UNITED STATES
SECURITIES AND EXCHANGE COMMISSION
Washington, D.C. 20549
FORM 10-K
(Mark One)
| ANNUAL REPORT PURSUANT TO SECTION 13 OR 15(d) OF THE SECURITIES EXCHANGE ACT OF 1934 |
For the fiscal year ended January 2,December 31, 2016
OR
| TRANSITION REPORT PURSUANT TO SECTION 13 OR 15(d) OF THE SECURITIES EXCHANGE ACT OF 1934 |
For the transition period from to
Commission file number 1-16247
FLOWERS FOODS, INC.
(Exact name of registrant as specified in its charter)
Georgia | 58-2582379 |
(State or other jurisdiction of incorporation or organization) | (IRS Employer Identification No.) |
|
|
1919 Flowers Circle Thomasville, Georgia | 31757 |
(Address of principal executive offices) | (Zip Code) |
Registrant’s telephone number, including area code:
(229) 226-9110
Securities registered pursuant to Section 12(b) of the Act:
| Title of Each Class |
|
|
| Name of Each Exchange on Which Registered |
|
Common Stock, $0.01 par value |
| New York Stock Exchange | ||||
Securities registered pursuant to Section 12(g) of the Act:
None
Indicate by check mark if the registrant is a well-known seasoned issuer, as defined in Rule 405 of the Securities Act. Yes x☒ No o☐
Indicate by check mark if the registrant is not required to file reports pursuant to Section 13 or Section 15(d) of the Act. Yes o☐ No x☒
Indicate by check mark whether the registrant (1) has filed all reports required to be filed by Section 13 or 15(d) of the Securities Exchange Act of 1934 during the preceding 12 months (or for such shorter period that the registrant was required to file such reports), and (2) has been subject to such filing requirements for the past 90 days. Yes x☒ No o☐
Indicate by check mark whether the registrant has submitted electronically and posted on its corporate Website, if any, every Interactive Data File required to be submitted and posted pursuant to Rule 405 of Regulation S-T (§ 232.405 of this chapter) during the preceding 12 months (or for such shorter period that the registrant was required to submit and post such files). Yes x☒ No o☐
Indicate by check mark if disclosure of delinquent filers pursuant to Item 405 of Regulation S-K is not contained herein, and will not be contained, to the best of registrant’s knowledge, in definitive proxy or information statements incorporated by reference in Part III of this Form 10-K or any amendment to this Form 10-K. o☐
Indicate by check mark whether the registrant is a large accelerated filer, an accelerated filer, a non-accelerated filer, or a smaller reporting company. See the definitions of “large accelerated filer,” “accelerated filer” and “smaller reporting company” in Rule 12b-2 of the Exchange Act. (Check one):
Large accelerated filer |
| Accelerated filer |
|
|
|
|
|
Non-accelerated filer |
| Smaller reporting company |
|
Indicate by check mark whether the registrant is a shell company (as defined in Rule 12b-2 of the Exchange Act). Yes o☐ No x☒
Based on the closing sales price on the New York Stock Exchange on July 18, 201516, 2016 the aggregate market value of the voting and non-voting common stock held by non-affiliates of the registrant was $4,212,236,667.$3,680,508,668.
On February 18, 2016,17, 2017, the number of shares outstanding of the registrant’s Common Stock, $0.01 par value, was 212,296,832.208,904,007.
DOCUMENTS INCORPORATED BY REFERENCE
Portions of the registrant’s Proxy Statement for the 20162017 Annual Meeting of Shareholders to be held May 26, 2016,25, 2017, which will be filed with the Securities and Exchange Commission on or about April 12, 2016,11, 2017, have been incorporated by reference into Part III, Items 10, 11, 12, 13 and 14 of this Annual Report on Form 10-K.
TABLE OF CONTENTS
|
| Page |
| PART I |
|
Item 1. |
| |
Item 1A. |
| |
Item 1B. |
| |
Item 2. |
| |
Item 3. |
| |
Item 4. |
| |
|
|
|
| PART II |
|
Item 5. |
| |
Item 6. |
| |
Item 7. | Management’s Discussion and Analysis of Financial Condition and Results of Operations |
|
Item 7A. | 51 | |
Item 8. | 51 | |
Item 9. | Changes in and Disagreements with Accountants on Accounting and Financial Disclosure | 51 |
Item 9A. |
| |
Item 9B. | 52 | |
|
|
|
| PART III |
|
Item 10. | 53 | |
Item 11. | 53 | |
Item 12. | Security Ownership of Certain Beneficial Owners and Management and Related Stockholder Matters | 53 |
Item 13. | Certain Relationships and Related Transactions, and Director Independence | 53 |
Item 14. | 53 | |
|
|
|
| PART IV |
|
Item 15. | 54 | |
Item 16. | 54 | |
| 58 |
i
Statements contained in this filing and certain other written or oral statements made from time to time by the company and its representatives that are not historical facts are forward-looking statements as defined in the Private Securities Litigation Reform Act of 1995. Forward-looking statements relate to current expectations regarding our future financial condition and results of operations and are often identified by the use of words and phrases such as “anticipate,” “believe,” “continue,” “could,” “estimate,” “expect,” “intend,” “may,” “plan,” “predict,” “project,” “should,” “will,” “would,” “is likely to,” “is expected to” or “will continue,” or the negative of these terms or other comparable terminology. These forward-looking statements are based upon assumptions we believe are reasonable.
Forward-looking statements are based on current information and are subject to risks and uncertainties that could cause our actual results to differ materially from those projected. Certain factors that may cause actual results, performance, liquidity, and achievements to differ materially from those projected are discussed in this report and may include, but are not limited to:
|
|
unexpected changes in any of the following: (i) general economic and business conditions; (ii) the competitive setting in which we operate, including advertising or promotional strategies by us or our competitors, as well as changes in consumer demand; (iii) interest rates and other terms available to us on our borrowings; (iv) energy and raw materials costs and availability and hedging counter-party risks; (v) relationships with or increased costs related to our employees and third party service providers; and (vi) laws and regulations (including environmental and health-related issues), accounting standards or tax rates in the markets in which we operate;
|
|
the loss or financial instability of any significant customer(s);
|
|
changes in consumer behavior, trends and preferences, including health and whole grain trends, and the movement toward more inexpensive store-branded products;
|
|
the level of success we achieve in developing and introducing new products and entering new markets;
|
|
our ability to implement new technology and customer requirements as required;
|
|
our ability to operate existing, and any new, manufacturing lines according to schedule;
|
|
our ability to execute our business strategy, which may involve integration of recent acquisitions or the acquisition or disposition of assets at presently targeted values;
|
|
consolidation within the baking industry and related industries;
|
|
changes in pricing, customer and consumer reaction to pricing actions, and the pricing environment among competitors within the industry;
|
|
disruptions in our direct-store-delivery distribution model, including litigation or an adverse ruling by a court or regulatory or governmental body that could affect the independent contractor classifications of the independent distributors;
|
|
increasing legal complexity and legal proceedings that we are or may become subject to;
|
|
increases in employee and employee-related costs, including funding of pension plans;
|
|
the credit, business, and legal risks associated with independent distributors and customers, which operate in the highly competitive retail food and foodservice industries;
|
|
any business disruptions due to political instability, armed hostilities, incidents of terrorism, natural disasters, labor strikes or work stoppages, technological breakdowns, product contamination or the responses to or repercussions from any of these or similar events or conditions and our ability to insure against such events;
|
|
the failure of our information technology systems to perform adequately, including any interruptions, intrusions or security breaches of such systems; and
regulation and legislation related to climate change that could affect our ability to procure our commodity needs or that necessitate additional unplanned capital expenditures.
The foregoing list of important factors does not include all such factors, nor necessarily present them in order of importance. In addition, you should consult other disclosures made by the company (such as in our other filings with the Securities and Exchange Commission (“SEC”) or in company press releases) for other factors that may cause actual results to differ materially from those projected by the company. Refer to Part I, Item 1A., Risk Factors, of this Annual Report on Form 10-K (the “Form 10-K”) for additional information regarding factors that could affect the company’s results of operations, financial condition and liquidity.
We caution you not to place undue reliance on forward-looking statements, as they speak only as of the date made and are inherently uncertain. The company undertakes no obligation to publicly revise or update such statements, except as required by law.
ii
You are advised, however, to consult any further public disclosures by the company (such as in our filings with the SEC or in company press releases) on related subjects.
We own or have rights to trademarks or trade names that we use in connection with the operation of our business, including our corporate names, logos and website names. In addition, we own or have the rights to copyrights, trade secrets and other proprietary rights that protect the content of our products and the formulations for such products. Solely for convenience, some of the trademarks, trade names and copyrights referred to in this Form 10-K are listed without the ©, ® and ™ symbols, but we will assert, to the fullest extent under applicable law, our rights to our trademarks, trade names and copyrights.
iii
Historical InformationThe Company
Flowers Foods’ beginning dates back to 1919 when two brothers, William Howard and Joseph Hampton Flowers, opened Flowers Baking Company in Thomasville, GA. In 1968, Flowers Baking Company went public, became Flowers Industries, and began trading over-the-counter stock. Less than a year later, the company listed on the American Stock Exchange. In 1982, Flowers listed on the New York Stock Exchange under the symbol FLO. In the mid-1990s, following the acquisitions of Keebler Foods, Company, one of the largest cookie and cracker companies in the U.S., and the top-selling Mrs. Smith’s frozen pie brand, Flowers Industries transformed from a strong regional baker into a national baked foods company. By 1999, the company had $4.2 billion in annual sales and three business units — Flowers Bakeries, a super-regional fresh baked foods company; Mrs. Smith’s Bakeries, a national frozen baked foods company; and Keebler Foods, a national cookie and cracker company. In March 2001, Flowers sold its investment in Keebler to the Kellogg Company. The remaining business units — Flowers Bakeries and Mrs. Smith’s Bakeries — were spun off into a new company, Flowers Foods, which was incorporated in Georgia in 2000. In April 2003, Flowers Foods sold its Mrs. Smith’s frozen dessert business to The Schwan Food Company, retaining its core fresh bakery and frozen bread and roll businesses.
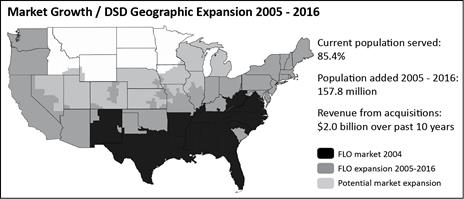
From 2003 through 2015, Flowers Foods executed its growth strategy to reach more of the U.S. population with fresh breads, buns, rolls, and snack cakes through its direct-store-delivery segment. During this time frame, the company’s geographic market for its fresh bakery products and brands grew from about 38% of the U.S. population to approximately 85%.
As used herein, referencesInc. (references to “we,” “our,” “us,” the “company,” “Flowers” or “Flowers Foods” include) was founded in 1919 as a Georgia corporation when two brothers — William Howard and Joseph Hampton Flowers — opened Flowers Baking Company in Thomasville, Georgia. Flowers’ operating strategy from the historical operating resultsbeginning was to invest in efficient and activities oftechnologically advanced bakeries, offer excellent baked foods, build strong brands, provide extraordinary service to customers, offer a workplace that fosters a team spirit, develop innovations to improve the business, operations that comprised Flowers Foods, Inc., as of January 2, 2016.
The Companyand grow through strategic acquisitions.
Flowers Foods currently operates two business segments: a direct-store-delivery segment (“DSD Segment”)is focused on opportunities for growth within the baked foods category and a warehouse delivery segment (“Warehouse Segment”).seeks to have its products available wherever bakery foods are sold or consumed — whether in homes, supermarkets, convenience stores, restaurants, fast food outlets, institutions, or vending machines. The DSD Segment (84% of total sales) operates 39 bakeries that marketcompany produces a wide varietyrange of fresh bakery foods, includingbreads, buns, rolls, snack cakes, and tortillas.
Segments
We manage our business by product delivery method. Our two operating segments reflect our two distinct methods of delivering products to market:
Direct-Store-Delivery Segment (the “DSD Segment”)
Produces fresh breads, buns, rolls, tortillas and snack cakes. These products arecakes sold throughprimarily by a direct-store-delivery modelnetwork of independent distributors to retail and foodservice customers in the Southeast, Mid-Atlantic, New England,following areas of the U.S.: East, South, Southwest, California, and select markets in Nevada, the Midwest, Pacific Northwest, Nevada, and the Pacific Northwest. The Warehouse Segment (16%Colorado.
Has a 39-bakery network with a highly developed reciprocal baking system (where bakeries can produce for its market and that of total sales) operates 10 bakeries that produce snack cakes, breadsother bakeries), which results in long and rolls for national retail, foodservice, vending, and co-pack customers, which are delivered through customers’ warehouse channels and one bakery mix plant.efficient production runs.
At the end of fiscal 2015, the DSD Segment’s fresh bakery foods were available to approximately 85% of the U.S. population. OurMajor DSD Segment is comprised of approximately 5,100 independent distributors who own the rights to distribute certain brands of our fresh packaged bakery foods in their geographic markets. The company has approximately 600 company-owned territories with the distribution rights for those territories available for sale include Nature’s Own, Wonder, Cobblestone Bread Company, Tastykake and an additional 230 company owned and operated territories with the distribution rights that are not available for sale.Dave’s Killer Bread.
The Warehouse Segment’sDelivery Segment (the “Warehouse Segment”)
Produces fresh snack cakes and frozen breads and rolls are sold nationally directrolls.
Delivers its products fresh or frozen to customers’ warehouses and delivered through frozen and non-frozennationwide via contract carriers.
Major brands include Mrs. Freshley’s, Alpine Valley Bread, and European Bakers.
The table below presents the sales, percent of total sales, and the number of plants by each segment:
Segment |
| Sales |
|
| Percent of total sales |
|
| Plants | ||
DSD Segment |
| $ | 3,284,177 |
|
|
| 84 | % |
| 39 |
Warehouse Segment |
| $ | 642,708 |
|
|
| 16 | % |
| 10 |
Consolidated |
| $ | 3,926,885 |
|
|
| 100 | % |
| 49 |
See Note 22, Segment Reporting, of Notes to Consolidated Financial Statements of this Form 10-K for more detailed financial information about our segments.
Our brands are among the best known in the baking industry. Many of our DSD Segment brands have a major presence in the product categories in which they compete. They have a leading share of fresh packaged branded sales measured in both dollars and units in the major metropolitan areas we serve in Southern markets. A listing of our leading brands, by sales and classification, include the following:
|
|
| ||
|
|
| ||
|
|
| ||
|
|
| ||
|
| |||
| ||||
| ||||
| ||||
| ||||
| ||||
|
Flowers Foods has focused on developing and refining operating strategies to create competitive advantages in the marketplace. We believe these operating strategies help us achieve our long-term objectives and work to build value for shareholders. Put simply, our strategies are to:
|
|
Grow Sales. We develop new and core markets through new customers, new products, strong brands, and acquisitions. We have a three-pronged strategy for growing sales through market expansions, core markets, and acquisitions.
|
|
Invest Wisely. We use technology and efficiencies to be the low-cost producer of delicious bakery foods. We invest to improve the effectiveness of our bakeries, distribution networks, and information systems.
|
|
Bake Smart. We innovate to improve processes, enhance quality, reduce costs, and conserve resources.
|
|
Give Extraordinary Service. We go beyond the expected to meet our customers’ needs.
Appreciate the Team. We respect every individual, embrace diversity, and promote the career growth of our team members. Strengths and core competencies Seasoned Team – Executive management team with an average of more than 20 years of baking industry experience Strong Brands – More than $3.3 billion in total branded retail sales, including vending Geographic Reach – Fresh products available to more than 85% of the U.S. population; frozen products available nationally Strong Financial Position – Driven by solid cash flows We aim to achieve consistent and sustainable growth in sales and earnings by focusing on improvements in the operating results of our existing bakeries and, after detailed analysis, acquiring companies and properties that add value to the company. We believe this strategy has resulted in consistent and sustainable growth that builds value for our shareholders. We regularly articulate our core business strategies to the investment community and internally to our team members, including long-term (five-year) goals. Compensation and bonus programs are linked to the company’s short and long-term goals. The majority of our employees participate in an annual formula-driven, performance-based cash bonus program. In addition, certain employees participate in a long-term incentive program that provides performance-contingent common stock awards that generally vest over a two-year period. We believe these incentive programs provide both a short and long-term goal for our most senior management team and aligns their interests with those of our shareholders. |
|
|
Grow Sales
This strategy encompasses specific efforts for growth through acquisitions, market expansions, product innovation, and core markets. As a leading U.S. baker, our products are available to consumers through traditional supermarkets, foodservice distributors, convenience stores, mass merchandisers, club stores, wholesalers, casual dining and quick-serve restaurants, schools, hospitals, dollar stores, and vending machines. To enhance our ability to grow sales, we develop bakery productsfoods that are responsive tomeet changing consumer needs and preferences using market research and the strength of our well-established brands. We establishmaintain and strengthen our brands in both existing and new markets by focusing on consistent product quality, offering a broad and diverse product line, and providing exceptional customer service. We expand our geographic reach by makingthrough strategic acquisitions and by expanding fromthe market reach of our existing bakeries into new markets.bakeries. We believe our growth strategy has provenbeen successful, evidenced by our sales and net income compound average annual growth rate of 8.1%7.3% and 6.7%5.8%, respectively, over the last five years. Our strategy encompasses specific efforts for growth through acquisitions, market expansions, and core markets.
Acquisitions
Growth through acquisitions hasAcquisitions have been an important component of our growth strategy. Since our initial public offering in 1968, we have made overmore than 100 acquisitions. Over the last ten yearsSince 2003, we have completed fourteen16 acquisitions that, atin the time of each acquisition,aggregate, added approximately $2.0 billion in annual revenue in the aggregate. Other than the Sara Lee California and the Acquired Hostess Bread Assets acquisitions discussed below, ourrevenue. Our primary acquisition targets have historically been independent/regional baking companies in areas of the country where weour fresh products have not previously had access to market our fresh baked foods.those markets. See Note 8, Acquisitions, of Notes to Consolidated Financial Statements of this Form 10-K for more details of each of the acquisitions described below.
Alpine Valley Bread acquisition (2015)
On October 13, 2015, the company completed the acquisition of Alpine Valley Bread Company (“Alpine”), a family-owned producer of certified organic and all natural breads in the U.S. The acquisition is intended to expand our penetration into the fast growing organic market and provide additional organic production capacity.
Dave’s Killer Bread acquisition (2015)
On September 12, 2015, the company completed the acquisition of Dave’s Killer Bread (“DKB”), the nation’s best-selling organic bread. We believeThe DKB acquisition not only gave us the acquisition of DKB strengthens our position as the second-largest bakertop organic bread brand in the U.S. by giving uscountry, it also gave our DSD Segment access to the fast growing organic bread category and expanding our geographic reach into the Pacific Northwest.
Modesto, California acquisition (2013)
On July 27, 2013, the company completed the acquisition of a bun line in Modesto, California from ARYZTA that now serves the CaliforniaNorthwest market.
Hostess bread assets acquisition (2013)
On July 19, 2013, the company completed the acquisition of certain assets of Hostess Brands, Inc. (“Hostess”), which included the Wonder, Nature’s Pride, Merita, Home Pride, and Butternut bread brands, 20 closed bakeries and 36 depots (the “Acquired Hostess Bread Assets”). We began re-introducing the brands associated with the Acquired Hostess Bread Assets to the marketplace near the end of the third quarter of fiscal 2013.
Sara Lee California acquisition (2013)
On February 23, 2013, the company completed its acquisition of certain assets and trademark licenses from BBU, Inc., a subsidiary of Grupo Bimbo S.A.B. de C.V. (“BBU”). The company acquired from BBU in the acquisition: (1) perpetual, exclusive, and royalty-free licenses to the Sara Lee and Earthgrains brands for sliced breads, buns, and rolls in the state of California and (2) a closed bakery in Stockton, California that we have since sold to a third party. In addition, we received a perpetual, exclusive, and royalty-free license to the Earthgrains brand for a broad range of fresh bakery products in the Oklahoma City, Oklahoma market area.
Expansion Markets
Expansion markets are defined as new DSD Segment markets entered into within the last five fiscal years. In 2011, we announced a specificdirect-store-delivery (“DSD”) market expansion goal:goal to serve a geographical area that includesreaching at least 75% of the U.S. population by 2016 with DSD distribution.2016. At the end of 2015,fiscal 2016, we had expandedexceeded that goal, expanding our population reach to approximately 85%, adding an additional 16 states for a total of 41. We exceeded our goal bythe U.S. population through acquisitions and expanding the market reach of existing bakeries. The chart below presents our existing bakeries into new territories and acquiring independent bakers in strategic locations.DSD Segment geographic expansion since fiscal 2005.
Our market expansion efforts are driven by our individual bakeries as they extend their service boundaries by serving new customers in markets adjacent to their current service areas.bakery subsidiaries. They accomplish this by partnering withreaching out to new and existing retail and foodservice customers to serve new locations, adding our direct-store-delivery model, and working to reach new customers in the targeted growth area.new territory and expanding the DSD model by creating new territories and new independent distributor partnerships.
Core Markets
Core markets are those served by our DSD Segment for more than five years. These are markets where our brands are established. Our primary growth strategy for growth in core markets includes introducingis product innovation. We strive to develop innovative, new products to servefor both retail and foodservice customers. We have been successfulcustomers that will drive excitement and consumers to our brands and products. In addition, in developing innovative products that gained consumer acceptance. A list ofconjunction with the independent distributors, we focus on continually building relationships with both new products introduced in fiscal 2015 can be found below in the Brands & Products discussion.
In core markets, we also strive to enhance our customer base by reaching out to retailers orand potential retail and foodservice customers, to offer additional products to those we currently serve and develop relationships with those who are potential customers.which helps grow sales.
Invest Wisely and Bake Smart
Throughout our history, we have devoted significant resources to automate our production facilitiesbakeries and improve our distribution capabilities. We believe these investments have made us one of the most efficient, low-cost producers of packaged bakery products in the United States. We believe our capital investments yield valuable long-term benefits, such as more consistent product quality highly sanitary processes, and greater production volume at a lower cost per unit.
From 20102012 through 2015,2016, we invested $420.2$442.7 million in capital projects. We believe this consistent, yearly investment in our bakeries hasannual capital investments have given us a competitive edge in the industry and we are committed to maintaining that advantage by continuing our investmentsinvesting in new technologytechnologies and improved processes.
During the second quarter of fiscal 2015, we opened the bread line at our Lenexa bakery which was acquired as part of the Acquired Hostess Bread Assets in July 2013. We opened the bun line during the third quarter of fiscal 2015. The bakery produces products for the Kansas, eastern Oklahoma, Missouri, and Nebraska markets under the Nature’s Own, Wonder, and Home Pride
brands. During fiscal 2015, we closed a DSD Segment production facility located in Morristown, Tennessee and relocated the production to one of our other DSD Segment bakeries located in Knoxville, Tennessee. The purpose was to take advantage of more efficient production capacity available at the Knoxville, Tennessee bakery.
On July 27, 2013, we completed the acquisition of a bun line in Modesto, California that now serves the California market. Also in 2013, we announced that we began production at our Henderson, Nevada bakery, which was acquired as a part of the Acquired Hostess Bread Assets. This bakery produces products for markets in southern Nevada and parts of California.
During the second quarter of fiscal 2014, we opened our Knoxville, Tennessee bakery that was acquired as a part of the Acquired Hostess Bread Assets. This bakery operates bread and bun lines and increased our production capacity for markets in Tennessee, Kentucky, and Ohio. We also opened a bun line at the Henderson, Nevada bakery and added a bread line to the Modesto, California bakery during fiscal 2014. These bakeries increased our production capacity for the California and Nevada markets.
Through several decades, we have established a reciprocal baking system that allows us to move or shift production among our DSD Segment bakeries to ensure thatbakeries. Because of this system, we are ablehave the flexibility to meet currentchanging market needs, can respond effectively to extraordinary events (such as hurricanes orand other wide-spread
natural disasters),disasters, and remainbe a low-cost producer and marketer of a full line of bakery products on a nationalboth regionally and super-regional basis. We alsonationally. For efficient movement of products from bakery to market, we use company-owned and leased warehouses and distribution centers located in geographic areas that allow for efficient movement of our products from bakery to market.centers.
We believe our company also invests wisely and bakes smart by:
|
|
Engaging in research and development to create new products, improve the quality of existing products, and improve production processes and techniques.
|
|
Developing and evaluating new processing techniques for both current and proposed product lines.
|
|
Improving the efficiency and accuracy of our shipping logistics. We have been installing a paperless, user-directed automated shipping system at our bakeries that uses barcode labels, displays, and door scanners. The system streamlines the finished goods product flow, provides for greater accountability of finished goods received and shipped, improves order fulfillment, and minimizes shortage costs. At the end of fiscal 2016, we had installed this automated shipping system in approximately 80% of our bakeries. We expect to have this system in place in all our bakeries by the end of fiscal 2018.
Give Extraordinary Service
When it comes to our customers,retail and foodservice partnerships, our strategy is to gosimple: Go beyond the expected. We know that greatOur bakery, sales, and corporate national account teams forge strong business relationships built on providing the best quality products at the best price when and where our customers need them. Focusing on extraordinary service helps grow sales in both core and new markets. Also critical to this strategy within our DSD Segment is the professionalism and service provided by the independent distributors who provide daily customer service and build strong relationships with our retail and foodservice customers. Our reputation for excellent service supports our sales growth in core markets and helps us as we move into new markets.relationships.
Appreciate the Team
We strive to treat all our team members and associates with respect and dignity and work to maintain good relationships and ongoing communications with all of our team members.open communication. We are committed to equal employment opportunities meetingand operating our facilities under all federal and state employment laws and striving to respect the dignity of all of our team members and associates.regulations. In addition, our subsidiaries provide:
|
|
Fair and equitable compensation and a balanced program of benefits;
|
|
Working conditions that promote employees’ health and safety;
|
|
Training opportunities that encourage professional development; and
|
|
Ways for team members to discuss concerns through an open door policy, peer review program, and anonymous toll-free hotline.
We employ approximately 10,90010,800 people. Approximately 1,1501,220 of these employees are covered by collective bargaining agreements. We believe
Project Centennial
In June of 2016, the company launched Project Centennial, an enterprise-wide business and operational review to evaluate opportunities to streamline our operations, drive efficiencies, and invest in strategic capabilities that we have good relationsbelieve will strengthen our competitive position and drive profitable revenue growth. Based upon the results of this review, Flowers has begun executing on four primary strategic initiatives:
reinvigorate the core business – invest in the growth and innovation of our core brands, streamline our brand and product portfolio, improve trade promotion management, and strengthen our partnership with our employees.distributors so they can grow their businesses;
capitalize on product adjacencies – greater focus on growing segments of the bakery category, such as foodservice, in-store bakery, impulse items, and healthy snacking;
reduce costs to fuel growth – reduce complexity and better leverage scale to lower costs; and
develop leading capabilities – invest in capabilities to become a more centralized and analytics-focused company.
The company intends to transition to these primary strategies in fiscal 2017 and future periods.
The company reports sales (consolidated and by segment) as branded retail, store branded retail, or non-retail and other. The non-retail and other category includes foodservice, restaurant, institutional, vending, thrift stores, and contract manufacturing. The table below presents our major brands and the geographic locations in the U.S. in which our products are available:
Brand | Availability | |
Natureʼs Own, Wonder, Cobblestone Bread Co., Daveʼs Killer Bread | East, South, Southwest, California, and select markets in the Midwest, Pacific Northwest, Nevada, and Colorado | |
Tastykake | Northeast, South, southern Midwest, Southwest, and select markets in California | |
Whitewheat, Betsy Ross, Butterkrust, Captain John Derst's, Home Pride, Dandee, Aunt Hattieʼs, Bunny, Butternut, Country Kitchen, Evangeline Maid, Holsum, Merita, Roman Meal (bread only), Sunbeam, Natural Grains, Earthgrains, and Sara Lee (California) | Available in select regional markets across the country | |
Alpine Valley Breads | Nationally, in select markets | |
Barowskyʼs Organics | New England | |
Mrs. Freshleyʼs | Nationally, in select markets | |
Mi Casa | Nationally, in select markets | |
Frestillas | Regionally, in select markets |
Brand Highlights
Nature’s Own, including Whitewheat, is the best-selling loaf bread in the U.S., and its compound annual growth rate in retail sales since 2000 has been 10.1%9.0%. The Nature’s Own sales, at retail, were $1.1$1.0 billion for fiscal 2015.2016.
Nature’s Own Honey Wheat is the number one selling fresh packaged bread uniform parcel code (“UPC”) in the U.S. Nature’s Own had three of the top five UPC’s in the Fresh Packaged Bread category during the fourth quarter of fiscal 2016 (source: IRI Total US MultiOutlet).
OurWe launched DKB throughout our entire DSD Segmentmarket in April 2016. DKBis the #1 organic brand activities duringin the U.S. with retail sales of $241.8 million for fiscal 2015 include the following:2016.
|
|
|
|
|
|
|
|
|
|
|
|
|
|
|
|
Our Warehouse Segment markets a line of organicspecialty and specialtyorganic breads and rolls under the Alpine Valley Bread, European Bakers brand for retail and foodservice customers. It also produces proprietary breads, buns, and rolls for specific foodservice customers. This segment’s snack cakes are sold under the Mrs. Freshley’s, Broad Street Bakery, and store brands. Our Warehouse Segment products are fresh and frozen and distributed nationally through retail, foodservice and vending customer warehouses.
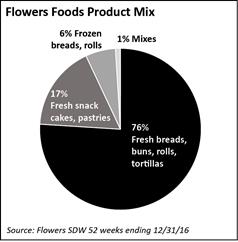
InThe table below presents our sales by product mix for fiscal 2015, we had the following initiatives2016 on a consolidated basis (internal sales data warehouse – “SDW”):
The table below presents our sales by channel for the Mrs. Freshley’sfiscal 2016 on a consolidated basis (internal sales data warehouse – “SDW”): brand:
Mrs. Freshley’s brought several innovative new products to market. These new product introductions included Red Velvet Cupcakes, Cinnamon Twirls and Cinnamon Mini Donuts both made with Cinnabon Cinnamon Vanilla and Chocolate Icers (iced crème filled layer cakes).
Marketing
We support our key brands with a multi-million dollaran advertising and marketing effort that reaches out to consumers through electronic and in-store coupons, social media (such as Facebook and Twitter), digital media (including e-newsletters to consumers), websites (our brand sites and third-party sites), event and sports marketing, on-package promotional offers and sweepstakes, and print advertising. When appropriate, we may join other sponsors with promotional tie-ins. We often focus our marketing efforts on specific products and holidays, such as hamburger and hot dog bun sales during Memorial Day, the Fourth of July, and Labor Day.Day, and snack cakes for specific seasons.
Customers
Our top 10 customers in fiscal 20152016 accounted for 43.5%46.8% of sales. During fiscal 2015,2016, our largest customer, Walmart/Sam’s Club, represented 19.3%19.6% of the company’s sales. The loss of, or a material negative change in our relationship with, Walmart/Sam’s Club or any other major customer could have a material adverse effect on our business. Walmart was the only customer to account for 10.0% or more of our sales during fiscal years 2016, 2015 2014 and 2013.2014.
Our freshFresh baked foodsfoods’ customers include mass merchandisers, supermarkets and other retailers, restaurants, quick-serve chains, food wholesalers, institutions, dollar stores, and vending companies. We also sell returned and surplus product through a system of discount bakery stores. The company currently operates 276292 such stores, and reported sales of $82.2$79.9 million during fiscal 2015 related to2016 from these outlets.
Our Warehouse Segment supplies national and regional restaurants, institutions and foodservice distributors, and retail in-store bakeries with frozen bakery products.breads and rolls. It also sells packaged bakery products to wholesale distributors for ultimate sale to a wide variety of food outlets. It sells packaged bakery snack cakes primarily to customers who distribute the product nationwide through multiple channels of distribution, including mass merchandisers, supermarkets, vending outlets and convenience stores. In certain circumstances, we enter into co-packing arrangements with retail customers or other food companies, some of which are competitors.
Distribution
Distributing fresh bakery foods through a direct-store-deliveryDSD model is a complex process. It involves determining appropriate order levels and delivering products from bakeries to independent distributors for sale and direct delivery to customer stores. The independent distributors are responsible for ordering products, stocking shelves, maintaining special displays, and visiting customers frequentlydeveloping and maintaining good customer relations to ensure adequate inventory and removing unsold goods.
To get fresh bakery foods to market, we use a network of approximately 5,930 territories to distribute Flowers DSD Segment brands in specified geographic markets. The company has sold the majority of the distribution rights for these territories to independent distributors under long-term financing arrangements. The independent distributor model is designed to provide retail and foodservice customers with superior service. Independent distributors, highly motivated by financial incentives from their distribution rights ownership, strive to increase sales by offering outstanding service and merchandising. Independent distributors have the opportunity to benefit directly from the enhanced value of their distribution rights resulting from higher branded sales volume.
Our DSD model is comprised of three types of territories. Independent distributors who own the rights to distribute certain brands of our fresh packaged bakery foods in defined geographic markets. Company-owned and operated territories with the distribution rights that are classified as available for sale and company owned and operated territories with the distribution rights that are classified as held and used. The table below presents the approximate number of territories used by the company on December 31, 2016:
Type of territory | Number of territories | |||
Independent distributor distribution rights | 5,128 | |||
Company owned classified as available for sale | 671 | |||
Company owned classified as held and used | 246 | |||
Total territories | 6,045 | |||
The company has developed proprietary software on the hand-held computers that independent distributors use for daily ordering, transactions, and to manage their businesses. The company provides these hand-held computers to the independent distributors and charges them an administrative fee for their use. This fee reducesis recognized as a reduction to the company’s selling, distribution and administrative expenses, and totaled $6.8 million in fiscal 2015, $6.6 million in fiscal 2014, and $5.2 million in fiscal 2013.expense. Our proprietary software permits distributors to track and communicate inventory data to bakeries and to calculate recommended order levels based on historical sales data and recent trends. These orders are electronically transmitted to the appropriate bakery on a nightly basis. This model is designed to provide distributors with an adequate supply of the right mix of products to meet retail and foodservice customers’ immediate needs. We believe this system assists us in minimizing returns of unsold goods. The fees collected for each of the last three fiscal years were as follows (amounts in thousands):
Year |
| Hand-held computer fees |
| |
Fiscal 2016 |
| $ | 6,544 |
|
Fiscal 2015 |
| $ | 6,790 |
|
Fiscal 2014 |
| $ | 6,561 |
|
In addition to hand-held computers, we maintain an information technology (“IT”) platform that allows us to track sales, product returns, and profitability by selling location, bakery, day, and other criteria. The system provides us with daily, real-time, on-line access to sales and gross margin reports, allowing us to make prompt operational adjustments when appropriate. It also permits us to better forecast sales and improve ourdistributors’ in-store product ordering by customer. This IT platform is integral to our hand-held computers.
We also use scan-based trading technology (referred to as “pay by scan” or “PBS”) to track and monitor sales and inventories more effectively. PBS allows the independent distributors to bypass the often lengthy product check-in at retail stores, which gives them more time to service customers and merchandise products. PBS also benefits retailers, who only pay suppliers for what they actually sell, or what is scanned at checkout. During the last three fiscal 2015 approximately $1.2 billion of our DSD Segmentyears PBS sales came through our PBS system.were as follows (amounts in thousands):
Year |
| PBS sales |
| |
Fiscal 2016 |
| $ | 1,273,660 |
|
Fiscal 2015 |
| $ | 1,245,422 |
|
Fiscal 2014 |
| $ | 1,206,608 |
|
Our Warehouse Segment distributes a portion of our packaged bakery snack products from a central distribution facility located near our Crossville, Tennessee snack cake bakery. We believe this centralized distribution method allows us to achieve both production and distribution efficiencies. Our snack cake bakeries operate what we believe are long, efficient production runs of a single product, which are then shipped to the central distribution facility. Products coming from different bakeries are then cross-docked and shipped directly to customers’ warehouses nationwide. Our frozen bread and roll products are shipped to various outside freezer facilities for distribution to our customers.
We own a number of trademarks, trade names, patents, and licenses. The company also sells products under franchised and licensed trademarks and trade names that it doeswe do not own.own (Sunbeam, Bunny, and Sara Lee – only in California – among others). We consider all of our trademarks and trade names important to our business since we use them to build strong brand awareness and consumer loyalty.
Our primary baking ingredients are flour, sweeteners, shortening, and water. We also use paper products, such as corrugated cardboard, films and plastics to package our bakery foods. We strive to maintain diversified sources for all of our baking ingredients and packaging products. In addition, we are dependent on natural gas or propane as fuel for firing our ovens.
Commodities, such as our baking ingredients, periodically experience price fluctuations. The cost of these inputs may fluctuate widely due to government policy and regulation, weather conditions, domestic and international demand, or other unforeseen circumstances. We enter into forward purchase agreements and other derivative financial instruments in an effort to manage the impact of such volatility in raw material prices, but some organic ingredients do not offer the same hedging opportunities to reduce the impact of price volatility. Any decrease in the supply available under these agreements and instruments could increase the effective price of these raw materials to us and significantly impact our earnings.
Regulations
As a producer and marketer of food items, our operations are subject to regulation by various federal governmental agencies, including the U.S. Food and Drug Administration, the U.S. Department of Agriculture, the U.S. Federal Trade Commission, the U.S. Environmental Protection Agency, the U.S. Department of Commerce, and the U.S. Department of Labor.Labor (the “DOL”). We also are subject to the regulations of various state agencies, with respect to production processes, product quality, packaging, labeling, storage, distribution, labor, and local regulations regarding the licensing of bakeries and the enforcement of state standards and facility inspections. Under various statutes and regulations, these federal and state agencies prescribe requirements and establish standards for quality, purity, and labeling. Failure to comply with one or more regulatory requirements could result in a variety of sanctions, including monetary fines or compulsory withdrawal of products from store shelves. On August 9, 2016, the DOL notified the company that it was scheduled for a compliance review under the Fair Labor Standards Act. The company is cooperating with the DOL.
Advertising of our businesses is subject to regulation by the Federal Trade Commission, and we are subject to certain health and safety regulations, including those issued under the Occupational Safety and Health Act.
The cost of compliance with such laws and regulations has not had a material adverse effect on the company’s business. We believe that we are currently in material compliance with applicable federal, state and local laws and regulations.
Our operations, like those of similar businesses, are subject to various federal, state and local laws and regulations with respect to environmental matters, including air and water quality and underground fuel storage tanks, as well as other regulations intended to protect public health and the environment. The company is not a party to any material proceedings arising under these laws and regulations. We believe compliance with existing environmental laws and regulations will not materially affect the Consolidated Financial Statements or the competitive position of the company. The company is currently in substantial compliance with all material environmental laws and regulations affecting the company and its properties.
The U.S. market for fresh and frozen bakery products is estimated at $35 billion at retail. This category is intensely competitive and underwenthas experienced significant change in 2013.the last several years. From a national standpoint, Flowers Foods is currently the number twosecond largest company in the U.S. fresh baking industry based on market share.share as presented in the following chart (internal sales data warehouse – “SDW”):
In January 2012, Hostess filed for bankruptcy. By November 2012, Hostess, which had been in bankruptcy for six of the last nine years, ceased production and announced it would liquidate. This event impacted the industry as Hostess sales shifted to other producers to meet marketplace needs. These producers included Flowers, BBU (with Sara Lee, Arnolds, Thomas, and Entenmann’s brands), Campbell Soup Company (with the Pepperidge Farm brand), McKee Foods Corporation (Little Debbie) and smaller regional bakeries, retailer-owned bakeries, and store brands. The Hostess cake products were re-introduced into the market in July 2013 by a new and separate company formed by Apollo Global Management and C. Dean Metropoulous & Co.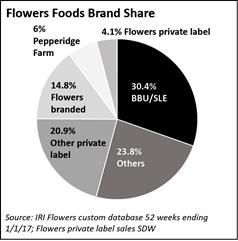
The current competitive landscape for breads and rolls in the U.S. baking industry now consists of BBU,Bimbo Bakeries USA, Flowers Foods, and Campbell Soup Company on a national or super-regional scale, together(Pepperidge Farm) along with smaller independent regional bakers, local bakeries, and retailer-owned bakeries. The company faces significant competition from store brands (also known as “private label”) and products produced by independent bakers. While store brand breads and rolls have been offered by food retailers for decades, food retailers have put more emphasis on store brand products with the entry of mass merchandisers like Walmart and the ongoing consolidation of traditional supermarkets into much larger regional operations. In general, the store brand share of retail fresh packaged bread accounts for approximately 26% of the dollar sales and approximately 39% of unit sales and has remained stable for the past five years.
There are a number of smaller regional bakers in the U.S. Some of these do not enjoy the competitive advantages of larger operations, including greater brand awareness and economies of scale in purchasing, distribution, production, information technology, advertising and marketing. However, size alone is not sufficient to ensure success in our industry. The company faces significant competition from regional and independent bakeries in certain geographic areas.
Competition in the baking industry continues to be driven by a number of factors. These include the ability to serve consolidated retail and foodservice customers, generational changes in family-owned businesses, and competitors’ promotional efforts on branded bread and store brands. Competition typically is based on product availability, product quality, brand loyalty, price, effective promotions, and the ability to target changing consumer preferences. Customer service, including frequent delivery to keep store shelves well-stocked, is an increasingly important competitive factor.
Competition for fresh packaged bakery snack products is based upon the ability to meet production and distribution demands of retail and vending customers at a competitive price. Primary national competitors for fresh packaged bakery snack products include Hostess cake products, McKee Foods Corporation (Little Debbie and Drake’s), ARYZTA (Cloverhill Bakery), and BBU.
Competitors for frozen bakery products include Alpha Baking Co., Inc., Rotella’s Italian Bakery, Highland Baking Company, United States Bakery, Turano Baking Company, and All Round Foods, Inc. Competition for frozen bakery products is based primarily on product quality and consistency, product variety and the ability to consistently meet production and distribution demands at a competitive price.
The company also faces competition from store brands that are produced botheither by us andor our competitors. For several decades, store brand breads and rollsStore brands (also known as “private label”) have been offered by food retail customers. Recently, food retailers for decades. With the growth of mass merchandisers like Walmart and the ongoing consolidation of regional supermarkets into larger operations, store brands have put more emphasis onbecome a significant competitor to the company in those areas where the company does not have the contract to produce the store brand products, initiating a store brand push in such categories as chips and cereals.brand. In general, the store brand share of retail fresh packaged bread in the fresh bread aisleU.S. accounts for approximately 24% of the dollar sales and approximately 34% of unit sales and has remained relatively consistent.stable for the past five years.
Other Available Information
Throughout this Form 10-K, we incorporate by reference information from parts of other documents filed with the SEC. The SEC allows us to disclose important information by referring to it in this manner, and you should review this information in addition to the information contained in this report.
Our annual report on Form 10-K, quarterly reports on Form 10-Q, current reports on Form 8-K, and proxy statement for the annual shareholders’ meeting, as well as any amendments to those reports, are available free of charge through our website as soon as reasonably practicable after we file them with the SEC. You can learn more about us by reviewing our SEC filings in the Investor Center on our website at www.flowersfoods.com.
The SEC also maintains a website at www.sec.gov that contains reports, proxy statements and other information about SEC registrants, including the company. You may also obtain these materials at the SEC’s Public Reference Room at 100 F Street, N.E.,
Washington, D.C. 20549. You can obtain information on the operation of the Public Reference Room by calling the SEC at 1-800-SEC-0330. Except as otherwise expressly set forth herein, the information contained on our website is neither included nor incorporated by reference herein.
The following corporate governance documents may be obtained free of charge through our website in the “Corporate Governance” section of the “Investor Center” tab (unless otherwise specified) or by sending a written request to Flowers Foods, Inc., 1919 Flowers Circle, Thomasville, GA 31757, Attention: Investor Relations.
|
|
Board Committees
|
|
Code of Business Conduct and Ethics
|
|
Flowers Foods Employee Code of Conduct
|
|
Disclosure Policy
|
|
Corporate Governance Guidelines
|
|
Stock Ownership Guidelines
|
|
Audit Committee Charter
|
|
Compensation Committee Charter
Nominating/Corporate Governance Committee Charter
Flowers Foods Supplier Code of Conduct (This document is on our website in the “Company Info” tab) |
|
|
|
|
You should carefully consider the risks described below, together with all of the other information included in this report, in considering our business and prospects. The risks and uncertainties described below are not the only ones facing us. These risk factors are not listed in any order of significance. Additional risks and uncertainties not presently known to us, or that we currently deem insignificant, may also impair our business operations. The occurrence of any of the following risks could harm our business, financial condition, liquidity or results of operations.
Economic conditions may negatively impact demand for our products, which could adversely impact our sales and operating profit.
The willingness of our customers and consumers to purchase our products dependsmay depend in part on economic conditions. In recent years, economic conditions were significantly strained in the United States. Continuing or worsening economic challenges could have a negative impact on our business. Economic uncertainty may result in increased pressure to reduce the prices of some of our products, limit our ability to increase or maintain prices, and reduce sales of higher margin products or shift our product mix to low-margin products. In addition, changes in tax or interest rates, whether due to recession, financial and credit market disruptions or other reasons, could negatively impact us. If any of these events occurs, or if unfavorable economic conditions continue or worsen, our sales and profitability could be adversely affected.
Increases in costs and/or shortages of raw materials, fuels and utilities could adversely impact our profitability.
Commodities, such as flour, sweeteners, shortening, and water which are used in our bakery products, are subject to price fluctuations. The cost of these inputs may fluctuate widely due to foreign and domestic government policies and regulations, weather conditions, domestic and international demand, or other unforeseen circumstances. Any substantial change in the prices or availability of raw materials may have an adverse impact on our profitability. We enter into forward purchase agreements and other derivative financial instruments from time to time to manage the impact of such volatility in raw materials prices; however, these strategies may not be adequate to overcome increases in market prices or availability. Our failure to enter into hedging arrangements or any decrease in the availability or increase in the cost of these agreements and instruments could increase the price of these raw materials and significantly affect our earnings.
In addition, we are dependent upon natural gas or propane for firing ovens. The independent distributors and third-party transportation companies are dependent upon gasoline and diesel for their vehicles. The cost of fuel may fluctuate widely due to economic and political conditions, government policy and regulation, war, or other unforeseen circumstances. Substantial future increases in prices for, or shortages of, these fuels could have a material adverse effect on our profitability, financial condition or
results of operations. There can be no assurance that we can cover these potential cost increases through future pricing actions. Also, as a result of these pricing actions, consumers could purchase less or move from purchasing high-margin products to lower-margin products.
Competition could adversely impact revenues and profitability.
The United States bakery industry is highly competitive. Our principal competitors in these categories all have substantial financial, marketing, and other resources. In most product categories, we compete not only with other widely advertised branded products, but also with store branded products that are generally sold at lower prices. Competition is based on product availability, product quality, price, effective promotions, and the ability to target changing consumer preferences. We experience price pressure from time to time due to competitors’ promotional activity and other pricing efforts. This pricing pressure is particularly strong during adverse economic periods. Increased competition could result in reduced sales, margins, profits and market share.
A disruption in the operation of our DSD distribution modelsystem could negatively affect our results of operations, financial condition and cash flows.
We believe that our DSD distribution system is a significant competitive advantage. A material negative change in our relationship with the independent distributors, litigation or one or more adverse rulings by courts or regulatory or governmental bodies in various jurisdictions regarding our independent distributorship model,program, including actions or decisions that could affect the independent contractor classifications of the independent distributors, or an adverse judgment against the company for actions taken by the independent distributors could materially and negatively affect our financial condition, results of operations, and cash flows.
The costs of maintaining and enhancing the value and awareness of our brands are increasing, which could have an adverse impact on our revenues and profitability.
We rely on the success of our well-recognized brand names and we intend to maintain our strong brand recognition by continuing to devote resources to advertising, marketing and other brand building efforts. Brand value could diminish significantly due to a number of factors, including consumer perception that we have acted in an irresponsible manner, adverse publicity about our products (whether or not valid), our failure to maintain the quality of our products, the failure of our products to deliver consistently positive consumer experiences, or the products becoming unavailable to consumers. Our marketing investments may not prove successful in maintaining or increasing our market share. If we are not able to successfully maintain our brand recognition, our revenues and profitability could be adversely affected.
We rely on several large customers for a significant portion of our sales and the loss of one of our large customers could adversely affect our financial condition and results of operations.
We have several large customers that account for a significant portion of our sales, and the loss of one of our large customers could adversely affect our financial condition and results of operations. Our top ten customers accounted for 43.5%46.8% of our sales during fiscal 2015.2016. Our largest customer, Walmart/Sam’s Club, accounted for 19.3%19.6% of our sales during this period. These customers do not typically enter into long-term sales contracts, and instead make purchase decisions based on a combination of price, product quality, consumer demand, and customer service performance. At any time, they may use more of their shelf space, including space currently used for our products, for store branded products or for products from other suppliers. Additionally, our customers may face financial or other difficulties that may impact their operations and their purchases from us. Disputes with significant suppliers could also adversely affect our ability to supply products to our customers. If our sales to one or more of these customers are reduced, this reduction may adversely affect our business, financial condition or results of operations.
Inability to anticipate or respond to changes in consumer preferences may result in decreased demand for our products, which could have an adverse impact on our future growth and operating results.
Our success depends, in part, on our ability to respond to current market trends and to anticipate the tastes and dietary habits of consumers, including concerns of consumers regarding health and wellness, obesity, product attributes, and ingredients. Introduction of new products and product extensions requires significant development and marketing investment. If our products fail to meet consumer preferences, or we fail to introduce new and improved products on a timely basis, then the return on that investment will be less than anticipated and our strategy to grow sales and profits with investments in marketing and innovation will be less successful. If we fail to anticipate, identify, or react to changes in consumer preferences, or we fail to introduce new or improved products on a timely basis we could experience reduced demand for our products, which could in turn cause our operating results to suffer.
We may be adversely impacted by the failure to successfully execute acquisitions and divestitures and integrate acquired operations.
From time to time, the company undertakes acquisitions or divestitures. In fiscal 2015, we acquired DKB and Alpine and in fiscal 2013 we acquired the Acquired Hostess Bread Assets, certain assets and the Sara Lee trademark licenses from BBU in California, and a bun line in Modesto, California. The success of these acquisitions, or any other acquisition or divestiture depends on the company’s ability to identify opportunities that help us meet our strategic objectives, consummate a transaction on favorable contractual terms, and achieve expected returns and other financial benefits.
Acquisitions, including our recent acquisitions, require us to efficiently integrate the acquired business or businesses, which involves a significant degree of difficulty, including the following:
|
|
integrating the operations and business cultures of the acquired businesses while carrying on the ongoing operations of the businesses we operated prior to the acquisitions;
|
|
managing a significantly larger company than before consummation of the acquisitions;
|
|
the possibility of faulty assumptions underlying our expectations regarding the prospects of the acquired businesses;
|
|
coordinating a greater number of diverse businesses and businesses located in a greater number of geographic locations;
|
|
attracting and retaining the necessary personnel associated with the acquisitions;
|
|
creating uniform standards, controls, procedures, policies and information systems and controlling the costs associated with such matters; and
expectations about the performance of acquired trademarks and brands and the fair value of such trademarks and brands. |
|
|
|
|
Divestitures have operational risks that may include impairment charges. Divestitures also present unique financial and operational risks, including diversion of management attention from the existing core business, separating personnel and financial data and other systems, and adverse effects on existing business relationships with suppliers and customers.
In situations where acquisitions or divestitures are not successfully implemented or completed, or the expected benefits of such acquisitions or divestitures are not otherwise realized, the company’s business or financial results could be negatively impacted.
This risk includes our expectations about the performance of acquired trademarks and brands. If we are unable to implement our growth strategies for these acquired intangible assets as expected, it could adversely impact the carrying value of the acquired brands. The fair value of the trademarks could be less than our carrying value if any of our four material assumptions in our fair value analysis: (a) weighted average cost of capital; (b) long-term sales growth rates; (c) forecasted operating margins; and (d) market multiples do not meet our expectations, thereby requiring us to record an asset impairment.
We are subject to increasing legal complexity and could be party to litigation that may adversely affect our business.
Increasing legal complexity may negativelycontinue to affect our operations and results in material ways. We are or could be subject to legal proceedings that may adversely affect our business, including class actions, administrative proceedings, government investigations, securities laws, employment and personal injury claims, disputes with current or former suppliers, claims by current or former independent distributors, and intellectual property claims (including claims that we infringed another party’s trademarks, copyrights, or patents). Inconsistent standards imposed by governmental authorities can adversely affect our business and increase our exposure to litigation. Litigation involving our independent distributor model and the independent contractor classification of the independent distributors, as well as litigation related to disclosure made by us in connection therewith, if determined adversely, could increase costs, negatively impact our business prospects and the business prospects of the independentour distributors and subject us to incremental liability.liability for their actions. We are also subject to the legal and compliance risks associated with privacy, data collection, protection and management, in particular as it relates to information we collect when we provide products to customers.
Changes in the Administration may impact fiscal and tax policies that may affect our business.
The new Administration has called for substantial change to fiscal and tax policies, which may include comprehensive tax reform. We cannot predict the impact, if any, of these changes to our business. However, it is possible that these changes could adversely affect our business. It is likely that some policies adopted by the new administration will benefit us and others will negatively affect us. Until we know what changes are enacted, we will not know whether in total we benefit from, or are negatively affected by, the changes.
Consolidation in the retail and foodservice industries could affect our sales and profitability.
If our retail and foodservice customers continue to grow larger due to consolidation in their respective industries, they may demand lower pricing and increased promotional programs. Meeting these demands could adversely affect our sales and profitability.
Our large customers may impose requirements on us that may adversely affect our results of operations.
From time to time, our large customers may re-evaluate or refine their business practices and impose new or revised requirements on us, the distributors, and theirthe customers’ other suppliers. The growth of large mass merchandisers, supercenters and
dollar stores, together with changes in consumer shopping patterns, have produced large, sophisticated customers with increased buying power and negotiating strength. Current trends among retailers and foodservice customers include fostering high levels of competition among suppliers, demanding new products or increased promotional programs, requiring suppliers to maintain or reduce product prices, reducing shelf space for our products, and requiring product delivery with shorter lead times. These business changes may involve inventory practices, logistics, or other aspects of the customer-supplier relationship. Compliance with requirements imposed by major customers may be costly and may have an adverse effect on our margins and profitability. However, if we fail to meet a significant customer’s demands, we could lose that customer’s business, which also could adversely affect our results of operations.
Our inability to execute our business strategy could adversely affect our business.
We employ various operating strategies to maintain our position as one of the nation’s leading producers and marketers of bakery products available to customers through multiple channels of distribution. If we are unsuccessful in implementing or executing one or more of these strategies, our business could be adversely affected.
Increases in employee and employee-related costs could have adverse effects on our profitability.
Pension, health care, and workers’ compensation costs are increasing and will likely continue to do so. Any substantial increase in pension, health care or workers’ compensation costs may have an adverse impact on our profitability. The company records pension costs and the liabilities related to its benefit plans based on actuarial valuations, which include key assumptions determined by management. Material changes in pension costs may occur in the future due to changes in these assumptions. Future annual amounts could be impacted by various factors, such as changes in the number of plan participants, changes in the discount rate, changes in the expected long-term rate of return, changes in the level of contributions to the plan, and other factors. In addition, legislation or regulations involving labor and employment and employee benefit plans (including employee health care benefits and costs) may impact our operational results.
We have risks related to our pension plans, which could impact the company’s liquidity.
The company has trusteed, noncontributory defined benefit pension plans covering certain employees maintained under the U.S. Employee Retirement Income Security Act of 1974 (“ERISA”). The funding obligations for our pension plans are impacted by the performance of the financial markets, including the performance of our common stock, which comprised approximately 11.8%12.1% of all the pension plan assets as of January 2,December 31, 2016.
If the financial markets do not provide the long-term returns that are expected, the likelihood of the company being required to make larger contributions will increase which could impact our liquidity. The equity markets can be, and recently have been, very volatile, and therefore our estimate of future contribution requirements can change dramatically in relatively short periods of time. Similarly, changes in interest rates can impact our contribution requirements. In a low interest rate environment, the likelihood of larger required contributions increases. Adverse developments in any of these areas could adversely affect our financial condition, liquidity or results of operations.
Disruption in our supply chain or distribution capabilities from political instability, armed hostilities, incidents of terrorism, natural disasters, weather or labor strikes could have an adverse effect on our business, financial condition and results of operations.
Our ability to make, move and sell products is critical to our success. Damage or disruption to our manufacturing or distribution capabilities, or the manufacturing or distribution capabilities of our suppliers due to weather, natural disaster, fire or explosion, terrorism, pandemics, or labor strikes or work stoppages, or adverse outcomes in litigation involving our independent distributor model could impair our ability to manufacture or sell our products. Moreover, terrorist activity, armed conflict, political instability or natural disasters that may occur within or outside the U.S. may disrupt manufacturing, labor, and other business operations. Failure to take adequate steps to mitigate the likelihood or potential impact of such events, or to effectively manage such events if they occur, could adversely affect our business, financial conditions and results of operations.
Future product recalls or safety concerns could adversely impact our results of operations.
We may be required to recall certain of our products should they be mislabeled, contaminated, spoiled, tampered with or damaged. We also may become involved in lawsuits and legal proceedings if it is alleged that the consumption of any of our products causes injury, illness or death. A product recall or an adverse result in any such litigation could have a material adverse effect on our operating and financial results, depending on the costs of the recall, the destruction of product inventory, competitive reaction and consumer attitudes. Even if a product liability or consumer fraud claim is unsuccessful or without merit, the negative publicity
surrounding such assertions regarding our products could adversely affect our reputation and brand image. We also could be adversely affected if consumers in our principal markets lose confidence in the safety and quality of our products.
We may be adversely impacted if our information technology systems fail to perform adequately, including with respect to cybersecurity issues.
The efficient operation of our business depends on our information technology systems. We rely on our information technology systems to effectively manage our business data, communications, supply chain, order entry and fulfillment, and other business processes. The failure of our information technology systems (including those provided to us by third parties) to perform as we anticipate could disrupt our business and could result in billing, collecting, and ordering errors, processing inefficiencies, and the loss of sales and customers, causing our business and results of operations to suffer.
In addition, our information technology systems may be vulnerable to damage or interruption from circumstances beyond our control, including fire, natural disasters, systems failures, security breaches or intrusions (including theft of customer, consumer or other confidential data), and viruses. If we are unable to prevent physical and electronic break-ins, cyber-attacks and other information security breaches, we may suffer financial and reputational damage, be subject to litigation or incur remediation costs or penalties because of the unauthorized disclosure of confidential information belonging to us or to our partners, customers, suppliers or employees.
Government regulation could adversely impact our results of operations and financial condition.
As a producer and marketer of food items, our production processes, product quality, packaging, labeling, storage, and distribution are subject to regulation by various federal, state and local government entities and agencies. In addition, the marketing and labeling of food products has come under increased scrutiny in recent years, and the food industry has been subject to an increasing number of legal proceedings and claims relating to alleged false or deceptive marketing and labeling under federal, state or local laws or regulations. Uncertainty regarding labeling standards has led to customer confusions and legal challenges.
Compliance with federal, state and local laws and regulations is costly and time consuming. Failure to comply with, or violations of, applicable laws and the regulatory requirements of one or more of these agencies could subject us to civil remedies, including fines,
injunctions, recalls or seizures, as well as potential criminal sanctions, any of which could result in increased operating costs and adversely affect our results of operations and financial condition. Legal proceedings or claims related to our marketing could damage our reputation and/or adversely affect our business or financial results.
Executive Offices
The address and telephone number of our principal executive offices are 1919 Flowers Circle, Thomasville, Georgia 31757, (229) 226-9110.
Executive Officers of Flowers Foods
The following table sets forth certain information regarding the persons who currently serve as the executive officers of Flowers Foods. Our Board of Directors (the “Board”) elects our Executive Chairman of the Board for a one-year term. The Board of Directors has granted the Executive Chairman of the Board the authority to appoint the executive officers to hold office until they resign or are removed.
EXECUTIVE OFFICERS
Name, Age and Office |
| Business Experience |
|
|
|
Allen L. Shiver Age President and Chief Executive Officer |
| Mr. Shiver has been President and Chief Executive Officer of Flowers Foods since May 2013. Mr. Shiver was President of Flowers Foods from January 2010 to May 2013. Mr. Shiver previously served as Executive Vice President and Chief Marketing Officer of Flowers Foods from May 2008 to December 2009. Prior to that he served as President and Chief Operating Officer of the Warehouse Segment from April 2003 until May 2008. Prior to that, he served as President and Chief Operating Officer of Flowers Snack from July 2002 until April 2003. Prior to that time Mr. Shiver served as Executive Vice President of Flowers Bakeries from 1998 until 2002, as a Regional Vice President of Flowers Bakeries in 1998, and as President of Flowers Baking Company of Villa Rica from 1995 until 1998. Prior to that time, Mr. Shiver served in various sales and marketing positions at Flowers Bakeries. |
|
|
|
R. Steve Kinsey Age Executive Vice President and Chief Financial Officer |
| Mr. Kinsey has been Executive Vice President and Chief Financial Officer of Flowers Foods since May 2008. Mr. Kinsey previously served as Senior Vice President and Chief Financial Officer of Flowers Foods from September 2007 to May 2008. Prior to that he served as Vice President and Corporate Controller of Flowers Foods from June 2003 to September 2007. Prior to that he served as Corporate Controller from March 2002 to June 2003. Prior to that he served as Director of Tax of Flowers Foods from 2001 to March 2002 and at Flowers Industries from June 1998 to 2001. Mr. Kinsey served as Tax Manager of Flowers Industries from July 1994 to June 1998. Mr. Kinsey joined the company in July 1989 as a Tax Associate. |
|
|
|
Bradley K. Alexander Age Executive Vice President and Chief Operating Officer |
| Mr. Alexander has been Executive Vice President and Chief Operating Officer since July 2014. Mr. Alexander previously served as President of Flowers Bakeries from May 2008 to July 2014. Prior to that time Mr. Alexander served as a Regional Vice President of Flowers Bakeries from 2003 until May 2008. Prior to that, he served in various sales, marketing and operational positions since joining the company in 1981, including bakery president and Senior Vice President of Sales and Marketing. |
|
|
|
Stephen R. Avera Age Executive Vice President, Secretary and General Counsel |
| Mr. Avera has been Executive Vice President, Secretary and General Counsel of Flowers Foods since May 2008. Mr. Avera previously served as Senior Vice President, Secretary and General Counsel of Flowers Foods from September 2004 to May 2008. Prior to that, he served as Secretary and General Counsel from February 2002 until September 2004. He also served as Vice President and General Counsel of Flowers Bakeries from July 1998 to February 2002. Mr. Avera also previously served as an Associate and Assistant General Counsel of Flowers Industries from February 1986 to July 1998. |
|
|
|
D. Keith Wheeler Age President, Flowers Bakeries |
| Mr. Wheeler was named President of Flowers Bakeries in July 2014. Mr. Wheeler previously served as a Senior Vice President of Flowers Foods’ West Coast Region from 2012 until July 2014. Prior to that time Mr. Wheeler served in various operational positions within the company, including bakery president, region controller, and director of both business systems and strategic planning. |
|
|
|
Robert B. Hysell Age President, Flowers Foodservice Group |
| Mr. Hysell has been President of Flowers Foodservice Group since January 2012. He previously served as Senior Vice President of Flowers Bakeries from 2011 to 2012, and prior to that served as Senior Vice President of Flowers Foods’ Specialty Group from 2003 through 2010. He joined the company in 2001, initially serving as Vice President of Sales for the company’s frozen pie business. |
|
|
|
Joseph G. Tashie Age President, Flowers Cake Group |
| Mr. Tashie has been President of Flowers Cake Group since January 2012. Mr. Tashie previously served as a Senior Vice President of Flowers Bakeries from 2002 to 2011. Prior to that time, he served in various sales, marketing, and operations positions since joining the company in 1978, including president at two Flowers bakeries. |
Name, Age and Office |
| Business Experience |
|
|
|
Marta Jones Turner Age Executive Vice President of Corporate Relations |
| Ms. Jones Turner has been Executive Vice President of Corporate Relations of Flowers Foods since May 2008. Ms. Jones Turner previously served as Senior Vice President of Corporate Relations of Flowers Foods from July 2004 to May 2008. Prior to that time, she served as Vice President of Communications and Investor Relations from November 2002 until July 2004. She also served as Vice President of Public Affairs of Flowers Industries from September 1997 until November 2002 and Director of Public Relations of Flowers Industries from 1985 until 1997. Ms. Jones Turner joined the company in 1978. |
|
|
|
Robert L. Benton, Jr. Age Senior Vice President and Chief Manufacturing Officer |
| Mr. Benton has been Senior Vice President and Chief Manufacturing Officer of Flowers Foods, Inc. since January 2015. Mr. Benton previously served as Senior Vice President of Manufacturing and Operations Support from January 2011 until January 2015, Vice President of Manufacturing from July 2001 until January 2011, and Director of Manufacturing from August 1993 until July 2001. Prior to that time Mr. Benton served in several manufacturing and operational management positions including regional manufacturing coordinator, bakery vice president of operations, director of manufacturing, and manufacturing manager at various locations throughout the company since 1980. |
|
|
|
H. Mark Courtney Age Senior Vice President of Sales |
| Mr. Courtney has been Senior Vice President of Sales of Flowers Bakeries since April of 2008. Prior to that time Mr. Courtney served in various sales, marketing, and operations positions, including Executive Vice President of Flowers Snack Group. Mr. Courtney joined the company in 1983. |
|
|
|
David A. Hubbard Age Senior Vice President and Chief Information Officer |
| Mr. Hubbard has been Senior Vice President and Chief Information Officer of Flowers Foods since December 2012. Prior to that he served as Vice President and Chief Information Officer from October 2011 to December of 2012. He previously served as Vice President, IT Technology and Development in 2011. Prior to that time, Mr. Hubbard was the IT Director, SAP Technology and eBusiness from 2003 through early 2011. |
|
|
|
Karyl H. Lauder Age Senior Vice President and Chief Accounting Officer |
| Ms. Lauder has been Senior Vice President and Chief Accounting Officer of Flowers Foods since May 2008. Ms. Lauder previously served as Vice President and Chief Accounting Officer of Flowers Foods from September 2007 to May 2008. Ms. Lauder previously served as Vice President and Operations Controller of Flowers Foods from 2003 to 2007. Prior to that time, she served as Division Controller for Flowers Bakeries Group from 1997 to 2003. Prior to that time, Ms. Lauder served as a Regional Controller for Flowers Bakeries after serving as Controller and in other accounting supervisory positions at various bakery locations since 1978. |
|
|
|
Craig Parr Age Senior Vice President of Finance and Chief Risk Officer |
| Mr. Parr has been Senior Vice President of Finance and Chief Risk Officer since October 2012. Prior to joining Flowers Foods, Inc., Mr. Parr was with The Andersons, Inc. for 20 years, where he served as vice president of risk management and food ingredient supply, and in various leadership positions in accounting, treasury, quantitative analysis and purchasing. |
|
|
|
Dan W. Stone Age Senior Vice President of Logistics and Chief Integration Officer |
| Mr. Stone has been Senior Vice President of Logistics and Chief Integration Officer for Flowers Foods since January 2014. Mr. Stone previously served as Vice President of Logistics and Supply Chain Services from 2005 to 2014 and as Vice President of Purchasing from 2001 to 2005. Prior to that time, Mr. Stone served as Director of Purchasing from 1997 to 2001. From 1995 to mid 1997, Mr. Stone served as Division Controller for Flowers Bakeries after serving as Regional Controller from 1990 to 1995. Prior to that he served in several management positions including Executive Vice President of Operations and Controller at various bakery locations since joining the company in 1979. |
|
|
|
Tonja Taylor Age Senior Vice President of Human Resources |
| Ms. Taylor has been Senior Vice President of Human Resources for Flowers Foods since September 2013. Prior to that time she served as Vice President of Human Resources from 2008 until September 2013. Ms. Taylor began her career with Flowers in 1999 as Change Management Coordinator for a key information technology initiative. She joined the corporate Human Resources team in 2000 and served in various positions including Manager of Organizational Development, Director of Organizational Development, and Managing Director of Human Resources. |
None
The company currently operates 49 bakeries, of which 4647 are owned and threetwo are leased, and one mix plant.leased. We believe our properties are in good condition, well maintained, and sufficient for our present operations. During fiscal 2015,2016, DSD Segment facilities, taken as a whole, operated moderately above capacity and Warehouse Segment facilities operated moderately below capacity. Our production plant locations are:
DSD Segment | |||||
State |
| City |
| State | City |
Alabama |
| Birmingham |
| Louisiana | New Orleans |
Alabama |
| Opelika |
| Maine | Lewiston (2 locations) |
Alabama |
| Tuscaloosa |
| Nevada | Henderson |
Arizona |
| Phoenix |
| North Carolina | Goldsboro |
Arizona |
| Tolleson |
| North Carolina | Jamestown |
Arkansas |
| Batesville |
| North Carolina | Newton |
California |
| Modesto (Leased) |
| Oregon | Milwaukie |
Florida |
| Bradenton |
| Pennsylvania | Oxford |
Florida |
| Jacksonville |
| Pennsylvania | Philadelphia (Leased) |
Florida |
| Lakeland |
| Tennessee | Knoxville |
Florida |
| Miami |
| Texas | Denton |
Georgia |
| Atlanta |
| Texas | El Paso |
Georgia |
| Savannah |
| Texas | Houston (2 locations) |
Georgia |
| Thomasville |
| Texas | San Antonio |
Georgia |
| Villa Rica |
| Texas | Tyler |
Kansas |
| Lenexa |
| Vermont | Brattleboro |
Kentucky |
| Bardstown |
| Virginia | Lynchburg |
Louisiana |
| Baton Rouge |
| Virginia | Norfolk |
Louisiana |
| Lafayette |
|
|
|
Warehouse Segment | |||||
State |
| City |
| State | City |
Alabama |
| Montgomery |
|
|
|
Arizona |
| Mesa (2 locations) |
|
|
|
Arkansas |
| Texarkana |
|
|
|
Georgia |
| Suwanee |
| Tennessee |
|
Georgia |
| Tucker |
|
|
|
In Thomasville, Georgia, the company leases properties that house itsour shared services center and information technology group, and owns itsour corporate headquarters facility.offices.
The company and its subsidiaries from time to time are parties to, or targetsFor a description of lawsuits, claims, investigations and proceedings, which are being handled and defended in the ordinary course of business. While the company is unable to predict the outcome of these matters, it believes, based upon currently available facts, that it is remote that the ultimate resolution of any such pending matters will have a material adverse effect on its overall financial condition, results of operations or cash flows in the future. However, adverse developments could negatively impact earnings in a particular future fiscal period.
The company’s facilities are subject to various federal, state and local laws and regulations regarding the discharge of material into the environment and the protection of the environment in other ways. The company is not a party to any material proceedings arising under these regulations. The company believes that compliance with existing environmental laws and regulations will not materially affect the consolidated financial condition, results of operations, cash flows or the competitive position of the company. The company believes it is currently in substantial compliance with all material environmental regulations affecting the companypending legal proceedings, See Note 21, Commitments and its properties.
On September 12, 2012, a complaint was filed in the U.S. District Court for the Western DistrictContingencies, of North Carolina (Charlotte Division) by Scott Rehberg, Willard Allen Riley and Mario Ronchetti against the company and its subsidiary, Flowers Baking CompanyNotes to Consolidated Financial Statements of Jamestown, LLC. Plaintiffs are or were distributors of our Jamestown subsidiary who contend they were misclassified as independent contractors. The action sought class certification on behalf of a class comprised of independent distributors of our Jamestown subsidiary who are classified as independent contractors. In March 2013, the court conditionally certified the class action for claims under the Fair Labor Standards Act (“FLSA”). On March 23, 2015, the court re-affirmed its FLSA certification decision and also certified claims under state law. On February 12, 2016, the court dismissed the parties’ respective motions for summary judgement with the exception of the plaintiffs’ motions related to a waiver of state wage statute claims and waiver of the right to seek liquidated damages.
At this time, the company is also aware of seventeen other complaints alleging misclassification claims that have been filed. The company and/or its respective subsidiaries are vigorously defending these lawsuits. Given the stage of the complaints and the claims and issues presented, the company cannot reasonably estimate at this time the possible loss or range of loss, if any, that may arise from the unresolved lawsuits.Form 10-K.
Not Applicable
Item 5. | Market for the Registrant’s Common Equity, Related Stockholder Matters and Issuer Purchases of Equity Securities |
Market Information
Shares of Flowers Foods common stock are quoted on the New York Stock Exchange (the “NYSE”) under the symbol “FLO.” The following table sets forth quarterly dividend information and the high and low sale prices of the company’s common stock on the New York Stock ExchangeNYSE as reported in published sources.
|
| Fiscal 2015 |
|
| Fiscal 2014 |
|
| Fiscal 2016 |
|
| Fiscal 2015 |
| ||||||||||||||||||||||||||||||||||||
|
| Market Price |
|
| Dividend |
|
| Market Price |
|
| Dividend |
|
| Market Price |
|
| Dividend |
|
| Market Price |
|
| Dividend |
| ||||||||||||||||||||||||
Quarter |
| High |
|
| Low |
|
|
|
|
|
| High |
|
| Low |
|
|
|
|
|
| High |
|
| Low |
|
|
|
|
|
| High |
|
| Low |
|
|
|
|
| ||||||||
First |
| $ | 23.62 |
|
| $ | 18.66 |
|
| $ | 0.1325 |
|
| $ | 22.22 |
|
| $ | 18.70 |
|
| $ | 0.1125 |
|
| $ | 22.08 |
|
| $ | 15.64 |
|
| $ | 0.1450 |
|
| $ | 23.62 |
|
| $ | 18.66 |
|
| $ | 0.1325 |
|
Second |
| $ | 23.56 |
|
| $ | 20.33 |
|
| $ | 0.1450 |
|
| $ | 21.42 |
|
| $ | 19.71 |
|
| $ | 0.1200 |
|
| $ | 19.80 |
|
| $ | 17.39 |
|
| $ | 0.1600 |
|
| $ | 23.56 |
|
| $ | 20.33 |
|
| $ | 0.1450 |
|
Third |
| $ | 26.27 |
|
| $ | 20.51 |
|
| $ | 0.1450 |
|
| $ | 21.28 |
|
| $ | 17.83 |
|
| $ | 0.1200 |
|
| $ | 19.62 |
|
| $ | 14.35 |
|
| $ | 0.1600 |
|
| $ | 26.27 |
|
| $ | 20.51 |
|
| $ | 0.1450 |
|
Fourth |
| $ | 27.31 |
|
| $ | 21.34 |
|
| $ | 0.1450 |
|
| $ | 20.25 |
|
| $ | 17.46 |
|
| $ | 0.1325 |
|
| $ | 20.10 |
|
| $ | 14.74 |
|
| $ | 0.1600 |
|
| $ | 27.31 |
|
| $ | 21.34 |
|
| $ | 0.1450 |
|
Holders
As of February 18, 2016,16, 2017, there were approximately 3,6743,745 holders of record of our common stock.
Dividends
The payment of dividends is subject to the discretion of our Board of Directors.the Board. The Board of Directors bases its decisions regarding dividends on, among other things, general business conditions, our financial results, contractual, legal and regulatory restrictions regarding dividend payments and any other factors the Board may consider relevant.
Securities Authorized for Issuance Under Equity Compensation Plans
The following chart sets forth the amounts of securities authorized for issuance under the company’s compensation plans as of January 2, 2016.December 31, 2016 (amounts in thousands, except per share data).
Plan Category |
| Number of Securities to be Issued Upon Exercise of Outstanding Options, Warrants and Rights |
|
| Weighted Average Exercise Price of Outstanding Options, Warrants and Rights |
|
| Number of Securities Remaining Available for Future Issuance Under Equity Compensation Plans (Excluding Securities Reflected in Column(a)) |
|
| Number of Securities to be Issued Upon Exercise of Outstanding Options, Warrants and Rights |
|
| Weighted Average Exercise Price of Outstanding Options, Warrants and Rights |
|
| Number of Securities Remaining Available for Future Issuance Under Equity Compensation Plans (Excluding Securities Reflected in Column(a)) |
| ||||||
|
| (a) |
|
| (b) |
|
| (c) |
| |||||||||||||||
|
| (Amounts in thousands, except per share data) |
|
| (a) |
|
| (b) |
|
| (c) |
| ||||||||||||
Equity compensation plans approved by security holders |
|
| 4,353 |
|
| $ | 10.97 |
|
|
| 7,081 |
|
|
| 1,846 |
|
| $ | 10.89 |
|
|
| 6,212 |
|
Equity compensation plans not approved by security holders |
|
| — |
|
|
| — |
|
|
| — |
|
|
| — |
|
|
| — |
|
|
| — |
|
Total |
|
| 4,353 |
|
| $ | 10.97 |
|
|
| 7,081 |
|
|
| 1,846 |
|
| $ | 10.89 |
|
|
| 6,212 |
|
Under the company’s 2014 Omnibus Equity and Incentive Compensation Plan (the “Omnibus Plan”), the Board of Directors is authorized to grant a variety of stock-based awards, including stock options, restricted stock awards and deferred stock, to its directors and certain of its employees. The number of securities set forth in column (c) above reflects securities available for issuance as stock options, restricted stock and deferred stock under the company’s compensation plans. The number of shares originally available under the Omnibus Plan is 8,000,000 shares. The Omnibus Plan replaced the Flowers Foods’ 2001 Equity and Performance Incentive Plan, as amended and restated as of April 1, 2009 (“EPIP”), the Stock Appreciation Rights Plan, and the Annual Executive Bonus Plan. As a result, no additional shares will be issued under the EPIP. See Note 16, Stock-Based Compensation, of Notes to Consolidated Financial Statements of this Form 10-K for additional information on equity compensation plans.
Purchases of Equity Securities by the Issuer
OurThe Board of Directors approved a plan that authorized share repurchases of up to 67.5 million shares of the company’s common stock. In November 2014, the Board increased the company’s share repurchase authorization by 7.1 million shares to a total of 74.6 million shares. At the close of the company’s fourth quarter on January 2,December 31, 2016, 13.76.8 million shares remained available for repurchase under the existing authorization. Under the plan, the company may repurchase its common stock in open market or privately
privately negotiated transactions or under an accelerated repurchase program at such times and at such prices as determined to be in the company’s best interest. These purchases may be commenced or suspended without prior notice depending on then-existing business or market conditions and other factors. The table below provides the shares and cost of the shares acquired during fiscal 2015 by quarter under the plan.
Fiscal Quarter |
| Total Number of Shares Purchased |
|
| Total Dollars of Shares Purchased (amounts in thousands) |
| ||
During the quarter ended April 25, 2015 |
|
| 318,399 |
|
| $ | 6,858 |
|
During the quarter ended July 18, 2015 |
|
| — |
|
| $ | — |
|
During the quarter ended October 10, 2015 |
|
| — |
|
| $ | — |
|
During the quarter ended January 2, 2016 |
|
| — |
|
| $ | — |
|
Total |
|
| 318,399 |
|
| $ | 6,858 |
|
From the inception of the plan through January 2,December 31, 2016, 60.967.8 million shares, at a cost of $504.1$630.4 million, have been purchased. The following chart sets forth the amounts of our common stock purchased by the company during the fourth quarter of fiscal 2016 under the stock repurchase plan.
Period |
| Total Number of Shares Purchased |
|
| Weighted Average Price Per Share |
|
| Total Number of Shares Purchased as Part of Publicly Announced Plan or Programs |
|
| Maximum Number of Shares that May Yet Be Purchased Under the Plan or Programs |
| ||||
October 9, 2016 — November 5, 2016 |
|
| 127 |
| * | $ | 15.09 |
|
|
| 127 |
|
|
| 6,789,280 |
|
November 6, 2016 — December 3, 2016 |
|
| — |
|
|
| — |
|
|
| — |
|
|
| 6,789,280 |
|
December 4, 2016 — December 31, 2016 |
|
| — |
|
|
| — |
|
|
| — |
|
|
| 6,789,280 |
|
Total |
|
| 127 |
|
| $ | 15.09 |
|
|
| 127 |
|
|
|
|
|
* | All shares purchased by the company during the twelve weeks ended December 31, 2016 were acquired to satisfy employees’ tax withholding and payment obligations in connection with the vesting of awards of performance share awards, which are repurchased by the company based on their fair market value on the vesting date. |
The chart below is a comparison of the cumulative total return (assuming the reinvestment of all dividends paid) of our common stock, Standard & Poor’s 500 Index, Standard & Poor’s 500 Packaged Foods and Meats Index, and Standard & Poor’s MidCap 400 Index for the period January 1,December 31, 2011 through December 31, 2015,2016, the last trading day of our 20152016 fiscal year.

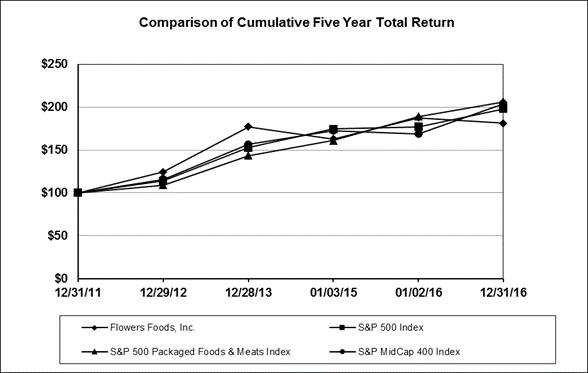
|
| January 1, 2011 |
|
| December 31, 2011 |
|
| December 29, 2012 |
|
| December 28, 2013 |
|
| January 3, 2015 |
|
| January 2, 2016 |
|
| December 31, 2011 |
|
| December 29, 2012 |
|
| December 28, 2013 |
|
| January 3, 2015 |
|
| January 2, 2016 |
|
| December 31, 2016 |
| ||||||||||||
FLOWERS FOODS INC |
|
| 100.00 |
|
|
| 109.03 |
|
|
| 135.67 |
|
|
| 193.29 |
|
|
| 177.71 |
|
|
| 204.69 |
|
|
| 100.00 |
|
|
| 124.43 |
|
|
| 177.28 |
|
|
| 163.00 |
|
|
| 187.75 |
|
|
| 181.22 |
|
S&P 500 INDEX |
|
| 100.00 |
|
|
| 102.11 |
|
|
| 116.48 |
|
|
| 156.23 |
|
|
| 178.27 |
|
|
| 180.78 |
|
|
| 100.00 |
|
|
| 114.07 |
|
|
| 153.00 |
|
|
| 174.58 |
|
|
| 177.04 |
|
|
| 198.21 |
|
S&P 500 PACKAGED FOODS & MEAT INDEX |
|
| 100.00 |
|
|
| 117.19 |
|
|
| 127.85 |
|
|
| 168.27 |
|
|
| 188.79 |
|
|
| 221.58 |
|
|
| 100.00 |
|
|
| 109.10 |
|
|
| 143.59 |
|
|
| 161.10 |
|
|
| 189.08 |
|
|
| 206.35 |
|
S&P MIDCAP 400 INDEX |
|
| 100.00 |
|
|
| 98.27 |
|
|
| 114.01 |
|
|
| 153.92 |
|
|
| 169.65 |
|
|
| 166.09 |
|
|
| 100.00 |
|
|
| 116.02 |
|
|
| 156.63 |
|
|
| 172.65 |
|
|
| 169.02 |
|
|
| 204.07 |
|
Companies in the S&P 500 Index, the S&P 500 Packaged Foods and Meats Index, and the S&P MidCap 400 Index are weighted by market capitalization and indexed to $100 at January 1,December 31, 2011. Flowers Foods’ share price is also indexed to $100 at January 1,December 31, 2011. These prices have been adjusted for stock splits.
The selected consolidated historical financial data presented below as of and for the fiscal years 2016, 2015, 2014, 2013, 2012, and 20112012 have been derived from the audited Consolidated Financial Statements of the company. The results of operations presented below are not necessarily indicative of results that may be expected for any future period and should be read in conjunction with Management’s Discussion and Analysis of Financial Condition and Results of Operations, and our Consolidated Financial Statements and the accompanying Notes to Consolidated Financial Statements included in this Form 10-K.10-K (amounts in thousands, except per share data).
|
| For Fiscal Year |
| |||||||||||||||||||||||||||||||||||||
|
| Fiscal 2015 |
|
| Fiscal 2014 |
|
| Fiscal 2013 |
|
| Fiscal 2012 |
|
| Fiscal 2011 |
|
| For Fiscal Year |
| ||||||||||||||||||||||
|
| 52 Weeks |
|
| 53 Weeks |
|
| 52 Weeks |
|
| 52 Weeks |
|
| 52 Weeks |
|
| Fiscal 2016 |
|
| Fiscal 2015 |
|
| Fiscal 2014 |
|
| Fiscal 2013 |
|
| Fiscal 2012 |
| ||||||||||
|
| (Amounts in thousands, except per share data) |
|
| 52 Weeks |
|
| 52 Weeks |
|
| 53 Weeks |
|
| 52 Weeks |
|
| 52 Weeks |
| ||||||||||||||||||||||
Statement of Income Data: |
|
|
|
|
|
|
|
|
|
|
|
|
|
|
|
|
|
|
|
|
|
|
|
|
|
|
|
|
|
|
|
|
|
|
|
|
|
|
|
|
Sales |
| $ | 3,778,505 |
|
| $ | 3,748,973 |
|
| $ | 3,732,616 |
|
| $ | 3,031,124 |
|
| $ | 2,759,367 |
|
| $ | 3,926,885 |
|
| $ | 3,778,505 |
|
| $ | 3,748,973 |
|
| $ | 3,732,616 |
|
| $ | 3,031,124 |
|
Net income |
| $ | 189,191 |
|
| $ | 175,739 |
|
| $ | 230,894 |
|
| $ | 136,121 |
|
| $ | 123,428 |
|
| $ | 163,776 |
|
| $ | 189,191 |
|
| $ | 175,739 |
|
| $ | 230,894 |
|
| $ | 136,121 |
|
Net income attributable to Flowers Foods, Inc. common shareholders per basic share |
| $ | 0.90 |
|
| $ | 0.84 |
|
| $ | 1.11 |
|
| $ | 0.66 |
|
| $ | 0.61 |
|
| $ | 0.79 |
|
| $ | 0.90 |
|
| $ | 0.84 |
|
| $ | 1.11 |
|
| $ | 0.66 |
|
Net income attributable to Flowers Foods, Inc. common shareholders per diluted share |
| $ | 0.89 |
|
| $ | 0.82 |
|
| $ | 1.09 |
|
| $ | 0.66 |
|
| $ | 0.60 |
|
| $ | 0.78 |
|
| $ | 0.89 |
|
| $ | 0.82 |
|
| $ | 1.09 |
|
| $ | 0.66 |
|
Cash dividends per common share |
| $ | 0.5675 |
|
| $ | 0.4850 |
|
| $ | 0.4440 |
|
| $ | 0.4200 |
|
| $ | 0.3890 |
|
| $ | 0.6250 |
|
| $ | 0.5675 |
|
| $ | 0.4850 |
|
| $ | 0.4440 |
|
| $ | 0.4200 |
|
Balance Sheet Data: |
|
|
|
|
|
|
|
|
|
|
|
|
|
|
|
|
|
|
|
|
|
|
|
|
|
|
|
|
|
|
|
|
|
|
|
|
|
|
|
|
Total assets |
| $ | 2,885,168 |
|
| $ | 2,408,974 |
|
| $ | 2,504,014 |
|
| $ | 1,995,849 |
|
| $ | 1,553,998 |
|
| $ | 2,761,068 |
|
| $ | 2,844,051 |
|
| $ | 2,408,974 |
|
| $ | 2,504,014 |
|
| $ | 1,995,849 |
|
Long-term debt and capital lease obligations |
| $ | 933,932 |
|
| $ | 728,940 |
|
| $ | 892,478 |
|
| $ | 535,016 |
|
| $ | 283,406 |
|
| $ | 946,667 |
|
| $ | 930,022 |
|
| $ | 724,459 |
|
| $ | 887,740 |
|
| $ | 531,194 |
|
Notes to the Selected Financial Data table for additional context
| 1. | During 2016, the company adopted new guidance that reclassified debt issuance costs as a reduction to the carrying amount of debt obligations and deferred tax assets and liabilities as one noncurrent amount on the Consolidated Balance Sheet. The table above presents all prior periods revised in accordance with this new guidance. |
2. | Fiscal 2016 includes the impact of a $6.6 million pension settlement loss, $24.9 million of impairment charges, $10.5 million of accrued legal settlements (including $0.3 million of related tax liabilities) which affect comparability, the issuance of our $400.0 million senior notes due 2026, and $1.9 million of debt issuance costs recognized as interest expense (for a loss on extinguishment of debt) at the time we paid off $367.5 million of outstanding indebtedness under two of our term loans. |
3. | Fiscal 2015 includes the results of DKB and Alpine as of and from the date of each acquisition. |
|
| During the fourth quarter of fiscal 2014, we revised net sales. Historically, certain immaterial discounts had been recorded as an expense to selling, distribution and administrative costs. These discounts are now recorded as contra revenue. These revisions were made for all periods presented in the fiscal 2014 Form 10-K. |
|
| Fiscal 2014 includes the impact of a $15.4 million pension settlement loss. |
|
| Fiscal 2013 includes the recording of a bargain purchase gain of $50.1 million at the time of the Sara Lee California acquisition. |
|
| Fiscal 2013 includes the results of Modesto, Sara Lee California, and the Acquired Hostess Bread Assets as of and from the date of each acquisition. |
|
| Fiscal 2012 includes the results of Lepage as of and from the date of the acquisition. |
|
| Fiscal 2012 includes the issuance of our $400.0 million senior notes due 2022. |
|
|
The following discussion should be read in conjunction with the Selected Financial Data included hereinItem 1., Business, and the Consolidated Financial Statements and accompanying Notes to Consolidated Financial Statements included in this Form 10-K. The following information contains forward-looking statements which involve certain risks and uncertainties. See Forward-Looking Statements at the beginning of this Form 10-K.
Overview:
Management’s Discussion and Analysis of Financial Condition and Results of Operations (“MD&A”) is segregated into four sections, including:
|
|
Executive overview — provides a summary of our operating performance and cash flows, industry trends, and our strategic initiatives.
|
|
Critical accounting estimates — describes the accounting areas where management makes critical estimates to report our financial condition and results of operations.
|
|
Results of operations — an analysis of the company’s consolidated results of operations for the two comparative periods presented in the Consolidated Financial Statements.
| Liquidity, MATTERS AFFECTING COMPARABILITY Detailed below are matters affecting comparability as well as other |
There were several significant events that will provide additional context while reading this discussion.discussion:
| Fiscal 2016 |
|
| Fiscal 2015 |
|
| Fiscal 2014 |
| |||
| 52 weeks |
|
| 52 weeks |
|
| 53 weeks |
| |||
| (Amounts in thousands) |
| |||||||||
Impairment of assets | $ | 24,877 |
|
| $ | 3,771 |
|
| $ | 10,308 |
|
Facility closure costs/Gain on divestiture |
| — |
|
|
| 736 |
|
|
| (1,007 | ) |
Pension plan settlement losses |
| 6,646 |
|
|
| — |
|
|
| 15,387 |
|
Acquisition-related costs |
| — |
|
|
| 6,187 |
|
|
| — |
|
Legal settlements and related tax liabilities |
| 10,500 |
|
|
| — |
|
|
| — |
|
Loss on extinguishment of debt |
| 1,900 |
|
|
| — |
|
|
| — |
|
| $ | 43,923 |
|
| $ | 10,694 |
|
| $ | 24,688 |
|
Impairment of assets. The table below details asset impairments recorded in fiscal 2016, 2015 and 2014, all of which related to assets of the DSD Segment. In fiscal 2016, we recorded asset impairment charges for certain trademarks acquired in the Lepage and Acquired Hostess Bread Assets acquisitions, primarily resulting from a brand rationalization initiative which is part of Project Centennial (discussed below). We also recorded impairments on certain assets held for sale, which were subsequently sold for proceeds of $7.4 million. Asset impairment charges recorded in fiscal 2015 related to assets held for sale and a production line that we no longer intended to use. During fiscal 2014, asset impairment charges related to certain assets held for sale and goodwill associated with our tortilla facility in Ft. Worth, Texas that we sold.
| Fiscal 2016 |
|
| Fiscal 2015 |
|
| Fiscal 2014 |
| |||
| 52 weeks |
|
| 52 weeks |
|
| 53 weeks |
| |||
| (Amounts in thousands) |
| |||||||||
Property, plant and equipment impairments | $ | 9,877 |
|
| $ | 3,771 |
|
| $ | 7,684 |
|
Trademark impairments |
| 15,000 |
|
|
| — |
|
|
| — |
|
Goodwill impairments |
| — |
|
|
| — |
|
|
| 2,624 |
|
| $ | 24,877 |
|
| $ | 3,771 |
|
| $ | 10,308 |
|
Legal settlements. In fiscal 2016, we reached agreements to settle Rehberg et al. v. Flowers Foods, Inc. and Flowers Baking Company of Jamestown, LLC, a class action lawsuit, for $9.0 million and Bokanoski et al. v. Lepage Bakeries, LLC and CK Sales Co., LLC for $1.25 million. Both settlements include attorneys’ fees and remain subject to court approval. Additionally, we have accrued $0.3 million of related tax liabilities. These settlements are recorded in our DSD Segment’s selling, distribution and administrative expenses in our Consolidated Statements of Income for fiscal 2016. See Note 21, Commitments and Contingencies, of Notes to Consolidated Financial Statements of this Form 10-K for additional information.
Issuance of $400.0 million of senior notes and payoff of existing term loans. On September 28, 2016, we issued $400.0 million of ten year senior notes (the “2026 notes”) which bear interest at 3.50% per annum. Proceeds from the 2026 notes were used to repay debt currently outstanding under our existing term loan facilities and for general corporate purposes, including repayment of a portion of our accounts receivable securitization facility (“the facility”). Debt issuance costs of $1.9 million associated with the term loan facilities were recorded as interest expense in our fiscal 2016 results of operations. See Note 12, Debt, Lease and Other Commitments, of Notes to Consolidated Financial Statements of this Form 10-K for additional information.
Project Centennial, an enterprise-wide business and operational review. During the second quarter of fiscal 2016, we partnered with a globally recognized consulting firm to perform an enterprise-wide business and operational review to evaluate opportunities to streamline our operations, drive efficiencies and invest in strategic capabilities that we believe will strengthen our competitive position and drive profitable revenue growth. We have completed the diagnostic phase of Project Centennial and have begun the implementation phase. Consulting costs associated with the project in fiscal 2016 were $6.3 million and we anticipate costs to be in the range of $25 million to $30 million in fiscal 2017. These costs were and will continue to be reflected in the selling, distribution and administrative expenses line item of the Consolidated Statements of Income. For additional information regarding Project Centennial, see the “Executive Overview” section below.
Pension plan settlement losses. At the beginning of fiscal 2016, the company began offering retired and terminated vested pension plan participants not yet receiving their benefit payments the option to elect to receive their benefit as a single lump sum payment. Lump sum distributions paid during fiscal 2016 triggered settlement charges of $6.6 million for fiscal 2016. Additional settlement charges may be recorded in fiscal 2017 depending on the level of lump sum payment options elected by the eligible plan participants. In fiscal 2014, the company offered a one-time voluntary lump sum offer which resulted in a $15.4 million settlement loss. See Note 19, Postretirement Plans, of Notes to Consolidated Financial Statements of this Form 10-K for additional information.
Nationwide launch of Dave’s Killer Bread brand. On April 25, 2016, the beginning of the second quarter of fiscal 2016, we began the national rollout of our organic, non-GMO DKB brand on our DSD network. We have completed the launch of the DKB products and as of December 31, 2016 these products were available in over 17,000 stores within our DSD geographic footprint. Sales of the DKB brand, including sales from the nationwide launch, were included in acquisition sales until the first anniversary of the acquisition on September 12, 2016. After this date, these sales were and will continue to be included in core or expansion markets (defined as markets we entered in the last five years) as determined by the market in which they are sold.
Conversion of our Tuscaloosa, Alabama bakery to organic production. At the end of the first quarter of fiscal 2016, we completed the conversion of our Tuscaloosa, Alabama plant to an all-organic production facility. We incurred start-up costs related to the conversion of approximately $2.5 million, of which $0.3 million is included in depreciation and amortization expense and the remainder is included in materials, supplies, labor and other production costs in our Consolidated Statement of Income for fiscal 2016. The plant began producing for the market at the beginning of the second quarter of fiscal 2016.
Accelerated Share Repurchase program. In fiscal 2016, we completed an accelerated share repurchase (“ASR”) program, repurchasing 6.5 million shares of our common stock for $120.0 million. The ASR was funded with borrowings from our existing credit facilities and cash on hand. See Note 15, Stockholders’ Equity, of Notes to Consolidated Financial Statements of this Form 10-K for additional information.
Alpine Valley Bread Company acquisition. On October 13, 2015, we completed the acquisition of Alpine, a family-owned producer of certified organic and all-natural breads in the U.S., for $121.9 million in cash and stock. Alpine has two production facilities in Mesa, Arizona and is included in the Warehouse Segment. The acquisition expands our penetration into the organic market and provides additional organic production capacity. We funded the cash portion of the purchase price for the Alpine acquisition with our existing credit facilities and also issued 481,540 shares of our common stock to fund the equity portion of the purchase price.
Dave’s Killer Bread acquisition. On September 12, 2015, we completed the acquisition of DKB for total cash payments of $282.1 million inclusive of payments for certain tax benefits. We believe the acquisition strengthens our position as the second-largest baker in the U.S. by giving us greater access to the fast growing organic bread category and expanding our geographic reach into the Pacific Northwest. DKB operates one production facility in Milwaukie, Oregon and is included in the DSD Segment. We funded the purchase price of the DKB acquisition with cash on hand and borrowings from our existing credit facilities.
Reporting Periods. The company operates on a 52-53 week fiscal year ending the Saturday nearest December 31. Fiscal 2016 and 2015 consisted of 52 weeks. Fiscal 2014 was a 53 weeks. Fiscal 2017 will consist of 52 weeks. The sales impact in our Consolidated Statements of Income for fiscal 2014 week year while53 was $63.2 million. The DSD Segment and Warehouse Segment impact of week 53 was $53.4 million and $9.8 million, respectively, in fiscal 2015 and2014. The impact of week 53 to fiscal 2013 were 52 week years. These events include:2014 earnings per share was approximately $0.01 per share.
|
|
|
|
|
|
|
|
|
|
|
|
|
|
|
|
|
|
|
| Divestiture. Subsequent to our fiscal year end, on January 14, 2017, we completed the sale of our mix plant in Cedar Rapids, Iowa, for $44.0 million, subject to finalizing a working capital adjustment. This resulted in a preliminary gain on sale in the range of approximately $31.0 million to $33.0 million which will be recognized in our results of operations in the first quarter of fiscal 2017. The mix plant was included in the Warehouse Segment. The plant’s property, plant and equipment was reflected in assets held for sale in the Consolidated Balance Sheet at December 31, 2016. EXECUTIVE OVERVIEW We are the second largest producer and marketer of packaged bakery foods in the U.S. with fiscal 2016 sales of $3.9 billion. We operate in the highly competitive fresh bakery market and our product offerings include fresh breads, buns, rolls, snack cakes and tortillas, as well as frozen breads and rolls. Our business is managed based on delivery method of our products and we have two segments: DSD Segment and Warehouse Segment. We operate 49 plants |
Business
Flowers is focused on opportunities for growth within the baked foods category and seeks to have its products available wherever baked foods are consumed — whether in homes, restaurants, fast food outlets, institutions, or vending machines. The company has 49 operating bakeries in 18 states that produce a wide range of breads, buns, rolls, snack cakes, and tortillas. See Item 1., Business, of this Form 10-K for information regarding our segments, customers and brands, business strategies, strengths and core competencies, and competition and risks.
SegmentsSummary of Operating Results, Cash Flows and Delivery MethodsFinancial Condition:
The company has two business segments that reflect its two distinct methodsSales increased 3.9% in fiscal 2016 due to the DKB and Alpine acquisitions, both completed in the second half of delivering products to market. DSD Segment products are soldfiscal 2015, and delivered fresh to customers through a network of independent distributors who are incentivized to grow sales and to build equity in their distributorships. The DSD Segment reaches approximately 85%the nationwide launch of the U.S. populationDKB brand in our DSD markets in fiscal 2016. Sales increased 0.8% in fiscal 2015 due to the DKB and Alpine acquisitions, partially offset by the impact of the additional week in fiscal 2014.
Net income in fiscal 2016 decreased 13.4% as compared to fiscal 2015 primarily due to higher asset impairment charges, and increased legal costs attributable to ongoing and additional litigation, including distributor lawsuits, and related legal settlements. Additionally, increased consulting costs and pension settlement losses incurred in the current year negatively impacted net income in fiscal 2016, partially offset by prior year acquisition-related costs. Fiscal 2015 net income increased 7.7% largely due to both the pension settlement loss and higher asset impairment charges recorded in fiscal 2014, partially offset by the acquisition-related costs incurred in fiscal 2015.
In fiscal 2016, we generated net cash flows from operations of $346.0 million. We invested $101.7 million in capital expenditures. We converted certain of our variable rate, shorter-term debt arrangements to significantly longer-term, fixed rate debt with fresh bakery foods. The Warehouse Segment ships fresh and frozen products to customers’ warehouses nationwide. Customers then distribute these products to their depots, stores, or restaurants. Flowers’ bakeries fall into either the DSD Segment or Warehouse Segment depending onissuance of the primary method of delivery used to sell their products.
The DSD Segment operates a highly involved system of reciprocal baking whereby each bakery has an assigned production mission to produce certain items for its own market as well as for other DSD Segment bakeries’ markets2026 notes and the Warehouse Segment. This system allowspayoff of our term loans. Additionally, we extended the maturity of the facility to September 28, 2018 and reduced our total indebtedness $55.6 million. In fiscal 2016, we repurchased 6.9 million shares of our common stock for long$126.3 million and efficient production runs that help the company maintain its position as a low-cost producer. Bakeries within regional networks exchange products overnight through a third-party transportation system so that at the beginning of each sales day every DSD Segment bakery has a full complement of fresh productspaid $131.1 million in dividends to our shareholders. In fiscal 2015, we generated $318.3 million in net cash flows from operations, paid $390.2 million for the independent distributor to provide to retailcash portion of the DKB and foodservice customers.
The company hasAlpine acquisitions, invested significant capital in its bakeries for several decades to ensure its production is as efficient as possible, uses technology effectively, provides consistently excellent quality, and offers a good working environment for team members. In fiscal years 2015, 2014, and 2013, the company had capital expenditures of $90.8 million, $83.8paid dividends of $120.4 million and $99.2 million, respectively.increased our net borrowings $247.0 million.
ConsumersIndustry Trends
The chart below details the sales change in dollars and units of the Fresh Packaged Breads category for the years 2014, 2015 and 2016 (year ago – “YA”):
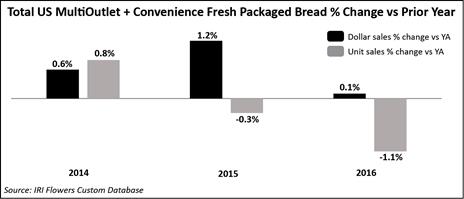
We hold a 14.9 dollar share of the Fresh Packaged Breads category. (Source: Flowers Custom Database – IRI Total US MultiOutlet + Convenience Store for calendar year 2016 ending 1/1/17)
• | We hold an 8.6 dollar share of the Commercial Cake category. (Source: Flowers Custom Database – IRI Total US MultiOutlet + Convenience Store for calendar year 2016 ending 1/1/17) |
We expect stable consumer demand for fresh baked bakery foods.
The Fresh Packaged Breads category is highly competitive.
We anticipate our growth will be driven by our organic bread brands, partially offset by softer demand for some of our other product offerings.
Project Centennial Strategic Initiatives
Capitalizing on consumer preferences is conducted and outside resources are engaged to help ensure our bakery products remainproduct adjacencies – by focusing on trend
with consumers’ changing taste, texture, and flavor trends. Our marketing, quality assurance, and research and development teams collaborate regularly as new products are considered, developed, tested, and introduced.
Brands are important ingrowing segments of the bakery category, such as foodservice, in-store bakery, impulse items and the company has invested over several decadeshealthy snacks.
Reducing costs to fuel growth – by reducing complexity and better leveraging scale to lower costs.
Developing leading capabilities – by centralizing our operations and investing in itstechnology to become a more analytics-focused company.
Our priorities are to simplify and streamline our brand portfolio through advertising, promotion, and packaging. Nature’s Own, introduced in 1977, was developed to address the emerging trend of consumers demanding baked foods with a healthier profile. Nature’s Own, from inception, has offered baked foods with no artificial flavors, colors, or preservatives.
On October 13, 2015, we completed the acquisition of Alpine and their product line of super premium organic and all-natural bread products. These products, which are warehouse delivered, are marketed under the Alpine Valley Bread brand and further extend our organic product line.
On September 12, 2015, we completed the DKB acquisition, which includes a full product line of super premium whole-grain 100% organic and non-GMO bakery products sold under the Dave’s Killer Bread label, the leading organic bread brand in the U.S.
On July 19, 2013, we completed the acquisition of the Acquired Hostess Bread Assets, which included the Wonder, Merita, Home Pride and Butternut brands. These brands were taken off the market when Hostess ceased operations in November 2012. Late in the third quarter of fiscal 2013, we began re-introducing these brandsassortment, provide additional tools to the marketplace within our DSD Segment. We planindependent distributors to continueenable them to re-introduce these brands as we expand into new markets.
Snack cakes have been partgrow their businesses, reduce costs of the company’s product offerings since at least the early 1920s. Inpurchased goods and services and put in place a more recent years, snack cakes have been developed and introduced under several brands, such as Blue Bird and Mrs. Freshley’s. In 2011, the company acquired Tasty Baking Co. (“Tasty”) and its extensive line of Tastykake branded snack cakes. Since the acquisition of Tasty, we have expanded the distribution of the Tastykake products throughout our territories and expect to continue this expansion.
In 2014, we re-branded the Cobblestone Mill brand to the Cobblestone Bread Company brand. There were twelve core products and other regional favorites at introduction. This brand includes restaurant and sandwich shop inspired breads and rolls. We completed the roll-out to the full market in July 2014.
Strengths and core competencies
We aim to achieve consistent and sustainable growth in sales and earnings by focusing on improvements in theefficient operating results of our existing bakeries and, after detailed analysis, acquiring companies and properties that add value to the company. We believe this strategy has resulted in consistent and sustainable growth that will continue to build value for our shareholders.
The company is also committed to maintaining a collaborative, in-house information technology team, as well as certain outsourced services, that meets all of our bakeries’ needs and maximizes efficiencies. The consumer packaged goods industry has used PBS over several years to share information between the supplier and retailer. An extension of this technology allows the retailer to pay the supplier when the consumer purchases the goods rather than at the time they are delivered to the retailer. In addition, PBS permits the manufacturer to more accurately track trends in product sales and manage inventory. In fiscal years 2015, 2014, and 2013, the company recorded $1.2 billion, $1.2 billion, and $1.1 billion, respectively, in sales through PBS.
We regularly articulate our core business strategies to the investment community and internally to our team members, including long-term (five-year) goals. Compensation and bonus programs are linked to the company’s short and long-term goals. The majority of our employees participate in an annual formula-driven, performance-based cash bonus program. In addition, certain employees participate in a long-term incentive program that provides performance-contingent common stock awards that generally vest over a two-year period. We believe these incentive programs provide both a short and long-term goal for our most senior management team and aligns their interests with those of our shareholders.
We believe our highly automated bakeries, with teams that focus on quality, bake products that meet consumers’ needs. We strive to maintain and exceed service levels for our customers, consumers, and suppliers. The design of our delivery systems and segments permits us to allocate management time and resources to meet marketplace expectations.
Competition and risks
Hostess’ liquidation in late November 2012 impacted the industry as Hostess sales shifted to other providers to meet marketplace needs. These providers included Flowers, Grupo Bimbo (with Sara Lee, Arnolds, Thomas, and Entenmann’s brands), Campbell Soup Company (with the Pepperidge Farm brand), McKee Foods Corporation (Little Debbie) and smaller regional bakeries, retailer-owned bakeries, and store brands. Certain Hostess cake products were re-introduced into the market in July 2013 by a new and
separate company, Hostess Brands, LLC (“Hostess LLC”), formed by the outside investment group of Apollo Global Management and C. Dean Metropoulous & Co.
Sales are principally affected by pricing, quality, brand recognition, new product introductions, product line extensions, marketing, and service. Sales for fiscal 2015 increased 0.8% as compared to fiscal 2014. This change was due to both volume increases and the DKB and Alpine acquisition contribution, partially offset by the lack of a 53rd week in fiscal 2015 as compared to fiscal 2014.
Commodities, such as our baking ingredients, periodically experience price fluctuations. The cost of these inputs may fluctuate widely due to government policy and regulation, weather conditions, domestic and international demand, or other unforeseen circumstances. We enter into forward purchase agreements and other derivative financial instruments in an effort to manage the impact of such volatility in raw material prices. Any decrease in the availability of these agreements and instruments could increase the effective price of these raw materials to us and significantly affect our earnings.model.
Critical Accounting Estimates
Note 2, Summary of Significant Accounting Policies, of the Notes to Consolidated Financial Statements of this Form 10-K includes a summary of the significant accounting policies and methods used in the preparation of the company’s Consolidated Financial Statements.
The company’s discussion and analysis of its results of operations and financial condition are based upon the Consolidated Financial Statements of the company, which have been prepared in accordance with generally accepted accounting principles in the United States (“GAAP”). The preparation of these financial statements requires the company to make estimates and assumptions that affect the reported amounts of assets, liabilities, revenues and expenses, and related disclosure of contingent assets and liabilities at the date of the financial statements and the reported amounts of the revenues, expenses, and cash flows during the reporting period. On an ongoing basis, the company evaluates its estimates, including those related to customer programs and incentives, bad debts, raw materials, inventories, long-lived assets, intangible assets, income taxes, restructuring, pensions and other post-retirement benefits, and contingencies and litigation. The company bases its estimates on historical experience and on various other assumptions that are believed to be reasonable under the circumstances, the results of which form the basis for making judgments about the carrying values of assets and liabilities that are not readily apparent from other sources. Actual results may differ from these estimates.
The selection and disclosure of the company’s critical accounting estimates have been discussed with the company’s audit committee. The following, in no particular orderNote 2, Summary of importance, isSignificant Accounting Policies, of Notes to Consolidated Financial Statements of this Form 10-K includes a reviewsummary of the critical assumptions and estimates, and thesignificant accounting policies and methods listed below, which are used in the preparation of the Consolidated Financial Statements:Statements. The following table lists, in no particular order of importance, areas of critical assumptions and estimates used in the preparation of the Consolidated Financial Statements. Additional detail can be found in the following notes:
Critical Accounting Estimate |
|
|
| |
Revenue recognition |
|
|
|
Derivative instruments |
|
|
| |
Long-lived assets | — | |||
Goodwill and other intangible | ||||
|
|
| |
Self-insurance reserves |
|
|
| |
Income tax expense and | ||||
|
|
| |
Postretirement plans |
|
|
| |
Stock-based compensation |
|
|
| |
Commitments and | 21 | |||
Revenue Recognition. The company recognizes revenue from the sale of its products at the time of delivery when title and risk of loss pass to the customer.customer or consumer. The company records both direct and estimated reductions to gross revenue for customer programs and incentive offerings at the time the incentive is offered or at the time of revenue recognition for the underlying transaction that results in progress by the customer towards earning the incentive. These allowances include price promotion discounts, coupons, customer rebates, cooperative advertising, and product returns. Price promotion discount expense is recorded as a reduction to gross sales when
the discounted product is sold to the customer. If market conditions were to decline, the company may take actions to increase incentive offerings, possibly resulting in an incremental reduction of revenue.
The consumer packaged goods industry has used scan-based trading technology over several years to share information between the supplier and retailer. An extension of this technology allows the retailer to pay the supplier when the consumer purchases the goods rather than at the time they are delivered to the retailer. Consequently, revenue on these sales is not recognized until the product is purchased by the consumer. This technology is referred to as PBS. The company began a pilot program in fiscal 1999, working with
certain retailers to develop the technology to execute PBS, and there has been a sharp increase in its use since that time. In fiscal 2015, the company recorded $1.2 billion in sales through PBS. The company will continue to implement PBS technology for current PBS customers as they open new retail stores during 2016. In addition, new PBS customers will begin implementation during 2016. Revenue on PBS sales is recognized when the product is purchased by the end consumer because that is when title and risk of loss is transferred. Non-PBS sales are recognized when the product is delivered to the customer since that is when title and risk of loss is transferred.
Derivative Instruments. The company’s cost of primary raw materials is highly correlated to certain commodities markets. Commodities, such as our baking ingredients, experience price fluctuations. If actual market conditions become significantly different than those anticipated, raw material prices could increase significantly, adversely affecting our results of operations. We enter into forward purchase agreements and other derivative financial instruments qualifying for hedge accounting to manage the impact of volatility in raw material prices. The company measures the fair value of its derivative portfolio using fair value as the price that would be received to sell an asset or paid to transfer a liability in the principal market for that asset or liability. When quoted market prices for identical assets or liabilities are not available, the company bases fair value on internally developed models that use current market observable inputs, such as exchange-quoted futures prices and yield curves.
Valuation of Long-Lived Assets, Goodwill and Other Intangible Assets. The company records an impairment charge to property, plant and equipment, goodwill and intangible assets in accordance with applicable accounting standards when, based on certain indicators of impairment, it believes such assets have experienced a decline in value that is other than temporary. Future adverse changes in market conditions or poor operating results of these underlying assets could result in losses or an inability to recover the carrying value of the asset that may not be reflected in the asset’s current carrying value, thereby possibly requiring impairment charges in the future. AsImpairment charges recorded in fiscal 2016, 2015 and 2014 are discussed above during fiscal 2015, we decided to close a production line at one of our bakeries and transition this production to another facility. We recognized an impairment loss of $1.5 million onin the equipment we no longer intend to use. Based on management’s evaluation, no impairment charges relating to long-lived held and used assets were recorded for fiscal years 2014 or 2013.“Matters Affecting Comparability” section.
The company evaluates the recoverability of the carrying value of its goodwill on an annual basis or at a time when events occur that indicate the carrying value of the goodwill may be impaired using a two-step process. We have elected not to perform the qualitative approach. The first step of this evaluation is performed by calculating the fair value of the business segment, or reporting unit, with which the goodwill is associated. Our reporting units are at the segment level. Each segment consists of several components. These components are aggregated by their respective delivery method into the Warehouse Segment and DSD Segment. These segments rely on reciprocal baking among their components, cross-sellscross-selling their products/brands within the segment, and utilizeutilizing the same delivery method. Marketing, research and development and capital projects are measured at the segment level. We believe these factors support our reporting unit classifications. This fair value is compared to the carrying value of the reporting unit, and if less than the carrying value, the goodwill is evaluated for potential impairment under step two. Under step two of this calculation, goodwill is measured for potential impairment by comparing the implied fair value of the reporting unit’s goodwill, determined in the same manner as a business combination, with the carrying amount of the goodwill.
Our annual evaluation of goodwill impairment requires management judgment and the use of estimates and assumptions to determine the fair value of our reporting units. Fair value is estimated using standard valuation methodologies incorporating market participant considerations and management’s assumptions on revenue, revenue growth rates, operating margins, discount rates, and EBITDA (defined as earnings before interest, taxes, depreciation and amortization). Our estimates can significantly affect the outcome of the test. We perform the fair value assessment using the income and market approach. We use this data to complete a separate fair value analysis for each reporting unit. Changes in our forecasted operating results and other assumptions could materially affect these estimates. This test is performed in ourthe fourth quarter of each fiscal year unless circumstances require this analysis to be completed sooner. The income approach is tested using a sensitivity analysis to changes in the discount rate and yield a sufficient buffer to significant variances in our estimates. The estimated fair values of our reporting units exceeded our carrying values in excess of $700$500 million in each reporting unit in fiscal 2015.2016. Based on management’s evaluation, other than the $2.6 million impairment loss related to our Ft. Worth, Texas tortilla facility discussed above, no other impairment charges relating to goodwill were recorded for the fiscal years 2016, 2015, 2014, or 2013.2014.
In connection with acquisitions, the company has acquired trademarks, customer lists, and non-compete agreements, a portion of which are amortizable. The company evaluates these assets whenever events or changes in circumstances indicate that the carrying amount of the asset may not be recoverable. The undiscounted future cash flows of each intangible asset isare compared to the carrying amount, and if less than the carrying value, the intangible asset is written down to the extent the carrying amount exceeds the fair value. The fair value is computed using the same approach described above for goodwill and includes the same risks and estimates. The fair value of the trademarks could be less than our carrying value if any of our four material assumptions in our fair value analysis: (a) weighted average cost of capital; (b) long-term sales growth rates; (c) forecasted operating margins; and (d) market multiples do not meet our expectations, thereby requiring us to record an asset impairment. We use the multi-period excess earnings and relief from royalty methods to value these intangibles. The method used for impairment testing purposes is consistent with the
valuation method employed at acquisition of the intangible asset. Based on management’s evaluation, no impairment charges relating to amortizable intangible assets were recorded for the fiscal years 2016, 2015, 2014, or 2013.2014.
TheAs of December 31, 2016, the company also owns $414.0$243.0 million of trademarks acquired in acquisitions that are indefinite-lived intangible assets not subject to amortization. A total of $144.0 million of the trademarks were from the Lepage acquisition that occurred in July 2012. A total of $79.5 million and $189.0 million of the trademarks were from the Sara Lee California and the Acquired Hostess Bread Assets acquisitions, respectively, both completed in fiscal 2013. The company evaluates the recoverability by comparing the fair value to the carrying
value of these intangible assets on an annual basis or at a time when events occur that indicate the carrying value may be impaired. In addition, the assets are evaluated to determine whether events and circumstances continue to support an indefinite life. The fair value is compared to the carrying value of the intangible asset, and if less than the carrying value, the intangible asset is written down to fair value. As discussed above, during fiscal 2016, we recorded asset impairment charges of $15.0 million on certain indefinite-lived trademarks acquired in the Lepage and Acquired Hostess Bread Assets acquisitions and determined these trademarks no longer are deemed to have an indefinite life. We will begin amortizing these trademarks in fiscal 2017. During fiscal 2015, in conjunction with the DKB and Alpine acquisitions, we determined that the Barowsky’s trademark acquired in the Lepage acquisition would be used on a more regional basis as an organic brand rather than distributed nationally, and therefore is deemed to have a finite life. We began amortizing this trademark in fiscal 2015.
There are certain inherent risks included in our expectations about the performance of acquired trademarks and brands. If we are unable to implement our growth strategies for these acquired intangible assets as expected, it could adversely impact the carrying value of the brands. The fair value of the trademarks could be less than our carrying value if any of our four material assumptions in our fair value analysis: (a) weighted average cost of capital; (b) long-term sales growth rates; (c) forecasted operating margins; and (d) market multiples do not meet our expectations, thereby requiring us to record an asset impairment. There were no impairmentsImpairment charges recorded onfor indefinite-lived intangible assets not subject to amortization for fiscal 2016, 2015 and 2014 are described above in the fiscal years 2015, 2014 and 2013.“Matters Affecting Comparability” section.
The impairment analysis on the indefinite-lived intangible assets not subject to amortization is very sensitive to the long-term growth rates of the brand. The brands acquired in the Acquired Hostess Bread Assets have been valued based on our expectation of the timing reintroducing the brands. The company is also continually analyzing these brands to determine the expansion markets in which they will be introduced. If the timing of our expansion does not proceed as we currently anticipate, there may be additional impairments related to these brands could become impaired.brands.
Self-Insurance Reserves. We are self-insured for various levels of general liability, auto liability, workers’ compensation, and employee medical and dental coverage. Insurance reserves are calculated on an undiscounted basis and are based on actual claim data and estimates of incurred but not reported claims developed utilizing historical claim trends. Projected settlements and incurred but not reported claims are estimated based on pending claims and historical trends and data. Though the company does not expect them to do so, actual settlements and claims could differ materially from those estimated. Material differences in actual settlements and claims could have an adverse effect on our financial condition and results of operations.
Income Tax Expense and Accruals. The annual tax rate is based on our income, statutory tax rates, and tax planning opportunities available to us in the various jurisdictions in which we operate. Changes in statutory rates and tax laws in jurisdictions in which we operate may have a material effect on the annual tax rate. The effect of these changes, if any, would be recognized when the change takes place.
Deferred income taxes arise from temporary differences between the tax and financial statement recognition of revenues and expenses. Our income tax expense, deferred tax assets and liabilities, and reserve for uncertain tax benefits reflect our best assessment of future taxes to be paid in the jurisdictions in which we operate. The company records a valuation allowance to reduce its deferred tax assets if we believe it is more likely than not that some or all of the deferred assets will not be realized. While the company considers future taxable income and ongoing prudent and feasible tax strategies in assessing the need for a valuation allowance, if these estimates and assumptions change in the future, the company may be required to adjust its valuation allowance, which could result in a charge to, or an increase in, income in the period such determination is made. The company has a deferred tax asset of $4.1 million related to a federal capital loss carryforward. No valuation allowance has been recorded against the asset as we expect to fully utilize the benefit against the capital gain generated by the sale of our mix plant in Cedar Rapids, Iowa that occurred on January 14, 2017.
Periodically, we face audits from federal and state tax authorities, which can result in challenges regarding the timing and amount of income or deductions. We provide reserves for potential exposures when we consider it more likely than not that a taxing authority may take a sustainable position on a matter contrary to our position. We evaluate these reserves on a quarterly basis to ensure that they have been appropriately adjusted for events, including audit settlements that may impact the ultimate payment of such potential exposures. While the ultimate outcome of audits cannot be predicted with certainty, we do not currently believe that current or future audits will have a material adverse effect on our consolidated financial condition or results of operations. The company is no longer subject to federal examination for years prior to fiscal 2012 and is currently under audit for fiscal years 2012 through 2014.2015.
Pension Obligations.Postretirement Plans. The company records pension costs and benefit obligations related to its defined benefit plans based on actuarial valuations. These valuations reflect key assumptions determined by management, including the discount rate, expected long-term rate of return on plan assets and mortality. Material changes in pension costs and in benefit obligations may occur in the future due to experience that is different than assumed and changes in these assumptions.
Effective January 1, 2006, the company curtailed its largest defined benefit plan (Plan(“Plan No. 1)1”) that covered the majority of its workforce. Benefits under this plan are frozen, and no future benefits will accrue under this plan. The company assumed sponsorship of two defined benefit plans as part of the ButterKrust acquisition (2008) and a qualified defined benefit plan as part of the Tasty acquisition (2011); benefits under these plans are frozen, and no future benefits will accrue under these plans. The ButterKrust plans and the Tasty plan were merged into Plan No. 1 effective December 31, 2011 and December 31, 2012, respectively. In addition to Plan No. 1, the company sponsors an ongoing defined benefit pension plan for union employees (Plan(“Plan No. 2)2”) and a frozen nonqualified plan covering former Tasty executives.
The company recorded pension income of $6.0 million on our qualified defined benefit plans for fiscal 2015. We recorded pension cost of $5.6 million for fiscal 2014 (inclusive of a $15.4 million settlement charge for lump sums paid in the fourth quarter of 2014). We expect pension income of approximately $6.2 million on our qualified defined benefit plans for fiscal 2016.
In September 2014, the company announced a one-time voluntary lump sum offer to approximately 2,500 former employees in Plan No. 1 and 2 who had not yet started receiving monthly payments of their vested benefits. The offer supported the company’s pension risk management strategy and reduced plan obligations by 10%. Distributions of $50.4 million in lump sums from existing plan assets for Plan 1 and Plan 2 in December 2014 resulted in a settlement charge of $15.4 million for Plan No. 1 only. No settlement charge was required for Plan No. 2 as the distributions were not in excess of service costs and interest costs for fiscal 2014.
On January 1, 2016, the company began providing retired and terminated vested pension plan participants who have not yet started their payments the option to receive their benefit as a single lump sum payment. Participants can elect this option when they retire or when they leave the company. This change supports our long-term pension risk management strategy. The amountLump sum payments made in 2016 triggered $6.6 million of settlement charges. Depending on the level of lump sum payments made, additional settlement charges may trigger abe recorded in 2017.
The company recorded pension income and settlement chargecharges on our qualified defined benefit plans and nonqualified plan in fiscal 2016, but at this time we are not able to estimate2015 and 2014 as detailed in the possible impact, if any.table below (amounts in thousands). Settlement charges in fiscal 2016 and 2014 were triggered by lump sums paid during those fiscal years. We expect pension income of approximately $5.0 million on our qualified defined benefit plans and nonqualified plan for fiscal 2017 excluding any potential settlement losses.
| Fiscal 2016 |
|
| Fiscal 2015 |
|
| Fiscal 2014 |
| |||
| 52 weeks |
|
| 52 weeks |
|
| 53 weeks |
| |||
Pension income | $ | (4,451 | ) |
| $ | (5,788 | ) |
| $ | (9,825 | ) |
Pension plan settlement losses |
| 6,646 |
|
|
| — |
|
|
| 15,387 |
|
Net pension cost (income) | $ | 2,195 |
|
| $ | (5,788 | ) |
| $ | 5,562 |
|
In 2016, we will refinerefined the method used to estimate service cost and interest cost components of net periodic benefit costs. Historically, we estimated the service cost and interest cost components using a single weighted average discount rate derived from the yield curve used to measure the benefit obligation at the beginning of the period. Going forward,Currently, we will use a spot rate approach to estimate these components of benefit cost by applying the specific spot rates along the yield curve to the relevant projected cash flows, as we believe this provides a better estimate of service and interest costs. We considerconsidered this a change in estimate and accordingly, will accountaccounted for it prospectively startingon a prospective basis beginning in 2016. This change does not affect the measurement of our total benefit obligation. Refining the method used to estimate service cost and interest cost components of net periodic benefit cost reduced total fiscal 2016 cost by approximately $3.2 million.
In developing the expected long-term rate of return on plan assets at each measurement date, the company considers the plan assets’ historical actual returns, targeted asset allocations, and the anticipated future economic environment and long-term performance of individual asset classes, based on the company’s investment strategy. While appropriate consideration is given to recent and historical investment performance, the assumption represents management’s best estimate of the long-term prospective return. Based on these factors, the long-term rate of return assumption for the plans was set at 8.0% for fiscal 2015,2016, as compared with the average annual return on the plans’ assets over the past 15 years of approximately 6.9% (net of expenses). with consistently similar asset allocations. The returns over the last five years of 8.5% have exceeded our expected return on asset estimates. We believe our asset allocation will meet our return estimates over time consistent with past performance and historical asset allocations. The plan has an average annual rate of return since inception in 1987 of 9.1%8.9% (net of expenses). The expected long-term rate of return assumption is based on a target asset allocation of 40-60% equity securities, 10-40% fixed income securities, 0-25% real estate, 0-40% other diversifying strategies (including, absolute return funds, hedged equity funds, and guaranteed insurance contracts), and 0-25% short-term investments and cash. The company regularly reviews such allocations and periodically rebalances the plan assets to the targeted allocation when considered appropriate. Pension costs do not include an explicit expense assumption and the return on assets rate reflects the long-term expected return, net of expenses. For the details of our pension plan assets, see Note 19, Postretirement Plans, of Notes to Consolidated Financial Statements of this Form 10-K.
The company utilizes the Society of Actuaries’ (“SOA”) published mortality tables and improvement scales in developing their best estimates of mortality. In October 2014, the SOA published final reports on their “standard” mortality table (“RP-2014”) and mortality improvement scale (“MP-2014”). In October 2015,2016, the SOA published a revised mortality improvement scale (“MP-2015”MP-2016”). Based on an evaluation of the information released in 2015,2016, the Companycompany updated the mortality assumptions for purposes of measuring pension benefit obligations at year-end 2015.2016. The Companycompany will continue to use the standard mortality tables and mortality improvement scale with adjustments to the base table as applicable: 15%30% adjustment for Plan No. 1, and blue collar adjustment for Plan No. 2.2 and no adjustment for the nonqualified plan. Based on an analysis of the most recent five years of actual experience for Plan No. 1 population of retirees (2011-2015), actual deaths are higher than expected based on the RP-2016 table. The resulting adjustment factor to be applied to the standard mortality rates is 30% for the RP-2016 table, meaning that standard mortality rates were increased
by 30% to reflect this observed experience. Plan No. 2 is made up of union participants (or former union participants); therefore, blue collar adjustments can be applied to the RP-2016 table. The change to the mortality assumption decreased the year-end pension benefit obligations by $6.3$20.2 million.
The company determines the fair value of substantially all of its plans’ assets utilizing market quotes rather than developing “smoothed” values, “market related” values, or other modeling techniques. Plan asset gains or losses in a given year are included with other actuarial gains and losses due to remeasurement of the plans’ projected benefit obligations (“PBO”). If the total unrecognized gain or loss exceeds 10% of the larger of (i) the PBO or (ii) the market value of plan assets, the excess of the total unrecognized gain or loss is amortized over the expected average future lifetime of participants in the frozen pension plans. Prior service cost or credit, which represents the effect on plan liabilities due to plan amendments, is amortized over the average remaining service period of active covered employees. The total unrecognized loss and prior service cost in accumulated other comprehensive income (“AOCI”) as of December 31, 20152016 for the pension plans the company sponsors is $144.1$138.7 million. The company uses a calendar year end for the measurement date since the plans are based on a calendar year and because it approximates the company’s fiscal year end.
Amortization of this unrecognized loss and prior service cost during fiscal 20162017 is expected to be approximately $6.2$6.8 million. To the extent that this unrecognized loss and prior service cost is subsequently recognized, the loss will increase the company’s pension costs in the future.
A sensitivity analysis of fiscal 20152016 pension costs on a pre-tax basis and year-end benefit obligations for our qualified plans is presented in the table below (amounts in thousands) to changes in the discount rate and expected long-term rate of return on plan assets (“EROA”):
Percentage increase (decrease) |
| 0.25% Discount Rate |
|
| (0.25%) Discount Rate |
|
| 0.25% EROA |
|
| (0.25%) EROA |
| ||||
Estimated change in FY 2015 pension costs |
| $ | (121 | ) |
| $ | 116 |
|
| $ | (927 | ) |
| $ | 927 |
|
Estimated change in FY 2015 year-end benefit obligations |
| $ | (11,651 | ) |
| $ | 12,215 |
|
| N/A |
|
| N/A |
| ||
Percentage increase (decrease) |
| 0.25% Discount Rate |
|
| (0.25%) Discount Rate |
|
| 0.25% EROA |
|
| (0.25%) EROA |
| ||||
Estimated change in FY 2016 pension costs |
| $ | (171 | ) |
| $ | 173 |
|
| $ | (876 | ) |
| $ | 876 |
|
Estimated change in FY 2016 year-end benefit obligations |
| $ | (10,530 | ) |
| $ | 11,038 |
|
| N/A |
|
| N/A |
| ||
During 2017, the company does not anticipate making any contributions to our qualified pension plans, but does expect to pay $0.3 million in nonqualified pension benefits from corporate assets.
Stock-based compensation. Stock-based compensation expense for all share-based payment awards granted is determined based on the grant date fair value. The company recognizes these compensation costs net of an estimated forfeiture rate, and recognizes compensation cost only for those shares expected to vest on a straight-line basis over the requisite service period of the award, which is generally the vesting term of the share-based payment award.
Employee grants issued before fiscal 2012 included non-qualified stock options (“NQSOs”) and performance-contingent stock awards (“PSAs”). The NQSOs were valued using a Black-Scholes option-pricing model. The inputs for the model include an expected life, risk-free rate, expected volatility, and dividend yield. The PSAs incorporated a market and performance condition component. However, because of the market condition the expense amount would only change if we determined the performance condition was triggered. The performance condition was always satisfied and adjustments were never made. The market condition was dependent on certain market benchmarks but the expense for these awards never changed.
In fiscal 2013, 2014, and 2015, we grantedWe grant PSAs that separately have a market and performance condition. The expense computed for the total shareholder return shares (“TSR”) is fixed and recognized on a straight-line basis over the vesting period. The expense computed for the return on invested capital (“ROIC”) shares can change depending on the attainment of performance condition goals. The expense for the ROIC shares can be within a range of 0% to 125% of the target. There is a possibility that this expense component will change in subsequent quarters depending on how the company performs relative to the ROIC target. The payouts for the TSR and ROIC shares to be issued in fiscal 20162017 (on the 20142015 awards) are estimated to be 27%0% and 96%87%, respectively. See Note 16, Stock-Based Compensation, of Notes to Consolidated Financial Statements of this Form 10-K for additional information.
Our Chief Executive Officer (“CEO”) received a time-based restricted stock award of approximately $1.3 million in 2013, which will vest 100% on the fourth anniversary of the date of grant provided the CEO remains employed by the company during this time. This award is being expensed on a straight line basis over the four year vesting period.
Commitments and contingencies. The company and its subsidiaries from time to time are parties to, or targets of, lawsuits, claims, investigations and proceedings, including personal injury, commercial, contract, environmental, antitrust, product liability, health and safety and employment matters, including lawsuits related to the independent distributors, which are being handled and defended in the ordinary course of business. WhileLoss contingencies are recorded at the time it is probable an asset is impaired or a liability has been incurred and the amount can be reasonably estimated. For litigation claims, the company is unableconsiders the degree of probability of an unfavorable outcome and the ability to predictmake a reasonable estimate of the outcome of these matters, it believes, based upon currently available facts, that it is remote that the ultimate resolution of any such pending matters will have a material adverse effect on its overall financial condition, results of operations or cash flowsloss. Losses are recorded in selling, distribution and administrative expense in the future. However, adverse developments could negatively impact earnings in a particular future fiscal period.
Results of Operations
Matters Affecting Analysis
Fiscal 2014 Week 53. The sales impact in our Consolidated Statements of Income for fiscal 2014 week 53 was $63.2 million. The DSD Segment and Warehouse Segment impact was $53.4 million and $9.8 million, respectively. The impact to fiscal 2014 earnings per share was $0.01 per share.
Reporting Periods. The company operates on a 52-53 week fiscal year ending the Saturday nearest December 31. Fiscal 2014 consisted of 53 weeks. Fiscal 2015 and 2013 consisted of 52 weeks.
Revision of prior period sales and Impairment of Assets. Refer to the “Overview” section above for a description of each of these items. Acquisitions are described below. Income.
Alpine Valley Bread acquisition (2015)Results of Operations
On October 13, 2015, the company completed the acquisition of Alpine Valley Bread Company, a family-owned producer of certified organic and all natural breads in the U.S. The acquisition expands our penetration into the organic market and provides additional organic production capacity.
Dave’s Killer Bread acquisition (2015)
On September 12, 2015, the company completed the acquisition of Dave’s Killer Bread, the nation’s best-selling organic bread. We believe the acquisition of DKB strengthens our position as the second-largest baker in the U.S. by giving us access to the fast growing organic bread category and expanding our geographic reach into the Pacific Northwest.
Modesto, California acquisition (2013)
On July 27, 2013, the company completed the acquisition of certain assets related to a bun line in Modesto, California that now serves the California market for a total cash payment of $10.3 million. This acquisition is included in our DSD Segment and the total goodwill for this acquisition was $4.2 million.
Hostess Bread assets acquisition (2013)
On July 19, 2013, the company completed the Acquired Hostess Bread Assets acquisition for a total cash payment of $355.3 million. We continue to incur carrying costs on the acquired properties and depots not currently in operation and in fiscal 2015, fiscal 2014 and fiscal 2013, these costs were $12.8 million, $19.5 million and $10.6 million, respectively. These costs include workforce-related costs, property taxes, utilities, and depreciation, among other costs and were primarily included in the materials, supplies, labor, and other production costs (exclusive of depreciation and amortization shown separately) line item in our Condensed Consolidated Statements of Income. We began re-introducing the brands associated with the Acquired Hostess Bread Assets to the marketplace in the third quarter of fiscal 2013.
Sara Lee California acquisition (2013)
On February 23, 2013, the company completed its acquisition of certain assets and trademark licenses from BBU, Inc., a subsidiary of Grupo Bimbo, SAB de CV (“BBU”), for a total cash payment of $50.0 million. The company acquired from BBU in the acquisition: (1) perpetual, exclusive, and royalty-free licenses to the Sara Lee and Earthgrains brands for sliced breads, buns, and rolls in the state of California and (2) a closed bakery in Stockton, California. In addition, we received a perpetual, exclusive, and royalty-free license to the Earthgrains brand for a broad range of fresh bakery products in the Oklahoma City, Oklahoma market area. We financed this acquisition with cash on hand and debt. We believe the California acquisition resulted in a bargain purchase because the Department of Justice (the “DOJ”) required BBU to divest these assets, which resulted in a more favorable price to us than would have normally resulted from a typical arms-length negotiation. Accordingly, the fair value of the assets acquired exceeded the consideration paid by approximately $50.1 million after tax. The company agreed to a $10.0 million escrow holdback provision as a part of the Sara Lee California acquisition of which the company received $7.5 million during the first quarter of fiscal 2014. The escrow holdback is described in more detail in Note 8, Acquisitions, of Notes to Consolidated Financial Statements of this Form 10-K.
The company’s results of operations, expressed as a percentage of sales, are set forth below for fiscal 20152016 and 20142015 (by segment):
|
|
|
|
|
|
|
|
|
| Percentage of Sales |
|
| Increase (Decrease) |
|
|
|
|
|
|
|
|
|
| Percentage of Sales |
|
| Increase (Decrease) |
| ||||||||||||||||||||
|
| Fiscal 2015 |
|
| Fiscal 2014 |
|
| Fiscal 2015 |
|
| Fiscal 2014 |
|
| Dollars |
|
| % |
|
| Fiscal 2016 |
|
| Fiscal 2015 |
|
| Fiscal 2016 |
|
| Fiscal 2015 |
|
| Dollars |
|
| % |
| ||||||||||||
|
| 52 weeks |
|
| 53 weeks |
|
| 52 weeks |
|
| 53 weeks |
|
|
|
|
|
|
|
|
|
| 52 weeks |
|
| 52 weeks |
|
| 52 weeks |
|
| 52 weeks |
|
|
|
|
|
|
|
|
| ||||||||
|
| (Amounts in thousands) |
|
|
|
|
|
|
|
|
|
| (Amounts in thousands) |
|
| (Amounts in thousands, except percentages) |
| |||||||||||||||||||||||||||||||
Sales |
|
|
|
|
|
|
|
|
|
|
|
|
|
|
|
|
|
|
|
|
|
|
|
|
|
|
|
|
|
|
|
|
|
|
|
|
|
|
|
|
|
|
|
|
|
|
|
|
DSD Segment |
| $ | 3,179,348 |
|
| $ | 3,155,607 |
|
|
| 84.1 |
|
|
| 84.2 |
|
| $ | 23,741 |
|
|
| 0.8 |
|
| $ | 3,284,177 |
|
| $ | 3,179,348 |
|
|
| 83.6 |
|
|
| 84.1 |
|
| $ | 104,829 |
|
|
| 3.3 |
|
Warehouse Segment |
|
| 599,157 |
|
|
| 593,366 |
|
|
| 15.9 |
|
|
| 15.8 |
|
|
| 5,791 |
|
|
| 1.0 |
|
|
| 642,708 |
|
|
| 599,157 |
|
|
| 16.4 |
|
|
| 15.9 |
|
|
| 43,551 |
|
|
| 7.3 |
|
Total |
| $ | 3,778,505 |
|
| $ | 3,748,973 |
|
|
| 100.0 |
|
|
| 100.0 |
|
| $ | 29,532 |
|
|
| 0.8 |
|
| $ | 3,926,885 |
|
| $ | 3,778,505 |
|
|
| 100.0 |
|
|
| 100.0 |
|
| $ | 148,380 |
|
|
| 3.9 |
|
Materials, supplies, labor and other production costs (exclusive of depreciation and amortization shown separately below) |
|
|
|
|
|
|
|
|
|
|
|
|
|
|
|
|
|
|
|
|
|
|
|
|
|
|
|
|
|
|
|
|
|
|
|
|
|
|
|
|
|
|
|
|
|
|
|
|
DSD Segment(1) |
| $ | 1,532,738 |
|
| $ | 1,515,536 |
|
|
| 48.2 |
|
|
| 48.0 |
|
| $ | 17,202 |
|
|
| 1.1 |
|
| $ | 1,569,861 |
|
| $ | 1,532,738 |
|
|
| 47.8 |
|
|
| 48.2 |
|
| $ | 37,123 |
|
|
| 2.4 |
|
Warehouse Segment(1) |
|
| 430,415 |
|
|
| 435,097 |
|
|
| 71.8 |
|
|
| 73.3 |
|
|
| (4,682 | ) |
|
| (1.1 | ) |
|
| 456,506 |
|
|
| 430,415 |
|
|
| 71.0 |
|
|
| 71.8 |
|
|
| 26,091 |
|
|
| 6.1 |
|
Total |
| $ | 1,963,153 |
|
| $ | 1,950,633 |
|
|
| 52.0 |
|
|
| 52.0 |
|
| $ | 12,520 |
|
|
| 0.6 |
|
| $ | 2,026,367 |
|
| $ | 1,963,153 |
|
|
| 51.6 |
|
|
| 52.0 |
|
| $ | 63,214 |
|
|
| 3.2 |
|
Selling, distribution and administrative expenses |
|
|
|
|
|
|
|
|
|
|
|
|
|
|
|
|
|
|
|
|
|
|
|
|
|
|
|
|
|
|
|
|
|
|
|
|
|
|
|
|
|
|
|
|
|
|
|
|
DSD Segment(1) |
| $ | 1,224,677 |
|
| $ | 1,231,651 |
|
|
| 38.5 |
|
|
| 39.0 |
|
| $ | (6,974 | ) |
|
| (0.6 | ) |
| $ | 1,308,935 |
|
| $ | 1,224,677 |
|
|
| 39.9 |
|
|
| 38.5 |
|
| $ | 84,258 |
|
|
| 6.9 |
|
Warehouse Segment(1) |
|
| 96,742 |
|
|
| 91,652 |
|
|
| 16.1 |
|
|
| 15.4 |
|
|
| 5,090 |
|
|
| 5.6 |
|
|
| 107,599 |
|
|
| 96,742 |
|
|
| 16.7 |
|
|
| 16.1 |
|
|
| 10,857 |
|
|
| 11.2 |
|
Corporate(2) |
|
| 60,108 |
|
|
| 44,986 |
|
|
| — |
|
|
| — |
|
|
| 15,122 |
|
|
| 33.6 |
|
|
| 47,702 |
|
|
| 60,108 |
|
|
| — |
|
|
| — |
|
|
| (12,406 | ) |
|
| (20.6 | ) |
Total |
| $ | 1,381,527 |
|
| $ | 1,368,289 |
|
|
| 36.6 |
|
|
| 36.5 |
|
| $ | 13,238 |
|
|
| 1.0 |
|
| $ | 1,464,236 |
|
| $ | 1,381,527 |
|
|
| 37.3 |
|
|
| 36.6 |
|
| $ | 82,709 |
|
|
| 6.0 |
|
Depreciation and amortization |
|
|
|
|
|
|
|
|
|
|
|
|
|
|
|
|
|
|
|
|
|
|
|
|
|
|
|
|
|
|
|
|
|
|
|
|
|
|
|
|
|
|
|
|
|
|
|
|
DSD Segment(1) |
| $ | 115,801 |
|
| $ | 113,881 |
|
|
| 3.6 |
|
|
| 3.6 |
|
| $ | 1,920 |
|
|
| 1.7 |
|
| $ | 120,009 |
|
| $ | 115,801 |
|
|
| 3.7 |
|
|
| 3.6 |
|
| $ | 4,208 |
|
|
| 3.6 |
|
Warehouse Segment(1) |
|
| 16,734 |
|
|
| 15,166 |
|
|
| 2.8 |
|
|
| 2.6 |
|
|
| 1,568 |
|
|
| 10.3 |
|
|
| 20,138 |
|
|
| 16,734 |
|
|
| 3.1 |
|
|
| 2.8 |
|
|
| 3,404 |
|
|
| 20.3 |
|
Corporate(2) |
|
| (360 | ) |
|
| (86 | ) |
|
| — |
|
|
| — |
|
|
| (274 | ) |
| NM |
|
|
| 722 |
|
|
| (360 | ) |
|
| — |
|
|
| — |
|
|
| 1,082 |
|
| NM |
| ||
Total |
| $ | 132,175 |
|
| $ | 128,961 |
|
|
| 3.5 |
|
|
| 3.4 |
|
| $ | 3,214 |
|
|
| 2.5 |
|
| $ | 140,869 |
|
| $ | 132,175 |
|
|
| 3.6 |
|
|
| 3.5 |
|
| $ | 8,694 |
|
|
| 6.6 |
|
Pension Plan Settlement Loss |
|
|
|
|
|
|
|
|
|
|
|
|
|
|
|
|
|
|
|
|
|
|
|
| ||||||||||||||||||||||||
Pension plan settlement loss |
|
|
|
|
|
|
|
|
|
|
|
|
|
|
|
|
|
|
|
|
|
|
|
| ||||||||||||||||||||||||
DSD Segment(1) |
| $ | — |
|
| $ | — |
|
|
| — |
|
|
| — |
|
| $ | — |
|
|
| — |
|
| $ | — |
|
| $ | — |
|
|
| — |
|
|
| — |
|
| $ | — |
|
|
| — |
|
Warehouse Segment(1) |
|
| — |
|
|
| — |
|
|
| — |
|
|
| — |
|
|
| — |
|
|
| — |
|
|
| — |
|
|
| — |
|
|
| — |
|
|
| — |
|
|
| — |
|
|
| — |
|
Corporate(2) |
|
| — |
|
|
| 15,387 |
|
|
| — |
|
|
| — |
|
|
| (15,387 | ) |
| NM |
|
|
| 6,646 |
|
|
| — |
|
|
| — |
|
|
| — |
|
|
| 6,646 |
|
| NM |
| ||
Total |
| $ | — |
|
| $ | 15,387 |
|
|
| — |
|
|
| 0.4 |
|
| $ | (15,387 | ) |
| NM |
|
| $ | 6,646 |
|
| $ | — |
|
|
| 0.2 |
|
|
| — |
|
| $ | 6,646 |
|
| NM |
| ||
Impairment of Assets |
|
|
|
|
|
|
|
|
|
|
|
|
|
|
|
|
|
|
|
|
|
|
|
| ||||||||||||||||||||||||
Impairment of assets |
|
|
|
|
|
|
|
|
|
|
|
|
|
|
|
|
|
|
|
|
|
|
|
| ||||||||||||||||||||||||
DSD Segment(1) |
| $ | 3,771 |
|
| $ | 10,308 |
|
|
| 0.1 |
|
|
| 0.3 |
|
| $ | (6,537 | ) |
| NM |
|
| $ | 24,877 |
|
| $ | 3,771 |
|
|
| 0.8 |
|
|
| 0.1 |
|
| $ | 21,106 |
|
| NM |
| ||
Warehouse Segment(1) |
|
| — |
|
|
| — |
|
|
| — |
|
|
| — |
|
|
| — |
|
|
| — |
|
|
| — |
|
|
| — |
|
|
| — |
|
|
| — |
|
|
| — |
|
|
| — |
|
Corporate(2) |
|
| — |
|
|
| — |
|
|
| — |
|
|
| — |
|
|
| — |
|
|
| — |
|
|
| — |
|
|
| — |
|
|
| — |
|
|
| — |
|
|
| — |
|
|
| — |
|
Total |
| $ | 3,771 |
|
| $ | 10,308 |
|
|
| 0.1 |
|
|
| 0.3 |
|
| $ | (6,537 | ) |
| NM |
|
| $ | 24,877 |
|
| $ | 3,771 |
|
|
| 0.6 |
|
|
| 0.1 |
|
| $ | 21,106 |
|
| NM |
| ||
Income from operations |
|
|
|
|
|
|
|
|
|
|
|
|
|
|
|
|
|
|
|
|
|
|
|
|
|
|
|
|
|
|
|
|
|
|
|
|
|
|
|
|
|
|
|
|
|
|
|
|
DSD Segment(1) |
| $ | 302,361 |
|
| $ | 284,231 |
|
|
| 9.5 |
|
|
| 9.0 |
|
| $ | 18,130 |
|
|
| 6.4 |
|
| $ | 260,495 |
|
| $ | 302,361 |
|
|
| 7.9 |
|
|
| 9.5 |
|
| $ | (41,866 | ) |
|
| (13.8 | ) |
Warehouse Segment(1) |
|
| 55,266 |
|
|
| 51,451 |
|
|
| 9.2 |
|
|
| 8.7 |
|
|
| 3,815 |
|
|
| 7.4 |
|
|
| 58,465 |
|
|
| 55,266 |
|
|
| 9.1 |
|
|
| 9.2 |
|
|
| 3,199 |
|
|
| 5.8 |
|
Corporate(2) |
|
| (59,748 | ) |
|
| (60,287 | ) |
|
| — |
|
|
| — |
|
|
| 539 |
|
|
| 0.9 |
|
|
| (55,070 | ) |
|
| (59,748 | ) |
|
| — |
|
|
| — |
|
|
| 4,678 |
|
|
| 7.8 |
|
Total |
| $ | 297,879 |
|
| $ | 275,395 |
|
|
| 7.9 |
|
|
| 7.3 |
|
| $ | 22,484 |
|
|
| 8.2 |
|
| $ | 263,890 |
|
| $ | 297,879 |
|
|
| 6.7 |
|
|
| 7.9 |
|
| $ | (33,989 | ) |
|
| (11.4 | ) |
Interest expense, net |
| $ | 4,848 |
|
| $ | 7,341 |
|
|
| 0.1 |
|
|
| 0.2 |
|
| $ | (2,493 | ) |
|
| (34.0 | ) |
| $ | 14,353 |
|
| $ | 4,848 |
|
|
| 0.4 |
|
|
| 0.1 |
|
| $ | 9,505 |
|
|
| 196.1 |
|
Income taxes |
| $ | 103,840 |
|
| $ | 92,315 |
|
|
| 2.7 |
|
|
| 2.5 |
|
| $ | 11,525 |
|
|
| 12.5 |
|
| $ | 85,761 |
|
| $ | 103,840 |
|
|
| 2.2 |
|
|
| 2.7 |
|
| $ | (18,079 | ) |
|
| (17.4 | ) |
Net income |
| $ | 189,191 |
|
| $ | 175,739 |
|
|
| 5.0 |
|
|
| 4.7 |
|
| $ | 13,452 |
|
|
| 7.7 |
|
| $ | 163,776 |
|
| $ | 189,191 |
|
|
| 4.2 |
|
|
| 5.0 |
|
| $ | (25,415 | ) |
|
| (13.4 | ) |
Comprehensive income |
| $ | 177,293 |
|
| $ | 190,411 |
|
|
| 4.5 |
|
|
| 5.0 |
|
| $ | (13,118 | ) |
|
| (6.9 | ) | ||||||||||||||||||||||||
1. | As a percentage of revenue within the reporting segment. |
2. | The corporate segment has no revenues. |
NM – the computation is not meaningful
Percentages may not add due to rounding.
The company’s results of operations, expressed as a percentage of sales, are set forth below for fiscal 20142015 and 20132014 (by segment):
|
|
|
|
|
|
|
|
|
| Percentage of Sales |
|
| Increase (Decrease) |
|
|
|
|
|
|
|
|
|
| Percentage of Sales |
|
| Increase (Decrease) |
| ||||||||||||||||||||
|
| Fiscal 2014 |
|
| Fiscal 2013 |
|
| Fiscal 2014 |
|
| Fiscal 2013 |
|
| Dollars |
|
| % |
|
| Fiscal 2015 |
|
| Fiscal 2014 |
|
| Fiscal 2015 |
|
| Fiscal 2014 |
|
| Dollars |
|
| % |
| ||||||||||||
|
| 53 weeks |
|
| 52 weeks |
|
| 53 weeks |
|
| 52 weeks |
|
|
|
|
|
|
|
|
|
| 52 weeks |
|
| 53 weeks |
|
| 52 weeks |
|
| 53 weeks |
|
|
|
|
|
|
|
|
| ||||||||
|
| (Amounts in thousands) |
|
|
|
|
|
|
|
|
|
| (Amounts in thousands) |
|
| (Amounts in thousands, except percentages) |
| |||||||||||||||||||||||||||||||
Sales |
|
|
|
|
|
|
|
|
|
|
|
|
|
|
|
|
|
|
|
|
|
|
|
|
|
|
|
|
|
|
|
|
|
|
|
|
|
|
|
|
|
|
|
|
|
|
|
|
DSD Segment |
| $ | 3,155,607 |
|
| $ | 3,080,255 |
|
|
| 84.2 |
|
|
| 82.5 |
|
| $ | 75,352 |
|
|
| 2.4 |
|
| $ | 3,179,348 |
|
| $ | 3,155,607 |
|
|
| 84.1 |
|
|
| 84.2 |
|
| $ | 23,741 |
|
|
| 0.8 |
|
Warehouse Segment |
|
| 593,366 |
|
|
| 652,361 |
|
|
| 15.8 |
|
|
| 17.5 |
|
|
| (58,995 | ) |
|
| (9.0 | ) |
|
| 599,157 |
|
|
| 593,366 |
|
|
| 15.9 |
|
|
| 15.8 |
|
|
| 5,791 |
|
|
| 1.0 |
|
Total |
| $ | 3,748,973 |
|
| $ | 3,732,616 |
|
|
| 100.0 |
|
|
| 100.0 |
|
| $ | 16,357 |
|
|
| 0.4 |
|
| $ | 3,778,505 |
|
| $ | 3,748,973 |
|
|
| 100.0 |
|
|
| 100.0 |
|
| $ | 29,532 |
|
|
| 0.8 |
|
Materials, supplies, labor and other production costs (exclusive of depreciation and amortization shown separately below) |
|
|
|
|
|
|
|
|
|
|
|
|
|
|
|
|
|
|
|
|
|
|
|
|
|
|
|
|
|
|
|
|
|
|
|
|
|
|
|
|
|
|
|
|
|
|
|
|
DSD Segment(1) |
| $ | 1,515,536 |
|
| $ | 1,482,765 |
|
|
| 48.0 |
|
|
| 48.1 |
|
| $ | 32,771 |
|
|
| 2.2 |
|
| $ | 1,532,738 |
|
| $ | 1,515,536 |
|
|
| 48.2 |
|
|
| 48.0 |
|
| $ | 17,202 |
|
|
| 1.1 |
|
Warehouse Segment(1) |
|
| 435,097 |
|
|
| 489,456 |
|
|
| 73.3 |
|
|
| 75.0 |
|
|
| (54,359 | ) |
|
| (11.1 | ) |
|
| 430,415 |
|
|
| 435,097 |
|
|
| 71.8 |
|
|
| 73.3 |
|
|
| (4,682 | ) |
|
| (1.1 | ) |
Total |
| $ | 1,950,633 |
|
| $ | 1,972,221 |
|
|
| 52.0 |
|
|
| 52.8 |
|
| $ | (21,588 | ) |
|
| (1.1 | ) |
| $ | 1,963,153 |
|
| $ | 1,950,633 |
|
|
| 52.0 |
|
|
| 52.0 |
|
| $ | 12,520 |
|
|
| 0.6 |
|
Selling, distribution and administrative expenses |
|
|
|
|
|
|
|
|
|
|
|
|
|
|
|
|
|
|
|
|
|
|
|
|
|
|
|
|
|
|
|
|
|
|
|
|
|
|
|
|
|
|
|
|
|
|
|
|
DSD Segment(1) |
| $ | 1,231,651 |
|
| $ | 1,198,106 |
|
|
| 39.0 |
|
|
| 38.9 |
|
| $ | 33,545 |
|
|
| 2.8 |
|
| $ | 1,224,677 |
|
| $ | 1,231,651 |
|
|
| 38.5 |
|
|
| 39.0 |
|
| $ | (6,974 | ) |
|
| (0.6 | ) |
Warehouse Segment(1) |
|
| 91,652 |
|
|
| 95,488 |
|
|
| 15.4 |
|
|
| 14.6 |
|
|
| (3,836 | ) |
|
| (4.0 | ) |
|
| 96,742 |
|
|
| 91,652 |
|
|
| 16.1 |
|
|
| 15.4 |
|
|
| 5,090 |
|
|
| 5.6 |
|
Corporate(2) |
|
| 44,986 |
|
|
| 63,148 |
|
|
| — |
|
|
| — |
|
|
| (18,162 | ) |
|
| (28.8 | ) |
|
| 60,108 |
|
|
| 44,986 |
|
|
| — |
|
|
| — |
|
|
| 15,122 |
|
|
| 33.6 |
|
Total |
| $ | 1,368,289 |
|
| $ | 1,356,742 |
|
|
| 36.5 |
|
|
| 36.3 |
|
| $ | 11,547 |
|
|
| 0.9 |
|
| $ | 1,381,527 |
|
| $ | 1,368,289 |
|
|
| 36.6 |
|
|
| 36.5 |
|
| $ | 13,238 |
|
|
| 1.0 |
|
Depreciation and amortization |
|
|
|
|
|
|
|
|
|
|
|
|
|
|
|
|
|
|
|
|
|
|
|
|
|
|
|
|
|
|
|
|
|
|
|
|
|
|
|
|
|
|
|
|
|
|
|
|
DSD Segment(1) |
| $ | 113,881 |
|
| $ | 102,341 |
|
|
| 3.6 |
|
|
| 3.3 |
|
| $ | 11,540 |
|
|
| 11.3 |
|
| $ | 115,801 |
|
| $ | 113,881 |
|
|
| 3.6 |
|
|
| 3.6 |
|
| $ | 1,920 |
|
|
| 1.7 |
|
Warehouse Segment(1) |
|
| 15,166 |
|
|
| 15,483 |
|
|
| 2.6 |
|
|
| 2.4 |
|
|
| (317 | ) |
|
| (2.0 | ) |
|
| 16,734 |
|
|
| 15,166 |
|
|
| 2.8 |
|
|
| 2.6 |
|
|
| 1,568 |
|
|
| 10.3 |
|
Corporate(2) |
|
| (86 | ) |
|
| 667 |
|
|
| — |
|
|
| — |
|
|
| (753 | ) |
| NM |
|
|
| (360 | ) |
|
| (86 | ) |
|
| — |
|
|
| — |
|
|
| (274 | ) |
| NM |
| ||
Total |
| $ | 128,961 |
|
| $ | 118,491 |
|
|
| 3.4 |
|
|
| 3.2 |
|
| $ | 10,470 |
|
|
| 8.8 |
|
| $ | 132,175 |
|
| $ | 128,961 |
|
|
| 3.5 |
|
|
| 3.4 |
|
| $ | 3,214 |
|
|
| 2.5 |
|
Pension Plan Settlement Loss |
|
|
|
|
|
|
|
|
|
|
|
|
|
|
|
|
|
|
|
|
|
|
|
| ||||||||||||||||||||||||
Pension plan settlement loss |
|
|
|
|
|
|
|
|
|
|
|
|
|
|
|
|
|
|
|
|
|
|
|
| ||||||||||||||||||||||||
DSD Segment(1) |
| $ | — |
|
| $ | — |
|
|
| — |
|
|
| — |
|
| $ | — |
|
|
| — |
|
| $ | — |
|
| $ | — |
|
|
| — |
|
|
| — |
|
| $ | — |
|
|
| — |
|
Warehouse Segment(1) |
|
| — |
|
|
| — |
|
|
| — |
|
|
| — |
|
|
| — |
|
|
| — |
|
|
| — |
|
|
| — |
|
|
| — |
|
|
| — |
|
|
| — |
|
|
| — |
|
Corporate(2) |
|
| 15,387 |
|
|
| — |
|
|
| — |
|
|
| — |
|
|
| 15,387 |
|
| NM |
|
|
| — |
|
|
| 15,387 |
|
|
| — |
|
|
| — |
|
|
| (15,387 | ) |
| NM |
| ||
Total |
| $ | 15,387 |
|
| $ | — |
|
|
| 0.4 |
|
|
| 0.0 |
|
| $ | 15,387 |
|
| NM |
|
| $ | — |
|
| $ | 15,387 |
|
|
| — |
|
|
| 0.4 |
|
| $ | (15,387 | ) |
| NM |
| ||
Impairment of Assets |
|
|
|
|
|
|
|
|
|
|
|
|
|
|
|
|
|
|
|
|
|
|
|
| ||||||||||||||||||||||||
DSD Segment(1) |
| $ | 10,308 |
|
| $ | — |
|
|
| 0.3 |
|
|
| 0.0 |
|
| $ | 10,308 |
|
| NM |
| |||||||||||||||||||||||||
Warehouse Segment(1) |
|
| — |
|
|
| — |
|
|
| — |
|
|
| — |
|
|
| — |
|
|
| — |
| ||||||||||||||||||||||||
Corporate(2) |
|
| — |
|
|
| — |
|
|
| — |
|
|
| — |
|
|
| — |
|
|
| — |
| ||||||||||||||||||||||||
Total |
| $ | 10,308 |
|
| $ | — |
|
|
| 0.3 |
|
|
| 0.0 |
|
| $ | 10,308 |
|
| NM |
| |||||||||||||||||||||||||
Gain on acquisition |
|
|
|
|
|
|
|
|
|
|
|
|
|
|
|
|
|
|
|
|
|
|
|
| ||||||||||||||||||||||||
Impairment of assets |
|
|
|
|
|
|
|
|
|
|
|
|
|
|
|
|
|
|
|
|
|
|
|
| ||||||||||||||||||||||||
DSD Segment(1) |
| $ | — |
|
| $ | 50,071 |
|
|
| 0.0 |
|
|
| 1.6 |
|
| $ | (50,071 | ) |
| NM |
|
| $ | 3,771 |
|
| $ | 10,308 |
|
|
| 0.1 |
|
|
| 0.3 |
|
| $ | (6,537 | ) |
| NM |
| ||
Warehouse Segment(1) |
|
| — |
|
|
| — |
|
|
| 0.0 |
|
|
| 0.0 |
|
|
| — |
|
|
| — |
|
|
| — |
|
|
| — |
|
|
| — |
|
|
| — |
|
|
| — |
|
|
| — |
|
Corporate(2) |
|
| — |
|
|
| — |
|
|
| — |
|
|
| — |
|
|
| — |
|
|
| — |
|
|
| — |
|
|
| — |
|
|
| — |
|
|
| — |
|
|
| — |
|
|
| — |
|
Total |
| $ | — |
|
| $ | 50,071 |
|
|
| 0.0 |
|
|
| 1.3 |
|
| $ | (50,071 | ) |
| NM |
|
| $ | 3,771 |
|
| $ | 10,308 |
|
|
| 0.1 |
|
|
| 0.3 |
|
| $ | (6,537 | ) |
| NM |
| ||
Income from operations |
|
|
|
|
|
|
|
|
|
|
|
|
|
|
|
|
|
|
|
|
|
|
|
|
|
|
|
|
|
|
|
|
|
|
|
|
|
|
|
|
|
|
|
|
|
|
|
|
DSD Segment(1) |
| $ | 284,231 |
|
| $ | 347,114 |
|
|
| 9.0 |
|
|
| 11.3 |
|
| $ | (62,883 | ) |
|
| (18.1 | ) |
| $ | 302,361 |
|
| $ | 284,231 |
|
|
| 9.5 |
|
|
| 9.0 |
|
| $ | 18,130 |
|
|
| 6.4 |
|
Warehouse Segment(1) |
|
| 51,451 |
|
|
| 51,934 |
|
|
| 8.7 |
|
|
| 8.0 |
|
|
| (483 | ) |
|
| (0.9 | ) |
|
| 55,266 |
|
|
| 51,451 |
|
|
| 9.2 |
|
|
| 8.7 |
|
|
| 3,815 |
|
|
| 7.4 |
|
Corporate(2) |
|
| (60,287 | ) |
|
| (63,815 | ) |
|
| — |
|
|
| — |
|
|
| 3,528 |
|
|
| 5.5 |
|
|
| (59,748 | ) |
|
| (60,287 | ) |
|
| — |
|
|
| — |
|
|
| 539 |
|
|
| 0.9 |
|
Total |
| $ | 275,395 |
|
| $ | 335,233 |
|
|
| 7.3 |
|
|
| 9.0 |
|
| $ | (59,838 | ) |
|
| (17.8 | ) |
| $ | 297,879 |
|
| $ | 275,395 |
|
|
| 7.9 |
|
|
| 7.3 |
|
| $ | 22,484 |
|
|
| 8.2 |
|
Interest expense, net |
| $ | 7,341 |
|
| $ | 12,860 |
|
|
| 0.2 |
|
|
| 0.3 |
|
| $ | (5,519 | ) |
|
| (42.9 | ) |
| $ | 4,848 |
|
| $ | 7,341 |
|
|
| 0.1 |
|
|
| 0.2 |
|
| $ | (2,493 | ) |
|
| (34.0 | ) |
Income taxes |
| $ | 92,315 |
|
| $ | 91,479 |
|
|
| 2.5 |
|
|
| 2.5 |
|
| $ | 836 |
|
|
| 0.9 |
|
| $ | 103,840 |
|
| $ | 92,315 |
|
|
| 2.7 |
|
|
| 2.5 |
|
| $ | 11,525 |
|
|
| 12.5 |
|
Net income |
| $ | 175,739 |
|
| $ | 230,894 |
|
|
| 4.7 |
|
|
| 6.2 |
|
| $ | (55,155 | ) |
|
| (23.9 | ) |
| $ | 189,191 |
|
| $ | 175,739 |
|
|
| 5.0 |
|
|
| 4.7 |
|
| $ | 13,452 |
|
|
| 7.7 |
|
Comprehensive income |
| $ | 190,411 |
|
| $ | 140,234 |
|
|
| 5.0 |
|
|
| 3.7 |
|
| $ | 50,177 |
|
|
| 35.8 |
| ||||||||||||||||||||||||
1. | As a percentage of revenue within the reporting segment. |
2. | The corporate segment has no revenues. |
NM – the computation is not meaningful
Percentages may not add due to rounding.
CONSOLIDATED AND SEGMENT RESULTSConsolidated and Segment Results - Fiscal 2016 compared to Fiscal 2015
Sales
Consolidated
|
| Fiscal 2016 |
|
| Fiscal 2015 |
|
|
|
|
| ||||||||||
|
| 52 weeks |
|
| 52 weeks |
|
|
|
|
| ||||||||||
|
| $ |
|
| % |
|
| $ |
|
| % |
|
| % Increase |
| |||||
|
| (Amounts in thousands) |
|
|
|
|
|
| (Amounts in thousands) |
|
|
|
|
|
|
|
|
| ||
Branded retail |
| $ | 2,282,892 |
|
|
| 58.1 |
|
| $ | 2,151,514 |
|
|
| 56.9 |
|
|
| 6.1 |
|
Store branded retail |
|
| 582,523 |
|
|
| 14.8 |
|
|
| 571,827 |
|
|
| 15.1 |
|
|
| 1.9 |
|
Non-retail and other |
|
| 1,061,470 |
|
|
| 27.1 |
|
|
| 1,055,164 |
|
|
| 28.0 |
|
|
| 0.6 |
|
Total |
| $ | 3,926,885 |
|
|
| 100.0 |
|
| $ | 3,778,505 |
|
|
| 100.0 |
|
|
| 3.9 |
|
The 3.9% increase in sales was attributable to the following:
Percentage point change in sales attributed to: | Favorable (Unfavorable) | |||
Pricing/mix | (0.3 | ) | ||
Volume | 0.2 | |||
Acquisitions (until cycled the acquisition date) | 4.0 | |||
Total percentage change in sales | 3.9 | |||
The overall sales increase resulted primarily from increased sales due to the DKB and Alpine acquisitions. Declines in pricing/mix were mostly in the non-retail and other category, partially offset by positive pricing/mix in the branded retail category. Branded retail sales increased due to the contribution from the DKB and Alpine acquisitions, the national rollout of the DKB brand, sales growth in our expansion markets (defined as new markets we entered into in the last five years) and positive pricing/mix. Partially offsetting the increase was softer sales for other branded retail products, most significantly branded soft variety bread, due to softness in the packaged bread category and reductions in the company’s promotional activities in the first half of fiscal 2016. Increases in sales of store branded variety bread, cake and buns and rolls resulted in the increase in the store branded retail category. The modest increase in non-retail and other sales, which include contract manufacturing, vending and foodservice, was primarily due to volume increases in foodservice and vending, mostly offset by decreases in pricing/mix.
DSD Segment
|
| Fiscal 2016 |
|
| Fiscal 2015 |
|
|
|
|
| ||||||||||
|
| 52 weeks |
|
| 52 weeks |
|
| % Increase |
| |||||||||||
|
| $ |
|
| % |
|
| $ |
|
| % |
|
| (Decrease) |
| |||||
|
| (Amounts in thousands) |
|
|
|
|
|
| (Amounts in thousands) |
|
|
|
|
|
|
|
|
| ||
Branded retail |
| $ | 2,113,595 |
|
|
| 64.4 |
|
| $ | 2,011,433 |
|
|
| 63.3 |
|
|
| 5.1 |
|
Store branded retail |
|
| 464,705 |
|
|
| 14.1 |
|
|
| 457,467 |
|
|
| 14.4 |
|
|
| 1.6 |
|
Non-retail and other |
|
| 705,877 |
|
|
| 21.5 |
|
|
| 710,448 |
|
|
| 22.3 |
|
|
| (0.6 | ) |
Total |
| $ | 3,284,177 |
|
|
| 100.0 |
|
| $ | 3,179,348 |
|
|
| 100.0 |
|
|
| 3.3 |
|
The 3.3% increase in sales was attributable to the following:
Percentage point change in sales attributed to: | Favorable (Unfavorable) | |||
Pricing/mix | 0.7 | |||
Volume | (1.0 | ) | ||
Acquisition (until cycled the acquisition date) | 3.6 | |||
Total percentage change in sales | 3.3 | |||
Sales from the DKB acquisition drove the overall sales increase in the DSD Segment, partially offset by softer volume for other products due to the company’s reduced promotional activity in the first half of fiscal 2016 and overall softness in the packaged bread category. Branded retail sales increased due to the contribution from the DKB acquisition, the national rollout of the DKB brand,
sales growth in our expansion markets and positive pricing/mix. Softer volume for other branded retail products, with the largest decline in branded soft variety bread, partially offset the increase. The increase in store branded retail sales was due primarily to volume increases in store branded variety bread and buns and rolls. The modest decrease in non-retail and other sales, which include contract manufacturing, vending and foodservice, was primarily due to volume declines.
Warehouse Segment
|
| Fiscal 2016 |
|
| Fiscal 2015 |
|
|
|
|
| ||||||||||
|
| 52 weeks |
|
| 52 weeks |
|
|
|
|
| ||||||||||
|
| $ |
|
| % |
|
| $ |
|
| % |
|
| % Increase |
| |||||
|
| (Amounts in thousands) |
|
|
|
|
|
| (Amounts in thousands) |
|
|
|
|
|
|
|
|
| ||
Branded retail |
| $ | 169,297 |
|
|
| 26.3 |
|
| $ | 140,081 |
|
|
| 23.4 |
|
|
| 20.9 |
|
Store branded retail |
|
| 117,818 |
|
|
| 18.3 |
|
|
| 114,360 |
|
|
| 19.1 |
|
|
| 3.0 |
|
Non-retail and other |
|
| 355,593 |
|
|
| 55.4 |
|
|
| 344,716 |
|
|
| 57.5 |
|
|
| 3.2 |
|
Total |
| $ | 642,708 |
|
|
| 100.0 |
|
| $ | 599,157 |
|
|
| 100.0 |
|
|
| 7.3 |
|
The 7.3% increase in sales was attributable to the following:
Percentage point change in sales attributed to: | Favorable (Unfavorable) | |||
Pricing/mix | (2.5 | ) | ||
Volume | 3.9 | |||
Acquisition (until cycled the acquisition date) | 5.9 | |||
Total percentage change in sales | 7.3 | |||
The Warehouse Segment’s sales increased significantly due to sales from the Alpine acquisition and to a lesser extent, volume growth in the non-retail and other category, partially offset by negative pricing/mix. Pricing/mix declined largely due to lower foodservice pricing. Branded retail sales increased due to the Alpine acquisition and less significantly to growth in bakery deli sales, partially offset by declines in branded cake. Increases in sales of store branded cake drove the increase in the store branded retail category. The increase in non-retail and other sales, which include contract manufacturing, vending and foodservice, was mainly due to growth in foodservice sales, due to new foodservice products for certain of our customers, and in vending, partially offset by negative pricing/mix.
Materials, Supplies, Labor, and Other Production Costs (exclusive of depreciation and amortization shown separately; as a percent of sales)
Consolidated
Line item component |
| Fiscal 2016 % of sales |
|
| Fiscal 2015 % of sales |
|
| Increase (Decrease) as a % of sales |
| |||
Ingredients |
|
| 24.5 |
|
|
| 25.3 |
|
|
| (0.8 | ) |
Workforce-related costs |
|
| 14.5 |
|
|
| 14.1 |
|
|
| 0.4 |
|
Packaging |
|
| 4.4 |
|
|
| 4.7 |
|
|
| (0.3 | ) |
Utilities |
|
| 1.5 |
|
|
| 1.6 |
|
|
| (0.1 | ) |
Other |
|
| 6.7 |
|
|
| 6.3 |
|
|
| 0.4 |
|
Total |
|
| 51.6 |
|
|
| 52.0 |
|
|
| (0.4 | ) |
Ingredient costs were lower as a percent of sales mainly due to lower prices for non-organic flour, oils and eggs and increased outside purchases of product (sales with no associated ingredient costs), partially offset by increases in sweetener prices and increased purchases of higher priced organic ingredients due to the DKB and Alpine acquisitions. Outside purchases of products are included in the other line item above and the increase largely relates to purchases of certain DKB products from co-manufacturers due to capacity constraints and to a lesser extent outside purchases for other products. As of the end of fiscal 2016, outside purchases of product had decreased considerably because of the additional organic production capacity provided by the Alpine plant and the Tuscaloosa, Alabama plant, which began producing organic bread at the beginning of the second quarter of fiscal 2016. The increase in workforce-related costs as a percent of sales was mainly due to wage increases on softer non-acquisition related sales and costs associated with the organic plant conversion, partially offset by increases in outside purchases of product (sales with no associated
workforce-related costs). Lower packaging costs as a percent of sales mainly resulted from lower resin and paperboard prices and a shift in mix from cake to bread items.
Commodities, such as our baking ingredients, periodically experience price fluctuations. The cost of these inputs may fluctuate widely due to government policy and regulation, weather conditions, domestic and international demand, or other unforeseen circumstances. We enter into forward purchase agreements and other derivative financial instruments in an effort to manage the impact of such volatility in raw material prices. Any decrease in the availability of these agreements and instruments could increase the effective price of these raw materials to us and significantly affect our earnings.
DSD Segment
Line item component |
| Fiscal 2016 % of sales |
|
| Fiscal 2015 % of sales |
|
| Increase (Decrease) as a % of sales |
| |||
Ingredients |
|
| 21.7 |
|
|
| 22.7 |
|
|
| (1.0 | ) |
Workforce-related costs |
|
| 12.6 |
|
|
| 12.3 |
|
|
| 0.3 |
|
Packaging |
|
| 3.1 |
|
|
| 3.3 |
|
|
| (0.2 | ) |
Utilities |
|
| 1.4 |
|
|
| 1.5 |
|
|
| (0.1 | ) |
Other |
|
| 9.0 |
|
|
| 8.4 |
|
|
| 0.6 |
|
Total |
|
| 47.8 |
|
|
| 48.2 |
|
|
| (0.4 | ) |
The decrease in ingredient costs as a percent of sales for the DSD Segment was attributable to lower pricing on non-organic flour, oils and eggs, and increases in purchases of product from the Warehouse Segment and from co-manufacturers due to capacity constraints (sales with no associated ingredient costs), partially offset by higher sweetener prices. The increase in the other line item reflects these product purchases, largely for certain DKB products. As discussed above, by the end of fiscal 2016, outside purchases for the DKB products had declined significantly due to the added production capacity provided by our Tuscaloosa, Alabama plant and the Alpine plant in the Warehouse Segment. Wage increases on lower non-acquisition related sales and costs related to converting the Tuscaloosa, Alabama plant to an organic facility, drove the increase in workforce-related costs as a percent of sales, partially offset by increased outside and intercompany purchases of product (sales with no associated workforce-related costs).
Warehouse Segment
Line item component |
| Fiscal 2016 % of sales |
|
| Fiscal 2015 % of sales |
|
| Increase (Decrease) as a % of sales |
| |||
Ingredients |
|
| 39.0 |
|
|
| 38.8 |
|
|
| 0.2 |
|
Workforce-related costs |
|
| 23.9 |
|
|
| 23.7 |
|
|
| 0.2 |
|
Packaging |
|
| 11.0 |
|
|
| 11.6 |
|
|
| (0.6 | ) |
Utilities |
|
| 1.7 |
|
|
| 1.8 |
|
|
| (0.1 | ) |
Other |
|
| (4.6 | ) |
|
| (4.1 | ) |
|
| (0.5 | ) |
Total |
|
| 71.0 |
|
|
| 71.8 |
|
|
| (0.8 | ) |
The Warehouse Segment’s increase in ingredient costs as a percent of sales was mostly due to increased purchases of higher priced organic ingredients due to the DKB and Alpine acquisitions, price increases for sweeteners and increased sales of product to the DSD Segment (ingredient costs with no associated sales). Partially offsetting the increase was lower prices for non-organic flour, eggs and oil and increases in outside purchases of product (sales with no associated ingredient costs). Packaging costs decreased as a percent of sales primarily due to significantly lower packaging costs for Alpine products relative to the Warehouse Segment as a whole and lower paperboard prices. The other line item reflects the increased intercompany sales of product to the DSD Segment, largely the DKB products, somewhat offset by the increase in outside purchases of product.
Selling, Distribution and Administrative Expenses (as a percent of sales)
Consolidated
Line item component |
| Fiscal 2016 % of sales |
|
| Fiscal 2015 % of sales |
|
| Increase (Decrease) as a % of sales |
| |||
Workforce-related costs |
|
| 17.7 |
|
|
| 17.1 |
|
|
| 0.6 |
|
Distributor distribution fees |
|
| 12.7 |
|
|
| 13.4 |
|
|
| (0.7 | ) |
Other |
|
| 6.9 |
|
|
| 6.1 |
|
|
| 0.8 |
|
Total |
|
| 37.3 |
|
|
| 36.6 |
|
|
| 0.7 |
|
Workforce-related costs increased as a percent of sales primarily due to a smaller portion of sales being sold via independent distributors in the current year as compared to the prior year, partially offset by lower employee incentive costs. The distributor distribution fees decrease correlates to the increase in workforce-related costs. Significantly higher legal and consulting costs as well as increased marketing for the DKB and Alpine brands caused the increase in the other line item component, partially offset by prior year acquisition-related costs of $6.2 million. Legal costs increased primarily due to the ongoing and additional distributor lawsuits, and two legal settlements totaling $10.25 million recorded in the current year. See Note 21, Commitments and Contingencies, of Notes to Consolidated Financial Statements of this Form 10-K for additional information. As discussed in the “Matters Affecting Comparability” section above, consulting costs associated with Project Centennial were $6.3 million in the current year and we expect these costs to significantly increase in fiscal 2017.
DSD Segment
Line item component |
| Fiscal 2016 % of sales |
|
| Fiscal 2015 % of sales |
|
| Increase (Decrease) as a % of sales |
| |||
Workforce-related costs |
|
| 17.8 |
|
|
| 17.1 |
|
|
| 0.7 |
|
Distributor distribution fees |
|
| 15.1 |
|
|
| 15.9 |
|
|
| (0.8 | ) |
Other |
|
| 7.0 |
|
|
| 5.5 |
|
|
| 1.5 |
|
Total |
|
| 39.9 |
|
|
| 38.5 |
|
|
| 1.4 |
|
The increase in workforce-related costs as a percentage of sales was due to a smaller portion of sales being sold via independent distributors in the current year as compared to the prior year resulting in the decrease in distributor distribution fees as a percent of sales. The increase in workforce-related costs was somewhat offset by lower employee incentive costs. The increase in the other line item as a percentage of sales was primarily a result of significantly higher legal costs related to the distributor lawsuits and $10.25 million of legal settlements discussed above, and increased corporate overhead charges to the DSD Segment.
Warehouse Segment
Line item component |
| Fiscal 2016 % of sales |
|
| Fiscal 2015 % of sales |
|
| Increase (Decrease) as a % of sales |
| |||
Workforce-related costs |
|
| 7.9 |
|
|
| 7.9 |
|
|
| — |
|
Freezer storage/rent |
|
| 2.0 |
|
|
| 2.1 |
|
|
| (0.1 | ) |
Distribution costs (includes freight and shipping and hauling) |
|
| 2.1 |
|
|
| 2.1 |
|
|
| — |
|
Other |
|
| 4.7 |
|
|
| 4.0 |
|
|
| 0.7 |
|
Total |
|
| 16.7 |
|
|
| 16.1 |
|
|
| 0.6 |
|
Higher marketing costs as a percent of sales drove the increase in the other line item, mainly attributable to promotional spending for the Alpine brand, as well as increased corporate overhead charges to the Warehouse Segment.
Depreciation and Amortization Expense
Depreciation and amortization expense increased in dollars and as a percent of sales due primarily to amortizing the DKB (included in the DSD Segment) and Alpine (included in the Warehouse Segment) intangible assets which were acquired in the third
and fourth quarter of fiscal 2015, respectively. We expect amortization expense to be $3.0 million higher in fiscal 2017 primarily due to reclassifying $156.0 million of indefinite-lived trademarks to finite-lived at the end of fiscal 2016.
The DSD Segment’s depreciation and amortization expense increased in dollars primarily due to the amortization of the acquired DKB intangible assets, partially offset by lower depreciation expense.
The Warehouse Segment’s depreciation and amortization expense increase in dollars and as a percent of sales was mostly due to amortization of the acquired Alpine intangible assets.
Pension Plan Settlement Loss
We recorded settlement charges of $6.6 million during fiscal 2016 related to our pension risk mitigation plan. Refer to the Pension plan settlement losses discussion in the “Matters Affecting Comparability” section above for additional details.
Impairment of Assets
We recorded impairment of assets of $24.9 million and $3.8 million during fiscal 2016 and 2015, respectively, related to assets in the DSD Segment. Refer to the Impairment of assets discussion in the “Matters Affecting Comparability” section above for additional details.
Income from Operations
Operating income (loss) |
| Favorable (Unfavorable) Percentage |
|
| Decrease as a % of Sales |
| ||
DSD Segment |
|
| (13.8 | ) |
|
| (1.6 | ) |
Warehouse Segment |
|
| 5.8 |
|
|
| (0.1 | ) |
Unallocated corporate |
|
| 7.8 |
|
| NA |
| |
Consolidated |
|
| (11.4 | ) |
|
| (1.2 | ) |
NA | Not applicable as the corporate segment has no revenues. |
The unfavorable decrease in the DSD Segment’s income from operations was largely attributable to the higher asset impairment charges, increased legal costs and related settlements, and higher corporate overhead charges in the current year as compared to the prior year. The Warehouse Segment’s operating income was relatively consistent with the prior year as a percent of sales. The favorable change in unallocated corporate expenses was mostly due to increased overhead charges to the segments in the current year and $6.2 million of acquisition-related costs incurred in the prior year, partially offset by pension plan settlement losses of $6.6 million and Project Centennial consulting costs both incurred in the current year. In the prior year, unanticipated legal costs were not allocated to the segments, but instead were absorbed at the corporate level.
Net Interest Expense
The increase in net interest expense resulted from higher average amounts outstanding under the company’s debt arrangements during the current fiscal year and to a lesser extent decreased interest income in fiscal 2016 due to lower average distributor notes receivable outstanding during the current fiscal year. Additionally, we expensed $1.9 million of debt issuance costs associated with our existing term loans that were paid off prior to maturity with the proceeds from the issuance of the 2026 notes.
Income Taxes
The effective tax rate for fiscal 2016 and fiscal 2015 was 34.4% and 35.4%, respectively. The decrease in the rate was primarily related to an increase in the Section 199 qualifying production activities benefit. The most significant differences in the effective rate and the statutory rate were additions for state income taxes and the benefit for Section 199 qualifying production activities deduction. Financial Accounting Standards Board (“FASB”) guidance requiring tax windfalls and shortfalls related to employee share-based payment awards to be recognized as income tax expense (benefit) at vesting of these awards will be effective for the company as of the beginning of fiscal 2017. During the first quarter of fiscal 2017, we anticipate a tax shortfall of $3.0 million to $3.3 million to be recognized as income tax expense in the Consolidated Financial Statements upon the vesting of our performance-based share-based payment awards.
The decrease in comprehensive income resulted from a decrease in net income year over year, partially offset by changes in the fair value of derivative instruments.
Consolidated and Segment Results - Fiscal 2015 compared to Fiscal 2014
Sales
Consolidated Sales
|
| Fiscal 2015 |
|
| Fiscal 2014 |
|
|
|
|
| ||||||||||
|
| 52 weeks |
|
| 53 weeks |
|
| % Increase |
| |||||||||||
|
| $ |
|
| % |
|
| $ |
|
| % |
|
| (Decrease) |
| |||||
|
| (Amounts in thousands) |
|
|
|
|
|
| (Amounts in thousands) |
|
|
|
|
|
|
|
|
| ||
Branded Retail |
| $ | 2,150,624 |
|
|
| 56.9 |
|
| $ | 2,102,028 |
|
|
| 56.1 |
|
|
| 2.3 |
|
Store Branded Retail |
|
| 571,594 |
|
|
| 15.1 |
|
|
| 608,617 |
|
|
| 16.2 |
|
|
| (6.1 | ) |
Non-retail and Other |
|
| 1,056,287 |
|
|
| 28.0 |
|
|
| 1,038,328 |
|
|
| 27.7 |
|
|
| 1.7 |
|
Total |
| $ | 3,778,505 |
|
|
| 100.0 |
|
| $ | 3,748,973 |
|
|
| 100.0 |
|
|
| 0.8 |
|
|
| Fiscal 2015 |
|
| Fiscal 2014 |
|
|
|
|
| ||||||||||
|
| 52 weeks |
|
| 53 weeks |
|
| % Increase |
| |||||||||||
|
| $ |
|
| % |
|
| $ |
|
| % |
|
| (Decrease) |
| |||||
|
| (Amounts in thousands) |
|
|
|
|
|
| (Amounts in thousands) |
|
|
|
|
|
|
|
|
| ||
Branded retail |
| $ | 2,151,514 |
|
|
| 56.9 |
|
| $ | 2,102,028 |
|
|
| 56.1 |
|
|
| 2.4 |
|
Store branded retail |
|
| 571,827 |
|
|
| 15.1 |
|
|
| 608,617 |
|
|
| 16.2 |
|
|
| (6.0 | ) |
Non-retail and other |
|
| 1,055,164 |
|
|
| 28.0 |
|
|
| 1,038,328 |
|
|
| 27.7 |
|
|
| 1.6 |
|
Total |
| $ | 3,778,505 |
|
|
| 100.0 |
|
| $ | 3,748,973 |
|
|
| 100.0 |
|
|
| 0.8 |
|
The 0.8% increase in sales was attributable to the following:
Percentage |
| Favorable (Unfavorable) |
| |
Pricing/ |
|
| 0.2 |
|
Volume |
|
| 1.0 |
|
Acquisitions |
|
| 1.3 |
|
Week 53 impact from Fiscal 2014 |
|
| (1.7 | ) |
Total |
|
| 0.8 |
|
Sales category discussion
Overall, sales increased in fiscal 2015 due primarily to the DKB and Alpine acquisitions and volume growth in both the branded retail and non-retail categories. These increases were partially offset by the impact of the additional week in fiscal 2014 which affected all categories, and volume declines in the store branded retail category. The increase in branded retail sales was due primarily to the DKB and Alpine acquisition contribution, volume increases from the re-introduction of the brands we acquired as part of the Acquired Hostess Bread Assets and growth in our expansion markets (defined as new markets we entered into in the last five years), partially offset by the impact of the additional week in fiscal 2014. The decrease in store branded retail sales was due primarily to volume decreases from certain exited business, a shift to branded products and the impact of the additional week in fiscal 2014. The increase in non-retail and other sales, which include contract manufacturing, vending and foodservice, was largely due to significant volume increases in foodservice. The increase was partially offset by volume declines in contract manufacturing due to exiting the non-retail tortilla business in the second half of fiscal 2014, as well as declines in pricing/mix and the impact of the additional week in fiscal 2014.
DSD Segment Sales
|
| Fiscal 2015 |
|
| Fiscal 2014 |
|
|
|
|
| ||||||||||
|
| 52 weeks |
|
| 53 weeks |
|
| % Increase |
| |||||||||||
|
| $ |
|
| % |
|
| $ |
|
| % |
|
| (Decrease) |
| |||||
|
| (Amounts in thousands) |
|
|
|
|
|
| (Amounts in thousands) |
|
|
|
|
|
|
|
|
| ||
Branded Retail |
| $ | 2,010,792 |
|
|
| 63.2 |
|
| $ | 1,971,851 |
|
|
| 62.5 |
|
|
| 2.0 |
|
Store Branded Retail |
|
| 457,234 |
|
|
| 14.4 |
|
|
| 486,886 |
|
|
| 15.4 |
|
|
| (6.1 | ) |
Non-retail and Other |
|
| 711,322 |
|
|
| 22.4 |
|
|
| 696,870 |
|
|
| 22.1 |
|
|
| 2.1 |
|
Total |
| $ | 3,179,348 |
|
|
| 100.0 |
|
| $ | 3,155,607 |
|
|
| 100.0 |
|
|
| 0.8 |
|
|
| Fiscal 2015 |
|
| Fiscal 2014 |
|
|
|
|
| ||||||||||
|
| 52 weeks |
|
| 53 weeks |
|
| % Increase |
| |||||||||||
|
| $ |
|
| % |
|
| $ |
|
| % |
|
| (Decrease) |
| |||||
|
| (Amounts in thousands) |
|
|
|
|
|
| (Amounts in thousands) |
|
|
|
|
|
|
|
|
| ||
Branded retail |
| $ | 2,011,433 |
|
|
| 63.3 |
|
| $ | 1,971,851 |
|
|
| 62.5 |
|
|
| 2.0 |
|
Store branded retail |
|
| 457,467 |
|
|
| 14.4 |
|
|
| 486,886 |
|
|
| 15.4 |
|
|
| (6.0 | ) |
Non-retail and other |
|
| 710,448 |
|
|
| 22.3 |
|
|
| 696,870 |
|
|
| 22.1 |
|
|
| 1.9 |
|
Total |
| $ | 3,179,348 |
|
|
| 100.0 |
|
| $ | 3,155,607 |
|
|
| 100.0 |
|
|
| 0.8 |
|
The 0.8% increase in sales was attributable to the following:
Percentage |
| Favorable (Unfavorable) |
| |
Pricing/ |
|
| 0.3 |
|
Volume |
|
| 1.0 |
|
Acquisition |
|
| 1.2 |
|
Week 53 impact from Fiscal 2014 |
|
| (1.7 | ) |
Total |
|
| 0.8 |
|
Sales category discussion
The increase in branded retail sales was due primarily to the DKB acquisition sales contribution and volume increases driven by the re-introduction of the brands we acquired as part of the Acquired Hostess Bread Assets and in our expansion markets, partially offset by the impact of the additional week in fiscal 2014. The decrease in store branded retail sales was due primarily to volume decreases from certain exited business, the impact of the additional week in fiscal 2014 and a shift to branded products. The increase in non-retail and other sales, which include contract manufacturing, vending and foodservice, was largely due to volume increases in foodservice, partially offset by the impact of the additional week in fiscal 2014.
Warehouse Segment Sales
|
| Fiscal 2015 |
|
| Fiscal 2014 |
|
|
|
|
| ||||||||||
|
| 52 weeks |
|
| 53 weeks |
|
| % Increase |
| |||||||||||
|
| $ |
|
| % |
|
| $ |
|
| % |
|
| (Decrease) |
| |||||
|
| (Amounts in thousands) |
|
|
|
|
|
| (Amounts in thousands) |
|
|
|
|
|
|
|
|
| ||
Branded Retail |
| $ | 139,832 |
|
|
| 23.3 |
|
| $ | 130,177 |
|
|
| 21.9 |
|
|
| 7.4 |
|
Store Branded Retail |
|
| 114,360 |
|
|
| 19.1 |
|
|
| 121,731 |
|
|
| 20.5 |
|
|
| (6.1 | ) |
Non-retail and Other |
|
| 344,965 |
|
|
| 57.6 |
|
|
| 341,458 |
|
|
| 57.6 |
|
|
| 1.0 |
|
Total |
| $ | 599,157 |
|
|
| 100.0 |
|
| $ | 593,366 |
|
|
| 100.0 |
|
|
| 1.0 |
|
|
| Fiscal 2015 |
|
| Fiscal 2014 |
|
|
|
|
| ||||||||||
|
| 52 weeks |
|
| 53 weeks |
|
| % Increase |
| |||||||||||
|
| $ |
|
| % |
|
| $ |
|
| % |
|
| (Decrease) |
| |||||
|
| (Amounts in thousands) |
|
|
|
|
|
| (Amounts in thousands) |
|
|
|
|
|
|
|
|
| ||
Branded retail |
| $ | 140,081 |
|
|
| 23.4 |
|
| $ | 130,177 |
|
|
| 21.9 |
|
|
| 7.6 |
|
Store branded retail |
|
| 114,360 |
|
|
| 19.1 |
|
|
| 121,731 |
|
|
| 20.5 |
|
|
| (6.1 | ) |
Non-retail and other |
|
| 344,716 |
|
|
| 57.5 |
|
|
| 341,458 |
|
|
| 57.6 |
|
|
| 1.0 |
|
Total |
| $ | 599,157 |
|
|
| 100.0 |
|
| $ | 593,366 |
|
|
| 100.0 |
|
|
| 1.0 |
|
The 1.0% increase in sales was attributable to the following:
Percentage |
| Favorable (Unfavorable) |
| |
Pricing/ |
|
| (0.1 | ) |
Volume |
|
| 0.7 |
|
Acquisition |
|
| 2.0 |
|
Week 53 impact from Fiscal 2014 |
|
| (1.6 | ) |
Total |
|
| 1.0 |
|
Sales category discussion
Branded retail sales increased due to the Alpine acquisition sales contribution, partially offset by the impact of the additional week in fiscal 2014. Store branded retail sales decreased due to significant volume declines in store branded cake and the impact of the additional week in the prior year. The increase in non-retail and other sales, which include contract manufacturing, vending and foodservice (including tortillas), was due primarily to significant volume increases in foodservice sales, partially offset by declines in contract manufacturing due to exiting the non-retail tortilla business in the second half of fiscal 2014, lower mix sales and the impact of the additional week in the prior year.
Materials, Supplies, Labor, and Other Production Costs (exclusive of depreciation and amortization shown separately). The table below presents the significant componentsseparately; as a percent of materials, supplies, labor, and other production costs (exclusive of depreciation and amortization shown separately):sales)
Consolidated
Line item component |
| Fiscal 2015 % of sales |
|
| Fiscal 2014 % of sales |
|
| Increase (Decrease) as a % of sales |
| |||
Ingredients |
|
| 25.3 |
|
|
| 25.9 |
|
|
| (0.6 | ) |
Workforce-related costs |
|
| 14.1 |
|
|
| 13.7 |
|
|
| 0.4 |
|
Packaging |
|
| 4.7 |
|
|
| 4.6 |
|
|
| 0.1 |
|
Utilities |
|
| 1.6 |
|
|
| 1.7 |
|
|
| (0.1 | ) |
Other |
|
| 6.3 |
|
|
| 6.1 |
|
|
| 0.2 |
|
Total |
|
| 52.0 |
|
|
| 52.0 |
|
|
| — |
|
Lower ingredient costs as a percent of sales, decreases in carrying costs, excluding depreciation, associated with the acquired Hostess facilities acquired as part of the Acquired Hostess Bread Assets, as well as, improved manufacturing efficiencies were offset by higher costs as a percent of sales for the acquired companies and higher workforce-related costs as a percent of sales. Ingredient costs decreased as a percent of sales largely due to lower prices for flour, sweeteners and oils and increases in outside purchases of product (sales with no associated ingredient costs), partially offset by higher egg prices and higher costs for the organic ingredients. This outside purchased product is included in the other line item above and largely relates to purchases of DKB products from co-manufacturers due to capacity constraints and higher outside purchases of product for the Warehouse Segment. Increases in workforce-related costs as a percent of sales primarily resulted from higher employee incentive costs and the incremental costs of adding productions lines, partially offset by increases in outside purchases of product (sales with no associated workforce-related costs).
Commodities, such as our baking ingredients, periodically experience price fluctuations. The cost of these inputs may fluctuate widely due to government policy and regulation, weather conditions, domestic and international demand, or other unforeseen circumstances. We enter into forward purchase agreements and other derivative financial instruments in an effort to manage the impact of such volatility in raw material prices. Any decrease in the availability of these agreements and instruments could increase the effective price of these raw materials to us and significantly affect our earnings.
The table below presents the significant components of materials, supplies, labor, and other production costs for the DSD Segment (exclusive of depreciation and amortization shown separately):
Line item component |
| Fiscal 2015 % of sales |
|
| Fiscal 2014 % of sales |
|
| Increase (Decrease) as a % of sales |
| |||
Ingredients |
|
| 22.7 |
|
|
| 23.4 |
|
|
| (0.7 | ) |
Workforce-related costs |
|
| 12.3 |
|
|
| 12.0 |
|
|
| 0.3 |
|
Packaging |
|
| 3.3 |
|
|
| 3.4 |
|
|
| (0.1 | ) |
Utilities |
|
| 1.5 |
|
|
| 1.6 |
|
|
| (0.1 | ) |
Other |
|
| 8.4 |
|
|
| 7.6 |
|
|
| 0.8 |
|
Total |
|
| 48.2 |
|
|
| 48.0 |
|
|
| 0.2 |
|
The DSD Segment’s decrease in ingredient costs as a percent of sales was attributable to lower pricing on flour, sweeteners and oils for core bakeries, decreases in sales of product to the Warehouse Segment (ingredient costs with no associated sales), increases in outside purchases of product (sales with no associated ingredient cost) and lower stales. Higher costs for DKB’s organic ingredients and higher egg prices partially offset the ingredient decrease. Workforce-related costs increased as a percent of sales primarily due to additional production lines and higher employee incentive costs, partially offset by decreased sales of product to the Warehouse Segment (workforce-related costs with no associated sales). The increase in the other line item is mainly due to decreases in sales of product to the Warehouse Segment, mainly the non-retail tortilla products, and increases in outside purchases of product, largely certain DKB products due to capacity constraints.
The table below presents the significant components of materials, supplies, labor and other production costs for the Warehouse Segment (exclusive of depreciation and amortization shown separately):
Line item component |
| Fiscal 2015 % of sales |
|
| Fiscal 2014 % of sales |
|
| Increase (Decrease) as a % of sales |
| |||
Ingredients |
|
| 38.8 |
|
|
| 39.0 |
|
|
| (0.2 | ) |
Workforce-related costs |
|
| 23.7 |
|
|
| 22.8 |
|
|
| 0.9 |
|
Packaging |
|
| 11.6 |
|
|
| 11.0 |
|
|
| 0.6 |
|
Utilities |
|
| 1.8 |
|
|
| 1.9 |
|
|
| (0.1 | ) |
Other |
|
| (4.1 | ) |
|
| (1.4 | ) |
|
| (2.7 | ) |
Total |
|
| 71.8 |
|
|
| 73.3 |
|
|
| (1.5 | ) |
The Warehouse Segment’s decrease in ingredient costs as a percent of sales was primarily attributed to lower prices for flour, sweeteners, oils and cocoa for core bakeries and increases in outside purchases of product (sales with no associated ingredient costs). Higher egg prices, decreased product purchases from the DSD Segment (sales with no associated ingredient costs) and higher ingredient costs for Alpine partially offset the ingredient decrease. Workforce-related costs increased as a percent of sales mainly due to increased headcount, decreased purchases of product from the DSD Segment (sales with no associated workforce-related costs) and higher employee incentive costs. The increase in packaging was due primarily to price increases. The decrease in the other line item is primarily due to decreased purchases of product from the DSD Segment, largely the tortilla products for the non-retail tortilla business we exited in fiscal 2014, partially offset by increases in outside purchases of product.
Selling, Distribution and Administrative Expenses. The table below presents the significant components of selling, distribution and administrative expenses asExpenses (as a percent of sales:sales)
Consolidated
Line item component |
| Fiscal 2015 % of sales |
|
| Fiscal 2014 % of sales |
|
| Increase (Decrease) as a % of sales |
| |||
Workforce-related costs |
|
| 17.1 |
|
|
| 17.4 |
|
|
| (0.3 | ) |
Distributor distribution fees |
|
| 13.4 |
|
|
| 13.4 |
|
|
| — |
|
Other |
|
| 6.1 |
|
|
| 5.7 |
|
|
| 0.4 |
|
Total |
|
| 36.6 |
|
|
| 36.5 |
|
|
| 0.1 |
|
Workforce-related costs decreased as a percent of sales due to lower costs for the acquired companies, improvements at Lepage and cost saving initiatives we have implemented, partially offset by higher employee incentive costs and lower pension income. The majority of the acquisition sales were distributed via warehouse delivery which carries a lower cost structure than direct-store-delivery and we anticipate this to continue into fiscal 2016 while we are converting the DKB sales to the direct-store-delivery distribution method.direct-store-delivery. Acquisition-related costs of $6.2 million, as well as higher legal and consulting costs in fiscal 2015 as compared to fiscal 2014 caused the majority of the increase in the other line item component.
The table below presents the significant components of our DSD Segment selling, distribution and administrative expenses as a percent of sales:
Line item component |
| Fiscal 2015 % of sales |
|
| Fiscal 2014 % of sales |
|
| Increase (Decrease) as a % of sales |
|
| Fiscal 2015 % of sales |
|
| Fiscal 2014 % of sales |
|
| Decrease as a % of sales |
| ||||||
Workforce-related costs |
|
| 17.1 |
|
|
| 17.5 |
|
|
| (0.4 | ) |
|
| 17.1 |
|
|
| 17.5 |
|
|
| (0.4 | ) |
Distributor distribution fees |
|
| 15.9 |
|
|
| 15.9 |
|
|
| — |
|
|
| 15.9 |
|
|
| 15.9 |
|
|
| — |
|
Other |
|
| 5.5 |
|
|
| 5.6 |
|
|
| (0.1 | ) |
|
| 5.5 |
|
|
| 5.6 |
|
|
| (0.1 | ) |
Total |
|
| 38.5 |
|
|
| 39.0 |
|
|
| (0.5 | ) |
|
| 38.5 |
|
|
| 39.0 |
|
|
| (0.5 | ) |
The decrease in workforce-related costs as a percent of sales was attributable to lower costs for DKB as a percent of sales, conversions to independent distributors in newer markets, improvements at Lepage and implementing cost saving initiatives, partially offset by higher employee incentive costs. The majority of the DKB products were distributed via warehouse delivery and we anticipate this to continue intoin fiscal 2016 while we are converting these sales to the direct-store-delivery method.2015. This resulted in distributor distribution fees remaining consistent with the prior fiscal year as a percent of sales.
The table below presents the significant components of our Warehouse Segment selling, distribution and administrative expenses as a percent of sales:
Line item component |
| Fiscal 2015 % of sales |
|
| Fiscal 2014 % of sales |
|
| Increase (Decrease) as a % of sales |
|
| Fiscal 2015 % of sales |
|
| Fiscal 2014 % of sales |
|
| Increase as a % of sales |
| ||||||
Workforce-related costs |
|
| 7.9 |
|
|
| 7.7 |
|
|
| 0.2 |
|
|
| 7.9 |
|
|
| 7.7 |
|
|
| 0.2 |
|
Freezer storage/rent |
|
| 2.1 |
|
|
| 2.0 |
|
|
| 0.1 |
|
|
| 2.1 |
|
|
| 2.0 |
|
|
| 0.1 |
|
Distribution costs (includes freight and shipping and hauling) |
|
| 2.1 |
|
|
| 2.0 |
|
|
| 0.1 |
|
|
| 2.1 |
|
|
| 2.0 |
|
|
| 0.1 |
|
Other |
|
| 4.0 |
|
|
| 3.7 |
|
|
| 0.3 |
|
|
| 4.0 |
|
|
| 3.7 |
|
|
| 0.3 |
|
Total |
|
| 16.1 |
|
|
| 15.4 |
|
|
| 0.7 |
|
|
| 16.1 |
|
|
| 15.4 |
|
|
| 0.7 |
|
Workforce-related costs increased primarily due to higher employee incentive costs as compared to the prior year on smaller sales increases. Additionally, higher marketing costs as a percent of sales drove the increase in the other line item, mainly attributable to marketing initiatives for the Alpine products.
Depreciation and Amortization.Amortization Expense
Depreciation and amortization expense increased in dollars and as a percent of sales due primarily to the DKB and Alpine acquisitions. We preliminarily recorded $240.9 million of amortizing intangible assets related to the DKB and Alpine acquisitions and we expect amortization expense to continue to be higher in fiscal 2016 as a result of this.acquisitions.
The DSD Segment’s depreciation and amortization expense increased in dollars primarily due to the amortization of the acquired DKB intangible assets, partially offset by lower depreciation expense.
The Warehouse Segment’s depreciation and amortization expense increase in dollars and as a percent of sales was mostly the result of the amortization of the acquired Alpine intangible assets.
Pension Plan Settlement Loss.Loss
We recorded a settlement charge of $15.4 million during the fourth quarter of our fiscal 2014 related to our pension risk mitigation plan. Refer to the Pension plan settlement lossesdiscussion in Pension Obligations in the “Critical Accounting Estimates”“Matters Affecting Comparability” section above for additional details.
Impairment of Assets.Assets
We recorded impairments of assets of $3.8 million and $10.3 million during fiscal 2015 and 2014, respectively. Refer to the Impairment of Assetsassets discussion in the “Overview”“Matters Affecting Comparability” section above for additional details.
Income from Operations. The table below summarizes the change in operating income by segment as a percent of sales:Operations
Operating income (loss) |
| Favorable (Unfavorable) Percentage |
|
| Increase (Decrease) as a % of Sales |
| ||
DSD Segment |
|
| 6.4 |
|
|
| 0.5 |
|
Warehouse Segment |
|
| 7.4 |
|
|
| 0.5 |
|
Unallocated corporate |
|
| 0.9 |
|
| NA |
| |
Consolidated |
|
| 8.2 |
|
|
| 0.6 |
|
|
| |||
|
| |||
|
| |||
|
| |||
|
| segment has no revenues. | ||
The favorable increase in the DSD Segment income from operations was largely attributable to sales increases, lower ingredient costs and lower asset impairment charges in the current year as compared to the prior year. The Warehouse Segment’s favorable increase was largely attributable to exiting the lower margin non-retail tortilla business in the second half of fiscal 2014, partially offset by higher selling, distribution and administrative costs as a percent of sales. The favorable decrease in the unallocated corporate expense was largely due to the $15.4 million pension plan settlement loss recorded in fiscal 2014, mostly offset by $6.2 million of acquisition-related costs, higher legal and consulting costs and lower pension income recorded in the current fiscal year as compared to the prior fiscal year.2015.
The decrease in net interest expense resulted from lower average debt outstanding during the current fiscal year2015 and lower average interest rates on debt outstanding, as well as, higher interest income in fiscal 2015 due to higher average distributor notes receivable outstanding during the current fiscalyear over year. We expect net interest expense to be elevated in fiscal 2016 due to the drawdowns to fund the acquisitions completed in fiscal 2015.
The effective tax rate for fiscal 2015 and fiscal 2014 was 35.4% and 34.4%, respectively. The increase in the rate was primarily related to a reduction in the Section 199 qualifying production activities deduction and certain nondeductible
acquisition-related costs. The most significant differences in the effective rate and the statutory rate were related to additions for state income taxes, partially offset by reductions for the Section 199 qualifying production activities deduction.
Fiscal 2014 compared to Fiscal 2013Comprehensive Income
Consolidated Sales
|
| Fiscal 2014 |
|
| Fiscal 2013 |
|
|
|
|
| ||||||||||
|
| 53 weeks |
|
| 52 weeks |
|
| % Increase |
| |||||||||||
|
| $ |
|
| % |
|
| $ |
|
| % |
|
| (Decrease) |
| |||||
|
| (Amounts in thousands) |
|
|
|
|
|
| (Amounts in thousands) |
|
|
|
|
|
|
|
|
| ||
Branded Retail |
| $ | 2,102,028 |
|
|
| 56.1 |
|
| $ | 2,038,726 |
|
|
| 54.6 |
|
|
| 3.1 |
|
Store Branded Retail |
|
| 608,617 |
|
|
| 16.2 |
|
|
| 645,858 |
|
|
| 17.3 |
|
|
| (5.8 | ) |
Non-retail and Other |
|
| 1,038,328 |
|
|
| 27.7 |
|
|
| 1,048,032 |
|
|
| 28.1 |
|
|
| (0.9 | ) |
Total |
| $ | 3,748,973 |
|
|
| 100.0 |
|
| $ | 3,732,616 |
|
|
| 100.0 |
|
|
| 0.4 |
|
The 0.4% increase in sales was attributable to the following:
|
| |||
|
| |||
|
|
| ||
|
| |||
|
| |||
|
| |||
Sales category discussion
Overall, sales increased due to the additional week in fiscal 2014 which affected all categories, as well as favorable pricing/mix due to a shift from lower margin cake items and store branded bread, buns, and rolls to higher margin branded bread, buns and rolls, and the Sara Lee California acquisition contribution. These increases were partially offset by volume declines in our cake business, store branded breads, buns and rolls and foodservice business, and increased promotional activity. The re-introduction of the Hostess cake brands by a competitor negatively impacted our cake sales and certain store branded and foodservice business was exited during the fiscal year. The increase in branded retail sales was due primarily to volume increasescomprehensive income resulted from an increase the re-introductionfair value of the brands we acquired as part of the Acquired Hostess Bread Assets, growth in our expansion marketspension and the Sara Lee California acquisition, partially offset by significant volume declines in branded cake. The decrease in store branded retail sales was due primarily to volume decreases in branded cake and certain exited business. The decrease in non-retail and other sales, which include contract manufacturing, vending and foodservice, was largely due to volume decreases in foodservice, institutional and vending sales, partially offset by positive pricing/mix. Sales from the Acquired Hostess Bread Assets are not included in the acquisition contribution because Hostess filed for bankruptcy and ceased operations in November 2012. As a result, there were no sales from the Acquired Hostess Bread Asset brands between November 2012 and our reintroduction of the Acquired Hostess Bread Asset brands in the fourth quarter of fiscal 2013.
DSD Segment Sales
|
| Fiscal 2014 |
|
| Fiscal 2013 |
|
|
|
|
| ||||||||||
|
| 53 weeks |
|
| 52 weeks |
|
| % Increase |
| |||||||||||
|
| $ |
|
| % |
|
| $ |
|
| % |
|
| (Decrease) |
| |||||
|
| (Amounts in thousands) |
|
|
|
|
|
| (Amounts in thousands) |
|
|
|
|
|
|
|
|
| ||
Branded Retail |
| $ | 1,971,851 |
|
|
| 62.5 |
|
| $ | 1,898,016 |
|
|
| 61.6 |
|
|
| 3.9 |
|
Store Branded Retail |
|
| 486,886 |
|
|
| 15.4 |
|
|
| 504,707 |
|
|
| 16.4 |
|
|
| (3.5 | ) |
Non-retail and Other |
|
| 696,870 |
|
|
| 22.1 |
|
|
| 677,532 |
|
|
| 22.0 |
|
|
| 2.9 |
|
Total |
| $ | 3,155,607 |
|
|
| 100.0 |
|
| $ | 3,080,255 |
|
|
| 100.0 |
|
|
| 2.4 |
|
The 2.4% increase in sales was attributable to the following:
|
| |||
|
| |||
|
| |||
|
| |||
|
| |||
|
| |||
Sales category discussion
Sales increased due to the additional week in fiscal 2014 which impacted all categories, as well as volume increases resulting from the re-introduction of the Acquired Hostess Bread Assets, growth in our expansion marketspostretirement plan assets and to a lesser extent the Sara Lee California acquisition. Declines in cake volumes and store branded products partially offset these increases. The re-introduction of the Hostess cake brands by a competitor negatively impacted our sales. We also experienced declines in certain store branded business. The increase in branded retail sales was due primarily to volume increases and the Sara Lee California acquisition, partially offset by declines in branded cake and pricing/mix. We continue to experience heavy promotional activity within the category. The decrease in store branded retail was mainly due to volume declines related to certain exited business. The increase in non-retail and other sales was due to positive pricing/mix, partially offset by volume decreases in institutional sales.
Warehouse Segment Sales
|
| Fiscal 2014 |
|
| Fiscal 2013 |
|
|
|
|
| ||||||||||
|
| 53 weeks |
|
| 52 weeks |
|
| % Increase |
| |||||||||||
|
| $ |
|
| % |
|
| $ |
|
| % |
|
| (Decrease) |
| |||||
|
| (Amounts in thousands) |
|
|
|
|
|
| (Amounts in thousands) |
|
|
|
|
|
|
|
|
| ||
Branded Retail |
| $ | 130,177 |
|
|
| 21.9 |
|
| $ | 140,710 |
|
|
| 21.6 |
|
|
| (7.5 | ) |
Store Branded Retail |
|
| 121,731 |
|
|
| 20.5 |
|
|
| 141,151 |
|
|
| 21.6 |
|
|
| (13.8 | ) |
Non-retail and Other |
|
| 341,458 |
|
|
| 57.6 |
|
|
| 370,500 |
|
|
| 56.8 |
|
|
| (7.8 | ) |
Total |
| $ | 593,366 |
|
|
| 100.0 |
|
| $ | 652,361 |
|
|
| 100.0 |
|
|
| (9.0 | ) |
The 9.0% decrease in sales was attributable to the following:
|
| |||
|
|
| ||
|
|
| ||
|
| |||
|
|
| ||
Sales category discussion
Volume declined in all categories due to decreases in our cake business associated with the re-introduction of the Hostess cake brands by a competitor in the second half of fiscal 2013 as well as declines in our foodservice business, partially offset by the additional week in fiscal 2014 which affected all categories. Branded and store branded retail decreased due to significant volume declines in cake, partially offset by positive pricing/mix. The decrease in non-retail and other sales, which include contract manufacturing, vending and foodservice (including tortillas), was due primarily to certain exited foodservice business and to a lesser extent lower vending and contract manufacturing volume.
Materials, Supplies, Labor, and Other Production Costs (exclusive of depreciation and amortization shown separately). The table below presents the significant components of materials, supplies, labor, and other production costs (exclusive of depreciation and amortization shown separately):
Line item component |
| FY 2014 % of sales |
|
| FY 2013 % of sales |
|
| Increase (Decrease) as a % of sales |
| |||
Ingredients |
|
| 25.9 |
|
|
| 26.9 |
|
|
| (1.0 | ) |
Workforce-related costs |
|
| 13.7 |
|
|
| 13.1 |
|
|
| 0.6 |
|
Packaging |
|
| 4.6 |
|
|
| 4.5 |
|
|
| 0.1 |
|
Utilities |
|
| 1.7 |
|
|
| 1.5 |
|
|
| 0.2 |
|
Other |
|
| 6.1 |
|
|
| 6.8 |
|
|
| (0.7 | ) |
Total |
|
| 52.0 |
|
|
| 52.8 |
|
|
| (0.8 | ) |
Overall, the decrease was attributable to lower ingredient costs as a percent of sales and improved manufacturing efficiencies, partially offset by the carrying costs, excluding depreciation, associated with the acquired Hostess facilities increasing $5.4 million and higher workforce-related costs. Ingredient costs decreased as a percent of sales largely due to lower prices for sweeteners, oils and flour, partially offset by higher gluten costs and decreases in outside purchases of product (sales with no associated ingredient costs). This outside purchased product is included in the other line item above and largely relates to purchases from BBU in the prior year for the Sara Lee product. Increases in workforce-related costs as a percent of sales primarily resulted from lower sales for the Warehouse Segment and decreases in outside purchases of product (sales with no associated workforce-related costs).
Commodities, such as our baking ingredients, periodically experience price fluctuations. The cost of these inputs may fluctuate widely due to government policy and regulation, weather conditions, domestic and international demand, or other unforeseen circumstances. We enter into forward purchase agreements and other derivative financial instruments in an effort to manage the impact of such volatility in raw material prices. Any decrease in the availability of these agreements and instruments could increase the effective price of these raw materials to us and significantly affect our earnings.
The table below presents the significant components of materials, supplies, labor, and other production costs for the DSD Segment (exclusive of depreciation and amortization shown separately):
Line item component |
| FY 2014 % of sales |
|
| FY 2013 % of sales |
|
| Increase (Decrease) as a % of sales |
| |||
Ingredients |
|
| 23.4 |
|
|
| 24.2 |
|
|
| (0.8 | ) |
Workforce-related costs |
|
| 12.0 |
|
|
| 11.6 |
|
|
| 0.4 |
|
Packaging |
|
| 3.4 |
|
|
| 3.4 |
|
|
| — |
|
Utilities |
|
| 1.6 |
|
|
| 1.5 |
|
|
| 0.1 |
|
Other |
|
| 7.6 |
|
|
| 7.4 |
|
|
| 0.2 |
|
Total |
|
| 48.0 |
|
|
| 48.1 |
|
|
| (0.1 | ) |
The DSD Segment’s decrease in ingredient costs as a percent of sales was attributable to lower pricing on sweeteners, oils and flour, partially offset by decreases in sales of outside purchased products (sales with no associated ingredient costs) and higher gluten prices. Workforce-related costs increased as a percent of sales primarily due to decreased outside purchases of product (sales with no associated workforce-related costs). This outside purchased product is included in the other line item above and largely relates to purchases from BBU in the prior year for the Sara Lee product. The increase in the other line item is due to decreases in sales of product to and increases in purchases from the Warehouse Segment and increases in other carrying costs associated with the acquired Hostess facilities, mostly offset by decreases in outside purchases of product.
The table below presents the significant components of materials, supplies, labor and other production costs for the Warehouse Segment (exclusive of depreciation and amortization shown separately):
Line item component |
| FY 2014 % of sales |
|
| FY 2013 % of sales |
|
| Increase (Decrease) as a % of sales |
| |||
Ingredients |
|
| 39.0 |
|
|
| 39.6 |
|
|
| (0.6 | ) |
Workforce-related costs |
|
| 22.8 |
|
|
| 20.4 |
|
|
| 2.4 |
|
Packaging |
|
| 11.0 |
|
|
| 9.9 |
|
|
| 1.1 |
|
Utilities |
|
| 1.9 |
|
|
| 1.7 |
|
|
| 0.2 |
|
Other |
|
| (1.4 | ) |
|
| 3.4 |
|
|
| (4.8 | ) |
Total |
|
| 73.3 |
|
|
| 75.0 |
|
|
| (1.7 | ) |
The Warehouse Segment’s decrease in ingredient costs as a percent of sales was primarily attributed to lower ingredient pricing, partially offset by increased sales to the DSD Segment (ingredient costs with no associated sales). The decreases in sales volume and increased sales to the DSD Segment increased workforce-related costs as a percent of sales (workforce-related costs with no associated sales). The increase in packaging was due primarily to price increases and increased sales to the DSD Segment (packaging costs with no associated sales). The decrease in the other line item is primarily due to decreased purchases of product from the DSD Segment and, to a lesser extent, increased sales of product to the DSD Segment.
Selling, Distribution and Administrative Expenses. The table below presents the significant components of selling, distribution and administrative expenses as a percent of sales:
Line item component |
| FY 2014 % of sales |
|
| FY 2013 % of sales |
|
| Increase (Decrease) as a % of sales |
| |||
Workforce-related costs |
|
| 17.4 |
|
|
| 17.7 |
|
|
| (0.3 | ) |
Distributor distribution fees |
|
| 13.4 |
|
|
| 12.3 |
|
|
| 1.1 |
|
Other |
|
| 5.7 |
|
|
| 6.3 |
|
|
| (0.6 | ) |
Total |
|
| 36.5 |
|
|
| 36.3 |
|
|
| 0.2 |
|
The distributor distribution fees increased due to converting the DSD Segment’s Lepage and California territories to independent distributors, as well as the DSD Segment comprising a larger percentage of consolidated sales. Workforce-related costs decreased due to the conversion to independent distributors, partially offset by costs associated with the Lepage integration and lower sales for the Warehouse Segment. Prior year acquisition-related costs of $17.8 million caused the majority of the decline in the other line item component.
The table below presents the significant components of our DSD Segment selling, distribution and administrative expenses as a percent of sales:
Line item component |
| FY 2014 % of sales |
|
| FY 2013 % of sales |
|
| Increase (Decrease) as a % of sales |
| |||
Workforce-related costs |
|
| 17.5 |
|
|
| 18.2 |
|
|
| (0.7 | ) |
Distributor distribution fees |
|
| 15.9 |
|
|
| 14.9 |
|
|
| 1.0 |
|
Other |
|
| 5.6 |
|
|
| 5.8 |
|
|
| (0.2 | ) |
Total |
|
| 39.0 |
|
|
| 38.9 |
|
|
| 0.1 |
|
The decrease in workforce-related costs was attributable to the conversion to independent distributors discussed above which corresponds to the increase in distributor distribution fees. These decreases were partially offset by higher costs associated with the Lepage integration. The decrease in the other line item is mainly attributable to lower marketing costs in fiscal 2014 as compared to the prior year.
The table below presents the significant components of our Warehouse Segment selling, distribution and administrative expenses as a percent of sales:
Line item component |
| FY 2014 % of sales |
|
| FY 2013 % of sales |
|
| Increase (Decrease) as a % of sales |
| |||
Workforce-related costs |
|
| 7.7 |
|
|
| 7.4 |
|
|
| 0.3 |
|
Freezer storage/rent |
|
| 2.0 |
|
|
| 1.8 |
|
|
| 0.2 |
|
Distribution costs (includes freight and shipping and hauling) |
|
| 2.0 |
|
|
| 2.1 |
|
|
| (0.1 | ) |
Other |
|
| 3.7 |
|
|
| 3.3 |
|
|
| 0.4 |
|
Total |
|
| 15.4 |
|
|
| 14.6 |
|
|
| 0.8 |
|
The overall increase in selling, distribution and administrative expenses was primarily driven by significantly lower sales which spread the costs over a smaller sales base.
Depreciation and Amortization. Depreciation and amortization expense increased in dollars and as a percent of sales due primarily to the Acquired Hostess Bread Assets, the Henderson, Nevada bakery placed into operation, the acquisition of a bun line in Modesto, California and their bread line added in fiscal 2014, and certain capital leases entered into during fiscal 2014.
The DSD Segment’s depreciation and amortization expense increased in dollars and as a percent of sales primarily due to the Acquired Hostess Bread Assets, the Henderson, Nevada bakery placed into operation, the acquisition of certain assets related to a bun line in Modesto, California and their bread line added in fiscal 2014, and certain capital leases entered into during fiscal 2014.
The Warehouse Segment’s depreciation and amortization expense increase as a percent of sales was the result of significantly lower sales in fiscal 2014 as compared to the prior year.
Pension Plan Settlement Loss. We recorded a settlement charge of $15.4 million during the fourth quarter of our fiscal 2014 related to our pension risk mitigation plan. Refer to the discussion in Pension Obligations in the “Critical Accounting Estimates” section above for additional details.
Impairment of Assets. We recorded impairments of assets of $10.3 million during fiscal 2014. Refer to the Impairment of Assets discussion in the “Overview” section above for additional details.
Income from Operations. The table below summarizes the change in operating income by segment as a percent of sales:
|
| |||
|
|
| ||
|
|
| ||
|
| |||
|
|
| ||
The unfavorable decrease in the DSD Segment income from operations was largely attributable to the gain on acquisition recorded for the Sara Lee California acquisition in fiscal 2013 as discussed above. The gain on acquisition accounted for 13.8% of the DSD Segment decrease in operating income. Excluding the gain on acquisition, the decrease was 4.3% which was driven by the impairment of assets discussed in the “Overview” section above, higher costs for the acquired Hostess facilities, and the Lepage integration costs, partially offset by lower ingredient costs. The unfavorable decrease in the Warehouse Segment income from operations was primarily due to sales decreases which were driven by volume declines as discussed above, partially offset by lower ingredient costs. The favorable decrease in unallocated corporate expenses was primarily due to the prior year acquisition costs associated with the Acquired Hostess Bread Assets and the Sara Lee California acquisition in fiscal 2013 and higher pension income in fiscal 2014 as compared to the prior year, partially offset by the pension plan settlement loss discussed above.
Net Interest Expense. The decrease resulted from higher interest income in fiscal 2014 due to an increase in distributor notes receivables outstanding as compared to the prior fiscalnet income year over year.
Income Taxes. The effective tax rate for fiscal 2014 and fiscal 2013 was 34.4% and 28.4%, respectively. The fiscal 2013 rate was driven by the gain on acquisition, which was recorded net of deferred taxes as a component of income before income taxes. The fiscal 2013 gain was treated as a permanent item in the tax provision, and favorably impacted the rate by approximately 5.2%. The
other significant differences in the effective rate and the statutory rate are additions for state income taxes, offset by reductions for the Section 199 qualifying production activities deduction, and discrete tax benefits.
LIQUIDITY, AND CAPITAL RESOURCES AND FINANCIAL POSITION
Liquidity representsStrategy
We believe our ability to consistently generate sufficient cash flows from operating activities to meet our obligationsliquidity needs is one of our key financial strengths and commitments as well aswe do not anticipate significant risks to these cash flows in the foreseeable future. Additionally, we strive to maintain a conservative financial position aiming to achieve this through prudent debt reduction and share repurchase programs. We believe having a conservative financial position allows us flexibility to make investments and acquisitions and is a strategic competitive advantage. Currently, our ability to obtain appropriate financing and to convert into cash those assets that are no longer required to meet existing strategic and financing objectives. Therefore, liquidity cannot be considered separately from capital resources that consist primarily of current and potentially available funds for use in achieving long-range business objectives. Currently, the company’s liquidity needs arise primarily from working capital requirements, capital expenditures, pension contributions and obligated debt repayments. We believe we currently have access to available funds and financing sources to meet our short and long-term capital expenditures.requirements. The company’s strategy for use of its excess cash flow includes flows includes:
paying dividends to shareholders, our shareholders;
repayment of indebtedness prior to the maturity date;
making acquisitions, growing internally,strategic acquisitions; and
repurchasing shares of its common stock, when appropriate. We believe we have access to available funds to meet our short and long-term capital requirements.
As discussed in the Overview section above, we completed the DKB acquisition on September 12, 2015 which required $282.1 million of cash and the Alpine acquisition on October 13, 2015 which required $109.3 million of cash and the issuance of 481,540 shares of our common stock. We funded the cash paid for the acquisitions and acquisition-related costs with cash on hand and funds available under the accounts receivable securitization and the credit facilities.
The company leases certain property and equipment under various operating and capital lease arrangements. Most of the operating leases provide the company with the option, after the initial lease term, either to purchase the property at the then fair value or renew itsthe lease at the then fair value. The capital leases provide the company with the option to purchase the property at a fixed price at the end of the lease term. The company believes the use of leases as a financing alternative places the company in a more favorable position to fulfill its long-term strategy for the use of its cash flow. See Note 12, Debt, Lease and Other Commitments, of Notes to Consolidated Financial Statements of this Form 10-K for detailed financial information regarding the company’s lease arrangements.
Key items impacting our liquidity, capital resources and financial position in Fiscal 2016 and 2015:
Fiscal 2016:
We generated $346.0 million of net cash from operating activities.
We issued $400.0 million of the 2026 notes that mature on October 1, 2026.
We repaid the 2016 and 2013 term loans prior to maturity with proceeds from the 2026 notes.
We reduced our total debt outstanding $55.6 million.
We repurchased 6.9 million shares of our common stock for $126.3 million (including shares repurchased under the ASR).
We invested in our plants through capital expenditures of $101.7 million (DSD Segment of $61.7 million and Warehouse Segment of $16.8 million).
We continued our pension de-risking strategy by offering pension plan participants who have not yet started receiving their payments, the option to receive their benefit as a single lump sum payment.
Fiscal 2015:
We generated $318.3 million of cash from operating activities.
We acquired DKB for $282.1 million in cash.
We acquired Alpine for $109.3 in cash and 481,540 shares of our common stock.
Our capital expenditures were $90.8 million (DSD Segment of $72.1 million and Warehouse Segment of $9.6 million).
We paid dividends of $120.4 million.
Our debt and capital lease obligations increased $247.0 million (primarily to fund the cash paid for the acquisitions).
Liquidity discussion Fiscal 2015 (52 Weeks) compared to Fiscal 2014 (53 Weeks)Discussion
Flowers Foods’ cash and cash equivalents were $6.4 million at December 31, 2016, $14.4 million at January 2, 2016 as compared toand $7.5 million at January 3, 2015. The cash and cash equivalents were derived from the activities presented in the table below (amounts in thousands):
Cash flow component |
| Fiscal 2015 |
|
| Fiscal 2014 |
|
| Change |
|
| Fiscal 2016 |
|
| Fiscal 2015 |
|
| Fiscal 2014 |
| ||||||
Cash flows provided by operating activities |
| $ | 324,233 |
|
| $ | 313,970 |
|
| $ | 10,263 |
|
| $ | 346,044 |
|
| $ | 318,301 |
|
| $ | 315,183 |
|
Cash disbursed for investing activities |
|
| (467,508 | ) |
|
| (33,313 | ) |
|
| (434,195 | ) |
|
| (70,047 | ) |
|
| (461,576 | ) |
|
| (34,526 | ) |
Cash provided by (disbursed for) financing activities |
|
| 150,130 |
|
|
| (281,664 | ) |
|
| 431,794 |
|
|
| (283,965 | ) |
|
| 150,130 |
|
|
| (281,664 | ) |
Total change in cash |
| $ | 6,855 |
|
| $ | (1,007 | ) |
| $ | 7,862 |
|
| $ | (7,968 | ) |
| $ | 6,855 |
|
| $ | (1,007 | ) |
Cash Flows Provided by Operating Activities. Net cash provided by operating activities included the following items for non-cash adjustments to net income (amounts in thousands):
|
| Fiscal 2015 |
|
| Fiscal 2014 |
|
| Change |
|
| Fiscal 2016 |
|
| Fiscal 2015 |
|
| Fiscal 2014 |
| ||||||
Depreciation and amortization |
| $ | 132,175 |
|
| $ | 128,961 |
|
| $ | 3,214 |
|
| $ | 140,869 |
|
| $ | 132,175 |
|
| $ | 128,961 |
|
Stock-based compensation |
|
| 15,692 |
|
|
| 18,662 |
|
|
| (2,970 | ) |
|
| 18,761 |
|
|
| 15,692 |
|
|
| 18,662 |
|
Impairment of assets |
|
| 3,771 |
|
|
| 10,308 |
|
|
| (6,537 | ) |
|
| 24,877 |
|
|
| 3,771 |
|
|
| 10,308 |
|
Loss (gain) reclassified from accumulated other comprehensive income to net income |
|
| 8,551 |
|
|
| 5,218 |
|
|
| 3,333 |
| ||||||||||||
Deferred income taxes |
|
| 18,293 |
|
|
| 9,241 |
|
|
| 9,052 |
|
|
| (14,457 | ) |
|
| 18,293 |
|
|
| 9,241 |
|
Provision for inventory obsolescence |
|
| 776 |
|
|
| 1,074 |
|
|
| (298 | ) | ||||||||||||
Allowances for accounts receivable |
|
| 2,395 |
|
|
| 4,956 |
|
|
| (2,561 | ) | ||||||||||||
Pension and postretirement plans expense (includes settlement loss in fiscal 2014) |
|
| (5,878 | ) |
|
| 5,341 |
|
|
| (11,219 | ) | ||||||||||||
Pension and postretirement plans (benefit) expense (including settlement losses) |
|
| 2,238 |
|
|
| (5,878 | ) |
|
| 5,341 |
| ||||||||||||
Other non-cash |
|
| (3,425 | ) |
|
| (6,215 | ) |
|
| 2,790 |
|
|
| 6,039 |
|
|
| 8,297 |
|
|
| 5,033 |
|
Net non-cash adjustment to net income |
| $ | 172,350 |
|
| $ | 177,546 |
|
| $ | (5,196 | ) |
| $ | 178,327 |
|
| $ | 172,350 |
|
| $ | 177,546 |
|
Net cash used for working capital requirements and pension contributions included the following items (amounts in thousands):
|
| Fiscal 2015 |
|
| Fiscal 2014 |
|
| Change |
| |||
Changes in accounts receivable, net |
| $ | (16,873 | ) |
| $ | 7,181 |
|
| $ | (24,054 | ) |
Changes in inventories, net |
|
| (9,717 | ) |
|
| 6,977 |
|
|
| (16,694 | ) |
Changes in hedging activities, net |
|
| (12,818 | ) |
|
| 22 |
|
|
| (12,840 | ) |
Changes in other assets |
|
| (7,133 | ) |
|
| (23,993 | ) |
|
| 16,860 |
|
Changes in accounts payable |
|
| 14,563 |
|
|
| (9,951 | ) |
|
| 24,514 |
|
Changes in other accrued liabilities |
|
| 4,670 |
|
|
| (6,552 | ) |
|
| 11,222 |
|
Qualified pension plan contributions |
|
| (10,000 | ) |
|
| (12,999 | ) |
|
| 2,999 |
|
Net changes in working capital and pension contributions |
| $ | (37,308 | ) |
| $ | (39,315 | ) |
| $ | 2,007 |
|
The changechanges in depreciation and amortization waswere primarily due to the acquisition ofintangible assets acquired with the DKB and Alpine intangible assetsacquisitions which have finite lives. Depreciation and amortization expense increased primarily as a result
Refer to the Impairment of these activities. The decreaseassets discussion in stock-based compensation was primarilythe “Matters Affecting Comparability” section above.
Deferred income taxes changed due to the lower expected vesting percentage of the ROIC shares awardedchanges in fiscal 2014. See Note 16, Stock-Based Compensation, of Notes to Consolidated Financial Statements of this Form 10-K for a more detailed description of our award types. The changetemporary differences year over year.
Changes in deferred income taxes was primarily due to an increase in favorable temporary differences. The pension and postretirement plan (benefit) expense decreasedwere primarily becausedue to settlement losses of the settlement loss of$6.6 million and $15.4 million in fiscal 2014. 2016 and 2014, respectively. There were no settlement losses recorded in fiscal 2015.
Other non-cash items include non-cash interest expense for the amortization of debt discounts and deferred financing costs and gains or losses on the sale of assets.
Net cash for working capital requirements and pension contributions included the following items (amounts in thousands):
The changes in accounts receivable and inventories are described above and are due to sales increases.
|
| Fiscal 2016 |
|
| Fiscal 2015 |
|
| Fiscal 2014 |
| |||
Changes in accounts receivable, net |
| $ | (7,888 | ) |
| $ | (16,873 | ) |
| $ | 7,181 |
|
Changes in inventories, net |
|
| (1,526 | ) |
|
| (9,717 | ) |
|
| 6,977 |
|
Changes in hedging activities, net |
|
| 13,592 |
|
|
| (12,818 | ) |
|
| 22 |
|
Changes in other assets |
|
| (11,107 | ) |
|
| (12,899 | ) |
|
| (11,337 | ) |
Changes in accounts payable |
|
| (519 | ) |
|
| 14,563 |
|
|
| (9,951 | ) |
Changes in other accrued liabilities |
|
| 12,389 |
|
|
| 4,504 |
|
|
| (17,995 | ) |
Qualified pension plan contributions |
|
| (1,000 | ) |
|
| (10,000 | ) |
|
| (12,999 | ) |
Net changes in working capital and pension contributions |
| $ | 3,941 |
|
| $ | (43,240 | ) |
| $ | (38,102 | ) |
Hedging activities change from market movements that affect the fair value and required collateral of positions and the timing and recognition of deferred gains or losses. These changes will occur as part of our hedging program. The other assets and accrued liabilities changes are from changes in income tax receivable balances, deferred tax liabilities, accrued interest and accrued employee costs (including accrued compensation for our formula driven, performance-based cash bonus program).
Refer to Note 10, 19, Other Current and Noncurrent AssetsPostretirement Plans, , Note 11, Other Accrued Liabilities, and Note 20, Income Taxes,of Notes to Consolidated Financial Statements of this Form 10-K list material items in each respective category for additional context to changes in working capital.
We contributed $10.0 million in cash to ourregarding qualified pension plans in fiscal 2015. These contributions were discretionary. Additionally, we contributed $0.4 million from other corporate assets to our non-qualified pension plan. In fiscal 2014, there were required pension contributions under the minimum funding requirements of ERISA and the Pension Protection Act of 2006 (“PPA”) to our qualified plans of $4.6 million and discretionary contributions of $8.4 million. In addition, there were $0.4 million in nonqualified pension benefits paid from corporate assets during fiscal 2014. During 2016, the company does not anticipate making any contributions to our qualified pension plans, but does expect to pay $0.4 million in nonqualified pension benefits from corporate assets. The expected contributions to qualified pension plans represent the estimated minimum pension contributions required under ERISA and the PPA as well as discretionary contributions to avoid benefit restrictions. The company believes its cash flow and balance sheet will allow it to fund future pension needs without adversely affecting the business strategy of the company.plan contributions.
During the first quarter of fiscal 2016,2017, we anticipate making payments of approximately $25.8$17.8 million, including our share of employment taxes, in performance-based cash awards under our bonus plan. During fiscal 2016 and 2015, the company paid $25.6 million and $16.4 million, respectively, including our share of employment taxes, in performance-based cash awards under the company’s bonus plan. An additional $0.4 million and $1.5 million for our share of employment taxes on the vesting of the performance-contingent restricted stock award was also paid during fiscal 2015. During fiscal 2014, the company paid $24.7 million, including our share of employment taxes, in performance-based cash awards under the company’s bonus plan.2016 and 2015, respectively.
Cash Flows Disbursed for Investing Activities. The table below presents net cash disbursed for investing activities for fiscal 2016, 2015 and fiscal 2014 (amounts in thousands):
|
| Fiscal 2015 |
|
| Fiscal 2014 |
|
| Change |
|
| Fiscal 2016 |
|
| Fiscal 2015 |
|
| Fiscal 2014 |
| ||||||
Purchase of property, plant, and equipment |
| $ | (90,773 | ) |
| $ | (83,778 | ) |
| $ | (6,995 | ) |
| $ | (101,727 | ) |
| $ | (90,773 | ) |
| $ | (83,778 | ) |
Repurchase of independent distributor territories |
|
| (21,866 | ) |
|
| (17,056 | ) |
|
| (4,810 | ) |
|
| (10,350 | ) |
|
| (13,768 | ) |
|
| (16,198 | ) |
Principal payments from notes receivable |
|
| 26,028 |
|
|
| 23,718 |
|
|
| 2,310 |
|
|
| 22,272 |
|
|
| 23,023 |
|
|
| 21,103 |
|
Acquisition of businesses, net of cash acquired |
|
| (390,221 | ) |
|
| — |
|
|
| (390,221 | ) |
|
| — |
|
|
| (390,221 | ) |
|
| — |
|
Contingently refundable consideration |
|
| — |
|
|
| 7,500 |
|
|
| (7,500 | ) |
|
| — |
|
|
| — |
|
|
| 7,500 |
|
Proceeds from sale of property, plant and equipment |
|
| 14,324 |
|
|
| 36,303 |
|
|
| (21,979 | ) |
|
| 17,667 |
|
|
| 14,324 |
|
|
| 36,303 |
|
Acquisition of intangible assets |
|
| (5,000 | ) |
|
| — |
|
|
| (5,000 | ) |
|
| — |
|
|
| (5,000 | ) |
|
| — |
|
Other |
|
| 2,091 |
|
|
| 839 |
|
|
| 544 |
| ||||||||||||
Net cash disbursed for investing activities |
| $ | (467,508 | ) |
| $ | (33,313 | ) |
| $ | (434,195 | ) |
| $ | (70,047 | ) |
| $ | (461,576 | ) |
| $ | (34,526 | ) |
Capital expenditures by segment were as follows:
Segment |
| Fiscal 2016 |
|
| Fiscal 2015 |
|
| Fiscal 2014 |
| |||
DSD Segment |
| $ | 61,669 |
|
| $ | 72,148 |
|
| $ | 73,454 |
|
Warehouse Segment |
|
| 16,792 |
|
|
| 9,596 |
|
|
| 6,468 |
|
The company currently estimates capital expenditures of approximately $95.0 million to $105.0 million on a consolidated basis during fiscal 2017.
Net cash disbursed for investing activities included cash paidCash payments for the DKB acquisition of $282.1 million in the third quarter of fiscal 2015 and for the Alpine acquisition of $109.3 million in the fourth quarter of fiscal 2015. The acquisitions2015 were funded from cash on hand and drawdowns from our existing credit facilities. Additionally, we acquired the Roman Meal trademark for $5.0 million in the first quarter of fiscal 2015. There were no acquisitions during fiscal 2014.
In fiscal 2014, the company received $7.5 million for the cancelation of a co-pack agreement associated with the Sara Lee California acquisition. See Note 8, Acquisitions, of Notes to Consolidated Financial Statements of this Form 10-K for more details on the acquisitions that occurred during the reporting periods. In fiscal 2015, we received proceeds of $9.1 million on
Proceeds from the sale of property, plant and equipment in fiscal 2016, 2015 and 2014 were primarily related to the sale of certain idle plants, depots and equipment acquired in the Acquired Hostess Bread Assets plants and depotsacquisition as compared to $24.2 million received in fiscal 2014.well as other closed plants. Additionally, in fiscal 2014, we received proceeds of $8.4 million from the sale of our Ft. Worth, Texas tortilla facility.
Capital expenditures for the DSD Segment and Warehouse Segment were $72.1 million and $9.6 million, respectively, in fiscal 2015. The company currently estimates capital expenditures of approximately $90.0 million to $100.0 million on a consolidated basis during fiscal 2016. The change in the distributor territories repurchased and the principal payments on notes receivable are due to the sale of territories in newer markets in the current year and the implementation of the independent distributor model at Lepage during fiscal 2014.
Cash Flows Provided by (Disbursed for) Financing Activities. The table below presents net cash provided by (disbursed for) financing activities for fiscal 2016, 2015 and fiscal 2014 (amounts in thousands):
|
| Fiscal 2015 |
|
| Fiscal 2014 |
|
| Change |
|
| Fiscal 2016 |
|
| Fiscal 2015 |
|
| Fiscal 2014 |
| ||||||
Dividends paid, including dividends on share-based payment awards |
| $ | (120,442 | ) |
| $ | (102,302 | ) |
| $ | (18,140 | ) |
| $ | (131,073 | ) |
| $ | (120,442 | ) |
| $ | (102,302 | ) |
Exercise of stock options, including windfall tax benefit |
|
| 28,751 |
|
|
| 28,893 |
|
|
| (142 | ) |
|
| 31,482 |
|
|
| 28,751 |
|
|
| 28,893 |
|
Payment of debt issuance costs |
|
| (646 | ) |
|
| (773 | ) |
|
| 127 |
| ||||||||||||
Stock repurchases |
|
| (6,858 | ) |
|
| (38,916 | ) |
|
| 32,058 |
| ||||||||||||
Payments for financing fees |
|
| (4,380 | ) |
|
| (646 | ) |
|
| (773 | ) | ||||||||||||
Stock repurchases, including accelerated stock repurchases |
|
| (126,300 | ) |
|
| (6,858 | ) |
|
| (38,916 | ) | ||||||||||||
Change in bank overdrafts |
|
| 2,325 |
|
|
| (679 | ) |
|
| 3,004 |
|
|
| 1,914 |
|
|
| 2,325 |
|
|
| (679 | ) |
Net debt and capital lease obligation changes |
|
| 247,000 |
|
|
| (167,887 | ) |
|
| 414,887 |
|
|
| (55,608 | ) |
|
| 247,000 |
|
|
| (167,887 | ) |
Net cash provided by (disbursed for) financing activities |
| $ | 150,130 |
|
| $ | (281,664 | ) |
| $ | 431,794 |
|
| $ | (283,965 | ) |
| $ | 150,130 |
|
| $ | (281,664 | ) |
Our annual dividend payout rate increased 10.1% from fiscal 2015 to fiscal 2016 and 17.0% from fiscal 2014 to fiscal 2015. While there are no requirements to increase the dividend payout we have shown a recent historical trend to do so. Should this continue in the future we will have additional cash needs to meet these expected dividend payouts.
As of January 2,December 31, 2016, there were nonqualified stock option grants of 4.41.8 million shares that were exercisable. These have a remaining contractual life of approximately 1.420.90 years and a weighted average exercise price of $10.97$10.89 per share. At this time, it is expected that these shares will be exercised before the contractual term expires and such exercises may provide an increase to the cash provided by financing activities.
Stock repurchase decisions are made based on our stock price, our belief of relative value, and our cash projections at any given time. The change in bank overdraft was a functionIn fiscal 2016, we repurchased 6.9 million shares of our cash receipts since the endcommon stock, of our fiscal 2014. Our cash objective is to minimize cash on hand by using the credit facility described below. The net debt obligations increased primarily from the drawdowns used to fund the acquisitions in fiscal 2015, net of repayments we made during the year.
The credit facility, securitization facility and new term loan are variable rate debt, as described below. In periods of rising interest rates the cost of using the credit facility will become more expensive and increase our interest expense. The stated interest rate of the senior notes will not change. Therefore, borrowingswhich 6.5 million were repurchased under the credit facility provide us the greatest direct exposure to rising rates. In addition, if interest rates do increase it will make the cost of funds more expensive. Considering our current debt obligations, an environment of rising rates could materially affect our Consolidated Statements of Income.
Liquidity discussion Fiscal 2014 (53 Weeks) compared to Fiscal 2013 (52 Weeks)
Flowers Foods’ cash and cash equivalents were $7.5 million at January 3, 2015 as compared to $8.5 million at December 28, 2013. The cash and cash equivalents were derived from the activities presented in the table below (amounts in thousands):
Cash flow component |
| Fiscal 2014 |
|
| Fiscal 2013 |
|
| Change |
| |||
Cash flows provided by operating activities |
| $ | 313,970 |
|
| $ | 270,484 |
|
| $ | 43,486 |
|
Cash disbursed for investing activities |
|
| (33,313 | ) |
|
| (502,885 | ) |
|
| 469,572 |
|
Cash (disbursed for) provided by financing activities |
|
| (281,664 | ) |
|
| 227,656 |
|
|
| (509,320 | ) |
Total change in cash |
| $ | (1,007 | ) |
| $ | (4,745 | ) |
| $ | 3,738 |
|
Cash Flows Provided by Operating Activities. Net cash provided by operating activities included the following items for non-cash adjustments to net income (amounts in thousands):
|
| Fiscal 2014 |
|
| Fiscal 2013 |
|
| Change |
| |||
Depreciation and amortization |
| $ | 128,961 |
|
| $ | 118,491 |
|
| $ | 10,470 |
|
Stock-based compensation |
|
| 18,662 |
|
|
| 15,943 |
|
|
| 2,719 |
|
Impairment of assets |
|
| 10,308 |
|
|
| — |
|
|
| 10,308 |
|
Gain on acquisition |
|
| — |
|
|
| (50,071 | ) |
|
| 50,071 |
|
Loss (gain) reclassified from accumulated other comprehensive income to net income |
|
| 5,218 |
|
|
| 27,055 |
|
|
| (21,837 | ) |
Deferred income taxes |
|
| 9,241 |
|
|
| 6,485 |
|
|
| 2,756 |
|
Provision for inventory obsolescence |
|
| 1,074 |
|
|
| 1,210 |
|
|
| (136 | ) |
Allowances for accounts receivable |
|
| 4,956 |
|
|
| 4,110 |
|
|
| 846 |
|
Pension and postretirement plans expense (includes settlement loss in fiscal 2014) |
|
| 5,341 |
|
|
| (2,041 | ) |
|
| 7,382 |
|
Other non-cash |
|
| (6,215 | ) |
|
| (5,701 | ) |
|
| (514 | ) |
Net non-cash adjustment to net income |
| $ | 177,546 |
|
| $ | 115,481 |
|
| $ | 62,065 |
|
Net cash used for working capital requirements and pension contributions included the following items (amounts in thousands):
|
| Fiscal 2014 |
|
| Fiscal 2013 |
|
| Change |
| |||
Changes in accounts receivable, net |
| $ | 7,181 |
|
| $ | 1,114 |
|
| $ | 6,067 |
|
Changes in inventories, net |
|
| 6,977 |
|
|
| (10,708 | ) |
|
| 17,685 |
|
Changes in hedging activities, net |
|
| 22 |
|
|
| (39,325 | ) |
|
| 39,347 |
|
Changes in other assets |
|
| (23,993 | ) |
|
| (22,151 | ) |
|
| (1,842 | ) |
Changes in accounts payable |
|
| (9,951 | ) |
|
| (702 | ) |
|
| (9,249 | ) |
Changes in other accrued liabilities |
|
| (6,552 | ) |
|
| 10,699 |
|
|
| (17,251 | ) |
Qualified pension plan contributions |
|
| (12,999 | ) |
|
| (14,818 | ) |
|
| 1,819 |
|
Net changes in working capital and pension contributions |
| $ | (39,315 | ) |
| $ | (75,891 | ) |
| $ | 36,576 |
|
The change in depreciation and amortization was primarily due to the acquisition of the Acquired Hostess Bread Assets, the Henderson, Nevada plant placed into operation, the Modesto, California bread line placed into service, and certain capital leases entered into during the year. Depreciation and amortization increased $10.0 million primarily as a result of these activities. The change in stock-based compensation was primarily because the awards granted in fiscal 2014 and fiscal 2013 were full awards compared to a partial award granted in fiscal 2012. This caused an increase in the expense in fiscal 2014.ASR program. See Note 16, 15, Stock-Based CompensationStockholders’ Equity, of Notes to Consolidated Financial Statements of this Form 10-K for additional information.
Net debt obligations increased in fiscal 2015 primarily due to funding the DKB and Alpine acquisitions, net of repayments we made during the year.
Capital Structure
Long-term debt and capital lease obligations were as follows at December 31, 2016 and January 2, 2016. For a more detailed description of our award types. The pensiondebt and postretirement plan expense increased because of the settlement loss of $15.4 million.capital lease obligations and information regarding our credit ratings, distributor arrangements, deferred compensation, and guarantees and indemnification obligations, see Note 12, Debt, Lease and Other non-cash items include non-cash interest expense for the amortization of debt discounts and deferred financing costs and gains or losses on the sale of assets.
The changes in accounts receivable and inventories are described above and are due to sales increases. Hedging activities change from market movements that affect the fair value and required collateral of positions and the timing and recognition of deferred gains or losses. These changes will occur as part of our hedging program. The other assets and accrued liabilities changes are from changes in income tax receivable balances, deferred tax liabilities, accrued interest and accrued employee costs (including accrued compensation for our formula driven, performance-based cash bonus program). Note 10, Other Current and Noncurrent Assets, Note 11, Other Accrued Liabilities, and Note 20, Income TaxesCommitments, of Notes to Consolidated Financial Statements of this Form 10-K list material items10-K:
|
| Interest Rate at |
|
| Final |
| Balance at |
|
| Fixed or | ||||||
|
| December 31, 2016 |
|
| Maturity |
| December 31, 2016 |
|
| January 2, 2016 |
|
| Variable Rate | |||
|
|
|
|
|
|
|
| (Amounts in thousands) |
|
|
| |||||
2026 senior notes |
|
| 3.50% |
|
| 2026 |
| $ | 394,406 |
|
| $ | — |
|
| Fixed Rate |
2022 senior notes |
|
| 4.38% |
|
| 2022 |
|
| 397,458 |
|
|
| 396,975 |
|
| Fixed Rate |
Unsecured credit facility |
|
| 4.08% |
|
| 2020 |
|
| 24,000 |
|
|
| 160,000 |
|
| Variable Rate |
Accounts receivable securitization |
|
| 1.59% |
|
| 2018 |
|
| 95,000 |
|
|
| 170,000 |
|
| Variable Rate |
Unsecured 2016 term loan |
|
| — |
|
| NA |
|
| — |
|
|
| — |
|
| Variable Rate |
Unsecured 2013 term loan |
|
| — |
|
| NA |
|
| — |
|
|
| 238,515 |
|
| Variable Rate |
Capital lease obligations |
|
| 3.70% |
|
| 2024 |
|
| 30,427 |
|
|
| 20,228 |
|
|
|
Other notes payable |
|
| 2.10% |
|
| 2020 |
|
| 16,866 |
|
|
| 18,989 |
|
|
|
|
|
|
|
|
|
|
|
| 958,157 |
|
|
| 1,004,707 |
|
|
|
Current maturities of long-term debt and capital lease obligations |
|
|
|
|
|
|
|
| 11,490 |
|
|
| 74,685 |
|
|
|
Long-term debt and capital lease obligations |
|
|
|
|
|
|
| $ | 946,667 |
|
| $ | 930,022 |
|
|
|
NA – not applicable. The term loans were paid off prior to their maturity date in each respective category for additional context to changes in working capital.
In fiscal 2014, there were required pension contributions under the minimum funding requirements of ERISA and the Pension Protection Act of 2006 (“PPA”) to our qualified plans of $4.6 million and discretionary contributions of $8.4 million. In addition, there were $0.4 million in nonqualified pension benefits paid from corporate assets during fiscal 2014. The expected contributions to qualified pension plans represent the estimated minimum pension contributions required under ERISA and the PPA as well as discretionary contributions to avoid benefit restrictions.
During fiscal 2014, the company paid $24.7 million, including our share of employment taxes, in performance-based cash awards under the company’s bonus plan. During fiscal 2013, the company paid $23.7 million, including our share of employment taxes and deferred compensation contributions, relating to its formula-driven, performance-based cash bonus program.2016.
Cash Flows DisbursedThe facility and credit facility are generally used for Investing Activities.short term liquidity needs. The table below presents net cash disbursed for investing activities for fiscal 2014company has historically entered into amendments and fiscal 2013 (amounts in thousands):
|
| Fiscal 2014 |
|
| Fiscal 2013 |
|
| Change |
| |||
Purchase of property, plant, and equipment |
| $ | (83,778 | ) |
| $ | (99,181 | ) |
| $ | 15,403 |
|
Repurchase of independent distributor territories |
|
| (17,056 | ) |
|
| (26,418 | ) |
|
| 9,362 |
|
Principal payments from notes receivable |
|
| 23,718 |
|
|
| 21,596 |
|
|
| 2,122 |
|
Acquisition of businesses, net of cash acquired |
|
| — |
|
|
| (415,813 | ) |
|
| 415,813 |
|
Contingently refundable consideration |
|
| 7,500 |
|
|
| — |
|
|
| 7,500 |
|
Proceeds from sale of new distribution territories |
|
| — |
|
|
| 13,965 |
|
|
| (13,965 | ) |
Proceeds from sale of property, plant and equipment |
|
| 36,303 |
|
|
| 2,966 |
|
|
| 33,337 |
|
Net cash disbursed for investing activities |
| $ | (33,313 | ) |
| $ | (502,885 | ) |
| $ | 469,572 |
|
Net cash disbursed for investing activities included the Sara Lee California asset acquisition of $49.5 million in the first quarter of fiscal 2013. There was an additional $0.2 million paid for the final working capital adjustment for the Lepage acquisition during the second quarter of fiscal 2013. The Acquired Hostess Bread Assets acquisition requiredextensions approximately $337.0 million in cash when the acquisition closed on July 19, 2013. We previously paid $18.0 million as a deposit during the first quarter of fiscal 2013 that was appliedone year prior to the purchase pricematurity of the Acquired Hostess Bread Assets acquisition at closing. An additional $0.3 million was paid for the Acquired Hostess Bread Assets shortly after closing. The acquisition was funded from cash on hand and drawings under the new term loan and the securitization facility. There were no acquisitions during fiscal 2014. In fiscal 2014 the company did receive $7.5 million for the cancelation of a co-pack agreement associated with the Sara Lee California acquisition. See Note 8, Acquisitions, of Notes to Consolidated Financial Statements of this Form 10-K for more details on the acquisitions that occurred during the reporting periods.
Capital expenditures for the DSD Segment and Warehouse Segment were $73.5 million and $6.5 million, respectively. The change in the distributor territories repurchased and the principal payments on notes receivable are due to the Sara Lee California acquisition distributor territory during fiscal 2013 and for the implementation of the independent distributor model at Lepage. The $14.0 million in proceeds from the sale of new distribution territories was specifically for certain territories in California that were acquired outright from the company during fiscal 2013 and which were not financed at the time of acquisition. There were none of these in that market during fiscal 2014.
Cash Flows (Disbursed for) Provided by Financing Activities. The table below presents net cash provided by (disbursed for) financing activities for fiscal 2014 and fiscal 2013 (amounts in thousands):
|
| Fiscal 2014 |
|
| Fiscal 2013 |
|
| Change |
| |||
Dividends paid, including dividends on share-based payment awards |
| $ | (102,302 | ) |
| $ | (92,840 | ) |
| $ | (9,462 | ) |
Exercise of stock options, including windfall tax benefit |
|
| 28,893 |
|
|
| 21,466 |
|
|
| 7,427 |
|
Payment of debt issuance costs |
|
| (773 | ) |
|
| (2,456 | ) |
|
| 1,683 |
|
Stock repurchases |
|
| (38,916 | ) |
|
| (8,819 | ) |
|
| (30,097 | ) |
Change in bank overdrafts |
|
| (679 | ) |
|
| (499 | ) |
|
| (180 | ) |
Net debt and capital lease obligation changes |
|
| (167,887 | ) |
|
| 310,856 |
|
|
| (478,743 | ) |
Other |
|
| — |
|
|
| (52 | ) |
|
| 52 |
|
Net cash (disbursed for) provided by financing activities |
| $ | (281,664 | ) |
| $ | 227,656 |
|
| $ | (509,320 | ) |
Our annual dividend payout rate increased 9.2% from fiscal 2013 to fiscal 2014. Stock option exercises and the associated tax windfall benefit increased as a result of more exercises occurring during fiscal 2014 when compared to fiscal 2013. As of January 3, 2015, there were nonqualified stock option grants of 6.2 million shares that were exercisable. These have a remaining contractual life of approximately 2.27 years and a weighted average exercise price of $10.88 per share.
Stock repurchase decisions are made based on our stock price, our belief of relative value, and our cash projections at any given time. Payments for debt issuance costs changed because we incurred fees for the securitization facility and the new term loan, described in liquidity below, that were secured in fiscal 2013. The change in bank overdraft was a function of our cash receipts since the end of our fiscal 2013. The net debt obligations decreased primarily from the payments used to decrease our debt obligations.
The credit facility, the securitization facility and the new term loan are variable rate debt, as described below. In periods of rising interest rates the cost of using the credit facility will become more expensive and increase our interest expense. The stated interest rate of the senior notes will not change.
Accounts Receivable Securitization Facility, New Term Loan, Senior Notes, Credit Facility, and Term Loan
Accounts Receivable Securitization Facility. On July 17, 2013, the company entered into an accounts receivable securitization facility (the “facility”). On August 7, 2014, the company entered into an amendment to the facility. The amendment (i) increased the revolving commitments under the facility to $200.0 million from $150.0 million, (ii) extended the term one year to July 17, 2016, and (iii) made certain other conforming changes. On December 17, 2014, the company executed a second amendment to the facility to add a bank to the lending group. The original commitment amount was split between the original lender and the new lender in the proportion of 62.5% for the original lender and 37.5% for the new lender. This modification, which was accounted for as an extinguishment of the debt, resulted in a charge of $0.1 million, or 37.5%, of the unamortized financing costs. On August 20, 2015, the company executed a third amendment to the facility to extend the term to August 11, 2017 and to add a leverage pricing grid. This amendment was accounted for as a modification. Under the facility, a wholly-owned, bankruptcy-remote subsidiary purchases, on an ongoing basis, substantially all trade receivables. As borrowings are made under the facility, the subsidiary pledges the receivables as collateral. In the event of liquidation of the subsidiary, its creditors would be entitled to satisfy their claims from the subsidiary’s pledged receivables prior to distributions of collections to the company. We include the subsidiary in our Condensed Consolidated Financial Statements. The facility contains certain customary representations and warranties, affirmative and negative covenants, and events of default. As of January 2, 2016, there was $170.0 million outstanding under the facility compared to no amounts outstanding as of January 3, 2015. As of January 2, 2016 and January 3, 2015, the company was in compliance with all restrictive covenants under the facility. On January 2, 2016, the company had $2.1 million available under its facility for working capital and general corporate purposes. Amounts available for withdrawal under the facility are determined as the lesser of the total commitments and a formula derived amount based on qualifying trade receivables.
Optional principal repayments may be made at any time without premium or penalty. Interest is due two days after our reporting periods end in arrears on the outstanding borrowings and is computed as the cost of funds rate plus an applicable margin of 70 basis points. An unused fee of 25 basis points is applicable on the unused commitment at each reporting period. The company paid financing costs of $0.8 million in connection with the facility at the time we entered into the facility, which are being amortized over the life of the facility. During fiscal 2014, we incurred $0.2 million in financing costs with the first and second amendments. An additional $0.2 million in financing costs was paid during fiscal 2015 for the second and third amendments.
New Term Loan. We entered into a senior unsecured delayed-draw term facility (the “new term loan”) on April 5, 2013 with a commitment of up to $300.0 million. The company drew down the full amount of the new term loan on July 18, 2013 (the “borrowing date”).
The new term loan amortizes in quarterly installments based on an increasing annual percentage. The first payment was due and payable on the last business day of the first calendar quarter ending after the borrowing date, quarterly payments are due on the last business day of each successive calendar quarter and all remaining outstanding principal is due and payable on the fifth anniversary of the borrowing date. The table below presents the principal payment amounts remaining under the new term loan as of January 2, 2016 (amounts in thousands):
Fiscal Year |
| Payments |
| |
2016 |
| $ | 67,500 |
|
2017 |
| $ | 112,500 |
|
2018 |
| $ | 60,000 |
|
On February 14, 2014, we entered into an amendment to the new term loan which was accounted for as a modification of the debt and favorably reduced the interest rates described below from those entered into originally on April 5, 2013. Voluntary prepayments on the new term loan may be made without premium or penalty. Interest is due quarterly in arrears on any outstanding borrowings at a customary Eurodollar rate or the base rate plus applicable margin. The applicable margin ranges from 0.00% to 1.25% for base rate loans and from 1.00% to 2.25% for Eurodollar loans, and is based on the company’s leverage ratio. Interest on base rate loans is payable quarterly in arrears on the last business day of each calendar quarter. Interest on Eurodollar loans is payable in arrears at the end of the interest period and every three months in the case of interest periods in excess of three months. The company paid financing costs of $1.7 million in connection with the new term loan, which are being amortized over the life of the new term loan. A commitment fee of 20 basis points on the daily undrawn portion of the lenders’ commitments commenced on May 1, 2013 and continued until the borrowing date, when the company borrowed the available $300.0 million for the acquisition of certain Hostess Brands, Inc. bread assets. The new term loan is subject to customary restrictive covenants, including certain limitations on liens and significant acquisitions and financial covenants regarding minimum interest coverage ratio and maximum leverage ratio. The February 14, 2014 amendment cost $0.3 million and is being amortized over the remaining term. As of January 2, 2016 and January 3, 2015, the company was in compliance with all restrictive covenants under the new term loan.
Senior Notes. On April 3, 2012, the company issued $400.0 million of senior notes. The company pays semiannual interest on the notes on each April 1 and October 1, beginning on October 1, 2012, and the notes will mature on April 1, 2022. The notes bear
interest at 4.375% per annum. On any date prior to January 1, 2022, the company may redeem some or all of the notes at a price equal to the greater of (1) 100% of the principal amount of the notes redeemed and (2) a “make-whole” amount plus, in each case, accrued and unpaid interest. The make-whole amount is equal to the sum of the present values of the remaining scheduled payments of principal thereof (not including any interest accrued thereon to, but not including, the date of redemption), discounted to the date of redemption on a semi-annual basis (assuming a 360-day year consisting of twelve 30-day months) at the treasury rate (as defined in the indenture governing the notes), plus 35 basis points, plus in each case, unpaid interest accrued thereon to, but not including, the date of redemption. At any time on or after January 1, 2022, the company may redeem some or all of the notes at a price equal to 100% of the principal amount of the notes redeemed plus accrued and unpaid interest. If the company experiences a “change of control triggering event” (which involves a change of control of the company and related rating of the notes below investment grade), it is required to offer to purchase the notes at a purchase price equal to 101% of the principal amount, plus accrued and unpaid interest thereon unless the company exercised its option to redeem the notes in whole. The notes are also subject to customary restrictive covenants, including certain limitations on liens and sale and leaseback transactions.
The face value of the notes is $400.0 million and the current discount on the notes is $0.6 million. The company paid issuance costs (including underwriting fees and legal fees) for issuing the notes of $3.9 million. The issuance costs and the debt discount are being amortized to interest expense over the term of the notes. As of January 2, 2016 and January 3, 2015, the company was in compliance with all restrictive covenants under the indenture governing the notes.
Credit Facility. On April 21, 2015, the company amended its senior unsecured credit facility (the “credit facility”) to extend the term to April 21, 2020, reduce the applicable margin on base rate and Eurodollar loans and reduce the facility fees, described below. The amendment was accounted for as a modification of the debt. The credit facility is a five-year, $500.0 million senior unsecured revolving loan facility. The credit facility contains a provision that permits Flowers to request up to $200.0 million in additional revolving commitments, for a total of up to $700.0 million, subject to the satisfaction of certain conditions. Proceeds from the credit facility may be used for working capital and general corporate purposes, including capital expenditures, acquisition financing, refinancing of indebtedness, dividends and share repurchases. The credit facility includes certain customary restrictions, which, among other things, require maintenance of financial covenants and limit encumbrance of assets and creation of indebtedness. Restrictive financial covenants include such ratios as a minimum interest coverage ratio and a maximum leverage ratio. The company believes that, given its current cash position, its cash flow from operating activities and its available credit capacity, it can comply with the current terms of the amended credit facility and can meet presently foreseeable financial requirements. As of January 2, 2016 and January 3, 2015, the company was in compliance with all restrictive covenants under the credit facility.
Interest is due quarterly in arrears on any outstanding borrowings at a customary Eurodollar rate or the base rate plus applicable margin. The underlying rate is defined as rates offered in the interbank Eurodollar market, or the higher of the prime lending rate or the federal funds rate plus 0.50%, with a floor rate defined by the one-month interbank Eurodollar market rate plus 1.00%. The applicable margin ranges from 0.0% to 0.50% for base rate loans and from 0.70% to 1.50% for Eurodollar loans. In addition, a facility fee ranging from 0.05% to 0.25% is due quarterly on all commitments under the credit facility. Both the interest margin and the facility fee are based on the company’s leverage ratio. The company paid additional financing costs of $0.4 million in connection with the April 21, 2015 amendment of the credit facility, which, in addition to the remaining balance of the original $1.3 million in financing costs, is being amortized over the life of the credit facility. The company recognized $0.1 million in financing costs forfollowing table details the modification atamounts available under the time offacility and credit facility and the April 21, 2015 amendment.
At January 2, 2016, there was $160.0 millionhighest and lowest balances outstanding under the credit facility. There were $53.0 million in outstanding borrowings under the credit facility at January 3, 2015. The highest outstanding daily balancethese arrangements during fiscal 2015 was $160.0 million and the lowest outstanding balance was zero. 2016:
|
| Amount Available |
|
| Highest |
| Lowest |
| |||
|
| for Withdrawal at |
|
| Balance in |
| Balance in |
| |||
Facility |
| December 31, 2016 |
|
| Fiscal 2016 |
| Fiscal 2016 |
| |||
|
| (Amounts in thousands) |
| ||||||||
Facility |
| $ | 85,200 |
|
| $ | 190,000 |
| $ | 90,000 |
|
Credit facility (1) |
|
| 466,920 |
|
| $ | 244,200 |
|
| — |
|
|
| $ | 552,120 |
|
|
|
|
|
|
|
|
(1) | Amount excludes a provision in the agreement which allows the company to request an additional $200.0 million in additional revolving commitments. |
Amounts outstanding under the credit facility vary daily. Changes in the gross borrowings and repayments can be caused by cash flow activity from operations, capital expenditures, acquisitions, dividends, share repurchases, and tax payments, as well as derivative transactions which are part of the company’s overall risk management strategy as discussed in Note 9, Derivative Financial Instruments.Instruments, of Notes to Consolidated Financial Statements of this Form 10-K. During fiscal 2015,2016, the company borrowed $820.0$1,392.0 million in revolving borrowings under the credit facility and repaid $713.0$1,528.0 million in revolving borrowings. The amount available under the credit facility is reduced by $16.9$9.1 million for letters of credit. On
The facility and the credit facility are variable rate debt. In periods of rising interest rates, the cost of using the facility and the credit facility will become more expensive and increase our interest expense. Therefore, borrowings under these facilities provide us the greatest direct exposure to rising rates. In addition, if interest rates do increase it will make the cost of funds more expensive. Considering our current debt obligations, an environment of rising rates could materially affect our Consolidated Statements of Income.
Restrictive financial covenants for our borrowings include such ratios as a minimum interest coverage ratio and a maximum leverage ratio. Our debt may also contain certain customary representations and warranties, affirmative and negative covenants, and events of default. The company believes that, given its current cash position, its cash flow from operating activities and its available credit capacity, it can comply with the current terms of the debt agreements and can meet its presently foreseeable financial requirements. As of December 31, 2016 and January 2, 2016, the company had $323.1 million availablewas in compliance with all restrictive covenants under its credit facility for working capital and general corporate purposes.
Credit Ratings. Currently, the company’s credit ratings by Fitch Ratings, Moody’s Investors Service, and Standard & Poor’s are BBB, Baa2, and BBB, respectively. Standard & Poor’s upgraded the company from a BBB- credit rating on September 16, 2015. Changes in the company’s credit ratings do not trigger a change in the company’s available borrowings or costs under the facility, new term loan, senior notes, and credit facility, but could affect future credit availability and cost.
Assets recorded under capital lease agreements included in property, plant and equipment consist of machinery and equipment and transportation equipment.
Aggregate maturities ofour debt outstanding, including capital leases and the associated interest, as of January 2, 2016, are as follows (excluding unamortized debt discount and issuance costs) (amounts in thousands):
2016 |
| $ | 74,685 |
|
2017 |
|
| 292,194 |
|
2018 |
|
| 69,960 |
|
2019 |
|
| 8,443 |
|
2020 |
|
| 163,118 |
|
2021 and thereafter |
|
| 401,828 |
|
Total |
| $ | 1,010,228 |
|
Stock Repurchase Plan. Our Board of Directors approved a plan that authorized share repurchases of up to 67.5 million shares of the company’s common stock. In November 2014, the Board increased the company’s share repurchase authorization by 7.1 million shares to a total of 74.6 million shares. At the close of the company’s fourth quarter on January 2, 2016, 13.7 million shares remained under the existing authorization. Under the plan, the company may repurchase its common stock in open market or privately negotiated transactions or under an accelerated repurchase program at such times and at such prices as determined to be in the company’s best interest. These purchases may be commenced or suspended without prior notice depending on then-existing business or market conditions and other factors. As of January 2, 2016, 60.9 million shares at a cost of $504.1 million have been purchased under this plan. Included in these amounts are 0.3 million shares at a cost of $6.9 million purchased during fiscal 2015.
Income Taxes. Federal and state tax payments totaled $87.6 million, $82.8 million, and $83.8 million during fiscal years 2015, 2014, and 2013, respectively, and were funded with cash flows from operations.
Distributor Arrangements. The company offers long-term financing to independent distributors for the purchase of their distribution rights, and a vast majority of the independent distributors elect to use this financing alternative and a liability is established. These notes generally have terms of up to ten years and the independent distributor pays principal and interest weekly. A majority of the independent distributors have the right to require the company to repurchase the distribution rights and trucks, if applicable, at the original price paid by the independent distributor on the long-term financing arrangement in the six-month period following the sale of a distribution right to the independent distributor. If the truck is leased, the company will assume the lease payment (but not the lease) if the distribution rights are repurchased during the first six-month period. After the six-month period expires, the company retains a right of first refusal to repurchase these distribution rights. Additionally, in the event the company exits a geographic market or ceases to utilize the independent distribution form of doing business, the company is contractually required to purchase the distribution rights from the independent distributor. If the company acquires a distribution right from an independent distributor that is to be resold, the company operates the territory until it can be resold. If the distribution rights are not to be resold, the value of the distribution rights is charged to earnings. The company held an aggregate of $174.9 million and $182.2 million as of January 2, 2016 and January 3, 2015, respectively, of distribution rights notes receivable. The company does not view this aggregate amount as a concentrated credit risk, as each note relates to an individual independent distributor. The company has approximately $28.3 million and $20.5 million as of January 2, 2016 and January 3, 2015, respectively, of distribution rights held for sale.
In the ordinary course of business, when an independent distributor terminates the relationship with the company, the company, although not legally obligated, generally purchases and operates that territory utilizing the leased truck of the former independent distributor. To accomplish this, the company operates the leased truck for the independent distributor, who generally remains solely liable under the original truck lease to the third party lessor, and continues the payments on behalf of the former independent distributor. Once the territory is resold to an independent distributor, the truck lease is assumed by the new independent distributor. At January 2, 2016 and January 3, 2016, the company operated approximately 600 and 420 trucks as held for sale distributorships, respectively. Assuming the company does not resell these territories to a new independent distributor, at January 2, 2016 and January 3, 2015, the maximum contractual obligation associated with these truck leases was approximately $6.2 million and $8.1 million, respectively. There is no liability recorded in the Consolidated Balance Sheet with respect to such leases, as the obligation for each lease is retained by the former independent distributor until the distribution rights to the territory are sold to a new independent distributor. The company does not anticipate operating these territories over the life of the lease as it intends to resell these territories to a new independent distributor.agreements.
Special Purpose Entities.At December 31, 2016 and January 2, 2016, and January 3, 2015, the company did not have any relationships with unconsolidated entities or financial partnerships, such as entities often referred to as structured finance or special purpose entities, which are established to facilitate off-balance sheet arrangements or other contractually narrow or limited purposes.
Aggregate Maturities of Debt.
Assets recorded under capital lease agreements included in property, plant and equipment consist of machinery and equipment and transportation equipment.
Aggregate maturities of debt outstanding, including capital leases, as of December 31, 2016, are as follows (excluding unamortized debt discount and issuance costs) (amounts in thousands):
2017 |
| $ | 11,490 |
|
2018 |
|
| 106,794 |
|
2019 |
|
| 10,314 |
|
2020 |
|
| 29,028 |
|
2021 |
|
| 3,276 |
|
2022 and thereafter |
|
| 806,025 |
|
Total |
| $ | 966,927 |
|
Deferred Compensation. The Executive Deferred Compensation Plan (“EDCP”) consists of unsecured general obligations of the company to pay the deferred compensation of, and our contributions to, participants in the EDCP. The obligations will rank equally with our other unsecured and unsubordinated indebtedness payable from the company’s general assets.
The company’s directors and certain key members of management are eligible to participate in the EDCP. Directors may elect to defer all or any portion of their annual retainer fee and meeting fees. Deferral elections by directors must be made prior to the beginning of each year and are thereafter irrevocable. Eligible employees may elect to defer up to 75% of their base salaries, and up to 100% of any cash bonuses and other compensation through December 31, 2015. Effective January 1, 2016, employees may elect to defer up to 75% of their base salaries, any cash bonuses and other compensation. Deferral elections by eligible executives must be made prior to the beginning of each year and are thereafter irrevocable during that year. The portion of the participant’s compensation that is deferred depends on the participant’s election in effect with respect to his or her elective contributions under the EDCP. The amount outstanding at January 2, 2016 and January 3, 2015 was $14.8 million and $14.5 million, respectively.
Contractual Obligations and Commitments. The following table summarizes the company’s contractual obligations and commitments at January 2,December 31, 2016 and the effect such obligations are expected to have on its liquidity and cash flow in the indicated future periods:
|
| Payments Due by Fiscal Year |
|
| Payments Due by Fiscal Year |
| ||||||||||||||||||||||||||||||||||
|
| (Amounts in thousands) |
|
| (Amounts in thousands) |
| ||||||||||||||||||||||||||||||||||
|
| Total |
|
| 2016 |
|
| 2017-2018 |
|
| 2019-2020 |
|
| 2021 and Beyond |
|
| Total |
|
| 2017 |
|
| 2018-2019 |
|
| 2020-2021 |
|
| 2022 and Beyond |
| ||||||||||
Contractual Obligations: |
|
|
|
|
|
|
|
|
|
|
|
|
|
|
|
|
|
|
|
|
|
|
|
|
|
|
|
|
|
|
|
|
|
|
|
|
|
|
|
|
Long-term debt |
| $ | 990,000 |
|
| $ | 70,000 |
|
| $ | 352,500 |
|
| $ | 167,500 |
|
| $ | 400,000 |
|
| $ | 936,500 |
|
| $ | 5,000 |
|
| $ | 105,000 |
|
| $ | 26,500 |
|
| $ | 800,000 |
|
Interest payments(1) |
|
| 136,576 |
|
|
| 23,415 |
|
|
| 38,786 |
|
|
| 35,000 |
|
|
| 39,375 |
|
|
| 231,516 |
|
|
| 33,011 |
|
|
| 63,755 |
|
|
| 63,000 |
|
|
| 71,750 |
|
Capital leases |
|
| 20,228 |
|
|
| 4,685 |
|
|
| 9,654 |
|
|
| 4,061 |
|
|
| 1,828 |
|
|
| 30,427 |
|
|
| 6,490 |
|
|
| 12,108 |
|
|
| 5,804 |
|
|
| 6,025 |
|
Interest on capital leases |
|
| 1,568 |
|
|
| 537 |
|
|
| 660 |
|
|
| 240 |
|
|
| 131 |
|
|
| 2,486 |
|
|
| 713 |
|
|
| 932 |
|
|
| 520 |
|
|
| 321 |
|
Non-cancelable operating lease obligations(2) |
|
| 530,846 |
|
|
| 60,550 |
|
|
| 104,335 |
|
|
| 77,966 |
|
|
| 287,995 |
|
|
| 405,962 |
|
|
| 57,341 |
|
|
| 98,931 |
|
|
| 69,183 |
|
|
| 180,507 |
|
Pension and postretirement contributions and payments(3) |
|
| 8,816 |
|
|
| 730 |
|
|
| 1,871 |
|
|
| 1,849 |
|
|
| 4,366 |
|
|
| 6,801 |
|
|
| 692 |
|
|
| 1,480 |
|
|
| 1,338 |
|
|
| 3,291 |
|
Deferred compensation plan obligations(4) |
|
| 14,812 |
|
|
| 2,204 |
|
|
| 4,472 |
|
|
| 1,413 |
|
|
| 6,723 |
|
|
| 14,883 |
|
|
| 1,675 |
|
|
| 1,597 |
|
|
| 708 |
|
|
| 10,903 |
|
Purchase obligations(5) |
|
| 369,617 |
|
|
| 369,617 |
|
|
| — |
|
|
| — |
|
|
| — |
|
|
| 320,412 |
|
|
| 320,412 |
|
|
| — |
|
|
| — |
|
|
| — |
|
Total contractual cash obligations |
| $ | 2,072,463 |
|
| $ | 531,738 |
|
| $ | 512,278 |
|
| $ | 288,029 |
|
| $ | 740,418 |
|
| $ | 1,948,987 |
|
| $ | 425,334 |
|
| $ | 283,803 |
|
| $ | 167,053 |
|
| $ | 1,072,797 |
|
|
| Amounts Expiring by Fiscal Year |
|
| Amounts Expiring by Fiscal Year |
| ||||||||||||||||||||||||||||||||||
|
| (Amounts in thousands) |
|
| (Amounts in thousands) |
| ||||||||||||||||||||||||||||||||||
|
| Total |
|
| Less than 1 Year |
|
| 1-3 Years |
|
| 4-5 Years |
|
| More than 5 Years |
|
| Total |
|
| Less than 1 Year |
|
| 1-3 Years |
|
| 4-5 Years |
|
| More than 5 Years |
| ||||||||||
Commitments: |
|
|
|
|
|
|
|
|
|
|
|
|
|
|
|
|
|
|
|
|
|
|
|
|
|
|
|
|
|
|
|
|
|
|
|
|
|
|
|
|
Standby letters of credit(6) |
| $ | 16,880 |
|
| $ | 16,880 |
|
| $ | — |
|
| $ | — |
|
| $ | — |
|
| $ | 16,260 |
|
| $ | 16,260 |
|
| $ | — |
|
| $ | — |
|
| $ | — |
|
Truck lease guarantees |
|
| 6,230 |
|
|
| 87 |
|
|
| 244 |
|
|
| 4,599 |
|
|
| 1,300 |
|
|
| 4,806 |
|
|
| 111 |
|
|
| 3,361 |
|
|
| 1,264 |
|
|
| 70 |
|
Total commitments |
| $ | 23,110 |
|
| $ | 16,967 |
|
| $ | 244 |
|
| $ | 4,599 |
|
| $ | 1,300 |
|
| $ | 21,066 |
|
| $ | 16,371 |
|
| $ | 3,361 |
|
| $ | 1,264 |
|
| $ | 70 |
|
(1) | The |
(2) | Does not include lease payments expected to be incurred in fiscal |
(3) | Includes the expected benefit payments for postretirement plans from fiscal |
(4) | These are unsecured general obligations to pay the deferred compensation of, and our contributions to, participants in the |
(5) | Represents the company’s various ingredient and packaging purchasing commitments. This item is not recorded on the Consolidated Balance Sheet. |
(6) | These letters of credit are for the benefit of certain insurance companies related to workers’ compensation liabilities recorded by the company as of |
Because we are uncertain as to if or when settlements may occur, these tables do not reflect the company’s net liability of $0.6$1.2 million related to uncertain tax positions as of January 2,December 31, 2016. Details regarding this liability are presented in Note 20, Income Taxes, of Notes to Consolidated Financial Statements of this Form 10-K.
In the event the company ceases to utilize the independent distribution form of doing business or exits a geographic market, the company is contractually required to purchase the distribution rights from the independent distributor. These potential commitments are excluded from the table above because they cannot be known at this time.
Total stockholders’ equity was as follows at December 31, 2016 and January 2, 2016:
Guarantees
|
| Balance at |
| |||||
|
| December 31, 2016 |
|
| January 2, 2016 |
| ||
| �� | (Amounts in thousands) |
| |||||
Total stockholders' equity |
| $ | 1,210,080 |
|
| $ | 1,243,082 |
|
Stock Repurchase Plan. The Board approved a plan that authorized share repurchases of up to 67.5 million shares of the company’s common stock. In November 2014, the Board increased the company’s share repurchase authorization by 7.1 million shares to a total of 74.6 million shares. At the close of the company’s fourth quarter on December 31, 2016, 6.8 million shares remained under the existing authorization. Under the plan, the company may repurchase its common stock in open market or privately negotiated transactions or under an accelerated repurchase program at such times and Indemnification Obligations. Our company has provided various representations, warranties,at such prices as determined to be in the company’s best interest. These purchases may be commenced or suspended without prior notice depending on then-existing business or market conditions and other standard indemnifications in various agreementsfactors. In March 2016, the company entered into an ASR agreement with customers, suppliersDeutsche Bank AG to repurchase an aggregate of $120.0 million of the company’s common stock under the existing share repurchase program. During fiscal 2016, 6.9 million shares, at a cost of $126.3 million, of the company’s common stock were repurchased under the plan. This included share repurchases under the ASR of 6.5 million shares, at a cost of $120.0 million, and other parties, as well as in agreements to sell business assets or lease facilities. In general, these provisions indemnifyshare repurchases. From the counterparty for matters such as breaches of representations and warranties, certain environmental conditions and tax matters, and, in the context of sales of business assets, any liabilities arising prior to the closinginception of the transactions. Non-performance underplan through December 31, 2016, 67.8 million shares, at a contract could triggercost of $630.4 million, have been repurchased. In the fourth quarter of fiscal 2016, the company repurchased an obligationimmaterial number of shares of its common stock related to withholding and payment obligations in connection with the company. The ultimate effect on future financial results is not subject to reasonable estimation because considerable uncertainty exists as to the final outcomevesting of any potential claims. We do not believe that any of these commitments will have a material effect on our results of operations or financial condition.performance share awards.
New Accounting Pronouncements Not Yet Adopted
See Note 4,3, NewRecent Accounting Pronouncements, Not Yet Adopted, of Notes to Consolidated Financial Statements of this Form 10-K regarding this information.
The company uses derivative financial instruments as part of an overall strategy to manage market risk. The company uses forwards, futures, swaps, and option contracts to hedge existing or future exposure to changes in interest rates and commodity prices. The company does not enter into these derivative financial instruments for trading or speculative purposes. If actual market conditions are less favorable than those anticipated, interest rates and commodity prices could increase significantly, adversely affecting our interest costs and the margins from the sale of our products.
Commodity Price Risk
The company enters into commodity forward, futures, option, and swap contracts for wheat and, to a lesser extent, other commodities in an effort to provide a predictable and consistent commodity price and thereby reduce the impact of market volatility in its raw material and packaging prices. As of January 2,December 31, 2016, the company’s hedge portfolio contained commodity derivatives with a fair value of $14.9$(0.8) million. Of this fair value, $11.9$(0.8) million is based on quoted market prices and $2.9 million is based on models and other valuation methods;prices. Nearly all of this fair value relates to instruments that will be utilized in fiscal 2016.2017.
A sensitivity analysis has been prepared to quantify the company’s potential exposure to commodity price risk with respect to its derivative portfolio. Based on the company’s derivative portfolio as of January 2,December 31, 2016, a hypothetical ten percent change in commodity prices would increase or decrease the fair value of the derivative portfolio by $14.5$3.2 million. The analysis disregards changes in the exposures inherent in the underlying hedged items; however, the company expects that any increase or decrease in the fair value of the portfolio would be substantially offset by increases or decreases in raw material and packaging prices.
Refer to the Index to Consolidated Financial Statements and the Financial Statement Schedule for the required information.
None.
Management’s Evaluation of Disclosure Controls and Procedures:
We have established and maintain a system of disclosure controls and procedures that are designed to ensure that material information relating to the company, which is required to be timely disclosed by us in reports that we file or submit under the Securities Exchange Act of 1934 (“Exchange Act”), is accumulated and communicated to management in a timely fashion and is recorded, processed, summarized and reported within the time periods specified by the SEC’s rules and forms. An evaluation of the effectiveness of the design and operation of our disclosure controls and procedures (as defined in Rule 13a-15(e) under the Exchange Act) was performed as of the end of the period covered by this annual report. This evaluation was performed under the supervision
and with the participation of management, including our Chief Executive Officer (“CEO”),CEO, Chief Financial Officer (“CFO”), and Chief Accounting Officer (“CAO”).
Based upon that evaluation, our CEO, CFO, and CAO have concluded that these disclosure controls and procedures were effective as of the end of the period covered by this annual report.
Management’s Report on Internal Control Over Financial Reporting:
Our management is responsible for establishing and maintaining adequate internal control over financial reporting, as such term is defined in Exchange Act Rule 13a-15(f). under the Exchange Act. Under the supervision and with the participation of our management, including our CEO, CFO, and CAO, we conducted an evaluation of the effectiveness of our internal control over financial reporting based on the framework in “Internal Control — Integrated Framework (2013)” issued by the Committee of Sponsoring Organizations of the Treadway Commission. Based on our evaluation our management concluded that our internal control over financial reporting was effective as of January 2,December 31, 2016.
In making its assessment of internal control over financial reporting as of January 2, 2016, management has excluded DKB and Alpine because they were acquired by the company in purchase business combination transactions on September 12, 2015 and October 13, 2015, respectively. DKB contributed revenues to the company for fiscal 2015 of $37.6 million, representing approximately 1.0% of our consolidated revenues for the fiscal year. DKB’s assets represented approximately 1.2% of our consolidated assets at January 2, 2016. We will include DKB in our fiscal 2016 assessment of internal control over financial reporting. Alpine contributed revenues to the company for fiscal 2015 of $11.9 million, representing approximately 0.3% of our consolidated revenues. Alpine’s assets represented approximately 0.9% of our consolidated assets at January 2, 2016. We will include Alpine in our fiscal 2016 assessment of internal control over financial reporting.
The effectiveness of our internal control over financial reporting as of January 2,December 31, 2016 has been audited by PricewaterhouseCoopers LLP, an independent registered public accounting firm, as stated in theirits report which is included herein.
Changes in Internal Control Over Financial Reporting:
There were no changes in our internal control over financial reporting that occurred during our last fiscal quarter that have materially affected, or are reasonably likely to materially affect, our internal control over financial reporting.
None.
The information required by this item with respect to directors of the company is incorporated herein by reference to the information set forth under the captions “Proposal I — Election of Directors”, “Directors and Corporate Governance”, “Corporate Governance — The Board of Directors and Committees of the Board of Directors”, “Corporate Governance — Relationships Among Certain Directors”, “Audit Committee Report” and “Section 16(a) Beneficial Ownership Reporting Compliance” in the company’s definitive proxy statement for the 20162017 Annual Meeting of Shareholders expected to be filed with the SEC in April (the “proxy”). The information required by this item with respect to executive officers of the company is set forth in Part I of this Form 10-K.
We have adopted the Flowers Foods, Inc. Code of Business Conduct and Ethics for Officers and Members of the Board of Directors (the “Code of Business Conduct and Ethics”), which applies to all of our directors and executive officers. The Code of Business Conduct and Ethics is publicly available on our website at www.flowersfoods.com in the “Corporate Governance” section of the “Investor Center” tab. If we make any substantive amendments to our Code of Business Conduct and Ethics or we grant any waiver, including any implicit waiver, from a provision of the Code of Business Conduct and Ethics, that applies to any of our directors or executive officers, including our principal executive officer, principal financial officer or principal accounting officer, we intend to disclose the nature of the amendment or waiver on our website at the same location. Alternatively, we may elect to disclose the amendment or waiver in a current report on Form 8-K filed with the SEC.
Our President and Chief Executive OfficerCEO certified to the New York Stock Exchange (“NYSE”)NYSE on July 1, 2015June 24, 2016 pursuant to Section 303A.12 of the NYSE’s listing standards, that he was not aware of any violation by Flowers Foods of the NYSE’s corporate governance listing standards as of that date.
The information required by this item is incorporated herein by reference to the information set forth under the caption “Executive Compensation” in the proxy.
Item 12. | Security Ownership of Certain Beneficial Owners and Management and Related Stockholder Matters |
See Item 5 of this Form 10-K for information regarding Securities Authorized for Issuance under Equity Compensation Plans. The remaining information required by this item is incorporated herein by reference to the information set forth under the caption “Security Ownership of Certain Beneficial Owners and Management” in the proxy.
The information required by this item is incorporated herein by reference to the information set forth under the caption “Corporate Governance — Determination of Independence” and “Transactions with Management and Others” in the proxy.
The information required by this item is incorporated herein by reference to the information set forth under the caption “Fiscal 20152016 and Fiscal 20142015 Audit Firm Fee Summary” in the proxy.
(a) | List of documents filed as part of this report. |
| 1. | Financial Statements of the Registrant |
Report of Independent Registered Public Accounting Firm.
Consolidated Balance Sheets at January 2,December 31, 2016 and January 3, 2015.2, 2016.
Consolidated Statements of Income for Fiscal 2015,2016, Fiscal 2014,2015, and Fiscal 2013.2014.
Consolidated Statements of Comprehensive Income for Fiscal 2015,2016, Fiscal 2014,2015, and Fiscal 2013.2014.
Consolidated Statements of Changes in Stockholders’ Equity for Fiscal 2015,2016, Fiscal 2014,2015, and Fiscal 2013.2014.
Consolidated Statements of Cash Flows for Fiscal 2015,2016, Fiscal 2014,2015, and Fiscal 2013.2014.
Notes to Consolidated Financial Statements.
The company has elected not to provide summary information.
Exhibit |
|
|
| Name of Exhibit | ||
No |
|
|
|
| ||
2.1 |
| — |
| Distribution Agreement, dated as of October 26, 2000, by and between Flowers Industries, Inc. and Flowers Foods, Inc. (Incorporated by reference to Exhibit 2.1 to Flowers Foods’ Registration Statement on Form 10, dated December 1, 2000, File No. 1-16247). | ||
2.2 |
| — |
| Amendment No. 1 to Distribution Agreement, dated as of March 12, 2001, by and between Flowers Industries, Inc. and Flowers Foods, Inc. (Incorporated by reference to Exhibit 2.2 to Flowers Foods’ Annual Report on Form 10-K, dated March 30, 2001, File No. 1-16247). | ||
2.3 |
| — |
| Acquisition Agreement, dated as of May 31, 2012, by and among Flowers Foods, Inc., Lobsterco I, LLC, Lepage Bakeries, Inc., RAL, Inc., Bakeast Company, Bakeast Holdings, Inc., and the equity holders named therein (Incorporated by reference to Exhibit 2.1 to Flowers Foods’ Current Report on Form 8-K, dated June 1, 2012, File No. 1-16247). | ||
2.4 |
| — |
| Agreement and Plan of Merger, dated as of May 31, 2012, by and among Flowers Foods, Inc., Lobsterco II, LLC, Aarow Leasing, Inc., The Everest Company, Incorporated and the shareholders named therein (Incorporated by reference to Exhibit 2.2 to Flowers Foods’ Current Report on Form 8-K, dated June 1, 2012, File No. 1-16247). | ||
2.5 |
| — |
| Asset Purchase Agreement, dated as of January 11, 2013, by and among Hostess Brands, Inc., Interstate Brands Corporation, IBC Sales Corporation, Flowers Foods, Inc. and FBC Georgia, LLC (Incorporated by reference to Exhibit 2.1 to Flowers Foods’ Current Report on Form 8-K, dated January 14, 2013, File No. 1-16247). | ||
2.6 |
| — |
| Stock Purchase Agreement, dated as of August 12, 2015, by and among Flowers Foods, Inc., AVB, Inc., Goode Seed Holdings, LLC, Goode Seed Co-Invest, LLC, Glenn Dahl, trustee of the Glenn Dahl Family Trust, U/A/D November 28, 2012, David J. Dahl, trustee of the David Dahl Family Trust, U/A/D May 1, 2012, Shobi L. Dahl, trustee of the Shobi Dahl Family Trust, U/A/D, December 16, 2011, and Flowers Bakeries, LLC. (Incorporated by reference to Exhibit 2.6 to Flowers Foods' Quarterly Report on Form 10-Q, dated November 12, 2015, File No. 1-16247).** | ||
3.1 |
| — |
| Restated Articles of Incorporation of Flowers Foods, Inc., as amended through June 5, 2015 (Incorporated by reference to Exhibit 3.1 to Flowers Foods’ Current Report on Form 8-K, dated June 10, 2015, File No. 1-16247). | ||
3.2 |
| — |
| Amended and Restated Bylaws of Flowers Foods, Inc., as amended through June 5, 2015 (Incorporated by reference to Exhibit 3.2 to Flowers Foods’ Current Report on Form 8-K, dated June 10, 2015, File No. 1-16247). | ||
4.1 |
| — |
| Form of Share Certificate of Common Stock of Flowers Foods, Inc. (Incorporated by reference to Exhibit 4.1 to Flowers Foods’ Annual Report on Form 10-K, dated February 29, 2012, File No. 1-16247). | ||
4.2 |
| — |
| Form of Indenture (Incorporated by reference to Exhibit 4.6 to Flowers Foods’ Registration Statement on Form S-3, dated February 8, 2011, File No. 1-16247). | ||
4.3 |
| — |
| Form of Indenture (Incorporated by reference to Exhibit 4.1 to Flowers Foods’ Current Report on Form 8-K, dated March 29, 2012, File No. 1-16247). | ||
4.4 |
| — |
| Indenture, dated as of April 3, 2012, by and between Flowers Foods, Inc. and Wells Fargo Bank, National Association (Incorporated by reference to Exhibit 4.1 to Flowers Foods’ Current Report on Form 8-K, dated April 3, 2012, File No. 1-16247). | ||
4.5 |
| — |
| Officers’ Certificate pursuant to Section 2.02 of the Indenture (Incorporated by reference to Exhibit 4.2 to Flowers Foods’ Current Report on Form 8-K, dated April 3, 2012, File No. 1-16247). | ||
4.6 |
| — |
| Form of 4.375% Senior Notes due 2022 (Incorporated by reference to Exhibit 4.3 to Flowers Foods’ Current Report on Form 8-K, dated April 3, 2012, File No. 1-16247). | ||
4.7 |
|
| ||||
|
| — |
| Flowers Foods, Inc. 401(k) Retirement Savings Plan, as amended through December 17, 2013 (Incorporated by reference to Exhibit 4.1 to Flowers Foods’ Registration Statement on Form S-8, dated May 21, 2014, File No. 333-196125). | ||
|
| — | Officers’ Certificate pursuant to Section 2.02 of the Indenture (Incorporated by reference to Exhibit 4.2 to Flowers Foods’ Current Report on Form 8-K, dated September 28, 2016, File No. 1-16247). | |||
4.9 | — | Form of 3.50% Senior Notes due 2026 (Incorporated by reference to Exhibit 4.3 to Flowers Foods’ Current Report on Form 8-K, dated September 28, 2016, File No. 1-16247). | ||||
10.1 |
| — |
| Amended and Restated Credit Agreement, dated as of May 20, 2011, by and among, Flowers Foods, Inc., the Lenders party thereto from time to time, Deutsche Bank AG New York Branch, as administrative agent, Bank of America, N.A., as syndication agent, and Coöperatieve Centrale Raiffeisen-Boerenleenbank, B.A., “Rabobank International,” New York Branch, Branch Banking & Trust Company and Regions Bank, as co-documentation agents (Incorporated by reference to Exhibit 10.1 to Flowers Foods’ Current Report on Form 8-K, dated May 26, 2011, File No. 1-16247). | ||
| — |
| First Amendment to Amended and Restated Credit Agreement, dated as of November 16, 2012, by and among Flowers Foods, Inc., the Lenders party thereto and Deutsche Bank AG, New York Branch, as administrative agent (Incorporated by reference to Exhibit 10.1 to Flowers Foods’ Current Report on Form 8-K, dated November 21, 2012, File No. 1-16247). | |||
10.3 |
| — |
| Second Amendment to Amended and Restated Credit Agreement, dated as of April 5, 2013, by and among Flowers Foods, Inc., the Lenders party thereto and Deutsche Bank AG New York Branch, as administrative agent, swingline lender and issuing lender (Incorporated by reference to Exhibit 10.3 to Flowers Foods’ Current Report on Form 8-K, dated April 10, 2013, File No. 1-16247). | ||
10.4 |
| — |
| Third Amendment to Amended and Restated Credit Agreement, dated as of February 14, 2014, by and among Flowers Foods, Inc., the Lenders party thereto and Deutsche Bank AG New York Branch, as administrative agent, swingline lender and issuing lender (Incorporated by reference to Exhibit 10.2 to Flowers Foods’ Current Report on Form 8-K, dated February 18, 2014, File No. 1-16247). | ||
10.5 |
| — |
| Fourth Amendment to Amended and Restated Credit Agreement, dated as of April 21, 2015, by and among Flowers Foods, Inc., the Lenders party thereto and Deutsche Bank AG New York Branch, as administrative agent, swingline lender and issuing lender (Incorporated by reference to Exhibit 10.5 to Flowers Foods' Quarterly Report on Form 10-Q, dated May 28, 2015, File No. 1-16247). | ||
10.6 |
| — | Fifth Amendment to Amended and Restated Credit Agreement, dated as of April 19, 2016, among Flowers Foods, Inc., the lenders party thereto, Deutsche Bank AG New York Branch, as administrative agent, the swingline lender and issuing lender (Incorporated by reference to Exhibit 10.3 to Flowers Foods' Current Report on Form 8-K, dated April 22, 2016, File No. 1-16247). | |||
10.7 |
| — |
| Credit Agreement, dated as of April 5, 2013, by and among Flowers Foods, Inc., the lenders party thereto, Branch Banking and Trust Company, Coöperatieve Centrale Raiffeisen-Boerenleenbank B.A., “Rabobank Nederland,” New York Branch, and Regions Bank, as co-documentation agents, Bank of America, N.A., as syndication agent, and Deutsche Bank AG New York Branch, as administrative agent (Incorporated by reference to Exhibit 10.1 to Flowers Foods’ Current Report on Form 8-K, dated April 10, 2013, File No. 1-16247). | ||
| 10.8 |
| — |
| First Amendment to Credit Agreement, dated as of February 14, 2014, by and among Flowers Foods, Inc., the lenders party thereto and Deutsche Bank AG New York Branch, as administrative agent (Incorporated by reference to Exhibit 10.1 to Flowers Foods’ Current Report on Form 8-K, dated February 18, 2014, File No. 1-16247). | |
|
| — | Second Amendment to Credit Agreement, dated as of April 19, 2016, among Flowers Foods, Inc., the lenders party thereto and Deutsche Bank AG New York Branch, as administrative agent (Incorporated by reference to Exhibit 10.2 to Flowers Foods' Current Report on Form 8-K, dated April 22, 2016, File No. 1-16247). | |||
10.10 |
| — |
| Receivables Loan, Security and Servicing Agreement, dated as of July 17, 2013, by and among Flowers Finance II, LLC, Flowers Foods, Inc., as servicer, Coöperatieve Centrale Raiffeisen-Boerenleenbank B.A., “Rabobank Nederland,” New York Branch, as administrative agent and facility agent, and certain financial institutions party thereto (Incorporated by reference to Exhibit 10.1 to Flowers Foods’ Current Report on Form 8-K, dated July 22, 2013, File No. 1-16247). | ||
| 10.11 |
| — |
| First Amendment to Receivables Loan, Security and Servicing Agreement, dated as of August 7, 2014, by and among Flowers Finance II, LLC, Flowers Foods, Inc., as servicer, Nieuw Amsterdam Receivables Corporation and Coöperatieve Centrale Raiffeisen-Boerenleenbank B.A., “Rabobank Nederland,” New York Branch, as administrative agent and facility agent (Incorporated by reference to Exhibit 10.1 to Flowers Foods’ Current Report on Form 8-K, dated August 12, 2014, File No. 1-16247). | |
| 10.12 |
| — |
| Second Amendment to Receivables Loan, Security and Servicing Agreement, dated as of December 17, 2014, by and among Flowers Finance II, LLC, Flowers Foods, Inc., as servicer, Nieuw Amsterdam Receivables Corporation and Coöperatieve Centrale Raiffeisen-Boerenleenbank B.A., “Rabobank,” New York Branch, as administrative agent and facility agent. (Incorporated by reference to Exhibit 10.9 to Flowers Foods’ Annual Report on Form 10-K, dated February 25, 2015, File No. 1-16247). | |
| 10.13 |
| — |
| Third Amendment to Receivables Loan, Security and Servicing Agreement, dated as of August 20, 2015, by and among Flowers Finance II, LLC, Flowers Foods, Inc., as servicer, Nieuw Amsterdam Receivables Corporation and Coöperatieve Centrale Raiffeisen-Boerenleenbank B.A., “Rabobank,” New York Branch, as administrative agent and facility agent (Incorporated by reference to Exhibit 10.11 to Flowers Foods' Quarterly Report on Form 10-Q, dated November 12, 2015, File No. 1-16247). | |
|
| — | Fourth Amendment to Receivables Loan, Security and Servicing Agreement, dated as of September 30, 2016, by and among Flowers Finance II, LLC, Flowers Foods, Inc., as servicer, Nieuw Amsterdam Receivables Corporation and Coöperatieve Centrale Raiffeisen-Boerenleenbank B.A., “Rabobank,” New York Branch, as administrative agent and facility agent (Incorporated by reference to Exhibit 10.1 to Flowers Foods' Current Report on Form 8-K, dated October 3, 2016, File No. 1-16247). |
— | Credit Agreement, dated as of April 19, 2016, among Flowers Foods, Inc., the lenders party thereto from time to time, Deutsche Bank Securities Inc., as lead arranger and bookrunner, Bank of America, N.A., Branch Banking and Trust Company, Coöperatieve Rabobank U.A., New York Branch, PNC Bank, Nationial Association and Wells Fargo Bank, National Association, as co-documentation agents, Deutsche Bank Securities Inc., as syndication agent, and Deutsche Bank AG New York Branch, as administrative agent (Incorporated by reference to Exhibit 10.1 to Flowers Foods' Current Report on Form 8-K, dated April 22, 2016, File No. 1-16247). | |||||
10.16 | + | — |
| Flowers Foods, Inc. Retirement Plan No. 1, as amended and restated effective as of March 26, 2001 (Incorporated by reference to Exhibit 10.3 to Flowers Foods’ Annual Report on Form 10-K, dated March 30, 2001, File No. 1-16247). | ||
| 10.17 | + | — |
| Flowers Foods, Inc. 2001 Equity and Performance Incentive Plan, as amended and restated effective as of April 1, 2009 (Incorporated by reference to Annex A to Flowers Foods’ Proxy Statement on Schedule 14A, dated April 24, 2009, File No. 1-16247). | |
| 10.18 | + | — |
| Flowers Foods, Inc. Stock Appreciation Rights Plan (Incorporated by reference to Exhibit 10.8 to Flowers Foods’ Annual Report on Form 10-K, dated March 29, 2002, File No. 1-16247). | |
| 10.19 | + | — |
| Flowers Foods, Inc. Annual Executive Bonus Plan (Incorporated by reference to Annex B to Flowers Foods’ Proxy Statement on Schedule 14A, dated April 24, 2009, File No. 1-16247). | |
| 10.20 | + | — |
| Flowers Foods, Inc. 2014 Omnibus Equity and Incentive Compensation Plan (Incorporated by reference to Exhibit 10.1 to Flowers Foods’ Current Report on Form 8-K, dated May 27, 2014, File No. 1-16247). | |
| 10.21 | + | — |
| Flowers Foods, Inc. Supplemental Executive Retirement Plan (Incorporated by reference to Exhibit 10.10 to Flowers Foods’ Annual Report on Form 10-K, dated March 29, 2002, File No. 1-16247). |
| 10.22 | + | — |
| Form of Indemnification Agreement, by and between Flowers Foods, Inc., certain executive officers and the directors of Flowers Foods, Inc. (Incorporated by reference to Exhibit 10.14 to Flowers Foods’ Annual Report on Form 10-K, dated March 28, 2003, File No. 1-16247). | |
| 10.23 | + | — |
| Ninth Amendment to the Flowers Foods, Inc. Retirement Plan No. 1, dated as of November 7, 2005 (Incorporated by reference to Exhibit 10.15 to Flowers Foods’ Quarterly Report on Form 10-Q, dated November 17, 2005, File No. 1-16247). | |
| 10.24 | + | — |
| Flowers Foods, Inc. Change of Control Plan, dated as of February 23, 2012 (Incorporated by reference to Exhibit 10.1 to Flowers Foods’ Current Report on Form 8-K, dated February 29, 2012, File No. 1-16247). | |
10.25 |
| *+ | — |
| Form of 2013 Restricted Stock Agreement by and between Flowers Foods, Inc. and | |
|
|
|
| |||
|
|
|
| |||
| 10.26 | + | — |
| Form of 2015 Restricted Stock Agreement by and between Flowers Foods, Inc. and certain executive officers of Flowers Foods, Inc. (Incorporated by reference to Exhibit 10.24 to Flowers Foods’ Annual Report on Form 10-K, dated February 25, 2015, File No. 1-16247). | |
10.27 |
|
| — |
| Form of 2016 Restricted Stock Agreement by and between Flowers Foods, Inc. and certain executive officers of Flowers Foods, Inc. (Incorporated by reference to Exhibit 10.25 to Flowers Foods' Annual Report on Form 10-K, dated February 24, 2016, File No. 1-16247). | |
10.28 | *+ | — |
|
| ||
12.1 | * | — |
| Computation of Ratio of Earnings to Fixed | ||
21 | * | — |
| Subsidiaries of Flowers Foods, Inc. | ||
23 | * | — |
| Consent of Independent Registered Public Accounting Firm, PricewaterhouseCoopers | ||
31.1 | * | — |
| Certification of Chief Executive Officer pursuant to Section 302 of the Sarbanes-Oxley Act of 2002. | ||
31.2 | * | — |
| Certification of Chief Financial Officer pursuant to Section 302 of the Sarbanes-Oxley Act of 2002. | ||
31.3 | * | — |
| Certification of Chief Accounting Officer pursuant to Section 302 of the Sarbanes-Oxley Act of 2002. | ||
32 | * | — |
| Certification Pursuant to 18 U.S.C. Section 1350, as Adopted Pursuant to Section 906 of the Sarbanes-Oxley Act of 2002, by Allen L. Shiver, Chief Executive Officer, R. Steve Kinsey, Chief Financial Officer and Karyl H. Lauder, Chief Accounting Officer for the Quarter Ended | ||
101.INS | * | — |
| XBRL Instance Document. | ||
|
|
|
| |||
|
|
|
| |||
|
|
|
| |||
|
|
|
| |||
|
|
|
| |||
* | Filed herewith |
** | Portions of this exhibit have been omitted and filed separately with the Securities and Exchange Commission as part of an application for confidential treatment pursuant to Rule 24b-2 promulgated under the Securities Exchange Act of 1934, which application has been granted. Schedules to this exhibit have been omitted pursuant to Item 601(b)(2) of Regulation S-K and will be furnished supplementally to the Securities and Exchange Commission upon request. |
+ | Management contract or compensatory plan or arrangement |
Pursuant to the requirements of Section 13 or 15(d) of the Securities Exchange Act of 1934, Flowers Foods, Inc. has duly caused this Form 10-K to be signed on its behalf by the undersigned, thereunto duly authorized on this 24th23rd day of February, 2016.2017.
FLOWERS FOODS, INC. |
|
/s/ ALLEN L. SHIVER |
Allen L. Shiver |
President and |
Chief Executive Officer |
|
/s/ R. STEVE KINSEY |
R. Steve Kinsey |
Executive Vice President and |
Chief Financial Officer |
|
/s/ KARYL H. LAUDER |
Karyl H. Lauder |
Senior Vice President and Chief Accounting Officer |
Pursuant to the requirements of the Securities Exchange Act of 1934, this Form 10-K has been signed below by the following persons on behalf of Flowers Foods, Inc. and in the capacities and on the dates indicated.
Signature |
| Title |
| Date |
|
|
|
|
|
/s/ ALLEN L. SHIVER |
| President and Chief Executive Officer and Director |
| February |
Allen L. Shiver |
|
| ||
|
|
|
|
|
/s/ R. STEVE KINSEY |
| Executive Vice President and Chief Financial Officer |
| February |
R. Steve Kinsey |
|
| ||
|
|
|
|
|
/s/ KARYL H. LAUDER |
| Senior Vice President and Chief Accounting Officer |
| February |
Karyl H. Lauder |
|
| ||
|
|
|
|
|
/s/ GEORGE E. DEESE |
| Chairman |
| February |
George E. Deese | ||||
|
|
| ||
| ||||
|
|
| ||
|
|
| ||
|
|
|
|
|
/s/ RHONDA O. GASS |
| Director |
| February |
Rhonda O. Gass |
|
| ||
|
|
|
|
|
/s/ BENJAMIN H. GRISWOLD, IV |
| Director |
| February |
Benjamin H. Griswold, IV |
|
| ||
|
|
|
|
|
/s/ RICHARD LAN |
| Director |
| February |
Richard Lan |
|
| ||
|
|
|
|
|
/s/ MARGARET G. LEWIS |
| Director |
| February |
Margaret G. Lewis |
|
| ||
|
|
|
|
|
/s/ AMOS R. MCMULLIAN |
| Director |
| February |
Amos R. McMullian |
|
| ||
|
|
|
|
|
/s/ J.V. SHIELDS, JR. |
| Director |
| February |
J.V. Shields, Jr. |
|
| ||
|
|
|
|
|
/s/ DAVID V. SINGER |
| Director |
| February |
David V. Singer |
|
| ||
|
|
|
|
|
/s/ JAMES T. SPEAR |
| Director |
| February |
James T. Spear |
|
| ||
|
|
|
|
|
/s/ MELVIN T. STITH, PH.D. |
| Director |
| February |
Melvin T. Stith, Ph.D. |
|
| ||
|
|
|
|
|
/s/ C. MARTIN WOOD III |
| Director |
| February |
C. Martin Wood III |
|
|
FLOWERS FOODS, INC. AND SUBSIDIARIES
INDEX TO CONSOLIDATED FINANCIAL STATEMENTS
Report of Independent Registered Public Accounting Firm
To the Board of Directors and Stockholders of Flowers Foods, Inc.:
In our opinion, the accompanying consolidated balance sheets and the related consolidated statements of income, comprehensive income, changes in stockholders’ equity and cash flows present fairly, in all material respects, the financial position of Flowers Foods, Inc. and its subsidiaries at January 2,December 31, 2016 and January 3, 2015,2, 2016, and the results of their operations and their cash flows for each of the three years in the period ended January 2,December 31, 2016 in conformity with accounting principles generally accepted in the United States of America. Also in our opinion, the Company maintained, in all material respects, effective internal control over financial reporting as of January 2,December 31, 2016, based on criteria established in Internal Control - Integrated Framework (2013) issued by the Committee of Sponsoring Organizations of the Treadway Commission (COSO). The Company's management is responsible for these financial statements, for maintaining effective internal control over financial reporting and for its assessment of the effectiveness of internal control over financial reporting, included in Management’s Report on Internal Control over Financial Reporting appearing under Item 9A. Our responsibility is to express opinions on these financial statements and on the Company's internal control over financial reporting based on our integrated audits. We conducted our audits in accordance with the standards of the Public Company Accounting Oversight Board (United States). Those standards require that we plan and perform the audits to obtain reasonable assurance about whether the financial statements are free of material misstatement and whether effective internal control over financial reporting was maintained in all material respects. Our audits of the financial statements included examining, on a test basis, evidence supporting the amounts and disclosures in the financial statements, assessing the accounting principles used and significant estimates made by management, and evaluating the overall financial statement presentation. Our audit of internal control over financial reporting included obtaining an understanding of internal control over financial reporting, assessing the risk that a material weakness exists, and testing and evaluating the design and operating effectiveness of internal control based on the assessed risk. Our audits also included performing such other procedures as we considered necessary in the circumstances. We believe that our audits provide a reasonable basis for our opinions.
As discussed in Note 3 to the consolidated financial statements, the Company changed the manner in which it presents deferred income taxes in 2016.
A company’s internal control over financial reporting is a process designed to provide reasonable assurance regarding the reliability of financial reporting and the preparation of financial statements for external purposes in accordance with generally accepted accounting principles. A company’s internal control over financial reporting includes those policies and procedures that (i) pertain to the maintenance of records that, in reasonable detail, accurately and fairly reflect the transactions and dispositions of the assets of the company; (ii) provide reasonable assurance that transactions are recorded as necessary to permit preparation of financial statements in accordance with generally accepted accounting principles, and that receipts and expenditures of the company are being made only in accordance with authorizations of management and directors of the company; and (iii) provide reasonable assurance regarding prevention or timely detection of unauthorized acquisition, use, or disposition of the company’s assets that could have a material effect on the financial statements.
Because of its inherent limitations, internal control over financial reporting may not prevent or detect misstatements. Also, projections of any evaluation of effectiveness to future periods are subject to the risk that controls may become inadequate because of changes in conditions, or that the degree of compliance with the policies or procedures may deteriorate.
As described in Management’s Report on Internal Control over Financial Reporting appearing under Item 9A, management has excluded Dave’s Killer Bread (“DKB”) and Alpine Valley Bread Company (“Alpine”) from its assessment of internal control over financial reporting as of January 2, 2016 because they were acquired by the Company in a purchase business combination during 2015. We have also excluded DKB and Alpine from our audit of internal control over financial reporting. DKB and Alpine are wholly-owned subsidiaries whose total assets and total revenues represent 2.1% and 1.3%, respectively, of the related consolidated financial statement amounts as of and for the year ended January 2, 2016.
/s/ PricewaterhouseCoopers LLP
Atlanta, Georgia
February 24, 201623, 2017
FLOWERS FOODS, INC. AND SUBSIDIARIES
|
| January 2, 2016 |
|
| January 3, 2015 |
|
| December 31, 2016 |
|
| January 2, 2016 |
| ||||
|
| (Amounts in thousands, except share data) |
|
| (Amounts in thousands, except share data) |
| ||||||||||
ASSETS | ASSETS |
| ASSETS |
| ||||||||||||
Current Assets: |
|
|
|
|
|
|
|
|
|
|
|
|
|
|
|
|
Cash and cash equivalents |
| $ | 14,378 |
|
| $ | 7,523 |
|
| $ | 6,410 |
|
| $ | 14,378 |
|
Accounts and notes receivable, net of allowances of $1,341 and $2,723, respectively |
|
| 269,683 |
|
|
| 235,911 |
| ||||||||
Accounts and notes receivable, net of allowances of $1,703 and $1,341, respectively |
|
| 271,913 |
|
|
| 269,683 |
| ||||||||
Inventories: |
|
|
|
|
|
|
|
|
|
|
|
|
|
|
|
|
Raw materials |
|
| 42,336 |
|
|
| 33,579 |
|
|
| 41,830 |
|
|
| 42,336 |
|
Packaging materials |
|
| 21,853 |
|
|
| 19,591 |
|
|
| 20,354 |
|
|
| 21,853 |
|
Finished goods |
|
| 46,988 |
|
|
| 39,930 |
|
|
| 48,698 |
|
|
| 46,988 |
|
|
|
| 111,177 |
|
|
| 93,100 |
|
|
| 110,882 |
|
|
| 111,177 |
|
Spare parts and supplies |
|
| 57,288 |
|
|
| 54,058 |
|
|
| 59,509 |
|
|
| 57,288 |
|
Deferred taxes |
|
| 37,207 |
|
|
| 26,823 |
| ||||||||
Other |
|
| 47,782 |
|
|
| 43,148 |
|
|
| 28,128 |
|
|
| 47,782 |
|
Total current assets |
|
| 537,515 |
|
|
| 460,563 |
|
|
| 476,842 |
|
|
| 500,308 |
|
Property, Plant and Equipment: |
|
|
|
|
|
|
|
|
|
|
|
|
|
|
|
|
Land |
|
| 93,115 |
|
|
| 93,314 |
|
|
| 89,674 |
|
|
| 93,115 |
|
Buildings |
|
| 455,626 |
|
|
| 441,444 |
|
|
| 458,200 |
|
|
| 455,626 |
|
Machinery and equipment |
|
| 1,162,314 |
|
|
| 1,115,129 |
|
|
| 1,147,861 |
|
|
| 1,162,314 |
|
Furniture, fixtures and transportation equipment |
|
| 131,875 |
|
|
| 124,173 |
|
|
| 158,188 |
|
|
| 131,875 |
|
Construction in progress |
|
| 38,334 |
|
|
| 18,566 |
|
|
| 37,564 |
|
|
| 38,334 |
|
|
|
| 1,881,264 |
|
|
| 1,792,626 |
|
|
| 1,891,487 |
|
|
| 1,881,264 |
|
Less: accumulated depreciation |
|
| (1,076,296 | ) |
|
| (985,168 | ) |
|
| (1,110,461 | ) |
|
| (1,076,296 | ) |
|
|
| 804,968 |
|
|
| 807,458 |
|
|
| 781,026 |
|
|
| 804,968 |
|
Notes Receivable |
|
| 154,311 |
|
|
| 161,905 |
|
|
| 154,924 |
|
|
| 154,311 |
|
Assets Held for Sale |
|
| 36,191 |
|
|
| 39,108 |
|
|
| 36,976 |
|
|
| 36,191 |
|
Other Assets |
|
| 11,791 |
|
|
| 12,011 |
|
|
| 9,758 |
|
|
| 7,881 |
|
Goodwill |
|
| 464,926 |
|
|
| 282,960 |
|
|
| 465,578 |
|
|
| 464,926 |
|
Other Intangible Assets, net |
|
| 875,466 |
|
|
| 644,969 |
|
|
| 835,964 |
|
|
| 875,466 |
|
Total assets |
| $ | 2,885,168 |
|
| $ | 2,408,974 |
|
| $ | 2,761,068 |
|
| $ | 2,844,051 |
|
LIABILITIES AND STOCKHOLDERS’ EQUITY | LIABILITIES AND STOCKHOLDERS’ EQUITY |
| LIABILITIES AND STOCKHOLDERS’ EQUITY |
| ||||||||||||
Current Liabilities: |
|
|
|
|
|
|
|
|
|
|
|
|
|
|
|
|
Current maturities of long-term debt and capital lease obligations |
| $ | 74,685 |
|
| $ | 34,496 |
|
| $ | 11,490 |
|
| $ | 74,685 |
|
Accounts payable |
|
| 171,923 |
|
|
| 142,643 |
|
|
| 173,102 |
|
|
| 171,923 |
|
Other accrued liabilities |
|
| 157,130 |
|
|
| 138,414 |
|
|
| 156,032 |
|
|
| 157,130 |
|
Total current liabilities |
|
| 403,738 |
|
|
| 315,553 |
|
|
| 340,624 |
|
|
| 403,738 |
|
Long-term debt: |
|
|
|
|
|
|
|
|
|
|
|
|
|
|
|
|
Total long-term debt and capital lease obligations |
|
| 933,932 |
|
|
| 728,940 |
|
|
| 946,667 |
|
|
| 930,022 |
|
Other Liabilities: |
|
|
|
|
|
|
|
|
|
|
|
|
|
|
|
|
Post-retirement/post-employment obligations |
|
| 76,541 |
|
|
| 93,589 |
|
|
| 69,601 |
|
|
| 76,541 |
|
Deferred taxes |
|
| 183,669 |
|
|
| 94,153 |
|
|
| 145,854 |
|
|
| 146,462 |
|
Other long-term liabilities |
|
| 44,206 |
|
|
| 53,695 |
|
|
| 48,242 |
|
|
| 44,206 |
|
Total other long-term liabilities |
|
| 304,416 |
|
|
| 241,437 |
|
|
| 263,697 |
|
|
| 267,209 |
|
Stockholders’ Equity: |
|
|
|
|
|
|
|
|
|
|
|
|
|
|
|
|
Preferred stock — $100 stated par value, 200,000 authorized and none issued |
|
| — |
|
|
| — |
|
|
| — |
|
|
| — |
|
Preferred stock — $.01 stated par value, 800,000 authorized and none issued |
|
| — |
|
|
| — |
|
|
| — |
|
|
| — |
|
Common stock — $.01 stated par value and $.001 current par value; 500,000,000 authorized shares; 228,729,585 issued shares |
|
| 199 |
|
|
| 199 |
|
|
| 199 |
|
|
| 199 |
|
Treasury stock — 16,463,137 and 19,382,272 shares, respectively |
|
| (174,635 | ) |
|
| (202,062 | ) | ||||||||
Treasury stock — 20,306,784 and 16,463,137 shares, respectively |
|
| (261,812 | ) |
|
| (174,635 | ) | ||||||||
Capital in excess of par value |
|
| 636,501 |
|
|
| 613,859 |
|
|
| 644,456 |
|
|
| 636,501 |
|
Retained earnings |
|
| 877,817 |
|
|
| 809,068 |
|
|
| 910,520 |
|
|
| 877,817 |
|
Accumulated other comprehensive loss |
|
| (96,800 | ) |
|
| (98,020 | ) |
|
| (83,283 | ) |
|
| (96,800 | ) |
Total stockholders’ equity |
|
| 1,243,082 |
|
|
| 1,123,044 |
|
|
| 1,210,080 |
|
|
| 1,243,082 |
|
Total liabilities and stockholders’ equity |
| $ | 2,885,168 |
|
| $ | 2,408,974 |
|
| $ | 2,761,068 |
|
| $ | 2,844,051 |
|
See Accompanying Notes to Consolidated Financial Statements
FLOWERS FOODS, INC. AND SUBSIDIARIES
CONSOLIDATED STATEMENTS OF INCOME
|
| Fiscal 2015 |
|
| Fiscal 2014 |
|
| Fiscal 2013 |
|
| Fiscal 2016 |
|
| Fiscal 2015 |
|
| Fiscal 2014 |
| ||||||
|
| 52 weeks |
|
| 53 weeks |
|
| 52 weeks |
|
| 52 weeks |
|
| 52 weeks |
|
| 53 weeks |
| ||||||
|
| (Amounts in thousands, except per share data) |
|
| (Amounts in thousands, except per share data) |
| ||||||||||||||||||
Sales |
| $ | 3,778,505 |
|
| $ | 3,748,973 |
|
| $ | 3,732,616 |
|
| $ | 3,926,885 |
|
| $ | 3,778,505 |
|
| $ | 3,748,973 |
|
Materials, supplies, labor and other production costs (exclusive of depreciation and amortization shown separately below) |
|
| 1,963,153 |
|
|
| 1,950,633 |
|
|
| 1,972,221 |
|
|
| 2,026,367 |
|
|
| 1,963,153 |
|
|
| 1,950,633 |
|
Selling, distribution and administrative expenses |
|
| 1,381,527 |
|
|
| 1,368,289 |
|
|
| 1,356,742 |
|
|
| 1,464,236 |
|
|
| 1,381,527 |
|
|
| 1,368,289 |
|
Depreciation and amortization |
|
| 132,175 |
|
|
| 128,961 |
|
|
| 118,491 |
|
|
| 140,869 |
|
|
| 132,175 |
|
|
| 128,961 |
|
Pension plan settlement loss |
|
| — |
|
|
| 15,387 |
|
|
| — |
|
|
| 6,646 |
|
|
| — |
|
|
| 15,387 |
|
Impairment of assets |
|
| 3,771 |
|
|
| 10,308 |
|
|
| — |
|
|
| 24,877 |
|
|
| 3,771 |
|
|
| 10,308 |
|
Gain on acquisition |
|
| — |
|
|
| — |
|
|
| (50,071 | ) | ||||||||||||
Income from operations |
|
| 297,879 |
|
|
| 275,395 |
|
|
| 335,233 |
|
|
| 263,890 |
|
|
| 297,879 |
|
|
| 275,395 |
|
Interest expense |
|
| 26,815 |
|
|
| 28,288 |
|
|
| 28,875 |
|
|
| 34,905 |
|
|
| 26,815 |
|
|
| 28,288 |
|
Interest income |
|
| (21,967 | ) |
|
| (20,947 | ) |
|
| (16,015 | ) |
|
| (20,552 | ) |
|
| (21,967 | ) |
|
| (20,947 | ) |
Income before income taxes |
|
| 293,031 |
|
|
| 268,054 |
|
|
| 322,373 |
|
|
| 249,537 |
|
|
| 293,031 |
|
|
| 268,054 |
|
Income tax expense |
|
| 103,840 |
|
|
| 92,315 |
|
|
| 91,479 |
|
|
| 85,761 |
|
|
| 103,840 |
|
|
| 92,315 |
|
Net income |
| $ | 189,191 |
|
| $ | 175,739 |
|
| $ | 230,894 |
|
| $ | 163,776 |
|
| $ | 189,191 |
|
| $ | 175,739 |
|
Net Income Per Common Share: |
|
|
|
|
|
|
|
|
|
|
|
|
|
|
|
|
|
|
|
|
|
|
|
|
Basic: |
|
|
|
|
|
|
|
|
|
|
|
|
|
|
|
|
|
|
|
|
|
|
|
|
Net income per common share |
| $ | 0.90 |
|
| $ | 0.84 |
|
| $ | 1.11 |
|
| $ | 0.79 |
|
| $ | 0.90 |
|
| $ | 0.84 |
|
Weighted average shares outstanding |
|
| 210,793 |
|
|
| 209,683 |
|
|
| 207,935 |
|
|
| 208,511 |
|
|
| 210,793 |
|
|
| 209,683 |
|
Diluted: |
|
|
|
|
|
|
|
|
|
|
|
|
|
|
|
|
|
|
|
|
|
|
|
|
Net income per common share |
| $ | 0.89 |
|
| $ | 0.82 |
|
| $ | 1.09 |
|
| $ | 0.78 |
|
| $ | 0.89 |
|
| $ | 0.82 |
|
Weighted average shares outstanding |
|
| 213,356 |
|
|
| 213,092 |
|
|
| 211,927 |
|
|
| 210,354 |
|
|
| 213,356 |
|
|
| 213,092 |
|
Cash dividends paid per common share |
| $ | 0.5675 |
|
| $ | 0.4850 |
|
| $ | 0.4440 |
|
| $ | 0.6250 |
|
| $ | 0.5675 |
|
| $ | 0.4850 |
|
See Accompanying Notes to Consolidated Financial Statements
FLOWERS FOODS, INC. AND SUBSIDIARIES
CONSOLIDATED STATEMENTS OF COMPREHENSIVE INCOME
|
| Fiscal 2016 |
|
| Fiscal 2015 |
|
| Fiscal 2014 |
| |||
|
| 52 weeks |
|
| 52 weeks |
|
| 53 weeks |
| |||
|
| (Amounts in thousands, except per share data) |
| |||||||||
Net income |
| $ | 163,776 |
|
| $ | 189,191 |
|
| $ | 175,739 |
|
Other comprehensive income, net of tax: |
|
|
|
|
|
|
|
|
|
|
|
|
Pension and postretirement plans: |
|
|
|
|
|
|
|
|
|
|
|
|
Settlement loss |
|
| 4,087 |
|
|
| — |
|
|
| 9,463 |
|
Net loss for the period |
|
| (4,013 | ) |
|
| (2,537 | ) |
|
| (45,516 | ) |
Amortization of prior service credit included in net income |
|
| 108 |
|
|
| (164 | ) |
|
| (289 | ) |
Amortization of actuarial loss included in net income |
|
| 4,206 |
|
|
| 2,703 |
|
|
| 829 |
|
Pension and postretirement plans, net of tax |
|
| 4,388 |
|
|
| 2 |
|
|
| (35,513 | ) |
Derivative instruments: |
|
|
|
|
|
|
|
|
|
|
|
|
Net change in fair value of derivatives |
|
| 5,730 |
|
|
| (4,195 | ) |
|
| (3,358 | ) |
Loss reclassified to net income |
|
| 3,399 |
|
|
| 5,413 |
|
|
| 3,366 |
|
Derivative instruments, net of tax |
|
| 9,129 |
|
|
| 1,218 |
|
|
| 8 |
|
Other comprehensive income (loss), net of tax |
|
| 13,517 |
|
|
| 1,220 |
|
|
| (35,505 | ) |
Comprehensive income |
| $ | 177,293 |
|
| $ | 190,411 |
|
| $ | 140,234 |
|
See Accompanying Notes to Consolidated Financial Statements
FLOWERS FOODS, INC. AND SUBSIDIARIES
CONSOLIDATED STATEMENTS OF CHANGES IN STOCKHOLDERS’ EQUITY
|
| Common Stock |
|
| Capital |
|
|
|
|
|
| Accumulated Other |
|
| Treasury Stock |
|
|
|
|
| ||||||||||||
|
| Number of Shares Issued |
|
| Par Value |
|
| in Excess of Par Value |
|
| Retained Earnings |
|
| Comprehensive Loss |
|
| Number of Shares |
|
| Cost |
|
| Total |
| ||||||||
|
| (Amounts in thousands, except share data) |
| |||||||||||||||||||||||||||||
Balances at December 28, 2013 |
|
| 228,729,585 |
|
| $ | 199 |
|
| $ | 593,355 |
|
| $ | 735,631 |
|
| $ | (62,515 | ) |
|
| (20,166,635 | ) |
| $ | (190,481 | ) |
| $ | 1,076,189 |
|
Net income |
|
|
|
|
|
|
|
|
|
|
|
|
|
| 175,739 |
|
|
|
|
|
|
|
|
|
|
|
|
|
|
| 175,739 |
|
Derivative instruments, net of tax |
|
|
|
|
|
|
|
|
|
|
|
|
|
|
|
|
|
| 8 |
|
|
|
|
|
|
|
|
|
|
| 8 |
|
Pension and postretirement plans, net of tax |
|
|
|
|
|
|
|
|
|
|
|
|
|
|
|
|
|
| (35,513 | ) |
|
|
|
|
|
|
|
|
|
| (35,513 | ) |
Stock repurchases |
|
|
|
|
|
|
|
|
|
|
|
|
|
|
|
|
|
|
|
|
|
| (2,014,610 | ) |
|
| (38,916 | ) |
|
| (38,916 | ) |
Exercise of stock options |
|
|
|
|
|
|
|
|
|
| 2,206 |
|
|
|
|
|
|
|
|
|
|
| 1,921,397 |
|
|
| 18,808 |
|
|
| 21,014 |
|
Issuance of deferred stock awards |
|
|
|
|
|
|
|
|
|
| (2,095 | ) |
|
|
|
|
|
|
|
|
|
| 211,850 |
|
|
| 2,095 |
|
|
| — |
|
Amortization of share-based compensation awards |
|
|
|
|
|
|
|
|
|
| 18,917 |
|
|
|
|
|
|
|
|
|
|
|
|
|
|
|
|
|
|
| 18,917 |
|
Income tax benefits related to share-based payments |
|
|
|
|
|
|
|
|
|
| 7,908 |
|
|
|
|
|
|
|
|
|
|
|
|
|
|
|
|
|
|
| 7,908 |
|
Performance-contingent restricted stock awards issued (Note 16) |
|
|
|
|
|
|
|
|
|
| (6,168 | ) |
|
|
|
|
|
|
|
|
|
| 652,719 |
|
|
| 6,168 |
|
|
| — |
|
Issuance of deferred compensation |
|
|
|
|
|
|
|
|
|
| (264 | ) |
|
|
|
|
|
|
|
|
|
| 13,007 |
|
|
| 264 |
|
|
| — |
|
Dividends paid on vested performance-contingent restricted stock and deferred share awards |
|
|
|
|
|
|
|
|
|
|
|
|
|
| (608 | ) |
|
|
|
|
|
|
|
|
|
|
|
|
|
| (608 | ) |
Dividends paid — $0.4850 per common share |
|
|
|
|
|
|
|
|
|
|
|
|
|
| (101,694 | ) |
|
|
|
|
|
|
|
|
|
|
|
|
|
| (101,694 | ) |
Balances at January 3, 2015 |
|
| 228,729,585 |
|
| $ | 199 |
|
| $ | 613,859 |
|
| $ | 809,068 |
|
| $ | (98,020 | ) |
| $ | (19,382,272 | ) |
| $ | (202,062 | ) |
| $ | 1,123,044 |
|
Net income |
|
|
|
|
|
|
|
|
|
|
|
|
|
| 189,191 |
|
|
|
|
|
|
|
|
|
|
|
|
|
|
| 189,191 |
|
Derivative instruments, net of tax |
|
|
|
|
|
|
|
|
|
|
|
|
|
|
|
|
|
| 1,218 |
|
|
|
|
|
|
|
|
|
|
| 1,218 |
|
Pension and postretirement plans, net of tax |
|
|
|
|
|
|
|
|
|
|
|
|
|
|
|
|
|
| 2 |
|
|
|
|
|
|
|
|
|
|
| 2 |
|
Shares issued for acquisition |
|
|
|
|
|
|
|
|
|
| 7,493 |
|
|
|
|
|
|
|
|
|
|
| 481,540 |
|
|
| 5,109 |
|
|
| 12,602 |
|
Stock repurchases |
|
|
|
|
|
|
|
|
|
|
|
|
|
|
|
|
|
|
|
|
|
| (318,399 | ) |
|
| (6,858 | ) |
|
| (6,858 | ) |
Exercise of stock options |
|
|
|
|
|
|
|
|
|
| 137 |
|
|
|
|
|
|
|
|
|
|
| 1,838,083 |
|
|
| 19,480 |
|
|
| 19,617 |
|
Issuance of deferred stock awards |
|
|
|
|
|
|
|
|
|
| (591 | ) |
|
|
|
|
|
|
|
|
|
| 55,713 |
|
|
| 591 |
|
|
| — |
|
Amortization of share-based compensation awards |
|
|
|
|
|
|
|
|
|
| 15,574 |
|
|
|
|
|
|
|
|
|
|
|
|
|
|
|
|
|
|
| 15,574 |
|
Income tax benefits related to share-based payments |
|
|
|
|
|
|
|
|
|
| 9,134 |
|
|
|
|
|
|
|
|
|
|
|
|
|
|
|
|
|
|
| 9,134 |
|
Performance-contingent restricted stock awards issued (Note 16) |
|
|
|
|
|
|
|
|
|
| (8,899 | ) |
|
|
|
|
|
|
|
|
|
| 853,206 |
|
|
| 8,899 |
|
|
| — |
|
Issuance of deferred compensation |
|
|
|
|
|
|
|
|
|
| (206 | ) |
|
|
|
|
|
|
|
|
|
| 8,992 |
|
|
| 206 |
|
|
| — |
|
Dividends paid on vested performance-contingent restricted stock and deferred share awards |
|
|
|
|
|
|
|
|
|
|
|
|
|
| (879 | ) |
|
|
|
|
|
|
|
|
|
|
|
|
|
| (879 | ) |
Dividends paid — $0.5675 per common share |
|
|
|
|
|
|
|
|
|
|
|
|
|
| (119,563 | ) |
|
|
|
|
|
|
|
|
|
|
|
|
|
| (119,563 | ) |
Balances at January 2, 2016 |
|
| 228,729,585 |
|
| $ | 199 |
|
| $ | 636,501 |
|
| $ | 877,817 |
|
| $ | (96,800 | ) |
|
| (16,463,137 | ) |
| $ | (174,635 | ) |
| $ | 1,243,082 |
|
Net income |
|
|
|
|
|
|
|
|
|
|
|
|
|
| 163,776 |
|
|
|
|
|
|
|
|
|
|
|
|
|
|
| 163,776 |
|
Derivative instruments, net of tax |
|
|
|
|
|
|
|
|
|
|
|
|
|
|
|
|
|
| 9,129 |
|
|
|
|
|
|
|
|
|
|
| 9,129 |
|
Pension and postretirement plans, net of tax |
|
|
|
|
|
|
|
|
|
|
|
|
|
|
|
|
|
| 4,388 |
|
|
|
|
|
|
|
|
|
|
| 4,388 |
|
Stock repurchases |
|
|
|
|
|
|
|
|
|
| (1,125 | ) |
|
|
|
|
|
|
|
|
|
| (6,892,322 | ) |
|
| (125,175 | ) |
|
| (126,300 | ) |
Exercise of stock options |
|
|
|
|
|
|
|
|
|
| (4,323 | ) |
|
|
|
|
|
|
|
|
|
| 2,506,255 |
|
|
| 31,954 |
|
|
| 27,631 |
|
Issuance of deferred stock awards |
|
|
|
|
|
|
|
|
|
| (1,411 | ) |
|
|
|
|
|
|
|
|
|
| 111,868 |
|
|
| 1,411 |
|
|
| — |
|
Amortization of share-based compensation awards |
|
|
|
|
|
|
|
|
|
| 18,772 |
|
|
|
|
|
|
|
|
|
|
|
|
|
|
|
|
|
|
| 18,772 |
|
Income tax benefits related to share-based payments |
|
|
|
|
|
|
|
|
|
| 675 |
|
|
|
|
|
|
|
|
|
|
|
|
|
|
|
|
|
|
| 675 |
|
Performance-contingent restricted stock awards issued (Note 16) |
|
|
|
|
|
|
|
|
|
| (4,519 | ) |
|
|
|
|
|
|
|
|
|
| 424,787 |
|
|
| 4,519 |
|
|
| — |
|
Issuance of deferred compensation |
|
|
|
|
|
|
|
|
|
| (114 | ) |
|
|
|
|
|
|
|
|
|
| 5,765 |
|
|
| 114 |
|
|
| — |
|
Dividends paid on vested performance-contingent restricted stock and deferred share awards |
|
|
|
|
|
|
|
|
|
|
|
|
|
| (583 | ) |
|
|
|
|
|
|
|
|
|
|
|
|
|
| (583 | ) |
Dividends paid — $.6250 per common share |
|
|
|
|
|
|
|
|
|
|
|
|
|
| (130,490 | ) |
|
|
|
|
|
|
|
|
|
|
|
|
|
| (130,490 | ) |
Balances at December 31, 2016 |
|
| 228,729,585 |
|
| $ | 199 |
|
| $ | 644,456 |
|
| $ | 910,520 |
|
| $ | (83,283 | ) |
|
| (20,306,784 | ) |
| $ | (261,812 | ) |
| $ | 1,210,080 |
|
See Accompanying Notes to Consolidated Financial Statements
FLOWERS FOODS, INC. AND SUBSIDIARIES
CONSOLIDATED STATEMENTS OF COMPREHENSIVE INCOME
|
| Fiscal 2015 |
|
| Fiscal 2014 |
|
| Fiscal 2013 |
| |||
|
| 52 weeks |
|
| 53 weeks |
|
| 52 weeks |
| |||
|
| (Amounts in thousands, except per share data) |
| |||||||||
Net income |
| $ | 189,191 |
|
| $ | 175,739 |
|
| $ | 230,894 |
|
Other comprehensive income, net of tax: |
|
|
|
|
|
|
|
|
|
|
|
|
Pension and postretirement plans: |
|
|
|
|
|
|
|
|
|
|
|
|
Prior service credit for the period |
|
| — |
|
|
| — |
|
|
| 682 |
|
Settlement loss |
|
| — |
|
|
| 9,463 |
|
|
| — |
|
Net (loss) gain for the period |
|
| (2,537 | ) |
|
| (45,516 | ) |
|
| 55,637 |
|
Amortization of prior service credit included in net income |
|
| (164 | ) |
|
| (289 | ) |
|
| (158 | ) |
Amortization of actuarial loss included in net income |
|
| 2,703 |
|
|
| 829 |
|
|
| 3,307 |
|
Pension and postretirement plans, net of tax |
|
| 2 |
|
|
| (35,513 | ) |
|
| 59,468 |
|
Derivative instruments: |
|
|
|
|
|
|
|
|
|
|
|
|
Net change in fair value of derivatives |
|
| (4,195 | ) |
|
| (3,358 | ) |
|
| (24,457 | ) |
Loss reclassified to net income |
|
| 5,413 |
|
|
| 3,366 |
|
|
| 17,141 |
|
Derivative instruments, net of tax |
|
| 1,218 |
|
|
| 8 |
|
|
| (7,316 | ) |
Other comprehensive income (loss), net of tax |
|
| 1,220 |
|
|
| (35,505 | ) |
|
| 52,152 |
|
Comprehensive income |
| $ | 190,411 |
|
| $ | 140,234 |
|
| $ | 283,046 |
|
See Accompanying Notes to Consolidated Financial Statements
FLOWERS FOODS, INC. AND SUBSIDIARIES
CONSOLIDATED STATEMENTS OF CHANGES IN STOCKHOLDERS’ EQUITY
|
| Common Stock |
|
| Capital |
|
|
|
|
|
| Accumulated Other |
|
| Treasury Stock |
|
|
|
|
| ||||||||||||
|
| Number of Shares Issued |
|
| Par Value |
|
| in Excess of Par Value |
|
| Retained Earnings |
|
| Comprehensive Loss |
|
| Number of Shares |
|
| Cost |
|
| Total |
| ||||||||
|
| (Amounts in thousands, except share data) |
| |||||||||||||||||||||||||||||
Balances at December 29, 2012 |
|
| 152,488,008 |
|
| $ | 199 |
|
| $ | 571,924 |
|
| $ | 597,629 |
|
| $ | (114,667 | ) |
|
| (14,214,819 | ) |
| $ | (196,465 | ) |
| $ | 858,620 |
|
Net income |
|
|
|
|
|
|
|
|
|
|
|
|
|
| 230,894 |
|
|
|
|
|
|
|
|
|
|
|
|
|
|
| 230,894 |
|
Derivative instruments, net of tax |
|
|
|
|
|
|
|
|
|
|
|
|
|
|
|
|
|
| (7,316 | ) |
|
|
|
|
|
|
|
|
|
| (7,316 | ) |
Pension and postretirement plans, net of tax |
|
|
|
|
|
|
|
|
|
|
|
|
|
|
|
|
|
| 59,468 |
|
|
|
|
|
|
|
|
|
|
| 59,468 |
|
Adjustment for 3 for 2 stock split |
|
| 76,241,577 |
|
|
|
|
|
|
|
|
|
|
| (52 | ) |
|
|
|
|
|
| (6,860,135 | ) |
|
|
|
|
|
| (52 | ) |
Stock repurchases |
|
|
|
|
|
|
|
|
|
|
|
|
|
|
|
|
|
|
|
|
|
| (367,623 | ) |
|
| (8,819 | ) |
|
| (8,819 | ) |
Exercise of stock options |
|
|
|
|
|
|
|
|
|
| 508 |
|
|
|
|
|
|
|
|
|
|
| 1,158,590 |
|
|
| 13,177 |
|
|
| 13,685 |
|
Issuance of deferred stock awards |
|
|
|
|
|
|
|
|
|
| (752 | ) |
|
|
|
|
|
|
|
|
|
| 54,120 |
|
|
| 752 |
|
|
| — |
|
Amortization of share-based compensation awards |
|
|
|
|
|
|
|
|
|
| 14,725 |
|
|
|
|
|
|
|
|
|
|
|
|
|
|
|
|
|
|
| 14,725 |
|
Income tax benefits related to share-based payments |
|
|
|
|
|
|
|
|
|
| 7,824 |
|
|
|
|
|
|
|
|
|
|
|
|
|
|
|
|
|
|
| 7,824 |
|
Performance-contingent restricted stock awards supplemental grant for exceeding TSR (Note 16) |
|
|
|
|
|
|
|
|
|
| (874 | ) |
|
|
|
|
|
|
|
|
|
| 63,232 |
|
|
| 874 |
|
|
| — |
|
Dividends paid on vested performance-contingent restricted stock and deferred share awards |
|
|
|
|
|
|
|
|
|
|
|
|
|
| (386 | ) |
|
|
|
|
|
|
|
|
|
|
|
|
|
| (386 | ) |
Dividends paid — $0.4440 per common share |
|
|
|
|
|
|
|
|
|
|
|
|
|
| (92,454 | ) |
|
|
|
|
|
|
|
|
|
|
|
|
|
| (92,454 | ) |
Balances at December 28, 2013 |
|
| 228,729,585 |
|
| $ | 199 |
|
| $ | 593,355 |
|
| $ | 735,631 |
|
| $ | (62,515 | ) |
|
| (20,166,635 | ) |
| $ | (190,481 | ) |
| $ | 1,076,189 |
|
Net income |
|
|
|
|
|
|
|
|
|
|
|
|
|
| 175,739 |
|
|
|
|
|
|
|
|
|
|
|
|
|
|
| 175,739 |
|
Derivative instruments, net of tax |
|
|
|
|
|
|
|
|
|
|
|
|
|
|
|
|
|
| 8 |
|
|
|
|
|
|
|
|
|
|
| 8 |
|
Pension and postretirement plans, net of tax |
|
|
|
|
|
|
|
|
|
|
|
|
|
|
|
|
|
| (35,513 | ) |
|
|
|
|
|
|
|
|
|
| (35,513 | ) |
Stock repurchases |
|
|
|
|
|
|
|
|
|
|
|
|
|
|
|
|
|
|
|
|
|
| (2,014,610 | ) |
|
| (38,916 | ) |
|
| (38,916 | ) |
Exercise of stock options |
|
|
|
|
|
|
|
|
|
| 2,206 |
|
|
|
|
|
|
|
|
|
|
| 1,921,397 |
|
|
| 18,808 |
|
|
| 21,014 |
|
Issuance of deferred stock awards |
|
|
|
|
|
|
|
|
|
| (2,095 | ) |
|
|
|
|
|
|
|
|
|
| 211,850 |
|
|
| 2,095 |
|
|
| — |
|
Amortization of share-based compensation awards |
|
|
|
|
|
|
|
|
|
| 18,917 |
|
|
|
|
|
|
|
|
|
|
|
|
|
|
|
|
|
|
| 18,917 |
|
Income tax benefits related to share-based payments |
|
|
|
|
|
|
|
|
|
| 7,908 |
|
|
|
|
|
|
|
|
|
|
|
|
|
|
|
|
|
|
| 7,908 |
|
Performance-contingent restricted stock awards issued (Note 16) |
|
|
|
|
|
|
|
|
|
| (6,168 | ) |
|
|
|
|
|
|
|
|
|
| 652,719 |
|
|
| 6,168 |
|
|
| — |
|
Issuance of deferred compensation |
|
|
|
|
|
|
|
|
|
| (264 | ) |
|
|
|
|
|
|
|
|
|
| 13,007 |
|
|
| 264 |
|
|
| — |
|
Dividends paid on vested performance-contingent restricted stock and deferred share awards |
|
|
|
|
|
|
|
|
|
|
|
|
|
| (608 | ) |
|
|
|
|
|
|
|
|
|
|
|
|
|
| (608 | ) |
Dividends paid — $0.4850 per common share |
|
|
|
|
|
|
|
|
|
|
|
|
|
| (101,694 | ) |
|
|
|
|
|
|
|
|
|
|
|
|
|
| (101,694 | ) |
Balances at January 3, 2015 |
|
| 228,729,585 |
|
| $ | 199 |
|
| $ | 613,859 |
|
| $ | 809,068 |
|
| $ | (98,020 | ) |
|
| (19,382,272 | ) |
| $ | (202,062 | ) |
| $ | 1,123,044 |
|
Net income |
|
|
|
|
|
|
|
|
|
|
|
|
|
| 189,191 |
|
|
|
|
|
|
|
|
|
|
|
|
|
|
| 189,191 |
|
Derivative instruments, net of tax |
|
|
|
|
|
|
|
|
|
|
|
|
|
|
|
|
|
| 1,218 |
|
|
|
|
|
|
|
|
|
|
| 1,218 |
|
Pension and postretirement plans, net of tax |
|
|
|
|
|
|
|
|
|
|
|
|
|
|
|
|
|
| 2 |
|
|
|
|
|
|
|
|
|
|
| 2 |
|
Shares issued for acquisition |
|
|
|
|
|
|
|
|
|
| 7,493 |
|
|
|
|
|
|
|
|
|
|
| 481,540 |
|
|
| 5,109 |
|
|
| 12,602 |
|
Stock repurchases |
|
|
|
|
|
|
|
|
|
|
|
|
|
|
|
|
|
|
|
|
|
| (318,399 | ) |
|
| (6,858 | ) |
|
| (6,858 | ) |
Exercise of stock options |
|
|
|
|
|
|
|
|
|
| 137 |
|
|
|
|
|
|
|
|
|
|
| 1,838,083 |
|
|
| 19,480 |
|
|
| 19,617 |
|
Issuance of deferred stock awards |
|
|
|
|
|
|
|
|
|
| (591 | ) |
|
|
|
|
|
|
|
|
|
| 55,713 |
|
|
| 591 |
|
|
| — |
|
Amortization of share-based compensation awards |
|
|
|
|
|
|
|
|
|
| 15,574 |
|
|
|
|
|
|
|
|
|
|
|
|
|
|
|
|
|
|
| 15,574 |
|
Income tax benefits related to share-based payments |
|
|
|
|
|
|
|
|
|
| 9,134 |
|
|
|
|
|
|
|
|
|
|
|
|
|
|
|
|
|
|
| 9,134 |
|
Performance-contingent restricted stock awards issued (Note 16) |
|
|
|
|
|
|
|
|
|
| (8,899 | ) |
|
|
|
|
|
|
|
|
|
| 853,206 |
|
|
| 8,899 |
|
|
| — |
|
Issuance of deferred compensation |
|
|
|
|
|
|
|
|
|
| (206 | ) |
|
|
|
|
|
|
|
|
|
| 8,992 |
|
|
| 206 |
|
|
| — |
|
Dividends paid on vested performance-contingent restricted stock and deferred share awards |
|
|
|
|
|
|
|
|
|
|
|
|
|
| (879 | ) |
|
|
|
|
|
|
|
|
|
|
|
|
|
| (879 | ) |
Dividends paid — $0.5675 per common share |
|
|
|
|
|
|
|
|
|
|
|
|
|
| (119,563 | ) |
|
|
|
|
|
|
|
|
|
|
|
|
|
| (119,563 | ) |
Balances at January 2, 2016 |
|
| 228,729,585 |
|
| $ | 199 |
|
| $ | 636,501 |
|
| $ | 877,817 |
|
| $ | (96,800 | ) |
|
| (16,463,137 | ) |
| $ | (174,635 | ) |
| $ | 1,243,082 |
|
See Accompanying Notes to Consolidated Financial Statements
FLOWERS FOODS, INC. AND SUBSIDIARIES
CONSOLIDATED STATEMENTS OF CASH FLOWS
|
| Fiscal 2015 |
|
| Fiscal 2014 |
|
| Fiscal 2013 |
|
| Fiscal 2016 |
|
| Fiscal 2015 |
|
| Fiscal 2014 |
| ||||||
|
| 52 weeks |
|
| 53 weeks |
|
| 52 weeks |
|
| 52 weeks |
|
| 52 weeks |
|
| 53 weeks |
| ||||||
|
| (Amounts in thousands) |
|
| (Amounts in thousands) |
| ||||||||||||||||||
Cash flows provided by (disbursed for) operating activities: |
|
|
|
|
|
|
|
|
|
|
|
|
|
|
|
|
|
|
|
|
|
|
|
|
Net income |
| $ | 189,191 |
|
| $ | 175,739 |
|
| $ | 230,894 |
|
| $ | 163,776 |
|
| $ | 189,191 |
|
| $ | 175,739 |
|
Adjustments to reconcile net income to net cash provided by operating activities: |
|
|
|
|
|
|
|
|
|
|
|
|
|
|
|
|
|
|
|
|
|
|
|
|
Gain on acquisition |
|
| — |
|
|
| — |
|
|
| (50,071 | ) | ||||||||||||
Depreciation and amortization |
|
| 132,175 |
|
|
| 128,961 |
|
|
| 118,491 |
|
|
| 140,869 |
|
|
| 132,175 |
|
|
| 128,961 |
|
Impairment of assets |
|
| 3,771 |
|
|
| 10,308 |
|
|
| — |
|
|
| 24,877 |
|
|
| 3,771 |
|
|
| 10,308 |
|
Stock-based compensation |
|
| 15,692 |
|
|
| 18,662 |
|
|
| 15,943 |
|
|
| 18,761 |
|
|
| 15,692 |
|
|
| 18,662 |
|
Loss reclassified from accumulated other comprehensive income to net income |
|
| 8,551 |
|
|
| 5,218 |
|
|
| 27,055 |
|
|
| 5,307 |
|
|
| 8,551 |
|
|
| 5,218 |
|
Deferred income taxes |
|
| 18,293 |
|
|
| 9,241 |
|
|
| 6,485 |
|
|
| (14,457 | ) |
|
| 18,293 |
|
|
| 9,241 |
|
Provision for inventory obsolescence |
|
| 776 |
|
|
| 1,074 |
|
|
| 1,210 |
|
|
| 1,324 |
|
|
| 776 |
|
|
| 1,074 |
|
Allowances for accounts receivable |
|
| 2,395 |
|
|
| 4,956 |
|
|
| 4,110 |
|
|
| 3,365 |
|
|
| 2,395 |
|
|
| 4,956 |
|
Pension and postretirement plans (benefit) expense |
|
| (5,878 | ) |
|
| 5,341 |
|
|
| (2,041 | ) |
|
| 2,238 |
|
|
| (5,878 | ) |
|
| 5,341 |
|
Other |
|
| (3,425 | ) |
|
| (6,215 | ) |
|
| (5,701 | ) |
|
| (3,957 | ) |
|
| (3,425 | ) |
|
| (6,215 | ) |
Qualified pension plan contributions |
|
| (10,000 | ) |
|
| (12,999 | ) |
|
| (14,818 | ) |
|
| (1,000 | ) |
|
| (10,000 | ) |
|
| (12,999 | ) |
Changes in operating assets and liabilities, net of acquisitions and disposals: |
|
|
|
|
|
|
|
|
|
|
|
|
|
|
|
|
|
|
|
|
|
|
|
|
Accounts and notes receivable, net |
|
| (16,873 | ) |
|
| 7,181 |
|
|
| 1,114 |
|
|
| (7,888 | ) |
|
| (16,873 | ) |
|
| 7,181 |
|
Inventories, net |
|
| (9,717 | ) |
|
| 6,977 |
|
|
| (10,708 | ) |
|
| (1,526 | ) |
|
| (9,717 | ) |
|
| 6,977 |
|
Hedging activities, net |
|
| (12,818 | ) |
|
| 22 |
|
|
| (39,325 | ) |
|
| 13,592 |
|
|
| (12,818 | ) |
|
| 22 |
|
Other assets |
|
| (7,133 | ) |
|
| (23,993 | ) |
|
| (22,151 | ) |
|
| (11,107 | ) |
|
| (12,899 | ) |
|
| (11,337 | ) |
Accounts payable |
|
| 14,563 |
|
|
| (9,951 | ) |
|
| (702 | ) |
|
| (519 | ) |
|
| 14,563 |
|
|
| (9,951 | ) |
Other accrued liabilities |
|
| 4,670 |
|
|
| (6,552 | ) |
|
| 10,699 |
|
|
| 12,389 |
|
|
| 4,504 |
|
|
| (17,995 | ) |
Net cash provided by operating activities |
|
| 324,233 |
|
|
| 313,970 |
|
|
| 270,484 |
|
|
| 346,044 |
|
|
| 318,301 |
|
|
| 315,183 |
|
Cash flows provided by (disbursed for) investing activities: |
|
|
|
|
|
|
|
|
|
|
|
|
|
|
|
|
|
|
|
|
|
|
|
|
Purchase of property, plant and equipment |
|
| (90,773 | ) |
|
| (83,778 | ) |
|
| (99,181 | ) | ||||||||||||
Purchases of property, plant and equipment |
|
| (101,727 | ) |
|
| (90,773 | ) |
|
| (83,778 | ) | ||||||||||||
Repurchase of independent distributor territories |
|
| (21,866 | ) |
|
| (17,056 | ) |
|
| (26,418 | ) |
|
| (10,350 | ) |
|
| (13,768 | ) |
|
| (16,198 | ) |
Principal payments from notes receivable |
|
| 26,028 |
|
|
| 23,718 |
|
|
| 21,596 |
|
|
| 22,272 |
|
|
| 23,023 |
|
|
| 21,103 |
|
Acquisition of businesses, net of cash acquired |
|
| (390,221 | ) |
|
| — |
|
|
| (415,813 | ) |
|
| — |
|
|
| (390,221 | ) |
|
| — |
|
Contingently refundable consideration |
|
| — |
|
|
| 7,500 |
|
|
| — |
|
|
| — |
|
|
| — |
|
|
| 7,500 |
|
Proceeds from sale of new distribution territories |
|
| — |
|
|
| — |
|
|
| 13,965 |
| ||||||||||||
Proceeds from sale of property, plant and equipment |
|
| 14,324 |
|
|
| 36,303 |
|
|
| 2,966 |
| ||||||||||||
Proceeds from sales of property, plant and equipment |
|
| 17,667 |
|
|
| 14,324 |
|
|
| 36,303 |
| ||||||||||||
Acquisition of intangible assets |
|
| (5,000 | ) |
|
| — |
|
|
| — |
|
|
| — |
|
|
| (5,000 | ) |
|
| — |
|
Other investing activities |
|
| 2,091 |
|
|
| 839 |
|
|
| 544 |
| ||||||||||||
Net cash disbursed for investing activities |
|
| (467,508 | ) |
|
| (33,313 | ) |
|
| (502,885 | ) |
|
| (70,047 | ) |
|
| (461,576 | ) |
|
| (34,526 | ) |
Cash flows provided by (disbursed for) financing activities: |
|
|
|
|
|
|
|
|
|
|
|
|
|
|
|
|
|
|
|
|
|
|
|
|
Dividends paid, including dividends on share-based payment awards |
|
| (120,442 | ) |
|
| (102,302 | ) |
|
| (92,840 | ) |
|
| (131,073 | ) |
|
| (120,442 | ) |
|
| (102,302 | ) |
Exercise of stock options |
|
| 19,617 |
|
|
| 21,014 |
|
|
| 13,685 |
|
|
| 27,631 |
|
|
| 19,617 |
|
|
| 21,014 |
|
Excess windfall tax benefit related to share-based payment awards |
|
| 9,134 |
|
|
| 7,879 |
|
|
| 7,781 |
|
|
| 3,851 |
|
|
| 9,134 |
|
|
| 7,879 |
|
Payments for debt issuance costs |
|
| (646 | ) |
|
| (773 | ) |
|
| (2,456 | ) |
|
| (4,380 | ) |
|
| (646 | ) |
|
| (773 | ) |
Stock repurchases |
|
| (6,858 | ) |
|
| (38,916 | ) |
|
| (8,819 | ) |
|
| (126,300 | ) |
|
| (6,858 | ) |
|
| (38,916 | ) |
Change in bank overdrafts |
|
| 2,325 |
|
|
| (679 | ) |
|
| (499 | ) |
|
| 1,914 |
|
|
| 2,325 |
|
|
| (679 | ) |
Proceeds from debt borrowings |
|
| 1,064,600 |
|
|
| 1,175,200 |
|
|
| 2,169,950 |
|
|
| 2,090,492 |
|
|
| 1,064,600 |
|
|
| 1,175,200 |
|
Debt and capital lease obligation payments |
|
| (817,600 | ) |
|
| (1,343,087 | ) |
|
| (1,859,094 | ) |
|
| (2,146,100 | ) |
|
| (817,600 | ) |
|
| (1,343,087 | ) |
Other |
|
| — |
|
|
| — |
|
|
| (52 | ) | ||||||||||||
Net cash provided by (disbursed for) financing activities |
|
| 150,130 |
|
|
| (281,664 | ) |
|
| 227,656 |
| ||||||||||||
Net increase (decrease) in cash and cash equivalents |
|
| 6,855 |
|
|
| (1,007 | ) |
|
| (4,745 | ) | ||||||||||||
Net cash (disbursed for) provided by financing activities |
|
| (283,965 | ) |
|
| 150,130 |
|
|
| (281,664 | ) | ||||||||||||
Net (decrease) increase in cash and cash equivalents |
|
| (7,968 | ) |
|
| 6,855 |
|
|
| (1,007 | ) | ||||||||||||
Cash and cash equivalents at beginning of period |
|
| 7,523 |
|
|
| 8,530 |
|
|
| 13,275 |
|
|
| 14,378 |
|
|
| 7,523 |
|
|
| 8,530 |
|
Cash and cash equivalents at end of period |
| $ | 14,378 |
|
| $ | 7,523 |
|
| $ | 8,530 |
|
| $ | 6,410 |
|
| $ | 14,378 |
|
| $ | 7,523 |
|
Schedule of non cash investing and financing activities: |
|
|
|
|
|
|
|
|
|
|
|
|
|
|
|
|
|
|
|
|
|
|
|
|
Issuance of executive deferred compensation plan common stock |
| $ | 206 |
|
| $ | 264 |
|
| $ | — |
|
| $ | 114 |
|
| $ | 206 |
|
| $ | 264 |
|
Capital and right-to-use lease obligations |
| $ | 2,298 |
|
| $ | 12,399 |
|
| $ | 8,971 |
|
| $ | 15,622 |
|
| $ | 2,298 |
|
| $ | 12,399 |
|
Issuance of notes receivable on new distribution territories |
| $ | 18,744 |
|
| $ | 44,346 |
|
| $ | 22,611 |
| ||||||||||||
Issuance of notes receivable on new distribution territories, net |
| $ | 23,352 |
|
| $ | 15,739 |
|
| $ | 41,731 |
| ||||||||||||
Distributor routes sold with deferred gains, net |
| $ | 5,213 |
|
| $ | 166 |
|
| $ | 11,443 |
| ||||||||||||
Shares issued for the Alpine acquisition |
| $ | 12,602 |
|
| $ | — |
|
| $ | — |
|
| $ | — |
|
| $ | 12,602 |
|
| $ | — |
|
Increase in property, plant and equipment from financing |
| $ | 4,855 |
|
| $ | — |
|
| $ | — |
| ||||||||||||
Purchase of property, plant and equipment included in accounts payable |
| $ | 3,637 |
|
| $ | 1,094 |
|
| $ | 435 |
|
| $ | 5,203 |
|
| $ | 3,637 |
|
| $ | 1,094 |
|
Supplemental disclosures of cash flow information: |
|
|
|
|
|
|
|
|
|
|
|
|
|
|
|
|
|
|
|
|
|
|
|
|
Cash paid during the period for: |
|
|
|
|
|
|
|
|
|
|
|
|
|
|
|
|
|
|
|
|
|
|
|
|
Interest |
| $ | 24,112 |
|
| $ | 26,065 |
|
| $ | 25,996 |
|
| $ | 26,897 |
|
| $ | 24,112 |
|
| $ | 26,065 |
|
Income taxes paid, net of refunds of $7,587, $4,240 and $323, respectively |
| $ | 80,062 |
|
| $ | 78,587 |
|
| $ | 83,525 |
| ||||||||||||
Income taxes paid, net of refunds of $12,212, $7,587 and $4,240, respectively |
| $ | 84,108 |
|
| $ | 80,062 |
|
| $ | 78,587 |
| ||||||||||||
See Accompanying Notes to Consolidated Financial Statements
FLOWERS FOODS, INC. AND SUBSIDIARIES
NOTES TO CONSOLIDATED FINANCIAL STATEMENTS
Note 1. | Basis of Presentation |
General. Flowers Foods, Inc. (the(references to “we”, “our”, “us”, the “company”, “Flowers”, or “Flowers Foods”) is one of the largest producers and marketers of bakery products in the United States. The company consists of two business segments: direct-store-delivery (“DSD Segment”) and warehouse delivery (“Warehouse Segment”). The DSD Segment focuses on the production and marketing of bakery products throughout the Southeast, Mid-Atlantic, New England,East, South, Southwest, California, and select markets in Nevada, the Midwest, Pacific Northwest, Nevada, and the Pacific Northwest.Colorado. The Warehouse Segment produces snack cakes, breads and rolls that are shipped both fresh and frozen to national retail, foodservice, vending, and co-pack customers through their warehouse channels.
Note 2. | Summary of Significant Accounting Policies |
Basis of Consolidation. The Consolidated Financial Statements include the accounts of the company and its wholly-owned subsidiaries. Intercompany transactions and balances are eliminated in consolidation.
Variable Interest EntitiesUse of Estimates. The incorporated independent distributors (“IDs”) qualify as variable interest entities (“VIEs”). The company typically finances the ID and also enters into a contractpreparation of financial statements in conformity with the ID to supply product at a discount for distributionaccounting principles generally accepted in the ID’s territory. The combinationUnited States of America requires management to make estimates and assumptions that affect the reported amounts of assets and liabilities and disclosure of contingent assets and liabilities at the date of the company’s loans to the IDsfinancial statements and the ongoing supply arrangements withreported amounts of revenues and expenses during the IDs provides a level of protection to the equity owners of the various IDs that would not otherwise be available. However, the company is not considered to be the primary beneficiary of the VIEs because the company does not (i) have the ability to direct the majority of the significant activities of the VIEs that would affect their ability to operate their respective distributor territories or (ii) provide any implicit or explicit guarantees or other financial support to the VIEs, other than the financing described above, for specific return or performance benchmarks. The activities controlled by the IDs that are deemed to most significantly impact the ultimate success of the ID entities relate toreporting period. Actual results could differ from those decisions inherent in operating the distribution business in the territory, including acquiring truck and trailers, managing fuel costs, employee matters and other strategic decisions. estimates.
The company also maintains a transportation agreement with an entity that transports a significant portion of the company’s fresh bakery products from the company’s production facilities to outlying distribution centers. The company represents a significant portion of the entity’s revenue. This entity qualifies as a VIE, but the company has determined it is not the primary beneficiary of the VIE. See Note 13, Variable Interest Entities, for additional disclosure of this VIE entity.
Fiscal Year End. The company operates on a 52-53 week fiscal year ending the Saturday nearest December 31. Fiscal 20152016 and fiscal 2013Fiscal 2015 consisted of 52 weeks. Fiscal 2014 consisted of 53 weeks. Fiscal 20162017 will consist of 52 weeks.
Revenue Recognition. The company recognizes revenue from the sale of product at the time of delivery when title and risk of loss pass to the customer. The company records both direct and estimated reductions to gross revenue for customer programs and incentive offerings at the time the incentive is offered or at the time of revenue recognition for the underlying transaction that results in progress by the customer towards earning the incentive. These allowances include price promotion discounts, coupons, customer rebates, cooperative advertising, and product returns. Price promotion discount expense is recorded as a reduction to gross sales when the discounted product is sold to the customer. See Note 3, Financial Statement Revisions, for documentation of the revisions associated with the revenues reported in prior periods.
The consumer packaged goods industry has used scan-basedScan-based trading technology over many years to share information between the supplier and retailer. An extension of this technology allows the retailer to take ownership of our goods when the consumer purchases the goods rather than at the time they are delivered to the retailer. Consequently, revenue on these sales is not recognized until the product is purchased by the consumer. This technology is referred to as pay-by-scan (“PBS”). In fiscal years 2016, 2015, 2014, and 2013,2014, the company recorded $1.2$1.3 billion, $1.2 billion, and $1.1$1.2 billion, respectively, in sales through PBS.
Revenue on PBS sales is recognized when the product is purchased by the end consumer because that is when title and risk of loss is transferred. Non-PBS sales are recognized when the product is delivered to the customer since that is when title and risk of loss is transferred.
The company’s production facilities have ourdeliver products delivered to independent distributors, who sell and deliver ourthose products to outlets of retail accounts that are within the independent distributors’ defined geographic territory. PBS is utilized primarily in certain national and regional retail accounts (“PBS Outlet”). Generally, no revenue is recognized by the company upon delivery of our
products by the company to the independent distributor or upon delivery of our products by the independent distributor to a PBS Outlet. It is recognized when our products are purchased by the end consumer. Product inventory in the PBS Outlet is reflected as inventory on the company’s balance sheet. The balance of PBS inventory at December 31, 2016 and January 2, 2016 and January 3, 2015 was $6.2$7.6 million and $6.1$6.2 million, respectively.
The independent distributor performs a physical inventory of products at each PBS Outlet weekly and reports the results to the company. The inventory data submitted by the independent distributor for each PBS Outlet is compared with the product delivery data. Product delivered to a PBS Outlet that is not recorded in the inventory data has been purchased by the consumer/customer of the PBS Outlet and is recorded as sales revenue by the company.
TheThough under no obligation to do so, the company repurchases distribution rights from and sells distribution rights to independent distributors from time to time. At the time the company purchases a distribution rightrights from an independent distributor, the fair value purchase price of the distribution right is recorded as “Assets Held for Sale”. Upon the sale of the distribution rights to a new independent distributor, generallythe new distributor franchisee/owner may choose how he/she desires to finance the purchase of the
business. If the new distributor chooses to use optional financing via a company-related entity, a note receivable of up to ten years is recorded for the sales price of the distribution right (for those situations when the company provides direct financing to the independent distributor)financed amount with a corresponding credit to assets held for sale to relieve the carrying amount of the territory. Any difference between the amountselling price of the note receivable (i.e., the sales price)business and the distribution rights’ carrying value, if any, is recorded as a gain or a loss in selling, distribution and administrative expenses because the company considers the independent distributor activity a cost of distribution. Since the independent distributor has the right to require the company to repurchase the distribution rights at the original purchase price within the first six-month period following the date of sale, noThis gain is recorded on the sale of the distribution rights until after the six-month period is completed and a liability is established (except that gains of $5,000 or less are recognized immediately upon the sale). The company is not required to repay interest paid by the distributor during such six-month period. Upon expiration of the six-month period, the amount of the deferred gain is recorded into income over the remaining term of the note.outstanding notes receivable as payments are received from the independent distributor. In instances where a distribution right is sold for less than its carrying value, a loss is recorded at the date of sale and any impairment of a distribution right held for sale is recorded at such time when the impairment occurs. The deferred gains were $28.3 million and $26.2 million at December 31, 2016 and $30.1 million at January 2, 2016, and January 3, 2015, respectively, and are recorded in other short and long-term liabilities on the Consolidated Balance Sheet. The company recorded net gains of $3.1 million during fiscal 2016, $4.1 million during fiscal 2015, and $3.8 million during fiscal 2014 and $5.5 million during fiscal 2013 related to the sale of distribution rights as a component of selling, distribution and administrative expenses.
Cash and Cash Equivalents. The company considers deposits in banks, certificates of deposits, and short-term investments with original maturities of three months or less as cash and cash equivalents.
Accounts and Notes Receivable. Accounts receivable consists of trade receivables, current portions of distributor notes receivable, and miscellaneous receivables. The company maintains allowances for doubtful accounts for estimated losses resulting from the inability of its customers to make required payments for trade receivables, distributor notes receivable, and miscellaneous receivables. Bad debts are charged to this reserve after all attempts to collect the balance are exhausted. If the financial condition of the company’s customers were to deteriorate, resulting in an impairment of their ability to make payments, additional allowances may be required. In determining past due or delinquent status of a customer, the aged trial balance is reviewed on a weekly basis by sales management and generally any accounts older than seven weeks are considered delinquent. Activity in the allowance for doubtful accounts is as follows (amounts in thousands):
|
| Beginning Balance |
|
| Charged to Expense |
|
| Write-Offs and Other |
|
| Ending Balance |
|
| Beginning Balance |
|
| Charged to Expense |
|
| Write-Offs and Other |
|
| Ending Balance |
| ||||||||
Fiscal 2016 |
| $ | 1,341 |
|
| $ | 3,365 |
|
| $ | 3,003 |
|
| $ | 1,703 |
| ||||||||||||||||
Fiscal 2015 |
| $ | 2,723 |
|
| $ | 2,395 |
|
| $ | 3,777 |
|
| $ | 1,341 |
|
| $ | 2,723 |
|
| $ | 2,395 |
|
| $ | 3,777 |
|
| $ | 1,341 |
|
Fiscal 2014 |
| $ | 1,598 |
|
| $ | 4,956 |
|
| $ | 3,831 |
|
| $ | 2,723 |
|
| $ | 1,598 |
|
| $ | 4,956 |
|
| $ | 3,831 |
|
| $ | 2,723 |
|
Fiscal 2013 |
| $ | 386 |
|
| $ | 4,110 |
|
| $ | 2,898 |
|
| $ | 1,598 |
| ||||||||||||||||
The amounts charged to expense for bad debts in the table above are reported as adjustments to reconcile net income to net cash provided by operating activities in the Consolidated Statements of Cash Flows. The write-offs and other column represents the amounts that are actually used to reduce the gross accounts and notes receivable at the time the balance due from the customer is written-off. The lower endingWalmart/Sam’s Club is our only customer with a balance in fiscal 2015 is attributable to bad debt expense recorded in fiscal 2014 that did not re-occur in fiscal 2015greater than 10% of outstanding trade receivables. Their percentage of trade receivables was 18.8% and was primarily from one non-trade customer.18.9%, on a consolidated basis, as of December 31, 2016 and January 2, 2016, respectively. No other customer accounted for greater than 10% of the company’s outstanding receivables.
Concentration of Credit Risk. The company performs periodic credit evaluations and grants credit to customers, who are primarily in the grocery and foodservice markets, and generally does not require collateral. Our top 10 customers in fiscal years 2016, 2015 2014 and 20132014 accounted for 43.5%46.8%, 43.9%43.5% and 44.7%43.9% of sales, respectively. Our largest customer, Walmart/Sam’s Club, weighted percent of sales for fiscal years 2016, 2015 2014 and 20132014 was as follows:
|
| Percent of Sales |
|
| Percent of Sales |
| ||||||||||||||||||
|
| DSD Segment |
|
| Warehouse Segment |
|
| Total |
|
| DSD Segment |
|
| Warehouse Segment |
|
| Total |
| ||||||
Fiscal 2016 |
|
| 17.0 | % |
|
| 2.6 | % |
|
| 19.6 | % | ||||||||||||
Fiscal 2015 |
|
| 16.7 | % |
|
| 2.6 | % |
|
| 19.3 | % |
|
| 16.7 | % |
|
| 2.6 | % |
|
| 19.3 | % |
Fiscal 2014 |
|
| 16.8 | % |
|
| 2.6 | % |
|
| 19.4 | % |
|
| 16.8 | % |
|
| 2.6 | % |
|
| 19.4 | % |
Fiscal 2013 |
|
| 17.1 | % |
|
| 3.1 | % |
|
| 20.2 | % | ||||||||||||
Inventories. Inventories at January 2,December 31, 2016 and January 3, 20152, 2016 are valued at lower of cost or market. Costs for raw materials and packaging are recorded at moving average cost. Finished goods inventories are at average costs.
The company will write down inventory to market for estimated unmarketable inventory equal to the difference between the cost of inventory and the estimated market value for situations when the inventory is impaired by damage, deterioration, or obsolescence.
Activity in the inventory reserve allowance is as follows (amounts in thousands):
|
| Beginning Balance |
|
| Charged to Expense |
|
| Write-Offs and Other |
|
| Ending Balance |
|
| Beginning Balance |
|
| Charged to Expense |
|
| Write-Offs and Other |
|
| Ending Balance |
| ||||||||
Fiscal 2016 |
| $ | 238 |
|
| $ | 1,324 |
|
| $ | 472 |
|
| $ | 1,090 |
| ||||||||||||||||
Fiscal 2015 |
| $ | 159 |
|
| $ | 776 |
|
| $ | 697 |
|
| $ | 238 |
|
| $ | 159 |
|
| $ | 776 |
|
| $ | 697 |
|
| $ | 238 |
|
Fiscal 2014 |
| $ | 93 |
|
| $ | 1,074 |
|
| $ | 1,008 |
|
| $ | 159 |
|
| $ | 93 |
|
| $ | 1,074 |
|
| $ | 1,008 |
|
| $ | 159 |
|
Fiscal 2013 |
| $ | 38 |
|
| $ | 1,210 |
|
| $ | 1,155 |
|
| $ | 93 |
| ||||||||||||||||
The amounts charged to expense for inventory loss in the table above are reported as adjustments to reconcile net income to net cash provided by operating activities in the Consolidated Statements of Cash Flows. The write-offs and other column represents the amounts that are actually used to reduce gross inventories.
Shipping Costs. Shipping costs are included in the selling, distribution and administrative line item of the Consolidated Statements of Income. For fiscal years 2016, 2015, 2014, and 2013,2014, shipping costs were $855.1 million, $852.3 million, $847.6 million, and $797.4$847.6 million, respectively, including the costs paid to independent distributors for selling and delivering our products.distributors.
Spare Parts and Supplies. The company maintains inventories of spare parts and supplies, which are used for repairs and maintenance of its machinery and equipment. These spare parts and supplies allow the company to react quickly in the event of a mechanical breakdown. These parts are valued using the moving average method and are expensed as the part is used. Periodic physical inventories of the parts are performed, and the value of the parts is adjusted for any obsolescence or difference from the physical inventory count.
Property, Plant and Equipment and Depreciation. Property, plant and equipment is stated at cost. Depreciation expense is computed using the straight-line method based on the estimated useful lives of the depreciable assets. Certain equipment held under capital leases of $44.2 million and $29.9 million at December 31, 2016 and $28.9 million at January 2, 2016, and January 3, 2015, respectively, is classified as property, plant and equipment and the related obligations are recorded as liabilities. Depreciation of assets held under capital leases is included in depreciation and amortization expense. Total accumulated depreciation for assets held under capital leases was $13.7 million and $9.7 million at December 31, 2016 and $6.3 million at January 2, 2016, and January 3, 2015, respectively.
Buildings are depreciated over ten to forty years, machineryThe table below presents the range of estimated useful lives by property, plant and equipment over three to twenty-five years, and furniture, fixtures, and transportation equipment over three to fifteen years. class.
|
| Useful life term (years) | ||
Asset Class |
| Low |
| High |
Buildings |
| 10 |
| 40 |
Machinery and equipment |
| 3 |
| 25 |
Furniture, fixtures and transportation equipment |
| 3 |
| 15 |
Property under capital leases and leasehold improvements are amortized over the shorter of the lease term or the estimated useful life of the property.
Depreciation expense for fiscal years 2016, 2015, and 2014 and 2013 was $116.8 million, $117.2 million and $106.7 million, respectively. as follows (amounts in thousands):
|
| Depreciation expense |
| |
Fiscal 2016 |
| $ | 116,367 |
|
Fiscal 2015 |
| $ | 116,772 |
|
Fiscal 2014 |
| $ | 117,221 |
|
The company had no capitalized interest during fiscal 2016, 2015, 2014, and 2013.2014. The cost of maintenance and repairs is charged to expense as incurred. Upon disposal or retirement, the cost and accumulated depreciation of assets are eliminated from the respective accounts. Any gain or loss is reflected in the company’s income from operations and is included in adjustments to reconcile net income to net cash provided by operating activities in the Consolidated Statements of Cash Flows.
Segments. The company’s segments are separated primarily by the different delivery methods each segment uses for their respective product deliveries. DSD Segment products are delivered fresh to customers through a network of independent distributors who are incentivized to grow sales and to build equity in their distributorships. The Warehouse Segment ships fresh and frozen
products to customers’ warehouses nationwide. Our bakeries fall into either the DSD Segment or Warehouse Segment depending on the primary method of delivery used to sell that bakery’s products. The bakeries within each segment produce products that are sold externally to their customers and internally to bakeries within the segment and to the other segment. Sales between bakeries are transferred at standard cost.
Impairment of Long-Lived Held and Used Assets. The company determines whether there has been an impairment of long-lived held and used assets when indicators of potential impairment are present. We consider historical performance and future estimated results in our evaluation of impairment. In the event that facts and circumstances indicate that the cost of any long-lived held and used assets may be impaired, an evaluation of recoverability would be performed. If an evaluation is required, the estimated future gross, undiscounted cash flows associated with the asset would be compared to the asset’s carrying amount to determine if a write-down to market value is required.
Future adverse changes in market conditions or poor operating results of underlying long-lived held and used assets could result in losses or an inability to recover the carrying value of the long-lived held and used assets that may not be reflected in the assets’ current carrying values, thereby possibly requiring an impairment charge in the future.
In fiscal 2016, we recorded asset impairment charges totaling $9.9 million at the time certain idle assets were reclassified as held for sale. We recorded an impairment charge of $1.5 million when we closed a production line at one of our bakeries on equipment we no longer intend to use in fiscal 2015. There were no impairment charges for long-lived held and used assets during fiscal years 2014 or 2013.year 2014. See Note 6, Assets Held for Sale, for impairments related to assets classified as held for sale.
Impairment of Other Intangible Assets. The company accounts for other intangible assets recognized in a purchase business combination at fair value. These intangible assets can be either finite or indefinite-lived depending on the facts and circumstances at acquisition.
Finite-lived intangible assets are reviewed for impairment when facts and circumstances indicate that the cost of any finite-lived intangible asset may be impaired. This recoverability test is based on an undiscounted cash flows expected to result from the company’s use and eventual disposition of the asset. If these cash flows are sufficient to recover the carrying value over the useful life there is no impairment. Amortization of finite-lived intangible assets occurs over their estimated useful lives. The amortization periods, at origination, range from two years to forty years for these assets. The attribution methods we primarily use are sum-of-the-year digits for customer relationships and straight-line for other intangible assets. These finite-lived intangible assets generally include trademarks, customer relationships, non-compete agreements, distributor relationships, and supply agreements.
Identifiable intangible assets that are determined to have an indefinite useful economic life are not amortized. Indefinite-lived intangible assets are tested for impairment, at least annually, using a one-step fair value based approach or when certain indicators of potential impairment are present. We have elected not to perform the qualitative approach. We also reassess the indefinite-lived classification to determine if it is appropriate to reclassify these assets as finite-lived assets that will require amortization. We consider historical performance and future estimated results in our evaluation of impairment. In the event that facts and circumstances indicate that the cost of any indefinite-lived intangible assets may be impaired, an evaluation of the fair value of the asset is compared to its carrying amount. If the carrying amount exceeds the fair value, an impairment charge is recorded for the difference. Fair value is estimated using the future gross, discounted cash flows associated with the asset using the following four material assumptions: (a) discount rate; (b) long-term sales growth rates; (c) forecasted operating margins; and (d) market multiples. We use the multi-period excess earnings and relief from royalty methods to value these indefinite-lived intangible assets. The method used for impairment testing purposes is consistent with the valuation method employed at acquisition of the intangible asset. These indefinite-lived intangible assets are trademarks acquired in a purchase business combination. During fiscal 2016, the company recorded an impairment charge of $15.0 million on certain trademarks the company no longer intends to grow nationally. These brands will continue to be produced and sold in their respective markets.
The company evaluates useful lives for finite-lived intangible assets to determine if facts or circumstances arise that may impact the estimates of useful lives assigned and the remaining amortization duration. Indefinite-lived intangible assets that are determined to have a finite useful life are tested for impairment as an indefinite-lived intangible asset prior to commencing amortization. We determined the impaired assets should be reclassified from indefinite-lived to finite-lived with an attribution period covering our estimate of the assets useful life. Each of these intangible assets was assigned a useful life of forty years.
Future adverse changes in market conditions or poor operating results of underlying intangible assets could result in losses or an inability to recover the carrying value of the intangible assets that may not be reflected in the assets’ current carrying values, thereby possibly requiring an impairment charge in the future. There were no impairment charges related to other intangible assets during fiscal years 2015 2014 or 2013.2014. See Note 7, Goodwill and Other Intangible Assets, for additional disclosure.
Goodwill. The company accounts for goodwill in a purchase business combination as the excess of the cost over the fair value of net assets acquired. Goodwill is allocated to the DSD Segment and Warehouse SegmentsSegment based on the segment assignment for the acquisition. The company tests goodwill for impairment on an annual basis (or an interim basis if an event occurs that indicates the fair value of a reporting unit may be below its carrying value) using a two-step method. This analysis is performed for both of our segments. Goodwill is recorded at the segment level primarily because of reciprocal baking arrangements for plants within each segment. We have
elected not to perform the qualitative approach. The company conducts this review during the fourth quarter of each fiscal year absent any triggering events. We use the following four material assumptions in our fair value analysis: (a) weighted average cost of capital; (b) long-term sales growth rates; (c) forecasted operating margins; and (d) market multiples. No impairment resulted from the annual review performed in fiscal years 2015, 2014,2016 or 2013.2015. During the second quarter of fiscal 2014, we recorded an impairment of $2.6 million related to the disposition of certain assets as described in Note 6, Assets Held For Sale. This goodwill impairment represented the share of goodwill for the disposed assets. See Note 7, Goodwill and Other Intangible Assets, for additional disclosure.
Derivative Financial Instruments. The company enters into commodity derivatives, designated as cash flow hedges of existing or future exposure to changes in commodity prices. The company’s primary raw materials are flour, sweeteners, shortening, and water, along with pulp, paper, and petroleum-based packaging products. The company uses natural gas as fuel for firing ovens. The company also periodically enters into interest rate derivatives to hedge exposure to changes in interest rates. The company measures the fair value of its derivative portfolio using the fair value as the price that would be received to sell an asset or paid to transfer a liability in the principal market for that asset or liability. When quoted market prices for identical assets or liabilities are not available, the company bases fair value upon internally developed models that use current market observable inputs, such as exchange-quoted futures prices and yield curves. None of our hedge positions are for trading purposes.
The effective portion of changes in fair value for these derivatives is recorded each period in other comprehensive income (loss), and any ineffective portion of the change in fair value is recorded to current period earnings in selling, distribution and administrative expenses. All of our commodity derivatives at January 2,December 31, 2016 qualified for hedge accounting. During fiscal years 2016, 2015, 2014, and 20132014 there was no material income or expense recorded due to ineffectiveness in current earnings due to changes in the fair value of these instruments.our commodity hedges. The company recognized $0.1 million of ineffectiveness during fiscal year 2016 at the settlement of a treasury lock for an interest rate hedge. See Note 9, Derivative Financial Instruments, for additional disclosure.
The company routinely transfers amounts from other comprehensive income (“OCI”) to earnings as transactions for which cash flow hedges were held occur and impact earnings. Significant situations which do not routinely occur that could cause transfers from OCI to earnings are as follows: (i) an event that causes a hedge to be suddenly ineffective and significant enough that hedge accounting must be discontinued or (ii) cancellation of a forecasted transaction for which a derivative was held as a hedge or a significant and material reduction in volume used of a hedged ingredient such that the company is overhedged and must discontinue hedge accounting. During fiscal 2016, 2015, 2014, and 20132014 there were no discontinued hedge positions.
The impact to earnings is included in our materials, supplies, labor and other production costs (exclusive of depreciation and amortization shown separately) line item. Changes in the fair value of the asset or liability are recorded as either a current or long-term asset or liability depending on the underlying fair value. Amounts reclassified to earnings for the commodity cash flow hedges are presented as an adjustment to reconcile net income to net cash provided by operating activities on the Consolidated Statements of Cash Flows. See Note 9, Derivative Financial Instruments, for additional disclosure.
Treasury Stock. The company records acquisitions of its common stock for treasury at cost. Differences between proceeds for reissuances of treasury stock and average cost are credited or charged to capital in excess of par value to the extent of prior credits and thereafter to retained earnings. See Note 15, Stockholders’ Equity, for additional disclosure.
Advertising and Marketing Costs. Advertising and marketing costs are expensed the first time the advertising takes place. Advertising and marketing costs were $33.9 million, $23.5 million, $22.9 million, and $28.1$22.9 million for fiscal years 2016, 2015, 2014, and 2013,2014, respectively. Advertising and marketing costs are recorded in the selling, distribution and administrative expense line item in our Consolidated Statements of Income.
Stock-Based Compensation. Stock-based compensation expense for all share-based payment awards granted is determined based on the grant date fair value. The company recognizes compensation costs only for those shares expected to vest on a straight-line basis over the requisite service period of the award, which is generally the vesting term of the share-based payment award. The shares issued for exercises and at vesting of the awards are issued from Treasury Stock.treasury stock. See Note 16, Stock-Based Compensation, for additional disclosure. Stock-based compensation expense is included in selling, distribution and administrative expense in the Consolidated Statements of Income.
Software Development Costs. The company expenses internal and external software development costs incurred in the preliminary project stage, and, thereafter, capitalizes costs incurred in developing or obtaining internally used software. Certain costs, such as maintenance and training, are expensed as incurred. Capitalized costs are amortized over a period of three to eight years and are subject to impairment evaluation. The net balance of capitalized software development costs included in plant, property and equipment was $23.4 million and $15.0 million at December 31, 2016 and $13.0 million at January 2, 2016, and January 3, 2015, respectively. Amortization expense of capitalized software development costs, which is included in depreciation and amortization expense in the Consolidated Statements of Income, was $3.3 million, $3.5 million, $2.4 million, and $3.2$2.4 million in fiscal years 2016, 2015, 2014, and 2013,2014, respectively.
Income Taxes. The company accounts for income taxes using the asset and liability method and recognizes deferred tax assets and liabilities for the expected future tax consequences of events that have been included in the financial statements. Under this method, deferred tax assets and liabilities are determined based on the temporary differences between the financial statement and tax basis of assets and liabilities using enacted tax rates in effect for the year in which the differences are expected to reverse. The effect of a change in tax rates on deferred tax assets and liabilities is recognized in income in the period that includes the enactment date.
The company records a valuation allowance to reduce its deferred tax assets to the amount that is more likely than not to be realized. The company has considered carryback, future taxable income, and prudent and feasible tax planning strategies in assessing
the need for the valuation allowance. In the event the company were to determine that it would be more likely than not able to realize its deferred tax assets in the future in excess of its net recorded amount, an adjustment to the valuation allowance would increase income in the period such a determination was made. Likewise, should the company determine that it would not more likely than not be able to realize all or part of its net deferred tax asset in the future, an adjustment to the valuation allowance would decrease income in the period such determination was made.
The company recognizes a tax benefit from an uncertain tax position when it is more likely than not that the position will be sustained upon examination, including resolution of any related appeals or litigation process. Interest related to unrecognized tax benefits is recorded within the interest expense line in the accompanying Consolidated Statements of Income. See Note 20, Income Taxes, for additional disclosure.
The deductions column in the table below presents the amounts reduced in the deferred tax asset valuation allowance that were recorded to, and included as part of, deferred tax expense. The additions column represents amounts that increased the allowance.
Activity in the deferred tax asset valuation allowance is as follows (amounts in thousands):
|
| Beginning Balance |
|
| Deductions |
|
| Additions |
|
| Ending Balance |
|
| Beginning Balance |
|
| Deductions |
|
| Additions |
|
| Ending Balance |
| ||||||||
Fiscal 2016 |
| $ | 18 |
|
| $ | — |
|
| $ | — |
|
| $ | 18 |
| ||||||||||||||||
Fiscal 2015 |
| $ | 2,534 |
|
| $ | 2,516 |
|
| $ | — |
|
| $ | 18 |
|
| $ | 2,534 |
|
| $ | 2,516 |
|
| $ | — |
|
| $ | 18 |
|
Fiscal 2014 |
| $ | 2,895 |
|
| $ | 361 |
|
| $ | — |
|
| $ | 2,534 |
|
| $ | 2,895 |
|
| $ | 361 |
|
| $ | — |
|
| $ | 2,534 |
|
Fiscal 2013 |
| $ | 4,545 |
|
| $ | 1,650 |
|
| $ | — |
|
| $ | 2,895 |
| ||||||||||||||||
Self-Insurance Reserves. The company is self-insured for various levels of general liability, auto liability, workers’ compensation, and employee medical and dental coverage. Insurance reserves are calculated on an undiscounted basis based on actual claim data and estimates of incurred but not reported claims developed utilizing historical claim trends. Projected settlements of incurred but not reported claims are estimated based on pending claims and historical trends and data. Though the company does not expect them to do so, actual settlements and claims could differ materially from those estimated. Material differences in actual settlements and claims could have an adverse effect on our results of operations and financial condition.
Loss contingencies. Loss contingencies are recorded at the time it is probable an asset is impaired or a liability has been incurred and the amount can be reasonably estimated. For litigation claims the company considers the degree of probability of an unfavorable outcome and the ability to make a reasonable estimate of the loss. Losses are recorded as a selling, distribution, and administrative expense in our Consolidated Statements of Income.
Net Income Per Common Share. Basic net income per share is computed by dividing net income by weighted average common shares outstanding for the period. Diluted net income per share is computed by dividing net income by the weighted average common and common equivalent shares outstanding for the period. Common stock equivalents consist of the incremental shares associated with the company’s stock compensation plans, as determined under the treasury stock method. The performance contingent restricted stock awards do not contain a non-forfeitable right to dividend equivalents and are included in the computation for diluted net income per share. Fully vested shares which have a deferral period extending beyond the vesting date are included in the computation for basic net income per share. See Note 18, Earnings Per Share, for additional disclosure.
Variable Interest Entities. The incorporated independent distributors (“IDs”) in the DSD Segment are not voting interest entities since the company has no direct interest in each entity; however, they qualify as variable interest entities (“VIEs”). The independent distributors who are formed as sole proprietorships are excluded from the VIE accounting analysis because sole proprietorships are not within scope for determination of VIE status. The company typically finances the ID and also enters into a contract with the ID to supply product at a discount for distribution in the ID’s territory. The combination of the company’s loans to the IDs and the ongoing supply arrangements with the IDs provides a level of protection to the equity owners of the various IDs that would not otherwise be available. However, the company is not considered to be the primary beneficiary of the VIEs. See Note 13, Variable Interest Entities, for additional disclosure of this VIE entity.
The company also maintains a transportation agreement with an entity that transports a significant portion of the company’s fresh bakery products from the company’s production facilities to outlying distribution centers. The company represents a significant portion of the entity’s revenue. This entity qualifies as a VIE, but the company has determined it is not the primary beneficiary of the VIE. See Note 13, Variable Interest Entities, for additional disclosure of this VIE entity.
Pension/OPEB Obligations. The company records net periodic benefit costs and obligations related to its three defined benefit pension and two other post employmentpost-employment benefit (“OPEB”) plans based on actuarial valuations. These valuations reflect key assumptions determined by management, including the discount rate and expected long-term rate of return on plan assets. The expected long-term rate of return assumption considers the asset mix of the plans’ portfolios, past performance of these assets, the anticipated future economic environment, and long-term performance of individual asset classes, and other factors. Material changes in benefit costs and obligations may occur in the future due to experience different than assumed and changes in these assumptions. Future benefit obligations and annual benefit costs could be impacted by changes in the discount rate, changes in the expected long-term rate of return, changes in the level of contributions to the plans’, and other factors. Effective January 1, 2006, the company curtailed its largest defined benefit pension plan that covered the majority of its workforce. Benefits under this plan were frozen, and no future benefits will accrue under this plan. The company still maintains a smaller unfrozen pension plan for certain eligible unionized employees.
The company determines the fair value of substantially all its plans’ assets utilizing market quotes rather than developing “smoothed” values, “market related” values, or other modeling techniques. Plan asset gains or losses in a given year are included with other actuarial gains and losses due to remeasurement of the plans’ projected benefit obligations (“PBO”). If the total unrecognized gain or loss exceeds 10% of the larger of (i) the PBO or (ii) the market value of plan assets, the excess of the total unrecognized gain, or loss is amortized over the expected average future lifetime of participants in the frozen pension plans. The company uses a calendar year end for the measurement date since the plans are based on a calendar year and because it approximates the company’s fiscal year end. See Note 19, Postretirement Plans, for additional disclosure.
Pension Plan assets. Effective January 1, 2014, the Finance Committee (“committee”) of the Board of Directors delegated its fiduciary and other responsibilities with respect to the plans to the newly established Investment Committee. The Investment Committee, which consists of certain members of management, establishes investment guidelines and strategies and regularly monitors the performance of the plans’ assets. The Investment Committee is responsible for executing these strategies and investing
the pension assets in accordance with ERISA and fiduciary standards. The investment objective of the pension plans is to preserve the plans’ capital and maximize investment earnings within acceptable levels of risk and volatility. The Investment Committee meets on a regular basis with its investment advisors to review the performance of the plans’ assets. Based upon performance and other measures and recommendations from its investment advisors, the Investment Committee rebalances the plans’ assets to the targeted allocation when considered appropriate.
Use of Estimates. The preparation of financial statements in conformity with accounting principles generally accepted in the United States of America requires management to make estimates and assumptions that affect the reported amounts of assets and liabilities and disclosure of contingent assets and liabilities at the date of the financial statements and the reported amounts of revenues and expenses during the reporting period. Actual results could differ from those estimates.
Fair Value of Financial Instruments. On September 28, 2016, the company issued $400.0 million of senior notes (the “2026 notes”). On April 3, 2012, the company issued $400.0 million of senior notes. Thenotes (the “2022 notes”). These notes are recorded in our financial statements at carrying value, net of debt discount and issuance costs. The debt discount and issuance costs are being amortized over the ten year term of the note to interest expense. In addition and for disclosure purposes, the fair value of the notes is estimated using yields obtained from independent pricing sources for similar types of borrowing arrangements and is considered a Level 2 valuation. Additional details are included in Note 14, Fair Value of Financial Instruments.
Research and Development. The company recorded research and development costs of $3.0 million, $3.3 million, $3.2 million, and $2.6$3.2 million for fiscal years 2016, 2015, 2014, and 2013,2014, respectively. These costs are recorded as selling, distribution and administrative expenses in our Consolidated Statements of Income.
Other Comprehensive Income. The company reports comprehensive income in two separate but consecutive financial statements. See Note 17, Accumulated Other Comprehensive Income (Loss), for additional required disclosures.
Note 3. | Recent Accounting Pronouncements |
Recently adopted accounting pronouncements
In April 2015, the FASB issued guidance to simplify the presentation of debt issuance costs. This guidance requires that debt issuance costs related to a recognized debt liability be presented in the balance sheet as a direct reduction from the carrying amount of that debt liability, consistent with debt discount presentation. This guidance is effective for financial statements for fiscal years beginning after December 15, 2015, and interim periods within those years. This guidance is applied on a retrospective basis at adoption and the disclosures for a change in an accounting principle apply. This guidance was adopted as of January 3, 2016 (the first day of our fiscal 2016) with application of the provisions retrospectively. Debt issuance costs associated with line-of-credit arrangements is not addressed by this guidance. The company’s accounts receivable securitization facility and credit facility,
discussed in Note 12, Debt, Lease and Other Commitments, are excluded from this guidance and are still presented as other long-term assets in the Consolidated Balance Sheet. As a result of adopting this standard, the debt issuance costs of our other debt obligations were reclassified as a reduction to the carrying amount of the debt liability for the Consolidated Balance Sheets as of December 31, 2016 and January 2, 2016. The balance sheet as of January 2, 2016 was retrospectively adjusted, which resulted in a $3.9 million decrease to other non-current assets and to total long-term debt and capital lease obligations.
In November 2015, the FASB issued guidance that requires entities to report deferred tax liabilities and assets as noncurrent in a classified statement of financial position. The previous requirement that deferred tax liabilities and assets of a tax-paying component of an entity be offset and presented as a single amount is not affected by this guidance. This guidance is effective for fiscal years beginning after December 15, 2016, and interim periods within those annual periods. Earlier application is permitted for all entities as of the beginning of an interim or annual reporting period. The company adopted this standard for the annual period beginning on January 3, 2016 (the first day of our fiscal 2016) and applied it retrospectively. As a result of adopting this standard, all deferred tax assets and liabilities have been classified as noncurrent for the Consolidated Balance Sheets as of December 31, 2016 and January 2, 2016. The balance sheet as of January 2, 2016 was retrospectively adjusted, which resulted in a $37.2 million decrease in the current deferred income tax asset balance and in the long-term deferred income tax liability balance.
The table below presents the adjustments for each of the line items impacted for these pronouncements (amounts in thousands):
|
|
|
|
| As Adjusted |
| |
| January 2, 2016 |
|
| January 2, 2016 |
| ||
ASSETS |
|
|
|
|
|
|
|
Deferred taxes | $ | 37,207 |
|
| $ | — |
|
Total current assets | $ | 537,515 |
|
| $ | 500,308 |
|
Other assets | $ | 11,791 |
|
| $ | 7,881 |
|
Total assets | $ | 2,885,168 |
|
| $ | 2,844,051 |
|
LIABILITIES AND STOCKHOLDERS' EQUITY |
|
|
|
|
|
|
|
Total long-term debt and capital lease obligations | $ | 933,932 |
|
| $ | 930,022 |
|
Deferred taxes | $ | 183,669 |
|
| $ | 146,462 |
|
Total other long-term liabilities | $ | 304,416 |
|
| $ | 267,209 |
|
Total liabilities and stockholders' equity | $ | 2,885,168 |
|
| $ | 2,844,051 |
|
In September 2015, the FASB issued guidance that entities that have reported provisional amounts for items in a business combination for which the accounting is incomplete by the end of the reporting period in which the combination occurs and during the measurement period have an adjustment to provisional amounts recognized. This update requires that an acquirer recognize adjustments to provisional amounts that are identified during the measurement period in the reporting period in which the adjustment amounts are determined. This guidance also requires that an entity present separately on the face of the income statement or disclose in the notes the portion of the amount recorded in current-period earnings by line item that would have been recorded in previous reporting periods if the adjustment to the provisional amounts had been recognized as of the acquisition date. This guidance is effective for our fiscal 2016. The guidance is applied prospectively to adjustments to provisional amounts that occur after the effective date of the guidance. The potential impact of the guidance on the company’s Consolidated Financial Statements will only be known after a measurement period adjustment for an acquisition is recognized. The adoption of this guidance is presented in Note 7, Goodwill and Other Intangible Assets, for the measurement period adjustments related to the acquisitions discussed in Note 8, Acquisitions, below.
In May, 2015, the FASB issued guidance to eliminate the requirement to disclose the level of the fair value hierarchy for pension plan assets for which the fair value is measured at net asset value using the practical expedient. Investments for which net asset value is fair value, and not a practical expedient, must still be included in the fair value table. The company’s assets reported at net asset value are included as a reconciling item between the fair value hierarchy disclosure and total plan assets. See Note 19, Postretirement Plans, for disclosures related to our pension plan assets.
In August, 2014 the FASB issued guidance that requires management to assess an entity’s ability to continue as a going concern by incorporating and expanding upon certain principles that are currently in U.S. auditing standards. Specifically, the amendments provide a definition of the term substantial doubt, require an evaluation every reporting period including interim periods, provide principles for considering the mitigating effect of management’s plans, require certain disclosures when substantial doubt is alleviated as a result of consideration of management’s plans, require an express statement and other disclosures when substantial doubt is not alleviated, and require an assessment for a period of one year after the date of that the financial statements are issued. The company adopted the updated standard in the fourth quarter of fiscal 2016. This guidance required additional controls at adoption but did not have a material impact on the Consolidated Financial Statements.
Accounting pronouncements not yet adopted
In May 2014, the Financial Accounting Standards Board (the “FASB”) issued guidance for recognizing revenue in contracts with customers. This guidance requires entities to recognize revenue to depict the transfer of promised goods or services to customers in an amount that reflects the consideration to which the entity expects to be entitled in exchange for those goods or services. There are five steps outlined in the guidance to achieve this core principle. This guidance was originally effective January 1, 2017, the first day of our fiscal 2017. In July 2015, the FASB issued a deferral for one year, making the effective date December 31, 2017, the first day of our fiscal 2018. In March 2016, the FASB amended the initial guidance to clarify the implementation guidance on principal versus agent considerations. In April 2016, the FASB amended the initial guidance to clarify the identification of performance conditions and the licensing implementation guidance. In May 2016, the FASB amended the initial guidance to update certain narrow scopes within the revenue recognition guidance. Early application is permitted, but not before January 1, 2017. Entities will have the option to apply the final standard retrospectively or use a modified retrospective method, recognizing the cumulative effect of the standards in retained earnings at the date of initial application. An entity will not restate prior periods if it uses the modified retrospective method, but will be required to disclose the amount by which each financial statement line item is affected in the current reporting period by the application of the standard as compared to the guidance in effect prior to the change, as well as reasons for significant changes. The company intends to adopt the updated standard in the first quarter of fiscal 2018. The company is currently in the process of assessing the adoption methodology to apply.
The company is currently evaluating the impact that implementing this standard will have on its financial statements and disclosures and whether the effect will be material to our revenue. Our initial review found three areas that will continue to be studied through fiscal 2017. The company's PBS sales, stale accounting, and distributor discounts are under review for either how to account for PBS inventory, estimated stale charges, or whether an item is reported at net or gross. These are not intended to be a complete inventory of the potentially impactful types of revenue, but we have identified these for further study. More impactful revenue sources may be discovered as we continue our review. The company does not typically enter into long-term revenue contracts and does not anticipate those areas to be material. The company does not anticipate significant changes to our systems or processes upon adoption. As of December 31, 2016, we have not selected a transition method.
In July 2015, the FASB issued guidance that entities should measure inventory at the lower of cost and net realizable value. Net realizable value is the estimated selling prices in the ordinary course of business, less reasonably predictable costs of completion, disposal, and transportation. This guidance is effective for fiscal years, and interim periods within those fiscal years, beginning after December 15, 2016. This guidance must be applied prospectively with earlier application permitted as of the beginning of an interim or annual reporting period. This guidance will impact the company during our first quarter of fiscal 2017. We anticipate that an adjustment to our inventory reported at the end of our first quarter in fiscal 2017 may be required and will be impacted by the inclusion of more components for the net realizable value standard.
In February 2016, the FASB issued guidance that requires an entity to recognize lease liabilities and a right-of-use asset for virtually all leases (other than those that meet the definition of a short-term lease) on the balance sheet and to disclose key information about the entity’s leasing arrangements. This guidance is effective for annual reporting periods beginning after December 15, 2018, including interim periods within that reporting period, with earlier adoption permitted. This guidance must be adopted using a modified retrospective approach for all leases existing at, or entered into after the date of initial adoption, with an option to elect to use certain transition relief. The company intends to adopt the updated standard in the first quarter of fiscal 2019. The company currently has significant operating leases with our fiscal 2016 lease expense totaling $97.4 million. The company is evaluating the potential impact of this guidance on our Consolidated Financial Statements.
In March 2016, the FASB issued guidance to simplify several aspects of the accounting for employee share-based payment transactions including the accounting for income taxes, forfeitures, and statutory tax withholding requirements, as well as classification in the statement of cash flows. This guidance is effective for fiscal years beginning after December 15, 2016, and interim periods within those fiscal years, and early adoption is permitted. Amendments related to the timing of when excess tax benefits are recognized, minimum statutory withholding requirements, forfeitures, and intrinsic value will be adopted using a modified retrospective transition method by means of a cumulative-effect adjustment to equity as of the beginning of the period in which the guidance is adopted. Amendments related to the presentation of employee taxes paid on the statement of cash flows when the employer withholds shares to meet the minimum statutory will not impact the company since we already report cash flows according to the new guidance. The recognition of excess tax benefits and deficiencies in the income statement will be applied prospectively. The company will adopt the presentation of excess tax benefits on the statement of cash flows under the retrospective transition method. At adoption of this guidance during the first quarter of our fiscal 2017, we anticipate the impact to our first quarter Consolidated Financial Statements to reflect a tax shortfall of $3.0 million to $3.3 million that will be recognized as income tax expense at vesting of our performance-based share-based payment awards. Approximately 1.7 million non-qualified stock options related to the 2011 award are outstanding with an exercise price of $10.87 and an expiration date of February 10, 2018. If those
options are exercised during fiscal 2017 at an amount in excess of $10.87, a tax windfall will be recognized as an income tax benefit. The company intends to record forfeitures as incurred. See Note 16, Stock-Based Compensation, for details of our awards.
In August 2016, the FASB issued guidance on the classification of certain cash receipts and payments in the statement of cash flows. The guidance is effective for fiscal years beginning after December 15, 2017, and interim periods within those years. Early adoption is permitted. The guidance must be applied retrospectively to all periods presented but may be applied prospectively if retrospective application would be impracticable. The company is currently evaluating the impact that the new guidance will have on our Consolidated Financial Statements.
In January 2017, the FASB issued guidance to clarify the definition of a business with the objective of adding guidance to assist entities with evaluating whether transactions should be accounted for as acquisitions (or disposals) of assets or businesses. This guidance is effective for annual period beginning after December 15, 2017, including interim periods within those periods. This guidance shall be applied prospectively at adoption. This guidance will impact the company’s assessment of the acquisition of either an asset or a business beginning in our fiscal 2018.
In January 2017, the FASB issued guidance to simplify the accounting for goodwill impairment. The guidance removed Step 2 of the goodwill impairment test, which requires a hypothetical purchase price allocation. A goodwill impairment will now be the amount by which a reporting unit’s carrying value exceeds its fair value, not to exceed the carrying amount of goodwill. Companies will still have the option to perform a qualitative assessment to determine if a quantitative impairment test is necessary. This guidance will be applied prospectively. Companies are required to disclose the nature of and reason for the change in accounting principle upon transition. That disclosure shall be provided in the first annual period and in the interim period within the first annual period when the company adopts this guidance. This is effective for fiscal years beginning after December 15, 2019. Early adoption is permitted after January 1, 2017. The company is currently evaluating when this guidance will be adopted and the impact on our Consolidated Financial Statements.
We have reviewed other recently issued accounting pronouncements and concluded that they are either not applicable to our business or that no material effect is expected upon future adoption.
Note | Financial Statement Revisions |
During the fourth quarter of fiscal 2014,2016, we revised our previously reported net sales.Consolidated Statements of Cash Flows for fiscal years 2015 and 2014. Historically, certain immaterial discounts hadamounts for presenting payments received from notes receivable, payments for the repurchase of territories, and non-cash issuance of notes receivable were presented incorrectly. The company reported non-cash amounts as payments from notes receivable and payments for the repurchase of territories that should have been recordeddisclosed as an expense to selling, distributionnon-cash transactions. The error impacted the Statement of Cash Flows for fiscal years 2015 and administrative costs. These discounts are now recorded as contra revenue. These revisions were made for all periods presented in the fiscal 2014 Form 10-K. The impact of these cash sales was 0.5% to our previously reported consolidated sales in our fiscal 2013 financial statements. In addition, since these types of sales are only applicable to our DSD Segment, the impact was 0.6% to our previously reported DSD Segment sales in our fiscal 2013 financial statements. We have concluded that these revisions are immaterial to our fiscal 2013 financial statements and each of the quarterlyinterim periods in those years. The error also impacted the first, second, and third quarters of fiscal years 2014 and 2013.
Our prior year financial statements were revised to correctly report the discounts by decreasing sales and decreasing selling, distribution and administrative expenses by the amount of the discounts in the respective periods presented. There are no impacts to2016. These corrections did not impact our previously reported Consolidated Balance Sheets, Consolidated Statements of Income, Consolidated Statements of Comprehensive Income, and Consolidated Statements of Changes in Stockholders’ Equity, or Consolidated Statements of Cash Flows for any prior periods. Additionally, the correction did not impact our previously reported income from operations, net income or earnings per share.Equity.
The tables below present the revisions to the applicable financial statementConsolidated Statements of Cash Flows line itemsitem to correct the errors for all periods presented and for the quarterly information for fiscal year 2014 (amounts in thousands).:
|
| Fiscal 2013 |
| |||||||||
Impacted Financial Statement line item |
| As Previously Reported |
|
| Revisions |
|
| As Revised |
| |||
Sales |
| $ | 3,751,005 |
|
| $ | (18,389 | ) |
| $ | 3,732,616 |
|
Selling, distribution and administrative expense |
| $ | 1,375,131 |
|
| $ | (18,389 | ) |
| $ | 1,356,742 |
|
|
| Quarter 1 of Fiscal 2014 |
| |||||||||
Impacted Financial Statement line item |
| As Previously Reported |
|
| Revisions |
|
| As Revised |
| |||
Sales |
| $ | 1,159,760 |
|
| $ | (5,843 | ) |
| $ | 1,153,917 |
|
Selling, distribution and administrative expense |
| $ | 426,390 |
|
| $ | (5,843 | ) |
| $ | 420,547 |
|
|
| Quarter 2 of Fiscal 2014 |
| |||||||||
Impacted Financial Statement line item |
| As Previously Reported |
|
| Revisions |
|
| As Revised |
| |||
Sales |
| $ | 877,378 |
|
| $ | (4,587 | ) |
| $ | 872,791 |
|
Selling, distribution and administrative expense |
| $ | 319,582 |
|
| $ | (4,587 | ) |
| $ | 314,995 |
|
|
| Quarter 3 of Fiscal 2014 |
| |||||||||
Impacted Financial Statement line item |
| As Previously Reported |
|
| Revisions |
|
| As Revised |
| |||
Sales |
| $ | 849,360 |
|
| $ | (4,428 | ) |
| $ | 844,932 |
|
Selling, distribution and administrative expense |
| $ | 306,514 |
|
| $ | (4,428 | ) |
| $ | 302,086 |
|
|
| Fiscal 2015 |
| |||||||||
Impacted Consolidated Cash Flow Statement line item |
| As Previously Reported |
|
| Revisions |
|
| As Revised |
| |||
Other assets |
| $ | (7,133 | ) |
| $ | (5,766 | ) |
| $ | (12,899 | ) |
Other accrued liabilities |
| $ | 4,670 |
|
| $ | (166 | ) |
| $ | 4,504 |
|
Net cash provided by operating activities |
| $ | 324,233 |
|
| $ | (5,932 | ) |
| $ | 318,301 |
|
Repurchase of independent distributor territories |
| $ | (21,866 | ) |
| $ | 8,098 |
|
| $ | (13,768 | ) |
Principal payments from notes receivable |
| $ | 26,028 |
|
| $ | (3,005 | ) |
| $ | 23,023 |
|
Other investing activities |
| $ | — |
|
| $ | 839 |
|
| $ | 839 |
|
Net cash disbursed for investing activities |
| $ | (467,508 | ) |
| $ | 5,932 |
|
| $ | (461,576 | ) |
Issuance of notes receivable on new distribution territories, net |
| $ | 18,744 |
|
| $ | (3,005 | ) |
| $ | 15,739 |
|
Distributor routes sold with gains recognized as deferred income, net |
| $ | — |
|
| $ | 166 |
|
| $ | 166 |
|
|
|
In May 2014, the Financial Accounting Standards Board (the “FASB”) issued guidance for recognizing revenue in contracts with customers. This guidance requires entities to recognize revenue to depict the transfer of promised goods or services to customers in an amount that reflects the consideration to which the entity expects to be entitled in exchange for those goods or services. There are five steps outlined in the guidance to achieve this core principle. This guidance was originally effective January 1, 2017 the first day of our fiscal 2017. In July 2015, the FASB issued a deferral for one year making the effective date December 31, 2017, the first day of our fiscal 2018. Early application is permitted but not before January 1, 2017. The standard permits the use of either the modified retrospective or cumulative effect transition method. We are in the process of determining the effect this guidance will have on our Consolidated Financial Statements and which transition method we will apply.
In April 2015, the FASB issued guidance to simplify the presentation of debt issuance costs. This guidance requires that debt issuance costs related to a recognized debt liability be presented in the balance sheet as a direct reduction from the carrying amount of that debt liability, consistent with debt discount presentation. This guidance is effective for financial statements for fiscal years beginning after December 15, 2015, and interim periods within those years. This guidance is applied on a retrospective basis at adoption and the disclosures for a change in an accounting principle apply. Earlier application is permitted. Based on the balances as of January 2, 2016, the adoption of this guidance will require us to reclassify approximately $3.9 million of unamortized debt issuance costs from other long-term assets to long-term debt in future periods.
In April 2015, the FASB issued guidance to provide a practical expedient permitting applicable entities to measure defined benefit plan assets and obligations using the month-end that is closest to the entity’s fiscal year end and apply that practical expedient consistently from year to year. This guidance is effective for fiscal years beginning after December 15, 2015, and interim periods within those fiscal years. Earlier application is permitted. The company does not anticipate this guidance having a material impact on our Consolidated Financial Statements.
In May 2015, the FASB issued guidance to remove the requirement to categorize within the fair value hierarchy all investments for which fair value is measured using the net asset value per share expedient. The amendments also remove the requirement to make certain disclosures for all investments that are eligible to be measured at fair value using the net asset value per share practical expedient. These disclosures are limited to investments for which the entity has elected to measure the fair value using that practical expedient. This guidance is effective for fiscal years beginning after December 15, 2015, and interim periods within those fiscal years. These are to be applied retrospectively to all periods presented. Earlier adoption is permitted. The company is still analyzing the potential impact of this guidance on the company’s Consolidated Financial Statements.
In July 2015, the FASB issued guidance that entities should measure inventory at the lower of cost or net realizable value. Net realizable value is the estimated selling prices in the ordinary course of business, less reasonably predictable costs of completion, disposal, and transportation. This guidance is effective for fiscal years, and interim periods within those fiscal years, beginning after December 15, 2016. This guidance shall be applied prospectively with earlier application permitted as of the beginning of an interim or annual reporting period. The company is still analyzing the potential impact of this guidance on the company’s Consolidated Financial Statements.
In September 2015, the FASB issued guidance related to entities that have reported provisional amounts in a business combination for which the accounting is incomplete by the end of the reporting period in which the combination occurs. This update requires that an acquirer recognize adjustments to provisional amounts that are identified during the measurement period in the reporting period in which the adjustment amounts are determined. This update also requires that an entity present separately on the face of the income statement or disclose in the notes to the consolidated financial statements the portion of the amount recorded in current-period earnings by line item that would have been recorded in previous reporting periods if the adjustment to the provisional amounts had been recognized as of the acquisition date. This guidance is effective for fiscal years beginning after December 15, 2015, including interim periods within those fiscal years. This is applied prospectively to adjustments to provisional amounts that occur after the effective date of the guidance. The potential impact of the guidance on the company’s Consolidated Financial Statements will only be known after a measurement period adjustment for an acquisition is recognized. There will be a potential impact as long as our purchase price allocation remains preliminary at the end of each reporting period.
In November 2015, the FASB issued guidance that requires entities to report deferred tax liabilities and assets as noncurrent in a classified statement of financial position. The previous requirement that deferred tax liabilities and assets of a tax-paying component
of an entity be offset and presented as a single amount is not affected by this guidance. This guidance is effective for fiscal years beginning after December 15, 2016, and interim periods within those annual periods. Earlier application is permitted for all entities as of the beginning of an interim or annual reporting period. If this guidance were applicable on January 2, 2016 the company would report a net noncurrent deferred tax liability in our Consolidated Financial Statements.
We have reviewed other recently issued accounting pronouncements and concluded that they are either not applicable to our business or that no material effect is expected as a result of future adoption.
| Fiscal 2014 |
| ||||||||||
Impacted Consolidated Cash Flow Statement line item |
| As Previously Reported |
|
| Revisions |
|
| As Revised |
| |||
Other assets |
| $ | (23,993 | ) |
| $ | 12,656 |
|
| $ | (11,337 | ) |
Other accrued liabilities |
| $ | (6,552 | ) |
| $ | (11,443 | ) |
| $ | (17,995 | ) |
Net cash provided by operating activities |
| $ | 313,970 |
|
| $ | 1,213 |
|
| $ | 315,183 |
|
Repurchase of independent distributor territories |
| $ | (17,056 | ) |
| $ | 858 |
|
| $ | (16,198 | ) |
Principal payments from notes receivable |
| $ | 23,718 |
|
| $ | (2,615 | ) |
| $ | 21,103 |
|
Other investing activities |
| $ | — |
|
| $ | 544 |
|
| $ | 544 |
|
Net cash disbursed for investing activities |
| $ | (33,313 | ) |
| $ | (1,213 | ) |
| $ | (34,526 | ) |
Issuance of notes receivable on new distribution territories, net |
| $ | 44,346 |
|
| $ | (2,615 | ) |
| $ | 41,731 |
|
Distributor routes sold with gains recognized as deferred income, net |
| $ | — |
|
| $ | 11,443 |
|
| $ | 11,443 |
|
Note 5. | Notes Receivable |
The company provides direct financing to certain independent distributors for the purchase of the independent distributors’ distribution rights and records the notes receivable on the Consolidated Balance Sheets. The distribution rights are financed for up to ten years. During fiscal years 2016, 2015, and 2014 and 2013, $22.0 million, $20.9 million, and $16.0 million, respectively, wasthe following amounts were recorded as interest income relating to these notes receivable. receivable (amounts in thousands):
|
| Interest income |
| |
Fiscal 2016 |
| $ | 20,552 |
|
Fiscal 2015 |
| $ | 21,967 |
|
Fiscal 2014 |
| $ | 20,947 |
|
The notes receivable are collateralized by the independent distributors’ distribution rights. Additional details are included in Note 14, Fair Value of Financial Instruments.
Note 6. | Assets Held for Sale |
The company purchases distribution rights from and sells distribution rights to independent distributors from time to time. The company repurchases distribution rights from independent distributors in circumstances when the company decides to exit a territory or, in some cases, when the independent distributor elects to terminate the relationship with the company.company is terminated. In the eventmajority of the Distributor Agreements, if the company decides to exit a territory or stop using the independent distribution model in a territory, the company is contractually required to purchase the distribution rights from the independent distributor. In the event an independent distributor terminates his or her relationship with the company, the company, although not legally obligated, may repurchase and operate those distribution rights as a company-owned territory. The independent distributors may also sell their distribution rights to another person or entity. Distribution rights purchased from independent distributors and operated as company-owned territories are recorded on the company’s Consolidated Balance Sheet in the line item “Assets Held for Sale” while the company actively seeks another independent distributor to purchase the distribution rights for the territory.
Distribution rights held for sale and operated by the company are sold to independent distributors at the fair market value of the distribution rights. In accordance withpursuant to the terms of a Distributor Agreement. There are multiple versions of the applicable Distributor Agreement withinin place at any given time and the six-month period following the dateterms of sale, the independent distributor has the right to require the company to repurchase the distribution rights and truck, if applicable, at the original purchase price paid by the independent distributor. The company records a liability for this amount during the six-month period. The company is not required to repay interest paid by the independent distributor during such six-month period. If the independent distributor’s truck is leased, the company will assume the lease payment (but not the lease) if the distribution rights are repurchased during the six-month period. Should the independent distributor wish to sell the distribution rights after the six-month period has expired, the company has the right of first refusal but is not legally required to purchase the distribution rights. After the six-month period the liability is recorded as deferred income and will be recognized over the term of the distribution rights notes receivable.Distributor Agreements vary.
The company is also selling certain manufacturing facilitiesplants and depots that it acquired in July 2013 from theHostess Brands, Inc., which initially included 20 closed plants and 36 depots (the “Acquired Hostess Bread Assets”). The Acquired Hostess Bread Assets purchased in July 2013. These assets were originally recorded as held and used in the purchase price allocation in Note 8, Acquisitions.allocation. Subsequent to the acquisition of the Acquired Hostess Bread Assets, we determined that some of the acquired manufacturing facilitiesplants and depots do not meet our long-term operating strategy, and we are actively marketing them.them for sale. There are certain other properties not associated with the Acquired Hostess Bread Assets that are also in the process of being sold. These assets are recorded on the Consolidated Balance Sheets in the line item “Assets Held for Sale” and are included in the “Other” line item in the summary table below.
During fiscal 2015,2016, the company received $9.1 million ondecided to sell the saleremainder of five Acquired Hostess Bread Asset depots and manufacturing facilities. During fiscal 2014, the company received $24.2 million on the sale of 22 Acquired Hostess Bread Assets not specifically reserved for future use. As a result, we recorded an impairment of $5.3 million for these plants, depots, and manufacturing facilities.equipment and completed the sale in our fourth quarter of fiscal 2016.
The table below presents the proceeds from the sale of the Acquired Hostess Bread Assets for fiscal years 2016, 2015 and 2014 (amounts in thousands):
|
| Proceeds from sale of Acquired Hostess Bread Assets |
| |
Fiscal 2016 |
| $ | 6,848 |
|
Fiscal 2015 |
| $ | 9,079 |
|
Fiscal 2014 |
| $ | 24,163 |
|
In addition to the impairments for the Acquired Hostess Bread Assets above, during the fourth quarter of our fiscal 2016, we recognized an impairment loss of $4.6 million for the difference between the carrying value and fair value of other assets classified as held for sale.
During the second quarter of fiscal 2014, we decided to sell certain assets at our Ft. Worth, Texas, tortilla facility (the “disposal group”). The company relocated our flour tortilla equipment to an existing manufacturing facility and continues to sell these products through our DSD Segment. The disposal group sale closed on August 13, 2014 for a sale price of $8.4 million in cash. The carrying value of the assets sold was $7.6 million. Assets not included in the disposal group were either transferred to other plants or were scrapped shortly after closing. We recognized an impairment of $2.3 million and $5.8 million for assets held for sale during fiscal years 2015 and 2014, respectively. We recognized an impairment loss on goodwill of $2.6 million and an additional impairment loss of $1.9 million for the scrapped assets during the second quarter of fiscal 2014. These impairments are recorded on the Consolidated Statements of Income in the line item “Impairment of assets”. The total gain on the divestiture was $1.8 million, of which $0.8 million related to property, plant and equipment recorded as held for sale in our second quarter of fiscal 2014, and was recorded on the
Consolidated Statements of Income in the line item “Selling, distribution and administrative expenses”. We also incurred costs of $0.8 million included in the Consolidated Statements of Income line item “Materials, supplies, labor, and other production costs, excluding depreciation” relating to severance and inventory. The total costs for fiscal 2014 relating to the divestiture were $3.5 million.
In addition to the impairments described above, during the fourth quarter of our fiscal 2014, we recognized an impairment loss of $5.8 million for the difference between the carrying value and the fair value of certain Acquired Hostess Bread Assets classified as held for sale.
Additional assets recorded in assets held for sale are for property, plant and equipment exclusive of the amounts disclosed as part of the Acquired Hostess Bread Assets and the disposal group discussed above. Also included in assets held for sale are property, plant and equipment from a non-core mix manufacturing business located in Cedar Rapids, Iowa. The carrying values of assets held for sale are not amortized and are evaluated for impairment as required. The table below presents the assets held for sale as of January 2,December 31, 2016 and January 3, 2015,2, 2016, respectively (amounts in thousands):
|
| January 2, 2016 |
|
| January 3, 2015 |
|
| December 31, 2016 |
|
| January 2, 2016 |
| ||||
Distribution rights |
| $ | 28,325 |
|
| $ | 20,491 |
|
| $ | 31,897 |
|
| $ | 28,325 |
|
Acquired Hostess Bread Assets plants and depots |
|
| 3,082 |
|
|
| 13,406 |
|
|
| 479 |
|
|
| 3,082 |
|
Other |
|
| 4,784 |
|
|
| 5,211 |
|
|
| 4,600 |
|
|
| 4,784 |
|
Total assets held for sale |
| $ | 36,191 |
|
| $ | 39,108 |
|
| $ | 36,976 |
|
| $ | 36,191 |
|
Note 7. | Goodwill and Other Intangible Assets |
The table below summarizes our goodwill and other intangible assets at January 2,December 31, 2016 and January 3, 2015,2, 2016, respectively, each of which is explained in additional detail below (amounts in thousands):
|
| January 2, 2016 |
|
| January 3, 2015 |
|
| December 31, 2016 |
|
| January 2, 2016 |
| ||||
Goodwill |
| $ | 464,926 |
|
| $ | 282,960 |
|
| $ | 465,578 |
|
| $ | 464,926 |
|
Amortizable intangible assets, net of amortization |
|
| 461,466 |
|
|
| 189,969 |
|
|
| 592,964 |
|
|
| 461,466 |
|
Indefinite-lived intangible assets |
|
| 414,000 |
|
|
| 455,000 |
|
|
| 243,000 |
|
|
| 414,000 |
|
Total goodwill and other intangible assets |
| $ | 1,340,392 |
|
| $ | 927,929 |
|
| $ | 1,301,542 |
|
| $ | 1,340,392 |
|
The changes in the carrying amount of goodwill, by segment, during fiscal 20142015 and fiscal 2015,2016, are as follows (amounts in thousands):
|
| DSD Segment |
|
| Warehouse Segment |
|
| Total |
|
| DSD Segment |
|
| Warehouse Segment |
|
| Total |
| ||||||
Balance as of December 28, 2013 |
| $ | 277,927 |
|
| $ | 4,477 |
|
| $ | 282,404 |
| ||||||||||||
Goodwill impairment |
|
| (2,624 | ) |
|
| — |
|
|
| (2,624 | ) | ||||||||||||
Change in goodwill related to an acquisition |
|
| 3,180 |
|
|
| — |
|
|
| 3,180 |
| ||||||||||||
Balance as of January 3, 2015 |
| $ | 278,483 |
|
| $ | 4,477 |
|
| $ | 282,960 |
|
| $ | 278,483 |
|
| $ | 4,477 |
|
| $ | 282,960 |
|
Change in goodwill related to acquisitions |
|
| 145,925 |
|
|
| 36,041 |
|
|
| 181,966 |
|
|
| 145,925 |
|
|
| 36,041 |
|
|
| 181,966 |
|
Balance as of January 2, 2016 |
| $ | 424,408 |
|
| $ | 40,518 |
|
| $ | 464,926 |
|
| $ | 424,408 |
|
| $ | 40,518 |
|
| $ | 464,926 |
|
Change in goodwill related to acquisitions |
|
| 155 |
|
|
| 497 |
|
|
| 652 |
| ||||||||||||
Balance as of December 31, 2016 |
| $ | 424,563 |
|
| $ | 41,015 |
|
| $ | 465,578 |
| ||||||||||||
The $2.6 million goodwill impairment during fiscal 2014 is discussed in Note 6, Assets Held For Sale, and relates to a portion of the DSD Segment’s goodwill allocated to the disposal group. Changes in goodwill related to acquisitions during fiscal 2015 and fiscal 2016 are from DKB in the DSD Segment and Alpine Valley Bread Company (“Alpine”) in the Warehouse Segment and are discussedSegment.
The table below presents the changes to goodwill by acquisition, for the original goodwill amount recorded at acquisition, from January 3, 2015 to January 2, 2016 (amounts in Note 8, Acquisitions.thousands):
|
| DKB |
|
| Alpine |
|
| Total |
| |||
Change in goodwill during fiscal 2015 |
| $ | 145,925 |
|
| $ | 36,041 |
|
| $ | 181,966 |
|
The table below presents the changes to goodwill by acquisition from January 2, 2016 to December 28, 2013 to January 3, 201531, 2016 (amounts in thousands):
|
| Acquired Hostess Assets |
| |
Adjustment for spare parts and final fair value assessment |
| $ | (3,503 | ) |
Adjustment to property, plant and equipment |
|
| 6,683 |
|
Change in goodwill during fiscal 2014 |
| $ | 3,180 |
|
|
| DKB |
|
| Alpine |
|
| Total |
| |||
Working capital adjustments |
| $ | 60 |
|
| $ | 497 |
|
| $ | 557 |
|
Acquisition-related tax adjustments |
|
| (315 | ) |
|
| — |
|
|
| (315 | ) |
Adjustment to property, plant and equipment |
|
| 410 |
|
|
| — |
|
|
| 410 |
|
Change in goodwill during fiscal 2016 |
| $ | 155 |
|
| $ | 497 |
|
| $ | 652 |
|
As of December 31, 2016 and January 2, 2016, and January 3, 2015, the company had the following amounts related to amortizable intangible assets (amounts in thousands):
|
| January 2, 2016 |
|
| January 3, 2015 |
|
| December 31, 2016 |
|
| January 2, 2016 |
| ||||||||||||||||||||||||||||||||||||
Asset |
| Cost |
|
| Accumulated Amortization |
|
| Net Value |
|
| Cost |
|
| Accumulated Amortization |
|
| Net Value |
|
| Cost |
|
| Accumulated Amortization |
|
| Net Value |
|
| Cost |
|
| Accumulated Amortization |
|
| Net Value |
| ||||||||||||
Trademarks |
| $ | 246,327 |
|
| $ | 18,037 |
|
| $ | 228,290 |
|
| $ | 71,727 |
|
| $ | 14,152 |
|
| $ | 57,575 |
|
| $ | 402,327 |
|
| $ | 25,129 |
|
| $ | 377,198 |
|
| $ | 246,327 |
|
| $ | 18,037 |
|
| $ | 228,290 |
|
Customer relationships |
|
| 281,621 |
|
|
| 51,650 |
|
|
| 229,971 |
|
|
| 169,921 |
|
|
| 41,099 |
|
|
| 128,822 |
|
|
| 281,621 |
|
|
| 68,163 |
|
|
| 213,458 |
|
|
| 281,621 |
|
|
| 51,650 |
|
|
| 229,971 |
|
Non-compete agreements |
|
| 4,874 |
|
|
| 4,043 |
|
|
| 831 |
|
|
| 4,274 |
|
|
| 3,351 |
|
|
| 923 |
|
|
| 4,874 |
|
|
| 4,666 |
|
|
| 208 |
|
|
| 4,874 |
|
|
| 4,043 |
|
|
| 831 |
|
Distributor relationships |
|
| 4,123 |
|
|
| 1,749 |
|
|
| 2,374 |
|
|
| 4,123 |
|
|
| 1,474 |
|
|
| 2,649 |
|
|
| 4,123 |
|
|
| 2,023 |
|
|
| 2,100 |
|
|
| 4,123 |
|
|
| 1,749 |
|
|
| 2,374 |
|
Total |
| $ | 536,945 |
|
| $ | 75,479 |
|
| $ | 461,466 |
|
| $ | 250,045 |
|
| $ | 60,076 |
|
| $ | 189,969 |
|
| $ | 692,945 |
|
| $ | 99,981 |
|
| $ | 592,964 |
|
| $ | 536,945 |
|
| $ | 75,479 |
|
| $ | 461,466 |
|
As of December 31, 2016 and January 2, 2016, and January 3, 2015, there was $414.0$243.0 million and $455.0$414.0 million, respectively, of indefinite-lived intangible trademark assets separately identified from goodwill. These trademarks are classified as indefinite-lived because theythere is no foreseeable limit to the period over which the asset is expected to contribute to our cash flows. They are well established brands, many older than forty years old, with a long history and well defined markets. In addition, we are continuing to use these brands both in their original markets and throughout our expansion territories. We believe these factors support an indefinite-life assignment with an annual impairment analysis to determine if the trademarks are realizing their expected economic benefits.
DuringThe company’s core markets were flat in fiscal 2016. As a result, we noticed that several of our brands were performing below expectations in the back half of the year. This was caused primarily from our regional brands that were negatively impacted by our national brands and the flat market in general. Concurrent with our annual impairment test, the company was also undergoing an enterprise-wide business and operational review. The diagnostic phase of this review was completed in our fourth quarter and included a brand rationalization study that impacts certain trademarks’ future revenue projections. This study included examining which brands will be part of a national or regional focus. We included the potential impact of this study in our fiscal 2015, we reviewedexpected results while performing our long-term strategyannual impairment test for all of our organic bread brands. We purchasedindefinite-lived intangible trademark assets. This led to a $15.0 million impairment charge of three indefinite-lived trademarks. This study is ongoing and may impact future periods. Following this impairment, the Barowsky’s brand, which included certain organic products, in fiscal 2012. We originally intended to distribute that brand nationally throughout our territory. The acquisitions ofcompany evaluated the Dave’s Killer Bread (“DKB”)indefinite-lived classification and Alpine Valley Bread Company (“Alpine”) organic brands in our third and fourth quarter, respectively, of fiscal 2015 caused us to review our organic bread brands strategy. As a result, the DKB brand will be distributed through our DSD Segment and the Alpine brand will be distributed through our Warehouse Segment. The Barowsky’s brand will remain a more regional bread brand. Since the asset will not be used as originally intended we examined the indefinite-life assignment and we determined that it is appropriatethe three trademarks which were impaired
should be reassigned as finite-lived assets with an estimated useful life of forty years each. We do not intend to begin amortizing this brand. Beginning indiscontinue using these trademarks; however, our fourth quarter the Barowsky’s brand began being amortized over a 35 year straight-line attribution period.expectation of limiting them to each of their respective core markets impacts their growth potential. The change in strategy still reflects that the estimatedcarrying value of these three trademarks, before impairment, was $171.0 million. The fair value exceedsof these three trademarks was $156.0 million during our test. The difference between the carrying value and the fair value resulted in a $15.0 million impairment. The remaining indefinite-lived intangible trademark assets all had fair values in excess of their respective carrying values so anno impairment charge was not applicable.recognized.
Net amortizationAmortization expense for fiscal 2016, 2015, 2014, and 20132014 was as follows (amounts in thousands):
|
| Fiscal 2015 |
|
| Fiscal 2014 |
|
| Fiscal 2013 |
| |||
Total |
| $ | 15,403 |
|
| $ | 11,741 |
|
| $ | 11,741 |
|
|
| Amortization expense |
| |
Fiscal 2016 |
| $ | 24,502 |
|
Fiscal 2015 |
| $ | 15,403 |
|
Fiscal 2014 |
| $ | 11,740 |
|
Estimated amortization of intangibles for 20162017 and the next four years thereafter is as follows (amounts in thousands):
|
| Amortization of Intangibles |
| |||||
2016 |
| $ | 24,485 |
| ||||
Fiscal year |
| Amortization of Intangibles |
| |||||
2017 |
| $ | 23,578 |
|
| $ | 27,495 |
|
2018 |
| $ | 22,878 |
|
| $ | 26,778 |
|
2019 |
| $ | 22,385 |
|
| $ | 26,285 |
|
2020 |
| $ | 21,893 |
|
| $ | 25,776 |
|
2021 |
| $ | 25,300 |
| ||||
Note 8. | Acquisitions |
Alpine Valley Bread Company
On October 13, 2015, the company completed the acquisition of 100% of the outstanding common stock of Alpine, a leading organic bread baker, from its shareholders for total consideration of approximately $121.9 million inclusive of payments for certain tax benefits. We paid cash of $109.3 million and issued 481,540 shares of our common stock to the sellers in a private placement. We believe the acquisition of Alpine strengthens our position as the second-largest baker in the U.S. by giving us access to the fast growing organic bread category. The Alpine acquisition has been accounted for as a business combination and is included in our Warehouse Segment. The results of Alpine’s operations are included in the company’s Consolidated Financial Statements beginning on October 14, 2015. The total preliminary goodwill recorded for this acquisition was $36.0$36.5 million and it is deductible for tax purposes.
During fiscal 2015, the company incurred $1.6 million of acquisition-related costs for Alpine. The acquisition-related costs for Alpine arewere recorded in the selling, distribution and administrative expense line item in our Consolidated Statements of Income. Alpine
contributed $11.9 million in sales during fiscal 2015. Alpine’s operating income since the acquisition was immaterial to our fiscal 2015 results of operations.
The following table summarizes the consideration paid for Alpine based on the fair value at the acquisition date. This table is based on preliminary valuations for the assets acquired and liabilities assumed. The identifiable intangible assets, property, plant and equipment, and certain financial assets are still under review. We will continue reviewing the final recognized amounts of identifiable assets acquired and liabilities assumeddate (amounts in thousands):
Fair Value of consideration transferred: |
|
|
| �� |
|
|
Cash consideration paid | $ | 109,340 |
| $ | 109,340 |
|
Stock consideration paid |
| 12,602 |
|
| 12,602 |
|
Total consideration paid |
| 121,942 |
|
| 121,942 |
|
Recognized amounts of identifiable assets acquired and liabilities assumed: |
|
|
|
|
|
|
Property, plant, and equipment |
| 15,614 |
|
| 15,614 |
|
Identifiable intangible assets |
| 64,600 |
|
| 64,600 |
|
Financial assets |
| 5,687 |
|
| 5,190 |
|
Net recognized amounts of identifiable assets acquired |
| 85,901 |
|
| 85,404 |
|
Goodwill | $ | 36,041 |
| $ | 36,538 |
|
A measurement period adjustment of $0.5 million related to working capital was recorded in our third quarter of fiscal 2016 and is reflected in the table above. See Note 7, Goodwill and Other Intangible Assets, for the impact of this adjustment.
The following table presents the acquired intangible assets subject to amortization (amounts in thousands, except amortization periods):
|
| Total |
|
| Weighted average amortization years |
|
| Attribution Method |
| Total |
|
| Weighted average amortization years |
|
| Attribution Method | ||||
Trademarks |
| $ | 20,900 |
|
|
| 40.0 |
|
| Straight-line |
| $ | 20,900 |
|
|
| 40.0 |
|
| Straight-line |
Customer relationships |
|
| 43,700 |
|
|
| 25.0 |
|
| Sum of year digits |
|
| 43,700 |
|
|
| 25.0 |
|
| Sum of year digits |
|
| $ | 64,600 |
|
|
| 29.9 |
|
|
|
| $ | 64,600 |
|
|
| 29.9 |
|
|
|
Alpine operates two production facilities in Mesa, Arizona and has widespread distribution across the U.S. The primary reason for the acquisition was to purchase a brand of organic bakery products in the U.S. and to add organic production capacity.
The fair value of trade receivables iswas $4.8 million. The gross amount of the receivable iswas $4.8 million with an immaterial amount determined to be uncollectible. We did not acquire any other class of receivables as a result of the acquisition.
Dave’s Killer Bread
On September 12, 2015, the company completed the acquisition of 100% of the outstanding common stock of Dave’s Killer Bread (“DKB”), the nation’s best-selling organic bread, from its shareholders for total cash payments of approximately $282.1 million inclusive of payments for certain tax benefits. We believe the acquisition of DKB strengthens our position as the second-largest baker in the U.S. by giving us access to the fast growing organic bread category and expanding our geographic reach into the Pacific Northwest. The DKB acquisition has been accounted for as a business combination and is included in our DSD Segment. The results of DKB’s operations are included in the company’s Consolidated Financial Statements beginning on September 13, 2015. The total preliminary goodwill recorded for this acquisition was $145.9$146.1 million and it is not deductible for tax purposes.
During fiscal 2015, the company incurred $4.6 million of acquisition-related costs for DKB. The acquisition-related costs for DKB are recorded in the selling, distribution and administrative expense line item in our Consolidated Statements of Income. DKB contributed $37.6 million in sales during fiscal 2015. DKB’s operating income since the acquisition was immaterial to our fiscal 2015 results of operations.
The following table summarizes the consideration paid for DKB based on the fair value at the acquisition date. This table is based on preliminary valuations for the assets acquired and liabilities assumed. The identifiable intangible assets and certain financial assets are still under review. We will continue reviewing the final recognized amounts of identifiable assets acquired and liabilities assumeddate (amounts in thousands):
Fair Value of consideration transferred: |
|
|
|
|
|
|
Cash consideration paid | $ | 282,115 |
| $ | 282,115 |
|
Recognized amounts of identifiable assets acquired and liabilities assumed: |
|
|
|
|
|
|
Property, plant, and equipment |
| 9,769 |
|
| 9,359 |
|
Identifiable intangible assets |
| 176,300 |
|
| 176,300 |
|
Deferred income taxes |
| (60,142 | ) |
| (59,827 | ) |
Financial assets |
| 10,263 |
|
| 10,203 |
|
Net recognized amounts of identifiable assets acquired |
| 136,190 |
|
| 136,035 |
|
Goodwill | $ | 145,925 |
| $ | 146,080 |
|
Measurement period adjustments of $0.2 million related to working capital, tax adjustments, and property, plant and equipment were recorded in our third quarter of fiscal 2016 and are reflected in the table above. See Note 7, Goodwill and Other Intangible Assets, for the impact of these adjustments.
The following table presents the acquired intangible assets subject to amortization (amounts in thousands, except amortization periods):
|
| Total |
|
| Weighted average amortization years |
|
| Attribution Method |
| Total |
|
| Weighted average amortization years |
|
| Attribution Method | ||||
Trademarks |
| $ | 107,700 |
|
|
| 40.0 |
|
| Straight-line |
| $ | 107,700 |
|
|
| 40.0 |
|
| Straight-line |
Customer relationships |
|
| 68,000 |
|
|
| 25.0 |
|
| Sum of year digits |
|
| 68,000 |
|
|
| 25.0 |
|
| Sum of year digits |
Non-compete agreements |
|
| 600 |
|
|
| 2.0 |
|
| Straight-line |
|
| 600 |
|
|
| 2.0 |
|
| Straight-line |
|
| $ | 176,300 |
|
|
| 34.1 |
|
|
|
| $ | 176,300 |
|
|
| 34.1 |
|
|
|
DKB operates one production facility in Milwaukie, Oregon and has widespread distribution across the U.S. and Canada. The primary reason for the acquisition was to purchase the leading brand of organic bakery products in the U.S.
The fair value of trade receivables iswas $14.2 million. The gross amount of the receivable iswas $14.4 million of which $0.2 million iswas determined to be uncollectible. We did not acquire any other class of receivables as a result of the acquisition.
Unaudited pro forma consolidated results of operations for the DKB and Alpine acquisitions are not included because the company determined that they are immaterial individually and in the aggregate.
Modesto acquisition
On July 27, 2013, the company completed the acquisition of a bun line in Modesto, California that serves the California market for a total cash payment of $10.3 million. This acquisition is included in our DSD Segment and the total goodwill recorded for this acquisition was $4.2 million.
Acquired Hostess Bread Assets
On July 19, 2013, the company completed its acquisition of Hostess’ Wonder, Nature’s Pride, Merita, Home Pride, and Butternut bread brands, 20 closed bakeries, and 36 depots (the “Acquired Hostess Bread Assets”) for a total cash payment of $355.3 million.
The company had filed a complaint in July 2008 alleging that Hostess infringed upon Flowers Foods’ Nature’s Own trademark by using or intending to use the Nature’s Pride trademark. This lawsuit was settled at the closing of the Acquired Hostess Bread Assets acquisition, and we recorded a $1.4 million gain during the third quarter of our fiscal 2013 to reflect our estimate of the settlement fair value, determined as the saved future legal expenses as a result of the settlement, at closing. The gain was recorded in selling, distribution and administrative expense in our Condensed Consolidated Statements of Income.
We believe the acquisition of the Acquired Hostess Bread Assets strengthens the company’s position as the second-largest baker in the U.S. by adding brands and bakeries that are expected to enhance our ability to steadily expand the geographic reach of our fresh breads, buns, and rolls into new markets. The Acquired Hostess Bread Assets are included in our DSD Segment. Late in the third
quarter of fiscal 2013, we began to re-introduce these acquired brands through our DSD Segment and are continuing to do so in new markets as we expand into new regions of the country.
During fiscal 2013, the company incurred $16.0 million of acquisition-related costs for the Acquired Hostess Bread Assets. A second proposed Hostess asset purchase agreement provided for the purchase of the Beefsteak brand for $30.0 million. This second agreement was topped by another bidder and the agreement terminated. In connection with this termination we received a break-up fee of $0.9 million during the first quarter of fiscal 2013. The acquisition-related costs for the Acquired Hostess Assets and the break-up fee related to the second proposed Hostess acquisition are recorded in the selling, distribution and administrative expense line item in our Condensed Consolidated Statements of Income.
The following table summarizes the consideration paid for the Acquired Hostess Bread Assets and liabilities assumed based on the fair value at the acquisition date (amounts in thousands):
Fair value of consideration transferred: |
|
|
|
|
Cash consideration transferred |
| $ | 355,342 |
|
Recognized amounts of identifiable assets acquired and liabilities assumed: |
|
|
|
|
Property, plant, and equipment |
| $ | 153,990 |
|
Identifiable intangible assets |
|
| 189,000 |
|
Financial assets |
|
| 5,153 |
|
Net recognized amounts of identifiable assets acquired |
| $ | 348,143 |
|
Gain on legal settlement |
|
| (1,400 | ) |
Net recognized amounts of identifiable assets acquired and gain on settlement |
| $ | 346,743 |
|
Goodwill |
| $ | 8,599 |
|
The goodwill is deductible for tax purposes and is included in our DSD Segment. Sales were $26.6 million during fiscal 2013, when the brands were reintroduced, for the brands acquired as part of the Acquired Hostess Bread Assets. The identified intangible assets in the table above are for trademarks that were assigned indefinite lives and are discussed in Note 7, Goodwill and Other Intangible Assets.
The table below presents the changes to goodwill from December 28, 2013 to January 3, 2015 for the Acquired Hostess Bread Assets (amounts in thousands):
Goodwill reported on December 28, 2013 for the Acquired Hostess Bread Assets |
| $ | 5,419 |
|
Changes in goodwill for spare parts and final fair value adjustments |
|
| (3,503 | ) |
Changes in goodwill for property, plant and equipment final fair value adjustments |
|
| 6,683 |
|
Net changes to goodwill |
| $ | 3,180 |
|
Final Acquired Hostess Bread Assets goodwill |
| $ | 8,599 |
|
Sara Lee California and Earthgrains acquisition of trademark licenses
On February 23, 2013, the company completed its acquisition from BBU, Inc., a subsidiary of Grupo Bimbo (“BBU”), of (1) perpetual, exclusive, and royalty-free licenses to the Sara Lee and Earthgrains brands for sliced breads, buns, and rolls in the state of California and (2) a closed bakery in Stockton, California for a total cash payment of $50.0 million. In addition, we received a perpetual, exclusive, and royalty-free license to the Earthgrains brand for a broad range of fresh bakery products in the Oklahoma City, Oklahoma market area. The acquisition of the Oklahoma license was completed during fiscal 2012 for immaterial consideration. The results of operations of these acquisitions are included in our DSD Segment.
The following table summarizes the consideration paid to acquire these licenses and the amounts of identified assets acquired and liabilities assumed based on the fair value at the acquisition date (amounts in thousands):
Fair value of consideration transferred: |
|
|
|
|
Cash consideration transferred |
| $ | 49,950 |
|
Contingently refundable consideration (the “holdback”) |
|
| (7,600 | ) |
Total consideration, net |
| $ | 42,350 |
|
Recognized amounts of identifiable assets acquired and liabilities assumed: |
|
|
|
|
Property, plant, and equipment |
| $ | 6,476 |
|
Identifiable intangible assets |
|
| 117,290 |
|
Deferred income taxes, net |
|
| (31,345 | ) |
Net recognized amounts of identifiable assets acquired |
| $ | 92,421 |
|
Bargain purchase gain |
| $ | 50,071 |
|
The following table presents the acquired intangible assets (amounts in thousands, except amortization periods):
|
| Total |
|
| Weighted average amortization years |
|
| Attribution Method | ||
Trademarks |
| $ | 79,500 |
|
| N/A |
|
| Indefinite life | |
Customer relationships |
|
| 12,000 |
|
|
| 21.0 |
|
| Sum of year digits |
Distribution rights |
|
| 25,790 |
|
| N/A |
|
| N/A | |
|
| $ | 117,290 |
|
|
|
|
|
|
|
The primary reason for this acquisition was to expand the company’s footprint into the California markets. The trademarks are non-amortizable assets and the customer relationships are being amortized over 21 years. The distribution rights were reclassified to assets held for sale immediately after the acquisition. We believe the acquisition resulted in a bargain purchase because the U.S. Department of Justice (the “DOJ”) required BBU to divest these assets, which resulted in a more favorable price to us than may have resulted from an arms-length negotiation. The bargain purchase gain is recognized in the line item “Gain on Acquisition”.
During the third quarter of fiscal 2013 we recorded a measurement period adjustment related to the distribution rights. The fair value of the distribution rights was reduced by $2.0 million as additional information became available. This reduction decreased the amount of the bargain purchase gain by $1.2 million, which is net of deferred taxes of $0.8 million. The measurement period adjustment was recorded as a revision to our first quarter 2013 Condensed Consolidated Balance Sheet and the Condensed Consolidated Statements of Income.
The asset purchase agreement included a holdback provision (the “holdback”) in the amount of $10.0 million of the cash consideration paid at closing that remained in escrow until disbursed based on the possible occurrence of one of two triggering events. The purpose of the holdback was to encourage the company to increase production capacity serving the California market. The first triggering event related to the co-pack arrangement and the second triggering event related to the possible opening of the acquired Stockton Bakery. We entered into a co-pack arrangement with BBU at the acquisition date under which BBU was required to supply the company with Sara Lee branded product in California and Earthgrains branded product for a period of up to 18 months ending August 17, 2014. If we terminated the co-pack agreement (“co-pack decision”) or reopened the Stockton Bakery (“bakery decision”), potential payments from the holdback would be made to us. The amount of such payments was determined based on the company making the co-pack decision and/or the bakery decision by certain specified dates. The total amount available under the holdback was capped at $10.0 million. The table below reflects the potential payments to us under each scenario (amounts in thousands):
|
| February 23, 2013 – November 20, 2013 |
|
| November 21, 2013 – February 18, 2014 |
|
| February 19, 2014 – May 19, 2014 |
|
| May 20, 2014 – August 17, 2014 |
| ||||
Co-pack decision |
| $ | 10,000 |
|
| $ | 7,500 |
|
| $ | 5,000 |
|
| $ | — |
|
Bakery decision |
| $ | 10,000 |
|
| $ | 10,000 |
|
| $ | 7,500 |
|
| $ | 5,000 |
|
If we did not make the co-pack decision by May 19, 2014 or did not make the bakery decision by August 17, 2014, any remaining amount of the holdback would be distributed to BBU. The holdback fair value of $7.6 million represented our assessment, at the time of acquisition for inclusion into the purchase price allocation, of the probability that we would terminate the co-pack arrangement and/or open the Stockton bakery. This probability was assessed at each reporting period and changes in the fair value of the holdback were recorded through earnings in the period of change. There were no changes as a result of the probability assessment
in the second or third quarter of fiscal 2013. We initially notified BBU of our intent to terminate the co-pack agreement during the fourth quarter of fiscal 2013 and, upon completion of these notifications, we received $7.5 million during the first quarter of fiscal 2014. This holdback amount was recorded as a current receivable at December 28, 2013 on the Consolidated Balance Sheet. As a result of our initial notification, during the fourth quarter of fiscal 2013, we recorded a $0.1 million reduction to the fair value of the holdback (recorded in selling, distribution and administrative expense). The final delivery date under the supply agreement was February 14, 2014.
Sales from the Sara Lee California and Earthgrains acquisitions during fiscal 2013 were $79.7 million. We incurred $1.5 million in acquisition-related costs during fiscal 2013. These expenses were included in the selling, distribution and administrative line item in the company’s Consolidated Statement of Income for fiscal 2013. Since the acquisition date, we developed distribution rights for territories to sell to independent distributors who serve California. The territory development took place in several phases in fiscal 2013. Amounts received upon sale of these distribution rights are shown in our Consolidated Statement of Cash Flows as an investing activity.
Acquisition pro formas
We determined that the consolidated results of operations for the DKB and Alpine acquisitions are immaterial in the aggregate and the pro forma financial statements are not required for fiscal 2015. The following unaudited pro forma consolidated results of operations have been prepared as if the acquisition of Lepage and of the Acquired Hostess Bread Assets occurred at the beginning of fiscal 2012. Unaudited pro forma consolidated results of operations for the Sara Lee California and Earthgrains asset acquisitions are not included because the company determined that they are immaterial. Hostess filed for bankruptcy and ceased operations in November 2012 (the “Hostess Shutdown”). As a result, there were no sales related to the Acquired Hostess Assets for fiscal 2013 because of the Hostess Shutdown and there is no data to include in the pro forma presentation below. The acquisitions’ results from operations were included in our Consolidated Statements of Income during fiscal 2014 and, as a result, no pro forma data is presented (amounts in thousands, except per share data):
|
| Fiscal 2013 |
| |
|
| 52 weeks |
| |
Sales: |
|
|
|
|
As reported |
| $ | 3,732,616 |
|
Pro forma |
| $ | 3,732,616 |
|
Net income: |
|
|
|
|
As reported |
| $ | 230,894 |
|
Pro forma |
| $ | 227,076 |
|
Basic net income per common share: |
|
|
|
|
As reported |
| $ | 1.11 |
|
Pro forma |
| $ | 1.09 |
|
Diluted net income per common share: |
|
|
|
|
As reported |
| $ | 1.09 |
|
Pro forma |
| $ | 1.07 |
|
These amounts have been calculated after applying the company’s accounting policies and adjusting the results to reflect additional depreciation and amortization that would have been charged assuming the fair value adjustments to property, plant, and equipment, and amortizable intangible assets had been applied. In addition, pro forma adjustments have been made for the interest incurred for financing the acquisitions with either the credit facility or the senior notes. Taxes have also been adjusted for the effect of the items discussed. These pro forma results of operations have been prepared for comparative purposes only, and they do not purport to be indicative of the results of operations that actually would have resulted had the acquisition occurred on the date indicated or that may result in the future.
The company measures the fair value of its derivative portfolio by using the price that would be received to sell an asset or paid to transfer a liability in the principal market for that asset or liability. These measurements are classified into a hierarchy by the inputs used to perform the fair value calculation as follows:
Level 1: Fair value based on unadjusted quoted prices for identical assets or liabilities at the measurement date
Level 2: Modeled fair value with model inputs other than quoted prices included within Level 1 that are observable for the asset or liability, either directly or indirectly
Level 3: Modeled fair value with unobservable model inputs that are used to estimate the fair value of the asset or liability
Commodity Price Risk
The company enters into commodity derivatives, designated as cash-flow hedges of existing or future exposure to changes in commodity prices. The company’s primary raw materials are flour, sweeteners, and shortening, along with pulp, paper, and petroleum-based packaging products. Natural gas, which is used as oven fuel, is also an important commodity used for production.
As of January 2,December 31, 2016, the company’s commodity hedge portfolio contained derivatives which are recorded in the following accounts with fair values measured as indicated (amounts in thousands):
|
| Level 1 |
|
| Level 2 |
|
| Level 3 |
|
| Total |
|
| Level 1 |
|
| Level 2 |
|
| Level 3 |
|
| Total |
| ||||||||
Assets: |
|
|
|
|
|
|
|
|
|
|
|
|
|
|
|
| ||||||||||||||||
Other current |
| $ | 1,576 |
|
| $ | — |
|
| $ | — |
|
| $ | 1,576 |
| ||||||||||||||||
Other long-term |
|
| 35 |
|
|
| — |
|
|
| — |
|
|
| 35 |
| ||||||||||||||||
Total |
| $ | 1,611 |
|
| $ | — |
|
| $ | — |
|
| $ | 1,611 |
| ||||||||||||||||
Liabilities: |
|
|
|
|
|
|
|
|
|
|
|
|
|
|
|
|
|
|
|
|
|
|
|
|
|
|
|
|
|
|
|
|
Other current |
| $ | 11,926 |
|
| $ | 2,941 |
|
| $ | — |
|
| $ | 14,867 |
|
| $ | (2,435 | ) |
| $ | — |
|
| $ | — |
|
| $ | (2,435 | ) |
Other long-term |
|
| 20 |
|
|
| — |
|
|
| — |
|
|
| 20 |
|
|
| — |
|
|
| — |
|
|
| — |
|
|
| — |
|
Total |
|
| 11,946 |
|
|
| 2,941 |
|
|
| — |
|
|
| 14,887 |
|
|
| (2,435 | ) |
|
| — |
|
|
| — |
|
|
| (2,435 | ) |
Net Fair Value |
| $ | 11,946 |
|
| $ | 2,941 |
|
| $ | — |
|
| $ | 14,887 |
|
| $ | (824 | ) |
| $ | — |
|
| $ | — |
|
| $ | (824 | ) |
As of January 3, 2015,2, 2016, the company’s commodity hedge portfolio contained derivatives which are recorded in the following accounts with fair values measured as indicated (amounts in thousands):
|
| Level 1 |
|
| Level 2 |
|
| Level 3 |
|
| Total |
|
| Level 1 |
|
| Level 2 |
|
| Level 3 |
|
| Total |
| ||||||||
Liabilities: |
|
|
|
|
|
|
|
|
|
|
|
|
|
|
|
|
|
|
|
|
|
|
|
|
|
|
|
|
|
|
|
|
Other current |
| $ | 10,873 |
|
| $ | 2,025 |
|
| $ | — |
|
| $ | 12,898 |
|
| $ | (11,926 | ) |
| $ | (2,941 | ) |
| $ | — |
|
| $ | (14,867 | ) |
Other long-term |
|
| 2,057 |
|
|
| 1,298 |
|
|
| — |
|
|
| 3,355 |
|
|
| (20 | ) |
|
| — |
|
|
| — |
|
|
| (20 | ) |
Net Fair Value |
| $ | 12,930 |
|
| $ | 3,323 |
|
| $ | — |
|
| $ | 16,253 |
|
| $ | (11,946 | ) |
| $ | (2,941 | ) |
| $ | — |
|
| $ | (14,887 | ) |
The positions held in the portfolio are used to hedge economic exposure to changes in various raw materials and production input prices and effectively fixes the price, or limits increases in prices, for a period of time extending into fiscal 2017.2018. These instruments are designated as cash-flow hedges. See Note 2, Summary of Significant Accounting Policies, for the accounting treatment of these hedged transactions.
Interest Rate Risk
The company entered into treasury rate locks on August 5, 2016 and August 8, 2016 to fix the interest rate for the 3.5% senior notes due 2026 (“2026 notes”) issued on September 28, 2016. The derivative positions were closed when the debt was priced on September 23, 2016 with a cash settlement net receipt of $1.0 million that offset changes in the benchmark treasury rate between execution of the treasury rate locks and the debt pricing date. These rate locks were designated as a cash flow hedge. During fiscal 2016, the company recognized $0.1 million of ineffectiveness due to issuing the debt earlier than the settlement date of the treasury locks. The ineffectiveness amount is reported as a selling, distribution, and administrative expense in our Consolidated Statements of Income.
The company entered into a treasury rate lock on March 28, 2012 to fix the interest rate for the 4.375% senior notes due 2022 (“2022 notes”) issued on April 3, 2012. The derivative position was closed when the debt was priced on March 29, 2012 with a cash settlement that offset changes in the benchmark treasury rate between the execution of the treasury rate lock and the debt pricing date. This treasury rate lock was designated as a cash flow hedgehedge.
The following table outlines the company’s derivatives which were hedging the risk of changes in forecasted interest payments on forecasted issuance of long-term debt (amounts in thousands, before tax, and the cash settlement was $3.1 million, of which $0.6 million was recognized after debt issuancean asset is a positive value and $2.5 million ($1.5 million, net of tax)a liability is being amortized to interest expense over the term of the notes.a negative value):
Terminated |
| Description |
| Aggregate Notional Amount |
|
| Fair Value When Terminated |
|
| Fair Value Deferred in AOCI (1) |
|
| Ineffective Portion at Termination |
| ||||
April/2012 |
| Treasury lock |
| $ | 500,000 |
|
| $ | (3,137 | ) |
| $ | 2,510 |
|
| $ | 627 |
|
September/2016 |
| Treasury lock |
| $ | 200,000 |
|
| $ | 1,298 |
|
| $ | (1,298 | ) |
| $ | — |
|
September/2016 |
| Treasury lock |
| $ | 150,000 |
|
| $ | (323 | ) |
| $ | 215 |
|
| $ | 108 |
|
(1) | The amount reported in AOCI will be reclassified to interest expense as interest payments are made on the related notes. |
Derivative Assets and Liabilities
The company had the following derivative instruments recorded on the Consolidated Balance Sheet, all of which are utilized for the risk management purposes detailed above (amounts in thousands):
|
| Derivative Liabilities |
|
| Derivative Assets |
| ||||||||||||||||||
|
| January 2, 2016 |
|
| January 3, 2015 |
|
| December 31, 2016 |
|
| January 2, 2016 |
| ||||||||||||
Derivatives Designated as Hedging Instruments |
| Balance Sheet Location |
| Fair Value |
|
| Balance Sheet Location |
| Fair Value |
|
| Balance Sheet Location |
| Fair Value |
|
| Balance Sheet Location |
| Fair Value |
| ||||
Commodity contracts |
| Other current liabilities |
| $ | 14,867 |
|
| Other current liabilities |
| $ | 12,898 |
|
| Other current assets |
| $ | 1,576 |
|
| Other current assets |
| $ | — |
|
Commodity contracts |
| Other long-term liabilities |
|
| 20 |
|
| Other long-term liabilities |
|
| 3,355 |
|
| Other long-term assets |
|
| 35 |
|
| Other long-term assets |
|
| — |
|
Total |
|
|
| $ | 14,887 |
|
|
|
| $ | 16,253 |
|
|
|
| $ | 1,611 |
|
|
|
| $ | — |
|
|
| Derivative Liabilities |
| |||||||||
|
| December 31, 2016 |
|
| January 2, 2016 |
| ||||||
Derivatives Designated as Hedging Instruments |
| Balance Sheet Location |
| Fair Value |
|
| Balance Sheet Location |
| Fair Value |
| ||
Commodity contracts |
| Other current liabilities |
| $ | 2,435 |
|
| Other current liabilities |
| $ | 14,867 |
|
Commodity contracts |
| Other long-term liabilities |
|
| — |
|
| Other long-term liabilities |
|
| 20 |
|
Total |
|
|
| $ | 2,435 |
|
|
|
| $ | 14,887 |
|
Derivative Accumulated Other Comprehensive Income (“AOCI”) transactions
The company had the following derivative instruments for deferred gains and (losses) on closed contracts and the effective portion for changes in fair value recorded in AOCI (no amounts were excluded from the effectiveness test), all of which are utilized for the risk management purposes detailed above (amounts in thousands and net of tax):
|
| Amount of Gain or (Loss) Recognized in OCI on Derivatives (Effective Portion)(Net of tax) |
|
| Amount of Gain or (Loss) Recognized in OCI on Derivatives (Effective Portion)(Net of tax) |
| ||||||||||||||||||
Derivatives in Cash Flow Hedging Relationships |
| Fiscal 2015 |
|
| Fiscal 2014 |
|
| Fiscal 2013 |
|
| Fiscal 2016 |
|
| Fiscal 2015 |
|
| Fiscal 2014 |
| ||||||
Interest rate contracts |
| $ | — |
|
| $ | — |
|
| $ | (205 | ) |
| $ | 666 |
|
| $ | — |
|
| $ | — |
|
Commodity contracts |
|
| (4,195 | ) |
|
| (3,358 | ) |
|
| (24,252 | ) |
|
| 5,064 |
|
|
| (4,195 | ) |
|
| (3,358 | ) |
Total |
| $ | (4,195 | ) |
| $ | (3,358 | ) |
| $ | (24,457 | ) |
| $ | 5,730 |
|
| $ | (4,195 | ) |
| $ | (3,358 | ) |
|
| Amount of (Gain) or Loss Reclassified from Accumulated OCI into Income (Effective Portion)(Net of tax) |
|
| Location of (Gain) or Loss Reclassified from AOCI into Income |
| Amount of (Gain) or Loss Reclassified from Accumulated OCI into Income (Effective Portion)(Net of tax) |
|
| Location of (Gain) or Loss Reclassified from AOCI into Income | ||||||||||||||||||
Derivatives in Cash Flow Hedging Relationships |
| Fiscal 2015 |
|
| Fiscal 2014 |
|
| Fiscal 2013 |
|
| (Effective Portion) |
| Fiscal 2016 |
|
| Fiscal 2015 |
|
| Fiscal 2014 |
|
| (Effective Portion) | ||||||
Interest rate contracts |
| $ | 154 |
|
| $ | 157 |
|
| $ | 502 |
|
| Interest expense (income) |
| $ | 135 |
|
| $ | 154 |
|
| $ | 157 |
|
| Interest expense (income) |
Commodity contracts |
|
| 5,259 |
|
|
| 3,209 |
|
|
| 16,639 |
|
| Production costs (1) |
|
| 3,264 |
|
|
| 5,259 |
|
|
| 3,209 |
|
| Production costs (1) |
Total |
| $ | 5,413 |
|
| $ | 3,366 |
|
| $ | 17,141 |
|
|
|
| $ | 3,399 |
|
| $ | 5,413 |
|
| $ | 3,366 |
|
|
|
1. | Included in Materials, supplies, labor and other production costs (exclusive of depreciation and amortization shown separately). |
The balance in accumulated other comprehensive loss (income) related to commodity price risk and interest rate risk derivative transactions that are closed or will expire over the next three years are as follows (amounts in thousands and net of tax) at January 2,December 31, 2016:
|
| Commodity Price Risk Derivatives |
|
| Interest Rate Risk Derivatives |
|
| Totals |
|
| Commodity Price Risk Derivatives |
|
| Interest Rate Risk Derivatives |
|
| Totals |
| ||||||
Closed contracts |
| $ | 69 |
|
| $ | 965 |
|
| $ | 1,034 |
|
| $ | 392 |
|
| $ | 163 |
|
| $ | 555 |
|
Expiring in 2016 |
|
| 9,143 |
|
|
| — |
|
|
| 9,143 |
| ||||||||||||
Expiring in 2017 and beyond |
|
| 13 |
|
|
| — |
|
|
| 13 |
| ||||||||||||
Expiring in 2017 |
|
| 528 |
|
|
| — |
|
|
| 528 |
| ||||||||||||
Expiring in 2018 and beyond |
|
| (22 | ) |
|
| — |
|
|
| (22 | ) | ||||||||||||
Total |
| $ | 9,225 |
|
| $ | 965 |
|
| $ | 10,190 |
|
| $ | 898 |
|
| $ | 163 |
|
| $ | 1,061 |
|
See Note 2, Summary of Significant Accounting Policies, for the accounting treatment of other comprehensive income for these hedged transactions.
Derivative transactions notional amounts
As of January 2,December 31, 2016, the company had entered into the following financial contracts to hedge commodity and interest rate risks:risks (amounts in thousands):
Derivatives in Cash Flow Hedging Relationships |
| Notional amount |
|
| Notional amount |
| ||
|
| (Thousands) |
| |||||
Wheat contracts |
| $ | 175,898 |
|
| $ | 26,353 |
|
Soybean oil contracts |
|
| 20,729 |
|
|
| 2,834 |
|
Natural gas contracts |
|
| 9,421 |
|
|
| 3,347 |
|
Total |
| $ | 206,048 |
|
| $ | 32,534 |
|
The company’s derivative instruments contained no credit-risk-related contingent features at January 2,December 31, 2016. As of January 2,December 31, 2016, the company had $20.7$3.0 million recorded in other current assets, and on January 3, 2015,2, 2016, the company had $16.1$20.7 million recorded in other current assets representing collateral from or with counterparties for hedged positions.
Other current assets consist of:of (amounts in thousands):
|
| January 2, 2016 |
|
| January 3, 2015 |
| ||||||||||
|
| (Amounts in thousands) |
|
| December 31, 2016 |
|
| January 2, 2016 |
| |||||||
Prepaid assets |
| $ | 15,957 |
|
| $ | 17,430 |
|
| $ | 20,902 |
|
| $ | 15,957 |
|
Fair value of derivative instruments |
|
| 1,576 |
|
|
| — |
| ||||||||
Collateral to counterparties for derivative positions |
|
| 20,716 |
|
|
| 16,077 |
|
|
| 3,039 |
|
|
| 20,716 |
|
Income taxes receivable |
|
| 9,815 |
|
|
| 8,932 |
|
|
| 920 |
|
|
| 9,815 |
|
Other |
|
| 1,294 |
|
|
| 709 |
|
|
| 1,691 |
|
|
| 1,294 |
|
Total |
| $ | 47,782 |
|
| $ | 43,148 |
|
| $ | 28,128 |
|
| $ | 47,782 |
|
Other non-current assets consist of:of (amounts in thousands):
|
| January 2, 2016 |
|
| January 3, 2015 |
|
| December 31, 2016 |
|
| January 2, 2016 |
| ||||
|
| (Amounts in thousands) |
| |||||||||||||
Unamortized debt issuance costs |
| $ | 2,425 |
|
| $ | 2,812 |
| ||||||||
Unamortized financing fees |
|
| 3,246 |
|
|
| 3,492 |
|
| $ | 1,364 |
|
| $ | 1,761 |
|
Investments |
|
| 3,490 |
|
|
| 3,637 |
| ||||||||
Notes receivable |
|
| 2,747 |
|
|
| — |
| ||||||||
Other |
|
| 6,120 |
|
|
| 5,707 |
|
|
| 2,157 |
|
|
| 2,483 |
|
Total |
| $ | 11,791 |
|
| $ | 12,011 |
|
| $ | 9,758 |
|
| $ | 7,881 |
|
Note 11. | Other Accrued Liabilities |
Other accrued liabilities consist of:of (amounts in thousands):
|
| January 2, 2016 |
|
| January 3, 2015 |
| ||||||||||
|
| (Amounts in thousands) |
|
| December 31, 2016 |
|
| January 2, 2016 |
| |||||||
Employee compensation |
| $ | 73,571 |
|
| $ | 58,900 |
|
| $ | 62,536 |
|
| $ | 73,571 |
|
Fair value of derivative instruments |
|
| 14,867 |
|
|
| 12,898 |
|
|
| 2,435 |
|
|
| 14,867 |
|
Insurance |
|
| 23,900 |
|
|
| 24,403 |
|
|
| 28,043 |
|
|
| 23,900 |
|
Bank overdraft |
|
| 17,992 |
|
|
| 15,668 |
|
|
| 19,905 |
|
|
| 17,992 |
|
Accrued interest |
|
| 4,717 |
|
|
| 4,660 |
|
|
| 7,872 |
|
|
| 4,717 |
|
Accrued taxes |
|
| 6,633 |
|
|
| 6,443 |
| ||||||||
Accrued legal settlements |
|
| 10,250 |
|
|
| — |
| ||||||||
Other |
|
| 22,083 |
|
|
| 21,885 |
|
|
| 18,358 |
|
|
| 15,640 |
|
Total |
| $ | 157,130 |
|
| $ | 138,414 |
|
| $ | 156,032 |
|
| $ | 157,130 |
|
Note 12. | Debt, Lease and Other Commitments |
Long-term debt, including capital lease obligations, consisted of the following at January 2,December 31, 2016 and January 3, 2015:2, 2016:
|
| Interest Rate at January 2, 2016 |
|
| Final Maturity |
| January 2, 2016 |
|
| January 3, 2015 |
|
| Interest Rate at December 31, 2016 |
|
| Final Maturity |
|
| December 31, 2016 |
|
| January 2, 2016 |
| |||||||
|
|
|
|
|
|
|
| (Amounts in thousands) |
|
|
|
|
|
|
|
|
|
| (Amounts in thousands) |
| ||||||||||
Unsecured credit facility |
|
| 2.68% |
|
| 2020 |
| $ | 160,000 |
|
| $ | 53,000 |
|
|
| 4.08% |
|
| 2020 |
|
| $ | 24,000 |
|
| $ | 160,000 |
| |
Unsecured new term loan |
|
| 1.92% |
|
| 2018 |
|
| 240,000 |
|
|
| 270,000 |
| ||||||||||||||||
4.375% senior notes due April 1, 2022 |
|
| 4.38% |
|
| 2022 |
|
| 399,400 |
|
|
| 399,304 |
| ||||||||||||||||
Unsecured 2013 term loan |
|
| — |
|
|
| — |
|
|
| — |
|
|
| 238,515 |
| ||||||||||||||
3.5% senior notes due 2026 |
|
| 3.50% |
|
| 2026 |
|
|
| 394,406 |
|
|
| — |
| |||||||||||||||
4.375% senior notes due 2022 |
|
| 4.38% |
|
| 2022 |
|
|
| 397,458 |
|
|
| 396,975 |
| |||||||||||||||
Accounts receivable securitization |
|
| 1.15% |
|
| 2018 |
|
| 170,000 |
|
|
| — |
|
|
| 1.59% |
|
| 2018 |
|
|
| 95,000 |
|
|
| 170,000 |
| |
Capital lease obligations |
|
| 3.82% |
|
| 2020 |
|
| 20,228 |
|
|
| 22,526 |
|
|
| 3.70% |
|
| 2024 |
|
|
| 30,427 |
|
|
| 20,228 |
| |
Other notes payable |
|
| 2.10% |
|
| 2020 |
|
| 18,989 |
|
|
| 18,606 |
|
|
| 2.10% |
|
| 2020 |
|
|
| 16,866 |
|
|
| 18,989 |
| |
|
|
|
|
|
|
|
|
| 1,008,617 |
|
|
| 763,436 |
|
|
|
|
|
|
|
|
|
|
| 958,157 |
|
|
| 1,004,707 |
|
Current maturities of long-term debt and capital lease obligations | Current maturities of long-term debt and capital lease obligations |
|
| 74,685 |
|
|
| 34,496 |
| Current maturities of long-term debt and capital lease obligations |
|
|
| 11,490 |
|
|
| 74,685 |
| |||||||||||
Long-term debt and capital lease obligations | Long-term debt and capital lease obligations |
| $ | 933,932 |
|
| $ | 728,940 |
| Long-term debt and capital lease obligations |
|
| $ | 946,667 |
|
| $ | 930,022 |
| |||||||||||
Bank overdrafts occur when checks have been issued but have not been presented to the bank for payment. Certain of our banks allow us to delay funding of issued checks until the checks are presented for payment. The delay in funding results in a temporary source of financing from the bank. The activity related to bank overdrafts is shown as a financing activity in our Consolidated Statements of Cash Flows. Bank overdrafts are included in other current liabilities on our Consolidated Balance Sheets. As of January 2,December 31, 2016 and January 3, 2015,2, 2016, the bank overdraft balance was $18.0$19.9 million and $15.7$18.0 million, respectively.
The company also had standby letters of credit (“LOCs”) outstanding of $9.1 million and $16.9 million at December 31, 2016 and $16.4 million at January 2, 2016, and January 3, 2015, respectively, which reduce the availability of funds under the credit facility. The outstanding LOCs are for the benefit of certain insurance companies and lessors. None of the LOCs are recorded as a liability on the Consolidated Balance Sheet.
2026 Notes, 2016 Term Loan, Accounts Receivable Securitization Facility, New2013 Term Loan, Senior2022 Notes, and Credit Facility
2026 Notes. On September 28, 2016, the company issued $400.0 million of senior notes (the “2026 notes”). The company will pay semiannual interest on the 2026 notes on each April 1 and October 1, beginning on April 1, 2017, and the 2026 notes will mature on October 1, 2026. The notes bear interest at 3.500% per annum. The 2026 notes are subject to interest rate adjustments if either Moody’s or S&P downgrades (or downgrades and subsequently upgrades) the credit rating assigned to the 2026 notes. On any date prior to July 1, 2026, the company may redeem some or all of the notes at a price equal to the greater of (1) 100% of the principal amount of the notes redeemed and (2) a “make-whole” amount plus, in each case, accrued and unpaid interest. The make-whole amount is equal to the sum of the present values of the remaining scheduled payments of principal and interest on the 2026 notes to be redeemed that would be due if such notes matured July 1, 2026 (exclusive of interest accrued to, but not including, the date of redemption), discounted to the date of redemption on a semi-annual basis (assuming a 360-day year consisting of twelve 30-day months) at the treasury rate (as defined in the indenture governing the notes), plus 30 basis points, plus in each case accrued and unpaid interest. At any time on or after July 1, 2026, the company may redeem some or all of the 2026 notes at a price equal to 100% of the principal amount of the notes redeemed plus accrued and unpaid interest. If the company experiences a “change of control triggering event” (which involves a change of control of the company and related rating of the notes below investment grade), it is required to offer to purchase the notes at a purchase price equal to 101% of the principal amount, plus accrued and unpaid interest thereon unless the company exercised its option to redeem the notes in whole. The 2026 notes are also subject to customary restrictive covenants, including certain limitations on liens and sale and leaseback transactions.
The face value of the 2026 notes is $400.0 million. There was a debt discount representing the difference between the net proceeds, after expenses, received upon issuance of debt and the amount repayable at its maturity. The company also paid issuance costs (including underwriting fees and legal fees) on the 2026 notes. Debt issuance costs and the debt discount are being amortized to interest expense over the term of the 2026 notes. As of December 31, 2016, the company was in compliance with all restrictive covenants under the indenture governing the 2026 notes. The table below presents the debt discount, underwriting fees and the legal and other fees for issuing the 2026 notes (amounts in thousands):
Total fees for 2026 notes |
| Amount at Issuance |
| |
Debt discount |
| $ | 2,108 |
|
Underwriting, legal, and other fees |
|
| 3,900 |
|
Total fees |
| $ | 6,008 |
|
2016 Term LoanLoan. We entered into an unsecured term facility (the “2016 term loan”) on April 19, 2016. The 2016 term loan provided for a five-year, syndicated, unsecured term loan pursuant to which we may incur term loan borrowings in a single draw up to an aggregate principal amount of $150.0 million. The proceeds of the 2016 term loan borrowings were used to finance working capital and for general corporate purposes and to pay fees and expenses related to the 2016 term loan. The company drew down the full amount of the 2016 term loan at execution. The company paid financing costs of $0.6 million in connection with the 2016 term loan.
The 2016 term loan was paid off in full on September 28, 2016, at the time the company issued the 2026 notes. The payoff was accounted for as an extinguishment of debt with the loss on extinguishment recorded as interest expense. The extinguishment loss of $0.6 million was immediately recognized at the time the 2016 term loan was paid off. The company has no further obligations under this agreement.
Accounts Receivable Securitization Facility. On July 17, 2013, the company entered into an accounts receivable securitization facility (the “facility”). On August 7, 2014, the company entered into an amendment to the facility. The amendment (i) increased the revolving commitments under the facility to $200.0 million from $150.0 million, (ii) extended the term one year to July 17, 2016, and (iii) made certain other conforming changes. On December 17, 2014, the company executed a second amendment to the facility to add a bank to the lending group. The original commitment amount was split between the original lender and the new lender in the
proportion of 62.5% for the original lender and 37.5% for the new lender. This modification, which was accounted for as an extinguishment of the debt, resulted in a charge of $0.1 million, or 37.5%, of the unamortized financing costs. On August 20, 2015, the company executed a third amendment to the facility to extend the term to August 11, 2017 and to add a leverage pricing grid. This amendment was accounted for as a modification. On September 30, 2016, the company executed a fourth amendment to the facility to extend the term to September 28, 2018. This amendment was accounted for as a modification.
Under the facility, a wholly-owned, bankruptcy-remote subsidiary purchases, on an ongoing basis, substantially all trade receivables. As borrowings are made under the facility, the subsidiary pledges the receivables as collateral. In the event of liquidation of the subsidiary, its creditors would be entitled to satisfy their claims from the subsidiary’s pledged receivables prior to distributions of collections to the company. We include the subsidiary in our Condensed Consolidated Financial Statements. The facility contains certain customary representations and warranties, affirmative and negative covenants, and events of default. As of January 2,December 31, 2016, there was $170.0$95.0 million outstanding under the facility compared to no$170.0 million amounts outstanding as of January 3, 2015.2, 2016. As of January 2,December 31, 2016 and January 3, 2015,2, 2016, the company was in compliance with all restrictive covenants under the facility. On January 2,December 31, 2016, the company had $2.1$85.2 million available under its facility for working capital and general corporate purposes. Amounts available for withdrawal under the facility are determined as the lesser of the total commitments and a formula derived amount based on qualifying trade receivables.
Optional principal repayments may be made at any time without premium or penalty. Interest is due two days after our reporting periods end in arrears on the outstanding borrowings and is computed as the cost of funds rate plus an applicable margin of 70 basis points. An unused fee of 25 basis points is applicable on the unused commitment at each reporting period. The company paid financing costs of $0.8 million in connection with the facility at the time we entered into the facility, which are being amortized over the life of the facility. During fiscal 2014, we incurred $0.2 million in issuance costs with the first and second amendments. An additional $0.2$0.1 million in financing costs was paid during fiscal 2015 for the second and third amendments. An additional $0.1 million in financing costs were paid during fiscal 2016 for the fourth amendment.
New2013 Term Loan. We entered into a senior unsecured delayed-draw term facility (the “new“2013 term loan”) on April 5, 2013 with a commitment of up to $300.0 million. The company drew down the full amount of the new2013 term loan on July 18, 2013 (the “borrowing date”).
2013. The new2013 term loan amortizeswas paid off in quarterly installments basedfull on September 28, 2016, at the time the company issued the 2026 notes, and an increasing annual percentage.extinguishment of $1.3 million was recognized. The first payment was due the last business day of the first calendar quarter ending after the borrowing date, quarterly payments are due on the last business day of each successive calendar quarter and all remaining outstanding principal is due and payable on the fifth anniversary of the borrowing date.company has no further obligations under this agreement. The table below presents the principal payment amounts remaining under the new term loan as of January 2, 2016 (amounts in thousands):
Fiscal Year |
| Payments |
| |
2016 |
| $ | 67,500 |
|
2017 |
| $ | 112,500 |
|
2018 |
| $ | 60,000 |
|
On February 14, 2014, we entered into an amendment, whichpayoff was accounted for as a modificationan extinguishment of debt that favorably reduced the interest rates described below from those entered into originally on April 5, 2013. Voluntary prepayments on the new term loan may be made without premium or penalty. Interest is due quarterly in arrears on any outstanding borrowings at a customary Eurodollar rate or the base rate plus applicable margin. The applicable margin ranges from 0.00% to 1.25% for base rate loans and from 1.00% to 2.25% for Eurodollar loans, and is based on the company’s leverage ratio. Interest on base rate loans is payable quarterly in arrears on the last business day of each calendar quarter. Interest on Eurodollar loans is payable in arrears at the end of the interest period and every three months in the case of interest periods in excess of three months. The company paid financing costs of
$1.7 million in connection with the new term loan, which are being amortized over the life of the new term loan. A commitment fee of 20 basis pointsloss on the daily undrawn portion of the lenders’ commitments commenced on May 1, 2013 and continued until the borrowing date, when the company borrowed the available $300.0 million for the acquisition of certain Hostess Brands, Inc. bread assets. The new term loan is subject to customary restrictive covenants, including certain limitations on liens and significant acquisitions and financial covenants regarding minimumextinguishment recorded as interest coverage ratio and maximum leverage ratio. The February 14, 2014 amendment cost $0.3 million and is being amortized over the remaining term. As of January 2, 2016 and January 3, 2015, the company was in compliance with all restrictive covenants under the new term loan.expense.
Senior2022 Notes. On April 3, 2012, the company issued $400.0 million of senior notes.notes (the “2022 notes”). The company pays semiannual interest on the notes on each April 1 and October 1, beginning on October 1, 2012, and the notes will mature on April 1, 2022. The notes bear interest at 4.375% per annum. On any date prior to January 1, 2022, the company may redeem some or all of the notes at a price equal to the greater of (1) 100% of the principal amount of the notes redeemed and (2) a “make-whole” amount plus, in each case, accrued and unpaid interest. The make-whole amount is equal to the sum of the present values of the remaining scheduled payments of principal thereof (not including any interest accrued thereon to, but not including, the date of redemption), discounted to the date of redemption on a semi-annual basis (assuming a 360-day year consisting of twelve 30-day months) at the treasury rate (as defined in the indenture governing the notes), plus 35 basis points, plus in each case, unpaid interest accrued thereon to, but not including, the date of redemption. At any time on or after January 1, 2022, the company may redeem some or all of the notes at a price equal to 100% of the principal amount of the notes redeemed plus accrued and unpaid interest. If the company experiences a “change of control triggering event” (which involves a change of control of the company and related rating of the notes below investment grade), it is required to offer to purchase the notes at a purchase price equal to 101% of the principal amount, plus accrued and unpaid interest thereon unless the company exercised its option to redeem the notes in whole. The notes are also subject to customary restrictive covenants, including certain limitations on liens and sale and leaseback transactions.
The face value of the notes is $400.0 million and the current discount on the notes is $0.6$0.5 million. The company paid issuance costs (including underwriting fees and legal fees) for issuing the notes of $3.9 million. The issuance costs and the debt discount are being amortized to interest expense over the term of the notes. As of January 2,December 31, 2016 and January 3, 2015,2, 2016, the company was in compliance with all restrictive covenants under the indenture governing the notes.
Credit Facility. On April 19, 2016, the company amended its senior unsecured credit facility (the “credit facility”), which was accounted for as a modification of the debt, that addressed changes in law affecting the terms of the existing agreement, makes certain terms of the existing agreement consistent with the terms of the 2016 term loan, and amends the terms to permit the indebtedness to be incurred under the 2016 term loan. In addition, the amendment increases the highest applicable margin applicable to base rate loans to 0.75% and the Eurodollar rate loans to 1.75%, in each case, based on the leverage ratio of the company. It also increases the highest applicable facility fee to 0.50%, due quarterly on all commitments under the facility. Previously, on April 21, 2015, the company amended its senior unsecured credit facility (the “credit facility”) to extend the term to April 21, 2020, reduce the applicable margin on base rate and Eurodollar loans and reduce the facility fees, described below. The amendment was accounted for as a modification
of the debt. The credit facility is a five-year, $500.0 million senior unsecured revolving loan facility. The credit facility contains a provision that permits Flowers to request up to $200.0 million in additional revolving commitments, for a total of up to $700.0 million, subject to the satisfaction of certain conditions. Proceeds from the credit facility may be used for working capital and general corporate purposes, including capital expenditures, acquisition financing, refinancing of indebtedness, dividends and share repurchases. The credit facility includes certain customary restrictions, which, among other things, require maintenance of financial covenants and limit encumbrance of assets and creation of indebtedness. Restrictive financial covenants include such ratios as a minimum interest coverage ratio and a maximum leverage ratio. The company believes that, given its current cash position, its cash flow from operating activities and its available credit capacity, it can comply with the current terms of the amended credit facility and can meet its presently foreseeable financial requirements. As of January 2,December 31, 2016 and January 3, 2015,2, 2016, the company was in compliance with all restrictive covenants under the credit facility.
Interest is due quarterly in arrears on any outstanding borrowings at a customary Eurodollar rate or the base rate plus applicable margin. The underlying rate is defined as rates offered in the interbank Eurodollar market, or the higher of the prime lending rate or the federal funds rate plus 0.50%, with a floor rate defined by the one-month interbank Eurodollar market rate plus 1.00%. The applicable margin ranges from 0.0% to 0.50% for base rate loans and from 0.70% to 1.50% for Eurodollar loans. In addition, a facility fee ranging from 0.05% to 0.25% is due quarterly on all commitments under the credit facility. Both the interest margin and the facility fee are based on the company’s leverage ratio. The company paid additional financing costs of $0.4 million in connection with the April 21, 2015 amendment of the credit facility, which, in addition to the remaining balance of the original $1.3 million in financing costs, is being amortized over the life of the credit facility. The company recognized $0.1 million in financing costsas interest expense for the modification at the time of the April 21, 2015 amendment.
At January 2, 2016, there was $160.0 million outstanding under the credit facility. There were $53.0 million in outstanding borrowings under the credit facility at January 3, 2015. The highest outstanding daily balance during fiscal 2015 was $160.0 million and the lowest outstanding balance was zero. Amounts outstanding under the credit facility vary daily. Changes in the gross borrowings and repayments can be caused by cash flow activity from operations, capital expenditures, acquisitions, dividends, share repurchases, and tax payments, as well as derivative transactions which are part of the company’s overall risk management strategy as discussed in Note 9, Derivative Financial Instruments. During fiscal 2015,The table below presents the company borrowed $820.0 million in revolving borrowings and repayments under the credit facility and repaid $713.0 million in revolving borrowings. during fiscal 2016:
|
| Amount (thousands) |
| |
Balance as of January 2, 2016 |
| $ | 160,000 |
|
Borrowings |
|
| 1,391,600 |
|
Payments |
|
| (1,527,600 | ) |
Balance as of December 31, 2016 |
| $ | 24,000 |
|
The table below presents the net amount available under the credit facility is reduced by $16.9 million for lettersas of credit. On January 2, 2016,December 31, 2016:
|
| Amount (thousands) |
| |
Gross amount available |
| $ | 500,000 |
|
Outstanding |
|
| (24,000 | ) |
Letters of credit |
|
| (9,080 | ) |
Available for withdrawal |
| $ | 466,920 |
|
The table below presents the company had $323.1 million availablehighest and lowest outstanding balance under itsthe credit facility for working capital and general corporate purposes.during fiscal 2016:
|
| Amount (thousands) |
| |
High balance |
| $ | 244,200 |
|
Low balance |
| $ | — |
|
Credit Ratings. Currently, the company’s credit ratings by Fitch Ratings, Moody’s Investors Service, and Standard & Poor’s are BBB, Baa2, and BBB, respectively. Standard & Poor’s upgraded the company from a BBB- credit rating on September 16, 2015. Changes in the company’s credit ratings do not trigger a change in the company’s available borrowings or costs under the 2026 notes, facility, new term loan, senior2022 notes, andor credit facility, but could affect future credit availability and cost.
Assets recorded under capital lease agreements included in property, plant and equipment consist of machinery and equipment and transportation equipment.
Aggregate debt maturities. Aggregate maturities of debt outstanding, including capital leases, and the associated interest, as of January 2,December 31, 2016, are as follows (excluding unamortized debt discount and issuance costs) (amounts in thousands):
2017 |
| $ | 11,490 |
|
2018 |
|
| 106,794 |
|
2019 |
|
| 10,314 |
|
2020 |
|
| 29,028 |
|
2021 |
|
| 3,276 |
|
2022 and thereafter |
|
| 806,025 |
|
Total |
| $ | 966,927 |
|
Debt issuance costs and debt discount. In fiscal 2016, the company adopted guidance, as discussed in Note 3, Recent Accounting Pronouncements, that requires debt issuances costs be presented in the balance sheet as a direct reduction from the carrying amount of $1.6 million for the senior notesliability. The table below reconciles the debt issuance costs and other notes payable)debt discounts to the net carrying value of each of our debt obligations (excluding line-of-credit arrangements) at December 31, 2016 (amounts in thousands):
|
| Face Value |
|
| Debt issuance costs and debt discount |
|
| Net carrying value |
| |||
3.5% senior notes due 2026 |
| $ | 400,000 |
|
| $ | 5,594 |
|
| $ | 394,406 |
|
4.375% senior notes due 2022 |
|
| 400,000 |
|
|
| 2,542 |
|
|
| 397,458 |
|
Other notes payable |
|
| 17,500 |
|
|
| 634 |
|
|
| 16,866 |
|
Total |
| $ | 817,500 |
|
| $ | 8,770 |
|
| $ | 808,730 |
|
The table below reconciles the debt issuance costs and debt discounts to the net carrying value of each of our debt obligations (excluding line-of-credit arrangements) at January 2, 2016 (amounts in thousands):
2016 |
| $ | 74,685 |
|
2017 |
|
| 292,194 |
|
2018 |
|
| 69,960 |
|
2019 |
|
| 8,443 |
|
2020 |
|
| 163,118 |
|
2021 and thereafter |
|
| 401,828 |
|
Total |
| $ | 1,010,228 |
|
|
| Face Value |
|
| Debt issuance costs and debt discount |
|
| Net carrying value |
| |||
Unsecured 2013 term loan |
| $ | 240,000 |
|
| $ | 1,485 |
|
| $ | 238,515 |
|
4.375% senior notes due 2022 |
|
| 400,000 |
|
|
| 3,025 |
|
|
| 396,975 |
|
Other notes payable |
|
| 20,000 |
|
|
| 1,011 |
|
|
| 18,989 |
|
Total |
| $ | 660,000 |
|
| $ | 5,521 |
|
| $ | 654,479 |
|
Leases
The company leases certain property and equipment under various operating and capital lease arrangements that expire over the next 2118 years. The property leases include distribution facilities, thrift store locations, and threetwo manufacturing facilities. The equipment leases include production, sales, distribution, and office equipment. Initial lease terms range from two to 26 years. Many of the operating leases provide the company with the option, after the initial lease term, either to purchase the property at the then fair value or renew its lease at fair value rents for periods from one month to ten years. Rent escalations vary in these leases, from no escalation over the initial lease term, to escalations linked to changes in economic variables such as the Consumer Price Index. Rental expense is recognized on a straight-line basis. The capital leases are primarily used for distribution vehicle financing and are discussed in Note 13, Variable Interest Entities, below. Future minimum lease payments under scheduled capital leases that have initial or remaining non-cancelable terms in excess of one year are as follows:follows (amounts in thousands):
|
| Capital Leases |
|
| Capital Leases |
| ||
|
| (Amounts in thousands) |
| |||||
2016 |
| $ | 5,222 |
| ||||
2017 |
|
| 5,091 |
|
| $ | 7,203 |
|
2018 |
|
| 5,223 |
|
|
| 7,336 |
|
2019 |
|
| 3,591 |
|
|
| 5,704 |
|
2020 |
|
| 710 |
|
|
| 2,822 |
|
2021 and thereafter |
|
| 1,959 |
| ||||
2021 |
|
| 3,502 |
| ||||
2022 and thereafter |
|
| 6,346 |
| ||||
Total minimum payments |
|
| 21,796 |
|
|
| 32,913 |
|
Amount representing interest |
|
| 1,568 |
|
|
| 2,486 |
|
Obligations under capital leases |
|
| 20,228 |
|
|
| 30,427 |
|
Obligations due within one year |
|
| 4,685 |
|
|
| 6,490 |
|
Long-term obligations under capital leases |
| $ | 15,543 |
|
| $ | 23,937 |
|
The table below presents the total future minimum lease payments under scheduled operating leases that have initial or remaining non-cancelable terms in excess of one year (amounts in thousands):
|
| Operating Leases |
|
| Operating Leases |
| ||
|
| (Amounts in thousands) |
| |||||
2016 |
| $ | 60,550 |
| ||||
2017 |
|
| 59,103 |
|
| $ | 63,861 |
|
2018 |
|
| 45,232 |
|
|
| 59,304 |
|
2019 |
|
| 39,849 |
|
|
| 53,005 |
|
2020 |
|
| 38,117 |
|
|
| 46,141 |
|
2021 and thereafter |
|
| 287,995 |
| ||||
2021 |
|
| 36,934 |
| ||||
2022 and thereafter |
|
| 283,915 |
| ||||
Total minimum payments |
| $ | 530,846 |
|
| $ | 543,160 |
|
Rent expense for all operating leases amounted to $87.9 million, $88.7 million, and $90.3 million for fiscal years 2015, 2014, and 2013.was as follows (amounts in thousands):
|
| Rent expense |
| |
Fiscal 2016 |
| $ | 97,357 |
|
Fiscal 2015 |
| $ | 87,864 |
|
Fiscal 2014 |
| $ | 88,700 |
|
Deferred Compensation
The Executive Deferred Compensation Plan (“EDCP”) consists of unsecured general obligations of the company to pay the deferred compensation of, and our contributions to, participants in the EDCP. The obligations will rank equally with our other unsecured and unsubordinated indebtedness payable from the company’s general assets.
The company’s directors and certain key members of management are eligible to participate in the EDCP. Directors may elect to defer all or any portion of their annual retainer fee and meeting fees. Deferral elections by directors must be made prior to the beginning of each year and are thereafter irrevocable. Eligible employees may elect to defer up to 75% of their base salaries, and up to 100% of any cash bonuses and other compensation through December 31, 2015. Effective January 1, 2016, employees may elect to defer up to 75% of their base salaries, any cash bonuses, and other compensation. Deferral elections by eligible executives must be made prior to the beginning of each year and are thereafter irrevocable during that year. The portion of the participant’s compensation that is deferred depends on the participant’s election in effect with respect to his or her elective contributions under the EDCP.
The amountamounts outstanding at December 31, 2016 and January 2, 2016 and January 3, 2015 was $14.8 million and $14.5 million of which $2.2 million and $1.9 million, respectively, are recordedwere as current liabilities.follows (amounts in thousands):
|
| December 31, 2016 |
|
| January 2, 2016 |
| ||
Deferral elections outstanding |
| $ | 14,883 |
|
| $ | 14,812 |
|
Current portion of deferral elections |
|
| 1,675 |
|
|
| 2,204 |
|
Long-term portion of deferral elections |
| $ | 13,208 |
|
| $ | 12,608 |
|
Guarantees and Indemnification Obligations
The company has provided various representations, warranties, and other standard indemnifications in various agreements with customers, suppliers, and other parties as well as in agreements to sell business assets or lease facilities. In general, these provisions indemnify the counterparty for matters such as breaches of representations and warranties, certain environmental conditions and tax matters, and, in the context of sales of business assets, any liabilities arising prior to the closing of the transactions. Non-performance under a contract could trigger an obligation of the company. The ultimate effect on future financial results is not subject to reasonable estimation because considerable uncertainty exists as to the final outcome of any potential claims.
No material guarantees or indemnifications have been entered into by the company through January 2,December 31, 2016.
Transportation agreement variable interest entity (the “VIE”) analysis
The company maintains a transportation agreement with an entity that transports a significant portion of the company’s fresh bakery products from the company’s production facilities to outlying distribution centers. The company represents a significant portion of the entity’s revenue. This entity qualifies as a VIE, but the company has determined it is not the primary beneficiary of the VIE. The company is not considered to be the primary beneficiary of the VIEs because the company does not (i) have the ability to direct the significant activities of the VIEs and (ii) provide any implicit or explicit guarantees or other financial support to the VIEs for specific return or performance benchmarks. In addition, we do not provide, nor do we intend to provide, financial or other support to the entity.
The company has concluded that certain of the trucks and trailers the VIE uses for distributing our products from the manufacturing facilities to the distribution centers qualify as right to use leases. As of December 31, 2016 and January 2, 2016, and January 3, 2015, there was $20.2$30.4 million and $22.5$20.2 million, respectively, in net property, plant and equipment and capital lease obligations associated with the right to use leases.
Distribution rights agreement VIE analysis
The incorporated independent distributors (“IDs”) in the DSD Segment qualify as VIEs. The independent distributors who are formed as sole proprietorships are excluded from the following VIE accounting analysis. The company typically finances the ID’s acquisition of theanalysis and discussion.
IDs acquire distribution rights and also entersenter into a contract with the IDcompany to sell product at a discount for distributionthe company’s products in the ID’s territory covered byIDs’ defined geographic territory. The IDs have the option to finance the acquisition of their distribution rights with the company. They can also pay cash or obtain external financing at the time they acquire the distribution rights. The combination of the company’s loans to the IDs and the ongoing supplydistributor arrangements
with the IDs provide a level of protection and funding to the equity owners of the various IDs that would not otherwise be available. As of December 31, 2016 and January 2, 2016, and January 3, 2015, there was $50.8$84.3 million and $51.0$50.8 million, respectively, in gross distribution rights notes receivable outstanding for IDs.
The company is not considered to be the primary beneficiary of the VIEs because the company does not (i) have the ability to direct the significant activities of the VIEs that would affect their ability to operate their respective independent distributor territoriesbusinesses and (ii) provide any implicit or explicit guarantees or other financial support to the VIEs, other than the financing described above, for specific return or performance benchmarks. The activities controlled by the IDs that are deemed to most significantly impact the ultimate success of the ID entities relate to those decisions inherent in operating the distribution business in the territory, including acquiring trucks and trailers, managing fuel costs, employee matters and other strategic decisions. In addition, we do not provide, nor do we intend to provide, financial or other support to the IDs. The IDs are responsible for the operations of their respective territories including ordering of products.territories.
The company’s maximum contractual exposure to loss for the IDs relates to the distributor rights note receivable for the portion of the territory the IDs financed at the time they acquired the distribution rights. The IDs remit payment on their distributor rights note receivable each week during the settlement process of their weekly activity. In the event the IDs abandon their territory and have a remaining balance outstanding on the distribution rights note receivable, we will take the distribution rights revert back fromto the IDscompany (recording the distribution rights as assets held for sale) and the company subsequently sellsells the distribution rights to another independent distributor. The company’s collateral from the territory distribution rights mitigates potential losses.
Note 14. | Fair Value of Financial Instruments |
The carrying value of cash and cash equivalents, accounts receivable, and short-term debt approximates fair value because of the short-term maturity of the instruments. Notes receivable are entered into in connection with the purchase of independent distributors’ distribution rights by independent distributors. These notes receivable are recorded in the Consolidated Balance Sheet at carrying value, which represents the closest approximation of fair value. Fair value is defined as the price that would be received to sell an asset or paid to transfer a liability in an orderly transaction between market participants at the measurement date. As a result, the appropriate interest rate that should be used to estimate the fair value of the distribution rights notes is the prevailing market rate at which similar loans would be made to independent distributors with similar credit ratings and for the same maturities. However, the company financed approximately 3,4003,600 and 3,700 independent distributors’ distribution rights as of January 2,December 31, 2016 and January 3, 2015,2, 2016, respectively, all with varied financial histories and credit risks. Considering the diversity of credit risks among the independent distributors, the company has no method to accurately determine a market interest rate to apply to the notes. The distribution rights are generally financed for up to ten years and the distribution rights notes are collateralized by the independent distributors’ distribution rights. The company maintains a wholly-owned subsidiary to assist in financing the distribution rights purchase activities if requested by new independent distributors, using the distribution rights and certain associated assets as collateral. These notes receivable earn interest at a fixed rate.
At December 31, 2016 and January 2, 2016, and January 3, 2015, respectively, the carrying value of the distribution rights notes receivable was as follows (amounts in thousands):
|
| January 2, 2016 |
|
| January 3, 2015 |
| ||
Distribution rights notes receivable |
| $ | 174,904 |
|
| $ | 182,188 |
|
Current portion of distribution rights notes receivable recorded in accounts and notes receivable, net |
|
| 20,593 |
|
|
| 20,283 |
|
Long-term portion of distribution rights notes receivable |
| $ | 154,311 |
|
| $ | 161,905 |
|
|
| December 31, 2016 |
|
| January 2, 2016 |
| ||
Distribution rights notes receivable |
| $ | 175,984 |
|
| $ | 174,904 |
|
Current portion recorded in accounts and notes receivable, net |
|
| 21,060 |
|
|
| 20,593 |
|
Long-term portion of distribution rights notes receivable |
| $ | 154,924 |
|
| $ | 154,311 |
|
Interest income for the distribution rights notes receivable was as follows (amounts in thousands):
|
| Interest Income |
|
| Interest Income |
| ||
Fiscal 2016 |
| $ | 20,552 |
| ||||
Fiscal 2015 |
| $ | 21,967 |
|
| $ | 21,967 |
|
Fiscal 2014 |
| $ | 20,947 |
|
| $ | 20,947 |
|
Fiscal 2013 |
| $ | 16,015 |
| ||||
At January 2,December 31, 2016 and January 3, 2015,2, 2016, the company has evaluated the collectability of the distribution rights notes receivable and determined that a reserve is not necessary. Payments on these notes are collected by the company weekly in conjunction with the settlement process.
The fair value of the company’s variable rate debt at January 2,December 31, 2016 approximates the recorded value. The fair value of the company’s notes, issued on April 3, 2012, as discussed in Note 12, Debt, Lease and Other Commitments, is approximately $416.1 million while
the carrying value is $399.4 million on January 2, 2016. The fair value of the notes isare estimated using yields obtained from independent pricing sources for similar types of borrowing arrangements and isare considered a Level 2 valuation. The fair value of the notes are presented in the table below (amounts in thousands, except level classification):
|
| Carrying Value |
|
| Fair Value |
|
| Level | ||
3.5% senior notes due 2026 |
| $ | 394,406 |
|
| $ | 377,972 |
|
| 2 |
4.375% senior notes due 2022 |
| $ | 397,458 |
|
| $ | 421,756 |
|
| 2 |
For fair value disclosure information about our derivative assets and liabilities see Note 9, Derivative Financial Instruments. For fair value disclosure information about our pension plan net assets see Note 19, Postretirement Plans.
Note 15. | Stockholders’ Equity |
Flowers Foods’ articles of incorporation provide that its authorized capital consist of 500,000,000 shares of common stock having a par value of $0.01 per share and 1,000,000 shares of preferred stock. The preferred stock of which (a) 200,000 shares have been designated by the Board of Directors as Series A Junior Participating Preferred Stock, having a par value per share of $100 and (b) 800,000 shares of preferred stock, having a par value per share of $0.01, have not been designated by the Board of Directors. No shares of preferred stock have been issued by Flowers Foods.
Common Stock
The holders of Flowers Foods common stock are entitled to one vote for each share held of record on all matters submitted to a vote of shareholders. Subject to preferential rights of any issued and outstanding preferred stock, including the Series A Preferred Stock, holders of common stock are entitled to receive ratably such dividends, if any, as may be declared by the Board of Directors of the company out of funds legally available. In the event of a liquidation, dissolution, or winding-up of the company, holders of common stock are entitled to share ratably in all assets of the company, if any, remaining after payment of liabilities and the liquidation preferences of any issued and outstanding preferred stock, including the Series A Preferred Stock. Holders of common stock have no preemptive rights, no cumulative voting rights, and no rights to convert their shares of common stock into any other securities of the company or any other person.
Preferred Stock
The Board of Directors has the authority to issue up to 1,000,000 shares of preferred stock in one or more series and to fix the designations, relative powers, preferences, rights, qualifications, limitations, and restrictions of all shares of each such series, including without limitation, dividend rates, conversion rights, voting rights, redemption and sinking fund provisions, liquidation preferences, and the number of shares constituting each such series, without any further vote or action by the holders of our common stock. Although the
Board of Directors does not presently intend to do so, it could issue shares of preferred stock, with rights that could adversely affect the voting power and other rights of holders of our common stock without obtaining the approval of our shareholders. In addition, the issuance of preferred shares could delay or prevent a change in control of the company without further action by our shareholders.
Stock Repurchase Plan
Our Board of Directors has approved a plan (on December 19, 2002) that currently authorizes share repurchases of up to 74.6 million shares of the company’s common stock. As of January 2,December 31, 2016, 13.76.8 million shares remained available for repurchase under the existing authorization. Under the plan, the company may repurchase its common stock in open market or privately negotiated transactions or under an accelerated repurchase program at such times and at such prices as determined to be in the company’s best interest.
The table below presents the shares repurchased under the Stock Repurchase Plan during our fiscal 20152016 (amounts in thousands except shares purchased):
Fiscal 2015 Quarter |
| Total Number of Shares Purchased |
|
| Total Cost of Shares Purchased |
| ||
For the quarter ended April 25, 2015 |
|
| 318,399 |
|
| $ | 6,858 |
|
For the quarter ended July 18, 2015 |
|
| — |
|
| $ | — |
|
For the quarter ended October 10, 2015 |
|
| — |
|
| $ | — |
|
For the quarter ended January 2, 2016 |
|
| — |
|
| $ | — |
|
Total |
|
| 318,399 |
|
| $ | 6,858 |
|
Fiscal 2016 Quarter |
| Total Number of Shares Purchased |
|
| Total Cost of Shares Purchased |
| ||
For the quarter ended April 23, 2016 |
|
| 5,959,814 |
|
| $ | 108,298 |
|
For the quarter ended July 16, 2016 |
|
| 932,380 |
|
| $ | 18,000 |
|
For the quarter ended October 8, 2016 |
|
| — |
|
| $ | — |
|
For the quarter ended December 31, 2016 |
|
| 128 |
|
| $ | 2 |
|
Total |
|
| 6,892,322 |
|
| $ | 126,300 |
|
As of January 2,December 31, 2016, 60.967.8 million shares at a cost of $504.1$630.4 million have been purchased undersince the inception of this plan.
Accelerated Share Repurchase Program
On March 16, 2016, the company announced that we entered into an accelerated share repurchase program (“ASR”) agreement to repurchase an aggregate of $120.0 million of the company’s common stock. Under the terms of the ASR, the company paid $120.0 million in cash and received an initial delivery of 5.6 million shares immediately. The final number of shares repurchased was based on the daily volume-weighted average stock price over the life of the transaction, less a negotiated discount. During the second quarter of fiscal 2016, a total of 0.9 million shares were issued to the company at the time of final settlement. The ASR met all applicable criteria for equity classification and, therefore, was not accounted for as a derivative instrument. Shares repurchased under the ASR were added to our treasury shares. The company funded the ASR with borrowings on its credit facility and cash on hand.
Dividends
During fiscal years 2016, 2015, 2014, and 2013,2014, the company paid the following dividends, of $119.6 million, or $0.5675excluding dividends on vested stock-based compensation awards discussed in Note 16, Stock-Based Compensation, below (amounts in thousands except per share $101.7 million, or $0.4850 per share, and $92.5 million, or $0.4440 per share, respectively.data):
|
| Dividends paid |
|
| Dividends paid per share |
| ||
Fiscal 2016 |
| $ | 130,490 |
|
| $ | 0.6250 |
|
Fiscal 2015 |
| $ | 119,563 |
|
| $ | 0.5675 |
|
Fiscal 2014 |
| $ | 101,694 |
|
| $ | 0.4850 |
|
On March 5, 2014, our Board of Directors approved and adopted the 2014 Omnibus Equity and Incentive Compensation Plan (“Omnibus Plan”). The Omnibus Plan was approved by our shareholders on May 21, 2014. The Omnibus Plan authorizes the compensation committee of the Board of Directors to provide equity-based compensation in the form of stock options, stock appreciation rights, restricted stock, restricted stock units, performance shares, performance units, dividend equivalents and other awards for the purpose of providing our officers, key employees, and non-employee directors’ incentives and rewards for performance. The Omnibus Plan replaced the Flowers Foods’ 2001 Equity and Performance Incentive Plan, as amended and restated as of April 1, 2009 (“EPIP”), the Stock Appreciation Rights Plan, and the Annual Executive Bonus Plan. All outstanding equity awards that were made under the EPIP will continue to be governed by the EPIP; however, all equity awards granted after May 21, 2014 are governed by the Omnibus Plan. No additional awards will be issued under the EPIP. Awards granted under the Omnibus Plan are limited to the authorized amount of 8,000,000 shares.
The EPIP authorized the compensation committee of the Board of Directors to make awards of options to purchase our common stock, restricted stock, performance stock and units and deferred stock. The company’s officers, key employees and non-employee directors (whose grants are generally approved by the full Board of Directors) were eligible to receive awards under the EPIP. Over the life of the EPIP, the company issued options, restricted stock and deferred stock.
The following is a summary of stock options, restricted stock, and deferred stock outstanding under the plans described above. Information relating to the company’s stock appreciation rights, which were issued under a separate stock appreciation right plan, is also described below.
Stock Options
The company issued non-qualified stock options (“NQSOs”) during fiscal years 2011 and prior that have no additional service period remaining. All outstanding NQSOs have vested and are exercisable on January 2,December 31, 2016.
The stock option activity for fiscal years 2016, 2015, 2014, and 20132014 pursuant to the EPIP is set forth below:below (amounts in thousands, except price data):
|
| Fiscal 2015 |
|
| Fiscal 2014 |
|
| Fiscal 2013 |
| |||||||||||||||||||||||||||||||||||||||
|
| Options |
|
| Weighted Average Exercise Price |
|
| Options |
|
| Weighted Average Exercise Price |
|
| Options |
|
| Weighted Average Exercise Price |
|
| Fiscal 2016 |
|
| Fiscal 2015 |
|
| Fiscal 2014 |
| |||||||||||||||||||||
|
| (Amounts in thousands, except price data) |
|
| Options |
|
| Weighted Average Exercise Price |
|
| Options |
|
| Weighted Average Exercise Price |
|
| Options |
|
| Weighted Average Exercise Price |
| |||||||||||||||||||||||||||
Outstanding at beginning of year |
|
| 6,191 |
|
| $ | 10.88 |
|
|
| 8,112 |
|
| $ | 10.89 |
|
|
| 9,541 |
|
| $ | 10.71 |
|
|
| 4,353 |
|
| $ | 10.97 |
|
|
| 6,191 |
|
| $ | 10.88 |
|
|
| 8,112 |
|
| $ | 10.89 |
|
Exercised |
|
| (1,838 | ) |
| $ | 10.67 |
|
|
| (1,921 | ) |
| $ | 10.94 |
|
|
| (1,415 | ) |
| $ | 9.67 |
|
|
| (2,507 | ) |
| $ | 11.02 |
|
|
| (1,838 | ) |
| $ | 10.67 |
|
|
| (1,921 | ) |
| $ | 10.94 |
|
Forfeitures |
|
| — |
|
| $ | — |
|
|
| — |
|
| $ | — |
|
|
| (14 | ) |
| $ | 10.99 |
| ||||||||||||||||||||||||
Outstanding at end of year |
|
| 4,353 |
|
| $ | 10.97 |
|
|
| 6,191 |
|
| $ | 10.88 |
|
|
| 8,112 |
|
| $ | 10.89 |
|
|
| 1,846 |
|
| $ | 10.89 |
|
|
| 4,353 |
|
| $ | 10.97 |
|
|
| 6,191 |
|
| $ | 10.88 |
|
Exercisable at end of year |
|
| 4,353 |
|
|
|
|
|
|
| 6,191 |
|
|
|
|
|
|
| 4,978 |
|
|
|
|
|
|
| 1,846 |
|
|
|
|
|
|
| 4,353 |
|
|
|
|
|
|
| 6,191 |
|
|
|
|
|
As of January 2,December 31, 2016, options outstanding under the EPIP had an average exercise price of $10.97,$10.89, a weighted average remaining contractual life of 1.420.90 years, and an aggregate intrinsic value of $45.8$16.8 million.
The cash received, the windfall tax benefits, and intrinsic value from stock option exercises for fiscal years 2016, 2015, 2014, and 20132014 are set forth below (amounts in thousands):
|
| Fiscal 2015 |
|
| Fiscal 2014 |
|
| Fiscal 2013 |
|
| Fiscal 2016 |
|
| Fiscal 2015 |
|
| Fiscal 2014 |
| ||||||
Cash received from option exercises |
| $ | 19,617 |
|
| $ | 21,014 |
|
| $ | 13,685 |
|
| $ | 27,631 |
|
| $ | 19,617 |
|
| $ | 21,014 |
|
Cash tax windfall benefit, net |
| $ | 7,660 |
|
| $ | 4,572 |
|
| $ | 5,622 |
|
| $ | 3,746 |
|
| $ | 7,660 |
|
| $ | 4,572 |
|
Intrinsic value of stock options exercised |
| $ | 24,590 |
|
| $ | 16,725 |
|
| $ | 18,132 |
|
| $ | 15,778 |
|
| $ | 24,590 |
|
| $ | 16,725 |
|
Performance-Contingent Restricted Stock Awards
Performance-Contingent Total Shareholder Return Shares (“TSR Shares”)
Since 2012, certain key employees have been granted performance-contingent restricted stock under the EPIP and the Omnibus Plan in the form of TSR Shares. The awards generally vest approximately two years from the date of grant (after the filing of the company’s Annual Report on Form 10-K), and the shares become non-forfeitable if, and to the extent that, on that date the vesting conditions are satisfied. As a result of the delay (July as opposed to January) in the grant of the 2012 awards, the 2012 awards vested during the first quarter of 2014, 18 months from the grant date. The 2013, 2014 and 2015 awardsAwards granted subsequent to the 2012 award (granted during the first quarters of their respective years) vest two years from the date of grant. The total shareholder return (“TSR”) is the percent change in the company’s stock price over the measurement period plus the dividends paid to shareholders. The performance payout is calculated at the end of each of the last four quarters (averaged) in the measurement period. Once the TSR is determined for the company (“Company TSR”), it is compared to the TSR of our food company peers (“Peer Group TSR”). The Company TSR compared to the Peer Group TSR will determine the payout as set forth below:below (the “TSR Modifier”):
Percentile |
| Payout as % of Target |
| |
90th |
|
| 200 | % |
70th |
|
| 150 | % |
50th |
|
| 100 | % |
30th |
|
| 50 | % |
Below 30th |
|
| 0 | % |
For performance between the levels described above, the degree of vesting is interpolated on a linear basis. The 2012 award actual attainment was 195%table below presents the payout percentage for each of target. The 2013 award actual attainment was 88% of target.the TSR awards:
Award | Fiscal year vested | Payout (%) | ||
2012 award | Fiscal 2014 | 195 | ||
2013 award | Fiscal 2015 | 88 | ||
2014 award | Fiscal 2016 | 27 |
The TSR shares vest immediately if the grantee dies or becomes disabled. However, if the grantee retires at age 65 (or age 55 with at least 10 years of service with the company) or later, on the normal vesting date the grantee will receive a pro-rated number of shares based upon the retirement date and measured at the actual performance for the entire performance period. In addition, if the company undergoes a change in control, the TSR shares will immediately vest at the target level, provided that if 12 months of the performance period have been completed, vesting will be determined based on Company TSR as of the date of the change in control without application of four-quarter averaging. During the vesting period, the grantee has none of the rights of a shareholder. Dividends declared during the vesting period will accrue and will be paid at vesting on the shares that ultimately vest. The fair value estimate was determined using a Monte Carlo simulation model, which utilizes multiple input variables to estimate the probability of the company achieving the market condition discussed above. Inputs into the model included the following for the company and comparator companies: (i) TSR from the beginning of the performance cycle through the measurement date; (ii) volatility; (iii) risk-free interest rates; and (iv) the correlation of the comparator companies’ TSR. The inputs are based on historical capital market data.
The following performance-contingent TSR Shares have been granted under the EPIP (2014) and the Omnibus Plan (2015) and have service period remaining (amounts in thousands, except price data):
Grant date |
| January 4, 2015 |
|
| January 1, 2014 |
|
| January 3, 2016 |
|
| January 4, 2015 |
| ||||
Shares granted |
|
| 414 |
|
|
| 366 |
|
|
| 401 |
|
|
| 414 |
|
Assumed vesting date |
| 3/1/2017 |
|
| 3/1/2016 |
|
| 2/21/2018 |
|
| 2/23/2017 |
| ||||
Fair value per share |
| $ | 21.21 |
|
| $ | 23.97 |
|
| $ | 24.17 |
|
| $ | 21.21 |
|
As of January 2,December 31, 2016, there was $4.9$5.7 million of total unrecognized compensation cost related to nonvested TSR Shares granted under the EPIP and Omnibus Plan. That cost is expected to be recognized over a weighted-average period of 1.081.03 years.
Performance-Contingent Return on Invested Capital Shares (“ROIC Shares”)
Since 2012, certain key employees have been granted performance-contingent restricted stock under the EPIP and the Omnibus Plan in the form of ROIC Shares. The awards generally vest approximately two years from the date of grant (after the filing of the company’s Annual Report on Form 10-K), and the shares become non-forfeitable if, and to the extent that, on that date, the vesting conditions are satisfied. As a result of the delay (July as opposed to January) in the grant of the 2012 awards, the 2012 awards vested during the first quarter of 2014, 18 months from the grant date. The 2013, 2014, and 2015 awardsAwards granted subsequent to the 2012 award (granted during the first quarters of their respective years) vest two years from the date of grant. Return on Invested Capital is calculated by dividing our profit, as defined, by the invested capital (“ROIC”). Generally, the performance condition requires the company’s average ROIC to exceed its average weighted cost of capital (“WACC”) by between 1.75 to 4.75 percentage points (the “ROI Target”) over the two fiscal year
performance period. If the lowest ROI Target is not met, the awards are forfeited. The shares can be earned based on a range from 0% to 125% of target as defined below:below (the “ROIC Modifier”):
|
|
0% payout if ROIC exceeds WACC by less than 1.75 percentage points;
|
|
ROIC above WACC by 1.75 percentage points pays 50% of ROI Target; or
|
|
ROIC above WACC by 3.75 percentage points pays 100% of ROI Target; or
|
|
ROIC above WACC by 4.75 percentage points pays 125% of ROI Target.
For performance between the levels described above, the degree of vesting is interpolated on a linear basis. The 2012 and 2013 awards actual attainment was 125%table below presents the payout percentage for each of ROI Target.the ROIC awards:
Award | Fiscal year vested | Payout (%) | ||
2012 award | Fiscal 2014 | 125 | ||
2013 award | Fiscal 2015 | 125 | ||
2014 award | Fiscal 2016 | 96 |
The ROIC Shares vest immediately if the grantee dies or becomes disabled. However, if the grantee retires at age 65 (or age 55 with at least 10 years of service with the company) or later, on the normal vesting date the grantee will receive a pro-rated number of shares based upon the retirement date and actual performance for the entire performance period. In addition, if the company undergoes a change in control, the ROIC Shares will immediately vest at the target level. During the vesting period, the grantee has none of the rights of a shareholder. Dividends declared during the vesting period will accrue and will be paid at vesting on the shares that ultimately vest. The fair value of this type of award is equal to the stock price on the grant date. Since these awards have a performance condition feature the expense associated with these awards may change depending on the expected ROI Target attained at each reporting period. The expected ROI Target for expense calculations at January 2,December 31, 2016 was 90%100% for the 20142015 award and 100% for the 20152016 award. The following performance-contingent ROIC Shares have been granted under the EPIP (2014) and the Omnibus Plan (2015) and have service period remaining (amounts in thousands, except price data):
Grant date |
| January 4, 2015 |
|
| January 1, 2014 |
|
| January 3, 2016 |
|
| January 4, 2015 |
| ||||
Shares granted |
|
| 414 |
|
|
| 366 |
|
|
| 401 |
|
|
| 414 |
|
Assumed vesting date |
| 3/1/2017 |
|
| 3/1/2016 |
|
| 2/21/2018 |
|
| 2/23/2017 |
| ||||
Fair value per share |
| $ | 19.14 |
|
| $ | 21.47 |
|
| $ | 21.49 |
|
| $ | 19.14 |
|
As of January 2,December 31, 2016, there was $4.3$5.1 million of total unrecognized compensation cost related to nonvested ROIC Shares granted under the EPIP. This cost is expected to be recognized over a weighted-average period of 1.081.03 years.
Performance-Contingent Restricted Stock Summary
In connection withThe table below presents the TSR Modifier share adjustment, ROIC Modifier share adjustment, accumulated dividends on vested shares, and the tax windfall/shortfall at vesting of the performance-contingent restricted stock grantedawards (amounts in January 2013, during fiscal 2015, 48,069 common shares availablethousands except for this grant were reduced because the company attained only 88% of the S&P TSR target of the grant (“TSR modifier”). An additional 100,090 common shares were issued in the aggregate for this grant because the company exceeded the ROIC by the maximum at 125% (“ROIC modifier”). At vesting, the company paid accumulated dividends of $0.9 million. The tax windfall at vesting of these awards was $1.4 million.share data):
In connection with the vesting of the performance-contingent restricted stock granted in July 2012, during fiscal 2014, an additional 193,756 common shares were issued because the company exceeded the median TSR of its peer group and payout was 195% of the target grant (“TSR modifier”) and an additional 50,939 common shares were issued because the company’s ROIC exceeded its WACC by the maximum amount and payout was 125% of the target grant (“ROIC modifier”). At vesting the company paid accumulated dividends of $0.4 million.
Award granted |
| Fiscal year vested |
| TSR Modifier increase/(decrease) shares |
|
| ROIC Modifier increase/(decrease) shares |
|
| Dividends at vesting (thousands) |
|
| Tax windfall/(shortfall) |
|
| Fair value at vesting |
| |||||
2014 |
| 2016 |
|
| (248,872 | ) |
|
| (13,637 | ) |
| $ | 441 |
|
| $ | (3,090 | ) |
| $ | 7,173 |
|
2013 |
| 2015 |
|
| (48,069 | ) |
|
| 100,090 |
|
| $ | 859 |
|
| $ | 1,430 |
|
| $ | 18,378 |
|
2012 |
| 2014 |
|
| 193,756 |
|
|
| 50,939 |
|
| $ | 429 |
|
| $ | 2,668 |
|
| $ | 13,748 |
|
A summary of the status of all of the company’s nonvested shares for performance-contingent restricted stock (including the TSR Shares and the ROIC Shares) for fiscal 2016, 2015 2014 and 20132014 is set forth below:below (amounts in thousands, except price data):
|
| Fiscal 2015 |
|
| Fiscal 2014 |
|
| Fiscal 2013 |
| |||||||||||||||||||||||||||||||||||||||
|
| Number of Shares |
|
| Weighted Average Fair Value |
|
| Number of Shares |
|
| Weighted Average Fair Value |
|
| Number of Shares |
|
| Weighted Average Fair Value |
|
| Fiscal 2016 |
|
| Fiscal 2015 |
|
| Fiscal 2014 |
| |||||||||||||||||||||
|
| (Amounts in thousands, except price data) |
|
| Number of Shares |
|
| Weighted Average Fair Value |
|
| Number of Shares |
|
| Weighted Average Fair Value |
|
| Number of Shares |
|
| Weighted Average Fair Value |
| |||||||||||||||||||||||||||
Balance at beginning of year |
|
| 1,404 |
|
| $ | 19.09 |
|
|
| 1,229 |
|
| $ | 15.88 |
|
|
| 888 |
|
| $ | 12.61 |
|
|
| 1,349 |
|
| $ | 21.26 |
|
|
| 1,404 |
|
| $ | 19.09 |
|
|
| 1,229 |
|
| $ | 15.88 |
|
Initial grant |
|
| 829 |
|
| $ | 20.18 |
|
|
| 732 |
|
| $ | 22.72 |
|
|
| 828 |
|
| $ | 16.37 |
|
|
| 801 |
|
| $ | 22.83 |
|
|
| 829 |
|
| $ | 20.18 |
|
|
| 732 |
|
| $ | 22.72 |
|
Supplemental grant for exceeding ROIC modifier |
|
| 100 |
|
| $ | 14.37 |
|
|
| 51 |
|
| $ | 14.37 |
|
|
| — |
|
| $ | — |
|
|
| — |
|
| $ | — |
|
|
| 100 |
|
| $ | 14.37 |
|
|
| 51 |
|
| $ | 14.37 |
|
Supplemental grant for exceeding the TSR modifier |
|
| — |
|
| $ | — |
|
|
| 194 |
|
| $ | 15.45 |
|
|
| 95 |
|
| $ | 10.62 |
|
|
| — |
|
| $ | — |
|
|
| — |
|
| $ | — |
|
|
| 194 |
|
| $ | 15.45 |
|
Vested |
|
| (853 | ) |
| $ | 16.22 |
|
|
| (759 | ) |
| $ | 16.11 |
|
|
| (571 | ) |
| $ | 10.62 |
|
|
| (312 | ) |
| $ | 22.02 |
|
|
| (853 | ) |
| $ | 16.22 |
|
|
| (759 | ) |
| $ | 16.11 |
|
Grant reduction for not achieving the ROIC modifier |
|
| (249 | ) |
| $ | 23.97 |
|
|
| — |
|
| $ | — |
|
|
| — |
|
| $ | — |
| ||||||||||||||||||||||||
Grant reduction for not achieving the TSR modifier |
|
| (48 | ) |
| $ | 17.22 |
|
|
| — |
|
| $ | — |
|
|
| — |
|
| $ | — |
|
|
| (14 | ) |
| $ | 21.47 |
|
|
| (48 | ) |
| $ | 17.22 |
|
|
| — |
|
| $ | — |
|
Forfeitures |
|
| (83 | ) |
| $ | 20.99 |
|
|
| (43 | ) |
| $ | 19.73 |
|
|
| (11 | ) |
| $ | 15.88 |
|
|
| (32 | ) |
| $ | 23.60 |
|
|
| (83 | ) |
| $ | 20.99 |
|
|
| (43 | ) |
| $ | 19.73 |
|
Balance at end of year |
|
| 1,349 |
|
| $ | 21.26 |
|
|
| 1,404 |
|
| $ | 19.09 |
|
|
| 1,229 |
|
| $ | 15.88 |
|
|
| 1,543 |
|
| $ | 21.53 |
|
|
| 1,349 |
|
| $ | 21.26 |
|
|
| 1,404 |
|
| $ | 19.09 |
|
As of January 2,December 31, 2016, there was $9.2$10.7 million of total unrecognized compensation cost related to nonvested restricted stock granted under the EPIP. This cost is expected to be recognized over a weighted-average period of 1.081.03 years. The fair value of performance-contingent restricted share awards that vested during fiscal 2015 was $18.4 million. There was a tax windfall of $1.4 million on the vesting (issuance) of performance-contingent awards during fiscal 2015.
Deferred and Restricted Stock
Pursuant to the EPIP, previously the company allowed non-employee directors to convert their annual board retainers into deferred stock equal in value to 130% of the cash payments these directors would have otherwise received. The deferred stock had a minimum two yeartwo-year vesting period and will be distributed to the individual (along with accumulated dividends) at a time designated by the individual at the date of conversion. On January 2, 2015 (our fiscal 2014), cash pay was converted into an aggregate of 19,852 shares. The company recorded compensation expense for this deferred stock over the two-year minimum vesting period. There were no shares distributed under the EPIP during fiscal 2015. Following the May 2014 Board of Directors meeting and the adoption of the Omnibus Plan, annual board retainers converted into deferred stock and issued under the Omnibus Plan are equal in value to 100% of the cash payments directors would otherwise receive and the vesting period is a one-year period to match the period of time that cash would have been received if no conversion existed. Going forward, under the Omnibus Plan, non-employee directors may elect to convert their annual board retainers into deferred stock equal in value to 100% of the cash payments they otherwise would have received. The deferred stock so converted will have a one-year pro-rated vesting period. Accumulated dividends are paid upon delivery of the shares. A total of 2,380 common shares were issued after the deferral period during fiscal 2016.
Pursuant to the Omnibus Plan and the EPIP, non-employee directors also receive annual grants of deferred stock. This deferred stock vests over one year from the grant date. During the second quarter of fiscal 2015,2016, non-employee directors were granted an aggregate of 69,58295,314 shares of deferred stock pursuant to the Omnibus Plan. The deferred stock will be distributed to the grantee at a time designated by the grantee at the date of grant. Compensation expense is recorded on this deferred stock over the one year minimum vesting period. During fiscal 2015,2016, a total of 55,713111,868 previously deferred shares were issued after the deferral period.
A total of 105,621 shares of previously vested and deferred awards were also distributed during fiscal 2014 for a director who retired on May 21, 2014 and the cumulative deferred shares (including retainer conversions and annual grants) were issued at that time. An additional 46,364 shares of previously vested and deferred awards were also distributed during fiscal 2014 for a director who retired on December 31, 2014 and the cumulative deferred shares (including retainer conversions and annual grants) were issued at that time.
On May 31, 2013, the company’s Chief Executive Officer (“CEO”) received a time-based restricted stock award of approximately $1.3 million of restricted stock pursuant to the EPIP. This award will vest 100% on the fourth anniversary of the date of grant provided the CEO remains employed by the company during this period and the award value does not exceed 0.5% of our cumulative EBITDA over the vesting period. Vesting will also occur in the event of the CEO’s death or disability, but not his retirement. Dividends will accrue on the award and will be paid to the CEO on the vesting date for all shares that vest. There were 58,500 shares issued for this award at a fair value of $22.25 per share.
The deferred and restricted stock activity for fiscal years 2016, 2015, 2014, and 20132014 is set forth below:below (amounts in thousands, except price data):
|
| Fiscal 2015 |
|
| Fiscal 2014 |
|
| Fiscal 2013 |
| |||||||||||||||||||||||||||||||||||||||
|
| Number of Shares |
|
| Weighted Average Fair Value |
|
| Number of Shares |
|
| Weighted Average Fair Value |
|
| Number of Shares |
|
| Weighted Average Fair Value |
|
| Fiscal 2016 |
|
| Fiscal 2015 |
|
| Fiscal 2014 |
| |||||||||||||||||||||
|
| (Amounts in thousands, except price data) |
|
| Number of Shares |
|
| Weighted Average Fair Value |
|
| Number of Shares |
|
| Weighted Average Fair Value |
|
| Number of Shares |
|
| Weighted Average Fair Value |
| |||||||||||||||||||||||||||
Nonvested shares at beginning of year |
|
| 151 |
|
| $ | 21.06 |
|
|
| 177 |
|
| $ | 18.92 |
|
|
| 138 |
|
| $ | 13.04 |
|
|
| 126 |
|
| $ | 21.89 |
|
|
| 151 |
|
| $ | 21.06 |
|
|
| 177 |
|
| $ | 18.92 |
|
Granted |
|
| 70 |
|
| $ | 21.59 |
|
|
| 117 |
|
| $ | 20.24 |
|
|
| 149 |
|
| $ | 20.32 |
|
|
| 95 |
|
| $ | 19.30 |
|
|
| 70 |
|
| $ | 21.59 |
|
|
| 117 |
|
| $ | 20.24 |
|
Vested |
|
| (95 | ) |
| $ | 20.28 |
|
|
| (123 | ) |
| $ | 17.81 |
|
|
| (110 | ) |
| $ | 13.41 |
|
|
| (72 | ) |
| $ | 21.59 |
|
|
| (95 | ) |
| $ | 20.28 |
|
|
| (123 | ) |
| $ | 17.81 |
|
Forfeited |
|
| — |
|
| $ | — |
|
|
| (20 | ) |
| $ | 18.93 |
|
|
| — |
|
| $ | — |
|
|
| — |
|
| $ | — |
|
|
| — |
|
| $ | — |
|
|
| (20 | ) |
| $ | 18.93 |
|
Nonvested shares at end of year |
|
| 126 |
|
| $ | 21.89 |
|
|
| 151 |
|
| $ | 21.06 |
|
|
| 177 |
|
| $ | 18.92 |
|
|
| 149 |
|
| $ | 20.39 |
|
|
| 126 |
|
| $ | 21.89 |
|
|
| 151 |
|
| $ | 21.06 |
|
Vested and deferred shares at end of year |
|
| 222 |
|
|
|
|
|
|
| 169 |
|
|
|
|
|
|
| 92 |
|
|
|
|
|
|
| 331 |
|
|
|
|
|
|
| 222 |
|
|
|
|
|
|
| 169 |
|
|
|
|
|
As of January 2,December 31, 2016, there was $1.1$0.7 million of total unrecognized compensation cost related to deferred and restricted stock awards granted under the EPIP. This cost is expected to be recognized over a weighted-average period of 0.840.40 years. The intrinsic value of deferred stock awards that vested during fiscal 20152016 was $2.2$1.3 million. There was aan immaterial tax windfall of $0.1 million on the exercise of deferred share awards during fiscal 2015.2016.
Stock Appreciation Rights
Prior to 2007, the company allowed non-employee directors to convert their retainers and committee chair fees into rights. These rights vested after one year and can be exercised over nine years. The company records compensation expense for these rights at a measurement date based on changes between the grant price and an estimated fair value of the rights using the Black-Scholes option-pricing model. The liability for these rights at January 2, 2016 and January 3, 2015 was $0.2 million and $0.3 million, respectively, and iswas recorded in other current liabilities. The company paid $0.3$0.2 million at the time of exercise of 15,52513,500 shares during fiscal 2015.
The fair value of the rights at January 2, 2016 ranged from $10.61 to $10.97. The following assumptions were used to determine the fair value of the rights discussed above using the Black-Scholes option-pricing model at January 2, 2016: dividend yield 2.4%; expected volatility 22.0%; risk-free interest rate 0.25% and expected life of 0.50 years to 0.70 years.2016. There are no remaining liabilities for these awards.
The rights activity for fiscal years 2016, 2015, 2014, and 20132014 is set forth below:below (amounts in thousands, except price data):
|
| Fiscal 2015 |
|
| Fiscal 2014 |
|
| Fiscal 2013 |
| |||||||||||||||
|
| (Amounts in thousands, except price data) |
|
| Fiscal 2016 |
|
| Fiscal 2015 |
|
| Fiscal 2014 |
| ||||||||||||
Balance at beginning of year |
|
| 29 |
|
|
| 141 |
|
|
| 195 |
|
|
| 14 |
|
|
| 29 |
|
|
| 141 |
|
Rights exercised |
|
| (15 | ) |
|
| (112 | ) |
|
| (54 | ) |
|
| (14 | ) |
|
| (15 | ) |
|
| (112 | ) |
Balance at end of year |
|
| 14 |
|
|
| 29 |
|
|
| 141 |
|
|
| — |
|
|
| 14 |
|
|
| 29 |
|
Weighted average — grant date fair value |
| $ | 8.67 |
|
| $ | 8.47 |
|
| $ | 7.20 |
|
| $ | — |
|
| $ | 8.67 |
|
| $ | 8.47 |
|
Shared-Based Payments Compensation Expense Summary
The following table summarizes the company’s stock-based compensation expense, all of which was recognized in selling, distribution, and administration expense, for fiscal years 2016, 2015 and 2014 and 2013:(amounts in thousands):
|
| Fiscal 2015 |
|
| Fiscal 2014 |
|
| Fiscal 2013 |
| |||||||||||||||
|
| (Amounts in thousands) |
|
| Fiscal 2016 |
|
| Fiscal 2015 |
|
| Fiscal 2014 |
| ||||||||||||
Stock options |
| $ | — |
|
| $ | 197 |
|
| $ | 1,776 |
|
| $ | — |
|
| $ | — |
|
| $ | 197 |
|
Performance-contingent restricted stock awards |
|
| 13,369 |
|
|
| 16,544 |
|
|
| 11,180 |
|
|
| 16,611 |
|
|
| 13,369 |
|
|
| 16,544 |
|
Deferred stock awards |
|
| 2,205 |
|
|
| 2,176 |
|
|
| 1,769 |
|
|
| 2,161 |
|
|
| 2,205 |
|
|
| 2,176 |
|
Stock appreciation rights (income) expense |
|
| 118 |
|
|
| (255 | ) |
|
| 1,218 |
|
|
| (11 | ) |
|
| 118 |
|
|
| (255 | ) |
Total stock-based compensation expense |
| $ | 15,692 |
|
| $ | 18,662 |
|
| $ | 15,943 |
|
| $ | 18,761 |
|
| $ | 15,692 |
|
| $ | 18,662 |
|
The company’s total comprehensive loss presently consists of net income, adjustments for our derivative financial instruments accounted for as cash flow hedges, and various pension and other postretirement benefit related items.
During fiscal years 2016, 2015, 2014, and 2013,2014, reclassifications out of accumulated other comprehensive lossAOCI were as follows (amounts in thousands):
Details about Accumulated |
| Amount Reclassified from Accumulated Other Comprehensive Loss |
|
| Affected Line Item in the Statement |
| Amount Reclassified from Accumulated Other Comprehensive Loss |
|
| Affected Line Item in the Statement | ||||||||||||||||||
Other Comprehensive Income Components (Note 2) |
| Fiscal 2015 |
|
| Fiscal 2014 |
|
| Fiscal 2013 |
|
| Where Net Income is Presented |
| Fiscal 2016 |
|
| Fiscal 2015 |
|
| Fiscal 2014 |
|
| Where Net Income is Presented | ||||||
Gains and losses on cash flow hedges: |
|
|
|
|
|
|
|
|
|
|
|
|
|
|
|
|
|
|
|
|
|
|
|
|
|
|
|
|
Interest rate contracts |
| $ | (250 | ) |
| $ | (255 | ) |
| $ | (816 | ) |
| Interest expense |
| $ | (221 | ) |
| $ | (250 | ) |
| $ | (255 | ) |
| Interest expense |
Commodity contracts |
|
| (8,551 | ) |
|
| (5,218 | ) |
|
| (27,055 | ) |
| Cost of sales, Note 3, below |
|
| (5,307 | ) |
|
| (8,551 | ) |
|
| (5,218 | ) |
| Cost of sales, Note 3, below |
Total before tax |
| $ | (8,801 | ) |
| $ | (5,473 | ) |
| $ | (27,871 | ) |
| Total before tax |
| $ | (5,528 | ) |
| $ | (8,801 | ) |
| $ | (5,473 | ) |
| Total before tax |
Tax benefit |
|
| 3,388 |
|
|
| 2,107 |
|
|
| 10,730 |
|
| Tax benefit |
|
| 2,129 |
|
|
| 3,388 |
|
|
| 2,107 |
|
| Tax benefit |
Total net of tax |
| $ | (5,413 | ) |
| $ | (3,366 | ) |
| $ | (17,141 | ) |
| Net of tax |
| $ | (3,399 | ) |
| $ | (5,413 | ) |
| $ | (3,366 | ) |
| Net of tax |
Pension and postretirement benefit items: |
|
|
|
|
|
|
|
|
|
|
|
|
|
|
|
|
|
|
|
|
|
|
|
|
|
|
|
|
Prior-service credits |
| $ | 267 |
|
| $ | 469 |
|
| $ | 257 |
|
| Note 1, below |
| $ | (175 | ) |
| $ | 267 |
|
| $ | 469 |
|
| Note 1, below |
Settlement loss |
|
| — |
|
|
| (15,387 | ) |
|
| — |
|
| Note 1, below |
|
| (6,646 | ) |
|
| — |
|
|
| (15,387 | ) |
| Note 1, below |
Actuarial losses |
|
| (4,395 | ) |
|
| (1,348 | ) |
|
| (5,378 | ) |
| Note 1, below |
|
| (6,840 | ) |
|
| (4,395 | ) |
|
| (1,348 | ) |
| Note 1, below |
Total before tax |
| $ | (4,128 | ) |
| $ | (16,266 | ) |
| $ | (5,121 | ) |
| Total before tax |
| $ | (13,661 | ) |
| $ | (4,128 | ) |
| $ | (16,266 | ) |
| Total before tax |
Tax benefit |
|
| 1,589 |
|
|
| 6,263 |
|
|
| 1,972 |
|
| Tax benefit |
|
| 5,260 |
|
|
| 1,589 |
|
|
| 6,263 |
|
| Tax benefit |
Total net of tax |
| $ | (2,539 | ) |
| $ | (10,003 | ) |
| $ | (3,149 | ) |
| Net of tax benefit |
| $ | (8,401 | ) |
| $ | (2,539 | ) |
| $ | (10,003 | ) |
| Net of tax benefit |
Total reclassifications |
| $ | (7,952 | ) |
| $ | (13,369 | ) |
| $ | (20,290 | ) |
| Net of tax benefit |
| $ | (11,800 | ) |
| $ | (7,952 | ) |
| $ | (13,369 | ) |
| Net of tax benefit |
| Note 1: | These items are included in the computation of net periodic pension cost. See Note 19, Postretirement Plans, for additional information. |
| Note 2: | Amounts in parentheses indicate debits to determine net income. |
| Note 3: | Amounts are presented as an adjustment to reconcile net income to net cash provided by operating activities on the Consolidated Statements of Cash Flows. |
During fiscal 2015,2016, changes to accumulated other comprehensive loss,AOCI, net of income tax, by component were as follows (amounts in thousands):
|
| Gains/Losses on Cash Flow Hedges |
|
| Defined Benefit Pension Plan Items |
|
| Total |
|
| Cash Flow Hedge Items |
|
| Defined Benefit Pension Plan Items |
|
| Total |
| ||||||
Accumulated other comprehensive loss, January 3, 2015 |
| $ | (11,408 | ) |
| $ | (86,612 | ) |
| $ | (98,020 | ) | ||||||||||||
Other comprehensive income before reclassifications |
|
| (4,195 | ) |
|
| (2,537 | ) |
|
| (6,732 | ) | ||||||||||||
Accumulated other comprehensive loss, January 2, 2016 |
| $ | (10,190 | ) |
| $ | (86,610 | ) |
| $ | (96,800 | ) | ||||||||||||
Other comprehensive income (loss) before reclassifications |
|
| 5,730 |
|
|
| (4,013 | ) |
|
| 1,717 |
| ||||||||||||
Reclassified to earnings from accumulated other comprehensive loss |
|
| 5,413 |
|
|
| 2,539 |
|
|
| 7,952 |
|
|
| 3,399 |
|
|
| 8,401 |
|
|
| 11,800 |
|
Accumulated other comprehensive loss, January 2, 2016 |
| $ | (10,190 | ) |
| $ | (86,610 | ) |
| $ | (96,800 | ) | ||||||||||||
Accumulated other comprehensive loss, December 31, 2016 |
| $ | (1,061 | ) |
| $ | (82,222 | ) |
| $ | (83,283 | ) | ||||||||||||
During fiscal 2014,2015, changes to accumulated other comprehensive loss,AOCI, net of income tax, by component were as follows (amounts in thousands):
|
| Gains/Losses on Cash Flow Hedges |
|
| Defined Benefit Pension Plan Items |
|
| Total |
|
| Cash Flow Hedge Items |
|
| Defined Benefit Pension Plan Items |
|
| Total |
| ||||||
Accumulated other comprehensive loss, December 28, 2013 |
| $ | (11,416 | ) |
| $ | (51,099 | ) |
| $ | (62,515 | ) | ||||||||||||
Other comprehensive income before reclassifications |
|
| (3,358 | ) |
|
| (45,516 | ) |
|
| (48,874 | ) | ||||||||||||
Accumulated other comprehensive loss, January 3, 2015 |
| $ | (11,408 | ) |
| $ | (86,612 | ) |
| $ | (98,020 | ) | ||||||||||||
Other comprehensive loss before reclassifications |
|
| (4,195 | ) |
|
| (2,537 | ) |
|
| (6,732 | ) | ||||||||||||
Reclassified to earnings from accumulated other comprehensive loss |
|
| 3,366 |
|
|
| 10,003 |
|
|
| 13,369 |
|
|
| 5,413 |
|
|
| 2,539 |
|
|
| 7,952 |
|
Accumulated other comprehensive loss, January 3, 2015 |
| $ | (11,408 | ) |
| $ | (86,612 | ) |
| $ | (98,020 | ) | ||||||||||||
Accumulated other comprehensive loss, January 2, 2016 |
| $ | (10,190 | ) |
| $ | (86,610 | ) |
| $ | (96,800 | ) | ||||||||||||
Amounts reclassified out of accumulated other comprehensive lossAOCI to net income that relate to commodity contracts are presented as an adjustment to reconcile net income to net cash provided by operating activities on the Condensed Consolidated Statements of Cash Flows. The following table presents the net of tax amount of the loss reclassified from accumulated other comprehensive income (“AOCI”)AOCI for our commodity contracts:contracts (amounts in thousands):
|
| Fiscal 2015 |
|
| Fiscal 2014 |
|
| Fiscal 2013 |
| |||||||||||||||
|
| (Amounts in thousands) |
|
| Fiscal 2016 |
|
| Fiscal 2015 |
|
| Fiscal 2014 |
| ||||||||||||
Gross loss reclassified from AOCI into income |
| $ | 8,551 |
|
| $ | 5,218 |
|
| $ | 27,055 |
|
| $ | 5,307 |
|
| $ | 8,551 |
|
| $ | 5,218 |
|
Tax benefit |
|
| (3,292 | ) |
|
| (2,009 | ) |
|
| (10,416 | ) |
|
| (2,043 | ) |
|
| (3,292 | ) |
|
| (2,009 | ) |
Net of tax |
| $ | 5,259 |
|
| $ | 3,209 |
|
| $ | 16,639 |
|
| $ | 3,264 |
|
| $ | 5,259 |
|
| $ | 3,209 |
|
Note 18. | Earnings Per Share |
The following is a reconciliation of net income and weighted average shares for calculating basic and diluted earnings per common share for fiscal years 2016, 2015, 2014, and 20132014 (amounts in thousands, except per share data):
|
| Fiscal 2015 |
|
| Fiscal 2014 |
|
| Fiscal 2013 |
|
| Fiscal 2016 |
|
| Fiscal 2015 |
|
| Fiscal 2014 |
| ||||||
Net income |
| $ | 189,191 |
|
| $ | 175,739 |
|
| $ | 230,894 |
|
| $ | 163,776 |
|
| $ | 189,191 |
|
| $ | 175,739 |
|
Basic Earnings Per Common Share: |
|
|
|
|
|
|
|
|
|
|
|
|
|
|
|
|
|
|
|
|
|
|
|
|
Basic weighted average shares outstanding per common share |
|
| 210,793 |
|
|
| 209,683 |
|
|
| 207,935 |
|
|
| 208,511 |
|
|
| 210,793 |
|
|
| 209,683 |
|
Basic earnings per common share |
| $ | 0.90 |
|
| $ | 0.84 |
|
| $ | 1.11 |
|
| $ | 0.79 |
|
| $ | 0.90 |
|
| $ | 0.84 |
|
Diluted Earnings Per Common Share: |
|
|
|
|
|
|
|
|
|
|
|
|
|
|
|
|
|
|
|
|
|
|
|
|
Basic weighted average shares outstanding per common share |
|
| 210,793 |
|
|
| 209,683 |
|
|
| 207,935 |
|
|
| 208,511 |
|
|
| 210,793 |
|
|
| 209,683 |
|
Add: Shares of common stock assumed issued upon exercise of stock options, vesting of performance-contingent restricted stock and deferred stock |
|
| 2,563 |
|
|
| 3,409 |
|
|
| 3,992 |
|
|
| 1,843 |
|
|
| 2,563 |
|
|
| 3,409 |
|
Diluted weighted average shares outstanding per common share |
|
| 213,356 |
|
|
| 213,092 |
|
|
| 211,927 |
|
|
| 210,354 |
|
|
| 213,356 |
|
|
| 213,092 |
|
Diluted earnings per common share |
| $ | 0.89 |
|
| $ | 0.82 |
|
| $ | 1.09 |
|
| $ | 0.78 |
|
| $ | 0.89 |
|
| $ | 0.82 |
|
There were no anti-dilutive shares for fiscal years 2016, 2015 2014 or 2013.2014.
Note 19. | Postretirement Plans |
The following summarizes the company’s balance sheet related pension and other postretirement benefit plan accounts at December 31, 2016 and January 2, 2016 and January 3, 2015:(amounts in thousands):
|
| As of |
| |||||||||||||
|
| January 2, 2016 |
|
| January 3, 2015 |
| ||||||||||
|
| (Amounts in thousands) |
|
| December 31, 2016 |
|
| January 2, 2016 |
| |||||||
Current benefit liability |
| $ | 1,118 |
|
| $ | 1,089 |
|
| $ | 979 |
|
| $ | 1,118 |
|
Noncurrent benefit liability |
| $ | 76,541 |
|
| $ | 93,589 |
|
| $ | 69,601 |
|
| $ | 76,541 |
|
Accumulated other comprehensive loss, net of tax |
| $ | 86,610 |
|
| $ | 86,612 |
|
| $ | 82,222 |
|
| $ | 86,610 |
|
Beginning January 1, 2016, theThe company will provideamended our qualified defined benefit plans in October 2015 to allow retired and terminated vested pension plan participants who have not yet started theirreceiving benefit payments the option to elect to receive their benefit as a single lump sum payment. Participants can elect this option when they retire or when they leave the company.This amendment was effective as of January 1, 2016. This change supports our long-term pension risk management strategy.
In September 2014,Settlement accounting, which accelerates recognition of a plan’s unrecognized net gain or loss, is triggered if the company announced a one-time voluntary lump sum offer to approximately 2,500 former employees in Plan No. 1 and 2 who had not yet started monthly payment of their vested benefits. The offer supports the company’s pension risk management strategy and reduced plan obligations by 10%. Distributions of $50.4 million intotal lump sums from existing plan assets for Plan No. 1paid during a year exceeds the sum of the plan’s service and Plan No. 2 in December 2014 resulted in ainterest cost. With no settlement charge of $15.4 millionrecognized until the second quarter, the table below presents the recognized settlement charges by quarter for Plan No. 1 only. No settlement charge was required for Plan No. 2 as distributions of $2.0 million were notfiscal 2016 (amounts in excess of service costs and interest costs for 2014.thousands):
Fiscal 2016 |
| Settlement loss |
| |
Quarter 2 |
| $ | 4,641 |
|
Quarter 3 |
|
| 1,832 |
|
Quarter 4 |
|
| 173 |
|
Total fiscal 2016 |
| $ | 6,646 |
|
The company used a measurement date of December 31, 20152016 for the defined benefit and postretirement benefit plans described below. We believe that the difference in the fair value of plan assets between the measurement date of December 31, 2015 and our fiscal year end date of January 2, 2016 was not material and that for practical purposes the measurement date of December 31, 2015 was used throughout for preparation of our financial statements.
The company has trusteed, noncontributory defined benefit pension plans covering certain current and former employees. Benefits under the company’s largest pension plan are frozen. The company continues to maintain an ongoing plan that covers a small number of certain union employees. The benefits in this plan are based on years of service and the employee’s career earnings. The qualified plans are funded at amounts deductible for income tax purposes but not less than the minimum funding required by the Employee Retirement Income Security Act of 1974 (“ERISA”) and the Pension Protection Act of 2006 (“PPA”). The company uses a calendar year end for the measurement date since the plans are based on a calendar year end and because it approximates the company’s fiscal year end. As of December 31, 20152016 and December 31, 2014,2015, the assets of the qualified plans included certificates of deposit, marketable equity securities, mutual funds, corporate and government debt securities, private and public real estate partnerships, other diversifying strategies and annuity contracts. The company expects pension income of approximately $6.2$5.0 million for fiscal 2016.2017.
The net periodic pension cost (income) for the company’s pension plans includes the following components for fiscal years 2016, 2015 and 2014 and 2013:(amounts in thousands):
|
| Fiscal 2015 |
|
| Fiscal 2014 |
|
| Fiscal 2013 |
| |||||||||||||||
|
| (Amounts in thousands) |
|
| Fiscal 2016 |
|
| Fiscal 2015 |
|
| Fiscal 2014 |
| ||||||||||||
Service cost |
| $ | 873 |
|
| $ | 640 |
|
| $ | 708 |
|
| $ | 830 |
|
| $ | 873 |
|
| $ | 640 |
|
Interest cost |
|
| 18,003 |
|
|
| 21,427 |
|
|
| 20,089 |
|
|
| 13,682 |
|
|
| 18,003 |
|
|
| 21,427 |
|
Expected return on plan assets |
|
| (29,642 | ) |
|
| (33,817 | ) |
|
| (28,680 | ) |
|
| (26,644 | ) |
|
| (29,642 | ) |
|
| (33,817 | ) |
Settlement loss |
|
| — |
|
|
| 15,387 |
|
|
| — |
|
|
| 6,646 |
|
|
| — |
|
|
| 15,387 |
|
Amortization of actuarial loss |
|
| 4,978 |
|
|
| 1,925 |
|
|
| 6,177 |
| ||||||||||||
Amortization: |
|
|
|
|
|
|
|
|
|
|
|
| ||||||||||||
Prior service cost |
|
| 387 |
|
|
| — |
|
|
| — |
| ||||||||||||
Actuarial loss |
|
| 7,294 |
|
|
| 4,978 |
|
|
| 1,925 |
| ||||||||||||
Net periodic pension cost (income) |
|
| (5,788 | ) |
|
| 5,562 |
|
|
| (1,706 | ) |
|
| 2,195 |
|
|
| (5,788 | ) |
|
| 5,562 |
|
Other changes in plan assets and benefit obligations recognized in other comprehensive income: |
|
|
|
|
|
|
|
|
|
|
|
|
|
|
|
|
|
|
|
|
|
|
|
|
Current year actuarial loss (gain) |
|
| (1,916 | ) |
|
| 74,510 |
|
|
| (90,706 | ) |
|
| 8,879 |
|
|
| (1,916 | ) |
|
| 74,510 |
|
Current year prior service cost |
|
| 6,199 |
|
|
| — |
|
|
| — |
|
|
| — |
|
|
| 6,199 |
|
|
| — |
|
Settlement loss |
|
| — |
|
|
| (15,387 | ) |
|
| — |
|
|
| (6,646 | ) |
|
| — |
|
|
| (15,387 | ) |
Amortization of prior service cost |
|
| (387 | ) |
|
| — |
|
|
| — |
| ||||||||||||
Amortization of actuarial (loss) |
|
| (4,978 | ) |
|
| (1,925 | ) |
|
| (6,177 | ) |
|
| (7,294 | ) |
|
| (4,978 | ) |
|
| (1,925 | ) |
Total recognized in other comprehensive (loss) income |
|
| (695 | ) |
|
| 57,198 |
|
|
| (96,883 | ) |
|
| (5,448 | ) |
|
| (695 | ) |
|
| 57,198 |
|
Total recognized in net periodic benefit cost and other comprehensive loss |
| $ | (6,483 | ) |
| $ | 62,760 |
|
| $ | (98,589 | ) |
| $ | (3,253 | ) |
| $ | (6,483 | ) |
| $ | 62,760 |
|
Actual return on plan assets for fiscal years 2016, 2015, and 2014 and 2013 was $4.7 million, $6.9 million, $11.6 million, and $73.2$11.6 million, respectively.
Approximately $6.2$6.8 million will be amortized from accumulated other comprehensive income into net periodic benefit cost in fiscal 20162017 relating to the company’s pension plans. The funded status and the amounts recognized in the Consolidated Balance Sheets for the company’s pension plans are as follows:follows (amounts in thousands):
|
| January 2, 2016 |
|
| January 3, 2015 |
| ||||||||||
|
| (Amounts in thousands) |
|
| December 31, 2016 |
|
| January 2, 2016 |
| |||||||
Change in benefit obligation: |
|
|
|
|
|
|
|
|
|
|
|
|
|
|
|
|
Benefit obligation at beginning of year |
| $ | 462,639 |
|
| $ | 463,726 |
|
| $ | 438,023 |
|
| $ | 462,639 |
|
Service cost |
|
| 873 |
|
|
| 640 |
|
|
| 830 |
|
|
| 873 |
|
Interest cost |
|
| 18,003 |
|
|
| 21,427 |
|
|
| 13,682 |
|
|
| 18,003 |
|
Actuarial loss (gain) |
|
| (24,677 | ) |
|
| 52,305 |
|
|
| (13,076 | ) |
|
| (24,677 | ) |
Benefits paid |
|
| (25,014 | ) |
|
| (27,046 | ) |
|
| (25,130 | ) |
|
| (25,014 | ) |
Plan amendments |
|
| 6,199 |
|
|
| — |
|
|
| — |
|
|
| 6,199 |
|
Settlements |
|
| — |
|
|
| (48,413 | ) |
|
| (15,734 | ) |
|
| — |
|
Benefit obligation at end of year |
| $ | 438,023 |
|
| $ | 462,639 |
|
| $ | 398,595 |
|
| $ | 438,023 |
|
Change in plan assets: |
|
|
|
|
|
|
|
|
|
|
|
|
|
|
|
|
Fair value of plan assets at beginning of year |
| $ | 378,194 |
|
| $ | 428,605 |
|
| $ | 370,497 |
|
| $ | 378,194 |
|
Actual return on plan assets |
|
| 6,881 |
|
|
| 11,613 |
|
|
| 4,689 |
|
|
| 6,881 |
|
Employer contribution |
|
| 10,436 |
|
|
| 13,435 |
|
|
| 1,341 |
|
|
| 10,436 |
|
Benefits paid |
|
| (25,014 | ) |
|
| (27,046 | ) |
|
| (25,130 | ) |
|
| (25,014 | ) |
Settlements |
|
| — |
|
|
| (48,413 | ) |
|
| (15,734 | ) |
|
| — |
|
Fair value of plan assets at end of year |
| $ | 370,497 |
|
| $ | 378,194 |
|
| $ | 335,663 |
|
| $ | 370,497 |
|
Funded status, end of year: |
|
|
|
|
|
|
|
|
|
|
|
|
|
|
|
|
Fair value of plan assets |
| $ | 370,497 |
|
| $ | 378,194 |
|
| $ | 335,663 |
|
| $ | 370,497 |
|
Benefit obligations |
|
| (438,023 | ) |
|
| (462,639 | ) |
|
| (398,595 | ) |
|
| (438,023 | ) |
Unfunded status and amount recognized at end of year |
| $ | (67,526 | ) |
| $ | (84,445 | ) |
| $ | (62,932 | ) |
| $ | (67,526 | ) |
Amounts recognized in the balance sheet: |
|
|
|
|
|
|
|
|
|
|
|
|
|
|
|
|
Current liability |
|
| (402 | ) |
|
| (409 | ) |
|
| (291 | ) |
|
| (402 | ) |
Noncurrent liability |
|
| (67,124 | ) |
|
| (84,036 | ) |
|
| (62,641 | ) |
|
| (67,124 | ) |
Amount recognized at end of year |
| $ | (67,526 | ) |
| $ | (84,445 | ) |
| $ | (62,932 | ) |
| $ | (67,526 | ) |
Amounts recognized in accumulated other comprehensive income: |
|
|
|
|
|
|
|
|
|
|
|
|
|
|
|
|
Net actuarial loss before taxes |
| $ | 137,948 |
|
| $ | 144,842 |
|
| $ | 132,886 |
|
| $ | 137,948 |
|
Prior service cost |
|
| 6,199 |
|
| $ | — |
|
|
| 5,813 |
|
|
| 6,199 |
|
Amount recognized at end of year |
| $ | 144,147 |
|
| $ | 144,842 |
|
| $ | 138,699 |
|
| $ | 144,147 |
|
|
|
|
|
|
|
|
|
|
|
|
|
|
|
|
|
|
Accumulated benefit obligation at end of year |
| $ | 436,455 |
|
| $ | 460,931 |
|
| $ | 397,224 |
|
| $ | 436,455 |
|
Assumptions used in accounting for the company’s pension plans at each of the respective fiscal years ending are as follows:
|
| Fiscal 2015 |
|
| Fiscal 2014 |
|
| Fiscal 2013 |
|
| Fiscal 2016 |
|
| Fiscal 2015 |
|
| Fiscal 2014 |
| ||||||
Weighted average assumptions used to determine benefit obligations: |
|
|
|
|
|
|
|
|
|
|
|
|
|
|
|
|
|
|
|
|
|
|
|
|
Measurement date |
| 12/31/2015 |
|
| 12/31/2014 |
|
| 12/31/2013 |
|
| 12/31/2016 |
|
| 12/31/2015 |
|
| 12/31/2014 |
| ||||||
Discount rate |
|
| 4.25 | % |
|
| 4.00 | % |
|
| 4.75 | % |
|
| 4.00 | % |
|
| 4.25 | % |
|
| 4.00 | % |
Rate of compensation increase |
|
| 3.00 | % |
|
| 4.00 | % |
|
| 4.00 | % |
|
| 3.00 | % |
|
| 3.00 | % |
|
| 4.00 | % |
Weighted average assumptions used to determine net periodic benefit (income)/cost: |
|
|
|
|
|
|
|
|
|
|
|
|
|
|
|
|
|
|
|
|
|
|
|
|
Measurement date |
| 1/1/2015 |
|
| 1/1/2014 |
|
| 1/1/2013 |
|
| 1/1/2016 |
|
| 1/1/2015 |
|
| 1/1/2014 |
| ||||||
Discount rate |
|
| 4.00 | % |
|
| 4.75 | % |
|
| 4.00 | % |
|
| 4.25 | % |
|
| 4.00 | % |
|
| 4.75 | % |
Expected return on plan assets |
|
| 8.00 | % |
|
| 8.00 | % |
|
| 8.00 | % |
|
| 8.00 | % |
|
| 8.00 | % |
|
| 8.00 | % |
Rate of compensation increase |
|
| 4.00 | % |
|
| 4.00 | % |
|
| 4.00 | % |
|
| 3.00 | % |
|
| 4.00 | % |
|
| 4.00 | % |
In developing the expected long-term rate of return on plan assets at each measurement date, the company considers the plan assets’ historical actual returns, targeted asset allocations, and the anticipated future economic environment and long-term performance of individual asset classes, based on the company’s investment strategy. While appropriate consideration is given to recent and historical investment performance, the assumption represents management’s best estimate of the long-term prospective return. Based on these factors the expected long-term rate of return assumption for the plans was set at 8.0% for fiscal 2015,2016, as
compared with the average annual return on the plan assets over the last 15 years of approximately 6.9% (net of expenses). The plan has an average annual rate of return since inception in 1987 of 9.1%8.9% (net of expenses) with consistently similar asset allocations where equities are targeted at 65%. The returns over the last five years of 8.5% have exceeded our expected return on asset estimates. We believe our asset allocation will meet our return estimates over time consistent with past performance and historical asset allocations.
Plan Assets
Effective January 1, 2014, the Finance Committee (“committee”) of the Board of Directors delegated its fiduciary and other responsibilities with respect to the plans to the newly established Investment Committee. The Investment Committee, which consists of certain members of management, establishes investment guidelines and strategies and regularly monitors the performance of the plans’ assets. The Investment Committee is responsible for executing these strategies and investing the pension assets in accordance with ERISA and fiduciary standards. The investment objective of the pension plans is to preserve the plans’ capital and maximize investment earnings within acceptable levels of risk and volatility. The Investment Committee meets on a regular basis with its investment advisors to review the performance of the plans’ assets. Based upon performance and other measures and recommendations from its investment advisors, the Investment Committee rebalances the plans’ assets to the targeted allocation when considered appropriate. The fair values of all of the company pension plan assets at December 31, 20152016 and December 31, 2014,2015, by asset class are as follows (amounts in thousands):
|
| Fair value of Pension Plan Assets as of December 31, 2015 |
|
| Fair value of Pension Plan Assets as of December 31, 2016 |
| ||||||||||||||||||||||||||
Asset Class |
| Quoted prices in active markets for identical assets (Level 1) |
|
| Significant Observable Inputs (Level 2) |
|
| Significant Unobservable Inputs (Level 3) |
|
| Total |
|
| Quoted prices in active markets for identical assets (Level 1) |
|
| Significant Observable Inputs (Level 2) |
|
| Significant Unobservable Inputs (Level 3) |
|
| Total |
| ||||||||
Short term investments and cash |
| $ | — |
|
| $ | 5,200 |
|
| $ | — |
|
| $ | 5,200 |
|
| $ | — |
|
| $ | 4,712 |
|
| $ | — |
|
| $ | 4,712 |
|
Equity securities: |
|
|
|
|
|
|
|
|
|
|
|
|
|
|
|
|
|
|
|
|
|
|
|
|
|
|
|
|
|
|
|
|
U.S. companies |
|
| 93,600 |
|
|
| — |
|
|
| — |
|
|
| 93,600 |
|
|
| 88,427 |
|
|
| — |
|
|
| — |
|
|
| 88,427 |
|
International companies |
|
| 1,957 |
|
|
| — |
|
|
| — |
|
|
| 1,957 |
|
|
| 1,427 |
|
|
| — |
|
|
| — |
|
|
| 1,427 |
|
Domestic equity funds |
|
| 54,949 |
|
|
| — |
|
|
| — |
|
|
| 54,949 |
|
|
| 47,916 |
|
|
| — |
|
|
| — |
|
|
| 47,916 |
|
International equity funds(a) |
|
| — |
|
|
| 53,971 |
|
|
| — |
|
|
| 53,971 |
| ||||||||||||||||
International equity funds(b) |
|
| — |
|
|
| 22,914 |
|
|
| — |
|
|
| 22,914 |
| ||||||||||||||||
Fixed income securities: |
|
|
|
|
|
|
|
|
|
|
|
|
|
|
|
|
|
|
|
|
|
|
|
|
|
|
|
|
|
|
|
|
U.S. government bonds |
|
| — |
|
|
| 5,257 |
|
|
| — |
|
|
| 5,257 |
|
|
| — |
|
|
| 8,796 |
|
|
| — |
|
|
| 8,796 |
|
U.S. government agency bonds |
|
| — |
|
|
| 3,215 |
|
|
| — |
|
|
| 3,215 |
|
|
| — |
|
|
| 5,909 |
|
|
| — |
|
|
| 5,909 |
|
U.S. mortgage backed securities |
|
| — |
|
|
| 7,201 |
|
|
| — |
|
|
| 7,201 |
|
|
| — |
|
|
| 5,512 |
|
|
| — |
|
|
| 5,512 |
|
U.S. corporate bonds |
|
| — |
|
|
| 2,787 |
|
|
| — |
|
|
| 2,787 |
|
|
| — |
|
|
| 10,539 |
|
|
| — |
|
|
| 10,539 |
|
Real estate funds(d) |
|
| — |
|
|
| — |
|
|
| 17,336 |
|
|
| 17,336 |
| ||||||||||||||||
Other types of investments: |
|
|
|
|
|
|
|
|
|
|
|
|
|
|
|
| ||||||||||||||||
Guaranteed insurance contracts(e) |
|
| — |
|
|
| — |
|
|
| 9,784 |
|
|
| 9,784 |
| ||||||||||||||||
Hedged equity funds(f)(k) |
|
| — |
|
|
| — |
|
|
| 40,582 |
|
|
| 40,582 |
| ||||||||||||||||
Absolute return funds(c) |
|
| — |
|
|
| — |
|
|
| 74,850 |
|
|
| 74,850 |
|
|
| — |
|
|
| — |
|
|
| 25,737 |
|
|
| 25,737 |
|
Other types of investments measured at net asset value (*): |
|
|
|
|
|
|
|
|
|
|
|
|
|
|
|
| ||||||||||||||||
Hedged equity funds(d) |
|
| — |
|
|
| — |
|
|
| — |
|
|
| 32,095 |
| ||||||||||||||||
Absolute return funds(c) |
|
| — |
|
|
| — |
|
|
| — |
|
|
| 24,299 |
| ||||||||||||||||
International equity funds(b) |
|
| — |
|
|
| — |
|
|
| — |
|
|
| 24,987 |
| ||||||||||||||||
Real estate funds(e) |
|
| — |
|
|
| — |
|
|
| — |
|
|
| 17,296 |
| ||||||||||||||||
Other types of investments measured at contract value (^): |
|
|
|
|
|
|
|
|
|
|
|
|
|
|
|
| ||||||||||||||||
Guaranteed insurance contracts(f) |
|
| — |
|
|
| — |
|
|
| — |
|
|
| 10,124 |
| ||||||||||||||||
Pending sale orders(g) |
|
| — |
|
|
| — |
|
|
| — |
|
|
| 5,000 |
| ||||||||||||||||
Other assets and (liabilities)(g) |
|
| — |
|
|
| — |
|
|
| 183 |
|
|
| 183 |
|
|
| — |
|
|
| — |
|
|
| — |
|
|
| 70 |
|
Accrued (expenses) income(g) |
|
| — |
|
|
| — |
|
|
| (375 | ) |
|
| (375 | ) |
|
| — |
|
|
| — |
|
|
| — |
|
|
| (97 | ) |
Total |
| $ | 150,506 |
|
| $ | 77,631 |
|
| $ | 142,360 |
|
| $ | 370,497 |
|
| $ | 137,770 |
|
| $ | 58,382 |
|
| $ | 25,737 |
|
| $ | 335,663 |
|
| Fair value of Pension Plan Assets as of December 31, 2014 |
|
| Fair value of Pension Plan Assets as of December 31, 2015 |
| |||||||||||||||||||||||||||
Asset Class |
| Quoted prices in active markets for identical assets (Level 1) |
|
| Significant Observable Inputs (Level 2) |
|
| Significant Unobservable Inputs (Level 3) |
|
| Total |
|
| Quoted prices in active markets for identical assets (Level 1) |
|
| Significant Observable Inputs (Level 2) |
|
| Significant Unobservable Inputs (Level 3) |
|
| Total |
| ||||||||
Short term investments and cash |
| $ | — |
|
| $ | 6,701 |
|
| $ | — |
|
| $ | 6,701 |
|
| $ | — |
|
| $ | 5,200 |
|
| $ | — |
|
| $ | 5,200 |
|
Equity securities: |
|
|
|
|
|
|
|
|
|
|
|
|
|
|
|
|
|
|
|
|
|
|
|
|
|
|
|
|
|
|
|
|
U.S. companies |
|
| 94,739 |
|
|
| — |
|
|
| — |
|
|
| 94,739 |
|
|
| 93,600 |
|
|
| — |
|
|
| — |
|
|
| 93,600 |
|
International companies |
|
| 2,700 |
|
|
| — |
|
|
| — |
|
|
| 2,700 |
|
|
| 1,957 |
|
|
| — |
|
|
| — |
|
|
| 1,957 |
|
Domestic equity funds |
|
| 63,551 |
|
|
| — |
|
|
| — |
|
|
| 63,551 |
|
|
| 54,949 |
|
|
| — |
|
|
| — |
|
|
| 54,949 |
|
International equity funds(a) |
|
| — |
|
|
| 45,851 |
|
|
| — |
|
|
| 45,851 |
| ||||||||||||||||
International equity funds(b) |
|
| — |
|
|
| 26,565 |
|
|
| — |
|
|
| 26,565 |
| ||||||||||||||||
Fixed income securities: |
|
|
|
|
|
|
|
|
|
|
|
|
|
|
|
|
|
|
|
|
|
|
|
|
|
|
|
|
|
|
|
|
U.S. government bonds |
|
| — |
|
|
| 4,664 |
|
|
| — |
|
|
| 4,664 |
|
|
| — |
|
|
| 5,257 |
|
|
| — |
|
|
| 5,257 |
|
U.S. government agency bonds |
|
| — |
|
|
| 874 |
|
|
| — |
|
|
| 874 |
|
|
| — |
|
|
| 3,215 |
|
|
| — |
|
|
| 3,215 |
|
U.S. mortgage backed securities |
|
| — |
|
|
| 2,333 |
|
|
| — |
|
|
| 2,333 |
|
|
| — |
|
|
| 7,201 |
|
|
| — |
|
|
| 7,201 |
|
U.S. corporate bonds |
|
| — |
|
|
| 2,452 |
|
|
| — |
|
|
| 2,452 |
|
|
| — |
|
|
| 21,202 |
|
|
| — |
|
|
| 21,202 |
|
Real estate funds(d) |
|
| — |
|
|
| — |
|
|
| 14,651 |
|
|
| 14,651 |
| ||||||||||||||||
Other types of investments: |
|
|
|
|
|
|
|
|
|
|
|
|
|
|
|
| ||||||||||||||||
Guaranteed insurance contracts(e) |
|
| — |
|
|
| — |
|
|
| 9,450 |
|
|
| 9,450 |
| ||||||||||||||||
Hedged equity funds(f)(i) |
|
| — |
|
|
| — |
|
|
| 52,420 |
|
|
| 52,420 |
| ||||||||||||||||
Absolute return funds(c)(j) |
|
| — |
|
|
| — |
|
|
| 78,094 |
|
|
| 78,094 |
| ||||||||||||||||
Absolute return funds(c) |
|
| — |
|
|
| — |
|
|
| 28,964 |
|
|
| 28,964 |
| ||||||||||||||||
Other types of investments measured at net asset value (*): |
|
|
|
|
|
|
|
|
|
|
|
|
|
|
|
| ||||||||||||||||
Hedged equity funds(d) |
|
| — |
|
|
| — |
|
|
| — |
|
|
| 40,582 |
| ||||||||||||||||
Absolute return funds(c) |
|
| — |
|
|
| — |
|
|
| — |
|
|
| 27,473 |
| ||||||||||||||||
International equity funds(b) |
|
| — |
|
|
| — |
|
|
| — |
|
|
| 27,406 |
| ||||||||||||||||
Real estate funds(e) |
|
| — |
|
|
| — |
|
|
| — |
|
|
| 17,335 |
| ||||||||||||||||
Other types of investments measured at contract value (^): |
|
|
|
|
|
|
|
|
|
|
|
|
|
|
|
| ||||||||||||||||
Guaranteed insurance contracts(f) |
|
| — |
|
|
| — |
|
|
| — |
|
|
| 9,784 |
| ||||||||||||||||
Other assets and (liabilities)(g) |
|
| — |
|
|
| — |
|
|
| 184 |
|
|
| 184 |
|
|
| — |
|
|
| — |
|
|
| — |
|
|
| (376 | ) |
Accrued (expenses) income(g) |
|
| — |
|
|
| — |
|
|
| (470 | ) |
|
| (470 | ) |
|
| — |
|
|
| — |
|
|
| — |
|
|
| 183 |
|
Total |
| $ | 160,990 |
|
| $ | 62,875 |
|
| $ | 154,329 |
|
| $ | 378,194 |
|
| $ | 150,506 |
|
| $ | 68,640 |
|
| $ | 28,964 |
|
| $ | 370,497 |
|
(a) | This class includes funds with the principal strategy to invest primarily in long positions in |
(b) | This class |
(c) | This class invests primarily in absolute return strategy funds. |
(d) | This class invests primarily in hedged equity funds. |
(e) | This class includes funds that invest primarily in U.S. commercial real estate. |
| This class invests primarily guaranteed insurance contracts through various U.S. insurance companies. |
|
|
(g) | This class includes accrued interest, dividends, and amounts receivable from asset sales and amounts payable for asset purchases. This class also includes pending sale requests. |
|
|
|
|
|
|
|
|
The following tables provide information on the pension plan assets that are reported using significant unobservable inputs in the estimation of fair value (amounts in thousands):
|
| 2015 Changes in Fair Value Measurements Using Significant Unobservable Inputs (Level 3) |
| |||||||||||||||||||||
|
| Real Estate Funds |
|
| Guaranteed Insurance Contracts |
|
| Hedged Equity Funds |
|
| Absolute Return Funds |
|
| Other Assets and Liabilities and Accrued (Expenses) Income |
|
| Totals |
| ||||||
Balance at December 31, 2014 |
| $ | 14,651 |
|
| $ | 9,450 |
|
| $ | 52,420 |
|
| $ | 78,094 |
|
| $ | (286 | ) |
| $ | 154,329 |
|
Actual return on plan assets: |
|
|
|
|
|
|
|
|
|
|
|
|
|
|
|
|
|
|
|
|
|
|
|
|
Total gains or losses (realized and unrealized) |
|
| 2,170 |
|
|
| — |
|
|
| 2,452 |
|
|
| 756 |
|
|
| — |
|
|
| 5,378 |
|
Purchases |
|
| — |
|
|
| 399 |
|
|
| — |
|
|
| 4,000 |
|
|
| — |
|
|
| 4,399 |
|
Issues |
|
| 736 |
|
|
| — |
|
|
| — |
|
|
| — |
|
|
| — |
|
|
| 736 |
|
Sales |
|
| (221 | ) |
|
| (65 | ) |
|
| (14,290 | ) |
|
| (8,000 | ) |
|
| — |
|
|
| (22,576 | ) |
Settlements |
|
| — |
|
|
| — |
|
|
| — |
|
|
| — |
|
|
| 94 |
|
|
| 94 |
|
Transfers out of Level 3 |
|
| — |
|
|
| — |
|
|
| — |
|
|
| — |
|
|
| — |
|
|
| — |
|
Ending balance at December 31, 2015 |
| $ | 17,336 |
|
| $ | 9,784 |
|
| $ | 40,582 |
|
| $ | 74,850 |
|
| $ | (192 | ) |
| $ | 142,360 |
|
|
| 2016 Changes in Fair Value Measurements Using Significant Unobservable Inputs (Level 3) |
| |
|
| Absolute Return Funds |
| |
Balance at December 31, 2015 |
| $ | 28,964 |
|
Actual return on plan assets: |
|
|
|
|
Total gains or losses (realized and unrealized) |
|
| 1,773 |
|
Sales |
|
| (5,000 | ) |
Balance at December 31, 2016 |
| $ | 25,737 |
|
| 2014 Changes in Fair Value Measurements Using Significant Unobservable Inputs (Level 3) |
| ||||||||||||||||||||||
|
| Real Estate Funds |
|
| Guaranteed Insurance Contracts |
|
| Hedged Equity Funds |
|
| Absolute Return Funds |
|
| Other Assets and Liabilities and Accrued (Expenses) Income |
|
| Totals |
| ||||||
Balance at December 31, 2013 |
| $ | 13,298 |
|
| $ | 9,594 |
|
| $ | 58,176 |
|
| $ | 80,616 |
|
| $ | (106 | ) |
| $ | 161,578 |
|
Actual return on plan assets: |
|
|
|
|
|
|
|
|
|
|
|
|
|
|
|
|
|
|
|
|
|
|
|
|
Total gains or losses (realized and unrealized) |
|
| 954 |
|
|
| (5 | ) |
|
| 4,280 |
|
|
| 4,978 |
|
|
| — |
|
|
| 10,207 |
|
Purchases |
|
| — |
|
|
| 440 |
|
|
| — |
|
|
| — |
|
|
| — |
|
|
| 440 |
|
Issues |
|
| 636 |
|
|
| 5 |
|
|
| — |
|
|
| — |
|
|
| — |
|
|
| 641 |
|
Sales |
|
| (237 | ) |
|
| (584 | ) |
|
| (10,036 | ) |
|
| (7,500 | ) |
|
| — |
|
|
| (18,357 | ) |
Settlements |
|
| — |
|
|
| — |
|
|
| — |
|
|
| — |
|
|
| (180 | ) |
|
| (180 | ) |
Transfers out of Level 3 |
|
| — |
|
|
| — |
|
|
| — |
|
|
| — |
|
|
| — |
|
|
| — |
|
Ending balance at December 31, 2014 |
| $ | 14,651 |
|
| $ | 9,450 |
|
| $ | 52,420 |
|
| $ | 78,094 |
|
| $ | (286 | ) |
| $ | 154,329 |
|
| 2015 Changes in Fair Value Measurements Using Significant Unobservable Inputs (Level 3) |
| ||
|
| Absolute Return Funds |
| |
Balance at December 31, 2014 |
| $ | 32,411 |
|
Actual return on plan assets: |
|
|
|
|
Total gains or losses (realized and unrealized) |
|
| 553 |
|
Sales |
|
| (4,000 | ) |
Balance at December 31, 2015 |
| $ | 28,964 |
|
The tables above reflect a correction of an error in the fair value hierarchy table of the pension plan assets as of December 31, 2014 to present the private equity fund (absolute return objective) balance as a Level 3 asset rather than a Level 2 asset as previously disclosed.
The company’s investment policy includes various guidelines and procedures designed to ensure the plan’s assets are invested in a manner necessary to meet expected future benefits earned by participants. The investment guidelines consider a broad range of economic conditions. The plan asset allocation as of the measurement dates December 31, 20152016 and December 31, 2014,2015, and target asset allocations for fiscal year 20162017 are as follows:
|
| Target Allocation |
| Percentage of Plan Assets at the Measurement Date (As percent) |
|
| Target Allocation |
| Percentage of Plan Assets at the Measurement Date (As percent) |
| ||||||||||
Asset Category |
| 2016 |
| 2015 |
|
| 2014 |
|
| 2017 |
| 2016 |
|
| 2015 |
| ||||
Equity securities |
| 40-60% |
|
| 55.6 |
|
|
| 55.0 |
|
| 40-60% |
|
| 51.1 |
|
|
| 55.6 |
|
Fixed income securities |
| 10-40% |
|
| 10.0 |
|
|
| 7.1 |
|
| 10-40% |
|
| 9.3 |
|
|
| 10.0 |
|
Real estate |
| 0-25% |
|
| 4.7 |
|
|
| 3.9 |
|
| 0-25% |
|
| 5.2 |
|
|
| 4.7 |
|
Other diversifying strategies(1) |
| 0-40% |
|
| 28.7 |
|
|
| 33.2 |
|
| 0-40% |
|
| 33.5 |
|
|
| 28.7 |
|
Short term investments and cash |
| 0-25% |
|
| 1.0 |
|
|
| 0.8 |
|
| 0-25% |
|
| 0.9 |
|
|
| 1.0 |
|
Total |
|
|
|
| 100.0 |
|
|
| 100.0 |
|
|
|
|
| 100.0 |
|
|
| 100.0 |
|
(1) | Includes absolute return funds, hedged equity funds, and guaranteed insurance contracts. |
Equity securities include 2,030,363 shares and 2,030,363 shares of the company’s common stock in the amount of $40.5 million and $43.6 million (12.1% and $39.0 million (11.8% and 10.2%11.8% of total plan assets) as of December 31, 20152016 and December 31, 2014,2015, respectively. The plan sold on the open market 1,000,000 shares of the company’s stock during fiscal 2014 for proceeds of $19.1 million. This sale was specifically from plan assets and did not directly impact the company’s Consolidated Financial Statements.
The objectives of the target allocations are to maintain investment portfolios that diversify risk through prudent asset allocation parameters, achieve asset returns that meet or exceed the plans’ actuarial assumptions, and achieve asset returns that are competitive with like institutions employing similar investment strategies.
Cash Flows
Company contributions to qualified and nonqualified plans are as follows:follows (amounts in thousands):
Year |
| Required |
|
| Discretionary |
|
| Total |
|
| Required |
|
| Discretionary |
|
| Total |
| ||||||
|
| (Amounts in thousands) |
| |||||||||||||||||||||
2016 |
| $ | 341 |
|
| $ | 1,000 |
|
| $ | 1,341 |
| ||||||||||||
2015 |
| $ | 436 |
|
| $ | 10,000 |
|
| $ | 10,436 |
|
| $ | 436 |
|
| $ | 10,000 |
|
| $ | 10,436 |
|
2014 |
| $ | 5,070 |
|
| $ | 8,365 |
|
| $ | 13,435 |
|
| $ | 5,070 |
|
| $ | 8,365 |
|
| $ | 13,435 |
|
2013 |
| $ | 5,416 |
|
| $ | 9,838 |
|
| $ | 15,254 |
| ||||||||||||
All contributions are made in cash. The required contributions made during fiscal 20152016 include $0.4$0.3 million in nonqualified pension benefits paid from corporate assets. The discretionary contributions of $10.0$1.0 million made to qualified plans during fiscal 20152016 were not required to be made by the minimum funding requirements of ERISA, but the company believed, due to its strong cash flow and financial position, this was an appropriate time at which to make the contribution in order to reduce the impact of future
contributions. During 2016,fiscal 2017, the company expects to pay $0.4$0.3 million in nonqualified pension benefits from corporate assets. There are no expected contributions to the qualified pension plans required under ERISA and the PPA.PPA during fiscal 2017. These amounts represent estimates that are based on assumptions that are subject to change. In July 2012, the Moving Ahead for Progress Act for the 21
st Century (“MAP-21”) was signed into law allowing pension plan sponsors to use higher interest rates to value plan liabilities and determine funding requirements. This legislation was extended in 2014 via the Highway and Transportation Funding Act (“HATFA”). As a result of both MAP-21 and HATFA, the company is not subject to required contributions for the 2015 or 2016 plan years.
Benefit Payments
The following are benefits paid under the plans (including settlements) during fiscal years 2016, 2015 2014 and 20132014 and expected to be paid from fiscal 20162017 through fiscal 2025.2026. Estimated future payments include qualified pension benefits that will be paid from the plans’ assets (including potential payments for the lump sum option discussed above) and nonqualified pension benefits that will be paid from corporate assets.assets (amounts in thousands):
|
| Pension Benefits |
|
| ||||||
|
| (Amounts in thousands) |
|
| ||||||
2013 |
| $ | 25,494 |
|
| |||||
Year |
| Pension Benefits |
|
| ||||||
2014 |
| $ | 75,459 |
| * |
| $ | 75,459 |
| * |
2015 |
| $ | 25,014 |
|
|
| $ | 25,014 |
|
|
2016 |
| $ | 40,864 |
| ^ | |||||
Estimated Future Payments: |
|
|
|
|
|
|
|
|
|
|
2016 |
| $ | 42,450 |
|
| |||||
2017 |
| $ | 37,428 |
|
|
| $ | 33,675 |
|
|
2018 |
| $ | 35,419 |
|
|
| $ | 32,349 |
|
|
2019 |
| $ | 34,205 |
|
|
| $ | 31,157 |
|
|
2020 |
| $ | 31,710 |
|
|
| $ | 29,762 |
|
|
2021 – 2025 |
| $ | 137,041 |
|
| |||||
2021 |
| $ | 28,916 |
|
| |||||
2022 – 2026 |
| $ | 128,858 |
|
| |||||
* | Includes $48.4 million and $2.0 million from Plan No. 1 and Plan No. 2, respectively paid in December 2014, associated with |
^ | Includes $15.7 million and $1.6 million from Plan No. 1 and Plan No. 2, respectively, paid as lump sums. The plans were amended effective January 1, 2016 to allow participants not yet receiving benefit payments to elect to receive their benefit as a single lump sum. |
Postretirement Benefit Plans
The company sponsors postretirement benefit plans that provide health care and life insurance benefits to retirees who meet certain eligibility requirements. Generally, this includes employees with at least 10 years of service who have reached age 55 and participate in a Flowers retirement plan. Retiree medical coverage is provided for a period of three to five years, depending on the participant’s age and service at retirement. Participant premiums are determined using COBRA premium levels. Retiree life insurance benefits are offered to a closed group of retirees. The company also sponsors a medical, dental, and life insurance benefits plan to a limited and closed group of participants.
Effective January 1, 2014, theThe company delivers retiree medical and dental benefits for Medicare eligible retirees through a health-care reimbursement account. The company will no longer sponsorsponsors a medical plan for Medicare eligible retirees and will no longerdoes not file for a Medicare Part D subsidy. These changes were recognized at year-end 2013.
The net periodic benefit (income) cost for the company’s postretirement benefit plans includes the following components for fiscal years 2016, 2015 and 2014 and 2013:(amounts in thousands):
|
| Fiscal 2015 |
|
| Fiscal 2014 |
|
| Fiscal 2013 |
| |||||||||||||||
|
| (Amounts in thousands) |
|
| Fiscal 2016 |
|
| Fiscal 2015 |
|
| Fiscal 2014 |
| ||||||||||||
Service cost |
| $ | 398 |
|
| $ | 377 |
|
| $ | 341 |
|
| $ | 401 |
|
| $ | 398 |
|
| $ | 377 |
|
Interest cost |
|
| 360 |
|
|
| 445 |
|
|
| 380 |
|
|
| 309 |
|
|
| 360 |
|
|
| 445 |
|
Amortization: |
|
|
|
|
|
|
|
|
|
|
|
|
|
|
|
|
|
|
|
|
|
|
|
|
Prior service credit |
|
| (267 | ) |
|
| (469 | ) |
|
| (257 | ) |
|
| (212 | ) |
|
| (267 | ) |
|
| (469 | ) |
Actuarial gain |
|
| (583 | ) |
|
| (577 | ) |
|
| (799 | ) |
|
| (454 | ) |
|
| (583 | ) |
|
| (577 | ) |
Total net periodic benefit income |
|
| (92 | ) |
|
| (224 | ) |
|
| (335 | ) |
|
| 44 |
|
|
| (92 | ) |
|
| (224 | ) |
Other changes in plan assets and benefit obligations recognized in other comprehensive income: |
|
|
|
|
|
|
|
|
|
|
|
|
|
|
|
|
|
|
|
|
|
|
|
|
Current year actuarial (gain) loss* |
|
| (159 | ) |
|
| (497 | ) |
|
| 240 |
|
|
| (2,354 | ) |
|
| (159 | ) |
|
| (497 | ) |
Current year prior service credit |
|
| — |
|
|
| — |
|
|
| (1,110 | ) | ||||||||||||
Amortization of actuarial gain |
|
| 583 |
|
|
| 577 |
|
|
| 799 |
|
|
| 454 |
|
|
| 583 |
|
|
| 577 |
|
Amortization of prior service credit |
|
| 267 |
|
|
| 469 |
|
|
| 257 |
|
|
| 212 |
|
|
| 267 |
|
|
| 469 |
|
Total recognized in other comprehensive loss |
|
| 691 |
|
|
| 549 |
|
|
| 186 |
|
|
| (1,688 | ) |
|
| 691 |
|
|
| 549 |
|
Total recognized in net periodic benefit cost and other comprehensive (income) loss |
| $ | 599 |
|
| $ | 325 |
|
| $ | (149 | ) |
| $ | (1,644 | ) |
| $ | 599 |
|
| $ | 325 |
|
* |
|
Approximately $(0.7) million will be amortized from accumulated other comprehensive income into net periodic benefit cost in fiscal year 20162017 relating to the company’s postretirement benefit plans.
The unfunded status and the amounts recognized in the Consolidated Balance Sheets for the company’s postretirement benefit plans are as follows:follows (amounts in thousands):
|
| January 2, 2016 |
|
| January 3, 2015 |
| ||||||||||
|
| (Amounts in thousands) |
|
| December 31, 2016 |
|
| January 2, 2016 |
| |||||||
Change in benefit obligation: |
|
|
|
|
|
|
|
|
|
|
|
|
|
|
|
|
Benefit obligation at beginning of year |
| $ | 10,229 |
|
| $ | 10,406 |
|
| $ | 10,133 |
|
| $ | 10,229 |
|
Service cost |
|
| 398 |
|
|
| 377 |
|
|
| 401 |
|
|
| 398 |
|
Interest cost |
|
| 360 |
|
|
| 445 |
|
|
| 309 |
|
|
| 360 |
|
Participant contributions |
|
| 224 |
|
|
| 192 |
|
|
| 284 |
|
|
| 224 |
|
Actuarial gain |
|
| (180 | ) |
|
| (521 | ) |
|
| (2,354 | ) |
|
| (180 | ) |
Benefits paid |
|
| (898 | ) |
|
| (670 | ) |
|
| (1,125 | ) |
|
| (898 | ) |
Less federal subsidy on benefits paid |
|
| — |
|
|
| — |
| ||||||||
Plan amendments |
|
| — |
|
|
| — |
| ||||||||
Benefit obligation at end of year |
| $ | 10,133 |
|
| $ | 10,229 |
|
| $ | 7,648 |
|
| $ | 10,133 |
|
Change in plan assets: |
|
|
|
|
|
|
|
|
|
|
|
|
|
|
|
|
Fair value of plan assets at beginning of year |
| $ | — |
|
| $ | — |
|
| $ | — |
|
| $ | — |
|
Employer contributions |
|
| 674 |
|
|
| 478 |
|
|
| 841 |
|
|
| 674 |
|
Participant contributions |
|
| 224 |
|
|
| 192 |
|
|
| 284 |
|
|
| 224 |
|
Benefits paid |
|
| (898 | ) |
|
| (670 | ) |
|
| (1,125 | ) |
|
| (898 | ) |
Fair value of plan assets at end of year |
| $ | — |
|
| $ | — |
|
| $ | — |
|
| $ | — |
|
Funded status, end of year: |
|
|
|
|
|
|
|
|
|
|
|
|
|
|
|
|
Fair value of plan assets |
| $ | — |
|
| $ | — |
|
| $ | — |
|
| $ | — |
|
Benefit obligations |
|
| (10,133 | ) |
|
| (10,229 | ) |
|
| (7,648 | ) |
|
| (10,133 | ) |
Unfunded status and amount recognized at end of year |
| $ | (10,133 | ) |
| $ | (10,229 | ) |
| $ | (7,648 | ) |
| $ | (10,133 | ) |
Amounts recognized in the balance sheet: |
|
|
|
|
|
|
|
|
|
|
|
|
|
|
|
|
Current liability |
| $ | (716 | ) |
| $ | (680 | ) |
| $ | (688 | ) |
| $ | (716 | ) |
Noncurrent liability |
|
| (9,417 | ) |
|
| (9,549 | ) |
|
| (6,960 | ) |
|
| (9,417 | ) |
Amount recognized at end of year |
| $ | (10,133 | ) |
| $ | (10,229 | ) |
| $ | (7,648 | ) |
| $ | (10,133 | ) |
Amounts recognized in accumulated other comprehensive loss: |
|
|
|
|
|
|
|
|
|
|
|
|
|
|
|
|
Net actuarial gain before taxes |
| $ | (2,631 | ) |
| $ | (3,056 | ) |
| $ | (4,531 | ) |
| $ | (2,631 | ) |
Prior service credit before taxes |
|
| (686 | ) |
|
| (953 | ) |
|
| (474 | ) |
|
| (686 | ) |
Amounts recognized in accumulated other comprehensive loss |
| $ | (3,317 | ) |
| $ | (4,009 | ) |
| $ | (5,005 | ) |
| $ | (3,317 | ) |
Assumptions used in accounting for the company’s postretirement benefit plans at each of the respective fiscal years ending are as follows:
|
| Fiscal 2015 |
|
| Fiscal 2014 |
|
| Fiscal 2013 |
|
| Fiscal 2016 |
|
| Fiscal 2015 |
|
| Fiscal 2014 |
| ||||||
Weighted average assumptions used to determine benefit obligations: |
|
|
|
|
|
|
|
|
|
|
|
|
|
|
|
|
|
|
|
|
|
|
|
|
Measurement date |
| 12/31/2015 |
|
| 12/31/2014 |
|
| 12/31/2013 |
|
| 12/31/2016 |
|
| 12/31/2015 |
|
| 12/31/2014 |
| ||||||
Discount rate |
|
| 3.83 | % |
|
| 3.50 | % |
|
| 4.31 | % |
|
| 3.66 | % |
|
| 3.83 | % |
|
| 3.50 | % |
Health care cost trend rate used to determine benefit obligations: |
|
|
|
|
|
|
|
|
|
|
|
|
|
|
|
|
|
|
|
|
|
|
|
|
Initial rate |
|
| 8.00 | % |
|
| 8.00 | % |
|
| 8.50 | % |
|
| 6.50 | % |
|
| 8.00 | % |
|
| 8.00 | % |
Ultimate rate |
|
| 5.00 | % |
|
| 5.00 | % |
|
| 5.00 | % |
|
| 5.00 | % |
|
| 5.00 | % |
|
| 5.00 | % |
Year trend reaches the ultimate rate |
| 2022 |
|
| 2021 |
|
| 2021 |
|
| 2023 |
|
| 2022 |
|
| 2021 |
| ||||||
Weighted average assumptions used to determine net periodic cost: |
|
|
|
|
|
|
|
|
|
|
|
|
|
|
|
|
|
|
|
|
|
|
|
|
Measurement date |
| 1/1/2015 |
|
| 1/1/2014 |
|
| 1/1/2013 |
|
| 1/1/2016 |
|
| 1/1/2015 |
|
| 1/1/2014 |
| ||||||
Discount rate |
|
| 3.50 | % |
|
| 4.31 | % |
|
| 3.34 | % |
|
| 3.83 | % |
|
| 3.50 | % |
|
| 4.31 | % |
Health care cost trend rate used to determine net periodic cost: |
|
|
|
|
|
|
|
|
|
|
|
|
|
|
|
|
|
|
|
|
|
|
|
|
Initial rate |
|
| 8.00 | % |
|
| 8.50 | % |
|
| 8.00 | % |
|
| 8.00 | % |
|
| 8.00 | % |
|
| 8.50 | % |
Ultimate rate |
|
| 5.00 | % |
|
| 5.00 | % |
|
| 5.00 | % |
|
| 5.00 | % |
|
| 5.00 | % |
|
| 5.00 | % |
Year trend reaches the ultimate rate |
| 2021 |
|
| 2021 |
|
| 2019 |
|
| 2022 |
|
| 2021 |
|
| 2021 |
| ||||||
Assumed health care cost trend rates have a significant effect on the amounts reported for the health care plans. A one-percentage-point change in assumed health care cost trend rates would have the following effects for fiscal years 2016, 2015, and 2014 and 2013:(amounts in thousands):
|
| One-Percentage-Point Decrease |
|
| One-Percentage-Point Increase |
| ||||||||||||||||||||||||||||||||||||||||||
|
| For the Year Ended |
|
| For the Year Ended |
|
| One-Percentage-Point Decrease |
|
| One-Percentage-Point Increase |
| ||||||||||||||||||||||||||||||||||||
|
| Fiscal 2015 |
|
| Fiscal 2014 |
|
| Fiscal 2013 |
|
| Fiscal 2015 |
|
| Fiscal 2014 |
|
| Fiscal 2013 |
|
| For the Year Ended |
|
| For the Year Ended |
| ||||||||||||||||||||||||
|
| (Amounts in thousands) |
|
| Fiscal 2016 |
|
| Fiscal 2015 |
|
| Fiscal 2014 |
|
| Fiscal 2016 |
|
| Fiscal 2015 |
|
| Fiscal 2014 |
| |||||||||||||||||||||||||||
Effect on total of service and interest cost |
| $ | (65 | ) |
| $ | (60 | ) |
| $ | (64 | ) |
| $ | 76 |
|
| $ | 68 |
|
| $ | 73 |
|
| $ | (58 | ) |
| $ | (65 | ) |
| $ | (60 | ) |
| $ | 67 |
|
| $ | 76 |
|
| $ | 68 |
|
Effect on postretirement benefit obligation |
| $ | (554 | ) |
| $ | (558 | ) |
| $ | (485 | ) |
| $ | 626 |
|
| $ | 629 |
|
| $ | 542 |
|
| $ | (427 | ) |
| $ | (554 | ) |
| $ | (558 | ) |
| $ | 480 |
|
| $ | 626 |
|
| $ | 629 |
|
Cash Flows
Company contributions to postretirement plans are as follows (amounts in thousands):
Year |
| Employer Net Contribution |
|
| Employer Net Contribution |
| ||
2013 |
| $ | 900 |
| ||||
2014 |
| $ | 478 |
|
| $ | 478 |
|
2015 |
| $ | 674 |
|
| $ | 674 |
|
2016 (Expected) |
| $ | 730 |
| ||||
2016 |
| $ | 841 |
| ||||
2017 (Expected) |
| $ | 692 |
| ||||
The table above reflects only the company’s share of the benefit cost. TheSince the company contributions shown are net of income from federal subsidy payments received pursuant tono longer receives reimbursement for Medicare Part D subsidies, the Medicare Prescription Drug, Improvement and Modernization Act of 2003 (“MMA”). MMA subsidy payments, which reduce the company’s cost for the plans, are shown separately in the benefits table below. Of theentire $0.7 million expected funding for postretirement benefit plans during 2016,2017 the entire amount will be required to pay for benefits. Contributions by participants to postretirement benefits were $0.2$0.3 million, $0.2 million, and $0.4$0.2 million for fiscal years 2016, 2015, and 2014, and 2013, respectively.
The following are benefits paid by the company during fiscal years 2016, 2015 2014 and 20132014 and expected to be paid from fiscal 20162017 through fiscal 2025.2026. All benefits are expected to be paid from the company’s assets. The expected benefits show the company’s cost without regard to income from federal subsidy payments received pursuant to the MMA. Expected MMA subsidy payments, which reduce the company’s cost for the plans, are shown separately.assets (amounts in thousands):
|
| Postretirement Benefits |
|
| Postretirement benefits |
| ||||||
|
| (Amounts in thousands) |
| |||||||||
|
| Employer Gross Contribution |
|
| MMA Subsidy (Income) |
| ||||||
2013 |
| $ | 952 |
|
| $ | (52 | ) | ||||
Year |
| Employer gross contribution |
| |||||||||
2014 |
| $ | 478 |
|
| $ | — |
|
| $ | 478 |
|
2015 |
| $ | 674 |
|
| $ | — |
|
| $ | 674 |
|
2016 |
| $ | 841 |
| ||||||||
Estimated Future Payments: |
|
|
|
|
|
|
|
|
|
|
|
|
2016 |
| $ | 730 |
|
| $ | — |
| ||||
2017 |
| $ | 903 |
|
| $ | — |
|
| $ | 692 |
|
2018 |
| $ | 968 |
|
| $ | — |
|
| $ | 745 |
|
2019 |
| $ | 959 |
|
| $ | — |
|
| $ | 735 |
|
2020 |
| $ | 890 |
|
| $ | — |
|
| $ | 677 |
|
2021 – 2025 |
| $ | 4,366 |
|
| $ | — |
| ||||
2021 |
| $ | 661 |
| ||||||||
2022 – 2026 |
| $ | 3,291 |
| ||||||||
Multiemployer Plans
The company contributes to various multiemployer pension plans. Benefits provided under the multiemployer pension plans are generally based on years of service and employee age. Expense under these plans was $2.2 million for fiscal 2016, $2.1 million for fiscal 2015, and $2.1 million for fiscal 2014, and $1.9 million for fiscal 2013.2014.
The company contributes to several multiemployer defined benefit pension plans under the terms of collective-bargaining agreements that cover various union-represented employees. The risks of participating in these multiemployer plans are different from
single-employer plans. Assets contributed to the multiemployer plan by one employer may be used to provide benefits to employees of other participating employers. If a participating employer stops contributing to the plan, the unfunded obligations of the plan may be borne by the remaining participating employers. If we choose to stop participating in some of these multiemployer plans, we may be required to pay those plans an amount based on the underfunded status of the plan, referred to as a withdrawal liability. None of the contributions to the pension funds was in excess of 5% or more of the total contributions for plan years 2016, 2015, 2014, and 2013.2014. There are no contractually required minimum contributions to the plans as of January 2,December 31, 2016.
The company’s participation in these multiemployer plans for fiscal 20152016 is outlined in the table below. The EIN/Pension Plan Number column provides the Employer Identification Number (“EIN”) and the three-digit plan number, if applicable. Unless otherwise noted, the most recent PPA zone status available in 20152016 and 20142015 is for the plan’s year-end at December 31, 20152016 and December 31, 2014,2015, respectively. The zone status is based on information that the company received from the plan and is certified by the plan’s actuary. Among other factors, plans in the red zone are generally less than 65 percent funded, plans in the yellow zone are less than 80 percent funded, and plans in the green zone are at least 80 percent funded. The FIP/RP Status Pending/Implemented column indicates plans for which a financial improvement plan (“FIP”) or a rehabilitation plan (“RP”) is either pending or has been implemented. The last column lists the expiration date(s) of the collective-bargaining agreements to which the plans are subject. Finally, there have been no significant changes that affect the comparability of contributions.
In December 2014, the Consolidated and Further Continuing Appropriations Act of 2015 (the “2015 Appropriations Act”) was signed into law and materially amended the PPA funding rules. In general, the PPA funding rules were made more flexible in order to make more manageable the steps necessary for multi-employer plans to become or remain economically viable in the future. While in previous years we have been informed that several of the multi-employer pension plans to which our subsidiaries contribute have been labeled with a “critical” or “endangered” status as defined by the PPA, the changes made by the 2015 Appropriations Act will materially impact, on a going forward basis, these prior funding status assessments. In any event, it is unclear at this time what impact, if any, the 2015 Appropriations Act will have on our future obligations to the multi-employer pension plans in which we participate.
|
|
|
|
|
|
|
| Pension Protection Act |
|
|
| Contributions (Amounts in |
|
|
|
|
| |||||||||||
|
|
|
|
|
|
|
| Zone Status |
|
|
| thousands) |
|
|
|
| Expiration Date of | |||||||||||
|
|
|
| Pension |
|
|
|
|
|
| FIP/RP Status |
| 2015 |
|
| 2014 |
|
| 2013 |
|
| Surcharge |
| Collective Bargaining | ||||
Pension Fund |
| EIN |
| Plan No. |
|
| 2015 |
| 2014 |
| Pending/Implemented |
| ($) |
|
| ($) |
|
| ($) |
|
| Imposed |
| Agreement | ||||
IAM National Pension Fund |
| 51-6031295 |
|
| 002 |
|
| Green |
| Green |
| No |
|
| 113 |
|
|
| 99 |
|
|
| 104 |
|
| No |
| 5/1/2016 |
Retail, Wholesale and Department Store International Union and Industry Pension Fund |
| 63-0708442 |
|
| 001 |
|
| Red |
| Green |
| No |
|
| 130 |
|
|
| 132 |
|
|
| 130 |
|
| No |
| 8/12/2017 |
Western Conference of Teamsters Pension Trust |
| 91-6145047 |
|
| 001 |
|
| Green |
| Green |
| No |
|
| 271 |
|
|
| 260 |
|
|
| 252 |
|
| No |
| 2/4/2017 |
BC&T International Pension Fund |
| 52-6118572 |
|
| 001 |
|
| Red |
| Red |
| Yes |
|
| 1,121 |
|
|
| 1,077 |
|
|
| 939 |
|
| Yes |
| 10/31/2015 |
|
|
|
|
|
|
|
| Pension Protection Act |
|
|
| Contributions (Amounts in |
|
|
|
|
| |||||||||||
|
|
|
|
|
|
|
| Zone Status |
|
|
| thousands) |
|
|
|
| Expiration Date of | |||||||||||
|
|
|
| Pension |
|
|
|
|
|
| FIP/RP Status |
| 2016 |
|
| 2015 |
|
| 2014 |
|
| Surcharge |
| Collective Bargaining | ||||
Pension Fund |
| EIN |
| Plan No. |
|
| 2016 |
| 2015 |
| Pending/Implemented |
| ($) |
|
| ($) |
|
| ($) |
|
| Imposed |
| Agreement | ||||
IAM National Pension Fund |
| 51-6031295 |
|
| 002 |
|
| Green |
| Green |
| No |
|
| 121 |
|
|
| 113 |
|
|
| 99 |
|
| No |
| 4/30/2021 |
Retail, Wholesale and Department Store International Union and Industry Pension Fund |
| 63-0708442 |
|
| 001 |
|
| Red |
| Red |
| Yes |
|
| 156 |
|
|
| 130 |
|
|
| 132 |
|
| No |
| 8/12/2017 |
Western Conference of Teamsters Pension Trust* |
| 91-6145047 |
|
| 001 |
|
| Green |
| Green |
| No |
|
| 233 |
|
|
| 271 |
|
|
| 260 |
|
| No |
| 2/4/2017 |
BC&T International Pension Fund* |
| 52-6118572 |
|
| 001 |
|
| Red |
| Red |
| Yes |
|
| 1,194 |
|
|
| 1,121 |
|
|
| 1,077 |
|
| Yes |
| 10/31/2015 |
The collective bargaining agreement for the BC&T International Pension Fund, described in the above table, has been extended through March 5, 2016.
* | The collective bargaining agreement is currently under negotiation. |
401(k) Retirement Savings Plans
The Flowers Foods 401(k) Retirement Savings Plan covers substantially all of the company’s employees who have completed certain service requirements. During fiscal years 2016, 2015, 2014, and 2013,2014, the total cost and employer contributions were $26.5 million, $26.2 million, and $23.0 million, respectively.as follows (amounts in thousands):
Contributions by fiscal year |
| Defined contribution plans expense |
| |
Fiscal 2016 |
| $ | 27,057 |
|
Fiscal 2015 |
| $ | 25,473 |
|
Fiscal 2014 |
| $ | 24,799 |
|
The company acquired DKB and Alpine during fiscal 2015, at the time of each acquisition we assumed sponsorship of a 401(k) savings plan. We intend to mergemerged these two plans into the Flowers Foods 401(k) Retirement Savings Plan during fiscal 2016 after receipt of final determination letters.
The company’s provision for income tax expense consists of the following for fiscal years 2016, 2015 and 2014 and 2013:(amounts in thousands):
|
| Fiscal 2015 |
|
| Fiscal 2014 |
|
| Fiscal 2013 |
| |||||||||||||||
|
| (Amounts in thousands) |
|
| Fiscal 2016 |
|
| Fiscal 2015 |
|
| Fiscal 2014 |
| ||||||||||||
Current Taxes: |
|
|
|
|
|
|
|
|
|
|
|
|
|
|
|
|
|
|
|
|
|
|
|
|
Federal |
| $ | 75,128 |
|
| $ | 72,780 |
|
| $ | 73,669 |
|
| $ | 86,235 |
|
| $ | 75,128 |
|
| $ | 72,780 |
|
State |
|
| 10,419 |
|
|
| 10,294 |
|
|
| 11,325 |
|
|
| 13,983 |
|
|
| 10,419 |
|
|
| 10,294 |
|
|
|
| 85,547 |
|
|
| 83,074 |
|
|
| 84,994 |
|
|
| 100,218 |
|
|
| 85,547 |
|
|
| 83,074 |
|
Deferred Taxes: |
|
|
|
|
|
|
|
|
|
|
|
|
|
|
|
|
|
|
|
|
|
|
|
|
Federal |
|
| 16,236 |
|
|
| 7,691 |
|
|
| 7,970 |
|
|
| (11,656 | ) |
|
| 16,236 |
|
|
| 7,691 |
|
State |
|
| 2,057 |
|
|
| 1,550 |
|
|
| (1,485 | ) |
|
| (2,801 | ) |
|
| 2,057 |
|
|
| 1,550 |
|
|
|
| 18,293 |
|
|
| 9,241 |
|
|
| 6,485 |
|
|
| (14,457 | ) |
|
| 18,293 |
|
|
| 9,241 |
|
Income tax expense |
| $ | 103,840 |
|
| $ | 92,315 |
|
| $ | 91,479 |
|
| $ | 85,761 |
|
| $ | 103,840 |
|
| $ | 92,315 |
|
Income tax expense differs from the amount computed by applying the U.S. federal income tax rate (35%) because of the effect of the following items for fiscal years 2016, 2015, and 2014 and 2013:(amounts in thousands):
|
| Fiscal 2015 |
|
| Fiscal 2014 |
|
| Fiscal 2013 |
| |||||||||||||||
|
| (Amounts in thousands) |
|
| Fiscal 2016 |
|
| Fiscal 2015 |
|
| Fiscal 2014 |
| ||||||||||||
Tax at U.S. federal income tax rate |
| $ | 102,560 |
|
| $ | 93,819 |
|
| $ | 112,831 |
|
| $ | 87,338 |
|
| $ | 102,560 |
|
| $ | 93,819 |
|
State income taxes, net of federal income tax benefit |
|
| 8,556 |
|
|
| 7,698 |
|
|
| 6,396 |
|
|
| 7,266 |
|
|
| 8,556 |
|
|
| 7,698 |
|
Section 199 qualifying production activities benefit |
|
| (6,725 | ) |
|
| (6,892 | ) |
|
| (7,022 | ) |
|
| (8,007 | ) |
|
| (6,725 | ) |
|
| (6,892 | ) |
Bargain purchase |
|
| — |
|
|
| — |
|
|
| (17,524 | ) | ||||||||||||
Other |
|
| (551 | ) |
|
| (2,310 | ) |
|
| (3,202 | ) |
|
| (836 | ) |
|
| (551 | ) |
|
| (2,310 | ) |
Income tax expense |
| $ | 103,840 |
|
| $ | 92,315 |
|
| $ | 91,479 |
|
| $ | 85,761 |
|
| $ | 103,840 |
|
| $ | 92,315 |
|
In 20152016 and 2014,2015, the most significant differences in the effective rate and the statutory rate are state income taxes offset by reductions for the Section 199 qualifying production activities deduction.
The company’s effectivecompany early adopted guidance discussed in Note 3, Recent Accounting Pronouncements, and retrospectively adjusted our current deferred income tax rate for 2013 was also impacted byasset balance of $37.2 million at January 2, 2016 to the bargain purchase gain on acquisition, which was recorded net oflong-term deferred taxes as a component of income before income taxes. The gain was treated as a permanent item which had a favorable impact on the 2013 tax rate by approximately 5.2%. Tax legislation signed into law on December 18, 2015 had an immaterial impact on the rate.liability balance.
Deferred tax assets (liabilities) are comprised of the following:following (amounts in thousands):
|
| January 2, 2016 |
|
| January 3, 2015 |
| ||||||||||
|
| (Amounts in thousands) |
|
| December 31, 2016 |
|
| January 2, 2016 |
| |||||||
Self-insurance |
| $ | 6,073 |
|
| $ | 6,294 |
|
| $ | 7,051 |
|
| $ | 6,073 |
|
Compensation and employee benefits |
|
| 13,632 |
|
|
| 12,898 |
|
|
| 13,512 |
|
|
| 13,632 |
|
Deferred income |
|
| 10,102 |
|
|
| 9,896 |
|
|
| 10,893 |
|
|
| 10,102 |
|
Loss and credit carryforwards |
|
| 21,839 |
|
|
| 21,421 |
|
|
| 19,556 |
|
|
| 21,839 |
|
Equity-based compensation |
|
| 13,676 |
|
|
| 15,597 |
|
|
| 11,890 |
|
|
| 13,676 |
|
Hedging |
|
| 6,391 |
|
|
| 7,153 |
|
|
| 676 |
|
|
| 6,391 |
|
Pension |
|
| 23,981 |
|
|
| 30,160 |
| ||||||||
Postretirement benefits |
|
| 6,427 |
|
|
| 6,796 |
| ||||||||
Pension and postretirement benefits |
|
| 27,537 |
|
|
| 30,408 |
| ||||||||
Intangible assets |
|
| 4,718 |
|
|
| 4,763 |
|
|
| 4,548 |
|
|
| 4,718 |
|
Other |
|
| 10,409 |
|
|
| 10,674 |
|
|
| 16,801 |
|
|
| 10,409 |
|
Deferred tax assets valuation allowance |
|
| (18 | ) |
|
| (2,534 | ) |
|
| (18 | ) |
|
| (18 | ) |
Deferred tax assets |
|
| 117,230 |
|
|
| 123,118 |
|
|
| 112,446 |
|
|
| 117,230 |
|
Depreciation |
|
| (79,667 | ) |
|
| (79,480 | ) |
|
| (75,569 | ) |
|
| (79,667 | ) |
Intangible assets |
|
| (180,216 | ) |
|
| (107,188 | ) |
|
| (179,491 | ) |
|
| (180,216 | ) |
Other |
|
| (3,809 | ) |
|
| (3,780 | ) |
|
| (3,240 | ) |
|
| (3,809 | ) |
Deferred tax liabilities |
|
| (263,692 | ) |
|
| (190,448 | ) |
|
| (258,300 | ) |
|
| (263,692 | ) |
Net deferred tax liability |
| $ | (146,462 | ) |
| $ | (67,330 | ) |
| $ | (145,854 | ) |
| $ | (146,462 | ) |
The company has a deferred tax asset of $12.1$7.2 million related to a federal net operating loss carryforward, and $4.1 million related to a federal capital loss carryforward, which we expect to fully utilize.utilize before expiration. Additionally, the company and various subsidiaries have a net deferred tax asset of $6.7$5.7 million related to state net
operating loss carryforwards, and $3.0$2.6 million for credit carryforwards with expiration dates through fiscal 2035. The utilization of a portion of these state carryforwards could be limited in the future; therefore, an immaterial valuation allowance has been recorded. Should the company determine at a later date that certain of these losses which have been reserved for may be utilized, a benefit may be recognized in the Consolidated Statements of Income. Likewise, should the company determine at a later date that certain of these net operating losses for which a deferred tax asset has been recorded may not be utilized, a charge to the Consolidated Statements of Income may be necessary.
The gross amount of unrecognized tax benefits was $0.7$1.8 million and $2.1$0.7 million as of January 2,December 31, 2016 and January 3, 2015,2, 2016, respectively. This change is primarily due to the addition of state reserves for uncertain positions taken in prior years, which is partially offset by the expiration of the statute of limitations on several previously unrecognized tax benefits. These amounts are exclusive of interest accrued and are recorded in other long-term liabilities on the Consolidated Balance Sheet. If recognized, the $0.7$1.8 million (less $0.2$0.6 million related to tax imposed in other jurisdictions) would impact the effective rate.
The company accrues interest expense and penalties related to income tax liabilities as a component of income before taxes. No accrual of penalties is reflected on the company’s balance sheet as the company believes the accrual of penalties is not necessary based upon the merits of its income tax positions. The company had an accrued interest balance of approximately $0.2 million and $0.1 million at December 31, 2016 and $0.3 million at January 2, 2016, and January 3, 2015, respectively.
The company defines the federal jurisdiction as well as various state jurisdictions as “major” jurisdictions. The company is no longer subject to federal examinations for years prior to 2012,2015, and with limited exceptions, for years prior to 20112012 in state jurisdictions. TheDuring the current year, the company is currently underclosed a federal income tax audit bywith the IRSInternal Revenue Service (“IRS”) for the fiscal 2012 through 2014 tax years. At this time, we do not expect theThe impact of the audit todid not have a material effect on our consolidated financial statements.
The following is a reconciliation of the total amounts of unrecognized tax benefits for fiscal years 2016, 2015 and 2014 and 2013:(amounts in thousands):
|
| Fiscal 2015 |
|
| Fiscal 2014 |
|
| Fiscal 2013 |
| |||||||||||||||
|
| (Amounts in thousands) |
|
| Fiscal 2016 |
|
| Fiscal 2015 |
|
| Fiscal 2014 |
| ||||||||||||
Unrecognized tax benefit at beginning of fiscal year |
| $ | 2,107 |
|
| $ | 4,809 |
|
| $ | 7,304 |
|
| $ | 727 |
|
| $ | 2,107 |
|
| $ | 4,809 |
|
Gross increases — acquisitions |
|
| — |
|
|
| — |
|
|
| 500 |
| ||||||||||||
Gross increases |
|
| 1,488 |
|
|
| — |
|
|
| — |
| ||||||||||||
Lapses of statutes of limitations |
|
| (1,380 | ) |
|
| (2,702 | ) |
|
| (2,995 | ) |
|
| (461 | ) |
|
| (1,380 | ) |
|
| (2,702 | ) |
Unrecognized tax benefit at end of fiscal year |
| $ | 727 |
|
| $ | 2,107 |
|
| $ | 4,809 |
|
| $ | 1,754 |
|
| $ | 727 |
|
| $ | 2,107 |
|
At this time, we do not anticipate material changes to the amount of gross unrecognized tax benefits over the next twelve months.
Note 21. | Commitments and Contingencies |
Self-insurance reserves and other commitments and contingencies
The company has recorded current liabilities of $28.0 million and $23.9 million related to self-insurance reserves at December 31, 2016 and January 2, 2016, respectively. The reserves include an estimate of expected settlements on pending claims, defense costs and a provision for claims incurred but not reported. These estimates are based on the company’s assessment of potential liability using an analysis of available information with respect to pending claims, historical experience and current cost trends. The amount of the company’s ultimate liability in respect of these matters may differ materially from these estimates.
In the event the company ceases to utilize the independent distribution form of doing business or exits a geographic market, the company is contractually required to purchase the distribution rights from the independent distributor. The company expects to continue operating under this model and the possibility of a loss is remote.
The company’s facilities are subject to various federal, state and local laws and regulations regarding the discharge of material into the environment and the protection of the environment in other ways. The company is not a party to any material proceedings arising under these regulations. The company believes that compliance with existing environmental laws and regulations will not materially affect the consolidated financial condition, results of operations, cash flows or the competitive position of the company. The company believes it is currently in substantial compliance with all material environmental regulations affecting the company and its properties. On August 9, 2016, the U.S. Department of Labor (the “DOL”) notified the company that it was scheduled for a compliance review under the Fair Labor Standards Act (“FLSA”). The company is cooperating with the DOL.
Litigation
The company and its subsidiaries from time to time are parties to, or targets of, lawsuits, claims, investigations and proceedings, including personal injury, commercial, contract, environmental, antitrust, product liability, health and safety and employment matters, which are being handled and defended in the ordinary course of business. While the company is unable to predict the outcome of these matters, it believes, based upon currently available facts, that it is remote that the ultimate resolution of any such pending matters will have a material adverse effect on its overall financial condition, results of operations or cash flows in the future. However, adverse developments could negatively impact earnings in a particular future fiscal period.
The company has recorded current liabilities of $23.9 million and $24.4 million related to self-insurance reserves at January 2, 2016 and January 3, 2015, respectively. The reserves include an estimate of expected settlements on pending claims, defense costs and a provision for claims incurred but not reported. These estimates are based on the company’s assessment of potential liability using an analysis of available information with respect to pending claims, historical experience and current cost trends. The amount of the company’s ultimate liability in respect of these matters may differ materially from these estimates.
In the event the company ceases to utilize the independent distribution form of doing business or exits a geographic market,At this time, the company is contractually required defending 26 complaints filed by distributors alleging that such distributors were misclassified as independent contractors. Nineteen of these lawsuits seek class and/or collective action treatment. The remaining seven cases allege individual claims and do not seek class or collective action treatment. The respective courts have ruled on plaintiffs’ motions for class certification in 12 of the pending cases, each of which is discussed below and in each case where a class has been conditionally certified under the FLSA, the company has the ability to purchasepetition the distribution rightscourt to decertify that class at a later date:
Case | Status | |
Rehberg et al. v. Flowers Foods, Inc. and Flowers Baking Co. of Jamestown, LLC | On September 12, 2012, Scott Rehberg and certain other plaintiffs filed a complaint against the company and one of its subsidiaries in the U.S. District Court for the Western District of North Carolina. On March 22, 2013, the court conditionally certified under the FLSA a collective action consisting of all individuals who entered into a distributor agreement with Flowers Baking Co. of Jamestown, LLC (“Jamestown”) after September 12, 2009. On March 24, 2015, the court certified a North Carolina state law wage claim as a class action consisting of all individuals located within the State of North Carolina who entered into a distributor agreement with Jamestown after September 12, 2009. On December 9, 2016, the company announced that it reached an agreement to settle this matter for a payment of $9.0 million, comprised of $5.2 million in settlement funds and $3.8 million in attorneys’ fees. The settlement also contains certain non-economic terms that are intended to strengthen and enhance the independent contractor model, which remains in place. The parties are working to obtain court approval of this settlement. This settlement charge has been recorded as a selling, distribution and administrative expense in our Consolidated Statements of Income during the fourth quarter of fiscal 2016. | |
Martinez et al. v. Flowers Foods, Inc., Flowers Bakeries Brands, Inc., Flowers Baking Co. of California, LLC, and Flowers Baking Co. of Henderson, LLC | On July 7, 2015, Giovanni Martinez and certain other plaintiffs filed various California state law wage claims against the company and certain of its subsidiaries in the U.S. District Court for the Central District of California. On February 1, 2016, the court denied a motion to certify these claims as a class action. This lawsuit was settled on confidential terms, and dismissed on July 7, 2016. The denial of the class certification is currently on appeal to the U.S. Court of Appeals for the Ninth Circuit. | |
Stewart et al. v. Flowers Foods, Inc. and Flowers Baking Co. of Batesville, LLC | On July 2, 2015, Jacky Stewart and certain other plaintiffs filed a complaint against the company and one of its subsidiaries in the U.S. District Court for the Western District of Tennessee. On August 12, 2016, the court conditionally certified under the FLSA a collective action consisting of all individuals who entered into a distributor agreement with Flowers Baking Co. of Batesville, LLC, after July 2, 2012. The court limited the conditionally certified class to distributors operating out of designated warehouse locations in the State of Tennessee only. | |
Coyle v. Flowers Foods, Inc. and Holsum Bakery, Inc. | On July 20, 2015, Terry Coyle filed a complaint against the company and one of its subsidiaries in the U.S. District Court for the District of Arizona. On August 30, 2016, the court conditionally certified under the FLSA a collective action consisting of all individuals who entered into a distributor agreement with Holsum Bakery, Inc. after August 30, 2013. The court limited the conditionally certified class to distributors operating within the State of Arizona. Plaintiff also alleges in his complaint Arizona state law wage claims. | |
McCurley v. Flowers Foods, Inc. and Derst Baking Co., LLC | On January 20, 2016, Paul McCurley filed a complaint against the company and one of its subsidiaries in the U.S. District Court for the District of South Carolina. On October 24, 2016, the Court conditionally certified under the FLSA a collective action consisting of all individuals who entered into a distributor agreement with Derst Baking Co., LLC after January 20, 2013. The company has the ability to petition the court to decertify this class at a later date. Plaintiff also alleges in his complaint a South Carolina state law wage claim. | |
Neff et al. v. Flowers Foods, Inc., Lepage Bakeries Park Street, LLC, and CK Sales Co., LLC | On December 2, 2015, Nick Neff and certain other plaintiffs filed a complaint against the company and certain of its subsidiaries in the U.S. District Court for the District of Vermont. On November 7, 2016, the court conditionally certified under the FLSA a collective action consisting of all individuals who entered into a distributor agreement with Lepage Bakeries Park Street, LLC or CK Sales Co., LLC after December 2, 2012. The court excluded from the class distributors operating in the State of Maine. Plaintiffs also allege in their complaint Vermont state law wage and consumer fraud claims. | |
The company and/or its respective subsidiaries are vigorously defending all of these lawsuits. Given the stage of the complaints and the claims and issues presented, except for lawsuits disclosed herein that have reached a settlement or agreement in principle, a loss is reasonably possible but the company cannot reasonably estimate at this time the possible loss or range of loss that may arise from the unresolved lawsuits.
On November 8, 2016, Flowers Foods' subsidiary, Lepage Bakeries, reached an agreement to settle a lawsuit seeking class action treatment (Bokanoski et al. v. Lepage Bakeries Park Street, LLC and CK Sales Co., LLC), originally filed by Bart Bokanoski and certain other plaintiffs in the U.S. District Court for the District of Connecticut on January 6, 2015, for $1.25 million, including attorneys' fees. The settlement also includes certain non-economic terms which are intended to strengthen and enhance the independent distributor.
The company’s facilities arecontractor model. This agreement, which includes 49 territories, is subject to various federal, statecourt approval. This settlement was recorded in selling, distribution and local laws and regulations regardingadministrative expenses in our Consolidated Statements of Income during the dischargethird quarter of material into the environment and the protection of the environment in other ways. The company is not a party to any material proceedings arising under these regulations. The company believes that compliance with existing environmental laws and regulations will not materially affect the consolidated financial condition, results of operations, cash flows or the competitive position of the company. The company believes it is currently in substantial compliance with all material environmental regulations affecting the company and its properties.our fiscal 2016.
On SeptemberAugust 12, 2012,2016, a class action complaint was filed in the U.S. District Court for the WesternSouthern District of North Carolina (Charlotte Division)New York by Scott Rehberg, Willard Allen Riley and Mario RonchettiChris B. Hendley (the “Hendley complaint”) against the company and its subsidiary, Flowers Baking Companycertain senior members of Jamestown, LLC.management (collectively, the “defendants”). On August 17, 2016, another class action complaint was filed in the U.S. District Court for the Southern District of New York by Scott Dovell, II (the “Dovell complaint” and together with the Hendley complaint, the “complaints”) against the defendants. Plaintiffs in the complaints are securities holders that acquired company securities between February 7, 2013 and August 10, 2016. The complaints generally allege that the defendants made materially false and/or misleading statements and/or failed to disclose that (1) the company’s labor practices were distributorsnot in compliance with applicable federal laws and regulations; (2) such non-compliance exposed the company to legal liability and/or negative regulatory action; and (3) as a result, the defendants’ statements about the company’s business, operations, and prospects were false and misleading and/or lacked a reasonable basis. The counts of our Jamestown subsidiary who contend they were misclassified as independent contractors.the complaints are asserted against the defendants pursuant to Sections 10(b) and 20(a) of the Exchange Act and Rule 10b-5 under the Exchange Act. The action soughtcomplaints seek (1) class certification on behalfunder the Federal Rules of Civil Procedure, (2) compensatory damages in favor of the plaintiffs and all other class members against the defendants, jointly and severally, for all damages sustained as a class comprisedresult of independent distributors of our Jamestown subsidiary who are classified as independent contractors. In March 2013, the court conditionally certifiedwrongdoing, in an amount to be proven at trial, including interest, and (3) awarding plaintiffs and the class their reasonable costs and expenses incurred in the actions, including counsel and expert fees. On October 21, 2016, the U.S. District Court for the Southern District of New York consolidated the complaints into one action captioned “In re Flowers Foods, Inc. Securities Litigation” (the “consolidated action”), appointed Walter Matthews as lead plaintiff (“lead plaintiff”), and appointed Glancy Prongay & Murray LLP and Johnson & Weaver, LLP as co-lead counsel for claims under the Fair Labor Standards Act (“FLSA”).putative class. On March 23, 2015, the court re-affirmed its FLSA certification decision and also certified claims under state law. On February 12,November 21, 2016, the court dismissedgranted defendants’ and lead plaintiff’s joint motion to transfer the parties’ respective motionsconsolidated action to the U.S. District Court for summary judgment with the exceptionMiddle District of Georgia. Lead plaintiff filed his Consolidated Class Action Complaint (“Complaint”) on January 12, 2017, raising the plaintiffs’ motion relatedsame counts and general allegations and seeking the same relief as the Dovell and Hendley complaints. Pursuant to a waiverthe U.S. District Court for the Middle District of state wage statute claimsGeorgia’s scheduling order, defendants must answer, move, or otherwise respond to the Complaint by March 13, 2017, lead plaintiff must file an opposition brief by May 12, 2017, and waiver of the right to seek liquidated damages.
At this time, the company is also aware of seventeen other complaints alleging misclassification claims that have been filed.defendants must file any reply memoranda by June 12, 2017. The company and/or its respective subsidiaries are vigorously defending these lawsuits. Given the stage of the complaints and the claims and issues presented, the company cannot reasonably estimate at this time the possible loss or range of loss, if any, that may arise from the unresolved lawsuits.
See Note 12, Debt, Lease and Other Commitments, for additional information.information on the company’s commitments.
Note 22. | Segment Reporting |
The company’s DSD Segment primarily produces fresh packaged breads, buns, rolls, tortillas, and snack cakes and the Warehouse Segment produces fresh and frozen bread and rolls and snack cakes.
The company purchased DKB and Alpine during fiscal 2015, See Note 8, Acquisitions, for more detailed disclosures for these acquisitions. DKB is included in our DSD Segment and Alpine is included in our Warehouse Segment. Their results from operations and impact on our total assets are included in the tables below in their respective segment. Effective the first day of fiscal 2014, we reclassified our tortilla operation from a Warehouse Segment bakery to the DSD Segment. This reclassification was made to better align their sales with the delivery method primarily used to serve their customers. All prior period information has been recasted to reflect this change.
During the fourth quarter of fiscal 2014, we revised net sales. Historically, certain immaterial discounts had been recorded as an expense to selling, distribution and administrative costs. These discounts are now recorded as contra revenue. See Note 3, Financial Statement Revisions, for more detailed disclosure of this revision. All prior period information was revised in our 2014 Form 10-K to reflect this change.
The company evaluates each segment’s performance based on income or loss before interest and income taxes, excluding unallocated expenses and charges which the company’s management deems to be an overall corporate cost or a cost not reflective of the segments’ core operating businesses. Information regarding the operations of these segments is as follows for fiscal years 2016, 2015, and 2014 and 2013:(amounts in thousands):
|
| Fiscal 2015 |
|
| Fiscal 2014 |
|
| Fiscal 2013 |
| |||||||||||||||
|
| (Amounts in thousands) |
|
| Fiscal 2016 |
|
| Fiscal 2015 |
|
| Fiscal 2014 |
| ||||||||||||
Sales: |
|
|
|
|
|
|
|
|
|
|
|
|
|
|
|
|
|
|
|
|
|
|
|
|
DSD Segment |
| $ | 3,242,482 |
|
| $ | 3,227,695 |
|
| $ | 3,171,241 |
|
| $ | 3,347,616 |
|
| $ | 3,242,482 |
|
| $ | 3,227,695 |
|
Warehouse Segment |
|
| 733,170 |
|
|
| 723,541 |
|
|
| 774,443 |
|
|
| 787,233 |
|
|
| 733,170 |
|
|
| 723,541 |
|
Eliminations: |
|
|
|
|
|
|
|
|
|
|
|
|
|
|
|
|
|
|
|
|
|
|
|
|
Sales from Warehouse Segment to DSD Segment |
|
| (134,013 | ) |
|
| (130,175 | ) |
|
| (122,082 | ) |
|
| (144,525 | ) |
|
| (134,013 | ) |
|
| (130,175 | ) |
Sales from DSD Segment to Warehouse Segment |
|
| (63,134 | ) |
|
| (72,088 | ) |
|
| (90,986 | ) |
|
| (63,439 | ) |
|
| (63,134 | ) |
|
| (72,088 | ) |
|
| $ | 3,778,505 |
|
| $ | 3,748,973 |
|
| $ | 3,732,616 |
|
| $ | 3,926,885 |
|
| $ | 3,778,505 |
|
| $ | 3,748,973 |
|
Impairment of assets: |
|
|
|
|
|
|
|
|
|
|
|
| ||||||||||||
DSD Segment |
| $ | 24,877 |
|
| $ | 3,771 |
|
| $ | 10,308 |
| ||||||||||||
Warehouse Segment |
|
| — |
|
|
| — |
|
|
| — |
| ||||||||||||
Other(1) |
|
| — |
|
|
| — |
|
|
| — |
| ||||||||||||
|
| $ | 24,877 |
|
| $ | 3,771 |
|
| $ | 10,308 |
| ||||||||||||
Depreciation and amortization: |
|
|
|
|
|
|
|
|
|
|
|
|
|
|
|
|
|
|
|
|
|
|
|
|
DSD Segment |
| $ | 115,801 |
|
| $ | 113,881 |
|
| $ | 102,341 |
|
| $ | 120,009 |
|
| $ | 115,801 |
|
| $ | 113,881 |
|
Warehouse Segment |
|
| 16,734 |
|
|
| 15,166 |
|
|
| 15,483 |
|
|
| 20,138 |
|
|
| 16,734 |
|
|
| 15,166 |
|
Other(1) |
|
| (360 | ) |
|
| (86 | ) |
|
| 667 |
|
|
| 722 |
|
|
| (360 | ) |
|
| (86 | ) |
|
| $ | 132,175 |
|
| $ | 128,961 |
|
| $ | 118,491 |
|
| $ | 140,869 |
|
| $ | 132,175 |
|
| $ | 128,961 |
|
Income from operations: |
|
|
|
|
|
|
|
|
|
|
|
|
|
|
|
|
|
|
|
|
|
|
|
|
DSD Segment(2) |
| $ | 302,361 |
|
| $ | 284,231 |
|
| $ | 347,114 |
| ||||||||||||
DSD Segment |
| $ | 260,495 |
|
| $ | 302,361 |
|
| $ | 284,231 |
| ||||||||||||
Warehouse Segment |
|
| 55,266 |
|
|
| 51,451 |
|
|
| 51,934 |
|
|
| 58,465 |
|
|
| 55,266 |
|
|
| 51,451 |
|
Other(1) |
|
| (59,748 | ) |
|
| (60,287 | ) |
|
| (63,815 | ) |
|
| (55,070 | ) |
|
| (59,748 | ) |
|
| (60,287 | ) |
|
| $ | 297,879 |
|
| $ | 275,395 |
|
| $ | 335,233 |
|
| $ | 263,890 |
|
| $ | 297,879 |
|
| $ | 275,395 |
|
Interest expense |
| $ | 26,815 |
|
| $ | 28,288 |
|
| $ | 28,875 |
|
| $ | 34,905 |
|
| $ | 26,815 |
|
| $ | 28,288 |
|
Interest income |
| $ | (21,967 | ) |
| $ | (20,947 | ) |
| $ | (16,015 | ) |
| $ | (20,552 | ) |
| $ | (21,967 | ) |
| $ | (20,947 | ) |
Income before income taxes |
| $ | 293,031 |
|
| $ | 268,054 |
|
| $ | 322,373 |
|
| $ | 249,537 |
|
| $ | 293,031 |
|
| $ | 268,054 |
|
Capital expenditures: |
|
|
|
|
|
|
|
|
|
|
|
|
|
|
|
|
|
|
|
|
|
|
|
|
DSD Segment |
| $ | 72,148 |
|
| $ | 73,454 |
|
| $ | 81,664 |
|
| $ | 61,669 |
|
| $ | 72,148 |
|
| $ | 73,454 |
|
Warehouse Segment |
|
| 9,596 |
|
|
| 6,468 |
|
|
| 7,051 |
|
|
| 16,792 |
|
|
| 9,596 |
|
|
| 6,468 |
|
Other(1) |
|
| 9,029 |
|
|
| 3,856 |
|
|
| 10,466 |
|
|
| 23,266 |
|
|
| 9,029 |
|
|
| 3,856 |
|
|
| $ | 90,773 |
|
| $ | 83,778 |
|
| $ | 99,181 |
|
| $ | 101,727 |
|
| $ | 90,773 |
|
| $ | 83,778 |
|
|
| As of |
| |||||||||||||
|
| January 2, 2016 |
|
| January 3, 2015 |
|
| December 31, 2016 |
|
| January 2, 2016 |
| ||||
Assets: |
|
|
|
|
|
|
|
|
|
|
|
|
|
|
|
|
DSD Segment |
| $ | 2,409,902 |
|
| $ | 2,094,047 |
|
| $ | 2,344,616 |
|
| $ | 2,409,902 |
|
Warehouse Segment |
|
| 334,029 |
|
|
| 201,240 |
|
|
| 330,006 |
|
|
| 334,029 |
|
Other (3) |
|
| 141,237 |
|
|
| 113,687 |
| ||||||||
Other (2) |
|
| 86,446 |
|
|
| 100,120 |
| ||||||||
|
| $ | 2,885,168 |
|
| $ | 2,408,974 |
|
| $ | 2,761,068 |
|
| $ | 2,844,051 |
|
(1) | Represents the company’s corporate head office amounts, acquisition costs, and the fiscal 2016 and fiscal 2014 pension settlement |
(2) |
|
| Represents the company’s corporate head office assets including primarily cash and cash equivalents, deferred taxes and deferred financing costs. |
Sales by product category in each reportable segment are as follows for fiscal years 2016, 2015, 2014, and 20132014 (amounts in thousands):
|
| Fiscal 2015 |
|
| Fiscal 2014 |
|
| Fiscal 2013 |
|
| Fiscal 2016 |
|
| Fiscal 2015 |
|
| Fiscal 2014 |
| ||||||||||||||||||||||||||||||||||||||||||||||||||||||
|
| Total |
|
| DSD Segment |
|
| Warehouse Segment |
|
| Total |
|
| DSD Segment |
|
| Warehouse Segment |
|
| Total |
|
| DSD Segment |
|
| Warehouse Segment |
|
| Total |
|
| DSD Segment |
|
| Warehouse Segment |
|
| Total |
|
| DSD Segment |
|
| Warehouse Segment |
|
| Total |
|
| DSD Segment |
|
| Warehouse Segment |
| ||||||||||||||||||
Branded retail |
| $ | 2,150,624 |
|
| $ | 2,010,792 |
|
| $ | 139,832 |
|
| $ | 2,102,028 |
|
| $ | 1,971,851 |
|
| $ | 130,177 |
|
| $ | 2,038,726 |
|
| $ | 1,898,016 |
|
| $ | 140,710 |
|
| $ | 2,282,892 |
|
| $ | 2,113,595 |
|
| $ | 169,297 |
|
| $ | 2,151,514 |
|
| $ | 2,011,433 |
|
| $ | 140,081 |
|
| $ | 2,102,028 |
|
| $ | 1,971,851 |
|
| $ | 130,177 |
|
Store branded retail |
|
| 571,594 |
|
|
| 457,234 |
|
|
| 114,360 |
|
|
| 608,617 |
|
|
| 486,886 |
|
|
| 121,731 |
|
|
| 645,858 |
|
|
| 504,707 |
|
|
| 141,151 |
|
|
| 582,523 |
|
|
| 464,705 |
|
|
| 117,818 |
|
|
| 571,827 |
|
|
| 457,467 |
|
|
| 114,360 |
|
|
| 608,617 |
|
|
| 486,886 |
|
|
| 121,731 |
|
Non-retail and other |
|
| 1,056,287 |
|
|
| 711,322 |
|
|
| 344,965 |
|
|
| 1,038,328 |
|
|
| 696,870 |
|
|
| 341,458 |
|
|
| 1,048,032 |
|
|
| 677,532 |
|
|
| 370,500 |
|
|
| 1,061,470 |
|
|
| 705,877 |
|
|
| 355,593 |
|
|
| 1,055,164 |
|
|
| 710,448 |
|
|
| 344,716 |
|
|
| 1,038,328 |
|
|
| 696,870 |
|
|
| 341,458 |
|
Total |
| $ | 3,778,505 |
|
| $ | 3,179,348 |
|
| $ | 599,157 |
|
| $ | 3,748,973 |
|
| $ | 3,155,607 |
|
| $ | 593,366 |
|
| $ | 3,732,616 |
|
| $ | 3,080,255 |
|
| $ | 652,361 |
|
| $ | 3,926,885 |
|
| $ | 3,284,177 |
|
| $ | 642,708 |
|
| $ | 3,778,505 |
|
| $ | 3,179,348 |
|
| $ | 599,157 |
|
| $ | 3,748,973 |
|
| $ | 3,155,607 |
|
| $ | 593,366 |
|
Note 23. | Unaudited Quarterly Financial Information |
Results of operations for each of the four quarters in the respective fiscal years are as follows. Each quarter during fiscal 2016 and fiscal 2015 represents a period of twelve weeks, except the first quarter, which includes sixteen weeks. The first quarter of fiscal 2014 represents sixteen weeks the second and third quarter of fiscal 2014 represents twelve weeks, and the(amounts in thousands, except per share data):
|
|
|
| First Quarter |
|
| Second Quarter |
|
| Third Quarter |
|
| Fourth Quarter |
| ||||
Sales |
| 2016 |
| $ | 1,204,352 |
|
| $ | 935,025 |
|
| $ | 918,791 |
|
| $ | 868,717 |
|
|
| 2015 |
| $ | 1,146,045 |
|
| $ | 888,795 |
|
| $ | 885,302 |
|
| $ | 858,363 |
|
Materials, supplies, labor and other production costs (exclusive of depreciation and amortization shown separately) |
| 2016 |
| $ | 621,190 |
|
| $ | 477,955 |
|
| $ | 476,760 |
|
| $ | 450,462 |
|
|
| 2015 |
| $ | 585,916 |
|
| $ | 457,253 |
|
| $ | 464,045 |
|
| $ | 455,939 |
|
Net income |
| 2016 |
| $ | 59,363 |
|
| $ | 51,155 |
|
| $ | 40,216 |
|
| $ | 13,042 |
|
|
| 2015 |
| $ | 61,389 |
|
| $ | 51,760 |
|
| $ | 43,796 |
|
| $ | 32,246 |
|
Basic net income per share |
| 2016 |
| $ | 0.28 |
|
| $ | 0.25 |
|
| $ | 0.19 |
|
| $ | 0.06 |
|
|
| 2015 |
| $ | 0.29 |
|
| $ | 0.25 |
|
| $ | 0.21 |
|
| $ | 0.15 |
|
Diluted net income per share |
| 2016 |
| $ | 0.28 |
|
| $ | 0.24 |
|
| $ | 0.19 |
|
| $ | 0.06 |
|
|
| 2015 |
| $ | 0.29 |
|
| $ | 0.24 |
|
| $ | 0.21 |
|
| $ | 0.15 |
|
The fourth quarter of fiscal 2014 represents thirteen weeks.
2016 included impairment charges ($24.9 million), a legal settlement ($9.25 million), and a pension settlement loss ($0.2 million). See Note 2, Summary of Significant Accounting Policies, Note 6, Assets Held for Sale, and Note 7, Goodwill and Other Intangible Assets, for additional information on these items. During the fourth quarter of fiscal 2014,2016, we revisedidentified and recorded out-of-period adjustments of $2.3 million for an intangible asset impairment which related to the second quarter of fiscal 2016 and a $0.9 million reduction to deferred tax expense which related to the fourth quarter of fiscal 2015. The net sales and revised allimpact of these two items resulted in $0.5 million of lower net income in the fourth quarter of fiscal 2016. We concluded that the correction of the errors was not material to the fourth quarter of fiscal 2016 or to any of the prior periods in the fiscal 2014 Form 10-K. Historically, certain immaterial discounts had been recorded as an expense to selling, distribution and administrative costs. These discounts are now recorded as contra revenue. See Note 3, Financial Statement Revisions, for more detailed disclosure.that were impacted.
|
|
|
| First Quarter |
|
| Second Quarter |
|
| Third Quarter |
|
| Fourth Quarter |
| ||||
|
| (Amounts in thousands, except per share data) |
| |||||||||||||||
Sales |
| 2015 |
| $ | 1,146,045 |
|
| $ | 888,795 |
|
| $ | 885,302 |
|
| $ | 858,363 |
|
|
| 2014 |
| $ | 1,153,917 |
|
| $ | 872,791 |
|
| $ | 844,932 |
|
| $ | 877,333 |
|
Materials, supplies, labor and other production costs (exclusive of depreciation and amortization shown separately) |
| 2015 |
| $ | 585,916 |
|
| $ | 457,253 |
|
| $ | 464,045 |
|
| $ | 455,939 |
|
|
| 2014 |
| $ | 595,877 |
|
| $ | 458,019 |
|
| $ | 442,978 |
|
| $ | 453,759 |
|
Net income |
| 2015 |
| $ | 61,389 |
|
| $ | 51,760 |
|
| $ | 43,796 |
|
| $ | 32,246 |
|
|
| 2014 |
| $ | 61,066 |
|
| $ | 42,064 |
|
| $ | 44,599 |
|
| $ | 28,010 |
|
Basic net income per share |
| 2015 |
| $ | 0.29 |
|
| $ | 0.25 |
|
| $ | 0.21 |
|
| $ | 0.15 |
|
|
| 2014 |
| $ | 0.29 |
|
| $ | 0.20 |
|
| $ | 0.21 |
|
| $ | 0.13 |
|
Diluted net income per share |
| 2015 |
| $ | 0.29 |
|
| $ | 0.24 |
|
| $ | 0.21 |
|
| $ | 0.15 |
|
|
| 2014 |
| $ | 0.29 |
|
| $ | 0.20 |
|
| $ | 0.21 |
|
| $ | 0.13 |
|
Note 24. | Subsequent Events |
The company has evaluated subsequent events since January 2,December 31, 2016, the date of these financial statements. We believe there were no material events or transactions discovered during this evaluation that requires recognition or disclosure in the financial statements other than the itemitems discussed below.
Divestiture. On January 14, 2017, the company completed the sale of a non-core mix manufacturing business located in Cedar Rapids, Iowa for $44.0 million, subject to finalizing a working capital adjustment. This resulted in a preliminary gain on sale in the range of $31.0 million to $33.0 million, which will be recognized in the first quarter of fiscal 2017.
Dividend. On February 19, 2016,17, 2017, the Board of Directors declared a dividend of $0.1450$0.16 per share on the company’s common stock to be paid on March 18, 201617, 2017 to shareholders of record on March 4, 2016.3, 2017.
F-55
F-58