UNITED STATES
SECURITIES AND EXCHANGE COMMISSION
Washington, D.C. 20549
FORM 10-K
| ANNUAL REPORT PURSUANT TO SECTION 13 OR 15(d) OF THE SECURITIES EXCHANGE ACT OF 1934 |
For the fiscal year ended December 31, 20152017
Or
| TRANSITION REPORT PURSUANT TO SECTION 13 OR 15(d) OF THE SECURITIES EXCHANGE ACT OF 1934 |
For the transition period from to
Commission File No. 001-35083
GSI GroupNovanta Inc.
(Exact name of registrant as specified in its charter)
New Brunswick, Canada |
| 98-0110412 |
(State or other jurisdiction of incorporation or organization) |
| (I.R.S. Employer Identification No.) |
|
| |
125 Middlesex Turnpike |
| 01730 |
Bedford, Massachusetts, USA |
| (Zip Code) |
(Address of principal executive offices) |
|
|
(781) 266-5700
(Registrant’s telephone number, including area code)
Securities Registered Pursuant to Section 12(b) of the Act:
Title of Each Class
|
| Name of Exchange on Which Registered
|
Common Shares, no par value |
| The |
Securities Registered Pursuant to Section 12(g) of the Act:
None
Indicate by check mark if the registrant is a well-known seasoned issuer, as defined in Rule 405 of the Securities Act. Yes ¨☑ No þ☐
Indicate by check mark if the registrant is not required to file reports pursuant to Section 13 or 15(d) of the Act. Yes ¨☐ No þ☑
Indicate by check mark whether the registrant (1) has filed all reports required to be filed by Section 13 or 15(d) of the Securities Exchange Act of 1934 during the preceding 12 months (or for such shorter period that the registrant was required to file such reports), and (2) has been subject to such filing requirements for the past 90 days. Yes þ☑ No ¨☐
Indicate by check mark whether the registrant has submitted electronically and posted on its corporate Web site, if any, every Interactive Data File required to be submitted and posted pursuant to Rule 405 of Regulation S-T (Section 232.405 of this chapter) during the preceding 12 months (or for such shorter period that the registrant was required to submit and post such files). Yes þ☑ No ¨☐
Indicate by check mark if disclosure of delinquent filers pursuant to Item 405 of Regulation S-K is not contained herein, and will not be contained, to the best of registrant’s knowledge, in definitive proxy or information statements incorporated by reference in Part III of this Form 10-K or any amendment to this Form 10-K. ¨☑
Indicate by check mark whether the registrant is a large accelerated filer, an accelerated filer, a non-accelerated filer, or a smaller reporting company or an emerging growth company. See the definitions of “large accelerated filer,” “accelerated filer”filer,” “smaller reporting company” and “smaller reporting“emerging growth company” in Rule 12b-2 of the Exchange Act. (Check one):
Large accelerated filer | ☑ |
| Accelerated filer |
| ☐ | |
Non-accelerated filer |
|
| Smaller reporting company | ☐ | ||
| ||||||
Emerging growth company | ☐ | |||||
If an emerging growth company, indicate by check mark if the registrant has elected not to use the extended transition period for complying with any new or revised financial accounting standards provided pursuant to Section 13(a) of the Exchange Act. ☐
Indicate by check mark whether the registrant is a shell company (as defined in Rule 12b-2 of the Exchange Act). Yes ¨☐ No þ☑
The aggregate market value of the Registrant’s outstanding common shares held by non-affiliates of the Registrant, based on the closing price of the common shares on the NASDAQNasdaq Global Select Market on the last business day of the Registrant’s most recently completed second fiscal quarter (July 3, 2015)(June 30, 2017) was $430,444,038.$1,021,670,127. For purposes of this disclosure, common shares held by officers and directors of the Registrant and by persons who hold more than 5%10% of the Registrant’s outstanding common shares have been excluded because such persons may be deemed to be affiliates. This determination of affiliate status is not necessarily conclusive.
As of February 26, 2016,23, 2018, there were 34,346,58934,596,971 of the Registrant’s common shares, no par value, issued and outstanding.
DOCUMENTS INCORPORATED BY REFERENCE
Portions of the Registrant’s Definitive Proxy Statement for the Registrant’s Annual Meeting of Shareholders scheduled to be held on May 10, 20162018 to be filed with the Securities and Exchange Commission are incorporated by reference in answer to Part III of this Annual Report on Form 10-K.
FORM 10-K
YEAR ENDED DECEMBER 31, 20152017
TABLE OF CONTENTS
Item No. |
|
|
| Page No. |
| ||||
Item 1. |
|
| 1 | |
Item 1A. |
|
| 9 | |
Item 1B. |
|
|
| |
Item 2. |
|
|
| |
Item 3. |
|
|
| |
Item 4. |
|
|
| |
| ||||
Item 5. |
|
|
| |
Item 6. |
|
|
| |
Item 7. |
| Management’s Discussion and Analysis of Financial Condition and Results of Operations |
|
|
Item 7A. |
|
|
| |
Item 8. |
|
|
| |
Item 9. |
| Changes in and Disagreements with Accountants on Accounting and Financial Disclosure |
|
|
Item 9A. |
|
|
| |
Item 9B. |
|
|
| |
| ||||
Item 10. |
|
|
| |
Item 11. |
|
|
| |
Item 12. |
| Security Ownership of Certain Beneficial Owners and Management and Related Stockholder Matters |
|
|
Item 13. |
| Certain Relationships and Related Transactions, and |
|
|
Item 14. |
|
|
| |
| ||||
Item 15. |
|
|
| |
Item 16. | 108 | |||
|
| |||
As used in this report, the terms “we,” “us,” “our,” “GSI Group,“Novanta,” “GSI,” “GSIG”“NOVT” and the “Company” mean GSI GroupNovanta Inc. and its subsidiaries, unless the context indicates another meaning.
Unless otherwise noted, all dollar amounts in this report are expressed in United States dollars.
The following brand and trade names of GSI GroupNovanta Inc. are used in this report: MicroE Systems,Cambridge Technology, Lincoln Laser, ExoTec Precision, Synrad, Laser Quantum, WOM, Lemke, NDS, NDSsi, Reach Technology, JADAK, Skyetek, ThingMagic, Photo Research, General Scanning, Celera Motion, Westwind, Synrad, Cambridge Technology, ExoTec Precision, General Scanning, Photo Research, JADAK, NDS, Dome, NDSsi,MicroE, Applimotion Lincoln Laser and Skyetek.
Westwind.
Cautionary Note Regarding Forward Looking Statements
Except for historical information, the matters discussed in this Annual Report on Form 10-K are forward looking statements that involve risks, uncertainties and assumptions that, if they never materialize or if they prove incorrect, could cause our consolidated results to differ materially from those expressed or implied by such forward looking statements. The Company makes such forward looking statements under the provision of the “Safe Harbor” section of the Private Securities Litigation Reform Act of 1995. Actual future results may vary materially from those projected, anticipated, or indicated in any forward looking statements as a result of various important factors, including those set forth in Item 1A of this Annual Report on Form 10-K under the heading “Risk Factors.” Readers should also carefully review the risk factors described in the other documents that we file with the SEC from time to time with the SEC.time. In this Annual Report on Form 10-K, the words “anticipates,” “believes,” “expects,” “intends,” “future,” “could,” “estimates,” “plans,” “would,” “should,” “potential,” “continues” and similar words or expressions (as well as other words or expressions referencing future events, conditions or circumstances) identify forward looking statements. Forward looking statements also include the assumptions underlying or relating to any of the forward looking statements. The forward looking statements contained in this Annual Report include, but are not limited to, statements related to: our belief that the Purchasing Managers Index (PMI) may provide an indication of the impact of general economic conditions on our sales into the advanced industrial end market; anticipated financial performance; expected liquidity and capitalization; drivers of revenue growth;growth and our growth expectations in various markets; management’s plans and objectives for future operations, expenditures and product development, and investments in research and development; business prospects; potential of future product releases;releases and expansion of our product and service offerings; anticipated revenue performance; industry trends; market conditions; our competitive positions; changes in economic and political conditions; changes in accounting principles; changes in actual or assumed tax liabilities; expectations regarding tax exposures; anticipated reinvestment of future earnings;earnings and dividend policy; anticipated expenditures in regard to the Company’s benefit plans; future acquisitions, and dispositionsintegration and anticipated benefits from acquisitions; anticipated use of currency hedges;acquisitions and dispositions; ability to repay our indebtedness; our intentions regarding the use of cash; expectations regarding legal and regulatory environmental requirements and our compliance thereto; and other statements that are not historical facts. All forward looking statements included in this document are based on information available to us on the date hereof. We will not undertake and specifically decline any obligation to update any forward looking statements.statements, except as required under applicable law.
OVERVIEWOverview
GSI GroupNovanta Inc. and its subsidiaries (collectively referred to as the “Company”, “Novanta”, “we”, “us”, “our”) design, develop, manufacture and sell precision photonic and motion control components and subsystems to Original Equipment Manufacturers (“OEM’s”) in the medical equipmentis a global supplier of core technology solutions that give healthcare and advanced industrial original equipment manufacturers (“OEMs”) a competitive advantage. Novanta combines deep proprietary technology markets. Our highly engineered enabling technologies include laser sources, laser scanningexpertise and beam delivery products, optical data collection and machinecompetencies in photonics, vision technologies, medical visualization and informatics solutions, and precision motion control products. We specialize in collaborating with OEM customersa proven ability to adapt our componentsolve complex technical challenges. This enables Novanta to engineer core components and subsystem technologiessub-systems that deliver extreme precision and performance, tailored to deliver highly differentiated performance in theircustomers' demanding applications.
GSI GroupNovanta Inc. was founded and initially incorporated in Massachusetts in 1968 as General Scanning, Inc. (“General Scanning”). General Scanning developed, manufactured and sold components and subsystems used for high-speed micro positioning of laser beams. In 1999, General Scanning merged with Lumonics Inc., a Canadian company that developed, manufactured and sold laser-based advanced manufacturing systems for electronics, semiconductor, and general industrial applications. The post-merger entity, GSI Lumonics Inc., continued under the laws of the Province of New Brunswick, Canada. In 2005, the Company changed its name to GSI Group Inc. Through a series of strategic divestitures and acquisitions, the Company transformed from a focus on the semiconductor industry to primarily selling components and sub-systems to OEMs in the medical and advanced industrial markets. The Company changed its name to Novanta Inc. in May 2016.
Strategy
Our strategy is to drive sustainable, profitable growth through short-term and long-term initiatives, including:
|
|
disciplined focus on our diversified business model of providing functionality to long life-cycle OEM customer platforms in attractive medical and advanced industrial niche markets;
improving our business mix to increase medical sales as a percentage of total revenue by:
| - | introducing new products aimed at attractive medical applications, such as minimally invasive and robotic surgery, ophthalmology, patient monitoring, drug delivery, |
| - | deepening our key account management relationships with and driving cross selling of our |
| - | pursuing complementary medical technology acquisitions; |
1
broadening our portfolio of enabling proprietary technologies and capabilities through increased investment in new product development, expanded sales and marketing channels to reach target customers, and investments in application development to further penetrate existing customers, while expanding the applicability of our solutions to new markets;
|
|
broadening our product and service offerings through the acquisition of innovative and complementary technologies and solutions in medical and advanced industrial technology applications, including increasing our recurring revenue streams such as services, spare parts and consumables;
|
|
improving our existing operations to expand profit margins and improve customer satisfaction by implementing lean manufacturing principles and strategic sourcing across our major production sites; and
|
|
attracting, retaining, and developing world-class talented and motivated employees.
Acquisitions
We continuously evaluate our business mix and financial performance. Since 2013, we have executed a series of acquisitions in line with our strategy.
In July 2017, the Company acquired W.O.M. World of Medicine GmbH (“WOM”), a Berlin, Germany-based provider of medical insufflators, pumps and related disposables for OEMs in the minimally invasive surgery market, for a total purchase price of €118.1 million ($134.9 million).
In January 2017, the Company acquired an additional approximately 35% of the outstanding shares of Laser Quantum Limited (“Laser Quantum”), a Manchester, United Kingdom-based provider of solid state continuous wave lasers, femtosecond lasers, and optical light engines to OEMs in the medical market, for a total purchase price of £25.5 million ($31.1 million). As a result of the acquisition of these additional shares, the Company’s equity ownership percentage increased from approximately 41% to approximately 76%.
In January 2017, the Company acquired ThingMagic, a Woburn, Massachusetts-based provider of ultra-high frequency (“UHF”) radio frequency identification (“RFID”) modules and finished RFID readers to OEMs in the medical and advanced industrial markets, for a total purchase price of $19.1 million.
In May 2016, the Company acquired Reach Technology Inc., a Fremont, California-based provider of embedded touch screen technology solutions to OEMs in the medical and advanced industrial markets, for a total purchase price of $9.4 million.
In December 2015, the Company acquired all assets and certain liabilities of Skyetek Inc., a Denver, Colorado-based provider of embedded and standalone radio frequency identification (“RFID”)RFID solutions for OEM customers in the medical and advanced industrial markets, for a total purchase price of $2.8 million. Cash paid upon closing was $2.6 million, subject to customary working capital adjustments.
In November 2015, the Company acquired certain assets and liabilities of Lincoln Laser Company, a Phoenix, Arizona-based provider of ultrafast precision polygon scanners and other optical scanning solutions for the medical food processing, and advanced industrial markets, for a total purchase price of $12.2$12.1 million. Cash paid upon closing was $10.3 million, subject to customary working capital adjustments.
In February 2015, the Company acquired Applimotion Inc., a Loomis, California-based provider of advanced precision motor and motion control technology to OEM customers in the medical and advanced industrial markets, for a total purchase price of $14.0 million. Cash paid upon closing was $13.0 million, net of working capital adjustments.
In March 2014, the Company acquired JADAK LLC, JADAK Technologies Inc. and Advance Data Capture Corporation (together, “JADAK”), a North Syracuse, New York-based provider of optical data collection and machine vision technologies to OEM medical device manufacturers, for a total purchase price of $93.7 million, net of working capital adjustments.million.
In January 2013, the Company acquired NDS Surgical Imaging LLC (“NDS”), a San Jose, California-based company that designs, manufactures, and markets high definition visualization solutions and imaging informatics products for the surgical, radiology and patient monitoring end markets,market segments, for a total final purchase price of $75.4 million, net of working capital adjustments.million.
2
Divestitures and Product Rationalization
We continuously evaluateAs part of our ongoing evaluation of our business mix and financial performance.performance, we also review our business for potential divestitures and product rationalizations. Since 2011, we have executed a series of divestitures and product rationalizations in line with our strategy.
In January 2016, the Company decided to discontinuediscontinued its radiology products, sold under the Dome brand name and operated within the Company’s Visualization Solutions product line. Total revenue from these products was approximately $9zero, $1.4 million and $9.4 million in 2015.2017, 2016, and 2015, respectively.
In June 2015, the Company finalized an agreement to divestdivested its 50% owned joint venture in India, Excel Laser Technology Private Limited, for net cash proceeds of $0.2 million.
In April 2015, the Company completed the sale of its fiber laser business, operated under the JK Lasers brand name, for $29.6 million in cash, net of working capital adjustments.cash.
In July 2014, the Company completed the sale of theits Scientific Lasers business, operated under the Continuum and Quantronix brand names, for $6.5 million in cash, net of working capital adjustments.cash.
In May 2013, the Company sold theits Semiconductor Systems business, operated under the GSI Group brand name, for $9.7 million in cash, net of working capital adjustments.cash.
In October 2012, the Company divested thesold its Lasers Systems business, operated under the Control Laser and Baublys brand names, for $6.6 million in cash, net of working capital adjustments.
cash.
The Company evaluates the performance of, and allocates resources to, its segments based on revenue, gross profit and operating profit. The Company’s reportable segments have been identified based on commonality and adjacency of technologies, applications, and customers amongst the Company’s individual product lines.
The following table shows the external revenues, gross profit margin and operating profit for each of the segments for the year ended December 31, 20152017 (dollars in thousands):
| Revenue |
|
| Gross Profit Margin |
|
| Operating Profit |
| |||
Laser Products | $ | 168,331 |
|
|
| 43.7 | % |
| $ | 35,971 |
|
Vision Technologies |
| 124,725 |
|
|
| 39.3 | % |
|
| (2,057 | ) |
Precision Motion |
| 80,542 |
|
|
| 45.6 | % |
|
| 16,877 |
|
| Revenue |
|
| Gross Profit Margin |
|
| Operating Profit |
| |||
Photonics | $ | 232,359 |
|
|
| 45.7 | % |
| $ | 51,289 |
|
Vision | $ | 183,074 |
|
|
| 37.8 | % |
| $ | 7,883 |
|
Precision Motion | $ | 105,857 |
|
|
| 44.0 | % |
| $ | 27,146 |
|
See Note 1618 to Consolidated Financial Statements for additional financial information about ourthe Company’s reportable segments.
Laser ProductsPhotonics
The Laser ProductsPhotonics segment designs, manufactures and markets photonics-based solutions, including CO2 laser sources, laser scanning and laser beam delivery, CO2 laser, continuous wave and ultrafast laser, and optical light engine products to customers worldwide. The segment serves highly demanding photonics-based applications such as industrial material processing, metrology, medical and life science imaging, DNA sequencing, and medical laser procedures. The vast majority of the segment’s product offerings are sold to Original Equipment ManufacturerOEM customers. The segment sells these products both directly, utilizing a highly technical sales force, and indirectly, through resellers and distributors.
3
The Laser ProductsPhotonics segment is comprised of threefour product lines:
| Key End Market |
| Brand Names |
| Description | |
Laser Beam Delivery Components |
| Advanced Industrial and Medical |
| Cambridge Technology, Lincoln Laser & ExoTec Precision |
| Galvanometer and |
Laser Beam Delivery Solutions |
| Advanced Industrial and Medical |
| Cambridge Technology, Lincoln Laser & Synrad |
| Galvanometer and polygon based optical scan heads. These products provide precise control and delivery of laser beams through motorized manipulation of mirrors and optical elements in two and |
CO2 Lasers |
| Advanced Industrial |
|
Synrad |
| Both continuous and pulsed |
Continuous Wave and Ultrafast Lasers | Medical and Advanced Industrial | Laser Quantum | Continuous wave diode-pumped solid state lasers, ultrafast lasers and subsystems in the visible to near-infrared. Lasers integrated into sub-systems for OEM integrators, including full beam parameter control. Applications include DNA sequencing, microscopy, super-resolution imaging, semiconductor particle detection and chip masking, frequency combs and seed-amplification. |
Vision
Vision Technologies
The Vision Technologies segment (formerly known as Medical Technologies) designs, manufactures and markets a range of medical grade technologies, including visualization solutions, imaging informatics products,medical insufflators, pumps and related disposables; surgical displays and operating room integration technologies; optical data collection and machine vision technologies; radio frequency identification (“RFID”) technologies; thermal printers; spectrometry technologies, RFID technologies, thermal printers, and light and color measurement instrumentation to customers worldwide.embedded
4
touch screen solutions. The vast majority of the segment’s product offerings are sold to Original Equipment ManufacturerOEM customers. The segment sells these products both directly, utilizing a highly technical sales force, and indirectly, through resellers and distributors.
The Vision Technologies segment has sixten product lines:
Product Line |
| Key End Market |
| Brand Names |
| Description |
Medical Insufflators, Pumps, Cameras and Accessories | Medical | WOM, Lemke | Insufflators, pumps, video cameras, light sources and video couplers, gamma probes, laser lithotripters and related accessories for minimally invasive surgery. | |||
Visualization Solutions |
| Medical |
| NDS, NDSsi |
| High definition visualization solutions for |
|
| Medical |
|
NDS, NDSsi |
| Imaging management for visual information, including real-time distribution, documentation, control, and streaming for multiple imaging modalities for surgical applications. |
Wireless OR Solutions |
| Medical |
| NDS, NDSsi | High definition wireless transmission of video signals to replace video cables in minimally invasive surgical equipment. | |
Touch Panel Displays | Medical and Advanced Industrial | Reach Technology | Embedded capacitive and resistive touch panel technology that delivers high-performance solutions. | |||
Machine Vision | Medical and Advanced Industrial |
|
JADAK |
|
| |
Radio Frequency Identification (RFID) |
| Medical and Advanced Industrial |
|
JADAK, Skyetek, ThingMagic |
| RFID |
Barcode Scanning | Medical and Advanced Industrial | JADAK | Embedded and handheld data collection products for barcode scanning. | |||
Thermal |
| Medical |
|
|
| Rugged thermal |
Light and Color Measurement |
| Medical and Advanced Industrial |
|
Photo Research |
| Light and color measurement |
Precision Motion
The Precision Motion segment designs, manufactures and markets optical encoders, precision motorsmotor and other motion control technology, air bearing spindles and precision machined components to customers worldwide. The vast majority of the segment’s product offerings are sold into the advanced industrial market and the medical market.to OEM customers. The segment sells these products both directly, utilizing a highly technical sales force, and indirectly, through resellers and distributors.
5
The Precision Motion segment includes four product lines:
Product Line |
| Key End Market |
| Brand Names |
| Description |
Optical Encoders |
| Advanced Industrial and Medical |
| Celera Motion, MicroE |
| Precision optical encoders from core product brand, MicroE. Applications include motion control of equipment and instruments used in the semiconductor and electronics manufacturing, industrial and medical robotics, metrology, satellite communications, medical devices, and laboratory |
Precision Motors |
| Advanced Industrial and Medical |
| Celera Motion, Applimotion |
| Precision direct drive motor components from core product brand, Applimotion. Applications include motion control of equipment and instruments used in the semiconductor and electronics manufacturing, industrial and medical robotics, autonomous vehicles, metrology, satellite communications, surveillance, medical devices, and laboratory |
Integrated Motion Control Solutions |
| Advanced Industrial and Medical |
| Celera Motion |
| Precision integrated motion control solutions. Applications include motion control of equipment and instruments used in the semiconductor and electronics manufacturing, industrial and medical robotics, autonomous vehicles, metrology, satellite communications, surveillance, medical devices, and laboratory |
Air Bearing Spindles |
|
Advanced Industrial |
| Westwind |
| High-speed and precision air bearing spindles used in the PCB manufacturing, automotive coating, semiconductor manufacturing equipment, micro machining and power generation markets. |
We primarily operate in two end markets: the advanced industrial market and the medical market.
Advanced Industrial Market
For the year ended December 31, 2015,2017, the advanced industrial market accounted for approximately 60%50% of the Company’s revenue. Revenue from our products sold to the advanced industrial market is affected by a number of factors, including changing technology requirements and preferences of our customers, productivity or quality investments in a manufacturing environment, the financial condition of our customers, changes in regulatory requirements and laws, and general economic conditions. We believe that the Purchasing Managers Index (PMI) on manufacturing activities specific to different regions around the world may provide an indication of the impact of general economic conditions on our sales into the advanced industrial market.
Medical Market
For the year ended December 31, 2015,2017, the medical market accounted for approximately 40%50% of the Company’s revenue. Our revenue from products sold to the medical market is generally affected by hospital and other health care provider capital spending, changes in regulatory requirements and laws, aggregation of purchasing by healthcare networks, trends in surgical procedures, changes in technology requirements, changes in customerscustomer or patient preferences, and general demographic trends.
6
There are no special inventory requirements or credit terms extended to customers that would have a material adverse effect on our working capital.
Customers
We have a diverse group of customers that include companies that are global leaders in their industries. Many of our customers participate in several market industries. No customer accounted for greater than 10% of our consolidated revenue during the years ended December 31, 2015, 20142017, 2016 or 2013.2015.
Customers of our Laser Products,Photonics, Vision, Technologies, and Precision Motion segments include a large number of original equipment manufacturersOEM customers who integrate our products into their systems for sale to end users. We also sell directly to end users. Our customers include leaders in the medical and advanced industrial markets. A typical OEM customer will usually evaluate our products and our ability to provide application knowledge and expertise, post-sales application support and services, supply chain management over long durations, manufacturing capabilities, product quality, global presence, and product customization before deciding to incorporate our products into their products or systems. Customers generally choose suppliers based on a number of factors, including product performance, reliability, application support, price, breadth of the supplier’s product offerings, the financial condition of the supplier, and the geographical coverage offered by the supplier. Once certain of our products have been designed into a given OEM customer’s product or system, there are generally significant barriers to subsequent supplier changes, especially in the medical market.
Seasonality
While our revenues are not highly seasonal on a consolidated basis, the revenues of some of our individual product lines, particularly our visualization solutions, imaging informatics, and thermal printer products, are impacted in the first and fourth quarters by seasonality due to hospital budgeting cycles.
Backlog
As of December 31, 20152017 and 2014,2016, our consolidated backlog was approximately $96.8$187.1 million and $82.1$115.0 million, respectively. The majority of open orders included in backlog represent open orders for products and services that, based on management’s projections, have a reasonable probability of being delivered over the subsequent twelve month period. Orders included in backlog may be canceled or rescheduled by customers without significant penalty. Management believes that backlog is not a meaningful indicator of future business prospects for any of our business segments due to the short lead time required on our products and the ability of customers to reschedule or cancel orders. Therefore, backlog as of any particular date should not be relied upon as indicative of our revenues for any future period.
Manufacturing
Manufacturing functions are performed internally when management chooseswe choose to maintain control over critical portions of the production process or for cost related reasons while some of the less critical portions are outsourced to third parties. To the extent it makes financial sense, we will consider outsourcing additional portions of the production process.
Products offered by our Laser ProductsPhotonics segment are manufactured at facilities in Bedford, Massachusetts; Mukilteo, Washington; Phoenix, Arizona; Taunton and Manchester, United Kingdom; and Suzhou, China. Products offered by our Vision Technologies segment are manufactured at facilities in Syracuse, New York; San Jose, California; and Chatsworth, California; Bedford, Massachusetts; and Suzhou, China.Ludwigsstadt, Germany. Products offered by our Precision Motion segment are primarily manufactured at facilities in Bedford, Massachusetts; Loomis, California; Poole, United Kingdom; and Suzhou, China.
Many of our products are manufactured under ISO 9001 certification, while the majority of our products manufactured for the medical market are manufactured under ISO 13485 certification. Our medical insufflators, pumps, cameras and accessories products are also manufactured under ISO 14001 certification. Certain visualization solutions, thermal printers and imaging informatics products are manufactured under current good manufacturing practices (CGMP’s)(CGMPs), which is a requirement of their medical device classification by the U.S. Food and Drug Administration (the “FDA”). In addition, certain visualization solutions, thermal printers, and imaging informatics and medical insufflators, pumps, cameras and accessories products are manufactured under section 510(k) of the FDA.
Research and Development and Engineering
We incur research and development and engineering expenses as part of our ongoing operations. We are strongly committed to research and development for core technology programs directed at creating new products, product enhancements, increasing our
7
addressable market, and new applications for existing products. We are also committed to funding research into future market opportunities. Our markets have experienced rapid technological changes and product innovations. We believe that continued timely development of new products and product enhancements to serve existing and new markets is necessary for us to remain competitive. Research and development and engineering expenses were $41.7 million, or 8.0% of revenue, for the year ended December 31, 2017, compared to $32.0 million, or 8.3% of revenue, for the year ended December 31, 2016 and $31.0 million, or 8.3% of revenue, for the year ended December 31, 2015,
compared to $29.0 million, or 7.9% of revenue, for the year ended December 31, 2014 and $23.8 million, or 7.5% of revenue, for the year ended December 31, 2013.2015.
Marketing, Sales and Distribution
We sell our products globally, primarily through our direct sales force. Sales to foreign jurisdictionsoutside of the United States are largely based on a direct sales force, but occasionally are sold through distributors, including manufacturers’ representatives, to either augment our selling effort or addressserve a local market where we have no direct sales force. Our local sales, applications, and service teams and our distributors work closely with our customers to ensure customer satisfaction with our products. We have sales and service centers located in North America,the United States, Europe China, and Japan.Asia.
To support our sales efforts, we maintain and continue to invest in a number of applicationsapplication centers around the world, where our applicationsapplication experts work closely with customers on integrating and using our solutions in their equipment. The applications span a wide range, with teams residing inWe currently maintain several facilitiesservice and application centers in the United States, Europe and Asia.
Competition
The markets in which we compete are dynamic and highly competitive. Due to the wide range of our products, we face many different types of competition and competitors. This affects our ability to sell our products and the prices at which these products are sold. Our competitors range from large foreign and domestic organizations, which produce a comprehensive array of goods and services and may have greater financial and other resources than we do, to small firms producing a limited number of goods or services for specialized market segments.
Competitive factors in our Laser Products,Photonics, Vision, Technologies, and Precision Motion segments include product performance, price, quality and reliability, features, compatibility of products with existing systems, technical support, product breadth, market presence, on-time delivery and our overall reputation. We believe that our products offer a number of competitive advantages. However, some of our competitors are substantially larger and have greater financial and other resources.
Raw Materials, Components and Supplies
Each of our businesses uses a wide variety of raw materials, key components and parts that are generally available from alternative sources of supply and in adequate quantities from domestic and foreign sources. In some instances, we design and/or re-engineer the parts and components used in our products. For certain critical raw materials, key components and parts used in the production of some of our principal products, we have identified only a limited number of suppliers or, in some instances, a single source of supply. We also rely on a limited number of independent contractors to manufacture subassemblies for some of our products.
For a further discussion of the importance and risks associated with our supply chain, see applicable risk factors under Item 1A of this Annual Report on Form 10-K.
Patents and Intellectual Property
We rely upon a combination of copyrights, patents, trademarks, trade secret laws and restrictions on disclosure to protect our intellectual property rights. We hold a number of registered and pending patents in the United States and other countries. In addition, we also have trademarks registered in the United States and foreignother countries. We will continue to actively pursue applications for new patents and trademarks as we deem appropriate. However, there can be no assurance that any other patents will be issued to us or that such patents, if and when issued, will provide any protection or benefit to us.
Although we believe that our patents and pending patent applications are important, we rely upon several additional factors that are essential to our business success, including: market position, technological innovation, know-how, application knowledge and product performance. Considering the diversified nature of our businesses, we do not believe that any individual patent is material to our business as a whole. However, there can be no assurance that we will be able to sustain these advantages.
We also protect our proprietary rights by controlling access to our proprietary information and by maintaining confidentiality agreements with our employees, consultants, and certain customers and suppliers. For a further discussion of the importance of risks associated with our intellectual property rights, see applicable risk factors under Item 1A of this Annual Report on Form 10-K.
8
As of December 31, 20152017 and 2014,2016, we employed 1,3552,034 and 1,4181,269 employees, respectively, of which zerorespectively. We also utilize temporary and 36 employees, respectively, were part of our discontinued businesses.
contract personnel that are not included in these headcount numbers. Employee headcount increased in 2017 mainly due to acquisitions during the year.
We are a multinational company with approximately 59%58% of our 20152017 revenue outside the United States and approximately 14%52% of our net property, plant and equipment net, outside the United States atas of December 31, 2015.2017. Geographic information is discussed in Note 1618 to the Consolidated Financial Statements. For a further discussion of the risks associated with our foreign operations, see applicable risk factors under Item 1A of this Annual Report on Form 10-K.
Government Regulation
Our current and contemplated activities and the products and processes that will result from such activities are subject to substantial government regulations, both in the United States and internationally. Most of our production facilities are subject to various federal, state, local, and/or foreign environmental regulations, related to the use, storage, handling, and disposals of regulated materials, chemical,chemicals, and certain waste products. Such rules are subject to change by the governing agencyagencies and we monitor those changes closely. We expect all operations to meet the legal and regulatory environmental requirements. Although we believe that our safety procedures for using, handling, storing and disposing of such materials comply with the standards required by federal and state laws and regulations, we cannot completely eliminate the risk of accidental contamination or injury from these materials.
We may face the potential of increasing complexity in our product designs and procurement operations due to the evolving nature of product compliance standards. Those standards may impact the material composition of our products entering specific markets. Such regulations went into effect in the European Union (“EU”) in 2006 (The(“The Restriction of Hazardous Substances Directive (RoHS)Directive” (“RoHS”)) and in 2007 (Registration,(“Registration, Evaluation, Authorisation and Restriction of Chemicals (REACH)Chemicals” (“REACH”)), and in China in 2007 (Management(“Management Methods for Controlling Pollution Caused by Electronic Information Products Regulation (China-RoHS)Regulation” (“China-RoHS”)).
Our capital expenditures, earnings, and competitive position have not been, and are not expected to be materially affected by our compliance with federal, state, and local environmental provisions which have been enacted or adopted to regulate the distribution of materials into the environment.
United States Food and Drug Administration
Certain products manufactured by us are integrated into systems by our customers that are subject to certain regulations administered by the United States Food and Drug Administration. We must comply with certain quality control measurements in order for our products to be effectively used in our customers’ end products. Non-compliance with quality control measurements could result in loss of business with our customers, fines and penalties.
We are subject to certain medical device regulations. Medical devices are subject to extensive and rigorous regulation by the Food and Drug Administration and by other federal, state and local authorities. The Federal Food, Drug and Cosmetic Act and related regulations govern the conditions of safety, efficacy, clearance, approval, manufacturing, quality system requirements, labeling, packaging, distribution, storage, record keeping,recordkeeping, reporting, marketing, advertising, and promotion of products. Non-compliance with applicable requirements can result in, among other things, fines, injunctions, civil penalties, recall or seizure of products, total or partial suspension of production, refusal by the government to grant premarket clearance or approval of products, withdrawal of clearances and approvals, and criminal prosecution.
Other Information
We maintain a website with the address www.gsig.com.www.novanta.com. We are not including the information contained on our website as part of, or incorporating it by reference into, this Annual Report on Form 10-K. We make available, free of charge through our website, our annual reports on Form 10-K, quarterly reports on Form 10-Q, current reports on Form 8-K, and amendments to these reports as soon as reasonably practicable after we electronically file these materials with, or otherwise furnish them to, the Securities and Exchange Commission (“SEC”). In addition, our reports and other information are filed with securities commissions or other similar authorities in Canada, and are available over the Internet at www.sedar.com.
The following risk factors could have a material adverse effect on our business, financial position, results of operations and cash flows and could cause the market value of our common shares to fluctuate or decline. These risk factors may not include all of the
9
important factors that could affect our business or that could cause our future financial results to differ materially from historic or expected results or cause the market price of our common shares to fluctuate or decline.
Risks Relating to our Business
Our results of operations could be adversely affected by economic and political conditions and the effects of these conditions on our customers’ businesses and levels of business activities.
A large portion of our product sales are dependent on theour customers’ need for increased capacity, productivity and cost saving initiatives, improved product quality and performance, and new investments by our customers.investments. Weaknesses in our end markets could negatively impact our revenue and gross margin and consequently have a material adverse effect on our business, financial condition and results of operations. For instance, uncertainty in our medical and advanced industrial end markets has caused customers in those markets to purchase fewer products from us during certain recent quarters. If such uncertainty continues or worsens, we may not be able to meet anticipated revenue levels on a quarterly or annual basis. Moreover, aA severe and/or prolonged overall economic downturn or a negative or uncertain political climate could lead to weaknesses in our end markets and adversely affect our customers’ financial condition and the timing or levels of business activity of our customers and the industries we serve. In particular, reducedmoderate growth expectations in China, economic and political uncertainty as Britain negotiates withdrawal from the uncertain European financial situationUnion, as well as political and economic uncertainty in the United States as a result of the current U.S. government could have anadversely impact on our customers’ financial condition and ability to maintain product ordersorder levels in the future. This may reduce the demand for our products or depress pricing for our products and have a material adverse effect on our results of operations. Changes in global economic conditions could also shift demand tofor products or services for which we do not have competitive advantages, and thisadvantages. This could negatively affect the amount of business that we are able to obtain. In addition, if we are unable to successfully anticipate changingchanges in economic and political conditions, we may be unable to effectively plan for and respond to those changes, and our business could be negatively affected.
Our business depends significantly upon our customers’ capital expenditures, which are subject to cyclical market fluctuations.
TheCertain sub-segments of the advanced industrial market that we serve, including the microelectronics and industrial capital equipment industriesmarkets, are cyclical and have historically experienced periods of oversupply, resulting in downturns in demand for capital equipment in which many of our products are used. The timing, length and severity of these cycles,downturns and their impact on our business are difficult to predict. Further, our order levels or results of operations for a given period may not be indicative of order levels or results of operations for subsequent periods. For the foreseeable future, our operations will continue to depend upon industries that are subject to market cycles which, in turn, could adversely affect the market demand for our products.
We experienced significant cyclical end market fluctuations in the past. We cannot assure you that suchpredict when slowdowns will not recur or that the impact of such slowdowns will be more or less significant compared to historical fluctuations.
Our business success depends upon our ability to respond to fluctuations in product demand, but doing so may require us to incur costs despite limited visibility toward future business declines.
In periods of weak demand, we may be required to reduce costs while maintaining the ability to motivate and retain key employees at the same time. Additionally, to remain competitive, we must also continually invest in research and development, which may inhibit our ability to reduce costs in a down cycle. Long product lead-times create a risk that we may purchase or manufacture inventories of products that we are unable to sell.
During a period of increasing demand and rapid growth, we must be able to increase manufacturing capacity quickly. Our inability to quickly increase production in response to a surge in demand could prompt customers to look for alternative sources of supply or leave our customers without a supply, both of which events could harm our reputation and make it difficult for us to retain our existing customers or to obtain new customers.
In periods of weak demand, we may be required to reduce costs while maintaining the ability to motivate and retain key employees at the same time. Additionally, to remain competitive, we must continually invest in research and development, which may inhibit our ability to reduce costs in a down cycle. Long product lead-times create a risk that we may purchase or manufacture inventories of products that we are unable to sell.
The success of our business depends on our ability to continuously innovate and to manage transitiontransitions to new product innovations.
Technology requirements in our markets are constantly advancing. We must continually introduce new products that meet evolving customer needs. Our ability to grow depends on the successful development, introduction and market acceptance of new or enhanced products that address our customer’scustomers’ requirements. Developing new technology is a complex and uncertain process requiring us to accurately anticipate technological and market trends and meet those trends with responsivethe right products. Additionally, this requires that we manage the transition from older products to minimize disruption in customer ordering patterns, avoid excess inventory and ensure adequate supplies of new products. Failure to develop new products, failed market acceptance of new products or problems associated with new product transitions could harm our business.
10
If we fail to introduce new products in a timely manner, we may lose market share and be unable to achieve revenue growth targets.
Our research and development efforts may not lead to the successful introduction of products within the time frame that our customers demand. Our competitors may introduce new or improved products, processes or technologies that make our current or proposed products obsolete or less competitive. We may encounter delays or problems in connection with our research and development efforts. Product development delays may result from numerous factors, including:
|
|
changing product specifications and customer requirements;
inability to manufacture new products cost effectively;
|
|
difficulties in reallocating engineering resources and overcoming resource limitations;
|
|
changing market or competitive product requirements; and
|
|
unanticipated engineering complexities.
New products often take longer to develop, may have fewer features than originally considered desirable, and have higher costs than initially estimated. There may be difficulty in sourcing components for new products and delays in starting volume production. New products may also not be commercially successful. Any of these adverse developments could harm our business and our results of operations.
Customer order timing and other factors beyond our control may cause our operating results to fluctuate from period to period.
Changes in customer order timing and the existence of certain other factors beyond our control may cause our operating results to fluctuate from period to period. Such factors include:
|
|
fluctuations in our customers’ businesses;
|
|
timing and recognition of revenues from customer orders;
|
|
timing and market acceptance of new products or enhancements introduced by us or our competitors;
|
|
availability of parts from our suppliers and the manufacturing capacity of our subcontractors;
|
|
decisions by customers to reduce their purchases of our products;
|
|
changes in the prices of our products or of our competitors’ products; and
|
|
fluctuations in foreign currency exchange rates.
We may receive several large orders in one quarter from a customer and then receive no orders from that customer in the next quarter. As a result, the timing of revenue recognition from customer orders can cause significant fluctuations in our operating results from quarter to quarter. In addition, our sales are reactive to changes in our customers’ businesses. For instance, a customer that placed a large order in one period could subsequently experience a downturn in business and, as a result, could cancel an order or reduce the amount of products it purchases from us in future periods.
A delay in a shipment near the end of a reporting period due to rescheduling or cancellation by customers or unexpected production delays experienced by us may cause revenue in the period to decline significantly and may have a material adverse effect on our operationsoperating results for that period.
We cannot predict how the market will react to new products introduced by us or to enhancements made to our existing products. If any of our new or enhanced products contain defects or perceived defects or have reliability, quality or compatibility problems or perceived problems, or if our competitors release similar products or enhancements at the same time that are more widely accepted by our customers, our revenue and results of operations for one or more reporting periods could be adversely affected.
In addition, we or our competitors may raise or lower the prices of products in response to market demands or competitive pressures. If we lower the prices of our products, or if our competitors lower the prices of their products such that demand for our products weakens, our revenue for one or more quarters may decline and our operating results would be adversely affected. Changes in foreign currency exchange rates can also cause significant fluctuations in our results of operations from quarter to quarter.
As a result of these factors, our results of operations for any quarter are not necessarily indicative of results to be expected in future periods.
11
If we experience a significant disruption in, or breach in security of, our information technology systems, our business may be adversely affected.
We rely on information technology systems throughout the Company to manage orders, process shipments to customers, manage inventory levels and maintain financial, customer and employee information. Certain events could result in the disruption of our systems, including power outages, computer attacks by hackers, viruses, catastrophes, hardware and software failures and other unforeseen events. If we were to experience a significant period of system disruption in information technology systems that involve our interactions with customers or suppliers, it could result in the loss of revenue and customers as well as significant response and significant incrementalmitigation costs, which couldwould adversely affect our business. In addition, security breaches of our information technology systems could result in the misappropriation or unauthorized
disclosure of confidential information belonging to us or to our employees, partners, customers or suppliers, which could result in significant financial or reputational damage to us.us, as well as litigation, regulatory enforcement action, or other liability risks that could lead to substantial damages, fines, penalties and legal costs. The regulatory environment with regard to cybersecurity, privacy and data protection issues is increasingly challenging and may impact the Company’s business, including increased risk, costs and expanded compliance obligations. In particular, as we increase our presence in the European Union, our operations will increasingly be subject to the European Union’s new General Data Protection Regulation, effective in May 2018, which will impose a host of new data privacy and security requirements on companies doing business in the European Union and substantial penalties for non-compliance.
As we transact a portion of our sales, and maintain significant cash balances, in foreign currencies, changes in interest rates, credit ratings or foreign currency rates could have a material adverse effect on our financial position, results of operations, and cash flows.
A portion of our revenue is derived from our European and Asian operations and includeincludes transactions in Euros, British Pounds and Japanese Yen, while our products are mainly manufactured in the United States, United Kingdom, Germany and China. In the event of a decline in the value of the Euro, British Pounds or Japanese Yen, or British Pound, we would typically experience a decline in our revenues and profit margins. If we increase the selling prices on our products sold in Europe and JapanAsia in order to maintain profit margins and recover costs, we may lose customer sales to lower cost competitors.
Additionally, balances maintained in foreign currencies create additional financial exposure to changing foreign currency rates. If foreign currency rates were to change rapidly, we could incur material losses. While we use foreign currency contracts and other risk management techniques to hedge our foreign currency exposure, we cannot be certain that our efforts will be adequate to protect us against significant foreign currency fluctuations or that such efforts will not expose us to additional exchange rate risks.
Our reliance on international operations in foreign countries subjects us to risks not typically faced by companies operating exclusively in the United States.
During the year ended December 31, 2015,2017, approximately 59%58% of our revenues from continuing operations were derived from operations and customers outside of the United States. The scope of our international operations subjects us to risks which could materially impact our results of operations, including:
|
|
foreign exchange rate fluctuations;
|
|
increases in shipping costs;
|
|
longer customer payment cycles;
|
|
greater difficulty in collecting accounts receivable;
|
|
use of incompatible systems and equipment;
|
|
problems with staffing and managing foreign operations in diverse cultures;
|
|
protective tariffs;
|
|
|
|
|
|
|
|
|
|
|
|
We cannot predict whether the United States or any other country will impose new quotas, tariffs, taxes or other trade barriers uponand export/import controls;
transportation delays and interruptions;
increased vulnerability to the importationtheft of, and reduced protection for, intellectual property rights;
government currency control and restrictions, delays, penalties or exportationrequired withholdings on repatriation of our products or supplies or gauge earnings;
the effect that new barriers would have on our financial position or resultsimpact of operations.recessionary foreign economies; and
natural disasters and acts of terrorism.
12
We also are subject to risks that our operations outside the United States could be conducted by our employees, contractors, service providers, representatives or agents in ways that violate the Foreign Corrupt Practices Act or other similar anti-bribery laws. Any such violations could have a negative impact on our business and could result in government investigations and/or injunctive, monetary or other penalties. Moreover, we face additional risks that our anti-bribery policy and procedures may be violated by third-party sales representatives or other agents that help sell our products or provide other services, because suchservices. Such representatives or agents are not our employees and it may be more difficult to oversee their conduct.
Increased outsourcing of components manufacturing to manufacturers outside the United States leads to additional risks whichthat could negatively impact our business.
We are increasingly outsourcing the manufacture of subassemblies to suppliers based in China and elsewhere overseas in order to reduce our manufacturing cost. However, economic, political or trade problems with foreign countries could substantially impact our
ability to obtain critical parts needed in the timely manufacture of our products.products, or could substantially increase the costs of these parts. Additionally, this practice increases our vulnerability to the theft of, and reduced protection for, our intellectual property.
Our global operations are subject to extensive and complex import and export rules that vary among the legal jurisdictions in which we operate. Failure to comply with these rules could result in substantial penalties.
Due to the international scope of our operations, we are subject to a complex system of import and export related laws and regulations, including U.S. export control and customs regulations and customs regulations of other countries. These regulations are complex and vary among the legal jurisdictions in which we operate. Any alleged or actual failure to comply with such regulations may subject us to government scrutiny, investigation and civil and criminal penalties, and may limit our ability to import or export our products or to provide services outside the United States. Any of these penalties could have a material impact on our financial position, results of operations and cash flows. Additionally, the United Kingdom is likely to implement new import and export rules as part of the process of exiting the European Union. There will likely be new costs of compliance associated with such rules, as well as the additional risk of penalties for failure to comply.
The United Kingdom’s plan for withdrawal from the European Union and the actions of the current U.S. government may have a negative effect on global economic conditions, financial markets and our business, which could reduce the price of our common shares.
We are a multinational company with worldwide operations, including business operations and investments in the United Kingdom, Europe, Germany and China. In March 2017, Prime Minister Theresa May of the United Kingdom formally began the process of withdrawing the United Kingdom from the European Union, following the June 2016 referendum in which a majority of voters in the United Kingdom supported such withdrawal. The terms of the withdrawal are subject to a negotiation period that could last at least until March 2019. The announcement has created significant uncertainty about the future relationship between the United Kingdom and the European Union, and has given rise to calls for the governments of other European Union member states to consider withdrawal. If the United Kingdom and the European Union are unable to negotiate acceptable withdrawal terms or if other European Union member states pursue withdrawal, barrier-free access between the United Kingdom and other European Union member states or among the European economic area overall could be diminished or eliminated. These developments in turn may inhibit our sales of products, mobility of our personnel, and our access to capital.
The policies of the current U.S. government regarding U.S. trade, tax and health care policies, among other things, have led to substantial uncertainty in global financial markets. The current U.S. government has withdrawn the United States from the Trans-Pacific Partnership trade agreement, is attempting to re-negotiate North American Free Trade Agreement (“NAFTA”) and has made various comments suggesting the possible re-negotiation of, or withdrawal from, other trade agreements and the potential imposition of new import barriers. The current U.S. government has also enacted comprehensive tax law reform, which may result in additional tax on payments to foreign subsidiaries, limitations on tax deductions for interest expenses, or changes in foreign income taxation for multinational companies. The current U.S. government has also attempted to repeal the U.S. Patient Protection and Affordable Care Act (the “PPACA”), and may continue to seek repeal of the PPACA. These developments and the lack of clarity regarding future U.S. tax, trade and health care policies have created significant uncertainty that could have a material adverse effect on global economic conditions and the stability of global financial markets. Any major changes in these policies could have a material adverse effect on our business, financial condition and results of operations and reduce the price of our common shares. Because of the global nature of our business, and our strategy to increase our sales to the medical market, our business may be particularly impacted by any major changes in U.S. trade, tax and health care policies.
Others may violate our intellectual property rights and cause us to incur significant costs to protect our rights.
Our future success depends in part upon our intellectual property rights, including trade secrets, know-how and continuing technological innovation. We do not have personnel dedicated to the oversight, organization and management of our intellectual property. There can be no assurance that the steps we take to protect our intellectual property rights will be adequate to prevent
13
misappropriation or disclosure. It is possible that, despite our efforts, other parties may use, obtain or try to copy our technology and products. There can be no assurance that other companies are not investigating or developing other technologies that are similar to ours, that any patents will be issued from any application filed by us, or that, if patents are issued, the claims allowed will be sufficient to deter or prohibit others from marketing similar products. In addition, our patents may be challenged, invalidated or circumvented in a legal or administrative proceeding. Policing unauthorized use of our intellectual property rights is difficult and time consuming and may involve initiating claims or litigation against third parties for infringement of our proprietary rights, which could be costly.
Our efforts to protect our intellectual property rights against infringement may not be effective in some foreign countries where we operate or sell our products. If we fail to adequately protect our intellectual property in these countries, we may lose significant business to our competitors.
Our operating results would suffer if we are unable to successfully defend against infringement claims of infringement by third parties.
We have received in the past, and could receive in the future, notices from third parties alleging that our products infringe patent or other proprietary rights. These allegations could result in significant costs and diversion of the attention of management. In the event that any third party makes a valid claim against us or our customers and a license is not available to us on commercially reasonable terms, our operating results would be adversely affected. Adverse consequences may also apply if we fail to avoid litigation for infringement or misappropriation of proprietary rights of third parties. If a successful claim were brought against us and we are found to infringehave infringed a third party’sthird-party’s intellectual property rights, we could be required to pay substantial amounts for damages or be enjoined from using the technology deemed to be infringing, or from using, making or selling products deemed to be infringing. If we have supplied infringing products to third parties, we may be obligated to indemnify these third parties for any damages that they may be required to pay to the patent holder and for any losses that they may sustain as a result of the infringement.
We operate in highly competitive industries and, if we lose competitive advantages, our business would suffer adverse consequences.
Some of our competition comes from established competitors that have greater financial, engineering, manufacturing and marketing resources than we do. Our competitors will continue to improve the design and performance of their existing products and introduce new products. It is possible that we may not successfully differentiate our current and proposed products from the products of our competitors, or that the marketplace will not consider our products to be superior to competing products. To remain competitive, we will be required to invest heavily in research and development, marketing and customer service and support. However, we may not be able to make the necessary technological advances to maintain our competitive position and our products may not receive market acceptance. These factors would cause us not to be able to compete successfully in the future. Increased competition may also result in price reductions, reduced profit margins, loss of market share and an inability to generate cash flows that are sufficient to maintain or expand our new product development of new products.programs.
Our results of operations will be adversely affected if we fail to successfully integrate future acquisitions into our business or to grow the acquired businesses.
As part of our business strategy, we expect to broaden our product and service offerings by acquiring businesses, technologies, assets and product lines that, we believe, complement or expand our existing businesses. WeIn recent years, we have made a number of acquisitions, including the acquisitions of W.O.M. World of Medicine GmbH and Laser Quantum Limited in 2017, and we expect to continue to
make acquisitions.acquisitions in the future. We may fail to successfully identify appropriate acquisition candidates or integrate acquisitionsacquired businesses, products, technologies or personnel into our businessbusinesses and, as a result, may fail to realize the synergies, cost savings and other benefits expected from the acquisitions. If we are not able to successfully achieve these objectives, the anticipated benefits of such acquisitions may not be realized fully or at all, and our results of operations could be adversely affected. As a result of the number of recent and expected future acquisitions in a relatively short amount of time, these risks may be heightened due to limited resources available to integrate these new businesses.
Further, our ability to maintain and increase profitability of an acquired business will depend on our ability to manage and control operating expenses and to generate and sustain increased levels of revenue. Our expectations to achieve more consistent and predictable levels of revenue and to increase profitability as a result of any acquisition may not be realized. Such revenues and profitability may even decline as we integrate operations into our business.businesses. If revenues of acquired businesses grow more slowly than we anticipate or decline, or if their operating expenses are higher than we expect, we may not be able to sustain or increase their profitability, in which case our financial condition will suffer and our stock price could decline. For example, reductions in orders by a customer within our Visualization Solutions product line have caused our revenues in that business in 2013, 2014 and 2015 to be lower than we had expected when we acquired the business. Moreover, our acquisition activities may divert management’s attention from our regular operations. Managing a larger and more geographically dispersed operation and product portfolio could also pose challenges for our management team. In addition, through our acquisitions, we may assume liabilities, losses or costs for which we are not indemnified or insured or for which our indemnity or insurance is inadequate. Any such liabilities may have a material adverse effect on our financial position or results of operations.
Our business strategy may include making strategic divestitures. There can be no assurance that any divestitures will provide business benefit.14
Our business strategy includes divesting certain non-core businesses. We sold certain assets and liabilities of our Laser Systems businesses in October 2012, our Semiconductor Systems business in May 2013, our Scientific Lasers business in July 2014, and our JK Lasers business in April 2015. There may be additional sales of other non-core businesses in the future. The divestiture of an existing business could reduce our future profits and operating cash flows and make our financial results more volatile. A divestiture could also cause a decline in the price of our common shares and increased reliance on other elements of our core business operations. If we do not successfully manage the risks associated with a divestiture, our business, financial condition, and results of operations could be adversely affected. In addition, there could be other negative unforeseen effects from a divestiture. We also may not find suitable purchasers for our non-core businesses and may continue to pay operating costs associated with these businesses. Failed attempts to divest non-core businesses may distract management’s attention from other business activities, erode employee morale and customers’ confidence, and harm our business.
If we do not attract and retain our key personnel, our ability to execute our business strategy will be limited.
Our success depends, to a significant extent, upon the continued service of our executive officers, key management and technical personnel, particularly our experienced engineers, and upon our ability to continue to attract, retain, and motivate qualified personnel. The competition for these employees is intense. The loss of the services of one or more of our key personnel could have a material adverse effect on our operating results. In addition, there could be a material adverse effect on us should the turnover rates for engineers and other key personnel increase significantly or if we are unable to continue to attract qualified personnel.
Our success also depends on our ability to execute leadership succession plans. The inability to successfully transition key management roles could have a material adverse effect on our operating results.
We have undertaken restructuring and realignment activities in the past, and we will continue to assess our operating structure in the future. These actions may not improve our financial position, and may ultimately prove detrimental to our operations and sales.
We have undertaken restructuring and realignment activities in the past, and we will continue to assess our operating structure in the future. Our ability to reduce operating expenses is dependent upon the nature of the actions we take to reduce expenses and our subsequent ability to implement those actions and realize expected cost savings. We may need to take additional restructuring actions, such as eliminating or consolidating certain of our facilities or operations, reducing our headcount, or eliminating certain positions for a variety of reasons, including deterioration in global economic conditions or significant declines in demand for our products. Failure to successfully implement such restructuring activities could adversely affect our ability to meet customer demand for our products and could increase the cost of production versus our projections, both of which could adversely impact our operating results. Further, expenses and cost inefficiencies associated with our restructuring activities, including severance costs and the loss of trained employees with knowledge of our business and operations, could exceed our expectations and negatively impact our financial results. The elimination or consolidation of operations could also result in restructuring charges that would adversely affect our results of operations and financial condition.
Product defects or problems with integrating our products with other vendors’ products may seriously harm our business and reputation.
We produce complex products that can contain latent defects or performance problems. This could happen to both existing and new products. Such defects or performance problems could be detrimental to our business and reputation.
In addition, customers frequently integrate our products with other vendors’ products. When problems occur in a combined environment, it may be difficult to identify the source of the problem. These problems may cause us to incur significant warranty and repair costs, divert the attention of our engineering personnel from our product development efforts, and cause significant customer relationship issues.
Disruptions in the supply of certain key components and other goods from our suppliers, including limited or single source suppliers, could have an adverse effect on the results of our business operations, and could damage our relationships with customers.
The production of our products requires a wide variety of raw materials, key components and other goods that are generally available from alternate sources of supply. However, certain critical raw materials, key components and other goods required for the production and sale of some of our principal products are available from limited or single sources of supply. If the receipt of certain limited source or single source materials is delayed, our relationship with customers may be harmed if such delays cause us to miss our scheduled shipment deadlines. Certain of our businesses buy components, including limited or sole source items, from competitors of our other businesses, and certain of our businesses sell products to customers that compete with certain other segments of our business. This dynamic may adversely impact our relationship with these suppliers and customers. For example, these suppliers could increase the price of those components or reduce their supply of those components to us. Similarly, these customers could elect to manufacture products to meet their own requirements rather than purchasing products from us. Our businesses may be adversely affected by our other business relationships with customers and suppliers. Our current or alternative sources may not be able to continue to meet all of our demands on a timely basis. If suppliers or subcontractors experience difficulties or fail to meet any of our manufacturing requirements, our business would be harmed until we are able to secure alternative sources, if any, on commercially reasonable terms. A prolonged inability to obtain certain raw materials, key components or other goods is possible and could have a significant adverse effect on our business operations, damage our relationships with customers, or even lead to permanent loss of customer orders.
In addition, certain of our businesses buy components, including limited or sole source items, from competitors of our other businesses. This dynamic may adversely impact our relationship with these suppliers. For example, these suppliers could increase the price of those components or reduce their supply of those components to us, which could have a significant adverse effect on our business operations or lead to permanent loss of customer orders.
If we fail to accurately forecast component and raw material requirements for our products, we could incur additional costs and experience significant delays in shipments, which could have an adverse effect on the results of our business operations, and could damage our relationships with customers.
We use rolling forecasts based on anticipated product orders to determine our production requirements. It is important that we accurately predict both the demand for our products and the lead times required to obtain the necessary components and raw materials
15
to manufacture our products. Lead times for components and raw materials that we order vary significantly and depend on factors including the specific supplier requirements, the size of the order, contract terms and current market demand. For substantial increases in our sales levels of certain products, some of our suppliers may need significant lead time. If we overestimate our component and raw material requirements, we may have excess inventory, which would increase our costs. If we underestimate our component and raw material requirements, we may have inadequate inventory, which could interrupt and delay delivery of our products to customers. Any of these occurrences could adversely affect our results of operations and damage our relationships with customers.
Production difficulties and product delivery delays or disruptions could have a material adverse effect on our business.
We assemble our products at our facilities in the United States, the United Kingdom, Germany and China. Each of our products is typically manufactured in a single manufacturing location. If production activities at any of our manufacturing facilities were disrupted by a natural disaster or otherwise, our operations would be negatively impacted until we could establish alternative production and service operations. Significant production difficulties could be the result of:
|
|
mistakes made while transferring manufacturing processes between locations;
|
|
changing process technologies;
|
|
ramping production;
|
|
installing new equipment at our manufacturing facilities;
|
|
implementing new information technology systems;
|
|
shortage of key components; and
|
|
loss of electricity or employees’ access to the manufacturing facilities due to natural disasters.
In addition, we may experience product delivery delays in the future. We ship a significant portion of our products to our customers through independent package delivery and import/export companies. We also ship our products through national trucking firms, overnight carrier services and local delivery practices. If one or more of the package delivery or import/export providers experience significant disruption in services or institutes a significant price increase, the delivery of our products could be disrupted or delayed. Such events could cause us to incur increased shipping costs that could not be passed on to our customers, negatively impacting our profitability and our relationships with customers.
We are subject to regulations by various federal, stateextensive and foreign agencies that require usdynamic medical device regulation, which may impede or hinder the approval or sale of our products and, in some cases, may ultimately result in an inability to comply with a wide varietyobtain approval of regulations, including those regardingcertain products or may result in the manufacturerecall or seizure of previously approved products.
Some of our products and the shipping of our products.
Certain medical devices that we manufacturerelated sales and marketing development activities and manufacturing processes are subject to regulationsextensive and rigorous regulation by the U.S. Food and Drug Administration (the “FDA”) pursuant to the Federal Food, Drug, and similar international agencies. These regulations govern a wide variety of product activities,Cosmetic Act (the “FDCA”), by comparable agencies in foreign countries, and by other regulatory agencies and governing bodies. Under the FDCA, medical devices must receive FDA clearance or approval or an exemption from design and development to labeling,
manufacturing, promotion, sales and distribution. Ifsuch clearance or approval before they can be commercially marketed in the U.S. In the European Union, we failare required to comply with applicable medical device directives (including the Medical Devices Directive) and to obtain CE Mark certification in order to market medical devices. The CE Mark is applied following approval from an independent notified body or declaration of conformity. The process of obtaining marketing approval or clearance from the FDA or by comparable agencies in foreign countries for new products, or with respect to enhancements or modifications to existing products, could:
take a significant period of time;
require the expenditure of substantial resources;
involve rigorous pre-clinical and clinical testing, as well as increased post-market surveillance;
require changes to products; and
result in limitations on the indicated uses of products.
In addition, exported devices are subject to the regulatory requirements of each country to which the device is exported. Some countries do not have medical device regulations, but in most foreign countries, medical devices are regulated. Most countries outside of the U.S. require that product approvals be renewed or recertified on a regular basis, generally every four to five years. The renewal or recertification process requires that we evaluate any device changes and any new regulations or standards relevant to the device and conduct appropriate testing to document continued compliance. Where renewal or recertification applications are required, they may need to be renewed and/or approved in order to continue selling our products in those countries. There can be no assurance that we
16
will receive the required approvals for new products or modifications to existing products on a timely basis or that any approval will not be subsequently withdrawn or conditioned upon extensive post-market study requirements.
In addition, on April 5, 2017, the European Parliament passed the Medical Devices Regulation (the “MDR”) which repeals and replaces the EU Medical Devices Directive. Unlike directives, which must be implemented into the national laws of the European Economic Area (the “EEA”) member states, the regulations are directly applicable (i.e., without the need for adoption of EEA member state laws implementing them) in all EEA member states and are intended to eliminate current differences in the regulation of medical devices among EEA member states. The MDR, among other things, is intended to establish a uniform, transparent, predictable and sustainable regulatory framework across the EEA for medical devices and in vitro diagnostic devices and ensure a high level of safety and health while supporting innovation. The MDR will however only become applicable three years after publication. Once applicable, the new regulations will among other things:
strengthen the rules on placing devices on the market and reinforce surveillance once they are available;
establish explicit provisions on manufacturers’ responsibilities for the follow-up of the quality, performance and safety of devices placed on the market;
improve the traceability of medical devices throughout the supply chain to the end-user or patient through a unique identification number;
set up a central database to provide patients, healthcare professionals and the public with comprehensive information on products available in the European Union; and
strengthen rules for the assessment of certain high-risk devices, such regulations, weas implants, which may have to recall productsundergo an additional check by experts before they are placed on the market.
We face uncertainties as the MDR is rolled out and cease their manufactureenforced by the European Commission and distribution, which would increase our costsEEA competent authorities, creating risks in several areas including the CE Marking process and reduce our revenues.data transparency in the upcoming years.
In recent years, theThe FDA and other worldwide regulatory agencies actively monitor compliance with local laws and regulations through review and inspection of design and manufacturing practices, recordkeeping, reporting of adverse events, labeling and promotional practices. The FDA can ban certain medical industry has undergone significant changes indevices; detain or seize adulterated or misbranded medical devices; order to reduce healthcare costs. This includes cuts in Medicare, consolidationrepair, replacement or refund of these devices; and require notification of healthcare distribution companiesprofessionals and collective purchasing arrangements by office-based healthcare practitioners. Foreignothers with regard to medical devices that present unreasonable risks of substantial harm to the public health. The FDA can take action against a company that promotes "off-label" uses. The FDA may also enjoin and domestic governments have also undertaken efforts to control healthcare costs through legislation and regulation. In March 2010, President Obama signed into law health care reform legislation in the formrestrain a company for certain violations of the U.S. Patient ProtectionFDCA and Affordable Care Act (the “PPACA”). Manyregulations pertaining to medical devices, or initiate action for criminal prosecution of such violations. Any adverse regulatory action, depending on its magnitude, may restrict a company from effectively marketing and selling its products, may limit a company's ability to obtain future premarket clearances or approvals, and could results in a substantial modification to the impactscompany's business practices and operations. International sales of the PPACA will not be known until those regulations are enacted over the next several years. The implementation of health care reform and medical cost containment measuresdevices manufactured in the U.S. that are not approved by the FDA for use in the U.S., or that are banned or deviate from lawful performance standards, are subject to FDA export requirements.
Regulations regarding the development, manufacture and sale of medical devices are evolving and subject to future change. We cannot predict what impact, if any, those changes might have on our business. Failure to comply with regulatory requirements could have a material adverse effect on our business, financial condition and results of operations. Later discovery of previously unknown problems with a product or manufacturer could result in fines, delays or suspensions of regulatory clearances or approvals, seizures or recalls of products, physician advisories or other field actions, operating restrictions and/or criminal prosecution. We may also initiate field actions as a result of a failure to strictly comply with our internal quality policies. The failure to receive product approval clearance on a timely basis, suspensions of regulatory clearances, seizures or recalls of products, physician advisories or other field actions, or the withdrawal of product approval by the FDA or by comparable agencies in foreign countries in which we operate could:could have a material adverse effect on our business, financial condition and results of operations.
|
|
|
|
|
|
Changes in governmental regulation ofregulations related to our business or our products could reduce demand for our products or increase our expenses.
We are subject to many governmental regulations, including but not limited to the laser radiation safety regulations of the Radiation Control for Health and Safety Act administered by the National Center for Devices and Radiological Health, a branch of the U.S. Food and Drug Administration, and certain health regulations related to the manufacture of products using beryllium, an element used in some of our products. Among other things, these regulations require us to file annual reports, to maintain quality control and sales records, to perform product testing, to distribute appropriate operating manuals, to conduct safety reviews, to incorporate design and operating features in products sold to end-users and to certify and label our products. Depending on the class of the product, various warning labels must be affixed and certain protective devices must be installed.
17
We are also subject to regulatory oversight, including comparable enforcement remedies, in the markets we serve. We compete in many markets in which we and our customers must comply with federal, state, local and international regulations, such as environmental, health and safety and food and drug regulations. We develop, configure and market our products to meet customer needs created by those regulations. Any significant changechanges in these regulations could reduce demand for our products or increase our expenses, which in turn could adversely affect our business, financial condition, results of operations and cash flows.
Conflict minerals regulations will cause us to incur additional expenses and could limit the supply and increase the cost of certain metals used in manufacturing our products.
In August 2012, the Securities and Exchange Commission adopted rules requiring disclosures by public companies concerning tin, tantalum, tungsten and gold (collectively known as “conflict minerals”) that are necessary to the functionality or production of products manufactured or contracted to be manufactured. The rules require companies to perform due diligence, disclose and report whether or not such minerals originate from the Democratic Republic of Congo or any of the adjoining countries. There are, and will be, costs associated with complying with the disclosure requirements, such as costs related to determining the source of certain minerals used in our products, as well as costs of possible changes to processes or sources of supply as a consequence of such verification activities. As our supply chain is complex, we may not be able to sufficiently verify the origins of the relevant minerals used in our products through the due diligence procedures that we implement, which may harm our reputation. In addition, we may encounter challenges to satisfy those customers who require that all of the components of our products be certified as conflict-free, which could place us at a competitive disadvantage if we are unable to do so.
Compliance or the failure to comply with current and future environmental regulations could cause us significant expense.
Our operations are subject to a variety of federal, state, local and international environmental regulations relating to the use, storage, discharge and disposal of hazardous chemicals used during our manufacturing process or requiring design changes orthe recycling of products we manufacture. We are subject to the federal regulation of the Environmental Protection Agency in the United States and comparable authorities in other countries. If we fail to comply with any present or future regulations, we could be subject to regulatory fines.
Future developments, administrative actions or liabilities relating to environmental matters could have a material adverse effect on our business, results of operations or financial condition. It is difficult to anticipate how such regulations will be implemented and enforced. We continue to evaluate the necessary steps for compliance with regulations as they are enacted. Certain regulations may
require us to re-design our products to ensure compliance with the applicable standards. These redesigns may adversely affect the performance of our products, add greater testing lead-times for product introductions and reduce our profitability.
If we fail to implement new information technology systems successfully, our business could be adversely affected.
We rely on various centralized information systems throughout the Company to keep financial records, process orders, manage inventory, process shipments to customers, and operate other critical functions. We are in the process of upgrading our information technology infrastructure, including implementing new enterprise resource planning (ERP) systems and other complementary information technology systems. We have invested, and will continue to invest, significant capital and human resources in the upgrades and new ERP systems. Any disruptions, delays or deficiencies in the transition, design and implementation of the upgrades and new ERP systems, particularly any disruptions, delays or deficiencies that impact our operations, could have a material adverse effect on our results of operations and cash flows.
We may experience difficulties as we transition to these new upgraded systems and processes, including loss of data and the ability to process customer orders, ship products, provide services and support to our customers, bill and track our customers,issue sales invoices, collect accounts receivable, fulfill contractual obligations, conductsatisfy internal and external financial reporting and file SEC reportsrequirements in a timely manner, or otherwise run our business. We may also experience decreases in productivity as our personnel implement these systems and become familiar with the new systems. In addition, as we are dependent upon our ability to gather and promptly transmit accurate information to key decision makers, our business, results of operations and financial condition may be materially and adversely affected if our information technology infrastructure does not allow us to transmit accurate information, even for a short period of time. Furthermore, the transition, design and implementation of upgrades and new ERP systems may be much more costly than we anticipated.
Our results of operations will be adversely affected if we fail to realize the full value of our intangible assets.
As of December 31, 2015, our total assets included $169.72017, we had $366.0 million of net intangible assets, including goodwill.goodwill, on our consolidated balance sheet. Net intangible assets consist principally of goodwill, customer relationships, patents, trademarks, core technologies and technology licenses. Goodwill and indefinite-lived intangible assets are tested for impairment at least on an annual basis. All other intangible assets are evaluated for impairment should discrete events occur that call into question the recoverability of the intangible assets.
Adverse changes in our business, adverse changes in the assumptions used to determine the fair value of our reporting units, or the failure to grow our businesses may result in an impairment of our intangible assets, which could adversely affect our results of operations. For example, the Company recorded a non-cash impairment charge of $41.4 million in the consolidated financial statements for the year ended December 31, 2014 as a result of lower expectations for revenue and operating profit from our NDS business.
We are exposed to the credit risk of some of our customers and to credit exposures in weakened markets, which could adversely affect our results of operations.
Customers with liquidity issues may lead to additional bad debt expense. There can be no assurance that our open credit customers will pay the amounts they owe to us or that the reserves we maintain will be adequate to cover such credit exposures. In addition, to the extent that turmoil in the credit markets makesor increases in interest rates make it more difficult for some customers to obtain financing, their ability to pay may be adversely impacted. Our customers’ failure to pay and/or our failure to maintain sufficient reserves could have a material adverse effect on our future operating resultscash flows and financial condition.
18
Our reliance upon third party distribution channels subjects us to credit, inventory, business concentration, and business failure risks beyond our control.
We sell many of our products through resellers, distributors, and system integrators. As these third parties tend to have more limited financial resources than OEM and end-user customers, they generally represent sources of increased credit risk. Any downturn in the business of our resellers, distributors, and systems integrators would in turn harm our results of operations and financial condition.
Our sales also depend upon the ability of our OEM customers to develop and sell systems that incorporate our products. Adverse economic conditions, large inventory positions, limited marketing resources and other factors influencing these OEM customers could have a substantial adverse effect on our financial results. We cannot assure investors that our OEM customers will not experience financial or other difficulties that could adversely affect their operations and, in turn, adversely affect our results of operations and financial condition.
We may be subject to U.S. federal income taxation even though Novanta Inc. is a non-U.S. corporation.
Novanta, Inc. is a holding company organized in Canada and is subject to Canadian tax laws. However, we are also subject to U.S. tax rules and file U.S. federal income tax returns for our operations in the United States. In addition, distributions or payments from entities in one jurisdiction to entities in another jurisdiction may be subject to income and/or withholding taxes. We do not intend to operate in a manner that will cause Novanta, Inc. to be treated as engaged in a U.S. trade or business or otherwise be subject to U.S. federal income taxes on its income, but it generally will be subject to U.S. federal withholding tax on certain U.S.-sourced passive income items, such as dividends and certain types of interest.
Tax audits by tax authorities could adversely affect future results.
We are subject to regular examination of our income tax returns by the Internal Revenue Service (“IRS”) and other tax authorities. We regularly assess the likelihood of favorable or unfavorable outcomes resulting from these examinations to determine the adequacy of our provision for income taxes. Although we believe our tax estimates are reasonable, there can be no assurance that any final determination will not be materially different than the treatment reflected in our historical income tax provisions and accruals, which could materially and adversely affect our financial condition, net income and earnings per share.
Our effective tax rate is subject to fluctuation, which could impact our financial position and earnings per share.
Our effective tax rate is subject to fluctuation as the effective income tax rate for each year is a function of (a) taxable income levels in numerous tax jurisdictions, (b) our ability to utilize recordedrecognized deferred tax assets, (c) taxes, interest, or penalties resulting from tax audits and, (d) credits and deductions as a percentage of total taxable income. From time to time, the United States, foreign and state governments make substantive changes to tax rules where significant judgment is required to determine the impact of such changes on our provision for income taxes.taxes, which may result in increased costs. Further, such tax law changes may cause our effective tax rate to fluctuate between periods.
We may be subject to U.S. federal income taxation even though GSIG is a non-U.S. corporation.
GSI Group, Inc. is a holding company organized in Canada and is subject to Canadian tax laws. However, we are subject to U.S. tax rules and file U.S. federal income tax returns for our operations in the United States. In addition, distributions or payments from entities in one jurisdiction to entities in another jurisdiction may be subject to withholding taxes. We do not intend to operate in a manner that will cause GSI Group, Inc. to be treated as engaged in a U.S. trade or business or otherwise be subject to U.S. federal income taxes on its income, but it generally will be subject to U.S. federal withholding tax on certain U.S.-sourced passive income items, such as dividends and certain types of interest.
Risks Relating to Our Common Shares and Our Capital Structure
We may require additional capital to adequately respond to business challenges or opportunities and repay or refinance our existing indebtedness, andbut this capital may not be available on acceptable terms or at all.
We may require additional capital to adequately respond to future business challenges or opportunities, including, but not limited to, the need to develop new products or enhance our existing products, maintaining or expanding research and development projects, the need to build inventory or to invest other cash to support business growth, and opportunities to acquire complementary businesses and technologies.
As of December 31, 2015,2017, we had outstanding debt of $97.5$237.8 million under the amended and restated senior secured credit agreement (the “Amended“Second Amended and Restated Credit Agreement”) and $105.0$175.5 million available to be drawn under the revolving credit facility. If we are unable to satisfy the conditions in the Second Amended and Restated Credit Agreement or our needs exceed the amounts available under the revolving credit facility, we may need to engage in equity or debt financings to obtain additional funds. If we raise additional funds through further issuances of equity or convertible debt securities, our existing shareholders could suffer significant dilution. Any new equity securities we issue could have rights, preferences and privileges superior to those of the holders of our common shares. Further, our Second Amended and Restated Credit Agreement restricts our ability to obtain additional debt financing from other sources. If we are unable to obtain adequate financing or obtain financing on terms satisfactory to us when we require it, our ability to continue to support our business growth and to respond to business challenges could be significantly
19
limited. In addition, the terms of any additional equity or debt issuances may adversely affect the value and price of our common shares.
Global credit conditions have varied widely over the last several years and could continue to vary significantly in the future. Although these conditions have not affected our current plans, adverse credit conditions in the future could have a negative impact on our ability to execute on future strategic activities.initiatives.
Our existing indebtedness could adversely affect our future business, financial condition and results of operations.
As of December 31, 2017, we had $237.8 million of outstanding debt. This level of debt could have significant consequences on our future operations, including:
reducing the availability of our cash flow to fund working capital, capital expenditures, research and development efforts, acquisitions and other general corporate purposes, and limiting our ability to obtain additional financing for these purposes;
limiting our flexibility in planning for or reacting to, and increasing our vulnerability to, changes in our business, changes in the general economic environment, and market changes in the industries in which we operate; and
placing us at a competitive disadvantage compared to our competitors that have less debt or are less leveraged.
Any of these factors could have an adverse effect on our business, financial condition and results of operations.
In addition, our Second Amended and Restated Credit Agreement contains covenants that will limit our ability to engage in activities that may be in our long-term best interests. Our failure to comply with those covenants could result in an event of default which, if not cured or waived, could result in the acceleration of all of our borrowings thereunder.
The market price for our common shares may be volatile.
The market price of our common shares could be subject to wide fluctuations. These fluctuations could be caused by:
|
|
quarterly variations in our results of operations;
|
|
changes in earnings estimates by analysts;
conditions in the markets we serve; or
|
|
general market or economic conditions.
In addition, the stock market has experienced extreme price and volume fluctuations in recent years. These fluctuations have had a substantial effect on the market prices of many companies, often unrelated to the operating performance of the specific companies. These market fluctuations could adversely affect the price of our common shares.
We may not have access to the cash flow and other assets of our subsidiaries that may be needed to service our indebtedness and fund our operations.
Although much of our business is conducted through our subsidiaries, none of our subsidiaries are obligated to make funds available to us. Local laws and regulations and/or the terms of our indebtedness may restrict certain of our subsidiaries from paying dividends and otherwise transferring assets to us. We cannot assure you that applicable laws and regulations and/or the terms of our indebtedness will permit our subsidiaries to provide us with sufficient dividends, distributions or loans when necessary. Therefore, our ability to make payments on our indebtedness and fund our operations may be adversely affected if our subsidiaries cannot distribute funds to us.
Certain significant shareholders could have substantial influence over our Board of Directors and our outstanding common shares, which could limit our other shareholders’ ability to influence the outcome of key transactions.
Our largest shareholders and their respective affiliates, in the aggregate, beneficially own a substantial amount of our outstanding common shares. As a result, these shareholders may be able to influence matters requiring approval by our shareholders, including the election of directors and the approval of mergers, or other extraordinary transactions. One of these shareholders also serves on our Board of Directors and therefore could have a substantial influence over our Board of Directors. These significant shareholders may have interests that differ from other shareholders and may vote in a way that may be adverse to the interests of other shareholders.
Certain provisions of our articles of incorporation may delay or prevent a change in control of the Company.
Our corporate documents and our existence as a corporation under the laws of New Brunswick subject us to provisions of Canadian law that may enable our Board of Directors to resist a change in control of the Company. These provisions include:
|
|
limitations on persons authorized to call a special meeting of shareholders;
|
|
the ability to issue an unlimited number of common shares; and
|
|
advance notice procedures required for stockholders to nominate candidates for election as directors or to bring matters before an annual meeting of shareholders.
20
These anti-takeover defenses could discourage, delay or prevent a transaction involving a change in control of the Company. These provisions could also discourage proxy contests and make it more difficult for shareholders to elect directors of their choosing and cause us to take other corporate actions that shareholders desire. In addition, under New Brunswick law, provides that cumulative voting is mandatory in director elections which can result in stockholders holding less than a majority of shares being able to elect persons to the Board of Directors and prevent a majority stockholder from controlling the election of all of the directors.
Our existing indebtedness could adversely affect our future business, financial condition and results of operations.
As of December 31, 2015, we had $97.5 million of outstanding debt. This level of debt could have significant consequences on our future operations, including:
|
|
|
|
|
|
Any of the above-listed factors could have an adverse effect on our business, financial condition and results of operations.
In addition, our Amended and Restated Credit Agreement contains covenants that will limit our ability to engage in activities that may be in our long-term best interests. Our failure to comply with those covenants could result in an event of default which, if not cured or waived, could result in the acceleration of all of our borrowings thereunder.
Risks Relating to Our Internal Controls
If we fail to maintain appropriate internal controls in the future, we may not be able to report our financial results accurately, which may adversely affect our stock price and our business.
While our management and our independent registered public accounting firm concluded that our internal control over financial reporting was effective as of December 31, 2015,2017, it is possible that material weaknesses may be identified in the future.
If we are unable to maintain effective internal controls, we may not have adequate, accurate or timely financial information, and we may be unable to meet our reporting obligations as a publicly traded company or to comply with the requirements of the SEC or the Sarbanes-Oxley Act of 2002. This could result in a restatement of our financial statements, the imposition of sanctions, including the inability of registered broker dealers to make a market in our common shares, or investigation by regulatory authorities. Any such action or other negative results caused by our inability to meet our internal control and financial reporting requirements or to comply with legal and regulatory requirements or by disclosure of an accounting, reporting or control issue could adversely affect the trading price of our securitiescommon stock and our business. Material weaknesses in our internal control over financial reporting could also reduce our ability to obtain financing or could increase the cost of any financing we obtain.
As part of our growth strategy, we may make additional acquisitions of privately held businesses. Prior to becoming part of our consolidated company, the acquired business would not be required to implement or maintain the disclosure controls and procedures or internal control over financial reporting that are required of public companies. We are required to integrate the acquired businesses into our consolidated company’s system of disclosure controls and procedures and internal control over financial reporting, but we cannot provide assurance as to how long the integration process may take for our recently acquired businessbusinesses or any businessbusinesses that we may acquire in the future. Additionally, we may need to improve our internal control or those of any business we acquire and may be required to design enhanced processes and controls in order to make such improvements. This could result in significant costs to us and could require us to divert substantial resources, including management time, from other activities.
Item 1B. Unresolved Staff Comments
None.
21
The principal owned and leased properties of the Company and its subsidiaries as of December 31, 20152017 are listed in the table below.
Location |
| Principal Use |
| Current |
| Approximate |
| Owned/Leased |
Bedford, Massachusetts, USA |
| Manufacturing, R&D, Marketing, Sales and Administration |
| 1,2,3,4 |
| 147,000 |
| Leased; expires in 2019 |
San Jose, California, USA |
|
Manufacturing, R&D, Marketing, Sales and Administration |
|
2 |
|
73,000 |
|
Leased; expires in 2019 |
Mukilteo, Washington, USA |
|
Manufacturing, R&D, Marketing, Sales and Administration |
|
1 |
|
63,000 |
|
Owned |
North Syracuse, New York, USA |
|
Manufacturing, R&D, Marketing, Sales and Administration |
|
2 |
|
55,000 |
|
Leased; expires in 2029 |
Suzhou, People’s Republic of China |
|
Manufacturing, R&D, Marketing, Sales and Administration |
|
1,2,3 |
|
55,000 |
|
Leased; expires in 2018 |
Poole, United Kingdom |
|
Manufacturing, R&D, Marketing, Sales and Administration |
|
3 |
|
51,000 |
|
Building owned; land leased through 2078 |
Phoenix, Arizona, USA |
| Manufacturing, R&D, Marketing, Sales and Administration |
|
1 |
|
31,000 |
|
Owned |
Chatsworth, California, USA |
|
Manufacturing, R&D, Marketing, Sales and Administration |
|
2 |
|
22,000 |
|
Owned |
Location |
| Principal Use |
| Current |
| Approximate |
| Owned/Leased |
Bedford, Massachusetts, United States |
| Manufacturing, R&D, Marketing, Sales and Administration |
| Photonics, Precision Motion & Corporate |
| 147,000 |
| Leased; expires in 2019 |
Ludwigsstadt, Germany |
|
Manufacturing |
|
Vision |
|
100,000 |
|
Owned |
San Jose, California, United States |
|
Manufacturing, R&D, Marketing, Sales and Administration |
|
Vision |
|
73,000 |
|
Leased; expires in 2019 |
Mukilteo, Washington, United States |
|
Manufacturing, R&D, Marketing, Sales and Administration |
|
Photonics |
|
63,000 |
|
Owned |
North Syracuse, New York, United States |
|
Manufacturing, R&D, Marketing, Sales and Administration |
|
Vision |
|
55,000 |
|
Leased; expires in 2029 |
Suzhou, People’s Republic of China |
|
Manufacturing, R&D, Marketing, Sales and Administration |
|
Photonics, Vision & Precision Motion |
|
55,000 |
|
Leased; expires in 2018 |
Poole, United Kingdom |
|
Manufacturing, R&D, Marketing, Sales and Administration |
|
Precision Motion |
|
51,000 |
|
Building owned; land leased through 2078 |
Berlin, Germany |
|
R&D, Marketing, Sales and Administration |
|
Vision |
|
50,000 |
|
Leased; expires in 2021 |
Phoenix, Arizona, United States |
|
Manufacturing, R&D, Marketing, Sales and Administration |
|
Photonics |
|
31,000 |
|
Owned |
Manchester, United Kingdom |
|
Manufacturing, R&D, Marketing, Sales and Administration |
|
Photonics |
|
31,000 |
|
(1) |
Loomis, California, United States |
|
Manufacturing, R&D, Marketing, Sales and Administration |
|
Precision Motion |
|
23,000 |
|
Leased; expires in 2018 |
Taunton, United Kingdom |
|
Manufacturing, R&D, Marketing and Sales |
|
Photonics |
|
19,000 |
|
Leased; expires in 2018 |
Location |
| Principal Use |
| Current |
| Approximate |
| Owned/Leased |
|
|
|
|
|
|
|
|
|
|
|
|
|
|
|
In connection with our senior credit facility, we entered into open ended deeds of trust for our properties in Orlando, Florida, Chatsworth, California and Mukilteo, Washington.
A portion of our leased facility in San Jose, California is currently underutilized.under-utilized. As of December 31, 2015,2017, the Company was in process of exiting a portionhad exited approximately 22,000 square feet of this facility.
Additional research and development, sales, service and logistics sites are located in Arizona, California, Florida, Oregon and Colorado, (U.S.);United States; Munich, Reichenbach and Konstanz, Germany; the Breda, and Zevenhuizen, the Netherlands; Brno, Czech Republic; Tokyo, Japan; Beijing, Shenzhen and Hong Kong, China; Monza, Italy and Sri Lanka.Milan, Italy. These additional offices are leased facilities occupying approximately 90,000100,000 square feet in the aggregate, and are related to our Laser Products,Photonics, Vision Technologies and Precision Motion segments. As of December 31, 2015, the Company was in the process of exiting leased facilities in Zevenhuizen, Netherlands totaling 18,300 square feet and Sri Lanka totaling 6,500 square feet. The Company will need to continue to pay for the leased facilities in Zevenhuizen, Netherlands until November 2017 and Sri Lanka until March 2016.
Our owned facility in Orlando, Florida and our leased facilities in Lexington, Massachusetts were restructured and are not in use by the Company. These owned and leased facilities constitute approximately 80,000 and 33,000 square feet, respectively. In May 2013, we entered into a sublease agreement for our Lexington facility through December 2016.
In connection with the sale of our Scientific Lasers business, we assigned to the buyer the lease for a facility in California, where the Scientific Lasers business operated. The buyer assumed all of our rights and obligations under the original lease, including the duty to pay the rent for the remainder term of the lease. So long as the buyer performs its obligations as the tenant, as required by the Asset
22
and Equity Purchase Agreement for its acquisition of the Scientific Lasers business, the Company has no responsibilities for the lease. Should the buyer cease performance under the lease, however, the landlord could still pursue the Company as the original tenant until February 28, 2019, the end of the lease term. The Company has indemnification rights against the buyer under the Asset and Equity Purchase Agreement for such buyer’s default.
The Company is subject to various legal proceedings and claims that arise in the ordinary course of business. The Company does not believe that the outcome of these claims will have a material adverse effect upon its financial condition or results of operations but there can be no assurance that any such claims, or any similar claims, would not have a material adverse effect upon its financial condition or results of operations.
Item 4. Mine Safety Disclosures
Not applicable.
23
Item 5. Market for Registrant’s Common Shares, Related Stockholder Matters and Issuer Purchases of Equity Securities
Market Information
The Company’s common shares, no par value, are traded on the NASDAQNasdaq Global Select MarketMarket. Prior to May 12, 2016, the Company’s shares were traded under the trading symbol “GSIG”. Since May 12, 2016, the Company’s shares have been traded under the symbol “NOVT”. The following table sets forth the high and low prices of the Company’s common shares during the periods indicated.
| 2015 |
|
| 2014 |
| 2017 |
|
| 2016 |
| ||||||||||||||||||||
| High |
|
| Low |
|
| High |
|
| Low |
| High |
|
| Low |
|
| High |
|
| Low |
| ||||||||
First Quarter | $ | 14.47 |
|
| $ | 12.27 |
|
| $ | 13.05 |
|
| $ | 10.33 |
| $ | 27.50 |
|
| $ | 20.90 |
|
| $ | 14.16 |
|
| $ | 11.73 |
|
Second Quarter | $ | 15.75 |
|
| $ | 13.15 |
|
| $ | 13.60 |
|
| $ | 11.92 |
| $ | 38.00 |
|
| $ | 26.10 |
|
| $ | 16.00 |
|
| $ | 13.90 |
|
Third Quarter | $ | 15.05 |
|
| $ | 12.08 |
|
| $ | 12.97 |
|
| $ | 11.29 |
| $ | 43.60 |
|
| $ | 36.45 |
|
| $ | 17.39 |
|
| $ | 15.02 |
|
Fourth Quarter | $ | 14.59 |
|
| $ | 12.81 |
|
| $ | 14.87 |
|
| $ | 11.15 |
| $ | 54.75 |
|
| $ | 43.70 |
|
| $ | 21.40 |
|
| $ | 16.80 |
|
Holders
As of the close of business on February 26, 2016,23, 2018, there were approximately 3633 holders of record of the Company’s common shares. Since many of the common shares are registered in “nominee” or “street” names, the Company believes that the total number of beneficial owners is considerably higher.
Dividend Policy
The Company has never declared or paid cash dividends on its common shares and does not anticipate paying any cash dividends in the foreseeable future.
Purchases of Equity Securities by the Issuer and Affiliated Purchaser
In October 2013, the Company’s Board of Directors authorized a share repurchase plan for the repurchase of up to an aggregate of $10.0 million of the Company’s common stock. The share repurchase plan does not obligate the Company to acquire any particular amount of our common stock. No time limit was set for the completion of the share repurchase program, and the program may be suspended or discontinued at any time.
The following table sets forth certain information with respect to repurchasesSince the adoption of the Company’sshare repurchase plan, the Company repurchased 296 thousand shares of our common stock for an aggregate purchase price of $4.2 million at an average price of $14.05 per share. No repurchases occurred during the periods indicated.quarter ended December 31, 2017. The Company had $5.8 million available for share repurchases under the authorized share repurchase plan as of December 31, 2017.
24
Period |
| Total Number of Shares Purchased |
|
| Average Price Paid per Share |
|
| Total Number of Shares Purchased as Part of Publicly Announced Plans or Programs(1) |
|
| Approximate Dollar Value that May Yet Be Purchased Under the Plans or Programs |
| ||||
October 3 - October 30, 2015 |
|
| — |
|
| $ | — |
|
|
| — |
|
| $ | 8,477,236 |
|
October 31 - November 27, 2015 |
|
| 45,923 |
|
| $ | 13.71 |
|
|
| 45,923 |
|
| $ | 7,847,481 |
|
November 27 - December 31, 2015 |
|
| — |
|
| $ | — |
|
|
| — |
|
| $ | 7,847,481 |
|
Total |
|
| 45,923 |
|
| $ | 13.71 |
|
|
| 45,923 |
|
|
|
|
|
(1) The Company has repurchased 172,423 shares of its common stock pursuant to the share repurchase program since its adoption. |
| |||||||||||||||
The following graph compares the cumulative total return to stockholders foron the Company’s common shares with the cumulative total return on the Nasdaq Composite Index and the Russell 2000 Index for the period from December 31, 20102012 through December 31, 2015 with the NASDAQ Composite Index, the S&P Technology Index and the Russell 2000 Index.2017. The comparison assumes an investment of $100 is made on December 31, 20102012 in the Company’s common shares and in each of the indices and, in the case of the indices, it also assumes reinvestment of all dividends. The performance shown is not necessarily indicative of future performance.
The Company intends to remove the S&P Technology Index as its comparable published industry index due to a shift in the Company’s business, primarily an increase in medical market revenues. The Company’s revenues to medical end markets represented approximately 40% of total revenues for the year ended December 31, 2015. For comparative and historical purposes, the Company has included the total returns and performance of the S&P Technology Index in the table below.
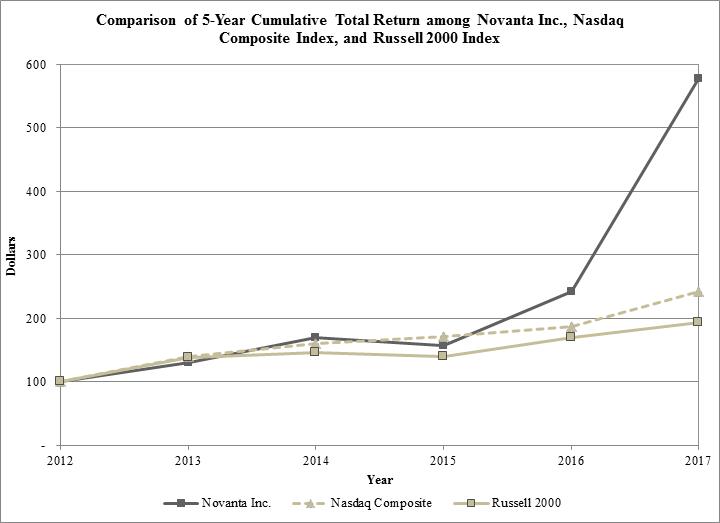
| December 31, 2010 |
|
| December 31, 2011 |
|
| December 31, 2012 |
|
| December 31, 2013 |
|
| December 31, 2014 |
|
| December 31, 2015 |
| ||||||
GSI Group Inc. | $ | 100.00 |
|
| $ | 96.69 |
|
| $ | 81.85 |
|
| $ | 106.24 |
|
| $ | 139.13 |
|
| $ | 128.73 |
|
NASDAQ Composite Index | $ | 100.00 |
|
| $ | 99.17 |
|
| $ | 116.48 |
|
| $ | 163.21 |
|
| $ | 187.27 |
|
| $ | 200.31 |
|
S&P Technology Index (1) | $ | 100.00 |
|
| $ | 95.59 |
|
| $ | 109.59 |
|
| $ | 135.61 |
|
| $ | 154.48 |
|
| $ | 158.78 |
|
Russell 2000 Index (2) | $ | 100.00 |
|
| $ | 95.82 |
|
| $ | 111.49 |
|
| $ | 154.78 |
|
| $ | 162.35 |
|
| $ | 155.18 |
|
| December 31, 2012 |
|
| December 31, 2013 |
|
| December 31, 2014 |
|
| December 31, 2015 |
|
| December 31, 2016 |
|
| December 31, 2017 |
| ||||||
Novanta Inc. | $ | 100.00 |
|
| $ | 129.79 |
|
| $ | 169.98 |
|
| $ | 157.27 |
|
| $ | 242.49 |
|
| $ | 577.37 |
|
Nasdaq Composite Index | $ | 100.00 |
|
| $ | 140.12 |
|
| $ | 160.78 |
|
| $ | 171.97 |
|
| $ | 187.22 |
|
| $ | 242.71 |
|
Russell 2000 Index (1) | $ | 100.00 |
|
| $ | 138.82 |
|
| $ | 145.62 |
|
| $ | 139.19 |
|
| $ | 168.85 |
|
| $ | 193.64 |
|
(1) |
|
| Copyright © Russell Investments |
25
ItemItem 6. Selected Financial Data
The selected financial data set forth below is not necessarily indicative of results of future operations, and should be read in conjunction with “Management’s Discussion and Analysis of Financial Condition and Results of Operations” in Item 7 and the
consolidated financial statements and related notes thereto in Item 8 of this Annual Report on Form 10-K to fully understand factors that may affect the comparability of the information presented below. The selected consolidated financial data in this section is not intended to replace the consolidated financial statements.
The consolidated statements of operations data for the years ended December 31, 2015, 20142017, 2016 and 20132015 and the consolidated balance sheet data as of December 31, 20152017 and 20142016 are derived from our audited consolidated financial statements in this Annual Report on Form 10-K. The consolidated statements of operations data for the years ended December 31, 20122014 and 20112013 and the consolidated balance sheet data as of December 31, 2013, 20122015, 2014 and 20112013 are derived from our audited consolidated financial statements that are not included in this Annual Report on Form 10-K.
| Year Ended December 31, |
| Year Ended December 31, |
| ||||||||||||||||||||||||||||||||||
| 2015 |
|
| 2014 |
|
| 2013 |
|
| 2012 |
|
| 2011 |
| 2017 (1) |
|
| 2016 |
|
| 2015 |
|
| 2014 |
|
| 2013 |
| ||||||||||
| (In thousands, except per share data) |
| (In thousands, except per share data) |
| ||||||||||||||||||||||||||||||||||
Consolidated Statements of Operations Data: |
|
|
|
|
|
|
|
|
|
|
|
|
|
|
|
|
|
|
|
|
|
|
|
|
|
|
|
|
|
|
|
|
|
|
|
|
|
|
Revenue | $ | 373,598 |
|
| $ | 364,706 |
|
| $ | 316,910 |
|
| $ | 243,796 |
|
| $ | 269,697 |
| $ | 521,290 |
|
| $ | 384,758 |
|
| $ | 373,598 |
|
| $ | 364,706 |
|
| $ | 316,910 |
|
Gross profit |
| 157,890 |
|
|
| 150,167 |
|
|
| 132,227 |
|
|
| 105,518 |
|
|
| 119,559 |
|
| 220,531 |
|
|
| 162,452 |
|
|
| 157,890 |
|
|
| 150,167 |
|
|
| 132,227 |
|
Operating expenses |
| 128,957 |
|
|
| 166,973 |
|
|
| 112,781 |
|
|
| 85,256 |
|
|
| 81,213 |
|
| 163,336 |
|
|
| 129,889 |
|
|
| 128,957 |
|
|
| 166,973 |
|
|
| 112,781 |
|
Operating income (loss) from continuing operations |
| 28,933 |
|
|
| (16,806 | ) |
|
| 19,446 |
|
|
| 20,262 |
|
|
| 38,346 |
|
| 57,195 |
|
|
| 32,563 |
|
|
| 28,933 |
|
|
| (16,806 | ) |
|
| 19,446 |
|
Income (loss) from continuing operations before income taxes (1) (2) |
| 46,022 |
|
|
| (17,915 | ) |
|
| 16,177 |
|
|
| 16,702 |
|
|
| 26,553 |
| |||||||||||||||||||
Income (loss) from continuing operations before income taxes (2) (3) (4) |
| 76,134 |
|
|
| 32,522 |
|
|
| 46,022 |
|
|
| (17,915 | ) |
|
| 16,177 |
| |||||||||||||||||||
Income tax provision (benefit) |
| 10,394 |
|
|
| (1,006 | ) |
|
| 6,200 |
|
|
| (11,595 | ) |
|
| 2,136 |
|
| 13,827 |
|
|
| 10,519 |
|
|
| 10,394 |
|
|
| (1,006 | ) |
|
| 6,200 |
|
Income (loss) from continuing operations |
| 35,628 |
|
|
| (16,909 | ) |
|
| 9,977 |
|
|
| 28,297 |
|
|
| 24,417 |
|
| 62,307 |
|
|
| 22,003 |
|
|
| 35,628 |
|
|
| (16,909 | ) |
|
| 9,977 |
|
Income (loss) from discontinued operations, net of tax |
| (13 | ) |
|
| (5,607 | ) |
|
| (2,054 | ) |
|
| (10,974 | ) |
|
| 4,584 |
| |||||||||||||||||||
Gain (loss) on disposal of discontinued operations, net of tax (4) |
| — |
|
|
| (1,726 | ) |
|
| (592 | ) |
|
| 2,255 |
|
|
| — |
| |||||||||||||||||||
Loss from discontinued operations, net of tax |
| — |
|
|
| — |
|
|
| (13 | ) |
|
| (5,607 | ) |
|
| (2,054 | ) | |||||||||||||||||||
Loss on disposal of discontinued operations, net of tax (5) |
| — |
|
|
| — |
|
|
| — |
|
|
| (1,726 | ) |
|
| (592 | ) | |||||||||||||||||||
Consolidated net income (loss) |
| 35,615 |
|
|
| (24,242 | ) |
|
| 7,331 |
|
|
| 19,578 |
|
|
| 29,001 |
|
| 62,307 |
|
|
| 22,003 |
|
|
| 35,615 |
|
|
| (24,242 | ) |
|
| 7,331 |
|
Less: Net income attributable to noncontrolling interest |
| — |
|
|
| (10 | ) |
|
| (22 | ) |
|
| (40 | ) |
|
| (28 | ) |
| (2,256 | ) |
|
| — |
|
|
| — |
|
|
| (10 | ) |
|
| (22 | ) |
Net income (loss) attributable to GSI Group Inc. | $ | 35,615 |
|
| $ | (24,252 | ) |
| $ | 7,309 |
|
| $ | 19,538 |
|
| $ | 28,973 |
| |||||||||||||||||||
Earnings (loss) per common share from continuing operations: |
|
|
|
|
|
|
|
|
|
|
|
|
|
|
|
|
|
|
| |||||||||||||||||||
Net income (loss) attributable to Novanta Inc. | $ | 60,051 |
|
| $ | 22,003 |
|
| $ | 35,615 |
|
| $ | (24,252 | ) |
| $ | 7,309 |
| |||||||||||||||||||
Earnings (loss) per common share from continuing operations (6): |
|
|
|
|
|
|
|
|
|
|
|
|
|
|
|
|
|
|
| |||||||||||||||||||
Basic | $ | 1.03 |
|
| $ | (0.49 | ) |
| $ | 0.29 |
|
| $ | 0.84 |
|
| $ | 0.73 |
| $ | 1.14 |
|
| $ | 0.63 |
|
| $ | 1.03 |
|
| $ | (0.49 | ) |
| $ | 0.29 |
|
Diluted | $ | 1.02 |
|
| $ | (0.49 | ) |
| $ | 0.29 |
|
| $ | 0.84 |
|
| $ | 0.73 |
| $ | 1.13 |
|
| $ | 0.63 |
|
| $ | 1.02 |
|
| $ | (0.49 | ) |
| $ | 0.29 |
|
Earnings (loss) per common share from discontinued operations: |
|
|
|
|
|
|
|
|
|
|
|
|
|
|
|
|
|
|
| |||||||||||||||||||
Loss per common share from discontinued operations: |
|
|
|
|
|
|
|
|
|
|
|
|
|
|
|
|
|
|
| |||||||||||||||||||
Basic | $ | (0.00 | ) |
| $ | (0.21 | ) |
| $ | (0.08 | ) |
| $ | (0.26 | ) |
| $ | 0.14 |
| $ | — |
|
| $ | — |
|
| $ | (0.00 | ) |
| $ | (0.21 | ) |
| $ | (0.08 | ) |
Diluted | $ | (0.00 | ) |
| $ | (0.21 | ) |
| $ | (0.08 | ) |
| $ | (0.26 | ) |
| $ | 0.13 |
| $ | — |
|
| $ | — |
|
| $ | (0.00 | ) |
| $ | (0.21 | ) |
| $ | (0.08 | ) |
Earnings (loss) per common share attributable to GSI Group Inc.: |
|
|
|
|
|
|
|
|
|
|
|
|
|
|
|
|
|
|
| |||||||||||||||||||
Earnings (loss) per common share attributable to Novanta Inc. (6): |
|
|
|
|
|
|
|
|
|
|
|
|
|
|
|
|
|
|
| |||||||||||||||||||
Basic | $ | 1.03 |
|
| $ | (0.70 | ) |
| $ | 0.21 |
|
| $ | 0.58 |
|
| $ | 0.87 |
| $ | 1.14 |
|
| $ | 0.63 |
|
| $ | 1.03 |
|
| $ | (0.70 | ) |
| $ | 0.21 |
|
Diluted | $ | 1.02 |
|
| $ | (0.70 | ) |
| $ | 0.21 |
|
| $ | 0.58 |
|
| $ | 0.86 |
| $ | 1.13 |
|
| $ | 0.63 |
|
| $ | 1.02 |
|
| $ | (0.70 | ) |
| $ | 0.21 |
|
Weighted average common shares outstanding—basic |
| 34,579 |
|
|
| 34,352 |
|
|
| 34,073 |
|
|
| 33,775 |
|
|
| 33,481 |
|
| 34,817 |
|
|
| 34,694 |
|
|
| 34,579 |
|
|
| 34,352 |
|
|
| 34,073 |
|
Weighted average common shares outstanding—diluted |
| 34,827 |
|
|
| 34,352 |
|
|
| 34,396 |
|
|
| 33,936 |
|
|
| 33,589 |
|
| 35,280 |
|
|
| 34,914 |
|
|
| 34,827 |
|
|
| 34,352 |
|
|
| 34,396 |
|
(1) | In 2017, the Company completed the acquisitions of WOM, Laser Quantum and ThingMagic businesses, which contributed a total of $102.7 million in revenues for the year ended December 31, 2017. The operating results of these businesses have been included in the consolidated statement of operations since their respective acquisition dates. |
(2) | In 2014, the Company recorded an impairment charge of $41.4 million |
|
|
|
|
| The Company sold its Scientific Lasers business in 2014 and its Semiconductor Systems business in 2013 and |
(6) | In the computation of earnings per common share from continuing operations and earnings per common share attributable to Novanta Inc., income from continuing operations and net income attributable to Novanta Inc. included a $20.2 million adjustment of redeemable noncontrolling interest to estimated redemption value for the year ended December 31, 2017. |
December 31, |
| ||||||||||||||||||
| 2017 (1) |
|
| 2016 |
|
| 2015 |
|
| 2014 |
|
| 2013 |
| |||||
| (in thousands) |
| |||||||||||||||||
Consolidated Balance Sheet Data: |
|
|
|
|
|
|
|
|
|
|
|
|
|
|
|
|
|
|
|
Cash and cash equivalents | $ | 100,057 |
|
| $ | 68,108 |
|
| $ | 59,959 |
|
| $ | 51,146 |
|
| $ | 60,980 |
|
Total assets (2) |
| 726,703 |
|
|
| 425,637 |
|
|
| 416,045 |
|
|
| 396,294 |
|
|
| 375,916 |
|
Debt, current (2) |
| 9,119 |
|
|
| 7,366 |
|
|
| 7,385 |
|
|
| 7,345 |
|
|
| 7,306 |
|
Debt, long-term (2) |
| 225,500 |
|
|
| 70,554 |
|
|
| 88,426 |
|
|
| 105,030 |
|
|
| 61,303 |
|
Long-term liabilities, excluding debt |
| 44,567 |
|
|
| 25,717 |
|
|
| 25,965 |
|
|
| 25,951 |
|
|
| 10,917 |
|
Redeemable noncontrolling interest (3) |
| 46,923 |
|
|
| — |
|
|
| — |
|
|
| — |
|
|
| — |
|
Total stockholders’ equity |
| 311,545 |
|
|
| 258,870 |
|
|
| 244,701 |
|
|
| 210,825 |
|
|
| 241,984 |
|
| December 31, |
| |||||||||||||||||
| 2015 |
|
| 2014 |
|
| 2013 |
|
| 2012 |
|
| 2011 |
| |||||
| (in thousands) |
| |||||||||||||||||
Consolidated Balance Sheet Data: |
|
|
|
|
|
|
|
|
|
|
|
|
|
|
|
|
|
|
|
Cash and cash equivalents | $ | 59,959 |
|
| $ | 51,146 |
|
| $ | 60,980 |
|
| $ | 65,788 |
|
| $ | 54,835 |
|
Total assets (1) |
| 416,045 |
|
|
| 396,294 |
|
|
| 375,916 |
|
|
| 333,711 |
|
|
| 345,731 |
|
Debt, current (1) |
| 7,385 |
|
|
| 7,345 |
|
|
| 7,306 |
|
|
| 7,270 |
|
|
| 9,662 |
|
Debt, long-term (1) |
| 88,426 |
|
|
| 105,030 |
|
|
| 61,303 |
|
|
| 38,982 |
|
|
| 55,566 |
|
Long-term liabilities, excluding debt |
| 25,965 |
|
|
| 25,951 |
|
|
| 10,917 |
|
|
| 11,308 |
|
|
| 22,440 |
|
Total GSI Group Inc. stockholders’ equity |
| 244,701 |
|
|
| 210,825 |
|
|
| 241,984 |
|
|
| 227,809 |
|
|
| 209,003 |
|
(1) | In 2017, the Company completed the acquisitions of WOM, Laser Quantum and ThingMagic businesses. Total assets acquired amounted to $284.4 million as of the acquisition date. The acquisitions were financed with borrowings under the revolving credit facility in an aggregate amount of $176.8 million. See Note 3 to the accompanying Consolidated Financial Statements. |
| In April 2015, the Financial Accounting Standards Board issued Accounting Standards Update (“ASU”) 2015-03, “Simplifying the Presentation of Debt Issuance Costs.” ASU 2015-03 requires debt issuance related costs to be presented in the balance sheet as a direct reduction to the carrying amount of the associated debt liability. The Company adopted the provisions of ASU 2015-03 during 2015. |
(3) | In 2017, the Company acquired an additional approximately 35% of the outstanding shares of Laser Quantum, which increased our ownership position in Laser Quantum from approximately 41% to approximately 76%. The noncontrolling interest is considered a redeemable equity instrument and is presented as temporary equity on the |
27
Item 7. Management’s Discussion and Analysis of Financial Condition and Results of Operations
Management’s Discussion and Analysis of Financial Condition and Results of Operations (“MD&A”) should be read in conjunction with the Consolidated Financial Statements and Notes included in Item 8 of this Annual Report on Form 10-K. The MD&A contains certain forward looking statements within the meaning of the United States Private Securities Litigation Reform Act of 1995, Section 27A of the Securities Act of 1933, as amended, and Section 21E of the Securities Exchange Act of 1934, as amended. In addition to historical financial information, the following discussion and analysis contains forward looking statements that involve risks, uncertainties and assumptions. These forward looking statements include, but are not limited to, our belief that the Purchasing Managers Index (PMI) may provide an indication of the impact of general economic conditions on our sales into the advanced industrial end market; our strategy; anticipated financial performance; expected liquidity and capitalization; drivers of revenue growth;growth and our growth expectations in various markets; management’s plans and objectives for future operations, expenditures and product development, and investments in research and development; expectations regarding our acquisitions of WOM, Laser Quantum and ThingMagic; business prospects; potential of future product releases;releases and expansion of our product and service offerings in general; anticipated revenue performance; industry trends; market conditions; our competitive positions; changes in economic and political conditions; changes in accounting principles; changes in actual or assumed tax liabilities; expectations regarding tax exposures; anticipated impact from the recently enacted Tax Reform Act in the U.S.; anticipated reinvestment of future earnings;earnings and dividend policy; anticipated expenditures in regard to the Company’s benefit plans; future acquisitions and dispositions and anticipated benefits from acquisitions; anticipated use of currency hedges; ability to repay our indebtedness; our intentions regarding the use of cash; expectations regarding legal and regulatory environmental requirements and our compliance thereto; and other statements that are not historical facts. These forward looking statements are neither promises nor guarantees, but involve risks and uncertainties that may cause actual results to differ materially from those contained in the forward looking statements. Our actual results could differ materially from those anticipated in these forward looking statements as a result of various important factors, including those set forth in Item 1A of this Annual Report on Form 10-K under the heading “Risk Factors.” The words “anticipates,” “believes,” “expects,” “intends,” “future,” “could,” “estimates,” “plans,” “would,” “should,” “potential,” “continues,” and similar words or expressions (as well as other words or expressions referencing future events, conditions or circumstances) identify forward looking statements. Readers should not place undue reliance on any such forward looking statements, which speak only as of the date they are made. Management and the Company disclaim any obligation to publicly update or revise any such statement to reflect any change in its expectations or in events, conditions, or circumstances on which any such statements may be based, or that may affect the likelihood that actual results will differ from those contained in the forward looking statements.statements, except as required under applicable law.
Business Overview
GSI GroupNovanta Inc. and its subsidiaries (collectively referred to as, the “Company”, “Novanta”, “we”, “us”, “our”) design, develop, manufacture and sell precision photonic and motion control components and subsystems to Original Equipment Manufacturers (OEM’s) in the medical equipmentis a global supplier of core technology solutions that give healthcare and advanced industrial original equipment manufacturers (“OEMs”) a competitive advantage. We combine deep proprietary technology markets. Our highly engineered enabling technologies include laser sources, laser scanningexpertise and beam delivery products, optical data collection and machinecompetencies in photonics, vision technologies, medical visualization and informatics solutions, and precision motion control products. We specialize in collaborating with OEM customersa proven ability to adaptsolve complex technical challenges. This enables us to engineer core components and sub-systems that deliver extreme precision and performance, tailored to our component and subsystem technologies to deliver highly differentiated performance in theircustomers' demanding applications.
End Markets
We primarily operate in two end markets: the advanced industrial market and the medical market.
Advanced Industrial Market
For the year ended December 31, 2017, the advanced industrial market accounted for approximately 50% of the Company’s revenue. Revenue from our products sold to the advanced industrial market is affected by a number of factors, including changing technology requirements and preferences of our customers, productivity or quality investments in a manufacturing environment, the financial condition of our customers, changes in regulatory requirements and laws, and general economic conditions. We believe that the Purchasing Managers Index (PMI) on manufacturing activities specific to different regions around the world may provide an indication of the impact of general economic conditions on our sales into the advanced industrial market.
Medical Market
For the year ended December 31, 2017, the medical market accounted for approximately 50% of the Company’s revenue. Our revenue from products sold to the medical market is generally affected by hospital and other health care provider capital spending, changes in regulatory requirements and laws, aggregation of purchasing by healthcare networks, trends in surgical procedures, changes in technology requirements, changes in customer or patient preferences, and general demographic trends.
28
Our strategy is to drive sustainable, profitable growth through short-term and long-term initiatives, including:
|
|
disciplined focus on our diversified business model of providing functionality to long life-cycle OEM customer platforms in attractive medical and advanced industrial niche markets;
improving our business mix to increase medical sales as a percentage of total revenue by:
| - | introducing new products aimed at attractive medical applications, such as minimally invasive and robotic surgery, ophthalmology, patient monitoring, drug delivery, |
| - | deepening our key account management relationships with and driving cross selling of our |
| - | pursuing complementary medical technology acquisitions; |
|
|
increasing our penetration of high growth advanced industrial applications, such as laser materials processing, robotics, automation and metrology, by working closely with OEM customers to launch application specific products that closely match the requirements of each application;
|
|
broadening our portfolio of enabling proprietary technologies and capabilities through increased investment in new product development, expanded sales and marketing channels to reach target customers, and investments in application development to further penetrate existing customers, while expanding the applicability of our solutions to new markets;
| broadening our product and service offerings through the acquisition of innovative and complementary technologies and solutions in |
|
|
|
|
Significant Events and Updates
Acquisition of Skyetek
On December 18, 2015, the Company acquired all assets and certain liabilities of Skyetek, Inc. (“Skyetek”), a Denver, Colorado-based provider of embedded and standalone RFID Solutions for medical OEM’s, for a total purchase price of $2.8 million, subject to customary working capital adjustments. This total purchase price includes $2.6 million in cash paid for the acquisition and $0.2 million in estimated fair value of future contingent consideration payable upon the achievement of certain sales order commitment targets from October 2015 through June 2017. The undiscounted range of contingent consideration is zero to $0.3 million. Skyetek specializes in high-performing HF and UHF RFID technologies that maximize efficiency and visibility for OEM’s serving the medical and advanced industrial markets.technology applications, including increasing our recurring revenue streams such as services, spare parts and consumables;
improving our existing operations to expand profit margins and improve customer satisfaction by implementing lean manufacturing principles and strategic sourcing across our major production sites; and
attracting, retaining, and developing world-class talented and motivated employees.
Significant Events and Updates
Amendment to Second Amended and Restated Credit Agreement
On August 1, 2017, we entered into an amendment (the “Third Amendment”) to the second amended and restated credit agreement, dated as of May 19, 2016 (the “Second Amended and Restated Credit Agreement”). The acquisition creates an expanded range of highly competitive RFID solutions that significantly enhances our value propositionThird Amendment increased the revolving credit facility commitment under the Second Amended and Restated Credit Agreement by $100 million, from $225 million to OEM customers in various industries, but especially within$325 million, and reset the healthcare industry where there is an ever-growing needuncommitted accordion feature to $125 million for improvements in workflow solutions, patient safety, anti-counterfeiting, and asset tracking throughoutpotential future expansion. Additionally, the hospital environment. The Skyetek business is included inThird Amendment increased the Company’s Vision Technologies reportable segment.term loan balance from $65.6 million to $90.6 million.
Acquisition of Lincoln LaserW.O.M. World of Medicine
On November 9, 2015, the Company acquired certain assets and liabilities of Lincoln Laser Company (“Lincoln Laser”), a Phoenix, Arizona-based provider of ultrafast precision polygon scanners and other optical scanning solutions for the medical, food processing, and advanced industrial markets, for a total purchase price of $12.6 million, subject to customary working capital adjustments. This total purchase price includes $10.3 million in cash paid for the acquisition and $2.3 million in estimated fair value of future contingent consideration payable upon the achievement of certain revenue targets for fiscal year 2016. The undiscounted range of contingent consideration is zero to $6.0 million. Lincoln Laser specializes in ultrafast scanning, leveraging their expertise in polygon motor design and electro-optic subsystems. The acquisition creates an expanded range of highly competitive beam delivery technologies for the Company. The Lincoln Laser business is included in the Company’s Laser Products reportable segment.
Acquisition of Applimotion
On February 19, 2015, the CompanyJuly 3, 2017, we acquired 100% of the outstanding stock of Applimotion Inc.W.O.M. World of Medicine GmbH (“Applimotion”WOM”), a Loomis, California basedBerlin, Germany-based provider of advanced precision motormedical insufflators, pumps and motionrelated disposables for OEMs in the minimally invasive surgery market, for a total purchase price of €118.1 million ($134.9 million). The acquisition was financed with a €118.0 million ($134.8 million) draw-down on our revolving credit facility. We expect that the addition of WOM will help to better serve our customers in minimally invasive surgery applications with a broader range of product offerings. WOM is included in our Vision reportable segment.
Acquisition of Laser Quantum Limited
On January 10, 2017, we acquired an additional approximately 35% of the outstanding shares of Laser Quantum Limited (“Laser Quantum”), a Manchester, United Kingdom-based provider of solid state continuous wave lasers, ultrafast lasers, and optical light engines to OEMs in the medical market. Cash paid for the acquisition was £25.5 million ($31.1 million) and was financed with cash on hand and a $30.0 million draw-down on our revolving credit facility. In addition, we entered into a call and put option agreement with the remaining equity holders for the purchase and sale in 2020 of all remaining Laser Quantum shares held by the remaining equity holders, subject to certain conditions. The purchase price for the remaining shares will be based on the proportionate share of the noncontrolling interest in Laser Quantum’s cash on hand as of December 31, 2019 and a multiple of Laser Quantum’s EBITDA for the twelve months ending December 31, 2019, as defined in the call and put option agreement. As a result of this transaction, our ownership position in Laser Quantum increased from approximately 41% to approximately 76%. The financial results of Laser Quantum were previously accounted for under the equity method of accounting. As a result of the acquisition of the additional shares, the financial results of Laser Quantum have been consolidated in our consolidated financial statements since January 2017. In connection with the purchase price allocation under the business combination rules, we recognized a nontaxable gain of $26.4 million during the three months ended March 31, 2017, representing the excess fair value of our previously-held equity interest in Laser
29
Quantum over its carrying value. By establishing control through a majority equity ownership, we expect to broaden our technology capability in photonics solutions for medical applications, particularly within the growing DNA sequencing market, while providing key enabling photonics-based technologies for instrumentation and life science applications such as biomedical imaging, cell sorting, and ophthalmology. Laser Quantum is included in our Photonics reportable segment.
Acquisition of ThingMagic
On January 10, 2017, we acquired ThingMagic, a Woburn, Massachusetts-based provider of ultra-high frequency (“UHF”) radio frequency identification (“RFID”) modules and finished RFID readers to OEM customersOEMs in the medical and advanced industrial markets, for a total purchase price of $14.0 million, net of working capital adjustments. This total purchase price includes $13.0 million in cash paid for the acquisition and $1.0 million in estimated fair value of future contingent considerations payable upon the achievement of certain revenue targets for the fiscal years 2015 to 2017. The undiscounted range of contingent considerations is zero to $4.0$19.1 million. Applimotion specializes in motor applications that require highly precise and dynamic motion control. The acquisition enhanceswas financed with cash on hand and a $12.0 million draw-down on our strategic positionrevolving credit facility. We expect that the addition of ThingMagic will broaden our portfolio of RFID solutions, while providing the resources to address the growing need for improvements in precision motion control by enabling us to offerworkflow solutions, patient safety, anti-counterfeiting, and asset tracking in a broader range of motion control technologies and integrated solutions. Applimotionmedical environment. ThingMagic is included in the Company’s Precision Motionour Vision reportable segment.
JK Lasers Divestiture
On April 15, 2015, the Company completed the sale of our JK Lasers business for $29.6 million in cash, net of working capital adjustments and transaction costs, and recognized a $19.6 million pre-tax gain on the sale in the consolidated statement of operations. The JK Lasers business divestiture does not qualify for discontinued operations accounting treatment.
2016 Restructuring
During the third quarter of 2015, the Company initiated a program targeting annualized savings of $4.5 million to $5.5 million after the program is fully executed. The 2016 restructuring program includes consolidating our manufacturing operations to optimize our facility footprint and to better utilize resources, and reducing redundant costs due to productivity cost savings and business volume reductions. The Company expects to incur cash charges of $4.5 million to $5.5 million related to this program, which we anticipate completing during the second quarter of 2016. The Company incurred costs related to the 2016 restructuring program amounting to $3.1 million during the year ended December 31, 2015.
2015 Restructuring
During the first quarter of 2015, the Company implemented a program to eliminate redundant costs, as a result of acquisition and divestiture activities, to better align our operations to our strategic growth plans, to further integrate our business lines, and as a consequence of our productivity initiatives. The Company substantially completed the program in 2015, incurring costs amounting to $1.5 million during the year ended December 31, 2015. We principally intend to reallocate resources and reinvest savings from the 2015 restructuring into higher growth businesses and lower cost regions.
30
Total revenue for 20152017 was $373.6$521.3 million, an increase of $8.9$136.5 million, or 2.4%35.5%, versus the prior year primarily as the2016. The net resulteffect of our acquisitions in 2016 and divestitures, which increased revenues by $10.02017 and our decision in 2016 to discontinue our radiology products resulted in an increase in revenue of $105.8 million, or 2.8%27.5%. Foreign exchange rates adversely impacted our revenue by 4.0% during the year ended December 31, 2015. Excluding the impact of acquisitions, divestitures and changes$1.9 million, or 0.5%, in foreign exchange rates, total revenue for 2015 increased 3.6% versus the prior year. Our organic revenue growth is summarized as follows:
| |||
|
|
| |
|
|
| |
|
|
| |
|
|
| |
The organic growth in our revenue for the year ended December 31, 2015 compared to the prior year was primarily attributable to growth in our Laser Products and Precision Motion segments offset by a decline in revenue in our Vision Technologies (formerly known as Medical Technologies) segment. The increase in revenue in our Laser Products segment was attributable to an increase in revenue from our laser beam delivery and CO2 lasers products. The growth in our Precision Motion segment was driven by an increase in revenue of optical encoders products, partially offset by a decline in revenue from our air bearing spindles products. These increases were partially offset by a decline in revenue in our Vision Technologies segment related to our visualization solutions product line.2017.
Operating income from continuing operations increased $45.7$24.6 million from an operating loss of $16.8$32.6 million in 20142016 to operating income of $28.9$57.2 million in 2015.2017. This increase was primarily attributable to an impairment charge of $41.4 million related to the NDS business in 2014 and an increase in gross profit of $58.1 million as a result of higher revenue, partially offset by an increase in 2015.operating expenses of $33.4 million, primarily due to acquisitions in 2016 and 2017.
Diluted earnings per share (“EPS”) from continuing operations of $1.13 in 2017 increased $1.51$0.50 from a loss per sharean EPS of ($0.49)$0.63 in 2014 to an earnings per share of $1.02 in 2015. The2016. This increase was primarily attributable to higher operating income from continuing operations and a $26.4 million nontaxable gain on acquisition of the additional approximately 35% of Laser Quantum equity interest in 2015 versus operating lossJanuary 2017, partially offset by the adjustment of Laser Quantum redeemable noncontrolling interest to the estimated redemption value as of December 31, 2017. Diluted EPS from continuing operations for the year ended December 31, 2017 was negatively impacted by the $20.2 million redeemable noncontrolling interest redemption value adjustment, which was nontaxable and was recorded as a reduction to retained earnings in stockholders’ equity instead of net income in the prior yearconsolidated statement of operations. However, in the earnings per share calculation, the redeemable noncontrolling interest redemption value adjustment was included as a reduction to net income attributable to Novanta Inc., and higher other income resulting fromresulted in a $0.57 per share reduction to Diluted EPS. (See Note 9 to the gain recognized from the JK Lasers divestiture.accompanying Consolidated Financial Statements.)
The specificSpecific components of our operating results for 2015, 20142017, 2016 and 20132015 are further discussed below.
The following table sets forth our results of operations as a percentage of revenue for the years indicated:
| 2015 |
|
| 2014 |
|
| 2013 |
| 2017 |
|
| 2016 |
|
| 2015 |
| ||||||
Revenue |
| 100.0 | % |
|
| 100.0 | % |
|
| 100.0 | % |
| 100.0 | % |
|
| 100.0 | % |
|
| 100.0 | % |
Cost of revenue |
| 57.7 |
|
|
| 58.8 |
|
|
| 58.3 |
|
| 57.7 |
|
|
| 57.8 |
|
|
| 57.7 |
|
Gross profit |
| 42.3 |
|
|
| 41.2 |
|
|
| 41.7 |
|
| 42.3 |
|
|
| 42.2 |
|
|
| 42.3 |
|
Operating expenses: |
|
|
|
|
|
|
|
|
|
|
|
|
|
|
|
|
|
|
|
|
|
|
Research and development and engineering |
| 8.3 |
|
|
| 7.9 |
|
|
| 7.5 |
|
| 8.0 |
|
|
| 8.3 |
|
|
| 8.3 |
|
Selling, general and administrative |
| 22.0 |
|
|
| 23.1 |
|
|
| 24.1 |
|
| 19.6 |
|
|
| 21.2 |
|
|
| 22.0 |
|
Amortization of purchased intangible assets |
| 2.1 |
|
|
| 2.8 |
|
|
| 2.3 |
|
| 2.3 |
|
|
| 2.1 |
|
|
| 2.0 |
|
Restructuring, acquisition and divestiture related costs |
| 2.2 |
|
|
| 0.6 |
|
|
| 1.7 |
|
| 1.4 |
|
|
| 2.1 |
|
|
| 2.2 |
|
Impairment of goodwill and intangible assets |
| — |
|
|
| 11.4 |
|
|
| — |
| |||||||||||
Total operating expenses |
| 34.6 |
|
|
| 45.8 |
|
|
| 35.6 |
|
| 31.3 |
|
|
| 33.8 |
|
|
| 34.5 |
|
Operating income (loss) from continuing operations |
| 7.7 |
|
|
| (4.6 | ) |
|
| 6.1 |
| |||||||||||
Operating income from continuing operations |
| 11.0 |
|
|
| 8.5 |
|
|
| 7.7 |
| |||||||||||
Interest income (expense), net |
| (1.4 | ) |
|
| (1.4 | ) |
|
| (1.1 | ) |
| (1.4 | ) |
|
| (1.2 | ) |
|
| (1.4 | ) |
Foreign exchange transaction gains (losses), net |
| (0.0 | ) |
|
| 0.4 |
|
|
| (0.4 | ) |
| (0.1 | ) |
|
| 0.6 |
|
|
| (0.0 | ) |
Other income (expense), net |
| 0.7 |
|
|
| 0.7 |
|
|
| 0.5 |
|
| 0.0 |
|
|
| 0.6 |
|
|
| 0.7 |
|
Gain on acquisition of business |
| 5.1 |
|
|
| — |
|
|
| — |
| |||||||||||
Gain on disposal of business |
| 5.3 |
|
|
| — |
|
|
| — |
|
| — |
|
|
| — |
|
|
| 5.3 |
|
Income (loss) from continuing operations before income taxes |
| 12.3 |
|
|
| (4.9 | ) |
|
| 5.1 |
| |||||||||||
Income tax provision (benefit) |
| 2.8 |
|
|
| (0.3 | ) |
|
| 2.0 |
| |||||||||||
Income (loss) from continuing operations |
| 9.5 |
|
|
| (4.6 | ) |
|
| 3.1 |
| |||||||||||
Income from continuing operations before income taxes |
| 14.6 |
|
|
| 8.5 |
|
|
| 12.3 |
| |||||||||||
Income tax provision |
| 2.7 |
|
|
| 2.7 |
|
|
| 2.8 |
| |||||||||||
Income from continuing operations |
| 12.0 |
|
|
| 5.7 |
|
|
| 9.5 |
| |||||||||||
Loss from discontinued operations, net of tax |
| — |
|
|
| (1.6 | ) |
|
| (0.6 | ) |
| — |
|
|
| — |
|
|
| (0.0 | ) |
Loss on disposal of discontinued operations, net of tax |
| — |
|
|
| (0.4 | ) |
|
| (0.2 | ) | |||||||||||
Consolidated net income (loss) |
| 9.5 |
|
|
| (6.6 | ) |
|
| 2.3 |
| |||||||||||
Consolidated net income |
| 12.0 |
|
|
| 5.7 |
|
|
| 9.5 |
| |||||||||||
Less: Net income attributable to noncontrolling interest |
| — |
|
|
| — |
|
|
| — |
|
| (0.4 | ) |
|
| — |
|
|
| — |
|
Net income (loss) attributable to GSI Group Inc. |
| 9.5 | % |
|
| (6.6 | )% |
|
| 2.3 | % | |||||||||||
Net income attributable to Novanta Inc. |
| 11.5 | % |
|
| 5.7 | % |
|
| 9.5 | % | |||||||||||
31
The following table sets forth external revenue by reportable segment for 2015, 20142017, 2016 and 20132015 (dollars in thousands):
|
|
|
|
|
|
|
|
|
|
|
|
| % Change |
|
|
|
|
|
|
|
|
|
|
|
|
| % Change |
| ||||||||||
| 2015 |
|
| 2014 |
|
| 2013 |
|
| 2015 vs. 2014 |
|
| 2014 vs. 2013 |
| 2017 |
|
| 2016 |
|
| 2015 |
|
| 2017 vs. 2016 |
|
| 2016 vs. 2015 |
| ||||||||||
Laser Products | $ | 168,331 |
|
| $ | 177,726 |
|
| $ | 166,598 |
|
|
| (5.3 | )% |
|
| 6.7 | % | |||||||||||||||||||
Vision Technologies |
| 124,725 |
|
|
| 122,187 |
|
|
| 90,276 |
|
|
| 2.1 | % |
|
| 35.3 | % | |||||||||||||||||||
Photonics | $ | 232,359 |
|
| $ | 174,158 |
|
| $ | 168,331 |
|
|
| 33.4 | % |
|
| 3.5 | % | |||||||||||||||||||
Vision |
| 183,074 |
|
|
| 122,250 |
|
|
| 124,725 |
|
|
| 49.8 | % |
|
| (2.0 | )% | |||||||||||||||||||
Precision Motion |
| 80,542 |
|
|
| 64,793 |
|
|
| 60,036 |
|
|
| 24.3 | % |
|
| 7.9 | % |
| 105,857 |
|
|
| 88,350 |
|
|
| 80,542 |
|
|
| 19.8 | % |
|
| 9.7 | % |
Total | $ | 373,598 |
|
| $ | 364,706 |
|
| $ | 316,910 |
|
|
| 2.4 | % |
|
| 15.1 | % | $ | 521,290 |
|
| $ | 384,758 |
|
| $ | 373,598 |
|
|
| 35.5 | % |
|
| 3.0 | % |
Laser ProductsPhotonics
Laser ProductsPhotonics segment revenue in 2015 decreased2017 increased by $9.4$58.2 million, or 5.3%33.4%, versus the prior year,2016, primarily as a result of the JK Lasers divestiture,Laser Quantum acquisition, which reducedincreased segment revenues by $16.7$44.7 million, partially offset byand an increase in revenue of our laser beam delivery products and our CO2 laserlasers products due to an increase in demandas a result of increased volumes in the advanced industrial market and certain medical applications andmarket.
Photonics segment revenue in 2016 increased by $5.8 million, or 3.5%, versus 2015, as a result of an increase in revenue of our laser beam delivery products of $10.1 million primarily attributable to the Lincoln Laser acquisition.acquisition in November 2015, partially offset by a decrease of $5.7 million in JK Lasers products as a result of the JK Lasers divestiture in April 2015.
Laser ProductsVision
Vision segment revenue in 20142017 increased by $11.1$60.8 million, or 6.7%49.8%, versus the prior year,2016. The increase was primarily due to growth across alla $58.4 million increase in revenue as a result of the WOM, ThingMagic and Reach acquisitions.
Vision segment revenue in 2016 decreased by $2.5 million, or 2.0%, versus 2015. The decrease was primarily due to a $13.4 million decline in our visualization solutions revenue attributable to our decision to discontinue our radiology products, which accounted for a $7.9 million decrease in revenue, and lower demand for our surgical products, and a $2.6 million decline in our thermal printers product lines.revenue. These were partially offset by an increase in revenue from our optical data collection products of $8.1 million and an increase in revenue as a result of the acquisition of Reach of $5.6 million.
Precision Motion
Precision Motion segment revenue in 2017 increased by $17.5 million, or 19.8%, versus 2016. The revenue growthincrease was primarily due to an increase in revenue of our CO2 lasers and fiber lasers products, driven by new product launches, new customer wins, and market growth. In addition, revenue of our laser beam delivery products grew due to increased demand in material processing in advanced industrial markets and certain medical applications.
Vision Technologies
Vision Technologies segment revenue in 2015 increased by $2.5 million, or 2.1%, versus the prior year. The increase was primarily due to revenue from our optical data collection business being included in reported revenue in the prior year only following the JADAK acquisition in March 2014 and increases in revenue from our thermal printers and light and color measurement products,
partially offset by a decline in our visualization solutions revenue as a result of our radiologyCelera Motion products and customer qualification cycles.
Vision Technologies segment revenue in 2014 increased by $31.9 million, or 35.3%, versus the prior year. A $45.4 million increase in revenue attributable to the JADAK acquisition was partially offset by a decline in revenue in our visualization solutionsair bearing spindles products as a result of dual sourcing at an OEM customer that beganincreased demand in 2013, softness inthe advanced industrial and medical equipment spending impacting our customer’s demand for our products, and delays in new product introductions.
Precision Motionmarkets.
Precision Motion segment revenue in 20152016 increased by $15.7$7.8 million, or 24.3%9.7%, versus the prior year. This2015. The increase was principally driven by the Applimotion acquisition and increasedan increase in revenue of our optical encodersmotor components products of $6.9 million as a result of increased customer volumesdemand in both the medical and advanced industrial markets, partially offset by a decline in revenue of our air bearing spindles products due to lower demand from the printed circuit board industry.
Precision Motion segment revenue in 2014 increased by $4.8 million, or 7.9%, versus the prior year. This increase was principally driven by increased revenue of our optical encoders products as a result of a market share gain with a major OEM customer and new customer wins.medical markets.
Gross Profit
The following table sets forth the gross profit and gross profit margin for each of our reportable segments for 2015, 20142017, 2016 and 20132015 (dollars in thousands):
| 2015 |
|
| 2014 |
|
| 2013 |
| 2017 |
|
| 2016 |
|
| 2015 |
| ||||||
Gross profit: |
|
|
|
|
|
|
|
|
|
|
|
|
|
|
|
|
|
|
|
|
|
|
Laser Products | $ | 73,602 |
|
| $ | 74,224 |
|
| $ | 68,819 |
| |||||||||||
Vision Technologies |
| 48,966 |
|
|
| 48,678 |
|
|
| 35,824 |
| |||||||||||
Photonics | $ | 106,117 |
|
| $ | 76,696 |
|
| $ | 73,602 |
| |||||||||||
Vision |
| 69,249 |
|
|
| 47,181 |
|
|
| 48,966 |
| |||||||||||
Precision Motion |
| 36,709 |
|
|
| 28,333 |
|
|
| 27,778 |
|
| 46,564 |
|
|
| 40,044 |
|
|
| 36,709 |
|
Unallocated Corporate and Shared Services |
| (1,387 | ) |
|
| (1,068 | ) |
|
| (194 | ) |
| (1,399 | ) |
|
| (1,469 | ) |
|
| (1,387 | ) |
Total | $ | 157,890 |
|
| $ | 150,167 |
|
| $ | 132,227 |
| $ | 220,531 |
|
| $ | 162,452 |
|
| $ | 157,890 |
|
Gross profit margin: |
|
|
|
|
|
|
|
|
|
|
|
|
|
|
|
|
|
|
|
|
|
|
Laser Products |
| 43.7 | % |
|
| 41.8 | % |
|
| 41.3 | % | |||||||||||
Vision Technologies |
| 39.3 | % |
|
| 39.8 | % |
|
| 39.7 | % | |||||||||||
Photonics |
| 45.7 | % |
|
| 44.0 | % |
|
| 43.7 | % | |||||||||||
Vision |
| 37.8 | % |
|
| 38.6 | % |
|
| 39.3 | % | |||||||||||
Precision Motion |
| 45.6 | % |
|
| 43.7 | % |
|
| 46.3 | % |
| 44.0 | % |
|
| 45.3 | % |
|
| 45.6 | % |
|
|
|
|
|
|
|
|
|
|
|
|
|
|
|
|
|
|
|
|
|
|
|
Total |
| 42.3 | % |
|
| 41.2 | % |
|
| 41.7 | % |
| 42.3 | % |
|
| 42.2 | % |
|
| 42.3 | % |
32
Gross profit and gross profit margin can be influenced by a number of factors, including product mix, pricing, volume, manufacturing efficiencies and utilization, costs for raw materials and outsourced manufacturing, headcount, inventory obsolescence and warranty expenses.
Laser ProductsPhotonics
Laser ProductsPhotonics segment gross profit in 2015 decreased $0.6for 2017 increased $29.4 million, or 0.8%38.4%, versus the prior year primarily2016, due to a declinean increase in revenue as a result of the JK Lasers divestiture, which decreased gross profit by $4.9 million, partially offset by revenue growthLaser Quantum acquisition and increased volumes in our laser beam delivery and CO2 laser products and an increase in gross profit margin. Laser Productslegacy product lines. Photonics segment gross profit margin was 43.7%45.7% for 2015,2017, compared with a gross profit margin of 41.8%44.0% for the prior year.2016. The increase in gross profit margin was primarily attributable to the JK Lasers divestiture, which accountedLaser Quantum acquisition. Gross profit margin for 1.3 percentage point of the 1.9 percentage point increase. The remainingyear ended December 31, 2017 was negatively impacted by an increase in gross profit margin was driven by increases in volume in our laser beam deliveryamortization of inventory fair value adjustments and CO2 laser products, product mix, and continuous improvement productivity initiatives.amortization of developed technology of $3.2 million.
Laser ProductsPhotonics segment gross profit in 2014for 2016 increased $5.4$3.1 million, or 7.9%4.2%, versus the prior year2015, primarily due to an increase in revenue and an increase in gross profit margin. Laser ProductsPhotonics segment gross profit margin was 41.8%44.0% for 2014, compared with a gross profit margin of 41.3% for the prior year. The 0.5 percentage point increase in gross profit margin was primarily attributable to productivity improvements as a result of our manufacturing process improvement initiatives and margin improvements in our fiber lasers products.
Vision Technologies segment gross profit for 2015 increased $0.3 million, or 0.6%, versus the prior year. The increase was primarily attributable to a decline in intangible asset amortization expense, partially offset by product mix. Vision Technologies segment gross profit margin was 39.3% for 2015, compared with a gross profit margin of 39.8% for the prior year. The 0.5 percentage point decrease in gross profit margin was primarily attributable to product mix, offset by lower intangible asset amortization expense. Included in gross profit for 2015 was amortization of developed technologies of $2.2 million. Included in gross profit for 2014 was amortization of developed technologies and amortization of inventory fair value step-ups of $3.7 million.
Vision Technologies segment gross profit for 2014 increased $12.9 million, or 35.9%, versus the prior year. The increase was primarily attributable to the JADAK acquisition in March 2014, which accounted for an $18.9 million increase in gross profit year over year, partially offset by a decline in gross profit for our visualization solutions products due to lower revenue. Vision Technologies segment gross profit margin remained relatively flat year over year. Included in gross profit was amortization of developed technologies and amortization of inventory fair value step-ups of $3.7 million and $3.1 million for 2014 and 2013, respectively.
Precision Motion
Precision Motion segment gross profit for 2015 increased $8.4 million, or 29.6%, versus the prior year primarily due to an increase in revenue and gross profit margin. Precision Motion segment gross profit margin was 45.6% for 2015,2016, compared with a gross profit margin of 43.7% for 2015. Gross profit margin improvements from continuous improvement productivity initiatives were mostly offset by lower margins from the prior year.Lincoln Laser acquisition which was included in the operating results for the full year in 2016 versus only two months in 2015.
Vision
Vision segment gross profit for 2017 increased $22.1 million, or 46.8%, versus 2016. The 1.9 percentage point increase was primarily attributable to an increase in revenue from the WOM, ThingMagic and Reach acquisitions, which increased gross profit by $17.6 million. Vision segment gross profit margin was 37.8% for 2017, compared with a gross profit margin of 38.6% for 2016. The decrease in gross profit margin was primarily attributable to an increase in volumes,amortization of inventory fair value adjustments and amortization of developed technology of $6.1 million, which resulted in a 3.3 percentage point decrease in gross profit margin, partially offset by changes in product mix and continuous improvement productivity initiatives.cost savings from restructuring activities in 2016.
Vision segment gross profit for 2016 decreased $1.8 million, or 3.6%, versus 2015. The decrease was primarily attributable to a decline in revenue and a $1.6 million charge related to the discontinuation of our radiology products. Vision segment gross profit margin was 38.6% for 2016, compared with a gross profit margin of 39.3% for 2015. The decrease in gross profit margin was primarily attributable to costs associated with discontinuing our radiology products, which resulted in a 1.3 percentage point decrease in gross profit margin.
Precision Motion
Precision Motion segment gross profit for 20142017 increased $0.6$6.5 million, or 2.0%16.3%, versus the prior year2016, primarily due to an increase in revenue volume of our optical encoders products.revenue. Precision Motion segment gross profit margin was 43.7%44.0% for 2014,2017, compared with a gross profit margin of 46.3%45.3% for the prior year.2016. The 2.6 percentage point decrease in gross profit margin was attributable to temporary supply chain transition challenges in our Celera Motion business, which led to production inefficiencies and quality impacts.
Precision Motion segment gross profit for 2016 increased $3.3 million, or 9.1%, versus 2015, primarily due to an increase in revenue. Precision Motion segment gross profit margin was 45.3% for 2016, compared with a consequencegross profit margin of manufacturing ramp-up costs.45.6% for 2015. The slight decrease in gross profit margin was attributable to product mix as a result of stronger growth from lower margin products.
Operating Expenses
The following table sets forth operating expenses for 2015, 20142017, 2016 and 20132015 (dollars in thousands):
|
|
|
|
|
|
|
|
|
|
|
|
| % Change |
|
|
|
|
|
|
|
|
|
|
|
|
| % Change |
| ||||||||||
| 2015 |
|
| 2014 |
|
| 2013 |
|
| 2015 vs. 2014 |
|
| 2014 vs. 2013 |
| 2017 |
|
| 2016 |
|
| 2015 |
|
| 2017 vs. 2016 |
|
| 2016 vs. 2015 |
| ||||||||||
Research and development and engineering | $ | 31,043 |
|
| $ | 28,954 |
|
| $ | 23,787 |
|
|
| 7.2 | % |
|
| 21.7 | % | $ | 41,673 |
|
| $ | 32,002 |
|
| $ | 31,043 |
|
|
| 30.2 | % |
|
| 3.1 | % |
Selling, general and administrative |
| 82,049 |
|
|
| 84,380 |
|
|
| 76,337 |
|
|
| (2.8 | )% |
|
| 10.5 | % |
| 102,025 |
|
|
| 81,691 |
|
|
| 82,049 |
|
|
| 24.9 | % |
|
| (0.4 | )% |
Amortization of purchased intangible assets |
| 7,611 |
|
|
| 10,262 |
|
|
| 7,270 |
|
|
| (25.8 | )% |
|
| 41.2 | % |
| 12,096 |
|
|
| 8,251 |
|
|
| 7,611 |
|
|
| 46.6 | % |
|
| 8.4 | % |
Restructuring, acquisition and divestiture related costs |
| 8,254 |
|
|
| 1,935 |
|
|
| 5,387 |
|
|
| 326.6 | % |
|
| (64.1 | )% |
| 7,542 |
|
|
| 7,945 |
|
|
| 8,254 |
|
|
| (5.1 | )% |
|
| (3.7 | )% |
Impairment of goodwill and intangible assets |
| — |
|
|
| 41,442 |
|
|
| — |
|
| N/A |
|
| N/A |
| |||||||||||||||||||||
Total | $ | 128,957 |
|
| $ | 166,973 |
|
| $ | 112,781 |
|
|
| (22.8 | )% |
|
| 48.1 | % | $ | 163,336 |
|
| $ | 129,889 |
|
| $ | 128,957 |
|
|
| 25.8 | % |
|
| 0.7 | % |
33
Research and Development and Engineering Expenses
Research and development and engineering (“R&D”) expenses are primarily comprised of employee compensation and related expenses and cost of materials for R&D projects.
R&D expenses were $31.0$41.7 million, or 8.0% of revenue, in 2017, versus $32.0 million, or 8.3% of revenue, in 2015, versus $29.0 million, or 7.9% of revenue, in 2014. R&D expenses increased in terms of total dollars and as a percentage of revenue, primarily due to acquisitions, partially offset by the JK Lasers divestiture.
R&D expenses were $29.0 million, or 7.9% of revenue, in 2014, versus $23.8 million, or 7.5% of revenue, in 2013.2016. R&D expenses increased in terms of total dollars primarily due to R&D expenses from acquisitions in 2016 and 2017.
R&D expenses were $32.0 million, or 8.3% of revenue, in 2016, versus $31.0 million, or 8.3% of revenue, in 2015. R&D expenses increased in terms of total dollars primarily due to increased R&D expenses from acquisitions, partially offset by decreased costs as a result of the acquisition of JADAK.JK Lasers divestiture.
Selling, General and Administrative Expenses
Selling, general and administrative (“SG&A”) expenses include costs for sales and marketing, sales administration, finance, human resources, legal, information systems and executive management.
SG&A expenses were $102.0 million, or 19.6% of revenue, in 2017, versus $81.7 million, or 21.2% of revenue, in 2016. SG&A expenses increased in terms of total dollars primarily due to acquisitions in 2016 and 2017, investments in sales and marketing resources and higher variable compensation associated with the Company’s financial performance.
SG&A expenses were $81.7 million, or 21.2% of revenue, in 2016, versus $82.0 million, or 22.0% of revenue, in 2015, versus $84.4 million, or 23.1% of revenue, in 2014.2015. SG&A expenses decreased in terms of total dollars and as a percentage of revenue primarily due to a $3.7 million decrease in costs from our visualization solutions business as a result of prior year restructuring programs and the discontinuation of our radiology products and a $1.1 million decrease in costs as a result of the JK Lasers divestiture, and lower compensation expense, partially offset by increasesa $2.5 million increase in costs from current year acquisitions in 2016 and the JADAK acquisition in March 2014.
SG&A expenses were $84.42015 and $1.3 million or 23.1% of revenue, in 2014, versus $76.3 million, or 24.1% of revenue, in 2013. SG&A expenses increased in terms of total dollars primarily due to the acquisition of JADAK.CEO transition costs.
Amortization of Purchased Intangible Assets
Amortization of purchased intangible assets is charged to our Laser Products,Photonics, Vision Technologies and Precision Motion segments. Amortization of core technologies is included in cost of revenue in the consolidated statement of operations. Amortization of customer relationships, trademarks, backlog and other intangibles are included in operating expenses in the consolidated statement of operations.
Amortization of purchased intangible assets, excluding the amortization forof developed technologies that is included in cost of revenue, was $7.6$12.1 million, or 2.0%2.3% of revenue, in 2015,2017, versus $10.3$8.3 million, or 2.8%2.1% of revenue, in 2014.2016. The decrease,increase, in terms of total dollars and as a percentage of revenue, was related to a decrease in amortizationthe result of more acquired intangible assets from prior year acquisitions.acquisitions in 2016 and 2017.
Amortization of purchased intangible assets, excluding the amortization of developed technologies that is included in cost of revenue, was $10.3$8.3 million, or 2.8%2.1% of revenue, in 2014,2016, versus $7.3$7.6 million, or 2.3%2.0% of revenue, in 2013.2015. The increase, in terms of total dollars and as a percentage of revenue, was related to the amortizationresult of more acquired intangible assets from the JADAK acquisition.acquisitions in 2015 and 2016.
Restructuring, Acquisition and Divestiture Related Costs
Restructuring, acquisition and divestiture related charges primarily relate to our restructuring programs, acquisition and related costs incurred for thecompleted acquisitions, acquisition of Skyetek in December 2015, Lincoln Laser in November 2015, Applimotion in February 2015, JADAK in March 2014 and NDS in January 2013. Acquisition related costs also include costs related to future potential acquisitions and failed acquisitions, and changes in fair value of contingent considerations. Divestiture costs primarily related to the JK Lasers divestiture in April 2015.
The Company recorded restructuring, acquisition and divestiture related costs of $8.3$7.5 million in 2015,2017, versus $1.9$7.9 million in 2014.2016. The Company recognized acquisition related costs of $1.3 million in 2015. Acquisition related costs included expenses of $1.9 million related to acquisitions in 2015, partially offset by a $0.6 million reversal of accruals for earn-out agreements in connection with the 2014 JADAK acquisition. The Company recorded restructuring costs of $5.8 million primarily related to our restructuring programs and $1.1 million in divestiture costs related to the JK Lasers divestiture. The increasedecrease in restructuring, acquisition and divestiture related costs isversus 2016 was primarily due to a $2.6 million decrease in restructuring related charges as a result of the 2016 restructuring program which was substantially completed in 2016, partially offset by an increase in costsacquisition related charges of $2.2 million mostly attributable to an investment banking success fee related to restructuring programs in 2015. Acquisition related costs were $1.5 million during 2014.the WOM acquisition.
The Company recorded restructuring, acquisition and divestiture related costs of $1.9$7.9 million in 2014,2016, versus $5.4$8.3 million in 2013. The Company recognized acquisition related costs of $1.5 million in 2014, which included expenses of $0.6 million recognized under earn-out agreements in connection with the JADAK acquisition.2015. The decrease in restructuring, acquisition and divestiture related costs isversus 2015 was primarily due to thea $2.9 million decrease in costsrestructuring related to restructuring programscharges and a $1.1 million decrease in 2014 as compared to 2013. Acquisitiondivestiture related costs were $1.6 million during 2013.
Impairment of Goodwill and Intangible Assets
The Company recorded a non-cash impairment charge of $41.4 million in the consolidated financial statements in 2014 as a result of lower expectations for revenuethe JK Lasers divestiture in 2015, partially offset by an increase in acquisition related charges of $3.6 million. Restructuring related charges in 2016 were offset by a $1.6 million gain on the sale of our Chatsworth, California facility. Acquisition related costs in 2016 were primarily related to $2.5
34
million in professional fees in connection with acquisitions and operating profit from our NDS business.
costs of $2.5 million related to transition services and changes in the fair value of contingent considerations related to acquisitions in 2015.
Operating Income (Loss) from Continuing Operations by Segment
The following table sets forth operating income (loss) from continuing operations by segment for 2015, 20142017, 2016 and 20132015 (in thousands):
| 2015 |
|
| 2014 |
|
| 2013 |
| 2017 |
|
|
|
| 2016 |
|
|
| 2015 |
| |||||||||||
Operating Income (Loss) from Continuing Operations |
|
|
|
|
|
|
|
|
|
|
|
|
|
|
|
|
|
| ||||||||||||
Laser Products | $ | 35,971 |
|
| $ | 33,053 |
|
| $ | 25,143 |
| |||||||||||||||||||
Vision Technologies |
| (2,057 | ) |
|
| (43,079 | ) |
|
| 3,566 |
| |||||||||||||||||||
Photonics | $ | 51,289 |
|
|
| $ | 34,825 |
|
|
| $ | 35,971 |
| |||||||||||||||||
Vision |
| 7,883 |
|
|
| (1,277 | ) |
|
|
| (2,057 | ) | ||||||||||||||||||
Precision Motion |
| 16,877 |
|
|
| 13,023 |
|
|
| 12,062 |
|
| 27,146 |
|
|
| 21,101 |
|
|
| 16,877 |
| ||||||||
Unallocated Corporate and Shared Services |
| (21,858 | ) |
|
| (19,803 | ) |
|
| (21,325 | ) |
| (29,123 | ) |
|
|
|
| (22,086 | ) |
|
|
|
| (21,858 | ) | ||||
Total | $ | 28,933 |
|
| $ | (16,806 | ) |
| $ | 19,446 |
| $ | 57,195 |
|
|
| $ | 32,563 |
|
|
| $ | 28,933 |
| ||||||
Laser ProductsPhotonics
Laser ProductsPhotonics segment operating income from continuing operations for 2015 increased by $2.9was $51.3 million, or 8.8%, from 2014 primarily due to the improved profitability22.1% of the Laser Products segment after the JK Lasers divestiture, partially offset by anrevenue, in 2017, versus $34.8 million, or 20.0% of revenue, in 2016. The increase in restructuring and divestiture related costs of $1.7 million. Amortization of intangible assets for the Laser Products segment was $4.4 million in 2015 compared to $4.1 million in 2014.
Laser Products operating income from continuing operations for 2014 increased by $7.9 million, or 31.5%, from 2013was primarily due to an increase in gross profit of $5.4$29.4 million, and a $2.0 million decreasepartially offset by increases in restructuring and acquisitionoperating expenses, primarily related charges compared to 2013. Amortization of intangible assets for the Laser Products segment was $4.1 millionQuantum acquisition and increased volumes in both 2014 and 2013.
Vision Technologies
Vision Technologiesour legacy product lines. Photonics operating lossincome from continuing operations decreasedfor the year ended December 31, 2017 was negatively affected by $41.0a $7.1 million increase in amortization of inventory fair value adjustments and amortization of intangible assets.
Photonics segment operating income from ancontinuing operations was $34.8 million, or 20.0% of revenue, in 2016, versus $36.0 million, or 21.4% of revenue, in 2015. The decrease in operating loss of $43.1 million in 2014 to an operating loss of $2.1 million in 2015income from continuing operations was primarily due to an increase in R&D and SG&A expenses of $6.2 million as a result of the NDS goodwillLincoln Laser acquisition and intangible assets impairment charge recordedinvestments in 2014R&D, sales and a decrease in amortization of purchased intangibles of $4.8 million,marketing resources, partially offset by an increase in R&D expenses asgross profit of $3.1 million, and a result of the 2014 JADAKdecrease in restructuring, acquisition and an increasedivestiture related costs of $2.0 million primarily due to the JK Lasers divestiture in restructuring charges2015 and decreases in the fair value of contingent considerations related to our 2016 restructuring program.the Lincoln Laser acquisition.
Vision
Vision Technologiessegment operating income from continuing operations decreased by $46.6was $7.9 million, from operating incomeor 4.3% of $3.6 millionrevenue, in 2013 to2017, versus an operating loss of $43.1$1.3 million, or (1.0%) of revenue, in 2014 primarily due to the NDS goodwill and intangible assets impairment charge of $41.4 million, an increase in amortization of intangibles and amortization of our inventory fair value step-ups of $3.7 million and a decline in visualization solutions revenue, partially offset by an2016. The increase in operating income from continuing operations as a result of the JADAK acquisition.
Precision Motion
Precision Motion operating income from continuing operations for 2015 increased by $3.9 million, or 29.6%, from 2014was primarily due to an increase in gross profit of $8.4$22.1 million partially offset by higher operating expenses due to the Applimotion acquisition and an increasea decrease in restructuring chargesspending primarily related to our 2016 restructuring program.
Precision Motionprogram, which was substantially completed in 2016, partially offset by an increase in R&D and SG&A expenses related to acquisitions in 2017. Vision operating income from continuing operations for 2014 increasedthe year ended December 31, 2017 was negatively affected by a $6.0 million increase in amortization of inventory fair value adjustments and amortization of intangible assets.
Vision segment operating loss from continuing operations was $1.3 million, or (1.0%) of revenue, in 2016, versus $2.1 million, or (1.6%) of revenue, in 2015. The decrease in operating loss from continuing operations was primarily due to a decrease in SG&A expenses of $4.0 million attributable to cost savings from our restructuring programs and a $1.6 million gain from the sale of our facility in Chatsworth, California, partially offset by a decrease in gross profit of $1.8 million, an increase in amortization of intangibles of $1.0 million as a result of acquisitions in 2016 and 2015, an increase in restructuring related costs of $0.8 million, and $1.2 million of transition services costs related to the Reach acquisition.
Precision Motion
Precision Motion segment operating income from continuing operations was $27.1 million, or 8.0%,25.6% of revenue, in 2017, versus $21.1 million, or 23.9% of revenue, in 2016. The increase in operating income from 2013continuing operations was primarily due to an increase in gross profit of $0.6$6.5 million.
Precision Motion segment operating income from continuing operations was $21.1 million, or 23.9% of revenue, in 2016, versus $16.9 million, or 21.0% of revenue, in 2015. The increase in operating income from continuing operations was primarily due to an increase in gross profit of $3.3 million as a result of higher volume, a reduction of R&D and SG&A expenses of approximately $1.7 million as a result of cost savings from the 2016 restructuring program and other cost saving initiatives, and a $0.4 million decrease in restructuring costs.charges of $0.8 million as the majority of the related costs had been recognized as of December 31, 2015. These were partially offset by $1.7 million of costs related to increases in the fair value of contingent considerations for the Applimotion acquisition.
35
Unallocated Corporate and Shared Services
Unallocated corporate and shared services costs primarily represent costs of corporate and shared service functions and other public company costs that are not allocated to the operating segments, including certain restructuring and most acquisition related costs.
Unallocated corporate and shared services costs for 20152017 increased by $2.1$7.0 million, or 10.4%31.9%, from 20142016 primarily due to an increase in professional servicesacquisition related costs of $2.3 million mostly attributable to an investment banking success fee related to the WOM acquisition, and an increase in restructuringSG&A expenses of $5.4 million as a result of higher headcount and acquisition related costs of $1.1 million. Restructuring and acquisition related costs were $2.6 million in 2015, compared to $1.5 million in 2014.higher variable compensation associated with the Company’s financial performance.
Unallocated corporate and shared services costs for 2014 decreased2016 increased by $1.5$0.2 million, or 7.1%1.0%, from 2013 primarily due to lower restructuring and acquisition costs. Restructuring and acquisition related costs were $1.5 million in 2014, compared to $2.2 million in 2013.
2015.
Interest Income (Expense), Foreign Exchange Transaction Gains (Losses), and Other Income (Expense), Net
The following table sets forth interest income (expense), net, foreign exchange transaction gains (losses), net and other income (expense), net for 2015, 20142017, 2016 and 20132015 (in thousands):
| 2015 |
|
| 2014 |
|
| 2013 |
| 2017 |
|
| 2016 |
|
| 2015 |
| ||||||
Interest income (expense), net | $ | (5,180 | ) |
| $ | (5,096 | ) |
| $ | (3,468 | ) | $ | (7,165 | ) |
| $ | (4,559 | ) |
| $ | (5,180 | ) |
Foreign exchange transaction gains (losses), net |
| (21 | ) |
|
| 1,281 |
|
|
| (1,301 | ) |
| (447 | ) |
|
| 2,317 |
|
|
| (23 | ) |
Other income (expense), net |
| 2,661 |
|
|
| 2,706 |
|
|
| 1,500 |
|
| 142 |
|
|
| 2,201 |
|
|
| 2,663 |
|
Gain on acquisition of business |
| 26,409 |
|
|
| — |
|
|
| — |
| |||||||||||
Gain on disposal of business |
| 19,629 |
|
|
| — |
|
|
| — |
|
| — |
|
|
| — |
|
|
| 19,629 |
|
Interest Income (Expense), Net
Net interest expense was $5.2$7.2 million in 20152017 versus $5.1$4.6 million in 2016. The increase in net interest expense was primarily due to an increase in average debt levels as a result of acquisitions in 2017, partially offset by a decrease in the prior year.weighted average interest rate on our Senior Credit Facilities. The weighted average interest rate on our Senior Credit Facilities was 3.32% and 3.52% during 2017 and 2016, respectively. Included in net interest expense was non-cash interest expense of approximately $0.8 million and $0.9 million in 2017 and 2016, respectively, related to the amortization of deferred financing costs on our debt.
Net interest expense was $4.6 million in 2016 versus $5.2 million in 2015. The decrease in net interest expense was primarily due to a decrease in average debt levels, partially offset by an increase in the weighted average interest rate on our Senior Credit Facilities. The weighted average interest rate on our Senior Credit Facilities was 3.52% and 3.24% during 2016 and 3.25% during 2015, and 2014, respectively. Included in net interest expense was non-cash interest expense of approximately $0.9 million in both 2016 and $1.0 million in 2015, and 2014, respectively, related to amortization of deferred financing costs on our debt.
The increase in net interest expense in 2014 versus the prior year was the result of higher average debt levels and higher average interest rates during 2014. The higher debt levels in 2014 were the result of borrowings to fund the JADAK acquisition in March 2014. The weighted average interest rate on our Senior Credit Facilities was 3.25% and 2.83% during 2014 and 2013, respectively. Included in net interest expense was non-cash interest expense of approximately $1.0 million and $0.9 million in 2014 and 2013, respectively, related to amortization of deferred financing costs on our debt.
Foreign Exchange Transaction Gains (Losses), Net
Foreign exchange transaction gains (losses), were $0.4 million net losses in 2017 versus $2.3 million net gains in 2016 primarily due to changes in the value of the U.S. Dollar against the British Pound, Euro and Japanese Yen.
Foreign exchange transaction gains (losses) were $2.3 million net gains in 2016 versus less than $0.1 million net losses infor 2015 versus $1.3 million net gains for the prior year due to changes in the value of the U.S. Dollar exchange rates against the Euro, British Pound and Japanese YenEuro and a $1.3 millionan unrealized foreign currency loss in 2015 related to the cash proceeds in U.S. dollars from the JK Lasers divestiture being held for a period of time by our UK subsidiary.
Foreign exchange transaction gains (losses), net, were $1.3 million net gains in 2014 versus $1.3 million net losses for the prior year due to the performance of the U.S. Dollar against the Euro, British Pound and Japanese Yen.
Other Income (Expense), Net
We recognized $2.6Other income was $0.1 million $2.7in 2017 versus $2.2 million and $1.5 million ofin 2016. The decrease in other income in 2015, 2014 and 2013, respectively,was primarily relateddue to earnings from our equity-method investment in Laser Quantum reported in other income (expense) prior to 2017. In January 2017, the Company acquired an additional approximately 35% of the outstanding shares of Laser Quantum. As a result of this acquisition, earnings from Laser Quantum have been consolidated in the Company’s consolidated financial statements for year ended December 31, 2017 since the acquisition date.
Other income increased from 2013was $2.2 million in 2016 versus $2.7 million in 2015. Other income in 2016 and 2015 primarily related to 2014 due to higher earnings from our previously-held equity-method investment in Laser Quantum and an increase in our ownership percentage from 25.1% to 41.2% during the second quarterQuantum.
36
Gain on Acquisition of 2013.Business
The summarized financial information forgain on acquisition of business in 2017 was related to a nontaxable gain of $26.4 million recognized upon gaining control of Laser Quantum isin January 2017 as follows (in thousands):a result of acquiring an additional approximately 35% of its outstanding shares. Laser Quantum was previously accounted for as an equity-method investment.
| 2015 |
|
| 2014 |
|
| 2013 |
| |||
Revenue | $ | 25,599 |
|
| $ | 23,013 |
|
| $ | 16,269 |
|
Income from operations | $ | 7,362 |
|
| $ | 7,434 |
|
| $ | 4,720 |
|
Net income | $ | 6,925 |
|
| $ | 6,627 |
|
| $ | 3,745 |
|
Gain on Disposal of Business
The gain on disposal of business in 2015 was due to a $19.6 million gain recognized as a result of the JK Lasers divestiture in April 2015.
Income Taxes
We recorded a tax provision of $10.4$13.8 million in 2015,2017, as compared to a tax benefitprovision of $1.0$10.5 million in 2014.2016. The effective tax rate for 20152017 was 22.6%18.2% of income before taxes, compared to an effective tax rate of 5.6%32.3% of lossincome before taxes for 2014.2016. Our effective tax
rate in 20152017 differs from the Canadian statutory rate of 27.0%29.0% primarily due to a $1.4$1.2 million tax effect of non-deductible acquisition related expenses and a $2.8 million provision for the revaluation of deferred tax assets and liabilities as of December 31, 2017 as a result of the U.S. Tax Cuts and Jobs Act (the “Tax Reform Act”), which reduced the U.S. federal statutory corporate income tax rate from 35% to 21%. These increases were offset by a $2.0 million benefit from international tax rate differences, a $1.1 million benefit due to the JK Lasers divestiture,Section 199 Domestic Production Activity deduction in the U.S., a $0.7$1.0 million benefit associated with R&D and foreign tax credits generated duringin 2017, recognition of $1.6 million net tax benefits from uncertain tax positions upon expiration of statute of limitations and conclusion of income tax audits, and a $1.6 million benefit from the patent box deduction in the U.K. In addition, in 2017, we reported a nontaxable gain of $26.4 million on our previously-held Laser Quantum equity interest and wrote off $1.5 million of Laser Quantum related deferred tax liability, which had a combined 8.7% favorable impact on our effective tax rate for the year a $0.7 million IRS audit settlement related impact and a decrease of $0.6 million valuation allowance recorded in the U.S.ended December 31, 2017.
We recorded a tax benefitprovision of $1.0$10.5 million in 2014,2016, as compared to a tax expenseprovision of $6.2$10.4 million in 2013.2015. The effective tax rate for 20142016 was 5.6%32.3% of lossincome before taxes, compared to an effective tax rate of 38.3%22.6% of income before taxes for 2013.2015. Our effective tax rate in 20142016 differs from the Canadian statutory rate of 27.0%28.5% primarily due to $4.6 million additional valuation allowance on net operating losses in Canada and certain other jurisdictions, which was partially offset by $1.1$0.9 million of international tax rate difference, $1.4 million tax effect of non-deductible acquisition related expenses and an increase of $1.2 million in valuation allowance recorded mainly for losses and other temporary differences andin Canada. These increases were offset by a $1.7$1.1 million benefit due to the Section 199 Domestic Production Activity deduction in the U.S., a $1.1 million benefit associated with R&D and foreign tax credits generated during the year.
Asin 2016 and a significant portion of the NDS goodwill and intangible assets impairment charge was recognized$0.9 million benefit for changes in Canada, we had a $20.2 million loss before taxes in Canada in 2014 where we do not recognize anylocal statutory tax benefit as a result of the full valuation allowance on deferred tax assets. This significantly reduced the income tax benefit as a percentage of the loss before taxes as reported in the consolidated statement of operations for 2014.rates.
Discontinued Operations
Loss from discontinued operations, net of tax, was zero in 2017 and 2016, respectively, and less than $0.1 million and $7.3 million in 2015 and 2014, respectively.2015. The decrease in thesmall loss from discontinued operations net of tax,in 2015 was primarily due to losses related to the Scientific Lasers business whichthat was solddivested in July 2014.
Loss from discontinued operations, net of tax, was $7.3 million and $2.7 million in 2014 and 2013, respectively. The increase in the loss from discontinued operations, net of tax, was primarily due to the sale of the Scientific Lasers business, which resulted in a $3.0 million fair value write-down of the Scientific Lasers business and an impairment charge of $0.5 million in connection with our joint venture investment in Excel Laser Technology Private Limited, which is part of our Scientific Lasers business.
In July 2014, we completed the sale of the Scientific Lasers business for $6.5 million in cash, net of working capital adjustments. We recorded a $1.7 million loss on the sale, net of tax, in the consolidated statement of operations.
Liquidity and Capital Resources
We assess our liquidity in terms of our ability to generate cash to fund our operating, investing, and financing activities. Our primary ongoing cash requirements are funding operations, capital expenditures, investments in businesses, and repayment of our debt and related interest expense. Our primary sources of liquidity are cash flows from operations and borrowings under our revolving credit facility. We believe our future operating cash flows will be sufficient to meet our future operating and capital expenditure cash needs for the foreseeable future, including at least the next 12 months. The availability of borrowingsborrowing capacity under our revolving credit facility provides an additionalanother potential source of liquidity should it be required for business acquisitions. In addition, weWe may seek to raise additional capital, which could be in the form of bonds, convertible debt or equity, to fund business development activities or other future investing cash requirements, subject to approval by the lenders in the Second Amended and Restated Credit Agreement.
Significant factors affecting the management of our ongoing cash requirements are the adequacy of available bank lines of credit and our ability to attract long-termlong term capital with satisfactory terms. The sources of our liquidity are subject to all of the risks of our business and could be adversely affected by, among other factors, a decrease in demand for our products, our ability to integrate current and future acquisitions, deterioration in certain financial ratios, availability of borrowings under our revolving credit facility, and market changes in general. See “Risks Relating to Our Common Shares and Our Capital Structure” included in Item 1A of this Annual Report on Form 10-K.
Our ability to make payments on our indebtedness and to fund our operations may be dependent upon the earnings and the distribution of funds from our subsidiaries. Local laws and regulations and/or the terms of our indebtedness restrict certain of our
37
subsidiaries from paying dividends and transferring assets to us. We cannot assure you that applicable laws and regulations and/or the terms of our indebtedness will permit our subsidiaries to provide us with sufficient dividends, distributions or loans when necessary.
In October 2013, the Company’s Board of Directors authorized a share repurchase plan under which the Company may repurchase outstanding shares of the Company’s common stock up to an aggregate amount of $10.0 million. The shares may be repurchased from time to time, at the Company’s discretion, based on ongoing assessment of the capital needs of the business, the market price of the Company’s common stock, and general market conditions. Shares may also be repurchased through an accelerated stock purchase agreement, on the open market or in privately negotiated transactions in accordance with applicable federal securities laws. Repurchases may be made under certain SEC regulations, which would permit common stock to be purchased when the Company would otherwise be prohibited from doing so under insider trading laws. The share repurchase plan does not obligate the Company to acquire any particular amount of common stock. No time limit was set for the completion of the share repurchase program, and the program may be suspended or discontinued at any time. The Company expects to fund the share repurchaserepurchases through cash on hand and future cash flowgenerated from operations. During 2015,2017, the Company repurchased 12214 thousand shares in the open market for an aggregate
purchase price of $1.6$0.4 million at an average price of $13.29$26.41 per share. As of December 31, 2015,2017, the Company had repurchased an aggregatea total of 172296 thousand shares for an aggregate purchase price of $2.2$4.2 million at an average price of $12.48$14.05 per share. As of December 31, 2017, the Company had $5.8 million available for share repurchases under the authorized share repurchase plan.
As of December 31, 2015, $35.22017, $69.7 million of our $60.0$100.1 million cash and cash equivalents was held by our subsidiaries outside of Canada and the United States, including Laser Quantum. We have a 76% ownership interest in Laser Quantum and, Canada.accordingly, have access to our proportionate interest in the cash and cash equivalents held at this subsidiary. Generally, our intent is to use cash held in these foreign subsidiaries to fund our local operations or acquisitions by those local subsidiaries and to pay down borrowings under our revolving credit facility. Approximately 59.5% of our outstanding borrowings under our Senior Credit Facilities (defined below) were held in our subsidiaries outside of Canada and the United States. Additionally, we may use intercompany loans to address short-term cash flow needs for various subsidiaries. However, inIn certain instances, we have identified excess cash for which we may repatriate and have established liabilities for the expected tax cost. Additionally, we may use intercompany loansBecause of the ownership structure of the Company, the Company’s foreign entities outside the U.S. are not considered controlled foreign corporations of the U.S. company, as defined under U.S. tax principles, and accordingly, the accumulated earnings of these foreign subsidiaries are not subject to address short-term cash flow needs for various subsidiaries.the one-time Toll Charge under the Tax Reform Act.
Second Amended and Restated Credit Agreement
In December 2012,May 2016, we entered into anthe second amended and restated senior secured credit agreement (the “Amended“Second Amended and Restated Credit Agreement”), consisting of a $50.0$75.0 million, 5-year term loan facility and a $75.0$225.0 million, 5-year revolving credit facility (collectively, the “Senior Credit Facilities”). The Senior Credit Facilities mature in December 2017.May 2021. In August 2017, we entered into a third amendment (the “Third Amendment”) to the Second Amended and Restated Credit Agreement. The Third Amendment increased the borrowing limit under the revolving credit facility commitment from $225 million to $325 million and reset the accordion feature to $125 million for future expansion. Additionally, the Third Amendment increased the term loan balance from $65.6 million to $90.6 million. The term loan is payable in quarterly installments of $2.3 million beginning in October 2017, with the remaining amount due upon maturity. We may make payments to pay down our revolving credit facility with cash on hand and cash generated from future operations.
On February 2014,26, 2018, we entered into a fourth amendment (the “Fourth Amendment”) to the Second Amended and Restated Credit Agreement (the “Fourth Amendment”).Agreement. The Fourth Amendment increased the revolving credit facility commitment under the Amended and Restated Credit Agreement by $100 million from $75 million to $175 million and resets the accordion feature to $100 million for future expansion. Additionally, the Fourth Amendment increasedincreases the maximum permitted consolidated leverage ratio financial covenant from 2.753.00 to 3.00.3.50, increases the maximum consolidated leverage ratio for permitted acquisitions and stock repurchases from 2.50 to 3.00, increases the maximum permitted consolidated leverage ratio for a designated acquisition from 3.00 to 3.50, and increases the maximum leverage ratio for four consecutive quarters following a designated acquisition from 3.50 to 4.00. Certain other technical changes were made to the Second Amended and Restated Credit Agreement as a result of the Fourth Amendment and are not considered material.
As of December 31, 2015,2017, we had term loans of $27.5$88.3 million and revolving loans of $70.0$149.5 million outstanding under the Second Amended and Restated Credit Agreement.
The Second Amended and Restated Credit Agreement contains various covenants that we believe are usual and customary for this type of agreement, including a maximum allowed leverage ratio and a minimum required fixed charge coverage ratio (as defined in the Second Amended and Restated Credit Agreement). The following table summarizes these financial covenant requirements as stated in the Fourth Amendmentcovenants and our compliance therewith as of December 31, 2015.2017:
| Requirement |
|
| Actual December 31, 2015 |
| Requirement |
|
| Actual December 31, 2017 |
| ||||
Maximum consolidated leverage ratio |
| 3.00 |
|
|
| 1.60 |
|
| 4.00 |
|
|
| 2.14 |
|
Minimum consolidated fixed charge coverage ratio |
| 1.50 |
|
|
| 3.78 |
|
| 1.50 |
|
|
| 5.63 |
|
38
In addition, the Second Amended and Restated Credit Agreement contains various other customary representations, warranties and covenants applicable to the Company and its subsidiaries, including: (i) limitations on certain payments; (ii) limitations on fundamental changes involving the Company; (iii) limitations on the disposition of assets; and (iv) limitations on indebtedness, investments, and liens.
Cash Flows
Cash and cash equivalents totaled $60.0$100.1 million at December 31, 2015,2017, versus $51.1$68.1 million at December 31, 2014.2016. The net increase in cash and cash equivalents is primarily relatedattributable to cash inflows fromprovided by operating activities of $33.4$63.4 million net cash proceeds of $29.6 million from the sale of our JK Lasers business, and borrowings of $13.0 million under our Senior Credit Facilities.revolving credit facility of $176.8 million. These cash inflows were offset by cash outflows of $26.0$168.3 million for the acquisitionacquisitions of Applimotion, LincolnWOM, ThingMagic and Laser and Skyetek,Quantum, debt repayments of our debt of $30.5$26.9 million, and capital expenditures of $5.6$9.1 million.
The following table summarizes our cash and cash equivalent balances, cash flows and unused andborrowing capacity available funds onunder our revolving credit facility for the years indicated (in thousands):
| 2015 |
|
| 2014 |
|
| 2013 |
| |||
Cash and cash equivalents | $ | 59,959 |
|
| $ | 51,146 |
|
| $ | 60,980 |
|
Net cash provided by operating activities of continuing operations | $ | 33,429 |
|
| $ | 43,990 |
|
| $ | 56,178 |
|
Net cash used in investing activities of continuing operations | $ | (1,842 | ) |
| $ | (93,541 | ) |
| $ | (85,297 | ) |
Net cash provided by (used in) financing activities of continuing operations | $ | (21,535 | ) |
| $ | 40,281 |
|
| $ | 18,574 |
|
Unused and available funds under revolving credit facility | $ | 105,000 |
|
| $ | 95,000 |
|
| $ | 46,000 |
|
| 2017 |
|
| 2016 |
|
| 2015 |
| |||
Cash and cash equivalents, end of year | $ | 100,057 |
|
| $ | 68,108 |
|
| $ | 59,959 |
|
Net cash provided by operating activities of continuing operations | $ | 63,378 |
|
| $ | 47,788 |
|
| $ | 33,429 |
|
Net cash used in investing activities of continuing operations | $ | (177,380 | ) |
| $ | (14,363 | ) |
| $ | (1,842 | ) |
Net cash provided by (used in) financing activities of continuing operations | $ | 143,330 |
|
| $ | (23,189 | ) |
| $ | (21,535 | ) |
Unused borrowing capacity available under revolving credit facility, end of year | $ | 175,547 |
|
| $ | 215,000 |
|
| $ | 105,000 |
|
Cash provided by operating activities of continuing operations was $33.4$63.4 million in 20152017, versus $44.0$47.8 million in 2014. Income from continuing operations increased in 2015 while changes in operating assets and liabilities decreased cash2016. Cash provided by operating activities of continuing operations in 2017 increased from 2016 primarily due to the increase in income from continuing operations.
Cash provided by $6.4 million.operating activities of continuing operations for 2017 was positively impacted by an increase in our outstanding payables and accrued expenses. Cash provided by operating activities of continuing operations was negatively impacted by an increase in outstanding trade receivables and an increase in inventories, excluding trade receivables and inventories acquired from acquisitions in 2017, and an increase in income tax payments.
Cash provided by operating activities of continuing operations was $47.8 million in 2016, versus $33.4 million in 2015. Cash provided by operating activities of continuing operations was positively impacted by an increase in our days payables outstanding from 41 days at December 31, 2015 to 53 days at December 31, 2016 and improvement in our inventory turnover ratio from 3.6 at December 31, 2015 to 3.7 at December 31, 2016. Cash provided by operating activities of continuing operations was negatively impacted by an increase in our days sales outstanding from 53 days at December 31, 2014 to 57 days at December 31, 2015 a decrease in our days payables outstanding from 45to 59 days at December 31, 2014 to 41 days at December 31, 2015 and an increase in inventories (excluding inventories sold as part of JK Lasers divestiture and inventories from the Applimotion, Lincoln Laser and Skyetek acquisitions). The Company’s days sales outstanding was impacted by the timing of sales occurring later in the fourth quarter in 2015 compared to 2014.
Cash provided by operating activities of continuing operations was $44.0 million in 2014 versus $56.2 million in 2013. Cash provided operating activities of continuing operations decreased $12.2 million primarily due to net tax refunds of $11.8 million received in 2013 as a result of the settlement with the IRS. Cash provided by operating activities of continuing operations was positively impacted by a decrease in our days sales outstanding from 56 at December 31, 2013 to 53 at December 31, 2014 and a decrease in inventories excluding inventories from the JADAK acquisition. Cash provided by operating activities of continuing operations was negatively impacted by a decrease in our days payables outstanding from 48 at December 31, 2013 to 45 at December 31, 2014.2016.
Cash used in operating activities of discontinued operations was less than $0.1 million in 2015, as a result of the sale of our Scientific Lasers business in July 2014. Cash used in operating activities of discontinued operations was $1.7 million and $7.0 million in 2014 and 2013, respectively. The $5.3 million decrease in cash used in operating activities of discontinued operations in 2014 from 2013 was primarily related to the divestiture of the Scientific Lasers business in 2014 and divestiture of the Semiconductor Systems business in 2013.2014.
Investing Cash Flows
Cash used in investing activities of continuing operations was $177.4 million during 2017 primarily driven by our acquisitions of WOM, ThingMagic and Laser Quantum. In connection with these acquisitions, we paid $185.0 million in cash considerations, which is reported in the consolidated statement of cash flows as $168.3 million cash outflows from investing activities (net of cash acquired of $16.7 million and working capital adjustments). We also paid $9.1 million for capital expenditures during 2017.
Cash used in investing activities of continuing operations was $14.4 million during 2016 primarily due to $13.4 million in cash consideration paid for the Reach acquisition and the acquisition of certain developed technology assets, and $8.5 million in cash paid for capital expenditures, partially offset by $3.6 million in net cash consideration received from the sale of our Orlando, Florida facility in March 2016, $3.4 million in net cash consideration received from the sale of our Chatsworth, California facility in August 2016, and $0.4 million received from the finalization of the Lincoln Laser acquisition working capital adjustments.
Cash used in investing activities of continuing operations was $1.8 million during 2015 primarily due to cash consideration of $26.0 million paid for the Applimotion, Lincoln Laser and Skyetek acquisitions and $5.6 million in capital expenditures, partially offset by $29.6 million inof cash proceeds received from the sale of the JK Lasers business.
Cash used in investing activities of continuing operations was $93.5 million during 2014 primarily due to cash consideration of $93.7 million paid for the JADAK acquisition in March 2014 and $5.4 million in capital expenditures, partially offset by proceeds of $5.4 million from an escrow claim related to the NDS acquisition. This compares to cash used in investing activities of continuing operations of $85.3 million in 2013 primarily related to cash consideration of $80.8 million paid for the NDS acquisition and $4.8 million in capital expenditures.
Cash provided by investing activities of discontinued operations was $0.2$1.5 million during 2016 primarily related to the release of escrow funds from our July 2014 Scientific Lasers divestiture. Cash provided by investing activities of discontinued operations was
39
$0.2 million during 2015 primarily related to net cash proceeds from the sale of Excel Laser Technology Private Limited (the “India JV”). Cash provided by investing activities of discontinued operations was $3.8 million during 2014, primarily related to $4.7 million of net proceeds from the sale of the Scientific Lasers business, offset by capital expenditures of $0.9 million. This compares to cash provided by investing activities of discontinued operations in 2013 of $12.3 million, primarily related to $8.2 million in net proceeds from the sale of the Semiconductor Systems business and $4.6 million in net proceeds from the sale of our East Setauket, New York facility which was part of our Scientific Lasers business.
We have no material commitments to purchase property, plant and equipment andequipment. We expect such expenditures to beuse approximately $6$12 million to $7$15 million in 2016.2018 for capital expenditures related to investments in new property, plant and equipment for our existing businesses.
Financing Cash Flows
Cash provided by financing activities of continuing operations was $143.3 million during 2017, primarily due to $176.8 million of borrowings under our revolving credit facility used to fund a portion of the cash considerations paid for the WOM, ThingMagic and Laser Quantum acquisitions, partially offset by $7.9 million of contractual term loan payments, $19.0 million of optional repayments of borrowings under our revolving credit facility, $2.5 million of contingent consideration payments, $2.1 million of payroll withholding tax payments on stock-based compensation awards, $0.4 million of repurchases of our common shares and $0.9 million of principal payments under our capital lease obligations. We also paid $0.7 million for debt issuance costs as a result of the Third Amendment to the Second Amended and Restated Credit Agreement entered into in August 2017.
Cash used in financing activities of continuing operations was $23.2 million during 2016, primarily due to $7.5 million of contractual term loan payments, $8.8 million of optional repayments of borrowings under our revolving credit facility, $1.8 million of payroll withholding tax payments on stock-based compensation awards, $1.6 million of repurchases of our common shares, and $1.2 million of principal payments under our capital lease obligations. We also paid $2.5 million for debt issuance costs as a result of the Second Amended and Restated Credit Agreement signed in May 2016.
Cash used in financing activities of continuing operations was $21.5 million during 2015, primarily due to $7.5 million of our contractual term loan payments, $23.0 million of optional repayments of borrowings under our revolving credit facility and the repurchase of $1.6 million of the Company’srepurchases of our common stock,shares, offset by $13.0 million of borrowings under our revolving credit facility to fund the Applimotion acquisition. Cash provided by financing activities of continuing operations was $40.3 million during 2014, primarily due to $77.0 million of borrowings under our revolving credit facility used to pay a portion of the cash consideration paid for the JADAK acquisition, partially offset by $7.5 million of our contractual term loan payments and $26.0 million of optional repayments of borrowings under our revolving credit facility. Cash provided by financing activities of continuing operations was $18.6 million during 2013, primarily due to $60.0 million of borrowings under our revolving credit facility used to pay for the NDS
acquisition, partially offset by $7.5 million of our contractual term loan payments and $31.0 million of optional repayments of borrowings under our revolving credit facility.
We expect to use $8.5$9.8 million of cash in 20162018 for financing activities, comprised of quarterly contractual payments of $1.9$2.3 million on our term loan facility, and $1.0$0.6 million in principal payments forunder our capital lease obligations. In addition, from time to time we may make payments to pay down our revolving credit facility from time to time with futureavailable cash flows generated from future operating activities.
Other Liquidity Matters
Pension Plans
We maintain a defined benefit pension plan in the U.K. (the “U.K. Plan”). Our U.K. Plan was closed to new members in 1997 and stopped accruing additional pension benefits for existing members in 2003, thereby limiting our obligation to benefits earned through that date. Benefits under this plan were based on the employees’ years of service and compensation as of the date the plan was frozen.frozen, adjusted for inflation. On July 1, 2013, the Company provided a Guarantee (the “Guarantee”) in favor of the trustees of the U.K. Plan with respect to all present and future obligations and liabilities under the U.K. Plan (whether actual or contingent and whether owed jointly or severally and in any capacity whatsoever) of GSI GroupNovanta Technologies UK Limited, a wholly owned subsidiary of GSI GroupNovanta Inc.
Our funding policy is to fund pensions based on actuarial methods as permitted by regulatory authorities. The results of funding valuations depend on both the funding deficit and the assumptions that we make with regard to attributes such as asset returns, discount rates, mortality, retail price inflation and other market driven changes. The assumptions used represent one estimate of amany possible future outcome.outcomes. The final cost to us will be determined by events as they actually become known. Due to the underfunded positionsposition that our U.K. Plan currently has and potential changes in the actual outcomes relative to our assumptions, we may have to increase payments to fund this plan in the future. As of December 31, 2015,2017, the projected benefit obligation under the U.K. Plan exceeded the fair value of plan assets by $3.5$3.9 million.
Based on the results of the most recent funding valuation completed in the fourth quarter 2015, the Company’s annual contributions willare expected to be approximately $1.0$0.9 million per year in 20162018 and will increase by 2.9% per year thereafter.
As a result of the covenant that exists between our U.K. subsidiary and the Plan Trustees regarding the funding of the U.K. Plan, our ability to transfer assets outside our U.K. subsidiary, and its wholly owned subsidiary in China, may be limited.
Our defined benefit pension plan in Japan was terminated in the first quarter of 2015. The accrued retirement allowance amount calculated in accordance with Japanese retirement benefit rules on a voluntary retirement basis as of March 1, 2015 is being transferred to each employee’s new defined contribution plan account over 4 years.
Off-Balance Sheet Arrangements, Contractual Obligations
Contractual Obligations
The following table summarizes our contractual obligations at December 31, 20152017 and the effect that such obligations are expected to have on liquidity and cash flows in future years. We have excluded the future cash payments for unrecognized tax benefits of $6.1 $3.8
40
million, including interest and penalties, because we are uncertain if and when such amounts may be settled. These unrecognized tax benefits have been classified as long-term liabilities on the consolidated balance sheets and have beenare further explained in Note 1314 to our Consolidated Financial Statements included in Item 8 of this Annual Report on Form 10-K.
Contractual Obligations |
| Total |
|
| 2016 |
|
| 2017-2018 |
|
| 2019-2020 |
|
| Thereafter |
|
| Total |
|
| 2018 |
|
| 2019 - 2020 |
|
| 2021 - 2022 |
|
| Thereafter |
| ||||||||||
|
| (In thousands) |
|
| (In thousands) |
| ||||||||||||||||||||||||||||||||||
Senior Credit Facilities (1) |
| $ | 97,500 |
|
| $ | 7,500 |
|
| $ | 90,000 |
|
| $ | — |
|
| $ | — |
|
| $ | 237,778 |
|
| $ | 9,200 |
|
| $ | 18,400 |
|
| $ | 210,178 |
|
| $ | — |
|
Interest on Senior Credit Facilities (2) |
|
| 4,963 |
|
|
| 2,687 |
|
|
| 2,276 |
|
|
| — |
|
|
| — |
|
|
| 22,093 |
|
|
| 7,043 |
|
|
| 13,021 |
|
|
| 2,029 |
|
|
| — |
|
Capital leases |
|
| 13,845 |
|
|
| 1,498 |
|
|
| 2,366 |
|
|
| 1,842 |
|
|
| 8,139 |
|
|
| 11,130 |
|
|
| 1,013 |
|
|
| 1,978 |
|
|
| 1,814 |
|
|
| 6,325 |
|
Operating leases (3) |
|
| 18,482 |
|
|
| 4,973 |
|
|
| 6,259 |
|
|
| 1,889 |
|
|
| 5,361 |
|
|
| 24,212 |
|
|
| 6,695 |
|
|
| 7,982 |
|
|
| 3,086 |
|
|
| 6,449 |
|
Purchase commitments (4) |
|
| 35,916 |
|
|
| 34,122 |
|
|
| 1,794 |
|
|
| — |
|
|
| — |
|
|
| 86,419 |
|
|
| 78,687 |
|
|
| 7,732 |
|
|
| — |
|
|
| — |
|
U.K. pension plan (5) |
|
| 6,294 |
|
|
| 975 |
|
|
| 2,037 |
|
|
| 2,157 |
|
|
| 1,125 |
|
|
| 3,945 |
|
|
| 944 |
|
|
| 1,972 |
|
|
| 1,029 |
|
|
| — |
|
Contingent consideration (6) |
|
| 4,104 |
|
|
| 2,800 |
|
|
| 714 |
|
|
| 590 |
|
|
| — |
| ||||||||||||||||||||
Total contractual cash obligations |
| $ | 177,000 |
|
| $ | 51,755 |
|
| $ | 104,732 |
|
| $ | 5,888 |
|
| $ | 14,625 |
|
| $ | 389,681 |
|
| $ | 106,382 |
|
| $ | 51,799 |
|
| $ | 218,726 |
|
| $ | 12,774 |
|
(1) | On August 1, 2017, we entered into the Third Amendment to the Second Amended and Restated Credit Agreement. As of December 31, |
(3) | These amounts primarily represent the gross amounts due for facilities that are leased. The amounts include payments due with respect to both active operating facilities and idle facilities that have been |
(4) | Purchase commitments represent |
(5) | Assumes funding obligations equivalent to |
(6) | These amounts represent the estimated fair value of contingent consideration obligations as of December 31, 2017, $2.8 million of which was paid in January 2018. The remaining amounts are expected to be paid between 2019 and 2022. The undiscounted range of the |
Off-Balance Sheet Arrangements
Through December 31, 2015,2017, we have not entered into any off-balance sheet arrangements or material transactions with unconsolidated entities or other persons.
Critical Accounting Policies and Estimates
The preparation of financial statements in conformity with generally accepted accounting principles requires us to make estimates and assumptions that affect the reported amounts of assets and liabilities and disclosure of contingent assets and liabilities atas of the dates of the financial statements and the reported amounts of revenues and expenses duringfor the reporting periods. On an ongoing basis, we evaluate our estimates, assumptions and judgments, including those related to revenue recognition, inventory valuation, assessment of the valuation of goodwill, intangible assets and tangible long-lived assets, contingent consideration obligations, employee benefit plans, restructuring charges, accounting for income taxes, and accounting for loss contingencies. Actual results could differ significantly from our estimates in the future.
We believe that the following critical accounting policies and estimates most significantly affect the portrayal of our financial condition and results of operations and require the most difficult and subjective judgments.
Revenue Recognition. Revenue from the sale of products is recognized when we meet all four of the criteria for revenue recognition within the fiscal period. These criteria are: evidence of an arrangement exists; delivery has occurred; the price is fixed or determinable; and collection of the resulting receivable is reasonably assured. Revenue recognition requires judgment and estimates, which may affect the amount and timing of revenue recognized in any given period.
The Laser Products,Photonics, Vision, Technologies, and Precision Motion segments have revenue transactions that are comprised of both single-element and multiple-element transactions. Multiple-element transactions typically include two or more products and occasionally contain non-standard/extended warranties or preventative maintenance plans. For multiple-element transactions, revenue is generally recognized
41
upon shipment, using the relative selling price method in accordance with Accounting Standards Codification (“ASC”) 605-25, “Revenue – Multiple-Element Arrangements”. Single-element transactions are typically recognized upon shipment at their contractually stated prices.
The Company generally provides warranties for its products. The standard warranty period is typically 12 months to 24 months for the Laser ProductsPhotonics and Precision Motion segments and 12 months to 36 months for the Vision Technologies segment. The standard warranty period for product sales is accounted for under the provisions of ASC 450, “Contingencies”,“Contingencies,” as the Company has the ability to ascertain the likelihood of the liability and can reasonably estimate the amount of the liability. A provision for the estimated cost related to warranty is recorded to cost of revenue at the time revenue is recognized. The Company’s estimate of costs to service the warranty obligations is based on historical experience and expectations of future conditions. To the extent the Company experiences warranty claims or costs associated with servicing those claims that differ from the original estimates, revisions to the estimated warranty liability are recorded at that time, with an offsetting entry recorded to cost of revenue.
The Company occasionally sells separately priced non-standard/extendedextended/non-standard warranty services or preventative maintenance plans, which are accounted for in accordance with provisions of ASC 605-20-25-3, “Separately Priced Extended Warranty and Product Maintenance Contracts”.Contracts.” Under this guidance, we recognize the separately priced extended/non-standard warranty and preventative maintenance fees ratably over the associated period.
The Company, atAt the request of its customers, the Company may perform professional services, generally for the maintenance and repair of products previously sold to those customers. These services are usually in the form of time and materials based contracts which are short in duration. Revenue for time and materials services is recorded at the completion of services requested under a customer’s purchase order.
In May 2014, the Financial Accounting Standards Board (the “FASB”) issued Accounting Standards Update (“ASU”) 2014-09, “Revenue from Contracts with Customers” (“ASU 2014-09” or “Topic 606”), which provides new guidance for revenue recognition. ASU 2014-09 requires entities to recognize revenue in a way that depicts the transfer of goods or services to customers at an amount that reflects the consideration to which the entity expects to be entitled in exchange for those goods or services. In August 2015, the FASB issuedAs amended by ASU 2015-14, “Revenue from Contracts with Customers – Deferral of the Effective Date,” which delayed effective date of ASU 2014-09 to the firstwill be effective for annual and interim reporting periods beginning after December 15, 2017. EarlyUpon adoption is permitted, however, no earlier than the original effective date of the first reporting period after December 15, 2016 under ASU 2014-09. Upon adoption,Topic 606, an entity may apply the new guidance either retrospectively to each prior reporting period presented (the “full retrospective method”) or using modified retrospective approach which will result in the recording of the cumulative effect of applying the standardretrospectively only to customer contracts not yet completed as of the date of adoption with the cumulative effect of initially applying the standard recognized in the beginning retained earnings balance at the date of the initial application. application (the “modified retrospective method”).
The Company is currently evaluatingwill adopt the impactnew standard as in the first quarter of 2018, which will be reflected in the consolidated financial statements for the interim and annual periods in the year ending December 31, 2018, and conducted various activities to prepare for the adoption of the new standard in 2017. The Company surveyed cross-functional leaders to identify potential revenue streams that could be impacted by Topic 606 and identified certain revenue streams that could be impacted. The Company also reviewed a representative sample of individual customer contracts related to these various revenue streams to determine if the guidance under Topic 606 is expected to have a material impact on revenue recognition. The Company has concluded that the Company’sadoption of Topic 606 is not expected to have a material impact on its consolidated financial statements.
Inventories. Inventories, which include materials and conversion costs, are stated at the lower of cost or market,net realizable value, using athe first-in, first-out method. We periodically review these values to ascertain that marketCost includes the cost of purchased materials, inbound freight charges, external and internal processing and applicable labor and overhead costs. Net realizable value is the estimated selling price in the ordinary course of the inventory continues to exceed its recorded cost. Generally, reductions in inventory value below cost are caused by technological obsolescencebusiness, less reasonably predictable costs of the inventory.completion, disposal and transportation.
We regularly review inventory quantities on hand and, when necessary, record provisions for excess and obsolete inventory based on either our forecasted product demand and production requirements or historical trailing usage of the product. If our sales do not materialize as planned or at historical levels, we may have to increase our reserve for excess and obsolete inventory, which would reduce our earnings. If actual market conditions are more favorable than anticipated, inventory previously written down may be sold, resulting in lower cost of revenue and higher income from operations than expected in that period.
Share-Based Compensation. The Company records expenses associated with share-based compensation awards to employees and directors based on the fair value of awards as of the grant date. For stock-based compensation awards that vest over time based on employment, the associated expenses are recognized in the consolidated statements of operations ratably over the vesting period of the award, net of estimated forfeitures.
The Company grants two types of performance-based awards to certain members of the executive management team: non-GAAP EPS performance-based restricted stock units (“EPS-PSUs”) and relative total shareholder return performance-based restricted stock units (“TSR-PSUs”). For EPS-PSUs, share-based compensation expense is recognized ratably over the vesting period when it is probable that specified performance targets are expected to be achieved based on management’s projections. Management’s
42
projections are revised, if necessary, in subsequent periods when underlying factors change the evaluation of the probability of achieving the performance targets. Accordingly, share-based compensation expense associated with EPS-PSUs may differ significantly from period to period based on changes to the probability of achieving performance targets. For TSR-PSUs, the Company recognizes the related compensation expense based on the fair value of the TSR-PSUs, which is determined using the Monte-Carlo simulation valuation model as of the date of grant. The expense related to TSR-PSUs is recognized on a straight-line basis from the grant date to the end of the performance period, which is generally three years.
The Monte Carlo simulation model utilizes multiple input variables that determine the probability of satisfying the performance conditions stipulated in the grant agreement and calculates the fair market value for the market-based restricted stock units granted. The Monte Carlo simulation model also uses stock price volatility and other variables to estimate the probability of satisfying the performance conditions, including the possibility that the market condition may not be satisfied, and the resulting fair value of the award. We recognize the expense related to these awards on a straight-line basis over the vesting period, which is generally three years.
Valuation of Long-lived Assets. The purchase price we pay for acquired companies is allocated first to the identifiable assets acquired and liabilities assumed at their fair value. Any excess purchase price is then allocated to goodwill. We make various assumptions and estimates in order to assign fair value to acquired tangible and intangible assets and liabilities. These assumptions typically include cash flow forecasts, discount rates, technology royalty rates, and customer attrition rates, among others. Actual cash flows may vary from forecasts used to value these assets at the time of the business combination.
Our most significant identifiable intangible assets are customer relationships, acquired technologies, trademarks and trade names. In addition to our review of the carrying value of each asset, the useful life assumption for each asset, including the classification of certain intangible assets as “indefinite lived,“indefinite-lived,” are reviewed on a periodic basis to determine if changes in circumstances warrant revisions to them. All definite-lived intangible assets are amortized over the periods in which their economic benefits are expected to be realized.
Impairment analyses of goodwill and indefinite-lived intangible assets are conducted in accordance with ASC 350, “Intangibles—Goodwill and Other.” We test our goodwill balances annually as of the beginning of the second quarter or more frequently if indicators are present or changes in circumstances suggest that an impairment may exist. Should the fair value of the Company’s goodwill or indefinite-lived intangible assets decline because of reduced operating performance, market declines, or other indicators of impairment, or as a result of changes in the discount rate, charges for impairment loss may be necessary.
The Company evaluates its goodwill, intangible assets and other long-lived assets for impairment at the reporting unit level which is generally at least one level below our reportable segments. The Company has the option of first performing a qualitative (“Step 0”) assessment to determine whether it is necessary to perform the quantitative two-step impairment test. In performing the Step 0 assessment, the Company reviews qualitative factors both specific to the reporting unit and to the Company as a whole, such as financial performance, macroeconomic conditions, industry and market considerations, and the fair value of each reporting unit at the last valuation date. If the Company elects this option and believes, as a result of the Step 0 assessment, that it is more likely than not that the carrying value of goodwill is not recoverable, the quantitative two-step impairment test we utilizeis required; otherwise, no further testing is required.
Alternatively, the Company may elect to bypass the Step 0 qualitative assessment and perform the quantitative two-step impairment test. This two-step approach which requires a comparison of the carrying value of each of our reporting units to the fair value of these reporting units. The Company’s product lines generally correspond with its reporting units which is the level at which the Company evaluates its goodwill, intangible assets and other long-lived assets for impairment. If the carrying value of a reporting unit exceeds its fair value, we calculateestimate the implied fair value of the reporting unit’s goodwill and compare it to the carrying value. If the carrying value of goodwill exceeds its implied fair value, an impairment charge is recorded for the difference. The fair value of a reporting unit is estimated primarily based onusing a discounted cash flow (“DCF”) method. The DCF approach requires that we forecast future cash flows for each of the reporting units and discount the cash flow streams based on a weighted average cost of capital (“WACC”) that is derived, in part, from comparable companies within similar industries. The DCF calculations also include a terminal value calculation that is based upon an expected long-term growth rate for the applicable reporting unit. The carrying values of each reporting unit include assets and liabilities which relate to the reporting unit’s operations. Additionally, reporting units that benefit from corporate assets or liabilities are allocated a portion of those corporate assets and liabilities on a proportional basis.
We assess indefinite-lived intangible assets for impairment on an annual basis, and more frequently if impairment indicators are identified. We also periodically reassess their continuing classification as indefinite-lived intangible assets. Impairment exists if the fair value of the intangible asset is less than its carrying value. An impairment charge equal to the difference is recorded to reduce the carrying value to its fair value.
We evaluate amortizable intangible assets and other long-lived assets for impairment in accordance with ASC 360-10-35-15, “Impairment or Disposal of Long-Lived Assets,” whenever changes in events or circumstances indicate that the carrying values of the reporting units may exceed theirthe undiscounted cash flow forecasts.forecasts attributable to the reporting units. If undiscounted cash flow forecasts
43
indicate that the carrying value of a definite-lived
intangible asset or other long-lived asset may not be recoverable, a fair value assessment is performed. For intangible assets, fair value estimates are derived from discounted cash flow forecasts. For other long-lived assets (primarily property, plant and equipment), fair value estimates are derived from the sources most appropriate for the particular asset and have historically included such approaches as sales comparison approach and replacement cost approach. If fair value is less than carrying value, an impairment charge equal to the difference is recorded. We also review the useful life and residual value assumptions for definite-lived intangible assets and other long-lived assets on a periodic basis to determine if changes in circumstances warrant revisions to them.
Factors which may trigger an impairment of our goodwill, intangible assets and other long-lived assets include the following:
|
|
significant underperformance relative to historical or projected future operating results;
|
|
changes in our use of the acquired assets or the strategy for our overall business;
|
|
long-term negative industry or economic trends;
|
|
technological changes or developments;
|
|
changes in competition;
|
|
loss of key customers or personnel;
|
|
adverse judicial or legislative outcomes or political developments;
|
|
significant declines in our stock price for a sustained period of time; and
the decline of our market capitalization below net book value as of the end of any reporting period. |
|
|
|
|
The occurrence of any of these events or any other unforeseeable events or circumstances that materially affectsaffect future operating results or cash flows may cause an impairment that is material to our results of operations or financial position in the reporting period in which it occurs or is identified.
The most recent annual goodwill and indefinite-lived intangible asset impairment test was performed as of the beginning of the second quarter of 2015,2017, using a Step 0 assessment, noting no impairment. With the exception of our NDS reporting unit, implied fair values of all reporting units exceeded their carrying values by at least 20%. As of December 31, 2015,2017, there were no indicators of impairment of our long-lived assets.
We maintainhave a significant balance in ouramount of goodwill, intangible assets and other long-lived assets. The following table shows the breakdown of goodwill, intangiblesintangible assets and property, plant and equipment by reportable segment as of December 31, 20152017 (in thousands):
| Goodwill |
|
| Intangible Assets, net |
|
| Property, Plant & Equipment, net |
| Goodwill |
|
| Intangible Assets, net |
|
| Property, Plant & Equipment, net |
| ||||||
Laser Products | $ | 33,860 |
|
| $ | 25,831 |
|
| $ | 10,282 |
| |||||||||||
Vision Technologies |
| 52,679 |
|
|
| 34,685 |
|
|
| 12,684 |
| |||||||||||
Photonics | $ | 68,357 |
|
| $ | 54,787 |
|
| $ | 17,372 |
| |||||||||||
Vision |
| 125,714 |
|
|
| 97,035 |
|
|
| 36,119 |
| |||||||||||
Precision Motion |
| 16,917 |
|
|
| 5,753 |
|
|
| 4,980 |
|
| 16,917 |
|
|
| 3,226 |
|
|
| 4,275 |
|
Unallocated Corporate and Shared Services |
| — |
|
|
| — |
|
|
| 12,604 |
|
| — |
|
|
| — |
|
|
| 3,952 |
|
Total | $ | 103,456 |
|
| $ | 66,269 |
|
| $ | 40,550 |
| $ | 210,988 |
|
| $ | 155,048 |
|
| $ | 61,718 |
|
Contingent Consideration. The purchase price we pay for acquired companies or acquired assets may include a contingent consideration obligation. Contingent consideration isobligations. For business combinations, contingent considerations are typically measured at fair value at the acquisition date using the Monte Carlo valuation method, and is are payable to the former shareholders of the acquired company based on the achievement of certain performance targets. Subsequent to the acquisition date, we update the fair value periodically with updated assumptions for the probability of achieving the targets based on actual performance to date. Any increases or decreases in the estimated fair value of contingent consideration liabilities subsequent to the acquisition date are recorded in the consolidated statement of operations as acquisition related costs until the liability is fully settled.
For asset acquisitions, contingent consideration is measured when the achievement of certain performance targets is probable and reasonably estimable, and is capitalized as part of the cost of the asset acquired. Subsequently, we update the fair value periodically with updated assumptions for the probability of achieving the targets based on actual performance to date until the liability is fully settled. Subsequent increases or decreases in the estimated fair value of contingent consideration liabilities are recorded as adjustments to the carrying value of the asset acquired and amortized over the remaining useful life of the underlying asset.
44
As of December 31, 2015,2017, the Company may have to pay up to $10.3$9.4 million contingent consideration related to all acquisitions with open contingency periods. As of December 31, 2015,2017, the Company has recorded an estimated fair value of $3.9$4.1 million of contingent consideration obligations relatingobligations.
Redeemable Noncontrolling Interest. On January 10, 2017, the Company acquired an additional approximately 35% of the outstanding shares of Laser Quantum, which increased our ownership position in Laser Quantum from approximately 41% to its acquisitionsapproximately 76%. As part of Skyetek, Lincolnthis transaction, the Company and the remaining shareholders of Laser Quantum entered into a call and Applimotion.put option agreement for the purchase and sale, in 2020, of all remaining Laser Quantum shares held by the other shareholders, subject to certain conditions. The purchase price for the remaining shares will be based on the proportionate share of the noncontrolling interest (“NCI”) in Laser Quantum’s cash on hand as of December 31, 2019 and a multiple of Laser Quantum’s EBITDA for the twelve months ending December 31, 2019. The NCI is considered a redeemable equity instrument and is presented as temporary equity on the consolidated balance sheet. The proportionate share of the net income attributable to the NCI is reported as a reduction to the consolidated net income in the Company’s consolidated statements of operations and an increase to the carrying value of the redeemable NCI.
The initial value of the NCI is measured at fair value at the date of the acquisition. The value of the NCI is determined using a combination of the discounted cash flow method (an income approach), the guideline public company method (a market approach), and the subject company transaction method (a market approach). The Company carries the redeemable NCI at the higher of (i) the carrying value without any redemption value adjustments or (ii) the estimated redemption value as of the end of the reporting period. The estimated redemption value is determined as of the end of the reporting period as if it were also the redemption date for the instrument. The resulting adjustments are recorded in retained earnings in shareholders’ equity and are include in the computation of earnings per share attributable to the Company. The resulting adjustments do not affect net income attributable to the Company.
Pension Plans. Our subsidiary located in the U.K. maintains a defined benefit pension plan (the “U.K. Plan”). The U.K. Plan was closed to new membership in 1997 and stopped accruing for additional pension benefits for existing members in 2003, limiting our obligation to benefits earned through that date. Benefits under this plan were based on the employees’ years of service and compensation as of the date the plan was frozen, adjusted for inflation. At December 31, 2015,2017, the fair market value of the plan assets was $32.4$36.5 million, which was $3.5$3.9 million, or 9.9%9.6%, less than the projected benefit obligation of $35.9$40.3 million.
The cost and obligations of our U.K. Plan are calculated using many assumptions. Major assumptions used in the accounting for this pension plan include the discount rate, rate of inflation, mortality rate and expected return on plan assets. Assumptions are determined each year based on data and appropriate market indicators in consultation with a third-party actuary. Should any of these assumptions change, they would have an effect on net periodic pension cost and the unfunded benefit obligation at year end.as of the end of the year. The most sensitive assumption affecting the determination of our U.K. Plan pension obligation is the discount rate. A 50 basis point decrease in the discount rate as of December 31, 20152017 would change the pension obligation by $3.3$3.5 million.
Restructuring Charges. In accounting for our restructuring activities, we follow the provisions of ASC 420, “Exit or Disposal Cost Obligations”.Obligations.” In accounting for these obligations, we make assumptions related to the amount of employee severance and benefits related costs, the time period over which facilities will remain vacant, sublease terms, sublease rental rates, and discount rates. Additionally, we make assumptions on the estimated remaining useful lives of assets being restructured and the residual value of the assets. Estimates and assumptions are based on the best information available at the time the obligation has arisen. These estimates are reviewed and revised as facts and circumstances dictate. Changes in these estimates could have a material effect on the amount previously expensed against our earnings and currently accrued on our consolidated balance sheet.
Accounting for Income Taxes. As part of the process of preparing our consolidated financial statements, we are required to calculate our income tax provision (benefit) in each of the jurisdictions in which we operate. This process involves estimating our current income tax provision (benefit) together with assessing temporary differences resulting from differing treatment of items for tax and accounting purposes. These differences result in deferred tax assets and liabilities, which are reported on our consolidated balance sheet.
Judgment is required in determining our worldwide income tax provision. In the ordinary course of a global business, there are many transactions and calculations where the ultimate outcome is uncertain. Although we believe our estimates are reasonable, no assurance can be given that the final outcome of these matters will not be different from that which is reflected in our historical income tax provisions and accruals. Such differences could have a material impact on our income tax provision and net income in the period in which such determination is made.
We record a valuation allowance on our deferred tax assets when it is more likely than not that they will not be realized. We have considered future taxable income and ongoing prudent and feasible tax planning strategies in assessing the need for a valuation allowance. In the event we determine that we are able to realize our deferred tax assets in the future in excess of their net recorded amount, an adjustment to the valuation allowance for the deferred tax assets would be recorded and would increase our net income in the period such determination is made. Likewise, should we determine that we will not be able to realize all or part of our net deferred
45
tax assets in the future, an adjustment to the valuation allowance for the deferred tax assets will be recorded and will reduce our net income in the period such determination is made.
In conjunction with our ongoing review of our actual results and anticipated future earnings, we continuously reassess the possibilityadequacy of increasing the valuation allowance currently in place on our deferred tax assets. WeIn 2017, we released $0.8 million valuation allowance againstof $0.1 million recorded on net operating losses and other timing items in certain tax jurisdictions. Further, we released $0.3 million of valuation allowance recorded on certain current year U.S. state net operating loss carryforwards during the year ended December 31, 2015.losses. The decrease of our valuation allowance was determined in accordance with the provisions of ASC 740, “Income Taxes,” which requires an assessment of both positive and negative evidence when determining whether it is more likely than not that deferred tax assets are recoverable. Such assessment is required on a jurisdiction by jurisdiction basis. Based on historical operating income and continuing projected income, future reversals of temporary differences and tax planning strategies, we have concluded that sufficient negative evidence indicates that it is not more likely than not that deferred tax assets will be realized.
The amount of income taxes we pay is subject to audits by federal, state and foreign tax authorities, which may result in proposed assessments. We believe that we have adequately provided for any reasonably foreseeable outcome related to these matters. However, our future results may include favorable or unfavorable adjustments to our tax liabilities in the period that the assessments are made or resolved, or when the statute of limitations for certain periods expires. As of December 31, 2015,2017, the total amount of gross unrecognized tax benefits was $5.5$4.1 million, of which $4.1 million would favorably affect our effective tax rate, if recognized. As of December 31, 2014, the amount of gross unrecognized tax benefits totaled approximately $6.3, of which $4.1$3.4 million would favorably affect our effective tax rate, if recognized. Over the next twelve months, the Company may need to record up to $1.2$0.2 million of previously unrecognized tax benefits in the event of statute of limitations closures.
Income and foreign withholding taxes have not been recognized on the excess of the amount for financial reporting purposes over the tax basis of investments in foreign subsidiaries that are essentially permanent in nature. This amount becomes taxable upon a repatriation of assets from a subsidiary or a sale or liquidation of a subsidiary. The amount of undistributed earnings of foreign subsidiaries totaled $18.2$98.0 million as of December 31, 2015.2017. The estimated unrecognized deferred income and foreign withholding tax liabilitiesliability on this temporary difference is approximately $0.4$0.2 million.
On December 22, 2017, the President of the United States signed into law the U.S. Tax Cuts and Jobs Act (the “Tax Reform Act”). The Tax Reform Act significantly changes U.S. tax law by, among other things, lowering corporate income tax rates, implementing a territorial tax system, providing a one-time transition Toll Charge on foreign earnings, creating a new limitation on deductible interest expense and modifying the officer’s compensation limitation. The Tax Reform Act permanently reduces the U.S. corporate income tax rate from a maximum of 35% to a flat 21% rate, effective January 1, 2018.
The Company’s accounting for the elements of the Tax Reform Act is incomplete. However, the Securities and Exchange Commission has issued guidance that allows for a measurement period of up to one year after the enactment date of the Tax Reform Act to finalize the recording of the related tax impacts. The Company has made reasonable estimates of the effects to the consolidated statements of operations and consolidated balance sheets and has, therefore, recorded provisional amounts. Provisional amounts recorded as of December 31, 2017 are subject to refinement due to various factors including, but not limited to, changes in interpretations, analysis and assumptions made by the Company, additional guidance that may be issued by the U.S. Department of the Treasury and the Internal Revenue Service, and any updates or changes to estimates the Company has utilized to calculate the transition impact. The Company currently anticipates finalizing and recording any resulting adjustments in December 2018.
As a result of the Tax Reform Act, the Company was required to revalue deferred tax assets and liabilities at 21%, the new enacted corporate income tax rate. This revaluation resulted in an additional income tax provision of $2.8 million in income from continuing operations and a corresponding reduction in the deferred tax assets and liabilities in the year ended December 31, 2017. Because of the ownership structure of the Company, the one-time transition Toll Charge on foreign earnings does not apply.
Loss Contingencies. We are subject to legal proceedings, lawsuits and other claims relating to labor, service and other matters arising in the ordinary course of business. Quarterly, weWe review the status of each significant matter and assess our potential financial exposure.exposure on a quarterly basis. If the potential loss from any claim or legal proceeding is considered probable and the amount can be reasonably estimated, we accrue a liability for the estimated loss. Significant judgment is required in both the determination of probability and the determination as to whether an exposure is reasonably estimable. Because of uncertainties related to these matters, accruals are based only on the best information available atas of the time.date of the financial statement. As additional information becomes available, we will reassess the potential liability related to our pending claims and litigation and may revise our estimates. Such revisions in the estimates of the potential liabilities could have a material impact on our results of operations and financial position. We expense legal fees as incurred.
Recent Accounting Pronouncements
See Note 2 to Consolidated Financial Statements for recent accounting pronouncements that could have an effect on us.
46
Item 7A. Quantitative and Qualitative Disclosures about Market Risk
We are exposed to market risk from changes in foreign currency exchange rates and interest rates, which could affect our operating results, financial position and cash flows. We manage our exposure to these market risks through our regular operating and financing activities. We generally do not enter intoaddress market risks from changes in foreign currency exchange rates through a risk management program that includes the use of derivative financial instruments to managemitigate certain balance sheet foreign currency exposure.transaction exposures.
Foreign Currency Exchange Rate Risk and Sensitivity
We are exposed to changes in foreign currency exchange rates which could affect our operating results as well as our financial position and cash flows. The foreign currencies to which we have the most significant exchange rate exposure are the Euro, British Pound and Japanese Yen. The Company manages its foreign currency exposures on a consolidated basis, which allows the Company to analyze exposures globally and take into account offsetting exposures in certain balances. The primary foreign currency denominated transactions include revenue and expenses and the resulting accounts receivable and accounts payable balances reflected on our consolidated balance sheet. Therefore,sheet and with intercompany trading partners that are eliminated in consolidation.
In the changeordinary course of business, we enter into foreign currency contracts for periods consistent with our committed exposures to mitigate the effect of foreign currency movements on transactions denominated in foreign currencies. We do not enter into or hold foreign currency derivative financial instruments for trading or speculative purposes nor do we enter into derivative financial instruments to hedge future cash flows or forecasted transactions. The intent of these economic hedges is to offset gains and losses on the underlying exposures from these currencies, with gains and losses resulting from the foreign currency contracts that hedge these exposures.
We had foreign currency contracts with notional amounts totaling $17.9 million and a fair value of $0.2 million as of December 31, 2017. A hypothetical 10% strengthening of the U.S. dollar compared to foreignagainst other currencies will have either a positive or negative effect on our financial position and results of operations. Historically, our primary exposure has related to transactions denominatedwould result in an approximately $1.7 million decrease in the Euro, British Pound and Japanese Yen.
A hypothetical depreciationfair value of 10% inour foreign currency exchange rate, primarily cumulative translation adjustments from the quoted foreign currency exchange rates as of December 31, 2015 would impact shareholder equity by $11.0 million or 4%. We did not hold foreign currency derivative contracts as of December 31, 2015.2017. By contract, a hypothetical weakening of the U.S. dollar against other currencies would result in an approximately $1.7 million increase in the fair value of our foreign currency contracts as of December 31, 2017.
Interest Rates
Our exposure to market risk associated with changes in interest rates relates primarily to our debt obligations. We have $97.5$237.8 million of outstanding variable rate debt as of December 31, 2015.2017. A 100 basis point increase in interest rates at December 31, 20152017 would increase our annual pre-tax interest expense by approximately $1.0$2.4 million. We do not actively trade derivative financial instruments, but may use them in the future to manage interest rate positions associated with our debt instruments. We did not hold interest rate derivative contracts as of December 31, 2015.
47
Item 8. Financial Statements and Supplementary Data
GSI GROUPNOVANTA INC.
INDEX TO CONSOLIDATED FINANCIAL STATEMENTS
Report of Independent Registered Public Accounting Firm – PricewaterhouseCoopers LLP |
|
|
Consolidated Balance Sheets as of December 31, |
|
|
|
| |
|
| |
|
| |
|
| |
|
|
48
Report of Independent RegisteredRegistered Public Accounting Firm
To the Board of Directors and Stockholders of GSI GroupNovanta Inc.:
In our opinion,Opinions on the Financial Statements and Internal Control over Financial Reporting
We have audited the accompanying consolidated balance sheets of Novanta Inc. and its subsidiaries as of December 31, 2017 and 2016, and the related consolidated statements of operations, comprehensive income, (loss), stockholders’ equity and cash flows for each of the three years in the period ended December 31, 2017, including the related notes (collectively referred to as the “consolidated financial statements”). We also have audited the Company's internal control over financial reporting as of December 31, 2017, based on criteria established in Internal Control - Integrated Framework (2013) issued by the Committee of Sponsoring Organizations of the Treadway Commission (COSO).
In our opinion, the consolidated financial statements referred to above present fairly, in all material respects, the financial position of GSI Group Inc. and its subsidiaries atthe Company as of December 31, 20152017 and December 31, 2014,2016, and the results of their operations and their cash flows for each of the three years in the period ended December 31, 20152017 in conformity with accounting principles generally accepted in the United States of America. Also in our opinion, the Company maintained, in all material respects, effective internal control over financial reporting as of December 31, 2015,2017, based on criteria established in Internal Control - Integrated Framework (2013) issued by the Committee of Sponsoring Organizations of the Treadway Commission (COSO). COSO.
Basis for Opinions
The Company's management is responsible for these consolidated financial statements, for maintaining effective internal control over financial reporting, and for its assessment of the effectiveness of internal control over financial reporting, included in Management’sManagement's Annual Report on Internal ControlsControl Over Financial Reporting appearing under Item 9A. Our responsibility is to express opinions on thesethe Company’s consolidated financial statements and on the Company's internal control over financial reporting based on our integrated audits. We are a public accounting firm registered with the Public Company Accounting Oversight Board (United States) ("PCAOB") and are required to be independent with respect to the Company in accordance with the U.S. federal securities laws and the applicable rules and regulations of the Securities and Exchange Commission and the PCAOB.
We conducted our audits in accordance with the standards of the Public Company Accounting Oversight Board (United States).PCAOB. Those standards require that we plan and perform the audits to obtain reasonable assurance about whether the consolidated financial statements are free of material misstatement, whether due to error or fraud, and whether effective internal control over financial reporting was maintained in all material respects.
Our audits of the consolidated financial statements included performing procedures to assess the risks of material misstatement of the consolidated financial statements, whether due to error or fraud, and performing procedures that respond to those risks. Such procedures included examining, on a test basis, evidence supportingregarding the amounts and disclosures in the consolidated financial statements, assessingstatements. Our audits also included evaluating the accounting principles used and significant estimates made by management, andas well as evaluating the overall presentation of the consolidated financial statement presentation.statements. Our audit of internal control over financial reporting included obtaining an understanding of internal control over financial reporting, assessing the risk that a material weakness exists, and testing and evaluating the design and operating effectiveness of internal control based on the assessed risk. Our audits also included performing such other procedures as we considered necessary in the circumstances. We believe that our audits provide a reasonable basis for our opinions.
As discusseddescribed in Note 2 toManagement’s Annual Report on Internal Control Over Financial Reporting, management has excluded W.O.M. World of Medicine GmbH and Laser Quantum Limited from its assessment of internal control over financial reporting as of December 31, 2017, because they were acquired by the Company in purchase business combinations during 2017. We have also excluded W.O.M. World of Medicine GmbH and Laser Quantum Limited from our audit of internal control over financial reporting. W.O.M. World of Medicine GmbH is a wholly-owned subsidiary, and Laser Quantum Limited is a 76% owned subsidiary, whose total assets and total revenues excluded from management’s assessment and our audit of internal control over financial reporting represent approximately 8% and 7% of total assets, respectively and approximately 9% and 9% of total revenues, respectively, of the related consolidated financial statements, the Company changed the manner in which it accountsstatement amounts as of and for the classification of deferred taxes in the consolidated balance sheets in 2015.year ended December 31, 2017.
Definition and Limitations of Internal Control over Financial Reporting
A company’s internal control over financial reporting is a process designed to provide reasonable assurance regarding the reliability of financial reporting and the preparation of financial statements for external purposes in accordance with generally accepted accounting principles. A company’s internal control over financial reporting includes those policies and procedures that (i) pertain to the maintenance of records that, in reasonable detail, accurately and fairly reflect the transactions and dispositions of the assets of the company; (ii) provide reasonable assurance that transactions are recorded as necessary to permit preparation of financial statements in accordance with generally accepted accounting principles, and that receipts and expenditures of the company are being made only in
49
accordance with authorizations of management and directors of the company; and (iii) provide reasonable assurance regarding prevention or timely detection of unauthorized acquisition, use, or disposition of the company’s assets that could have a material effect on the financial statements.
Because of its inherent limitations, internal control over financial reporting may not prevent or detect misstatements. Also, projections of any evaluation of effectiveness to future periods are subject to the risk that controls may become inadequate because of changes in conditions, or that the degree of compliance with the policies or procedures may deteriorate.
/s/ PricewaterhouseCoopers LLP
Boston, Massachusetts
March 2, 2016February 28, 2018
We have served as the Company’s auditor since 2013.
50
(In thousands of U.S. dollars or shares)
| December 31, |
|
| December 31, |
| December 31, |
|
| December 31, |
| ||||
| 2015 |
|
| 2014 |
| 2017 |
|
| 2016 |
| ||||
ASSETS |
|
|
|
|
|
|
|
|
|
|
|
|
|
|
Current Assets |
|
|
|
|
|
|
|
|
|
|
|
|
|
|
Cash and cash equivalents | $ | 59,959 |
|
| $ | 51,146 |
| $ | 100,057 |
|
| $ | 68,108 |
|
Accounts receivable, net of allowance of $500 and $282, respectively |
| 57,188 |
|
|
| 51,494 |
| |||||||
Accounts receivable, net of allowance of $554 and $565, respectively |
| 81,482 |
|
|
| 63,769 |
| |||||||
Inventories |
| 59,566 |
|
|
| 62,943 |
|
| 91,278 |
|
|
| 59,745 |
|
Income taxes receivable |
| 2,510 |
|
|
| 5,906 |
| |||||||
Deferred tax assets |
| — |
|
|
| 5,971 |
| |||||||
Prepaid income taxes and income taxes receivable |
| 4,387 |
|
|
| 2,058 |
| |||||||
Prepaid expenses and other current assets |
| 5,989 |
|
|
| 5,081 |
|
| 10,675 |
|
|
| 5,570 |
|
Assets of discontinued operations |
| — |
|
|
| 631 |
| |||||||
Total current assets |
| 185,212 |
|
|
| 183,172 |
|
| 287,879 |
|
|
| 199,250 |
|
Property, plant and equipment, net |
| 40,550 |
|
|
| 40,088 |
|
| 61,718 |
|
|
| 35,421 |
|
Deferred tax assets |
| 7,885 |
|
|
| 2,912 |
|
| 7,052 |
|
|
| 8,593 |
|
Other assets |
| 12,673 |
|
|
| 12,134 |
|
| 4,018 |
|
|
| 12,502 |
|
Intangible assets, net |
| 66,269 |
|
|
| 67,242 |
|
| 155,048 |
|
|
| 61,743 |
|
Goodwill |
| 103,456 |
|
|
| 90,746 |
|
| 210,988 |
|
|
| 108,128 |
|
Total assets | $ | 416,045 |
|
| $ | 396,294 |
| $ | 726,703 |
|
| $ | 425,637 |
|
LIABILITIES AND STOCKHOLDERS’ EQUITY |
|
|
|
|
|
|
| |||||||
LIABILITIES, NONCONTROLLING INTEREST AND STOCKHOLDERS’ EQUITY |
|
|
|
|
|
|
| |||||||
Current Liabilities |
|
|
|
|
|
|
|
|
|
|
|
|
|
|
Current portion of long-term debt | $ | 7,385 |
|
| $ | 7,345 |
| $ | 9,119 |
|
| $ | 7,366 |
|
Accounts payable |
| 24,401 |
|
|
| 25,592 |
|
| 39,793 |
|
|
| 32,213 |
|
Income taxes payable |
| 3,985 |
|
|
| 1,189 |
|
| 5,942 |
|
|
| 3,969 |
|
Deferred tax liabilities |
| — |
|
|
| 208 |
| |||||||
Accrued expenses and other current liabilities |
| 21,182 |
|
|
| 19,401 |
|
| 43,314 |
|
|
| 26,948 |
|
Liabilities of discontinued operations |
| — |
|
|
| 324 |
| |||||||
Total current liabilities |
| 56,953 |
|
|
| 54,059 |
|
| 98,168 |
|
|
| 70,496 |
|
Long-term debt |
| 88,426 |
|
|
| 105,030 |
|
| 225,500 |
|
|
| 70,554 |
|
Deferred tax liabilities |
| 449 |
|
|
| 35 |
|
| 25,672 |
|
|
| 1,294 |
|
Income taxes payable |
| 6,071 |
|
|
| 7,097 |
|
| 3,754 |
|
|
| 5,710 |
|
Other liabilities |
| 19,445 |
|
|
| 18,819 |
|
| 15,141 |
|
|
| 18,713 |
|
Total liabilities |
| 171,344 |
|
|
| 185,040 |
|
| 368,235 |
|
|
| 166,767 |
|
Commitments and Contingencies (Note 15) |
|
|
|
|
|
|
| |||||||
Commitments and Contingencies (Note 16) |
|
|
|
|
|
|
| |||||||
Redeemable noncontrolling interest |
| 46,923 |
|
|
| — |
| |||||||
Stockholders’ Equity: |
|
|
|
|
|
|
|
|
|
|
|
|
|
|
Common shares, no par value; Authorized shares: unlimited; Issued and outstanding: 34,345 and 34,219, respectively |
| 423,856 |
|
|
| 423,856 |
| |||||||
Common shares, no par value; Authorized shares: unlimited; Issued and outstanding: 34,595 and 34,458, respectively |
| 423,856 |
|
|
| 423,856 |
| |||||||
Additional paid-in capital |
| 29,225 |
|
|
| 28,590 |
|
| 33,309 |
|
|
| 30,276 |
|
Accumulated deficit |
| (189,550 | ) |
|
| (225,165 | ) |
| (127,740 | ) |
|
| (167,547 | ) |
Accumulated other comprehensive loss |
| (18,830 | ) |
|
| (16,456 | ) |
| (17,880 | ) |
|
| (27,715 | ) |
Total GSI Group Inc. stockholders’ equity |
| 244,701 |
|
|
| 210,825 |
| |||||||
Noncontrolling interest |
| — |
|
|
| 429 |
| |||||||
Total stockholders’ equity |
| 244,701 |
|
|
| 211,254 |
|
| 311,545 |
|
|
| 258,870 |
|
Total liabilities and stockholders’ equity | $ | 416,045 |
|
| $ | 396,294 |
| |||||||
Total liabilities, noncontrolling interest and stockholders’ equity | $ | 726,703 |
|
| $ | 425,637 |
| |||||||
The accompanying notes are an integral part of these consolidated financial statements.
51
CONSOLIDATED STATEMENTS OF OPERATIONS
(In thousands of U.S. dollars or shares, except per share amounts)
| Year Ended December 31, |
| Year Ended December 31, |
| ||||||||||||||||||
| 2015 |
|
| 2014 |
|
| 2013 |
| 2017 |
|
| 2016 |
|
| 2015 |
| ||||||
Revenue | $ | 373,598 |
|
| $ | 364,706 |
|
| $ | 316,910 |
| $ | 521,290 |
|
| $ | 384,758 |
|
| $ | 373,598 |
|
Cost of revenue |
| 215,708 |
|
|
| 214,539 |
|
|
| 184,683 |
|
| 300,759 |
|
|
| 222,306 |
|
|
| 215,708 |
|
Gross profit |
| 157,890 |
|
|
| 150,167 |
|
|
| 132,227 |
|
| 220,531 |
|
|
| 162,452 |
|
|
| 157,890 |
|
Operating expenses: |
|
|
|
|
|
|
|
|
|
|
|
|
|
|
|
|
|
|
|
|
|
|
Research and development and engineering |
| 31,043 |
|
|
| 28,954 |
|
|
| 23,787 |
|
| 41,673 |
|
|
| 32,002 |
|
|
| 31,043 |
|
Selling, general and administrative |
| 82,049 |
|
|
| 84,380 |
|
|
| 76,337 |
|
| 102,025 |
|
|
| 81,691 |
|
|
| 82,049 |
|
Amortization of purchased intangible assets |
| 7,611 |
|
|
| 10,262 |
|
|
| 7,270 |
|
| 12,096 |
|
|
| 8,251 |
|
|
| 7,611 |
|
Restructuring, acquisition and divestiture related costs |
| 8,254 |
|
|
| 1,935 |
|
|
| 5,387 |
|
| 7,542 |
|
|
| 7,945 |
|
|
| 8,254 |
|
Impairment of goodwill and intangible assets |
| — |
|
|
| 41,442 |
|
|
| — |
| |||||||||||
Total operating expenses |
| 128,957 |
|
|
| 166,973 |
|
|
| 112,781 |
|
| 163,336 |
|
|
| 129,889 |
|
|
| 128,957 |
|
Operating income (loss) from continuing operations |
| 28,933 |
|
|
| (16,806 | ) |
|
| 19,446 |
| |||||||||||
Operating income from continuing operations |
| 57,195 |
|
|
| 32,563 |
|
|
| 28,933 |
| |||||||||||
Interest income (expense), net |
| (5,180 | ) |
|
| (5,096 | ) |
|
| (3,468 | ) |
| (7,165 | ) |
|
| (4,559 | ) |
|
| (5,180 | ) |
Foreign exchange transaction gains (losses), net |
| (23 | ) |
|
| 1,281 |
|
|
| (1,301 | ) |
| (447 | ) |
|
| 2,317 |
|
|
| (23 | ) |
Other income (expense), net |
| 2,663 |
|
|
| 2,706 |
|
|
| 1,500 |
|
| 142 |
|
|
| 2,201 |
|
|
| 2,663 |
|
Gain on acquisition of business |
| 26,409 |
|
|
| — |
|
|
| — |
| |||||||||||
Gain on disposal of business |
| 19,629 |
|
|
| — |
|
|
| — |
|
| — |
|
|
| — |
|
|
| 19,629 |
|
Income (loss) from continuing operations before income taxes |
| 46,022 |
|
|
| (17,915 | ) |
|
| 16,177 |
| |||||||||||
Income tax provision (benefit) |
| 10,394 |
|
|
| (1,006 | ) |
|
| 6,200 |
| |||||||||||
Income (loss) from continuing operations |
| 35,628 |
|
|
| (16,909 | ) |
|
| 9,977 |
| |||||||||||
Income from continuing operations before income taxes |
| 76,134 |
|
|
| 32,522 |
|
|
| 46,022 |
| |||||||||||
Income tax provision |
| 13,827 |
|
|
| 10,519 |
|
|
| 10,394 |
| |||||||||||
Income from continuing operations |
| 62,307 |
|
|
| 22,003 |
|
|
| 35,628 |
| |||||||||||
Loss from discontinued operations, net of tax |
| (13 | ) |
|
| (5,607 | ) |
|
| (2,054 | ) |
| — |
|
|
| — |
|
|
| (13 | ) |
Loss on disposal of discontinued operations, net of tax |
| — |
|
|
| (1,726 | ) |
|
| (592 | ) | |||||||||||
Consolidated net income (loss) |
| 35,615 |
|
|
| (24,242 | ) |
|
| 7,331 |
| |||||||||||
Consolidated net income |
| 62,307 |
|
|
| 22,003 |
|
|
| 35,615 |
| |||||||||||
Less: Net income attributable to noncontrolling interest |
| — |
|
|
| (10 | ) |
|
| (22 | ) |
| (2,256 | ) |
|
| — |
|
|
| — |
|
Net income (loss) attributable to GSI Group Inc. | $ | 35,615 |
|
| $ | (24,252 | ) |
| $ | 7,309 |
| |||||||||||
Net income attributable to Novanta Inc. | $ | 60,051 |
|
| $ | 22,003 |
|
| $ | 35,615 |
| |||||||||||
|
|
|
|
|
|
|
|
|
|
|
|
|
|
|
|
|
|
|
|
|
|
|
Earnings (loss) per common share from continuing operations: |
|
|
|
|
|
|
|
|
|
|
| |||||||||||
Earnings per common share from continuing operations (Note 9): |
|
|
|
|
|
|
|
|
|
|
| |||||||||||
Basic | $ | 1.03 |
|
| $ | (0.49 | ) |
| $ | 0.29 |
| $ | 1.14 |
|
| $ | 0.63 |
|
| $ | 1.03 |
|
Diluted | $ | 1.02 |
|
| $ | (0.49 | ) |
| $ | 0.29 |
| $ | 1.13 |
|
| $ | 0.63 |
|
| $ | 1.02 |
|
Loss per common share from discontinued operations: |
|
|
|
|
|
|
|
|
|
|
| |||||||||||
Loss per common share from discontinued operations (Note 9): |
|
|
|
|
|
|
|
|
|
|
| |||||||||||
Basic | $ | (0.00 | ) |
| $ | (0.21 | ) |
| $ | (0.08 | ) | $ | — |
|
| $ | — |
|
| $ | (0.00 | ) |
Diluted | $ | (0.00 | ) |
| $ | (0.21 | ) |
| $ | (0.08 | ) | $ | — |
|
| $ | — |
|
| $ | (0.00 | ) |
Earnings (loss) per common share attributable to GSI Group Inc.: |
|
|
|
|
|
|
|
|
|
|
| |||||||||||
Earnings per common share attributable to Novanta Inc. (Note 9): |
|
|
|
|
|
|
|
|
|
|
| |||||||||||
Basic | $ | 1.03 |
|
| $ | (0.70 | ) |
| $ | 0.21 |
| $ | 1.14 |
|
| $ | 0.63 |
|
| $ | 1.03 |
|
Diluted | $ | 1.02 |
|
| $ | (0.70 | ) |
| $ | 0.21 |
| $ | 1.13 |
|
| $ | 0.63 |
|
| $ | 1.02 |
|
|
|
|
|
|
|
|
|
|
|
|
|
|
|
|
|
|
|
|
|
|
|
|
Weighted average common shares outstanding—basic |
| 34,579 |
|
|
| 34,352 |
|
|
| 34,073 |
|
| 34,817 |
|
|
| 34,694 |
|
|
| 34,579 |
|
Weighted average common shares outstanding—diluted |
| 34,827 |
|
|
| 34,352 |
|
|
| 34,396 |
|
| 35,280 |
|
|
| 34,914 |
|
|
| 34,827 |
|
|
|
|
|
|
|
|
|
|
|
|
|
|
|
|
|
|
|
|
|
|
|
|
Amounts attributable to GSI Group Inc.: |
|
|
|
|
|
|
|
|
|
|
| |||||||||||
Income (loss) from continuing operations | $ | 35,628 |
|
| $ | (16,909 | ) |
| $ | 9,977 |
| |||||||||||
Amounts attributable to Novanta Inc.: |
|
|
|
|
|
|
|
|
|
|
| |||||||||||
Income from continuing operations | $ | 60,051 |
|
| $ | 22,003 |
|
| $ | 35,628 |
| |||||||||||
Loss from discontinued operations |
| (13 | ) |
|
| (7,343 | ) |
|
| (2,668 | ) |
| — |
|
|
| — |
|
|
| (13 | ) |
Net income (loss) | $ | 35,615 |
|
| $ | (24,252 | ) |
| $ | 7,309 |
| |||||||||||
Net income | $ | 60,051 |
|
| $ | 22,003 |
|
| $ | 35,615 |
| |||||||||||
The accompanying notes are an integral part of these consolidated financial statements.
52
CONSOLIDATED STATEMENTS OF COMPREHENSIVE INCOME (LOSS)
(In thousands of U.S. dollars)
| Year Ended December 31, |
| Year Ended December 31, |
| ||||||||||||||||||
| 2015 |
|
| 2014 |
|
| 2013 |
| 2017 |
|
| 2016 |
|
| 2015 |
| ||||||
Consolidated net income (loss) | $ | 35,615 |
|
| $ | (24,242 | ) |
| $ | 7,331 |
| |||||||||||
Consolidated net income | $ | 62,307 |
|
| $ | 22,003 |
|
| $ | 35,615 |
| |||||||||||
Other comprehensive income (loss): |
|
|
|
|
|
|
|
|
|
|
|
|
|
|
|
|
|
|
|
|
|
|
Foreign currency translation adjustments, net of tax (1) |
| (4,083 | ) |
|
| (6,968 | ) |
|
| 54 |
|
| 8,909 |
|
|
| (7,524 | ) |
|
| (4,083 | ) |
Pension liability adjustments, net of tax (2) |
| 1,709 |
|
|
| (3,146 | ) |
|
| 3,353 |
|
| 926 |
|
|
| (1,361 | ) |
|
| 1,709 |
|
Total other comprehensive income (loss) |
| (2,374 | ) |
|
| (10,114 | ) |
|
| 3,407 |
|
| 9,835 |
|
|
| (8,885 | ) |
|
| (2,374 | ) |
Total consolidated comprehensive income (loss) |
| 33,241 |
|
|
| (34,356 | ) |
|
| 10,738 |
| |||||||||||
Total consolidated comprehensive income |
| 72,142 |
|
|
| 13,118 |
|
|
| 33,241 |
| |||||||||||
Less: Comprehensive income attributable to noncontrolling interest |
| — |
|
|
| (10 | ) |
|
| (22 | ) |
| (2,256 | ) |
|
| — |
|
|
| — |
|
Comprehensive income (loss) attributable to GSI Group Inc. | $ | 33,241 |
|
| $ | (34,366 | ) |
| $ | 10,716 |
| |||||||||||
Comprehensive income attributable to Novanta Inc. | $ | 69,886 |
|
| $ | 13,118 |
|
| $ | 33,241 |
| |||||||||||
(1) | The tax effect on this component of comprehensive income was ($94), $36 and $193 |
(2) | The tax effect on this component of comprehensive income was $277, ($462) and $307 |
The accompanying notes are an integral part of these consolidated financial statements.
53
CONSOLIDATED STATEMENTS OF STOCKHOLDERS’ EQUITY
(In thousands of U.S. dollars or shares)
| GSI Group Inc. Stockholders |
|
|
|
|
|
|
|
|
| Novanta Inc. Stockholders |
|
|
|
|
|
|
|
|
| ||||||||||||||||||||||||||||||||||
| Capital Stock |
|
| Additional Paid-In |
|
| Accumulated Other Comprehensive |
|
| Retained Earnings (Accumulated |
|
| Noncontrolling |
|
|
|
|
| Common Shares |
|
| Additional Paid-In |
|
| Accumulated Other Comprehensive |
|
| Accumulated |
|
| Noncontrolling |
|
|
|
|
| ||||||||||||||||||
| # of Shares |
|
| Amount |
|
| Capital |
|
| Income (Loss) |
|
| Deficit) |
|
| Interest |
|
| Total |
| # of Shares |
|
| Amount |
|
| Capital |
|
| Income (Loss) |
|
| Deficit |
|
| Interest |
|
| Total |
| ||||||||||||||
Balance at December 31, 2012 |
| 33,796 |
|
| $ | 423,856 |
|
| $ | 21,924 |
|
| $ | (9,749 | ) |
| $ | (208,222 | ) |
| $ | 397 |
|
| $ | 228,206 |
| |||||||||||||||||||||||||||
Net income |
| — |
|
|
| — |
|
|
| — |
|
|
| — |
|
|
| 7,309 |
|
|
| 22 |
|
|
| 7,331 |
| |||||||||||||||||||||||||||
Issuance of common stock upon vesting of non-vested stock awards |
| 395 |
|
|
| — |
|
|
| — |
|
|
| — |
|
|
| — |
|
|
| — |
|
|
| — |
| |||||||||||||||||||||||||||
Repurchase of common stock |
| (50 | ) |
|
| — |
|
|
| (526 | ) |
|
| — |
|
|
| — |
|
|
| — |
|
|
| (526 | ) | |||||||||||||||||||||||||||
Share-based compensation |
| — |
|
|
| — |
|
|
| 5,624 |
|
|
| — |
|
|
| — |
|
|
| — |
|
|
| 5,624 |
| |||||||||||||||||||||||||||
Net settlement of vested stock awards |
| (150 | ) |
|
| — |
|
|
| (1,495 | ) |
|
| — |
|
|
| — |
|
|
| — |
|
|
| (1,495 | ) | |||||||||||||||||||||||||||
Tax benefit (shortfalls) of vested stock awards |
| — |
|
|
| — |
|
|
| (144 | ) |
|
| — |
|
|
| — |
|
|
| — |
|
|
| (144 | ) | |||||||||||||||||||||||||||
Other comprehensive income, net of tax |
| — |
|
|
| — |
|
|
| — |
|
|
| 3,407 |
|
|
| — |
|
|
| — |
|
|
| 3,407 |
| |||||||||||||||||||||||||||
Balance at December 31, 2013 |
| 33,991 |
|
|
| 423,856 |
|
|
| 25,383 |
|
|
| (6,342 | ) |
|
| (200,913 | ) |
|
| 419 |
|
|
| 242,403 |
| |||||||||||||||||||||||||||
Net loss |
| — |
|
|
| — |
|
|
| — |
|
|
| — |
|
|
| (24,252 | ) |
|
| 10 |
|
|
| (24,242 | ) | |||||||||||||||||||||||||||
Issuance of common stock upon vesting of non-vested stock awards |
| 362 |
|
|
| — |
|
|
| — |
|
|
| — |
|
|
| — |
|
|
| — |
|
|
| — |
| |||||||||||||||||||||||||||
Share-based compensation |
| — |
|
|
| — |
|
|
| 4,659 |
|
|
| — |
|
|
| — |
|
|
| — |
|
|
| 4,659 |
| |||||||||||||||||||||||||||
Net settlement of vested stock awards |
| (134 | ) |
|
| — |
|
|
| (1,666 | ) |
|
| — |
|
|
| — |
|
|
| — |
|
|
| (1,666 | ) | |||||||||||||||||||||||||||
Tax benefit (shortfalls) of vested stock awards |
| — |
|
|
| — |
|
|
| 214 |
|
|
| — |
|
|
| — |
|
|
| — |
|
|
| 214 |
| |||||||||||||||||||||||||||
Other comprehensive loss, net of tax |
| — |
|
|
| — |
|
|
| — |
|
|
| (10,114 | ) |
|
| — |
|
|
| — |
|
|
| (10,114 | ) | |||||||||||||||||||||||||||
Balance at December 31, 2014 |
| 34,219 |
|
|
| 423,856 |
|
|
| 28,590 |
|
|
| (16,456 | ) |
|
| (225,165 | ) |
|
| 429 |
|
|
| 211,254 |
|
| 34,219 |
|
| $ | 423,856 |
|
| $ | 28,590 |
|
| $ | (16,456 | ) |
| $ | (225,165 | ) |
| $ | 429 |
|
| $ | 211,254 |
|
Net income |
| — |
|
|
| — |
|
|
| — |
|
|
| — |
|
|
| 35,615 |
|
|
| — |
|
|
| 35,615 |
|
| — |
|
|
| — |
|
|
| — |
|
|
| — |
|
|
| 35,615 |
|
|
| — |
|
|
| 35,615 |
|
Issuance of common stock upon vesting of non-vested stock awards |
| 398 |
|
|
| — |
|
|
| — |
|
|
| — |
|
|
| — |
|
|
| — |
|
|
| — |
| |||||||||||||||||||||||||||
Repurchase of common stock |
| (122 | ) |
|
| — |
|
|
| (1,627 | ) |
|
| — |
|
|
| — |
|
|
| — |
|
|
| (1,627 | ) | |||||||||||||||||||||||||||
Common stock issued under stock plans |
| 398 |
|
|
| — |
|
|
| — |
|
|
| — |
|
|
| — |
|
|
| — |
|
|
| — |
| |||||||||||||||||||||||||||
Shares withheld for taxes on vested stock awards |
| (150 | ) |
|
| — |
|
|
| (1,941 | ) |
|
| — |
|
|
| — |
|
|
| — |
|
|
| (1,941 | ) | |||||||||||||||||||||||||||
Repurchases of common stock |
| (122 | ) |
|
|
|
|
|
| (1,627 | ) |
|
| — |
|
|
| — |
|
|
| — |
|
|
| (1,627 | ) | |||||||||||||||||||||||||||
Share-based compensation |
| — |
|
|
| — |
|
|
| 4,065 |
|
|
| — |
|
|
| — |
|
|
| — |
|
|
| 4,065 |
|
| — |
|
|
| — |
|
|
| 4,065 |
|
|
| — |
|
|
| — |
|
|
| — |
|
|
| 4,065 |
|
Net settlement of vested stock awards |
| (150 | ) |
|
| — |
|
|
| (1,941 | ) |
|
| — |
|
|
| — |
|
|
| — |
|
|
| (1,941 | ) | |||||||||||||||||||||||||||
Tax benefit (shortfalls) of vested stock awards |
| — |
|
|
| — |
|
|
| 138 |
|
|
| — |
|
|
| — |
|
|
| — |
|
|
| 138 |
|
| — |
|
|
| — |
|
|
| 138 |
|
|
| — |
|
|
| — |
|
|
| — |
|
|
| 138 |
|
Other comprehensive loss, net of tax |
| — |
|
|
| — |
|
|
| — |
|
|
| (2,374 | ) |
|
| — |
|
|
| — |
|
|
| (2,374 | ) |
| — |
|
|
| — |
|
|
| — |
|
|
| (2,374 | ) |
|
| — |
|
|
| — |
|
|
| (2,374 | ) |
Dissolution of minority interest |
| — |
|
|
| — |
|
|
| — |
|
|
| — |
|
|
| — |
|
|
| (429 | ) |
|
| (429 | ) |
| — |
|
|
| — |
|
|
| — |
|
|
| — |
|
|
| — |
|
|
| (429 | ) |
|
| (429 | ) |
Balance at December 31, 2015 |
| 34,345 |
|
| $ | 423,856 |
|
| $ | 29,225 |
|
| $ | (18,830 | ) |
| $ | (189,550 | ) |
| $ | — |
|
| $ | 244,701 |
|
| 34,345 |
|
|
| 423,856 |
|
|
| 29,225 |
|
|
| (18,830 | ) |
|
| (189,550 | ) |
|
| — |
|
|
| 244,701 |
|
Net income |
| — |
|
|
| — |
|
|
| — |
|
|
| — |
|
|
| 22,003 |
|
|
| — |
|
|
| 22,003 |
| |||||||||||||||||||||||||||
Common stock issued under stock plans |
| 351 |
|
|
| — |
|
|
| 181 |
|
|
| — |
|
|
| — |
|
|
| — |
|
|
| 181 |
| |||||||||||||||||||||||||||
Shares withheld for taxes on vested stock awards |
| (129 | ) |
|
| — |
|
|
| (1,789 | ) |
|
| — |
|
|
| — |
|
|
| — |
|
|
| (1,789 | ) | |||||||||||||||||||||||||||
Repurchases of common stock |
| (109 | ) |
|
| — |
|
|
| (1,634 | ) |
|
| — |
|
|
| — |
|
|
| — |
|
|
| (1,634 | ) | |||||||||||||||||||||||||||
Share-based compensation |
| — |
|
|
| — |
|
|
| 4,293 |
|
|
| — |
|
|
| — |
|
|
| — |
|
|
| 4,293 |
| |||||||||||||||||||||||||||
Other comprehensive loss, net of tax |
| — |
|
|
| — |
|
|
| — |
|
|
| (8,885 | ) |
|
| — |
|
|
| — |
|
|
| (8,885 | ) | |||||||||||||||||||||||||||
Balance at December 31, 2016 |
| 34,458 |
|
|
| 423,856 |
|
|
| 30,276 |
|
|
| (27,715 | ) |
|
| (167,547 | ) |
|
| — |
|
|
| 258,870 |
| |||||||||||||||||||||||||||
Net income |
| — |
|
|
| — |
|
|
| — |
|
|
| — |
|
|
| 60,051 |
|
|
| — |
|
|
| 60,051 |
| |||||||||||||||||||||||||||
Adjustment of redeemable noncontrolling interest to estimated redemption value (Note 17) |
| — |
|
|
| — |
|
|
| — |
|
|
| — |
|
|
| (20,244 | ) |
|
| — |
|
|
| (20,244 | ) | |||||||||||||||||||||||||||
Common stock issued under stock plans |
| 228 |
|
|
| — |
|
|
| — |
|
|
| — |
|
|
| — |
|
|
| — |
|
|
| — |
| |||||||||||||||||||||||||||
Shares withheld for taxes on vested stock awards |
| (77 | ) |
|
| — |
|
|
| (2,090 | ) |
|
| — |
|
|
| — |
|
|
| — |
|
|
| (2,090 | ) | |||||||||||||||||||||||||||
Repurchases of common stock |
| (14 | ) |
|
| — |
|
|
| (370 | ) |
|
| — |
|
|
| — |
|
|
| — |
|
|
| (370 | ) | |||||||||||||||||||||||||||
Share-based compensation |
| — |
|
|
| — |
|
|
| 5,493 |
|
|
| — |
|
|
| — |
|
|
| — |
|
|
| 5,493 |
| |||||||||||||||||||||||||||
Other comprehensive income, net of tax |
| — |
|
|
| — |
|
|
| — |
|
|
| 9,835 |
|
|
| — |
|
|
| — |
|
|
| 9,835 |
| |||||||||||||||||||||||||||
Balance at December 31, 2017 |
| 34,595 |
|
| $ | 423,856 |
|
| $ | 33,309 |
|
| $ | (17,880 | ) |
| $ | (127,740 | ) |
| $ | — |
|
| $ | 311,545 |
| |||||||||||||||||||||||||||
The accompanying notes are an integral part of these consolidated financial statements.
54
CONSOLIDATED STATEMENTS OF CASH FLOWS
(In thousands of U.S. dollars)
| Year Ended December 31, |
| Year Ended December 31, |
| ||||||||||||||||||
| 2015 |
|
| 2014 |
|
| 2013 |
| 2017 |
|
| 2016 |
|
| 2015 |
| ||||||
Cash flows from operating activities: |
|
|
|
|
|
|
|
|
|
|
|
|
|
|
|
|
|
|
|
|
|
|
Consolidated net income (loss) | $ | 35,615 |
|
| $ | (24,242 | ) |
| $ | 7,331 |
| |||||||||||
Consolidated net income | $ | 62,307 |
|
| $ | 22,003 |
|
| $ | 35,615 |
| |||||||||||
Less: Loss from discontinued operations, net of tax |
| 13 |
|
|
| 7,333 |
|
|
| 2,646 |
|
| — |
|
|
| — |
|
|
| 13 |
|
Income (loss) from continuing operations |
| 35,628 |
|
|
| (16,909 | ) |
|
| 9,977 |
| |||||||||||
Adjustments to reconcile income (loss) from continuing operations to net cash provided by operating activities of continuing operations: |
|
|
|
|
|
|
|
|
|
|
| |||||||||||
Income from continuing operations |
| 62,307 |
|
|
| 22,003 |
|
|
| 35,628 |
| |||||||||||
Adjustments to reconcile income from continuing operations to net cash provided by operating activities of continuing operations: |
|
|
|
|
|
|
|
|
|
|
| |||||||||||
Depreciation and amortization |
| 19,114 |
|
|
| 23,797 |
|
|
| 19,570 |
|
| 30,758 |
|
|
| 20,357 |
|
|
| 19,114 |
|
Provision for inventory excess and obsolescence |
| 1,934 |
|
|
| 832 |
|
|
| 1,582 |
|
| 1,421 |
|
|
| 3,091 |
|
|
| 1,934 |
|
Impairment of goodwill and intangible assets |
| — |
|
|
| 41,442 |
|
|
| — |
| |||||||||||
Share-based compensation |
| 4,387 |
|
|
| 4,329 |
|
|
| 5,442 |
|
| 5,493 |
|
|
| 4,293 |
|
|
| 4,387 |
|
Deferred income taxes |
| (1,692 | ) |
|
| (6,736 | ) |
|
| 3,886 |
|
| (2,560 | ) |
|
| (1,766 | ) |
|
| (1,692 | ) |
Earnings from equity-method investment |
| (2,657 | ) |
|
| (2,700 | ) |
|
| (1,469 | ) |
| (104 | ) |
|
| (2,191 | ) |
|
| (2,657 | ) |
Dividend from equity-method investment |
| — |
|
|
| 2,341 |
|
|
| — |
| |||||||||||
Gain on acquisition of business |
| (26,409 | ) |
|
| — |
|
|
| — |
| |||||||||||
Gain on disposal of business |
| (19,629 | ) |
|
| — |
|
|
| — |
|
| — |
|
|
| — |
|
|
| (19,629 | ) |
Contingent consideration adjustment |
| 430 |
|
|
| — |
|
|
| — |
| |||||||||||
Gain on sale of fixed assets |
| 36 |
|
|
| (1,707 | ) |
|
| 1 |
| |||||||||||
Contingent consideration adjustments |
| 425 |
|
|
| 1,267 |
|
|
| 430 |
| |||||||||||
Inventory acquisition fair value adjustment |
| 4,754 |
|
|
| 173 |
|
|
| 215 |
| |||||||||||
Non-cash interest expense |
| 935 |
|
|
| 1,379 |
|
|
| 965 |
|
| 825 |
|
|
| 882 |
|
|
| 935 |
|
Other non-cash items |
| 1,408 |
|
|
| 1,586 |
|
|
| 1,230 |
|
| 283 |
|
|
| 813 |
|
|
| 1,192 |
|
Changes in assets and liabilities which provided (used) cash, excluding effects from businesses purchased or classified as held for sale: |
|
|
|
|
|
|
|
|
|
|
|
|
|
|
|
|
|
|
|
|
|
|
Accounts receivable |
| (7,526 | ) |
|
| 3,526 |
|
|
| (1,826 | ) |
| (2,077 | ) |
|
| (6,394 | ) |
|
| (7,526 | ) |
Inventories |
| (3,338 | ) |
|
| (991 | ) |
|
| (1,688 | ) |
| (13,587 | ) |
|
| (2,917 | ) |
|
| (3,338 | ) |
Prepaid expenses and other current assets |
| 902 |
|
|
| (527 | ) |
|
| 854 |
|
| (2,169 | ) |
|
| (1,729 | ) |
|
| 902 |
|
Income taxes receivable |
| 3,431 |
|
|
| (206 | ) |
|
| 10,848 |
| |||||||||||
Prepaid income taxes and income taxes receivable |
| (2,282 | ) |
|
| 462 |
|
|
| 3,431 |
| |||||||||||
Accounts payable, income taxes payable, accrued expenses and other current liabilities |
| 2,167 |
|
|
| (4,698 | ) |
|
| 5,958 |
|
| 8,993 |
|
|
| 10,590 |
|
|
| 2,167 |
|
Other non-current assets and liabilities |
| (2,065 | ) |
|
| (134 | ) |
|
| 849 |
|
| (2,729 | ) |
|
| (1,780 | ) |
|
| (2,065 | ) |
Cash provided by operating activities of continuing operations |
| 33,429 |
|
|
| 43,990 |
|
|
| 56,178 |
|
| 63,378 |
|
|
| 47,788 |
|
|
| 33,429 |
|
Cash used in operating activities of discontinued operations |
| (13 | ) |
|
| (1,701 | ) |
|
| (6,978 | ) |
| — |
|
|
| — |
|
|
| (13 | ) |
Cash provided by operating activities |
| 33,416 |
|
|
| 42,289 |
|
|
| 49,200 |
|
| 63,378 |
|
|
| 47,788 |
|
|
| 33,416 |
|
Cash flows from investing activities: |
|
|
|
|
|
|
|
|
|
|
|
|
|
|
|
|
|
|
|
|
|
|
Purchases of property, plant and equipment |
| (5,552 | ) |
|
| (5,415 | ) |
|
| (4,777 | ) |
| (9,094 | ) |
|
| (8,462 | ) |
|
| (5,552 | ) |
Acquisition of businesses, net of cash acquired and escrow recovery |
| (25,987 | ) |
|
| (88,238 | ) |
|
| (80,773 | ) | |||||||||||
Proceeds from the sale of business, net of transaction costs |
| 29,570 |
|
|
| — |
|
|
| — |
| |||||||||||
Proceeds from the sale of property, plant and equipment |
| 127 |
|
|
| 112 |
|
|
| 253 |
| |||||||||||
Acquisition of businesses, net of cash acquired |
| (168,332 | ) |
|
| (8,958 | ) |
|
| (25,987 | ) | |||||||||||
Acquisition of intangible assets |
| — |
|
|
| (3,980 | ) |
|
| — |
| |||||||||||
Proceeds from sale of business, net of transaction costs |
| — |
|
|
| — |
|
|
| 29,570 |
| |||||||||||
Proceeds from sale of property, plant and equipment |
| 46 |
|
|
| 7,037 |
|
|
| 127 |
| |||||||||||
Cash used in investing activities of continuing operations |
| (1,842 | ) |
|
| (93,541 | ) |
|
| (85,297 | ) |
| (177,380 | ) |
|
| (14,363 | ) |
|
| (1,842 | ) |
Cash provided by investing activities of discontinued operations |
| 209 |
|
|
| 3,768 |
|
|
| 12,341 |
|
| — |
|
|
| 1,498 |
|
|
| 209 |
|
Cash used in investing activities |
| (1,633 | ) |
|
| (89,773 | ) |
|
| (72,956 | ) |
| (177,380 | ) |
|
| (12,865 | ) |
|
| (1,633 | ) |
Cash flows from financing activities: |
|
|
|
|
|
|
|
|
|
|
|
|
|
|
|
|
|
|
|
|
|
|
Borrowings under revolving credit facility |
| 13,000 |
|
|
| 77,000 |
|
|
| 60,000 |
|
| 176,769 |
|
|
| — |
|
|
| 13,000 |
|
Repayments of long-term debt and revolving credit facility |
| (30,500 | ) |
|
| (33,500 | ) |
|
| (38,500 | ) |
| (26,925 | ) |
|
| (16,250 | ) |
|
| (30,500 | ) |
Payments for debt issuance costs |
| — |
|
|
| (712 | ) |
|
| (145 | ) | |||||||||||
Payments of debt issuance costs |
| (655 | ) |
|
| (2,523 | ) |
|
| — |
| |||||||||||
Payments of withholding taxes from stock-based awards |
| (1,941 | ) |
|
| (1,666 | ) |
|
| (1,495 | ) |
| (2,090 | ) |
|
| (1,789 | ) |
|
| (1,941 | ) |
Repurchase of common stock |
| (1,627 | ) |
|
| — |
|
|
| (526 | ) | |||||||||||
Payments of contingent considerations |
| (2,546 | ) |
|
| — |
|
|
| — |
| |||||||||||
Repurchases of common stock |
| (370 | ) |
|
| (1,634 | ) |
|
| (1,627 | ) | |||||||||||
Other financing activities |
| (467 | ) |
|
| (841 | ) |
|
| (760 | ) |
| (853 | ) |
|
| (993 | ) |
|
| (467 | ) |
Cash provided by (used in) financing activities of continuing operations |
| (21,535 | ) |
|
| 40,281 |
|
|
| 18,574 |
|
| 143,330 |
|
|
| (23,189 | ) |
|
| (21,535 | ) |
Cash provided by (used in) financing activities of discontinued operations |
| — |
|
|
| — |
|
|
| — |
|
| — |
|
|
| — |
|
|
| — |
|
Cash provided by (used in ) financing activities |
| (21,535 | ) |
|
| 40,281 |
|
|
| 18,574 |
| |||||||||||
Cash provided by (used in) financing activities |
| 143,330 |
|
|
| (23,189 | ) |
|
| (21,535 | ) | |||||||||||
Effect of exchange rates on cash and cash equivalents |
| (1,435 | ) |
|
| (2,631 | ) |
|
| 374 |
|
| 2,621 |
|
|
| (3,585 | ) |
|
| (1,435 | ) |
Increase (decrease) in cash and cash equivalents |
| 8,813 |
|
|
| (9,834 | ) |
|
| (4,808 | ) | |||||||||||
Increase in cash and cash equivalents |
| 31,949 |
|
|
| 8,149 |
|
|
| 8,813 |
| |||||||||||
Cash and cash equivalents, beginning of year |
| 51,146 |
|
|
| 60,980 |
|
|
| 65,788 |
|
| 68,108 |
|
|
| 59,959 |
|
|
| 51,146 |
|
Cash and cash equivalents, end of year | $ | 59,959 |
|
| $ | 51,146 |
|
| $ | 60,980 |
| $ | 100,057 |
|
| $ | 68,108 |
|
| $ | 59,959 |
|
Supplemental disclosure of cash flow information: |
|
|
|
|
|
|
|
|
|
|
|
|
|
|
|
|
|
|
|
|
|
|
Cash paid for interest | $ | 3,784 |
|
| $ | 3,793 |
|
| $ | 2,291 |
| $ | 5,832 |
|
| $ | 2,917 |
|
| $ | 3,784 |
|
Cash paid for income taxes | $ | 10,688 |
|
| $ | 6,087 |
|
| $ | 2,197 |
| $ | 21,121 |
|
| $ | 14,058 |
|
| $ | 10,688 |
|
Income tax refunds received | $ | 3,939 |
|
| $ | 931 |
|
| $ | 12,607 |
| $ | 337 |
|
| $ | 932 |
|
| $ | 3,939 |
|
Supplemental disclosure of non-cash investing activity: |
|
|
|
|
|
|
|
|
|
|
|
|
|
|
|
|
|
|
|
|
|
|
Accrual for capital expenditures | $ | 1,180 |
|
| $ | 26 |
|
| $ | 184 |
| $ | 1,601 |
|
| $ | 1,253 |
|
| $ | 1,180 |
|
Supplemental disclosure of non-cash financing activity: |
|
|
|
|
|
|
|
|
|
|
| |||||||||||
Assets acquired under capital lease obligation | $ | — |
|
| $ | 10,438 |
|
| $ | — |
| |||||||||||
The accompanying notes are an integral part of these consolidated financial statements.
50
55
NOTES TO CONSOLIDATED FINANCIAL STATEMENTS
AS OF DECEMBER 31, 20152017
1. Organization and Presentation
GSI GroupNovanta Inc. and its subsidiaries (collectively referred to as “Novanta”, the “Company”, “we”, “us”, “our”) design, develop, manufacture and sell precision photonic and motion control components and subsystems to Original Equipment Manufacturers (“OEM’s”) in the medicalis a leading global supplier of core technology solutions that give healthcare and advanced industrial markets. Our highly engineered enabling technologies include CO2 laser sources, laser scanningoriginal equipment manufacturers (“OEMs”) a competitive advantage. We combine deep proprietary technology expertise and beam delivery products, optical data collection and machinecompetencies in photonics, vision technologies, medical visualization and informatics solutions, and precision motion control products. We specialize in collaborating with OEM customersa proven ability to adaptsolve complex technical challenges. This enables Novanta to engineer core components and sub-systems that deliver extreme precision and performance, tailored to our component and subsystem technologies to deliver highly differentiated performance in theircustomers’ demanding applications.
Basis of Presentation
These consolidated financial statements have been prepared by the Company in U.S. dollars and in accordance with U.S.accounting principles generally accepted accounting principles,in the U.S., applied on a consistent basis.
The consolidated financial statements include the accounts of GSI GroupNovanta Inc. and its wholly owned subsidiaries. Intercompany accounts and transactions have been eliminated. In 2015, the Company’s 50% owned joint venture, Excel Laser Technology Private Limited (the “India JV”), was deconsolidated as
Prior to January 10, 2017, the Company sold 100% of its interest in the India JV. The accounts of the India JV were previously included in discontinued operations in the consolidated financial statements.
The Company has ahad an approximately 41% ownership interest in Laser Quantum Ltd.Limited (“Laser Quantum”), a privately held company located in the United Kingdom. The Company records the results of this entityKingdom, which was accounted for under the equity method as it does not haveof accounting. On January 10, 2017, the Company acquired an additional approximately 35% of the outstanding shares of Laser Quantum. As a controlling interestresult of this transaction, the Company’s ownership position in Laser Quantum increased from approximately 41% to approximately 76%. Since January 10, 2017, Laser Quantum has been consolidated in the entity.
The Company has evaluated subsequent events from December 31, 2015 through the date of the issuance of theseCompany’s consolidated financial statements.
Reclassifications
Certain immaterial reclassifications have been made in the consolidated statements and has determined that no material subsequent events have occurred that would affectof cash flows for prior periods to conform to the information presented in these consolidated financial statements.current year presentation.
2. Summary of Significant Accounting Policies
Use of Estimates
The preparation of financial statements in conformity with generally accepted accounting principles requires management to make estimates and assumptions that affect the reported amounts of assets and liabilities, disclosure of contingent assets and liabilities at the dates of the financial statements, and the reported amounts of revenue and expenses during the reporting periods. The Company evaluates its estimates based on historical experience, current conditions and various other assumptions that it believes are reasonable under the circumstances. Estimates and assumptions are reviewed on an on-going basis and the effects of revisions are reflected in the period in which they are deemed to be necessary. The Company evaluates its estimates based on historical experience, current conditions and various other assumptions that it believes are reasonable under the circumstances. Actual results could differ significantly from those estimates.
Foreign Currency Translation
The financial statements of the Company and its subsidiaries outside the United States have been translated into U.S. dollars. Assets and liabilities of foreign operations are translated from foreign currencies into U.S. dollars at the exchange rates in effect onas of the balance sheet date. Revenue and expenses are translated at the weighted average exchange rate in effectrates for the period. Accordingly, gains and losses resulting from translating foreign currency financial statements are reported as cumulative translation adjustment, a separate component of other comprehensive income (loss) in stockholders’ equity. Foreign currency transaction gains and losses, primarily from transactions denominated in currencies other than the functional currency,currencies, are included in the accompanying consolidated statements of operations.
Cash and Cash Equivalents
Cash equivalents primarily money market accounts, are highly liquid investments with original maturities of three months or less. These investments are carried at cost, which approximates fair value.
5156
GSI GROUPNOVANTA INC.
NOTES TO CONSOLIDATED FINANCIAL STATEMENTS — (Continued)
AS OF DECEMBER 31, 20152017
At December 31, 2015 and 2014,Prior to January 10, 2017, the Company had a 41% equity investment inaccounted for Laser Quantum a privately held company located in the United Kingdom. During the second quarter of 2013, the Company’s ownership percentage increased from 25% to 41% as a result of a stock buyback program by Laser Quantum. The Company continues to useunder the equity method to recordof accounting. During the results of this entity as it does not have a controlling interest inyears ended December 31, 2017, 2016 and 2015, the entity. The Company recognized income from its equity method investment income ofamounting to $0.1 million, $2.2 million and $2.7 million, $2.7 million and $1.5 million during 2015, 2014 and 2013, respectively, which iswas included in other income (expense) in the accompanying consolidated statements of operations. TheAt December 31, 2016, the Company’s net investment in Laser Quantum was $10.1$8.5 million and $8.0 million at December 31, 2015 and 2014, respectively, and iswas included in other long-term assets inon the accompanying consolidated balance sheets.sheet.
The summarized financial information for Laser Quantum is as follows (in thousands):
| Year Ended December 31, |
| Year Ended December 31, |
| ||||||||||||||
| 2015 |
|
| 2014 |
|
| 2013 |
| 2016 |
|
| 2015 |
| |||||
Revenue | $ | 25,599 |
|
| $ | 23,013 |
|
| $ | 16,269 |
| $ | 23,526 |
|
| $ | 25,599 |
|
Income from operations | $ | 7,362 |
|
| $ | 7,434 |
|
| $ | 4,720 |
| $ | 5,537 |
|
| $ | 7,362 |
|
Net income | $ | 6,925 |
|
| $ | 6,627 |
|
| $ | 3,745 |
| $ | 5,389 |
|
| $ | 6,925 |
|
| December 31, |
| December 31, |
| ||||||
| 2015 |
|
| 2014 |
| 2016 |
| |||
Total assets (1) | $ | 30,159 |
|
| $ | 25,423 |
| $ | 25,043 |
|
Total liabilities | $ | 2,552 |
|
| $ | 2,482 |
| $ | 1,556 |
|
| (1) | Total assets at December 31, |
In March 2016, the Company received a cash dividend of $2.3 million from Laser Quantum. The dividend was reported as a reduction to the carrying value of the Company’s net investment in Laser Quantum in the balance sheet and a cash inflow from operating activities in the consolidated statement of cash flows.
Accounts Receivable and Allowance for Doubtful Accounts
Accounts receivable are recorded at the invoiced amount. The Company maintainsamounts, net of an allowance for doubtful accounts based on the Company’s best estimate of probable credit losses resulting from the inability of the Company’s customers to make required payments. The Company determines the allowance based on a variety of factors, including the age of amounts outstanding relative to their contractual due date, specific customer factors, and other known risks and economic trends. Charges related to the allowance for doubtful accounts are included as selling, general and administrative expenses and are recorded in the period that the outstanding receivables are determined to be uncollectible. Account balances are charged off against the allowance when the Company believes it is probable that the receivable will not be recovered.
For the years ended December 31, 2015, 20142017, 2016 and 2013,2015, changes in the allowance for doubtful accounts were as follows (in thousands):
| 2015 |
|
| 2014 |
|
| 2013 |
| 2017 |
|
| 2016 |
|
| 2015 |
| ||||||
Balance at beginning of year | $ | 282 |
|
| $ | 575 |
|
| $ | 294 |
| $ | 565 |
|
| $ | 500 |
|
| $ | 282 |
|
Provision charged to selling, general and administrative expenses |
| 285 |
|
|
| 30 |
|
|
| 301 |
|
| 283 |
|
|
| 135 |
|
|
| 285 |
|
Allowance resulting from acquisitions |
| 5 |
|
|
| 52 |
|
|
| 117 |
|
| 52 |
|
|
| 15 |
|
|
| 5 |
|
Write-offs, net of recoveries of amounts previously reserved |
| (29 | ) |
|
| (352 | ) |
|
| (159 | ) |
| (358 | ) |
|
| (82 | ) |
|
| (29 | ) |
Divestiture of JK Lasers |
| (30 | ) |
|
| — |
|
|
| — |
|
| — |
|
|
| — |
|
|
| (30 | ) |
Exchange rate changes |
| (13 | ) |
|
| (23 | ) |
|
| 22 |
|
| 12 |
|
|
| (3 | ) |
|
| (13 | ) |
Balance at end of year | $ | 500 |
|
| $ | 282 |
|
| $ | 575 |
| $ | 554 |
|
| $ | 565 |
|
| $ | 500 |
|
Inventories
Inventories, which include materials and conversion costs, are stated at the lower of cost or market,net realizable value, using the first-in, first-out method. Market is defined as replacementCost includes the cost for rawof purchased materials, inbound freight charges, external and netinternal processing and applicable labor and overhead costs. Net realizable value for other inventories. Demo inventory is recorded at the lowerestimated selling price in the ordinary course of cost or its net realizable value.business, less reasonably predictable costs of completion, disposal and transportation. The Company periodically reviews quantities of inventories on hand and
5257
GSI GROUPNOVANTA INC.
NOTES TO CONSOLIDATED FINANCIAL STATEMENTS — (Continued)
AS OF DECEMBER 31, 20152017
on hand and compares these amounts to the expected use of each product. The Company records a charge to cost of revenue for the amount required to reduce the carrying value of inventory to the net realizable value. Costs associated with the procurement of inventories such as inbound freight charges, purchasing and receiving costs are capitalized in inventory on the consolidated balance sheets.
Property, Plant and Equipment
Property, plant and equipment are recorded at cost, adjusted for any impairment, less accumulated depreciation. The Company uses the straight-line method to calculate the depreciation of its fixed assetsproperty, plant and equipment over their estimated useful lives. Estimated useful lives range from 3 to 30 years for buildings and building improvements and 13 to 10 years for machinery and equipment. Leasehold improvements are depreciated over the lesser of their useful lives or the lease terms, including any renewal period options that are reasonably assured of being exercised. Repairs and maintenance costs are expensed as incurred. Certain costs to develop software for internal use are capitalized when the criteria under Accounting Standards Codification (“ASC”) 350-40, “Internal-Use Software,” are met. Lease arrangements meeting the criteria of ASC 840-30, “Leases – Capital Leases,” are capitalized based on the present value of future minimum lease payments and depreciated over the term of the lease.
In 2016, the Company sold its facilities in Chatsworth, California and Orlando, Florida and recognized a gain of $1.7 million as part of restructuring, acquisition and divestiture related costs.
Goodwill, IntangiblesIntangible Assets and Long-Lived Assets
Goodwill represents the excess of the purchase price over the tangible assets, identifiable intangible assets and assumed liabilities acquired in a business combination. Allocations of the purchase price are based upon a valuation of the fair value of assets and liabilities acquired. Assets acquired and liabilities assumed are recorded at their estimated fair values as of the acquisition date. The fair values of intangible assets are based on valuations using an income approach, with estimates and assumptions provided by management of the acquired companies and the Company. Goodwill and indefinite-lived intangibles are not amortized but are assessed for impairment at least annually to ensure their current fair values exceed their carrying values.
The Company’s most significant intangible assets are customer relationships, patents and acquired technologies, customer relationships, trademarks and trade names. The fair values of intangible assets are based on valuations using an income approach, with estimates and assumptions provided by management of the acquired companies and the Company. The process for estimating the fair values of identifiable intangible assets requires the use of significant estimates and assumptions, including estimating future cash flows and developing appropriate discount rates. All definite-lived intangible assets are amortized over the periods in which their economic benefits are expected to be realized. The Company reviews the useful life assumptions, including the classification of certain intangible assets as “indefinite-lived”, on a periodic basis to determine if changes in circumstances warrant revisions to them. Costs associated with patent and intellectual property applications, renewals or extensions are expensed as incurred.
The Company’s product lines generally correspond with its reporting units which is the level at which the Company evaluates its goodwill, intangible assets and other long-lived assets for impairment.impairment at the reporting unit level which is generally at least one level below our reportable segments.
Impairment Charges
Impairment analyses of goodwill and indefinite-lived intangible assets are conducted in accordance with ASC 350, “Intangibles—Goodwill“Intangibles —Goodwill and Other”. This guidance specifies that goodwill and other intangible assets must be periodically tested for impairment.Other.” The Company testsperforms its goodwill balancesimpairment test annually as of the beginning of the second quarter or more frequently if indicators are present, or changes in circumstances suggest, that an impairment may exist.
The Company utilizeshas the option of first performing a qualitative (“Step 0”) assessment to determine whether it is necessary to perform the quantitative analysistwo-step impairment test. In performing the Step 0 assessment, the Company reviews qualitative factors both specific to the reporting unit and to the Company as a whole, such as financial performance, macroeconomic conditions, industry and market considerations, and the fair value of each reporting unit at the last valuation date. If the Company elects this option and believes, as a result of the Step 0 assessment, that it is more likely than not that the carrying value of the reporting unit exceeds its fair value, the quantitative two-step impairment test goodwill for impairment.is required; otherwise, no further testing is required.
Alternatively, the Company may elect to bypass the Step 0 qualitative assessment and perform the quantitative two-step impairment test. This two-step approach requires a comparison of the carrying value of each of the Company’s reporting units to the estimated fair value of these reporting units. The fair value of a reporting unit is estimated primarily based onusing a discounted cash flow (“DCF”) method with a weighted average cost of capital. If the carrying value of a reporting unit exceeds its fair value, the Company calculates the implied fair value of the reporting unit’s goodwill and compares it to the goodwill’s carrying value. If the carrying value of the goodwill exceeds its implied fair value, an impairment charge is recorded for the difference.
58
NOVANTA INC.
NOTES TO CONSOLIDATED FINANCIAL STATEMENTS — (Continued)
AS OF DECEMBER 31, 2017
The Company assesses indefinite-lived intangible assets for impairment on an annual basis as of the beginning of the second quarter, and more frequently if indicators are present, or changes in circumstances suggest, that an impairment may exist. The Company will also reassess the continuing classification of these indefinite-lived intangible assets as indefinite-lived when circumstances change such that the useful life may no longer be considered indefinite. The fair values of the Company’s indefinite-lived intangible assets are determined using the relief from royalty method, based on forecasted revenues. If the fair value of an indefinite-lived intangible asset is less than its carrying value, an impairment charge is recorded for the difference between the carrying value and the fair value of the impaired asset.
53
GSI GROUP INC.
NOTES TO CONSOLIDATED FINANCIAL STATEMENTS — (Continued)
AS OF DECEMBER 31, 2015
The carrying amounts of definite-lived long-lived assets are reviewed for impairment whenever changes in events or circumstances indicate that their carrying values may not be recoverable. The recoverability of the carrying value is generally determined by comparison of the asset group’s carrying value to its undiscounted future cash flows. When this test indicates thea potential for impairment, a fair value assessment is performed. Once an impairment is determined and measured, an impairment charge is recorded for the difference between the carrying value and the fair value of the impaired asset.
Revenue Recognition
The Company recognizes revenue when persuasive evidence of an arrangement exists, delivery has occurred, price is fixed or determinable, and collection of the resulting receivable is reasonably assured. Revenue recognition requires judgment and estimates, which may affect the amount and timing of revenue recognized in any given period.
The Company’s revenue transactions are comprised of both single-element and multiple-element transactions. Multiple-element transactions may include two or more products, and occasionally non-standard/extended warranties or preventative maintenance plans. For multiple-element transactions, revenue is generally recognized upon shipment, using the relative selling price method in accordance with ASC 605-25, “Revenue – Multiple-Element Arrangements”.Arrangements.” Single-element transactions are typically recognized upon shipment at their contractually stated prices.
The Company generally provides warranties for its products. The standard warranty period is typically 12 months to 24 months for the Laser ProductsPhotonics and Precision Motion segments and 12 months to 36 months for the Vision Technologies segment. The standard warranty period for product sales is accounted for under the provisions of ASC 450, “Contingencies,” as the Company has the ability to ascertain the likelihood of the liability and can estimate the amount of the liability. A provision for the estimated cost related to warranty is recorded to cost of revenue at the time revenue is recognized. The Company’s estimate of costs to service the warranty obligations is based on historical experience and expectations of future conditions. To the extent that the Company experiences warranty claims or costs associated with servicing those claims that differ from the original estimates, revisions to the estimated warranty liability are recorded at that time.
The Company occasionally sells optional non-standard/extended warranty services and preventative maintenance contracts to customers. The Company accounts for these agreements in accordance with provisions of ASC 605-20-25-3, “Separately Priced Extended Warranty and Product Maintenance Contracts,” under which it recognizes the separately priced extended warranty and preventative maintenance fees ratably over the associated period.
The Company, atAt the request of its customers, the Company may perform professional services, generally for the maintenance and repair ofservices on products previously sold to those customers. These services are usually in the form of time and materials based contracts which are short in duration. Revenue for time and materials services is recorded at the completion of services requested under a customer’s purchase order.
Research and Development and Engineering Costs
Research and development and engineering (“R&D”) expenses are primarily comprised of employee related expenses and cost of materials for R&D projects. These costs are expensed as incurred.
Share-Based Compensation
The Company records the expense associated with share-based compensation awards to employees and directors based on the fair value of awards as of the grant date. For stock-based compensation awards that vest over time based on employment, the associated expenses are recognized in the consolidated statements of operations ratably over the vesting period, of the award, net of estimated forfeitures. ForThe Company also grants two types of performance-based awards to certain members of the executive management team: non-GAAP
59
NOVANTA INC.
NOTES TO CONSOLIDATED FINANCIAL STATEMENTS — (Continued)
AS OF DECEMBER 31, 2017
earnings per share performance-based restricted stock units (“EPS-PSUs”) and relative total shareholder return performance-based restricted stock units (“TSR-PSUs”). For EPS-PSUs, stock-based compensation expenses areexpense is recognized ratably over the vesting period when it is probable that the performance targets are expected to be achieved based on management’s projections. Management’s projections are revised, if necessary, in subsequent periods when underlying factors change the evaluation of the probability of achieving the performance targets. Accordingly, share-based compensation expense associated with performance-based restricted stock unitsEPS-PSUs may differ significantly from period to period based on changes toin the probability of achieving performance targets.For TSR-PSUs, the Company recognizes the related compensation expense based on the fair value of the TSR-PSUs, determined using the Monte-Carlo valuation model as of the grant date, on a straight-line basis from the grant date to the end of the performance period. Compensation expense will not be affected by the number of TSR-PSUs that will actually vest at the end of the performance period.
54
GSI GROUP INC.
NOTES TO CONSOLIDATED FINANCIAL STATEMENTS — (Continued)
AS OF DECEMBER 31, 2015
Shipping and handling costs are recorded in cost of revenue.
Advertising Costs
Advertising costs are expensed to selling, general and administrative expenses as incurred and were not material for 2015, 20142017, 2016 and 2013.2015.
Restructuring, Acquisition and Divestiture Related Costs
The Company accountedaccounts for its restructuring activities in accordance with the provisions of ASC 420, “Exit or Disposal Cost Obligations.” The Company makes assumptions related to the amounts of employee severance benefits and related costs, the time period over which facilities will remain vacant, useful lives and residual value of long-lived assets, sublease terms, sublease rental rates and discount rates. Estimates and assumptions are based on the best information available at the time the obligation is recognized. These estimates are reviewed and revised as facts and circumstances dictate.
Acquisition related costs incurred to effect a business combination, including finders’ fees, legal, valuation and other professional or consulting fees, are expensed as incurred. Acquisition related costs also include expenses recognized under earn-out agreements in connection with acquisitions. Expenses associated with divestiture activities, including legal and professional fees directly related to the completion of a business divestiture, are expensed as incurred.
Accounting for Income Taxes
The asset and liability method is used to account for income taxes. Under the asset and liability method, deferred tax assets and liabilities are recognized for the estimated future tax consequences attributable to temporary differences between the financial statement carrying amounts of assets and liabilities and their respective tax bases. This method also requires the recognition of future tax benefits, such as net operating loss carryforwards, to the extent that it is more likely than not that such benefits will be realized. Deferred tax assets and liabilities are measured using enacted tax rates in effect for the year in which the temporary differences are expected to be recovered or settled. A valuation allowance is established to reduce the deferred tax assets if it is more likely than not that some or all of the related tax benefits will not be realized in the future and isfuture. Valuation allowances are reassessed periodically to determine whether it is more likely than not that the tax benefits will be realized in the future and that suchany valuation allowance should be released.
The majority of the Company’s business activities are conducted through its subsidiaries outside of Canada. Earnings from these subsidiaries are generally indefinitely reinvested in the local businesses. Further, local laws and regulations may also restrict certain subsidiaries from paying dividends to their parents. As such, the Company generally does not accrue income taxes for the repatriation of such earnings in accordance with ASC 740, “Income Taxes.” To the extent that there are excess accumulated earnings that the Company intends to repatriate from any such subsidiaries, the Company recognizes deferred tax liabilities on such foreign earnings.
60
NOVANTA INC.
NOTES TO CONSOLIDATED FINANCIAL STATEMENTS — (Continued)
AS OF DECEMBER 31, 2017
The Company assesses its income tax positions and records tax benefits for all years subject to examination based on the evaluation of the facts, circumstances, and information available at each reporting date. For those tax positions with a greater than 50 percent likelihood of being realized upon ultimate settlement with a taxing authority that has full knowledge of all relevant information, the Company records a tax benefit. For those income tax positions that are not likely to be sustained, no tax benefit is recognized in the consolidated financial statements. The Company recognizes interest and penalties related to uncertain tax positions as part of the provision for income taxes.
On December 22, 2017, the President of the United States signed into law the Tax Cuts and Jobs Act (the “Tax Reform Act”). Further information on the tax impacts of the Tax Reform Act is included in Note 14 to the Consolidated Financial Statements.
55Foreign Currency Contracts
The Company uses foreign currency contracts as a part of its strategy to limit its exposures related to foreign currency denominated monetary assets and liabilities. The time duration of these foreign currency contracts approximates the underlying foreign currency transaction exposures, generally less than three months. These contracts are not designated as cash flow, fair value or net investment hedges. Changes in the fair value of these foreign currency contracts are recognized in income from continuing operations.
Recent Accounting Pronouncements
Statement of Cash Flows Classification of Certain Cash Receipts and Cash Payments
In August 2016, the Financial Accounting Standards Board (the “FASB”) issued Accounting Standards Update (“ASU”) 2016-15, “Statement of Cash Flows (Topic 230): Classification of Certain Cash Receipts and Cash Payments,” which provides further clarification on eight cash flow classification issues. ASU 2016-15 further clarifies the classification of the following: (i) debt prepayment or debt extinguishment costs; (ii) settlement of zero-coupon debt instruments or other debt instruments with coupon interest rates that are insignificant in relation to the effective interest rate of the borrowing; (iii) contingent consideration payments made after a business combination; (iv) proceeds from the settlement of insurance claims; (v) proceeds from the settlement of corporate-owned life insurance policies, including bank-owned life insurance policies; (vi) distributions received from equity method investees; (vii) beneficial interests in securitization transactions; and (viii) separately identifiable cash flows and application of the predominance principle. ASU 2016-15 will be effective for fiscal years, and interim periods within those fiscal years, beginning after December 15, 2017, with early adoption permitted. ASU 2016-15 should be applied using a retrospective transition method for each period presented. The Company adopted ASU 2016-15 during the first quarter of 2017. The adoption of ASU 2016-15 resulted in $2.5 million of payments of contingent considerations being reported as cash used in financing activities on the Company’s consolidated statements of cash flows in 2017.
Inventories
In July 2015, the FASB issued ASU 2015-11, “Inventory (Topic 330): Simplifying the Measurement of Inventory,” which simplifies the subsequent measurement of inventories by replacing the current lower of cost or market test with a lower of cost or net realizable value test. ASU 2015-11 will be effective for fiscal years beginning after December 15, 2016, and interim periods within those fiscal years, with early adoption permitted. The Company adopted this pronouncement in the first quarter of 2017. The adoption of ASU-2015-11 did not have a material impact on our consolidated financial statements.
Derivatives and Hedging
In August 2017, the FASB issued ASU 2017-12, “Derivatives and Hedging (Topic 815): Targeted Improvements to Accounting for Hedging Activities,” which amends and simplifies existing guidance in order to better align a company’s risk management activities and financial reporting for hedging relationships through changes to both the designation and measurement guidance for qualifying hedging relationships and the presentation of hedge results in the financial statements. ASU 2017-12 will become effective for fiscal years and interim reporting periods beginning after December 15, 2018, with early adoption permitted. The Company does not expect the adoption of ASU 2017-12 to have a material impact on its consolidated financial statements.
Share-Based Compensation
In May 2017, the FASB issued ASU 2017-09, “Compensation – Stock Compensation (Topic 718),” which provides guidance about which changes to the terms or conditions of a share-based payment award require an entity to apply modification accounting in
61
GSI GROUPNOVANTA INC.
NOTES TO CONSOLIDATED FINANCIAL STATEMENTS — (Continued)
AS OF DECEMBER 31, 20152017
Recent Accounting Pronouncements
Reporting Discontinued Operations and Disclosures of Disposals of Components of an Entity
In April 2014, the Financial Accounting Standards Board (“FASB”) issued Accounting Standards Update (“ASU”) 2014-08, “Reporting Discontinued Operations and Disclosures of Disposals of Components of an Entity.”Topic 718. ASU 2014-08 provides guidance on determining when disposals can be presented as discontinued operations. ASU 2014-082017-09 requires that only disposals representing a strategic shift that has (or will have) a major effect on an entity’s operations and financial results should be presented as discontinued operations. A strategic shift may include a disposalentity account for the effects of a major linemodification unless (i) the fair value of business, a majorthe modified award is the same as the fair value of the original award immediately before the original award is modified; (ii) the vesting conditions of the modified award are the same as the vesting conditions of the original award immediately before the original award is modified; and (iii) the classification of the modified award as an equity method investmentinstrument or a major partliability instrument is the same as the classification of an entity. Additionally,the original award immediately before the original award is modified. ASU 2014-08 requires expanded disclosures regarding discontinued operations. ASU 2014-08 is2017-09 will become effective prospectively for reportingfiscal years, and interim periods within those fiscal years, beginning after December 15, 2014. The Company adopted this pronouncement in January 2015.
Simplifying the Presentation of Debt Issuance Costs
In April 2015, the FASB issued ASU 2015-03, “Simplifying the Presentation of Debt Issuance Costs.” ASU 2015-03 requires debt issuance related costs to be presented in the balance sheet as a direct reduction to the carrying amount of the associated debt liability, consistent with the presentation of a debt discount. The Company adopted the provisions of ASU 2015-03 retrospectively as of the fiscal quarter ended October 2, 2015. Prior period amounts have been reclassified to conform to the current period presentation. As of December 31, 2014, $0.2 million of debt issuance costs were reclassified from prepaid expenses and other current assets to current portion of long-term debt and $2.5 million was reclassified from other long-term assets to long-term debt in the consolidated balance sheet. Other than these reclassifications, the adoption of ASU 2015-03 did not have an impact on the Company’s consolidated financial statements.
Customer’s Accounting for Fees Paid in a Cloud Computing Arrangement
In April 2015, the FASB issued ASU 2015-05, “Customer’s Accounting for Fees Paid in a Cloud Computing Arrangement,” which provides guidance to customers about whether a cloud computing arrangement includes a software license. If a cloud computing arrangement includes a software license, the customer should account for the software license element of the arrangement consistent with the acquisition of other software licenses. If a cloud computing arrangement does not include a software license, the customer should account for the arrangement as a service contract. ASU 2015-05 will be effective for annual and interim reporting periods beginning after December 15, 2015,2017, with early adoption permitted. Upon adoption, an entity may apply the new guidance either retrospectively or prospectively to all arrangements entered into or materially modified after the effective date. The Company does not expect the adoption of ASU 2015-052017-09 to have a material impact on its consolidated financial statements.
Presentation of Net Periodic Pension Cost
In March 2017, the FASB issued ASU 2017-07, “Compensation – Retirement Benefits (Topic 715): Improving the Presentation of Net Periodic Pension Cost and Net Periodic Postretirement Benefit Cost,” which requires employers that offer or maintain defined benefit plans to disaggregate the service component from the other components of net benefit cost and provides guidance on the presentation of the service component and the other components of net benefit cost in the statement of operations. The new standard is effective for public companies for annual periods beginning after December 15, 2017. The Company will adopt the new standard in the first quarter of 2018 and will report its net periodic pension cost related to its frozen U.K. pension plan, consisting of interest cost, expected return on plan assets and amortization of actuarial gains (losses) only, in other income (expense) in the consolidated statement of operations upon adoption. The adoption will not have a material impact on the Company’s consolidated financial statements.
Business CombinationsGoodwill Impairment
In September 2015,January 2017, the FASB issued ASU 2015-16, “Business Combinations,2017-04, “Intangibles – Goodwill and Other (Topic 350): Simplifying the Test for Goodwill Impairment,” which simplifies the accounting for goodwill impairment. The amendment in ASU 2017-04 removes Step-two of the goodwill impairment test, which requires a hypothetical purchase price allocation. ASU 2017-04 will become effective prospectively for fiscal years, and interim periods within those fiscal years, beginning after December 15, 2019, with early adoption permitted. The Company is currently evaluating the impact of the new standard on its consolidated financial statements.
Income Taxes
In October 2016, the FASB issued ASU 2016-16, “Income Taxes (Topic 740): Intra-Entity Transfers of Assets Other Than Inventory,” which requires an acquirerentity to recognize adjustments to provisional amounts that are identified during the measurement period in the reporting period in which the adjustment amounts are determined. ASU 2015-16 requires an entity to present separately on the face of the income statement or disclose intax consequences of an intra-entity transfer of an asset other than inventory when the notes the portion of the amount recorded in current-period earnings by line item that would have been recorded in previous reportingtransfer occurs. ASU 2016-16 is effective for fiscal years, and interim periods if the adjustment had been recognized at the acquisition date. ASU 2015-16 will be effective prospectively for reporting periodswithin those fiscal years, beginning after December 15, 2015. The Company does not expect the2017. Upon adoption of ASU 2015-062016-16, an entity should apply the guidance on a modified retrospective basis through a cumulative-effect adjustment directly to have a material impact onretained earnings as of the Company’s consolidated financial statements.
Balance Sheet Classificationbeginning of Deferred Taxes
In November 2015, the FASB issued ASU 2015-17, “Income Taxes – Balance Sheet Classificationperiod of Deferred Taxes,” which simplifies the presentation of deferred income taxes. Underadoption. The Company will adopt the new standard both deferred taxin the first quarter of 2018. The adoption of this guidance is expected to reduce total assets and liabilities are required to be classified as noncurrent in a classified balance sheet. ASU 2015-17 will become effective for annual and interim reporting periods beginning after December 15, 2016, with early adoption allowed. The Company elected to early adopt the provisions of ASU 2015-17 using the prospective method and reported both current and noncurrent deferred tax assets and liabilities as noncurrent on the accompanying consolidated balance sheet as of December 31, 2015. The prior year balances were not retrospectively adjusted.stockholders’ equity by $2.6 million.
Leases
56
GSI GROUP INC.
NOTES TO CONSOLIDATED FINANCIAL STATEMENTS — (Continued)
AS OF DECEMBER 31, 2015
In February 2016, the FASB issued ASU 2016-02, “Leases (Topic 842),” which provides comprehensive lease accounting guidance. The standard requires entities to recognize lease assets and liabilities on the balance sheet and to disclose key information about leasing arrangements. ASU 2016-02 will become effective for fiscal years, and interim periods within those fiscal years, beginning after December 15, 2018, with early adoption allowed.permitted. The Company is currently evaluating the impact of the newpotential impact of this guidance and an appropriate implementation strategy. While the Company’s evaluation of this guidance is in the early stages, the Company currently expects that the adoption of this guidance will result in a gross-up of assets and liabilities on ourits consolidated financial statements.balance sheet.
Revenue from Contracts with Customers
62
NOVANTA INC.
NOTES TO CONSOLIDATED FINANCIAL STATEMENTS — (Continued)
AS OF DECEMBER 31, 2017
In May 2014, the FASB issued ASU 2014-09, “Revenue from Contracts with Customers,”Customers” (“ASU 2014-09” or “Topic 606”), which provides new guidance for revenue recognition. ASU 2014-09 supersedes the revenue recognition requirements in ASC 605, “Revenue Recognition (Topic 605),” and requires entities to recognize revenue in a way that depicts the transfer of goods or services to customers at an amount that reflects the consideration to which the entity expects to be entitled in exchange for those goods or services. As amended by ASU 2015-14, “Revenue from Contracts with Customers – Deferral of the Effective Date,” ASU 2014-09 will be effective for annual and interim reporting periods beginning after December 15, 2016. Early2017. Upon adoption is not permitted. Upon adoption,of Topic 606, an entity may apply the new guidance either retrospectively to each prior reporting period presented (the “full retrospective method”) or retrospectively only to customer contracts not yet completed as of the date of adoption with the cumulative effect of initially applying the standard recognized in beginning retained earnings at the date of the initial application. In August 2015, the FASB issued ASU 2015-14, “Revenue from Contracts with Customers – Deferral of the Effective Date,” which defers the effective date of ASU 2014-09 by one year, with the option of early adoption as of the original effective date. The amendment in ASU 2015-14 will result in ASU 2014-09 being effective for annual and interim reporting periods beginning after December 15, 2017. application (the “modified retrospective method”).
The Company is currently evaluatinghas conducted various activities to prepare for the impactadoption of the new standard on the Company’s consolidated financial statements.
Disclosure of Uncertainties about an Entity’s Ability to Continue as a Going Concern
In August 2014, the FASB issued ASU 2014-15, "Presentation of Financial Statements - Going Concern (Subtopic 205-40)," which requires management to assess a company’s ability to continue as a going concern and to provide related footnote disclosures in certain circumstances. ASU 2014-15 will be effective for annual reporting periods ending after December 15, 2016. Early application is permitted.standard. The Company does not expectsurveyed cross-functional leaders to identify potential revenue streams that could be impacted by Topic 606 and identified certain revenue streams that could be affected. The Company also reviewed a representative sample of individual customer contracts related to these various revenue streams to determine if the guidance under Topic 606 is expected to have a material impact on revenue recognition. The Company’s work indicates the adoption of ASU 2014-15Topic 606 is not expected to change the revenue recognition method on any material revenue streams of the Company and is not expected to have ana material impact on the Company’s consolidated financial statements.
The Company will adopt the new standard in the first quarter of 2018, using the modified retrospective method. In addition, the Company will elect to apply certain practical expedients allowed under the guidance. First, the Company does not intend to adjust the promised amount of consideration for the effects of a financing component because the transfer of a promised good to a customer and the customer’s payment for that good are typically expected to be one year or less. Second, the Company will exclude from its transaction price any amounts collected from customers for all sales tax or other similar taxes, which is consistent with the Company’s current practice. Third, the Company will elect to account for shipping and handling activities that occur after the transfer of control over the related goods as fulfillment activities rather than performance obligations.
57
3. Business Combinations
2017 Acquisitions
WOM
On July 3, 2017, the Company acquired 100% of the outstanding shares of W.O.M. World of Medicine GmbH (“WOM”), a Berlin, Germany-based provider of medical insufflators, pumps, and related disposables for OEMs in the minimally invasive surgery market, for a total purchase price of €118.1 million ($134.9 million). The acquisition was financed with a €118.0 million ($134.8 million) draw-down on the Company’s revolving credit facility. The Company expects that the addition of WOM will help the Company to better serve customers in minimally invasive surgery applications with a broader range of product offerings. WOM is included in the Company’s Vision reportable segment.
The acquisition of WOM has been accounted for as a business combination. The allocation of the purchase price is based upon a valuation of assets acquired and liabilities assumed. Assets acquired and liabilities assumed have been recorded at their estimated fair values as of the acquisition date. The Company’s estimates and assumptions in determining the estimated fair values of certain assets and liabilities are subject to change within the measurement period (up to one year from the acquisition date) as a result of additional information obtained with regard to facts and circumstances that existed as of the acquisition date. The purchase price allocation is preliminary as the Company is in the process of collecting additional information for the valuation of accrued liabilities and unrecognized tax benefits.
63
GSI GROUPNOVANTA INC.
NOTES TO CONSOLIDATED FINANCIAL STATEMENTS — (Continued)
AS OF DECEMBER 31, 20152017
Based upon a preliminary valuation, the total purchase price allocation is as follows (in thousands):
| Amount |
| ||
Cash | $ | 1,400 |
| |
Accounts receivable |
| 11,807 |
| |
Inventories |
| 14,549 |
| |
Property, plant and equipment |
| 21,940 |
| |
Intangible assets |
| 59,732 |
| |
Goodwill |
| 55,632 |
| |
Other assets |
| 2,660 |
| |
Total assets acquired |
| 167,720 |
| |
|
|
|
| |
Accounts payable |
| 4,398 |
| |
Other liabilities |
| 8,681 |
| |
Deferred tax liabilities |
| 19,707 |
| |
Total liabilities assumed |
| 32,786 |
| |
Total assets acquired, net of liabilities assumed |
| 134,934 |
| |
Less: cash acquired |
| 1,400 |
| |
Total purchase price, net of cash acquired | $ | 133,534 |
| |
| ||||
The fair value of intangible assets is comprised of the following (dollar amounts in thousands):
|
|
|
|
| Weighted Average |
| Estimated Fair |
|
| Amortization | |
| Value |
|
| Period | |
Developed technologies | $ | 21,586 |
|
| 10 years |
Customer relationships |
| 35,634 |
|
| 12 years |
Trademarks and trade names |
| 2,284 |
|
| 10 years |
Backlog |
| 228 |
|
| 1 year |
Total | $ | 59,732 |
|
|
|
The purchase price allocation resulted in $59.7 million of identifiable intangible assets and $55.6 million of goodwill. As the WOM acquisition is an acquisition of outstanding common shares, none of the resulting goodwill is deductible for tax purposes. Intangible assets are being amortized over their weighted average useful lives primarily based upon the pattern in which anticipated economic benefits from such assets are expected to be realized. The goodwill recorded represents the anticipated incremental value of future cash flows attributable to: (i) WOM’s ability to grow its business with existing and new customers, including leveraging the Company’s customer base; and (ii) cost improvements due to expansion in scale.
The operating results of WOM were included in the Company’s results of operations beginning on July 3, 2017. WOM contributed revenues of $49.4 million and an operating loss from continuing operations before income taxes of $1.2 million for the year ended December 31, 2017. Operating loss from continuing operations before income taxes for the year ended December 31, 2017 included amortization of inventory fair value adjustments and amortization of purchased intangible assets of $6.0 million.
Laser Quantum
On January 10, 2017, the Company acquired an additional approximately 35% of the outstanding shares of Laser Quantum, a Manchester, United Kingdom-based provider of solid state continuous wave lasers, ultrafast lasers, and optical light engines to OEMs in the medical market, for £25.5 million ($31.1 million) in cash consideration. The purchase price was financed with cash on hand and a $30.0 million draw-down on the Company’s revolving credit facility. As a result of this transaction, the Company’s ownership position in Laser Quantum increased from approximately 41% to approximately 76%. By establishing control through a majority equity ownership, the Company expects to broaden its technology capability in photonics solutions for medical applications, particularly within the growing DNA sequencing market, while providing key enabling photonics-based technologies for instrumentation and life science applications such as biomedical imaging, cell sorting, and ophthalmology. Laser Quantum is included in the Company’s Photonics reportable segment.
64
NOVANTA INC.
NOTES TO CONSOLIDATED FINANCIAL STATEMENTS — (Continued)
AS OF DECEMBER 31, 2017
3. Business CombinationsAs part of this transaction, the Company and the remaining shareholders of Laser Quantum entered into a call and put option agreement for the purchase and sale, in 2020, of all the remaining Laser Quantum shares held by the remaining shareholders, subject to certain conditions. The purchase price for the remaining shares will be based on the proportionate share of the noncontrolling interest (“NCI”) in Laser Quantum’s cash on hand as of December 31, 2019 and a multiple of Laser Quantum’s EBITDA for the twelve months ending December 31, 2019, as defined in the call and put option agreement.
In connection with the purchase price allocation, upon gaining control over Laser Quantum, the Company recognized a nontaxable gain of $26.4 million in the consolidated statement of operations for the twelve months ended December 31, 2017. The gain represented the excess of the fair value of the Company’s previously-held equity interest in Laser Quantum over its carrying value upon gaining control.
The fair value of the approximately 41% equity interest previously held by the Company before the acquisition and the fair value of the approximately 24% NCI held by the remaining shareholders of Laser Quantum after the acquisition were determined using a combination of the discounted cash flow method (an income approach), the guideline public company method (a market approach), and the subject company transaction method (a market approach). The subject company transaction method was based on the purchase price paid by the Company for the acquisition of the additional approximately 35% of the outstanding shares, while giving consideration to the control and/or minority nature of the subject equity interests.
The acquisition of the additional equity interest in Laser Quantum has been accounted for as a business combination. The allocation of the purchase price is based upon a valuation of assets acquired and liabilities assumed. Assets acquired and liabilities assumed have been recorded at their estimated fair values as of the acquisition date.
The final purchase price allocation is as follows (in thousands):
Amount |
| ||
Cash | $ | 15,343 |
|
Accounts receivable |
| 2,739 |
|
Inventories |
| 6,264 |
|
Property, plant and equipment |
| 2,286 |
|
Intangible assets |
| 38,955 |
|
Goodwill |
| 31,168 |
|
Other assets |
| 717 |
|
Total fair value of assets |
| 97,472 |
|
|
|
|
|
Accounts payable |
| 796 |
|
Other liabilities |
| 2,068 |
|
Deferred tax liabilities |
| 7,337 |
|
Total fair value of liabilities |
| 10,201 |
|
Total fair value of assets, net of fair value of liabilities |
| 87,271 |
|
Less: fair value of equity interest previously held by Novanta |
| 34,637 |
|
Less: fair value of noncontrolling interest |
| 21,582 |
|
Total purchase price paid by Novanta |
| 31,052 |
|
Less: cash acquired |
| 15,343 |
|
Purchase price, net of cash acquired | $ | 15,709 |
|
65
NOVANTA INC.
NOTES TO CONSOLIDATED FINANCIAL STATEMENTS — (Continued)
AS OF DECEMBER 31, 2017
The fair value of intangible assets is comprised of the following (dollar amounts in thousands):
|
|
|
|
| Weighted Average |
| Estimated Fair |
|
| Amortization | |
| Value |
|
| Period | |
Developed technologies | $ | 15,501 |
|
| 15 years |
Customer relationships |
| 19,990 |
|
| 15 years |
Trademarks and trade names |
| 1,964 |
|
| 15 years |
Backlog |
| 1,500 |
|
| 9 months |
Total | $ | 38,955 |
|
|
|
The purchase price allocation resulted in $39.0 million of identifiable intangible assets and $31.2 million of goodwill. As the Laser Quantum acquisition is an acquisition of outstanding common shares, none of the resulting goodwill is deductible for tax purposes. Intangible assets are being amortized over their weighted average useful lives primarily based upon the pattern in which anticipated economic benefits from such assets are expected to be realized. The goodwill recorded represents the anticipated incremental value of future cash flow potential attributable to: (i) Laser Quantum’s ability to grow its business with existing and new customers, including leveraging the Company’s broader customer base; and (ii) cost improvements due to expansion in scale.
The operating results of Laser Quantum were included in the Company’s results of operations beginning on January 10, 2017. Laser Quantum contributed revenues of $44.7 million and income from continuing operations before income taxes of $11.3 million for the year ended December 31, 2017. Operating income from continuing operations before income taxes for the year ended December 31, 2017 included $7.1 million of expenses associated with the amortization of inventory fair value step-up and purchased intangible assets.
ThingMagic
On January 10, 2017, the Company acquired from Trimble Inc. certain assets and liabilities that constituted the business of ThingMagic, a Woburn, Massachusetts-based provider of ultra-high frequency (“UHF”) radio frequency identification (“RFID”) modules and finished RFID readers to OEMs in the medical and advanced industrial markets, for a total purchase price of $19.1 million. The acquisition was financed with cash on hand and a $12.0 million draw-down on the Company’s revolving credit facility. The Company expects that the addition of ThingMagic will broaden its portfolio of RFID solutions, while providing the resources to address the growing need for improvements in workflow solutions, patient safety, anti-counterfeiting, and asset tracking in a medical environment. ThingMagic is included in the Company’s Vision reportable segment.
The acquisition of ThingMagic has been accounted for as a business combination. The allocation of the purchase price is based upon a valuation of assets acquired and liabilities assumed. Assets acquired and liabilities assumed have been recorded at their estimated fair values as of the acquisition date.
The final purchase price allocation is as follows (in thousands):
Amount |
| ||
Inventories | $ | 1,832 |
|
Intangible assets |
| 7,423 |
|
Goodwill |
| 9,929 |
|
Total assets acquired |
| 19,184 |
|
|
|
|
|
Other liabilities |
| 95 |
|
Total liabilities assumed |
| 95 |
|
Total purchase price | $ | 19,089 |
|
66
NOVANTA INC.
NOTES TO CONSOLIDATED FINANCIAL STATEMENTS — (Continued)
AS OF DECEMBER 31, 2017
The fair value of intangible assets is comprised of the following (dollar amounts in thousands):
|
|
|
|
| Weighted Average |
| Estimated Fair |
|
| Amortization | |
| Value |
|
| Period | |
Developed technologies | $ | 4,600 |
|
| 10 years |
Customer relationships |
| 2,520 |
|
| 10 years |
Trademarks and trade names |
| 303 |
|
| 5 years |
Total | $ | 7,423 |
|
|
|
The purchase price allocation resulted in $7.4 million of identifiable intangible assets and $9.9 million of goodwill. As the ThingMagic acquisition is treated as an acquisition of assets for income tax purposes, the goodwill acquired is expected to be fully deductible for tax purposes. Intangible assets are being amortized over their weighted average useful lives primarily based upon the pattern in which anticipated economic benefits from such assets are expected to be realized. The goodwill recorded represents the anticipated incremental value of future cash flows potentially attributable to: (i) ThingMagic’s ability to grow its business with existing and new customers, including leveraging the Company’s customer base; (ii) cost synergies in combining the research and development capabilities from ThingMagic with the existing RFID capabilities within Novanta; and (iii) cost improvements due to the integration of ThingMagic operations into the Company’s existing infrastructure.
The operating results of ThingMagic were included in the Company’s results of operations beginning on January 10, 2017. ThingMagic contributed revenues of $8.6 million and operating income from continuing operations before income taxes of $0.4 million for the year ended December 31, 2017. Operating income from continuing operations before income taxes for the year ended December 31, 2017 included amortization of inventory fair value adjustments and amortization of purchased intangible assets of $1.5 million.
The pro forma financial information reflecting the operating results of ThingMagic, as if it had been acquired as of January 1, 2016, would not differ materially from the operating results of the Company as reported for the year ended December 31, 2016.
Unaudited Pro Forma Information
The unaudited pro forma information presented below includes the effects of business combination accounting resulting from the acquisitions of WOM and Laser Quantum, including amortization of inventory fair value adjustments, amortization of intangible assets, interest expense on borrowings in connection with the acquisitions, elimination of the gain from the Laser Quantum acquisition and income from the Company’s previous equity method investment in Laser Quantum, and the related tax effects, as though the acquisitions had been consummated as of January 1, 2016. The unaudited pro forma financial information is presented for comparative purposes only and is not necessarily indicative of the results of operations that actually would have been achieved if the acquisitions had taken place on January 1, 2016.
|
|
| |||||
| Year Ended December 31, |
| |||||
| 2017 |
|
| 2016 |
| ||
Revenue | $ | 562,818 |
|
| $ | 487,960 |
|
Income from continuing operations | $ | 39,630 |
|
| $ | 21,020 |
|
Earnings per share attributable to Novanta Inc. – Basic (1) | $ | 0.49 |
|
| $ | 0.62 |
|
Earnings per share attributable to Novanta Inc. – Diluted (1) | $ | 0.49 |
|
| $ | 0.61 |
|
(1) | The computation of pro forma earnings per share attributable to Novanta Inc. included $20.2 million and zero adjustment of redeemable noncontrolling interest to estimated redemption value for the years ended December 31, 2017 and 2016, respectively. |
Pro forma earnings during the year ended December 31, 2017 were adjusted to exclude non-recurring items such as amortization of inventory fair value adjustments of $4.4 million, acquisition related costs of $4.3 million, the gain on business acquisition of $26.4 million and income from equity method investment of $0.1 million. Pro forma earnings during the year ended December 31, 2017
67
NOVANTA INC.
NOTES TO CONSOLIDATED FINANCIAL STATEMENTS — (Continued)
AS OF DECEMBER 31, 2017
were adjusted to include an increase in amortization of intangible assets of $5.3 million and an increase in interest expense of $1.4 million associated with borrowings under the Company’s revolving credit facility used to fund the acquisitions.
Pro forma earnings during the year ended December 31, 2016 were adjusted to exclude non-recurring items such as acquisition related costs of $1.2 million and income from equity method investment of $2.2 million. Pro forma earnings during the year ended December 31, 2016 were adjusted to include an increase in amortization of intangible assets of $12.5 million and an increase in interest expense of $3.9 million associated with borrowings under the Company’s revolving credit facility used to fund the acquisitions.
2016 Acquisitions
Reach
On May 24, 2016, the Company acquired 100% of the outstanding stock of Reach Technology Inc. (“Reach”), a Fremont, California-based provider of embedded touch screen technology solutions for OEMs in the medical and advanced industrial markets, for a total purchase price of $9.4 million. The Company expects that the addition of Reach will enable the Company to enhance its value proposition with medical OEM customers by adding Reach’s high-performance touch screen solutions to its product offerings.
The final purchase price allocation is as follows (in thousands):
| Amount |
| |
Cash | $ | 238 |
|
Accounts receivable |
| 991 |
|
Inventory |
| 1,611 |
|
Prepaid expenses and other current assets |
| 12 |
|
Intangible assets |
| 3,953 |
|
Goodwill |
| 4,715 |
|
Total assets acquired |
| 11,520 |
|
|
|
|
|
Accounts payable |
| 280 |
|
Other liabilities |
| 148 |
|
Deferred tax liabilities |
| 1,474 |
|
Total liabilities assumed |
| 1,902 |
|
Total assets acquired, net of liabilities assumed |
| 9,618 |
|
Less: cash acquired |
| 238 |
|
Total purchase price, net of cash acquired | $ | 9,380 |
|
The fair value of intangible assets is comprised of the following (dollar amounts in thousands):
|
|
|
|
| Weighted Average |
| Estimated Fair |
|
| Amortization | |
| Value |
|
| Period | |
Customer relationships | $ | 2,770 |
|
| 15 years |
Developed technology |
| 500 |
|
| 7 years |
Trademarks and trade names |
| 258 |
|
| 10 years |
Backlog |
| 425 |
|
| 1 year |
Total | $ | 3,953 |
|
|
|
The purchase price allocation resulted in $4.7 million of goodwill and $4.0 million of identifiable intangible assets, none of which is expected to be deductible for tax purposes. Intangible assets are being amortized over their weighted average useful lives primarily based upon the pattern in which anticipated economic benefits from such assets are expected to be realized. The goodwill recorded represents the anticipated incremental value of future cash flow potential attributable to: (i) Reach’s ability to grow their business with existing and new customers, including leveraging the Company’s customer base, and (ii) cost improvements due to scale and more efficient operations.
68
NOVANTA INC.
NOTES TO CONSOLIDATED FINANCIAL STATEMENTS — (Continued)
AS OF DECEMBER 31, 2017
The operating results of Reach were included in the Company’s results of operations beginning on May 24, 2016. Reach is included in the Company’s Vision reportable segment.
2015 Acquisitions
Skyetek
On December 18, 2015, the Company acquired all assets and certain liabilities of Skyetek Inc. (“Skyetek”), a Denver, Colorado-based provider of embedded and standalone RFID solutions for medical OEM’s,OEMs, for a total purchase price of $2.8 million, subject to customary working capital adjustments.million. The purchase price includes $2.6 million in cash paid for the acquisition and $0.2 million in estimated fair value of future contingent consideration payable upon the achievement of certain sales order commitment targets from October 2015 through June 2017. The undiscounted range of possible contingent consideration iswas zero to $0.3 million. The actual contingent consideration was $0.1 million, which was paid during the third quarter of 2017. Skyetek specializes in high-performing HFhigh frequency and UHFultra high frequency RFID technologies that maximize efficiency and visibility for OEM’sOEMs serving the medical and advanced industrial markets. The acquisition creates an expanded range of highly competitive RFID solutions that significantly enhances our value proposition to OEM customers in various industries, but especially within the healthcare industry where there is an ever-growing need for improvements in workflow solutions, patient safety, anti-counterfeiting, and asset tracking throughout the hospital environment.
Lincoln Laser
On November 9, 2015, the Company acquired certain assets and liabilities of Lincoln Laser Company (“Lincoln Laser”), a Phoenix, Arizona-based provider of ultrafast precision polygon scanners and other optical scanning solutions for the medical, food processing, and advanced industrial markets, for a total purchase price of $12.6 million, subject to customary working capital adjustments.$12.1 million. This total purchase price includes $10.3$9.8 million in cash paid for the acquisition and $2.3 million in estimated fair value of future contingent consideration payable upon the achievement of certain revenue targets for fiscal year 2016. The undiscounted range of the contingent consideration isunder the purchase and sale agreement was zero to $6.0 million. The actual contingent consideration payment was $1.4 million, which was paid during the first quarter of 2017. Lincoln Laser specializes in ultrafast scanning solutions, leveraging their expertise in polygon motorscanner design and electro-optic subsystems. The acquisition creates an expanded range of highly competitive beam delivery technologies. Lincoln Laser contributed revenues of $1.9 million and a loss from continuing operations before income taxes of $0.3 million for the year ended December 31, 2015.
Applimotion
On February 19, 2015, the Company acquired 100% of the outstanding stock of Applimotion Inc. (“Applimotion”), a Loomis, California based provider of advanced precision motor and motion control technology to OEM customers in the medical and advanced industrial markets, for a total purchase price of $14.0 million, net of working capital adjustments.million. This total purchase price includes $13.0 million in cash paid for the acquisition and $1.0 million in estimated fair value of future contingent considerations payable upon the achievement of certain revenue targets for the fiscal years 2015 to 2017. The undiscounted range of contingent considerations iswas zero to $4.0 million. Based on Applimotion revenue performance for 2015 and 2016, the Company paid $1.2 million in contingent consideration during the first quarter of 2017. Based on revenue performance for 2016 and 2017, the Company paid $2.8 million in contingent consideration in January 2018. Applimotion specializes in motor applications that require highly precise and dynamic motion control. The acquisition enhances our strategic position in precision motion control by enabling us to offer a broader range of motion control technologies and integrated solutions. Applimotion contributed revenues of $14.0 million and income from continuing operations before income taxes of $1.0 million for the year ended December 31, 2015.
69
NOVANTA INC.
NOTES TO CONSOLIDATED FINANCIAL STATEMENTS — (Continued)
AS OF DECEMBER 31, 2017
The final purchase price for Skyetek, Lincoln Laser and Applimotion was allocated as follows (in thousands):
| Amount |
| |
Cash | $ | 331 |
|
Accounts receivable |
| 3,166 |
|
Inventory |
| 3,544 |
|
Prepaid expenses and other current assets |
| 148 |
|
Property and equipment |
| 3,220 |
|
Intangible assets |
| 11,370 |
|
Goodwill |
| 12,710 |
|
Other assets |
| 10 |
|
Total assets acquired |
| 34,499 |
|
|
|
|
|
Accounts payable |
| 1,681 |
|
Other liabilities |
| 1,197 |
|
Deferred tax liabilities |
| 2,308 |
|
58
GSI GROUP INC.
NOTES TO CONSOLIDATED FINANCIAL STATEMENTS — (Continued)
AS OF DECEMBER 31, 2015
| Amount |
| ||||
Cash | $ | 331 |
| |||
Accounts receivable |
| 3,166 |
| |||
Inventory |
| 3,544 |
| |||
Prepaid expenses and other current assets |
| 148 |
| |||
Property, plant and equipment |
| 3,220 |
| |||
Intangible assets |
| 11,370 |
| |||
Goodwill |
| 12,668 |
| |||
Other assets |
| 10 |
| |||
Total assets acquired |
| 34,457 |
| |||
|
|
|
| |||
Accounts payable |
| 1,681 |
| |||
Other liabilities |
| 1,197 |
| |||
Deferred tax liabilities |
| 2,308 |
| |||
| 5,186 |
|
| 5,186 |
| |
Total assets acquired, net of liabilities assumed |
| 29,313 |
|
| 29,271 |
|
Less: cash acquired |
| 331 |
|
| 331 |
|
Plus: working capital adjustments |
| 464 |
| |||
Total purchase price, net of cash acquired |
| 29,446 |
|
| 28,940 |
|
Less: contingent consideration |
| 3,459 |
|
| 3,459 |
|
Net cash used for acquisition of businesses | $ | 25,987 |
| $ | 25,481 |
|
As of December 31, 2015, the working capital adjustments for Skyetek and Lincoln Laser had not yet been finalized and were estimated to be an additional payment of less than $0.1 million to Skyetek and an additional cash receipt of $0.5 million from Lincoln Laser. These have been included in accrued expenses and other current liabilities and prepaid expenses and other current assets, respectively, in the consolidated balance sheet.
The fair value of intangible assets for Skyetek, Lincoln Laser and Applimotion is comprised of the following (dollar amounts in thousands):
|
|
|
|
| Weighted Average |
|
|
|
| Weighted Average |
| Estimated Fair |
|
| Amortization | Estimated Fair |
|
| Amortization | ||
| Value |
|
| Period | Value |
|
| Period | ||
Developed technologies | $ | 4,993 |
|
| 10 years | |||||
Customer relationships | $ | 4,266 |
|
| 12 years |
| 4,266 |
|
| 12 years |
Developed technology |
| 4,993 |
|
| 10 years | |||||
Trademarks and trade names |
| 593 |
|
| 9 years |
| 593 |
|
| 9 years |
Non-compete covenant |
| 684 |
|
| 4 years |
| 684 |
|
| 4 years |
Backlog |
| 834 |
|
| 1 year |
| 834 |
|
| 1 year |
Total | $ | 11,370 |
|
|
| $ | 11,370 |
|
|
|
59
GSI GROUP INC.
NOTES TO CONSOLIDATED FINANCIAL STATEMENTS — (Continued)
AS OF DECEMBER 31, 2015
The purchase price allocation resulted in $12.7 million of goodwill and $11.4 million of identifiable intangible assets, $10.3 million of which is expected to be deductible for tax purposes. Intangible assets are being amortized over their weighted average useful lives primarily based upon the pattern in which anticipated economic benefits from such assets are expected to be realized. The goodwill recorded represents the anticipated incremental value of future cash flow potential attributable to: (i) the ability to develop and market new products and technologies; (ii) the ability to develop relationships with new customers; and (iii) expected sales synergies from cross-selling current and future product offerings of Skyetek, Lincoln Laser, Applimotion and the Company to OEM customers.
The results of the SkyeTek, Lincoln Laser and Applimotion acquisitions were included in the Company’s results of operations beginning on the respective acquisition dates. The pro forma financial information reflecting the operating results of Skyetek, Lincoln Laser and Applimotion as if they had been acquired on January 1, 2014 is not presented herein as it would not differ materially from the operating results of the Company as reported for 2014. Skyetek, Lincoln Laser and Applimotion are included in the Company’s Vision Technologies, Laser Products and Precision Motion reportable segments, respectively.
JADAK
On March 14, 2014, the Company acquired 100% of the outstanding equity interests of JADAK, LLC , JADAK Technologies, Inc., and Advanced Data Capture Corporation (collectively, “JADAK”), a North Syracuse, New York-based provider of optical data collection and machine vision technologies to OEM medical device manufacturers, for $93.7 million in cash, net of working capital adjustments. The addition of JADAK has enabled the Company to offer a broader range of highly engineered enabling technologies to leading medical equipment manufacturers. JADAK contributed revenues of $45.4 million and loss from continuing operations before income taxes of $2.7 million for the year ended December 31, 2014.
The final purchase price allocation is as follows (in thousands):
|
|
|
|
| Amount |
| |
Cash | $ | 1,140 |
|
Accounts receivable |
| 7,907 |
|
Inventory |
| 6,865 |
|
Property and equipment |
| 904 |
|
Intangible assets |
| 40,250 |
|
Goodwill |
| 44,584 |
|
Other assets |
| 2,064 |
|
Total assets acquired |
| 103,714 |
|
|
|
|
|
Accounts payable |
| 3,057 |
|
Other liabilities |
| 2,380 |
|
Deferred tax liabilities |
| 3,481 |
|
Total liabilities assumed |
| 8,918 |
|
Total assets acquired and liabilities assumed |
| 94,796 |
|
Less: cash acquired |
| 1,140 |
|
Total purchase price, net of cash acquired | $ | 93,656 |
|
The fair value of JADAK intangible assets is comprised of the following (in thousands):
|
|
|
|
| Weighted Average |
| Estimated Fair |
|
| Amortization | |
| Value |
|
| Period | |
Customer relationships | $ | 23,570 |
|
| 20 years |
Developed technology |
| 10,910 |
|
| 10 years |
Trademarks and trade names |
| 2,130 |
|
| 10 years |
Backlog |
| 1,810 |
|
| 1 year |
Non-compete covenant |
| 1,830 |
|
| 5 years |
Total | $ | 40,250 |
|
|
|
60
GSI GROUP INC.
NOTES TO CONSOLIDATED FINANCIAL STATEMENTS — (Continued)
AS OF DECEMBER 31, 2015
The purchase price allocation resulted in $44.6 million of goodwill and $40.3 million of identifiable intangible assets, $61.8 million of which is expected to be deductible for tax purposes. Intangible assets are being amortized over their weighted average useful lives primarily based upon the pattern in which economic benefits related to such assets are expected to be realized. The amount of goodwill recorded represents the anticipated incremental value of future cash flow potential attributable to: (i) JADAK’s ability to develop and market new products and technologies; (ii) JADAK’s ability to develop relationships with new customers; and (iii) expected sales synergies from cross-selling current and future product offerings of both JADAK and the Company to OEM customers.
The following unaudited pro forma information presents the combined financial results for the Company and JADAK as if the acquisition of JADAK had been completed as of January 1, 2013 (in thousands, except per share information):
|
|
| |||||
| Year Ended December 31, |
| |||||
| 2014 |
|
| 2013 |
| ||
Revenue | $ | 375,737 |
|
| $ | 370,462 |
|
Income (loss) from continuing operations | $ | (16,067 | ) |
| $ | 11,900 |
|
Earnings per share from continuing operations - Basic | $ | (0.47 | ) |
| $ | 0.35 |
|
Earnings per share from continuing operations - Diluted | $ | (0.47 | ) |
| $ | 0.35 |
|
The pro forma information for all periods includes the effects of acquisition accounting, including amortization charges from acquired intangible assets, interest expense on borrowings in connection with the acquisition, and the related tax effects as though the acquisition of JADAK had been consummated as of the beginning of 2013. These pro forma results exclude the impact of transaction costs included in the historical results and the related tax effects. The pro forma financial information is presented for comparative purposes only and is not necessarily indicative of the results of operations that actually would have been achieved if the acquisition had taken place at the beginning of 2013.
NDS
On January 15, 2013, the Company acquired 100% of the outstanding membership interests of NDS Surgical Imaging, LLC and 100% of the outstanding stock of NDS Surgical Imaging KK (collectively, “NDS”) for $80.8 million in cash consideration, net of working capital adjustments. After the payment of closing working capital, a total of $5.4 million was held in escrow as indemnification for certain representations and warranty claims against the seller until the expiration of the escrow arrangement. In September 2014, the Company received the full remaining amount of $5.4 million held in escrow following the Company’s claims for breach of certain terms of the January 15, 2013 Securities Purchase Agreement for the acquisition of NDS. The escrow recovery was accounted for as a reduction to goodwill as the $5.4 million payment was clearly and directly related to the acquisition price. The escrow recovery resulted in a final adjusted NDS purchase price of $75.4 million.
The allocation of the purchase price is based upon a valuation of assets and liabilities acquired. Assets acquired and liabilities assumed have been recorded at their estimated fair values as of the acquisition date. The fair values of intangible assets were based on valuations using an income approach, with estimates and assumptions provided by management of NDS and the Company. The excess of the purchase price over the tangible assets, identifiable intangible assets and assumed liabilities was recorded as goodwill.
61
GSI GROUP INC.
NOTES TO CONSOLIDATED FINANCIAL STATEMENTS — (Continued)
AS OF DECEMBER 31, 2015
The total final purchase price allocation for the NDS acquisition was as follows (in thousands):
|
|
| ||
| Amount |
| ||
Accounts receivable | $ | 10,327 |
| |
Inventory |
| 14,144 |
| |
Property and equipment |
| 2,426 |
| |
Intangible assets |
| 37,817 |
| |
Goodwill |
| 21,160 |
| |
Other assets |
| 1,782 |
| |
Total assets acquired |
| 87,656 |
| |
|
|
|
| |
Accounts payable |
| 4,768 |
| |
Other liabilities |
| 7,149 |
| |
Deferred tax liabilities |
| 384 |
| |
Total liabilities assumed |
| 12,301 |
| |
Total purchase price | $ | 75,355 |
| |
The fair value of NDS intangible assets is comprised of the following (in thousands):
|
|
|
|
| Weighted Average |
| Estimated Fair |
|
| Amortization | |
| Value |
|
| Period | |
Customer relationships | $ | 22,294 |
|
| 20 years |
Developed technology |
| 6,689 |
|
| 10 years |
Trademarks and trade names |
| 7,565 |
|
| 20 years |
Backlog |
| 1,269 |
|
| 1 year |
Total | $ | 37,817 |
|
|
|
NDS contributed revenues of $68.4 million and loss from continuing operations before income taxes of $3.4 million for the year ended December 31, 2013.
Acquisition Costs
The Company recognized acquisition costs of $0.9$4.4 million, $0.7$0.2 million and $1.5$0.9 million in the years ended December 31, 2017, 2016 and 2015, 2014 and 2013, respectively, primarily related to the acquisitions of WOM, Laser Quantum, ThingMagic, Reach, Skyetek, Lincoln Laser, Applimotion, JADAK and NDS.Applimotion. These amounts were included in restructuring, acquisition and divestiture related costs in the consolidated statements of operations.
70
NOVANTA INC.
NOTES TO CONSOLIDATED FINANCIAL STATEMENTS — (Continued)
AS OF DECEMBER 31, 2017
4. Discontinued Operations and Divestitures
Divestitures
In April 2015, the Company completed the sale of certain assets and liabilities of the JK Lasers business, previously included in the Laser ProductsPhotonics reportable segment, for approximately $29.6 million in cash, net of final working capital adjustments and transactions costs. The Company recognized a pre-tax gain on sale of $19.6 million in the consolidated statement of operations.operations during the year ended December 31, 2015. The JK Lasers business divestiture doesdid not qualify for discontinued operations accounting treatment.
Discontinued Operations
In June 2015, the Company finalized an agreement to divest its 50% owned joint venture the India JV,(the “India JV”) and recorded a pre-tax loss of less than $0.1 million in operating loss from discontinued operations, net of tax in the consolidated statement of operations during the year ended December 31, 2015. The India JV was reported as discontinued operations in the Company’s consolidated financial statements because it was part of the Scientific Lasers business that the Company divested in July 2014. All assets, liabilities,
62
GSI GROUP INC.
NOTES TO CONSOLIDATED FINANCIAL STATEMENTS — (Continued)
AS OF DECEMBER 31, 2015
accumulated other comprehensive income and non-controlling interest of the India JV were derecognized as of the date of the agreement.
In July 2014, the Company completed the sale of certain assets and liabilities of the Scientific Lasers business, operating under the Continuum and Quantronix brand names, for approximately $6.5 million, net of working capital adjustments, and recognized a $1.7 million loss, net of tax, in the consolidated statement of operations during the year ended December 31, 2014. The Company began accounting for the Scientific Lasers business, which was previously included in the Laser Products reportable segment, as discontinued operations in the first quarter of 2014.adjustments. In accordance with the purchase and salessale agreement, $1.5 million of the sales proceeds waswere held in escrow until January 2016. The Company recorded the $1.5 million escrow in other current assets on the consolidated balance sheet. In January 2016, the $1.5 million escrow was released to the Company in full.
In May 2013, the Company consummated the sale of certain assetsfull and liabilities of the Semiconductor Systems business, sold under the GSI brand name, to Electro Scientific Industries, Inc. (“ESI”) for $9.7 million inis reported as cash including working capital adjustments of $1.7 million received in September 2013. The Company recognized a $0.4 million loss on the sale, net of tax, in the consolidated statements of operations during the year ended December 31, 2013.
In October 2012, the Company sold certain assets and liabilities of the Laser Systems business, operating under the Control Laser and Baublys brand names, for $7.0 million to Hans Laser, subject to working capital adjustments, and recorded a $2.3 million gain, net of tax, in the consolidated statement of operations during the year ended December 31, 2012. In September 2013, the Company paid $0.4 million to Hans Laser as the final net working capital adjustment which resulted in an additional loss of $0.2 million, net of tax.
Assets and liabilitiesflow from investing activities of discontinued operations as of December 31, 2014 included the balances of the India JV. There were no assets and liabilities of discontinued operations as of December 31, 2015. The major components of the assets and liabilities of discontinued operations as of December 31, 2014, respectively, were as follows (in thousands):operations.
|
|
|
|
| 2014 |
| |
Accounts receivable, net | $ | 95 |
|
Inventories |
| 161 |
|
Other assets |
| 375 |
|
Assets of discontinued operations | $ | 631 |
|
|
|
|
|
Accounts payable | $ | 16 |
|
Accrued expenses and other current liabilities |
| 74 |
|
Other liabilities |
| 234 |
|
Liabilities of discontinued operations | $ | 324 |
|
The following table presents the operating results which are reported as discontinued operations in the Company’s consolidated statements of operations (in thousands):
|
|
|
|
|
|
|
|
|
|
|
| Year Ended December 31, |
| |
| Year Ended December 31, |
| 2015 |
| ||||||||||
| 2015 |
|
| 2014 |
|
| 2013 |
| ||||||
Revenue from discontinued operations | $ | — |
|
| $ | 10,514 |
|
| $ | 33,792 |
| |||
Loss from discontinued operations, before income tax | $ | (13 | ) |
| $ | (8,059 | ) |
| $ | (3,361 | ) | $ | (13 | ) |
Loss from discontinued operations, net of tax | $ | (13 | ) |
| $ | (5,607 | ) |
| $ | (2,054 | ) | $ | (13 | ) |
Loss on disposal of discontinued operations, net of tax | $ | — |
|
| $ | (1,726 | ) |
| $ | (592 | ) | |||
The loss from discontinued operations for the year ended December 31, 2014 included a $3.0 million fair value write-down of the Scientific Lasers business to its fair value less costs to sell and a $0.5 million fair value write-down of the India JV.
63
GSI GROUP INC.
NOTES TO CONSOLIDATED FINANCIAL STATEMENTS — (Continued)
AS OF DECEMBER 31, 2015
5. Accumulated Other Comprehensive Income (Loss)
Comprehensive income (loss) is defined as net income or loss(loss) and other changes in stockholders’ equity that do not represent transactions with stockholders or in the Company’s stock. Changes in accumulated other comprehensive income (loss) is as follows (in thousands):
| Total accumulated |
|
|
|
|
|
|
|
|
| |||||||||||
| other |
|
| Cumulative |
|
|
|
|
| ||||||||||||
| comprehensive |
|
| translation |
|
| Pension |
| |||||||||||||
| income (loss) |
|
| adjustment |
|
| liability |
| |||||||||||||
Balance at December 31, 2012 |
| (9,749 | ) |
|
| 1,299 |
|
|
| (11,048 | ) | ||||||||||
Other comprehensive income |
| 2,686 |
|
|
| 54 |
|
|
| 2,632 |
| ||||||||||
Amounts reclassified from other comprehensive income (loss) (1) |
| 721 |
|
|
| — |
|
|
| 721 |
| ||||||||||
Balance at December 31, 2013 | $ | (6,342 | ) |
| $ | 1,353 |
|
| $ | (7,695 | ) | ||||||||||
Other comprehensive loss |
| (10,488 | ) |
|
| (6,968 | ) |
|
| (3,520 | ) | ||||||||||
Amounts reclassified from other comprehensive income (loss) (1) |
| 374 |
|
|
| — |
|
|
| 374 |
| ||||||||||
Balance at December 31, 2014 | $ | (16,456 | ) |
| $ | (5,615 | ) |
| $ | (10,841 | ) | ||||||||||
Other comprehensive income (loss) |
| (3,249 | ) |
|
| (4,083 | ) |
|
| 834 |
| ||||||||||
Amounts reclassified from other comprehensive income (loss) (1) |
| 875 |
|
|
| — |
|
|
| 875 |
| ||||||||||
Balance at December 31, 2015 | $ | (18,830 | ) |
| $ | (9,698 | ) |
| $ | (9,132 | ) | ||||||||||
| Total Accumulated |
|
|
|
|
|
|
|
|
| |
| Other |
|
| Cumulative |
|
| Pension |
| |||
| Comprehensive |
|
| Translation |
|
| Liability |
| |||
| Income (Loss) |
|
| Adjustments |
|
| Adjustments |
| |||
Balance at December 31, 2014 | $ | (16,456 | ) |
| $ | (5,615 | ) |
| $ | (10,841 | ) |
Other comprehensive income (loss) |
| (3,249 | ) |
|
| (4,083 | ) |
|
| 834 |
|
Amounts reclassified from accumulated other comprehensive income (loss) (1) |
| 875 |
|
|
| — |
|
|
| 875 |
|
Balance at December 31, 2015 | $ | (18,830 | ) |
| $ | (9,698 | ) |
| $ | (9,132 | ) |
Other comprehensive loss |
| (9,611 | ) |
|
| (7,524 | ) |
|
| (2,087 | ) |
Amounts reclassified from accumulated other comprehensive income (loss) (1) |
| 726 |
|
|
| — |
|
|
| 726 |
|
Balance at December 31, 2016 | $ | (27,715 | ) |
| $ | (17,222 | ) |
| $ | (10,493 | ) |
Other comprehensive income (loss) |
| 8,790 |
|
|
| 8,909 |
|
|
| (119 | ) |
Amounts reclassified from accumulated other comprehensive income (loss) (1) |
| 1,045 |
|
|
| — |
|
|
| 1,045 |
|
Balance at December 31, 2017 | $ | (17,880 | ) |
| $ | (8,313 | ) |
| $ | (9,567 | ) |
(1) | The amounts reclassified from accumulated other comprehensive income (loss) were included in selling, general and administrative expenses in the consolidated statements of operations. |
71
NOVANTA INC.
NOTES TO CONSOLIDATED FINANCIAL STATEMENTS — (Continued)
AS OF DECEMBER 31, 2017
6. Goodwill, Intangible Assets and Impairment Charges
Goodwill
The following table summarizes changes in goodwill during the year ended December 31, 20152017 (in thousands):
| December 31, 2015 |
| |
Balance at beginning of year | $ | 90,746 |
|
Goodwill acquired from the Applimotion acquisition |
| 7,672 |
|
Goodwill acquired from the Lincoln Laser acquisition |
| 3,367 |
|
Goodwill acquired from the Skyetek acquisition |
| 1,671 |
|
Balance at end of year | $ | 103,456 |
|
| December 31, 2017 |
| |
Balance at beginning of year | $ | 108,128 |
|
Goodwill acquired from Laser Quantum acquisition |
| 31,168 |
|
Goodwill acquired from ThingMagic acquisition |
| 9,929 |
|
Goodwill acquired from WOM acquisition |
| 55,632 |
|
Effect of foreign exchange rate changes |
| 6,131 |
|
Balance at end of year | $ | 210,988 |
|
Goodwill acquired from the Applimotion, Lincoln Laser Quantum acquisition is reflected in the Photonics segment. Goodwill acquired from the WOM and SkyetekThingMagic acquisitions is reflected in the Precision Motion, Laser Products and Vision Technologies segments, respectively.segment. Goodwill by reportable segment as of December 31, 20152017 is as follows (in thousands):
| Reportable Segment |
|
|
|
|
| Reportable Segment |
|
|
|
|
| ||||||||||||||||||
| Laser Products |
|
| Vision Technologies |
|
| Precision Motion |
|
| Total |
| Photonics |
|
| Vision |
|
| Precision Motion |
|
| Total |
| ||||||||
Goodwill | $ | 136,321 |
|
| $ | 84,401 |
|
| $ | 33,963 |
|
| $ | 254,685 |
| $ | 170,818 |
|
| $ | 157,436 |
|
| $ | 33,963 |
|
| $ | 362,217 |
|
Accumulated impairment of goodwill |
| (102,461 | ) |
|
| (31,722 | ) |
|
| (17,046 | ) |
|
| (151,229 | ) |
| (102,461 | ) |
|
| (31,722 | ) |
|
| (17,046 | ) |
|
| (151,229 | ) |
Total | $ | 33,860 |
|
| $ | 52,679 |
|
| $ | 16,917 |
|
| $ | 103,456 |
| $ | 68,357 |
|
| $ | 125,714 |
|
| $ | 16,917 |
|
| $ | 210,988 |
|
64Goodwill by reportable segment as of December 31, 2016 is as follows (in thousands):
| Reportable Segment |
|
|
|
|
| |||||||||
| Photonics |
|
| Vision |
|
| Precision Motion |
|
| Total |
| ||||
Goodwill | $ | 136,278 |
|
| $ | 89,116 |
|
| $ | 33,963 |
|
| $ | 259,357 |
|
Accumulated impairment of goodwill |
| (102,461 | ) |
|
| (31,722 | ) |
|
| (17,046 | ) |
|
| (151,229 | ) |
Total | $ | 33,817 |
|
| $ | 57,394 |
|
| $ | 16,917 |
|
| $ | 108,128 |
|
Intangible Assets
Intangible assets as of December 31, 2017 and 2016, respectively, are summarized as follows (dollar amounts in thousands):
| December 31, 2017 |
| |||||||||||||
| Gross Carrying Amount |
|
| Accumulated Amortization |
|
| Net Carrying Amount |
|
| Weighted Average Remaining Life (Years) |
| ||||
Amortizable intangible assets: |
|
|
|
|
|
|
|
|
|
|
|
|
|
|
|
Patents and acquired technologies | $ | 130,890 |
|
| $ | (77,295 | ) |
| $ | 53,595 |
|
|
| 10.2 |
|
Customer relationships |
| 131,809 |
|
|
| (52,015 | ) |
|
| 79,794 |
|
|
| 12.3 |
|
Customer backlog |
| 2,524 |
|
|
| (2,284 | ) |
|
| 240 |
|
|
| 0.8 |
|
Non-compete covenant |
| 2,514 |
|
|
| (1,956 | ) |
|
| 558 |
|
|
| 0.9 |
|
Trademarks and trade names |
| 15,708 |
|
|
| (7,874 | ) |
|
| 7,834 |
|
|
| 9.7 |
|
Amortizable intangible assets |
| 283,445 |
|
|
| (141,424 | ) |
|
| 142,021 |
|
|
| 11.3 |
|
Non-amortizable intangible assets: |
|
|
|
|
|
|
|
|
|
|
|
|
|
|
|
Trade names |
| 13,027 |
|
|
| — |
|
|
| 13,027 |
|
|
|
|
|
Total | $ | 296,472 |
|
| $ | (141,424 | ) |
| $ | 155,048 |
|
|
|
|
|
72
GSI GROUPNOVANTA INC.
NOTES TO CONSOLIDATED FINANCIAL STATEMENTS — (Continued)
AS OF DECEMBER 31, 2015
Goodwill by reportable segment as of December 31, 2014 is as follows (in thousands):2017
| Reportable Segment |
|
|
|
|
| |||||||||
| Laser Products |
|
| Vision Technologies |
|
| Precision Motion |
|
| Total |
| ||||
Goodwill | $ | 132,954 |
|
| $ | 82,730 |
|
| $ | 26,291 |
|
| $ | 241,975 |
|
Accumulated impairment of goodwill |
| (102,461 | ) |
|
| (31,722 | ) |
|
| (17,046 | ) |
|
| (151,229 | ) |
Total | $ | 30,493 |
|
| $ | 51,008 |
|
| $ | 9,245 |
|
| $ | 90,746 |
|
December 31, 2016 |
| ||||||||||||||
| Gross Carrying Amount |
|
| Accumulated Amortization |
|
| Net Carrying Amount |
|
| Weighted Average Remaining Life (Years) |
| ||||
Amortizable intangible assets: |
|
|
|
|
|
|
|
|
|
|
|
|
|
|
|
Patents and acquired technologies | $ | 84,742 |
|
| $ | (67,902 | ) |
| $ | 16,840 |
|
|
| 7.6 |
|
Customer relationships |
| 69,554 |
|
|
| (42,934 | ) |
|
| 26,620 |
|
|
| 12.9 |
|
Customer backlog |
| 622 |
|
|
| (540 | ) |
|
| 82 |
|
|
| 0.9 |
|
Non-compete covenant |
| 2,514 |
|
|
| (1,419 | ) |
|
| 1,095 |
|
|
| 2.0 |
|
Trademarks and trade names |
| 10,709 |
|
|
| (6,630 | ) |
|
| 4,079 |
|
|
| 8.3 |
|
Amortizable intangible assets |
| 168,141 |
|
|
| (119,425 | ) |
|
| 48,716 |
|
|
| 10.2 |
|
Non-amortizable intangible assets: |
|
|
|
|
|
|
|
|
|
|
|
|
|
|
|
Trade names |
| 13,027 |
|
|
| — |
|
|
| 13,027 |
|
|
|
|
|
Total | $ | 181,168 |
|
| $ | (119,425 | ) |
| $ | 61,743 |
|
|
|
|
|
Intangible Assets
Intangible assets as of December 31, 2015 and 2014, respectively, are summarized as follows (in thousands):
| December 31, 2015 |
| |||||||||||||
| Gross Carrying Amount |
|
| Accumulated Amortization |
|
| Net Carrying Amount |
|
| Weighted Average Remaining Life (Years) |
| ||||
Amortizable intangible assets: |
|
|
|
|
|
|
|
|
|
|
|
|
|
|
|
Patents and acquired technologies | $ | 82,821 |
|
| $ | (66,297 | ) |
| $ | 16,524 |
|
|
| 7.7 |
|
Customer relationships |
| 67,168 |
|
|
| (36,914 | ) |
|
| 30,254 |
|
|
| 13.6 |
|
Customer backlog |
| 2,644 |
|
|
| (2,589 | ) |
|
| 55 |
|
|
| 1.0 |
|
Non-compete covenant |
| 2,514 |
|
|
| (882 | ) |
|
| 1,632 |
|
|
| 3.2 |
|
Trademarks and trade names |
| 10,711 |
|
|
| (5,934 | ) |
|
| 4,777 |
|
|
| 9.1 |
|
Amortizable intangible assets |
| 165,858 |
|
|
| (112,616 | ) |
|
| 53,242 |
|
|
| 11.0 |
|
Non-amortizable intangible assets: |
|
|
|
|
|
|
|
|
|
|
|
|
|
|
|
Trade names |
| 13,027 |
|
|
| — |
|
|
| 13,027 |
|
|
|
|
|
Total | $ | 178,885 |
|
| $ | (112,616 | ) |
| $ | 66,269 |
|
|
|
|
|
| December 31, 2014 |
| |||||||||||||
| Gross Carrying Amount |
|
| Accumulated Amortization |
|
| Net Carrying Amount |
|
| Weighted Average Remaining Life (Years) |
| ||||
Amortizable intangible assets: |
|
|
|
|
|
|
|
|
|
|
|
|
|
|
|
Patents and acquired technologies | $ | 78,253 |
|
| $ | (62,010 | ) |
| $ | 16,243 |
|
|
| 7.5 |
|
Customer relationships |
| 63,029 |
|
|
| (31,531 | ) |
|
| 31,498 |
|
|
| 14.7 |
|
Customer backlog |
| 1,810 |
|
|
| (1,641 | ) |
|
| 169 |
|
|
| 0.2 |
|
Non-compete covenant |
| 1,830 |
|
|
| (366 | ) |
|
| 1,464 |
|
|
| 4.2 |
|
Trademarks and trade names |
| 10,205 |
|
|
| (5,364 | ) |
|
| 4,841 |
|
|
| 9.8 |
|
Amortizable intangible assets |
| 155,127 |
|
|
| (100,912 | ) |
|
| 54,215 |
|
|
| 11.8 |
|
Non-amortizable intangible assets: |
|
|
|
|
|
|
|
|
|
|
|
|
|
|
|
Trade names |
| 13,027 |
|
|
| — |
|
|
| 13,027 |
|
|
|
|
|
Total | $ | 168,154 |
|
| $ | (100,912 | ) |
| $ | 67,242 |
|
|
|
|
|
All definite-lived intangible assets are amortized either on a straight-line basis or an economic benefit basis over their remaining estimated useful life. Amortization expense for patents and acquired technologies is included in cost of revenue in the accompanying consolidated statements of operations. Amortization expense for customer relationships and definite-lived trademarks, trade names and other intangibles is included in operating expenses in the accompanying consolidated statements of operations. Amortization expense for patents and acquired technologies is included in cost of revenue in the accompanying consolidated statements of operations. Amortization expense is as follows (in thousands):
| Year Ended December 31, |
| Year Ended December 31, |
| ||||||||||||||||||
| 2015 |
|
| 2014 |
|
| 2013 |
| 2017 |
|
| 2016 |
|
| 2015 |
| ||||||
Amortization expense – cost of revenue | $ | 4,712 |
|
| $ | 6,143 |
|
| $ | 5,280 |
| $ | 8,824 |
|
| $ | 4,164 |
|
| $ | 4,712 |
|
Amortization expense – operating expenses |
| 7,611 |
|
|
| 10,262 |
|
|
| 7,270 |
|
| 12,096 |
|
|
| 8,251 |
|
|
| 7,611 |
|
Total amortization expense | $ | 12,323 |
|
| $ | 16,405 |
|
| $ | 12,550 |
| $ | 20,920 |
|
| $ | 12,415 |
|
| $ | 12,323 |
|
65
GSI GROUP INC.
NOTES TO CONSOLIDATED FINANCIAL STATEMENTS — (Continued)
AS OF DECEMBER 31, 2015
Estimated future amortization expense for each of the five succeeding years and thereafter is as follows (in thousands):
Year Ending December 31, |
| Cost of Revenue |
|
| Operating Expenses |
|
| Total |
|
| Cost of Revenue |
|
| Operating Expenses |
|
| Total |
| ||||||
2016 |
| $ | 3,963 |
|
| $ | 7,498 |
|
| $ | 11,461 |
| ||||||||||||
2017 |
|
| 3,600 |
|
|
| 6,898 |
|
|
| 10,498 |
| ||||||||||||
2018 |
|
| 2,080 |
|
|
| 6,306 |
|
|
| 8,386 |
|
| $ | 9,742 |
|
| $ | 14,584 |
|
| $ | 24,326 |
|
2019 |
|
| 1,768 |
|
|
| 4,324 |
|
|
| 6,092 |
|
|
| 8,877 |
|
|
| 13,511 |
|
|
| 22,388 |
|
2020 |
|
| 1,501 |
|
|
| 2,418 |
|
|
| 3,919 |
|
|
| 7,980 |
|
|
| 11,051 |
|
|
| 19,031 |
|
2021 |
|
| 7,088 |
|
|
| 10,238 |
|
|
| 17,326 |
| ||||||||||||
2022 |
|
| 5,682 |
|
|
| 8,586 |
|
|
| 14,268 |
| ||||||||||||
Thereafter |
|
| 3,612 |
|
|
| 9,274 |
|
|
| 12,886 |
|
|
| 14,226 |
|
|
| 30,456 |
|
|
| 44,682 |
|
Total |
| $ | 16,524 |
|
| $ | 36,718 |
|
| $ | 53,242 |
|
| $ | 53,595 |
|
| $ | 88,426 |
|
| $ | 142,021 |
|
Impairment Charges
The Company performed the most recent annual goodwill and indefinite-lived intangible asset impairment test was performed as of the beginning of the second quarter of 2015,2017 using a Step 0 assessment, noting no impairment. With the exception of our NDS reporting unit, implied fair values of all reporting units exceeded their carrying values by at least 20%.
During the fourth quarter of 2014, the Company completed its annual operating plan for the NDS business following the MEDICAThe Company’s assessment included reviewing factors such as financial performance, macroeconomic conditions, industry and RSNA tradeshows, two main tradeshows for the NDS business. Expectations for sales and operating profit were lowered significantly versus prior forecasts. The lower expectations for sales and operating profit were driven by a strategic decision to discontinue certain NDS products, lack of seasonal uptick during the fourth quarter of 2014 attributable to slower than expected hospital capital expenditures, and lower than expected customer orders from the fourth quarter tradeshows.
In considering the above mentioned factors, the Company determined that a triggering event occurred in the fourth quarter of 2014 and that an interim impairment review of the goodwill and intangible assets related to the NDS reporting unit was necessary. First, the Company performed a long-lived asset recoverability test in accordance with ASC 360-10-35-15, “Impairment or Disposal of Long-Lived Assets,” on the lowest level of identifiable cash flows, which was determined to be the NDS business. The recoverability test compared the carrying value of the NDS business to the undiscounted cash flows. As a result of this recoverability test, the Company determined that the assets were not recoverable. The Company then determined the fair value of the NDS business using a discounted cash flow methodology, which resulted in a $21.8 million intangible assets impairment charge in the fourth quarter of 2014. The impairment charge is reflected in the operating results of the Vision Technologies segment.
Subsequent to impairing the NDS business’s long-lived assets, step one of the goodwill impairment analysis was performed. As the carrying value of the NDS reporting unit exceeded its implied fair value, the Company performed the second step of the goodwill impairment test, comparing the implied fair value of the reporting unit’s goodwill with its carrying amount to measure the impairment loss. The implied fair value of goodwill is determined in the same manner as the amount of goodwill recognized in a business combination, whereby the estimated fair value of the reporting unit is allocated to all of the assets and liabilities of that reporting unit as if the reporting unit had been acquired in a business combinationmarket considerations, and the fair value of theeach reporting unit wasat the purchase price paid. Iflast valuation date, which exceeded the carrying amount of the reporting unit’s goodwill exceeds its implied fair value an impairment loss is recognized in an amount equal to that excess. After completing the second step of the goodwill impairment test, the Company recorded a $19.6 million goodwill impairment charge in the fourth quarter of 2014. The impairment charge is reflected in the operating results of the Vision Technologies segment.
The results of the impairment review as of December 31, 2014 are summarized in the following table (in thousands):
|
| Pre-Impairment Net Carrying Value |
|
| Impairment Charge |
|
| Post-Impairment Net Carrying Value |
| ||||
Goodwill |
| $ | 110,321 |
|
| $ | (19,575 | ) |
| $ | 90,746 |
| |
Intangible assets |
|
| 89,109 |
|
|
| (21,867 | ) |
|
| 67,242 |
| |
Total |
| $ | 199,430 |
|
| $ | (41,442 | ) |
| $ | 157,988 |
| |
by at least 20%.
The Company did not have any goodwill or indefinite-lived intangible asset impairment charges during the year ended December 31, 2013.
66
GSI GROUP INC.
NOTES TO CONSOLIDATED FINANCIAL STATEMENTS — (Continued)
AS OF DECEMBER 31, 2015
2017, 2016 or 2015.
7. Fair Value Measurements
ASC 820, “Fair Value Measurement,” establishes a fair value hierarchy based on three levels of inputs, of which the first two are considered observable and the third is considered unobservable:
Level 1: Quoted prices for identical assets or liabilities in active markets which the Company can access.
73
NOVANTA INC.
NOTES TO CONSOLIDATED FINANCIAL STATEMENTS — (Continued)
AS OF DECEMBER 31, 2017
Level 2: Observable inputs other than those described in Level 1.
Level 3: Unobservable inputs.
Cash equivalentsEquivalents
The Company’s cash equivalents are highly liquid investments in money market accounts,with original maturities of three months of less, which represent the only asset the Company measures at fair value on a recurring basis. The Company determines the fair value of our cash equivalents using a market approach based on quoted prices in active markets. The fair values of cash, accounts receivable, income taxes receivable, accounts payable, income taxes payable and accrued expenses and other current liabilities approximate their carrying values because of their short-term nature.
Foreign Currency Contracts
The Company addresses market risks from changes in foreign currency exchange rates through a risk management program that includes the use of derivative financial instruments to mitigate certain balance sheet foreign currency transaction exposures. The Company uses foreign currency forward contracts as a part of its strategy to manage exposures related to foreign currency denominated monetary assets and liabilities.
Contingent considerationConsideration
67
GSI GROUP INC.On December 14, 2016, the Company acquired certain video signal processing and management technologies used in medical visualization solutions. Under the purchase and sale agreement, the owners are eligible to receive contingent consideration based on the achievement of certain revenue targets from 2018 to 2021. The undiscounted range of possible contingent consideration is zero to €5.5 million ($6.6 million). If such targets are achieved, the contingent consideration would be payable in cash in four installments from 2019 to 2022. As the acquired assets did not meet the definition of a business, the fair value of the contingent consideration is recognized when probable and estimable and is capitalized as part of the cost of the acquired assets. In December 2017, the Company recorded an estimated fair value of $1.3 million in contingent consideration, which is reported as a long-term liability in other liabilities on the consolidated balance sheet as of December 31, 2017.
NOTES TO CONSOLIDATED FINANCIAL STATEMENTS — (Continued)
AS OF DECEMBER 31,On December 18, 2015,
the Company acquired all assets and certain liabilities of Skyetek Inc. (“Skyetek”). Under the purchase and sale agreement for the Skyetek acquisition, the owners of Skyetek arewere eligible to receive contingent consideration based on the achievement of certain sales order commitment targets from October 2015 through June 2017. The undiscounted range of possible contingent consideration was zero to $0.3 million. If such targets arewere achieved, the contingent consideration willwould be payable in 2017. The Company recognized an estimated fair value of $0.2 million as part of the purchase price as of the acquisition date. Subsequent changesBased on the actual sales order commitments through June 2017, the Company paid $0.1 million as the final Skyetek contingent consideration in the estimated fair valuethird quarter of this contingent liability will be recorded in2017.
On November 11, 2015, the consolidated statement of operations as acquisition related costs until the liability is fully settled. There have been no changes to the fair value of the contingent consideration since the acquisition date. The estimated fair value of the contingent consideration is reported as a long-term liability in the consolidated balance sheet.
Company acquired Lincoln Laser Company (“Lincoln Laser”). Under the purchase and sale agreement for the Lincoln Laser acquisition, the shareholders of Lincoln Laser arewere eligible to receive contingent consideration based on the achievement of certain revenue targets for fiscal year 2016. If such targets are achieved, the contingent consideration will be payable in cash in one installment in 2017. The estimated fair value of the contingent consideration of $2.3 million was determined based on the Monte Carlo valuation method and has beenwas recorded as part of the purchase price as of the acquisition date. Subsequent changes in the estimated fair value of this contingent liability will be recorded in the consolidated statement of operations as acquisition related costs until the liability is fully settled. There have been no changes toBased on Lincoln Laser’s fiscal year 2016 revenue results, the fair value of the contingent consideration since the acquisition date.was adjusted to $1.4 million as of December 31, 2016. The estimated fair valueCompany paid $1.4 million as final settlement of the contingent consideration is reported as a long-term liability in the consolidated balance sheet.first quarter of 2017.
TheOn February 19, 2015, the Company acquired Applimotion on February 19, 2015. The formerInc. (“Applimotion”). Under the purchase and sale agreement for the Applimotion acquisition, the shareholders of Applimotion are eligible to receive contingent consideration based on the achievement of certain revenue targets for fiscal years 2015 to 2017. The undiscounted range of contingent considerations is zero to $4.0 million. If such targets are achieved, the contingent consideration will be payable in cash in two installments in 2017 and 2018, respectively. The estimated fair value of the contingent consideration of $1.0 million was determined based on the Monte Carlo valuation method and has beenwas recorded as part of the purchase price as of the acquisition date. Subsequent changes in the estimated fair value of this contingent liability will be recorded in the consolidated statement of operations until the liability is fully settled. In December 2015, a $0.4 million increase in the estimated fair value of this contingent liability wasare recorded in the consolidated statement of operations in restructuring, acquisition and divestiture related costs. The estimatedcosts until the liability is fully settled. Under the Monte Carlo valuation method, the fair value of the contingent consideration for Applimotion was $3.6 million as of December 31, 2016. Based on Applimotion’s revenue performance for 2015 and 2016, the Company paid $1.2 million in contingent consideration in the first quarter of 2017. Based on Applimotion’s revenue performance for 2016 and 2017, the
74
NOVANTA INC.
NOTES TO CONSOLIDATED FINANCIAL STATEMENTS — (Continued)
AS OF DECEMBER 31, 2017
fair value for the remaining contingent consideration for Applimotion was adjusted to $2.8 million, which is reported as a long-termcurrent liability in accrued expenses and other current liabilities on the consolidated balance sheet.sheet as of December 31, 2017. The Company paid $2.8 million as the final Applimotion contingent consideration payment in January 2018.
The following table summarizes the fair values of ourthe Company’s assets and liabilities measured at fair value on a recurring basis as of December 31, 20152017 (in thousands):
|
|
|
|
| Quoted Prices in |
|
|
|
|
|
| Significant Other |
|
|
|
|
| Quoted Prices in |
|
|
|
|
|
| Significant Other |
| ||||
|
|
|
|
| Active Markets for |
|
| Significant Other |
|
| Unobservable |
|
|
|
|
| Active Markets for |
|
| Significant Other |
|
| Unobservable |
| ||||||
|
|
|
|
| Identical Assets |
|
| Observable Inputs |
|
| Inputs |
|
|
|
|
| Identical Assets |
|
| Observable Inputs |
|
| Inputs |
| ||||||
| Fair Value |
|
| (Level 1) |
|
| (Level 2) |
|
| (Level 3) |
| Fair Value |
|
| (Level 1) |
|
| (Level 2) |
|
| (Level 3) |
| ||||||||
Assets |
|
|
|
|
|
|
|
|
|
|
|
|
|
|
|
|
|
|
|
|
|
|
|
|
|
|
|
|
|
|
Cash equivalents | $ | 4,657 |
|
| $ | 4,657 |
|
| $ | — |
|
| $ | — |
| $ | 2,665 |
|
| $ | 2,665 |
|
| $ | — |
|
| $ | — |
|
Prepaid expenses and other current assets: |
|
|
|
|
|
|
|
|
|
|
|
|
|
|
| |||||||||||||||
Foreign currency forward contracts |
| 150 |
|
|
| — |
|
|
| 150 |
|
|
| — |
| |||||||||||||||
| $ | 2,815 |
|
| $ | 2,665 |
|
| $ | 150 |
|
| $ | — |
| |||||||||||||||
Liabilities |
|
|
|
|
|
|
|
|
|
|
|
|
|
|
|
|
|
|
|
|
|
|
|
|
|
|
|
|
|
|
Contingent consideration | $ | 3,889 |
|
| $ | — |
|
| $ | — |
|
| $ | 3,889 |
| |||||||||||||||
Accrued expenses and other current liabilities: |
|
|
|
|
|
|
|
|
|
|
|
|
|
|
| |||||||||||||||
Contingent consideration - Current | $ | 2,800 |
|
| $ | — |
|
| $ | — |
|
| $ | 2,800 |
| |||||||||||||||
Foreign currency forward contracts (1) |
| — |
|
|
| — |
|
|
| — |
|
|
| — |
| |||||||||||||||
Other liabilities: |
|
|
|
|
|
|
|
|
|
|
|
|
|
|
| |||||||||||||||
Contingent consideration - Long-term |
| 1,304 |
|
|
| — |
|
|
| — |
|
|
| 1,304 |
| |||||||||||||||
| $ | 4,104 |
|
| $ | — |
|
| $ | — |
|
| $ | 4,104 |
| |||||||||||||||
(1) | The unrealized loss from foreign currency forward contracts was nominal as of December 31, 2017. |
The following table summarizes the fair values of our financialthe Company’s assets and liabilities measured at fair value on a recurring basis as of December 31, 20142016 (in thousands):
|
|
|
|
| Quoted Prices in |
|
|
|
|
|
| Significant Other |
|
|
|
|
| Quoted Prices in |
|
|
|
|
|
| Significant Other |
| ||||
|
|
|
|
| Active Markets for |
|
| Significant Other |
|
| Unobservable |
|
|
|
|
| Active Markets for |
|
| Significant Other |
|
| Unobservable |
| ||||||
|
|
|
|
| Identical Assets |
|
| Observable Inputs |
|
| Inputs |
|
|
|
|
| Identical Assets |
|
| Observable Inputs |
|
| Inputs |
| ||||||
| Fair Value |
|
| (Level 1) |
|
| (Level 2) |
|
| (Level 3) |
| Fair Value |
|
| (Level 1) |
|
| (Level 2) |
|
| (Level 3) |
| ||||||||
Assets |
|
|
|
|
|
|
|
|
|
|
|
|
|
|
|
|
|
|
|
|
|
|
|
|
|
|
|
|
|
|
Cash equivalents | $ | 2,255 |
|
| $ | 2,255 |
|
| $ | — |
|
| $ | — |
| $ | 9,569 |
|
| $ | 9,569 |
|
| $ | — |
|
| $ | — |
|
Liabilities |
|
|
|
|
|
|
|
|
|
|
|
|
|
|
| |||||||||||||||
Accrued expenses and other current liabilities: |
|
|
|
|
|
|
|
|
|
|
|
|
|
|
| |||||||||||||||
Contingent consideration - Current | $ | 2,775 |
|
| $ | — |
|
| $ | — |
|
| $ | 2,775 |
| |||||||||||||||
Other liabilities: |
|
|
|
|
|
|
|
|
|
|
|
|
|
|
| |||||||||||||||
Contingent consideration - Long-term |
| 2,381 |
|
|
| — |
|
|
| — |
|
|
| 2,381 |
| |||||||||||||||
| $ | 5,156 |
|
| $ | — |
|
| $ | — |
|
| $ | 5,156 |
| |||||||||||||||
68
GSI GROUP INC.
NOTES TO CONSOLIDATED FINANCIAL STATEMENTS — (Continued)
AS OF DECEMBERDuring the years ended December 31, 20152017 and 2016, there were no transfers between fair value levels.
Changes in the fair value of our Level 3 contingent consideration for the year ended December 31, 2015 were2017 was as follows (in thousands):
| Contingent Consideration |
| |
Balance at December 31, 2014 | $ | — |
|
Acquisition of Applimotion |
| 965 |
|
Fair value adjustment |
| 430 |
|
Acquisition of Lincoln Laser |
| 2,344 |
|
Acquisition of Skyetek |
| 150 |
|
Balance at December 31, 2015 | $ | 3,889 |
|
| Contingent Consideration |
| |
Balance at December 31, 2016 | $ | 5,156 |
|
Payments of contingent consideration |
| (2,781 | ) |
Fair value adjustments |
| 1,729 |
|
Balance at December 31, 2017 | $ | 4,104 |
|
There were no Level 3 assets or liabilities during the year ended75
NOVANTA INC.
NOTES TO CONSOLIDATED FINANCIAL STATEMENTS — (Continued)
AS OF DECEMBER 31, 2017
The following table provides quantitative information associated with2017, the significant unobservable inputs used in the fair value measurement of the Company’s Level 3 liabilities:
|
|
|
|
| ||||
|
|
|
|
| ||||
|
|
|
|
|
contingent consideration were historical revenues, projected revenues and a discount rate. Increases or decreases in the unobservable inputs noted above would result in a higher or lower fair value measurement.
Except for the assets and liabilities acquired from the Applimotion, LincolnWOM, Laser Quantum and SkyetekThingMagic acquisitions, as disclosed in Note 3, there were no assets and liabilities that were measured at fair value on a non-recurring basis during 2015.2017. See Note 1011 for discussion of the estimated fair value of the Company’s outstanding debt and Note 1213 for discussion of the estimated fair value of the Company’s pension plan assets.
8. Foreign Currency Contracts
The Company addresses market risks from changes in foreign currency exchange rates through a risk management program that includes the use of derivative financial instruments to mitigate certain foreign currency transaction exposures from future settlement of non-functional currency monetary assets and liabilities as of the end of a period. The Company does not enter into derivative transactions for speculative purposes. Gains and losses on derivative financial instruments substantially offset losses and gains on underlying hedged exposures. Furthermore, the Company manages its exposure to counterparty risk on derivative instruments by entering into contracts with a diversified group of major financial institutions and by actively monitoring outstanding positions.
Beginning in September 2017, the Company commenced a foreign currency hedging program through the use of forward contracts as a part of its strategy to limit its exposures related to monetary assets and liabilities denominated in currencies other than the functional currency. These forward contracts are not designated as cash flow, fair value or net investment hedges. Changes in the fair value of these forward contracts are recognized in income from continuing operations.
As of December 31, 2017, the notional amount and fair value of the Company’s foreign currency forward contracts was $17.9 million and a net gain of $0.2 million, respectively.
For the year ended December 31, 2017, the Company recognized an aggregate net gain of $0.2 million, which is included in foreign exchange transaction gains (losses) in the consolidated statement of operations.
9. Earnings (Loss) per Common Share
Basic earnings (loss) per common share is computed by dividing net income (loss)attributable to Novanta Inc. after adjustment of redeemable noncontrolling interest to estimated redemption value by the weighted average number of common shares outstanding during the year. The Company recognizes changes in the redeemable noncontrolling interest redemption value by adjusting the carrying amount of the redeemable noncontrolling interest as of the end of the period to the higher of: (i) the estimated redemption value assuming the end of the period is also the redemption date or (ii) the carrying value without any redemption value adjustments. Such adjustments are recorded in retained earnings in stockholders’ equity instead of net income attributable to Novanta Inc. For both basic and diluted earnings (loss) per common share, such redemption value adjustments are included in the calculation of the numerator. For diluted earnings (loss) per common share, the denominator also includes the dilutive effect of outstanding restricted stock units, stock options and total shareholder return performance restricted stock units determined using the treasury stock method. Dilutive effects of contingently issuable shares are included in the weighted average dilutive share calculation using the treasury method when the contingencies have been resolved. For years in which net losses are generated, the dilutive potential common shares are excluded from the calculation of diluted earnings per share as the effect would be anti-dilutive.
6976
GSI GROUPNOVANTA INC.
NOTES TO CONSOLIDATED FINANCIAL STATEMENTS — (Continued)
AS OF DECEMBER 31, 20152017
The following table sets forth the computation of basic and diluted earnings (loss) per share (in thousands, except per share amounts):
| Year Ended December 31, |
| Year Ended December 31, |
| ||||||||||||||||||
| 2015 |
|
| 2014 |
|
| 2013 |
| 2017 |
|
| 2016 |
|
| 2015 |
| ||||||
Numerators: |
|
|
|
|
|
|
|
|
|
|
|
|
|
|
|
|
|
|
|
|
|
|
Income (loss) from continuing operations | $ | 35,628 |
|
| $ | (16,909 | ) |
| $ | 9,977 |
| |||||||||||
Consolidated loss from discontinued operations |
| (13 | ) |
|
| (7,333 | ) |
|
| (2,646 | ) | |||||||||||
Less: income attributable to noncontrolling interest |
| — |
|
|
| (10 | ) |
|
| (22 | ) | |||||||||||
Loss from discontinued operations attributable to GSI Group Inc. |
| (13 | ) |
|
| (7,343 | ) |
|
| (2,668 | ) | |||||||||||
Net income (loss) attributable to GSI Group Inc. | $ | 35,615 |
|
| $ | (24,252 | ) |
| $ | 7,309 |
| |||||||||||
Income from continuing operations | $ | 62,307 |
|
| $ | 22,003 |
|
| $ | 35,628 |
| |||||||||||
Less: Net income attributable to noncontrolling interest |
| (2,256 | ) |
|
| — |
|
|
| — |
| |||||||||||
Income from continuing operations attributable to Novanta Inc. |
| 60,051 |
|
|
| 22,003 |
|
|
| 35,628 |
| |||||||||||
Less: Adjustment of redeemable noncontrolling interest to estimated redemption value (see Note 17) |
| (20,244 | ) |
|
| — |
|
|
| — |
| |||||||||||
Income from continuing operations attributable to Novanta Inc. after adjustment of redeemable noncontrolling interest to estimated redemption value |
| 39,807 |
|
|
| 22,003 |
|
|
| 35,628 |
| |||||||||||
Loss from discontinued operations |
| — |
|
|
| — |
|
|
| (13 | ) | |||||||||||
Net income attributable to Novanta Inc. after adjustment of redeemable noncontrolling interest to estimated redemption value | $ | 39,807 |
|
| $ | 22,003 |
|
| $ | 35,615 |
| |||||||||||
|
|
|
|
|
|
|
|
|
|
|
|
|
|
|
|
|
|
|
|
|
|
|
Denominators: |
|
|
|
|
|
|
|
|
|
|
|
|
|
|
|
|
|
|
|
|
|
|
Weighted average common shares outstanding— basic |
| 34,579 |
|
|
| 34,352 |
|
|
| 34,073 |
|
| 34,817 |
|
|
| 34,694 |
|
|
| 34,579 |
|
Dilutive potential common shares (1) |
| 248 |
|
|
| — |
|
|
| 323 |
| |||||||||||
Dilutive potential common shares |
| 463 |
|
|
| 220 |
|
|
| 248 |
| |||||||||||
Weighted average common shares outstanding— diluted |
| 34,827 |
|
|
| 34,352 |
|
|
| 34,396 |
|
| 35,280 |
|
|
| 34,914 |
|
|
| 34,827 |
|
Antidilutive common shares excluded from above |
| — |
|
|
| 439 |
|
|
| 246 |
|
| — |
|
|
| 85 |
|
|
| — |
|
|
|
|
|
|
|
|
|
|
|
|
|
|
|
|
|
|
|
|
|
|
|
|
Basic Earnings (Loss) per Common Share: |
|
|
|
|
|
|
|
|
|
|
|
|
|
|
|
|
|
|
|
|
|
|
From continuing operations | $ | 1.03 |
|
| $ | (0.49 | ) |
| $ | 0.29 |
| $ | 1.14 |
|
| $ | 0.63 |
|
| $ | 1.03 |
|
From discontinued operations | $ | (0.00 | ) |
| $ | (0.21 | ) |
| $ | (0.08 | ) | $ | — |
|
| $ | — |
|
| $ | (0.00 | ) |
Basic earnings (loss) per share attributable to GSI Group Inc. | $ | 1.03 |
|
| $ | (0.70 | ) |
| $ | 0.21 |
| |||||||||||
Basic earnings (loss) per share attributable to Novanta Inc. | $ | 1.14 |
|
| $ | 0.63 |
|
| $ | 1.03 |
| |||||||||||
|
|
|
|
|
|
|
|
|
|
|
|
|
|
|
|
|
|
|
|
|
|
|
Diluted Earnings (Loss) per Common Share: |
|
|
|
|
|
|
|
|
|
|
|
|
|
|
|
|
|
|
|
|
|
|
From continuing operations | $ | 1.02 |
|
| $ | (0.49 | ) |
| $ | 0.29 |
| $ | 1.13 |
|
| $ | 0.63 |
|
| $ | 1.02 |
|
From discontinued operations | $ | (0.00 | ) |
| $ | (0.21 | ) |
| $ | (0.08 | ) | $ | — |
|
| $ | — |
|
| $ | (0.00 | ) |
Diluted earnings (loss) per share attributable to GSI Group Inc. | $ | 1.02 |
|
| $ | (0.70 | ) |
| $ | 0.21 |
| |||||||||||
Diluted earnings (loss) per share attributable to Novanta Inc. | $ | 1.13 |
|
| $ | 0.63 |
|
| $ | 1.02 |
| |||||||||||
|
|
Common Stock Repurchases
In October 2013, the Company’s Board of Directors authorized a share repurchase plan under which the Company may repurchase outstanding shares of the Company’s common stock up to an aggregate amount of $10.0 million. The shares may be repurchased from time to time, at the Company’s discretion, based on ongoing assessment of the capital needs of the business, the market price of the Company’s common stock, and general market conditions. Shares may also be repurchased through an accelerated stock purchase agreement, on the open market or in privately negotiated transactions in accordance with applicable federal securities laws. Repurchases may be made under certain SEC regulations, which would permit common stock to be purchasedrepurchased when the Company would otherwise be prohibited from doing so under insider trading laws. The share repurchase plan does not obligate the Company to acquire any particular amount of common stock. No time limit was set for the completion of the share repurchase program, and the program may be suspended or discontinued at any time. The Company expects to fund the share repurchaserepurchases through cash on hand and future cash flowgenerated from operations. During 2015,2017, the Company repurchased 12214 thousand shares in the open market for an aggregate purchase price of $1.6$0.4 million at an average price of $13.29$26.41 per share. As of December 31, 2015,2017, the Company had repurchased an aggregate of 172296 thousand shares for an aggregate purchase price of $2.2$4.2 million at an average price of $12.48$14.05 per share.
7077
GSI GROUPNOVANTA INC.
NOTES TO CONSOLIDATED FINANCIAL STATEMENTS — (Continued)
AS OF DECEMBER 31, 20152017
9.10. Supplementary Balance Sheet Information
The following tables provide the details of selected balance sheet items as of the dates indicated (in thousands):
Inventories
| December 31, |
| December 31, |
| ||||||||||
| 2015 |
|
| 2014 |
| 2017 |
|
| 2016 |
| ||||
Raw materials | $ | 38,511 |
|
| $ | 38,934 |
| $ | 57,277 |
|
| $ | 39,822 |
|
Work-in-process |
| 10,138 |
|
|
| 9,899 |
|
| 14,847 |
|
|
| 8,012 |
|
Finished goods |
| 9,266 |
|
|
| 11,945 |
|
| 16,443 |
|
|
| 9,511 |
|
Demo and consigned inventory |
| 1,651 |
|
|
| 2,165 |
|
| 2,711 |
|
|
| 2,400 |
|
Total inventories | $ | 59,566 |
|
| $ | 62,943 |
| $ | 91,278 |
|
| $ | 59,745 |
|
Property, Plant and Equipment, netNet
| December 31, |
| December 31, |
| ||||||||||
| 2015 |
|
| 2014 |
| 2017 |
|
| 2016 |
| ||||
Cost: |
|
|
|
|
|
|
|
|
|
|
|
|
|
|
Land, buildings and improvements | $ | 48,154 |
|
| $ | 46,222 |
| $ | 53,055 |
|
| $ | 38,384 |
|
Machinery and equipment |
| 43,376 |
|
|
| 50,487 |
|
| 74,122 |
|
|
| 52,136 |
|
Total cost |
| 91,530 |
|
|
| 96,709 |
|
| 127,177 |
|
|
| 90,520 |
|
Accumulated depreciation |
| (50,980 | ) |
|
| (56,621 | ) |
| (65,459 | ) |
|
| (55,099 | ) |
Property, plant and equipment, net | $ | 40,550 |
|
| $ | 40,088 |
| $ | 61,718 |
|
| $ | 35,421 |
|
As of December 31, 20152017 and 2014,2016, the Company hashad gross assets under capital lease of $13.2$13.6 million and $12.7$13.2 million, respectively. The assets acquired under capital leases are included in land, buildings and improvements and machinery and equipment and the related amortization expense is included in depreciation expense. The Company also capitalized software development costs of $2.0 million, $2.3 million and $1.9 million $0.2 millionin 2017, 2016 and $0.2 million in 2015, 2014 and 2013, respectively, in accordance with the guidance in ASC 350-40, “Internal-Use Software.”
The following table summarizes depreciation expense on property, plant and equipment, including demo units and assets under capital leases (in thousands):
| Year Ended December 31, |
| |||||||||
| 2015 |
|
| 2014 |
|
| 2013 |
| |||
Depreciation expense | $ | 7,873 |
|
| $ | 8,016 |
|
| $ | 7,400 |
|
| Year Ended December 31, |
| |||||||||
| 2017 |
|
| 2016 |
|
| 2015 |
| |||
Depreciation expense | $ | 9,838 |
|
| $ | 8,558 |
|
| $ | 7,873 |
|
The following table summarizes total accumulated depreciation on assets under capital leases as of the dates indicated (in thousands):
| December 31, |
| |||||
| 2015 |
|
| 2014 |
| ||
Accumulated depreciation on assets under capital leases | $ | 3,798 |
|
| $ | 2,741 |
|
| December 31, |
| |||||
| 2017 |
|
| 2016 |
| ||
Accumulated depreciation on assets under capital leases | $ | 6,097 |
|
| $ | 4,950 |
|
78
NOVANTA INC.
NOTES TO CONSOLIDATED FINANCIAL STATEMENTS — (Continued)
AS OF DECEMBER 31, 2017
Accrued Expenses and Other Current Liabilities
The following table summarizes accrued expenses and other current liabilities as of the dates indicated (in thousands):
| December 31, |
| December 31, |
| ||||||||||
| 2015 |
|
| 2014 |
| 2017 |
|
| 2016 |
| ||||
Accrued compensation and benefits | $ | 7,357 |
|
| $ | 7,741 |
| $ | 17,348 |
|
| $ | 9,647 |
|
Accrued warranty |
| 3,335 |
|
|
| 3,044 |
|
| 4,835 |
|
|
| 3,142 |
|
Accrued restructuring |
| 1,652 |
|
|
| 109 |
|
| 440 |
|
|
| 1,371 |
|
Accrued professional services fees and other |
| 8,838 |
|
|
| 8,507 |
| |||||||
Accrued professional services |
| 1,469 |
|
|
| 1,237 |
| |||||||
Accrued contingent considerations |
| 2,800 |
|
|
| 2,775 |
| |||||||
Customer deposits |
| 3,634 |
|
|
| 1,164 |
| |||||||
Other |
| 12,788 |
|
|
| 7,612 |
| |||||||
Total | $ | 21,182 |
|
| $ | 19,401 |
| $ | 43,314 |
|
| $ | 26,948 |
|
71
GSI GROUP INC.
NOTES TO CONSOLIDATED FINANCIAL STATEMENTS — (Continued)
AS OF DECEMBER 31, 2015
The following table summarizes accrued warranty activities for the periods indicated (in thousands):
| Year Ended December 31, |
| Year Ended December 31, |
| ||||||||||||||
| 2015 |
|
| 2014 |
| 2017 |
|
| 2016 |
|
| 2015 |
| |||||
Balance at beginning of year | $ | 3,044 |
|
| $ | 3,315 |
| $ | 3,142 |
|
| $ | 3,335 |
|
| $ | 3,044 |
|
Provision charged to cost of revenue |
| 2,025 |
|
|
| 1,684 |
|
| 3,169 |
|
|
| 1,673 |
|
|
| 2,025 |
|
Acquisition related warranty accrual |
| 132 |
|
|
| 90 |
| |||||||||||
Warranty liabilities acquired from acquisitions |
| 1,307 |
|
|
| 23 |
|
|
| 132 |
| |||||||
Use of provision |
| (1,454 | ) |
|
| (2,003 | ) |
| (2,857 | ) |
|
| (1,849 | ) |
|
| (1,454 | ) |
Divestiture of JK Lasers |
| (389 | ) |
|
| — |
|
| — |
|
|
| — |
|
|
| (389 | ) |
Foreign currency exchange rate changes |
| (23 | ) |
|
| (42 | ) |
| 74 |
|
|
| (40 | ) |
|
| (23 | ) |
Balance at end of year | $ | 3,335 |
|
| $ | 3,044 |
| $ | 4,835 |
|
| $ | 3,142 |
|
| $ | 3,335 |
|
Other Long Term Liabilities
The following table summarizes other long term liabilities as of the dates indicated (in thousands):
| December 31, |
| December 31, |
| ||||||||||
| 2015 |
|
| 2014 |
| 2017 |
|
| 2016 |
| ||||
Capital lease obligations | $ | 9,173 |
|
| $ | 9,507 |
| $ | 7,947 |
|
| $ | 8,111 |
|
Accrued pension liabilities |
| 3,693 |
|
|
| 6,037 |
|
| 3,853 |
|
|
| 5,957 |
|
Accrued contingent considerations |
| 3,889 |
|
|
| — |
|
| 1,304 |
|
|
| 2,381 |
|
Other |
| 2,690 |
|
|
| 3,275 |
|
| 2,037 |
|
|
| 2,264 |
|
Total |
| 19,445 |
|
|
| 18,819 |
| $ | 15,141 |
|
| $ | 18,713 |
|
10.79
NOVANTA INC.
NOTES TO CONSOLIDATED FINANCIAL STATEMENTS — (Continued)
AS OF DECEMBER 31, 2017
Debt consisted of the following (in thousands):
| December 31, |
| December 31, |
| ||||||||||
| 2015 |
|
| 2014 |
| 2017 |
|
| 2016 |
| ||||
Senior Credit Facilities – term loan | $ | 7,500 |
|
| $ | 7,500 |
| $ | 9,200 |
|
| $ | 7,500 |
|
Less: unamortized debt issuance costs |
| (115 | ) |
|
| (155 | ) |
| (81 | ) |
|
| (134 | ) |
Total current portion of long-term debt | $ | 7,385 |
|
| $ | 7,345 |
| $ | 9,119 |
|
| $ | 7,366 |
|
|
|
|
|
|
|
|
|
|
|
|
|
|
|
|
Senior Credit Facilities – term loan | $ | 20,000 |
|
| $ | 27,500 |
| $ | 79,125 |
|
| $ | 63,750 |
|
Senior Credit Facilities – revolving credit facility |
| 70,000 |
|
|
| 80,000 |
|
| 149,453 |
|
|
| 10,000 |
|
Less: unamortized debt issuance costs |
| (1,574 | ) |
|
| (2,470 | ) |
| (3,078 | ) |
|
| (3,196 | ) |
Total long-term debt | $ | 88,426 |
|
| $ | 105,030 |
| $ | 225,500 |
|
| $ | 70,554 |
|
|
|
|
|
|
|
|
|
|
|
|
|
|
|
|
Total Senior Credit Facilities | $ | 95,811 |
|
| $ | 112,375 |
| $ | 234,619 |
|
| $ | 77,920 |
|
Senior Credit Facilities
On December 27, 2012,May 19, 2016, the Company entered into anthe second amended and restated senior secured credit agreement (the “Amended“Second Amended and Restated Credit Agreement”) with new and existing lenders for an aggregate credit facility of $125.0$300.0 million, consisting of a $50.0$75.0 million, 5-year term loan facility and a $75.0$225.0 million, 5-year revolving credit facility (collectively, the “Senior Credit Facilities”). The Senior Credit Facilities mature in May 2021. The Second Amended and Restated Credit Agreement amended and restated the amended and restated credit agreement dated December 2017.27, 2012.
The borrowings outstanding under the credit facilitySenior Credit Facilities bear interest at rates based on (a) the EurodollarEurocurrency Rate, as defined in the Second Amended and Restated Credit Agreement, plus a rate ranging from 2.00%1.75% to 3.00%2.75% per annum or (b) the Base Rate, as defined in the Second Amended and Restated Credit Agreement, plus a rate ranging from 1.00%0.75% to 2.00%1.75% per annum, in each case based upon the Company’s consolidated leverage ratio. The Company is also required to pay a commitment fee on unused commitments under the
72
GSI GROUP INC.
NOTES TO CONSOLIDATED FINANCIAL STATEMENTS — (Continued)
AS OF DECEMBER 31, 2015
revolving credit facility ranging between 0.250%0.25% and 0.625%0.45% per annum, which is based upon the Company’s consolidated leverage ratio.
The Second Amended and Restated Credit Agreement contains various customary representations, warranties and covenants applicable to the Company and its subsidiaries, including: (i) covenants regarding maximum consolidated leverage ratio and minimum consolidated fixed charge coverage ratio; (ii) limitations on restricted payments, including dividend payments and stock repurchases, provided that the Company and its subsidiaries may repurchase its outstanding common sharestheir equity interests, so long as immediately after giving effect to the share repurchase, the Company’s consolidated leverage ratio is no more than 2.25:1.00, and the Company has unrestricted cash plus amounts available for borrowing under the Senior Credit Facilities of at least $25.0 million immediately after giving effect on the share repurchase; (iii)2.50; (ii) limitations on fundamental changes involving the Company; (iv)Company and its subsidiaries; (iii) limitations on the disposition of assets; and (v)(iv) limitations on indebtedness, investments, and liens.
The Company’s obligations under the Senior Credit Facilities are secured on a senior basis by a lien on substantially all of the assets of the Company and its material United States (“U.S.”) and United Kingdom (“U.K.”) subsidiaries and guaranteed by the Company and its material U.S. and U.K. subsidiaries. TheSecond Amended and Restated Credit Agreement also contains customary eventsrequires the Company to satisfy certain financial covenants, such as maintaining a minimum consolidated fixed charge coverage ratio of default.1.50 and a maximum consolidated leverage ratio of 3.00. The maximum consolidated leverage ratio will increase to 3.50 for four consecutive quarters following an acquisition with an aggregate consideration greater than or equal to $50.0 million.
TheOn August 1, 2017, the Company entered into three amendmentsan amendment (the “Third Amendment”) to the Second Amended and Restated Credit Agreement during 2013 and one amendment during 2014.Agreement. The first and second amendments resulted in immaterial modifications. On September 13, 2013, the Company entered into a third amendment (the “Third Amendment”) whichThird Amendment increased the accordion feature provided in the Amended and Restated Agreement from uncommitted $50.0 million to uncommitted $100.0 million in aggregate ofborrowing limit under the revolving credit facility from $225 million to $325 million and reset the uncommitted accordion feature to $125 million for potential future expansion. Additionally, the Third Amendment increased the term loan. On February 10, 2014,loan balance from $65.6 million to $90.6 million. Under the Third Amendment, the Company entered into a fourth amendment (the “Fourth Amendment”), which increasedis required to pay quarterly scheduled principal repayments of $2.3 million beginning in October 2017, with the final installment of $56.1 million due upon maturity in May 2021. Borrowings under the revolving credit facility commitment undermay be repaid at any time through May 2021, the Amended and Restateddate of maturity date of the Senior Credit Agreement by $100 million from $75 million to $175 million and reset the accordion feature to $100 million for future expansion. Additionally, the Fourth Amendment increased the maximum permitted consolidated leverage ratio from 2.75 to 3.00, and increased the maximum consolidated leverage ratio for permitted acquisitions and stock repurchases from 2.25 to 2.50. The Company was in compliance with these debt covenants as of December 31, 2015.
On January 22, 2016, the Company entered into a fifth amendment to the Amended and Restated Credit Agreement (the “Fifth Amendment”). The Fifth Amendment resulted in immaterial modifications.
The principal on the Company’s outstanding term loan matures as follows (in thousands):
| Term Loan |
| |
2016 | $ | 7,500 |
|
2017 |
| 20,000 |
|
Total debt repayments | $ | 27,500 |
|
|
|
|
|
Facilities. The Company may voluntarily prepay loans or reduce commitments under the Senior Credit Facilities, in whole or in part, without premium or penalty, subject to certain minimum principal amounts.
On February 26, 2018, the Company entered into a fourth amendment (the “Fourth Amendment”) to the Second Amended and Restated Credit Agreement. The Fourth Amendment increases the maximum permitted consolidated leverage ratio from 3.00 to 3.50, increases the maximum consolidated leverage ratio for permitted acquisitions and stock repurchases from 2.50 to 3.00, increases the maximum permitted consolidated leverage ratio for a designated acquisition from 3.00 to 3.50, and increases the maximum leverage
80
NOVANTA INC.
NOTES TO CONSOLIDATED FINANCIAL STATEMENTS — (Continued)
AS OF DECEMBER 31, 2017
ratio for four consecutive quarters following a designated acquisition from 3.50 to 4.00. Certain other technical changes were made to the Second Amended and Restated Credit Agreement as a result of the Fourth Amendment and are not considered material.
As of December 31, 2017, the outstanding principal under the Company’s term loan facility is scheduled to be repaid as follows (in thousands):
| Principal Amount |
| |
2018 | $ | 9,200 |
|
2019 |
| 9,200 |
|
2020 |
| 9,200 |
|
2021 |
| 60,725 |
|
Total debt repayments | $ | 88,325 |
|
|
|
|
|
The Company may be required to prepay outstanding loans under the Second Amended and Restated Credit Agreement with the net proceeds of certain asset dispositions and incurrences of certain debt. At the election of the Company, and so long as no default shall have occurred, the Company may reinvest within a year all, or any portion of, the net proceeds from such asset dispositions or incurrences of debt.debt within a year.
As of December 31, 2015,2017, the Company had $105.0$175.5 million available to be drawn under the revolving credit facility. Excluding commitment fees, the weighted average interest rate for the credit facilitySenior Credit Facilities was approximately 2.9%3.06% as of December 31, 2015.2017. The commitment fee rate for the unused commitments under the revolving credit facility was approximately 0.4% as of December 31, 2015.2017.
Guarantees
The Senior Credit Facilities is guaranteed by the Company, JADAK LLC, NDS Surgical Imaging LLC and Novanta Technologies UK Limited (collectively, “Guarantors”). Each Guarantor, as defined in the Amended and Restated Credit Agreement, jointly and severally, unconditionally guarantees the due and punctual payment of the principal, interest and fees under the Senior Credit Facilities, when due and payable, whether at maturity, by required prepayment, by acceleration or otherwise. In addition, Guarantors guarantee the due and punctual payment, fees
73
GSI GROUP INC.
NOTES TO CONSOLIDATED FINANCIAL STATEMENTS — (Continued)
AS OF DECEMBER 31, 2015
and interest on the overdue principal of the Senior Credit Facilities and the due and punctual performance of all obligations of the Company in accordance with the terms of the Second Amended and Restated Credit Agreement. Furthermore, each Guarantor, jointly and severally, unconditionally guarantees that in the event of any extension, renewal, amendment, refinancing or modification of any of the Senior Credit Facilities, or any of such other Obligations, as defined in the Amended and Restated Credit Agreement, amounts due will be promptly paid in full when due or performed in accordance with the terms of the extension or renewal, at stated maturity, by acceleration or otherwise.
The obligations of each Guarantor are limited to the maximum amount, after giving effect to all other contingent and fixed liabilities or any collections from, or payments made by or on behalf of, any other Guarantor. Each Guarantor that makes a payment or distribution under a Guarantee is entitled to a contribution from each other Guarantor of its Pro Rata Share, as defined in the Amended and Restated Credit Agreement,pro rata share based on the adjusted net assets of each Guarantor. The Guarantees will continue to be effective or be reinstated, as the case may be, ifIf at any time any payment of any of the obligations of the Guarantors is rescinded or must otherwise be returned upon the insolvency, bankruptcy or reorganization of the Company, a Guarantor or otherwise, allthe Guarantees will continue to be effective or be reinstated, as the case may be, as though such payment had not been made.
Each Guarantor may be released from its obligations under its respective Guarantee and its obligations under the Second Amended and Restated Credit Agreement upon the occurrence of certain events, including, but not limited to: (i) the Guarantor ceasesceasing to be a subsidiary; and (ii) payment in full of the principal and accrued and unpaid interest on the Senior Credit Facilities and all other obligations.
As of December 31, 2015, theThe maximum potential amount of future payments the Guarantors could be required to make under the Guarantee is the principal amount of the Senior Credit Facilities plus all accrued and unpaid interest thereon. However, as of December 31, 2015,2017, the Guarantors are not expected to be required to perform under the Guarantee.
Mortgages81
NOVANTA INC.
NOTES TO CONSOLIDATED FINANCIAL STATEMENTS — (Continued)
AS OF DECEMBER 31, 2017
The Company’s obligations under the Senior Credit Facilities are secured, on a senior basis, by a lien on substantially all of the assets of the Company and certain United States (“U.S.”), United Kingdom (“U.K.”) and German subsidiaries and guaranteed by the Company and these subsidiaries. The Second Amended and Restated Credit Agreement also contains customary events of default.
Deferred Financing Costs
In connection with the execution of the Third Amendment, the Company capitalized an additional $0.7 million deferred financing costs. The Company allocated these costs between the term loan and the revolving credit facility and is amortizing the costs on a straight-line basis over the term of the Senior Credit Facilities. Previously unamortized deferred financing costs related to the Second Amended and Restated Credit Agreement dated May 19, 2016 and as required thereby, GSI Group Corporationamended and Excel Technology, Inc. (“Excel”), each a subsidiaryrestated credit agreement dated December 27, 2012 will continue to be amortized. Non-cash interest expense related to the amortization of the Company, continuesdeferred financing costs was $0.8 million, $0.9 million and $0.9 million in 2017, 2016 and 2015, respectively. Unamortized deferred financing costs are presented as a reduction to be subject to an Open-End Deed of Trust, Assignment of Leases and Rents, Security Agreement and Fixture Filing, datedthe debt balances on the consolidated balance sheet as of October 19, 2011, in favor of or for the benefit of the Trustee, wherein GSI Group Corporation and Excel mortgaged, granted, bargained, assigned, sold and conveyed their respective interest in the property located in Mukilteo, Washington, Chatsworth, California, Orlando, Florida and Phoenix, Arizona, respectively, to secure (a) the payment of all of the obligations of the Borrower and the Guarantors under the Amended and Restated Credit Agreement, the respective mortgages and the other Security Documents (as defined in the respective mortgage), and (b) the performance of all terms, covenants, conditions, provisions, agreements and liabilities contained in the credit agreement.December 31, 2017.
Fair Value of Debt
As of December 31, 20152017 and 2014,2016, the outstanding balance of the Company’s debt approximated its fair value based on current rates available to the Company for debt of the same maturities. The fair value of the Company’s debt is classified as Level 2 under the fair value hierarchy.
11.
12. Capital Stock and Share-Based Compensation
Capital Stock
The authorized capital of the Company consists of an unlimited number of common shares without nominal or par value. Holders of common shares are entitled to one vote per share. Holders of common shares are entitled to receive dividends, if and when declared by the Board of Directors, and to share ratably in its assets legally available for distribution to the stockholders in the event of liquidation. Holders of common shares have no redemption or conversion rights.
2010 Incentive Award Plan
In November 2010, the Company’s stockholders approved the 2010 Incentive Award Plan (the “2010 Incentive Plan”), under which the Company may grant share-based compensation awards to employees, consultants and directors. In May 2014, the Company’s stockholders approved the amended and restated 2010 Incentive Award Plan (theand, in July 2016, the Company approved a further amended and restated 2010 Incentive Award Plan (as amended, the “Amended and Restated 2010 Incentive Plan”). The maximum number of shares which can be issued pursuant to the Amended and Restated 2010 Incentive Plan is 4,398,613, subject to adjustment as set forth in the Amended and Restated 2010 Incentive Plan. The Amended and Restated 2010 Incentive Plan provides for the grant of incentive stock options, non-qualified stock options, restricted stock, restricted stock units, stock appreciation
74
GSI GROUP INC.
NOTES TO CONSOLIDATED FINANCIAL STATEMENTS — (Continued)
AS OF DECEMBER 31, 2015
rights, deferred stock, deferred stock units, dividendsdividend equivalents, performance awards and stock payments (collectively referred to as “Awards”). The Amended and Restated 2010 Incentive Plan allows the Company to continue to grant awardsAwards intended to constitute “performance-based compensation” for purposes of Section 162(m) of the Internal Revenue Code of 1986, as amended, and includes certain provisions that reflect good corporate governance practices. The Amended and Restated 2010 Incentive Plan provides for specific limits on the number of shares with respect to Awards that may be granted to any person during any calendar year and the amount of cash that can be paid with respect to Awards to any one person during any calendar year. The Amended and Restated 2010 Incentive Plan will expire and no further Awards may be granted after April 9, 2024. As of December 31, 2015,2017, there were 1,986,1541,301,310 shares available for future awards under the Amended and Restated 2010 Incentive Plan.
Restricted stock units represent the right to receive common shares or the fair market value of such shares in cash as determined by the administrator of the Amended and Restated 2010 Incentive Plan at a specified date in the future, subject to forfeiture of such right. The purchase price for restricted stock units, if any, will be determined by the administrator of the Amended and Restated 2010 Incentive Plan on an award-by-award basis. Deferred stock units entitle the recipient thereof to receive one share of common stock on the date such deferred stock unit becomes vested and other conditions are removed or expire, if applicable, or upon a specified settlement date thereafter. Deferred stock units are typically awarded without payment of consideration.
Shares subject to Awards that have expired, forfeited or settled in cash, or repurchased by the Company at the same price paid by the awardee may be added back to the number of shares available for grant under the Amended and Restated 2010 Incentive Plan and may be granted as new Awards. SharesNotwithstanding the foregoing, the following shares will not be added back to the number of shares available for grant: (a) shares that are used to pay the exercise price for an option, (b) shares tendered or withheld to pay taxes with respect to any Award (other than options and stock appreciation rights) to the extent they exceed the number of shares with a fair market value equal to the tax liability based on minimum withholding rates, (c) shares tendered or withheld to pay taxes with respect to options and stock appreciation rights, (d) shares subject to a stock appreciation right that are not issued in connection with the stock
82
NOVANTA INC.
NOTES TO CONSOLIDATED FINANCIAL STATEMENTS — (Continued)
AS OF DECEMBER 31, 2017
settlement of the stock appreciation right on exercise thereof, and (e) shares purchased on the open market with the cash proceeds from the exercise of options will not be added back to the number of shares available for grant under the Amended and Restated 2010 Incentive Plan.options. Shares issued to satisfy Awards under the Amended and Restated 2010 Incentive Plan may be previously authorized but unissued shares, treasury shares or shares repurchased on the open market.
The table below summarizes activities relating to restricted and deferred stock units issued and outstanding under the Amended and Restated 2010 Incentive Plan during the year ended December 31, 2015:
| Restricted and Deferred Stock Units (In thousands) |
|
| Weighted Average Grant Date Fair Value |
|
| Weighted Average Remaining Vesting Period (in years) |
| Aggregate Intrinsic Value (1) (In thousands) |
| |||
Unvested at December 31, 2014 |
| 749 |
|
| $ | 10.80 |
|
|
|
|
|
|
|
Granted |
| 345 |
|
| $ | 13.46 |
|
|
|
|
|
|
|
Vested |
| (428 | ) |
| $ | 10.73 |
|
|
|
|
|
|
|
Forfeited |
| (47 | ) |
| $ | 11.11 |
|
|
|
|
|
|
|
Unvested at December 31, 2015 |
| 619 |
|
| $ | 12.32 |
|
| 0.88 years |
| $ | 8,429 |
|
Expected to vest as of December 31, 2015 |
| 605 |
|
| $ | 12.31 |
|
| 0.88 years |
| $ | 8,243 |
|
|
|
The total fair value of restricted stock units that vested in 2015, based on the market price of the underlying stock on the day of vesting, was $5.1 million.
Other Issuances
In March 2014, the Company granted restricted stock units in an aggregate of 180,000 shares as employment inducement awards related to an acquisition. These restricted stock units are performance-based awards and would vest after two years if certain financial targets and service conditions have been achieved. In 2015, these financial targets were no longer deemed probable and the cumulative expense recognized in the prior year was reversed. The share-based compensation expense and related adjustments for these awards are recorded in restructuring, acquisition and divestiture related costs in the consolidated statement of operations.
75
GSI GROUP INC.
NOTES TO CONSOLIDATED FINANCIAL STATEMENTS — (Continued)
AS OF DECEMBER 31, 2015
Share-Based Compensation Expense
The table below summarizes share-based compensation expense recorded in income from continuing operations (in thousands):
| Year Ended December 31, |
| Year Ended December 31, |
| ||||||||||||||||||
| 2015 |
|
| 2014 |
|
| 2013 |
| 2017 |
|
| 2016 |
|
| 2015 |
| ||||||
Selling, general and administrative | $ | 3,960 |
|
| $ | 3,967 |
|
| $ | 5,144 |
| $ | 5,065 |
|
| $ | 3,920 |
|
| $ | 3,960 |
|
Research and development and engineering |
| 170 |
|
|
| 196 |
|
|
| 180 |
|
| 221 |
|
|
| 117 |
|
|
| 170 |
|
Cost of revenue |
| 257 |
|
|
| 166 |
|
|
| 118 |
|
| 207 |
|
|
| 256 |
|
|
| 257 |
|
Restructuring, acquisition and divestiture related costs |
| (322 | ) |
|
| 322 |
|
|
| 125 |
|
| — |
|
|
| — |
|
|
| (322 | ) |
Total share-based compensation expense | $ | 4,065 |
|
| $ | 4,651 |
|
| $ | 5,567 |
| $ | 5,493 |
|
| $ | 4,293 |
|
| $ | 4,065 |
|
The expense recorded during each of the years ended December 31, 2015, 20142017, 2016 and 20132015 included $0.5 million related to deferred stock units granted to the members of the Company’s Board of Directors pursuant to the Company’s Amended and Restated 2010 Incentive Plan. The
As of December 31, 2017, the Company’s outstanding equity awards for which compensation expense associated withwill be recognized in the respective deferredfuture consist of time-based restricted stock units, was recognized in full on the respective date of grant, as the deferredperformance stock units, were fully vested and nonforfeitable upon grant.stock options granted under the Amended and Restated 2010 Incentive Plan. The Company expects to record aggregate share-based compensation expense of $9.8 million, net of estimated forfeitures, subsequent to December 31, 2017, over a weighted average period of 2.61 years, for all outstanding equity awards.
Restricted Stock Units and Deferred Stock Units
The Company’s restricted stock unit awardsunits (“RSUs”) have generally been issued with a three-year vesting periodperiods ranging from three years to five years and vest based solely on service conditions. Accordingly, the Company generally recognizes compensation expense on a straight-line basis over the requisite service period. The Company reduces the compensation expense by an estimated forfeiture rate which is based on anticipated forfeitures and actual experience.
AsDeferred stock units (“DSUs”) are granted to the members of December 31, 2015, the Company’s outstanding equity awards for whichBoard of Directors. The compensation expense will beassociated with the DSUs is recognized in full on the future consistrespective date of time-basedgrant, as DSUs are fully vested and non-forfeitable upon grant.
The table below summarizes activities relating to restricted and deferred stock units grantedissued and outstanding under the Amended and Restated 2010 Incentive Plan. Plan during 2017:
| Restricted and Deferred Stock Units (in thousands) |
|
| Weighted Average Grant Date Fair Value |
|
| Weighted Average Remaining Vesting Period (in years) |
| Aggregate Intrinsic Value (1) (in thousands) |
| |||
Unvested at December 31, 2016 |
| 635 |
|
| $ | 13.97 |
|
|
|
|
|
|
|
Granted |
| 248 |
|
| $ | 25.62 |
|
|
|
|
|
|
|
Vested |
| (224 | ) |
| $ | 14.05 |
|
|
|
|
|
|
|
Forfeited |
| (45 | ) |
| $ | 18.18 |
|
|
|
|
|
|
|
Unvested at December 31, 2017 |
| 614 |
|
| $ | 18.35 |
|
| 1.86 years |
| $ | 30,721 |
|
Expected to vest as of December 31, 2017 |
| 589 |
|
| $ | 18.13 |
|
| 1.86 years |
| $ | 29,436 |
|
(1) | The aggregate intrinsic value is calculated based on the fair value of $50.00 per share of the Company’s common stock on December 31, 2017 due to the fact that the restricted stock units carry a $0 purchase price. |
The total fair value of restricted stock units that vested in 2017 and deferred stock units that were granted and vested in 2017, based on the market price of the underlying stock on the day of vesting, was $6.0 million.
83
NOVANTA INC.
NOTES TO CONSOLIDATED FINANCIAL STATEMENTS — (Continued)
AS OF DECEMBER 31, 2017
The Company expectsgranted two types of performance-based stock awards to record aggregate share-basedcertain members of the executive management team: non-GAAP EPS performance-based restricted stock units (“EPS-PSUs”) and relative total shareholder return performance-based restricted stock units (“TSR-PSUs”). Both types of performance-based restricted stock units generally cliff vest on the first day following the end of the three-year performance period.
The number of common shares to be issued upon settlement following vesting of the EPS-PSUs is determined based on the Company’s cumulative non-GAAP EPS over the three-year performance period against the target established by the Company’s Board of Directors at the time of grant and will be in the range of zero to 200% of the target number of shares. The Company recognizes compensation expense ratably over the performance period based on the number of shares that are deemed probable of vesting at the end of the three-year performance cycle. This probability assessment is performed quarterly and the cumulative effect of a change in the estimated compensation expense, if any, is recognized in the consolidated statement of operations in the period in which such determination is made.
The number of common shares to be issued upon settlement following vesting of the TSR-PSUs is determined based on the relative market performance of the Company’s common stock compared to the Russell 2000 Index over the three-year performance period using a payout formula established by the Company’s Board of Directors at the time of grant and will be in the range of zero to 200% of the target number of shares. The Company recognizes the related compensation expense based on the fair value of the TSR-PSUs, determined using Monte-Carlo valuation model as of the grant date, on a straight-line basis from the grant date to the end of the three-year performance period. Compensation expense will not be affected by the number of TSR-PSUs that will actually vest at the end of the three-year performance period.
The table below summarizes activities relating to performance-based stock awards issued and outstanding under the Company’s Amended and Restated 2010 Incentive Plan during 2017:
| Performance Stock Units (1) (in thousands) |
|
| Weighted Average Grant Date Fair Value |
|
| Weighted Average Remaining Vesting Period (in years) |
| Aggregate Intrinsic Value (2) (in thousands) |
| |||
Unvested at December 31, 2016 |
| 29 |
|
| $ | 14.13 |
|
|
|
|
|
|
|
Granted |
| 60 |
|
| $ | 28.80 |
|
|
|
|
|
|
|
Vested |
| — |
|
| $ | — |
|
|
|
|
|
|
|
Forfeited |
| — |
|
| $ | — |
|
|
|
|
|
|
|
Unvested at December 31, 2017 |
| 89 |
|
| $ | 24.00 |
|
| 1.68 years |
| $ | 4,474 |
|
Expected to vest as of December 31, 2017 |
| 89 |
|
| $ | 24.00 |
|
| 1.68 years |
| $ | 4,474 |
|
(1) | The unvested PSUs are shown in this table at target, except for the number of shares vested, which reflect the shares earned. As of December 31, 2017, the maximum number of PSUs available to be earned is approximately 179 thousand. |
(2) | The aggregate intrinsic value is calculated based on the fair value of $50.00 per share of the Company’s common stock on December 31, 2017 due to the fact that the performance stock units carry a $0 purchase price. |
The fair value of the TSR-PSUs at the date of grant was estimated using the Monte-Carlo valuation model with the following assumptions:
| Year Ended December 31, 2017 |
| |
Grant-date stock price | $ | 24.30 |
|
Expected volatility |
| 28.6 | % |
Risk-free interest rate |
| 1.44 | % |
Expected annual dividend yield |
| — |
|
Weighted average fair value | $ | 33.31 |
|
84
NOVANTA INC.
NOTES TO CONSOLIDATED FINANCIAL STATEMENTS — (Continued)
AS OF DECEMBER 31, 2017
On March 30, 2016, the Company granted 193 thousand stock options to certain members of the executive management team to purchase common shares of the Company at a price equal to the closing market price of the Company’s common shares on the date of grant. The stock options vest ratably on the anniversary date of the grant date over a three-year period and expire on the tenth anniversary of the grant date. The fair value of stock options is estimated using the Black-Scholes valuation model. Key input assumptions used to estimate the fair value of stock options include the expected option term, the expected volatility of the Company’s common stock over the expected term of the options, the risk-free interest rate, and the expected dividend yield. The Company recognizes the compensation expense of $4.9 million, netstock options on a straight-line basis in the consolidated statement of estimated forfeitures, subsequentoperations over the vesting period. No stock options were granted or exercised during 2017.
The following table shows stock options that were outstanding, exercisable and expected to vest as of December 31, 2015, over a2017 and the related weighted average period of 1.9 years, for all outstanding equity awards.exercise price, weighted average remaining contractual term and aggregate intrinsic value:
| Number of Shares (In thousands) |
|
| Weighted Average Exercise Price |
|
| Weighted Average Remaining Contractual Term (years) |
|
| Aggregate Intrinsic Value (1) (In thousands) |
| ||||
Stock options outstanding |
| 103 |
|
| $ | 14.13 |
|
|
| 8.25 years |
|
| $ | 3,690 |
|
Stock options exercisable |
| 34 |
|
| $ | 14.13 |
|
|
| 8.25 years |
|
| $ | 1,230 |
|
Stock options expected to vest |
| 103 |
|
| $ | 14.13 |
|
|
| 8.25 years |
|
| $ | 3,690 |
|
(1) | The aggregate intrinsic value is calculated as the difference between the closing market price of $50.00 per share of the Company’s common stock on December 31, 2017 and the exercise price of the stock options. |
12.13. Employee Benefit Plans
Defined Benefit Plans
The Company maintains a defined benefit pension plan in the United Kingdom (the “U.K. Plan”). In 1997, membership to theThe U.K. Plan was closed. In 2003, the Company was allowedclosed to stopnew membership in 1997 and stopped accruing additional pension benefits to the participants.for existing members in 2003. Benefits under the U.K. Plan were based on the employees’ years of service and compensation as of 2003.the date the plan was frozen in 2003, adjusted for inflation. The Company continues to fund the plan in sufficient amounts to cover current benefit payments as well as to fund a portion of the unfunded pension obligations based on periodic agreements with the trustees of the U.K. Plan.
The net periodic pension cost includedconsisted of the following components (in thousands):
| Year Ended December 31, |
| Year Ended December 31, |
| ||||||||||||||||||
| 2015 |
|
| 2014 |
|
| 2013 |
| 2017 |
|
| 2016 |
|
| 2015 |
| ||||||
Components of the net periodic pension cost: |
|
|
|
|
|
|
|
|
|
|
|
|
|
|
|
|
|
|
|
|
|
|
Interest cost | $ | 1,340 |
|
| $ | 1,589 |
|
| $ | 1,403 |
| $ | 991 |
|
| $ | 1,232 |
|
| $ | 1,340 |
|
Expected return on plan assets |
| (1,844 | ) |
|
| (1,958 | ) |
|
| (1,595 | ) |
| (1,665 | ) |
|
| (1,566 | ) |
|
| (1,844 | ) |
Amortization of actuarial losses |
| 875 |
|
|
| 374 |
|
|
| 668 |
|
| 1,045 |
|
|
| 726 |
|
|
| 875 |
|
Net periodic pension cost | $ | 371 |
|
| $ | 5 |
|
| $ | 476 |
| $ | 371 |
|
| $ | 392 |
|
| $ | 371 |
|
The actuarial assumptions used to compute the net periodic pension cost for the years ended December 31, 2017, 2016 and 2015, 2014 and 2013, respectively, for the U.K. Plan were as follows:
| Year Ended December 31, |
| Year Ended December 31, |
| ||||||||||||||||||
| 2015 |
|
| 2014 |
|
| 2013 |
| 2017 |
|
| 2016 |
|
| 2015 |
| ||||||
Weighted-average discount rate |
| 3.5 | % |
|
| 4.6 | % |
|
| 4.3 | % |
| 2.6 | % |
|
| 3.8 | % |
|
| 3.5 | % |
Weighted-average long-term rate of return on plan assets |
| 5.6 | % |
|
| 5.9 | % |
|
| 5.7 | % |
| 5.2 | % |
|
| 5.3 | % |
|
| 5.6 | % |
7685
GSI GROUPNOVANTA INC.
NOTES TO CONSOLIDATED FINANCIAL STATEMENTS — (Continued)
AS OF DECEMBER 31, 20152017
The actuarial assumptions used to compute the funded status of the U.K. Planbenefit obligations as of December 31, 20152017 and 2014,2016, respectively, were as follows:
| December 31, |
| December 31, |
| ||||||||||
| 2015 |
|
| 2014 |
| 2017 |
|
| 2016 |
| ||||
Weighted-average discount rate |
| 3.8 | % |
|
| 3.5 | % |
| 2.4 | % |
|
| 2.6 | % |
Rate of inflation |
| 2.8 | % |
|
| 2.7 | % |
| 2.9 | % |
|
| 3.0 | % |
The discount rates used are derived from (AA) corporate bonds that have maturities approximating the terms of the related obligations. In estimating the expected return on plan assets, the Company considered the historical performance of the major asset classes held by the U.K. Plan and current forecasts of future rates of return for these asset classes.
The following table provides a reconciliation of benefit obligations and plan assets of the U.K. Plan (in thousands):
| December 31, |
| December 31, |
| ||||||||||
| 2015 |
|
| 2014 |
| 2017 |
|
| 2016 |
| ||||
Change in benefit obligation: |
|
|
|
|
|
|
|
|
|
|
|
|
|
|
Projected benefit obligation at beginning of year | $ | 39,421 |
|
| $ | 35,193 |
| $ | 37,261 |
|
| $ | 35,914 |
|
Interest cost |
| 1,340 |
|
|
| 1,589 |
|
| 991 |
|
|
| 1,232 |
|
Actuarial (gains) losses |
| (2,083 | ) |
|
| 6,060 |
|
| (27 | ) |
|
| 7,425 |
|
Benefits paid |
| (798 | ) |
|
| (1,006 | ) |
| (1,313 | ) |
|
| (809 | ) |
Foreign currency exchange rate changes |
| (1,966 | ) |
|
| (2,415 | ) |
| 3,417 |
|
|
| (6,501 | ) |
Projected benefit obligation at end of year | $ | 35,914 |
|
| $ | 39,421 |
| $ | 40,329 |
|
| $ | 37,261 |
|
Accumulated benefit obligation at end of year | $ | 35,914 |
|
| $ | 39,421 |
| $ | 40,329 |
|
| $ | 37,261 |
|
Change in plan assets: |
|
|
|
|
|
|
|
|
|
|
|
|
|
|
Fair value of plan assets at beginning of year | $ | 33,610 |
|
| $ | 33,457 |
| $ | 31,304 |
|
| $ | 32,374 |
|
Actual return on plan assets |
| 342 |
|
|
| 2,234 |
|
| 2,605 |
|
|
| 4,522 |
|
Employer contributions |
| 955 |
|
|
| 1,000 |
|
| 887 |
|
|
| 868 |
|
Benefits paid |
| (798 | ) |
|
| (1,006 | ) |
| (1,313 | ) |
|
| (809 | ) |
Foreign currency exchange rate changes |
| (1,735 | ) |
|
| (2,075 | ) |
| 2,993 |
|
|
| (5,651 | ) |
Fair value of plan assets at end of year | $ | 32,374 |
|
| $ | 33,610 |
| $ | 36,476 |
|
| $ | 31,304 |
|
Funded status at end of year | $ | (3,540 | ) |
| $ | (5,811 | ) | $ | (3,853 | ) |
| $ | (5,957 | ) |
Amounts included in accumulated other comprehensive loss not yet recognized in net periodic pension cost: |
|
|
|
|
|
|
|
|
|
|
|
|
|
|
Net actuarial losses at beginning of year | $ | (11,697 | ) |
| $ | (9,874 | ) | |||||||
Net actuarial gains (losses) during the year |
| 967 |
|
|
| (4,469 | ) | |||||||
Amounts reclassified from accumulated other comprehensive income to income before income taxes |
| 1,045 |
|
|
| 726 |
| |||||||
Foreign currency exchange rate changes |
| (808 | ) |
|
| 1,920 |
| |||||||
Net actuarial loss | $ | (9,874 | ) |
| $ | (11,890 | ) | $ | (10,493 | ) |
| $ | (11,697 | ) |
Amounts expected to be amortized from accumulated other comprehensive loss into net periodic pension cost over the next fiscal year consists of: |
|
|
|
|
|
|
|
|
|
|
|
|
|
|
Net actuarial loss | $ | 794 |
|
| $ | 892 |
| $ | 957 |
|
| $ | 1,148 |
|
The funded status of the U.K. Plan is included in other long term liabilities in the accompanying consolidated balance sheets.
7786
GSI GROUPNOVANTA INC.
NOTES TO CONSOLIDATED FINANCIAL STATEMENTS — (Continued)
AS OF DECEMBER 31, 20152017
The following table reflects the total expected benefit payments to plan participants and have been estimated based on the same assumptions used to measure the Company’s benefit obligations as of December 31, 20152017 (in thousands):
| Amount |
| Amount |
| ||
2016 | $ | 941 |
| |||
2017 |
| 1,043 |
| |||
2018 |
| 868 |
| $ | 768 |
|
2019 |
| 1,244 |
|
| 999 |
|
2020 |
| 1,428 |
|
| 1,234 |
|
2021-2025 |
| 8,135 |
| |||
2021 |
| 1,430 |
| |||
2022 |
| 1,169 |
| |||
2023-2026 |
| 8,320 |
| |||
Total | $ | 13,659 |
| $ | 13,920 |
|
In the U.K., funding valuations are conducted every three years in order to determine the future level of contributions. Based on the results of the most recent valuation completed in the fourth quarter of 2015, the Company’s annual contributions will be approximately $1.0$0.9 million per year in 2016 and will increase by 2.9% per year thereafter.2018. A new funding valuation is expected to be performed in 2018 using market assumptions as of December 31, 2017.
Fair Value of Plan Assets
The Company’strustees of the U.K. Plan have the fiduciary responsibilities to manage the plan assets in consultation with the Company. The overall objective is to invest plan assets in a portfolio of diversified assets, primarily through the use of institutional collective funds, to achieve long-term growth. The strategic asset allocation usesbalanced growth through a combination of risk controlledinvestments in equities for long-term growth and index strategiesinvestments in fixed incomedebt instruments that match a portion of the expected future benefit payments and global equities. The target allocations are approximately 60% to funds investing in global equities, approximately 18%maintain adequate liquidity to funds investing in global bonds, approximately 9%make pension payments to alternative assets (including private equity, real estate and hedge funds), and approximately 13% in cash.pensioners.
The following table summarizes the fair values of Plan assets by asset category as of December 31, 20152017 (in thousands):
Asset Category |
| Fair Value |
|
| Quoted Prices in Active Markets for Identical Assets (Level 1) |
|
| Significant Other Observable Inputs (Level 2) |
|
| Significant Other Unobservable Inputs (Level 3) |
|
| Fair Value |
|
| Quoted Prices in Active Markets for Identical Assets (Level 1) |
|
| Significant Other Observable Inputs (Level 2) |
|
| Significant Other Unobservable Inputs (Level 3) |
|
| Not Subject to Leveling |
| |||||||||
Mutual Funds: |
|
|
|
|
|
|
|
|
|
|
|
|
|
|
|
|
|
|
|
|
|
|
|
|
|
|
|
|
|
|
|
|
|
|
|
|
Balanced (1) |
| $ | 15,611 |
|
| $ | — |
|
| $ | 15,611 |
|
| $ | — |
|
| $ | 26,816 |
|
| $ | — |
|
| $ | — |
|
| $ | — |
|
| $ | 26,816 |
|
Growth (2) |
|
| 16,583 |
|
|
| — |
|
|
| 16,583 |
|
|
| — |
| ||||||||||||||||||||
Fixed income (2) |
|
| 9,524 |
|
|
| — |
|
|
| — |
|
|
| — |
|
|
| 9,524 |
| ||||||||||||||||
Cash |
|
| 180 |
|
|
| 180 |
|
|
| — |
|
|
| — |
|
|
| 136 |
|
|
| 136 |
|
|
| — |
|
|
| — |
|
|
| — |
|
Total |
| $ | 32,374 |
|
| $ | 180 |
|
| $ | 32,194 |
|
| $ | — |
|
| $ | 36,476 |
|
| $ | 136 |
|
| $ | — |
|
| $ | — |
|
| $ | 36,340 |
|
(1) | This class comprises a diversified portfolio of global investments which seeks a balanced return between capital growth and fixed income and is allocated on a weighted average basis as follows: equities |
(2) | This class comprises a diversified portfolio of global investments which seeks |
87
NOVANTA INC.
NOTES TO CONSOLIDATED FINANCIAL STATEMENTS — (Continued)
AS OF DECEMBER 31, 2017
The following table summarizes the fair values of Plan assets by asset category as of December 31, 20142016 (in thousands):
Asset Category |
| Fair Value |
|
| Quoted Prices in Active Markets for Identical Assets (Level 1) |
|
| Significant Other Observable Inputs (Level 2) |
|
| Significant Other Unobservable Inputs (Level 3) |
|
| Fair Value |
|
| Quoted Prices in Active Markets for Identical Assets (Level 1) |
|
| Significant Other Observable Inputs (Level 2) |
|
| Significant Other Unobservable Inputs (Level 3) |
|
| Not Subject to Leveling |
| |||||||||
Mutual Funds: |
|
|
|
|
|
|
|
|
|
|
|
|
|
|
|
|
|
|
|
|
|
|
|
|
|
|
|
|
|
|
|
|
|
|
|
|
Balanced (1) |
| $ | 16,287 |
|
| $ | — |
|
| $ | 16,287 |
|
| $ | — |
|
| $ | 23,317 |
|
| $ | — |
|
| $ | — |
|
| $ | — |
|
| $ | 23,317 |
|
Growth (2) |
|
| 17,149 |
|
|
| — |
|
|
| 17,149 |
|
|
| — |
|
|
| 3,239 |
|
|
| — |
|
|
| — |
|
|
| — |
|
|
| 3,239 |
|
Fixed income (3) |
|
| 4,512 |
|
|
| — |
|
|
| — |
|
|
| — |
|
|
| 4,512 |
| ||||||||||||||||
Cash |
|
| 174 |
|
|
| 174 |
|
|
| — |
|
|
| — |
|
|
| 236 |
|
|
| 236 |
|
|
| — |
|
|
| — |
|
|
| — |
|
Total |
| $ | 33,610 |
|
| $ | 174 |
|
| $ | 33,436 |
|
| $ | — |
|
| $ | 31,304 |
|
| $ | 236 |
|
| $ | — |
|
| $ | — |
|
| $ | 31,068 |
|
78
GSI GROUP INC.
NOTES TO CONSOLIDATED FINANCIAL STATEMENTS — (Continued)
AS OF DECEMBER 31, 2015
(1) | This class comprises a diversified portfolio of global investments which seeks a balanced return between capital growth and fixed income and is allocated on a weighted average basis as follows: equities |
(2) | This class comprises a diversified portfolio of global investments which seeks long-term capital growth and is allocated on a weighted average basis as follows: equities |
(3) | This class comprises a diversified portfolio of global investments which seeks fixed income growth and is allocated on a weighted average basis as follows: bonds (93%), other assets (1%) and cash (6%). |
The tables above present the fair value of plan assets in accordance with the fair value hierarchy. In 2016, the Company adopted ASU 2015-07, “Fair Value Measurement (Topic 820): Disclosure for Investments in Certain Entities That Calculate Net Asset Value per Share (or Its Equivalent).” As a result of the adoption, pension plan assets measured using the net asset value per share (or its equivalent) are presented as “Not Subject to Leveling.” Except for cash, pension plan assets are measured using net asset value per share (or its equivalent) and are reported as a level 2 investment above.. These investments have quoted prices in inactive markets and there are significant other observable inputs which can be corroborated by observable market data for substantially the full term of the plan assets.
Defined Contribution Plans
The Company has defined contribution employee savings plans in the U.K., Japan, and the U.S. The Company matches the contributions of participating employees on the basis of percentages specified in each plan. Company matching contributions to the plans were $2.7$3.1 million, $2.6$2.5 million and $1.7$2.7 million for the years ended December 31, 2015, 20142017, 2016 and 2013,2015, respectively.
13.14. Income Taxes
Components of the Company’s income (loss) from continuing operations before income taxes are as follows (in thousands):
| Year Ended December 31, |
| Year Ended December 31, |
| ||||||||||||||||||
| 2015 |
|
| 2014 |
|
| 2013 |
| 2017 |
|
| 2016 |
|
| 2015 |
| ||||||
Income (loss) from continuing operations before income taxes: |
|
|
|
|
|
|
|
|
|
|
|
|
|
|
|
|
|
|
|
|
|
|
Canadian | $ | (1,674 | ) |
| $ | (20,212 | ) |
| $ | (5,366 | ) | |||||||||||
Canada | $ | (2,036 | ) |
| $ | (1,872 | ) |
| $ | (1,674 | ) | |||||||||||
U.S. |
| 23,298 |
|
|
| (9,661 | ) |
|
| 12,838 |
|
| 37,327 |
|
|
| 20,422 |
|
|
| 23,298 |
|
Other |
| 24,398 |
|
|
| 11,958 |
|
|
| 8,705 |
|
| 40,843 |
|
|
| 13,972 |
|
|
| 24,398 |
|
Total | $ | 46,022 |
|
| $ | (17,915 | ) |
| $ | 16,177 |
| $ | 76,134 |
|
| $ | 32,522 |
|
| $ | 46,022 |
|
88
NOVANTA INC.
NOTES TO CONSOLIDATED FINANCIAL STATEMENTS — (Continued)
AS OF DECEMBER 31, 2017
Components of the Company’s income tax provision (benefit) are as follows (in thousands):
| Year Ended December 31, |
| Year Ended December 31, |
| ||||||||||||||||||
| 2015 |
|
| 2014 |
|
| 2013 |
| 2017 |
|
| 2016 |
|
| 2015 |
| ||||||
Current |
|
|
|
|
|
|
|
|
|
|
|
|
|
|
|
|
|
|
|
|
|
|
Canadian | $ | 96 |
|
| $ | 175 |
|
| $ | — |
| |||||||||||
Canada | $ | 146 |
|
| $ | 43 |
|
| $ | 96 |
| |||||||||||
U.S. |
| 8,136 |
|
|
| 3,615 |
|
|
| 1,662 |
|
| 9,434 |
|
|
| 9,678 |
|
|
| 8,136 |
|
Other |
| 3,854 |
|
|
| 1,940 |
|
|
| 652 |
|
| 6,807 |
|
|
| 2,564 |
|
|
| 3,854 |
|
|
| 12,086 |
|
|
| 5,730 |
|
|
| 2,314 |
|
| 16,387 |
|
|
| 12,285 |
|
|
| 12,086 |
|
Deferred |
|
|
|
|
|
|
|
|
|
|
|
|
|
|
|
|
|
|
|
|
|
|
Canadian |
| — |
|
|
| — |
|
|
| — |
| |||||||||||
Canada |
| — |
|
|
| — |
|
|
| — |
| |||||||||||
U.S. |
| (3,239 | ) |
|
| (6,731 | ) |
|
| 2,206 |
|
| 2,396 |
|
|
| (2,378 | ) |
|
| (3,239 | ) |
Other |
| 1,547 |
|
|
| (5 | ) |
|
| 1,680 |
|
| (4,956 | ) |
|
| 612 |
|
|
| 1,547 |
|
|
| (1,692 | ) |
|
| (6,736 | ) |
|
| 3,886 |
|
| (2,560 | ) |
|
| (1,766 | ) |
|
| (1,692 | ) |
Total | $ | 10,394 |
|
| $ | (1,006 | ) |
| $ | 6,200 |
| $ | 13,827 |
|
| $ | 10,519 |
|
| $ | 10,394 |
|
79
GSI GROUP INC.
NOTES TO CONSOLIDATED FINANCIAL STATEMENTS — (Continued)
AS OF DECEMBER 31, 2015
The Company is incorporated in Canada and therefore uses the Canadian statutory rate for income tax disclosure. The reconciliation of the statutory Canadian tax rate to the effective tax rate related to income before income taxes from continuing operations is as follows (in thousands, except percentage data):
| Year Ended December 31, |
| Year Ended December 31, |
| ||||||||||||||||||
| 2015 |
|
| 2014 |
|
| 2013 |
| 2017 |
|
| 2016 |
|
| 2015 |
| ||||||
Statutory Canadian tax rate |
| 27.00 | % |
|
| 27.00 | % |
|
| 26.00 | % |
| 29.00 | % |
|
| 28.50 | % |
|
| 27.00 | % |
Expected income tax provision at Canadian statutory tax rate | $ | 12,426 |
|
| $ | (4,837 | ) |
| $ | 4,206 |
| $ | 22,079 |
|
| $ | 9,269 |
|
| $ | 12,426 |
|
International tax rate differences |
| 304 |
|
|
| (1,132 | ) |
|
| 156 |
|
| (2,038 | ) |
|
| 891 |
|
|
| 304 |
|
State income taxes, net |
| 453 |
|
|
| (271 | ) |
|
| 148 |
|
| 674 |
|
|
| 503 |
|
|
| 453 |
|
Withholding and other taxes |
| 680 |
|
|
| 421 |
|
|
| 321 |
|
| 484 |
|
|
| 441 |
|
|
| 731 |
|
Permanent differences |
| 1,130 |
|
|
| 486 |
|
|
| 106 |
|
| 274 |
|
|
| 179 |
|
|
| 1,000 |
|
Section 199 deduction |
| (1,188 | ) |
|
| (574 | ) |
|
| — |
|
| (1,148 | ) |
|
| (1,063 | ) |
|
| (1,188 | ) |
Tax credits |
| (984 | ) |
|
| (1,095 | ) |
|
| (990 | ) | |||||||||||
Statutory tax rate changes |
| 2,823 |
|
|
| (856 | ) |
|
| 95 |
| |||||||||||
Uncertain tax positions |
| (1,607 | ) |
|
| (103 | ) |
|
| 121 |
| |||||||||||
Change in valuation allowance |
| (612 | ) |
|
| 4,809 |
|
|
| (3,076 | ) |
| (354 | ) |
|
| 1,202 |
|
|
| (612 | ) |
Acquisition contingent consideration adjustments |
| 149 |
|
|
| 762 |
|
|
| — |
| |||||||||||
Transaction costs |
| 1,011 |
|
|
| 649 |
|
|
| 270 |
| |||||||||||
Provision to return differences |
| (617 | ) |
|
| 962 |
|
|
| (312 | ) |
| 225 |
|
|
| (93 | ) |
|
| (617 | ) |
Tax credits |
| (990 | ) |
|
| (1,678 | ) |
|
| (938 | ) | |||||||||||
Net operating loss expirations |
| — |
|
|
| — |
|
|
| 4,538 |
| |||||||||||
Statutory tax rate change |
| 95 |
|
|
| (13 | ) |
|
| 354 |
| |||||||||||
Uncertain tax positions |
| 121 |
|
|
| 134 |
|
|
| 259 |
| |||||||||||
IRS audit |
| (748 | ) |
|
| 241 |
|
|
| 680 |
|
| — |
|
|
| — |
|
|
| (748 | ) |
Gain on Laser Quantum acquisition |
| (6,586 | ) |
|
| — |
|
|
| — |
| |||||||||||
UK patent box |
| (1,646 | ) |
|
| — |
|
|
| — |
| |||||||||||
JK Lasers divestiture |
| (1,432 | ) |
|
| — |
|
|
| — |
|
| — |
|
|
| — |
|
|
| (1,432 | ) |
Goodwill impairment |
| — |
|
|
| 330 |
|
|
| — |
| |||||||||||
Other |
| 772 |
|
|
| 116 |
|
|
| (242 | ) |
| 471 |
|
|
| (167 | ) |
|
| 581 |
|
Reported income tax provision (benefit) | $ | 10,394 |
|
| $ | (1,006 | ) |
| $ | 6,200 |
| |||||||||||
Reported income tax provision | $ | 13,827 |
|
| $ | 10,519 |
|
| $ | 10,394 |
| |||||||||||
Effective tax rate |
| 22.6 | % |
|
| 5.6 | % |
|
| 38.3 | % |
| 18.2 | % |
|
| 32.3 | % |
|
| 22.6 | % |
80On December 22, 2017, the President of the United States signed into law the Tax Reform Act. The Tax Reform Act significantly changes U.S. tax law by, among other things, lowering corporate income tax rates, implementing a territorial tax system, providing a one-time transition Toll Charge on foreign earnings, creating a new limitation on deductible interest expense and modifying the limitation on officer compensation. The Tax Reform Act permanently reduces the U.S. corporate income tax rate from a maximum of 35% to a flat 21% rate, effective January 1, 2018.
The Company’s accounting for the Tax Reform Act is incomplete. However, the Securities and Exchange Commission has issued guidance that allows for a measurement period of up to one year after the enactment date of the Tax Reform Act to finalize the
89
GSI GROUPNOVANTA INC.
NOTES TO CONSOLIDATED FINANCIAL STATEMENTS — (Continued)
AS OF DECEMBER 31, 20152017
recording of the related tax impacts. The Company has made reasonable estimates of the effects on the consolidated statements of operations and consolidated balance sheets and has, therefore, recorded provisional amounts. Provisional amounts recorded as of December 31, 2017 are subject to refinement due to various factors, including, but not limited to, changes in interpretations, analysis and assumptions made by the Company, additional guidance that may be issued by the U.S. Department of the Treasury and the Internal Revenue Service, and any updates or changes to estimates that the Company has utilized to calculate the transition impact. The Company currently anticipates finalizing and recording any resulting adjustments by December 2018.
As a result of the Tax Reform Act, the Company was required to revalue deferred tax assets and liabilities at the newly enacted 21% U.S. federal corporate income tax rate. This revaluation resulted in an additional income tax provision of $2.8 million in income from continuing operations for the year ended December 31, 2017 and a corresponding reduction in the net deferred tax assets and liabilities. Because of the ownership structure of the Company, the Company’s foreign entities outside the U.S. are not considered controlled foreign corporations of the U.S. company, as defined under U.S. tax principles, and accordingly, the accumulated earnings of these foreign subsidiaries are not subject to the one-time Toll Charge under the Tax Reform Act.
Deferred income taxes result principally from temporary differences in the recognition of certain revenue and expense items and operating loss and tax credit carryforwards for financial and tax reporting purposes. Significant components of the Company’s deferred tax assets and liabilities as of December 31, 20152017 and 20142016 are as follows (in thousands):
December 31, |
| December 31, |
| |||||||||||
| 2015 |
|
| 2014 |
| 2017 |
|
| 2016 |
| ||||
Deferred tax assets: |
|
|
|
|
|
|
|
|
|
|
|
|
|
|
Losses & IRC Section 163(j) carryforwards | $ | 9,985 |
|
| $ | 12,742 |
| |||||||
Losses | $ | 9,407 |
|
| $ | 9,557 |
| |||||||
Compensation related deductions |
| 2,915 |
|
|
| 3,749 |
|
| 3,687 |
|
|
| 4,437 |
|
Tax credits |
| 2,409 |
|
|
| 3,502 |
|
| 2,594 |
|
|
| 2,318 |
|
Unrealized currency gains/losses |
| 183 |
|
|
| — |
| |||||||
Restructuring related liabilities |
| 294 |
|
|
| 64 |
|
| 172 |
|
|
| 471 |
|
Inventory |
| 4,415 |
|
|
| 4,495 |
|
| 3,400 |
|
|
| 5,869 |
|
Depreciation |
| 503 |
|
|
| 683 |
| |||||||
Amortization |
| 3,205 |
|
|
| — |
|
| — |
|
|
| 3,082 |
|
Warranty |
| 1,127 |
|
|
| 876 |
|
| 768 |
|
|
| 1,049 |
|
Other |
| 1,281 |
|
|
| 2,206 |
|
| — |
|
|
| 1,688 |
|
Total deferred tax assets |
| 26,134 |
|
|
| 28,317 |
|
| 20,211 |
|
|
| 28,471 |
|
Valuation allowance for deferred tax assets |
| (12,537 | ) |
|
| (14,495 | ) | |||||||
Valuation allowance on deferred tax assets |
| (12,811 | ) |
|
| (13,014 | ) | |||||||
Net deferred tax assets | $ | 13,597 |
|
| $ | 13,822 |
| $ | 7,400 |
|
| $ | 15,457 |
|
Deferred tax liabilities: |
|
|
|
|
|
|
|
|
|
|
|
|
|
|
Equity investment | $ | (1,733 | ) |
| $ | (1,594 | ) | |||||||
Equity-method investment | $ | — |
|
| $ | (1,370 | ) | |||||||
Depreciation |
| — |
|
|
| (341 | ) |
| (1,353 | ) |
|
| (749 | ) |
Amortization |
| (2,791 | ) |
|
| (36 | ) |
| (23,496 | ) |
|
| (4,162 | ) |
Unrealized currency gain/loss |
| (1,292 | ) |
|
| (2,595 | ) | |||||||
Unrealized currency gains/losses |
| — |
|
|
| (659 | ) | |||||||
Other |
| (345 | ) |
|
| (525 | ) |
| (1,171 | ) |
|
| (1,218 | ) |
Total deferred tax liabilities | $ | (6,161 | ) |
| $ | (5,091 | ) | $ | (26,020 | ) |
| $ | (8,158 | ) |
Net deferred income tax assets (liabilities) | $ | 7,436 |
|
| $ | 8,731 |
| $ | (18,620 | ) |
| $ | 7,299 |
|
In determining its income tax provisions, the Company calculated deferred tax assets and liabilities for each separate jurisdiction. The Company then considered a number of factors, including positive and negative evidence related to the realization of its deferred tax assets, to determine whether a valuation allowance should be recognized with respect to its deferred tax assets.
In 2015,2017, the Company recordedreleased valuation allowance of $0.8$0.1 million against its current yearrecorded on net operating losses and other timing items in certain tax jurisdictions. Further, the Company released $0.8$0.3 million of valuation allowance recorded on certain U.S. state net operating losses.
In 2016, the Company recorded valuation allowance of $1.3 million against its current year net operating losses and other timing items in certain tax jurisdictions. The Company also reduced its Canadian loss carryforward and other attributes and the related valuation allowance of $0.3 million. Further, the Company released $0.1 million of valuation allowance recorded on certain U.S. state net operating losses and utilized $0.6$0.4 million of its U.S. capital loss carryforward against the current year net capital gain.
In 2014, the Company recorded valuation allowance of $0.3 million against its current year net operating losses in certain tax jurisdictions and increased valuation allowance recorded on certain U.S. state tax net operating losses by $0.3 million and capital loss carryforwards by $0.4 million.90
NOVANTA INC.
In 2013, the Company adjusted a portion of its Canadian loss carryforward and the related valuation allowance of $4.8 million. The Company also recorded $1.3 million valuation allowances against its 2013 net operating losses in certain other tax jurisdictions and released valuation allowance of $0.3 million previously recorded on certain U.S. state tax credits. Additionally, the Company adjusted the carrying value of deferred tax assets on net operating losses and tax credits and their related valuation allowance in Canada and the U.K. as a result of changes in statutory tax rates amounting to $0.7 million in 2013.NOTES TO CONSOLIDATED FINANCIAL STATEMENTS — (Continued)
AS OF DECEMBER 31, 2017
Valuation allowance continues to be provided on the remaining balances of the U.S. capital loss, certain U.S. state net operating losslosses and certain foreign tax attributes that the Company has determined that it is more likely than not that they will not be realized. In conjunction with the Company’s ongoing review of its actual results and anticipated future earnings, the Company continuously reassesses the possibility of releasing the valuation allowance currently in place on its deferred tax assets.
As of December 31, 2015,2017, the Company had net operating loss carryforwards of $4.9$3.7 million (tax effected) available to reduce future taxable income. Of this amount, approximately $1.6$1.0 million relates to the U.S. and expires through 2034; $2.42036; and $2.7 million relates to
81
GSI GROUP INC.
NOTES TO CONSOLIDATED FINANCIAL STATEMENTS — (Continued)
AS OF DECEMBER 31, 2015
Canada and expires starting in 2031; $0.7 million relates to2032. In addition, the U.K. and can be carried forward indefinitely; and other countriesCompany had capital loss carryforwards of $0.2$5.7 million, which will start expiring in 2020.had a full valuation allowance. Of this amount, $5.2 million and $0.5 million related to Canada and the U.K, respectively.
As of December 31, 2014,2016, the Company had net operating loss carryforwards of $4.5$4.4 million (tax effected) available to reduce future taxable income. Of this amount, approximately $1.4$1.3 million relates to the U.S. and expires through 2033; $2.32035; and $3.1 million relates to Canada and expires starting in 2015;2031. In addition, the Company had capital loss carryforwards of $5.2 million, which had a full valuation allowance. Of this amount, $4.7 million and $0.8$0.5 million relatesrelated to Canada and the U.K. and can be carried forward indefinitely.U.K, respectively.
As of December 31, 2015,2017, the Company had tax credit carryforwards of approximately $2.4$2.6 million available to reduce income taxes in future years. Approximately $0.7 million relates to the U.S. state tax attributes, of which $0.6 million will expire through 20302032 and $0.1 million can be carried forward indefinitely. The remaining $1.7$1.9 million tax credit carryforwards were related to Canada, of which $1.2 million expires through 2022 and $0.7 million can be carried forward indefinitely.
As of December 31, 2016, the Company had tax credit carryforwards of approximately $2.3 million available to reduce income taxes in future years. Approximately $0.5 million relates to the U.S. state tax attributes, of which $0.4 million will expire through 2031 and $0.1 million can be carried forward indefinitely. The remaining $1.8 million tax credit carryforwards were related to Canada, of which $1.1 million expires through 2022 and $0.6 million can be carried forward indefinitely.
As of December 31, 2014, the Company had tax credit carryforwards of approximately $4.2 million available to reduce income taxes in future years. Approximately $2.1 million relates to the U.S. tax attributes (both federal and state) and expires through 2034. The remaining $2.1 million relates to Canada, of which $0.8 million expires through 2021 and $1.3$0.7 million can be carried forward indefinitely.
Income and foreign withholding taxes have not been recognized on the excess of the amount for financial reporting purposes over the tax basis of investments in foreign subsidiaries that are essentially permanent in nature. This amount becomes taxable upon a repatriation of assets from a subsidiary or a sale or liquidation of a subsidiary. The amount of undistributed earnings of foreign subsidiaries totaled $18.2$98.0 million as of December 31, 2015.2017. However, these undistributed earnings are generally not subject to the repatriation taxes under the Tax Reform Act. The estimated unrecognized deferred income and foreign tax liabilitieswithholding tax liability on this temporary difference is approximately $0.4$0.2 million.
As of December 31, 2015,2017, the Company’s total amount of gross unrecognized tax benefits was $5.5$4.1 million, of which $4.1$3.4 million would favorably affect itsthe effective tax rate.rate if benefited. Over the next twelve months, the Company may need to record up to $1.2$0.2 million of previously unrecognized tax benefits in the event ofdue to statute of limitations closures. The Company believes there are no other jurisdictions in which the outcome of unresolved issues or claims is likely to be material to its results of operations, financial position or cash flows. Furthermore, the Company believes that it has adequately provided for all income tax uncertainties.
As of December 31, 2014,2016, the Company’s total amount of gross unrecognized tax benefits was $6.3$5.0 million, of which $4.1$4.0 million would favorably affect itsthe effective tax rate if recognized. As of December 31, 2013, the Company’s total amount of gross unrecognized tax benefits was $7.1 million, of which $4.9 million would favorably affect its effective tax rate, if recognized.is benefited.
8291
GSI GROUPNOVANTA INC.
NOTES TO CONSOLIDATED FINANCIAL STATEMENTS — (Continued)
AS OF DECEMBER 31, 20152017
The reconciliation of the total amounts of unrecognized tax benefits is as follows (in thousands):
Balance at December 31, 2012 | $ | 7,554 |
| |||
Additions based on tax positions related to the current year |
| 508 |
| |||
Additions for tax positions of prior years |
| 1,475 |
| |||
Reductions for tax positions of prior years |
| (1,888 | ) | |||
Reductions to tax positions resulting from a lapse of the applicable statute of limitations |
| (575 | ) | |||
Balance at December 31, 2013 |
| 7,074 |
| |||
Additions based on tax positions related to the current year |
| 1,180 |
| |||
Additions for tax positions of prior years |
| 2,601 |
| |||
Reductions for tax positions of prior years |
| (2,404 | ) | |||
Reductions to tax positions resulting from a lapse of the applicable statute of limitations |
| (2,177 | ) | |||
Balance at December 31, 2014 |
| 6,274 |
| $ | 6,274 |
|
Additions based on tax positions related to the current year |
| 752 |
|
| 752 |
|
Additions for tax positions of prior years |
| 78 |
|
| 78 |
|
Reductions for tax positions of prior years |
| (626 | ) | |||
Reductions to tax positions of prior years |
| (626 | ) | |||
Reductions to tax positions resulting from a lapse of the applicable statute of limitations |
| (226 | ) |
| (226 | ) |
Settlements with tax authorities |
| (762 | ) |
| (762 | ) |
Balance at December 31, 2015 | $ | 5,490 |
|
| 5,490 |
|
Additions based on tax positions related to the current year |
| 561 |
| |||
Additions for tax positions of prior years |
| 88 |
| |||
Reductions to tax positions of prior years |
| (45 | ) | |||
Reductions to tax positions resulting from a lapse of the applicable statute of limitations |
| (842 | ) | |||
Settlements with tax authorities |
| (290 | ) | |||
Balance at December 31, 2016 |
| 4,962 |
| |||
Additions based on tax positions related to the current year |
| 991 |
| |||
Additions for tax positions of prior years |
| 496 |
| |||
Reductions to tax positions of prior years |
| (28 | ) | |||
Reductions to tax positions resulting from a lapse of the applicable statute of limitations |
| (1,577 | ) | |||
Settlements with tax authorities |
| (755 | ) | |||
Balance at December 31, 2017 | $ | 4,089 |
| |||
The Company recognizes interest and penalties related to uncertain tax positions in income tax expense. As of each of December 31, 20152017 and 2014,2016, the Company had approximately $0.9$0.4 million and $1.1 million, respectively, of accrued interest and penalties related to uncertain tax positions. During the yearyears ended December 31, 2015,2017 and 2016, the Company recognized less than $0.1 million of expense for an increase in interest and penalties related to uncertain tax positions. During the year ended December 31, 2014, the Company recognized approximately $0.3 million of expense for an increase in interest and penalties related to uncertain tax positions.
The Company files income tax returns in Canada, the U.S., and various states and foreign jurisdictions. Generally, the Company is no longer subject to U.S. or foreign income tax examinations, including transfer pricing tax audits, by tax authorities for the years before 2007.
The Company’s income tax returns may be reviewed by tax authorities in the following countries for the following periods under the appropriate statute of limitations:
United States |
|
Canada |
|
United Kingdom |
|
Germany |
|
The Netherlands |
|
China |
|
Japan |
|
8392
GSI GROUPNOVANTA INC.
NOTES TO CONSOLIDATED FINANCIAL STATEMENTS — (Continued)
AS OF DECEMBER 31, 20152017
14.15. Restructuring, Acquisition and Divestiture Related Costs
The following table summarizes restructuring, acquisition and divestiture related costs recorded in the accompanying consolidated statements of operations (in thousands):
| Year Ended December 31, |
| Year Ended December 31, |
| ||||||||||||||||||
| 2015 |
|
| 2014 |
|
| 2013 |
| 2017 |
|
| 2016 |
|
| 2015 |
| ||||||
2016 restructuring | $ | 3,148 |
|
| $ | — |
|
| $ | — |
| $ | 332 |
|
| $ | 3,049 |
|
| $ | 3,148 |
|
2015 restructuring |
| 1,484 |
|
|
| — |
|
|
| — |
|
| — |
|
|
| — |
|
|
| 1,484 |
|
2013 restructuring |
| — |
|
|
| 25 |
|
|
| 2,463 |
| |||||||||||
2011 restructuring |
| 1,208 |
|
|
| 389 |
|
|
| 1,287 |
|
| 14 |
|
|
| (79 | ) |
|
| 1,208 |
|
Germany restructuring |
| — |
|
|
| — |
|
|
| 7 |
| |||||||||||
Total restructuring charges | $ | 5,840 |
|
| $ | 414 |
|
| $ | 3,757 |
| $ | 346 |
|
| $ | 2,970 |
|
| $ | 5,840 |
|
Acquisition and related charges | $ | 1,301 |
|
| $ | 1,521 |
|
| $ | 1,630 |
| $ | 7,196 |
|
| $ | 4,975 |
|
| $ | 1,301 |
|
Divestiture related charges |
| 1,113 |
|
|
| — |
|
|
| — |
|
| — |
|
|
| — |
|
|
| 1,113 |
|
Total acquisition and divestiture related charges | $ | 2,414 |
|
| $ | 1,521 |
|
| $ | 1,630 |
| $ | 7,196 |
|
| $ | 4,975 |
|
| $ | 2,414 |
|
Total restructuring, acquisition and divestiture related costs | $ | 8,254 |
|
| $ | 1,935 |
|
| $ | 5,387 |
| $ | 7,542 |
|
| $ | 7,945 |
|
| $ | 8,254 |
|
2016 Restructuring
During the third quarter of 2015, the Company initiated the 2016 restructuring program, which includesincluded consolidating certain of our manufacturing operations to optimize our facility footprint and better utilize resources, and reducing redundant costs due to productivity cost savings and business volume reductions. Restructuring costs incurredIn August 2016, the Company sold its facility in 2015Chatsworth, California for a net cash consideration of $2.6 million, $0.3$3.4 million and $0.2recognized a gain on sale of $1.6 million wereas part of restructuring, acquisition and divestiture related costs. As of December 31, 2017, the Company incurred cumulative costs related to severance, facility, and other, respectively. We anticipate completingthis restructuring plan totaling $6.5 million, net of the 2016 restructuring program duringgain on the second quartersale of 2016.the Chatsworth, California facility. The plan was completed in 2017.
The following table summarizes restructuring costs associated with the 2016 restructuring program for each segment and unallocated corporate costs for the year ended December 31, 2015 (in thousands):
| Year Ended |
|
|
|
| Year Ended |
|
| Cumulative Costs as of |
| ||||||||||||
| December 31, 2015 |
|
| Expected Cumulative Costs |
| December 31, 2017 |
|
| December 31, 2016 |
|
| December 31, 2015 |
|
| December 31, 2017 |
| ||||||
Laser Products | $ | 55 |
|
| $300 ̶ $400 |
| ||||||||||||||||
Vision Technologies |
| 2,200 |
|
| 3,200 ̶ 3,700 |
| ||||||||||||||||
Photonics | $ | — |
|
| $ | 813 |
|
| $ | 55 |
|
| $ | 868 |
| |||||||
Vision |
| 331 |
|
|
| 1,862 |
|
|
| 2,200 |
|
|
| 4,393 |
| |||||||
Precision Motion |
| 833 |
|
| 700 ̶ 1,000 |
|
| — |
|
|
| 106 |
|
|
| 833 |
|
|
| 939 |
| |
Unallocated Corporate and Shared Services |
| 60 |
|
|
| 300 ̶ 400 |
|
| 1 |
|
|
| 268 |
|
|
| 60 |
|
|
| 329 |
|
Total | $ | 3,148 |
|
| $4,500 ̶ $5,500 |
| $ | 332 |
|
| $ | 3,049 |
|
| $ | 3,148 |
|
| $ | 6,529 |
| |
2015 Restructuring
During the first quarter of 2015, the Company implemented a program to eliminate redundant costs, as a result of acquisition and divestiture activities, to better align our operations to ourthe Company’s strategic growth plans, to further integrate ourits business lines, and as a consequence of our productivity initiatives. Restructuring costs incurred in 2015 of $1.4 million and $0.1 million were related to severance and other, respectively. The plan was substantially completed during 2015.
The following table summarizes the total costs for each segment and unallocated corporate costs related to the 2015 restructuring plan (in thousands):
| Year Ended |
| Year Ended |
| ||
| December 31, 2015 |
| December 31, 2015 |
| ||
Laser Products | $ | 542 |
| |||
Vision Technologies |
| 525 |
| |||
Photonics | $ | 542 |
| |||
Vision |
| 525 |
| |||
Precision Motion |
| 79 |
|
| 79 |
|
Unallocated Corporate and Shared Services |
| 338 |
|
| 338 |
|
Total | $ | 1,484 |
| $ | 1,484 |
|
8493
GSI GROUPNOVANTA INC.
NOTES TO CONSOLIDATED FINANCIAL STATEMENTS — (Continued)
AS OF DECEMBER 31, 20152017
During the first half of 2013, the Company initiated a program following our acquisition of NDS to integrate the NDS business into our operating structure and further reduce manufacturing and operating costs across businesses to leverage our infrastructure and further integrate our product lines.
The following table summarizes restructuring costs for each segment and unallocated corporate costs related to the 2013 restructuring program (in thousands):
| Year Ended |
| |
| December 31, 2013 |
| |
Laser Products | $ | 836 |
|
Vision Technologies |
| 806 |
|
Precision Motion |
| 378 |
|
Unallocated Corporate and Shared Services |
| 443 |
|
Total | $ | 2,463 |
|
2011 Restructuring
In November 2011, the Company announced a strategic initiative (“2011 restructuring”) which aimed to consolidate operations to reduce the Company’s cost structure and improve operational efficiency. In total, eleven facilities have been exited as part of the 2011 restructuring plan. These eliminations resulted in the consolidation of the manufacturing facilities of the Scientific Lasers business and the optics products, the consolidation of the Company’s German operations into one facility, the consolidation of the laser scanners business into the Company’s Bedford, Massachusetts facility and the consolidation of the Company’s Japan operation into one facility. Included in the eleven facilities exited are five facilities exited as part of the Semiconductor and Laser Systems business divestitures. The restructuring costs for the Semiconductor and Laser Systems businesses have been excluded from the table below as they have been reported as part of the operating results from discontinued operations. The Company substantially completed the 2011 restructuring program in 2013. Restructuring costs fromIn March 2016, the 2011 restructuring program recognizedCompany sold its previously exited Laser Systems facility located in 2014 and 2015 are primarily depreciation and other costsOrlando, Florida for cash at the net carrying value of $3.5 million. In December 2016, the lease agreement for the idleCompany’s previously exited laser scanner business facility that was vacated by the Laser Systems business.terminated, which resulted in a benefit of $0.2 million.
The following table summarizes restructuring costs for each segment and unallocated corporate costs related to the 2011 restructuring plan (in thousands):
|
|
|
|
|
|
|
|
|
|
|
|
| Cumulative |
| |
| Year Ended December 31, |
|
| Costs as of |
| ||||||||||
| 2015 |
|
| 2014 |
|
| 2013 |
|
| December 31, 2015 |
| ||||
Laser Products | $ | — |
|
| $ | (106 | ) |
| $ | 1,042 |
|
| $ | 1,939 |
|
Vision Technologies |
| — |
|
|
| — |
|
|
| 48 |
|
|
| 48 |
|
Precision Motion |
| — |
|
|
| — |
|
|
| 5 |
|
|
| 122 |
|
Unallocated Corporate and Shared Services |
| 1,208 |
|
|
| 495 |
|
|
| 192 |
|
|
| 3,153 |
|
Total | $ | 1,208 |
|
| $ | 389 |
|
| $ | 1,287 |
|
| $ | 5,262 |
|
Presented below are actual cash charges, including severance, relocation, facility closure and consulting costs, and non-cash charges for depreciation related to the 2011 restructuring plan (in thousands):
|
|
|
|
|
|
|
|
|
|
|
|
| Cumulative |
| |
| Year Ended December 31, |
|
| Costs as of |
| ||||||||||
| 2015 |
|
| 2014 |
|
| 2013 |
|
| December 31, 2015 |
| ||||
Cash charges | $ | 126 |
|
| $ | (235 | ) |
| $ | 1,037 |
|
| $ | 3,174 |
|
Non-cash charges |
| 1,082 |
|
|
| 624 |
|
|
| 250 |
|
|
| 2,088 |
|
Total restructuring costs | $ | 1,208 |
|
| $ | 389 |
|
| $ | 1,287 |
|
| $ | 5,262 |
|
|
|
|
|
|
|
|
|
|
|
|
|
| Cumulative |
| |
| Year Ended December 31, |
|
| Costs as of |
| ||||||||||
| 2017 |
|
| 2016 |
|
| 2015 |
|
| December 31, 2017 |
| ||||
Photonics | $ | — |
|
| $ | (188 | ) |
| $ | — |
|
| $ | 1,751 |
|
Vision |
| — |
|
|
| — |
|
|
| — |
|
|
| 48 |
|
Precision Motion |
| — |
|
|
| — |
|
|
| — |
|
|
| 122 |
|
Unallocated Corporate and Shared Services |
| 14 |
|
|
| 109 |
|
|
| 1,208 |
|
|
| 3,276 |
|
Total | $ | 14 |
|
| $ | (79 | ) |
| $ | 1,208 |
|
| $ | 5,197 |
|
Rollforward of Accrued Expenses Related to Restructuring
85
GSI GROUP INC.
NOTES TO CONSOLIDATED FINANCIAL STATEMENTS — (Continued)
AS OF DECEMBER 31, 2015
The following table summarizes the accrual activities, by component, related to the Company’s restructuring charges recorded in the accompanying consolidated balance sheets (in thousands):
| Total |
|
| Severance |
|
| Facility |
|
| Depreciation |
|
| Other |
| Total |
|
| Severance |
|
| Facility |
|
| Depreciation |
|
| Other (b) |
| ||||||||||
Balance at December 31, 2013 | $ | 1,374 |
|
| $ | 687 |
|
| $ | 648 |
|
| $ | — |
|
| $ | 39 |
| |||||||||||||||||||
Balance at December 31, 2015 | $ | 1,882 |
|
| $ | 1,358 |
|
| $ | 406 |
|
| $ | — |
|
| $ | 118 |
| |||||||||||||||||||
Restructuring charges (a) |
| 4,929 |
|
|
| 2,738 |
|
|
| 777 |
|
|
| 616 |
|
|
| 798 |
| |||||||||||||||||||
Reserves reversed |
| (322 | ) |
|
| (322 | ) |
|
| — |
|
|
| — |
|
|
| — |
| |||||||||||||||||||
Cash payments |
| (4,181 | ) |
|
| (3,170 | ) |
|
| (104 | ) |
|
| — |
|
|
| (907 | ) | |||||||||||||||||||
Non-cash write-offs and other adjustments |
| (572 | ) |
|
| 7 |
|
|
| 32 |
|
|
| (616 | ) |
|
| 5 |
| |||||||||||||||||||
Balance at December 31, 2016 |
| 1,736 |
|
|
| 611 |
|
|
| 1,111 |
|
|
| — |
|
|
| 14 |
| |||||||||||||||||||
Restructuring charges |
| 414 |
|
|
| (83 | ) |
|
| (247 | ) |
|
| 624 |
|
|
| 120 |
|
| 346 |
|
|
| 185 |
|
|
| 146 |
|
|
| — |
|
|
| 15 |
|
Cash payments |
| (933 | ) |
|
| (502 | ) |
|
| (293 | ) |
|
| — |
|
|
| (138 | ) |
| (1,212 | ) |
|
| (692 | ) |
|
| (503 | ) |
|
| — |
|
|
| (17 | ) |
Non-cash write-offs and other adjustments |
| (624 | ) |
|
| — |
|
| �� | — |
|
|
| (624 | ) |
|
| — |
|
| (64 | ) |
|
| (65 | ) |
|
| 9 |
|
|
| — |
|
|
| (8 | ) |
Balance at December 31, 2014 |
| 231 |
|
|
| 102 |
|
|
| 108 |
|
|
| — |
|
|
| 21 |
| |||||||||||||||||||
Restructuring charges |
| 5,840 |
|
|
| 3,918 |
|
|
| 441 |
|
|
| 1,082 |
|
|
| 399 |
| |||||||||||||||||||
Cash payments |
| (3,126 | ) |
|
| (2,668 | ) |
|
| (156 | ) |
|
| — |
|
|
| (302 | ) | |||||||||||||||||||
Non-cash write-offs and other adjustments |
| (1,063 | ) |
|
| 6 |
|
|
| 13 |
|
|
| (1,082 | ) |
|
| — |
| |||||||||||||||||||
Balance at December 31, 2015 | $ | 1,882 |
|
| $ | 1,358 |
|
| $ | 406 |
|
| $ | — |
|
| $ | 118 |
| |||||||||||||||||||
Balance at December 31, 2017 | $ | 806 |
|
| $ | 39 |
|
| $ | 763 |
|
| $ | — |
|
| $ | 4 |
| |||||||||||||||||||
(a) | Excludes $1.6 million of gain on the sale of the Chatsworth, California facility. |
(b) | Other restructuring charges mainly related to consulting fees and relocation costs. |
The Company expects to make $1.8$0.4 million in cash payments during the twelve months ending December 31, 20162018.
Acquisition and Divestiture Related Charges
Acquisition related costs incurred to effect a business combination,combinations, including finders’ fees, legal, valuation and other professional or consulting fees, totaled $6.8 million, $2.5 million, and $1.5 million $0.9 million,during 2017, 2016, and $1.6 million during 2015, 2014, and 2013, respectively. Acquisition related costs recognized under earn-out agreements in connection with acquisitions totaled $(0.2)$0.4 million, $0.6$2.5 million, and zero $(0.2) million
94
NOVANTA INC.
NOTES TO CONSOLIDATED FINANCIAL STATEMENTS — (Continued)
AS OF DECEMBER 31, 2017
during 2015, 2014,2017, 2016, and 2013,2015, respectively. Expenses associated with divestiture activities of $1.1 million during 2015 included legal and professional fees directly related to the completion of the JK Lasers divestiture.
15.
16. Commitments and Contingencies
Operating Leases
The Company leases certain equipment and facilities under operating lease agreements. Most of these lease agreements expire between 20172018 and 2019.2022. In the U.K., where longer lease terms are more common, the Company has a land lease that extends through 2078. During the years ended December 31, 2015, 20142017, 2016 and 2013,2015, the Company recorded lease expense of $4.5$5.5 million, $4.1$4.2 million and $4.9$4.5 million, respectively. In addition to the base rent, the Company is generally required to pay insurance, real estate taxes and maintenance costs which isare recorded in lease expense.
In connection with the sale of the Scientific Lasers business in 2014, the Company assigned to the buyer the lease for the facility in San Jose, California, where the Scientific Lasers business operated. The buyer assumed all of ourthe rights and obligations under the original lease, including the duty to pay the rent for the remainder term of the lease. So long as the buyer performs its obligations as the tenant, as required by the Asset and Equity Purchase Agreement for its acquisition of the Scientific Lasers business, the Company has no responsibilities for the lease. Should the buyer cease performance under the lease, however, the landlord could still pursue the Company as the original tenant until February 28, 2019, the end of the lease term. In the meantime, the Company has indemnification rights against the buyer under the Asset and Equity Purchase Agreement for such buyer’s default. The lease associated with this facility has been excluded from the operating lease commitments table below.
86
GSI GROUP INC.
NOTES TO CONSOLIDATED FINANCIAL STATEMENTS — (Continued)
AS OF DECEMBER 31, 2015
As of December 31, 2015 and 2014, the Company has grossGross assets under capital lease as of $13.2December 31, 2017 and $12.7 million, respectively. 2016, respectively, are summarized as follows (in thousands):
|
| 2017 |
|
| 2016 |
| ||
Land, buildings and improvements |
| $ | 9,133 |
|
| $ | 9,133 |
|
Machinery and equipment |
|
| 4,429 |
|
|
| 4,026 |
|
Total gross assets under capital lease |
| $ | 13,562 |
|
| $ | 13,159 |
|
Future Lease Payments
Future minimum lease payments under operating and capital leases expiring subsequent to December 31, 2015,2017, including operating leases associated with facilities that have been vacated as a result of the Company’s restructuring actions, are summarized as follows (in thousands):
Year Ending December 31, |
| Operating Lease |
|
| Capital Lease(1) |
| ||||||||||
2016 |
| $ | 4,973 |
|
| $ | 1,498 |
| ||||||||
2017 |
|
| 3,536 |
|
|
| 1,398 |
| ||||||||
Year Ended December 31, |
| Operating Lease |
|
| Capital Lease(1) |
| ||||||||||
2018 |
|
| 2,723 |
|
|
| 968 |
|
| $ | 6,695 |
|
| $ | 1,013 |
|
2019 |
|
| 1,735 |
|
|
| 935 |
|
|
| 4,861 |
|
|
| 995 |
|
2020 |
|
| 154 |
|
|
| 907 |
|
|
| 3,121 |
|
|
| 983 |
|
2021 |
|
| 2,481 |
|
|
| 907 |
| ||||||||
2022 |
|
| 605 |
|
|
| 907 |
| ||||||||
Thereafter |
|
| 5,361 |
|
|
| 8,139 |
|
|
| 6,449 |
|
|
| 6,325 |
|
Total minimum lease payments |
| $ | 18,482 |
|
| $ | 13,845 |
|
| $ | 24,212 |
|
| $ | 11,130 |
|
(1) | Capital lease payments include interest payments of |
Purchase Commitments
As of December 31, 2015,2017, the Company had unconditionalpurchase commitments primarily for inventory purchases of $35.9$86.4 million. These purchase commitments are expected to be incurred as follows: $34.1$78.7 million in 2016, $1.52018, $5.6 million in 2017,2019 and $0.3$2.1 million in 2018.2020.
95
NOVANTA INC.
NOTES TO CONSOLIDATED FINANCIAL STATEMENTS — (Continued)
AS OF DECEMBER 31, 2017
The Company is subject to various legal proceedings and claims that arise in the ordinary course of business. The Company reviews the status of each significant matter and assesses the potential financial exposure on a quarterly basis. If the potential loss from any claim or legal proceeding is considered probable and the amount can be reasonably estimated, the Company accrues a liability for the estimated loss. Significant judgment is required in both the determination of probability and the determination as to whether an exposure is reasonably estimable. Because of uncertainties related to these matters, accruals are based only on the best information available as of the date of the consolidated balance sheet. As additional information becomes available, the Company reassesses the potential liability related to any pending claims and litigation and may revise its estimates. The Company does not believe that the outcome of these claims will have a material adverse effect upon its consolidated financial statements but there can be no assurance that any such claims, or any similar claims, would not have a material adverse effect upon its consolidated financial statements.
Guarantees and Indemnifications
In the normal course of its operations, the Company executes agreements that provide for indemnification and guarantees to counterparties in transactions such as business dispositions, sale of assets, sale of products and operating leases. Additionally, the by-laws of the Company require it to indemnify certain current or former directors, officers, and employees of the Company against expenses incurred by them in connection with each proceeding in which he or she is involved as a result of serving or having served in certain capacities. Indemnification is not available with respect to a proceeding as to which it has been adjudicated that the person did not act in good faith in the reasonable belief that the action was in the best interests of the Company. Certain of ourthe Company’s officers and directors are also a party to indemnification agreements with the Company. These indemnification agreements provide, among other things, that the director and officer shall be indemnified to the fullest extent permitted by applicable law against all expenses, judgments, fines and amounts paid in settlement actually and reasonably incurred by such officer or director in connection with any proceeding by reason of his or her relationship with the Company. In addition, the indemnification agreements provide for the advancement of expenses incurred by such director or officer in connection with any proceeding covered by the indemnification agreement, subject to the conditions set forth therein and to the extent such advancement is not prohibited by law. The indemnification agreements also set out the procedures for determining entitlement to indemnification, the requirements relating to notice and defense of claims for which indemnification is sought, the procedures for enforcement of indemnification rights, the limitations on and exclusions from indemnification, and the minimum levels of directors’ and officers’ liability insurance to be maintained by the Company.
On July 1, 2013, the Company provided a Guarantee (the “Guarantee”) in favor of the trustees of the U.K. Plan with respect to all present and future obligations and liabilities (whether actual or contingent and whether owed jointly or severally and in any capacity whatsoever) of GSI GroupNovanta Technologies UK Limited, a wholly owned subsidiary of GSI GroupNovanta Inc.
87
GSI GROUP INC.
NOTES TO CONSOLIDATED FINANCIAL STATEMENTS — (Continued)
AS OF DECEMBER 31, 2015
Credit Risks and Other Uncertainties
The Company maintains financial instruments such as cash and cash equivalents and trade receivables. From time to time, certain of these instruments may subject the Company to concentrations of credit risk whereby one institution may hold a significant portion of the cash and cash equivalents, or one customer may represent a large portion of the accounts receivable balances.
There was no significant concentration of credit risk related to the Company’s position in trade accounts receivable as no individual customer represented 10% or more of the Company’s outstanding accounts receivable at December 31, 20152017 and 2014.2016. Credit risk with respect to trade accounts receivables is generally minimized because of the diversification of the Company’s operations, as well as its large customer base and its geographical dispersion.
Certain of the components and materials included in the Company’s products are currently obtained from single source suppliers. There can be no assurance that a disruption of this outsidethe supply of such components and materials would not create substantial manufacturing delays and additional cost to the Company.
The Company’s operations involve a number of other risks and uncertainties including, but not limited to, the effects of general economic conditions, rapidly changing technology, and international operations.
16.17. Redeemable Noncontrolling Interest
96
NOVANTA INC.
NOTES TO CONSOLIDATED FINANCIAL STATEMENTS — (Continued)
AS OF DECEMBER 31, 2017
As a result of the Company’s acquisition of additional outstanding shares of Laser Quantum from the remaining shareholders on January 10, 2017, the Company increased its ownership position in Laser Quantum from approximately 41% to approximately 76% and began to consolidate the operating results of Laser Quantum in the consolidated financial statements. As part of the purchase agreement, the Company and the remaining shareholders entered into a call and put option agreement for the purchase and sale, in 2020, of all remaining Laser Quantum shares held by the remaining shareholders, subject to certain conditions. The purchase price for the remaining shares will be based on the proportionate share of the noncontrolling interest in Laser Quantum’s cash on hand as of December 31, 2019 and a multiple of Laser Quantum’s EBITDA for the twelve months ending December 31, 2019, as defined in the call and put option agreement. As a result of the put option held by the remaining shareholders, the noncontrolling interest is considered a redeemable equity instrument and is presented as temporary equity on the consolidated balance sheet. The proportionate share of the net income from Laser Quantum attributable to the noncontrolling interest has been reported as a reduction to the consolidated net income in the Company’s consolidated statement of operations and an increase to the carrying value of the redeemable noncontrolling interest.
The initial value of the noncontrolling interest of £17.7 million ($21.6 million) was measured at fair value at the date of the acquisition. The value of the noncontrolling interest was determined using a combination of the discounted cash flow method (an income approach), the guideline public company method (a market approach), and the subject company transaction method (a market approach). The Company carries the redeemable noncontrolling interest at the higher of (i) the carrying value without any redemption value adjustments or (ii) the estimated redemption value as of the end of the reporting period. The estimated redemption value is determined as of the end of the reporting period as if it were also the redemption date for the instrument. The resulting adjustments are recorded in retained earnings in shareholders’ equity and do not affect net income attributable to Novanta Inc.
In 2017, the Company increased the carrying value of the redeemable noncontrolling interest by $20.2 million to reflect the estimated redemption value as of December 31, 2017. The following table presents the reconciliation of changes in the Company’s redeemable noncontrolling interest (in thousands):
| Redeemable Noncontrolling Interest |
| |
Balance as of December 31, 2016 | $ | — |
|
Acquisition of noncontrolling interest |
| 21,582 |
|
Net income attributable to noncontrolling interest |
| 2,256 |
|
Adjustment of redeemable noncontrolling interest to estimated redemption value (1) |
| 20,244 |
|
Foreign currency translation |
| 2,841 |
|
Balance as of December 31, 2017 | $ | 46,923 |
|
(1) | Adjustment of the carrying value of redeemable noncontrolling interest to the estimated redemption value was recognized in retained earnings instead of the consolidated statement of operations but was included in the computation of earnings per share attributable to Novanta Inc. (see Note 9). |
18. Segment Information
Reportable Segments
The Company evaluates the performance of, and allocates resources to, its segments based on revenue, gross profit and operating profit. The Company’s reportable segments have been identified based on commonality and adjacency of technologies, applications and customers amongst the Company’s individual product lines. The Company determined that disclosing sales by specific product was impracticable due to the highly customized and extensive portfolio of products offered to customers.
We operate in three reportable segments: Laser Products,Photonics, Vision, Technologies (formerly known as Medical Technologies), and Precision Motion. The reportable segments and their principal activities consist of the following:
Laser ProductsPhotonics
The Laser ProductsPhotonics segment designs, manufactures and markets photonics-based solutions, including CO2 laser sources, laser scanning and laser beam delivery, CO2 laser, continuous wave and ultrafast laser, and optical light engine products to customers worldwide. The segment serves highly demanding photonics-based applications such as industrial material processing, metrology, medical and life science
97
NOVANTA INC.
NOTES TO CONSOLIDATED FINANCIAL STATEMENTS — (Continued)
AS OF DECEMBER 31, 2017
imaging, DNA sequencing, and medical laser procedures. The vast majority of the segment’s product offerings are sold to OEM customers. The segment sells these products both directly, utilizing a highly technical sales force, and indirectly, through resellers and distributors.
Vision Technologies
The Vision Technologies segment designs, manufactures and markets a range of medical grade technologies, including visualization solutions, imaging informatics products,medical insufflators, pumps and related disposables; surgical displays and operating room integration technologies; optical data collection and machine vision technologies,technologies; radio frequency identification technologies (RFID),(“RFID”) technologies; thermal printers,printers; spectrometry technologies; and light and color measurement instrumentation to customers worldwide.embedded touch screen solutions. The vast majority of the segment’s product offerings are sold to OEM customers. The segment sells these products both directly, utilizing a highly technical sales force, and indirectly, through resellers and distributors.
Precision Motion
The Precision Motion segment designs, manufactures and markets optical encoders, precision motor and motion control technology, air bearing spindles and precision machined components to customers worldwide. The vast majority of the segment’s product offerings are sold into the advanced industrial market and the medical market.to OEM customers. The segment sells these products both directly, utilizing a highly technical sales force, and indirectly, through resellers and distributors.
88
GSI GROUP INC.
NOTES TO CONSOLIDATED FINANCIAL STATEMENTS — (Continued)
AS OF DECEMBER 31, 2015
Reportable Segment Financial Information
Revenue, gross profit, operating income (loss) from continuing operations, depreciation and amortization, accounts receivable and inventory by reportable segments are as follows (in thousands):
| Year Ended December 31, |
| Year Ended December 31, |
| ||||||||||||||||||
| 2015 |
|
| 2014 |
|
| 2013 |
| 2017 |
|
| 2016 |
|
| 2015 |
| ||||||
Revenue |
|
|
|
|
|
|
|
|
|
|
|
|
|
|
|
|
|
|
|
|
|
|
Laser Products | $ | 168,331 |
|
| $ | 177,726 |
|
| $ | 166,598 |
| |||||||||||
Vision Technologies |
| 124,725 |
|
|
| 122,187 |
|
|
| 90,276 |
| |||||||||||
Photonics | $ | 232,359 |
|
| $ | 174,158 |
|
| $ | 168,331 |
| |||||||||||
Vision |
| 183,074 |
|
|
| 122,250 |
|
|
| 124,725 |
| |||||||||||
Precision Motion |
| 80,542 |
|
|
| 64,793 |
|
|
| 60,036 |
|
| 105,857 |
|
|
| 88,350 |
|
|
| 80,542 |
|
Total | $ | 373,598 |
|
| $ | 364,706 |
|
| $ | 316,910 |
| $ | 521,290 |
|
| $ | 384,758 |
|
| $ | 373,598 |
|
| Year Ended December 31, |
| |||||||||
| 2017 |
|
| 2016 |
|
| 2015 |
| |||
Gross Profit |
|
|
|
|
|
|
|
|
|
|
|
Photonics | $ | 106,117 |
|
| $ | 76,696 |
|
| $ | 73,602 |
|
Vision |
| 69,249 |
|
|
| 47,181 |
|
|
| 48,966 |
|
Precision Motion |
| 46,564 |
|
|
| 40,044 |
|
|
| 36,709 |
|
Unallocated Corporate and Shared Services |
| (1,399 | ) |
|
| (1,469 | ) |
|
| (1,387 | ) |
Total | $ | 220,531 |
|
| $ | 162,452 |
|
| $ | 157,890 |
|
| Year Ended December 31, |
| Year Ended December 31, |
| ||||||||||||||||||
| 2015 |
|
| 2014 |
|
| 2013 |
| 2017 |
|
| 2016 |
|
| 2015 |
| ||||||
Gross Profit |
|
|
|
|
|
|
|
|
|
|
| |||||||||||
Laser Products | $ | 73,602 |
|
| $ | 74,224 |
|
| $ | 68,819 |
| |||||||||||
Vision Technologies |
| 48,966 |
|
|
| 48,678 |
|
|
| 35,824 |
| |||||||||||
Operating Income (Loss) from Continuing Operations |
|
|
|
|
|
|
|
|
|
|
| |||||||||||
Photonics | $ | 51,289 |
|
| $ | 34,825 |
|
| $ | 35,971 |
| |||||||||||
Vision |
| 7,883 |
|
|
| (1,277 | ) |
|
| (2,057 | ) | |||||||||||
Precision Motion |
| 36,709 |
|
|
| 28,333 |
|
|
| 27,778 |
|
| 27,146 |
|
|
| 21,101 |
|
|
| 16,877 |
|
Unallocated Corporate and Shared Services |
| (1,387 | ) |
|
| (1,068 | ) |
|
| (194 | ) |
| (29,123 | ) |
|
| (22,086 | ) |
|
| (21,858 | ) |
Total | $ | 157,890 |
|
| $ | 150,167 |
|
| $ | 132,227 |
| $ | 57,195 |
|
| $ | 32,563 |
|
| $ | 28,933 |
|
| Year Ended December 31, |
| |||||||||
| 2015 |
|
| 2014 |
|
| 2013 |
| |||
Operating Income (Loss) from Continuing Operations |
|
|
|
|
|
|
|
|
|
|
|
Laser Products | $ | 35,971 |
|
| $ | 33,053 |
|
| $ | 25,143 |
|
Vision Technologies |
| (2,057 | ) |
|
| (43,079 | ) |
|
| 3,566 |
|
Precision Motion |
| 16,877 |
|
|
| 13,023 |
|
|
| 12,062 |
|
Unallocated Corporate and Shared Services |
| (21,858 | ) |
|
| (19,803 | ) |
|
| (21,325 | ) |
Total | $ | 28,933 |
|
| $ | (16,806 | ) |
| $ | 19,446 |
|
| Year Ended December 31, |
| |||||||||
| 2015 |
|
| 2014 |
|
| 2013 |
| |||
Depreciation and Amortization |
|
|
|
|
|
|
|
|
|
|
|
Laser Products | $ | 6,083 |
|
| $ | 6,481 |
|
| $ | 6,335 |
|
Vision Technologies |
| 8,599 |
|
|
| 13,254 |
|
|
| 8,808 |
|
Precision Motion |
| 2,533 |
|
|
| 1,943 |
|
|
| 1,979 |
|
Unallocated Corporate and Shared Services |
| 2,981 |
|
|
| 2,743 |
|
|
| 2,828 |
|
Total | $ | 20,196 |
|
| $ | 24,421 |
|
| $ | 19,950 |
|
8998
GSI GROUPNOVANTA INC.
NOTES TO CONSOLIDATED FINANCIAL STATEMENTS — (Continued)
AS OF DECEMBER 31, 20152017
| Year Ended December 31, |
| |||||||||
| 2017 |
|
| 2016 |
|
| 2015 |
| |||
Depreciation and Amortization |
|
|
|
|
|
|
|
|
|
|
|
Photonics | $ | 13,806 |
|
| $ | 6,738 |
|
| $ | 6,083 |
|
Vision |
| 13,590 |
|
|
| 10,402 |
|
|
| 8,599 |
|
Precision Motion |
| 2,308 |
|
|
| 2,439 |
|
|
| 2,533 |
|
Unallocated Corporate and Shared Services |
| 1,054 |
|
|
| 1,394 |
|
|
| 2,981 |
|
Total | $ | 30,758 |
|
| $ | 20,973 |
|
| $ | 20,196 |
|
| December 31, |
| |||||||||
| 2017 |
|
| 2016 |
|
| 2015 |
| |||
Accounts Receivable |
|
|
|
|
|
|
|
|
|
|
|
Photonics | $ | 33,490 |
|
| $ | 28,886 |
|
| $ | 21,763 |
|
Vision |
| 36,089 |
|
|
| 22,885 |
|
|
| 21,691 |
|
Precision Motion |
| 11,903 |
|
|
| 11,998 |
|
|
| 13,734 |
|
Total accounts receivable | $ | 81,482 |
|
| $ | 63,769 |
|
| $ | 57,188 |
|
Inventory |
|
|
|
|
|
|
|
|
|
|
|
Photonics |
| 44,451 |
|
|
| 28,976 |
|
|
| 29,501 |
|
Vision |
| 33,836 |
|
|
| 20,656 |
|
|
| 19,583 |
|
Precision Motion |
| 12,991 |
|
|
| 10,113 |
|
|
| 10,482 |
|
Total inventory | $ | 91,278 |
|
| $ | 59,745 |
|
| $ | 59,566 |
|
Total segment assets | $ | 172,760 |
|
| $ | 123,514 |
|
| $ | 116,754 |
|
| December 31, |
| |||||||||
| 2017 |
|
| 2016 |
|
| 2015 |
| |||
Total Assets |
|
|
|
|
|
|
|
|
|
|
|
Total segment assets | $ | 172,760 |
|
| $ | 123,514 |
|
| $ | 116,754 |
|
Cash and cash equivalents |
| 100,057 |
|
|
| 68,108 |
|
|
| 59,959 |
|
Prepaid income taxes and income taxes receivable |
| 4,387 |
|
|
| 2,058 |
|
|
| 2,510 |
|
Prepaid expenses and other current assets |
| 10,675 |
|
|
| 5,570 |
|
|
| 5,989 |
|
Property, plant and equipment, net |
| 61,718 |
|
|
| 35,421 |
|
|
| 40,550 |
|
Deferred tax assets |
| 7,052 |
|
|
| 8,593 |
|
|
| 7,885 |
|
Other assets |
| 4,018 |
|
|
| 12,502 |
|
|
| 12,673 |
|
Intangible assets, net |
| 155,048 |
|
|
| 61,743 |
|
|
| 66,269 |
|
Goodwill |
| 210,988 |
|
|
| 108,128 |
|
|
| 103,456 |
|
Total | $ | 726,703 |
|
| $ | 425,637 |
|
| $ | 416,045 |
|
99
NOVANTA INC.
NOTES TO CONSOLIDATED FINANCIAL STATEMENTS — (Continued)
AS OF DECEMBER 31, 2017
| December 31, |
| |||||
| 2015 |
|
| 2014 |
| ||
Accounts Receivable |
|
|
|
|
|
|
|
Laser Products |
| 21,763 |
|
|
| 24,083 |
|
Vision Technologies |
| 21,691 |
|
|
| 18,922 |
|
Precision Motion |
| 13,734 |
|
|
| 8,489 |
|
Total accounts receivable |
| 57,188 |
|
|
| 51,494 |
|
Inventory |
|
|
|
|
|
|
|
Laser Products |
| 29,501 |
|
|
| 34,947 |
|
Vision Technologies |
| 19,583 |
|
|
| 19,596 |
|
Precision Motion |
| 10,482 |
|
|
| 8,400 |
|
Total inventory |
| 59,566 |
|
|
| 62,943 |
|
Total segment assets |
| 116,754 |
|
|
| 114,437 |
|
| December 31, |
| |||||
| 2015 |
|
| 2014 |
| ||
Total Assets |
|
|
|
|
|
|
|
Total segment assets |
| 116,754 |
|
|
| 114,437 |
|
Cash and cash equivalents |
| 59,959 |
|
|
| 51,146 |
|
Income taxes receivable |
| 2,510 |
|
|
| 5,906 |
|
Deferred tax assets |
| — |
|
|
| 5,971 |
|
Prepaid expenses and other current assets |
| 5,989 |
|
|
| 5,081 |
|
Assets of discontinued operations |
| — |
|
|
| 631 |
|
Property, plant and equipment, net |
| 40,550 |
|
|
| 40,088 |
|
Deferred tax assets |
| 7,885 |
|
|
| 2,912 |
|
Other assets |
| 12,673 |
|
|
| 12,134 |
|
Intangible assets, net |
| 66,269 |
|
|
| 67,242 |
|
Goodwill |
| 103,456 |
|
|
| 90,746 |
|
Total | $ | 416,045 |
|
| $ | 396,294 |
|
Geographic Information
The Company aggregates geographic revenue based on the customer location where products are shipped. Revenue tofrom these customers is as follows (in thousands, except percentage data):
| Year Ended December 31, |
| Year Ended December 31, |
| ||||||||||||||||||||||||||||||||||||||||||
| 2015 |
|
| 2014 |
|
| 2013 |
| 2017 |
|
| 2016 |
|
| 2015 |
| ||||||||||||||||||||||||||||||
| Revenue |
|
| % of Total |
|
| Revenue |
|
| % of Total |
|
| Revenue |
|
| % of Total |
| Revenue |
|
| % of Total |
|
| Revenue |
|
| % of Total |
|
| Revenue |
|
| % of Total |
| ||||||||||||
United States | $ | 154,825 |
|
|
| 41.4 | % |
| $ | 140,973 |
|
|
| 38.7 | % |
| $ | 107,892 |
|
|
| 34.0 | % | $ | 220,583 |
|
|
| 42.3 | % |
| $ | 154,756 |
|
|
| 40.2 | % |
| $ | 154,825 |
|
|
| 41.4 | % |
Germany |
| 54,743 |
|
|
| 14.7 |
|
|
| 59,029 |
|
|
| 16.2 |
|
|
| 56,287 |
|
|
| 17.8 |
|
| 68,003 |
|
|
| 13.0 |
|
|
| 55,940 |
|
|
| 14.5 |
|
|
| 54,743 |
|
|
| 14.7 |
|
Rest of Europe |
| 48,277 |
|
|
| 12.9 |
|
|
| 54,308 |
|
|
| 14.9 |
|
|
| 45,698 |
|
|
| 14.4 |
|
| 81,001 |
|
|
| 15.5 |
|
|
| 51,705 |
|
|
| 13.4 |
|
|
| 48,277 |
|
|
| 12.9 |
|
China |
| 38,491 |
|
|
| 10.3 |
|
|
| 40,792 |
|
|
| 11.2 |
|
|
| 37,651 |
|
|
| 11.9 |
|
| 56,128 |
|
|
| 10.8 |
|
|
| 44,225 |
|
|
| 11.5 |
|
|
| 38,491 |
|
|
| 10.3 |
|
Rest of Asia-Pacific |
| 62,467 |
|
|
| 16.7 |
|
|
| 58,830 |
|
|
| 16.1 |
|
|
| 57,802 |
|
|
| 18.2 |
|
| 84,727 |
|
|
| 16.3 |
|
|
| 60,104 |
|
|
| 15.6 |
|
|
| 62,467 |
|
|
| 16.7 |
|
Other |
| 14,795 |
|
|
| 4.0 |
|
|
| 10,774 |
|
|
| 2.9 |
|
|
| 11,580 |
|
|
| 3.7 |
|
| 10,848 |
|
|
| 2.1 |
|
|
| 18,028 |
|
|
| 4.8 |
|
|
| 14,795 |
|
|
| 4.0 |
|
Total | $ | 373,598 |
|
|
| 100.0 | % |
| $ | 364,706 |
|
|
| 100.0 | % |
| $ | 316,910 |
|
|
| 100.0 | % | $ | 521,290 |
|
|
| 100.0 | % |
| $ | 384,758 |
|
|
| 100.0 | % |
| $ | 373,598 |
|
|
| 100.0 | % |
90
GSI GROUP INC.
NOTES TO CONSOLIDATED FINANCIAL STATEMENTS — (Continued)
AS OF DECEMBER 31, 2015
Long-lived assets consist of property, plant and equipment, net, and are aggregated based on the location of the assets. A summary of these long-lived assets is as follows (in thousands):
| December 31, |
| December 31, |
| ||||||||||||||
| 2015 |
|
| 2014 |
| 2017 |
|
| 2016 |
|
| 2015 |
| |||||
United States | $ | 34,907 |
|
| $ | 32,988 |
| $ | 29,920 |
|
| $ | 29,509 |
|
| $ | 34,907 |
|
Europe |
| 4,014 |
|
|
| 5,318 |
|
| 30,621 |
|
|
| 4,588 |
|
|
| 4,014 |
|
China |
| 1,593 |
|
|
| 1,705 |
|
| 1,127 |
|
|
| 1,286 |
|
|
| 1,593 |
|
Asia-Pacific and other |
| 36 |
|
|
| 77 |
|
| 50 |
|
|
| 38 |
|
|
| 36 |
|
Total | $ | 40,550 |
|
| $ | 40,088 |
| $ | 61,718 |
|
| $ | 35,421 |
|
| $ | 40,550 |
|
Significant Customers
No customer accounted for greater than 10% of the Company’s salesrevenue during the years ended December 31, 2015, 20142017, 2016 or 2013.
2015.
100
(Unaudited)
The Company’s interim financial statements are prepared on a quarterly basis ending on the Friday closest to the end of the calendar quarter, with the exception of the fourth quarter which always ends on December 31.
On April 15, 2015, the Company completed the sale of certain assets and liabilities of the JK Lasers business for $29.6 million in cash, net of the final working capital adjustments and transaction costs, and recorded a pre-tax gain on sale of $19.6 million.
In December 2014, the Company determined that an impairment test of the NDS goodwill and intangible assets was required, resulting in an impairment charge of $41.4 million in operating expenses.
On March 14, 2014,January 10, 2017, the Company acquired JADAK and started to include the operating results of JADAK in the consolidated financial statements asan additional 35% of the acquisition date.outstanding shares of Laser Quantum. In July 2014,connection with the purchase price allocation, the Company completedrecognized a nontaxable gain of $26.4 million representing the sale of certain assets and liabilitiesexcess of the Scientific Lasers business for $6.5 millionfair value of the Company’s previously-held equity interest in cash, net of working capital adjustments, and recorded a $1.7 million loss on sale.Laser Quantum over its carrying value upon gaining control.
The following tables reflect the Company’s unaudited condensed consolidated statements of operations (in thousands except per share data):
| Three Months Ended |
| Three Months Ended |
| ||||||||||||||||||||||||||
| December 31, |
|
| October 2, |
|
| July 3, |
|
| April 3, |
| December 31, |
|
| September 29, |
|
| June 30, |
|
| March 31, |
| ||||||||
| 2015 |
|
| 2015 |
|
| 2015 |
|
| 2015 |
| 2017 |
|
| 2017 |
|
| 2017 |
|
| 2017 |
| ||||||||
Revenue | $ | 90,219 |
|
| $ | 92,271 |
|
| $ | 96,494 |
|
| $ | 94,614 |
| $ | 146,918 |
|
| $ | 146,296 |
|
| $ | 119,102 |
|
| $ | 108,974 |
|
Cost of revenue |
| 53,590 |
|
|
| 52,361 |
|
|
| 55,149 |
|
|
| 54,608 |
|
| 84,677 |
|
|
| 87,589 |
|
|
| 65,613 |
|
|
| 62,880 |
|
Gross profit |
| 36,629 |
|
|
| 39,910 |
|
|
| 41,345 |
|
|
| 40,006 |
|
| 62,241 |
|
|
| 58,707 |
|
|
| 53,489 |
|
|
| 46,094 |
|
Operating expenses: |
|
|
|
|
|
|
|
|
|
|
|
|
|
|
|
|
|
|
|
|
|
|
|
|
|
|
|
|
|
|
Research and development and engineering |
| 7,295 |
|
|
| 7,693 |
|
|
| 7,840 |
|
|
| 8,215 |
|
| 11,795 |
|
|
| 11,659 |
|
|
| 9,004 |
|
|
| 9,215 |
|
Selling, general and administrative |
| 19,080 |
|
|
| 19,979 |
|
|
| 20,922 |
|
|
| 22,068 |
|
| 27,359 |
|
|
| 27,724 |
|
|
| 23,941 |
|
|
| 23,001 |
|
Amortization of purchased intangible assets |
| 2,018 |
|
|
| 1,852 |
|
|
| 1,852 |
|
|
| 1,889 |
|
| 2,683 |
|
|
| 3,217 |
|
|
| 3,347 |
|
|
| 2,849 |
|
Restructuring, acquisition and divestiture related costs |
| 4,022 |
|
|
| 1,379 |
|
|
| 416 |
|
|
| 2,437 |
|
| 1,310 |
|
|
| 3,834 |
|
|
| 1,581 |
|
|
| 817 |
|
Total operating expenses |
| 32,415 |
|
|
| 30,903 |
|
|
| 31,030 |
|
|
| 34,609 |
|
| 43,147 |
|
|
| 46,434 |
|
|
| 37,873 |
|
|
| 35,882 |
|
Operating income from continuing operations |
| 4,214 |
|
|
| 9,007 |
|
|
| 10,315 |
|
|
| 5,397 |
|
| 19,094 |
|
|
| 12,273 |
|
|
| 15,616 |
|
|
| 10,212 |
|
Interest income (expense), foreign exchange transaction gains (losses), other income (expense), net and gain on disposal of business |
| 1,721 |
|
|
| 13 |
|
|
| 15,506 |
|
|
| (151 | ) | |||||||||||||||
Interest income (expense), foreign exchange transaction gains (losses), other income (expense), net and gain on acquisition of business |
| (2,524 | ) |
|
| (2,776 | ) |
|
| (937 | ) |
|
| 25,176 |
| |||||||||||||||
Income from continuing operations before income taxes |
| 5,935 |
|
|
| 9,020 |
|
|
| 25,821 |
|
|
| 5,246 |
|
| 16,570 |
|
|
| 9,497 |
|
|
| 14,679 |
|
|
| 35,388 |
|
Income tax provision (benefit) |
| (168 | ) |
|
| 2,452 |
|
|
| 6,310 |
|
|
| 1,800 |
| |||||||||||||||
Income tax provision |
| 6,893 |
|
|
| 1,131 |
|
|
| 4,689 |
|
|
| 1,114 |
| |||||||||||||||
Income from continuing operations |
| 6,103 |
|
|
| 6,568 |
|
|
| 19,511 |
|
|
| 3,446 |
|
| 9,677 |
|
|
| 8,366 |
|
|
| 9,990 |
|
|
| 34,274 |
|
Loss from discontinued operations, net of tax |
| — |
|
|
| — |
|
|
| (13 | ) |
|
| — |
|
| — |
|
|
| — |
|
|
| — |
|
|
| — |
|
Consolidated net income | $ | 6,103 |
|
| $ | 6,568 |
|
| $ | 19,498 |
|
| $ | 3,446 |
|
| 9,677 |
|
|
| 8,366 |
|
|
| 9,990 |
|
|
| 34,274 |
|
Earnings per common share from continuing operations: |
|
|
|
|
|
|
|
|
|
|
|
|
|
|
| |||||||||||||||
Less: Net income attributable to noncontrolling interest |
| (812 | ) |
|
| (834 | ) |
|
| (588 | ) |
|
| (22 | ) | |||||||||||||||
Net income attributable to Novanta Inc. | $ | 8,865 |
|
| $ | 7,532 |
|
| $ | 9,402 |
|
| $ | 34,252 |
| |||||||||||||||
Earnings (loss) per common share from continuing operations: |
|
|
|
|
|
|
|
|
|
|
|
|
|
|
| |||||||||||||||
Basic | $ | 0.18 |
|
| $ | 0.19 |
|
| $ | 0.56 |
|
| $ | 0.10 |
| $ | (0.00 | ) |
| $ | (0.00 | ) |
| $ | 0.16 |
|
| $ | 0.99 |
|
Diluted | $ | 0.18 |
|
| $ | 0.19 |
|
| $ | 0.56 |
|
| $ | 0.10 |
| $ | (0.00 | ) |
| $ | (0.00 | ) |
| $ | 0.16 |
|
| $ | 0.98 |
|
Loss per common share from discontinued operations: |
|
|
|
|
|
|
|
|
|
|
|
|
|
|
|
|
|
|
|
|
|
|
|
|
|
|
|
|
|
|
Basic | $ | — |
|
| $ | — |
|
| $ | (0.00 | ) |
| $ | — |
| $ | — |
|
| $ | — |
|
| $ | — |
|
| $ | — |
|
Diluted | $ | — |
|
| $ | — |
|
| $ | (0.00 | ) |
| $ | — |
| $ | — |
|
| $ | — |
|
| $ | — |
|
| $ | — |
|
Earnings per common share attributable to GSI Group Inc. |
|
|
|
|
|
|
|
|
|
|
|
|
|
|
| |||||||||||||||
Earnings (loss) per common share attributable to Novanta Inc. |
|
|
|
|
|
|
|
|
|
|
|
|
|
|
| |||||||||||||||
Basic | $ | 0.18 |
|
| $ | 0.19 |
|
| $ | 0.56 |
|
| $ | 0.10 |
| $ | (0.00 | ) |
| $ | (0.00 | ) |
| $ | 0.16 |
|
| $ | 0.99 |
|
Diluted | $ | 0.18 |
|
| $ | 0.19 |
|
| $ | 0.56 |
|
| $ | 0.10 |
| $ | (0.00 | ) |
| $ | (0.00 | ) |
| $ | 0.16 |
|
| $ | 0.98 |
|
101
Three Months Ended |
| ||||||||||||||
| December 31, |
|
| September 30, |
|
| July 1, |
|
| April 1, |
| ||||
| 2016 |
|
| 2016 |
|
| 2016 |
|
| 2016 |
| ||||
Revenue | $ | 98,879 |
|
| $ | 97,829 |
|
| $ | 97,734 |
|
| $ | 90,316 |
|
Cost of revenue |
| 56,027 |
|
|
| 56,617 |
|
|
| 56,238 |
|
|
| 53,424 |
|
Gross profit |
| 42,852 |
|
|
| 41,212 |
|
|
| 41,496 |
|
|
| 36,892 |
|
Operating expenses: |
|
|
|
|
|
|
|
|
|
|
|
|
|
|
|
Research and development and engineering |
| 7,973 |
|
|
| 7,961 |
|
|
| 8,016 |
|
|
| 8,052 |
|
Selling, general and administrative |
| 19,334 |
|
|
| 20,972 |
|
|
| 20,198 |
|
|
| 21,187 |
|
Amortization of purchased intangible assets |
| 2,098 |
|
|
| 2,066 |
|
|
| 1,979 |
|
|
| 2,108 |
|
Restructuring, acquisition and divestiture related costs |
| 2,117 |
|
|
| (835 | ) |
|
| 3,705 |
|
|
| 2,958 |
|
Total operating expenses |
| 31,522 |
|
|
| 30,164 |
|
|
| 33,898 |
|
|
| 34,305 |
|
Operating income from continuing operations |
| 11,330 |
|
|
| 11,048 |
|
|
| 7,598 |
|
|
| 2,587 |
|
Interest income (expense), foreign exchange transaction gains (losses) and other income (expense), net |
| 753 |
|
|
| (207 | ) |
|
| (228 | ) |
|
| (359 | ) |
Income from continuing operations before income taxes |
| 12,083 |
|
|
| 10,841 |
|
|
| 7,370 |
|
|
| 2,228 |
|
Income tax provision (benefit) |
| 4,327 |
|
|
| 3,371 |
|
|
| 2,499 |
|
|
| 322 |
|
Income from continuing operations |
| 7,756 |
|
|
| 7,470 |
|
|
| 4,871 |
|
|
| 1,906 |
|
Loss from discontinued operations, net of tax |
| — |
|
|
| — |
|
|
| — |
|
|
| — |
|
Consolidated net income | $ | 7,756 |
|
| $ | 7,470 |
|
| $ | 4,871 |
|
| $ | 1,906 |
|
Earnings per common share from continuing operations: |
|
|
|
|
|
|
|
|
|
|
|
|
|
|
|
Basic | $ | 0.22 |
|
| $ | 0.22 |
|
| $ | 0.14 |
|
| $ | 0.05 |
|
Diluted | $ | 0.22 |
|
| $ | 0.21 |
|
| $ | 0.14 |
|
| $ | 0.05 |
|
Loss per common share from discontinued operations: |
|
|
|
|
|
|
|
|
|
|
|
|
|
|
|
Basic | $ | — |
|
| $ | — |
|
| $ | — |
|
| $ | — |
|
Diluted | $ | — |
|
| $ | — |
|
| $ | — |
|
| $ | — |
|
Earnings per common share attributable to Novanta Inc. |
|
|
|
|
|
|
|
|
|
|
|
|
|
|
|
Basic | $ | 0.22 |
|
| $ | 0.22 |
|
| $ | 0.14 |
|
| $ | 0.05 |
|
Diluted | $ | 0.22 |
|
| $ | 0.21 |
|
| $ | 0.14 |
|
| $ | 0.05 |
|
102
| Three Months Ended |
| |||||||||||||
| December 31, |
|
| September 26, |
|
| June 27, |
|
| March 28, |
| ||||
| 2014 |
|
| 2014 |
|
| 2014 |
|
| 2014 |
| ||||
Revenue | $ | 94,012 |
|
| $ | 94,656 |
|
| $ | 96,905 |
|
| $ | 79,133 |
|
Cost of revenue |
| 54,284 |
|
|
| 54,973 |
|
|
| 58,254 |
|
|
| 47,028 |
|
Gross profit |
| 39,728 |
|
|
| 39,683 |
|
|
| 38,651 |
|
|
| 32,105 |
|
Operating expenses: |
|
|
|
|
|
|
|
|
|
|
|
|
|
|
|
Research and development and engineering |
| 7,837 |
|
|
| 7,735 |
|
|
| 7,525 |
|
|
| 5,857 |
|
Selling, general and administrative |
| 21,840 |
|
|
| 21,512 |
|
|
| 21,410 |
|
|
| 19,618 |
|
Amortization of purchased intangible assets |
| 2,799 |
|
|
| 2,843 |
|
|
| 2,876 |
|
|
| 1,744 |
|
Restructuring, acquisition and divestiture related costs |
| (14 | ) |
|
| 771 |
|
|
| 360 |
|
|
| 818 |
|
Impairment of goodwill and intangible assets |
| 41,442 |
|
|
| — |
|
|
| — |
|
|
| — |
|
Total operating expenses |
| 73,904 |
|
|
| 32,861 |
|
|
| 32,171 |
|
|
| 28,037 |
|
Operating income (loss) from continuing operations |
| (34,176 | ) |
|
| 6,822 |
|
|
| 6,480 |
|
|
| 4,068 |
|
Interest income (expense), foreign exchange transaction gains (losses) and other income (expense), net |
| (127 | ) |
|
| 310 |
|
|
| (1,017 | ) |
|
| (275 | ) |
Income (loss) from continuing operations before income taxes |
| (34,303 | ) |
|
| 7,132 |
|
|
| 5,463 |
|
|
| 3,793 |
|
Income tax provision (benefit) |
| (6,013 | ) |
|
| 2,013 |
|
|
| 2,057 |
|
|
| 937 |
|
Income (loss) from continuing operations |
| (28,290 | ) |
|
| 5,119 |
|
|
| 3,406 |
|
|
| 2,856 |
|
Loss from discontinued operations, net of tax |
| (790 | ) |
|
| (273 | ) |
|
| (2,678 | ) |
|
| (1,866 | ) |
Loss on disposal of discontinued operations, net of tax |
| (1,405 | ) |
|
| (321 | ) |
|
| — |
|
|
| — |
|
Consolidated net income (loss) |
| (30,485 | ) |
|
| 4,525 |
|
|
| 728 |
|
|
| 990 |
|
Less: Net income attributable to noncontrolling interest |
| — |
|
|
| — |
|
|
| (3 | ) |
|
| (7 | ) |
Net income (loss) attributable to GSI Group Inc. | $ | (30,485 | ) |
| $ | 4,525 |
|
| $ | 725 |
|
| $ | 983 |
|
Earnings (loss) per common share from continuing operations: |
|
|
|
|
|
|
|
|
|
|
|
|
|
|
|
Basic | $ | (0.82 | ) |
| $ | 0.15 |
|
| $ | 0.10 |
|
| $ | 0.08 |
|
Diluted | $ | (0.82 | ) |
| $ | 0.15 |
|
| $ | 0.10 |
|
| $ | 0.08 |
|
Loss per common share from discontinued operations: |
|
|
|
|
|
|
|
|
|
|
|
|
|
|
|
Basic | $ | (0.06 | ) |
| $ | (0.02 | ) |
| $ | (0.08 | ) |
| $ | (0.05 | ) |
Diluted | $ | (0.06 | ) |
| $ | (0.02 | ) |
| $ | (0.08 | ) |
| $ | (0.05 | ) |
Earnings (loss) per common share attributable to GSI Group Inc. |
|
|
|
|
|
|
|
|
|
|
|
|
|
|
|
Basic | $ | (0.88 | ) |
| $ | 0.13 |
|
| $ | 0.02 |
|
| $ | 0.03 |
|
Diluted | $ | (0.88 | ) |
| $ | 0.13 |
|
| $ | 0.02 |
|
| $ | 0.03 |
|
ItemItem 9. Changes in and Disagreements with Accountants on Accounting and Financial Disclosure
None.
Item 9A. Controls and Procedures
The required certifications of our Chief Executive Officer and Chief Financial Officer are included in Exhibits 31.1 and 31.2 to this Annual Report on Form 10-K. The disclosures set forth in this Item 9A contain information concerning the evaluation of our disclosure controls and procedures, management’s report on internal controlscontrol over financial reporting and changes in internal control over financial reporting referred to in those certifications. Those certifications should be read in conjunction with this Item 9A for a more complete understanding of the matters covered by the certifications.
Evaluation of Disclosure Controls and Procedures as of December 31, 20152017
Our management, with the participation of our Chief Executive Officer and Chief Financial Officer, conducted an evaluation of our disclosure controls and procedures, as such term is defined under Rule 13a-15(e) promulgated under the Securities Exchange Act of 1934, as amended (the “Exchange Act”). Based on this evaluation, our Chief Executive Officer and Chief Financial Officer concluded that our disclosure controls and procedures were effective as of December 31, 2015.2017.
Changes in Internal Control Over Financial Reporting
During the fiscal quarter ended March 28, 2014, the Company acquired JADAK. Other than the changes to our internal controls to integrate JADAK into the Company, there wereThere has been no changeschange to our internal control over financial reporting during the fiscal quarter ended December 31, 20152017 that havehas materially affected, or areis reasonably likely to materially affect, our internal control over financial reporting.
Management’s Annual Report on Internal Control Over Financial Reporting
Management is responsible for establishing and maintaining adequate internal control over financial reporting, as defined in Rules 13a-15(f) under the Exchange Act. Internal control over financial reporting is designed to provide reasonable assurance regarding the reliability of financial reporting and the preparation of financial statements for external reporting purposes in accordance with generally accepted accounting principles. Internal control over financial reporting includes those policies and procedures that:
|
|
pertain to the maintenance of records that, in reasonable detail, accurately and fairly reflect our transactions and dispositions of our assets;
|
|
provide reasonable assurance that transactions are recorded as necessary to permit preparation of financial statements in accordance with generally accepted accounting principles, and that our receipts and expenditures are being made only in accordance with authorizations of our management and directors; and
|
|
provide reasonable assurance regarding prevention or timely detection of unauthorized acquisition, use or disposition of our assets that could have a material effect on the financial statements.
Because of its inherent limitations, internal control over financial reporting may not prevent or detect misstatements. Also, projections of any evaluation of effectiveness to future periods are subject to the risk that controls may become inadequate because of changes in conditions and that the degree of compliance with the policies or procedures may deteriorate.
Our management assessed the effectiveness of our internal control over financial reporting as of December 31, 2015.2017. In making their assessment, our management utilized the criteria set forth in Internal Control—Integrated Framework issued by the Committee of Sponsoring Organizations of the Treadway Commission (“COSO”) in 2013. Our assessment of, and conclusion on, the effectiveness of internal control over financial reporting did not include W.O.M. World of Medicine GmbH (“WOM”) and Laser Quantum Limited (“Laser Quantum”), both acquired in purchase business combinations in 2017 and included in our 2017 consolidated financial statements. WOM is a wholly-owned subsidiary, and Laser Quantum is a 76% owned subsidiary, whose total assets and total revenues excluded from our assessment of internal control over financial reporting represent approximately 8% and 7% of total assets, respectively, and approximately 9% and 9% of total revenues, respectively, of the related consolidated financial statement amounts as of and for the year ended December 31, 2017. Based on our evaluation under the framework in Internal Control—Integrated Framework, issued by COSO in 2013, our management concluded that our internal control over financial reporting was effective as of December 31, 2015.2017.
The effectiveness of our internal control over financial reporting as of December 31, 20152017 has been audited by PricewaterhouseCoopers LLP, an independent registered public accounting firm, as stated in their report which is contained in Item 8 of this Annual Report on Form 10-K.
103
ItemItem 9B. Other Information
None.
Certain information required by Part III is omitted from this Annual Report on Form 10-K and is incorporated herein by reference to the Company’s Definitive Proxy Statement for the 20162018 Annual Meeting of Shareholders to be filed with the Securities and Exchange Commission.
104
Item 10. Directors, Executive Officers and Corporate Governance
All of the Company’s directors, officers and employees must act in accordance with the Code of Ethics and Business Conduct, which has been adopted by the Company’s Board of Directors. A copy of the Code of Ethics and Business Conduct is available on the Company’s website at http://www.gsig.comwww.novanta.com in the “About GSI”Us” section. (This website address is not intended to function as a hyperlink, and the information contained in our website is not intended to be a part of this filing). The Company will provide to any person without charge, upon request, a copy of the Code of Ethics and Business Conduct. Such a request should be made in writing and addressed to GSI GroupNovanta Inc., Attention: Investor Relations, 125 Middlesex Turnpike, Bedford, MA 01730. The Company intends to satisfy the disclosure requirement under NASDAQNasdaq rules regarding waivers or under Item 5.05 of Form 8-K regarding disclosure of an amendment to, or waiver from, a provision of this Code of Ethics and Business Conduct with respect to its principal executive officer, principal financial officer, principal accounting officer or controller, or persons performing similar functions, by posting such information on the Company’s website at http://www.gsig.comwww.novanta.com in the “About GSI”Us” section, unless a Form 8-K is otherwise required by law or applicable listing rules.
The remainder of the response to this item is contained in the Proxy Statement for the Company’s Annual Meeting of Shareholders scheduled to be held on May 10, 20162018 and is incorporated herein by reference.
Item 11. Executive Compensation
The information required to be disclosed by this item is contained in the Proxy Statement for the Company’s Annual Meeting of Shareholders scheduled to be held on May 10, 20162018 and is incorporated herein by reference.
Item 12. Security Ownership of Certain Beneficial Owners and Management and Related Stockholder Matters
The information required to be disclosed by this item is contained in the Proxy Statement for the Company’s Annual Meeting of Shareholders scheduled to be held on May 10, 20162018 and is incorporated herein by reference.
Item 13. Certain Relationships and Related Transactions, and Director Independence
The information required to be disclosed by this item is contained in the Proxy Statement for the Company’s Annual Meeting of Shareholders scheduled to be held on May 10, 20162018 and is incorporated herein by reference.
Item 14. Principal Accounting Fees and Services
The information required to be disclosed by this item is contained in the Proxy Statement for the Company’s Annual Meeting of Shareholders scheduled to be held on May 10, 20162018 and is incorporated herein by reference.
105
Item 15. Exhibits and Financial Statement Schedules
(a) Documents filed as part of this report:
1. List of Financial Statements
The financial statements required by this item are listed in Item 8, “Financial Statements and Supplementary Data” herein.
2. List of Financial Statement Schedules
All schedules are omitted because they are not applicable, not required or the required information is shown in the consolidated financial statements or notes thereto.
3. List of Exhibits
See the Company’s SEC filings on Edgar at: http://www.sec.gov/ for all Exhibits.
|
|
|
| Incorporated by Reference |
| |||||||||||||||||||||
Exhibit Number |
| Exhibit Description |
| Form |
|
| File No. |
|
| Exhibit |
|
| Filing |
|
| Filed/ |
| |||||||||
|
|
|
|
|
|
| ||||||||||||||||||||
2.1 |
| Agreement and Plan of Merger, by and among the Registrant, Eagle Acquisition Corporation, and Excel Technology, Inc. dated July 9, 2008. |
|
| 8-K |
|
|
| 000-25705 |
|
|
| 2.1 |
|
|
| 7/11/08 |
|
|
|
|
| ||||
|
|
|
|
|
|
| ||||||||||||||||||||
2.2 |
| Asset Purchase Agreement, by and between GSI Group Corporation and Gooch & Housego (California) LLC., dated July 3, 2008. |
|
| 10-Q |
|
|
| 000-25705 |
|
|
| 2.1 |
|
|
| 4/13/10 |
|
|
|
|
| ||||
|
|
|
|
|
|
| ||||||||||||||||||||
2.3 |
| Final Fourth Modified Joint Chapter 11 Plan of Reorganization for the Registrant, GSI Group Corporation, and MES International, Inc., dated as of May 24, 2010, as supplemented on May 27, 2010, and as confirmed by the United States Bankruptcy Court for the District of Delaware on May 27, 2010. |
|
| 8-K |
|
|
| 000-25705 |
|
|
| 99.2 |
|
|
| 05/28/10 |
|
|
|
|
| ||||
|
|
|
|
|
|
| ||||||||||||||||||||
2.4 |
| Master Purchase and Sale Agreement, dated April 9, 2013, between GSI Group Inc., GSI Group Corporation, GSI Group Corporation, Korea Branch, GSI Group Corporation, Taiwan Branch, GSI Group Japan Corporation, GSI Group GmbH and Electro Scientific Industries, Inc. |
|
| 8-K |
|
|
| 000-25705 |
|
|
| 2.1 |
|
|
| 5/09/13 |
|
|
|
|
| ||||
|
|
|
|
|
|
| ||||||||||||||||||||
2.5 |
| Securities Purchase Agreement dated January 15, 2013, between NDSSI Holdings, LLC, NDS Surgical Imaging, Inc., GSI Group Inc. and GSI Group Limited UK. |
|
| 8-K |
|
|
| 001-35083 |
|
|
| 2.1 |
|
|
| 01/15/13 |
|
|
|
|
| ||||
|
|
|
|
|
|
| ||||||||||||||||||||
2.6 |
| Equity Purchase Agreement dated February 18, 2014, between JADAK, LLC, JADAK Technologies, Inc., Advanced Data Capture Corporation, GSI Group Inc. and GSI Group Corporation. |
|
| 8-K |
|
|
| 001-35083 |
|
|
| 10.1 |
|
|
| 02/18/14 |
|
|
|
|
| ||||
|
|
|
|
|
|
| ||||||||||||||||||||
2.7 |
| Asset and Equity Purchase Agreement, dated June 24, 2014, by and among GSI Group Inc., Excel Technology, Inc., Continuum Electro-Optics, Inc., GSI Europe GmbH, GSI Group France S.A.S., GSI Group Japan Corporation and Amplitude Laser, Inc. and Amplitude Technologies, S.A. (The registrant hereby agrees to furnish a copy of any omitted schedule to the Commission upon request.) |
|
| 8-K |
|
|
| 001-35083 |
|
|
| 2.1 |
|
|
| 07/21/14 |
|
|
|
|
| ||||
|
|
|
|
|
|
|
|
|
|
|
|
|
|
|
|
|
|
|
|
|
|
| ||||
2.8 |
| Purchase Agreement, dated April 15, 2015, by and among GSI Group Limited, GSI Group Corporation, GSI Group Europe GmbH, GSI Group Japan Corporation, GSI Group Precision Technologies (Suzhou) Co., LTD., GSI Group Inc., JKL Newco Limited, and SPI Lasers UK Limited, SPI Lasers LLC, SPI Lasers (Shanghai) Co., Ltd. and Trumpf Corporation. (The registrant hereby agrees to furnish a copy of any omitted schedule to the Commission upon request.) |
|
| 8-K |
|
|
| 001-35083 |
|
|
| 10.1 |
|
|
| 04/20/15 |
|
|
|
|
| ||||
3.1 |
| Certificate and Articles of Continuance of the Registrant, dated March 22, 1999. |
|
| S-3 |
|
|
| 333-202597 |
|
|
| 3.1 |
|
|
| 03/09/15 |
|
|
|
|
| ||||
|
|
|
|
|
|
| ||||||||||||||||||||
3.2 |
| By-Laws of the Registrant, as amended. |
|
| 10-Q |
|
|
| 000-25705 |
|
|
| 3.2 |
|
|
| 4/13/10 |
|
|
|
|
| ||||
|
|
|
|
|
|
| ||||||||||||||||||||
|
|
|
|
| Incorporated by Reference |
| |||||||||||||||||||||
Exhibit Number |
|
| Exhibit Description |
| Form |
|
| File No. |
|
| Exhibit |
|
| Filing |
|
| Filed/ |
| |||||||||
|
|
|
|
|
|
|
| ||||||||||||||||||||
|
|
|
|
|
|
|
| ||||||||||||||||||||
2.1 |
|
|
|
| 8-K |
|
|
| 001-35083 |
|
|
| 2.1 |
|
|
| 01/15/13 |
|
|
|
|
| |||||
|
|
|
|
|
|
|
| ||||||||||||||||||||
2.2 |
|
|
|
| 8-K |
|
|
| 001-35083 |
|
|
| 10.1 |
|
|
| 02/18/14 |
|
|
|
|
| |||||
|
|
|
|
|
|
|
| ||||||||||||||||||||
2.3 |
|
|
|
| 8-K |
|
|
| 001-35083 |
|
|
| 2.1 |
|
|
| 07/21/14 |
|
|
|
|
| |||||
|
|
|
|
|
|
|
|
|
|
|
|
|
|
|
|
|
|
|
|
|
|
|
| ||||
2.4 |
|
|
|
|
| 8-K |
|
|
| 001-35083 |
|
|
| 10.1 |
|
|
| 04/20/15 |
|
|
|
|
| ||||
2.5 |
|
|
|
| 8-K |
|
|
| 001-35083 |
|
|
| 2.1 |
|
|
| 06/09/17 |
|
|
|
|
| |||||
|
|
|
|
|
|
|
|
|
|
|
|
|
|
|
|
|
|
|
|
|
|
|
| ||||
3.1 |
|
| Certificate and Articles of Continuance of the Registrant, dated March 22, 1999. |
|
| S-3 |
|
|
| 333-202597 |
|
|
| 3.1 |
|
|
| 03/09/15 |
|
|
|
|
| ||||
|
|
|
|
|
|
|
| ||||||||||||||||||||
3.2 |
|
|
|
| 10-Q |
|
|
| 000-25705 |
|
|
| 3.2 |
|
|
| 4/13/10 |
|
|
|
|
| |||||
|
|
|
|
|
|
|
| ||||||||||||||||||||
3.3 |
|
| Articles of Reorganization of the Registrant, dated July 23, 2010. |
|
| 8-K |
|
|
| 000-25705 |
|
|
| 3.1 |
|
|
| 07/23/10 |
|
|
|
|
| ||||
|
|
|
|
|
|
|
| ||||||||||||||||||||
3.4 |
|
| Articles of Amendment of the Registrant, dated December 29, 2010. |
|
| S-3 |
|
|
| 333-202597 |
|
|
| 3.2 |
|
|
| 03/09/15 |
|
|
|
|
| ||||
|
|
|
|
|
|
|
|
|
|
|
|
|
|
|
|
|
|
|
|
|
|
|
| ||||
3.5 |
|
| Articles of Amendment of the Registrant, dated May 11, 2016. |
|
| 8-K |
|
|
| 001-35083 |
|
|
| 10.1 |
|
|
| 05/12/16 |
|
|
|
|
| ||||
|
|
|
|
|
|
|
|
|
|
|
|
|
|
|
|
|
|
|
|
|
|
|
| ||||
4.1 |
|
|
|
|
|
|
|
|
|
|
|
|
|
|
|
|
|
|
|
| * |
| |||||
|
|
|
|
|
|
|
|
|
|
|
|
|
|
|
|
|
|
|
|
|
|
|
| ||||
4.2 |
|
| Form of Indenture, between the Registrant and Wilmington Trust, National Association. |
|
| S-3 |
|
|
| 333-202597 |
|
|
| 4.3 |
|
|
| 03/09/15 |
|
|
|
|
| ||||
|
|
|
|
|
|
|
| ||||||||||||||||||||
106
107
|
|
|
| Incorporated by Reference |
| |||||||||||||||||||||
Exhibit Number |
| Exhibit Description |
| Form |
|
| File No. |
|
| Exhibit |
|
| Filing |
|
| Filed/ |
| |||||||||
| Articles of Reorganization of the Registrant, dated July 23, 2010. |
|
| 8-K |
|
|
| 000-25705 |
|
|
| 3.1 |
|
|
| 07/23/10 |
|
|
|
|
| |||||
|
|
|
|
|
|
| ||||||||||||||||||||
3.4 |
| Articles of Amendment of the Registrant, dated December 29, 2010. |
|
| S-3 |
|
|
| 333-202597 |
|
|
| 3.2 |
|
|
| 03/09/15 |
|
|
|
|
| ||||
|
|
|
|
|
|
|
|
|
|
|
|
|
|
|
|
|
|
|
|
|
|
| ||||
4.1 |
| Specimen Stock Certificate |
|
| S-3 |
|
|
| 333-202597 |
|
|
| 4.2 |
|
|
| 03/09/15 |
|
|
|
|
| ||||
|
|
|
|
|
|
|
|
|
|
|
|
|
|
|
|
|
|
|
|
|
|
| ||||
4.2 |
| Form of Indenture, between the Registrant and Wilmington Trust, National Association. |
|
| S-3 |
|
|
| 333-202597 |
|
|
| 4.3 |
|
|
| 03/09/15 |
|
|
|
|
| ||||
|
|
|
|
|
|
| ||||||||||||||||||||
10.1† |
| Form of Indemnification Agreement. |
|
| 8-K |
|
|
| 000-25705 |
|
|
| 10.1 |
|
|
| 06/10/09 |
|
|
|
|
| ||||
|
|
|
|
|
|
| ||||||||||||||||||||
10.2† |
| GSI Group, Inc. 2010 Incentive Award Plan (Amended and Restated Effective April 9, 2014). |
|
| 8-K |
|
|
| 000-35083 |
|
|
| 10.1 |
|
|
| 05/20/14 |
|
|
|
|
| ||||
|
|
|
|
|
|
| ||||||||||||||||||||
10.3† |
| Employment Agreement, dated as of November 16, 2010, between GSI Group Inc. and John Roush. |
|
| 8-K |
|
|
| 000-25705 |
|
|
| 10.1 |
|
|
| 11/17/10 |
|
|
|
|
| ||||
|
|
|
|
|
|
| ||||||||||||||||||||
10.4† |
| Employment Agreement, dated as of February 10, 2011, between GSI Group Inc. and Robert Buckley. |
|
| 8-K |
|
|
| 001-35083 |
|
|
| 10.1 |
|
|
| 02/11/11 |
|
|
|
|
| ||||
|
|
|
|
|
|
| ||||||||||||||||||||
10.5† |
| Form of Deferred Stock Unit Award Agreement. |
|
| 10-K |
|
|
| 001-35083 |
|
|
| 10.59 |
|
|
| 03/30/11 |
|
|
|
|
| ||||
|
|
|
|
|
|
| ||||||||||||||||||||
10.6† |
| Form of Restricted Stock Unit Award Agreement for John Roush and Robert Buckley. |
|
| 10-K |
|
|
| 001-35083 |
|
|
| 10.60 |
|
|
| 03/30/11 |
|
|
|
|
| ||||
|
|
|
|
|
|
| ||||||||||||||||||||
10.7 |
| First Amendment to the Engagement Letter between the Registrant, GSI Group Corporation, MES International, Inc. and FTI Consulting, Inc., dated as of February 6, 2011. |
|
| 10-K |
|
|
| 001-35083 |
|
|
| 10.61 |
|
|
| 03/30/11 |
|
|
|
|
| ||||
|
|
|
|
|
|
| ||||||||||||||||||||
10.8† |
| Form of U.S. Restricted Stock Unit Award Agreement. |
|
| 10-Q |
|
|
| 001-35083 |
|
|
| 10.2 |
|
|
| 05/16/11 |
|
|
|
|
| ||||
|
|
|
|
|
|
| ||||||||||||||||||||
10.9† |
| Offer Letter, dated June 8, 2011, between GSI Group Inc. and Peter Chang. |
|
| 10-Q |
|
|
| 001-35083 |
|
|
| 10.1 |
|
|
| 11/10/11 |
|
|
|
|
| ||||
|
|
|
|
|
|
| ||||||||||||||||||||
10.10 |
| Amended and Restated Lease, dated May 1, 2012, by and between GSI Group Inc. and 125 Middlesex Turnpike, LLC. |
|
| 8-K |
|
|
| 001-35083 |
|
|
| 10.1 |
|
|
| 05/04/12 |
|
|
|
|
| ||||
|
|
|
|
|
|
| ||||||||||||||||||||
10.11 |
| Second Amendment to Credit Agreement, dated July 19, 2012, by and among GSI Group Corporation, GSI Group Inc., and Bank of America, N.A., as Administrative Agent. |
|
| 8-K |
|
|
| 001-35083 |
|
|
| 10.1 |
|
|
| 07/23/12 |
|
|
|
|
| ||||
|
|
|
|
|
|
| ||||||||||||||||||||
10.12 |
| Third Amendment to Credit Agreement, dated October 16, 2012, by and among GSI Group Corporation, GSI Group, Inc., and Bank of America, N.A., as Administrative Agent. |
|
| 10-Q |
|
|
| 001-35083 |
|
|
| 10.3 |
|
|
| 11/07/12 |
|
|
|
|
| ||||
|
|
|
|
|
|
| ||||||||||||||||||||
10.13† |
| Severance Agreement, dated as of August 15, 2012, between GSI Group Inc. and Peter Chang.
|
|
| 10-Q |
|
|
| 001-35083 |
|
|
| 10.7 |
|
|
| 11/07/12 |
|
|
|
|
| ||||
10.14† |
| Offer Letter, dated August 24, 2012, between GSI Group Inc. and Matthijs Glastra. |
|
| 10-Q |
|
|
| 001-35083 |
|
|
| 10.7 |
|
|
| 11/07/12 |
|
|
|
|
| ||||
|
|
|
|
|
|
| ||||||||||||||||||||
10.15 |
| Amended and Restated Credit Agreement, dated as of December 27, 2012, by and among GSI Group Corporation, GSI Group Inc., Bank of America, N.A., as Administrative Agent, Line Lender and L/C Issuer, Silicon Valley Bank, as Syndication Agent, and HSBC Bank USA, N.A., as Documentation Agent, and the other lenders party thereto. |
|
| 8-K |
|
|
| 001-35083 |
|
|
| 10.1 |
|
|
| 01/03/13 |
|
|
|
|
| ||||
|
|
|
|
|
|
| ||||||||||||||||||||
10.16 |
| Consent and First Amendment to Amended and Restated Credit Agreement dated January 14, 2013 by and among GSI Group Corporation and Bank of America, N.A., as Administrative Agent, Swing Line Lender and L/C Issuer. |
|
| 8-K |
|
|
| 001-35083 |
|
|
| 10.1 |
|
|
| 01/15/13 |
|
|
|
|
| ||||
|
|
|
|
|
|
| ||||||||||||||||||||
10.17 |
| Joinder and Amendment Agreement, dated as of February 1, 2013, by and among GSI Group Corporation, NDS Surgical Imaging, LLC, GSI Group Inc., Bank of America, N.A., as Administrative Agent, Swing Line Lender and L/C Issuer, and the other lenders party thereto. |
|
| 8-K |
|
|
| 001-35083 |
|
|
| 10.1 |
|
|
| 02/07/13 |
|
|
|
|
| ||||
|
|
|
|
|
|
| ||||||||||||||||||||
|
|
|
| Incorporated by Reference |
| |||||||||||||||||||||
Exhibit Number |
| Exhibit Description |
| Form |
|
| File No. |
|
| Exhibit |
|
| Filing |
|
| Filed/ |
| |||||||||
| Letter Agreement, dated October 28, 2013, between GSI Group Inc. and Jamie Bader. |
|
| 8-K |
|
|
| 001-35083 |
|
|
| 10.1 |
|
|
| 10/30/13 |
|
|
|
|
| |||||
|
|
|
|
|
|
| ||||||||||||||||||||
10.19 |
| Third Amendment to Amended and Restated Credit Agreement, dated September 13, 2013, by and among GSI Group Corporation, NDS Surgical Imaging, LLC, GSI Group Inc., each of the other Guarantors party hereto, each lender party hereto, and Bank of America, N.A., as Administrative Agent. |
|
| 10-Q |
|
|
| 001-35083 |
|
|
| 10.1 |
|
|
| 11/05/13 |
|
|
|
|
| ||||
|
|
|
|
|
|
| ||||||||||||||||||||
10.20 |
| Lease Agreement, dated November 22, 2013, by and between Continuum Electro-Optics, Inc., GSI Group Corporation and Legacy Partners I San Jose, LLC. |
|
| 8-K |
|
|
| 001-35083 |
|
|
| 10.1 |
|
|
| 12/02/13 |
|
|
|
|
| ||||
|
|
|
|
|
|
| ||||||||||||||||||||
10.21 |
| Fourth Amendment to Amended and Restated Credit Agreement, dated as of February 10, 2014, by and among GSI Group Corporation, NDS Surgical Imaging, LLC, GSI Group Inc., Bank of America, N.A., as Administrative Agent, Swing Line Lender and L/C Issuer, and the other lenders party thereto. |
|
| 8-K |
|
|
| 001-35083 |
|
|
| 10.1 |
|
|
| 02/14/14 |
|
|
|
|
| ||||
|
|
|
|
|
|
|
|
|
|
|
|
|
|
|
|
|
|
|
|
|
|
| ||||
10.22 |
| Fifth Amendment to Amended and Restated Credit Agreement, dated as of January 22, 2016, by and among GSI Group Corporation, NDS Surgical Imaging, LLC, GSI Group Inc., Bank of America, N.A., as Administrative Agent, Swing Line Lender and L/C Issuer, and the other lenders party thereto. |
|
|
|
|
|
|
|
|
|
|
|
|
|
|
|
|
|
|
| * | ||||
|
|
|
|
|
|
| ||||||||||||||||||||
10.23 | Restricted Stock Unit Inducement Award Grant Notice | S-8 | 333-194557 | 99.1 | 03/14/14 |
| ||||||||||||||||||||
|
|
|
|
|
|
| ||||||||||||||||||||
10.24 | Lease Agreement, dated as of May 31, 2013, by and between JADAK, LLC and Hancock Part Development, LLC. | 10-Q | 001-35083 | 10.3 | 05/06/14 |
| ||||||||||||||||||||
|
|
|
|
|
|
| ||||||||||||||||||||
10.25† |
| Severance Agreement between GSI Group Inc. and Deborah A. Mulryan, dated January 13, 2015. |
|
| 10-K |
|
|
| 001-35083 |
|
|
| 10.23 |
|
|
| 03/09/15 |
|
|
|
|
| ||||
|
|
|
|
|
|
|
|
|
|
|
|
|
|
|
|
|
|
|
|
|
|
| ||||
21.1 |
| Subsidiaries of the Registrant. |
|
|
|
|
|
|
|
|
|
|
|
|
|
|
|
|
|
| * |
| ||||
|
|
|
|
|
|
| ||||||||||||||||||||
23.1 |
| Consent of Independent Registered Public Accounting Firm. |
|
|
|
|
|
|
|
|
|
|
|
|
|
|
|
|
|
| * |
| ||||
|
|
|
|
|
|
| ||||||||||||||||||||
31.1 |
| Chief Executive Officer Certification pursuant to Section 302 of the Sarbanes-Oxley Act of 2002. |
|
|
|
|
|
|
|
|
|
|
|
|
|
|
|
|
|
| * |
| ||||
|
|
|
|
|
|
| ||||||||||||||||||||
31.2 |
| Chief Financial Officer Certification pursuant to Section 302 of the Sarbanes-Oxley Act of 2002. |
|
|
|
|
|
|
|
|
|
|
|
|
|
|
|
|
|
| * |
| ||||
|
|
|
|
|
|
| ||||||||||||||||||||
32.1 |
| Chief Executive Officer Certification pursuant to 18 U.S.C. Section 1350, as adopted pursuant to Section 906 of the Sarbanes-Oxley Act of 2002. |
|
|
|
|
|
|
|
|
|
|
|
|
|
|
|
|
|
| * | * | ||||
|
|
|
|
|
|
| ||||||||||||||||||||
32.2 |
| Chief Financial Officer Certification pursuant to 18 U.S.C. Section 1350, as adopted pursuant to Section 906 of the Sarbanes-Oxley Act of 2002. |
|
|
|
|
|
|
|
|
|
|
|
|
|
|
|
|
|
| * | * | ||||
|
|
|
|
|
|
| ||||||||||||||||||||
101.INS |
| XBRL Instance Document. |
|
|
|
|
|
|
|
|
|
|
|
|
|
|
|
|
|
| * |
| ||||
|
|
|
|
|
|
| ||||||||||||||||||||
101.SCH |
| XBRL Schema Document. |
|
|
|
|
|
|
|
|
|
|
|
|
|
|
|
|
|
| * |
| ||||
|
|
|
|
|
|
| ||||||||||||||||||||
101.CAL |
| XBRL Calculation Linkbase Document. |
|
|
|
|
|
|
|
|
|
|
|
|
|
|
|
|
|
| * |
| ||||
|
|
|
|
|
|
| ||||||||||||||||||||
101.DEF |
| XBRL Definition Linkbase Document. |
|
|
|
|
|
|
|
|
|
|
|
|
|
|
|
|
|
| * |
| ||||
|
|
|
|
|
|
| ||||||||||||||||||||
101.LAB |
| XBRL Labels Linkbase Document. |
|
|
|
|
|
|
|
|
|
|
|
|
|
|
|
|
|
| * |
| ||||
|
|
|
|
|
|
| ||||||||||||||||||||
101.PRE |
| XBRL Presentation Linkbase Document. |
|
|
|
|
|
|
|
|
|
|
|
|
|
|
|
|
|
| * |
| ||||
|
|
|
|
| Incorporated by Reference |
| |||||||||||||||||||||
Exhibit Number |
|
| Exhibit Description |
| Form |
|
| File No. |
|
| Exhibit |
|
| Filing |
|
| Filed/ |
| |||||||||
|
|
|
|
| 8-K |
|
|
| 001-35083 |
|
|
| 10.1 |
|
|
| 08/03/17 |
|
|
|
|
| |||||
10.21† |
|
| Form of Indemnification Agreement, by and between Novanta Inc. and certain officers and directors.
|
|
| 10-Q |
|
|
| 001-35083 |
|
|
| 10.2 |
|
|
| 11/01/17 |
|
|
|
|
| ||||
10.22† |
|
|
|
|
| 10-Q |
|
|
| 001-35083 |
|
|
| 10.3 |
|
|
| 11/01/17 |
|
|
|
|
| ||||
10.23 |
|
|
|
|
|
|
|
|
|
|
|
|
|
|
|
|
|
|
|
| * |
| |||||
|
|
|
|
|
|
|
|
|
|
|
|
|
|
|
|
|
|
|
|
|
|
|
| ||||
21.1 |
|
|
|
|
|
|
|
|
|
|
|
|
|
|
|
|
|
|
|
| * |
| |||||
|
|
|
|
|
|
|
| ||||||||||||||||||||
23.1 |
|
|
|
|
|
|
|
|
|
|
|
|
|
|
|
|
|
|
|
| * |
| |||||
|
|
|
|
|
|
|
| ||||||||||||||||||||
31.1 |
|
| Chief Executive Officer Certifications pursuant to Section 302 of the Sarbanes-Oxley Act of 2002. |
|
|
|
|
|
|
|
|
|
|
|
|
|
|
|
|
|
| * |
| ||||
|
|
|
|
|
|
|
| ||||||||||||||||||||
31.2 |
|
| Chief Financial Officer Certifications pursuant to Section 302 of the Sarbanes-Oxley Act of 2002. |
|
|
|
|
|
|
|
|
|
|
|
|
|
|
|
|
|
| * |
| ||||
|
|
|
|
|
|
|
| ||||||||||||||||||||
32.1 |
|
|
|
|
|
|
|
|
|
|
|
|
|
|
|
|
|
|
|
| * | * | |||||
|
|
|
|
|
|
|
| ||||||||||||||||||||
32.2 |
|
|
|
|
|
|
|
|
|
|
|
|
|
|
|
|
|
|
|
| * | * | |||||
|
|
|
|
|
|
|
| ||||||||||||||||||||
101.INS |
|
| XBRL Instance Document. |
|
|
|
|
|
|
|
|
|
|
|
|
|
|
|
|
|
| * |
| ||||
|
|
|
|
|
|
|
| ||||||||||||||||||||
101.SCH |
|
| XBRL Schema Document. |
|
|
|
|
|
|
|
|
|
|
|
|
|
|
|
|
|
| * |
| ||||
|
|
|
|
|
|
|
| ||||||||||||||||||||
101.CAL |
|
| XBRL Calculation Linkbase Document. |
|
|
|
|
|
|
|
|
|
|
|
|
|
|
|
|
|
| * |
| ||||
|
|
|
|
|
|
|
| ||||||||||||||||||||
101.DEF |
|
| XBRL Definition Linkbase Document. |
|
|
|
|
|
|
|
|
|
|
|
|
|
|
|
|
|
| * |
| ||||
|
|
|
|
|
|
|
| ||||||||||||||||||||
101.LAB |
|
| XBRL Labels Linkbase Document. |
|
|
|
|
|
|
|
|
|
|
|
|
|
|
|
|
|
| * |
| ||||
|
|
|
|
|
|
|
| ||||||||||||||||||||
101.PRE |
|
| XBRL Presentation Linkbase Document. |
|
|
|
|
|
|
|
|
|
|
|
|
|
|
|
|
|
| * |
| ||||
† | This exhibit constitutes a management contract, compensatory plan, or arrangement. |
* | Filed herewith |
** | Furnished herewith |
Attached as Exhibit 101 to this report are the following formatted in XBRL (Extensible Business Reporting Language): (i) Consolidated Balance Sheets at December 31, 20152017 and December 31, 2014,2016, (ii) Consolidated Statements of Operations for the years ended December 31, 2015,2017, December 31, 2014,2016, and December 31, 2013,2015, (iii) Consolidated Statements of Comprehensive Income (Loss) for the years ended December 31, 2015,2017, December 31, 20142016, and December 31, 2013,2015, (iv) Consolidated Statements of Stockholders’ Equity for the years ended December 31, 2015,2017, December 31, 2014,2016, and December 31, 2013,2015, (v) Consolidated Statements of Cash Flows for the years ended December 31, 2015,2017, December 31, 2014,2016, and December 31, 2013,2015, and (vi) Notes to Consolidated Financial Statements.
None.
108
Pursuant to the requirements of Section 13 or 15(d) of the Securities Exchange Act of 1934, the registrant has duly caused this report to be signed on its behalf by the undersigned, thereunto duly authorized.
| ||
|
| |
By: |
| /s/ |
|
|
|
|
| Chief Executive Officer |
Date: March 2, 2016February 28, 2018
109
Pursuant to the requirements of the Securities Exchange Act of 1934, this report has been signed below by the following persons on behalf of the registrant and in the capacities and on the dates indicated.
GSI GroupNovanta Inc. (Registrant)
Name |
| Title |
| Date |
|
|
| ||
/s/ |
| Director, Chief Executive Officer |
|
|
|
|
|
|
|
|
|
| ||
/s/ Robert J. Buckley |
| Chief Financial Officer |
|
|
Robert J. Buckley |
|
|
|
|
|
|
| ||
/s/ Peter L. Chang |
| Vice President, Corporate Controller |
|
|
Peter L. Chang |
| (Chief Accounting Officer) |
|
|
|
|
| ||
/s/ Stephen W. Bershad |
| Chairman of the Board of Directors |
|
|
Stephen W. Bershad | ||||
|
|
| ||
|
|
|
|
|
|
|
| ||
/s/ Dennis J. Fortino |
| Director |
|
|
Dennis J. Fortino | ||||
/s/ Brian D. King | Director | February 28, 2018 | ||
Brian D. King |
|
|
|
|
|
|
| ||
/s/ Ira J. Lamel |
| Director |
|
|
Ira J. Lamel |
|
|
|
|
|
|
| ||
/s/ Dominic A. Romeo |
| Director |
|
|
Dominic A. Romeo |
|
|
|
|
|
|
| ||
/s/ Thomas N. Secor |
| Director |
|
|
Thomas N. Secor |
|
|
|
|
102
110