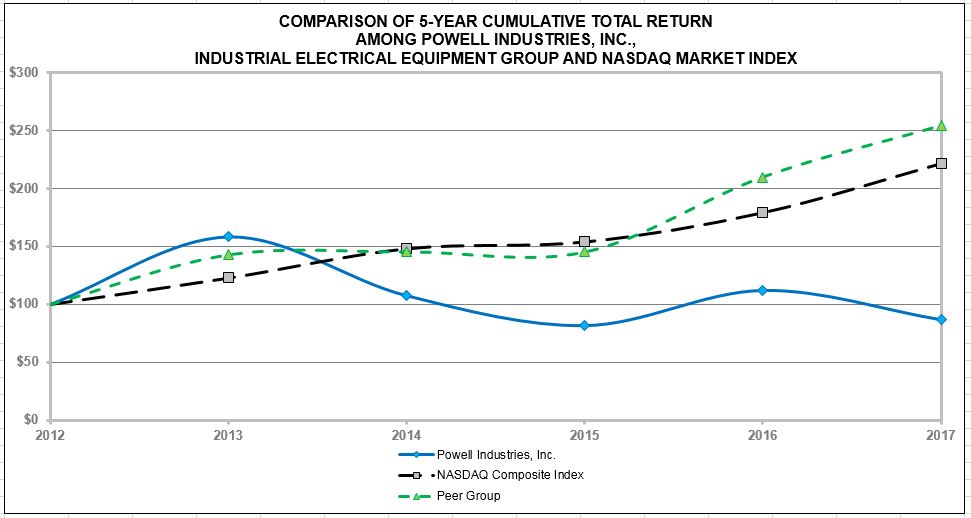
nonrecurring. Thus, multiple and/or continuous projects of similar magnitude with the same customer may vary. As such, the timing of large project awards may cause material fluctuations in revenues and gross profits. 2015. adjustments, with material-cost predictive estimating and by actively pursuing internal cost reduction efforts. We did not enter into any derivative contracts to hedge our exposure to commodity price changes in Fiscal 2017, 2016 2015. future operating results. Our backlog is subject to unexpected adjustments and cancellations and, therefore, may not be a reliable indicator of our future earnings. of operations. of operations. failure to compete effectively could adversely affect future regulations. " net income or loss and cash flow. The departure of key personnel could disrupt our business. Losses arising from such events may or may not be fully covered by our various insurance policies or may be subject to deductibles or exceed coverage limits. policy limits operations. operations. Location Description Acres Approximate Square Footage Houston, TX Corporate office and manufacturing facility 21.4 428,515 Houston, TX Office and manufacturing facility 53.4 290,554 Houston, TX Office, fabrication facility and yard 63.3 82,320 North Canton, OH Office and manufacturing facility 8.0 115,200 Northlake, IL Office and manufacturing facility 10.0 103,500 Bradford, U.K. Office and manufacturing facility 7.9 129,200 Acheson, Alberta, Canada Office and manufacturing facility 20.1 330,168 High Low Fiscal 2015: First Quarter $ 51.33 $ 38.12 Second Quarter 49.93 31.54 Third Quarter 39.45 32.54 Fourth Quarter 35.44 25.60 Fiscal 2016: First Quarter $ 35.89 $ 25.99 Second Quarter 30.41 23.00 Third Quarter 39.47 26.22 Fourth Quarter 41.10 34.40 Years ended September 30, 2016 2015 2014 2013 2012 Statement of Operations: (In thousands, except per share data) Revenues $ 565,243 $ 661,858 $ 647,814 $ 640,867 $ 690,741 Cost of goods sold 459,038 553,597 522,340 502,375 557,938 Gross profit 106,205 108,261 125,474 138,492 132,803 Selling, general and administrative expenses 74,924 76,801 87,756 79,707 76,961 Research and development expenses 6,731 6,980 7,608 7,615 6,286 Amortization of intangible assets 352 435 779 1,659 2,599 Restructuring and separation expenses 8,441 3,397 — 3,927 — Operating income 15,757 20,648 29,331 45,584 46,957 Gain on settlement — — — (1,709 ) — Other income (2,029 ) (2,402 ) (1,522 ) — — Interest expense (net) (7 ) 59 165 167 158 Income from continuing operations before income taxes 17,793 22,991 30,688 47,126 46,799 Income tax provision (1) 2,283 13,552 11,068 7,387 18,056 Income from continuing operations 15,510 9,439 19,620 39,739 28,743 Income from discontinued operations, net of tax — — 9,604 2,337 914 Net income $ 15,510 $ 9,439 $ 29,224 $ 42,076 $ 29,657 Earnings per share: Continuing operations $ 1.36 $ 0.80 $ 1.63 $ 3.32 $ 2.43 Discontinued operations — — 0.80 0.20 0.07 Basic earnings per share $ 1.36 $ 0.80 $ 2.43 $ 3.52 $ 2.50 Continuing operations $ 1.36 $ 0.79 $ 1.62 $ 3.32 $ 2.41 Discontinued operations — — 0.80 0.19 0.08 Diluted earnings per share $ 1.36 $ 0.79 $ 2.42 $ 3.51 $ 2.49 (1) For an explanation of the effective tax rate for the last three fiscal years, see Note H of the Notes to Consolidated Financial Statements included elsewhere in this Annual Report. Years ended September 30, 2016 2015 2014 2013 2012 Balance Sheet Data: (In thousands) Cash and cash equivalents $ 97,720 $ 43,569 $ 103,118 $ 107,411 $ 89,669 Property, plant and equipment, net 144,977 154,594 156,896 144,495 78,489 Total assets 462,516 468,824 541,443 530,903 448,312 Long-term debt, including current maturities 2,400 2,800 3,200 3,616 4,355 Total stockholders' equity 335,317 333,262 371,097 355,226 310,103 Total liabilities and stockholders' equity 462,516 468,824 541,443 530,903 448,312 Dividends paid on common stock 11,845 12,358 11,998 — — petrochemical markets. Fiscal 2016, compared to Fiscal 2015. These decreases Statements. We have a $75.0 million revolving credit facility in the Statements. short-term investments and reclassified $24.9 million as restricted cash for pledged collateral as stipulated by our amended credit agreement. As of September 30, 2016, Payments Due by Period: Long-Term Debt Obligations Operating Lease Obligations Total Less than 1 year $ 420 $ 2,495 $ 2,915 1 to 3 years 829 2,657 3,486 3 to 5 years 812 2,840 3,652 More than 5 years 400 2,485 2,885 Total long-term contractual obligations $ 2,461 $ 10,477 $ 12,938 2017. As of September 30, 2016, Payments Due by Period: Letters of Less than 1 year $ 11,417 1 to 3 years 18,362 More than 3 years 986 Total long-term commercial obligations $ 30,765 Off-Balance Sheet Arrangements cycle. necessary. Under the percentage-of-completion method of accounting, revenues are recognized as work is performed. The revenue earned to date is calculated by multiplying the total contract price by the percentage of performance to date, which is based on total costs or total labor dollars incurred to date compared to the total estimated costs or total labor dollars estimated at completion. The method used to determine the percentage of completion is typically the cost method, unless the labor method is a more accurate method of measuring the progress of the project. Application of the percentage-of-completion method of accounting requires the use of estimates of costs to be incurred for the performance of the contract. Contract costs include all direct material costs, direct labor costs and those indirect costs related to contract performance, such as indirect labor, supplies, tools, repairs and all costs associated with operation of equipment. The cost estimation process is based upon the professional knowledge and experience of our engineers, project managers and financial professionals. Factors that are considered in estimating the work to be completed and ultimate contract recovery include the availability and productivity of labor, the nature and complexity of the work to be performed, the effect of change orders, the availability of materials, the effect of any delays on our project performance and the recoverability of any claims. Changes in job performance, job conditions, estimated profitability and final contract settlements, including our estimate of liquidated damages, if any, may result in revisions to costs and income, with their effects being recognized in the period in which the revisions are determined. Whenever revisions of estimated contract costs and contract values indicate contract. This statements, we believe accounting for variable consideration and the number of performance obligations contained in each contract will have the greatest significance. The materiality of this guidance on our financial statements will be determined in large part by the contracts that are in progress as of the adoption date. decreased. Page Financial Statements: and Stockholders of Powell Industries, Inc. September 30, 2016 2015 ASSETS Current Assets: Cash and cash equivalents $ 97,720 $ 43,569 Accounts receivable, less allowance for doubtful accounts of $811 and $746 101,048 101,784 Costs and estimated earnings in excess of billings on uncompleted contracts 66,106 104,793 Inventories 26,521 32,891 Income taxes receivable 1,713 1,232 Deferred income taxes 4,006 3,910 Prepaid expenses 4,569 5,004 Other current assets 2,457 3,916 Total Current Assets 304,140 297,099 Property, plant and equipment, net 144,977 154,594 Goodwill and intangible assets, net 2,059 2,393 Other assets 11,340 10,117 Deferred income taxes — 2,288 Long-term receivable (Note E) — 2,333 Total Assets $ 462,516 $ 468,824 LIABILITIES AND STOCKHOLDERS' EQUITY Current Liabilities: Current maturities of long-term debt $ 400 $ 400 Income taxes payable 1,459 784 Accounts payable 34,985 48,008 Accrued salaries, bonuses and commissions 22,550 19,223 Billings in excess of costs and estimated earnings on uncompleted contracts 43,974 42,057 Accrued product warranty 4,639 4,930 Other accrued expenses 8,212 7,521 Deferred credit ─ short term (Note E) 2,029 2,029 Total Current Liabilities 118,248 124,952 Long-term debt, net of current maturities 2,000 2,400 Deferred compensation 4,840 4,950 Deferred income taxes 138 — Other long-term liabilities 1,466 723 Deferred credit ─ long term (Note E) 507 2,537 Total Liabilities 127,199 135,562 Commitments and Contingencies (Note G) Stockholders' Equity: Preferred stock, par value $.01; 5,000,000 shares authorized; none issued — — Common stock, par value $.01; 30,000,000 shares authorized; 12,199,511 and 12,031,243 shares issued, respectively 122 121 Additional paid-in capital 52,003 48,507 Retained earnings 331,959 328,294 Treasury stock, 806,018 and 670,181 shares at cost (24,999 ) (21,259 ) Accumulated other comprehensive loss (23,768 ) (22,401 ) Total Stockholders' Equity 335,317 333,262 Total Liabilities and Stockholders' Equity $ 462,516 $ 468,824 Year Ended September 30, 2016 2015 2014 Revenues $ 565,243 $ 661,858 $ 647,814 Cost of goods sold 459,038 553,597 522,340 Gross profit 106,205 108,261 125,474 Selling, general and administrative expenses 74,924 76,801 87,756 Research and development expenses 6,731 6,980 7,608 Amortization of intangible assets 352 435 779 Restructuring and separation expenses 8,441 3,397 — Operating income 15,757 20,648 29,331 Other income (See Note E) (2,029 ) (2,402 ) (1,522 ) Interest expense 149 145 178 Interest income (156 ) (86 ) (13 ) Income from continuing operations before income taxes 17,793 22,991 30,688 Income tax provision 2,283 13,552 11,068 Income from continuing operations 15,510 9,439 19,620 Income from discontinued operations, net of tax (Note N) — — 9,604 Net income $ 15,510 $ 9,439 $ 29,224 Earnings per share: Continuing operations $ 1.36 $ 0.80 $ 1.63 Discontinued operations — — 0.80 Basic earnings per share $ 1.36 $ 0.80 $ 2.43 Continuing operations $ 1.36 $ 0.79 $ 1.62 Discontinued operations — — 0.80 Diluted earnings per share $ 1.36 $ 0.79 $ 2.42 Weighted average shares: Basic 11,400 11,869 12,003 Diluted 11,431 11,908 12,058 Dividends per share $ 1.04 $ 1.04 $ 1.00 Year Ended September 30, 2016 2015 2014 Net income $ 15,510 $ 9,439 $ 29,224 Foreign currency translation adjustments (928 ) (16,104 ) (4,447 ) Postretirement benefit adjustment, net of tax (439 ) 206 17 Comprehensive income (loss) $ 14,143 $ (6,459 ) $ 24,794 Accumulated Additional Other Common Stock Paid-in Retained Treasury Stock Comprehensive Shares Amount Capital Earnings Shares Amount Income/(Loss) Total Balance, September 30, 2013 11,971 $ 119 $ 43,193 $ 313,987 — $ — $ (2,073 ) $ 355,226 Net income — — — 29,224 — — — 29,224 Foreign currency translation adjustments — — — — — — (4,447 ) (4,447 ) Stock-based compensation 44 — 3,385 — — — — 3,385 Excess tax benefit from share-based compensation — — 407 — — — — 407 Shares withheld in lieu of employee tax withholding — — (718 ) — — — — (718 ) Issuance of restricted stock 16 1 — — — — — 1 Retirement of stock — — — (11,998 ) — — — (11,998 ) Postretirement benefit adjustment, net of tax of $9 — — — — — — 17 17 Balance, September 30, 2014 12,031 $ 120 $ 46,267 $ 331,213 — $ — $ (6,503 ) $ 371,097 Net income — — — 9,439 — — — 9,439 Foreign currency translation adjustments — — — — — — (16,104 ) (16,104 ) Stock-based compensation 53 — 3,171 — — — — 3,171 Excess tax benefit from share-based compensation — — (191 ) — — — — (191 ) Shares withheld in lieu of employee tax withholding — — (740 ) — — — — (740 ) Issuance of restricted stock 16 1 — — — — — 1 Purchase of treasury shares — — — — (670 ) (21,259 ) — (21,259 ) Dividends paid — — — (12,358 ) — — — (12,358 ) Postretirement benefit adjustment, net of tax of $123 — — — — — — 206 206 Balance, September 30, 2015 12,100 $ 121 $ 48,507 $ 328,294 (670 ) $ (21,259 ) $ (22,401 ) $ 333,262 Net income — — — 15,510 — — — 15,510 Foreign currency translation adjustments — — — — — — (928 ) (928 ) Stock-based compensation 81 — 4,883 — — — — 4,883 Excess tax benefit from share-based compensation — — (387 ) — — — — (387 ) Shares withheld in lieu of employee tax withholding — — (1,000 ) — — — — (1,000 ) Issuance of restricted stock 18 1 — — — — — 1 Purchase of treasury shares — — — — (136 ) (3,740 ) — (3,740 ) Dividends paid — — — (11,845 ) — — — (11,845 ) Postretirement benefit adjustment, net of tax of $(237) — — — — — — (439 ) (439 ) Balance, September 30, 2016 12,199 $ 122 $ 52,003 $ 331,959 (806 ) $ (24,999 ) $ (23,768 ) $ 335,317 Year Ended September 30, 2016 2015 2014 Operating Activities: Net income $ 15,510 $ 9,439 $ 29,224 Adjustments to reconcile net income to net cash provided by operating activities: Depreciation 12,979 13,120 11,386 Amortization 352 435 779 Gain on sale of discontinued operations, net of tax — — (8,563 ) Stock-based compensation 4,883 3,171 3,385 Excess tax benefit from stock-based compensation 387 191 (407 ) Bad debt expense/(recovery) 187 (29 ) 1,074 Deferred income tax expense (benefit) 2,330 10,521 (3,212 ) Gain on amended supply agreement (2,029 ) (2,029 ) (1,522 ) Cash received from amended supply agreement 2,333 2,333 10,000 Changes in operating assets and liabilities: Accounts receivable, net 369 391 1,959 Costs and billings in excess of estimates on uncompleted contracts 39,612 (17,430 ) (17,089 ) Inventories 6,159 (572 ) (3,959 ) Prepaid expenses and other current assets 1,342 2,656 (1,101 ) Accounts payable and income taxes payable (12,334 ) (5,073 ) 1,002 Accrued liabilities 3,927 (3,373 ) (4,997 ) Other, net (1,101 ) (833 ) 1,524 Net assets held for sale — — (10,355 ) Net cash provided by operating activities 74,906 12,918 9,128 Investing Activities: Proceeds from sale of property, plant and equipment 187 112 118 Proceeds from sale of Transdyn — — 14,819 Purchases of property, plant and equipment (3,044 ) (34,719 ) (16,495 ) Net cash used in investing activities (2,857 ) (34,607 ) (1,558 ) Financing Activities: Payments on industrial development revenue bonds (400 ) (400 ) (400 ) Excess tax benefit from stock-based compensation (387 ) (191 ) 407 Shares withheld in lieu of employee tax withholding (1,000 ) (740 ) (499 ) Purchase of treasury shares (3,740 ) (21,259 ) — Dividends paid (11,845 ) (12,358 ) (11,998 ) Payments on short-term and other financing — — (16 ) Net cash used in financing activities (17,372 ) (34,948 ) (12,506 ) Net increase (decrease) in cash and cash equivalents 54,677 (56,637 ) (4,936 ) Effect of exchange rate changes on cash and cash equivalents (526 ) (2,912 ) 643 Cash and cash equivalents, beginning of period 43,569 103,118 107,411 Cash and cash equivalents, end of period $ 97,720 $ 43,569 $ 103,118 Year Ended September 30, 2016 2015 2014 Cash paid (received) during the period for: Interest, net of interest income $ 4 $ 70 $ 149 Income taxes, net of refunds (352) 2,298 18,889 Non-cash capital expenditures 221 147 13,527 property, plant and equipment, the cost and related accumulated depreciation are removed from the accounts, and any resulting gain or loss is recognized in the Consolidated Statements of Operations. statements, we believe accounting for variable consideration and the number of performance obligations contained in each contract will have the greatest significance. The materiality of this guidance on our financial statements will be determined in large part by the contracts that are in progress as of the adoption date. The following table reconciles basic and diluted weighted average shares used in the computation of earnings per share for the years ended September 30, 2017, 2016 Year Ended September 30, 2016 2015 2014 Numerator: Income from continuing operations $ 15,510 $ 9,439 $ 19,620 Income from discontinued operations — — 9,604 Net income $ 15,510 $ 9,439 $ 29,224 Denominator: Weighted average basic shares 11,400 11,869 12,003 Dilutive effect of restricted stock units 31 39 55 Weighted average diluted shares with assumed conversions 11,431 11,908 12,058 Net earnings per share: Continuing operations $ 1.36 $ 0.80 $ 1.63 Discontinued operations — — 0.80 Basic earnings per share $ 1.36 $ 0.80 $ 2.43 Continuing operations $ 1.36 $ 0.79 $ 1.62 Discontinued operations — — 0.80 Diluted earnings per share $ 1.36 $ 0.79 $ 2.42 September 30, 2016 2015 Balance at beginning of period $ 746 $ 1,577 Bad debt expense (recovery) 187 (29 ) Uncollectible accounts written off, net of recoveries (120 ) (749 ) Change due to foreign currency translation (2 ) (53 ) Balance at end of period $ 811 $ 746 September 30, 2016 2015 Raw materials, parts and subassemblies $ 29,639 $ 36,575 Work-in-progress 996 1,084 Provision for excess and obsolete inventory (4,114 ) (4,768 ) Total inventories $ 26,521 $ 32,891 September 30, 2016 2015 Costs incurred on uncompleted contracts $ 1,088,921 $ 912,237 Estimated earnings 350,125 271,640 1,439,046 1,183,877 Less: Billings to date (1,416,914 ) (1,121,141 ) Net underbilled position $ 22,132 $ 62,736 Included in the accompanying balance sheets under the following captions: Costs and estimated earnings in excess of billings on uncompleted contracts – underbilled $ 66,106 $ 104,793 Billings in excess of costs and estimated earnings on uncompleted contracts – overbilled (43,974 ) (42,057 ) Net underbilled position $ 22,132 $ 62,736 September 30, Range of 2016 2015 Asset Lives Land $ 22,107 $ 22,380 — Buildings and improvements 119,512 120,983 3 - 39 Years Machinery and equipment 103,268 100,306 3 - 15 Years Furniture and fixtures 3,806 3,564 3 - 10 Years Construction in process 1,009 1,013 — $ 249,702 $ 248,246 Less: Accumulated depreciation (104,725 ) (93,652 ) Total property, plant and equipment, net $ 144,977 $ 154,594 September 30, 2016 2015 Balance at beginning of period $ 4,930 $ 4,557 Increase to warranty expense 4,249 3,364 Deduction for warranty charges (4,464 ) (2,738 ) Change due to foreign currency translation (76 ) (253 ) Balance at end of period $ 4,639 $ 4,930 September 30, 2016 September 30, 2015 Gross Net Gross Net Carrying Accumulated Carrying Carrying Accumulated Carrying Value Amortization Value Value Amortization Value Purchased technology $ 11,749 $ (10,693 ) $ 1,056 $ 11,749 $ (10,359 ) $ 1,390 million. Years Ending September 30, Total 2017 $ 352 2018 352 2019 352 2020 ― 2021 ― As of September 30, 2017, there is approximately $0.5 million remaining in the deferred credit balance. September 30, 2016 2015 Industrial development revenue bonds $ 2,400 $ 2,800 Less: current portion (400 ) (400 ) Total long-term debt $ 2,000 $ 2,400 Year Ending September 30, Long‑Term 2017 $ 400 2018 400 2019 400 2020 400 2021 400 Thereafter 400 Total long-term debt maturities $ 2,400 In June 2017, we entered into the Third Amendment to the Credit Agreement (the Third Amendment). The Third Amendment, among other things, (i) extended the Maturity Date from December 2018 to June 2022; (ii) amended the definition of Applicable Rate by (a) providing that Pricing Level I shall apply when a Cash Collateral Period (described below) is in effect and that Pricing Level II shall apply when no Cash Collateral Period is in effect, (b) decreasing the Letter of Credit Fee percentage for Pricing Level I from 1.00% to 0.875% and (c) increasing the Commitment Fee percentage for both Pricing Level I and Pricing Level II from 0.1875% to 0.20%; (iii) added a new requirement that during a Cash Collateral Period we maintain a cash balance in a pledged cash collateral account equal to at least 102% of the Outstanding Amount of Revolving Loans and Letter of Credit Obligations and (iv) modified the Financial Covenants by requiring that, during any Cash Collateral Period, the Consolidated Current Ratio be no less than 1.10 to 1.0. Price Level 3 in the prior agreement was removed and our ability to pay dividends remains subject to financial covenant restrictions. 2017. There were no borrowings outstanding under the U.S. Revolver as of September 30, June 27, 2022. weekly by the Bonds’ remarketing agent, which was the underwriter for the Bonds and is an affiliate of the bank. This interest rate was 2017. We also sublease certain facilities that we are no longer occupying. Our sublease terms do not fully cover the existing rental commitments on certain facilities. Years Ending September 30, Operating 2017 $ 2,495 2018 1,491 2019 1,167 2020 1,470 2021 1,370 Thereafter 2,485 Total lease commitments $ 10,478 as follows (in thousands): 2017. Liquidated Damages Year Ended September 30, 2016 2015 2014 Current: Federal $ (1,395 ) $ 2,638 $ 12,184 State 449 699 2,226 Foreign 899 (306 ) (130 ) (47 ) 3,031 14,280 Deferred: Federal 1,923 3,296 (1,798 ) State 47 420 (311 ) Foreign 360 6,805 (1,103 ) 2,330 10,521 (3,212 ) Total income tax provision $ 2,283 $ 13,552 $ 11,068 Year Ended September 30, 2016 2015 2014 U.S. $ 5,087 $ 33,549 $ 35,131 Other than U.S. 12,706 (10,558 ) (4,443 ) Income before income taxes $ 17,793 $ 22,991 $ 30,688 Year Ended September 30, 2016 2015 2014 Statutory rate 35 % 35 % 35 % State income taxes, net of federal benefit 2 3 3 Research and development credit (8 ) (21 ) — Foreign rate differential (8 ) 4 1 Domestic production activities deduction — (3 ) (3 ) Foreign valuation allowance (11 ) 43 — Other 3 (2 ) — Effective rate 13 % 59 % 36 % January 1, 2015 to September 30, 2015. 2016. September 30, 2016 2015 Current deferred income taxes: Gross assets $ 4,384 $ 3,910 Gross liabilities (378 ) — Net current deferred income tax asset 4,006 3,910 Noncurrent deferred income taxes: Gross assets 16,170 5,005 Gross liabilities (16,308 ) (2,717 ) Net noncurrent deferred income tax asset (liability) (138 ) 2,288 Net deferred income tax asset $ 3,868 $ 6,198 September 30, 2016 2015 Deferred Tax Assets: Net operating loss $ 10,453 $ 9,877 Uniform capitalization and inventory 1,596 1,895 Deferred compensation 1,853 1,848 Stock-based compensation 760 993 Reserve for accrued employee benefits 1,679 1,482 Warranty accrual 1,388 915 Goodwill 345 398 Postretirement benefits liability 503 — Allowance for doubtful accounts 220 166 Accrued legal 294 60 Credit carryforwards 1,292 1,329 Other 171 8 Deferred tax assets 20,554 18,971 Deferred Tax Liabilities: Depreciation and amortization (8,247 ) (2,705 ) Other — (12 ) Deferred tax liabilities (8,247 ) (2,717 ) Less: valuation allowance (8,439 ) (10,056 ) Net deferred tax asset $ 3,868 $ 6,198 At September 30, 2017, the valuation allowance of $8.8 million was primarily related to these Canadian net deferred tax assets. Balance at September 30, 2013 $ 135 Charged to cost and expenses 80 Charged to other accounts 688 Balance at September 30, 2014 $ 903 Charged to cost and expenses 10,048 Charged to other accounts (895 ) Balance at September 30, 2015 $ 10,056 Charged to cost and expenses (1,934 ) Charged to other accounts 317 Balance at September 30, 2016 $ 8,439 Year Ended September 30, 2016 2015 2014 Balance at beginning of period $ 784 $ 4,026 $ 3,845 Increases related to tax positions taken during the current period 293 954 225 Increases related to tax positions taken during a prior period ― 2 14 Decreases related to expiration of statute of limitations (31 ) (49 ) (58 ) Decreases related to settlement with taxing authorities ― (4,149 ) — Balance at end of period $ 1,046 $ 784 $ 4,026 2017. Of the $6.4 million of total assets held by the trustee, $5.6 million is invested in company-owned life insurance policies and the remainder in mutual funds. 2017. Total RSU activity (number of shares) for the past Number of Weighted Restricted Average Stock Fair Value Units Per Share Outstanding at September 30, 2013 81,555 $ 38.66 Granted 57,200 66.15 Vested (29,832 ) 44.88 Forfeited (2,078 ) 56.34 Outstanding at September 30, 2014 106,845 $ 51.30 Granted 89,500 41.75 Vested (55,431 ) 45.23 Forfeited (7,408 ) 43.82 Outstanding at September 30, 2015 133,506 $ 47.83 Granted 168,800 31.64 Vested(1) (116,568 ) 33.10 Forfeited (25,750 ) 50.28 Outstanding at September 30, 2016 159,988 $ 43.12 available. 2017. measurement date. As such, fair value is a market-based measurement that should be determined based on assumptions that market participants would use in valuing an asset or liability. The accounting guidance requires the use of valuation techniques to measure fair value that maximize the use of observable inputs and minimize the use of unobservable inputs. As a basis for considering such assumptions and inputs, a fair value hierarchy has been established that identifies and prioritizes three levels of inputs to be used in measuring fair value. Fair Value Measurements at September 30, 2016 Quoted Prices in Significant Other Significant Active Markets for Observable Unobservable Fair Value at Identical Assets Inputs Inputs September 30, (Level 1) (Level 2) (Level 3) 2016 Assets: Cash equivalents $ 435 $ — $ — $ 435 Deferred compensation 1,643 4,130 — 5,773 Liabilities: Deferred compensation — 4,449 — 4,449 Fair Value Measurements at September 30, 2015 Quoted Prices in Significant Other Significant Active Markets for Observable Unobservable Fair Value at Identical Assets Inputs Inputs September 30, (Level 1) (Level 2) (Level 3) 2015 Assets: Cash equivalents $ 434 $ — $ — $ 434 Deferred compensation 1,879 2,904 — 4,783 Liabilities: Deferred compensation — 4,487 — 4,487 an interest-bearing savings account. See Note F for further discussion on restricted cash. Year Ended September 30, 2016 2015 2014 United States $ 405,298 $ 474,038 $ 365,085 Canada 77,252 101,191 137,684 Middle East and Africa 40,294 40,557 84,330 Europe 26,200 23,567 34,920 Far East 7,895 12,026 15,127 Mexico, Central and South America 8,304 10,479 10,668 Total revenues $ 565,243 $ 661,858 $ 647,814 September 30, 2016 2015 Long-lived assets: United States $ 88,304 $ 95,694 Canada 52,292 53,879 United Kingdom 4,381 5,021 Total $ 144,977 $ 154,594 Expenses in Fiscal 2017. Year Ended September 30, 2016 2015 2014 Revenues $ — $ — $ 13,923 Income from discontinued operations, net of tax of $633 $ — $ — $ 1,041 Gain on sale of discontinued operations, net of tax of $5,218 — — 8,563 Net income from discontinued operations, net of tax $ — $ — $ 9,604 Earnings per share information: Basic $ — $ — $ 0.80 Diluted $ — $ — $ 0.80 2015 Quarters First Second Third Fourth 2015 Revenues $ 152,601 $ 170,199 $ 176,733 $ 162,325 $ 661,858 Gross profit 21,069 24,301 32,944 29,947 108,261 Net income (loss) (239 ) (3,683 ) 7,049 6,312 9,439 Earnings (loss) per share: Basic $ (0.02 ) $ (0.31 ) $ 0.60 $ 0.54 $ 0.80 Diluted $ (0.02 ) $ (0.31 ) $ 0.60 $ 0.54 $ 0.79 2017. 3.1 3.2 10.1 Description of Supplemental Executive Benefit Plan (filed as Exhibit 10 to our Form 10-K for the fiscal year ended October 31, 1984, and incorporated herein by reference). Powell Industries, Inc. Directors’ Fees Program (filed as Exhibit 10.7 to our Form 10-K for the fiscal year ended October 31, 1992, and incorporated herein by reference). Powell Industries, Inc. Deferred Compensation Plan (filed as Exhibit 10.9 to our Form 10-K for the fiscal year ended October 31, 2002, and incorporated herein by reference). Banking facilities between HSBC Bank plc and Switchgear & Instrumentation Limited and Switchgear & Instrumentation Properties Limited dated September 12, 2005 (filed as Exhibit 10.16 to our Form 10-K for the fiscal year ended October 31, 2005, and incorporated herein by reference). Lease Agreement between the Company and C&L Partnership, Ltd. dated April 19, 2006 (filed as Exhibit 10.2 to our Form 8-K filed August 9, 2006, and incorporated herein by reference). Employment Agreement dated as of May 8, 2012 between the Company and Don R. Madison (filed as Exhibit 10.1 to our Form 10-Q for the quarter ended March 31, 2012, and incorporated herein by reference). Amended and Restated Credit Agreement dated as of April 26, 2012, between Powell PowerComm Inc., as Borrower, Powell Industries, Inc., Nextron Limited, PPC Technical Services Inc., as Guarantors, and HSBC Bank Canada, as Lender (filed as Exhibit 10.4 to our Form 10-Q for the quarter ended March 31, 2012, and incorporated herein by reference). Stock Purchase Agreement dated as of January 15, 2014, between the Company and Kapsch TrafficCom IVHS, Inc. (filed as Exhibit 10.1 to our Form 8-K filed January 17, 2014, and incorporated herein by reference). ** Description of Exhibits Severance Agreement and Release effective as of December 24, 2015, between the Company and Michael A. Lucas (filed as Exhibit 10.1 to our Form 10-Q filed February 3, 2016 and incorporated herein by reference). 10.27 * *31.1 *31.2 *32.1 Number — Certification of Chief Financial Officer Pursuant to Section 18 U.S.C. Section 1350, as Adopted Pursuant to Section 906 of the Sarbanes-Oxley Act of 2002. 101.INS — XBRL Instance Document 101.SCH — XBRL Taxonomy Extension Schema Document 101.CAL — XBRL Taxonomy Extension Calculation Linkbase Document 101.DEF — XBRL Taxonomy Extension Definition Linkbase Document 101.LAB — XBRL Taxonomy Extension Label Linkbase Document 101.PRE — XBRL Taxonomy Extension Presentation Linkbase Document Portions of this exhibit have been omitted based on a request for confidential treatment pursuant to Rule 24b-2 of the Securities Exchange Act of 1934. Such omitted portions have been filed separately with the Commission. By: Chairman of the Board Thomas W. Powell /s/Brett A. Cope Brett A. Cope /s/Don R. Madison Don R. Madison /s/Milburn Honeycutt Milburn Honeycutt /s/ Eugene L. Butler Director Eugene L. Butler /s/ Christopher E. Cragg Director Christopher E. Cragg /s/ Bonnie V. Hancock Director Bonnie V. Hancock /s/ Scott E. Rozzell Director Scott E. Rozzell /s/ Stephen W. Seale, Jr. Director Stephen W. Seale, Jr. /s/ John D. White Director John D. White /s/Richard E. Williams Richard E. Williams 3.1 3.2 10.1 Description of Supplemental Executive Benefit Plan (filed as Exhibit 10 to our Form 10-K for the fiscal year ended October 31, 1984, and incorporated herein by reference). Powell Industries, Inc. Directors’ Fees Program (filed as Exhibit 10.7 to our Form 10-K for the fiscal year ended October 31, 1992, and incorporated herein by reference). Banking facilities between HSBC Bank plc and Switchgear & Instrumentation Limited and Switchgear & Instrumentation Properties Limited dated September 12, 2005 (filed as Exhibit 10.16 to our Form 10-K for the fiscal year ended October 31, 2005, and incorporated herein by reference). ** Description of Exhibits * *31.1 *31.2 *32.1 *32.2 101.INS 101.SCH 101.CAL 101.LAB — XBRL Taxonomy Extension Label Linkbase Document 101.PRE — XBRL Taxonomy Extension Presentation Linkbase Document Portions of this exhibit have been omitted based on a request for confidential treatment pursuant to Rule 24b-2 of the Securities Exchange Act of 1934. Such omitted portions have been filed separately with the Commission.corporationcompany was the successor to a company founded by William E. Powell in 1947, which merged into the Company in 1977. We are headquartered in Houston, Texas, and our major subsidiaries, all of which are wholly owned, include: Powell Electrical Systems, Inc.; Powell (UK) Limited; Powell Canada Inc. and Powell Industries International, B.V.ourthis Annual ReportsReport on Form 10-K Quarterly Reports on Form 10-Q, Current Reports on Form 8-Kand other reports, and amendments to those reports, filed or furnished pursuant to Section 13(a) or 15(d) of the Securities Exchange Act of 1934 as soon as is reasonably practicable after we electronically file such material with, or furnish it to, the Securities and Exchange Commission (SEC). Additionally, all of our reports filed with the SEC are available via their website at http://www.sec.gov, or may be read and copied at the SEC Public Reference Room at 100 F Street, NE, Washington, DC 20549.equipmentproducts and systems for the distribution, control and monitoring of electrical energy designed towhich (1) distribute, control and monitor the flow of electrical energy and (2) provide protection to motors, transformers and other electrically powered equipment. Our principal products include integrated power control room substations (PCRs®), custom-engineered modules, electrical houses (E-Houses), traditional and arc-resistant distribution switchgear and control gear, medium-voltage circuit breakers, monitoring and control communications systems, motor control centers and bus duct systems. These products are designed for application voltages ranging from 480 volts to 38,000 volts and are used in oil and gas refining, onshore and offshore oil and gas production, petrochemical, pipeline, terminal, mining and metals, light rail traction power, electric utility, pulp and paper and other heavy industrial markets. Our product scope includes designs tested to meet both U.S. standards (ANSI) and international standards (IEC). We assist customers by providing value-added services such as spare parts, field service inspection, installation, commissioning, modification and repair, retrofit and retrofill components for existing systems and replacement circuit breakers for switchgear that is obsolete or that is no longer produced by the original manufacturer. We seek to establish long-term relationships with the end users of our systems as well as the designengineering, procurement and construction engineering(EPC) firms contracted by those end users. and Fiscal 2014 used throughout this Annual Report relate to our fiscal years ended September 30, 2017, 2016 and 2015, and 2014, respectively.72%71%, 72% and 56%72% of our consolidated revenues for Fiscal 2017, 2016 2015 and 2014,2015, respectively. Revenues from customers located in Canada accounted for approximately 14%12%, 15%14% and 21%15% of consolidated revenues for Fiscal 2017, 2016 2015 and 2014,2015, respectively. Approximately 61%60% of our long-lived assets were located in the U.S. at September 30, 2016,2017, with 36%37% of long-lived assets located in Canada and 3% of long-lived assets located in the United Kingdom (U.K.). Detailed geographic information is included in Note L of the Notes to Consolidated Financial Statements included elsewhere in this Annual Report.In January 2014, we sold our wholly owned subsidiary Transdyn Inc. (Transdyn). We have presented the results of these operations as income from discontinued operations, net of tax, in the accompanying consolidated statements of operations. Additionally, all current and historical financial information presented in this Annual Report excludes the financial information for Transdyn or presents it as discontinued operations where applicable. For more information about this disposition, see Note N of the Notes to Consolidated Financial Statements included elsewhere in this Annual Report.engineering, procurement and construction (EPC)EPC firm on behalf of the end user. Each project is specifically engineered and manufactured to meet the exact specifications and requirements of the individual customer. Powell’s expertise is in the design and engineering, manufacturing, project management and integration of the various systems into a single custom-engineered deliverable. We market and sell our products and services, which are typically awarded in competitive bid situations, to a wide variety of customers, governmental agencies, markets and geographic regions. Contracts often represent large-scale and complex projects with an individual customer. By their nature, these projects are typicallymargins.2016,2017, Fiscal 20152016 or Fiscal 2014. and withas well as smaller, regional competitors that typically have limited capabilities and scope of supply. Our principal competitors include ABB, Eaton, General Electric Company, Schneider and Siemens. The competitive factors used during bid evaluation by our customers vary from project to project and may include technical support and application expertise, engineering and manufacturing capabilities, equipment rating, delivered value, scheduling and price. While projects are typically non-recurring, a significant portion of our business is from repeat customers and many times involves third-party EPC firms hired by the end user and with which we also have long and established relationships. Ultimately, our competitive position is dependent upon our ability to provide quality custom-engineered products, services and systems on a timely basis at a competitive price.20162017 totaled $291.4$250.1 million compared to $441.4$291.4 million at September 30, 2015.2016. Backlog declined primarily due to lower demand in our core oil, gas and petrochemical markets. We anticipate that approximately $228$235.3 million of Fiscal 20162017 ending backlog will be fulfilled during our fiscal year ending September 30, 2017.2018. Backlog may not be indicative of future operating results as orders in our backlog may be cancelled or modified by our customers.and 46% of revenues in both Fiscal 2017 and Fiscal 2016 and 46% in Fiscal 2015, respectively.2015. Unanticipated changes in material requirements, disruptions in supplies or price increases could impact production costs and affect our consolidated results of operations.2015 or 2014.2016,2017, we had 2,3231,841 full-time employees located primarily in the United States,U.S., Canada and the U.K. Our employees are not represented by unions, and we believe that our relationship with our employees is good.most significant risks and uncertainties described below. If any of the following risks actually occur, our business, financial condition, cash flows, liquidity and results of operations could be negatively impacted and we may not be able to achieve our quarterly, annual or long-range plans. Additional risks and uncertainties not known to us or not described below may also impairnegatively impact our business operations. If any of the following risks actually occur, our business, financial condition, cash flows and results of operations could be harmed and we may not be able to achieve our goals.operations. This Annual Report also includes statements reflecting assumptions, expectations, projections, intentions or beliefs about future events that are intended as “forward-looking statements” under the Private Securities Litigation Reform Act of 1995 and should be read in conjunction with the discussion under “Forward-Looking Statements,” above.Due to the cyclical nature ofindustry, our business may bemarkets and we are adversely impacted by extended periods of low oil or gas prices, or unsuccessful exploration efforts which may decrease our customers’ spending, the demand for our products and thereforeservices and the prices we are able to charge. This has had, and may continue to have, an adverse effect on our results in the future.have declinedwhile improving somewhat in 2017, are still down from 2014 levels and are expected to remain unpredictable.volatile. This decline in oil and gas prices since 2014 has had a negative effect on our markets and led to the reduction of projects available and thus reduced our revenue and our backlog of projects. These unfavorableUnfavorable commodity prices have caused oil and gas companies to change their strategies, reduce project spending and delay and/or cancel projects. The price for oil and gas can be influenced by many factors, including global economic growth, inventory levels and supply and demand for these commodities. These factors could cause oil and gas prices to remain depressed or decrease further, which could result in a continued decrease in customer projects that could adversely impact our operations. Continued periods of reduced oil and gas prices couldwill negatively impact our consolidatedbusiness and results of operations cash flows and financial position and would likely result in operating losses and could result in impairment losses on our long-lived assets. Additionally, the loss of significant volume from one particular customer at one of our facilities could materially impact that facility. Furthermore, our ability to maintain or expand our business would be limited in the future if we are unable to maintain or increase our bonding capacity or our credit facility on favorable terms or at all. These disruptions could lead to reduced demand for our products and services and could materiallyadversely impact our business financial condition, cash flows and results of operations and could potentially impact the trading price of our common stock.Our stock price could decline or fluctuate significantly due to unforeseen circumstances. These fluctuations may cause our stockholders to incur losses.Our stock price could fluctuate or decline from quarter to quarter due to a variety of factors including, but not limited to, the timing and cancellation of projects, changes in our estimated costs to complete projects, or failure of our operating results to meet the expectations of securities analysts or investors which could reduce investor confidence. Additionally, we are required to assess and report on our internal controls each year. Findings of inadequate or failed internal controls could reduce investor confidence in the reliability of our financial information. These factors could adversely affect our operating results and the trading price of our common stock could decline significantly.that appeared to have a high certainty of going forward at the time the order was recorded. In the event of a project cancellation, or modification,modified and while we may be reimbursed for certain costs, butwe may not have a contractual right to the total revenue reflected in our backlog. In addition to our being unable to recover certain direct costs, cancelled projects may also result in additional unrecoverable costs due to the underutilization of our assets. Accordingly, the amounts recorded in backlog may not be a reliable indicator of our future earnings.a significantan adverse impact on our operating results for any fiscal quarter or year.them, could subject us to penalty provisions, liquidated damages or claims against the company or our outstanding letters of credit or performance bonds. In addition, some customer contracts stipulate protection against our gross negligence or willful misconduct. Each individual contract defines the conditions under which the customer may make a claim against us. It is possible that adjustments arising from such claims, or our failure to manage our contract risk, may not be covered by insurance and could have a significantan adverse impact on our operating results for any fiscal quarter or year.materiallyadversely impact our ability to meet commitments to our customers.2016.2017. Unanticipated increases in raw material requirements or prices, as well as changes in supplier availability or price increasessupplier consolidation, could increase production costs and adversely affect profitability as fixed-price contracts may prohibit our ability to charge the customer for the increase in raw material prices. We purchase a wide variety of materials and component parts from various suppliers to manufacture our products, including steel, aluminum, copper and various components. Our supply base for certain key components and raw materials is limited and may come from a single supplier. If we are unable to obtain key components and raw materials from these suppliers, the key components and raw materials may not be readily available from other suppliers or available with acceptable terms. Our success depends on our ability to meet customer commitments and could be negatively impacted if a supplier experiences a disruption or discontinuance in their operations. The time and effort associated with the selection and qualification of a new supplier and changes in our design and testing to accommodate similar components from other suppliers could be significant. Additionally, we rely on certain competitors for key materials used in our products. This could put us at risknegatively impact our ability to manufacture our products if the relationships change or become adversarial. around the world such as engineering, manufacturing and marketing resources. Competition in the industry depends on a number of factors, including the number of projects available, technical ability, production capacity, location and price. Certain of our competitors may have lower cost structures and may, therefore, be able to provide their products or services at lower prices than we are able to provide. Similarly, we cannot be certain that we will be able to maintain or enhance our competitive position within our industry, maintain our customer base at current levels, increase our customer base or continue to provide technologically superior products at a competitive price. New companies may enter the markets in which we compete, or industry consolidation may occur, further increasing competition in our markets. Oursalesrevenues and have a materialan adverse impact on our business model, financial position and our consolidated results of operations.regulations, including regulations related to conflict minerals. We may incur significant costs associated with the compliance with SEC reporting and due diligence requirements. In our industry, conflict minerals are most commonly found in metals. As there may be only a limited number of suppliers offering "conflict free" metals, we cannot be sure that we will be able to obtain necessary metals in sufficient quantities or at competitive prices. Also, we may face challenges with our customers and suppliers if we are unable to sufficiently verify that the metals used in our products are "conflict free.”United StatesU.S. and numerous foreign jurisdictions. A change in tax laws, deductions or credits, treaties or regulations, or their interpretation, in the countries in which we operate could result in a higher tax rate on our pre-tax income, which could have a material impact on our net income and cash flows from operations.income. We are regularly under audit by tax authorities, and our tax estimates and tax positions could be materially affected by many factors including the final outcome of tax audits and related litigation, the introduction of new tax accounting standards, legislation, regulations and related interpretations, our global mix of earnings, the extent to which deferred tax assets are realized and changes in uncertain tax positions. A significant increase in our tax rate could have a material effectimpact on our profitability.28%29% of our consolidated revenues in Fiscal 2016.2017. While our manufacturing facilities are located in developed countries with historically stable operating and fiscal environments, our consolidatedbusiness and results of operations cash flows and financial condition could be adversely affected by a number of factors, including: political and economic instability; social unrest, acts of terrorism, force majeure, war or other armed conflict; inflation; changes in tax laws; the pending exitapplication of the U.K. from the European union; inflation;foreign labor regulations; currency fluctuations, devaluations and conversion restrictions;restrictions and/or governmental activities that limit or disrupt markets, restrict payments or limit the movement of funds and trade restrictions or economic embargoes imposed by the U.S. or other countries. Additionally, the compliance with foreign and domestic import and export regulations and anti-corruption laws, such as the U.S. Foreign Corrupt Practices Act, or similar laws of other jurisdictions outside the United States,U.S., could adversely impact our ability to compete for contracts in such jurisdictions. Moreover, the violation of such laws or regulations, by us or our representatives, could result in severe penalties including monetary fines, criminal proceedings and suspension of export privileges.Our operating results may vary significantly from quarter to quarter.Our quarterly results may be materially and adversely affected by a number of factors, including: changes in estimates relating to revenues, costs, project scheduling; the timing and volume of work under new agreements; changes in existing customer schedules; general economic conditions; the spending patterns of customers; variations in the margins of projects performed during any particular quarter; losses experienced in our operations not otherwise covered by insurance; a change in the demand or production of our products and our services caused by severe weather conditions; a change in the mix of our customers, contracts and business; increases in design and manufacturing costs; the ability of customers to pay their invoices owed to us and disagreements with customers related to project performance on delivery. Accordingly, our operating results in any particular quarter may vary significantly and may not be indicative of future results.and profitabilityat competitive levels may be limited by our ability to employ, train and retain personnel necessary to meet our requirements. We face significant competition for qualified personnel in our industry. We may experience shortages of qualified personnel such as engineers, project managers and select skilled trades. We cannot be certain that we will be able to maintain an adequate skilled labor force or key technical personnel necessary to operate efficiently and to support our growth strategy and operations. We cannot be certain that our labor expensescosts will not increase as a result of a shortage in the supply of skilled and technical personnel. Labor shortages or increased labor costs could impair our ability to maintain our business, meet customer commitments or grow our revenues, and may adversely impact our business and results of operations.consolidatedbusiness and results of operations cash flows and financial condition could be adversely affected. In addition, claims, lawsuits and proceedings may harm our reputation or divert management resources away from operating our business.or telecommunications failures, cyber security attacks or other similar events, our business or results of operations could be adversely affected. In addition, despite implementation of security measures, our business systems may be vulnerable to computer viruses, cyber-attacks and other unauthorized access; and theseaccess.These security breaches could result in a disruption to our operations or in legal claims or proceedings. A material network breach of our business systems could involve the theft of intellectual property, financial data, employee data, or customer data, which may be used by competitors. We rely on third-party systems which could also suffer operational system failure or cyber-attacks. Any of these occurrences could disrupt our business, result in potential liability or reputational damage or otherwise have an adverse effect on our business or results of operations.andwhich could adversely impact our consolidatedbusiness and results of operations, cash flows and financial position. In addition, we may not be able to continue to obtain insurance at commercially reasonable rates or may be faced with liabilities not covered by insurance such as, but not limited to, environmental contamination or terrorist attacks.SuchWe may declare the existence of a force majeure event under our contracts in certain situations; however, a customer may dispute our force majeure claim, which may result in additional liabilities. Losses arising from such events may or may not be fully covered by our various insurance policies or may be subject to deductibles or exceed coverage limits. In addition, such events could result in temporary or long-term delays and/or cancellations of orders for raw materials from our suppliers which could impact our project execution. These situations or other disruptions are outside of our control and could have a significant adversemay adversely impact on our consolidatedbusiness and results of operations, cash flows and financial position.operationsbusiness and may adversely impact our profitability.Acquisitions involveresults of operations.pose risks tomay impact our strategy.operating results. Due diligence may not be adequate or reveal all risks and challenges associated with our acquisitions. Companies that we acquire may not achieve revenues, profitability or cash flows that we expected, or that ultimately justify the investment. It is possible that impairment charges resulting from the overpayment for an acquisition may negatively impact our results of operations. Financing for acquisitions may require us to obtain additional equity or debt financing which may not be available on attractive terms, if at all.all or which may be restricted under the terms of our credit facilities or other financing arrangements. Any failure to successfully complete or successfully integrate acquisitions could have a material adverse effect on our business consolidatedand results of operations.condition.reporting, however, any system of controls has limitations, including the possibility of human error, the circumvention or overriding of controls and/or fraud. Our failure to maintain effective internal controls over financial reporting could adversely affect our ability to report our financial results on a timely and accurate basis, which could result in a loss of investor confidence in our financial reports or have an adverse impact on our business and results of operations.United States,U.S., Canada and the U.K. Our facilities are generally located in areas that are readily accessible to materials and labor pools and are maintained in good condition. These facilities are expected to meet our needs for the foreseeable future.2016,2017, are as follows:Location Description Acres Houston, TX Corporate office and manufacturing facility 21.4 428,515 Houston, TX Office and manufacturing facility 53.4 290,554 Houston, TX Office, fabrication facility and yard 63.3 82,320 North Canton, OH Office and manufacturing facility 8.0 115,200 Northlake, IL Office and manufacturing facility 10.0 103,500 Bradford, U.K. Office and manufacturing facility 7.9 129,200 Acheson, Alberta, Canada Office and manufacturing facility 20.1 330,168 High Low Fiscal 2016: First Quarter $ 35.89 $ 25.99 Second Quarter 30.41 23.00 Third Quarter 39.47 26.22 Fourth Quarter 41.10 34.40 Fiscal 2017: First Quarter $ 46.68 $ 34.81 Second Quarter 40.00 30.86 Third Quarter 35.58 31.12 Fourth Quarter 33.47 27.28 2, 2016,1, 2017, the closing price of our common stock on the NASDAQ was $43.38$28.53 per share. As of December 2, 2016,1, 2017, there were 405308 stockholders of record of our common stock. All common stock held in street names are recorded in the Company’s stock register as being held by one stockholder.$11.8$11.9 million and $12.4$11.8 million in dividends in Fiscal 20162017 and Fiscal 2015,2016, respectively. The Board anticipates declaring cash dividends in future quarters; however, there is no assurance as to future dividends or their amounts because they depend on future earnings, capital requirements, financial condition and financial condition. debt covenants. Securities and Exchange Commission,SEC, nor shall such information be incorporated by reference into any future filing under the Securities Act of 1933 or Securities Act of 1934, each as amended, except to the extent that we specifically incorporate it by reference into such filing.20112012 to September 30, 2016,2017, the cumulative stockholder return on our common stock with the cumulative total return on the NASDAQ Market Index and the Industrial Electrical Equipment Group (a select group of peer companies – Altra Industrial Motion Corp.; Ameresco, Inc.; AZZ Inc.; Belden Inc.; Daktronics Inc.; Electro Scientific Industries, Inc.; EnerSys; Franklin Electric Co, Inc.; GrafTech International Ltd; Littelfuse Inc.; LSI Industries Inc.; Preformed Line Products; A O Smith Corporation and Woodward, Inc.). The comparison assumes that $100 was invested on October 1, 2011,2012, in our common stock, the NASDAQ Market Index and the Industrial Electrical Equipment Group, and that all dividends were re-invested. The stock price performance reflected on the following graph is not necessarily indicative of future stock price performance.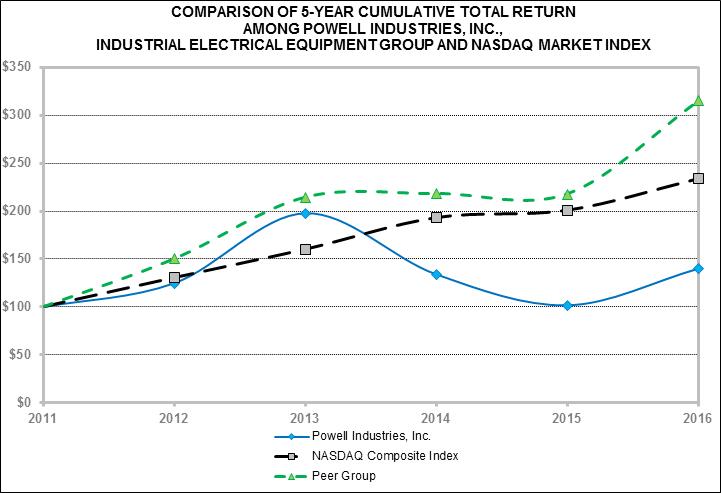
Years ended September 30, 2017 2016 2015 2014 2013 Statement of Operations: (In thousands, except per share data) Revenues $ 395,911 $ 565,243 $ 661,858 $ 647,814 $ 640,867 Cost of goods sold 345,142 459,038 553,597 522,340 502,375 Gross profit 50,769 106,205 108,261 125,474 138,492 Selling, general and administrative expenses 61,524 74,924 76,801 87,756 79,707 Research and development expenses 6,906 6,731 6,980 7,608 7,615 Amortization of intangible assets 355 352 435 779 1,659 Restructuring and separation expenses 1,322 8,441 3,397 — 3,927 Operating income (19,338 ) 15,757 20,648 29,331 45,584 Gain on settlement — — — — (1,709 ) Other income (2,029 ) (2,029 ) (2,402 ) (1,522 ) — Interest expense (net) (390 ) (7 ) 59 165 167 Income (loss) from continuing operations before income taxes (16,919 ) 17,793 22,991 30,688 47,126 Income tax provision (benefit) (1) (7,433 ) 2,283 13,552 11,068 7,387 Income (loss) from continuing operations (9,486 ) 15,510 9,439 19,620 39,739 Income from discontinued operations, net of tax (2) — — — 9,604 2,337 Net income (loss) $ (9,486 ) $ 15,510 $ 9,439 $ 29,224 $ 42,076 Earnings (Loss) per share: Continuing operations $ (0.83 ) $ 1.36 $ 0.80 $ 1.63 $ 3.32 Discontinued operations — — — 0.80 0.20 Basic earnings (loss) per share $ (0.83 ) $ 1.36 $ 0.80 $ 2.43 $ 3.52 Continuing operations $ (0.83 ) $ 1.36 $ 0.79 $ 1.62 $ 3.32 Discontinued operations — — — 0.80 0.19 Diluted earnings (loss) per share $ (0.83 ) $ 1.36 $ 0.79 $ 2.42 $ 3.51 Years ended September 30, 2017 2016 2015 2014 2013 Balance Sheet Data: (In thousands) Cash, cash equivalents and short-term investments (3) $ 95,188 $ 97,720 $ 43,569 $ 103,118 $ 107,411 Property, plant and equipment, net 139,420 144,977 154,594 156,896 144,495 Total assets 414,986 462,516 468,824 541,443 530,903 Long-term debt, including current maturities 2,000 2,400 2,800 3,200 3,616 Total stockholders' equity 321,296 335,317 333,262 371,097 355,226 Total liabilities and stockholders' equity 414,986 462,516 468,824 541,443 530,903 Dividends paid on common stock 11,875 11,845 12,358 11,998 — Our strategy in Canada has been to replicateAs a result, our project-based integration model which allows for the design, fabrication, integration and testing of our products at a single location. This strategic initiative has presented challenges for our Canadian operations in prior years, resulting in inefficiencies that led to higher operating costs, gross margin deterioration and operating losses. We took various actions in Canada and have seen improvements in our operational efficiencies during Fiscal 2016. However, the depressed oil and gas market conditions will likely have a negative impact on our Canadian operations for the foreseeable future.During Fiscal 2015, our consolidated operating results were negatively impacted by operational inefficiencies resulting from increased volumerevenues and project scheduling delays. Our inabilitybacklog have declined, and may continue to meet contractual commitments on existing projects, as well as delays in customer construction schedules,decline, which may further negatively impacted the timing and costs related to project execution. Our operating results were negatively impacted by the timing and resolution of change orders, project close-out and resolution of potential liquidated damage claims, all of which impacted gross margins during the period in which these items are resolved withimpact our customers. During Fiscal 2016, continued weakness in the oil and gas markets caused further declines in the number and size of projects leading to a decrease in revenues and backlog of projects.operations. In response to our reduced project backlog and the challenging market outlook in our core oil, gas and petrochemical markets, we took steps in Fiscal 2016, and have taken stepsadditional actions in Fiscal 2017, to reduce our overall cost structure restructureand better align our costs with current and future production requirements.alignworkforce reductions as a result of our salariedadverse market outlook and hourly workforcereduction in project backlog.future production requirements.On January 15, 2014,a valuation allowance. Additionally, the effective tax rates for both Fiscal 2017 and 2016 were favorably impacted by discrete items recognized, primarily related to the Research and Development Tax Credit (R&D Tax Credit), in the amounts of $0.9 million and $0.8 million, respectively. See Note H of the Notes to Consolidated Financial Statements. sold our wholly-owned subsidiary Transdynrecorded a net loss of $9.5 million, or $0.83 per diluted share, a decrease from net income of $15.5 million, or $1.36 per diluted share that we recorded in Fiscal 2016. The reduction in net income compared to the prior year was primarily due to a global providerdecline in our project backlog due to depressed market conditions and competitive pricing pressures, primarily in our core oil, gas and petrochemical markets.electronic toll collection systems, headquarteredwhich are petrochemical, oil and gas construction and transportation infrastructure projects which take a number of months to produce. The order backlog at September 30, 2017 was $250.1 million, compared to $291.4 million at September 30, 2016. New orders placed in Vienna, Austria. The purchase priceFiscal 2017 totaled $355.1 million, compared to $417.5 million in Fiscal 2016. This decrease in orders was primarily due to lower demand from the sale of this subsidiary totaled $16.0 million, subject to working capital adjustments. We received cash of $14.4 millionour customers in our core oil, gas and the remaining $1.6 million was placed into an escrow account and released to us in July 2015. We have presented the results of these operations as income from discontinued operations, net of tax, in the consolidated statements of operations for all periods presented. Accordingly, we have removed Transdyn from the Results of Operations discussions below.Results of Operationscontinuecontinued to see lower demand from our customers in the oil and gas markets. Domestic revenues decreased 15%, or $69.4 million, to $405.3 million and international revenues decreased 15%, or $27.2 million, to $159.9 million inarewere due to the overall reduction in revenues year over year primarily driven by the decline in backlog resulting from lower demand from our customers in the oil and gas markets. Revenues from commercial and industrial customers decreased 20%, or $105.4 million, to $419.1 million in Fiscal 2016, compared to Fiscal 2015, primarily from lower demand from our customers in the oil and gas markets. Revenues from public and private utilities increased 20%, or $16.8 million, to $101.9 million in Fiscal 2016, compared to Fiscal 2015. Revenues from municipal and transit projects decreased 15%, or $8.0 million, to $44.2 million in Fiscal 2016, compared to Fiscal 2015.have also overcomeovercame the operational challenges and cost overruns that occurred in previous years from their expansion and relocation into our new Canadian facility. Additionally, gross profit at our United Kingdom (U.K.)U.K. operations improved due to project execution. The increase in gross profit from our international operations was partially offset by a decline in gross profit from our domestic operations as margins were negatively impacted primarily by our reduced volume as a result of weak oil and gas market conditions and cost overruns related to a large U.S.-based transit project.Research and DevelopmentR&D Tax Credit (R&D Tax Credit) for the previously expired period from January 1, 2015 to September 30, 2015. The effective tax rate in Fiscal 2015 was above the combined U.S. federal and state statutory rate as no tax benefit was recorded against Canadian pre-tax losses due to the $9.0 million valuation allowance recorded in Fiscal 2015, partially offset by the resolution of an IRS audit and the retroactive reinstatement of the R&D Tax Credit for the second through fourth quarters of Fiscal 2014 (see2014. See Note H of the Notes to Consolidated Financial Statements included elsewhere in this Annual Report).
BacklogTwelve Months Ended2015 Compared2017, current assets exceeded current liabilities by 2.9 times and our debt to Twelve Months Endedtotal capitalization was 0.62%.2014Revenue and Gross ProfitRevenues increased 2%, or $14.02017, compared to $97.7 million to $661.9at September 30, 2016. In addition, at September 30, 2017, we had restricted cash of $24.9 million held in Fiscal 2015, primarily due to the increase in domestic revenues. Domestic revenues increased 30%, or $109.6 million, to $474.7 million in Fiscal 2015 primarily duea pledged collateral account related to our production efforts on various large petrochemical projects awarded in Fiscal 2014. International revenues decreased 34%, or $95.6 million, to $187.2 million in Fiscal 2015 primarily due to the substantial completionamended credit agreement. As of several large projects for both the Canadian market and the U.S. export projects. Revenues from commercial and industrial customers increased $50.0 million to $524.5 million in Fiscal 2015. Revenues from public and private utilities decreased $41.9 million to $85.1 million in Fiscal 2015. Revenues from municipal and transit projects increased $5.9 million to $52.2 million in Fiscal 2015. Gross profit decreased 14%, or $17.2 million, to $108.3 million in Fiscal 2015. Gross profitSeptember 30, 2016, we did not have any cash balances classified as a percentage of revenues decreased to 16% in Fiscal 2015 compared to 19% in Fiscal 2014. Our gross profit and gross profit as a percentage of revenues decreased in Fiscal 2015 compared to Fiscal 2014, primarily due to inefficiencies resulting fromrestricted. For further information regarding our production efforts and incremental costs required to maintain our customer’s schedules, as well as the overall mix of project types.Selling, General and Administrative ExpensesSelling, general and administrative expenses decreased by $11.0 million to $76.8 million in Fiscal 2015 compared to Fiscal 2014. Selling, general and administrative expenses, as a percentage of revenues, decreased to 12% in Fiscal 2015 compared to 14% in Fiscal 2014. These decreases were primarily due to a decrease in performance-based compensation, sales commissions, personnel and administrative costs resulting from reductions in force, reduced bad debt expense and overall cost reduction efforts.Restructuring and Separation ExpensesIn Fiscal 2015, we incurred $3.4 million in restructuring and separation costs. Of this, $2.6 million was from separation and severance costs and the remaining $0.8 million resulted from the exit of a Canadian facility lease and the write-off of associated leasehold improvements. Other IncomeWe recorded other income of $2.4 million in Fiscal 2015, of which $2.0 million related to the amortization of the deferred gain from the amended supplycredit agreement, discussed insee Note EF of the Notes to Consolidated Financial Statements, and $0.4 million was from a death benefit received from our company-owned life insurance policy. We recorded other income of $1.5 million in Fiscal 2014, which was solely from the amortization of the deferred gain.Income Tax ProvisionOur provision for income taxes was $13.6 million in Fiscal 2015, compared to $11.1 million in Fiscal 2014. The effective tax rate in Fiscal 2015 was 59% compared to an effective tax rate of 36% for Fiscal 2014. This increase in effective tax rate in Fiscal 2015 was primarily due to the establishment of a valuation allowance against the Canadian net deferred tax assets, partially offset by the resolution of an IRS audit and the retroactive reinstatement of the Federal Research and Development Tax Credit for the second through fourth quarters of Fiscal 2014 (see Note H of the Notes to Consolidated Financial Statements included elsewhere in this Annual Report). The effective tax rate for Fiscal 2014 approximated the combined U.S. federal and state statutory rate as the majority of our income was attributable to the U.S.Income from Continuing OperationsIn Fiscal 2015, we recorded income from continuing operations of $9.4 million, or $0.79 per diluted share, compared to $19.6 million, or $1.62 per diluted share in Fiscal 2014. This reduction to net income was primarily due to a valuation allowance recorded against our Canadian deferred tax assets (as discussed above) and higher domestic productions costs caused by inefficiencies resulting from our production efforts and incremental costs to maintain our customers’ scheduling requirements. These reductions to net income were partially offset by lower selling, general and administrative costs.Income from Discontinued OperationsIn Fiscal 2014, we recorded $9.6 million, or $0.80 per diluted share, of income from discontinued operations which included the gain on the sale. For additional information about this disposition, see Note N of the Notes to Consolidated Financial Statements.BacklogOur backlog includes various projects, some of which are petrochemical, oil and gas construction and transportation infrastructure projects which take a number of months to produce. The order backlog at September 30, 2015 was $441.4 million, compared to $507.1 million at September 30, 2014. New orders placed in Fiscal 2015 totaled $606.8 million, compared to $725.8 million in Fiscal 2014. This decrease in orders was due to reduced capital investments by our customers primarily in oil and gas and petrochemical industries.Liquidity and Capital ResourcesCash and cash equivalents increased to $97.7 million at September 30, 2016, compared to $43.6 million at September 30, 2015. As of September 30, 2016, current assets exceeded current liabilities by 2.6 times and our total debt-to-capitalization ratio was 0.71%.U.S., which expires in December 2018. AsU.S, and as of September 30, 2016,2017, there were no amounts borrowed under this line of credit. We also have a $7.6Total letters of credit outstanding under our U.S. credit facility, which reduce our availability, were $24.1 million at September 30, 2017 and $26.8 million at September 30, 2016. The amount available under the U.S. revolving credit facility in Canada. Atat September 30, 2016, there2017 was no balance outstanding under the Canadian revolving credit facility.$50.9 million. Total long-term debt, obligations, including current maturities, totaled $2.0 million at September 30, 2017, compared to $2.4 million at September 30, 2016, compared to $2.8 million at September 30, 2015. Total letters of credit outstanding were $26.8 million and $21.1 million at September 30, 2016 and 2015, respectively, which reduce our availability under our U.S. credit facility. Amounts available at September 30, 2016 under the U.S. and Canadian revolving credit facilities were $48.3 million and $7.6 million, respectively.2016. For further information regarding our debt, see Notes F and G of the Notes to Consolidated Financial Statements included elsewhere in this Annual Report.$30$36 million of our cash and short-term investments at September 30, 20162017 was held outside of the United StatesU.S. for international operations. It is our intention to indefinitely reinvest all current and future foreign earnings internationally in order to ensure sufficient working capital to support and expand theseour international operations. In the event that we elect to repatriate some or all of the foreign earnings that were previously deemed to be indefinitely reinvested outside the U.S., under current tax laws we would incur additional tax expense upon such repatriation.facilitiesfacility should be sufficient to finance future operating activities, capital improvements and debt repayments for the foreseeable future. We continue to monitor the factors that drive our markets and will continue to strive to maintain our leadership and competitive advantage in the markets we serve while aligning our cost structures with market conditions.million. Duringmillion and in Fiscal 2015, net cash provided by operating activities was $12.9 million and in Fiscal 2014, net cash provided by operating activities was $9.1 million. Cash flow from operations is primarily influenced by the timing of milestone payments from our customers and the payment terms with our suppliers, and is favorably impacted during a down cycle as project milestones are billed and collected as projects are completed. Cash flow from operations declined during Fiscal 2017 compared to Fiscal 2016 primarily as a result of our decrease in operating income and the payments of prior year accrued bonuses and commissions. Cash flow from operations in Fiscal 2017 was favorably impacted by the collection of accounts receivable and the reduction in inventories during our down cycle in project activity. During Fiscal 2016, our cash provided by operations increased over Fiscal 2015 primarily due to our ability to reduce working capital as projects were completed and payments on contracts were received. In Fiscal 2014, we received the $10.0 million payment related to the amended supply agreement discussed in Note E of the Notes to Consolidated Financial Statements included elsewhere in this Annual Report. 20162017 totaled $3.0$3.6 million compared to $34.7$3.0 million and $16.5$34.7 million in Fiscal 2016 and 2015, and 2014, respectively. This decreaseThe reduction in capital spending in Fiscal 2017 and 2016 was in response to our challenging market conditions. The $34.7 million spent in Fiscal 2015 was primarily due to the completion of the expansion of our Canadian facilitiesfacilities. During Fiscal 2017, we invested a net $26.8 million in Fiscal 2015.$17.4$12.7 million in Fiscal 2017, $17.4 million in Fiscal 2016 and $34.9 in Fiscal 2015 and $12.5includes approximately $12 million of dividends paid in each of the three years. The reduction in financing activities from Fiscal 2014. This reduction2015 was primarily due to the completion of our share repurchase program in December 2015, which is discussed below.Repurchase Programrepurchase of shares was funded from cash on hand and cash provided by operating activities. The Repurchase Programshare repurchase program expired on December 31, 2015. As of December 31, 2015, we had purchased 806,018 shares at an aggregate cost of $25 million under the Repurchase Program.this program. The average purchase price per share from inception of the program until its expiration was $31.02.2016,2017, our long-term contractual obligations were limited to debt and leases. The table below details our commitments by type of obligation, including interest if applicable, and the period that the payment will become due (in thousands). Long-Term Debt Obligations Net Operating Lease Obligations Total Less than 1 year $ 419 $ 1,890 $ 2,309 1 to 3 years 1,229 3,580 4,809 3 to 5 years 400 3,510 3,910 More than 5 years — 1,172 1,172 Total long-term contractual obligations $ 2,048 $ 10,152 $ 12,200 2016,2017, the total unrecognized tax benefit related to uncertain tax positions was $1.0$1.2 million. We estimate that none of this will be paid within the next 12 months. However, we believe that it is reasonably possible that within the next 12 months, the total unrecognized tax benefits will decrease by approximately 65%11% due to the expiration of certain statutes of limitations or resolution of tax audits. We are unable to make reasonably reliable estimates regarding the timing of future cash outflows, if any, associated with the remaining unrecognized tax benefits.$30.8$28.5 million as of September 30, 2016, of which $26.8 million reduces our borrowing capacity.
CreditLess than 1 year $ 17,143 1 to 3 years 7,739 More than 3 years 3,619 Total long-term commercial obligations $ 28,501 $233.6$218.8 million that were outstanding at September 30, 2016.2017. Performance and maintenance bonds are primarily used to guarantee our contract performance to our customers.gaspetrochemical markets. Unfavorable long-term oil and gas commodity price levels have caused, and maywe anticipate will continue to cause, our customers to changefurther delay their strategies or delay or cancel planned projects. We believe that sustained lower oil and gas prices from a continued global supply/demand imbalance will continue to negatively impact future orders due to reduced capital spending by our customers.investments. The reduction in available projects across the markets we serve has increased market price pressures during this downward market cycle. This reduction in new business opportunities and increased market price pressures have impacted, and will continue to negatively impact, our backlog, revenues and operating results. It is difficult to predict how longthe duration of the current depressed market cycle will continue. maywe anticipate will continue to be, negatively impacted by factors such as the timing of new order awards, customer approval of final engineering and design specifications and delays in customer construction schedules, all of which have and maywill continue to have, a negative impact on the timing of project execution. Our operating results also have been, and maywill continue to be, impacted by the timing and resolution of change orders, project close-out and resolution of potential contract claims and liquidated damages, all of which could improve or deteriorate gross margins during the period in which these items are resolved with our customers. These factors may result in periods of underutilization of our resources and facilities and negatively impact our ability to cover our fixed costs. If our core oil, gas and petrochemical markets remain depressed, or decline further, our project backlog and revenue could continue to decline and negatively impact our operations. In 2016, in response to the continued adverse effects of the materially lower oilour reduced project backlog and gas commodity prices on our results of operations,depressed market outlook, we took steps these past two fiscal years to reduce our costsoverall cost structure restructure our senior management team and better align our salaried and hourly workforcecosts with future production requirements. However, these effortsWe continue to assess our cost structure, operating performance and service offerings as the oil, gas and petrochemical markets remain challenging and uncertain. During Fiscal 2018, additional actions may not be sufficient to avoid operating losses in the near-term.facilitiesfacility should be sufficient to finance future operating activities, research and development initiatives, capital improvements and debt repayments for the foreseeable future. We continue to monitor the factors that drive our markets and will continue to strive to maintain our leadership and competitive advantage in the markets we serve while aligning our cost structures with market conditions. Occasionally a contract may require that we segment the project into specific deliverables for revenue recognition. Segmenting a contract may result in different interim rates of profitability for each scope of service than if we had recognized revenue on a combined basis.more-likely-than-notmore likely than not that some portion or all of the net deferred tax assets may not be realized. The ultimate realization of net deferred tax assets is dependent on the generation of future taxable income during the periods in which those temporary differences become deductible. Due to the historical Canadian losses, and the losses that we projected at the time of determination, we were required under the more-likely-than-notmore likely than not accounting standard to record a valuation allowance against the Canadian net deferred tax assets because we anticipated that we may not be able to realize the benefits of the net operating loss carryforwards and other deductible differences. Estimates may change as new events occur, estimates of future taxable income during the carryforward period are reduced or increased, additional information becomes available or operating environments change, which may result in a full or partial reversal of the valuation allowance. We will continue to assess the adequacy of the valuation allowance on a quarterly basis. Our judgments and tax strategies are subject to audit by various taxing authorities. included elsewhere in this Annual Report for disclosures related to the valuation allowance recorded in relation to foreign deferred taxes.From time to time, new accounting pronouncements are issued by(the FASB), which are adopted by us as of the specified effective date. Unless otherwise discussed, management believes that the impact of recently issued standards, which are not yet effective, will not have a material impact on our consolidated statements upon adoption.In May 2014, the FASB(FASB) issued a new standard on revenue recognition that supersedes previously issued revenue recognition guidance. This standard provides a five-step approach to be applied to all contracts with customers and requires expanded disclosures about the nature, amount, timing and uncertainty of revenue (and the related cash flows) arising from customer contracts, significant judgments and changes in judgments used in applying the revenue model and the assets recognized from costs incurred to obtain or fulfill aguidancestandard is now effective for fiscal years, and interim periods within those years, beginning after December 15, 2017, which would be our fiscal year ending September 30, 2019. The standard permitsWe plan to use the use of either the full retrospective or modified retrospective transition method; therefore,basis upon adoption. While we are still evaluating the effect thatpotential impact of this new guidance will have on our consolidated financial statements and related disclosures. We have not yet selected a transition method nor have we determined the effect of the standard on our ongoing financial reporting.The adoption ofWe are still evaluating this guidance isnew amendment, but we do not expectedexpect it to have a material impact on our consolidated financial position or results of operations.standardtopic is effective for fiscal years beginning after December 15, 2018, including interim periods within those fiscal years. Thisyears, which would be our fiscal year ending September 30, 2020. We are currentlystill evaluating the potential impact of this guidance on our pending adoptionfinancial statements. Our future obligations under operating leases as of September 30, 2017 are summarized in Note G of the Notes to Consolidated Financial Statements.standard,guidance on stock-based compensation, which includes amendments to existing guidance for employee share-based payment accounting. We elected to early adopt this new guidance in the first quarter of Fiscal 2017. Beginning Fiscal 2017, stock-based compensation excess tax benefits or deficiencies are reflected in the Consolidated Statement of Operations as a component of income taxes, whereas they were previously recorded in additional paid-in capital in the Consolidated Statement of Stockholders’ Equity. Additionally, we will now present excess tax benefits as an operating activity in the Consolidated Statements of Cash Flows. These changes have been adopted prospectively. Finally, we will continue to account for forfeitures as they occur, rather than estimate expected forfeitures.itthem to have a material impact on our consolidated financial position or results of operations.March 2016,January 2017, the FASB issued new guidance on stock-based compensation, which includes amendmentsgoodwill impairment intended to existing guidancesimplify the testing for employee share-based payment accounting. The amendments requiregoodwill impairment by the recognitionelimination of Step 2 in the income statement of the income tax effects of vested determination on whether goodwill should be considered impaired. The annual and/or settled awards. The amendments also allow for the employerinterim assessments are still required to repurchase more of an employee’s shares for tax withholding purposes and not classify the award as a liability that requires valuation on a mark-to-market basis. In addition, the amendments allow for a policy election to account for forfeitures as they occur rather than on an estimated basis. For public companies, the amendments in this standard arebe completed. This guidance is effective for annual periodsfiscal years (including interim periods) beginning after December 15, 2016, including interim periods within those annual periods. This would be our fiscal year ending September 30, 2018. Early2019. The adoption of this guidance is permitted in any interim or annual period. We will early adopt in Fiscal 2017, but it will not expected to have a material impact on our consolidated financial position or results of operations.2016,2017, our realized foreign exchange gains were $0.8$0.2 million and are included in selling, general and administrative expenses in the Consolidated Statements of Operations.$23.8$18.8 million as of September 30, 2016,2017, a slight increasedecrease from $22.4$23.8 million at September 30, 2015.2016. This improvement was primarily a result of fluctuations in the currency exchange rates for the Canadian Dollar and British Pound Sterling as we remeasured the foreign operations of those divisions. During Fiscal 2016,2017, the U.S. Dollar improveddeteriorated relative to these foreign currencies and, as a result, our accumulated other comprehensive losses increased.Index to Consolidated Financial Statements 26272829303132:atas of September 30, 20162017 and 2015, 2016and the results of their operations and their cash flows for each of the three years in the period ended September 30, 2016 2017in conformity with accounting principles generally accepted in the United States of America. Also in our opinion, the Company maintained, in all material respects, effective internal control over financial reporting as of September 30, 2016, 2017,based on criteria established in Internal Control - Integrated Framework 2013 (2013)issued by the Committee of Sponsoring Organizations of the Treadway Commission (COSO). The Company's management is responsible for these financial statements, for maintaining effective internal control over financial reporting and for its assessment of the effectiveness of internal control over financial reporting, included in Management'sManagement’s Report on Internal Control over Financial Reporting. Our responsibility is to express opinions on these financial statements and on the Company's internal control over financial reporting based on our integrated audits. We conducted our audits in accordance with the standards of the Public Company Accounting Oversight Board (United States). Those standards require that we plan and perform the audits to obtain reasonable assurance about whether the financial statements are free of material misstatement and whether effective internal control over financial reporting was maintained in all material respects. Our audits of the financial statements included examining, on a test basis, evidence supporting the amounts and disclosures in the financial statements, assessing the accounting principles used and significant estimates made by management, and evaluating the overall financial statement presentation. Our audit of internal control over financial reporting included obtaining an understanding of internal control over financial reporting, assessing the risk that a material weakness exists, and testing and evaluating the design and operating effectiveness of internal control based on the assessed risk. Our audits also included performing such other procedures as we considered necessary in the circumstances. We believe that our audits provide a reasonable basis for our opinions.7, 20166, 2017 September 30, 2017 2016 ASSETS Current Assets: Cash and cash equivalents $ 68,359 $ 97,720 Short-term investments 26,829 — Restricted cash 15,104 — Accounts receivable, less allowance for doubtful accounts of $179 and $811 53,852 101,048 Costs and estimated earnings in excess of billings on uncompleted contracts 51,554 66,106 Inventories 18,448 26,521 Income taxes receivable 8,222 1,713 Deferred income taxes 3,539 4,006 Prepaid expenses 3,701 4,569 Other current assets 463 2,457 Total Current Assets 250,071 304,140 Property, plant and equipment, net 139,420 144,977 Restricted cash 9,747 — Goodwill and intangible assets, net 1,719 2,059 Other assets 13,800 11,340 Deferred income taxes 229 — Total Assets $ 414,986 $ 462,516 LIABILITIES AND STOCKHOLDERS' EQUITY Current Liabilities: Current maturities of long-term debt $ 400 $ 400 Income taxes payable 1,219 1,459 Accounts payable 33,269 34,985 Accrued salaries, bonuses and commissions 14,984 22,550 Billings in excess of costs and estimated earnings on uncompleted contracts 26,166 43,974 Accrued product warranty 3,174 4,639 Other accrued expenses 5,860 8,212 Deferred credit ─ short term (Note E) 507 2,029 Total Current Liabilities 85,579 118,248 Long-term debt, net of current maturities 1,600 2,000 Deferred compensation (Note I) 5,314 4,840 Deferred income taxes — 138 Other long-term liabilities 1,197 1,466 Deferred credit ─ long term (Note E) — 507 Total Liabilities 93,690 127,199 Commitments and Contingencies (Note G) Stockholders' Equity: Preferred stock, par value $.01; 5,000,000 shares authorized; none issued — — Common stock, par value $.01; 30,000,000 shares authorized; 12,234,656 and 12,199,511 shares issued, respectively 122 122 Additional paid-in capital 54,329 52,003 Retained earnings 310,598 331,959 Treasury stock, 806,018 shares at cost (24,999 ) (24,999 ) Accumulated other comprehensive loss (18,754 ) (23,768 ) Total Stockholders' Equity 321,296 335,317 Total Liabilities and Stockholders' Equity $ 414,986 $ 462,516 Year Ended September 30, 2017 2016 2015 Revenues $ 395,911 $ 565,243 $ 661,858 Cost of goods sold 345,142 459,038 553,597 Gross profit 50,769 106,205 108,261 Selling, general and administrative expenses 61,524 74,924 76,801 Research and development expenses 6,906 6,731 6,980 Amortization of intangible assets 355 352 435 Restructuring and separation expenses 1,322 8,441 3,397 Operating income (loss) (19,338 ) 15,757 20,648 Other income (See Note E) (2,029 ) (2,029 ) (2,402 ) Interest expense 168 149 145 Interest income (558 ) (156 ) (86 ) Income (loss) before income taxes (16,919 ) 17,793 22,991 Income tax provision (benefit) (7,433 ) 2,283 13,552 Net income (loss) $ (9,486 ) $ 15,510 $ 9,439 Earnings (loss) per share: Basic $ (0.83 ) $ 1.36 $ 0.80 Diluted $ (0.83 ) $ 1.36 $ 0.79 Weighted average shares: Basic 11,453 11,400 11,869 Diluted 11,453 11,431 11,908 Dividends per share $ 1.04 $ 1.04 $ 1.04 Year Ended September 30, 2017 2016 2015 Net income (loss) $ (9,486 ) $ 15,510 $ 9,439 Foreign currency translation adjustments 4,822 (928 ) (16,104 ) Postretirement benefit adjustment, net of tax 192 (439 ) 206 Comprehensive income (loss) $ (4,472 ) $ 14,143 $ (6,459 ) Common Stock Additional
Paid-in
Capital Retained
Earnings Treasury Stock Accumulated
Other
Comprehensive
Income/(Loss) Shares Amount Shares Amount Total Balance, September 30, 2014 12,031 $ 120 $ 46,267 $ 331,213 — $ — $ (6,503 ) $ 371,097 Net income — — — 9,439 — — — 9,439 Foreign currency translation adjustments — — — — — — (16,104 ) (16,104 ) Stock-based compensation 53 — 3,171 — — — — 3,171 Excess tax benefit from share-based compensation — — (191 ) — — — — (191 ) Shares withheld in lieu of employee tax withholding — — (740 ) — — — — (740 ) Issuance of restricted stock 16 1 — — — — — 1 Purchase of treasury shares — — — — (670 ) (21,259 ) — (21,259 ) Dividends paid — — — (12,358 ) — — — (12,358 ) Postretirement benefit adjustment, net of tax of $123 — — — — — — 206 206 Balance, September 30, 2015 12,100 $ 121 $ 48,507 $ 328,294 (670 ) $ (21,259 ) $ (22,401 ) $ 333,262 Net income — — — 15,510 — — — 15,510 Foreign currency translation adjustments — — — — — — (928 ) (928 ) Stock-based compensation 81 — 4,883 — — — — 4,883 Excess tax benefit from share-based compensation — — (387 ) — — — — (387 ) Shares withheld in lieu of employee tax withholding — — (1,000 ) — — — — (1,000 ) Issuance of restricted stock 18 1 — — — — — 1 Purchase of treasury shares — — — — (136 ) (3,740 ) — (3,740 ) Dividends paid — — — (11,845 ) — — — (11,845 ) Postretirement benefit adjustment, net of tax of $(237) — — — — — — (439 ) (439 ) Balance, September 30, 2016 12,199 $ 122 $ 52,003 $ 331,959 (806 ) $ (24,999 ) $ (23,768 ) $ 335,317 Net loss — — — (9,486 ) — — — (9,486 ) Foreign currency translation adjustments — — — — — — 4,822 4,822 Stock-based compensation 18 — 2,724 — — — — 2,724 Shares withheld in lieu of employee tax withholding — — (398 ) — — — — (398 ) Issuance of restricted stock 17 — — — — — — — Dividends paid — — — (11,875 ) — — — (11,875 ) Postretirement benefit adjustment, net of tax of $103 — — — — — — 192 192 Balance, September 30, 2017 12,234 $ 122 $ 54,329 $ 310,598 (806 ) $ (24,999 ) $ (18,754 ) $ 321,296 Year Ended September 30, 2017 2016 2015 Operating Activities: Net income (loss) $ (9,486 ) $ 15,510 $ 9,439 Adjustments to reconcile net income (loss) to net cash provided by operating activities: Depreciation 12,400 12,979 13,120 Amortization 355 352 435 Stock-based compensation 2,724 4,883 3,171 Excess tax benefit from stock-based compensation — 387 191 Bad debt expense/(recovery) (160 ) 187 (29 ) Deferred income tax expense 100 2,330 10,521 Gain on amended supply agreement (2,029 ) (2,029 ) (2,029 ) Cash received from amended supply agreement 2,333 2,333 2,333 Changes in operating assets and liabilities: Accounts receivable 47,983 369 391 Costs and billings in excess of estimates on uncompleted contracts (3,270 ) 39,612 (17,430 ) Inventories 8,213 6,159 (572 ) Income taxes (6,758 ) (195 ) (1,647 ) Prepaid expenses and other current assets 453 861 4,222 Accounts payable (2,417 ) (11,658 ) (4,992 ) Accrued liabilities (11,676 ) 3,927 (3,373 ) Other, net (1,950 ) (1,101 ) (833 ) Net cash provided by operating activities 36,815 74,906 12,918 Investing Activities: Purchases of property, plant and equipment (3,636 ) (3,044 ) (34,719 ) Proceeds from sale of property, plant and equipment 12 187 112 Purchases of short-term investments (60,018 ) — — Maturities of short-term investments 33,189 — — Changes in restricted cash (24,851 ) — — Net cash used in investing activities (55,304 ) (2,857 ) (34,607 ) Financing Activities: Payments on industrial development revenue bonds (400 ) (400 ) (400 ) Excess tax benefit from stock-based compensation — (387 ) (191 ) Shares withheld in lieu of employee tax withholding (398 ) (1,000 ) (740 ) Purchase of treasury shares — (3,740 ) (21,259 ) Dividends paid (11,875 ) (11,845 ) (12,358 ) Net cash used in financing activities (12,673 ) (17,372 ) (34,948 ) Net increase (decrease) in cash and cash equivalents (31,162 ) 54,677 (56,637 ) Effect of exchange rate changes on cash and cash equivalents 1,801 (526 ) (2,912 ) Cash and cash equivalents, beginning of period 97,720 43,569 103,118 Cash and cash equivalents, end of period $ 68,359 $ 97,720 $ 43,569 corporationcompany was the successor to a company founded by William E. Powell in 1947, which merged into the Company in 1977. Our major subsidiaries, all of which are wholly owned, include: Powell Electrical Systems, Inc.; Powell (UK) Limited; Powell Canada Inc. and Powell Industries International, B.V. and Fiscal 2014 used throughout these Notes to Consolidated Financial Statements relate to our fiscal years ended September 30, 2017, 2016 and 2015, and 2014, respectively.In January 2014, we sold our wholly owned subsidiary Transdyn Inc. (Transdyn), which was reported in our Process Controls business segment. We have presented the results of these operations as income from discontinued operations, net of tax, in the Fiscal 2014 consolidated statement of operations. All current and historical financial information presented exclude the financial information for Transdyn or presents it as discontinued operations where applicable. For more information about this disposition, see Note N.goodwill and other intangible assets, self-insurance, warranty accruals and income taxes. The amounts recorded for insurance claims, warranties, legal, income taxes, impairment of long-lived assets (when applicable) and other contingent liabilities require judgments regarding the amount of expenses that will ultimately be incurred. We base our estimates on historical experience and on various other assumptions, as well as the specific circumstances surrounding these contingent liabilities, in evaluating the amount of liability that should be recorded. Additionally, the recognition of deferred tax assets requires estimates related to future income and other assumptions regarding timing and future profitability. Estimates may change as new events occur, additional information becomes available or operating environments change. Actual results may differ from our estimates.cash on hand,time deposits with banks and highly liquid investments with original maturities of three months or less.more. Year Ended September 30, 2017 2016 2015 Cash paid (received) during the period for: Interest paid, net of interest income $ (384 ) $ 4 70 Income taxes paid, net of refunds (764 ) (352 ) 2,298 Non-cash capital expenditures 634 221 147 the Canadian Prime Rate or the bank’s prime rate.20162017 and 2015,2016, accounts receivable included retention amounts of $2.7$2.1 million and $5.4$2.7 million, respectively. Retention amounts are in accordance with applicable provisions of contracts and become due upon completion of contractual requirements. All of theretained amount at September 30, 2016,2017, is expected to be collected in the next fiscal year.GoodwillGoodwill is evaluated for impairment annually, or immediately if conditions indicate that impairment could exist. The evaluation requires a two-step impairment test to identify potential goodwill impairment and measure the amount of a goodwill impairment loss. The first step of the test compares the fair value of a reporting unit with its carrying amount, including goodwill. If the carrying amount of a reporting unit exceeds its fair value, the second step of the goodwill impairment test is performed to measure the amount of the impairment loss. Both steps of the goodwill impairment testing involve significant estimates.Intangible AssetsThe costs of intangible assets with determinable useful lives are amortized over their estimated useful lives. Intangible assets with determinable lives are reviewed for impairment in a similar method as property, plant and equipment as discussed above. For additional information regarding our intangible assets, see Note E herein.more-likely-than-notmore likely than not that some portion or all of the net deferred tax assets may not be realized. The ultimate realization of net deferred tax assets is dependent on the generation of future taxable income during the periods in which those temporary differences become deductible. Due to the historical Canadian losses, and the losses that we projected at the time of determination, we were required under the more-likely-than-not accounting standard to record a valuation allowance against the Canadian net deferred tax assets because we anticipated that we may not be able to realize the benefits of the net operating loss carryforwards and other deductible differences. Estimates may change as new events occur, estimates of future taxable income during the carryforward period are reduced or increased, additional information becomes available or operating environments change, which may result in a full or partial reversal of the valuation allowance. We will continue to assess the adequacy of the valuation allowance on a quarterly basis. Our judgments and tax strategies are subject to audit by various taxing authorities.$7.0 million and $7.6$7.0 million in Fiscal 2017, 2016 and 2015, and 2014, respectively.that must beis recognized as income tax expense or benefit in the Consolidated Statement of Operations. Cash paid when directly in equity are consideredwithholding shares on an employee's behalf for tax withholding purposes is classified as a financing activity. We account for forfeitures as they occur, rather than operating cash flow activities.estimate expected forfeitures.From time to time, new accounting pronouncements are issued by(the FASB), which are adopted by us as of the specified effective date. Unless otherwise discussed, management believes that the impact of recently issued standards, which are not yet effective, will not have a material impact on our consolidated statements upon adoption.In May 2014, the FASB(FASB) issued a new standard on revenue recognition that supersedes previously issued revenue recognition guidance. This standard provides a five-step approach to be applied to all contracts with customers and requires expanded disclosures about the nature, amount, timing and uncertainty of revenue (and the related cash flows) arising from customer contracts, significant judgments and changes in judgments used in applying the revenue model and the assets recognized from costs incurred to obtain or fulfill a contract. This guidancestandard is now effective for fiscal years, and interim periods within those years, beginning after December 15, 2017, which would be our fiscal year ending September 30, 2019. The standard permitsWe plan to use the use of either the full retrospective or modified retrospective transition method; therefore,basis upon adoption. While we are still evaluating the effect thatpotential impact of this new guidance will have on our consolidated financial statements and related disclosures. We have not yet selected a transition method nor have we determined the effect of the standard on our ongoing financial reporting.The adoption ofWe are still evaluating this guidance isnew amendment, but we do not expectedexpect it to have a material impact on our consolidated financial position or results of operations.standardtopic is effective for fiscal years beginning after December 15, 2018, including interim periods within those fiscal years. Thisyears, which would be our fiscal year ending September 30, 2020. We are currentlystill evaluating the potential impact of this guidance on our pending adoptionfinancial statements. Our future obligations under operating leases as of September 30, 2017 are summarized in Note G of the Notes to Consolidated Financial Statements.standard,guidance on stock-based compensation, which includes amendments to existing guidance for employee share-based payment accounting. We elected to early adopt this new guidance in the first quarter of Fiscal 2017. Beginning Fiscal 2017, stock-based compensation excess tax benefits or deficiencies are reflected in the Consolidated Statement of Operations as a component of income taxes, whereas they were previously recorded in additional paid-in capital in the Consolidated Statement of Stockholders’ Equity. Additionally, we will now present excess tax benefits as an operating activity in the Consolidated Statements of Cash Flows. These changes have been adopted prospectively. Finally, we will continue to account for forfeitures as they occur, rather than estimate expected forfeitures.itthem to have a material impact on our consolidated financial position or results of operations.March 2016,January 2017, the FASB issued new guidance on stock-based compensation, which includes amendmentsgoodwill impairment intended to existing guidancesimplify the testing for employee share-based payment accounting. The amendments requiregoodwill impairment by the recognitionelimination of Step 2 in the income statement of the income tax effects of vested determination on whether goodwill should be considered impaired. The annual and/or settled awards. The amendments also allow for the employerinterim assessments are still required to repurchase more of an employee’s shares for tax withholding purposes and not classify the award as a liability that requires valuation on a mark-to-market basis. In addition, the amendments allow for a policy election to account for forfeitures as they occur rather than on an estimated basis. For public companies, the amendments in this standard arebe completed. This guidance is effective for annual periodsfiscal years (including interim periods) beginning after December 15, 2016, including interim periods within those annual periods. This would be our fiscal year ending September 30, 2018. Early2019. The adoption of this guidance is permitted in any interim or annual period. We will early adopt in Fiscal 2017, but it will not expected to have a material impact on our consolidated financial position or results of operations.restrictiverestricted stock units, as prescribed by the FASB guidance on earnings per share.2015 and 20142015 (in thousands, except per share data): Year Ended September 30, 2017 2016 2015 Numerator: Net income (loss) $ (9,486 ) $ 15,510 $ 9,439 Denominator: Weighted average basic shares 11,453 11,400 11,869 Dilutive effect of restricted stock units — 31 39 Weighted average diluted shares with assumed conversions 11,453 11,431 11,908 Net earnings (loss) per share: Basic earnings (loss) per share $ (0.83 ) $ 1.36 $ 0.80 Diluted earnings (loss) per share $ (0.83 ) $ 1.36 $ 0.79 September 30, 2017 2016 Balance at beginning of period $ 811 $ 746 Bad debt expense (recovery) (160 ) 187 Uncollectible accounts written off, net of recoveries (472 ) (120 ) Change due to foreign currency translation — (2 ) Balance at end of period $ 179 $ 811 September 30, 2017 2016 Raw materials, parts and subassemblies $ 22,100 $ 29,639 Work-in-progress 600 996 Provision for excess and obsolete inventory (4,252 ) (4,114 ) Total inventories $ 18,448 $ 26,521 September 30, 2017 2016 Costs incurred on uncompleted contracts $ 987,164 $ 1,088,921 Estimated earnings 316,970 350,125 1,304,134 1,439,046 Less: Billings to date (1,278,746 ) (1,416,914 ) Net underbilled position $ 25,388 $ 22,132 Included in the accompanying balance sheets under the following captions: Costs and estimated earnings in excess of billings on uncompleted contracts – underbilled $ 51,554 $ 66,106 Billings in excess of costs and estimated earnings on uncompleted contracts – overbilled (26,166 ) (43,974 ) Net underbilled position $ 25,388 $ 22,132 September 30, Range of 2017 2016 Asset Lives Land $ 22,441 $ 22,107 — Buildings and improvements 121,960 119,512 3 - 39 Years Machinery and equipment 106,113 103,268 3 - 15 Years Furniture and fixtures 3,806 3,806 3 - 10 Years Construction in process 1,749 1,009 — $ 256,069 $ 249,702 Less: Accumulated depreciation (116,649 ) (104,725 ) Total property, plant and equipment, net $ 139,420 $ 144,977 20162017 or September 30, 2015.2016. Depreciation expense from continuing operations, including the depreciation of capital leases when applicable, was $12.4 million, $13.0 million $13.1 million and $11.4$13.1 million for fiscal years 2017, 2016, and 2015, and 2014, respectively. September 30, 2017 2016 Balance at beginning of period $ 4,639 $ 4,930 Increase to warranty expense 1,806 4,249 Deduction for warranty charges (3,314 ) (4,464 ) Change due to foreign currency translation 43 (76 ) Balance at end of period $ 3,174 $ 4,639 6 to 7 years. We evaluate goodwill and intangible assets for impairment annually, or immediately if qualitative conditions indicate that an impairment could exist.its estimated useful life. No impairment expense has been recorded for the last three fiscal years.20162017 and 20152016 consisted of the following (in thousands): September 30, 2017 September 30, 2016 Purchased technology $ 11,749 $ (11,033 ) $ 716 $ 11,749 $ (10,693 ) $ 1,056 2015 and 2014,2015, was $0.4 million, $0.4 million and $0.8 million, respectively.Years Ended September 30, Total 2018 $ 204 2019 176 2020 176 2021 160 2022 — In connection with the acquisition, weWe recorded an intangible asset related to this supply agreement. On December 30, 2013, we and GE amended the supply agreement to allow GE to manufacture similar Products for sale immediately and allow them to begin purchasing Products from other suppliers beginning December 31, 2014. In return, GE paid us $10 million upon execution of the amended supply agreement and agreed to pay an additional $7 million over three years, subject to certain conditions. As of September 30, 2016, the remainingbeginning March 2015. The final balance of $2.3 million is classified as other current assets.was received in April 2017. We wrote off the intangible asset related to the original supply agreement and recorded a deferred credit in the amount of $8.1 million at December 31, 2013, the amount by which the total proceeds from GE exceeded the unamortized balance of our intangible asset. We are amortizing this deferred credit over the four-year life of the agreement and have recognized gains in other income of $2.0 million for both theall three fiscal years ended September 30, 2017, 2016 and 2015. September 30, 2017 2016 Industrial development revenue bonds $ 2,000 $ 2,400 Less: current portion (400 ) (400 ) Total long-term debt $ 1,600 $ 2,000 2016,2017, were as follows (in thousands):
Debt
MaturitiesYear Ending September 30, 2018 $ 400 2019 400 2020 400 2021 400 2022 400 Total long-term debt maturities $ 2,000 1.75%1.25%, as determined by our consolidated leverage ratio, is added to the applicable rate.$26.8$24.1 million for our outstanding letters of credit at September 30, 2016.2016.2017. Amounts available under the U.S. Revolver were $48.2$50.9 million at September 30, 2016.2017. The U.S. Revolver expires on December 31, 2018.The U.S. Revolver contains certain restrictive and maintenance-type covenants, such as restrictions on the amount of capital expenditures allowed. It also contains financial covenants defining various financial measures and the levels of these measures with which we must comply, as well as a “material adverse change” clause. A “material adverse change” is defined as a material change in our operations, business, properties, liabilities or condition (financial or otherwise) or a material impairment of our ability to perform our obligations under our credit agreements.subsidiary.subsidiary, as well as by the pledged cash collateral account during any Cash Collateral Period. The U.S. Revolver provides for customary events of default and carries cross-default provisions with other existing debt agreements. If an event of default (as defined in the U.S. Revolver) occurs and is continuing, on the terms and subject to the conditions set forth in the U.S. Revolver, amounts outstanding under the U.S. Revolver may be accelerated and may become immediately due and payable. As of September 30, 2016,2017, we were in compliance with all of the financial covenants of the U.S. Revolver.Canadian RevolverWe have a $7.6 million credit agreement with a major international bank in Canada (the Canadian Revolver) to provide working capital support and letters of credit for our operations in Canada. The Canadian Revolver provides for the issuance of letters of credit which reduce the amounts that may be borrowed under this revolver. There were no outstanding letters of credit at September 30, 2016. The interest rate for amounts outstanding under the Canadian Revolver is a floating interest rate based upon either the Canadian Prime Rate, or the lender’s Bankers’ Acceptance Rate. Once the applicable rate is determined, a margin of 0.50% to 1.75%, as determined by our consolidated leverage ratio, is added to the applicable rate. The Canadian Revolver expires on March 31, 2018.There were no borrowings outstanding under the Canadian Revolver as of September 30, 2016 and amounts available under the Canadian Revolver were $7.6 million at September 30, 2016. The principal financial covenants are consistent with those described in our U.S. Revolver. The Canadian Revolver contains a “material adverse effect” clause. A “material adverse effect” is defined as a material change in the operations of Powell or Powell Canada Inc. in relation to our financial condition, property, business operations, expected net cash flows, liabilities or capitalization.The Canadian Revolver is secured by the assets of our Canadian operations and provides for customary events of default and carries cross-default provisions with our existing debt agreements. If an event of default (as defined in the Canadian Revolver) occurs and is continuing, per the terms and subject to the conditions set forth in the Canadian Revolver, amounts outstanding under the Canadian Revolver may be accelerated and may become immediately due and payable. As of September 30, 2016, we were in compliance with all of the financial covenants of the Canadian Revolver.2016.2017. While the Bonds mature in 2021, the reimbursement agreement requires annual redemptions of $0.4 million that commenced on October 25, 2002. A sinking fund is used for the redemption of the Bonds. The Bonds bear interest at a floating rate determined1.02%1.19% as of September 30, 2016.2016,2017, the future minimum annual rental commitments and expected receipts under non-cancelable operating leases having terms in excess of one year were as follows (in thousands):
LeasesYears Ended September 30, Operating Leases Payments Operating Sublease Income 2018 $ 3,420 $ (1,530 ) 2019 2,973 (1,292 ) 2020 1,937 (39 ) 2021 1,767 — 2022 1,743 — Thereafter 1,172 — Total lease commitments $ 13,012 $ (2,861 ) for all operating leasesand sublease income from third parties was $3.5 million, $4.0 million and $3.9 million for Fiscal 2016, 2015 and 2014, respectively. In Fiscal 2015, we exited one of our previously occupied leased facilities in Acheson, Alberta, Canada. The lease does not expire until October 2019; however, we have sublet that facility through the remaining term of the lease. In Fiscal 2014, we also exited one of our previously occupied leased facilities in Edmonton, Alberta, Canada. This lease does not expire until July 2023; however, we have sublet that facility through July 2019. Year Ended September 30, 2017 2016 2015 Rental expense $ 3,734 $ 4,469 $ 4,907 Sublease income from third parties (1,389 ) (986 ) (947 ) $26.8$24.1 million as of September 30, 2016.2017. We also had performance and maintenance bonds totaling $233.6$218.8 million that were outstanding, with additional bonding capacity of $516.4$531.2 million available, at September 30, 2016.$9.1$6.7 million facility agreement (Facility Agreement) between Powell (UK) Limited and a large international bank. This Facility Agreement provides Powell (UK) Limited the ability to enter into bank guarantees as well as forward exchange contracts and currency options. At September 30, 2016,2017, we had outstanding guarantees totaling $4.1$4.4 million under this Facility Agreement and amounts available under this Facility Agreement were $5.0$2.3 million. This facility expiredexpires in November 2016.May 2018. The Facility Agreement provides for financial covenants and customary events of default, and carries cross-default provisions with our U.S. Revolver. If an event of default (as defined in the Facility Agreement) occurs and is continuing, per the terms and subject to the conditions set forth therein, obligations outstanding under the Facility Agreement may be accelerated and may become or be declared immediately due and payable. As of September 30, 2016,2017, we were in compliance with all of the financial covenants of the Facility Agreement.2016,2017, our exposure to possible liquidated damages is $2.5was $2.3 million, of which approximately $1.5$1.2 million iswas probable. Based on our actual or projected failure to meet these various contractual commitments, $1.5$1.2 million has been recorded as a reduction to revenue. We will attempt to obtain change orders, contract extensions or accelerate project completion which may resolve the potential for any unaccrued liquidated damage. Should we fail to achieve relief on some or all of these contractual obligations, we could be required to pay additional liquidated damages, which could negatively impact our future operating results. Year Ended September 30, 2017 2016 2015 Current: Federal $ (7,782 ) $ (1,395 ) $ 2,638 State (101 ) 449 699 Foreign 350 899 (306 ) (7,533 ) (47 ) 3,031 Deferred: Federal 392 1,923 3,296 State (515 ) 47 420 Foreign 223 360 6,805 100 2,330 10,521 Total income tax provision (benefit) $ (7,433 ) $ 2,283 $ 13,552 Year Ended September 30, 2017 2016 2015 U.S. $ (19,932 ) $ 5,087 $ 33,549 Other than U.S. 3,013 12,706 (10,558 ) Income (loss) before income taxes $ (16,919 ) $ 17,793 $ 22,991 Year Ended September 30, 2017 2016 2015 Statutory rate 35 % 35 % 35 % State income taxes, net of federal benefit 2 2 3 Research and development credit 9 (8 ) (21 ) Foreign rate differential 2 (8 ) 4 Domestic production activities deduction — — (3 ) Foreign valuation allowance 2 (11 ) 43 NOL carryback impact on deductions (4 ) — — Other (2 ) 3 (2 ) Effective rate 44 % 13 % 59 % for income taxes(benefit) reflects an effective tax rate on pre-tax earnings of 44% in Fiscal 2017 compared to 13% and 59% in Fiscal 2016 comparedand 2015, respectively. The effective tax rate for Fiscal 2017 was favorably impacted by the lower tax rate in the U.K., the relative amounts of income/loss recognized in various jurisdictions, the utilization of net operating loss carryforwards in Canada that have been fully reserved with a valuation allowance, as well as $0.9 million of discrete items recognized during the year, primarily related to 59%the Research and 36% in Fiscal 2015 and 2014, respectively.Development Tax Credit (R&D Tax Credit). The effective tax rate for Fiscal 2016 was favorably impacted by the statutory tax rates in the United Kingdom (U.K.)U.K. and Canada and the relative amounts of income earned in those jurisdictions, as well as the utilization of net operating loss carryforwards in Canada that have been fully reserved with a valuation allowance.mentioned above. Additionally, the effective tax rateResearch and DevelopmentR&D Tax Credit (R&D Tax Credit) for the previously expired period fromOn December 18, 2015, the “Protecting Americans from Tax Hikes Act of 2015” was enacted which retroactively reinstated and made permanent the R&D Tax Credit. The effective tax rate for Fiscal 2015 was adversely impacted by the establishment of a valuation allowance against our Canadian deferred tax assets during the second quarter of Fiscal 2015. This was partially offset by the release of a $4.1 million FIN 48 reserve related to the R&D Tax Credit upon closing an IRS audit. We also recorded a $0.6 million discrete item in Fiscal 2015 that was also related to the retroactive reinstatement of the R&D Tax Credit referred to above. The effective tax rate for Fiscal 2014 approximated the combined U.S. federal and state statutory rate.$21.5$22.2 million of undistributed earnings of our foreign subsidiaries because of management’s intent to indefinitely reinvest such earnings. Upon distribution of these earnings in the form of dividends or otherwise, we may be subject to U.S. income taxes and foreign withholding taxes. It is not practical, however, to estimate the amount of taxes that may be payable on the eventual remittance of these earnings.20112012 – 2015,2016, United Kingdom 20142015 – 20152016 and the United States 2013, 2015 and 2015. September 30, 2017 2016 Current deferred income taxes: Gross assets $ 3,978 $ 4,384 Gross liabilities and valuation allowance (439 ) (378 ) Net current deferred income tax asset 3,539 4,006 Noncurrent deferred income taxes: Gross assets 18,559 16,170 Gross liabilities and valuation allowance (18,330 ) (16,308 ) Net noncurrent deferred income tax asset (liability) 229 (138 ) Net deferred income tax asset $ 3,768 $ 3,868 At September 30, 2016, we had $39 million of gross foreign net operating loss carryforwards, the majority of which are subject to a September 30, 2017 2016 Deferred Tax Assets: Net operating income/loss $ 11,823 $ 10,453 Uniform capitalization and inventory 1,432 1,596 Deferred compensation 2,009 1,853 Stock-based compensation 1,094 760 Reserve for accrued employee benefits 1,208 1,679 Warranty accrual 892 1,388 Goodwill 64 345 Postretirement benefits liability 264 503 Allowance for doubtful accounts 14 220 Accrued legal 435 294 Credit carryforwards 3,258 1,292 Other 44 171 Deferred tax assets 22,537 20,554 Deferred Tax Liabilities: Depreciation and amortization (10,002 ) (8,247 ) Deferred tax liabilities (10,002 ) (8,247 ) Less: valuation allowance (8,767 ) (8,439 ) Net deferred tax asset $ 3,768 $ 3,868 20-year carryforward period and will begin to expire in 2031. more-likely-than-notmore likely than not that some portion or all of the net deferred tax assets may not be realized. The ultimate realization of net deferred tax assets is dependent on the generation of future taxable income during the periods in which those temporary differences become deductible. Due to the historical Canadian losses, and the losses that we projected at the time of determination, we were required under the more-likely-than-not accounting standard to record a valuation allowance against the Canadian net deferred tax assets because we anticipated that we may not be able to realize the benefits of the net operating loss carryforwards and other deductible differences.Balance at September 30, 2014 $ 903 Charged to cost and expenses 10,048 Charged to other accounts (895 ) Balance at September 30, 2015 $ 10,056 Charged to cost and expenses (1,934 ) Charged to other accounts 317 Balance at September 30, 2016 $ 8,439 Charged to cost and expenses (260 ) Charged to other accounts 588 Balance at September 30, 2017 $ 8,767 Year Ended September 30, 2017 2016 2015 Balance at beginning of period $ 1,046 $ 784 $ 4,026 Increases related to tax positions taken during the current period 179 293 954 Increases related to tax positions taken during a prior period 338 — 2 Decreases related to expiration of statute of limitations — (31 ) (49 ) Decreases related to settlement with taxing authorities (344 ) — (4,149 ) Balance at end of period $ 1,219 $ 1,046 $ 784 20162017 was not material.32%11%. Although timing of the resolution and/or closure of audits is uncertain, we believe it is probable that our unrecognized tax benefits could decrease by approximately 33% in the next 12 months due to an audit resolution.$5.9 million and $5.3$5.9 million in Fiscal 2017, 2016 and 2015, and 2014, respectively.2016.2017. Total assets held by the trustee and deferred compensation liabilities were $5.8$6.4 million and $4.4$5.0 million, respectively, at September 30, 2016. $0.4$0.3 million is recorded in deferred compensation related to this executive benefit plan. To assist in funding the deferred compensation liability, we have invested in corporate-ownedcompany-owned life insurance policies. The cash surrender value of these policies is presented in other assets and was $4.6$4.7 million at September 30, 2016.$1.4$1.1 million and $0.7$1.4 million as of September 30, 20162017 and 2015,2016, respectively, and our net periodic postretirement benefit expenses have been less than $0.1 million for the last three fiscal years. Due to the immateriality of the costs and liabilities of this plan, no further disclosure is being presented.In February 2016, the Board of Directors voted to modify future RSU awards. The modification provides that sixtySixty percent of the grant is time-based and vests over a three-year period on each anniversary of the grant date, based on continued employment. The remaining forty percent of the grant will beis earned based on the three-year earnings performance of the Company following the grant date. At September 30, 2016,2017, there were 159,988177,737 RSUs outstanding. The RSUs do not have voting rights but do receive dividend equivalents upon vesting; additionally, the shares of common stock underlying the RSUs are not considered issued and outstanding until vested and common stock is issued. three yearsfiscal year is summarized below:(1)Includes the accelerated vesting of 84,043 shares previously issued to our former Chief Executive Officer and other senior managers as part of their separation packages, see Note M. Outstanding at September 30, 2016 159,988 $ 43.12 Granted 62,100 39.57 Vested (29,051 ) 39.08 Forfeited/cancelled (15,300 ) 26.39 Outstanding at September 30, 2017 177,737 $ 37.00 In Fiscal 2016, 63,628 sharesAs of September 30, 2017, there were issued under the 2014 Plan and the total number of664,911 shares of common stock left available was 664,911 shares.annually and thatannually. Fifty percent of the annual grantrestricted stock granted to each of restricted shares will vest over a two-year period, of which 50% will vestour non-employee directors vests immediately, while the remaining fifty percent vests on eachthe anniversary of the grant date. InCompensation expense is recognized immediately for the first fifty percent of the restricted stock granted, while compensation expense for the remaining fifty percent will be recognized over the remaining vesting period based on the price per share on the grant date. In February 2015, we issued 16,000 restricted shares at a price of $33.37 per share and in September 2015, we issued 1,400 restricted shares at a price of $29.48 per share under the 2014 Director Plan. The total number of shares of common stock available for future awards under the 2014 Director plan was 101,60084,600 shares as of September 30, 2016. 20162017 and 2015,2016, there were 26,80016,000 shares and 26,20026,800 shares of unvested restricted stock outstanding. Total compensation expense related to restricted stock grants under all plans was $0.7 million, $1.3$0.7 million and $1.3 million for the years ended September 30, 2017, 2016 2015 and 2014,2015, respectively. Total compensation expense related to RSU’s under all plans was $2.0 million, $4.2 million and $1.9 million and $2.1 million for the years ended September 30, 2017, 2016 and 2015, and 2014, respectively.20162017 and 2015,2016, amounts not yet recognized related to non-vested stock totaled $2.1$1.6 million and $1.9$2.1 million, respectively. As of September 30, 2016,2017, the total weighted average remaining contractual life of our restricted stock and RSU’s is 0.82 yearssix months and 1.831.74 years, respectively. Fair Value Measurements at September 30, 2017 Fair Value at September 30, 2017 Assets: Cash and cash equivalents $ 68,359 $ — $ — $ 68,359 Short-term investments 26,829 — — 26,829 Restricted cash 24,851 — — 24,851 Deferred compensation — 6,442 — 6,442 Liabilities: Deferred compensation — 4,991 — 4,991 The following table summarizes the Fair Value Measurements at September 30, 2016 Fair Value at September 30, 2016 Assets: Cash and cash equivalents $ 97,720 $ — $ — $ 97,720 Deferred compensation — 5,773 — 5,773 Liabilities: Deferred compensation — 4,449 — 4,449 of our assetsdisclosures be presented in both interim and liabilities that were accounted for atannual reports. The estimated fair value on a recurring basis asamounts of September 30, 2015 (in thousands): financial instruments have been determined using available market information and valuation methodologies described below.Fair ValueOther Financial InstrumentsFair value guidance requires certain fair value disclosures be presentedthree months or more.both interim and annual reports. The estimated fair value amounts of financial instruments have been determined using available market information and valuation methodologies described below.fair values of the underlying securities of thesemutual funds are based on quoted market prices and are categorized as Level I in the fair value measurement hierarchy. The company-owned life insurance policies are valued at cash surrender valuecombined in the plan and are therefore categorized as Level 2 in the fair value measurement hierarchy.hierarchy.Industrial Development Revenue Bonds – The fair value of our long-term debt depends primarily on the coupon rate of our industrial development revenue bonds. The carrying value of our long-term debt at September 30, 2016, approximates fair value based on the current coupon rate of the bonds, which is reset weekly. It is classified as a Level 2 input in the fair value measurement hierarchy as there is an active market for the trading of these industrial development revenue bonds.There were no transfers between levels with the fair value measurement hierarchy during Fiscal 2016. Year Ended September 30, 2017 2016 2015 United States $ 279,352 $ 405,298 $ 474,038 Canada 45,540 77,252 101,191 Middle East and Africa 26,639 40,294 40,557 Europe 21,194 26,200 23,567 Mexico, Central and South America 19,309 8,304 10,479 Far East 3,877 7,895 12,026 Total revenues $ 395,911 $ 565,243 $ 661,858 September 30, 2017 2016 Long-lived assets: United States $ 82,589 $ 88,304 Canada 52,122 52,292 United Kingdom 4,709 4,381 Total $ 139,420 $ 144,977 CostsresponseFiscal 2017, we incurred approximately $1.3 million of restructuring costs as we continued to challenging conditions primarily in the oil and gas markets, we have taken various actions during Fiscal 2016reduce our overall cost structure to continue tobetter align our workforcecosts with future production requirements. Of the $1.3 million of restructuring costs incurred this fiscal year, $1.0 million has been paid and the remaining $0.3 million will be paid in Fiscal 2018.2015.2016. Of the $7.9 million in separation costs, recorded$6.8 million was paid in Fiscal 2016 $6.8 million has been paid and the remaining $1.1 million will bewas paid over the next fiscal year. The lease does not expire until October 2019; however, we have sublet the facility through the remaining term of the lease. N. Discontinued OperationsOn January 15, 2014, we sold our wholly owned subsidiary Transdyn to a global provider of electronic toll collection systems, headquartered in Vienna, Austria. The purchase price from the sale of this subsidiary totaled $16.0 million, of which we received cash of $14.4 million. The remaining $1.6 million was placed into an escrow account and was released to us in July 2015. We received additional cash of $0.4 million after the final working capital adjustment was calculated in March 2014. We recorded a gain on thistransaction of $8.6 million, net of tax, which has been included in income from discontinued operations in Fiscal 2014 in the accompanying consolidated statements of operations. Transdyn’s results were previously reflected in the Process Control Systems business segment.We have presented the results of these operations as income from discontinued operations, net of tax, in the Fiscal 2014 consolidated statement of operations. Summary comparative financial results of discontinued operations were as follows (in thousands):O. (the Repurchase Program) which allowed us to repurchase up to $25 million of our outstanding stock. The purchases were made from time to time in the open market through privately negotiated transactions and Rule 10b5-1 trading plans in accordance with applicable laws, rules and regulations. The Repurchase Programrepurchase of shares was funded from cash on hand and cash provided by operating activities. The Repurchase Program expired on December 31, 2015. As of December 31, 2015, we had purchased 806,018 shares at a cost of $25 million under the Repurchase Program. The average purchase price per share fromsince inception of the program until its expiration was $31.02.P. 20162017 and 20152016 (in thousands, except per share data): 2017 Quarters First Second Third Fourth 2017 Revenues $ 110,341 $ 104,680 $ 85,927 $ 94,963 $ 395,911 Gross profit 14,999 15,822 9,054 10,894 50,769 Net income (loss) (300 ) (829 ) (3,215 ) (5,142 ) (9,486 ) Earnings (loss) per share: Basic $ (0.03 ) $ (0.07 ) $ (0.28 ) $ (0.45 ) $ (0.83 ) Diluted $ (0.03 ) $ (0.07 ) $ (0.28 ) $ (0.45 ) $ (0.83 ) 2016 Quarters First Second Third Fourth 2016 Revenues $ 149,977 $ 152,266 $ 133,207 $ 129,793 $ 565,243 Gross profit 23,150 30,094 27,285 25,676 106,205 Net income (loss) (459 ) 5,567 4,894 5,508 15,510 Earnings (loss) per share: Basic $ (0.04 ) $ 0.49 $ 0.43 $ 0.48 $ 1.36 Diluted $ (0.04 ) $ 0.49 $ 0.43 $ 0.48 $ 1.36 2016,2017, the end of the period covered by this Annual Report on Form 10-K, our disclosure controls and procedures were effective to provide reasonable assurance that information required to be disclosed by us in reports that we file or submit under the Exchange Act is recorded, processed, summarized and reported within the time periods specified in the SEC’s rules and forms and that such information is accumulated and communicated to our management, including the CEO and CFO, as appropriate, to allow timely decisions regarding required disclosures.2016.2017. Management evaluated the effectiveness of our internal control over financial reporting based on the criteria in Internal Control – Integrated Framework (2013) issued by the Committee of Sponsoring Organizations of the Treadway Commission (COSO). Based on management’s evaluation, management has concluded that our internal control over financial reporting was effective at the reasonable assurance level as of September 30, 2016,2017, based on criteria in Internal Control – Integrated Framework (2013) issued by the COSO.2016,2017, which appears in their report on the financial statements included herein.2016.2016.2017.2016.2017.2016.2017.2016.2017.NumberNumber Description of Exhibits —— Certificate of Incorporation of Powell Industries, Inc. filed with the Secretary of State of the State of Delaware on February 11, 2004 (filed as Exhibit 3.1 to our Form 8-A/A filed November 1, 2004, and incorporated herein by reference). —— Amended and Restated By-laws of Powell Industries, Inc. (filed as Exhibit 3.1 to our Form 8-K filed October 12, 2012, and incorporated herein by reference). —— Powell Industries, Inc., Incentive Compensation Plan (filed as Exhibit 10.1 to our Form 10-K for the fiscal year ended October 31, 2003, and incorporated herein by reference).10.2—10.3—— 1992 Powell Industries, Inc. Stock Option Plan (filed as Exhibit 10.1 to our registration statement on Form S-8 filed on December 21, 2010, and incorporated herein by reference).10.4—Amendment to 1992 Powell Industries, Inc. Stock Option Plan (filed as Exhibit 10.8 to our Form 10-Q for the quarter ended April 30, 1996, and incorporated herein by reference).10.5—Amendment to 1992 Powell Industries, Inc. Stock Option Plan (the cover of the 1992 Powell Industries, Inc. Stock Option Plan has been noted to reflect the increase in the number of shares authorized for issuance under the Plan from 2,100,000 to 2,700,000, which increase was approved by the stockholders of the Company at the 2005 Annual Meeting of Stockholders).10.6—10.7—— Powell Industries, Inc. Executive Severance Protection Plan (filed as Exhibit 10.7 to our Form 10-K for the fiscal year ended October 31, 2002, and incorporated herein by reference). 10.8—— Powell Industries, Inc. Non-Employee Directors Stock Option Plan (filed as Exhibit 10.8 to our Form 10-K for the fiscal year ended October 31, 2002, and incorporated herein by reference).10.9—10.10—— Powell Industries, Inc. Non-Employee Director Restricted Stock Plan (filed as Exhibit 10.3 to our registration statement on Form S-8 filed on December 21, 2010, and incorporated herein by reference).10.11—Amended Loan Agreement dated October 29, 2004, between the Company and Bank of America, N.A. (filed as Exhibit 10.10 to our Form 10-K for the fiscal year ended October 31, 2004, and incorporated herein by reference).10.12—Credit and Reimbursement Agreement dated April 15, 2004, between the Company and Bank of America, N.A. (filed as Exhibit 10.11 to our Form 10-K for the fiscal year ended October 31, 2004, and incorporated herein by reference).Description of Exhibits10.13—Credit Agreement dated June 29, 2005 among Powell Industries, Inc., Inhoco 3210 Limited and Switchgear & Instrumentation Properties Limited, and Bank of America and the other lenders parties thereto (filed as Exhibit 10.1 to our Form 8-K filed July 6, 2005, and incorporated herein by reference).10.14—First Amendment to Credit Agreement dated November 7, 2005 among Powell Industries, Inc., Inhoco 3210 Limited (n/k/a Switchgear & Instrumentation Limited), Switchgear & Instrumentation Properties Limited, Bank of America, N.A., and the other lenders parties thereto (filed as Exhibit 10.14 to our Form 10-K for the fiscal year ended October 31, 2005, and incorporated herein by reference).10.15—Second Amendment to Credit Agreement dated January 11, 2006 among Powell Industries, Inc., Switchgear & Instrumentation Limited, Switchgear & Instrumentation Properties Limited, Bank of America, N.A., and the other lenders parties thereto (filed as Exhibit 10.15 to our Form 10-K for the fiscal year ended October 31, 2005, and incorporated herein by reference).10.16—Third Amendment to Credit Agreement dated August 4, 2006 among Powell Industries, Inc., Switchgear & Instrumentation Limited, Switchgear & Instrumentation Properties Limited, Bank of America, N.A., and the other lenders parties thereto (filed as Exhibit 10.3 to our Form 8-K filed August 9, 2006, and incorporated herein by reference).10.17—Fourth Amendment to Credit Agreement dated December 7, 2006 among Powell Industries, Inc., Switchgear & Instrumentation Limited, Switchgear & Instrumentation Properties Limited, Bank of America, N.A., and the other lenders parties thereto (filed as Exhibit 10.17 to our Transition report on Form 10-K for the fiscal year ended September 30, 2006, and incorporated herein by reference).10.18—Fifth Amendment to Credit Agreement, dated as of December 4, 2007, among Powell Industries, Inc., as Parent, the subsidiaries of Powell Industries, Inc. identified therein, as Borrowers, Bank of America, N.A., as Administrative Agent, Swing Line Lender and L/C Issuer, and the Lenders party thereto (filed as Exhibit 10.1 to our Quarterly Report on Form 10-Q for the quarter ended December 31, 2007, and incorporated herein by reference).10.19—Sixth Amendment to Credit Agreement, dated as of December 14, 2007, among Powell Industries, Inc., as Parent, the subsidiaries of Powell Industries, Inc. identified therein, as Borrowers, Bank of America, N.A., as Administrative Agent, Swing Line Lender and L/C issuer, and the Lenders party thereto (filed as Exhibit 10.1 to our Form 8-K filed December 19, 2007, and incorporated herein by reference).10.20—**10.21—— Powell Supply Agreement between the Company and General Electric Company dated August 7, 2006 (filed as Exhibit 10.1 to our Form 8-K/A filed June 16, 2008, and incorporated herein by reference).10.22—10.23—— Seventh Amendment to Credit Agreement, dated as of December 10, 2008, among Powell Industries, Inc., as Parent, the subsidiaries of Powell Industries, Inc. identified therein, as Borrowers, Bank of America, N.A., as Administrative Agent, Swing Line Lender and L/C issuer, and the Lenders party (filed as Exhibit 10.24 to our Form 10-K for the fiscal year ended September 30, 2008, and incorporated herein by reference).10.24—Powell Industries, Inc. 2006 Equity Compensation Plan (filed as Exhibit 10.2 to our registration statement on Form S-8 filed on December 21, 2010, and incorporated herein by reference).10.25—Credit Agreement dated as of December 15, 2009, between Powell PowerComm Inc., as Borrower, Powell Industries, Inc., Nextron Limited, PPC Technical Services Inc., as Guarantors, and HSBC Bank Canada, as Lender (filed as Exhibit 10.1 to our Form 8-K filed on December 21, 2009, and incorporated herein by reference).Description of Exhibits10.26—Ninth Amendment to Credit Agreement, dated as of May 18, 2011, among Powell Industries, Inc., as Parent, the subsidiaries of Powell Industries, Inc. identified therein, as Borrowers, Bank of America, N.A., as Administrative Agent, Swing Line Lender and L/C issuer, and the Lenders party (filed as Exhibit 10.1 to our Form 8-K dated May 18, 2011, and incorporated herein by reference).10.27—10.28—— Employment Agreement dated as of May 8, 2012 between the Company and Milburn E. Honeycutt (filed as Exhibit 10.2 to our Form 10-Q for the quarter ended March 31, 2012, and incorporated herein by reference). 10.29—— Tenth Amendment to Credit Agreement, dated as of March 26, 2012, among Powell Industries, Inc., as Parent, the subsidiaries of Powell Industries, Inc. identified herein, as Borrowers, Bank of America, N.A., as Administrative Agent, Swing Line Lender and L/C issuer, and the Lenders party (filed as Exhibit 10.3 to our Form 10-Q for the quarter ended March 31, 2012, and incorporated herein by reference).10.30—10.31—— Eleventh Amendment to Credit Agreement, dated as of June 27, 2013, among Powell Industries, Inc., as Parent, the subsidiaries of Powell Industries, Inc. identified therein, as Borrowers, Bank of America, N.A., as Administrative Agent, Swing Line Lender and L/C issuer, and the Lenders party thereto. (filed as Exhibit 10.1 to our Form 10-Q filed August 7, 2013, and incorporated herein by reference).10.32—10.33—— Amended and Restated Powell Supply Agreement dated as of December 30, 2013, between the Company and General Electric Company (filed as Exhibit 10.2 to our Form 10-Q filed February 5, 2014 and incorporated herein by reference). 10.34—— Restated Credit Agreement dated as of December 31, 2013, between the Company and Bank of America, N.A. (filed as Exhibit 10.3 to our Form 10-Q filed February 5, 2014 and incorporated herein by reference). 10.35—10.13 — 2014 Equity Incentive Plan (filed as Exhibit 10.2 to our Form 10-Q filed May 7, 2014 and incorporated herein by reference). 10.36—— Form of Restricted Stock Award Agreement under 2014 Equity Incentive Plan (filed as Exhibit 10.3 to our Form 10-Q filed May 7, 2014 and incorporated herein by reference). 10.37—— Form of Restricted Stock Unit Award Agreement under 2014 Equity Incentive Plan (filed as Exhibit 10.4 to our Form 10-Q filed May 7, 2014 and incorporated herein by reference). 10.38—— Form of Performance Unit Award Agreement under 2014 Equity Incentive Plan (filed as Exhibit 10.5 to our Form 10-Q filed May 7, 2014 and incorporated herein by reference). 10.39—— Form of Stock Option Award Agreement under 2014 Equity Incentive Plan (filed as Exhibit 10.6 to our Form 10-Q filed May 7, 2014 and incorporated herein by reference). 10.40—— Form of Stock Appreciation Right Award Agreement under 2014 Equity Incentive Plan (filed as Exhibit 10.7 to our Form 10-Q filed May 7, 2014 and incorporated herein by reference). 10.41—— 2014 Non-Employee Director Equity Incentive Plan (filed as Exhibit 10.8 to our Form 10-Q filed May 7, 2014 and incorporated herein by reference). 10.42—— Form of Restricted Stock Award Agreement under 2014 Non-Employee Director Equity Incentive Plan (filed as Exhibit 10.9 to our Form 10-Q filed May 7, 2014 and incorporated herein by reference). 10.43—— First Amendment to Credit Agreement, dated as of March 28, 2014, among Powell Industries, Inc., as Parent, certain subsidiaries of Powell Industries, Inc. identified therein, as Guarantors, Bank of America, N.A., as Administrative Agent, Swing Line Lender and L/C issuer, and the Lenders party thereto (filed as Exhibit 10.10 to our Form 10-Q filed May 7, 2014 and incorporated herein by reference). Description of Exhibits10.44—10.22 — Renewed banking facilities between HSBC Bank plc and Powell (UK) Limited dated October 20, 2014 (filed as Exhibit 10.48 to our Form 10-K filed December 3, 2014, and incorporated herein by reference). 10.45—— Second Amendment to Amended Credit Agreement, dated December 31, 2014, among Powell Industries, Inc., as Parent, certain subsidiaries of Powell Industries, Inc. identified therein, as Guarantors, Bank of America, N.A., as Administrative Agent, Swing Line Lender and L/C issuer, and the Lenders party thereto (filed as Exhibit 10.1 to our Form 10-Q filed February 4, 2015 and incorporated herein by reference). 10.46—— Amending Agreement to Amended and Restated Credit Agreement, effective as of March 31, 2015, between Powell Canada Inc., Powell Industries, Inc., Nextron Limited, PCG Northern Services Inc. and HSBC Bank Canada (filed as Exhibit 10.1 to our Form 10-Q filed May 6, 2015 and incorporated herein by reference). *10.47—— Severance Agreement and Release effective as of March 05, 2015, between the Company and Neil Dial.10.48��—10.49—— Employment Agreement dated September 29, 2016, between the Company and Brett A. Cope (filed as Exhibit 10.1 to our 8-K filed September 30, 2016 and incorporated herein by reference). Third Amendment to Credit Agreement, dated June 27, 2017, between Powell Industries, Inc., the subsidiaries of Powell named therein, Bank of America, N.A., as Administrative Agent, Swingline Lender and L/C issuer and the Lenders party thereto (filed as Exhibit 10.1 to our Form 8-K filed June 30, 2017 and incorporated herein by reference). *21.1 —— Subsidiaries of Powell Industries, Inc. 23.2—— Consent of PricewaterhouseCoopers LLP. —— Certification of Chief Executive Officer pursuant to Rule 13a-14(a)/15d-14(a). —— Certification of Chief Financial Officer pursuant to Rule 13a-14(a)/15d-14(a). —— Certification of Chief Executive Officer Pursuant to Section 18 U.S.C. Section 1350, as Adopted Pursuant to Section 906 of the Sarbanes-Oxley Act of 2002. Description of Exhibits *32.2 ** Filed herewith. ** POWELL INDUSTRIES, INC. By:/s/ Brett A. Cope Brett A. Cope SignatureTitleSignature Title /s/Thomas W. Powell 7, 20166, 2017NumberNumber Description of Exhibits —— Certificate of Incorporation of Powell Industries, Inc. filed with the Secretary of State of the State of Delaware on February 11, 2004 (filed as Exhibit 3.1 to our Form 8-A/A filed November 1, 2004, and incorporated herein by reference). —— —— Powell Industries, Inc., Incentive Compensation Plan (filed as Exhibit 10.1 to our Form 10-K for the fiscal year ended October 31, 2003, and incorporated herein by reference).10.2—10.3—— 1992 Powell Industries, Inc. Stock Option Plan (filed as Exhibit 10.1 to our registration statement on Form S-8 filed on December 21, 2010, and incorporated herein by reference).10.4—Amendment to 1992 Powell Industries, Inc. Stock Option Plan (filed as Exhibit 10.8 to our Form 10-Q for the quarter ended April 30, 1996, and incorporated herein by reference).10.5—Amendment to 1992 Powell Industries, Inc. Stock Option Plan (the cover of the 1992 Powell Industries, Inc. Stock Option Plan has been noted to reflect the increase in the number of shares authorized for issuance under the Plan from 2,100,000 to 2,700,000, which increase was approved by the stockholders of the Company at the 2005 Annual Meeting of Stockholders).10.6—10.7—— 10.8—— Powell Industries, Inc. Non-Employee Directors Stock Option Plan (filed as Exhibit 10.8 to our Form 10-K for the fiscal year ended October 31, 2002, and incorporated herein by reference).10.9—10.10—— Powell Industries, Inc. Non-Employee Director Restricted Stock Plan (filed as Exhibit 10.3 to our registration statement on Form S-8 filed on December 21, 2010, and incorporated herein by reference).10.11—Amended Loan Agreement dated October 29, 2004, between the Company and Bank of America, N.A. (filed as Exhibit 10.10 to our Form 10-K for the fiscal year ended October 31, 2004, and incorporated herein by reference).10.12—Credit and Reimbursement Agreement dated April 15, 2004, between the Company and Bank of America, N.A. (filed as Exhibit 10.11 to our Form 10-K for the fiscal year ended October 31, 2004, and incorporated herein by reference).10.13—Credit Agreement dated June 29, 2005 among Powell Industries, Inc., Inhoco 3210 Limited and Switchgear & Instrumentation Properties Limited, and Bank of America and the other lenders parties thereto (filed as Exhibit 10.1 to our Form 8-K filed July 6, 2005, and incorporated herein by reference).10.14—First Amendment to Credit Agreement dated November 7, 2005 among Powell Industries, Inc., Inhoco 3210 Limited (n/k/a Switchgear & Instrumentation Limited), Switchgear & Instrumentation Properties Limited, Bank of America, N.A., and the other lenders parties thereto (filed as Exhibit 10.14 to our Form 10-K for the fiscal year ended October 31, 2005, and incorporated herein by reference).10.15—Second Amendment to Credit Agreement dated January 11, 2006 among Powell Industries, Inc., Switchgear & Instrumentation Limited, Switchgear & Instrumentation Properties Limited, Bank of America, N.A., and the other lenders parties thereto (filed as Exhibit 10.15 to our Form 10-K for the fiscal year ended October 31, 2005, and incorporated herein by reference).Description of Exhibits10.16—Third Amendment to Credit Agreement dated August 4, 2006 among Powell Industries, Inc., Switchgear & Instrumentation Limited, Switchgear & Instrumentation Properties Limited, Bank of America, N.A., and the other lenders parties thereto (filed as Exhibit 10.3 to our Form 8-K filed August 9, 2006, and incorporated herein by reference).10.17—Fourth Amendment to Credit Agreement dated December 7, 2006 among Powell Industries, Inc., Switchgear & Instrumentation Limited, Switchgear & Instrumentation Properties Limited, Bank of America, N.A., and the other lenders parties thereto (filed as Exhibit 10.17 to our Transition report on Form 10-K for the fiscal year ended September 30, 2006, and incorporated herein by reference).10.18—Fifth Amendment to Credit Agreement, dated as of December 4, 2007, among Powell Industries, Inc., as Parent, the subsidiaries of Powell Industries, Inc. identified therein, as Borrowers, Bank of America, N.A., as Administrative Agent, Swing Line Lender and L/C Issuer, and the Lenders party thereto (filed as Exhibit 10.1 to our Quarterly Report on Form 10-Q for the quarter ended December 31, 2007, and incorporated herein by reference).10.19—Sixth Amendment to Credit Agreement, dated as of December 14, 2007, among Powell Industries, Inc., as Parent, the subsidiaries of Powell Industries, Inc. identified therein, as Borrowers, Bank of America, N.A., as Administrative Agent, Swing Line Lender and L/C issuer, and the Lenders party thereto (filed as Exhibit 10.1 to our Form 8-K filed December 19, 2007, and incorporated herein by reference).10.20—**10.21—— Powell Supply Agreement between the Company and General Electric Company dated August 7, 2006 (filed as Exhibit 10.1 to our Form 8-K/A filed June 16, 2008, and incorporated herein by reference).10.22—10.23—— Seventh Amendment to Credit Agreement, dated as of December 10, 2008, among Powell Industries, Inc., as Parent, the subsidiaries of Powell Industries, Inc. identified therein, as Borrowers, Bank of America, N.A., as Administrative Agent, Swing Line Lender and L/C issuer, and the Lenders party (filed as Exhibit 10.24 to our Form 10-K for the fiscal year ended September 30, 2008, and incorporated herein by reference).10.24—Powell Industries, Inc. 2006 Equity Compensation Plan (filed as Exhibit 10.2 to our registration statement on Form S-8 filed on December 21, 2010, and incorporated herein by reference).10.25—Credit Agreement dated as of December 15, 2009, between Powell PowerComm Inc., as Borrower, Powell Industries, Inc., Nextron Limited, PPC Technical Services Inc., as Guarantors, and HSBC Bank Canada, as Lender (filed as Exhibit 10.1 to our Form 8-K filed on December 21, 2009, and incorporated herein by reference).10.26—Ninth Amendment to Credit Agreement, dated as of May 18, 2011, among Powell Industries, Inc., as Parent, the subsidiaries of Powell Industries, Inc. identified therein, as Borrowers, Bank of America, N.A., as Administrative Agent, Swing Line Lender and L/C issuer, and the Lenders party (filed as Exhibit 10.1 to our Form 8-K dated May 18, 2011, and incorporated herein by reference).10.27—10.28—— 10.29—— Tenth Amendment to Credit Agreement, dated as of March 26, 2012, among Powell Industries, Inc., as Parent, the subsidiaries of Powell Industries, Inc. identified herein, as Borrowers, Bank of America, N.A., as Administrative Agent, Swing Line Lender and L/C issuer, and the Lenders party (filed as Exhibit 10.3 to our Form 10-Q for the quarter ended March 31, 2012, and incorporated herein by reference).10.30—Description of Exhibits10.31—Eleventh Amendment to Credit Agreement, dated as of June 27, 2013, among Powell Industries, Inc., as Parent, the subsidiaries of Powell Industries, Inc. identified therein, as Borrowers, Bank of America, N.A., as Administrative Agent, Swing Line Lender and L/C issuer, and the Lenders party thereto. (filed as Exhibit 10.1 to our Form 10-Q filed August 7, 2013, and incorporated herein by reference).10.10 10.32—10.33—— 10.34—— 10.35—— 10.36—— 10.37—— 10.38—— 10.17 — 10.39—10.40—10.18 — 10.41—— 10.42—— 10.43—— 10.44—— 10.45—— 10.46—— *10.47—— Severance Agreement and Release effective as of March 05, 2015, between the Company and Neil Dial.10.48—10.49—— Description of Exhibits10.27 *21.1 —— 23.2—— —— —— —— —— —— XBRL Instance Document —— XBRL Taxonomy Extension Schema Document —— XBRL Taxonomy Extension Calculation Linkbase Document 101.DEF—Number Description of Exhibits 101.DEF — XBRL Taxonomy Extension Definition Linkbase Document ** Filed herewith. ** 60