
D t
UNITED STATES
SECURITIES AND EXCHANGE COMMISSION
Washington, D.C. 20549
FORM 10-K
☒ | ANNUAL REPORT PURSUANT TO SECTION 13 OR 15 (d) OF THE SECURITIES EXCHANGE ACT OF 1934 |
For the fiscal year ended December 31, 20162017
OR
☐ | TRANSITION REPORT PURSUANT TO SECTION 13 OR 15 (d) OF THE SECURITIES EXCHANGE ACT OF 1934 |
For the transition period from to
Commission file number: 000-54685
CNL Healthcare Properties, Inc.
(Exact name of registrant as specified in its charter)
Maryland |
| 27-2876363 |
(State or other jurisdiction of incorporation or organization) |
| (I.R.S. Employer Identification No.) |
CNL Center at City Commons
|
|
|
(Address of principal executive offices) |
| (Zip Code) |
Registrant’s telephone number, including area code (407) 650-1000
Securities registered pursuant to Section 12(b) of the Act:
Title of each class |
| Name of each exchange on which registered |
|
|
Securities registered pursuant to Section 12(g) of the Act: Common Stock, $0.01 par value per share
Indicate by check mark if the registrant is a well-known seasoned issuer, as defined in Rule 405 of the Securities Act. Yes ☐ No ☒
Indicate by check mark if the registrant is not required to file reports pursuant to Section 13 or Section 15(d) of the Act. Yes ☐ No ☒
Indicate by check mark whether the registrant (1) has filed all reports required to be filed by Section 13 or 15(d) of the Securities Exchange Act of 1934 during the preceding 12 months (or for such shorter period that the registrant was required to file such reports), and (2) has been subject to such filing requirements for the past 90 days. Yes ☒ No ☐
Indicate by check mark whether the registrant has submitted electronically and posted on its corporate Web site, if any, every Interactive Data File required to be submitted and posted pursuant to Rule 405 of Regulation S-T (§232.405 of this chapter) during the preceding 12 months (or for such shorter period that the registrant was required to submit and post such files). Yes ☒ No ☐
Indicate by check mark if disclosure of delinquent filers pursuant to Item 405 of Regulation S-K is not contained herein, and will not be contained, to the best of registrant’s knowledge, in definitive proxy or information statements incorporated by reference in Part III of this Form 10-K or any amendment to this Form 10-K. ☒
Indicate by check mark whether the registrant is a large accelerated filer, an accelerated filer, a non-accelerated filer, or a smaller reporting company or emerging growth company. See the definitions of “large accelerated filer,” “accelerated filer”filer,” “smaller reporting company” and “smaller reporting“emerging growth company” in Rule 12b-2 of the Exchange Act.
Large accelerated filer | ☐ | Accelerated filer | ☐ | |
Non-accelerated filer | ☒ (Do not check if a smaller reporting company) | Smaller reporting company | ☐ | |
Emerging growth company | ☐ |
If an emerging growth company, indicate by check mark if the registrant has elected not to use the extended transition period for complying with any new or revised financial accounting standards provided pursuant to Section 13(a) of the Exchange Act. ☐
Indicate by check mark whether the registrant is a shell company (as defined in Rule 12b-2 of the Exchange Act). Yes ☐ No☒
There is currently no established public market for the registrant’s shares of common stock. Based on the Company’s $9.75$10.04 net asset value per share as of June 30, 20162017 (the last business day of the registrant’s most recently completed second fiscal quarter), the aggregate market value of the stock held by non-affiliates of the registrant on such date was $1.7$1.8 billion.
The number of shares of common stock of the registrant outstanding as of March 3, 20175, 2018 was 175,069,562.174,634,263.
DOCUMENTS INCORPORATED BY REFERENCE
Registrant incorporates by reference portions of the CNL Healthcare Properties, Inc.
Definitive Proxy Statement for the 2017 Annual Meeting of Stockholders
(Items 10, 11, 12, 13 and 14 of Part III) to be filed no later than
April 30, 2017.
None
|
|
|
| Page | |
|
|
|
| ||
|
|
| 3 | ||
| Item 1. |
| 4 | ||
| Item 1A. |
|
| ||
| Item 1B. |
|
| ||
| Item 2. |
|
| ||
| Item 3. |
|
| ||
| Item 4. |
|
| ||
|
|
|
|
| |
|
|
|
| ||
| Item 5. |
|
| ||
| Item 6. |
|
| ||
| Item 7. | Management’s Discussion and Analysis of Financial Condition and Results of Operations |
|
| |
| Item 7A. |
|
| ||
| Item 8. |
|
| ||
| Item 9. | Changes in and Disagreements With Accountants on Accounting and Financial Disclosure |
|
| |
| Item 9A. |
|
| ||
| Item 9B. |
|
| ||
|
|
|
|
| |
|
|
|
| ||
| Item 10. |
|
| ||
| Item 11. |
|
| ||
| Item 12. | Security Ownership of Certain Beneficial Owners and Management and Related Stockholder Matters |
|
| |
| Item 13. | Certain Relationships and Related Transactions, and Director Independence |
|
| |
| Item 14. |
|
| ||
|
|
|
|
| |
|
|
|
| ||
| Item 15. |
|
| ||
| Item 16. |
|
| ||
|
|
|
|
| |
|
| ||||
STATEMENT REGARDING FORWARD LOOKING INFORMATION
Statements contained under “Management’s Discussion and Analysis of Financial Condition and Results of Operations” and elsewhere in this Annual Report on Form 10-K for the fiscal year ended December 31, 20162017 (“Annual Report”) that are not statements of historical or current fact may constitute “forward-looking statements” within the meaning of the Federal Private Securities Litigation Reform Act of 1995. The Company intends that such forward-looking statements be subject to the safe harbor created by Section 21E of the Securities Exchange Act of 1934, as amended (“Exchange Act”). Forward-looking statements are statements that do not relate strictly to historical or current facts, but reflect management’s current understandings, intentions, beliefs, plans, expectations, assumptions and/or predictions regarding the future of the Company’s business and its performance, the economy, and other future conditions and forecasts of future events and circumstances. Forward-looking statements are typically identified by words such as “believes,” “expects,” “anticipates,” “intends,” “estimates,” “plans,” “continues,” “pro forma,” “may,” “will,” “seeks,” “should,” “could” and words and terms of similar substance in connection with discussions of future operating or financial performance, business strategy and portfolios, projected growth prospects, cash flows, costs and financing needs, legal proceedings, amount and timing of anticipated future distributions, estimates of per share net asset value of the Company’s common stock, and/or other matters. The Company’s forward-looking statements are not guarantees of future performance. While the Company’s management believes its forward-looking statements are reasonable, such statements are inherently susceptible to uncertainty and changes in circumstances. As with any projection or forecast, forward-looking statements are necessarily dependent on assumptions, data and/or methods that may be incorrect or imprecise, and may not be realized. The Company’s forward-looking statements are based on management’s current expectations and a variety of risks, uncertainties and other factors, many of which are beyond the Company’s ability to control or accurately predict. Although the Company believes that the expectations reflected in such forward-looking statements are based upon reasonable assumptions, the Company’s actual results could differ materially from those set forth in the forward-looking statements due to a variety of risks, uncertainties and other factors. Given these uncertainties, the Company cautions you not to place undue reliance on such statements.
For further information regarding risks and uncertainties associated with the Company’s business, and important factors that could cause the Company’s actual results to vary materially from those expressed or implied in its forward-looking statements, please refer to the factors listed and described under “Management’s Discussion and Analysis of Financial Condition and Results of Operations” and the “Risk Factors” sections of the Company’s documents filed from time to time with the U.S. Securities and Exchange Commission (“SEC” or “the Commission”), including, but not limited to, this Annual Report and the Company’s quarterly reports on Form 10-Q, copies of which may be obtained from the Company’s website at www.cnlhealthcareproperties.com.
All written and oral forward-looking statements attributable to the Company or persons acting on its behalf are qualified in their entirety by this cautionary note. Forward-looking statements speak only as of the date on which they are made, and the Company undertakes no obligation to, and expressly disclaims any obligation to, publicly release the results of any revisions to its forward-looking statements to reflect new information, changed assumptions, the occurrence of unanticipated subsequent events or circumstances, or changes to future operating results over time, except as otherwise required by law.
General
CNL Healthcare Properties, Inc. (“Company”) is a Maryland corporation incorporated on June 8, 2010 that elected to be taxed as a real estate investment trust (“REIT”) beginning with the year ended December 31, 2012 for United States (“U.S.”) federal income tax purposes. The terms “us,” “we,” “our,” “Company” and “CNL Healthcare Properties” include CNL Healthcare Properties, Inc. and each of its subsidiaries.
We are externally managed and advised by CNL Healthcare Corp. (“Advisor”), which serves as our advisor and is responsible for managing our day-to-day affairs and for identifying and making acquisitions and investments on our behalf. We have also retained CNL Healthcare Manager Corp. (“Property Manager”) to manage our properties.
We contributed the net proceeds from our public offerings (“Offerings”) to CHP Partners, LP (“Operating Partnership”) in exchange for partnership interests. Substantially all of our assets are held by, and all operations are conducted, either directly or indirectly, through: (1) the Operating Partnership in which we are the sole limited partner and our wholly owned subsidiary, CHP GP, LLC, is the sole general partner; (2) a wholly owned taxable REIT subsidiary (“TRS”), CHP TRS Holding, Inc.; (3) property owner subsidiaries and lender subsidiaries, which are single purpose entities; and (4) investments in joint ventures.
Our offices are located at 450 South Orange Avenue within the CNL Center at City Commons in Orlando, Florida, 32801, and our telephone number is (407) 650-1000.
Investment Objectives and Strategy
Our primary investment objectives have been to invest in a diversified portfolio of assets that will allow us to:
provide stockholders with attractive and stable cash distributions;
preserve, protect and grow stockholders’ invested capital; and
explore liquidity opportunities in the future, such as the sale of either the Company or our assets, potential merger, or the listing of our common shares on a national securities exchange.
There can be no assurance that we will be able to achieve our investment objectives. In 2017, we began evaluating strategic alternatives to provide liquidity to the Company’s stockholders. The Company continues to evaluate strategic alternatives for an outcome in the best interests of its stockholders and will announce publicly the Company’s formation of a special committee and/or engagement of any investment banker when either occurs. Until such time, we continue to strategically manage and position our portfolio to drive performance and value during what is now our maturation phase of the Company’s lifecycle.
With the completion of our Offerings, our Advisor is focused on actively managing our diversified portfolio of healthcare real estate and real estate-related assets within the seniors housing, medical office, post-acute care and acute care asset classes. The types of seniors housing properties that we have acquired include independent and assisted living facilities, continuing care retirement communities and Alzheimer’s / memory care facilities. The types of medical office facilities that we have acquired include medical office buildings, specialty medical and diagnostic service facilities, surgery centers, outpatient rehabilitation facilities, and other facilities designed for clinical services. The types of post-acute care facilities that we have acquired include skilled nursing facilities and inpatient rehabilitative facilities. The types of acute care facilities that we have acquired include specialty surgical hospitals. We view, manage and evaluate our portfolio homogeneously as one collection of healthcare assets with a common goal of maximizing revenues and property income regardless of the asset class or asset type.
We have primarily leased our seniors housing properties to wholly owned TRS entities and engaged independent third-party managers under management agreements to operate the properties as permitted under the REIT Investment Diversification and Empowerment Act of 2007 (“RIDEA”). We have also leased certain of our seniors housing properties to third-party tenants under triple-net or similar lease structures, where the tenant bears all or substantially all of the costs (including cost increases, for real estate taxes, utilities, insurance and ordinary repairs). Medical office, post-acute care and acute care properties have been leased on a triple-net, net or modified gross basis to third-party tenants. In addition, most of our investments are wholly owned, although, we have invested through partnerships with other entities where we believe it is appropriate and beneficial. We have and continue to invest in existing property developments or properties that have not reached full stabilization.
We believe recent demographic trends and compelling supply and demand indicators present a strong case for an investment focus on healthcare real estate and real estate-related assets. We believe that the healthcare sector will continue to provide attractive opportunities as compared to other asset sectors over the long-term. Our healthcare investment portfolio is geographically diversified with properties in 34 states. The map below shows our current property allocations across geographic regions as of December 31, 2016:2017:
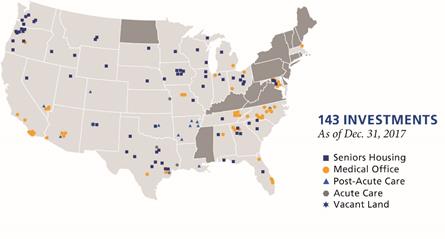
As of December 31, 2016,2017, our healthcare investment portfolio consisted of interests in 143 properties, including 72 seniors housing communities,properties, 54 medical office buildings (“MOB”), 12 post-acute care facilities and five acute care hospitals. Of our properties held at December 31, 2016,2017, five of our 72 seniors housing communities currently have real estate under development or current expansion projects and fiveproperties were owned through an unconsolidated joint venture. Oneventure and one was comprised of our 12 post-acute care facilities currently has real estate under development.unimproved land. The following table summarizes our healthcare portfolio by asset class and investment structure as of December 31, 2016:2017:
|
|
|
|
|
| Amount of |
|
| Percentage |
| |||||||||||||
Type of Investment |
| Number of Investments |
|
| Amount of Investments (in millions) |
|
| Percentage of Total Investments |
|
| Number of Investments |
|
| Investments (in millions) |
|
| of Total Investments |
| |||||
Consolidated investments: |
|
|
|
|
|
|
|
|
|
|
|
|
|
|
|
|
|
|
|
|
|
| |
Seniors housing leased (1) |
| 16 |
|
| $ | 360.9 |
|
| 12.0 | % |
|
| 15 |
|
| $ | 311.0 |
|
|
| 10.2 | % | |
Seniors housing managed (2) |
| 48 |
|
|
| 1,260.6 |
|
| 41.9 | % |
|
| 51 |
|
|
| 1,427.5 |
|
|
| 46.9 | % | |
Seniors housing developments (3) (6) |
| 3 |
|
|
| 80.5 |
|
| 2.7 | % | |||||||||||||
Seniors housing expansion projects (3) |
| ― | (4) |
|
| 3.8 |
|
| 0.1 | % | |||||||||||||
Seniors housing unimproved land |
|
| 1 |
|
|
| 1.1 |
|
|
| 0.0 | % | |||||||||||
Medical office leased (1) |
| 54 |
|
|
| 931.4 |
|
| 30.9 | % |
|
| 54 |
|
|
| 931.4 |
|
|
| 30.6 | % | |
Post-acute care leased (1) |
| 11 |
|
|
| 176.6 |
|
| 5.9 | % |
|
| 12 |
|
|
| 190.8 |
|
|
| 6.3 | % | |
Post-acute care development (3) |
| 1 |
|
|
| 12.9 |
|
| 0.4 | % | |||||||||||||
Acute care leased (1) |
| 5 |
|
|
| 153.9 |
|
| 5.1 | % |
|
| 5 |
|
|
| 153.9 |
|
|
| 5.0 | % | |
Unconsolidated investments: |
|
|
|
|
|
|
|
|
|
|
|
|
|
|
|
|
|
|
|
|
|
| |
Seniors housing managed (5) |
| 5 |
|
|
| 31.1 |
|
| 1.0 | % | |||||||||||||
Seniors housing managed (3) |
|
| 5 |
|
|
| 31.1 |
|
|
| 1 | % | |||||||||||
|
| 143 |
|
| $ | 3,011.7 |
|
| 100.0 | % |
|
| 143 |
|
| $ | 3,046.8 |
|
|
| 100 | % | |
_____________
FOOTNOTES:
(1) | Properties that are leased to third-party tenants for which we report rental income |
(2) | Properties that are leased to TRS entities and managed pursuant to third-party management contracts (i.e. RIDEA structure) where we report resident fees and services, and the corresponding property operating expenses. |
(3) |
|
|
|
|
|
We monitor the performance of our tenants and third-party operators to stay abreast of any material changes in the operations of the underlying properties by (1) reviewing the current, historical and prospective operating margins (measured by a tenant’s earnings before interest, taxes, depreciation, amortization and facility rent), (2) monitoring trends in the source of our tenants’ revenue, including the relative mix of public payors (including Medicare, Medicaid, etc.) and private payors (including commercial insurance and private pay patients), (3) evaluating the effect of evolving healthcare legislation and other regulations on our tenants’ profitability and liquidity, and (4) reviewing the competition and demographics of the local and surrounding areas in which the tenants operate.
In addition to operating statistics of the underlying properties, whenWhen evaluating the performance of our healthcare portfolio within the seniors housing and post-acute care asset classes, management reviews occupancy levels and monthly revenue per occupied unit, (“RevPOU”), which we define as total revenue divided by average number of occupied units or beds during a month and is considered an established keya performance metric within these asset classes. Similarly, within the medical office and acute care asset classes, management reviews operating statistics of the underlying properties, including occupancy levels and monthly rent per square foot. Lastly, when evaluating the performance of our third-party operators or developers, management reviews monthly financial statements, property-levelproperty level operating performance versus budgeted expectations, conducts periodic operational review calls with operators and conducts periodic property inspections or site visits. AllWe do not consider this information to be a non-GAAP measure that can be reconciled to our GAAP financial statements because it includes the performance of properties that are leased to third-party tenants. However, all of the aforementioned operating and statistical metrics assist us in determining the ability of our properties or operators to achieve market rental rates, to assess the overall performance of our diversified healthcare portfolio, and to review compliance with leases, debt, licensure, real estate taxes, and other collateral.
Furthermore, in our evaluation of the properties, we consider the operating stage of the investments within the following stages: development, value-add or stabilizing and stabilized. DevelopmentWhile we do not currently have any real estate under development, development properties are those in which we or our joint venture have purchased land for the development of new operating properties. We typically hold rights as the owner or managing member of the development properties while a third-party or our joint venture partner manages the development, construction and certain day-to-day operations of the property subject to our oversight. Stabilizing properties are either developed properties that have been fully constructed and in lease-up phase (typically 18 months post-construction) or existing (“value-add”) properties in which we expect to make capital investments to upgrade or expand. A property is considered stabilized upon the earlier of (i) when the property reaches 85% occupancy for a trailing three month period, or (ii) a two year period from acquisition or completion of development. For those assets that are above an 85% occupancy level and subsequently drop below 85%, they are reclassified to stabilizing until the assets attain the trailing three month 85% occupancy metric.
During the year ended December 31, 2016,2017, we continued to invest in existing ground-up development and value-add or stabilizing properties. During the construction and lease-up phase, these types of investments are expected to generate limited cash flows from operations and may result in near term downward pressure on our results of operations and net asset valuation. However, we believe that investing a portion of our capital into these types of properties is beneficial because they are expected to provide a higher yield on cost and higher net asset valuations in the long-term as compared to stabilized acquisitions. Additionally, these types of assets will result in our portfolio having a lower average age, which we believe will enhance our overall market value over the long-term.
Based on revenues as of December 31, 2016, the Company’s portfolio is comprised of 93.6% stabilized properties, of which 1.2% are completed developments, and 6.4% value-add or stabilizing properties, of which 0.6% are recently completed developments that are currently in the lease-up phase.
The following table lists our occupancy, RevPOU and rent per square feet by asset class within our healthcare portfolio as of December 31, 2016:
Operating Stage |
| Occupancy % |
|
| RevPOU |
| Rent per Square Feet | |||
Value-add or Stabilizing: |
|
|
|
|
|
|
|
|
| |
| Seniors Housing |
| 65.4% |
|
| $ | 4,216 |
| $ | ― |
| Medical Office |
| 80.1% |
|
| $ | ― |
| $ | 2.70 |
Stabilized: |
|
|
|
|
|
|
|
|
| |
| Seniors Housing |
| 88.6% |
|
| $ | 4,256 |
| $ | ― |
| Medical Office |
| 94.8% |
|
| $ | ― |
| $ | 2.65 |
| Acute Care |
| 100.0% |
|
| $ | ― |
| $ | 3.08 |
| Post-Acute Care (1) |
| 100.0% |
|
| $ | 7,115 |
| $ | 3.04 |
_____________
FOOTNOTE:
|
|
Real Estate Under Development
As of December 31, 2016, we had interests in four properties under development and two properties with expansion projects that will provide us with 524 additional units upon completion as follows:
Property Name (and Location) |
| Developer |
| Number of Units Upon Completion |
| Development Costs Incurred (in millions) (1) |
| Remaining Development Budget (in millions) (2) |
| Construction Loan Capacity (in millions) |
| Estimated Completion Date | |||
Developments |
|
|
|
|
|
|
|
|
|
|
|
|
|
|
|
Welbrook Senior Living Grand Junction (Grand Junction, CO) |
| Embree Asset Group, Inc. |
| 50 units |
| $ | 12.9 |
| $ | 1.9 |
| $ | ― |
| February 2017 |
Waterstone on Augusta (Greenville, SC) |
| T&D Greenville, LLC |
| 114 units |
|
| 24.2 |
|
| 5.0 |
|
| 6.2 |
| February 2017 |
Wellmore of Lexington (Lexington, SC) |
| Maxwell Group, Inc. |
| 200 units |
|
| 39.0 |
|
| 20.1 |
|
| 22.1 |
| 2nd quarter 2017 |
Dogwood Forest of Grayson (Grayson, GA) |
| Solomon Development Services, LLC |
| 99 units |
|
| 17.3 |
|
| 12.9 |
|
| 13.0 |
| 3rd quarter 2017 |
Expansion Projects |
|
|
|
|
|
|
|
|
|
|
|
|
|
|
|
Tranquillity at Fredericktowne (Frederick, MD) |
| Capital Health Partners |
| 32 units |
|
| 1.4 |
|
| 4.5 |
|
| ― |
| 2nd quarter 2017 |
Brookridge Heights Assisted Living & Memory Care (Marquette, MI) |
| Capital Health Partners |
| 29 units |
|
| 2.4 |
|
| 2.6 |
|
| ― |
| 2nd quarter 2017 |
|
| Total |
| 524 units |
| $ | 97.2 |
| $ | 47.0 |
| $ | 41.3 |
|
|
_____________
FOOTNOTES:
|
|
|
|
The development budgets include the cost of the land, construction costs, development fees, financing costs, start-up costs and initial operating deficits of the respective properties. Generally, we have delegated to an affiliate of the developer of the respective community the management and administration of the development and construction. Each developer is generally responsible for any cost overruns beyond the approved development budget for the applicable project.
Significant Tenants and Operators
Our real estate portfolio is operated by a mix of national or regional operators and the following represent the significant tenants and operators that lease or manage 5% or more of our rentable space as of December 31, 2016:2017:
Tenants |
| Number of Properties |
| Rentable Square Feet (in thousands) |
| Percentage of Rentable Square Feet |
| Lease Expiration Year |
| Number of Properties |
|
| Rentable Square Feet (in thousands) |
|
| Percentage of Rentable Square Feet |
|
| Lease Expiration Year | |||
TSMM Management, LLC |
| 13 |
| 1,261 |
| 21.6% |
| 2022-2025 |
|
| 13 |
|
|
| 1,261 |
|
|
| 22.7 | % |
| 2022-2025 |
Parc Communities, LLC (1) |
| 2 |
| 385 |
| 6.6% |
| 2017 | ||||||||||||||
Wellmore, LLC |
|
| 2 |
|
|
| 366 |
|
|
| 6.6 | % |
| 2026-2027 | ||||||||
Novant Medical Group, Inc. |
| 5 |
| 320 |
| 5.5% |
| 2017-2025 |
|
| 5 |
|
|
| 305 |
|
|
| 5.5 | % |
| 2018-2025 |
Other tenants and vacancies (2) |
| 66 |
| 3,881 |
| 66.3% |
| 2017-2038 | ||||||||||||||
Other (1) |
|
| 66 |
|
|
| 3,617 |
|
|
| 65.2 | % |
| 2018-2038 | ||||||||
|
| 86 |
| 5,847 |
| 100.0% |
|
|
|
| 86 |
|
|
| 5,549 |
|
|
| 100.0 | % |
|
|
|
|
|
|
|
|
|
|
|
|
|
|
|
|
|
|
|
|
|
|
|
|
|
Operators |
| Number of Properties |
| Rentable Square Feet (in thousands) |
| Percentage of Rentable Square Feet |
| Operator Expiration Year |
| Number of Properties |
|
| Rentable Square Feet (in thousands) |
|
| Percentage of Rentable Square Feet |
|
| Operator Expiration Year | |||
Integrated Senior Living, LLC |
| 6 |
| 1,803 |
| 31.7% |
| 2019-2021 |
|
| 7 |
|
|
| 2,039 |
|
|
| 32.2 | % |
| 2019-2021 |
Prestige Senior Living, LLC |
| 13 |
| 895 |
| 15.8% |
| 2019 |
|
| 13 |
|
|
| 895 |
|
|
| 14.1 | % |
| 2019 |
MorningStar Senior Management, LLC |
| 4 |
| 834 |
| 14.7% |
| 2018-2019 | ||||||||||||||
Morningstar Senior Management, LLC |
|
| 4 |
|
|
| 834 |
|
|
| 13.2 | % |
| 2018-2019 | ||||||||
SLH Austin Manager, LLC |
| 3 |
| 432 |
| 7.6% |
| 2020-2025 |
|
| 3 |
|
|
| 431 |
|
|
| 6.8 | % |
| 2020-2025 |
HarborChase Retirement, LLC |
| 4 |
| 380 |
| 6.7% |
| 2018-2024 | ||||||||||||||
Other operators (2) |
| 18 |
| 1,336 |
| 23.5% |
| 2017-2025 | ||||||||||||||
Parc Communities, LLC |
|
| 2 |
|
|
| 385 |
|
|
| 6.1 | % |
| 2022 | ||||||||
Harborchase Retirement, LLC |
|
| 4 |
|
|
| 380 |
|
|
| 6.0 | % |
| 2018-2024 | ||||||||
Other (1) |
|
| 18 |
|
|
| 1,363 |
|
|
| 21.6 | % |
| 2018-2025 | ||||||||
|
| 48 |
| 5,680 |
| 100.0% |
|
|
|
| 51 |
|
|
| 6,327 |
|
|
| 100.0 | % |
|
|
___________________
FOOTNOTES:FOOTNOTE:
(1) |
|
| Comprised of various tenants or operators each of which comprise less than 5% of our consolidated rentable square footage. |
While we are not directly impacted by the performance of the underlying properties leased to third-party tenants, we believe that the financial and operational performance of our tenants provides an indication about the stability of our tenants and their ability to pay rent. To the extent that our tenants, managers or joint venture partners experience operating difficulties and become unable to generate sufficient cash to make rent payments to us, there could be a material adverse impact on our consolidated results of operations, liquidity and/or financial condition. Our tenants and managers are generally contractually required to provide this information to us in accordance with their respective lease, management and/or joint venture agreements. Therefore, in order to mitigate the aforementioned risk, we monitor our investments through a variety of methods determined by the type of property.
We monitor the credit of our tenants to stay abreast of any material changes in quality. We monitor tenant credit quality by (1) reviewing financial statements that are publicly available or that are required to be delivered to us under the applicable lease, (2) direct interaction with onsite property managers, (3) monitoring news and rating agency reports regarding our tenants (or their parent companies) and their underlying businesses, (4) monitoring the timeliness of rent collections and (5) monitoring lease coverage.
Tenant Lease Expirations
As of December 31, 2016,2017, we owned 86 properties that were leased to tenants on a triple-net, net or modified gross basis, and accounted for as operating leases. During the year ended December 31, 2016,2017, our rental revenues from operating leasesincome represented approximately 33.1%32.5% of our total revenues. As of December 31, 2016,2017, approximately 67.2%57.0% of our rental revenues from operating leases wereincome was scheduled to expire in 20212023 or later. We do not expect lease turnover to have a significant impact on our cash flows from operations in the near term as approximately 55.9% of our 2017 expiring leased square feet relates to the Parc Communities (discussed above).term.
Our asset management team collaborates with existing tenants to understand their current and anticipated space needs in advance of their lease term renewal date. As of December 31, 2016,2017, approximately 32.8%43.0% of our rental revenues from operating leases wereincome was scheduled to expire through 2020.2022. We work with and begin lease-related negotiations well in advance of the lease expirations or renewal period options in order for us to maintain a balanced lease rollover schedule and
high occupancy levels, as well as to enhance the value of our properties through extended lease terms. Lease extensions are likely to create an obligation to pay lease commissions, lease incentives and/or tenant improvements and may also provide our tenants with some periods of reduced and/or “free rent.”Certain amendments or modifications to the terms of existing leases could require lender approval.
Under the terms of our triple-net lease agreements, each tenant is responsible for the payment of property taxes, general liability insurance, utilities, repairs and maintenance, including structural and roof expenses (“Triple-net Lease”). Each tenant is expected to pay real estate taxes directly to taxing authorities. However, if the tenant does not pay, we will be liable.
Under the terms of our net, modified gross or similar lease agreements for multi-tenant properties with third-party property managers, each tenant is responsible for the payment of their proportionate share of property taxes, general liability insurance, utilities, repairs and common area maintenance (“Modified Lease”). These amounts are billed monthly and recorded as tenant reimbursement income in the accompanying consolidated statements of operations.
The following table lists, on an aggregate basis, scheduled expirations for the next 10 years ending December 31st and thereafter on our consolidated healthcare investment portfolio (excluding real estate under development), assuming that none of the tenants exercise any of their renewal options (in thousands, except for number of tenants and percentages) as of December 31, 2016:2017:
Year of Expiration (1) |
| Number of Tenants |
| Expiring Leased Square Feet |
|
| Expiring Annualized Base Rents (2) |
| Percentage of Expiring Annual Base Rents |
| Number of Tenants |
|
| Expiring Leased Square Feet |
|
| Expiring Annualized Base Rents (2) |
|
| Percentage of Expiring Annual Base Rents |
| ||||
2017 |
| 87 |
| 689 |
|
| 11,320 |
| 10.1% | ||||||||||||||||
2018 |
| 99 |
| 396 |
| 8,139 |
| 7.3% |
|
| 83 |
|
|
| 372 |
|
|
| 9,614 |
|
|
| 8.0 | % | |
2019 |
| 77 |
| 328 |
| 6,496 |
| 5.8% |
|
| 74 |
|
|
| 337 |
|
|
| 7,958 |
|
|
| 6.6 | % | |
2020 |
| 57 |
| 324 |
| 6,146 |
| 5.5% |
|
| 67 |
|
|
| 400 |
|
|
| 9,185 |
|
|
| 7.6 | % | |
2021 |
| 46 |
| 246 |
| 4,863 |
| 4.4% |
|
| 57 |
|
|
| 295 |
|
|
| 7,331 |
|
|
| 6.1 | % | |
2022 |
| 26 |
| 1,027 |
| 15,210 |
| 13.6% |
|
| 42 |
|
|
| 1,088 |
|
|
| 17,571 |
|
|
| 14.7 | % | |
2023 |
| 83 |
| 768 |
| 18,345 |
| 16.4% |
|
| 74 |
|
|
| 815 |
|
|
| 19,392 |
|
|
| 16.1 | % | |
2024 |
| 8 |
| 239 |
| 5,712 |
| 5.1% |
|
| 14 |
|
|
| 272 |
|
|
| 6,742 |
|
|
| 5.6 | % | |
2025 |
| 32 |
| 604 |
| 11,660 |
| 10.4% |
|
| 33 |
|
|
| 555 |
|
|
| 10,789 |
|
|
| 9.0 | % | |
2026 |
| 4 |
| 154 |
| 1,538 |
| 1.4% |
|
| 6 |
|
|
| 160 |
|
|
| 3,509 |
|
|
| 2.9 | % | |
2027 |
|
| 14 |
|
|
| 496 |
|
|
| 6,367 |
|
|
| 5.3 | % | |||||||||
Thereafter |
| 38 |
| 798 |
| 22,322 |
| 20.0% |
|
| 23 |
|
|
| 759 |
|
|
| 21,665 |
|
|
| 18.1 | % | |
Total |
| 557 |
| 5,573 |
| $ | 111,751 |
| 100.0% |
|
| 487 |
|
|
| 5,549 |
|
| $ | 120,123 |
|
|
| 100.0 | % |
Weighted Average Remaining Lease Term (in years): (3)6.8 |
|
|
_________________
FOOTNOTES:
(1) | Represents current lease expiration and does not take into consideration lease renewals available under existing leases at the option of the tenants. |
(2) | Represents the current base rent, excluding tenant reimbursements and the impact of future rent bumps included in leases, multiplied by 12 and included in the year of expiration. |
(3) | Weighted average remaining lease term is the average remaining term weighted by annualized current base rents. |
Share Price Valuation
We have adopted a valuation policy designed to follow recommendations of the Investment Program Association (“IPA”), in the IPA Practice Guideline 2013-01, Valuations of Publicly Registered Non-Listed REITs, which was adopted by the IPA effective May 1, 2013 (“IPA Valuation Guideline”). The purpose of our valuation policy is to establish guidelines to be followed in determining the net asset value per share of our common stock for regulatory and investor reporting and on-going evaluation of investment performance. Net asset value (“NAV”) means the fair value of real estate, real estate-related investments and all other assets less the fair value of total liabilities. Our NAV will be determined based on the fair value of our assets less liabilities under market conditions existing as of the time of valuation and assuming the allocation of the resulting net value among our stockholders after any adjustments for incentive, preferred or special interests, if applicable.
In accordance with our valuation policy and as recommended by the IPA Valuation Guideline, we expect to produce an estimated NAV per share at least annually as of December 31 and disclose such amount as soon as possible after year-end. The audit committee of our board of directors, comprised of our independent directors (“Valuation Committee”), oversees our valuation process and engages one or more third-party valuation advisors to assist in the process of determining the estimated NAV per share of our common stock.
To assist our board of directors in its determination of the estimated NAV per share of our common stock, our board of directors engaged an independent valuation firm, CBRE Capital Advisors, Inc. (“CBRE Cap”), to provide property-level and aggregate valuation analyses of the Company and a range for the NAV per share of our common stock and to consider other information provided by our Advisor.
Upon the recommendation of our Valuation Committee, our board of directors approved our estimateestimated NAV per share to be $10.04$10.32 as of December 31, 2016. In accordance with our valuation policy and as recommended by the IPA Valuation Guideline, we expect to produce an2017, which includes deductions for estimated NAV per share at least annually as of December 31 and disclose such amount as soon as possible after year-end.
transaction costs.
For a detailed discussion of the determination of the estimated NAV per share of our common stock, including our valuation process and methodology, see Item 5. “Market For Registrant’s Common Equity, Related Stockholder Matters And Issuer Purchases Of Equity Securities – Stock Valuation.”
Distribution Policy
In order to qualify as a REIT, we are required to make distributions, other than capital gain distributions, to our stockholders each year in the amount of at least 90% of our taxable income. We may make distributions in the form of cash or other property, including distributions of our own securities. While we generally expect to pay distributions from cash flows provided by operating activities, we have and may continue to cover periodic shortfalls between distributions paid and cash flows provided by operating activities from other sources; such as from cash flows provided by financing activities (“Other Sources”), a component of which could include borrowings, whether collateralized by our assets or unsecured, or proceeds from our distribution reinvestment plan (“Reinvestment Plan”). Refer to Item 5. “Market for Registrant’s Common Equity, Related Stockholder Matters and Issuer Purchases of Equity Securities – Distributions” for additional information regarding our distributions.
Borrowings
We have borrowed funds to acquire properties, make loans and other permitted investments and to pay certain related fees. We may borrow money to pay distributions to stockholders, for working capital and for other corporate purposes. We also intend to encumber assets in connection with such borrowings and are subject to certain customary covenants and limitations in connection with our borrowings. The aggregate amount of long-term financing is not expected to exceed 60% of the carrying value of our total assets on an annual basis.
There is no limitation on the amount we may invest in any single property or other asset or on the amount we can borrow for the purchase of any individual property or other investment. Our board of directors has adopted a policy to generally limit our aggregate borrowings to approximately 75% of the aggregate value of our assets, unless substantial justification exists that borrowing a greater amount is in our best interests. Our intent is to target our aggregate borrowings ranging from 40% to 60% of the aggregate value of our assets now that we own a seasoned and stable asset portfolio. As of December 31, 20162017 and 2015,2016, we had an aggregate debt leverage ratio of approximately 55.8%59.5% and 52.6%55.8%, respectively, of the aggregate carrying value of our assets.
Competition
The current market for healthcare real estate is highly competitive as is the leasing market for such properties. We compete for investments and financing with many other entities engaged in real estate investment activities, including individuals, corporations, bank and insurance company investment accounts, REITs, real estate limited partnerships, many of which will have greater resources and lower costs of capital than we do. The level of competition impacts both our ability to manage our investments and locate suitable tenants. We may also compete with affiliates to acquire properties and other investments if we determine to make additional investments.
Our tenants and operators compete with other properties that provide comparable services in their local markets. Tenants and operators compete for patients, tenants and residents based on a variety of factors including, but not limited to: quality of care, reputation, location, services offered, physician groups, staff and price. We also face competition from other properties for tenants or residents, such as physicians and other health care providers that provide comparable facilities and services.
Employees
We are externally managed and as such we do not have any employees.
Financial Information about Industry Segments
We have determined that we operate in one business segment, real estate ownership, which consists of owning, managing, leasing, acquiring, developing, investing in, and as conditions warrant, disposing of real estate assets. We internally evaluate all of our real estate assets as one operating segment and, accordingly, we do not report segment information.
The following summary of the taxation of the Company and the material federal income tax consequences to the holders of our equity securities is for general information only and is not tax advice. This summary does not address all aspects of taxation that may be relevant to certain types of holders of securities (including, but not limited to, insurance companies, tax-exempt entities, financial institutions or broker-dealers, persons holding our securities as part of a hedging, integrated conversion, or constructive sale transaction or a straddle, traders in securities that use a mark-to-market method of accounting for their securities, investors in pass-through entities and foreign corporations and persons who are not citizens or residents of the United States)U.S.).
This summary does not discuss all of the aspects of U.S. federal income taxation that may be relevant in light of a particular investment or other circumstances. In addition, this summary does not discuss any state or local income taxation or foreign income taxation or other tax consequences. This summary is based on current U.S. federal income tax law. Subsequent developments in U.S. federal income tax law, including changes in law or differing interpretations, which may be applied retroactively, could have a material effect on the U.S. federal income tax consequences of purchasing, owning and disposing of our securities as set forth in this summary.
On December 22, 2017, the U.S. President signed into law H.R. 1, the “Tax Cuts and Jobs Act,” (the “Tax Act”) which generally took effect for taxable years beginning on or after January 1, 2018 and, in certain instances, is scheduled to expire for taxable years beginning on or after January 1, 2026.
The Tax Act makes many changes to the U.S. federal income tax laws that significantly impact the taxation of individuals, corporations (both regular subchapter C corporations as well as corporations that have elected to be taxed as REITs), and the taxation of taxpayers with overseas assets and operations. Among its changes, the Tax Act (1) temporarily reduces the top individual income tax rate to 37% (from 39.6%), (2) permanently replaces the progressive corporate tax rate structure with a flat corporate tax rate of 21%, (3) repeals the corporate alternative minimum tax, (4) generally limits net operating loss (“NOLs”) deductions to 80% of the taxable income in the carryforward year and eliminates the ability to carryback NOLs that arise in taxable years ending after December 31, 2017, and (5) generally limits the deduction for net business interest expense to 30% of “adjusted taxable income” with certain exceptions for electing real property trades or businesses.
To date, the U.S. Internal Revenue Service (“IRS”) has issued only limited guidance with respect to certain provisions of the Tax Act. There are numerous interpretive issues and ambiguities that will require guidance and that are not clearly addressed in the conference report that accompanied the Tax Act. Technical corrections legislation will likely be needed to clarify certain of the new provisions and give proper effect to congressional intent. There can be no assurance, however, that technical corrections or other legislative changes that may be needed to prevent unintended or unforeseen tax consequences will be enacted by Congress anytime soon. Although this summary addresses material provisions enacted by the Tax Act, which may affect REITs and their stockholders, given the complexity of this new law, and the limited administrative guidance issued as of the date of this Annual Report, prospective stockholders should consult their own tax advisors regarding its potential impact on the U.S. federal income tax consequence to them in light of their particular circumstances.
General. We elected to be taxed as a real estate investment trustREIT under the U.S. Internal Revenue Code of 1986, as amended (the “Code”) beginning with our taxable year ended December 31, 2012. We believe that, commencing with such taxable year, we have been organized and have operated in a manner so as to qualify as a REIT for U.S. federal income tax purposes.
Qualification and taxation as a REIT has depended upon, and will continue to depend upon, our ability to meet on a continuing basis, through actual operating results, distribution levels, diversity of share ownership and various qualification requirements imposed upon REITs by the Code. Our ability to qualify as a REIT also requires that we satisfy certain asset tests (discussed below), some of which depend upon the fair market values of assets directly or indirectly owned by us. Such values may not be susceptible to a precise determination. While we intend to continue to operate in a manner that will allow us to qualify as a REIT, no assurance can be given that the actual results of our operations for any taxable year will satisfy such requirements for qualification and taxation as a REIT.
As a REIT, we generally will not be subject to federal corporate income taxes on that portion of our ordinary income or capital gain we distribute currently to our stockholders, because the REIT provisions of the Code generally allow a REIT to deduct distributions, which are taxable dividends, paid to its stockholders. This substantially eliminates the federal double taxation on earnings (taxation at both the corporate level and stockholder level) that usually results from an investment in a corporation. With limited exceptions, dividends from us or from other entities that are taxed as REITs are generally not eligible for the capital gain rate and will continue to be taxed at rates applicable to ordinary income. Commencing with taxable years beginning on or after January 1, 2018 and continuing through 2025, the Tax Act temporarily reduces the effective tax rate on ordinary REIT dividends (i.e., dividends other than capital gain dividends and dividends attributable to certain qualified dividend income received by us) for U.S. stockholders (as hereinafter defined) of our common stock that are individuals, estates or trusts by permitting such stockholders to claim a deduction in determining their taxable income equal to 20% of any such dividends they receive. Taking into account the Tax Act’s reduction in the maximum individual federal income tax rate from 39.6% to 37%, this results in a maximum effective rate of regular income tax on ordinary REIT dividends of 29.6% through 2025 (as compared to the 20% maximum federal income tax rate applicable to qualified dividend income received from a non-REIT corporation).
Any net operating losses,NOLs, foreign tax credits and other tax attributes generally do not pass through to our stockholders, subject to special rules for certain items such as the capital gains that we recognize.
As a result of the enactment of the Tax Act, effective for taxable years beginning on or after January 1, 2018 our domestic taxable REIT subsidiaries (“TRSs”) are subject to U.S. federal income tax on their taxable income at a rate of 21% (as well as applicable state and local income tax), but NOL carryforwards of TRS losses arising in taxable years beginning after December 31, 2017 may be deducted only to the extent of 80% of TRS taxable income in the carryforward year (computed without regard to the NOL deduction). In contrast to prior law, which permitted unused NOL carryforwards to be carried back two years and forward 20 years, the Tax Act provides that losses arising in taxable years ending after December 31, 2017 can no longer be carried back but can be carried forward indefinitely.
Commencing in taxable years beginning after December 31, 2017, Section 163(j) of the Code, as amended by the Tax Act, limits the deductibility of net interest expense paid or accrued on debt properly allocable to a trade or business to 30% of “adjusted taxable income,” subject to certain exceptions. Any deduction in excess of the limitation is carried forward and may be used in a subsequent year, subject to the 30% limitation. “Adjusted taxable income” is determined without regard to certain deductions, including those for net interest expense, NOL carryforwards and, for taxable years beginning before January 1, 2022, depreciation, amortization and depletion. Provided the taxpayer makes a timely election (which is irrevocable), the 30% limitation does not apply to a trade or business involving real property development, redevelopment, construction, reconstruction, rental, operation, acquisition, conversion, disposition, management, leasing or brokerage, within the meaning of Section 469(c)(7)(C) of the Code. If this election is made, depreciable real property (including certain improvements) held by the relevant trade or business must be depreciated under the alternative depreciation system under the Code, which is generally less favorable than the generally applicable system of depreciation under the Code. In general, while there is no authority under such provision or in the legislative history of the Tax Act that specifically addresses healthcare properties or other facilities, including senior housing facilities and MOB, we believe that our leasing, management and operation of such facilities and buildings should constitute a real property trade or business, and we, or our TRSs, may elect not to have the interest deduction limitation apply to that trade or business. If we, or our TRSs, do
not make the election or if the election is determined not to be available with respect to all or certain of our, or our TRSs, business activities, the new interest deduction limitation could result in us having more REIT taxable income and thus increase the amount of distributions we must make to comply with the REIT requirements and avoid incurring corporate level tax. Similarly, the limitation could cause our TRSs to have greater taxable income and thus potentially greater corporate tax liability.
Even if we qualify for taxation as a REIT, however, we will be subject to federal income taxation as follows:
We will be taxed at the regular corporate ratesrate on our undistributed taxable income, including undistributed net capital gains.
Under some circumstances, we may be subject to an “alternative minimum tax.”
If we have net gain for tax purposes from prohibited transactions (which are, in general, sales or other dispositions of property, other than foreclosure property, held primarily for sale to customers in the ordinary course of business), such gain will be subject to a 100% tax.
If we elect to treat property that we acquire in connection with a foreclosure of a mortgage loan or certain leasehold terminations as “foreclosure property,” we may avoid the 100% tax on gain from a sale of that property (if the sale would otherwise constitute a prohibited transaction), but the income from the sale or operation of the property may be subject to corporate income tax at the highest applicable rate.
If we should fail to satisfy the asset test other than certain de minimis violations or other requirements applicable to REITs, as described below, yet nonetheless maintain our qualification as a REIT because there is reasonable cause for the failure and other applicable requirements are met, we may be subject to an excise tax. In that case, the amount of the tax will be at least $50,000 per failure, and, in the case of certain asset test failures, will be determined as the amount of net income generated by the assets in question multiplied by the highest corporate tax rate if that amount exceeds $50,000 per failure.
If we fail to satisfy either of the 75% or 95% income tests (discussed below) but have nonetheless maintained our qualification as a REIT because certain conditions have been met, we will be subject to a 100% tax on an amount based on the magnitude of the failure, as adjusted to reflect the profit margin associated with our gross income.
If we fail to distribute during each year at least the sum of (i) 85% of our REIT ordinary income for the year, (ii) 95% of our REIT capital gain net income for such year, and (iii) any undistributed taxable income from prior periods, then we will be subject to a 4% excise tax on the excess of the required distribution over the sum of (A) the amounts actually distributed, plus (B) retained amounts on which corporate level tax is paid by us.
We may elect to retain and pay tax on our net long-term capital gains. In that case, a U.S. stockholder would be taxed on its proportionate share of our undistributed long-term capital gains and would receive a credit or refund for its proportionate share of the tax we paid.
If we acquire appreciated assets from a C corporation that is not a REIT (i.e., a corporation generally subject to corporate level tax) in a transaction in which the C corporation would not normally be required to recognize any gain or loss on disposition of the asset and we subsequently recognize gain on the disposition of the asset during the five-year period beginning on the date on which we acquired the asset, then a portion of the gain may be subject to tax at the highest regular corporate rate, unless the C corporation made an election to treat the asset as if it were sold for its fair market value at the time of our acquisition. We will also be required to distribute prior non-REIT earnings and profits.
We may be required to pay monetary penalties to the Internal Revenue Service (“IRS”)IRS in certain circumstances, including if we fail to meet record keeping requirements intended to monitor our compliance with rules relating to the composition of a REIT’s stockholders.
The earnings of our taxable REIT subsidiariesTRSs are subject to federal corporate income tax. In addition, a 100% excise tax will be imposed on the REIT and a corporate level tax on the TRS for transactions between a TRS and the REIT that are deemed not to be conducted on an arm’s length basis.
In addition, we and our subsidiaries may be subject to a variety of taxes, including payroll taxes and state, local, foreign, property and other taxes, on our assets and operations. We could also be subject to tax in situations and on transactions not presently contemplated.
Requirements for Qualification as a REIT. Our qualification as a REIT has depended upon and will continue to depend upon our meeting and continuing to meet the requirements discussed below relating to our organization, sources of income, nature of assets and distributions of income to our stockholders.
Organizational Requirements. In order to qualify for taxation as a REIT under the Code we must meet tests regarding our income and assets described below and we must (i) be a corporation, trust or association that would be taxable as a domestic corporation but for the REIT provisions of the Code; (ii) be managed by one or more trustees or directors; (iii) have our beneficial ownership evidenced by transferable shares; (iv) not be a financial institution or an insurance company subject to special provisions of the federal income tax laws; (v) use a calendar year for federal income tax purposes; (vi) have at least 100 stockholders for at least 335 days of each taxable year of 12 months or during a proportionate part of a taxable year of less than 12 months; and (vii) not be closely held, as defined for purposes of the REIT provisions of the Code.
We would be treated as closely held if, during the last half of any taxable year, more than 50% in value of our outstanding capital shares is owned, directly or indirectly through the application of certain attribution rules, by five or fewer individuals, as defined in the Code to include certain entities. Items (vi) and (vii) above do not apply until after the first taxable year for which we elect to be taxed as a REIT. If we comply with U.S. Department of Treasury Regulationsregulations (“Treasury Regulations”) that provide procedures for ascertaining the actual ownership of our common stock for each taxable year and we did not know, and with the exercise of reasonable diligence could not have known, that we failed to meet item (vii) above for a taxable year, we will be treated as having met item (vii) for that year.
We have elected to be taxed as a REIT commencing with our taxable year ended December 31, 2012, and we intend to satisfy the other requirements described in items (i) through (v) above at all times during each of our taxable years. In addition, our charter contains restrictions regarding ownership and transfer of shares of our common stock that are intended to assist us in continuing to satisfy the share ownership requirements in items (vi) and (vii) above.
For purposes of the requirements described herein, any corporation that is a qualified REIT subsidiary of ours will not be treated as a corporation separate from us and all assets, liabilities and items of income, deduction and credit of our qualified REIT subsidiaries will be treated as our assets, liabilities and items of income, deduction and credit. A qualified REIT subsidiary is a corporation, other than a TRS (described below under “— Operational Requirements — Asset Tests”), of which all of its capital shares are owned by a REIT.
In the case of a REIT that is a partner in an entity treated as a partnership for federal tax purposes, the REIT is treated as owning its proportionate share, based on its capital interest, of the assets of the partnership and as earning its allocable share of the gross income of the partnership for purposes of the requirements described herein. In addition, the character of the assets and gross income of the partnership will retain the same character in the hands of the REIT for purposes of the REIT requirements, including the asset and income tests described below. As a result, our proportionate share, based on our capital interest, of the assets, liabilities and items of income of our operating partnership and of any other partnership, joint venture, limited liability company or other entity treated as a partnership for federal tax purposes in which we or the operating partnership have an interest, will be treated as our assets, liabilities and items of income.
The Code provides relief from violations of the REIT gross income requirements, as described below under “— Operational Requirements — Gross Income Tests,” in cases where a violation is due to reasonable cause and not willful neglect, and other requirements are met, including the payment of a penalty tax that is based upon the magnitude of the violation. In addition, the Code includes provisions that extend similar relief in the case of certain violations of the REIT asset requirements (see “— Operational Requirements — Asset Tests” below) and other REIT requirements, again provided that the violation is due to reasonable cause and not willful neglect, and other conditions are met, including the payment of a penalty tax. If we fail to satisfy any of the various REIT requirements, there can be no assurance that these relief provisions would be available to enable us to maintain our qualification as a REIT. If relief provisions are available, the amount of any resultant penalty tax could be substantial.
Operational Requirements — Gross Income Tests. To maintain our qualification as a REIT, we must satisfy annually two gross income requirements:
At least 75% of our gross income, excluding gross income from prohibited transactions, for each taxable year must be derived directly or indirectly from investments relating to real property or mortgages on real property and from other specified sources, including qualified temporary investment income, as described below. Gross income includes “rents from real property” (as defined in the Code) and, in some circumstances, interest, but excludes gross income from dispositions of property held primarily for sale to customers in the ordinary course of a trade or business. These dispositions are referred to as “prohibited transactions.” This is the “75% Income Test.”
At least 95% of our gross income, excluding gross income from prohibited transactions, for each taxable year must be derived from the real property investments described above and generally from dividends and interest and gains from the sale or disposition of shares of common stock or securities or from any combination of the foregoing. This is the “95% Income Test.”
The rents we will receive or be deemed to receive will qualify as “rents from real property” for purposes of satisfying the gross income requirements for a REIT only if the following conditions are met:
The amount of rent received from a tenant must not be based in whole or in part on the income or profits of any Person; however, an amount received or accrued generally will not be excluded from the term “rents from real property” solely by reason of being based on a fixed percentage or percentages of gross receipts or sales.
In general, neither we nor an owner of 10% or more shares of our common stock may directly or constructively own 10% or more of a tenant, which we refer to as a “Related Party Tenant,” or a subtenant of the tenant (in which case only rent attributable to the subtenant is disqualified).
Rent attributable to personal property leased in connection with a lease of real property cannot be greater than 15% of the total rent received under the lease, as determined based on the average of the fair market values as of the beginning and end of the taxable year.
We normally must not operate or manage the property or furnish or render services to tenants, other than through an “independent contractor” (as defined in the Code) who is adequately compensated and from whom we do not derive any income or through a TRS (discussed below). However, a REIT may provide services with respect to its properties, and the income derived therefrom will qualify as “rents from real property” if the services are “usually or customarily rendered” (as defined in the Code) in connection with the rental of space only and are not otherwise considered “rendered to the occupant” (as defined in the Code). Even if the services provided by us with respect to a property are impermissible customer services, the income derived therefrom will qualify as “rents from real property” if such income does not exceed 1% of all amounts received or accrued with respect to that property.
Interest income constitutes qualifying mortgage interest for purposes of the 75% Income Test to the extent that the obligation upon which such interest is paid is secured by a mortgage on real property. If we receive interest income with respect to a mortgage loan that is secured by both real property and other property, and the highest principal amount of the loan outstanding during a taxable year exceeds the fair market value of the real property on the date that we acquired or originated the mortgage loan, the interest income will be apportioned between the real property and the other collateral, and our income from the arrangement will qualify for purposes of the 75% income test only to the extent that the interest is allocable to the real property. Even if a loan is not secured by real property, or is under-secured, the income that it generates may nonetheless qualify for purposes of the 95% Income Test.
To the extent the terms of a loan provide for contingent interest that is based on the cash proceeds realized upon the sale of the property securing the loan (a “Shared Appreciation Provision”), income attributable to the participation feature will be treated as gain from sale of the underlying property, which generally will be qualifying income for purposes of both the 75% Income Test and 95% Income Test, provided that the real property is not held as inventory or dealer property or primarily for sale to customers in the ordinary course of business. Similar to the treatment of contingent rents from real property (discussed above), to the extent that we derive interest income from a mortgage loan where all or a portion of the amount of interest or rental income payable is contingent, such income generally will qualify for purposes of the 75% Income Test and 95% Income Test only if it is based upon the gross receipts or sales and not on the net income or profits of the borrower.
We may invest in mezzanine loans, which are loans secured by equity interests in an entity that directly or indirectly owns real property, rather than by a direct mortgage of the real property. The IRS has issued Revenue Procedure 2003-65, which provides a safe harbor applicable to mezzanine loans. Under the Revenue Procedure, if a mezzanine loan meets each of the requirements contained in the Revenue Procedure, (i) the mezzanine loan will be treated by the IRS as a real estate asset for purposes of the Asset Tests described below, and (ii) interest derived from the mezzanine loan will be treated as qualifying mortgage interest for purposes of the 75% Income Test. Although the Revenue Procedure provides a safe harbor on which taxpayers may rely, it does not prescribe rules of substantive tax law. We intend to structure any investments in mezzanine loans or similar products in a manner that generally complies with the various requirements applicable to our qualification as a REIT. Certain of our mezzanine loans may qualify under the safe harbor set forth in the Revenue Procedure. However, we may make or acquire some mezzanine loans that do not qualify for the safe harbor. To the extent that any of our mezzanine loans do not meet all of the requirements for reliance on the safe harbor set forth in the Revenue Procedure, there can be no assurance that the IRS will not challenge the tax treatment of these loans.
We may, from time to time, enter into hedging transactions with respect to interest rate exposure or currency fluctuation on one or more of our assets or liabilities. Any such hedging transactions could take a variety of forms, including the use of derivative instruments such as interest rate swap contracts, interest rate cap or floor contracts, futures or forward contracts, and options. To the extent that we or a pass-through subsidiary enters into a hedging transaction (i) to reduce interest rate risk on indebtedness incurred to acquire or carry real estate assets, (ii) to manage risk of currency fluctuations with respect to any item of income that would qualify under the 75% Income Test or the 95% Income Test, or (iii) for taxable years beginning after December 31, 2015, new hedging transactions entered into to hedge the income or loss from prior hedging transactions, where the property or indebtedness which was the subject of the prior hedging transaction was extinguished or disposed of, and the instrument is properly identified as a hedge along with the risk it hedges within prescribed time periods, any periodic income from the instrument, or gain from the disposition of such instrument, would be excluded altogether from the 95% Income Test or the 75% Income Test.
To the extent that we hedge in certain other situations, the resultant income will be treated as income that does not qualify under the 75% Income Test or the 95% Income Test, provided that certain requirements are met. We intend to structure any hedging transactions in a manner that does not jeopardize our status as a REIT. We may conduct some or all of our hedging activities through a TRS or other corporate entity, the income from which may be subject to federal, state, and/or international income tax, rather than by participating in the arrangements directly or through pass-through subsidiaries. No assurance can be given, however, that our hedging activities will not give rise to income that does not qualify for purposes of either or both of the REIT income tests, or that our hedging activities will not adversely affect our ability to satisfy the REIT qualification requirements.
Prior to the making of investments in real properties, we may invest the Net Offering Proceeds in liquid assets such as government securities or certificates of deposit. For purposes of the 75% Income Test, income attributable to a stock or debt instrument purchased with the proceeds received by a REIT in exchange for stock in the REIT (other than amounts received pursuant to a distribution reinvestment plan)Reinvestment Plan) constitutes qualified temporary investment income if such income is received or accrued during the one-year period beginning on the date the REIT receives such new capital. To the extent we hold any proceeds of the offering for longer than one year, we may invest those amounts in less liquid investments such as mortgage-backed securities, maturing mortgage loans purchased from mortgage lenders or shares of common stock in other REITs in order to satisfy the 75% Income Test and the 95% Income Test and the Asset Tests described below. We expect the bulk of the remainder of our income to qualify under the 75% Income and 95% Income Tests as rents from real property, gains from the sale of real property interests and interest on mortgages on real property in accordance with the requirements described above.
With regard to rental income, we anticipate most of our leases will be for fixed rentals with annual CPI or similar adjustments and that none of the rentals under our leases will be based on the income or profits of any Person. Rental leases may provide for payments based on gross receipts, which are generally permissible under the REIT income tests. In addition, none of our tenants are expected to be “Related Party Tenants” and the portion of the rent attributable to personal property is not expected to exceed 15% of the total rent to be received under any lease. We anticipate that all or most of the services to be performed with respect to our real properties will be performed by our property manager, and such services are expected to be those usually or customarily rendered in connection with the rental of real property and not rendered to the occupant of such real property. Finally, we anticipate any non-customarynon-
customary services will be provided by a TRS or, alternatively, by an independent contractor that is adequately compensated and from whom we derive no income. However, we can give no assurance that the actual sources of our gross income will allow us to satisfy the 75% Income Test and the 95% Income Test described above.
Further, we and our subsidiaries may hold investments in, and pay taxes to, foreign countries. Taxes that we pay in foreign jurisdictions may not be passed through to, or used by, our stockholders or us as a foreign tax credit or otherwise. Our foreign investments might also generate foreign currency gains and losses. Foreign currency gains that we derive from certain of our investments will be excluded for purposes of computing the REIT income tests if such foreign currency gain is “real estate foreign exchange gain” (as defined in the Code), that is, if such gains are attributable to any item of income that itself qualifies for purposes of the 75% Income Test or other specified sources. Other foreign currency gains, however, if such foreign currency gain is “passive foreign exchange gain” (as defined in the Code), will be excluded for purposes of computing the 95% Income Test but will be treated as income that does not qualify under the 75% Income Test. Generally, “passive foreign exchange gain” includes foreign exchange gain attributable to any item of income that itself qualifies for purposes of the 95% Income Test or other specified sources.
The Tax Act made fundamental changes to the U.S. international tax system that could affect the amount, timing or character of income we recognize with respect to any foreign subsidiary and, thus, may impact our decision to make investments in foreign jurisdictions. For example, if we were to form a foreign subsidiary, we would be subject to new rules enacted under the Tax Act which could subject us to current U.S. federal income tax on a portion of our income attributable to such foreign subsidiary.
Notwithstanding our failure to satisfy one or both of the 75% Income and the 95% Income Tests for any taxable year, we may still qualify as a REIT for that year if we are eligible for relief under specific provisions of the Code. These relief provisions generally will be available if:
our failure to meet these tests was due to reasonable cause and not due to willful neglect; and
following our identification of the failure, we file a schedule with a description of each item of gross income that caused the failure in accordance with Treasury Regulations.
It is not possible, however, to state whether, in all circumstances, we would be entitled to the benefit of these relief provisions. In addition, as discussed above, even if these relief provisions apply, a tax would be imposed with respect to the excess net income.
Operational Requirements — Prohibited Transactions. A “prohibited transaction” is a sale by a REIT of real property or other assets held primarily for sale in the ordinary course of the REIT’s trade or business (i.e., real property or other assets that are not held for investment but are held as inventory for sale by the REIT). A 100% penalty tax is imposed on any gain realized by a REIT from a prohibited transaction (including our distributive share of any such gain realized by our operating partnership). Under existing law, whether property is held as inventory or primarily for sale to customers in the ordinary course of a trade or business is a question of fact that depends on all the facts and circumstances surrounding the particular transaction. We do not presently intend to acquire or hold or allow the operating partnership to acquire or hold any property that represents inventory or other property held primarily for sale to customers in the ordinary course of our or the operating partnership’s trade or business.
A safe harbor to the characterization of the sale of property by a REIT as a prohibited transaction and the 100% prohibited transaction tax is available if the following requirements are met:
the REIT has held the property for not less than two years;
the aggregate expenditures made by the REIT, or any partner of the REIT, during the two-year period preceding the date of the sale that are includable in the basis of the property do not exceed 30% of the net selling price of the property;
either (i) during the year in question, the REIT did not make more than seven sales of property other than foreclosure property or Section 1031 like-kind exchanges, or (ii) the aggregate adjusted bases of the non-foreclosure property sold by the REIT during the year did not exceed 10% of the aggregate bases of all of the assets of the REIT at the beginning of such year, or (iii) the fair market value of the non-foreclosure property sold by the REIT during the year did not exceed 10% of the fair market value of all the assets of the REIT at the beginning of such year (20% for both aggregate basis and fair market value determinations beginning with taxable years beginning after December 18, 2015);
if the REIT has made more than seven sales of non-foreclosure property during the year, substantially all of the marketing and development expenditures with respect to the property were made through an independent contractor from whom the REIT derives no income.
For purposes of the limitation on the number of sales that a REIT may complete in any given year, the sale of more than one property to one buyer will be treated as one sale. Moreover, if a REIT obtains replacement property pursuant to a Section 1031 like-kind exchange, then it will be entitled to tack the holding period it has in the relinquished property for purposes of the two-year holding period requirement. Under the Tax Act, generally effective for exchanges completed after December 31, 2017, the rule providing for nonrecognition of gain in the case of like-kind exchanges is limited to exchanges of real property only, and not to tangible personal property or intangible property.
The failure of a sale to fall within the safe harbor does not alone cause such sale to be a prohibited transaction and subject to the 100% prohibited transaction tax. In that event, the particular facts and circumstances of the transaction must be analyzed to determine whether it is a prohibited transaction.
Operational Requirements — Asset Tests. At the close of each quarter of our taxable year, starting with the taxable year ending December 31, 2012 (i.e., starting with the quarter ending March 31, 2012), we also must satisfy four tests, which we refer to as “Asset Tests,” relating to the nature and diversification of our assets.
First, at least 75% of the value of our total assets must be represented by real estate assets, cash, cash items and government securities. The term “real estate assets” includes real property, mortgages on real property, shares of common stock in other qualified U.S. REITs, property attributable to the temporary investment of new capital as described above and a proportionate share of any real estate assets owned by a partnership in which we are a partner (for example, our operating partnership) or of any qualified REIT subsidiary of ours. For taxable years beginning after December 31, 2015, the term “real estate assets” also includes debt instruments of publicly offered REITs, personal property securing a mortgage secured by both real property and personal property if the fair market value of such personal property does not exceed 15% of the total fair market value of all such property, and personal property leased in connection with a lease of real property for which the rent attributable to personal property is not greater than 15% of the total rent received under the lease.
Second, no more than 25% of our total assets may be represented by securities other than those in the 75% asset class.
Third, of the investments included in the 25% asset class, the value of any one issuer’s securities that we own may not exceed 5% of the value of our total assets. Additionally, we may not own more than 10% of the voting power or value of any one issuer’s outstanding securities, which we refer to as the “10% Asset Test.” The 10% Asset Test does not apply to securities of a TRS, nor does it apply to certain “straight debt” (as defined in the Code) instruments possessing certain characteristics. The term “securities” also does not include the equity or debt securities of a qualified REIT subsidiary of ours or an equity interest in any entity treated as a partnership for federal tax purposes.
Fourth, no more than 25% (20%20% (25% for our taxable years beginning afterbefore December 31, 2017) of the value of our total assets may consist of the securities of one or more TRSs.
Fifth, for taxable years beginning after December 31, 2015, not more than 25% of the value of our total assets may be represented by debt instruments of publicly offered REITs to the extent those debt instruments would not be real estate assets but for the inclusion of debt instruments of publicly offered REITs in the meaning of real estate assets effective for taxable years beginning after December 31, 2015, as described above.
Any interests we hold in a real estate mortgage investment conduit (“REMIC”) will generally qualify as real estate assets and income derived from REMIC interests will generally be treated as qualifying income for purposes of the REIT income tests described above. If less than 95% of the assets of a REMIC are real estate assets, however, then only a proportionate part of our interest in the REMIC and income derived from the interest will qualify for purposes of the REIT asset and income tests. If we hold a “residual interest” (as defined in the Code) in a REMIC from which
we derive “excess inclusion income” (as defined in the Code), we will be required either to distribute the excess inclusion income or to pay tax on it (or a combination of the two), even though we may not receive the income in cash. To the extent that distributed excess inclusion income is allocable to a particular stockholder, the income (i) would not be allowed to be offset by any net operating lossesNOLs otherwise available to the stockholder, (ii) would be subject to tax as unrelated business taxable income in the hands of most types of stockholders that are otherwise generally exempt from federal income tax, and (iii) would result in the application of U.S. federal income tax withholding at the maximum rate without reduction pursuant to any otherwise applicable income tax treaty, to the extent allocable to most types of foreign stockholders. Moreover, any excess inclusion income that we receive that is allocable to specified categories of tax-exempt investors which are not subject to unrelated business income tax, such as government entities, may be subject to corporate-level income tax in our hands, whether or not it is distributed.
To the extent we hold mortgage participations or commercial mortgage-backed securities that do not represent REMIC interests, such assets may not qualify as real estate assets, and the income generated from them may not qualify for purposes of either or both of the REIT income tests, depending upon the circumstances and the specific structure of the investment.
We may enter into sale and repurchase agreements under which we would nominally sell certain of our loan assets to a counterparty and simultaneously enter into an agreement to repurchase the sold assets. We believe that we would be treated for U.S. federal income tax purposes as the owner of the loan assets that are the subject of any such agreement notwithstanding that such agreements may transfer record ownership of the assets to the counterparty during the term of the agreement. It is possible, however, that the IRS could assert that we did not own the loan assets during the term of the sale and repurchase agreement, in which case we could fail to qualify as a REIT.
Certain of our mezzanine loans which may qualify for the safe harbor in Revenue Procedure 2003-65 pursuant to which certain loans secured by a first priority security interest in ownership interests in a partnership or limited liability company will be treated as qualifying assets for purposes of the 75% real estate asset test and the 10% vote or value test. See “— Operational Requirements — Gross Income Tests.” We may make some mezzanine loans that do not qualify for that safe harbor and that do not qualify as “straight debt” securities or for one of the other exclusions from the definition of “securities” for purposes of the 10% value test. We intend to make such investments in such a manner as not to fail the asset tests described above.
Independent appraisals are not necessarily obtained by us to support our conclusions as to the value of our total assets or the value of any particular security or securities for purposes of these operational requirements. Moreover, values of some assets, including instruments issued in securitization transactions, may not be susceptible to a precise determination, and values are subject to change in the future. Furthermore, the proper classification of an instrument as debt or equity for federal income tax purposes may be uncertain in some circumstances, which could affect the application of the REIT asset requirements. Accordingly, there can be no assurance that the IRS will not contend that our interests in our subsidiaries or in the securities of other issuers will not cause a violation of the REIT asset tests.
The Asset Tests must generally be met for each quarter. Upon full investment of the Net Offering Proceeds, we expect most of our assets will consist of “real estate assets” and we therefore expect to satisfy the Asset Tests.
If we meet the Asset Tests at the close of any quarter, we maintain our qualification as a REIT despite a failure to satisfy the Asset Tests at the end of a later quarter in which we have not acquired any securities or other property if such failure occurs solely because of changes in asset values. If our failure to satisfy the Asset Tests results from an acquisition of securities or other property during a quarter, we can cure the failure by disposing of a sufficient amount of non-qualifying assets within 30 days after the close of that quarter. We intend to maintain adequate records of the value of our assets to ensure compliance with the Asset Tests and to take other action within 30 days after the close of any quarter as may be required to cure any noncompliance. If that does not occur, we may nonetheless qualify for one of the relief provisions described below.
The Code contains a number of provisions applicable to REITs, including relief provisions that allow REITs to satisfy the asset requirements, or to maintain REIT qualification notwithstanding certain violations of the asset and other requirements.
One such provision allows a REIT which fails one or more of the asset requirements to nevertheless maintain its REIT qualification if (i) it provides the IRS with a description of each asset causing the failure; (ii) the failure is due to reasonable cause and not willful neglect; (iii) the REIT pays a tax equal to the greater of (A) $50,000 per failure; or (B) the product of the net income generated by the assets that caused the failure multiplied by the highest applicable corporate tax rate; and (iv) the REIT either disposes of the assets causing the failure within six months after the last day of the quarter in which it identifies the failure, or otherwise satisfies the relevant asset tests within that time frame.
A second relief provision applies to de minimis violations of the 10% and 5% asset tests. A REIT may maintain its qualification despite a violation of such requirements if (i) the value of the assets causing the violation do not exceed the lesser of 1% of the REIT’s total assets and $10,000,000, or (ii) the REIT either disposes of the assets causing the failure within six months after the last day of the quarter in which it identifies the failure, or the relevant tests are otherwise satisfied within that time frame.
The Code also provides that certain securities will not cause a violation of the 10% value test described above. Such securities include instruments that constitute “straight debt,” which includes securities having certain contingency features. A security cannot qualify as “straight debt” if a REIT (or a controlled TRS) owns other securities in the issuer of that security which do not qualify as straight debt, unless the value of those other securities constitutes, in the aggregate, 1% or less of the total value of that issuer’s outstanding securities. In addition to straight debt, the Code provides that certain other securities will not violate the 10% value test. Such securities include:
any loan made to an individual or an estate;
certain rental agreements in which one or more payments are to be made in subsequent years (other than agreements between a REIT and certain Persons related to the REIT);
any obligation to pay rents from real property;
securities issued by governmental entities that are not dependent in whole or in part on the profits of (or payments made by) a non-governmental entity;
any security issued by another REIT; and
any debt instrument issued by a partnership if the partnership’s income is of a nature that it would satisfy the 75% gross income test described above under “— Operational Requirements — Gross Income Tests.”
In addition, when applying the 10% value test, a debt security issued by a partnership is not taken into account to the extent, if any, of the REIT’s proportionate equity interest in that partnership.
Operational Requirements — Annual Distribution Requirement. In order to be taxed as a REIT, we are required to make cash or taxable property distributions, other than capital gain distributions, to our stockholders each year in the amount of at least 90% of our taxable income (computed without regard to the dividends paid deduction and our net capital gain and subject to certain other potential adjustments) for all tax years. While we must generally make distributions in the taxable year to which they relate, we may also make distributions in the following taxable year if (i) they are declared before we timely file our federal income tax return for the taxable year in question and (ii) they are paid on or before the first regular distribution payment date after the declaration.
Even if we satisfy the foregoing distribution requirement and, accordingly, continue to qualify as a REIT for tax purposes, we will still be subject to federal income tax on the excess of our net capital gain and our REIT taxable income, as adjusted, over the amount of distributions to stockholders.
In addition, if we fail to distribute during each calendar year at least the sum of:
85% of our ordinary income for that year;
95% of our capital gain net income other than the capital gain net income which we elect to retain and pay tax on for that year; and
any undistributed taxable income from prior periods,
then we will be subject to a 4% non-deductible excise tax on the excess of the amount of the required distributions over the sum of (i) the amounts actually distributed plus (ii) retained amounts on which corporate level tax is paid by us.
We intend to make timely distributions sufficient to satisfy this requirement; however, it is possible we may experience timing differences between (i) the actual receipt of income and payment of deductible expenses, and (ii) the inclusion of that income and deduction of those expenses for purposes of computing our taxable income. Further, under changes made by the Tax Act, income generally must be accrued for U.S. federal income tax purposes no later than the taxable year in which such income is take into account as revenue in our financial statements, which could create a mismatch between our taxable income and the actual receipt of cash attributable to such income. It is also possible we may be allocated a share of net capital gain attributable to the sale of depreciated property by the operating partnership, or any other partnership in which we own an interest, that exceeds our allocable share of cash attributable to that sale. In those circumstances, we may have less cash than is necessary to meet our annual distribution requirement or to avoid income or excise taxation on undistributed income.
We may find it necessary in those circumstances to arrange for financing, raise funds through the issuance of additional shares of our common stock or to make a taxable stock distribution in order to meet our distribution requirements. If we fail to satisfy the distribution requirement for any taxable year by reason of a later adjustment to our taxable income made by the IRS, we may be able to pay “deficiency dividends” (as defined in the Code) in a later year and include such distributions in our deductions for dividends paid for the earlier year. In that event, we may be able to avoid the disqualification of our REIT status or being taxed on amounts distributed as deficiency dividends, but we would be required to pay interest and a penalty to the IRS based upon the amount of any deduction taken for deficiency dividends for the earlier year.
As noted above, we may also elect to retain, rather than distribute, some or all of our net long-term capital gains. The effect of such an election would be as follows:
We would be required to pay the federal income tax on the undistributed gains;
Taxable U.S. stockholders, while required to include their proportionate share of the undistributed long-term capital gains in income, would receive a credit or refund for their share of the tax paid by the REIT; and
The basis of the stockholder’s shares of our common stock would be increased by the difference between the designated amount included in the stockholder’s long-term capital gains and the tax deemed paid with respect to such shares of common stock.
In computing our taxable income, we will use the accrual method of accounting and intend to depreciate depreciable property under the alternative depreciation system. We are required to file an annual federal income tax return, which, like other corporate returns, is subject to examination by the IRS. Because the tax law requires us to make many judgments regarding the proper treatment of a transaction or an item of income or deduction, it is possible that the IRS will challenge positions we take in computing our taxable income and our distributions.
Challenges could arise, for example, with respect to the allocation of the purchase price of real properties between depreciable or amortizable assets and non-depreciable or non-amortizable assets such as land and the current deductibility of fees paid to our Advisor or its affiliates. If the IRS were to successfully challenge our characterization of a transaction or determination of our taxable income, we could be found to have failed to satisfy a requirement for qualification as a REIT. If we are determined to have failed to satisfy the distribution requirements for a taxable year, we would be disqualified as a REIT, unless we were permitted to pay a deficiency dividend to our stockholders and pay interest thereon to the IRS, as provided by the Code.
Operational Requirement — Recordkeeping. We must maintain certain records as set forth in Treasury Regulations in order to avoid the payment of monetary penalties to the IRS. Such Treasury Regulations require that we request, on an annual basis, certain information designed to disclose the ownership of shares of our outstanding common stock. We intend to comply with these requirements. See “— Statement of Share Ownership” below.
Taxable REIT Subsidiaries. A TRS is any corporation in which a REIT directly or indirectly owns stock, provided that the REIT and that corporation make a joint election to treat the corporation as a TRS. The election can be revoked at any time as long as the REIT and the TRS revoke such election jointly. In addition, if a TRS holds, directly or indirectly, more than 35% of the securities of any other corporation (by vote or by value), then that other corporation also is treated as a TRS. A corporation can be a TRS with respect to more than one REIT. We may form one or more TRSs for the purpose of owning and selling properties that do not meet the requirements of the “prohibited transactions” safe harbor. See “— Requirements for Qualification as a REIT — Operational Requirements — Prohibited Transactions” above.
To the extent of its taxable income, a TRS is subject to federal income tax at the regular corporate ratesrate and also may be subject to state and local taxation. Any distributions paid or deemed paid by any one of our TRSs also will be subject to tax, either (i) to us if we do not pay the distributions received to our stockholders as distributions, or (ii) to our stockholders if we do pay out the distributions received to our stockholders. Further, the rules impose a 100% excise tax on transactions between a TRS and its parent REIT or to the REIT’s tenants that are not conducted on an arm’s-length basis. We may hold more than 10% of the stock of a TRS without jeopardizing our qualification as a REIT notwithstanding the rule described above under “— Requirements for Qualification as a REIT — Operational Requirements — Asset Tests” that generally precludes ownership of more than 10% (by vote or value) of any issuer’s securities.
However, as noted below, in order for us to qualify as a REIT, the non-mortgage securities (both debt and equity) of all of the TRSs in which we have invested either directly or indirectly may not represent more than 25% (20%20% (25% for our taxable years beginning afterbefore December 31, 2017) of the total value of our assets. We expect that the aggregate value of all of our interests in TRSs will represent less than 25% of the total value of our assets. We cannot, however, assure you that we will always satisfy the 25% value limit or that the IRS will agree with the value we assign to our TRSs.
We may engage in activities indirectly through a TRS as necessary or convenient to avoid receiving the benefit of income or services that would jeopardize our REIT status if we engaged in the activities directly. In particular, in addition to the ownership of certain of our properties as noted above, we would likely use TRSs for providing services that are non-customary or that might produce income that does not qualify under the gross income tests described above. We may also use TRSs to satisfy various lending requirements with respect to special-purpose bankruptcy-remote entities.
Finally, while a REIT is generally limited in its ability to earn rents that qualify as “rents from real property” from a related party as defined by the Code, a REIT can earn “rents from real property” from the lease of a qualified healthcare property or qualified lodging facility to a TRS (even a wholly owned TRS) if an eligible independent contractor operates the facility. Generally, a qualified healthcare property means a property which is a healthcare facility or is necessary or incidental to the use of a healthcare facility. A qualified healthcare facility is defined as a hospital, nursing facility, assisted living facility, congregate care facility, qualified
continuing care facility or other licensed facility which extends medical or nursing or ancillary services to patients operated by a provider of such services which was eligible for participation in the Medicare program under title XVIII of the Social Security Act with respect to such facility. Qualified lodging facilities are defined as hotels, motels or other establishments where more than half of the dwelling units are used on a transient basis, provided that legally authorized wagering or gambling activities are not conducted at or in connection with such facilities. Also included in the definition are the qualified lodging facility’s customary amenities and facilities. For these purposes, a contractor qualifies as an “eligible independent contractor” if it is less than 35% affiliated with the REIT and, at the time the contractor enters into the agreement with the TRS to operate the qualified healthcare property or qualified lodging facility, that contractor or any Person related to that contractor is actively engaged in the trade or business of operating qualified healthcare properties or qualified lodging facilities, respectively, for Persons unrelated to the TRS or its affiliated REIT. For these purposes, an otherwise eligible independent contractor is not disqualified from that status on account of the TRS bearing the expenses for the operation of the qualified healthcare property or qualified lodging facility, the TRS receiving the revenues from the operation of the qualified healthcare property or qualified lodging facility, net of expenses for that operation and fees payable to the eligible independent contractor, or the REIT receiving income from the eligible independent contractor pursuant to a preexisting or otherwise grandfathered lease of another property.
Failure to Qualify as a REIT. If we fail to qualify as a REIT for any reason in a taxable year and applicable relief provisions do not apply, then we will be subject to tax (including any applicable alternative minimum tax) on our taxable income at the regular corporate rates.rate. We will not be able to deduct dividends paid to our stockholders in any year in which we fail to qualify as a REIT. In addition, if we fail to qualify as a REIT, all distributions to stockholders will be taxable as regular corporate dividends to the extent of current andor accumulated earnings and profits. In this event, stockholders taxed as individuals will be taxed on these dividends at the preferential income tax rates currently in effect for qualified dividends received from taxable C corporations and corporate distributees may be eligible for the dividends received deduction. We also will be disqualified for the four taxable years following the year during which qualification was lost unless we are entitled to relief under specific statutory provisions. It is not possible to state whether we would be entitled to this statutory relief.
Sale-Leaseback Transactions. We normally intend to treat our property leases as true leases for federal income tax purposes. However, depending on the terms of any specific transaction, the IRS might take the position that the transaction is not a true lease but is more properly treated in some other manner. If such re-characterization were successful, we would not be entitled to claim the depreciation deductions available to an owner of the property. In addition, the re-characterization of one or more of these transactions might cause us to fail to satisfy the Asset Tests or the Income Tests described above based upon the asset we would be treated as holding or the income we would be treated as having earned and such failure could result in our failing to qualify as a REIT.
Alternatively, the amount or timing of income inclusion or the loss of depreciation deductions resulting from the re-characterization might cause us to fail to meet the distribution requirement described above for one or more taxable years absent the availability of the deficiency dividend procedure or might result in a larger portion of our dividends being treated as ordinary income to our stockholders.
Taxation of Taxable U.S. Stockholders
Definition. In this section, the phrase “U.S. stockholder” means a holder of our common stock that for federal income tax purposes is:
a citizen or resident of the United States;U.S.;
a corporation, partnership or other entity treated as a corporation or partnership for U.S. federal income tax purposes created or organized in or under the laws of the United StatesU.S. or of any political subdivision thereof;
an estate, the income of which is subject to U.S. federal income taxation regardless of its source; or
a trust, if a U.S. court is able to exercise primary supervision over the administration of the trust and one or more U.S. Persons have the authority to control all substantial decisions of the trust.
If a partnership, including for this purpose any entity that is treated as a partnership for U.S. federal income tax purposes, holds our common stock, the tax treatment of a partner in the partnership will generally depend upon the status of the partner and the activities of the partnership. An investor that is a partnership and the partners in such partnership should consult their tax advisors about the U.S. federal income tax consequences of the acquisition, ownership and disposition of our common stock.
For any taxable year for which we qualify for taxation as a REIT, amounts distributed to, and gains realized by, taxable U.S. stockholders with respect to our common stock generally will be taxed as described below. For a summary of the federal income tax treatment of distributions reinvested in additional shares of our common stock pursuant to our Reinvestment Plan, see “Summary of Our Reinvestment Plan.”
Distributions Generally. Distributions paid to U.S. stockholders, other than capital gain distributions discussed below, made out of our current or accumulated earnings and profits and will be taxable to the stockholders as ordinary income for federal income tax
purposes. These distributions are not eligible for the dividends received deduction generally available to corporations. In addition, with limited exceptions, these distributions are not eligible for taxation at the preferential income tax rates currently in effect for qualified dividends received by U.S. stockholders that are individuals, trusts and estates from taxable C corporations. However, under the Tax Act, non-corporate stockholders may generally deduct 20% of the aggregate amount of ordinary REIT dividends distributed by us (other than “capital gain dividends” or “qualified dividend income”) for taxable years beginning after
December 31, 2017 and before January 1, 2026, thereby reducing the maximum effective tax rate applicable to REIT ordinary dividends to 29.6% (assuming the new maximum individual income tax rate of 37% applies). Stockholders that are individuals, trusts or estates however, may be taxed at the preferential rates currently in effect (assuming the relevant holding periods have been met) on dividends designated by and received from us to the extent that the dividends are attributable to (i) income retained by us in the prior taxable year on which we were subject to corporate level income tax (less the amount of tax), (ii) dividends received by us from taxable C corporations, including any dividends we may receive from a TRS, or (iii) income in the prior taxable year from the sales of “built-in gain” property acquired by us from C corporations in carryover basis transactions (less the amount of corporate tax on such income).
To the extent we make a distribution in excess of our current and accumulated earnings and profits, the distribution will be treated first as a tax-free return of capital, reducing the tax basis in a U.S. stockholder’s shares of common stock, and the amount of each distribution in excess of a U.S. stockholder’s tax basis in its shares of common stock will be taxable as gain realized from the sale of its shares of common stock. Dividends we declare in October, November or December of any year payable to a stockholder of record on a specified date in any of these months will be treated as both paid by us and received by the stockholder on December 31 of the year, provided that we actually pay the dividends during January of the following calendar year.
To the extent we have available net operating lossesNOLs (after application of the 80% limitation enacted under the Tax Act as described above) and capital losses carried forward from prior tax years, such losses may reduce the amount of distributions we must make in order to comply with the REIT distribution requirements. See “— Requirements for Qualification as a REIT — Operational Requirements — Annual Distribution Requirement.” Such losses, however, are not passed through to stockholders and do not offset income of stockholders from other sources, nor would such losses affect the character of any distributions that we make, which are generally subject to tax in the hands of stockholders to the extent that we have current or accumulated earnings and profits.
If excess inclusion income from a taxable mortgage pool or REMIC residual interest is allocated to any stockholder, that income will be taxable in the hands of the stockholder and would not be offset by any net operating lossesNOLs of the stockholder that would otherwise be available. As required by IRS guidance, we intend to notify our stockholders if a portion of a dividend paid by us is attributable to excess inclusion income.
We will be treated as having sufficient earnings and profits to treat as a dividend any distribution by us up to the amount required to be distributed in order to avoid imposition of the 4% excise tax discussed above. Moreover, any “deficiency distribution” will be treated as an ordinary or capital gain distribution, as the case may be, regardless of our earnings and profits. As a result, stockholders may be required to treat as taxable some distributions that would otherwise result in a tax-free return of capital.
Distributions to U.S. stockholders that we properly designate as capital gain distributions normally will be treated as long-term capital gains to the extent they do not exceed our actual net capital gain for the taxable year without regard to the period for which the U.S. stockholder has held his or her shares of common stock and, for taxable years beginning after December 31, 2015, may not exceed our distributions paid for the taxable year, including distributions paid the following year that are treated as paid in the current year,.year. A corporate U.S. stockholder might be required to treat up to 20% of some capital gain distributions as ordinary income. Long-term capital gains are generally taxable at preferential rates in the case of stockholders who are individuals, estates, and trusts. Capital gains attributable to the sale of depreciable real property held for more than 12 months are subject to a 25% maximum federal income tax rate for taxpayers who are individuals, to the extent of previously claimed depreciation deductions (unrecaptured Section 1250 gains). See “— Requirements for Qualification as a REIT — Operational Requirements — Annual Distribution Requirement” for the treatment by U.S. stockholders of net long-term capital gains that we elect to retain and pay tax on.
Certain Dispositions of Our Common Stock. In general, capital gains recognized by individuals upon the sale or disposition of shares of our common stock will be subject to tax at the federal capital gains rate if such shares of common stock are held for more than 12 months, and will be taxed at ordinary income rates if such shares of common stock are held for 12 months or less. Gains recognized by stockholders that are corporations are subject to federal income tax at a current maximumflat rate of 35%21%, whether or not classified as long-term capital gains. Capital losses recognized by a stockholder upon the disposition of a share of our common stock held for more than one year at the time of disposition will be considered long-term capital losses, and are generally available only to offset capital gain
income of the stockholder but not ordinary income (except in the case of individuals, trusts and estates who may offset up to $3,000 of ordinary income each year). In addition, any loss upon a sale or exchange of shares of common stock by a stockholder who has held such shares of common stock for six months or less, after applying holding period rules, will be treated as a long-term capital loss to the extent of distributions received from us that are required to be treated by the stockholder as long-term capital gain. In addition, under the so-called “wash sale” rules (as defined in the Code), all or a portion of any loss that a stockholder realizes upon a taxable disposition of shares of common stock may be disallowed if the stockholder purchases (including through our Reinvestment Plan) other shares of our stock (or stock substantially similar to our stock) within 30 days before or after the disposition.
If an investor recognizes a loss upon a subsequent disposition of our stock or other securities in an amount that exceeds a prescribed threshold, it is possible that the provisions of Treasury Regulations involving “reportable transactions” (as defined in the Code) could apply, with a resulting requirement to separately disclose the loss-generating transaction to the IRS. These regulations, though directed towards tax shelters, are broadly written and apply to transactions that would not typically be considered tax shelters. The Code imposes significant penalties for failure to comply with these requirements.
You should consult your tax advisor concerning any possible disclosure obligation with respect to the receipt or disposition of our stock or securities or transactions that we might undertake directly or indirectly. Moreover, you should be aware that we and other participants in the transactions in which we are involved (including their advisors) might be subject to disclosure or other requirements pursuant to these regulations, and that the failure to make such disclosures would result in substantial penalties.
Distributions we make and gain arising from the sale or exchange by a U.S. stockholder of our stock will not be treated as passive activity income. As a result, stockholders will not be able to apply any passive losses against income or gain relating to our stock. To the extent distributions we make do not constitute a return of capital or a long term capital gain (unless you elect otherwise), they will be treated as investment income for purposes of computing the investment interest limitation.
Additional Medicare Contribution Tax. An additional tax of 3.8% generally will be imposed on the “net investment income” of U.S. stockholders who meet certain requirements and are individuals, estates or certain trusts. Among other items, “net investment income” generally includes gross income from dividends and net gain attributable to the disposition of certain property, such as shares of our common stock. In the case of individuals, this tax will only apply to the extent such individual’s modified adjusted gross income exceeds $200,000 ($250,000 for married couples filing a joint return and surviving spouses, and $125,000 for married individuals filing a separate return). U.S. stockholders should consult their tax advisors regarding the possible applicability of this additional tax in their particular circumstances.
Information Reporting Requirements and Backup Withholding for U.S. Stockholders. As required, we will report to U.S. stockholders of our common stock and to the IRS the amount of distributions made or deemed made during each calendar year and the amount of tax withheld, if any. Under some circumstances, U.S. stockholders may be subject to backup withholding on payments made with respect to, or cash proceeds of a sale or exchange of, our common stock. Backup withholding will apply only if the stockholder:
Fails to furnish its taxpayer identification number (which, for an individual, would typically be his or her Social Security number);
Furnishes an incorrect taxpayer identification number;
Is notified by the IRS that the stockholder has failed to properly report payments of interest or dividends and is subject to backup withholding; or
Under some circumstances, fails to certify, under penalties of perjury, that it has furnished a correct taxpayer identification number and has not been notified by the IRS that the stockholder is subject to backup withholding for failure to report interest and dividend payments or has been notified by the IRS that the stockholder is no longer subject to backup withholding for failure to report those payments.
Backup withholding will not apply with respect to payments made to some stockholders, such as corporations in certain circumstances and tax-exempt organizations. Backup withholding is not an additional tax. Rather, the amount of any backup withholding with respect to a payment to a U.S. stockholder will be allowed as a credit against the U.S. stockholder’s U.S. federal income tax liability and may entitle the U.S. stockholder to a refund, provided that the required information is furnished to the IRS. U.S. stockholders should consult their tax advisors regarding their qualification for exemption from backup withholding and the procedure for obtaining an exemption.
Cost Basis Reporting. The IRS has issued final regulations thatTreasury Regulations require us to report the cost basis and gain or loss to a stockholder upon the sale or liquidation of “covered shares.” For purposes of the final regulations,these Treasury Regulations, all shares acquired by non-tax exempt stockholders through the Reinvestment Plan will be considered “covered shares” and will be subject to the applicable reporting requirements.
Upon the sale or liquidation of “covered shares,” a broker must report both the cost basis of the shares and the gain or loss recognized on the sale of those shares to the stockholder and to the IRS on Form 1099-B. In addition, stockholders that are S-corporations are no longer exempt from Form 1099-B reporting and shares purchased by an S-corporation are “covered shares” under the final regulations.Treasury Regulations. If we take an organizational action such as a stock split, merger, or acquisition that affects the cost basis of “covered shares,” we will report to each stockholder and to the IRS via our website a description of any such action and the quantitative effect of that action on the cost basis on an information return.
We have elected the first in, first out (FIFO) method as the default for calculating the cost basis and gain or loss upon the sale or liquidation of “covered shares”. A non-tax exempt stockholder may elect a different method of computation until the settlement date of the sold or liquidated shares. We suggest that you consult with your tax advisor to determine the appropriate method of accounting for your investment.
Treatment of Tax-Exempt Stockholders
Tax-exempt entities, including employee pension benefit trusts and individual retirement accounts, generally are exempt from U.S. federal income taxation. These entities are subject to taxation, however, on any “unrelated business taxable income” (“UBTI”), as defined in the Code. The IRS has issued a published ruling that distributions from a REIT to a tax-exempt pension trust do not constitute UBTI. Although rulings are merely interpretations of law by the IRS and may be revoked or modified, based on this analysis, indebtedness incurred by us or by our operating partnership in connection with the acquisition of a property should not cause any income derived from the property to be treated as UBTI upon the distribution of those amounts as dividends to a tax-exempt U.S. stockholder of our common stock. A tax-exempt entity that incurs indebtedness to finance its purchase of our common stock, however, will be subject to UBTI under the debt-financed income rules.
In certain circumstances, a pension trust that owns more than 10% of our stock could be required to treat a percentage of the dividends as UBTI if we are a “pension-held REIT.” We will not be a pension-held REIT unless (i) we are required to look through one or more of our pension trust stockholders in order to satisfy the REIT “closely-held” test, and (ii) either (A) one pension trust owns more than 25% of the value of our stock, or (B) one or more pension trusts, each individually holding more than 10% of the value of our stock, collectively owns more than 50% of the value of our stock. Certain restrictions on ownership and transfer of our stock generally should prevent a tax-exempt entity from owning more than 10% of the value of our stock and generally should prevent us from becoming a pension-held REIT. Tax-exempt stockholders are urged to consult their tax advisors regarding the federal, state, local and foreign income and other tax consequences of owning our common stock.
For social clubs, voluntary employee benefit associations, supplemental unemployment benefit trusts and qualified group legal services plans exempt from federal income taxation under Sections 501(c)(7), (c)(9), (c)(17) and (c)(20) of the Code, respectively, income from an investment in our shares will generally constitute UBTI unless the stockholder in question is able to deduct amounts set aside or placed in reserve for certain purposes so as to offset the UBTI generated. Any such organization that is a prospective stockholder should consult its own tax advisor concerning these set aside and reserve requirements, and regarding the treatment of distributions to such organization.
Special Tax Considerations for Non-U.S. Stockholders
The rules governing U.S. federal income taxation of non-resident alien individuals, foreign corporations, foreign partnerships and other foreign stockholders, which we refer to collectively as “Non-U.S. holders,” are complex. The following discussion is intended only as a summary of these rules. Non-U.S. holders should consult with their own tax advisors to determine the impact of U.S. federal, state and local income tax laws on an investment in our common stock, including any reporting requirements as well as the tax treatment of the investment under the tax laws of their home country.
Ordinary Dividends. The portion of distributions received by Non-U.S. holders payable out of our earnings and profits which are not attributable to our capital gains and which are not effectively connected with a U.S. trade or business of the Non-U.S. holder will be subject to U.S. withholding tax at the rate of 30%, unless reduced or eliminated by treaty. Reduced treaty rates and other exemptions are not available to the extent that income is attributable to excess inclusion income allocable to the foreign stockholder. Accordingly, we will withhold at a rate of 30% on any portion of a dividend that is paid to a non-U.S. holder and attributable to that holder’s share of our excess inclusion income. As required by IRS guidance, we intend to notify our stockholders if a portion of a dividend paid by us is attributable to excess inclusion income.
In general, Non-U.S. holders will not be considered to be engaged in a U.S. trade or business solely as a result of their ownership of our common stock. In cases where the distribution income from a Non-U.S. holder’s investment in our common stock is, or is treated as, effectively connected with the Non-U.S. holder’s conduct of a U.S. trade or business, the Non-U.S. holder generally will be subject to U.S. tax at graduated rates, in the same manner as U.S. stockholders are taxed with respect to such distributions, such income must generally be reported on a U.S. income tax return filed by or on behalf of the Non-U.S. holder, and the income may also be subject to the 30% branch profits tax in the case of a Non-U.S. holder that is a corporation.
Non-Dividend Distributions. Unless our common stock constitutes a U.S. real property interest (a “USRPI”), distributions by us which are not distributions out of our earnings and profits will not be subject to U.S. income tax. If it cannot be determined at the time at which a distribution is made whether or not the distribution will exceed current and accumulated earnings and profits, the distribution will be subject to withholding at the rate applicable to distributions. However, the Non-U.S. holder may seek a refund from the IRS of any amounts withheld if it is subsequently determined that the distribution was, in fact, in excess of our current and accumulated earnings and profits. If our common stock constitutes a USRPI, as described below, distributions by us in excess of the
sum of our earnings and profits plus the stockholder’s basis in shares of our common stock will be taxed under the Foreign Investment in Real Property Tax Act of 1980 (“FIRPTA”) at the rate of tax, including any applicable capital gains rates, that would apply to a U.S. stockholder of the same type (e.g., an individual or a corporation, as the case may be), and the collection of the tax will be enforced by a refundable withholding at a rate of 10%15% of the amount by which the distribution exceeds the stockholder’s share of our earnings and profits.
Capital Gain Distributions. A capital gain distribution will generally not be treated as income that is effectively connected with a U.S. trade or business, and will instead be treated the same as an ordinary distribution from us (see “— Special Tax Considerations for Non-U.S. Stockholders — Ordinary Dividends”), provided that (i) the capital gain distribution is received with respect to a class of stock that is regularly traded on an established securities market located in the United States,U.S., and (ii) the recipient Non-U.S. holder does not own more than 10% of that class of stock at any time during the taxable year in which the capital gain distribution is received. If such requirements are not satisfied, distributions that are sourced from capital gains will be treated as income that is effectively connected with a U.S. trade or business of the Non-U.S. holder without regard to whether the distribution is designated as a capital gain distribution and, in addition, shall be subject to a 35%21% withholding tax. We do not anticipate our common stock satisfying the “regularly traded” requirement. Distributions subject to FIRPTA may also be subject to a 30% branch profits tax in the hands of a Non-U.S. holder that is a corporation. A distribution is not a USRPI capital gain if we held the underlying asset solely as a creditor. Capital gain distributions received by a Non-U.S. holder from a REIT that are not USRPI capital gains are generally not subject to U.S. income tax, but may be subject to withholding tax. Distributions, to “qualified foreign pension funds” or entities all of the interests of which are held by “qualified foreign pension funds” are exempt from FIRPTA. Non-U.S. holders should consult their tax advisors regarding the application of these rules.
Estate Tax. If our stock is owned or treated as owned by an individual who is not a citizen or resident (as specially defined for U.S. federal estate tax purposes) of the United StatesU.S. at the time of such individual’s death, the stock will be includable in the individual’s gross estate for U.S. federal estate tax purposes, unless an applicable estate tax treaty provides otherwise, and may therefore be subject to U.S. federal estate tax.
Dispositions of Our Common Stock. Unless our common stock constitutes a USRPI, a sale of our common stock by a Non-U.S. holder generally will not be subject to U.S. taxation under FIRPTA. Our common stock will not be treated as a USRPI if less than 50% of our assets throughout a prescribed testing period consist of interests in real property located within the United States,U.S., excluding, for this purpose, interests in real property solely in a capacity as a creditor.
Even if the foregoing test is not met, our common stock nonetheless will not constitute a USRPI if we are a “domestically controlled REIT.” A “domestically controlled REIT” is a REIT in which, at all times during a specified testing period, less than 50% in value of its shares of common stock is held directly or indirectly by Non-U.S. holders. We currently anticipate that we will be a domestically controlled REIT and, therefore, the sale of our common stock should not be subject to taxation under FIRPTA. However, we cannot assure you that we are or will continue to be a domestically controlled REIT.
If we were not a domestically controlled REIT, whether a Non-U.S. holder’s sale of our common stock would be subject to tax under FIRPTA as a sale of a USRPI would depend on whether our common stock were “regularly traded” on an established securities market and on the size of the selling stockholder’s interest in us.
In addition, even if we are a domestically controlled REIT, upon disposition of our common stock (subject to the exception applicable to “regularly traded” stock described above), a non-U.S. holder may be treated as having gain from the sale or exchange of a USRPI if the non-U.S. holder (i) disposes of our common stock within a 30-day period preceding the ex-dividend date of distribution, any portion of which, but for the disposition, would have been treated as gain from the sale or exchange of a USRPI and (ii) acquires, or enters into a contract or option to acquire, other shares of our common stock within 30 days after such ex-dividend date.
If the gain on the sale of shares of common stock were subject to taxation under FIRPTA, a Non-U.S. holder would be subject to the same treatment as a U.S. stockholder with respect to the gain, subject to any applicable alternative minimum tax and a special alternative minimum tax in the case of non-resident alien individuals.
Gain from the sale of our common stock that would not otherwise be subject to FIRPTA will nonetheless be taxable in the United StatesU.S. to a non-U.S. holder in two cases: (i) if the non-U.S. holder’s investment in our common stock is effectively connected with a U.S. trade or business conducted by such non-U.S. holder, the non-U.S. holder will be subject to the same treatment as a U.S. stockholder with respect to such gain; or (ii) if the non-U.S. holder is a nonresident alien individual who was present in the United StatesU.S. for 183 days or more during the taxable year and has a “tax home” (as defined in the Code) in the United States,U.S., the nonresident alien individual will be subject to a 30% tax on the individual’s capital gain.
Information Reporting Requirements and Backup Withholding for Non-U.S. Holders. Non-U.S. holders should consult their tax advisors with regard to U.S. information reporting and backup withholding requirements under the Code. We will provide you with an annual IRS Form 1042-S, if required, by March 15 following the end of our fiscal year.
We are required to demand annual written statements from the record holders of designated percentages of our common stock disclosing the actual owners of the shares of common stock. Any record stockholder who, upon our request, does not provide us with required information concerning actual ownership of the shares of common stock is required to include specified information relating to his or her shares of common stock in his or her federal income tax return. We also must maintain, within the Internal Revenue District in which we are required to file our federal income tax return, permanent records showing the information we have received about the actual ownership of our common stock and a list of those Persons failing or refusing to comply with our demand.
Federal Income Tax Aspects of the Operating Partnership
The following discussion summarizes certain federal income tax considerations applicable to our investment in the operating partnership. This discussion applies only if, and during the period that, the operating partnership is treated as a partnership instead of a disregarded entity for federal income tax purposes. During the period that (i) we own 100% of the general and limited partnership interests in the operating partnership, either directly or indirectly through CHP GP, LLC and (ii) CHP GP, LLC has not elected to be taxed as a corporation for federal income tax purposes, the operating partnership will be disregarded as an entity separate from us for federal income tax purposes, and all of the operating partnership’s assets, liabilities and activities will be treated as our assets, liabilities and activities for federal income tax purposes. We do not know if or when additional interests in the operating partnership will be issued to a third party in a manner that would cause the operating partnership to cease being treated as a disregarded entity for federal income tax purposes. The discussion does not cover state or local tax laws or any federal tax laws other than income tax laws.
Classification as a Partnership. We will be entitled to include in our income a distributive share of the operating partnership’s income and to deduct our distributive share of the operating partnership’s losses only if the operating partnership is classified for federal income tax purposes as a partnership, rather than as a corporation or an association taxable as a corporation. Under applicable Treasury Regulations (the “Check-the-Box-Regulations”), an unincorporated domestic entity with at least two members may elect to be classified either as an association taxable as a corporation or as a partnership. If the entity fails to make an election, it generally will be treated as a partnership for federal income tax purposes. The operating partnership intends to be classified as a partnership for federal income tax purposes and will not elect to be treated as an association taxable as a corporation under the Check-the-Box-Regulations.
Even though the operating partnership will not elect to be treated as an association for U.S. federal income tax purposes, it may be taxed as a corporation if it is deemed to be a “publicly traded partnership.” A “publicly traded partnership” is a partnership whose interests are traded on an established securities market or are readily tradable on a secondary market or the substantial equivalent thereof. Under applicable Treasury Regulations (the “PTP Regulations”), limited safe harbors from the definition of a publicly traded partnership are provided. Pursuant to one of those safe harbors (the “Private Placement Exclusion”), interests in a partnership will not be treated as readily tradable on a secondary market or the substantial equivalent thereof if (i) all interests in the partnership were issued in a transaction (or transactions) that were not required to be registered under the Securities Act, and (ii) the partnership does not have more than 100 partners at any time during the partnership’s taxable year. In determining the number of partners in a partnership, a person owning an interest in a flow-through entity (including a partnership, grantor trust or S corporation) that owns an interest in the partnership is treated as a partner in such partnership only if (i) substantially all of the value of the owner’s interest in the flow-through entity is attributable to the flow-through entity’s direct or indirect interest in the partnership, and (ii) a principal purpose of the use of the flow-through entity is to permit the partnership to satisfy the 100 partner limitation. We and the operating partnership believe and currently intend to take the position that the operating partnership should not be classified as a publicly traded partnership because (i) operating partnership units are not traded on an established securities market, and (ii) operating partnership units should not be considered readily tradable on a secondary market or the substantial equivalent thereof. In addition, the operating partnership presently qualifies for the Private Placement Exclusion.
Even if the operating partnership were considered a publicly traded partnership under the PTP Regulations, the operating partnership should not be treated as a corporation for U.S. federal income tax purposes as long as 90% or more of its gross income consists of “qualifying income” under section 7704(d) of the Code. In general, “qualifying income” includes interest, dividends, real property rents (as defined by section 856 of the Code) and gain from the sale or disposition of real property. If the operating partnership were characterized as a publicly traded partnership even if it were not taxable as a corporation because of the qualifying income exception, however, holders of operating partnership units would be subject to special rules under section 469 of the Code. Under such rules, each holder of operating partnership units would be required to treat any loss derived from the operating partnership separately from any income or loss derived from any other publicly traded partnership, as well as from income or loss derived from other passive activities. In such case, any net losses or credits attributable to the operating partnership which are carried forward may only be offset against future income of the operating partnership. Moreover, unlike other passive activity losses, suspended losses attributable to the operating partnership would only be allowed upon the complete disposition of the operating partnership unit holder’s entire interest in the operating partnership.
We have not requested, and do not intend to request, a ruling from the IRS that the operating partnership will be classified as a partnership for federal income tax purposes.
If for any reason the operating partnership were taxable as a corporation, rather than a partnership, for federal income tax purposes, we would not be able to qualify as a REIT, unless we are eligible for relief from the violation pursuant to relief provisions described above. See “— Requirements for Qualification as a REIT — Organizational Requirements” and “Requirements for Qualification as a REIT—Operational Requirements—Asset Tests” above for discussion of the effect of the failure to satisfy the REIT tests for a taxable year, and of the relief provisions.
In addition, any change in the operating partnership’s status for tax purposes might be treated as a taxable event, in which case we might incur a tax liability without any related cash distribution. Further, items of income and deduction of the operating partnership would not pass through to its partners, and its partners would be treated as stockholders for tax purposes. The operating partnership would be required to pay income tax at corporate tax rates on its net income, and distributions to its partners would constitute distributions that would not be deductible in computing the operating partnership’s taxable income.
Income Taxation of the Operating Partnership and Its Partner, Not the Operating Partnership, Subject to Tax. A partnership generally is not a taxable entity for federal income tax purposes. As a partner in the operating partnership, we will be required to take into account our allocable share of the operating partnership’s income, gains, losses, deductions and credits for any taxable year of the operating partnership ending within or with our taxable year, without regard to whether we have received or will receive any distributions from the operating partnership.
Operating Partnership Allocations. Although a partnership agreement generally determines the allocation of income and losses among partners, such allocations will be disregarded for tax purposes if they do not comply with the provisions of section 704(b) of the Code and the Treasury Regulations promulgated thereunder. If an allocation is not recognized for federal income tax purposes, the item subject to the allocation will be reallocated in accordance with the partner’s interests in the partnership, which will be determined by taking into account all of the facts and circumstances relating to the economic arrangement of the partners with respect to such item. The operating partnership’s allocations of taxable income and loss are intended to comply with the requirements of section 704(b) of the Code and the Treasury Regulations promulgated thereunder.
Tax Allocations With Respect to Contributed Properties. Pursuant to section 704(c) of the Code, income, gain, loss and deduction with respect to property that is contributed to a partnership in exchange for an interest in the partnership must, for federal income tax purposes, be shared among the partners to take account of the unrealized gain or unrealized loss associated with the property at the time of the contribution. The amount of unrealized gain or unrealized loss is generally equal to the difference between the fair market value of the contributed property at the time of contribution and the adjusted tax basis of such property at the time of contribution. Under applicable Treasury Regulations, partnerships are required to use a reasonable method for allocating items subject to section 704(c) of the Code, and several reasonable allocation methods are described therein.
Under the operating partnership agreement, subject to exceptions applicable to limited partnership interests, depreciation or amortization deductions of the operating partnership generally is allocated among the partners in accordance with their respective interests in the operating partnership, except to the extent that the operating partnership is required under section 704(c) of the Code to use a different method for allocating depreciation deductions attributable to its properties. In addition, gain or loss on the sale of a property that has been contributed to the operating partnership will be specially allocated to the contributing partner to the extent of any built-in gain or loss with respect to the property for federal income tax purposes. It is possible that we may (i) be allocated lower amounts of depreciation deductions for tax purposes with respect to contributed properties than would be allocated to us if each such property were to have a tax basis equal to its fair market value at the time of contribution and (ii) be allocated taxable gain in the event of a sale of such contributed properties in excess of the economic profit allocated to us as a result of such sale. These allocations may cause us to recognize taxable income in excess of cash proceeds received by us, which might adversely affect our ability to comply with the REIT distribution requirements, although we do not anticipate that this event will occur. The foregoing principles also will affect the calculation of our earnings and profits for purposes of determining the portion of our distributions that are taxable as a dividend. The allocations described in this paragraph may result in a higher portion of our distributions being taxed as a dividend than would have occurred had we purchased such properties for cash.
Basis in Operating Partnership Interest. The adjusted tax basis of our partnership interest in the operating partnership generally is equal to the amount of cash and the basis of any other property contributed to the operating partnership by us, (i) increased by (A) our allocable share of the operating partnership’s income and (B) our allocable share of indebtedness of the operating partnership, and (ii) reduced, but not below zero, by (A) our allocable share of the operating partnership’s loss and (B) the amount of cash distributed to us, including constructive cash distributions resulting from a reduction in our share of indebtedness of the operating partnership.
If the allocation of our distributive share of the operating partnership’s loss would reduce the adjusted tax basis of our partnership interest in the operating partnership below zero, the recognition of the loss will be deferred until such time as the recognition of the loss would not reduce our adjusted tax basis below zero. If a distribution from the operating partnership or a reduction in our share of the operating partnership’s liabilities would reduce our adjusted tax basis below zero, that distribution, including a constructive distribution, will constitute taxable income to us. The gain realized by us upon the receipt of any such distribution or constructive
distribution would normally be characterized as capital gain, and if our partnership interest in the operating partnership has been held for longer than the long-term capital gain holding period (currently one year), the distribution would constitute long-term capital gain.
Depreciation Deductions Available to the Operating Partnership. The operating partnership uses a portion of contributions we make from Net Offering Proceeds to acquire interests in properties and securities. To the extent that the operating partnership acquires properties or securities for cash, the operating partnership’s initial basis in such properties for federal income tax purposes generally will be equal to the purchase price paid by the operating partnership. The operating partnership depreciates each depreciable property for federal income tax purposes under the alternative depreciation system of depreciation (“ADS”). Under ADS, the operating partnership generally depreciates buildings and improvements over a 40-year recovery period using a straight-line method and a mid-month convention and will depreciate furnishings and equipment over a 10-year recovery period using a straight-line method and a half-year convention. To the extent that properties are contributed to the operating partnership in exchange for units of the operating partnership, the operating partnership’s initial basis in each such property for federal income tax purposes should be the same as the transferor’s basis in that property on the date of contribution to the operating partnership. Although the law is not entirely clear, the operating partnership generally depreciates such depreciable property for federal income tax purposes over the same remaining useful lives and under the same methods used by the transferors.
Sale of the Operating Partnership’s Property. Generally, any gain realized by the operating partnership on the sale of property held for more than one year will be long-term capital gain, except for any portion of such gain that is treated as depreciation or cost recovery recapture. Our share of any gain realized by the operating partnership on the sale of any property held by the operating partnership as inventory or other property held primarily for sale to customers in the ordinary course of the operating partnership’s trade or business will be treated as income from a prohibited transaction that is subject to a 100% tax. We, however, do not presently intend to acquire or hold or allow the operating partnership to acquire or hold any property that represents inventory or other property held primarily for sale to customers in the ordinary course of our or the operating partnership’s trade or business.
Partnership Audit Rules
The recently enacted Bipartisan Budget Act of 2015 (the “Budget Act”) changes the rules applicable to U.S. federal income tax audits of partnerships. Under the newBudget Act rules (which are generally effectivetook effect for taxable years beginning after December 31, 2017), among other changes and subject to certain exceptions, any audit adjustment to items of income, gain, loss, deduction, or credit of a partnership (and any partner’s distributive share thereof) is determined, and taxes, interest, or penalties attributable thereto are assessed and collected, at the partnership level. Although it is uncertain how these new rules will be implemented, itIt is possible that theythe Budget Act rules could result in partnerships in which we directly or indirectly invest being required to pay additional taxes, interest and penalties as a result of an audit adjustment, and we, as a direct or indirect partner of these partnerships, could be required to bear the economic burden of those taxes, interest, and penalties even though we, as a REIT, may not otherwise have been required to pay additional corporate-level taxes as a result of the related audit adjustment. The changes created by these newthe Budget Act rules are sweeping and in many respects dependent on the promulgation of future regulations or other guidance by the U.S. Department of the Treasury. Prospective investors are urged to consult their tax advisors with respect to these changes and their potential impact on their investment in our shares.
Payments to Certain Foreign Financial Entities and Other Foreign Entities. Withholding tax at a rate of 30% will be imposed on certain payments to you or certain foreign financial institutions (including investment funds) and other non-U.S. entities receiving payments on your behalf, including distributions in respect of shares of our stock and gross proceeds from the sale of shares of our stock, if you or such institutions fail to comply with certain due diligence and other reporting rules as set forth in the recently issues Treasury regulations.Regulations. Accordingly, the entity through which shares of our stock are held will affect the determination of whether such withholding is required. Withholding currently applies to payments of dividends and will apply to payments of gross proceeds from a sale of shares of our stock made after December 31, 2019.2018. Stockholders that are otherwise eligible for an exemption from, or reduction of, U.S. withholding taxes with respect to such dividends and proceeds will be required to seek a refund from the IRS to obtain the benefit of such exemption or reduction. Additional requirements and conditions may be imposed pursuant to an intergovernmental agreement, if and when entered into, between the United StatesU.S. and such institution’s home jurisdiction. We will not pay any additional amounts to any stockholders in respect of any amounts withheld. You are encouraged to consult with your tax advisor regarding U.S. withholding taxes and the application of the recently issued Treasury regulationsRegulations in light of your particular circumstances.
Legislative or Other Actions Affecting REITs. Current and prospective holders of our stock should recognize the present federal income tax treatment of an investment in our stock may be modified by legislative, judicial or administrative action at any time and that any such action may affect investments and commitments previously made. For example, the Tax Act, which the U.S. President signed into law on December 22, 2017, significantly changes the U.S. federal income tax system, including rules that directly and indirectly affect REITs and their stockholders. The rules dealing with federal income taxation are constantly under review by persons involved in the legislative process and by the IRS and the U.S. Treasury Department. Changes to the federal tax laws and interpretations thereof could adversely affect an investment in our stock.
State, Local and Foreign Taxes. We and our subsidiaries and stockholders may be subject to state, local or foreign taxation in various jurisdictions including those in which we or they transact business, own property or reside. We own properties located in numerous jurisdictions, and may be required to file tax returns in some or all of those jurisdictions. Our state, local or foreign tax treatment and that of our stockholders may not conform to the federal income tax treatment discussed above. To the extent, if any, that we or our subsidiaries own assets, directly or indirectly, or conduct operations in foreign jurisdictions, we may be subject to foreign tax systems. Our favorable tax treatment in the United StatesU.S. as a REIT may not be recognized by foreign jurisdictions where we may be treated as a foreign corporation or other type of entity subject to a variety of taxes, such as income, corporate, trade, local and capital taxes, and distributions from such operations may be subject to withholding both as to dividends and interest paid to us.
Although we will seek to reduce the foreign taxes payable on foreign operations, it is unlikely that we will be able to mitigate totally such taxes, which could be significant. To the extent we incur such foreign taxes; we will receive reduced amounts from foreign operations and will have less cash available for distribution to our stockholders. Further, the foreign taxes cannot be passed through to our stockholders as a foreign tax credit and we cannot generally make effective use of foreign tax credits. As a result, we expect that neither we nor our stockholders will be able to reduce U.S. tax liability on account of our payment of foreign taxes. Accordingly, foreign taxes would impact our operations as an additional cost.
Furthermore, the fundamental changes made by the Tax Act to the U.S. international tax system could significantly impact our foreign tax exposure if we, or our subsidiaries, were to make investments in foreign jurisdictions. Prospective investors should consult their tax advisors regarding the application and effect of state, local and foreign income and other tax laws on an investment in our stock.
Advisor
Our Advisor has responsibility for our day-to-day operations, administering our accounting functions, serving as our consultant in connection with policy decisions to be made by our board of directors, and identifying and making acquisitions and investments on our behalf. In exchange for these services, our Advisor is entitled to receive certain fees from us.
Our Advisor and its affiliates are entitled to reimbursement of certain costs incurred on our behalf in connection with our organization, our Offerings, acquisitions, and operating activities. To the extent that operating expenses payable or reimbursable by us in any four consecutive fiscal quarters (“Expense Year”), commencing with the Expense Year ending June 30, 2013, exceed the greater of 2% of average invested assets or 25% of net income, the Advisor shall reimburse us, within 60 days after the end of the Expense Year, the amount by which the total operating expenses paid or incurred by us exceed the greater of the 2% or 25% threshold. Notwithstanding the above, we may reimburse the Advisor for expenses in excess of this limitation if a majority of our independent directors determines that such excess expenses are justified based on unusual and non-recurring factors. For the Expense Year ended December 31, 2016,2017, the Company did not incur operating expenses in excess of the limitation.
The current advisory agreement, which was approved by the board of directors on March 15, 2016,February 8, 2017, continues through June 2018. Our independent directors are required to review and approve the terms of our advisory agreement at least annually.
For additional information on our Advisor, its affiliates or other related parties, as well as the fees and reimbursements we pay, see Item 8. “Financial Statements and Supplementary Data” – Note 11. “Related Party Arrangements.”
Available Information
CNL Financial Group, LLC (“Sponsor” or “CNL”) maintains a web site at www.cnlhealthcareproperties.com containing additional information about our business, and a link to the SEC web site (www.sec.gov). We make available free of charge on our web site, our Annual Report on Form 10-K, Quarterly Reports on Form 10-Q, Current Reports on Form 8-K, and, if applicable, amendments to those reports filed or furnished pursuant to Section 13(a) or 15(d) of the Securities Exchange Act of 1934, as amended, as soon as reasonably practical after we file such material, or furnish it to, the SEC. You may read and copy any materials we file with the SEC at the SEC’s Public Reference Room at 100 F Street, NE, Washington, DC 20549. You may obtain information on the operation of the Public Reference Room by calling the SEC at 1-800-SEC-0330. The SEC also maintains a web site (www.sec.gov) where you can search for annual, quarterly and current reports, proxy and information statements, and other information regarding us and other public companies.
The contents of our web site are not incorporated by reference in, or otherwise a part of, this report.
Valuation Related Risks
In determining the Company’s estimated net asset valueNAV per share, the Company primarily relied upon a valuation of the Company’s portfolio of properties and debt as of December 31, 2016.2017. Valuations and appraisals of the Company’s properties and outstanding debt are estimates of fair value and may not necessarily correspond to realizable value upon the sale of such properties. Therefore, the Company’s estimated net asset valueNAV per share may not reflect the amount that would be realized upon a sale of each of the Company’s properties.
For the purposes of calculating the Company’s estimated net asset valueNAV per share, the Company retained an investment banking firm as valuation expert to determine the Company’s estimated net asset valueNAV per share and the value of the Company’s properties and debt as of December 31, 2016.2017. The valuation methodologies used to estimate the net asset valueNAV of the Company’s shares as well as the value of the Company’s properties and outstanding debt involved certain subjective judgments, including but not limited to, discounted cash flow analyses for wholly owned and partially owned properties. Ultimate realization of the value of an asset depends to a great extent on economic and other conditions beyond the Company’s control. Further, valuations do not necessarily represent the price at which an asset would sell, since market prices of assets can only be determined by negotiation between a willing buyer and seller. Therefore, the valuations of the Company’s properties and the Company’s investments in real estate-related assets may not correspond to the realizable value upon a sale of those assets.
Company Related Risks
The Company and its Advisor have limited operating histories and there is no assurance the Company will achieve its goals.
The Company and the Advisor have limited operating histories. To be successful, the Advisor must, among other things:
attract, integrate, motivate and retain qualified personnel to manage the Company’s day-to-day operations;
respond to competition for the Company’s targeted real estate properties and other investments; and
continue to build and expand its operational structure to support the Company’s business.
There can be no assurance that the Advisor will succeed in achieving these goals.
In prior periods the Company has not had sufficient cash available from operations to pay distributions, and, therefore, has paid distributions from the net proceeds of the Company’s offering. The Company may continue to pay distributions from sources other than its cash flow from operations or funds from operations, and any such distributions may reduce the amount of cash the Company ultimately invests in assets, negatively impact the value of the Company’s stockholders’ investment and be dilutive to its stockholders.
Prior to 2013, the Company generated little, if any, cash flow from operations or funds from operations. Further, investments by the Company in development or redevelopment projects, or in properties requiring significant capital, may affect the Company’s ability to make cash distributions. The Company’s organizational documents permit it to make distributions from any source, such as from the proceeds of the Company’s offerings (including its Reinvestment Plan), cash resulting from a deferral or waiver of asset management fees or expense reimbursements, and borrowings, which may be unsecured or secured by the Company’s assets, in anticipation of future net operating cash flow. The Company has not established any limit on the extent to which the Company may use alternate sources, including borrowings or proceeds of the Company’s offerings, to pay distributions. Commencing in the fourth fiscal quarter of 2011 through the fourth quarter of 2016,2017, the Company made cash distributions from offering proceeds, which were dilutive to the Company’s stockholders. To the extent the Company makes cash distributions, or a portion thereof, from sources other than operating cash flow or funds from operations, the Company will have less capital available to invest in properties and other real estate-related assets, the book value per share may decline, which might cause the Company to reduce the offering price in this offering or in future offerings, if any, and there willcan be no assurance that the Company will be able to sustain distributions at that level. Further, distributions that exceed cash flows from operations or funds from operations may not be sustainable. Distributions will be taxable as ordinary income to the stockholders to the extent
such distributions are made from the Company’s current and accumulated earnings and profits (“E&P”). In addition, to the extent distributions exceed E&P calculations on a tax basis, a stockholder’s basis in the Company’s stock will be reduced and, to the extent distributions exceed a stockholder’s basis, the stockholder may recognize a capital gain in the future.
There can be no assurance that the Company will be able to achieve expected cash flows necessary to pay or maintain distributions at any particular level or that distributions will increase over time.
There are many factors that can affect the availability and timing of distributions to stockholders. Distributions generally will be based upon such factors as the amount of cash available or anticipated to be available from real estate investments and investments in real estate-related securities, mortgage or other loans and assets, current and projected cash requirements and tax considerations.
Distributions may be limited in whole or in part by covenants of the Company’s senior unsecured revolving line of credit facilities(“Revolving Credit Facility”) or other loans. Because the Company receives income from property operations and interest or rents at various times during the Company’s fiscal year, distributions paid may not reflect the Company’s income earned in that particular distribution period. The amount of cash available for distributions is affected by many factors, such as the Company’s ability to make asset acquisitions as offering proceeds become available, the income from those investments and yields on securities of other real estate programs that the Company invests in, as well as the Company’s operating expense levels and many other variables. Actual cash available for distribution may vary substantially from estimates. The Company’s actual results may differ significantly from the assumptions used by the Company’s board of directors in establishing the distribution rates to be paid on its shares.
The Company cannot assure investors that:
rents or operating income from the Company’s properties will remain stable or increase;
tenants will not default under or terminate their leases;
acquisitions of real properties will increase the Company’s cash available for distributions to stockholders; or
development properties will be developed on budget or generate income once stabilized.
Many of the factors that can affect the availability and timing of cash distributions to stockholders are beyond the Company’s control, and a change in any one factor could adversely affect the Company’s ability to pay distributions. For instance:
Cash available for distributions may decrease if the Company is required to spend money to correct defects or to make improvements to properties.
(1) | Cash available for distributions may decrease if the Company is required to spend money to correct defects or to make improvements to properties. |
Cash available for distributions may decrease if the assets the Company acquires have lower yields than expected.
(2) | Cash available for distributions may decrease if the assets the Company acquires have lower yields than expected. |
Federal income tax laws require REITs to distribute at least 90% of their taxable income to stockholders each year. The Company has elected to be treated as a REIT for tax purposes, and this limits the earnings that the Company may retain for corporate growth, such as asset acquisition, development or expansion, and will make the Company more dependent upon additional debt or equity financing than corporations that are not REITs. If the Company borrows more funds in the future, more of the Company’s operating cash will be needed to make debt payments and cash available for distributions may decrease.
(3) | Federal income tax laws require REITs to distribute at least 90% of their taxable income to stockholders each year. The Company has elected to be treated as a REIT for tax purposes, and this limits the earnings that the Company may retain for corporate growth, such as asset acquisition, development or expansion, and will make the Company more dependent upon additional debt or equity financing than corporations that are not REITs. If the Company borrows more funds in the future, more of the Company’s operating cash will be needed to make debt payments and cash available for distributions may decrease. |
The payment of principal and interest required to service the debt resulting from the Company’s policy to use leverage to acquire assets may leave the Company with insufficient cash to pay distributions.
(4) | The payment of principal and interest required to service the debt resulting from the Company’s policy to use leverage to acquire assets may leave the Company with insufficient cash to pay distributions. |
As the Company has elected to be taxed as a REIT, the Company may pay distributions to the Company’s stockholders to comply with the distribution requirements of the Code, and to eliminate, or at least minimize, exposure to federal income taxes and the nondeductible REIT excise tax. Differences in timing between the receipt of income and the payment of expenses, and the effect of required debt payments, could require the Company to borrow funds on a short term basis to meet the distribution requirements that are necessary to achieve the tax benefits associated with qualifying as a REIT.
(5) | As the Company has elected to be taxed as a REIT, the Company may pay distributions to the Company’s stockholders to comply with the distribution requirements of the Code, and to eliminate, or at least minimize, exposure to federal income taxes and the nondeductible REIT excise tax. Differences in timing between the receipt of income and the payment of expenses, and the effect of required debt payments, could require the Company to borrow funds on a short term basis to meet the distribution requirements that are necessary to achieve the tax benefits associated with qualifying as a REIT. |
If the Company decides to list the Company’s common stock on a national exchange, it may wish to lower the Company’s distribution rate in order to optimize the price at which the Company’s shares would trade. In addition, subject to the applicable REIT rules, the Company’s board of directors, in its discretion, may retain any portion of the Company’s cash on hand or use offering proceeds for capital needs and other corporate purposes. Future
distribution levels are subject to adjustment based upon any one or more of the risk factors set forth in this prospectus, as well as other factors that the Company’s board of directors may, from time to time deem relevant to consider when determining an appropriate common stock distribution. As of December 31, 20162017 the Company has experienced cumulative losses and cannot assure investors that it will generate or have sufficient cash available to continue paying distributions to investors at any specified level or that distributions the Company makes may not be decreased or be eliminated in the future.
Because the Company relies on affiliates of CNL for advisory and property management and managing dealer services, if these affiliates or their executive officers and other key personnel are unable to meet their obligations to the Company, the Company may be required to find alternative providers of these services, which could disrupt the Company’s business.
CNL, through one or more of its affiliates or subsidiaries, owns and controls the Sponsor, Advisor and Property Manager, as well as CNL Securities Corp., the managing dealer of the Company’s offering.offerings. In the event that any of these affiliates are unable to meet their obligations to the Company, the Company might be required to find alternative service providers, which could disrupt the Company’s business by causing delays and/or increasing the Company’s costs.
Further, the Company’s success depends to a significant degree upon the contributions of Thomas K. Sittema, the Company’s chairman of the board of directors, Stephen H. Mauldin, the Company’s vice chairman of the board of directors, president and chief executive officer; Ixchell C. Duarte, the Company’s chief financial officer, senior vice president and Kevin Maddron,treasurer; and John F. Starr, the Company’s chief operating officer, chief financial officer and treasurer, each of whom would be difficult to replace. If any of these key personnel were to cease their affiliation with the Company or the Company’s affiliates, the Company may be unable to find suitable replacement personnel and the Company’s operating results could suffer. In addition, the Company has entered
into an advisory agreement with the Advisor which contains a non-solicitation and non-hire clause prohibiting the Company or the Company’s operating partnership from (i) soliciting or encouraging any person to leave the employment of the Advisor; or (ii) hiring on the Company’s behalf or on behalf of the Company’s operating partnership any person who has left the employment of the Advisor for one year after such departure. All of the Company’s executive officers and the executive officers of the Advisor are also executive officers of CNL Lifestyle Properties, Inc. (“CLP”) and its advisor, and CNL Healthcare Properties II, Inc. (“CHP II”), a new non-traded corporation that intends to qualify as a real estate investment trustREIT sponsored by CNL, which has begun to invest in healthcare properties substantially similar to those in which the Company has currently invested, and CHP II’s advisor, all of which are affiliates of the Advisor. The Company believes that its future success depends, in large part, upon the Advisor’s ability to hire and retain highly skilled managerial, operational and marketing personnel. Competition for such personnel is intense, and the Advisor may be unsuccessful in attracting and retaining such skilled personnel. The Company does not maintain key person life insurance on any of its officers.
Any adverse changes in CNL’s financial health, the public perception of CNL or the Company’s relationship with its sponsor or its affiliates could hinder the Company’s operating performance and the return on an investment.
Under certain circumstances, the Advisor and Property Manager have both committed to accept unvested restricted common stock in lieu of certain fees and expenses payable to them in order to provide additional cash to support of the Company’s distributions to investors. The Advisor and Property Manager may terminate their expense support obligations upon 30 days’ notice to the Company. If such expense support is terminated by either the Advisor, the Property Manager or both due to their or CNL’s financial health, the Company’s results from operations, cash from operations and funds from operations would all be negatively impacted and the Company’s ability to pay distributions to investors would be adversely impacted.
In addition, any deterioration in the perception of CNL in the broker-dealer and financial advisor industries could result in an adverse effect on the Company’s ability to acquire assets and obtain financing from third parties on favorable terms.
Adverse changes in affiliated programs could also adversely affect our ability to raise capital.
CNL has one other public, non-traded, real estate investment program which has investment objectives similar to the Company’s, CHP II, which has begun raising equity capital to invest in the healthcare sector. The Company’s Sponsor also has two other public, non-traded real estate investment programs, CLP and CNL Growth Properties, Inc. (“CGP”), which are closed to new investors. Adverse results in the other non-traded REITs on the CNL platform have the potential to affect CNL’s and the Company’s reputation among financial advisors and investors.
The Company may be restricted in its ability to replace the Property Manager under certain circumstances which could have a material adverse effect on the Company’s business and financial condition.
The Company’s ability to replace the Property Manager may be limited. Under the terms of the Company’s property management and leasing agreement, the Company may terminate the agreement (a) in the event of the Property Manager’s voluntary or involuntary bankruptcy or a similar insolvency event or (b) for “cause.” In this case, “cause” means a material breach of the property management and leasing agreement of any nature by the property manager relating to all or substantially all of the properties being managed under the agreement that is not cured within 30 days after notice to the property manager. The Company may amend the property management and leasing agreement from time to time to remove a particular property from the pool of properties managed by the Property Manager (a) if the property is sold to a bona fide unaffiliated purchaser, or (b) for “cause.” The Company’s board of directors may find the performance of the property manager to be unsatisfactory. However, unsatisfactory performance by the property manager may not constitute “cause.” As a result, the Company may be unable to terminate the property management and leasing agreement even if the Company’s board of directors concludes that doing so is in the Company’s best interest.
An investment return may be reduced if the Company is required to register as an investment company under the Investment Company Act.
The Company is not registered, and does not intend to register the Company or any of its subsidiaries, as an investment company under the Investment Company Act. If the Company or any of its subsidiaries become obligated to register as an investment company, the registered entity would have to comply with a variety of substantive requirements under the Investment Company Act imposing, among other things:
limitations on capital structure;
restrictions on specified investments;
prohibitions on transactions with affiliates; and
compliance with reporting, record keeping, voting, proxy disclosure and other rules and regulations that would significantly change the Company’s operations.
The Company believes it conducts its operations, directly and through the Company’s wholly and majority owned subsidiaries, so that neither the Company nor any of its subsidiaries will be an investment company and, therefore, will not be required to register as an investment company under the Investment Company Act. Under Section 3(a)(1)(A) of the Investment Company Act, a company is deemed to be an “investment company” if it is, or holds itself out as being, engaged primarily, or proposes to engage primarily, in the business of investing, reinvesting or trading in securities. Under Section 3(a)(1)(C) of the Investment Company Act, a company is deemed to be an “investment company” if it is engaged, or proposes to engage, in the business of investing, reinvesting, owning, holding or trading in securities and owns or proposes to acquire “investment securities” having a value exceeding 40% of the value of its total assets (exclusive of government securities and cash items) on an unconsolidated basis, which the Company refer to as the “40% Test.”
Since the Company is primarily engaged in the business of acquiring real estate, the Company believes that the Company and most, if not all, of the Company’s wholly and majority-owned subsidiaries will not be considered investment companies under either Section 3(a)(1)(A) or Section 3(a)(1)(C) of the Investment Company Act. If the Company or any of the Company’s wholly or majority-owned subsidiaries would ever inadvertently fall within one of the definitions of “investment company,” the Company intends to rely on the exception provided by Section 3(c)(5)(C) of the Investment Company Act.
Under Section 3(c)(5)(C), a company generally must maintain at least 55% of its assets directly in what are deemed “qualifying” real estate assets and at least 80% of the entity’s assets in such qualifying assets and in a broader category of what are deemed “real estate-related” assets to qualify for this exception. Mortgage-related securities may or may not constitute qualifying assets, depending on the characteristics of the mortgage-related securities, including the rights that the Company has with respect to the underlying loans. The Company’s ownership of mortgage-related securities, therefore, is limited by provisions of the Investment Company Act and Commission staff interpretations.
The method the Company uses to classify its assets for purposes of the Investment Company Act is based in large measure upon no-action positions taken by the Commission staff in the past. These no-action positions were issued in accordance with factual situations that may be substantially different from the factual situations the Company may face, and a number of these no-action positions were issued more than ten years ago. No assurance can be given that the Commission staff will concur with the Company’s classification of the Company’s assets. In addition, the Commission staff may, in the future, issue further guidance that may require the Company to re-classify the Company’s assets for purposes of qualifying for an exclusion from regulation under the Investment Company Act. If the Company is required to re-classify its assets, the Company may no longer be in compliance with the exception from the definition of an “investment company” provided by Section 3(c)(5)(C) of the Investment Company Act.
A change in the value of any of the Company’s assets could cause the Company or one or more of its wholly or majority-owned subsidiaries to fall within the definition of “investment company” and negatively affect the Company’s ability to maintain the Company’s exception from regulation under the Investment Company Act. To avoid being required to register as an investment company under the Investment Company Act, the Company and its subsidiaries may be unable to sell assets the Company would otherwise want to sell and may need to sell assets the Company would otherwise wish to retain. In addition, the Company may have to acquire additional income- or loss-generating assets that the Company might not otherwise have acquired or may have to forego opportunities to acquire interests in companies that the Company would otherwise want to acquire and would be important to the Company’s investment strategy.
If the Company were required to register as an investment company but failed to do so, it would be prohibited from engaging in the Company’s business, and criminal and civil actions could be brought against the Company. In addition, the Company’s contracts would be unenforceable unless a court required enforcement, and a court could appoint a receiver to take control of the Company and liquidate its business.
Stockholders have limited control over changes in the Company’s policies and operations.
The Company’s board of directors determines the Company’s investment policies, including its policies regarding financing, growth, debt capitalization, REIT qualification and distributions. The Company’s board of directors may amend or revise these and other policies without a vote of the Company’s stockholders. Under the Company’s charter and the Maryland General Corporation Law, its stockholders currently have a right to vote only on the following matters:
the election or removal of directors;
any amendment of the Company’s charter, except that the Company’s board of directors may amend its charter without stockholder approval to change the Company’s name, increase or decrease the aggregate number of the Company’s shares or the number of shares of any class or series that the Company has the authority to issue, effect certain reverse stock splits, or change the name or other designation or par value of any class or series of the Company’s stock and the aggregate par value of the Company’s stock;
the Company’s liquidation and dissolution; and
except as otherwise permitted by law, the Company’s being a party to any merger, consolidation, sale or other disposition of substantially all of its assets or similar reorganization.
If the Company does not successfully implement a liquidity event, investors may have to hold an investment for an indefinite period.
ItDuring 2018, it is currently contemplatedanticipated that by 2018 the Company’s board of directors will begincontinue to evaluate various strategic options to provide stockholders with liquidity of their investment. If the Company’s board of directors determines to pursue a liquidity event, the Company would be under no obligation to conclude the process within a set time. If the Company adopts a plan of liquidation, the timing of the sale of assets will depend on real estate and financial markets, economic conditions in areas in which its investments are located and federal income tax effects on stockholders that may prevail in the future. The Company cannot guarantee that the Company will be able to
liquidate all of the Company’s assets on favorable terms, if at all. After the Company adopts a plan of liquidation, the Company would likely remain in existence until all its investments are liquidated. If the Company does not pursue a liquidity event or delays such a transaction due to market conditions, the Company’s common stock may continue to be illiquid and investors may, for an indefinite period of time, be unable to convert investor shares to cash easily, if at all, and could suffer losses on an investment in the Company’s shares.
Non-traded REITs have been the subject of increased scrutiny by regulators and media outlets resulting from inquiries and investigations initiated by Financial Industry Regulatory Authority, Inc. and the Commission.
The Company’s securities, like other non-traded REITs, are sold through broker-dealers and financial advisors. Governmental and self-regulatory organizations such as the Commission and self-regulatory organizations such as Financial Industry Regulatory Authority, Inc. (“FINRA”) impose and enforce regulations on broker-dealers, investment advisers and similar financial services companies. In disciplinary proceedings in 2012, the Enforcement Division of FINRA required a broker-dealer to pay restitution to investors of a non-traded REIT in connection with the broker-dealer’s sale and promotion activities. FINRA has also filed complaints against a broker-dealer firm with respect to (i) its solicitation of investors to purchase shares in a non-traded REIT without conducting a reasonable inquiry of investor suitability and (ii) its provision of misleading distribution information. In February 2014, four non-traded REITs with affiliated sponsors disclosed in public filings a settlement with the Commission with respect to allegations that these REITs misled investors about their share-pricing methods, concealing inter-fund transactions and extra payments to executives.
The above-referenced proceedings have resulted in increased regulatory scrutiny from the Commission regarding non-traded REITs. As a result of this increased scrutiny and accompanying negative publicity and coverage by media outlets, FINRA may impose additional restrictions on sales practices in the independent broker-dealer channel for non-traded REITs, and accordingly the Company may face increased difficulties in raising capital. If the Company becomes the subject of scrutiny, even if the Company has complied with all applicable laws and regulations, responding to such regulator inquiries could be expensive and distract the Company’s management.
Risks Related to Conflicts of Interest and the Company’s Relationships with Its Advisor and Its Affiliates
There may be conflicts of interest because of interlocking boards of directors with affiliated companies.
Thomas K. SittemaStephen H. Mauldin serves as a director, president and chief executive officer of the Company and as chairman of the board of directors, president and chief executive officer of the Company, as well as chairmanCHP II. In addition, J. Chandler Martin, one of the board ofour independent directors, of CGP and as ais also an independent director of CLP, affiliates of the Company and/or the Advisor,CHP II. Mr. Mauldin and Stephen H. Mauldin serves as the Company’s vice chairman. These directorsMr. Martin may experience conflicts of interest in managing the Company because they also have management responsibilities for these affiliated entities,CHP II, which investinvests in properties in the same markets as the Company’s properties.
There will be competing demands on the Company’s officers and directors, and they may not devote all of their attention to the Company which could have a material adverse effect on its business and financial condition.
TwoStephen H. Mauldin, a member of the Company’s board of directors, Thomas K. Sittemapresident and Stephen H. Mauldin, arechief executive officer, is also officersan officer and directorsdirector of the Advisor and other affiliated entities and may experience conflicts of interest in managing the Company because theyhe also havehas management responsibilities for other companies including companies that may invest in some of the same types of assets in which the Company may invest. In addition, substantially all of the other companies that they workhe works for are affiliates of the Company and/or the Advisor. For these reasons, all of these individuals share theirhe shares his management time and services among those companies and the Company and will not devote all of theirhis attention to the Company and could take actions that are more favorable to the other companies than to the Company.
In addition, Kevin Maddron,Ixchell C. Duarte, the Company’s chief financial officer, senior vice president and treasurer, John F. Starr, the Company’s chief operating officer chief financial officer and treasurer, andsenior vice president, as well as the Company’s other officers serve as officers of, and devote time to, the Advisor, as well as CHP II, which has similar investment objectives to the Company. Certain of the Company’s officers may also serve as officers of, and devote time to, CLP and CGP, two other non-traded REITs affiliated with the Sponsor, and their respective advisors and other companies which may be affiliated with the Company in the future. These officers may experience conflicts of interest in managing the Company because they also have management responsibilities for multiple programs. For these reasons, these officers will share their management time and services among these other programs and the Company, and will not devote all of their attention to the Company and could take actions that are more favorable to CHP II than to the Company.
Other real estate investment programs sponsored by CNL or the Sponsor use investment strategies that are similar to the Company’s. The Advisor and its affiliates and their and the Company’s executive officers will face conflicts of interest relating to the purchase and leasing of properties and other investments, and such conflicts may not be resolved in the Company’s favor.
One or more real estate investment programs sponsored by CNL or the Sponsor may seek to invest in properties and other real estate-related investments similar to the assets the Company seeks to acquire. CNL has one public, real estate investment program, CHP II, which has investment strategies similar to the Company. CHP II will be managed by the executive officers of the Advisor and expects to invest in the same asset classes in which the Company owns properties. As a result, the Company may be buying properties and other real estate-related investments at the same time as CHP II is buying properties and other real estate-related investments in the asset classes in which the Company focuses. The Company cannot assure investors that properties the Company wants to acquire will be allocated to the Company in this situation. CNL is not required to allocate each prospective investment to the Advisor for review. The Advisor may choose a property that provides lower returns to the Company than a property allocated to CHP II. In addition, the Company may acquire properties in geographic areas where other programs sponsored by CNL or the Sponsor also invest. If one of such other programs sponsored by CNL or the Sponsor attracts a tenant for which the Company is competing, the Company could suffer a loss of revenue due to delays in locating another suitable tenant. Investors will not have the opportunity to evaluate the manner in which these conflicts of interest are resolved before or after making an investment.
The Advisor and its affiliates, including all of the Company’s executive officers and affiliated directors, will face conflicts of interest as a result of their compensation arrangements with the Company, which could result in actions that are not in the best interest of the Company’s stockholders.
The Company pays its Advisor and its affiliates, including the managing dealer of the Company’s offering and the Property Manager, substantial fees. These fees could influence their advice to the Company, as well as the judgment of affiliates of the Advisor performing services for the Company. Among other matters, these compensation arrangements could affect their judgment with respect to:
the continuation, renewal or enforcement of the Company’s agreements with its Advisor and its affiliates;
additional public offeringsOfferings of equity by the Company, which would create an opportunity for CNL Securities Corp., as managing dealer, to earn additional fees and for the Advisor to earn increased advisory fees;
property sales, which may entitle the Advisor to real estate commissions;
property acquisitions from third parties, which entitle the Advisor to an investment services fee;
borrowings to acquire assets, which increase the investment services fees and asset management fees payable to the Advisor and which entitle the Advisor or its affiliates to receive other acquisition fees in connection with assisting in obtaining financing for assets if approved by the Company’s board of directors, including a majority of the Company’s independent directors;
whether the Company seeks to internalize its management functions, which could result in it retaining some of the Advisor’s and its affiliates’ key officers for compensation that is greater than that which they currently earn or which could require additional payments to affiliates of the Advisor to purchase the assets and operations of the Advisor and its affiliates performing services for the Company;
the listing of, or other liquidity event with respect to, the Company’s shares, which may entitle the Advisor to a subordinated incentive fee;
a sale of assets, which may entitle the Advisor to a subordinated share of net sales proceeds; and
whether and when the Company seeks to sell the Company’s operating partnership or its assets, which sale could entitle the Advisor to additional fees.
The fees the Advisor receives in connection with transactions involving the purchase and management of the Company’s assets are not necessarily based on the quality of the investment or the quality of the services rendered to the Company. The basis upon which fees are calculated may influence the Advisor to recommend riskier transactions to the Company.
None of the agreements with the Advisor, Property Manager or any other affiliates were negotiated at arm’s length.
Agreements with the Advisor, Property Manager or any other affiliates may contain terms that would not otherwise apply if the Company entered into agreements negotiated at arm’s length with third parties.
If the Company internalizes the Company’s management functions, an interest in the Company could be diluted, the Company could incur other significant costs associated with being self-managed, the Company may not be able to retain or replace key personnel and may have increased exposure to litigation as a result of internalizing its management functions.
The Company may internalize management functions provided by the Advisor, Property Manager and their respective affiliates. The Company’s board of directors may decide in the future to acquire assets and personnel from the Advisor or its affiliates for consideration that would be negotiated at that time. However, as a result of the non-solicitation clause in the advisory agreement, generally the acquisition of Advisor personnel would require the prior written consent of the Advisor. There can be no assurances that the Company will be successful in retaining the Advisor’s key personnel in the event of an internalization transaction. In the event the Company acquires the Advisor or the Property Manager, the Company cannot be sure of the form or amount of consideration or other terms relating to any such acquisition, which could take many forms, including cash payments, promissory notes and shares of the Company’s stock. The payment of such consideration could reduce the percentage of the Company’s shares owned by persons who purchase shares in the Company’s offering and could reduce the net income per share and funds from operations per share attributable to an investment.
In addition, the Company may issue equity awards to officers and consultants, which would increase operating expenses and decrease net income and funds from operations. The Company cannot reasonably estimate the amount of fees to the Advisor, Property Manager and other affiliates the Company would save, and the costs it would incur, if the Company acquired these entities. If the expenses the Company assumes as a result of an internalization are higher than the expenses the Company avoid paying to the Advisor, Property Manager and other affiliates, its net income per share and funds from operations per share would be lower than they otherwise would have been had the Company not acquired these entities.
Additionally, if the Company internalizes its management functions, the Company could have difficulty integrating these functions. Currently, the officers of the Advisor and its affiliates perform asset management and general and administrative functions, including accounting and financial reporting, for multiple entities. The Company may fail to properly identify the appropriate mix of personnel and capital needs to operate as a stand-alone entity. An inability to manage an internalization transaction effectively could result in the Company’s incurring additional costs and divert its management’s attention from effectively managing the Company’s properties and overseeing other real estate-related assets.
In recent years, internalization transactions have been the subject of stockholder litigation. Stockholder litigation can be costly and time-consuming, and there can be no assurance that any litigation expenses the Company might incur would not be significant or that the outcome of litigation would be favorable to the Company. Any amounts the Company is required to expend defending any such litigation will reduce the amount of funds available for investment by the Company in properties or other investments.
The Company is not in privity of contract with service providers that may be engaged by the Advisor to perform advisory services and they may be insulated from liabilities to the Company, and the Advisor has minimal assets with which to remedy any liabilities to the Company.
The Advisor sub-contracts with affiliated or unaffiliated service providers for the performance of substantially all of its advisory services. The Advisor has engaged affiliates of the Sponsor to perform certain services on its behalf pursuant to agreements to which the Company is not a party. As a result, the Company is not in privity of contract with any such service provider and, therefore, such service provider will have no direct duties, obligations or liabilities to the Company. In addition, the Company has no right to any indemnification to which the Advisor may be entitled under any agreement with a service provider. The service providers the Advisor may subcontract with may be insulated from liabilities to the Company for services they perform, but may have certain liabilities to the Advisor. The Advisor has minimal assets with which to remedy liabilities to the Company resulting under the advisory agreement.
Risks Related to The Company’s Business
The Company has not established investment criteria limiting the size of property acquisitions. If the Company has an investment that represents a material percentage of the Company’s assets which experiences a loss, the value of an investment in the Company would be significantly diminished.
The Company is not limited in the size of any single property acquisition the Company may make and certain of the Company’s investments may represent a significant percentage of its assets. Should the Company experience a loss on a portion or all of an investment that represents a significant percentage of the Company’s assets, this event would have a material adverse effect on the Company’s business and financial condition, which would result in an investment in the Company being diminished.
The Company depends on tenants for a significant portion of its revenue and lease defaults or terminations could have an adverse effect.
The Company’s ability to repay any outstanding debt and make distributions to stockholders depends upon the ability of its tenants to make payments to the Company, and their ability to make these payments depends primarily on their ability to generate sufficient revenues in excess of operating expenses from businesses conducted on the Company’s properties. For example, a tenant’s failure or delay in making scheduled rent payments to the Company may result from the tenant realizing reduced revenues at the properties it operates. Defaults on lease payment obligations by tenants would cause the Company to lose the revenue associated with those leases and require the Company to find an alternative source of revenue to pay the Company’s mortgage indebtedness and prevent a foreclosure action. In addition, if a tenant at one of the Company’s single-user facilities, which are properties designed or built primarily for a particular tenant or a specific type of use, defaults on its lease obligations, the Company may not be able to readily market a single-user facility to a new tenant without making capital improvements or incurring other significant costs.
Significant tenant lease expirations may decrease the value of the Company’s investments.
Multiple, significant lease terminations in a given year in the Company’s medical office buildingsMOB produce tenant roll concentration and uncertainty as to the future cash flow of a property or portfolio and often decreases the value a potential purchaser will pay for one or more properties. There is no guarantee that medical office buildingsMOB acquired will not have tenant roll concentration, and if such concentration occurs it could decrease the Company’s ability to pay distributions to stockholders and the value of their investment.
The Company’s long-term leases may not result in fair market lease rates over time; therefore, the Company’s income and its distributions could be lower than if the Company did not enter into long-term leases.
The Company typically enters into long-term leases with tenants of certain of its properties. The Company’s long-term leases would likely provide for rent to increase over time. However, if the Company does not accurately judge the potential for increases in market rental rates, the Company may set the terms of these long-term leases at levels less than then-current market rental rates even after contractual rent increases. Further, the Company may have no ability to terminate those leases or to adjust the rent to then-prevailing market rates. As a result, the Company’s income and distributions could be lower than if the Company did not enter into long-term leases.
Medical office building properties that have vacancies for a significant period of time could be difficult to sell, which could diminish the return on your investment.
The Company’s medical office building properties may have vacancies as a result of the continued default of tenants under their leases or the expiration of tenant leases. If a high rate of vacancies persist, the Company may suffer reduced revenues. In addition, because properties’ market values depend principally upon the value of the properties’ leases, the resale value of properties with prolonged vacancies could suffer, which could further reduce your return.
The continuation of aA slow economy could adversely affect certain of the properties in which the Company invests, and the financial difficulties of the Company’s tenants and operators could adversely affect the Company.
The continuation of aA slow economy could adversely affect certain of the properties in which the Company invests. Although a general downturn in the real estate industry would be expected to adversely affect the value of the Company’s properties, a downturn in the seniors housing and healthcare sectors in which the Company invests could compound the adverse effect. Continued economic weakness combined with higher costs, especially for energy, food and commodities, hascan put considerable pressure on consumer spending, which, along with thea lack of available debt, could result in the Company’s tenants experiencing a decline in financial and operating performance and/or a decline in earnings from the Company’s TRS investments.
Further disruptionsDisruptions in the financial markets and deteriorating economic conditions could impact certain of the real estate properties the Company acquires and such real estate could experience reduced occupancy levels from that anticipated at the time of the Company’s acquisition of such real estate. The value of the Company’s real estate investments could decrease below the amounts the Company paid for the investments. Revenues from properties could decrease due to lower occupancy rates, reduced rental rates and potential increases in uncollectible rent. The Company will incur expenses, such as for maintenance costs, insurances costs and property taxes, even though a property is vacant. The longer the period of significant vacancies for a property, the greater the potential negative impact on the Company’s revenues and results of operations.
The inability of seniors to sell their homes could negatively impact occupancy rates, revenues, cash flows and results of operations of the properties the Company acquires.
Downturns in the housing markets could adversely affect the ability (or perceived ability) of seniors to currently afford entrance fees and resident fees as potential residents frequently use the proceeds from the sale of their homes to cover the cost of these fees. Specifically, if seniors have a difficult time selling their homes, these difficulties could impact their ability to relocate into, or finance their stays at, the Company’s seniors housing and post-acute care properties with private resources. If the volatility in the housing market returns, the occupancy rates, revenues, cash flows and results of operations for these properties could be negatively impacted.
The Company does not have control over market and business conditions that may affect its success.
The following external factors, as well as other factors beyond the Company’s control, may reduce the value of properties that it acquires, the ability of tenants to pay rent on a timely basis, or at all, the amount of the rent to be paid and the ability of borrowers to make loan payments on time, or at all:
changes in general or local economic or market conditions;
the pricing and availability of debt, operating lines of credit or working capital;
inflation and other increases in operating costs, including utilities and insurance premiums;
increased costs and shortages of labor;
increased competition;
quality of management;
failure by a tenant to meet its obligations under a lease;
bankruptcy of a tenant or borrower;
the ability of an operator to fulfill its obligations;
limited alternative uses for properties;
changing consumer habits or other changes in supply of, or demand for, similar or competing products;
acts of God, such as earthquakes, floods and hurricanes;
condemnation or uninsured losses;
changing demographics; and
changing government regulations, including REIT taxation, real estate taxes, environmental, land use and zoning laws.
Further, the results of operations for a property in any one period may not be indicative of results in future periods, and the long-term performance of such property generally may not be comparable to, and cash flows may not be as predictable as, other properties owned by third parties in the same or similar industry. If tenants are unable to make lease payments, TRS entities do not achieve the expected levels of operating income, or borrowers are unable to make loan payments as a result of any of these factors, cash available for distributions to the Company’s stockholders may be reduced.
The Company may be limited in its ability to vary the Company’s portfolio in response to changes in economic, market or other conditions, including by restrictions on transfer imposed by the Company’s limited partners, if any, in the Company’s operating partnership or by the Company’s lenders. Additionally, the return on the Company’s real estate assets also may be affected by a continued or exacerbated general economic slowdown experienced in the U.S. generally and in the local economies where its properties and the properties underlying the Company’s other real estate-related investments are located, including:
poor economic conditions may result in a decline in the operating income at the Company’s properties and defaults by tenants of the Company’s properties and borrowers under its investments in mortgage, bridge or mezzanine loans; and
increasing concessions, reduced rental rates or capital improvements may be required to maintain occupancy levels.
The Company’s exposure to typical real estate investment risks could reduce its income.
The Company’s properties, loans and other real estate-related investments are subject to the risks typically associated with investments in real estate. Such risks include the possibility that the Company’s properties will generate operating income, rent and capital appreciation, if any, at rates lower than anticipated or will yield returns lower than those available through other investments. Further, there are other risks by virtue of the fact that the Company’s ability to vary its portfolio in response to changes in economic and other conditions will be limited because of the general illiquidity of real estate investments. Income from the Company’s properties may be adversely affected by many factors including, but not limited to, an increase in the local supply of properties similar to the Company’s properties, newer competing properties, a decrease in the number of people interested in the properties that the Company acquires, changes in government regulation, including healthcare regulation, international, national or local economic deterioration, increases in operating costs due to inflation and other factors that may not be offset by increased lease rates, and changes in consumer tastes.
The Company may be unable to sell assets if or when the Company decides to do so.
Maintaining the Company’s REIT qualification and continuing to avoid registration under the Investment Company Act as well as many other factors, such as general economic conditions, the availability of financing, interest rates and the supply and demand for the particular asset type, may limit the Company’s ability to sell real estate assets. These factors are beyond the Company’s control. The Company cannot predict whether it will be able to sell any real estate asset on favorable terms and conditions, if at all, or the length of time needed to sell an asset.
An increase in real estate taxes may decrease the Company’s income from properties.
From time to time, the amount the Company pays for property taxes will increase as either property values increase or assessment rates are adjusted. Increases in a property’s value or in the assessment rate will result in an increase in the real estate taxes due on that property. If the Company is unable to pass the increase in taxes through to its tenants, the Company’s net operating income for the property will decrease.
Acquiring or attempting to acquire multiple properties in a single transaction may adversely affect the Company’s operations.
From time to time, the Company acquires multiple properties in a single transaction. Portfolio acquisitions typically are more complex and expensive than single property acquisitions, and the risk that a multiple-property acquisition does not close may be greater than in a single-property acquisition. Portfolio acquisitions may also result in the Company’s ownership of investments in geographically dispersed markets, placing additional demands on the Advisor and Property Manager in managing the properties in the portfolio. In addition, a seller may require that a group of properties be purchased as a package even though the Company may not want to purchase one or more properties in the portfolio. The Company also may be required to accumulate a large amount of cash to fund such acquisitions. The Company would expect the returns that it earns on such cash to be less than the returns on real property. Therefore, acquiring multiple properties in a single transaction may reduce the overall yield on the Company’s portfolio.
If one or more of the Company’s tenants file for bankruptcy protection, the Company may be precluded from collecting all sums due.
If one or more of the Company’s tenants, or the guarantor of a tenant’s lease, commences, or has commenced against it, any proceeding under any provision of the U.S. federal bankruptcy code, as amended, or any other legal or equitable proceeding under any bankruptcy, insolvency, rehabilitation, receivership or debtor’s relief statute or law, the Company may be unable to collect sums due under the Company’s lease(s) with that tenant. Any or all of the tenants, or a guarantor of a tenant’s lease obligations, could be subject to a bankruptcy or similar proceeding. A bankruptcy or similar proceeding may bar the Company’s efforts to collect pre-bankruptcy debts from those entities or their properties unless the Company is able to obtain an order from the bankruptcy court. If a lease is rejected by a tenant in bankruptcy, the Company would only have a general unsecured claim against the tenant, and may not be entitled to any further payments under the lease. Such an event could cause a decrease or cessation of rental payments which would reduce the Company’s cash flow and the amount available for distribution to stockholders. In the event of a bankruptcy or similar proceeding, the Company cannot assure investors that the tenant or its trustee will assume the Company’s lease. If a given lease, or guaranty of a lease, is not assumed, the Company’s cash flow and the amounts available for distribution to stockholders may be adversely affected.
If a sale-leaseback transaction is re-characterized in a tenant’s bankruptcy proceeding, the Company’s financial condition could be adversely affected.
The Company has entered into sale-leaseback transactions whereby the Company purchases a property and then leases the same property back to the person from whom it was purchased. In the event of the bankruptcy of a tenant, a transaction structured as a sale-leaseback may be re-characterized as either a financing or a joint venture, either of which outcomes could adversely affect the Company’s financial condition, cash flow, REIT qualification and the amount available for distributions to investors.
If the sale-leaseback were re-characterized as a financing, the Company might not be considered the owner of the property, and as a result would have the status of a creditor in relation to the tenant. In that event, the Company would no longer have the right to sell or encumber its ownership interest in the property. Instead, the Company would have a claim against the tenant for the amounts owed under the lease, with the claim arguably secured by the property. The tenant/debtor might have the ability to propose a plan restructuring the term, interest rate and amortization schedule of its outstanding balance. If confirmed by the bankruptcy court, the Company could be bound by the new terms and prevented from foreclosing its lien on the property. If the sale-leaseback were re-characterized as a joint venture, the Company’s lessee and the Company could be treated as co-venturers with regard to the property. As a result, the Company could be held liable, under some circumstances, for debts incurred by the lessee relating to the property.
Multiple property leases or loans with individual tenants or borrowers increase the Company’s risks in the event that such tenants or borrowers become financially impaired.
Defaults by a tenant or borrower may continue for some time before the Company determines that it is in the Company’s best interest to evict the tenant or foreclose on the property of the borrower.tenant. Tenants may lease more than one property, and borrowers may enter into more than one loan.property. As a result, a default by, or the financial failure of, a tenant or borrower could cause more than one property to become vacant or be in default or more than one lease or loan to become non-performing. Defaults or vacancies can reduce the Company’s rental income and funds available for distribution and could decrease the resale value of affected properties until they can be re-leased.
The Company relies on various security provisions in the Company’s leases for minimum rent payments which could have a material adverse effect on the Company’s financial condition.
The Company’s leases may, but are not required to, have security provisions such as deposits, stock pledges and guarantees or shortfall reserves provided by a third-party tenant or operator. These security provisions may terminate at either a specific time during the lease term once net operating income of the property exceeds a specified amount or upon the occurrence of other specified events. Certain security provisions may also have limits on the overall amount of the security under the lease. After the termination of a security feature, or in the event that the maximum limit of a security provision is reached, the Company may only look to the tenant to make lease payments. In the event that a security provision has expired or the maximum limit has been reached or a provider of a security provision is unable to meet its obligations, the Company’s results of operations and ability to pay distributions to the Company’s stockholders could be adversely affected if the Company’s tenants are unable to generate sufficient funds from operations to meet minimum rent payments and the tenants do not otherwise have the resources to make rent payments.
The Company’s real estate assets may be subject to impairment charges which could have a material adverse effect on the Company’s financial condition.
The Company is required to periodically evaluate the recoverability of the carrying value of the Company’s real estate assets for impairment indicators. Factors considered in evaluating impairment of the Company’s real estate assets held for investment include significant declines in property operating profits, recurring property operating losses and other significant adverse changes in general market conditions that are considered permanent in nature. Generally, a real estate asset held for investment is not considered impaired if the undiscounted, estimated future cash flows of the asset over its estimated holding period are in excess of the asset’s net book value at the balance sheet date. Management makes assumptions and estimates when considering impairments and actual results could vary materially from these assumptions and estimates.
The Company is uncertain that its existing sources for funding of future capital needs will remain adequate.
The Company has established a revolving credit facility and capital reserves on a property-by-property basis, as the Company deems appropriate to fund anticipated capital improvements. If the Company’s revolving credit facility is inadequate to address its capital improvement needs or if the Company does not have enough capital reserves to supply needed funds for capital improvements throughout the life of the Company’s investment in a property and there is insufficient cash available from operations or from other sources, the Company may be required to defer necessary improvements to a property. This may result in decreased cash flow and reductions in property values. If the Company’s reserves are insufficient to meet its cash needs, the Company may have to obtain financing from either affiliated or unaffiliated sources to fund its cash requirements. There can be no guarantee that these sources will be available to the Company. Accordingly, in the event that the Company develops a need for additional capital in the future for acquisitions or the maintenance or improvement of the Company’s properties or for any other reason, the Company has not identified any additional established sources for such funding, and the Company cannot assure investors that such sources of funding will be available to the Company in the future.
Increased competition for residents or patients may reduce the ability of certain of the Company’s operators to make scheduled rent payments to the Company or affect the Company’s operating results.
The types of properties in which the Company invests are expected to face competition for residents or patients from other similar properties, both locally and nationally. For example, competing seniors housing properties may be located near the seniors housing properties the Company owns or acquires. Any decrease in revenues due to such competition at any of the Company’s properties may adversely affect the Company’s operators’ ability to make scheduled rent payments to the Company and with respect to the Company’s seniors housing and other healthcare properties leased to TRS entities, may adversely affect the Company’s operating results of those properties.
Lack of diversification of the Company’s properties may increase the Company’s exposure to the risks of adverse economic conditions as to particular asset classes and categories of property within asset classes.
Since the Company’s assets are concentrated in certain asset classes or any brand or other category within an asset class, an economic downturn in such class or asset category could have an adverse effect on the Company’s results of operations and financial condition.
The Company may be subject to litigation which could have a material adverse effect on its business and financial condition.
The Company may be subject to litigation, including claims relating to the Company’s operations, offerings, unrecognized pre-acquisition contingencies and otherwise in the ordinary course of business. Some of these claims may result in potentially significant judgments against the Company, some of which are not, or cannot be, insured against. The Company generally intends to vigorously defend itself; however, the Company cannot be certain of the ultimate outcomes of claims that may arise in the future. Resolution of these types of matters against the Company may result in its payment of significant fines or settlements, which, if not insured against, or if these fines and settlements exceed insured levels, would adversely impact the Company’s earnings and cash flows. Certain litigation or the resolution of certain litigation may affect the availability or cost of some of the Company’s insurance coverage which could adversely impact the Company’s results of operations and cash flows, expose the Company to increased risks that would be uninsured and/or adversely impact its ability to attract officers and directors.
The Company will have no economic interest in the land beneath ground lease properties that the Company may acquire.
Certain of the properties that the Company acquires may be on land owned by a governmental entity or other third-party, while the Company owns a leasehold, permit, or similar interest. This means that the Company does not retain fee ownership in the underlying land. Accordingly, with respect to such properties, the Company will have no economic interest in the land or buildings at the expiration of the ground lease or permit. As a result, the Company will not share in any increase in value of the land associated with the underlying property and may forfeit rights to assets constructed on the land such as buildings and improvements at the end of the lease. Further, because the Company does not completely control the underlying land, the governmental or other third-party owners that lease
this land to the Company could take certain actions to disrupt the Company’s rights in the properties or the Company’s tenants’ operation of the properties or take the properties in an eminent domain proceeding. Such events are beyond the Company’s control. If the entity owning the land under one of the Company’s properties chose to disrupt the Company’s use either permanently or for a significant period of time, then the value of the Company’s assets could be impaired.
Existing seniors housing, medical office buildings,MOB, acute care and post-acute care properties that the Company acquires may be subject to unknown or contingent liabilities which could cause the Company to incur substantial costs.
The Company has acquired operating seniors housing, medical office buildings,MOB, acute care and post-acute care properties which may be subject to unknown or contingent liabilities for which the Company may have no recourse, or only limited recourse, against the sellers. In general, the representations and warranties provided under transaction agreements related to the Company’s acquisition of seniors housing and healthcare properties do not survive the closing of the transactions. While the Company generally requires the sellers to indemnify the Company with respect to breaches of representations and warranties that survive, such indemnification may be limited and subject to various materiality thresholds, a significant deductible or an aggregate cap on indemnifiable losses. There is no guarantee that the Company will recover any amounts with respect to losses due to breaches by the sellers of their representations and warranties. In addition, the total amount of costs and expenses that may be incurred with respect to liabilities associated with these properties may exceed the Company’s expectations, and it may experience other unanticipated adverse effects, all of which may adversely affect the Company’s financial condition, results of operations, the market price of its common stock and its ability to make distributions to the Company’s stockholders.
The Company may not be able to compete effectively in those markets where overbuilding exists and the Company’s inability to compete in those markets may have a material adverse effect on the Company’s business, financial condition and results of operations and the Company’s ability to make distributions to investors.
Overbuilding in the seniors housing segment in the late 1990s reduced occupancy and revenue rates at seniors housing facilities. The occurrence of another period of overbuilding could adversely affect the Company’s future occupancy and resident fee rates, decreased occupancy and operating margins, and lower profitability, which in turn could materially adversely affect the Company’s business, financial condition and results of operations and the Company’s ability to make distributions to its stockholders.
The Company invests in private-pay seniors housing properties, an asset class of the seniors housing sector that is highly competitive.
Private-pay seniors housing is a competitive asset class of the seniors housing sector. The Company’s seniors housing properties compete on the basis of location, affordability, quality of service, reputation and availability of alternative care environments. The
Company’s seniors housing properties also rely on the willingness and ability of seniors to select seniors housing options. The Company’s property operators may have competitors with greater marketing and financial resources able to offer incentives or reduce fees charged to residents thereby potentially reducing the perceived affordability of the Company’s properties. Additionally, the high demand for quality caregivers in a given market could increase the costs associated with providing care and services to residents. These and other factors could cause the amount of the Company’s revenue generated by private payment sources to decline or the Company’s operating expenses to increase. In periods of weaker demand, as has occurred during the recent general economic recession, profitability may be negatively affected by the relatively high fixed costs of operating a seniors housing property.
Events which adversely affect the ability of seniors to afford the Company’s daily resident fees could cause the occupancy rates, resident fee revenues and results of operations of the Company’s seniors housing properties to decline.
Costs to seniors associated with certain types of the seniors housing properties the Company acquires generally are not reimbursable under government reimbursement programs such as Medicaid and Medicare. Substantially all of the resident fee revenues generated by the Company’s properties are derived from private payment sources consisting of income or assets of residents or their family members. Only seniors with income or assets meeting or exceeding certain standards can typically afford to pay the Company’s daily resident and service fees and, in some
cases, entrance fees. Economic downturns such as the one recently experienced in the U.S., reductions or declining growth of government entitlement programs, such as social security benefits, or stock market volatility could adversely affect the ability of seniors to afford the fees for the Company’s seniors housing properties. If the Company’s tenants or managers are unable to attract and retain seniors with sufficient income, assets or other resources required to pay the fees associated with assisted and independent living services, the occupancy rates, resident fee revenues and results of operations for these properties could decline, which, in turn, could have a material adverse effect on the Company’s business.
Significant legal actions brought against the tenants or managers of the Company’s seniors housing, acute and post-acute care properties could subject them to increased operating costs and substantial uninsured liabilities, which may affect their ability to meet their obligations to the Company.
The tenants or managers of the Company’s seniors housing, acute care and post-acute care properties may be subject to claims that their services have resulted in resident injury or other adverse effects. The insurance coverage that is maintained by such tenants or managers, whether through commercial insurance or self-insurance, may not cover all claims made against them or continue to be available at a reasonable cost, if at all. In some states, insurance coverage for the risk of punitive damages arising from professional liability and general liability claims and/or litigation may not, in certain cases, be available to the Company’s tenants or managers due to state law prohibitions or limitations of availability. As a result, the tenants or managers of the Company’s healthcare properties operating in these states may be liable for punitive damage awards that are either not covered or are in excess of their insurance policy limits. From time to time, there may also be increases in government investigations of long-term care providers, as well as increases in enforcement actions resulting from these investigations. Insurance is not available to cover such losses. Any adverse determination in a legal proceeding or government investigation could lead to potential termination from government programs, large penalties and fines and otherwise have a material adverse effect on a facility operator’s financial condition. If a tenant or manager is unable to obtain or maintain insurance coverage, if judgments are obtained in excess of the insurance coverage, if a tenant or manager is required to pay uninsured punitive damages, or if a tenant or manager is subject to an uninsurable government enforcement action, the tenant or manager could be exposed to substantial additional liabilities, which could result in its bankruptcy or insolvency or have a material adverse effect on a tenant’s or manager’s business and its ability to meet its obligations to the Company.
Moreover, advocacy groups that monitor the quality of care at seniors housing, acute care and post-acute care properties have sued facility operators and demanded that state and federal legislators enhance their oversight of trends in seniors housing property ownership and quality of care. Patients have also sued operators of seniors housing, acute care and post-acute care properties and have, in certain cases, succeeded in winning very large damage awards for alleged abuses. This litigation and potential future litigation may materially increase the costs incurred by the tenants and managers of the Company’s properties for monitoring and reporting quality of care compliance. In addition, the cost of medical malpractice and liability insurance has increased and may continue to increase so long as the present litigation environment affecting the operations of healthcare properties continues. Increased costs could limit the ability of the tenants and managers of the Company’s properties to meet their obligations to the Company, potentially decreasing the Company’s revenue and increasing its collection and litigation costs. To the extent the Company is required to remove or replace a manager, the Company’s revenue from the affected facility could be reduced or eliminated for an extended period of time.
Finally, if the Company leases a seniors housing, acute care or post-acute care property to the Company’s TRS rather than leasing the property to a third-party tenant, the Company’s TRS will generally be the license holder and become subject to state licensing requirements and certain operating risks that apply to facility operators, including regulatory violations and third-party actions for negligence or misconduct. The TRS will have increased liability resulting from events or conditions that occur at the facility, including, for example, injuries to residents and deaths of residents at the facility. In the event the TRS incurs liability and a successful claim is made that the separate legal status of the TRS should be ignored for equitable or other reasons (i.e. a corporate veil
piercing claim), the Company may also become liable for such matters.matters. Insurance may not cover all such liabilities. Any negative publicity resulting from lawsuits related to the Company’s TRS status as a licensee could adversely affect the Company’s business reputation and ability to attract and retain residents in the Company’s leased properties, the Company’s ability to obtain or maintain licenses at the affected facility and other facilities, and the Company’s ability to raise additional capital.
Reductions in reimbursement from third-party payors, including Medicare and Medicaid, could adversely affect the profitability of tenants at any acute care and post-acute care healthcare properties that the Company may acquire, and hinder their ability to make rent payments to the Company.
Sources of revenue for tenants and operators at any acute care and post-acute care properties that the Company acquires include the federal Medicare program, state Medicaid programs, private insurance carriers and health maintenance organizations, among others. Efforts by these payors to reduce healthcare costs will likely continue, which may result in reductions or slower growth in reimbursement for certain services provided by some of these tenants. In addition, the failure of any of the Company’s tenants to comply with various laws and regulations could jeopardize their ability to continue participating in Medicare, Medicaid and other government-sponsored payment programs.
The healthcare property sector continues to face various challenges, including increased government and private payor pressure on healthcare providers to control or reduce costs. The Company believes that tenants at acute care and post-acute care properties will continue to experience a shift in payor mix away from fee-for-service payors, resulting in an increase in the percentage of revenues attributable to managed care payors, government payors and general industry trends that include pressures to control healthcare costs. Pressures to control healthcare costs and a shift away from traditional health insurance reimbursement have resulted in an increase in the number of patients whose healthcare coverage is provided under managed care plans, such as health maintenance organizations and preferred provider organizations. In addition, due to the aging of the population and the expansion of governmental payor programs, the Company anticipates that there will be a marked increase in the number of patients reliant on healthcare coverage provided by governmental payors. These changes could have a material adverse effect on the financial condition of tenants at the Company’s acute care and post-acute care properties.
Changes to Medicare and Medicaid budgets may adversely impact operations of certain acute care and post-acute care properties.
For post‑acute care properties such as skilled nursing facilities, Medicare reimbursement has the greatest impact on performance and the Company believes it will continue to come under scrutiny given looming long‑term budget issues with the aging of the population. The Centers for Medicare and Medicaid Services (“CMS”) implements changes to Medicare budgets for various asset classes (i.e., skilled nursing facilities, inpatient rehabilitation facilities, long‑term acute care hospitals (“LTACHs”) and hospice providers) at the beginning of October for the next fiscal year. Changes to budgets for the different asset classes could significantly impact rent coverage ratios of operators. The latest round of CMS budget pronouncements for 2014 was largely within expectations and provided modest increases that were below inflation levels. CMS continues to evaluate making Medicare payments “site neutral” for the same service delivered in an inpatient versus outpatient setting. Such a change could result in certain providers, particularly LTACHs and inpatient rehabilitation facilities, receiving lower reimbursement rates than those currently in place, which could have a significant impact on the financial condition of our tenants in those asset classes.
The Company is exposed to various operational risks, liabilities and claims with respect to its seniors housing, acute care and post-acute care properties that may adversely affect the Company’s ability to generate revenues and/or increase its costs.
Through the Company’s ownership of seniors housing, acute care and post-acute care properties, the Company is exposed to various operational risks, liabilities and claims with respect to the Company’s properties in addition to those generally applicable to ownership of real property. These risks include fluctuations in occupancy levels, the inability to achieve economic resident fees (including anticipated increases in those fees), rent control regulations, and increases in labor costs (as a result of unionization or otherwise) and services. Any one or a combination of these factors, together with other market and business conditions beyond the Company’s control, could result in operating deficiencies at the Company’s seniors housing, acute care and post-acute care properties, which could have a material adverse effect on the Company’s facility operators’ results of operations and their ability to meet their obligations to the Company and operate the properties effectively and efficiently, which in turn could adversely affect the Company.
Unanticipated expenses and insufficient demand for healthcare properties could adversely affect the Company’s profitability.
As part of the Company’s investment strategy, the Company may acquire seniors housing, medical office buildings,MOB, acute and post-acute care properties in geographic areas where potential customers may not be familiar with the benefits of, and care provided by, that particular property. As a result, the Company may have to incur costs relating to the opening, operation and promotion of such properties that are substantially greater than those incurred in other areas where the properties are better known by the public. These properties may attract fewer residents or patients than other properties the Company acquires and may have increased costs, such as for marketing expenses, adversely affecting the results of operations of such properties as compared to those properties that are better known.
The Company’s failure or the failure of the tenants and managers of the Company’s properties to comply with licensing and certification requirements, the requirements of governmental programs, fraud and abuse regulations or new legislative developments may materially adversely affect the operations of the Company’s seniors housing, acute care and post-acute care properties.
The operations of the Company’s seniors housing, acute care and post-acute care properties are subject to numerous federal, state and local laws and regulations that are subject to frequent and substantial changes resulting from legislation, adoption of rules and regulations, and administrative and judicial interpretations of existing laws. The ultimate timing or effect of any changes in these laws and regulations cannot be predicted. Failure to obtain licensure or loss or suspension of licensure or certification may prevent a facility from operating or result in a suspension of certain revenue sources until all licensure or certification issues have been resolved. Properties may also be affected by changes in accreditation standards or procedures of accrediting agencies that are recognized by governments in the certification process. State laws may require compliance with extensive standards governing operations and agencies administering those laws regularly inspect such properties and investigate complaints. Failure to comply with all regulatory requirements could result in the loss of the ability to provide or bill and receive payment for healthcare services at the Company’s seniors housing, acute care and/or post-acute care properties. Additionally, transfers of operations of certain facilities are subject to regulatory approvals not required for transfers of other types of commercial operations and real estate. The Company has no direct control over the tenant’s or manager’s ability to meet regulatory requirements and failure to comply with these laws, regulations and requirements may materially adversely affect the operations of these properties.
If the Company’s operators fail to cultivate new or maintain existing relationships with residents, community organizations and healthcare providers in the markets in which they operate, the Company’s occupancy percentage, payor mix and resident rates may deteriorate, which could have a material adverse effect on the Company’s business, financial condition and results of operations and the Company’s ability to make distributions to investors.
The Company continues to build relationships with several key seniors housing and post-acute care operators upon whom the Company must depend to successfully market the Company’s facilities to potential residents and healthcare providers whose referral practices can impact the choices seniors make with respect to their housing. If the Company’s operators are unable to successfully cultivate and maintain strong relationships with these community organizations and other healthcare providers, occupancy rates at the Company’s facilities could decline, which could materially adversely affect the Company’s business, financial condition and results of operations and its ability to make distributions to investors.
The Company cannot predict what the effect of new Healthcare Reform Laws or other healthcare proposals would have on those of the Company’s properties offering healthcare services and, thus, the Company’s business.
Healthcare, including the seniors housing, medical office facilities, acute care and post-acute care sectors, remains a dynamic, evolving industry. On March 23, 2010, the Patient Protection and Affordable Care Act of 2010 (“Affordable Care Act”) was enacted and on March 30, 2010, the Health Care and Education Reconciliation Act was enacted, which in part modified the Affordable Care Act (collectively, the “Healthcare Reform Laws”). Together, the Healthcare Reform Laws serve as the primary vehicle for comprehensive healthcare reform in the U.S. The Healthcare Reform Laws are intended to reduce the number of individuals in the U.S. without health insurance and effect significant other changes to the ways in which healthcare is organized, delivered and reimbursed. The legislation became effective in a phased approach, beginning in 2010 and concluding in 2018. At this time, the
effects of the legislation and its impact on the Company’s business are not yet known. The Company’s business could be materially and adversely affected by the Healthcare Reform Laws and further governmental initiatives undertaken pursuant to the Healthcare Reform Laws.
As a direct result of the recent U.S. presidential election and a Republican-controlled U.S. Congress, the repeal of the Affordable Care Act, in whole or in part, is possible. The impact of repealing existing Healthcare Reform Laws, or introducing new legislation, could materially increase the uninsured population in the U.S. or affect the affordability of healthcare insurance or services. Any such impact to the healthcare insurance coverage and affordability in the U.S. could result in changes in demand for healthcare services and healthcare facilities that could materially adversely affect our business.
At this time, the effects of potential new legislation and its impact on the Company’s business are not yet known. The Company’s business could be materially and adversely affected by government initiatives undertaken to change Healthcare Reform Laws.
Government budget deficits could lead to a reduction in Medicare and Medicaid reimbursement.
If the U.S. experiences a weakening of the economy or if the Affordable Care Act is repealed, states may be pressured to decrease reimbursement rates with the goal of decreasing state expenditures under state Medicaid programs. The need to control Medicaid expenditures may be exacerbated by the potential for increased enrollment in state Medicaid programs due to continued high unemployment, declines in family incomes and eligibility expansions authorized by the Healthcare Reform Laws. These potential reductions could be compounded by the potential for federal cost-cutting efforts that could lead to reductions in reimbursement rates under the federal Medicare program, state Medicaid programs and other healthcare-related programs. Potential reductions in reimbursements under these programs could negatively impact the Company’s business, financial condition and results of operations.
Adverse trends in healthcare provider operations may negatively affect the Company’s lease revenues and the Company’s ability to make distributions to the Company’s stockholders.
The healthcare industry currently is experiencing changes in the demand for and methods of delivering healthcare services; changes in third-party reimbursement policies; significant unused capacity in certain areas, which has created substantial competition for patients among healthcare providers in those areas; continuing pressure by private and governmental payors to reduce payments to providers of services; and increased scrutiny of billing, referral and other practices by federal and state authorities. These factors may adversely affect the economic performance of some or all of the Company’s tenants and, in turn, the Company’s lease revenues and its ability to make distributions to the Company’s stockholders.
In addition, the Affordable Care Act had expanded coverage through state Medicaid programs and health care exchanges. If the Affordable Care Act is repealed, the cash flow of our tenants and operators reliant on reimbursement from federal or state governments may be adversely affected. Limitations on reimbursement rates and fees charged by our tenants or operators as a result of any changes to Healthcare Reform Laws could impact their ability to meet their obligations under the terms of our leases, including the ability to pay rent, which in turn could negatively impact the cash flow to the Company. We cannot assure you that our tenants and operators who currently depend on governmental or private payor reimbursement will be adequately reimbursed for the services they provide.
Termination of resident lease agreements could adversely affect the Company’s revenues and earnings for seniors housing and post-acute care properties providing assisted living services.
Applicable regulations governing assisted living properties generally require written resident lease agreements with each resident. Most of these regulations also require that each resident have the right to terminate the resident lease agreement for any reason on reasonable notice or upon the death of the resident. The operators of seniors housing and post-acute care properties cannot contract with residents to stay for longer periods of time, unlike typical apartment leasing arrangements with terms of up to one year or longer. In addition, the resident turnover rate in the Company’s properties may be difficult to predict. If a large number of resident lease agreements terminate at or around the same time, and if the Company’s units remained unoccupied, then the Company’s tenant’s ability to
make scheduled rent payments to the Company or, with respect to certain of the Company’s seniors housing and other healthcare properties lease to TRS entities, the Company’s operating results, the Company’s revenues and the Company’s earnings could be adversely affected.
Certain healthcare properties the Company acquires, such as medical office buildings,MOB, diagnostic service centers and surgery centers, may be unable to compete successfully.
Certain healthcare properties the Company acquires, such as medical office buildings,MOB, diagnostic service centers and surgery centers, often face competition from nearby hospitals and other medical office buildingsMOB that provide comparable services. Some of those competing properties are owned by governmental agencies and supported by tax revenues, and others are owned by nonprofit corporations and may be supported to a large extent by endowments and charitable contributions. These types of support are not available to the Company’s properties.
Similarly, the Company’s tenants in such properties face competition from other medical practices in nearby hospitals and other medical properties. The Company’s tenants’ failure to compete successfully with these other practices could adversely affect their ability to make rental payments, which could adversely affect the Company’s rental revenues. Further, from time to time and for reasons beyond the Company’s control, referral sources, including physicians and managed care organizations, may change their lists of hospitals or physicians to which they refer patients. This could adversely affect the Company’s tenants’ ability to make rental payments, which could adversely affect its rental revenues.
Any reduction in rental revenues resulting from the inability of the Company’s medical office buildingsMOB and healthcare-related properties and the Company’s tenants to compete successfully may have a material adverse effect on the Company’s business, financial condition and results of operations and its ability to make distributions to its stockholders.
Some tenants of medical office buildings,MOB, diagnostic service centers, surgery centers, acute care properties and other healthcare properties are subject to fraud and abuse laws, the violation of which by a tenant may jeopardize the tenant’s ability to make rent payments to the Company.
There are various federal and state laws prohibiting fraudulent and abusive business practices by healthcare providers who participate in, receive payments from, or are in a position to make referrals in connection with government-sponsored healthcare programs, including the Medicare and Medicaid programs. Any lease arrangements the Company enter into with certain tenants could also be subject to these fraud and abuse laws concerning Medicare and Medicaid. These laws include:
the Federal Anti-Kickback Statute, which prohibits, among other things, the offer, payment, solicitation or receipt of any form of remuneration in return for, or to induce, the referral of any item or service reimbursed by Medicare or Medicaid;
the Federal Physician Self-Referral Prohibition, which, subject to specific exceptions, restricts physicians from making referrals for specifically designated health services for which payment may be made under Medicare or Medicaid programs to an entity with which the physician, or an immediate family member, has a financial relationship;
the False Claims Act, which prohibits any person from knowingly presenting false or fraudulent claims for payment to the federal government, including claims paid by the Medicare and Medicaid programs; and
the Civil Monetary Penalties Law, which authorizes the U.S. Department of Health and Human Services to impose monetary penalties for certain fraudulent acts.
Each of these laws includes criminal and/or civil penalties for violations that range from punitive sanctions, damage assessments, penalties, imprisonment, denial of Medicare and Medicaid payments and/or exclusion from the Medicare and Medicaid programs. Certain laws, such as the False Claims Act, allow for individuals to bring whistleblower actions on behalf of the government for violations thereof. Additionally, states in which the properties are located may have similar fraud and abuse laws. Investigation by a federal or state governmental body for violation of fraud and abuse laws or imposition of any of these penalties upon one of the Company’s tenants could jeopardize that tenant’s ability to operate or to make rent payments, which may have a material adverse effect on the Company’s business, financial condition and results of operations and the Company’s ability to make cash distributions.
The Company’s tenants may generally be subject to risks associated with the employment of unionized personnel for the Company’s seniors housing, medical office buildings,MOB, acute care and post-acute care properties.
From time to time, the operations of any seniors housing, medical office building, acute care and post-acute care properties may be disrupted through strikes, public demonstrations or other labor actions and related publicity. The Company or the Company’s tenants may also incur increased legal costs and indirect labor costs as a result of such disruptions, or contract disputes or other events. One or more of the Company’s tenants or the Company’s third-party managers operating some of these types of properties may be targeted by union actions or adversely impacted by the disruption caused by organizing activities. Significant adverse disruptions caused by union activities and/or increased costs affiliated with such activities could materially and adversely affect the Company’s operations and the financial condition of the seniors housing and healthcare properties the Company own through a TRS and affect the operating income of the Company’s tenants for those properties the Company lease to third parties.
Construction and development projects are subject to risks that materially increase the costs of completion.
The Company develops and constructs new seniors housing and healthcare properties or redevelops existing properties. In doing so, the Company is subject to risks and uncertainties associated with construction and development including, risks related to obtaining all necessary zoning, land-use, building occupancy and other governmental permits and authorizations, risks related to the environmental concerns of government entities or community groups, risks related to changes in economic and market conditions between development commencement and stabilization, risks related to construction labor disruptions, adverse weather, acts of God or shortages of materials which could cause construction delays and risks related to increases in the cost of labor and materials which could cause construction costs to be greater than projected.
The Company may not have control over construction on the Company’s properties.
The Company acquires sites on which a property the Company will own will be built, as well as sites that have existing properties (including properties that require renovation). The Company is subject to risks in connection with a developer’s ability to control construction costs and the timing of completion of construction or a developer’s ability to build in conformity with plans, specifications and timetables. A developer’s failure to perform may require legal action by the Company to terminate the development agreement or compel performance. The Company also incurs additional risks as it makes periodic payments or advances
to developers prior to completion of construction. These and other factors can result in increased costs of a development project or loss of the Company’s investment. In addition, post-construction, the Company is subject to ordinary lease-up risks relating to newly-constructed projects.
Development and value-add properties are expected to initially generate limited cash flows.
The Company has increased the level of its investment in new ground-up development andcontinues to have some value-add or stabilizing properties. During the construction and lease-phase, these types of investments are expected to initially generate limited cash flows, Funds from Operations (“FFO”) and Modified Funds from Operations (“MFFO”) and may result in near term downward pressure on the Company’s NAV.
Seniors housing, acute care and post-acute care properties in which the Company invests may not be readily adaptable to other uses.
Seniors housing, acute care and post-acute care properties in which the Company invests are specific-use properties that have limited alternative uses. Therefore, if the operations of any of the Company’s properties in these sectors become unprofitable for the Company’s tenant or operator or for the Company due to industry competition, a general deterioration of the applicable industry or otherwise, then the Company may have great difficulty re-leasing the property or developing an alternative use for the property and the liquidation value of the property may be substantially less than would be the case if the property were readily adaptable to other uses. Should any of these events occur, the Company’s income and cash available for distribution and the value of the Company’s property portfolio could be reduced.
The Company competes with other companies for investments and such competition may reduce the number of suitable acquisition opportunities that are available to the Company and adversely affect the Company’s ability to successfully acquire properties and other assets.
The Company competes with other companies and investors, including other REITs, real estate partnerships, mutual funds, institutional investors, specialty finance companies, opportunity funds, banks and insurance companies, for the acquisition of properties, loans and other real estate-related investments that the Company seeks to acquire or make. Some of the other entities that the Company competes with for acquisition opportunities will have substantially greater experience acquiring and owning the types of properties, loans or other real estate-related investments which the Company seeks to acquire or make, as well as greater financial resources and a broader geographic knowledge base than the Company has. As a result, competition may reduce the number of suitable acquisition opportunities available to the Company.
The Company will not control the management of the Company’s properties.
In order to maintain the Company’s status as a REIT for federal income tax purposes, the Company may not operate certain types of properties it acquires or participates in the decisions affecting their daily operations. The Company’s success, therefore, will depend on its ability to select qualified and creditworthy tenants or managers who can effectively manage and operate the properties. The Company’s tenants and managers will be responsible for maintenance and other day-to-day management of the properties or will enter into agreements with third-party operators. The Company’s financial condition will be dependent on the ability of third-party tenants and/or managers to operate the properties successfully. The Company generally enters into leasing agreements with tenants and management agreements with managers having substantial prior experience in the operation of the type of property being rented or managed; however, there can be no assurance that the Company will be able to make such arrangements. Additionally, if the Company elects to treat property it acquires as a result of a borrower’s default on a loan or a tenant’s default on a lease as “foreclosure property” for federal income tax purposes, the Company will be required to operate that property through an independent manager over whom it will not have control. If the Company’s tenants or third-party managers are unable to operate the properties successfully or if the Company selects unqualified managers, then such tenants and managers might not have sufficient revenue to be able to pay the Company’s rent, which could adversely affect the Company’s financial condition.
Since the Company’s properties leased to third-party tenants will generally be on a triple net or modified gross basis, the Company depends on its third-party tenants not only for rental income, but also to pay insurance, taxes, utilities and maintenance and repair expenses in connection with the leased properties. Any failure by the Company’s third-party tenants to effectively conduct their operations could adversely affect their business reputation and ability to attract and retain residents in the Company’s leased properties. The Company’s leases generally require such tenants to indemnify, defend and hold the Company harmless from and against various claims, litigation and liabilities arising in connection with the Company’s tenants’ respective businesses. The Company cannot assure investors that its tenants will have sufficient assets, income, access to financing and insurance coverage to enable it
to satisfy these indemnification obligations. Any inability or unwillingness by the Company’s tenants to make rental payments to the Company or to otherwise satisfy their obligations under their lease agreements with the Company could adversely affect the Company.
The Company may not control its joint ventures.
The Company sometimes enters into joint ventures with unaffiliated parties to purchase a property or to make loans or other real estate-related investments, and the joint venture or general partnership agreement relating to that joint venture or partnership generally provides that the Company will share with the unaffiliated party management control of the joint venture. For example, the Company’s venture partners share approval rights on many major decisions. Those venture partners may have differing interests from the Company’s and the power to direct the joint venture or partnership on certain matters in a manner with which the Company does not agree. In the event the joint venture or general partnership agreement provides that the Company will have sole management control of the joint venture, the agreement may be ineffective as to a third-party who has no notice of the agreement, and the Company may therefore be unable to control fully the activities of the joint venture. Should the Company enter into a joint venture with another program sponsored by an affiliate, the Company does not anticipate that the Company will have sole management control of the joint venture. In addition, when the Company invests in properties, loans or other real estate-related investments indirectly through the acquisition of interests in entities that own such properties, loans or other real estate-related investments, the Company may not be able to control the management of such assets which may adversely affect the Company’s REIT qualification, returns on investment and, therefore, cash available for distribution to the Company’s stockholders.
Joint venture partners may have different interests than the Company has, which may negatively impact the Company’s control over the Company’s ventures.
Investments in joint ventures involve the risk that the Company’s co-venturer may have economic or business interests or goals which, at a particular time, are inconsistent with the Company’s interests or goals, that the co-venturer may be in a position to take action contrary to the Company’s instructions, requests, policies or objectives, or that the co-venturer may experience financial difficulties. Among other things, actions by a co-venturer might subject assets owned by the joint venture to liabilities in excess of those contemplated by the terms of the joint venture agreement or to other adverse consequences. This risk is also present when the Company makes investments in securities of other entities. If the Company does not have full control over a joint venture, the value of the Company’s investment will be affected to some extent by a third-party that may have different goals and capabilities than the Company’s. As a result, joint ownership of investments and investments in other entities may adversely affect the Company’s REIT qualification, returns on investments and, therefore, cash available for distributions to the Company’s stockholders may be reduced.
It may be difficult for the Company to exit a joint venture after an impasse.
In the Company’s joint ventures, there is a potential risk of impasse in some business decisions because the Company’s approval and the approval of each co-venturer may be required for some decisions. In certain of the Company’s joint ventures, the Company has the right to buy the other co-venturer’s interest or to sell the Company’s own interest on specified terms and conditions in the event of an impasse regarding a sale. In the event of an impasse, it is possible that neither party will have the funds necessary to complete a buy-out. In addition, the Company may experience difficulty in locating a third-party purchaser for the Company’s joint venture interest and in obtaining a favorable sale price for the interest. As a result, it is possible that the Company may not be able to exit the relationship if an impasse develops.
Compliance with the Americans with Disabilities Act may reduce the Company’s expected distributions.
Under the Americans with Disabilities Act of 1992 (the “ADA”) all public accommodations and commercial properties are required to meet certain federal requirements related to access and use by disabled persons. Failure to comply with the ADA could result in the imposition of fines by the federal government or an award of damages to private litigants. Although the Company acquires properties that substantially comply with these requirements, the Company may incur additional costs to comply with the ADA. In addition, a number of federal, state, and local laws may require the Company to modify any properties the Company purchases or may restrict further renovations thereof with respect to access by disabled persons. Additional legislation could impose financial obligations or
restrictions with respect to access by disabled persons. Although the Company believes that these costs will not have a material adverse effect on the Company, if required changes involve a greater amount of expenditures than the Company currently anticipates, the Company’s ability to make expected distributions could be adversely affected.
The Company’s properties may be subject to environmental liabilities that could significantly impact the Company’s return from the properties and the success of the Company’s ventures.
Operations at certain of the properties the Company acquires, or which are used to collateralize loans the Company may originate, may involve the use, handling, storage, and contracting for recycling or disposal of hazardous or toxic substances or wastes, including environmentally sensitive materials such as herbicides, pesticides, fertilizers, motor oil, waste motor oil and filters, transmission fluid, antifreeze, Freon, waste paint and lacquer thinner, batteries, solvents, lubricants, degreasing agents, gasoline and diesel fuels, and sewage. Accordingly, the operations of certain properties the Company acquires will be subject to regulation by federal, state, and local authorities establishing health and environmental quality standards. In addition, certain of the Company’s properties may
maintain and operate underground storage tanks (“USTs”) for the storage of various petroleum products. USTs are generally subject to federal, state, and local laws and regulations that require testing and upgrading of USTs and the remediation of contaminated soils and groundwater resulting from leaking USTs.
As an owner of real estate, various federal and state environmental laws and regulations may require the Company to investigate and clean up certain hazardous or toxic substances, asbestos-containing materials, or petroleum products located on, in or emanating from the Company’s properties. Such laws often impose liability without regard to whether the owner knew of, or was responsible for, the release of hazardous substances. The Company may also be held liable to a governmental entity or to third parties for property damage and for investigation and cleanup costs incurred by those parties in connection with the contamination. In addition, some environmental laws create a lien on the contaminated site in favor of the government for damages and costs it incurs in connection with the contamination. Other environmental laws impose liability on a previous owner of property to the extent hazardous or toxic substances were present during the prior ownership period. A transfer of the property may not relieve an owner of such liability; therefore, the Company may have liability with respect to properties that the Company or the Company’s predecessors sold in the past.
The presence of contamination or the failure to remediate contamination at any of the Company’s properties may adversely affect the Company’s ability to sell or lease the properties or to borrow using the properties as collateral. While the Company’s leases are expected to provide that the tenant is solely responsible for any environmental hazards created during the term of the lease, the Company or an operator of a site may be liable to third parties for damages and injuries resulting from environmental contamination coming from the site.
The Company cannot be sure that all environmental liabilities associated with the properties that the Company acquires will have been identified or that no prior owner, operator or current occupant will have created an environmental condition not known to the Company. Moreover, the Company cannot be sure that: (i) future laws, ordinances or regulations will not impose any material environmental liability on the Company; or (ii) the environmental condition of the properties that it may acquire from time to time will not be affected by tenants and occupants of the properties, by the condition of land or operations in the vicinity of the properties (such as the presence of USTs), or by third parties unrelated to the Company. Environmental liabilities that the Company may incur could have an adverse effect on the Company’s financial condition, results of operations and ability to pay distributions.
In addition to the risks associated with potential environmental liabilities discussed above, compliance with environmental laws and regulations that govern the Company’s properties may require expenditures and modifications of development plans and operations that could have a detrimental effect on the operations of the properties and the Company’s financial condition, results of operations and ability to pay distributions to the Company’s stockholders. There can be no assurance that the application of environmental laws, regulations or policies, or changes in such laws, regulations and policies, will not occur in a manner that could have a detrimental effect on any property the Company may acquire.
The Company’s properties may contain or develop harmful mold, which could lead to liability for adverse health effects and costs of remediating the problem.
The presence of mold at any of the Company’s properties could require the Company to undertake a costly program to remediate, contain or remove the mold. Mold growth may occur when moisture accumulates in buildings or on building materials. Some molds may produce airborne toxins or irritants. Concern about indoor exposure to mold has been increasing because exposure to mold may cause a variety of adverse health effects and symptoms, including allergic or other reactions. The presence of mold could expose the Company to liability from the Company’s tenants, their employees and others if property damage or health concerns arise.
Legislation and government regulation may adversely affect the development and operations of properties the Company acquires.
In addition to being subject to environmental laws and regulations, certain of the development plans and operations conducted or to be conducted on properties the Company acquires require permits, licenses and approvals from certain federal, state and local authorities. Material permits, licenses or approvals may be terminated, not renewed or renewed on terms or interpreted in ways that are materially less favorable to the properties the Company purchases. Furthermore, laws and regulations that the Company or the Company’s operators are subject to may change in ways that are difficult to predict. There can be no assurance that the application of laws, regulations or policies, or changes in such laws, regulations and policies, will not occur in a manner that could have a detrimental effect on any property the Company may acquire, the operations of such property and the amount of rent it receives from the tenant of such property.
The Company may be unable to obtain desirable types of insurance coverage at a reasonable cost, if at all, and the Company may be unable to comply with insurance requirements contained in mortgage or other agreements due to high insurance costs.
The Company may not be able either to obtain desirable types of insurance coverage, such as terrorism, earthquake, flood, hurricane and pollution or environmental matter insurance, or to obtain such coverage at a reasonable cost in the future, and this risk may limit the Company’s ability to finance or refinance debt secured by the Company’s prosperities. Additionally, the Company could default under debt or other agreements if the cost and/or availability of certain types of insurance make it impractical or impossible to comply with covenants relating to the insurance the Company is required to maintain under such agreements. In such instances, the Company may be required to self-insure against certain losses or seek other forms of financial assurance. The Company may not be able to obtain insurance coverage at reasonable rates due to high premium and/or deductible amounts. As a result, the Company’s cash flows could be adversely impacted due to these higher costs, which would adversely affect the Company’s ability to pay distributions to the Company’s stockholders.
Uninsured losses or losses in excess of insured limits could result in the loss or substantial impairment of one or more of the Company’s investments.
The nature of the activities at certain of the Company’s properties will expose the Company, the Company’s tenants and the Company’s operators to potential liability for personal injuries and, with respect to certain types of properties may expose the Company to property damage claims. The Company maintains, and requires the Company’s tenants and operators, as well as mortgagors to whom the Company has loaned money to maintain, insurance with respect to each of the Company’s properties that tenants lease or operate and each property securing a mortgage that the Company holds, including comprehensive liability, fire, flood and extended coverage insurance. There are, however, certain types of losses (such as from hurricanes, floods, earthquakes or terrorist attacks) that may be either uninsurable or not economically feasible to insure. Furthermore, an insurance provider could elect to deny or limit coverage under a claim. Should an uninsured loss or loss in excess of insured limits occur, the Company could lose all or a portion of the Company’s anticipated revenue stream from the affected property, as well as all or a portion of the Company’s invested capital. Accordingly, if the Company, as landlord, incurs any liability which is not fully covered by insurance, the Company would be liable for the uninsured amounts, cash available for distributions to stockholders may be reduced and the value of the Company’s assets may decrease significantly. In the case of an insurance loss, the Company might nevertheless remain obligated for any mortgage debt or other financial obligations related to the property.
The Company’s TRS structure subjects it to the risk of increased operating expenses.
The Company’s TRSs engage independent facility managers pursuant to management agreements and pay these managers a fee for operating the properties and reimburse certain expenses paid by these managers. However, the TRS receives all the operating profit or losses at the facility, net of corporate income tax, and the Company is subject to the risk of increased operating expenses.
The Company’s TRS structure subjects the Company to the risk that the leases with the Company’s TRSs do not qualify for tax purposes as arm’s-length, which would expose the Company to potentially significant tax penalties.
The Company’s TRSs generally will incur taxes or accrue tax benefits consistent with a “C” corporation. If the leases between the Company and the Company’s TRSs were deemed by the Internal Revenue ServiceIRS to not reflect an arm’s-length transaction as that term is defined by tax law, the Company may be subject to significant tax penalties as the lessor that would adversely impact the Company’s profitability and the Company’s cash flows.
If the Company’s portfolio and risk management systems are ineffective, the Company may be exposed to material unanticipated losses.
The Company continues to refine the Company’s portfolio and risk management strategies and tools. However, the Company’s portfolio and risk management strategies may not fully mitigate the risk exposure of the Company’s operations in all economic or market environments, or against all types of risk, including risks that the Company might fail to identify or anticipate. Any failures in the Company’s portfolio and risk management strategies to accurately quantify such risk exposure could limit the Company’s ability to manage risks in the Company’s operations or to seek adequate risk-adjusted returns and could result in losses.
Changes in accounting pronouncements could adversely impact the Company’s or the Company’s tenants’ reported financial performance.
Accounting policies and methods are fundamental to how the Company records and reports its financial condition and results of operations. Uncertainties posed by various initiatives of accounting standard-setting by the Financial Accounting Standards Board (“FASB”) and the SEC, which create and interpret applicable accounting standards for U.S. companies, may change the financial accounting and reporting standards or their interpretation and application of these standards that govern the preparation of our
financial statements. Proposed changes include, but are not limited to, changes in lease accounting, revenue recognition, changes to the definition of a business and the adoption of accounting standards likely to require the increased use of “fair-value” measurements and disclosures.
These changes could have a material impact on our reported financial condition and results of operations. In some cases, we could be required to apply a new or revised standard retroactively, resulting in potentially material reclassifications of prior period financial statements. Similarly, these changes could have a material impact on our tenants’ reported financial condition or results of operations or could affect our tenants’ preferences regarding leasing real estate.
The Company is highly dependent on information systems and their failure could significantly disrupt the Company’s business.
As a healthcare real estate company, the Company’s business will be highly dependent on communications and information systems, including systems provided by third parties for which the Company has no control. Any failure or interruption of the Company’s systems, whether as a result of human error or otherwise, could cause delays or other problems in the Company’s activities, which could have a material adverse effect on the Company’s financial performance.
Cyber security risks and cyber incidents could adversely affect the Company’s business and disrupt operations.
Cyber incidents can result from deliberate attacks or unintentional events. These incidents can include, but are not limited to, gaining unauthorized access to digital systems for purposes of misappropriating assets or sensitive information, corrupting data, or causing operational disruption. The result of these incidents could include, but are not limited to, disrupted operations, misstated financial data liability for stolen assets or information, increased cyber security protection costs, litigation and reputational damage adversely affecting customer or investor confidence.
Proposed changes to FINRA rules and regulations could have a material impact on the Company’s ability to raise capital through the Company’s offerings.
In March 2012, FINRA requested public comment through April 11, 2012 on its proposed amendment to NASD Rule 2340 to require that per share estimated values of non-traded REITs be reported on customer account statements and modify the account statement disclosures that accompany the per share estimated value. In April 2013, FINRA’s board of governors authorized the submission of the proposed amendment to the Commission. In February 2014, the Commission began soliciting comments on the proposed rule. In July 2014, FINRA requested that the Commission allow broker-dealers longer than originally sought in the proposed rule to implement any revised rule. As our managing dealer and participating brokers selling the Company’s common stock in the Company’s offerings are subject to FINRA rules and regulations, any significant changes to Rule 2340 or their firms’ policies could have a material impact on how the Company’s share price calculations and commissions are disclosed.
Lending Related Risks
Decreases in the value of the property underlying the Company’s mortgage loans and borrower defaults might decrease the value of the Company’s assets.
The mortgage loans in which the Company may invest will be collateralized by underlying real estate. When the Company makes these loans, the Company is at risk of default on these loans caused by many conditions beyond the Company’s control, including local and other economic conditions affecting real estate values and interest rate levels. The Company does not know whether the values of the properties collateralizing mortgage loans will remain at the levels existing on the dates of origination of the loans. If the values of the underlying properties drop or in some instances fail to rise, the Company’s risk will increase and the value of its assets may decrease.
If a borrower defaults under a mortgage, bridge or mezzanine loan the Company has made, the Company will bear the risk of loss of principal to the extent of any deficiency between the value of the collateral and the principal and accrued interest of the loan. In the event of the bankruptcy of a borrower, the loan to such borrower will be deemed to be collateralized only to the extent of the value of the underlying collateral at the time of bankruptcy (as determined by the bankruptcy court), and the lien securing the loan will be subject to the avoidance powers of the bankruptcy trustee or debtor-in-possession to the extent the lien is unenforceable under state law. Foreclosure on a loan can be an expensive and lengthy process, which could have a substantial negative effect on the Company’s anticipated return on the foreclosed loan. If the Company determines that the sale of a foreclosed property is in its best interest, delays in the sale of such property could negatively impact the price the Company receives and the Company may not be receiving any income from the property although the Company will be required to incur expenses, such as for maintenance costs, insurance costs and property taxes. The longer the Company is required to hold the property, the greater the potential negative impact on the Company’s revenues and results of operations. In addition, any restructuring, workout, foreclosure or other exercise of remedies with respect to loans that the Company has made or acquired could create income tax costs or make it more difficult for the Company to
qualify as a REIT. Once the Company acquires a property by way of foreclosure or a deed in lieu of foreclosure or through a lease termination as a result of a tenant default, the Company may be subject to a 100% tax on net gain from a subsequent resale of that property under the prohibited transaction rules. Alternatively, if the Company makes an election to treat such property as “foreclosure property” under applicable income tax laws, the Company may avoid the 100% tax on prohibited transactions, but the net gain from the sale or operation of the property may be subject to corporate income tax at the highest applicable rate.
The loans the Company originates or invests in will be subject to interest rate fluctuations.
If the Company invests in fixed-rate, long-term loans and interest rates increase, the loans could yield a return that is lower than then-current market rates. Conversely, if interest rates decline, the Company will be adversely affected to the extent that loans are prepaid, because the Company may not be able to make new loans at the previously higher interest rate. If the Company invests in variable interest rate loans, if interest rates decrease, the Company’s revenues will likewise decrease.
If the Company sells properties by providing financing to purchasers, the Company will bear the risk of default by the purchaser.
The Company may, from time to time, sell a property or other asset by providing financing to the purchaser. There are no limits or restrictions on the Company’s ability to accept purchase money obligations secured by a mortgage as payment for the purchase price. The terms of payment to the Company will be affected by custom in the area where the property being sold is located and then-prevailing economic conditions. The Company will bear the risk of default by the purchaser and may incur significant litigation costs in enforcing its rights against the purchaser.
Instability in the credit market and real estate market could have a material adverse effect on the Company’s results of operations and financial condition.
The Company may not be able to obtain financing for investments on terms and conditions acceptable to the Company, if at all. Currently, domestic and international financial markets have experienced unusual volatility and uncertainty. If this volatility and uncertainty persists, the Company’s ability to borrow monies to finance the purchase of, or other activities related to, real estate assets will be significantly impacted. If the Company is unable to borrow funds on terms and conditions that it finds acceptable, the Company likely will have to reduce the number of properties it can purchase, and the return on the properties the Company does purchase likely will be lower. In addition, if the Company pays fees to lock-in a favorable interest rate, falling interest rates or other factors could require it to forfeit these fees. Additionally, the reduction in equity and debt capital resulting from turmoil in the capital markets has resulted in fewer buyers seeking to acquire commercial properties leading to lower property values and the continuation of these conditions could adversely impact the Company’s timing and ability to sell the Company’s properties.
In addition to volatility in the credit markets, the real estate market is subject to fluctuation and can be impacted by factors such as general economic conditions, supply and demand, availability of financing and interest rates. To the extent the Company purchasespurchased real estate in an unstable market, the Company is subject to the risk that if the real estate market ceases to attract the same level of capital investment in the future that it attracts at the time of the Company’s purchases, or the number of parties seeking to acquire properties decreases, the value of the Company’s investments may not appreciate or may decrease significantly below the amount the Company pay for these investments.
The Company may enter into agreements with lenders which restrict the Company’s ability to pay distributions to investors.
The Company’s revolving credit facility contains limitations on distributions and the extent of allowable distributions. The Company’s revolving credit facility requires that allowable distributions not exceed 95% of adjusted FFO (as defined in the revolving credit facility agreement), and limits the minimum amount of distributions required to maintain the Company’s REIT status. These and other similar restrictions in loan agreements the Company may enter into impact the Company’s ability to pay distributions to investors.
Mortgage indebtedness and other borrowings will increase the Company’s business risks.
The Company sometimes acquires real estate properties and other real estate-related investments, including entity acquisitions, by assuming either existing financing collateralized by the asset or by borrowing new funds. In addition, the Company has incurred and may increase the Company’s mortgage debt by obtaining loans collateralized by some or all of the Company’s assets to obtain funds to acquire additional investments or to pay distributions to the Company’s stockholders. If necessary, the Company also may borrow funds to satisfy the requirement that the Company distribute at least 90% of the Company’s annual taxable income, or otherwise as is necessary or advisable to assure that the Company maintain the Company’s qualification as a REIT for federal income tax purposes.
The Company’s charter provides that it may not borrow more than 300% of the value of the Company’s net assets without the approval of a majority of the Company’s independent directors and the borrowing must be disclosed to the Company’s stockholders in the Company’s first quarterly report after such approval. Borrowing may be risky if the cash flow from the Company’s properties and other real estate-related investments is insufficient to meet the Company’s debt obligations. In addition, the Company’s lenders may seek to impose restrictions on future borrowings, distributions and operating policies, including with respect to capital expenditures and asset dispositions. If the Company mortgages assets or pledges equity as collateral and the Company cannot meet the Company’s debt obligations, then the lender could take the collateral, and the Company would lose the asset or equity and the income the Company were deriving from the asset.
The Company uses credit facilities to finance the Company’s investments, which may require the Company to provide additional collateral and significantly impact its liquidity position.
Some of the Company’s credit facilities contain mark-to-market provisions providing that if the market value of the commercial real estate debt or securities pledged by the Company declines in value due to credit quality deterioration, the Company may be required by the Company’s lenders to provide additional collateral or pay down
a portion of the Company’s borrowings. In a weak economic environment, the Company would generally expect credit quality and the value of the commercial real estate debt or securities that serve as collateral for the Company’s credit facilities to decline, and in such a scenario it is likely that the terms of the Company’s credit facilities would require partial repayment from the Company, which could be substantial. Posting additional collateral to support the Company’s credit facilities could significantly reduce the Company’s liquidity and limit its ability to leverage its assets. In the event the Company does not have sufficient liquidity to meet such requirements, the Company’s lenders can accelerate the Company’s borrowings, which could have a material adverse effect on its business and operations.
The Company’s revenues are highly dependent on operating results of, and lease payments from, the Company’s properties. Defaults by the Company’s tenants would reduce the Company’s cash available for the repayment of the Company’s outstanding debt and for distributions.
The Company’s ability to repay any outstanding debt and make distributions to stockholders depends upon the ability of the Company’s tenants and managers to generate sufficient operating income to make payments to the Company, and their ability to make these payments will depend primarily on their ability to generate sufficient revenues in excess of operating expenses from businesses conducted on the Company’s properties. A tenant’s failure or delay in making scheduled rent payments to the Company may result from the tenant realizing reduced revenues at the properties it operates.
Defaults on the Company’s borrowings may adversely affect the Company’s financial condition and results of operations.
Defaults on loans collateralized by a property the Company owns may result in foreclosure actions and the Company’s loss of the property or properties securing the loan that is in default. Such legal actions are expensive. For tax purposes, in general a foreclosure would be treated as a sale of the property for a purchase price equal to the outstanding balance of the debt collateralized by the property. If the outstanding balance of the debt exceeds the Company’s tax basis in the property, the Company would recognize taxable income on the foreclosure, all or a portion of such taxable income may be subject to tax, and/or required to be distributed to the Company’s stockholders in order for the Company to qualify as a REIT. In such case, the Company would not receive any cash proceeds to enable it to pay such tax or make such distributions. If any mortgages contain cross collateralization or cross default provisions, more than one property may be affected by a default. If any of the Company’s properties are foreclosed upon due to a default, the Company’s financial condition, results of operations and ability to pay distributions to stockholders will be adversely affected.
Financing arrangements involving balloon payment obligations may adversely affect the Company’s ability to make distributions.
The Company sometimes enters into fixed-term financing arrangements which require it to make “balloon” payments at maturity. The Company’s ability to make a balloon payment at maturity is uncertain and may depend upon the Company’s ability to obtain additional financing or sell a particular property. At the time the balloon payment is due, the Company may not be able to raise equity or refinance the balloon payment on terms as favorable as the original loan or sell the property at a price sufficient to make the balloon payment. These refinancing or property sales could negatively impact the rate of return to stockholders and the timing of disposition of the Company’s assets. In addition, payments of principal and interest may leave the Company with insufficient cash to pay the distributions that the Company is required to pay to maintain its qualification as a REIT.
Increases in interest rates could increase the amount of the Company’s debt payments and adversely affect its ability to make distributions to its stockholders.
The Company also borrows money that bears interest at a variable rate and, from time to time, it may pay mortgage loans or refinance the Company’s properties in a rising interest rate environment. Accordingly, increases in interest rates could increase the Company’s interest costs, which could have a material adverse effect on the Company’s operating cash flow and its ability to make distributions to its stockholders.
Lenders may require the Company to enter into restrictive covenants relating to the Company’s operations, which could limit the Company’s ability to make distributions to its stockholders.
When providing financing, lenders may impose restrictions on the Company that affect the Company’s distributions, operating policies and ability to incur additional debt. Such limitations hamper the Company’s flexibility and may impair the Company’s ability to achieve its operating plans including maintaining the Company’s REIT status.
The Company may acquire various financial instruments for purposes of “hedging” or reducing the Company’s risks which may be costly and/or ineffective and will reduce the Company’s cash available for distribution to its stockholders.
The Company may engage in hedging transactions to manage the risk of changes in interest rates, price changes or currency fluctuations with respect to borrowings made or to be made, or ordinary obligations incurred or to be incurred, by the Company. The Company may use derivative financial instruments for this purpose, collateralized by the Company’s assets and investments. Derivative instruments may include interest rate swap contracts, interest rate cap or floor contracts, futures or forward contracts, options or repurchase agreements. The Company’s actual hedging decisions will be determined in light of the facts and circumstances existing at the time of the hedge and may differ from time to time. Hedging activities may be costly or become cost-prohibitive and the Company may have difficulty entering into hedging transactions.
To the extent that the Company uses derivative financial instruments to hedge against exchange rate and interest rate fluctuations, the Company will be exposed to credit risk, basis risk and legal enforceability risks. In this context, credit risk is the failure of the counterparty to perform under the terms of the derivative contract. If the fair value of a derivative contract is positive, the counterparty owes the Company, which creates credit risk for the Company. Basis risk occurs when the index upon which the contract is based is more or less variable than the index upon which the hedged asset or liability is based, thereby making the hedge less effective. Finally, legal enforceability risks encompass general contractual risks, including the risk that the counterparty will breach the terms of, or fail to perform its obligations under, the derivative contract. The Company may be unable to manage these risks effectively.
Tax Related Risks
Failure to qualify as a REIT would adversely affect the Company’s operations and the Company’s ability to pay distributions to investors.
The Company intends to operate as a REIT under the Code and believes the Company has and will continue to operate as a REIT in such manner. However, qualification as a REIT involves the application of highly technical and complex Code provisions for which there are only limited judicial and administrative interpretations. The determination of various factual matters and circumstances not entirely within the Company’s control may also affect the Company’s ability to remain qualified as a REIT. If the Company fails to qualify as a REIT for any taxable year, (i) the Company will be subject to federal and state income tax, including any applicable alternative minimum tax, on the Company’s taxable income for that year at regular corporate rates, (ii) unless entitled to relief under relevant statutory provisions, the Company would generally be disqualified from taxation as a REIT for the four taxable years following the year of disqualification as a REIT; and (iii) distributions to stockholders would no longer qualify for the dividends paid deduction in computing the Company’s taxable income. If the Company does not qualify as a REIT, the Company would not be required to make distributions to stockholders as a non-REIT is not required to pay dividends to stockholders in order to maintain REIT status or avoid an excise tax. The additional income tax liability the Company would incur as a result of failing to qualify as a REIT would reduce the Company’s net earnings available for distributions to stockholders and also reduce the funds available for satisfying the Company’s obligations in general. If the Company fails to qualify as a REIT, the Company may be required to borrow funds or liquidate some investments in order to pay the applicable tax. As a result of all these factors, the Company’s failure to qualify as a REIT also could impair the Company’s ability to implement its business strategy and would adversely affect the value of its stock.
The Company’s leases may be re-characterized as financings which would eliminate depreciation deductions on the Company’s properties.
The Company believes that it would be treated as the owner of properties where the Company would own the underlying real estate, except with respect to leases structured as “financing leases,” which would constitute financings for federal income tax purposes. If the lease of a property does not constitute a lease for federal income tax purposes and is re-characterized as a secured financing by the Internal Revenue Service,IRS, then the Company believes the lease should be treated as a financing arrangement and the income derived from such a financing arrangement should satisfy the 75% and the 95% gross income tests for REIT qualification as it would be considered to be interest on a loan collateralized by real property. Nevertheless, the re-characterization of a lease in this fashion may have adverse tax consequences for the Company. In particular, the Company would not be entitled to claim depreciation deductions with respect to the property (although the Company should be entitled to treat part of the payments the Company would receive under the arrangement as the repayment of principal and not rent). In such event, in some taxable years the Company’s taxable income, and the corresponding obligation to distribute 90% of such income, would be increased. With respect to leases structured as “financing leases,” the Company will report income received as interest income and will not take depreciation deductions related to the real property. Any increase in the Company’s distribution requirements may limit the Company’s ability to invest in additional properties and to make additional mortgage loans. No assurance can be provided that the Internal Revenue ServiceIRS would re-characterize such transactions as financings that would qualify under the 95% and 75% gross income tests.
Re-characterization of sale-leaseback transactions may cause the Company to lose the Company’s REIT status.
The Company sometimes purchases properties and leases them back to the sellers of such properties. While the Company uses the Company’s best efforts to structure any such sale-leaseback transaction so that the lease will be characterized as a “true lease,” thereby allowing the Company to be treated as the owner of the property for federal income tax purposes, the Internal Revenue ServiceIRS could challenge such characterization. In the event that any sale-leaseback transaction is challenged and re-characterized as a financing transaction or loan for federal income tax purposes, deductions for depreciation and cost recovery relating to such property would be disallowed. If a sale-leaseback transaction were so re-characterized, the Company might fail to satisfy the REIT qualification “asset tests” or the “income tests” and, consequently, fail to qualify as a REIT status effective with the year of re-characterization. Alternatively, the amount of the Company’s taxable income could be recalculated, which might also cause the Company to fail to meet the distribution requirement for a taxable year.
Excessive non-real estate asset values may jeopardize the Company’s REIT status.
In order to qualify as a REIT, among other requirements, at least 75% of the value of the Company’s assets must consist of investments in real estate, investments in other REITs, cash and cash equivalents and government securities. Accordingly, the value of any other property that is not considered a real estate asset for federal income tax purposes must represent in the aggregate not more than 25% of the Company’s total assets. In addition, under federal income tax law, the Company may not own securities in, or make loans to, any one company (other than a REIT, a qualified REIT subsidiary or a TRS) which represent in excess of 10% of the voting securities or 10% of the value of all securities of that company (other than certain securities), or which have, in the aggregate, a value in excess of 5% of the Company’s total assets, and the Company may not own securities of one or more TRSs which have, in the aggregate, a value in excess of 25% of the Company’s total assets (20% for taxable years beginning after December 31, 2017).
The 75%, 25%, 10% and 5% REIT qualification tests are determined at the end of each calendar quarter. If the Company fails to meet any such test at the end of any calendar quarter, and such failure is not remedied within 30 days after the close of such quarter, the Company will cease to qualify as a REIT, unless certain requirements are satisfied.
The Company may have to borrow funds or sell assets to meet the Company’s distribution requirements.
Subject to some adjustments that are unique to REITs, a REIT generally must distribute 90% of its taxable income to its stockholders. For the purpose of determining taxable income, the Company may be required to accrue interest, rent and other items treated as earned for tax purposes, but that it has not yet received. In addition, the Company may be required not to accrue as expenses for tax purposes some items which actually have been paid, or some of the Company’s deductions might be subject to certain disallowance rules under the Code. As a result, the Company could have taxable income in excess of cash available for distribution. If this occurs, the Company may have to borrow funds or liquidate some of its assets in order to meet the distribution requirements applicable to a REIT.
Even as a REIT, the Company remains subject to various taxes which would reduce operating cash flow if and to the extent certain liabilities are incurred.
Even as a REIT, the Company is or could be subject to some federal, foreign and state and local taxes on the Company’s income and property that could reduce operating cash flow, including but not limited to: (i) tax on any undistributed taxable income; (ii) “alternative minimum tax” on the Company’s items of tax preference; (iii) certain state income taxes (because not all states treat REITs the same as
they are treated for federal income tax purposes); (iv) a tax equal to 100% of net gain from “prohibited transactions”; (v) tax on net gains from the sale of certain “foreclosure property”; (vi) tax on gains of sale of certain “built-in gain” properties; and (vii) certain taxes and penalties if the Company fail to comply with one or more REIT qualification requirements, but nevertheless qualify to maintain the Company’s status as a REIT. Foreclosure property includes property with respect to which the Company acquires ownership by reason of a borrower default on a loan or possession by reason of a tenant’s default on a lease. The Company may elect to treat certain qualifying property as “foreclosure property,” in which case, the gross revenue and net gain from such property will be treated as qualifying income under the 75% and 95% gross income tests for three years following such acquisition. To qualify for such treatment, the Company must satisfy additional requirements, including that the Company operate the property through an independent contractor after a short grace period. The Company will be subject to tax on the Company’s net income from foreclosure property. Such net income generally means the excess of any gain from the sale or other disposition of foreclosure property and income derived from foreclosure property that otherwise does not qualify for the 75% gross income test, over the allowable deductions that relate to the production of such income. Any such tax incurred will reduce the amount of cash available for distribution.
The Company’s investment strategy may cause the Company to incur penalty taxes, fail to maintain the Company’s REIT status or own and sell properties through TRSs, each of which would diminish the return to the Company’s stockholders.
The sale of one or more of the Company’s properties may be considered a prohibited transaction under the Code. Any “inventory-like” sales would almost certainly be considered such a prohibited transaction. If the Company is deemed to have engaged in a “prohibited transaction” (i.e., the Company sell a property held by the Company primarily for sale in the ordinary course of the Company’s trade or business), all net gain that the Company derive from such sale would be subject to a 100% penalty tax. The Code sets forth a safe harbor for REITs that wish to sell property without risking the imposition of the 100% penalty tax. The principal requirements of the safe harbor are that: (i) the REIT must hold the applicable property for not less than two years for the production of rental income prior to its sale; (ii) the aggregate expenditures made by the REIT, or any partner of the REIT, during the two-year period preceding the date of sale which are includible in the basis of the property do not exceed 30% of the net selling price of the property; and (iii) the REIT does not make more than seven sales of property during the taxable year, the aggregate adjusted bases of property sold during the taxable year does not exceed 10% of the aggregate bases of all of the REIT’s assets as of the beginning of the taxable year or the fair market value of property sold during the taxable year does not exceed 10% of the fair market value of all of the REIT’s assets as of the beginning of the taxable year (this percentage threshold is changed to 20% of the aggregate bases or fair market value of all of the REIT’s assets, as the case may be, effective for taxable years beginning after December 18, 2015, pursuant to the Protecting Americans from Tax Hikes Act of 2015). Given the Company’s investment strategy, the sale of one or more of its properties may not fall within the prohibited transaction safe harbor.
If the Company desires to sell a property pursuant to a transaction that does not fall within the safe harbor, the Company may be able to avoid the prohibited transaction tax if the Company acquired the property through a TRS, or acquired the property and transferred it to a TRS for a non-tax business purpose prior to the sale (i.e., for a reason other than the avoidance of taxes). The Company may decide to forego the use of a TRS in a transaction that does not meet the safe harbor based on the Company’s own internal analysis, the opinion of counsel or the opinion of other tax advisors that the disposition will not be subject to the prohibited transaction tax. In cases where a property disposition is not effected through a TRS, the Internal Revenue ServiceIRS could successfully assert that the disposition constitutes a prohibited transaction, in which event all of the net gain from the sale of such property will be payable as a tax which will have a negative impact on cash flow and the ability to make cash distributions.
As a REIT, the value of the Company’s ownership interests held in the Company’s TRSs may not exceed 25% of the value of all of the Company’s assets at the end of any calendar quarter (20% for taxable years beginning after December 31, 2017). If the Internal Revenue ServiceIRS were to determine that the value of the Company’s interests in all of the Company’s
TRSs exceeded 25% of the value of the Company’s total assets at the end of any calendar quarter, then the Company would fail to qualify as a REIT. If the Company determines it to be in its best interest to own a substantial number of the Company’s properties through one or more TRSs, then it is possible that the Internal Revenue ServiceIRS may conclude that the value of the Company’s interests in the Company’s TRSs exceeds 25% of the value of the Company’s total assets at the end of any calendar quarter and therefore cause the Company to fail to qualify as a REIT. Additionally, as a REIT, no more than 25% of the Company’s gross income with respect to any year may be from sources other than real estate. Distributions paid to the Company from a TRS are considered to be non-real estate income. Therefore, the Company may fail to qualify as a REIT if distributions from all of the Company’s TRSs, when aggregated with all other non-real estate income with respect to any one year, are more than 25% of the Company’s gross income with respect to such year.
Investors may have current tax liability on distributions investors elect to reinvest in the Company’s common stock.
Investors who participate in the Company’s Reinvestment Plan will be deemed to have received, and for income tax purposes will be taxed on, the amount reinvested in shares of the Company’s common stock to the extent the amount reinvested was not a tax-free return of capital. In addition, investors will be treated for tax purposes as having received an additional distribution to the extent the shares are purchased at a discount to fair market value. As a result, unless investors are a tax-exempt entity, investors may have to use funds from other sources to pay a tax liability on the value of the shares of common stock received.
If the Company’s operating partnership fails to maintain its status as a partnership, the operating partnership’s income may be subject to taxation, which would reduce the cash available to the Company for distribution to its stockholders.
The Company maintains the status of its operating partnership as either a disregarded entity or an entity taxable as a partnership for federal income tax purposes. However, if the Internal Revenue ServiceIRS were to successfully challenge the status of the operating partnership as a disregarded entity or an entity taxable as a partnership, the Company’s operating partnership would be taxable as a corporation. In such event, this would reduce the amount of distributions that the operating partnership could make to the Company. Additionally, this could also result in the Company’s failure to qualify as a REIT, and becoming subject to a corporate level tax on the Company’s taxable income. This would substantially reduce the cash available to the Company to pay distributions and the return on an investment. In addition, if any of the partnerships or limited liability companies through which the Company’s operating partnership owns its properties, in whole or in part, loses its characterization as a partnership or disregarded entity for federal income tax purposes, it would be subject to taxation as a corporation, thereby reducing distributions to the Company’s operating partnership. Such a re-characterization of an underlying property owner could also threaten the Company’s ability to maintain REIT status.
Equity participation in mortgage, bridge, mezzanine or other loans may result in taxable income and gains from these properties that could adversely impact the Company’s REIT status.
If the Company participates under a loan in any appreciation of the properties securing the mortgage loan or its cash flow and the Internal Revenue ServiceIRS characterizes this participation as “equity” or as a “shared appreciation mortgage,” the Company might have to recognize income, gains and other items from the property as if an equity investor for federal income tax purposes. This could affect the Company’s ability to qualify as a REIT.
The Tax Cuts and Jobs Act, which makes significant changes to the U.S. federal income taxation of individuals and corporations, was signed into law on December 22, 2017.
On December 22, 2017, H.R. 1, the “Tax Cuts and Jobs Act” (the “Tax Act”) was signed into law. The Tax Act makes fundamental changes to the taxation of individuals and corporations, generally effective for taxable years beginning on or after January 1, 2018. Although the taxation of REITs is not materially changed by the Tax Act, the Company is continuing to evaluate the impact of the Tax Act and, as such, its implication for the Company’s business remains uncertain. Furthermore, the extensive changes made to non-REIT provisions of the Internal Revenue Code of 1986, as amended, may have unanticipated effects on the Company or its stockholders.
There are numerous interpretive issues and ambiguities in connection with the Tax Act that require guidance and that are not clearly addressed by its legislative history. The Company’s analysis of the Tax Act may be impacted by technical corrections legislation, guidance provided by the Congressional Joint Committee on Taxation, the U.S. Department of Treasury or other administrative guidance. For more information about the tax law changes enacted by the Tax Act, see “Part I––Statement Regarding Forward Looking Information––Item 1––Business––Taxation.”
Tax related legislative or regulatory action could adversely affect the Company or an investment in the Company.
In recent years, numerous legislative, judicial and administrative changes have been made in the provisions of the federal income tax laws applicable to investments similar to an investment in shares of the Company’s common stock. Additional changes to the tax laws are likely to continue to occur, and the Company cannot assure investors that any such changes will not adversely affect the taxation of the Company’s stockholders. Any such changes could have an adverse effect on an investment in the Company’s shares or on the market value or the resale potential of the Company’s assets. Investors are urged to consult with their own tax advisor with respect to the impact of recent legislation, including the Tax Act, and the status of legislative, regulatory or administrative developments on an investment in the Company’s shares. Investors also should note that the Company’s counsel’s tax opinion is based upon the Company’s representations and existing law and the regulations promulgated by the U.S. Department of Treasury, applicable as of the date of its opinion, all of which are subject to change, either prospectively or retroactively.
Although REITs continue to receive favorable tax treatment (a(e.g. a deduction for dividends paid), it is possible that future legislation would result in a REIT having fewer tax advantages, and it could become more advantageous for a company that invests in real estate to elect to be taxed for U.S. federal income tax purposes as a corporation. As a result, the Company’s charter provides its board of directors with the power, under certain circumstances, to revoke or otherwise terminate its REIT election and cause the Company to be taxed as a corporation, without the vote of the Company’s stockholders. The Company’s board of directors has fiduciary duties to the Company and the Company’s stockholders in accordance with the Maryland General Corporation Law and could only cause such changes in the Company’s tax treatment if it determines in good faith that such changes are in the best interest of its stockholders.
The lease of qualified health care properties to a TRS is subject to special requirements.
The Company leases certain qualified health care properties to TRSs (or limited liability companies of which the TRSs are members), which lessees contract with managers (or related parties) to manage the health care operations at these properties. The rents from this TRS lessee structure are treated as qualifying rents from real property if (1) they are paid pursuant to an arms-length lease of a qualified health care property with a TRS and (2) the manager qualifies as an eligible independent contractor (as defined in the Code). If any of these conditions are not satisfied, then the rents will not be qualifying rents and the Company might fail to meet the 95% and 75% gross income tests.
Risks Related to Investments by Tax-Exempt Entities and Benefit Plans Subject to the Employee Retirement Income Security Act (“ERISA”)
If the Company’s assets are deemed “plan assets” for the purposes of ERISA, the Company could be subject to excise taxes on certain prohibited transactions.
The Company believes that the Company’s assets will not be deemed to be “plan assets” for purposes of ERISA and/or the Code, but the Company has not requested an opinion of counsel to that effect, and no assurances can be given that the Company’s assets will never constitute “plan assets.” If the Company’s assets were deemed to be “plan assets” for purposes of ERISA and/or the Code,
among other things, (a) certain of the Company’s transactions could constitute “prohibited transactions” under ERISA and the Code, and (b) ERISA’s prudence and other fiduciary standards would apply to the Company’s investments (and might not be met). Among other things, ERISA makes plan fiduciaries personally responsible for any losses resulting to the plan from any breach of fiduciary duty, and the Code imposes nondeductible excise taxes on prohibited transactions. If such excise taxes were imposed on the Company, the amount of funds available for the Company to make distributions to stockholders would be reduced.
Risks Related to the Company’s Organizational Structure
The limit on the percentage of shares of the Company’s stock that any person may own may discourage a takeover or business combination that may benefit the Company’s stockholders.
The Company’s charter restricts the direct or indirect ownership by one person or entity to no more than 9.8%, by number or value, of any class or series of the Company’s equity securities (which includes common stock and any preferred stock the Company may issue). This restriction may deter individuals or entities from making tender offers for shares of the Company’s common stock on terms that might be financially attractive to stockholders or which may cause a change in the Company’s management. This ownership restriction may also prohibit business combinations that would have otherwise been approved by the Company’s board of directors and stockholders and may also decrease their ability to sell their shares of the Company’s common stock.
The Company’s board of directors can take many actions without stockholder approval which could have a material adverse effect on the distributions investors receive from the Company and/or could reduce the value of the Company’s assets.
The Company’s board of directors has overall authority to conduct the Company’s operations. This authority includes significant flexibility. For example, the Company’s board of directors can: (i) list the Company’s stock on a national securities exchange or include its stock for quotation on the National Market System of the NASDAQ Stock Market without obtaining stockholder approval; (ii) prevent the ownership, transfer and/or accumulation of shares in order to protect the Company’s status as a REIT or for any other reason deemed to be in the best interests of the stockholders; (iii) authorize and issue additional shares of any class or series of stock without obtaining stockholder approval, which could dilute an ownership interest; (iv) change the Company’s Advisor’s compensation, and employ and compensate affiliates; (v) direct the Company’s investments toward those that will not appreciate over time, such as loans and building-only properties, with the land owned by a third-party; and (vi) establish and change minimum creditworthiness standards with respect to tenants. Any of these actions could reduce the value of the Company’s assets without giving investors, as stockholders, the right to vote.
Investors will be limited in their right to bring claims against the Company’s officers and directors.
The Company’s charter provides generally that a director or officer will be indemnified against liability as a director or officer so long as he or she performs his or her duties in accordance with the applicable standard of conduct and without negligence or misconduct in the case of the Company’s officers and non-independent directors, and without gross negligence or willful misconduct in the case of the Company’s independent directors. In addition, the Company’s charter provides that, subject to the applicable limitations set forth therein or under Maryland law, no director or officer will be liable to the Company or the Company’s stockholders for monetary or other damages. The Company’s charter also provides that, with the approval of the Company’s board of directors, the Company may indemnify the Company’s employees and agents for losses they may incur by reason of their service in such capacities so long as they satisfy these requirements. The Company has entered into separate indemnification agreements with each of the Company’s directors and executive officers. As a result, the Company and the Company’s stockholders may have more limited rights against these persons than might otherwise exist under common law. In addition, the Company may be obligated to fund the defense costs incurred by these persons in some cases.
The Company’s use of an operating partnership structure may result in potential conflicts of interest with limited partners other than the Company, if any, whose interests may not be aligned with those of the Company’s stockholders.
Limited partners other than the Company, if any, in the Company’s operating partnership will have the right to vote on certain amendments to the operating partnership agreement, as well as on certain other matters. Persons holding such voting rights may exercise them in a manner that conflicts with the interests of the Company’s stockholders. As general partner of the Company’s operating partnership, the Company is obligated to act in a manner that is in the best interest of all partners of the Company’s operating partnership. Circumstances may arise in the future when the interests of other limited partners in the operating partnership may conflict with the interests of the Company’s stockholders. These conflicts may be resolved in a manner stockholders do not believe are in their best interest.
Item 1B. Unresolved Staff Comments
None.
As of December 31, 2016,2017, we had investments in 143 real estate investment properties. The following tables set forth details on our consolidated healthcare investment portfolio by asset class:
Name and Location | Name and Location |
| Structure |
| Date Acquired | Encumbrance at 12/31/2016 (in millions) | Investment Amount (in millions) |
| Structure |
| Date Acquired |
| Encumbrance at 12/31/2017 (in millions) |
|
| Investment Amount (in millions) |
| ||||||
Acute Care | Acute Care |
|
|
|
|
|
|
|
|
|
|
|
|
|
|
|
|
|
|
|
| ||
Medical Portfolio I Properties | Medical Portfolio I Properties |
|
|
|
|
|
|
|
|
|
|
|
|
|
|
|
|
|
|
|
| ||
| Doctors Specialty Hospital |
| Modified Lease |
| 8/16/2013 | $ | ― | $ | 10.0 | ||||||||||||||
|
| Leawood, KS ("Kansas City") |
|
|
|
|
|
|
|
| |||||||||||||
Doctors Specialty Hospital |
| Modified Lease |
| 8/16/2013 |
| $ | — |
|
| $ | 10.0 |
| |||||||||||
Leawood, KS ("Kansas City") |
|
|
|
|
|
|
|
|
|
|
|
| |||||||||||
Memorial Hermann Orthopedic & Spine Hospital ("MHOSH") | Memorial Hermann Orthopedic & Spine Hospital ("MHOSH") |
| Triple-net Lease |
| 6/2/2014 |
| 30.8 |
| 49.0 |
| Triple-net Lease |
| 6/2/2014 |
|
| 30.4 |
|
|
| 49.0 |
| ||
|
| Bellaire, TX ("Houston") |
|
|
|
|
|
|
|
| |||||||||||||
Bellaire, TX ("Houston") |
|
|
|
|
|
|
|
|
|
|
|
| |||||||||||
Medical Portfolio II Properties | Medical Portfolio II Properties |
|
|
|
|
|
|
|
|
|
|
|
|
|
|
|
|
|
|
|
| ||
| Hurst Specialty Hospital |
| Triple-net Lease |
| 8/15/2014 |
| 18.2 |
| 29.5 | ||||||||||||||
|
| Hurst, TX ("Dallas/Fort Worth") |
|
|
|
|
|
|
|
| |||||||||||||
| Beaumont Specialty Hospital |
| Triple-net Lease |
| 8/15/2014 |
| 20.8 |
| 33.6 | ||||||||||||||
|
| Beaumont, TX ("Houston") |
|
|
|
|
|
|
|
| |||||||||||||
Hurst Specialty Hospital |
| Triple-net Lease |
| 8/15/2014 |
|
| 17.8 |
|
|
| 29.5 |
| |||||||||||
Hurst, TX ("Dallas/Fort Worth") |
|
|
|
|
|
|
|
|
|
|
|
| |||||||||||
Beaumont Specialty Hospital |
| Triple-net Lease |
| 8/15/2014 |
|
| 20.3 |
|
|
| 33.6 |
| |||||||||||
Beaumont, TX ("Houston") |
|
|
|
|
|
|
|
|
|
|
|
| |||||||||||
Triangle Orthopaedic | Triangle Orthopaedic |
|
|
|
|
|
|
|
|
|
|
|
|
|
|
|
|
|
|
|
| ||
| North Carolina Specialty Hospital |
| Modified Lease |
| 6/29/2015 |
| 19.0 |
| 31.8 | ||||||||||||||
|
| Durham, NC |
|
|
|
|
|
|
|
| |||||||||||||
North Carolina Specialty Hospital |
| Modified Lease |
| 6/29/2015 |
|
| 18.8 |
|
|
| 31.8 |
| |||||||||||
Durham, NC |
|
|
|
|
|
|
|
|
|
|
|
| |||||||||||
Medical Office | Medical Office |
|
|
|
|
|
|
|
|
|
|
|
|
|
|
|
|
|
|
|
| ||
LaPorte Cancer Center | LaPorte Cancer Center |
| Modified Lease |
| 6/14/2013 |
| 7.8 |
| 13.1 |
| Modified Lease |
| 6/14/2013 |
|
| 7.6 |
|
|
| 13.1 |
| ||
|
| Westville, IN |
|
|
|
|
|
|
|
| |||||||||||||
Westville, IN |
|
|
|
|
|
|
|
|
|
|
|
| |||||||||||
Knoxville Medical Office Properties | Knoxville Medical Office Properties |
|
|
|
|
|
|
|
|
|
|
|
|
|
|
|
|
|
|
|
| ||
| Physicians Plaza A at North Knoxville Medical Center |
| Modified Lease |
| 7/10/2013 |
| 11.9 |
| 18.1 | ||||||||||||||
|
| Powell, TN ("Knoxville") |
|
|
|
|
|
|
|
| |||||||||||||
| Physicians Plaza B at North Knoxville Medical Center |
| Modified Lease |
| 7/10/2013 |
| 14.3 |
| 21.8 | ||||||||||||||
|
| Powell, TN ("Knoxville") |
|
|
|
|
|
|
|
| |||||||||||||
| Physicians Regional Medical Center – Central Wing Annex |
| Modified Lease |
| 7/10/2013 |
| 3.8 |
| 5.8 | ||||||||||||||
|
| Knoxville, TN |
|
|
|
|
|
|
|
| |||||||||||||
| Jefferson Medical Commons |
| Modified Lease |
| 7/10/2013 |
| 7.6 |
| 11.6 | ||||||||||||||
|
| Jefferson City, TN ("Knoxville") |
|
|
|
|
|
|
|
| |||||||||||||
Physicians Plaza A at North Knoxville Medical Center |
| Modified Lease |
| 7/10/2013 |
|
| 13.7 |
|
|
| 18.1 |
| |||||||||||
Powell, TN ("Knoxville") |
|
|
|
|
|
|
|
|
|
|
|
| |||||||||||
Physicians Plaza B at North Knoxville Medical Center |
| Modified Lease |
| 7/10/2013 |
|
| 16.6 |
|
|
| 21.8 |
| |||||||||||
Powell, TN ("Knoxville") |
|
|
|
|
|
|
|
|
|
|
|
| |||||||||||
Physicians Regional Medical Center – Central Wing Annex |
| Modified Lease |
| 7/10/2013 |
|
| 4.1 |
|
|
| 5.8 |
| |||||||||||
Knoxville, TN |
|
|
|
|
|
|
|
|
|
|
|
| |||||||||||
Jefferson Medical Commons |
| Modified Lease |
| 7/10/2013 |
|
| 8.4 |
|
|
| 11.6 |
| |||||||||||
Jefferson City, TN ("Knoxville") |
|
|
|
|
|
|
|
|
|
|
|
| |||||||||||
Medical Portfolio I Properties | Medical Portfolio I Properties |
|
|
|
|
|
|
|
|
|
|
|
|
|
|
|
|
|
|
|
| ||
| John C. Lincoln Medical Office Plaza I |
| Modified Lease |
| 8/16/2013 |
| ― |
| 4.4 | ||||||||||||||
|
| Phoenix, AZ |
|
|
|
|
|
|
|
| |||||||||||||
| John C. Lincoln Medical Office Plaza II |
| Modified Lease |
| 8/16/2013 |
| ― |
| 3.1 | ||||||||||||||
|
| Phoenix, AZ |
|
|
|
|
|
|
|
| |||||||||||||
| North Mountain Medical Plaza |
| Modified Lease |
| 8/16/2013 |
| ― |
| 6.2 | ||||||||||||||
|
| Phoenix, AZ |
|
|
|
|
|
|
|
| |||||||||||||
| Escondido Medical Arts Center |
| Modified Lease |
| 8/16/2013 |
| ― |
| 15.6 | ||||||||||||||
|
| Escondido, CA ("San Diego") |
|
|
|
|
|
|
|
| |||||||||||||
| Chestnut Commons MOB |
| Modified Lease |
| 8/16/2013 |
| ― |
| 20.2 | ||||||||||||||
|
| Elyria, OH ("Cleveland") |
|
|
|
|
|
|
|
| |||||||||||||
John C. Lincoln Medical Office Plaza I |
| Modified Lease |
| 8/16/2013 |
| ― |
|
|
| 4.4 |
| ||||||||||||
Phoenix, AZ |
|
|
|
|
|
|
|
|
|
|
|
| |||||||||||
John C. Lincoln Medical Office Plaza II |
| Modified Lease |
| 8/16/2013 |
| ― |
|
|
| 3.1 |
| ||||||||||||
Phoenix, AZ |
|
|
|
|
|
|
|
|
|
|
|
| |||||||||||
North Mountain Medical Plaza |
| Modified Lease |
| 8/16/2013 |
| ― |
|
|
| 6.2 |
| ||||||||||||
Phoenix, AZ |
|
|
|
|
|
|
|
|
|
|
|
| |||||||||||
Escondido Medical Arts Center |
| Modified Lease |
| 8/16/2013 |
| ― |
|
|
| 15.6 |
| ||||||||||||
Escondido, CA ("San Diego") |
|
|
|
|
|
|
|
|
|
|
|
| |||||||||||
Chestnut Commons MOB |
| Modified Lease |
| 8/16/2013 |
| ― |
|
|
| 20.2 |
| ||||||||||||
Elyria, OH ("Cleveland") |
|
|
|
|
|
|
|
|
|
|
|
| |||||||||||
Calvert Medical Office Properties | Calvert Medical Office Properties |
|
|
|
|
|
|
|
|
|
|
|
|
|
|
|
|
|
|
|
| ||
| Calvert MOBs I, II, & III |
| Modified Lease |
| 8/30/2013 |
| 10.4 |
| 16.4 | ||||||||||||||
|
| Prince Frederick, MD ("Washington D.C.") |
|
|
|
|
|
|
|
| |||||||||||||
| Calvert Medical Arts Center |
| Modified Lease |
| 8/30/2013 |
| 12.2 |
| 19.3 | ||||||||||||||
|
| Prince Frederick, MD ("Washington D.C.") |
|
|
|
|
|
|
|
| |||||||||||||
| Dunkirk Medical Center |
| Modified Lease |
| 8/30/2013 |
| 2.9 |
| 4.6 | ||||||||||||||
|
| Dunkirk, MD ("Washington D.C.") |
|
|
|
|
|
|
|
| |||||||||||||
Calvert MOBs I, II, & III |
| Modified Lease |
| 8/30/2013 |
|
| 10.2 |
|
|
| 16.4 |
| |||||||||||
Prince Frederick, MD ("Washington D.C.") |
|
|
|
|
|
|
|
|
|
|
|
| |||||||||||
Calvert Medical Arts Center |
| Modified Lease |
| 8/30/2013 |
|
| 12.0 |
|
|
| 19.3 |
| |||||||||||
Prince Frederick, MD ("Washington D.C.") |
|
|
|
|
|
|
|
|
|
|
|
| |||||||||||
Dunkirk Medical Center |
| Modified Lease |
| 8/30/2013 |
|
| 2.9 |
|
|
| 4.6 |
| |||||||||||
Dunkirk, MD ("Washington D.C.") |
|
|
|
|
|
|
|
|
|
|
|
| |||||||||||
Name and Location | Name and Location |
| Structure |
| Date Acquired |
| Encumbrance at 12/31/16 (in millions) |
| Investment Amount (in millions) |
| Structure |
| Date Acquired |
| Encumbrance at 12/31/17 (in millions) |
|
| Investment Amount (in millions) |
| |||||
Coral Springs MOBs | Coral Springs MOBs |
|
|
|
|
|
|
|
|
|
|
|
|
|
|
|
|
|
|
|
|
|
| |
| Coral Springs MOB I |
| Modified Lease |
| 12/23/2013 |
| $ | ― |
| $ | 14.9 | |||||||||||||
|
| Coral Springs, FL |
|
|
|
|
|
|
|
|
|
| ||||||||||||
| Coral Springs MOB II |
| Modified Lease |
| 12/23/2013 |
|
| ― |
|
| 16.1 | |||||||||||||
|
| Coral Springs, FL |
|
|
|
|
|
|
|
|
|
| ||||||||||||
Coral Springs MOB I |
| Modified Lease |
| 12/23/2013 |
| $ | — |
|
| $ | 14.9 |
| ||||||||||||
Coral Springs, FL |
|
|
|
|
|
|
|
|
|
|
|
| ||||||||||||
Coral Springs MOB II |
| Modified Lease |
| 12/23/2013 |
| ― |
|
|
| 16.1 |
| |||||||||||||
Coral Springs, FL |
|
|
|
|
|
|
|
|
|
|
|
| ||||||||||||
Chula Vista Medical Arts Center - Plaza II | Chula Vista Medical Arts Center - Plaza II |
| Modified Lease |
| 12/23/2013 |
|
| ― |
|
| 10.7 |
| Modified Lease |
| 12/23/2013 |
| ― |
|
|
| 10.7 |
| ||
|
| Chula Vista, CA ("San Diego") |
|
|
|
|
|
|
|
|
|
| ||||||||||||
Chula Vista, CA ("San Diego") |
|
|
|
|
|
|
|
|
|
|
|
| ||||||||||||
Chula Vista Medical Arts Center - Plaza I | Chula Vista Medical Arts Center - Plaza I |
| Modified Lease |
| 1/21/2014 |
|
| ― |
|
| 17.9 |
| Modified Lease |
| 1/21/2014 |
| ― |
|
|
| 17.9 |
| ||
|
| Chula Vista, CA ("San Diego") |
|
|
|
|
|
|
|
|
|
| ||||||||||||
Chula Vista, CA ("San Diego") |
|
|
|
|
|
|
|
|
|
|
|
| ||||||||||||
MHOSH MOB | MHOSH MOB |
| Modified Lease |
| 6/2/2014 |
|
| 17.0 |
|
| 27.0 |
| Modified Lease |
| 6/2/2014 |
|
| 16.7 |
|
|
| 27.0 |
| |
|
| Bellaire, TX ("Houston") |
|
|
|
|
|
|
|
|
|
| ||||||||||||
Bellaire, TX ("Houston") |
|
|
|
|
|
|
|
|
|
|
|
| ||||||||||||
Claremont Medical Office | Claremont Medical Office |
| Modified Lease |
| 8/29/2014 |
|
| 12.5 |
|
| 23.0 |
| Modified Lease |
| 8/29/2014 |
|
| 14.6 |
|
|
| 23.0 |
| |
|
| Claremont, CA ("Los Angeles") |
|
|
|
|
|
|
|
|
|
| ||||||||||||
Claremont, CA ("Los Angeles") |
|
|
|
|
|
|
|
|
|
|
|
| ||||||||||||
Lee Hughes MOB | Lee Hughes MOB |
| Modified Lease |
| 9/29/2014 |
|
| 18.1 |
|
| 29.9 |
| Modified Lease |
| 9/29/2014 |
|
| 17.6 |
|
|
| 29.9 |
| |
|
| Glendale, CA ("Los Angeles") |
|
|
|
|
|
|
|
|
|
| ||||||||||||
Glendale, CA ("Los Angeles") |
|
|
|
|
|
|
|
|
|
|
|
| ||||||||||||
Northwest Medical Park Building | Northwest Medical Park Building |
| Modified Lease |
| 10/31/2014 |
|
| 6.9 |
|
| 10.8 |
| Modified Lease |
| 10/31/2014 |
|
| 6.8 |
|
|
| 10.8 |
| |
|
| Margate, FL ("Fort Lauderdale") |
|
|
|
|
|
|
|
|
|
| ||||||||||||
Margate, FL ("Fort Lauderdale") |
|
|
|
|
|
|
|
|
|
|
|
| ||||||||||||
Newburyport Medical Center | Newburyport Medical Center |
| Modified Lease |
| 10/31/2014 |
|
| ― |
|
| 18.0 |
| Modified Lease |
| 10/31/2014 |
| ― |
|
|
| 18.0 |
| ||
|
| Newburyport, MA ("Boston") |
|
|
|
|
|
|
|
|
|
| ||||||||||||
Newburyport, MA ("Boston") |
|
|
|
|
|
|
|
|
|
|
|
| ||||||||||||
ProMed Building I (1) | ProMed Building I (1) |
| Modified Lease |
| 12/19/2014 |
|
| 6.9 |
|
| 11.0 |
| Modified Lease |
| 12/19/2014 |
|
| 6.7 |
|
|
| 11.0 |
| |
|
| Yuma, AZ |
|
|
|
|
|
|
|
|
|
| ||||||||||||
Yuma, AZ |
|
|
|
|
|
|
|
|
|
|
|
| ||||||||||||
Southeast Medical Office Properties | Southeast Medical Office Properties |
|
|
|
|
|
|
|
|
|
|
|
|
|
|
|
|
|
|
|
|
|
| |
| Midtown Medical Plaza |
| Modified Lease |
| 12/22/2014 |
|
| 28.4 |
|
| 54.7 | |||||||||||||
|
| Charlotte, NC |
|
|
|
|
|
|
|
|
|
| ||||||||||||
| Presbyterian Medical Tower |
| Modified Lease |
| 12/22/2014 |
|
| 18.9 |
|
| 36.3 | |||||||||||||
|
| Charlotte, NC |
|
|
|
|
|
|
|
|
|
| ||||||||||||
| Metroview Professional Building |
| Modified Lease |
| 12/22/2014 |
|
| 9.0 |
|
| 17.3 | |||||||||||||
|
| Charlotte, NC |
|
|
|
|
|
|
|
|
|
| ||||||||||||
| Physicians Plaza Huntersville |
| Modified Lease |
| 12/22/2014 |
|
| 15.8 |
|
| 30.0 | |||||||||||||
|
| Huntersville, NC ("Charlotte") |
|
|
|
|
|
|
|
|
|
| ||||||||||||
| Matthews Medical Office Building |
| Modified Lease |
| 12/22/2014 |
|
| 11.1 |
|
| 21.2 | |||||||||||||
|
| Matthews, NC ("Charlotte") |
|
|
|
|
|
|
|
|
|
| ||||||||||||
| Outpatient Care Center |
| Modified Lease |
| 12/22/2014 |
|
| 10.4 |
|
| 15.5 | |||||||||||||
|
| Clyde, NC ("Asheville") |
|
|
|
|
|
|
|
|
|
| ||||||||||||
| 330 Physicians Center |
| Modified Lease |
| 12/22/2014 |
|
| 19.3 |
|
| 30.1 | |||||||||||||
|
| Rome, GA |
|
|
|
|
|
|
|
|
|
| ||||||||||||
| Spivey Station Physicians Center |
| Modified Lease |
| 12/22/2014 |
|
| 9.4 |
|
| 14.4 | |||||||||||||
|
| Atlanta, GA |
|
|
|
|
|
|
|
|
|
| ||||||||||||
| Spivey Station ASC Building |
| Modified Lease |
| 12/22/2014 |
|
| 12.0 |
|
| 18.6 | |||||||||||||
|
| Atlanta, GA |
|
|
|
|
|
|
|
|
|
| ||||||||||||
Midtown Medical Plaza |
| Modified Lease |
| 12/22/2014 |
|
| 27.5 |
|
|
| 54.7 |
| ||||||||||||
Charlotte, NC |
|
|
|
|
|
|
|
|
|
|
|
| ||||||||||||
Presbyterian Medical Tower |
| Modified Lease |
| 12/22/2014 |
|
| 18.3 |
|
|
| 36.3 |
| ||||||||||||
Charlotte, NC |
|
|
|
|
|
|
|
|
|
|
|
| ||||||||||||
Metroview Professional Building |
| Modified Lease |
| 12/22/2014 |
|
| 8.7 |
|
|
| 17.3 |
| ||||||||||||
Charlotte, NC |
|
|
|
|
|
|
|
|
|
|
|
| ||||||||||||
Physicians Plaza Huntersville |
| Modified Lease |
| 12/22/2014 |
|
| 15.3 |
|
|
| 30.0 |
| ||||||||||||
Huntersville, NC ("Charlotte") |
|
|
|
|
|
|
|
|
|
|
|
| ||||||||||||
Matthews Medical Office Building |
| Modified Lease |
| 12/22/2014 |
|
| 10.7 |
|
|
| 21.2 |
| ||||||||||||
Matthews, NC ("Charlotte") |
|
|
|
|
|
|
|
|
|
|
|
| ||||||||||||
Outpatient Care Center |
| Modified Lease |
| 12/22/2014 |
|
| 10.0 |
|
|
| 15.5 |
| ||||||||||||
Clyde, NC ("Asheville") |
|
|
|
|
|
|
|
|
|
|
|
| ||||||||||||
330 Physicians Center |
| Modified Lease |
| 12/22/2014 |
|
| 18.6 |
|
|
| 30.1 |
| ||||||||||||
Rome, GA |
|
|
|
|
|
|
|
|
|
|
|
| ||||||||||||
Spivey Station Physicians Center |
| Modified Lease |
| 12/22/2014 |
|
| 9.1 |
|
|
| 14.4 |
| ||||||||||||
Atlanta, GA |
|
|
|
|
|
|
|
|
|
|
|
| ||||||||||||
Spivey Station ASC Building |
| Modified Lease |
| 12/22/2014 |
|
| 11.6 |
|
|
| 18.6 |
| ||||||||||||
Atlanta, GA |
|
|
|
|
|
|
|
|
|
|
|
| ||||||||||||
Novi Orthopaedic Center | Novi Orthopaedic Center |
| Modified Lease |
| 2/13/2015 |
|
| 19.8 |
|
| 30.5 |
| Modified Lease |
| 2/13/2015 |
|
| 19.8 |
|
|
| 30.5 |
| |
|
| Novi, MI |
|
|
|
|
|
|
|
|
|
| ||||||||||||
Novi, MI |
|
|
|
|
|
|
|
|
|
|
|
| ||||||||||||
Southeast Medical Office Properties | Southeast Medical Office Properties |
|
|
|
|
|
|
|
|
|
|
|
|
|
|
|
|
|
|
|
|
|
| |
| UT Cancer Institute Building |
| Modified Lease |
| 2/20/2015 |
|
| 20.8 |
|
| 33.7 | |||||||||||||
|
| Knoxville, TN |
|
|
|
|
|
|
|
|
|
| ||||||||||||
UT Cancer Institute Building |
| Modified Lease |
| 2/20/2015 |
|
| 20.1 |
|
|
| 33.7 |
| ||||||||||||
Knoxville, TN |
|
|
|
|
|
|
|
|
|
|
|
| ||||||||||||
Bend Memorial Clinic MOB | Bend Memorial Clinic MOB |
| Modified Lease |
| 5/11/2015 |
|
| ― |
|
| 36.0 |
| Modified Lease |
| 5/11/2015 |
| ― |
|
|
| 36.0 |
| ||
|
| Bend, OR |
|
|
|
|
|
|
|
|
|
| ||||||||||||
Bend, OR |
|
|
|
|
|
|
|
|
|
|
|
| ||||||||||||
Stoneterra Medical Plaza | Stoneterra Medical Plaza |
| Modified Lease |
| 5/29/2015 |
|
| ― |
|
| 15.1 |
| Modified Lease |
| 5/29/2015 |
| ― |
|
|
| 15.1 |
| ||
|
| San Antonio, TX |
|
|
|
|
|
|
|
|
|
| ||||||||||||
San Antonio, TX |
|
|
|
|
|
|
|
|
|
|
|
| ||||||||||||
Name and Location |
| Structure |
| Date Acquired |
| Encumbrance at 12/31/17 (in millions) |
|
| Investment Amount (in millions) |
| ||
Triangle Orthopaedic |
|
|
|
|
|
|
|
|
|
|
|
|
Triangle Orthopaedic Durham |
| Modified Lease |
| 6/29/2015 |
| $ | 12.7 |
|
| $ | 21.3 |
|
Durham, NC |
|
|
|
|
|
|
|
|
|
|
|
|
Triangle Orthopaedic Oxford |
| Modified Lease |
| 6/29/2015 |
|
| 2.8 |
|
|
| 4.7 |
|
Oxford, NC |
|
|
|
|
|
|
|
|
|
|
|
|
Triangle Orthopaedic Chapel Hill |
| Modified Lease |
| 6/29/2015 |
|
| 1.9 |
|
|
| 3.3 |
|
Chapel Hill, NC |
|
|
|
|
|
|
|
|
|
|
|
|
Triangle Orthopaedic Roxboro |
| Modified Lease |
| 6/29/2015 |
|
| 1.3 |
|
|
| 2.1 |
|
Roxboro, NC |
|
|
|
|
|
|
|
|
|
|
|
|
Doctor's Park |
|
|
|
|
|
|
|
|
|
|
|
|
Doctor's Park Building B |
| Modified Lease |
| 6/30/2015 |
| ― |
|
|
| 5.0 |
| |
Chula Vista, CA ("San Diego") |
|
|
|
|
|
|
|
|
|
|
|
|
Doctor's Park Building C |
| Modified Lease |
| 6/30/2015 |
| ― |
|
|
| 10.0 |
| |
Chula Vista, CA ("San Diego") |
|
|
|
|
|
|
|
|
|
|
|
|
540 New Waverly Place |
| Modified Lease |
| 7/20/2015 |
|
| 6.7 |
|
|
| 15.0 |
|
Cary, NC ("Raleigh") |
|
|
|
|
|
|
|
|
|
|
|
|
MedHelp |
| Modified Lease |
| 7/31/2015 |
| ― |
|
|
| 15.0 |
| |
Birmingham, AL |
|
|
|
|
|
|
|
|
|
|
|
|
Maryland MOBs |
|
|
|
|
|
|
|
|
|
|
|
|
Patriot Professional Center |
| Modified Lease |
| 7/31/2015 |
| ― |
|
|
| 16.9 |
| |
Frederick, MD ("Baltimore") |
|
|
|
|
|
|
|
|
|
|
|
|
Liberty Professional Center |
| Modified Lease |
| 7/31/2015 |
| ― |
|
|
| 7.4 |
| |
Frederick, MD ("Baltimore") |
|
|
|
|
|
|
|
|
|
|
|
|
Columbia MOBs |
|
|
|
|
|
|
|
|
|
|
|
|
Broadway Medical Plaza 1 |
| Modified Lease |
| 8/21/2015 |
| ― |
|
|
| 10.7 |
| |
Columbia, MO |
|
|
|
|
|
|
|
|
|
|
|
|
Broadway Medical Plaza 2 |
| Modified Lease |
| 8/21/2015 |
| ― |
|
|
| 13.1 |
| |
Columbia, MO |
|
|
|
|
|
|
|
|
|
|
|
|
Broadway Medical Plaza 4 |
| Modified Lease |
| 8/21/2015 |
| ― |
|
|
| 14.2 |
| |
Columbia, MO |
|
|
|
|
|
|
|
|
|
|
|
|
Center One |
| Modified Lease |
| 11/30/2015 |
| ― |
|
|
| 34.4 |
| |
Jacksonville, FL |
|
|
|
|
|
|
|
|
|
|
|
|
Red Bank MOB |
| Modified Lease |
| 12/14/2015 |
| ― |
|
|
| 10.6 |
| |
Cincinnati, OH |
|
|
|
|
|
|
|
|
|
|
|
|
Henderson NV MOBs |
|
|
|
|
|
|
|
|
|
|
|
|
Siena Pavilion IV |
| Modified Lease |
| 12/18/2015 |
| ― |
|
|
| 7.0 |
| |
Henderson, NV ("Las Vegas") |
|
|
|
|
|
|
|
|
|
|
|
|
Siena Pavilion V |
| Modified Lease |
| 12/18/2015 |
| ― |
|
|
| 27.8 |
| |
Henderson, NV ("Las Vegas") |
|
|
|
|
|
|
|
|
|
|
|
|
Siena Pavilion VI |
| Modified Lease |
| 12/18/2015 |
| ― |
|
|
| 20.0 |
| |
Henderson, NV ("Las Vegas") |
|
|
|
|
|
|
|
|
|
|
|
|
Post-Acute Care |
|
|
|
|
|
|
|
|
|
|
|
|
Perennial Communities |
|
|
|
|
|
|
|
|
|
|
|
|
Batesville Healthcare Center |
| Triple-net Lease |
| 5/31/2013 |
| ― |
|
|
| 6.2 |
| |
Batesville, AR |
|
|
|
|
|
|
|
|
|
|
|
|
Broadway Healthcare Center |
| Triple-net Lease |
| 5/31/2013 |
| ― |
|
|
| 11.9 |
| |
West Memphis, AR |
|
|
|
|
|
|
|
|
|
|
|
|
Jonesboro Healthcare Center |
| Triple-net Lease |
| 5/31/2013 |
| ― |
|
|
| 15.2 |
| |
Jonesboro, AR |
|
|
|
|
|
|
|
|
|
|
|
|
Magnolia Healthcare Center |
| Triple-net Lease |
| 5/31/2013 |
| ― |
|
|
| 11.8 |
| |
Magnolia, AR |
|
|
|
|
|
|
|
|
|
|
|
|
Name and Location |
| Structure |
| Date Acquired |
| Encumbrance at 12/31/17 (in millions) |
|
| Investment Amount (in millions) |
| ||
Mine Creek Healthcare Center |
| Triple-net Lease |
| 5/31/2013 |
| $ | — |
|
| $ | 3.4 |
|
Nashville, AR |
|
|
|
|
|
|
|
|
|
|
|
|
Searcy Healthcare Center |
| Triple-net Lease |
| 5/31/2013 |
| ― |
|
|
| 7.9 |
| |
Searcy, AR |
|
|
|
|
|
|
|
|
|
|
|
|
Medical Portfolio II Properties |
|
|
|
|
|
|
|
|
|
|
|
|
Oklahoma City Inpatient Rehabilitation Hospital |
| Modified Lease |
| 7/15/2014 |
|
| 15.4 |
|
|
| 25.5 |
|
Oklahoma City, OK |
|
|
|
|
|
|
|
|
|
|
|
|
Las Vegas Inpatient Rehabilitation Hospital |
| Modified Lease |
| 7/15/2014 |
|
| 13.5 |
|
|
| 22.3 |
|
Las Vegas, NV |
|
|
|
|
|
|
|
|
|
|
|
|
South Bend Inpatient Rehabilitation Hospital |
| Modified Lease |
| 7/15/2014 |
|
| 12.2 |
|
|
| 20.2 |
|
Mishawaka, IN ("South Bend") |
|
|
|
|
|
|
|
|
|
|
|
|
Welbrook Senior Living Grand Junction |
| Triple-net Lease |
| 9/4/2015 |
| ― |
|
|
| 14.1 |
| |
Grand Junction, CO |
|
|
|
|
|
|
|
|
|
|
|
|
Cobalt Rehabilitation Hospital Surprise |
| Triple-net Lease |
| 12/30/2015 |
|
| 15.2 |
|
|
| 23.7 |
|
Surprise, AZ ("Phoenix") |
|
|
|
|
|
|
|
|
|
|
|
|
Cobalt Rehabilitation Hospital New Orleans |
| Triple-net Lease |
| 10/19/2016 |
|
| 19.4 |
|
|
| 28.6 |
|
New Orleans, LA |
|
|
|
|
|
|
|
|
|
|
|
|
Seniors Housing |
|
|
|
|
|
|
|
|
|
|
|
|
Primrose I Communities |
|
|
|
|
|
|
|
|
|
|
|
|
Primrose Retirement Community of Casper |
| Triple-net Lease |
| 2/16/2012 |
|
| 11.5 |
|
|
| 19.0 |
|
Casper, WY |
|
|
|
|
|
|
|
|
|
|
|
|
Sweetwater Retirement Community |
| Triple-net Lease |
| 2/16/2012 |
|
| 10.0 |
|
|
| 16.3 |
|
Billings, MT |
|
|
|
|
|
|
|
|
|
|
|
|
Primrose Retirement Community of Grand Island |
| Triple-net Lease |
| 2/16/2012 |
|
| 8.1 |
|
|
| 13.4 |
|
Grand Island, NE |
|
|
|
|
|
|
|
|
|
|
|
|
Primrose Retirement Community of Mansfield |
| Triple-net Lease |
| 2/16/2012 |
|
| 11.1 |
|
|
| 18.3 |
|
Mansfield, OH |
|
|
|
|
|
|
|
|
|
|
|
|
Primrose Retirement Community of Marion |
| Triple-net Lease |
| 2/16/2012 |
|
| 9.2 |
|
|
| 17.9 |
|
Marion, OH |
|
|
|
|
|
|
|
|
|
|
|
|
HarborChase of Villages Crossing |
| Managed |
| 8/29/2012 |
| ― |
|
|
| 19.7 |
| |
Lady Lake, FL ("The Villages") |
|
|
|
|
|
|
|
|
|
|
|
|
Primrose II Communities |
|
|
|
|
|
|
|
|
|
|
|
|
Primrose Retirement Community of Lima |
| Triple-net Lease |
| 12/19/2012 |
| ― |
|
|
| 18.6 |
| |
Lima, OH |
|
|
|
|
|
|
|
|
|
|
|
|
Primrose Retirement Community of Zanesville |
| Triple-net Lease |
| 12/19/2012 |
|
| 11.4 |
|
|
| 19.1 |
|
Zanesville, OH ("Columbus") |
|
|
|
|
|
|
|
|
|
|
|
|
Primrose Retirement Community of Decatur |
| Triple-net Lease |
| 12/19/2012 |
|
| 10.1 |
|
|
| 18.2 |
|
Decatur, IL |
|
|
|
|
|
|
|
|
|
|
|
|
Primrose Retirement Community of Council Bluffs |
| Triple-net Lease |
| 12/19/2012 |
| ― |
|
|
| 12.9 |
| |
Council Bluffs, IA ("Omaha") |
|
|
|
|
|
|
|
|
|
|
|
|
Primrose Retirement Community Cottages |
| Triple-net Lease |
| 12/19/2012 |
| ― |
|
|
| 4.3 |
| |
Aberdeen, SD |
|
|
|
|
|
|
|
|
|
|
|
|
Capital Health Communities |
|
|
|
|
|
|
|
|
|
|
|
|
Brookridge Heights Assisted Living & Memory Care |
| Managed |
| 12/21/2012 |
|
| 13.0 |
|
|
| 18.5 |
|
Marquette, MI |
|
|
|
|
|
|
|
|
|
|
|
|
Curry House Assisted Living & Memory Care |
| Managed |
| 12/21/2012 |
|
| 7.7 |
|
|
| 13.5 |
|
Cadillac, MI |
|
|
|
|
|
|
|
|
|
|
|
|
Symphony Manor |
| Managed |
| 12/21/2012 |
|
| 14.7 |
|
|
| 24.0 |
|
Baltimore, MD |
|
|
|
|
|
|
|
|
|
|
|
|
Woodholme Gardens Assisted Living & Memory Care |
| Managed |
| 12/21/2012 |
|
| 6.8 |
|
|
| 17.1 |
|
Pikesville, MD ("Baltimore") |
|
|
|
|
|
|
|
|
|
|
|
|
Name and Location |
| Structure |
| Date Acquired |
| Encumbrance at 12/31/17 (in millions) |
|
| Investment Amount (in millions) |
| ||
Tranquillity at Fredericktowne |
| Managed |
| 12/21/2012 |
| $ | 20.5 |
|
| $ | 23.0 |
|
Frederick, MD |
|
|
|
|
|
|
|
|
|
|
|
|
HarborChase of Jasper |
| Managed |
| 8/1/2013 |
| ― |
|
|
| 7.3 |
| |
Jasper, AL |
|
|
|
|
|
|
|
|
|
|
|
|
South Bay I Communities |
|
|
|
|
|
|
|
|
|
|
|
|
Raider Ranch |
| Managed |
| 8/29/2013 |
| ― |
|
|
| 72.0 |
| |
Lubbock, TX |
|
|
|
|
|
|
|
|
|
|
|
|
Town Village |
| Managed |
| 8/29/2013 |
| ― |
|
|
| 23.7 |
| |
Oklahoma City, OK |
|
|
|
|
|
|
|
|
|
|
|
|
Pacific Northwest I Communities |
|
|
|
|
|
|
|
|
|
|
|
|
MorningStar of Billings |
| Managed |
| 12/2/2013 |
|
| 19.7 |
|
|
| 48.3 |
|
Billings, MT |
|
|
|
|
|
|
|
|
|
|
|
|
MorningStar of Boise |
| Managed |
| 12/2/2013 |
|
| 21.1 |
|
|
| 40.0 |
|
Boise, ID |
|
|
|
|
|
|
|
|
|
|
|
|
MorningStar of Idaho Falls |
| Managed |
| 12/2/2013 |
|
| 17.6 |
|
|
| 44.4 |
|
Idaho Falls, ID |
|
|
|
|
|
|
|
|
|
|
|
|
MorningStar of Sparks |
| Managed |
| 12/2/2013 |
|
| 23.4 |
|
|
| 55.2 |
|
Sparks, NV ("Reno") |
|
|
|
|
|
|
|
|
|
|
|
|
Prestige Senior Living Arbor Place |
| Managed |
| 12/2/2013 |
|
| 8.3 |
|
|
| 15.8 |
|
Medford, OR |
|
|
|
|
|
|
|
|
|
|
|
|
Prestige Senior Living Beaverton Hills |
| Managed |
| 12/2/2013 |
|
| 9.0 |
|
|
| 12.9 |
|
Beaverton, OR ("Portland") |
|
|
|
|
|
|
|
|
|
|
|
|
Prestige Senior Living Five Rivers |
| Managed |
| 12/2/2013 |
|
| 7.8 |
|
|
| 16.7 |
|
Tillamook, OR |
|
|
|
|
|
|
|
|
|
|
|
|
Prestige Senior Living High Desert |
| Managed |
| 12/2/2013 |
|
| 7.9 |
|
|
| 13.6 |
|
Bend, OR |
|
|
|
|
|
|
|
|
|
|
|
|
Prestige Senior Living Huntington Terrace |
| Managed |
| 12/2/2013 |
|
| 10.1 |
|
|
| 15.0 |
|
Gresham, OR ("Portland") |
|
|
|
|
|
|
|
|
|
|
|
|
Prestige Senior Living Orchard Heights |
| Managed |
| 12/2/2013 |
|
| 12.1 |
|
|
| 17.8 |
|
Salem, OR |
|
|
|
|
|
|
|
|
|
|
|
|
Prestige Senior Living Riverwood |
| Managed |
| 12/2/2013 |
|
| 4.6 |
|
|
| 9.7 |
|
Tualatin, OR ("Portland") |
|
|
|
|
|
|
|
|
|
|
|
|
Prestige Senior Living Southern Hills |
| Managed |
| 12/2/2013 |
|
| 7.6 |
|
|
| 12.9 |
|
Salem, OR |
|
|
|
|
|
|
|
|
|
|
|
|
Pacific Northwest II Communities |
|
|
|
|
|
|
|
|
|
|
|
|
Prestige Senior Living Auburn Meadows |
| Managed |
| 2/3/2014 |
|
| 10.6 |
|
|
| 21.9 |
|
Auburn, WA ("Seattle") |
|
|
|
|
|
|
|
|
|
|
|
|
Prestige Senior Living Bridgewood |
| Managed |
| 2/3/2014 |
|
| 13.3 |
|
|
| 22.1 |
|
Vancouver, WA ("Portland") |
|
|
|
|
|
|
|
|
|
|
|
|
Prestige Senior Living Monticello Park |
| Managed |
| 2/3/2014 |
|
| 17.8 |
|
|
| 27.4 |
|
Longview, WA |
|
|
|
|
|
|
|
|
|
|
|
|
Prestige Senior Living Rosemont |
| Managed |
| 2/3/2014 |
|
| 9.3 |
|
|
| 16.9 |
|
Yelm, WA |
|
|
|
|
|
|
|
|
|
|
|
|
Prestige Senior Living West Hills |
| Managed |
| 3/3/2014 |
|
| 8.8 |
|
|
| 15.0 |
|
Corvallis, OR |
|
|
|
|
|
|
|
|
|
|
|
|
Wellmore of Tega Cay |
| Triple-net Lease |
| 2/7/2014 |
|
| 28.0 |
|
|
| 32.2 |
|
Tega Cay, SC ("Charlotte") |
|
|
|
|
|
|
|
|
|
|
|
|
South Bay II Communities |
|
|
|
|
|
|
|
|
|
|
|
|
Isle at Cedar Ridge |
| Managed |
| 2/28/2014 |
| ― |
|
|
| 22.0 |
| |
Cedar Park, TX ("Austin") |
|
|
|
|
|
|
|
|
|
|
|
|
HarborChase of Plainfield |
| Managed |
| 3/28/2014 |
| ― |
|
|
| 26.5 |
| |
Plainfield, IL |
|
|
|
|
|
|
|
|
|
|
|
|
Legacy Ranch Alzheimer's Special Care Center |
| Managed |
| 3/28/2014 |
| ― |
|
|
| 12.0 |
| |
Midland, TX |
|
|
|
|
|
|
|
|
|
|
|
|
Name and Location |
| Structure |
| Date Acquired |
| Encumbrance at 12/31/16 (in millions) |
| Investment Amount (in millions) | ||||
Triangle Orthopaedic |
|
|
|
|
|
|
|
|
|
| ||
| Triangle Orthopaedic Durham |
| Modified Lease |
| 6/29/2015 |
| $ | 12.8 |
| $ | 21.3 | |
|
| Durham, NC |
|
|
|
|
|
|
|
|
|
|
| Triangle Orthopaedic Oxford |
| Modified Lease |
| 6/29/2015 |
|
| 2.8 |
|
| 4.7 | |
|
| Oxford, NC |
|
|
|
|
|
|
|
|
|
|
| Triangle Orthopaedic Chapel Hill |
| Modified Lease |
| 6/29/2015 |
|
| 1.9 |
|
| 3.3 | |
|
| Chapel Hill, NC |
|
|
|
|
|
|
|
|
|
|
| Triangle Orthopaedic Roxboro |
| Modified Lease |
| 6/29/2015 |
|
| 1.3 |
|
| 2.1 | |
|
| Roxboro, NC |
|
|
|
|
|
|
|
|
|
|
Doctor's Park |
|
|
|
|
|
|
|
|
|
| ||
| Doctor's Park Building B |
| Modified Lease |
| 6/30/2015 |
|
| ― |
|
| 5.0 | |
|
| Chula Vista, CA ("San Diego") |
|
|
|
|
|
|
|
|
|
|
| Doctor's Park Building C |
| Modified Lease |
| 6/30/2015 |
|
| ― |
|
| 10.0 | |
|
| Chula Vista, CA ("San Diego") |
|
|
|
|
|
|
|
|
|
|
540 New Waverly Place |
| Modified Lease |
| 7/20/2015 |
|
| 6.9 |
|
| 15.0 | ||
|
| Cary, NC ("Raleigh") |
|
|
|
|
|
|
|
|
|
|
MedHelp |
| Modified Lease |
| 7/31/2015 |
|
| ― |
|
| 15.0 | ||
|
| Birmingham, AL |
|
|
|
|
|
|
|
|
|
|
Maryland MOBs |
|
|
|
|
|
|
|
|
|
| ||
| Patriot Professional Center |
| Modified Lease |
| 7/31/2015 |
|
| ― |
|
| 16.9 | |
|
| Frederick, MD ("Baltimore") |
|
|
|
|
|
|
|
|
|
|
| Liberty Professional Center |
| Modified Lease |
| 7/31/2015 |
|
| ― |
|
| 7.4 | |
|
| Frederick, MD ("Baltimore") |
|
|
|
|
|
|
|
|
|
|
Columbia MOBs |
|
|
|
|
|
|
|
|
|
| ||
| Broadway Medical Plaza 1 |
| Modified Lease |
| 8/21/2015 |
|
| ― |
|
| 10.7 | |
|
| Columbia, MO |
|
|
|
|
|
|
|
|
|
|
| Broadway Medical Plaza 2 |
| Modified Lease |
| 8/21/2015 |
|
| ― |
|
| 13.1 | |
|
| Columbia, MO |
|
|
|
|
|
|
|
|
|
|
| Broadway Medical Plaza 4 |
| Modified Lease |
| 8/21/2015 |
|
| ― |
|
| 14.2 | |
|
| Columbia, MO |
|
|
|
|
|
|
|
|
|
|
Center One |
| Modified Lease |
| 11/30/2015 |
|
| ― |
|
| 34.4 | ||
|
| Jacksonville, FL |
|
|
|
|
|
|
|
|
|
|
Red Bank Professional Office Building |
| Modified Lease |
| 12/14/2015 |
|
| ― |
|
| 10.6 | ||
|
| Cincinnati, OH |
|
|
|
|
|
|
|
|
|
|
Henderson NV MOBs |
|
|
|
|
|
|
|
|
|
| ||
| Siena Pavilion IV |
| Modified Lease |
| 12/18/2015 |
|
| ― |
|
| 7.0 | |
|
| Henderson, NV ("Las Vegas") |
|
|
|
|
|
|
|
|
|
|
| Siena Pavilion V |
| Modified Lease |
| 12/18/2015 |
|
| ― |
|
| 27.8 | |
|
| Henderson, NV ("Las Vegas") |
|
|
|
|
|
|
|
|
|
|
| Siena Pavilion VI |
| Modified Lease |
| 12/18/2015 |
|
| ― |
|
| 20.0 | |
|
| Henderson, NV ("Las Vegas") |
|
|
|
|
|
|
|
|
|
|
Post-Acute Care |
|
|
|
|
|
|
|
|
|
| ||
Perennial Communities |
|
|
|
|
|
|
|
|
|
| ||
| Batesville Healthcare Center |
| Triple-net Lease |
| 5/31/2013 |
|
| ― |
|
| 6.2 | |
|
| Batesville, AR |
|
|
|
|
|
|
|
|
|
|
| Broadway Healthcare Center |
| Triple-net Lease |
| 5/31/2013 |
|
| ― |
|
| 11.8 | |
|
| West Memphis, AR |
|
|
|
|
|
|
|
|
|
|
| Jonesboro Healthcare Center |
| Triple-net Lease |
| 5/31/2013 |
|
| ― |
|
| 15.2 | |
|
| Jonesboro, AR |
|
|
|
|
|
|
|
|
|
|
| Magnolia Healthcare Center |
| Triple-net Lease |
| 5/31/2013 |
|
| ― |
|
| 11.8 | |
|
| Magnolia, AR |
|
|
|
|
|
|
|
|
|
|
Name and Location |
| Structure |
| Date Acquired |
| Encumbrance at 12/31/17 (in millions) |
|
| Investment Amount (in millions) |
| ||
The Springs Alzheimer's Special Care Center |
| Managed |
| 3/28/2014 |
| $ | — |
|
| $ | 10.9 |
|
San Angelo, TX |
|
|
|
|
|
|
|
|
|
|
|
|
Isle at Watercrest - Bryan |
| Managed |
| 4/21/2014 |
| ― |
|
|
| 50.4 |
| |
Bryan, TX |
|
|
|
|
|
|
|
|
|
|
|
|
Isle at Watercrest - Mansfield |
| Managed |
| 5/5/2014 |
| ― |
|
|
| 31.3 |
| |
Mansfield, TX ("Dallas/Fort Worth") |
|
|
|
|
|
|
|
|
|
|
|
|
Watercrest at Mansfield |
| Managed |
| 6/30/2014 |
|
| 25.7 |
|
|
| 49.0 |
|
Mansfield, TX ("Dallas/Fort Worth") |
|
|
|
|
|
|
|
|
|
|
|
|
Watercrest at Katy (2) |
| Managed |
| 6/27/2014 |
|
| 26.3 |
|
|
| 37.2 |
|
Lubbock, TX |
|
|
|
|
|
|
|
|
|
|
|
|
HarborChase of Shorewood |
| Managed |
| 7/8/2014 |
|
| 14.7 |
|
|
| 23.8 |
|
Shorewood, WI ("Milwaukee") |
|
|
|
|
|
|
|
|
|
|
|
|
Fairfield Village of Layton |
| Managed |
| 11/20/2014 |
| ― |
|
|
| 68.0 |
| |
Layton, UT ("Salt Lake City") |
|
|
|
|
|
|
|
|
|
|
|
|
Fieldstone Memory Care |
| Managed |
| 3/31/2015 |
| ― |
|
|
| 12.4 |
| |
Yakima, WA |
|
|
|
|
|
|
|
|
|
|
|
|
Primrose III Communities |
|
|
|
|
|
|
|
|
|
|
|
|
Primrose Retirement Community of Anderson |
| Triple-net Lease |
| 5/29/2015 |
| ― |
|
|
| 21.1 |
| |
Anderson, IN ("Muncie") |
|
|
|
|
|
|
|
|
|
|
|
|
Primrose Retirement Community of Lancaster |
| Triple-net Lease |
| 5/29/2015 |
| ― |
|
|
| 25.7 |
| |
Lancaster, OH ("Columbus") |
|
|
|
|
|
|
|
|
|
|
|
|
Primrose Retirement Community of Wausau |
| Triple-net Lease |
| 5/29/2015 |
| ― |
|
|
| 20.3 |
| |
Wausau, WI ("Green Bay") |
|
|
|
|
|
|
|
|
|
|
|
|
Superior Residences of Panama City |
| Managed |
| 7/15/2015 |
| ― |
|
|
| 20.0 |
| |
Panama City Beach, FL |
|
|
|
|
|
|
|
|
|
|
|
|
Southeast Seniors Housing Communities |
|
|
|
|
|
|
|
|
|
|
|
|
Parc at Duluth |
| Managed |
| 7/31/2015 |
| ― |
|
|
| 52.8 |
| |
Duluth, GA ("Atlanta") |
|
|
|
|
|
|
|
|
|
|
|
|
Parc at Piedmont |
| Managed |
| 7/31/2015 |
| ― |
|
|
| 50.8 |
| |
Marietta, GA ("Atlanta") |
|
|
|
|
|
|
|
|
|
|
|
|
The Pavilion at Great Hills |
| Managed |
| 7/31/2015 |
| ― |
|
|
| 35.0 |
| |
Austin, TX |
|
|
|
|
|
|
|
|
|
|
|
|
The Hampton at Meadows Place |
| Managed |
| 7/31/2015 |
| ― |
|
|
| 28.4 |
| |
Meadows Place, TX ("Houston") |
|
|
|
|
|
|
|
|
|
|
|
|
The Beacon at Gulf Breeze |
| Managed |
| 7/31/2015 |
| ― |
|
|
| 28.0 |
| |
Gulf Breeze, FL ("Pensacola") |
|
|
|
|
|
|
|
|
|
|
|
|
Waterstone on Augusta |
| Managed |
| 8/31/2015 |
|
| 18.3 |
|
|
| 26.8 |
|
Greenville, SC |
|
|
|
|
|
|
|
|
|
|
|
|
Wellmore of Lexington |
| Triple-net Lease |
| 9/14/2015 |
|
| 33.4 |
|
|
| 53.7 |
|
Lexington, SC ("Columbia") |
|
|
|
|
|
|
|
|
|
|
|
|
Palmilla Senior Living |
| Managed |
| 9/30/2015 |
|
| 26.8 |
|
|
| 47.6 |
|
Albuquerque, NM |
|
|
|
|
|
|
|
|
|
|
|
|
Cedar Lake Assisted Living and Memory Care |
| Managed |
| 9/30/2015 |
| ― |
|
|
| 30.0 |
| |
Lake Zurich, IL ("Chicago") |
|
|
|
|
|
|
|
|
|
|
|
|
Fieldstone at Pear Orchard (3) |
| Managed |
| 10/15/2015 |
|
| 10.9 |
|
|
| 14.3 |
|
Yakima WA |
|
|
|
|
|
|
|
|
|
|
|
|
The Shores of Lake Phalen |
| Managed |
| 11/10/2015 |
| ― |
|
|
| 29.2 |
| |
Maplewood, MN ("St. Paul") |
|
|
|
|
|
|
|
|
|
|
|
|
The Dogwood Forest of Grayson |
| Managed |
| 11/24/2015 |
|
| 15.6 |
|
|
| 25.7 |
|
Grayson, GA |
|
|
|
|
|
|
|
|
|
|
|
|
Park Place Senior Living at WingHaven |
| Managed |
| 12/17/2015 |
| ― |
|
|
| 54.0 |
| |
O'Fallon, MO ("St Louis") |
|
|
|
|
|
|
|
|
|
|
|
|
Name and Location |
| Structure |
| Date Acquired |
| Encumbrance at 12/31/16 (in millions) |
| Investment Amount (in millions) | ||||
| Mine Creek Healthcare Center |
| Triple-net Lease |
| 5/31/2013 |
| $ | ― |
| $ | 3.4 | |
|
| Nashville, AR |
|
|
|
|
|
|
|
|
|
|
| Searcy Healthcare Center |
| Triple-net Lease |
| 5/31/2013 |
|
| ― |
|
| 7.9 | |
|
| Searcy, AR |
|
|
|
|
|
|
|
|
|
|
Medical Portfolio II Properties |
|
|
|
|
|
|
|
|
|
| ||
| Oklahoma City Inpatient Rehabilitation Hospital |
| Modified Lease |
| 7/15/2014 |
|
| 15.8 |
|
| 25.5 | |
|
| Oklahoma City, OK |
|
|
|
|
|
|
|
|
|
|
| Las Vegas Inpatient Rehabilitation Hospital |
| Modified Lease |
| 7/15/2014 |
|
| 13.8 |
|
| 22.3 | |
|
| Las Vegas, NV |
|
|
|
|
|
|
|
|
|
|
| South Bend Inpatient Rehabilitation Hospital |
| Modified Lease |
| 7/15/2014 |
|
| 12.6 |
|
| 20.2 | |
|
| Mishawaka, IN ("South Bend") |
|
|
|
|
|
|
|
|
|
|
Cobalt Rehabilitation Hospital Surprise |
| Triple-net Lease |
| 12/30/2015 |
|
| 15.4 |
|
| 23.7 | ||
|
| Surprise, AZ ("Phoenix") |
|
|
|
|
|
|
|
|
|
|
Cobalt Rehabilitation Hospital New Orleans |
| Triple-net Lease |
| 10/19/2016 |
|
| 19.5 |
|
| 28.6 | ||
|
| New Orleans, LA |
|
|
|
|
|
|
|
|
|
|
Seniors Housing |
|
|
|
|
|
|
|
|
|
| ||
Primrose I Communities |
|
|
|
|
|
|
|
|
|
| ||
| Primrose Retirement Community of Casper |
| Triple-net Lease |
| 2/16/2012 |
|
| 11.8 |
|
| 19.0 | |
|
| Casper, WY |
|
|
|
|
|
|
|
|
|
|
| Sweetwater Retirement Community |
| Triple-net Lease |
| 2/16/2012 |
|
| 10.2 |
|
| 16.3 | |
|
| Billings, MT |
|
|
|
|
|
|
|
|
|
|
| Primrose Retirement Community of Grand Island |
| Triple-net Lease |
| 2/16/2012 |
|
| 8.3 |
|
| 13.4 | |
|
| Grand Island, NE |
|
|
|
|
|
|
|
|
|
|
| Primrose Retirement Community of Mansfield |
| Triple-net Lease |
| 2/16/2012 |
|
| 11.3 |
|
| 18.3 | |
|
| Mansfield, OH |
|
|
|
|
|
|
|
|
|
|
| Primrose Retirement Community of Marion |
| Triple-net Lease |
| 2/16/2012 |
|
| 9.4 |
|
| 17.9 | |
|
| Marion, OH |
|
|
|
|
|
|
|
|
|
|
HarborChase of Villages Crossing |
| Managed |
| 8/29/2012 |
|
| ― |
|
| 19.7 | ||
|
| Lady Lake, FL ("The Villages") |
|
|
|
|
|
|
|
|
|
|
Primrose II Communities |
|
|
|
|
|
|
|
|
|
| ||
| Primrose Retirement Community of Lima |
| Triple-net Lease |
| 12/19/2012 |
|
| ― |
|
| 18.6 | |
|
| Lima, OH |
|
|
|
|
|
|
|
|
|
|
| Primrose Retirement Community of Zanesville |
| Triple-net Lease |
| 12/19/2012 |
|
| 11.7 |
|
| 19.1 | |
|
| Zanesville, OH ("Columbus") |
|
|
|
|
|
|
|
|
|
|
| Primrose Retirement Community of Decatur |
| Triple-net Lease |
| 12/19/2012 |
|
| 10.3 |
|
| 18.2 | |
|
| Decatur, IL |
|
|
|
|
|
|
|
|
|
|
| Primrose Retirement Community of Council Bluffs |
| Triple-net Lease |
| 12/19/2012 |
|
| ― |
|
| 12.9 | |
|
| Council Bluffs, IA ("Omaha") |
|
|
|
|
|
|
|
|
|
|
| Primrose Retirement Community Cottages |
| Triple-net Lease |
| 12/19/2012 |
|
| ― |
|
| 4.3 | |
|
| Aberdeen, SD |
|
|
|
|
|
|
|
|
|
|
Capital Health Communities |
|
|
|
|
|
|
|
|
|
| ||
| Brookridge Heights Assisted Living & Memory Care |
| Managed |
| 12/21/2012 |
|
| 5.9 |
|
| 13.5 | |
|
| Marquette, MI |
|
|
|
|
|
|
|
|
|
|
| Curry House Assisted Living & Memory Care |
| Managed |
| 12/21/2012 |
|
| 6.0 |
|
| 13.5 | |
|
| Cadillac, MI |
|
|
|
|
|
|
|
|
|
|
| Symphony Manor |
| Managed |
| 12/21/2012 |
|
| 11.7 |
|
| 24.0 | |
|
| Baltimore, MD |
|
|
|
|
|
|
|
|
|
|
| Woodholme Gardens Assisted Living & Memory Care |
| Managed |
| 12/21/2012 |
|
| 7.0 |
|
| 17.1 | |
|
| Pikesville, MD ("Baltimore") |
|
|
|
|
|
|
|
|
|
|
| Tranquillity at Fredericktowne |
| Managed |
| 12/21/2012 |
|
| 5.8 |
|
| 17.0 | |
|
| Frederick, MD |
|
|
|
|
|
|
|
|
|
|
Name and Location |
| Structure |
| Date Acquired |
| Encumbrance at 12/31/17 (in millions) |
|
| Investment Amount (in millions) |
| ||
Hearthside Senior Living of Collierville |
| Managed |
| 12/29/2015 |
| $ | — |
|
| $ | 17.0 |
|
Collierville, TN ("Memphis") |
|
|
|
|
|
|
|
|
|
|
|
|
Unimproved Land |
|
|
|
|
|
|
|
|
|
|
|
|
Albuquerque NM, Land Owner |
| Managed |
| 9/7/2017 |
| ― |
|
|
| 1.1 |
| |
Albuquerque, NM |
|
|
|
|
|
|
|
|
|
|
|
|
|
|
|
|
|
| $ | 1,038.8 |
|
| $ | 3,015.7 |
|
Name and Location |
| Structure |
| Date Acquired |
| Encumbrance at 12/31/16 (in millions) |
| Investment Amount (in millions) | ||||
HarborChase of Jasper |
| Managed |
| 8/1/2013 |
| $ | ― |
| $ | 7.3 | ||
|
| Jasper, AL |
|
|
|
|
|
|
|
|
|
|
South Bay I Communities |
|
|
|
|
|
|
|
|
|
| ||
| Raider Ranch |
| Managed |
| 8/29/2013 |
|
| ― |
|
| 72.0 | |
|
| Lubbock, TX |
|
|
|
|
|
|
|
|
|
|
| Town Village |
| Managed |
| 8/29/2013 |
|
| ― |
|
| 23.7 | |
|
| Oklahoma City, OK |
|
|
|
|
|
|
|
|
|
|
Pacific Northwest I Communities |
|
|
|
|
|
|
|
|
|
| ||
| MorningStar of Billings |
| Managed |
| 12/2/2013 |
|
| 19.2 |
|
| 48.3 | |
|
| Billings, MT |
|
|
|
|
|
|
|
|
|
|
| MorningStar of Boise |
| Managed |
| 12/2/2013 |
|
| 20.5 |
|
| 40.0 | |
|
| Boise, ID |
|
|
|
|
|
|
|
|
|
|
| MorningStar of Idaho Falls |
| Managed |
| 12/2/2013 |
|
| 17.5 |
|
| 44.4 | |
|
| Idaho Falls, ID |
|
|
|
|
|
|
|
|
|
|
| MorningStar of Sparks |
| Managed |
| 12/2/2013 |
|
| 23.2 |
|
| 55.2 | |
|
| Sparks, NV ("Reno") |
|
|
|
|
|
|
|
|
|
|
| Prestige Senior Living Arbor Place |
| Managed |
| 12/2/2013 |
|
| 8.0 |
|
| 15.8 | |
|
| Medford, OR |
|
|
|
|
|
|
|
|
|
|
| Prestige Senior Living Beaverton Hills |
| Managed |
| 12/2/2013 |
|
| 9.0 |
|
| 12.9 | |
|
| Beaverton, OR ("Portland") |
|
|
|
|
|
|
|
|
|
|
| Prestige Senior Living Five Rivers |
| Managed |
| 12/2/2013 |
|
| 7.5 |
|
| 16.7 | |
|
| Tillamook, OR |
|
|
|
|
|
|
|
|
|
|
| Prestige Senior Living High Desert |
| Managed |
| 12/2/2013 |
|
| 7.8 |
|
| 13.6 | |
|
| Bend, OR |
|
|
|
|
|
|
|
|
|
|
| Prestige Senior Living Huntington Terrace |
| Managed |
| 12/2/2013 |
|
| 10.0 |
|
| 15.0 | |
|
| Gresham, OR ("Portland") |
|
|
|
|
|
|
|
|
|
|
| Prestige Senior Living Orchard Heights |
| Managed |
| 12/2/2013 |
|
| 12.0 |
|
| 17.8 | |
|
| Salem, OR |
|
|
|
|
|
|
|
|
|
|
| Prestige Senior Living Riverwood |
| Managed |
| 12/2/2013 |
|
| 4.4 |
|
| 9.7 | |
|
| Tualatin, OR ("Portland") |
|
|
|
|
|
|
|
|
|
|
| Prestige Senior Living Southern Hills |
| Managed |
| 12/2/2013 |
|
| 7.3 |
|
| 12.9 | |
|
| Salem, OR |
|
|
|
|
|
|
|
|
|
|
Pacific Northwest II Communities |
|
|
|
|
|
|
|
|
|
| ||
| Prestige Senior Living Auburn Meadows |
| Managed |
| 2/3/2014 |
|
| 10.3 |
|
| 21.9 | |
|
| Auburn, WA ("Seattle") |
|
|
|
|
|
|
|
|
|
|
| Prestige Senior Living Bridgewood |
| Managed |
| 2/3/2014 |
|
| 12.8 |
|
| 22.1 | |
|
| Vancouver, WA ("Portland") |
|
|
|
|
|
|
|
|
|
|
| Prestige Senior Living Monticello Park |
| Managed |
| 2/3/2014 |
|
| 17.9 |
|
| 27.4 | |
|
| Longview, WA |
|
|
|
|
|
|
|
|
|
|
| Prestige Senior Living Rosemont |
| Managed |
| 2/3/2014 |
|
| 9.3 |
|
| 16.9 | |
|
| Yelm, WA |
|
|
|
|
|
|
|
|
|
|
| Prestige Senior Living West Hills |
| Managed |
| 3/3/2014 |
|
| 8.6 |
|
| 15.0 | |
|
| Corvallis, OR |
|
|
|
|
|
|
|
|
|
|
Wellmore of Tega Cay |
| Triple-net Leased |
| 2/7/2014 |
|
| ― |
|
| 32.2 | ||
|
| Tega Cay, SC ("Charlotte") |
|
|
|
|
|
|
|
|
|
|
Name and Location |
| Structure |
| Date Acquired | Encumbrance at 12/31/16 (in millions) | Investment Amount (in millions) | ||||
South Bay II Communities |
|
|
|
|
|
|
|
| ||
| Isle at Cedar Ridge |
| Managed |
| 2/28/2014 | $ | ― | $ | 22.0 | |
|
| Cedar Park, TX ("Austin") |
|
|
|
|
|
|
|
|
| HarborChase of Plainfield |
| Managed |
| 3/28/2014 |
| ― |
| 26.5 | |
|
| Plainfield, IL |
|
|
|
|
|
|
|
|
| Legacy Ranch Alzheimer's Special Care Center |
| Managed |
| 3/28/2014 |
| ― |
| 12.0 | |
|
| Midland, TX |
|
|
|
|
|
|
|
|
| The Springs Alzheimer's Special Care Center |
| Managed |
| 3/28/2014 |
| ― |
| 10.9 | |
|
| San Angelo, TX |
|
|
|
|
|
|
|
|
| Isle at Watercrest - Bryan |
| Managed |
| 4/21/2014 |
| ― |
| 22.5 | |
|
| Bryan, TX |
|
|
|
|
|
|
|
|
| Watercrest at Bryan |
| Managed |
| 4/21/2014 |
| ― |
| 28.0 | |
|
| Bryan, TX |
|
|
|
|
|
|
|
|
| Isle at Watercrest - Mansfield |
| Managed |
| 5/5/2014 |
| ― |
| 31.3 | |
|
| Mansfield, TX ("Dallas/Fort Worth") |
|
|
|
|
|
|
|
|
| Watercrest at Mansfield |
| Managed |
| 6/30/2014 |
| 26.2 |
| 49.0 | |
|
| Mansfield, TX ("Dallas/Fort Worth") |
|
|
|
|
|
|
|
|
Watercrest at Katy (2) |
| Managed |
| 6/27/2014 |
| 24.0 |
| 37.2 | ||
|
| Katy, TX ("Houston") |
|
|
|
|
|
|
|
|
HarborChase of Shorewood |
| Managed |
| 7/8/2014 |
| 14.8 |
| 23.8 | ||
|
| Shorewood, WI ("Milwaukee") |
|
|
|
|
|
|
|
|
Fairfield Village of Layton |
| Managed |
| 11/20/2014 |
| ― |
| 68.0 | ||
|
| Layton, UT ("Salt Lake City") |
|
|
|
|
|
|
|
|
Fieldstone Memory Care |
| Managed |
| 3/31/2015 |
| ― |
| 12.4 | ||
|
| Yakima, WA |
|
|
|
|
|
|
|
|
Primrose III Communities |
|
|
|
|
|
|
|
| ||
| Primrose Retirement Community of Anderson |
| Triple-net Lease |
| 5/29/2015 |
| ― |
| 21.1 | |
|
| Anderson, IN ("Muncie") |
|
|
|
|
|
|
|
|
| Primrose Retirement Community of Lancaster |
| Triple-net Lease |
| 5/29/2015 |
| ― |
| 25.7 | |
|
| Lancaster, OH ("Columbus") |
|
|
|
|
|
|
|
|
| Primrose Retirement Community of Wausau |
| Triple-net Lease |
| 5/29/2015 |
| ― |
| 20.3 | |
|
| Wausau, WI ("Green Bay") |
|
|
|
|
|
|
|
|
Superior Residences of Panama City |
| Managed |
| 7/15/2015 |
| ― |
| 20.0 | ||
|
| Panama City Beach, FL |
|
|
|
|
|
|
|
|
Southeast Seniors Housing Communities |
|
|
|
|
|
|
|
| ||
| Parc at Duluth |
| Triple-net Lease |
| 7/31/2015 |
| ― |
| 52.8 | |
|
| Duluth, GA ("Atlanta") |
|
|
|
|
|
|
|
|
| Parc at Piedmont |
| Triple-net Lease |
| 7/31/2015 |
| ― |
| 50.8 | |
|
| Marietta, GA ("Atlanta") |
|
|
|
|
|
|
|
|
| The Pavilion at Great Hills |
| Managed |
| 7/31/2015 |
| ― |
| 35.0 | |
|
| Austin, TX |
|
|
|
|
|
|
|
|
| The Hampton at Meadows Place |
| Managed |
| 7/31/2015 |
| ― |
| 28.4 | |
|
| Meadows Place, TX ("Houston") |
|
|
|
|
|
|
|
|
| The Beacon at Gulf Breeze |
| Managed |
| 7/31/2015 |
| ― |
| 28.0 | |
|
| Gulf Breeze, FL ("Pensacola") |
|
|
|
|
|
|
|
|
Palmilla Senior Living |
| Managed |
| 9/30/2015 |
| 27.0 |
| 47.6 | ||
|
| Albuquerque, NM |
|
|
|
|
|
|
|
|
Cedar Lake Assisted Living and Memory Care |
| Managed |
| 9/30/2015 |
| ― |
| 30.0 | ||
|
| Lake Zurich, IL ("Chicago") |
|
|
|
|
|
|
|
|
Fieldstone at Pear Orchard (3) |
| Managed |
| 10/15/2015 |
| 8.9 |
| 14.3 | ||
|
| Yakima WA |
|
|
|
|
|
|
|
|
The Shores of Lake Phalen |
| Managed |
| 11/10/2015 |
| ― |
| 29.3 | ||
|
| Maplewood, MN ("St. Paul") |
|
|
|
|
|
|
|
|
Park Place Senior Living at WingHaven |
| Managed |
| 12/17/2015 |
| ― |
| 54.0 | ||
|
| O'Fallon, MO ("St. Louis") |
|
|
|
|
|
|
|
|
Hearthside Senior Living of Collierville |
| Managed |
| 12/29/2015 |
| ― |
| 17.0 | ||
|
| Collierville, TN ("Memphis") |
|
|
|
|
|
|
|
|
|
|
|
|
|
|
| $ | 914.4 | $ | 2,883.4 |
Name and Location |
| Structure |
| Date Acquired | Encumbrance at 12/31/16 (in millions) | Investment Amount (in millions) | ||||
Developments (4) |
|
|
|
|
|
|
|
| ||
Welbrook Senior Living Grand Junction (5) |
| Development |
| 9/4/2015 | $ | ― | $ | 12.9 | ||
|
| Grand Junction, CO |
|
|
|
|
|
|
|
|
Waterstone on Augusta (6) |
| Development |
| 8/31/2015 |
| 12.7 |
| 24.2 | ||
|
| Greenville, SC |
|
|
|
|
|
|
|
|
Wellmore of Lexington |
| Development |
| 9/14/2015 |
| 13.5 |
| 39.0 | ||
|
| Lexington, SC |
|
|
|
|
|
|
|
|
Dogwood Forest of Grayson |
| Development |
| 11/24/2015 |
| 3.4 |
| 17.3 | ||
|
| Grayson, GA |
|
|
|
|
|
|
|
|
Expansion Projects (7) |
|
|
|
|
|
|
|
| ||
Capital Health Communities |
|
|
|
|
|
|
|
| ||
| Brookridge Heights Assisted Living and Memory Care |
| Expansion |
| 12/21/2012 |
| ― |
| 2.4 | |
|
| Marquette, MI |
|
|
|
|
|
|
|
|
| Tranquillity at Fredericktowne |
| Expansion |
| 12/21/2012 |
| ― |
| 1.4 | |
|
| Fredrick, MD |
|
|
|
|
|
|
|
|
|
|
|
|
|
|
| $ | 944.0 | $ | 2,980.6 |
_________________
FOOTNOTES:
(1) | Property owned through a consolidated joint venture in which we hold a 90% controlling interest. |
(2) | Property owned through a consolidated joint venture in which we hold a 95% controlling interest. |
(3) | Property owned through a consolidated joint venture in which we hold a 75% controlling interest. |
|
|
|
|
|
|
|
|
As of December 31, 2016,2017, through an unconsolidated joint venture (“JV”), we had investments in five real estate properties. The following tables set forth details on the property holdings of our JV:
Name | Name |
| Structure |
| Date Acquired |
| Encumbrance at December 31, 2016 (in millions) |
| Investment Amount (in millions) |
| Structure |
| Date Acquired |
| Encumbrance at 12/31/17 (in millions) |
|
| Investment Amount (in millions) |
| |||||
Seniors Housing | Seniors Housing |
|
|
|
|
|
|
|
|
|
|
|
|
|
|
|
|
|
|
|
|
|
| |
Windsor Manor I Communities - 75% JV Interest | Windsor Manor I Communities - 75% JV Interest |
|
|
|
|
|
|
|
|
|
|
|
|
|
|
|
|
|
|
|
|
| ||
Windsor Manor of Vinton |
| Managed |
| 8/31/2012 |
| $ | 3.0 |
|
| $ | 5.8 |
| ||||||||||||
Vinton, IA |
|
|
|
|
|
|
|
|
|
|
|
| ||||||||||||
Windsor Manor of Webster City |
| Managed |
| 8/31/2012 |
|
| 2.8 |
|
|
| 6.8 |
| ||||||||||||
Webster City, IA |
|
|
|
|
|
|
|
|
|
|
|
| ||||||||||||
Windsor Manor of Nevada |
| Managed |
| 8/31/2012 |
|
| 6.2 |
|
|
| 6.3 |
| ||||||||||||
Nevada, IA |
|
|
|
|
|
|
|
|
|
|
|
| ||||||||||||
Windsor Manor II Communities - 75% JV Interest |
|
|
|
|
|
|
|
|
|
|
|
| ||||||||||||
Windsor Manor of Indianola |
| Managed |
| 4/2/2013 |
|
| 2.4 |
|
|
| 5.7 |
| ||||||||||||
Indianola, IA |
|
|
|
|
|
|
|
|
|
|
|
| ||||||||||||
Windsor Manor of Grinnell |
| Managed |
| 4/2/2013 |
|
| 5.9 |
|
|
| 6.5 |
| ||||||||||||
Grinnell, IA |
|
|
|
|
|
|
|
|
|
|
|
| ||||||||||||
| Windsor Manor of Vinton |
| Managed |
| 8/31/2012 |
| $ | 3.1 |
| $ | 5.8 |
|
|
|
|
| $ | 20.3 |
|
| $ | 31.1 |
| |
|
| Vinton, IA |
|
|
|
|
|
|
|
|
| |||||||||||||
| Windsor Manor of Webster City |
| Managed |
| 8/31/2012 |
|
| 2.8 |
| 6.8 | ||||||||||||||
|
| Webster City, IA |
|
|
|
|
|
|
|
|
| |||||||||||||
| Windsor Manor of Nevada |
| Managed |
| 8/31/2012 |
|
| 6.3 |
| 6.3 | ||||||||||||||
|
| Nevada, IA |
|
|
|
|
|
|
|
|
| |||||||||||||
Windsor Manor II Communities - 75% JV Interest |
|
|
|
|
|
|
|
|
| |||||||||||||||
| Windsor Manor of Indianola |
| Managed |
| 4/2/2013 |
|
| 2.5 |
| 5.7 | ||||||||||||||
|
| Indianola, IA |
|
|
|
|
|
|
|
|
| |||||||||||||
| Windsor Manor of Grinnell |
| Managed |
| 4/2/2013 |
|
| 6.1 |
| 6.5 | ||||||||||||||
|
| Grinnell, IA |
|
|
|
|
|
|
|
|
|
| ||||||||||||
|
|
|
|
|
|
|
| $ | 20.8 |
| $ | 31.1 | ||||||||||||
From time to time, we may be a party to legal proceedings in the ordinary course of, or incidental to the normal course of, our business, including proceedings to enforce our contractual or statutory rights. While we cannot predict the outcome of these legal proceedings with certainty, based upon currently available information, we do not believe the final outcome of any pending or threatened legal proceeding will have a material adverse effect on our results of operations or financial condition.
None.
Item 5. | Market for Registrant’s Common Equity, Related Stockholder Matters and Issuer Purchases of Equity Securities |
Market Information
There is no established public trading market for our common stock. Therefore, there is a risk that a stockholder may not be able to sell shares at a time or price acceptable to the stockholder, or at all. Unless and until our shares are listed on a national securities exchange, it is not expected that a public market for the shares will develop.
In August 2013, we adopted a valuation policy consistent with the IPA Valuation Guideline. The valuation process used by the Valuation Committee and the board of directors to determine the estimated NAV per share was designed to follow recommendations in the IPA Valuation Guideline and our valuation policy. In accordance with our valuation policy and in order to assist brokers in providing information on customer account statements consistent with the requirements of NASD Notice 01-08 and FINRA Rule 2340, we, based on the recommendation of the Valuation Committee and the approval of the board of directors, engaged CBRE Cap to assist us and the board of directors in determining the estimated NAV per share of our common stock as of December 31, 2016.2017.
Stockholder Information
As of December 31, 2016,2017, we had 47,09846,107 stockholders of record. The number of stockholders is based on the records of DST Systems, Inc., who serves as our transfer agent.
Stock Valuation
During the year ended December 31, 2016,2017, the Valuation Committee initiated a process to estimate our NAV per share and engaged CBRE Cap to provide a report containing, among other things, a range for the estimated NAV per share of our common stock (“Valuation Report”). The Valuation Committee, upon its receipt and review of the Valuation Report, concluded that the range of between $9.53$9.79 and $10.56$10.81 for our estimated NAV per share proposed in CBRE Cap’s Valuation Report was reasonable, and recommended to our board of directors that it adopt $10.04$10.32 as the estimated NAV per share of our common stock.stock, which includes deductions for estimated transaction costs. At a special meeting of our board of directors held on February 11, 2017,7, 2018, the board of directors accepted the recommendation of the Valuation Committee and approved $10.32 as the estimated NAV per share of our common stock as of December 31, 2017. This represented an increase from our previously approved $10.04 as the estimated NAV per share of our common stock as of December 31, 2016. This represented an increase from our previously approved $9.75 as the estimated NAV per share of our common stock as of December 31, 2015.
Refer to our Form 8-K filed on February 13, 201712, 2018 for additional details on the estimated NAV per share, valuation methodologies, material assumptions, limitations and engagement of CBRE Cap.
We have adopted a redemption plan that allows our stockholders who hold shares for at least one year to request that we redeem between 25% and 100% of their shares. If we have sufficient funds available to do so and if we choose, in our sole discretion, to redeem shares, the number of shares we may redeem in any calendar year and the price at which they are redeemed are subject to conditions and limitations, including:
If we elect to redeem shares, some or all of the proceeds from the sale of shares under our distribution Reinvestment Plan attributable to any quarter may be used to redeem shares presented for redemption during such quarter. In addition, we may use the unused amount of any offering proceeds available for use in future quarters to the extent not used to invest in assets or for other purposes;quarter;
No more than 5% of the weighted average number of shares of our common stock outstanding during such 12-month period may be redeemed during such 12-month period; and
Redemption pricing shall be at the Company’s then-current NAV per share as published from time to time in our Annual Report on Form 10-K, Quarterly Report on Form 10-Q or Current Report on Form 8-K, provided, however, that the price shall not exceed an amount equal to the lesser of (i) the then-current public offering price forestimated NAV per share of our shares of common stock;stock and (ii) the purchase price paid by the stockholder.
Our board of directors has the ability, in theirits sole discretion, to amend or suspend the redemption plan or to waive any specific conditions if it is deemed to be in our best interest.
During the year ended December 31, 2017, we received requests for the redemption of common stock totaling approximately $47.3 million, of which approximately $11.7 million was payable as of December 31, 2017 and paid in 2018. During the year ended December 31, 2016, we received requests for the redemption of common stock totaling approximately $36.2 million, of which approximately $10.4 million was payable as of December 31, 2016 and paid in 2017. During the year ended December 31, 2015, we received requests for the redemption of common stock totaling approximately $9.3 million, of which approximately $2.7 million was payable as of December 31, 2015 and paid in 2016. During
The redemption requests received during the year ended December 31, 2014, we2017 exceeded proceeds received requestsfrom our Reinvestment Plan by approximately $4.1 million, however, our board of directors approved the excess redemptions. There is no guarantee that any funds will be set aside under the Reinvestment Plan or otherwise made available for the redemption plan during any period during which redemptions may be requested.
We are not obligated to redeem shares under our redemption plan. Our board of common stock totaling approximately $3.0 million,directors will continue to evaluate the aggregate amount of funds that will be used to redeem shares pursuant to the redemption plan on a quarterly basis and will determine the amount of shares to be redeemed based on what it believes to be in the best interest of the Company and our stockholders as the redemption of shares dilutes the amount of cash available for other corporate purposes. The aggregate amount of funds may be less than, or may exceed, the aggregate proceeds received through our Reinvestment Plan.
In the event there are insufficient funds to redeem all of the shares for which approximately $0.9 million was payableredemption requests have been submitted, and we have determined to redeem shares, we will redeem pending requests in the following order:
pro rata as of December 31, 2014to redemptions sought upon a stockholder’s death;
pro rata as to redemptions sought by stockholders with a qualifying disability or by stockholders who have been confined to a long-term care facility;
pro rata as to redemptions sought by stockholders subject to bankruptcy;
pro rata as to redemptions that would result in a stockholder owning less than 100 shares; and paid
pro rata as to all other redemption requests.
With respect to a stockholder whose shares are not redeemed due to insufficient funds in 2015.that quarter, the redemption request will be retained by us unless it is withdrawn by the stockholder, and such shares will be redeemed in subsequent quarters as funds become available and before any subsequently received redemption requests are honored, subject to the priority for redemption requests listed above. Until such time as the Company redeems the shares, a stockholder may withdraw its redemption request as to any remaining shares not redeemed. Redeemed shares are considered retired and will not be reissued.
The following tables present a summary of requests received and shares redeemed pursuant to our stock redemption plan during the quarters and years ended December 31, 2017, 2016 and 2015 and 2014:(in thousands, except per share data):
2017 Quarters |
| First |
|
| Second |
|
| Third |
|
| Fourth |
|
| Total |
| |||||||||||||||
Redemptions requested |
|
| 1,088 |
|
|
| 1,072 |
|
|
| 1,408 |
|
|
| 1,172 |
|
|
| 4,740 |
| ||||||||||
Shares redeemed |
|
| (1,088 | ) |
|
| (1,072 | ) |
|
| (1,408 | ) |
|
| (1,172 | ) |
|
| (4,740 | ) | ||||||||||
Pending redemption requests |
| ― |
|
| ― |
|
| ― |
|
| ― |
|
| ― |
| |||||||||||||||
Average price paid per share |
| $ | 9.99 |
|
| $ | 9.97 |
|
| $ | 9.99 |
|
| $ | 9.99 |
|
| $ | 9.99 |
| ||||||||||
|
|
|
|
|
|
|
|
|
|
|
|
|
|
|
|
|
|
|
|
| ||||||||||
2016 Quarters |
| First |
| Second |
| Third |
| Fourth |
| Total |
| First |
|
| Second |
|
| Third |
|
| Fourth |
|
| Total |
| |||||
Redemptions requested |
| 276,777 |
| 1,528,751 |
| 851,234 |
| 1,068,134 |
| 3,724,896 |
|
| 277 |
|
|
| 1,529 |
|
|
| 850 |
|
|
| 1,069 |
|
|
| 3,725 |
|
Shares redeemed |
| (276,777) |
| (1,528,751) |
| (851,234) |
| (1,068,134) |
| (3,724,896) |
|
| (277 | ) |
|
| (1,529 | ) |
|
| (850 | ) |
|
| (1,069 | ) |
|
| (3,725 | ) |
Pending redemption requests |
| ― |
| ― |
| ― |
| ― |
| ― |
| ― |
|
| ― |
|
| ― |
|
| ― |
|
| ― |
| |||||
Average price paid per share |
| $9.73 |
| $9.73 |
| $9.73 |
| $9.73 |
| $9.73 |
| $ | 9.73 |
|
| $ | 9.73 |
|
| $ | 9.73 |
|
| $ | 9.73 |
|
| $ | 9.73 |
|
|
|
|
|
|
|
|
|
|
|
|
|
|
|
|
|
|
|
|
|
|
|
|
|
|
|
|
|
|
|
|
2015 Quarters |
| First |
| Second |
| Third |
| Fourth |
| Total |
| First |
|
| Second |
|
| Third |
|
| Fourth |
|
| Total |
| |||||
Redemptions requested |
| 204,184 |
| 195,873 |
| 292,429 |
| 286,145 |
| 978,631 |
|
| 204 |
|
|
| 196 |
|
|
| 292 |
|
|
| 286 |
|
|
| 978 |
|
Shares redeemed |
| (204,184) |
| (195,873) |
| (292,429) |
| (286,145) |
| (978,631) |
|
| (204 | ) |
|
| (196 | ) |
|
| (292 | ) |
|
| (286 | ) |
|
| (978 | ) |
Pending redemption requests |
| ― |
| ― |
| ― |
| ― |
| ― |
| ― |
|
| ― |
|
| ― |
|
| ― |
|
| ― |
| |||||
Average price paid per share |
| $9.51 |
| $9.51 |
| $9.51 |
| $9.51 |
| $9.51 |
| $ | 9.51 |
|
| $ | 9.51 |
|
| $ | 9.51 |
|
| $ | 9.51 |
|
| $ | 9.51 |
|
|
|
|
|
|
|
|
|
|
|
| ||||||||||||||||||||
2014 Quarters |
| First |
| Second |
| Third |
| Fourth |
| Total | ||||||||||||||||||||
Redemptions requested |
| 28,343 |
| 75,313 |
| 129,022 |
| 91,641 |
| 324,319 | ||||||||||||||||||||
Shares redeemed |
| (28,343) |
| (75,313) |
| (129,022) |
| (91,641) |
| (324,319) | ||||||||||||||||||||
Pending redemption requests |
| ― |
| ― |
| ― |
| ― |
| ― | ||||||||||||||||||||
Average price paid per share |
| $9.13 |
| $9.13 |
| $9.13 |
| $9.51 |
| $9.24 | ||||||||||||||||||||
Issuer Purchases of Equity Securities
The following tables presents details regarding our repurchasesrepurchase of securities under our redemption plan between October 1, 20162017 and December 31, 2016:2017 (in thousands, except per share data):
Period |
| Total number of shares purchased |
| Average price paid per share |
| Total number of shares purchased under the plan |
| Maximum number of shares that may yet be purchased under the plan (1) |
October 1, 2016 through October 31, 2016 |
| ― |
| ― |
| ― |
| 4,542,817 |
November 1, 2016 through November 30, 2016 |
| ― |
| ― |
| ― |
| 4,650,148 |
December 1, 2016 through December 31, 2016 |
| 1,068,134 |
| $9.73 |
| 1,068,134 |
| 3,965,287 |
Total |
| 1,068,134 |
| $9.73 |
| 1,068,134 |
|
|
Period |
| Total number of shares purchased |
|
| Average price paid per share |
|
| Total number of shares purchased under the plan |
|
| Maximum number of shares that may yet be purchased under the plan (1) |
| ||||
October 1, 2017 through October 31, 2017 |
| ― |
|
| ― |
|
| ― |
|
|
| 4,117 |
| |||
November 1, 2017 through November 30, 2017 |
| ― |
|
| ― |
|
| ― |
|
|
| 4,117 |
| |||
December 1, 2017 through December 31, 2017 |
|
| 1,172 |
|
| $ | 9.99 |
|
|
| 1,172 |
|
|
| 4,016 |
|
Total |
|
| 1,172 |
|
| $ | 9.99 |
|
|
| 1,172 |
|
|
|
|
|
____________
FOOTNOTE:
(1) | This represents the maximum number of shares which can be redeemed under the redemption plan and is subject to a five percent limitation in a rolling 12-month period as described above. However, we are not obligated to redeem such amounts and this does not take into account the amount the board of directors has determined to redeem or whether there are sufficient proceeds under the redemption plan. Under the redemption plan, we can, at our discretion, use the full amount of the proceeds from the sale of shares under our Reinvestment Plan attributable to any month to redeem shares presented for redemption during such month. Any amount of proceeds from our Reinvestment Plan, which is available for redemptions but which is unused, may be carried over to the next succeeding calendar quarter for use in addition to the amount of proceeds from our Reinvestment Plan that would otherwise be available for redemptions. |
Distributions to our stockholders are governed by the provisions of our articles of incorporation. We intend to continue paying distributions to our stockholders on a quarterly basis until such provisions are terminated or amended by our board of directors. The amount or basis of distributions declared to our stockholders will be determined by our board of directors and is dependent upon a number of factors, including:
Sources of cash available for distribution such as current year and inception to date cumulative cash flows from operating activities, funds from operations (“FFO”)FFO and modified funds from operations (“MFFO”),MFFO, as well as expected future long-term stabilized cash flows, FFO and MFFO;
The proportion of distributions paid in cash compared to the amount being reinvested through our Reinvestment Plan;
Limitations and restrictions contained in the terms of our current and future indebtedness concerning the payment of distributions; and
Other factors, including but not limited to, the avoidance of distribution volatility, our objective of continuing to qualify as a REIT, capital requirements, the general economic environment and other factors.
For the years ended December 31, 2017, 2016 2015 and 2014,2015, we declared cash distributions of approximately $77.7 million, $74.0 million $63.2 million and $31.9$63.2 million, respectively. Of these amounts, approximately $31.4$34.5 million, $26.4$31.5 million and $14.2$26.4 million, respectively, were paid in cash to stockholders and approximately $43.2 million, $42.6 million $36.8 million and $17.7$36.8 million, respectively, were reinvested pursuant to our Reinvestment Plan. In addition, for the yearsyear ended December 31, 2015 and 2014, we declared and made stock distributions of approximately 3.2 million and 2.4 million shares of common stock, respectively. stock.
The table in Item 7. “Management’s Discussion and Analysis of Financial Condition and Results of Operations” presents total cash distributions declared and issued, including distributions reinvested in additional shares through our Reinvestment Plan, and cash flows provided by operating activities for each quarter in the years ended December 31, 2017, 2016 2015 and 2014.2015.
The following table details our historical share prices in our Offerings, including the prices pursuant to the Reinvestment Plan and our monthly cash and stock distributions per share:share (in thousands, except per share data):
Period |
| Price per Share (1) |
| Reinvestment Plan Price per Share |
| Monthly Cash Distributions |
| Monthly Stock Distributions |
| Price per Share (1) |
|
| Reinvestment Plan Price per Share |
|
| Monthly Cash Distributions |
|
| Monthly Stock Distributions |
| |||||||
June 27, 2011 through December 10, 2013 |
| $ | 10.00 |
| $ | 9.50 |
| $ | 0.0333 |
| 0.0025 |
| $ | 10.00 |
|
| $ | 9.50 |
|
| $ | 0.0333 |
|
|
| 0.0025 |
|
December 11, 2013 through November 3, 2014 |
| $ | 10.14 |
| $ | 9.64 |
| $ | 0.0338 |
| 0.0025 |
| $ | 10.14 |
|
| $ | 9.64 |
|
| $ | 0.0338 |
|
|
| 0.0025 |
|
November 4, 2014 through February 11, 2016 |
| $ | 10.58 |
| $ | 10.06 |
| $ | 0.0353 |
| (2) |
| $ | 10.58 |
|
| $ | 10.06 |
|
| $ | 0.0353 |
|
|
| (2 | ) |
February 12, 2016 through February 13, 2017 |
| $ | 9.75 |
| $ | 9.75 |
| $ | 0.0353 |
| ― |
| $ | 9.75 |
|
| $ | 9.75 |
|
| $ | 0.0353 |
|
| ― |
| |
February 14, 2017 through the date of this filing |
| $ | 10.04 |
| $ | 10.04 |
| $ | 0.0353 |
| ― | ||||||||||||||||
February 14, 2017 through February 12, 2018 |
| $ | 10.04 |
|
| $ | 10.04 |
|
| $ | (3 | ) |
| ― |
| ||||||||||||
February 13, 2018 through the date of this filing |
| $ | 10.32 |
|
| $ | 10.32 |
|
| $ | 0.0388 |
|
| ― |
| ||||||||||||
____________
FOOTNOTES:
(1) | Price per share represents the then-current primary offering price per share through the close of our Offerings on September 30, 2015. Subsequently, as we are no longer offering shares in a public offering, price per share represents the estimated NAV per share as determined by our board of directors. |
| We closed our Offerings on September 30, 2015 and discontinued our stock distributions concurrently. The monthly stock distributions from November 4, 2014 through September 30, 2015 were 0.0025 per share. |
(3) | In September 2017, our board of directors approved an increase in our monthly cash distribution, from $0.03527 to $0.0388 per share, effective for the third quarter of 2017. |
The tax composition of our distributions declared for years ended December 31, 2017, 2016 2015 and 20142015 were as follows:
|
| December 31, |
| Years Ended December 31, |
| |||||||||||||
|
| 2016 |
| 2015 |
| 2014 |
| 2017 |
|
| 2016 |
|
| 2015 |
| |||
Ordinary income |
| 21.5% |
| 37.8% |
| 30.8% |
|
| 0.0 | % |
|
| 21.5 | % |
|
| 37.8 | % |
Capital gain |
| 14.4% |
| 0.0% |
| 0.0% |
|
| 0.0 | % |
|
| 14.4 | % |
|
| 0.0 | % |
Unrecaptured Sec. 1250 gain |
| 1.2% |
| 0.0% |
| 0.0% |
|
| 0.0 | % |
|
| 1.2 | % |
|
| 0.0 | % |
Return of capital |
| 62.9% |
| 62.2% |
| 69.2% |
|
| 100.0 | % |
|
| 62.9 | % |
|
| 62.2 | % |
Due to a variety of factors, the characterization of distributions declared for the year ended December 31, 20162017 may not be indicative of the characterization of distributions that may be expected for the year ending December 31, 2017. No amounts distributed to stockholders for the years ended December 31, 2016, 2015 and 2014 were required to be or have been treated as return of capital for purposes of calculating the stockholders’ return on their invested capital as described in our advisory agreement.2018. In determining the apportionment between taxable income and return of capital, the amounts distributed to stockholders (other than amounts designated as capital gains dividends) in excess of current or accumulated E&P are treated as a return of capital to the stockholders. E&P is a statutory calculation which is derived from net income and determined in accordance with the Code. It is not intended to be a measure of the REIT’s performance, nor do we consider it to be an absolute measure or indicator of our source or ability to pay distributions to stockholders. No amounts distributed to stockholders for the years ended December 31, 2017, 2016 and 2015 were required to be or have been treated as return of capital for purposes of calculating the stockholders’ return on their invested capital as described in our advisory agreement.
Unregistered Sales of Equity Securities
None.
Securities Authorized for Issuance under Equity Compensation Plans
None.
Secondary Sales of Registered Shares between Investors
During years ended December 31, 2017, 2016 and 2015, there were 25,522 shares, 10,864 shares and 2,677 shares, respectively, transferred by investors at a weighted average sales price of $8.25 per share, $9.33 per share and $8.60 per share, respectively. We are not aware of any other trades of our shares, other than previous purchases made in our Offerings and redemptions of shares by us.
The following selected financial data for the Company should be read in conjunction with Item 7. “Management’s Discussion and Analysis of Financial Condition and Results of Operations” and Item 8. “Financial Statements and Supplementary Data” (in thousands, except per share data):
|
| Years Ended December 31, |
| Years Ended December 31, |
| ||||||||||||||||||||||||||||||
|
| 2016 |
| 2015 |
| 2014 |
| 2013 |
| 2012 |
| 2017 |
|
| 2016 |
|
| 2015 |
|
| 2014 |
|
| 2013 |
| ||||||||||
Operating Data: | Operating Data: |
|
|
|
|
|
|
|
|
|
|
|
|
|
|
|
|
|
|
|
|
|
|
|
|
|
|
|
|
|
|
|
|
|
|
Total revenues |
| $ | 398,416 |
|
| $ | 377,055 |
|
| $ | 300,525 |
|
| $ | 181,084 |
|
| $ | 52,605 |
| |||||||||||||||
Operating income (loss) |
|
| 31,055 |
|
|
| 11,147 |
|
|
| (24,308 | ) |
|
| (23,178 | ) |
|
| (13,990 | ) | |||||||||||||||
Net loss attributable to common stockholders |
|
| (25,962 | ) |
|
| (31,667 | ) |
|
| (68,055 | ) |
|
| (52,511 | ) |
|
| (18,100 | ) | |||||||||||||||
Net loss per share |
|
| (0.15 | ) |
|
| (0.18 | ) |
|
| (0.44 | ) |
|
| (0.61 | ) |
|
| (0.42 | ) | |||||||||||||||
Weighted average shares outstanding (basic and diluted) (1) |
|
| 175,151 |
|
|
| 175,121 |
|
|
| 153,804 |
|
|
| 85,710 |
|
|
| 43,450 |
| |||||||||||||||
Cash distributions declared and paid (2) |
|
| 77,732 |
|
|
| 74,008 |
|
|
| 63,201 |
|
|
| 31,919 |
|
|
| 14,170 |
| |||||||||||||||
Cash distributions declared and paid per share |
|
| 0.44 |
|
|
| 0.42 |
|
|
| 0.41 |
|
|
| 0.37 |
|
|
| 0.33 |
| |||||||||||||||
Cash provided by operating activities (3) |
|
| 75,246 |
|
|
| 74,531 |
|
|
| 43,517 |
|
|
| 19,272 |
|
|
| 3,846 |
| |||||||||||||||
Cash used in investing activities (3) |
|
| (64,545 | ) |
|
| (99,443 | ) |
|
| (951,227 | ) |
|
| (917,744 | ) |
|
| (641,563 | ) | |||||||||||||||
Cash provided by (used in) financing activities (3) |
|
| (7,248 | ) |
|
| 16,941 |
|
|
| 884,811 |
|
|
| 953,532 |
|
|
| 665,893 |
| |||||||||||||||
Other Data: |
|
|
|
|
|
|
|
|
|
|
|
|
|
|
|
|
|
|
|
| |||||||||||||||
FFO (4) |
|
| 82,247 |
|
|
| 76,560 |
|
|
| 44,059 |
|
|
| 10,797 |
|
|
| (3,054 | ) | |||||||||||||||
FFO per share |
|
| 0.47 |
|
|
| 0.44 |
|
|
| 0.29 |
|
|
| 0.13 |
|
|
| (0.07 | ) | |||||||||||||||
MFFO (4) |
|
| 82,446 |
|
|
| 74,008 |
|
|
| 63,484 |
|
|
| 32,017 |
|
|
| 12,581 |
| |||||||||||||||
MFFO per share |
|
| 0.47 |
|
|
| 0.42 |
|
|
| 0.41 |
|
|
| 0.37 |
|
|
| 0.29 |
| |||||||||||||||
| Total revenues | $ | 377,055 |
| $ | 300,525 |
| $ | 181,084 |
| 52,605 |
| $ | 7,385 |
|
|
|
|
|
|
|
|
|
|
|
|
|
|
|
|
|
|
|
| |
| Operating income (loss) |
| 11,147 |
| (24,308) |
| (23,178) |
| (13,990) |
| (6,043) |
| As of December 31, |
| |||||||||||||||||||||
| Net loss attributable to common stockholders |
| (31,667) |
| (68,055) |
| (52,511) |
| (18,100) |
| (10,720) |
| 2017 |
|
| 2016 |
|
| 2015 |
|
| 2014 |
|
| 2013 |
| |||||||||
| Net loss per share |
| (0.18) |
| (0.44) |
| (0.61) |
| (0.42) |
| (0.69) | ||||||||||||||||||||||||
| Weighted average shares outstanding (basic and diluted) (1) |
| 175,121 |
| 153,804 |
| 85,710 |
| 43,450 |
| 15,452 | ||||||||||||||||||||||||
| Cash distributions declared and paid (2) |
| 74,008 |
| 63,201 |
| 31,919 |
| 14,170 |
| 3,197 | ||||||||||||||||||||||||
| Cash distributions declared and paid per share |
| 0.42 |
| 0.41 |
| 0.37 |
| 0.33 |
| 0.21 | ||||||||||||||||||||||||
| Cash provided by (used in) operating activities |
| 73,404 |
| 43,517 |
| 19,272 |
| 3,046 |
| (6,369) | ||||||||||||||||||||||||
| Cash used in investing activities |
| (101,877) |
| (950,761) |
| (925,658) |
| (643,792) |
| (315,647) | ||||||||||||||||||||||||
| Cash provided by financing activities |
| 18,068 |
| 884,811 |
| 953,532 |
| 666,693 |
| 330,276 | ||||||||||||||||||||||||
Other Data: |
|
|
|
|
|
|
|
|
|
| |||||||||||||||||||||||||
| FFO (3) |
| 76,560 |
| 44,059 |
| 10,797 |
| (3,054) |
| (6,242) | ||||||||||||||||||||||||
| FFO per share |
| 0.44 |
| 0.29 |
| 0.13 |
| (0.07) |
| (0.40) | ||||||||||||||||||||||||
| MFFO (3) |
| 74,008 |
| 63,484 |
| 32,017 |
| 12,581 |
| 797 | ||||||||||||||||||||||||
| MFFO per share |
| 0.42 |
| 0.41 |
| 0.37 |
| 0.29 |
| 0.05 | ||||||||||||||||||||||||
Balance Sheet Data: |
|
|
|
|
|
|
|
|
|
|
|
|
|
|
|
|
|
|
|
| |||||||||||||||
Total real estate assets, net |
| $ | 2,488,085 |
|
| $ | 2,516,979 |
|
| $ | 2,514,059 |
|
| $ | 1,704,653 |
|
| $ | 866,200 |
| |||||||||||||||
Intangibles, net |
|
| 99,512 |
|
|
| 130,609 |
|
|
| 172,452 |
|
|
| 140,264 |
|
|
| 52,400 |
| |||||||||||||||
Cash |
|
| 64,522 |
|
|
| 58,517 |
|
|
| 68,922 |
|
|
| 91,355 |
|
|
| 44,209 |
| |||||||||||||||
Total assets |
|
| 2,793,541 |
|
|
| 2,827,692 |
|
|
| 2,831,169 |
|
|
| 1,977,209 |
|
|
| 1,007,285 |
| |||||||||||||||
Mortgage and other notes payable, net |
|
| 1,032,153 |
|
|
| 936,723 |
|
|
| 831,825 |
|
|
| 843,662 |
|
|
| 431,319 |
| |||||||||||||||
Credit facilities |
|
| 630,066 |
|
|
| 641,989 |
|
|
| 656,284 |
|
|
| 204,496 |
|
|
| 98,500 |
| |||||||||||||||
Total liabilities |
|
| 1,740,881 |
|
|
| 1,672,875 |
|
|
| 1,572,067 |
|
|
| 1,105,049 |
|
|
| 555,304 |
| |||||||||||||||
Redeemable noncontrolling interest |
|
| 425 |
|
|
| 472 |
|
|
| 551 |
|
|
| 568 |
|
| ― |
| ||||||||||||||||
Total equity |
|
| 1,052,660 |
|
|
| 1,154,817 |
|
|
| 1,259,102 |
|
|
| 872,160 |
|
|
| 451,981 |
| |||||||||||||||
|
| As of December 31, | |||||||||||||
|
| 2016 |
| 2015 |
| 2014 |
| 2013 |
| 2012 | |||||
Balance Sheet Data: |
|
|
|
|
|
|
|
|
|
|
|
|
|
| |
| Total real estate assets, net | $ | 2,564,157 |
| $ | 2,514,059 |
| $ | 1,704,653 |
|
| 866,200 |
| $ | 238,873 |
| Intangibles, net |
| 131,502 |
|
| 172,452 |
|
| 140,264 |
|
| 52,400 |
|
| 7,024 |
| Cash |
| 58,517 |
|
| 68,922 |
|
| 91,355 |
|
| 44,209 |
|
| 18,262 |
| Total assets |
| 2,827,692 |
|
| 2,831,169 |
|
| 1,977,209 |
|
| 1,007,285 |
|
| 334,439 |
| Mortgage and other notes payable, net |
| 936,723 |
|
| 831,825 |
|
| 843,662 |
|
| 431,319 |
|
| 189,813 |
| Credit facilities |
| 641,989 |
|
| 656,284 |
|
| 204,496 |
|
| 98,500 |
|
| ― |
| Total liabilities |
| 1,672,875 |
|
| 1,572,067 |
|
| 1,105,049 |
|
| 555,304 |
|
| 193,788 |
| Redeemable noncontrolling interest |
| 472 |
|
| 551 |
|
| 568 |
|
| ― |
|
| ― |
| Total equity |
| 1,154,817 |
|
| 1,259,102 |
|
| 872,160 |
|
| 451,981 |
|
| 140,651 |
_____________
FOOTNOTES:
| For purposes of determining the weighted average number of shares of common stock outstanding, stock distributions are treated as if they were outstanding as of the beginning of each period presented. For the years ended December 31, 2015, 2014 |
(2) | For the years ended December 31, 2017, 2016, 2015, 2014 |
(4) | Due to certain unique operating characteristics of real estate companies, as discussed below, National Association of Real Estate Investment Trusts, (“NAREIT”), promulgated a measure known as FFO, which we believe to be an appropriate supplemental measure to reflect the operating performance of a REIT. The use of FFO is recommended by the REIT industry as a supplemental performance measure but is not equivalent to net income (loss) as determined under GAAP. |
We define FFO, a non-GAAP measure, consistent with the standards approved by the Board of Governors of NAREIT. NAREIT defines FFO as net income or loss computed in accordance with GAAP, excluding gains or losses from sales of property, asset impairment write-downs, plus depreciation and amortization, and after adjustments for unconsolidated partnerships and joint ventures. Our FFO calculation complies with NAREIT’s policy described above.
We define MFFO, a non-GAAP measure, consistent with the IPA, an industry trade group, Guideline 2010-01, Supplemental Performance Measure for Publicly Registered, Non-Listed REITs: MFFO, and the Practice Guideline, issued by the IPA in November 2010. The Practice Guideline defines MFFO as FFO further adjusted for the following items, as applicable, included in the determination of GAAP net income (loss): acquisition fees and expenses; amounts relating to deferred rent receivables and amortization of above and below market leases and liabilities (which are adjusted in order to remove the impact of GAAP straight-line adjustments from rental revenues); accretion of discounts and amortization of premiums on debt investments, mark-to-market adjustments included in net income; gains or losses included in net income from the extinguishment or sale of debt, hedges, foreign exchange, derivatives or securities holdings where trading of such holdings is not a fundamental attribute of the business plan, and unrealized gains or losses resulting from consolidation from, or deconsolidation to, equity accounting and after adjustments for consolidated and unconsolidated partnerships and joint ventures, with such adjustments calculated to reflect MFFO on the same basis.
FFO and MFFO are not necessarily indicative of cash flows available to fund cash needs and should not be considered (i) as an alternative to net income (loss), or net income (loss) from continuing operations, as an indication of our performance, (ii) as an alternative to cash flows from operating activities as an indication of our liquidity, or (iii) as indicative of funds available to fund our cash needs including our ability to make distributions to our stockholders. FFO and MFFO should not be construed as more relevant or accurate than the current GAAP methodology in calculating net income (loss) and its applicability in evaluating our operating performance.
For additional disclosures relating to FFO and MFFO, including a reconciliation of net loss to FFO and MFFO, for the years ended December 31, 2017, 2016 2015 and 20142015 refer to Item 7. “Management Discussion and Analysis of Financial Condition and Results of Operations” and for the years ended December 31, 20132014 and 20122013 refer to our Form 10-K filed on March 27, 2014.
2015.
Overview
CNL Healthcare Properties, Inc. is a Maryland corporation that incorporated on June 8, 2010. We qualified as a REIT for U.S. federal income tax purposes beginning with the year ended December 31, 2012 and our intention is to be organized and operate in a manner that allows us to remain qualified as a REIT for federal income tax purposes.
From July 2011 to September 2015, we raised approximately $1.7 billion through our Offerings. The net proceeds from our Offerings were contributed to CHP Partners, LP, our Operating Partnership, in exchange for partnership interests. Substantially all of our assets are held by, and all operations are conducted, either directly or indirectly, through: (1) the Operating Partnership in which we are the sole limited partner and our wholly owned subsidiary, CHP GP, LLC, is the sole general partner; (2) a wholly owned TRS, CHP TRS Holding, Inc.; (3) property owner subsidiaries and lender subsidiaries, which are single purpose entities; and (4) investments in joint ventures.
On September 30, 2015, we completed our Offerings pursuant to a registration statement on Form S-11 under the Securities Act of 1933 with the SEC. In October 2015, we deregistered the unsold shares of our common stock under our previous registration statement on Form S-11, except for 20 million shares that we concurrently registered on Form S-3 under the Securities Exchange Act of 1933 with the SEC for the sale of additional shares of common stock through our Reinvestment Plan.
Our Advisor is responsible for managing our affairs on a day-to-day basis and for identifying, recommending and executing acquisitions and dispositions on our behalf pursuant to an advisory agreement. Our Property Manager is responsible for managing and leasing our healthcare real estate investments. Our Advisor and Property Manager are each wholly owned by affiliates of our Sponsor, which is an affiliate of CNL, a private investment management firm providing global real estate and alternative investments. As a result, our Advisor and Property Manager each represent related parties and each have received or will receive compensation, fees and expense reimbursements for services related to managing of our business.
For a description of the individual property holdings by asset class included in our healthcare real estate portfolio, including the location, date acquired, and purchase price,amount invested, as of December 31, 2016,2017, see Item 2. “Properties.”
Market Opportunities and Trends
We believe that medical care will continue to grow rapidly and steadily for two basic reasons—it is an essential human service for an aging demographic and it is heavily supported by the government. These factors may result in healthcare-related property investments potentially experiencing less economic volatility than other sectors.
In addition, there are indications that significant opportunities for consolidation exist in the seniors housing and healthcare facility sectors, which we believe will create value as our portfolio grows and achieves scale through asset aggregation. A Bank of America Merrill Lynch Global Research Report entitled “Healthcare REITs: a defensive play on aging demographics” dated September 24, 2013 (“BofA Report”) estimates that the total value of healthcare-related real estate ranges from $700 billion to over $1 trillion, with REIT ownership accounting for only about 14% of the total. This continued ownership fragmentation of the healthcare property industry provides adequate opportunity for growth through consolidation opportunities.
The specific trends and characteristics unique to the healthcare sector and the asset classes on which we focus are described in greater detail below.
Demand Drivers for Healthcare Property
The primary drivers behind demand for seniors housing, medical office, acute care and post-acute care properties are the aging of the U.S. population and growth in national healthcare expenditures.
Expanded Healthcare Insurance Coverage. As the U.S. population over the age of 65 increases, more Americans become entitled to Medicare to cover their increasing healthcare needs and related costs. In addition, under The Patient Protection andthe Affordable Care Act (“Affordable Care Act”) and other legislation, healthcare insurance coverage has expanded in recent years to cover more
of the non-elderly, lower income populations. According to the National Center for Health Statistics, less than 9 percent of the population did not have health insurance coverage at the beginning of 2016, down from 16 percent at the time the Affordable Care Act passed in 2010. The resulting expansion of U.S. healthcare insurance coverage has created an increase in demand for healthcare services and healthcare facilities of all types. There is a risk however that the Affordable Care Act could be repealed in the future and may be replaced with new legislation, the effects of which are unknown at this time. The impact of repealing existing legislation, or introducing new legislation, could materially increase the uninsured population in the U.S. who are not able to obtain or afford health insurance coverage. We believe efforts to preserve and increase access to care will remain a primary focus of the new administration.government.
The Aging of America. According to a December 2014 report of the U.S. Census Bureau, 12,000 people in the United StatesU.S. will turn 65 every day until 2060. Most recent US Census Bureau projections (as of December 2014) estimate that by 2060, 98 million Americans , or 23.6% of the U.S. population, will be 65 years or older, compared to 14.9% of the population in 2015, an anticipated increase of 105% in the senior population between 2015 and 2060. The graph below depicts the projected increase in the size of the senior population in the United StatesU.S. over time based upon national population projections by the U.S. Census Bureau:


Source: US Census Bureau, December 2014
Disability is defined under the ADA as a substantial limitation in a major life activity. Research indicates that age is positively correlated with the presence of a physical disability, and the oldest people have the highest levels of both physical and cognitive disabilities. With the increasing age of the U.S. population, the healthcare system faces an increase in the population with age-related physical and cognitive disabilities, which require increased supportive health care services as well as housing options for older adults. Additionally, we expect an increased demand for healthcare facilities providing physician and ancillary care services for such disabilities.
Rising Healthcare Expenditures. The rise in the aging population, the expansion of U.S. healthcare insurance coverage through Medicare or other means, and medical technology innovations contribute to increasing healthcare expenditures. National healthcare spending is projected to increasegrow 1.9 percentage points faster than Gross Domestic Product (GDP) per year over the 2017-25 period; as a result, the healthcare spending share of GDP is expected to rise from approximately 1618.3 percent of the gross domestic product (GDP) in 20132017 to approximately 2521.2 percent by 2040 according to “The 2015 Long-Term Budget Outlook”, produced by the Congressional Budget Office in June 2015.2025.
The following graph depicts the projected rise in the national healthcare expenditures in the U.S. between 2000 and 2025:


Source: 1-“National Health Expenditure Projections 2015-2025,2016-2025,” The Centers for Medicare & Medicaid Services, Office of the Actuary, National Health Statistics Group. 2-GDP Projections from “An Update to the Budget and Economic Outlook: 2016-2026”2017-2027”, Congressional Budget Office, August 2016.June 2017.
As Americans age, they spend more on healthcare. The following graph depicts the increase in average annual per capita spending by Americans on healthcare as they age.

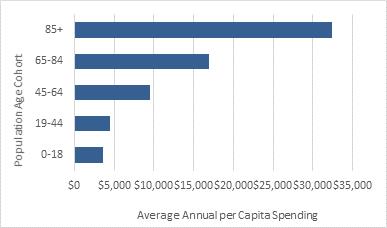
Source: “Health Expenditures by Age and Gender,” The Centers for Medicare & Medicaid Services, 2012.
Seniors Housing and Post-Acute Care Supply and Demand
Demographics and Existing Units. According to a National Center for Health Statistics report entitled “Health: United States, 2015” dated May 2016, individuals who are 65 years old in 2014 can expect to live, on average, an additional 19.3 years, up from an average of 13.9 additional years for those aged 65 in 1950 – a net gain of 5.4 years. Americans 65 years and older have longer life expectancies than the elderly did in the past and will therefore need additional housing options to accommodate their special needs as they age. Demand for seniors housing options is currently outpacing the existing supply of seniors housing units. According to the ASHA Special Issue Brief:
A Projection of Demand for Market Rate U.S. Seniors Housing 2015–2040, American Seniors Housing Association, Winter 2016, the projected annual demand growth for seniors housing will increase as “baby boomers” pass the over-75 age-threshold after 2020, increasing from the level of 25,000 units per year from 2015 to 2020 to a demand of 92,000 units per year from 2025 to 2030. The ASHA Special Issue Brief projects that approximately 1.8 million senior living units need to be constructed by 2040 to accommodate aging Americans at the same market penetration rate encountered today.


Source: A Projection of Demand for Market Rate U.S. Seniors Housing 2015–2040, American Seniors Housing Association, Winter 2016.
The supply growth of certain seniors housing asset classes over the last decade declined following a boom in seniors housing development in the 1990’s. Since 2008, there has been modest growth in the total national inventory of seniors housing units according to National Investment Center for Seniors Housing & Care (“NIC”) data, with a compound annual growth rate of 2.0%2.1% for seniors housing facilities as of the end of 2016.2017. However, the number of new seniors housing units under construction is increasing. MutedOver this time period, muted supply growth has helped rental levels recover and occupancy improve despite a modest economic recovery. The following graph depicts seniors housing supply-demand trends for independent living and assisted living combined:


Source: National Investment Center for Seniors Housing & Care, NIC MAP Property Trend, Q4-2016Q4-2017
According to data from the NIC for the fourth quarter of 2016,2017, overall seniors housing occupancy in the top 100 metropolitan statistical areas (“MSAs”) was 89.4%88.6%. As of the fourth quarter of 2016,2017, occupancy was 3.11.5 percentage points above its cyclical low of 87.1% during the first quarter of 2010. In 2016,2017, inventory of seniors housing units grew by 27,07630,421 units. This growth in inventory during 2017 has contributed to a decline in overall occupancy by 0.6
0.7 percentage points from year end 2015.2016. We believe seniors housing development will remain at an acceptable level given the growth in aging demographics, and that sufficient demand exists to absorb the new development units over time.
Rise in the Prevalence of Alzheimer’s disease. According to a study funded by the Alzheimer’s Association and NIH/National Institute on Aging, the number of people in the U.S. with Alzheimer’s disease may nearly triple by 2050, straining our healthcare system and taxing the resources of caregivers. Barring the development of medical breakthroughs to prevent or slow the disease, approximately 13.8 million people age 65 and older are projected to have Alzheimer’s disease by 2050. The following graph depicts the projected rise in the number of senior population with Alzheimer’s disease in the U.S. broken down by three age groups.


Source: Hebert LE, Weuve J, Scherr PA, Evans DA. Alzheimer disease in the United States (2010-2050) estimated using the 2010 Census. .
According to a National Center for Health Statistics Data Brief dated November 2013, in 2010, approximately 42% of individuals living in residential care communities had Alzheimer’s disease or other forms of dementia. We believe that the projected rise in the incidence of Alzheimer’s disease creates a need for seniors housing options that address the specialized needs of Alzheimer’s and other dementia patients and their families, which often cannot be addressed in a traditional home setting.
Stronger U.S. Housing Market. As the broader economy recovers and the U.S. residential real estate market strengthens, it is widely believed that the demand for seniors housing will continue to grow as the “baby boomer” generation reaches retirement and transitions to active adult communities and other seniors housing facilities. Seniors often sell their homes and use the proceeds to pay rent in private-pay retirement communities creating a strong correlation between seniors housing demand and home prices. According to data from a December 2016 report from the Joint Center for Housing Studies of Harvard University (“Joint Center Report”), the number of households headed by seniors will increase more than 60% over the next two decades. As the senior population ages into their late 70s and this segment of the population grows, they tend to seek more accessible and convenient living options. The Joint Center Report states the sheer growth in the older population will mean the number of renter households will expand from 6 to more than 11 million households over the next two decades. Overall, the share of renters will increase slightly, from 21 percent of older households in 2015 to 23 percent in 2035.
Seniors Housing and Post-Acute Care Asset Classes
Based on the above fundamentals and perceived trends, we may invest in or develop the following classes of seniors housing and post-acute care properties:
Active Adult Communities. Active adult communities offer social and recreational-centered living in a setting that may include town homes, condominiums, cluster homes, manufactured housing, single family homes and multi-family housing. These communities are generally classified as either: (a) age-restricted communities that require at least one household member to be over the age of 55 in at least 80% of the occupied units; or (b) age-targeted communities that target adults age 55 or older with no explicit age restrictions. Residents typically lead independent, active lifestyles in a country club setting where they can take advantage of amenities such as a clubhouse, gathering center or recreational center that is the focal point of activities, and may include a golf course, walking trails, hobby centers or other recreational spaces. These communities are generally not equipped to provide increased care or health-related services.
Independent Living Facilities. Independent living facilities are age-restricted, multi-family rental or ownership (condominium) housing with central dining facilities that provide residents, as part of a monthly fee, meals and other services such as housekeeping, linen service, transportation, social and recreational activities.
Assisted Living Facilities. Assisted living facilities are usually state-regulated rental properties that provide the same services as independent living facilities, but also provide, in a majority of the units, supportive care from trained employees to residents who are unable to live independently and require assistance with activities of daily living. The additional services may include assistance with bathing, dressing, eating, and administering medications.
Continuing Care Retirement Communities. Continuing care retirement communities offer age-restricted seniors housing facilities with a combination of independent living lifestyle options for individuals who do not need constant physician or nursing supervision and assisted living or skilled nursing facilities available to residents on the same or adjacent property of the complex. This type of community generally offers a longer term contract for seniors that provides for housing, services and nursing care with varying payment plans that may include entrance fees and condominium or cooperative rental programs. In general, these properties provide residential living in an apartment-style building with services and dining usually on the main level. In addition, those in a campus-like setting of several acres may offer other individual multi-family homes and offer amenities that may be similar to those found in an active adult community.
Memory Care/Alzheimer’s Facilities. Those suffering from the effects of Alzheimer’s disease or other forms of memory loss need specialized care. Memory care/Alzheimer’s centers provide the specialized care for this population including residential housing and assistance with the activities of daily living.
Post-Acute Care Properties
Skilled Nursing Facilities. A skilled nursing facility generally provides the highest level of care for older adults outside of a hospital and also provides custodial care and assistance with the activities of daily living. Skilled nursing facilities differ from other seniors housing facilities in that they also provide a high level of medical care. A licensed physician supervises each patient’s care and a nurse or other medical professional is almost always on the premises. Skilled nursing care is available on site, usually 24 hours a day. Other medical professionals, such as occupational or physical therapists, are also available. This allows the delivery of medical procedures and therapies on site that would not be possible in other housing options.
Long-Term Acute Care Hospitals. Long-term acute care hospitals, or LTACHs, are certified as acute care hospitals, but focus on patients who, on average, stay more than 25 days. Many of the patients in LTACHs are transferred from a hospital-based intensive or critical care unit. LTACHs specialize in treating patients who may have more than one serious condition, but who may improve with time and care and eventually return home. Services provided in LTACHs typically include comprehensive rehabilitation, respiratory therapy, head trauma treatment and pain management.
Inpatient Rehabilitative Facilities. Inpatient rehabilitative facilities are licensed facilities that provide intensive rehabilitation programs to patients who typically have complex medical issues resulting from incidents of trauma or strokes. They focus on providing high levels of physical, occupational and speech therapy under the supervision of highly trained medical doctors, staff and therapists.
Medical Office Building and Acute Care Property Supply and Demand
Demographics and Existing Space. The increased demand for medical office buildings, acute care and post-acute care properties is also supported by an aging population and increased health insurance coverage. As Americans 65 years and older have longer life expectancies than in the past, their need for health related services is projected to increase the need for additional healthcare properties. In 2012,2015, persons over age 65 were 1415 percent of the U.S. population but accounted for 2731 percent of physician visits in the U.S. According to the 2012 National Ambulatory Medical Care Survey, individuals over age 65 made an average of 5.96.6 visits to physicians’ offices in 2012,2015, or 2.73.3 times the number of visits made by individuals under 45 years of age. The graph below depicts the average number of physicians’ visits in the U.S. by age group in 2012.2015.

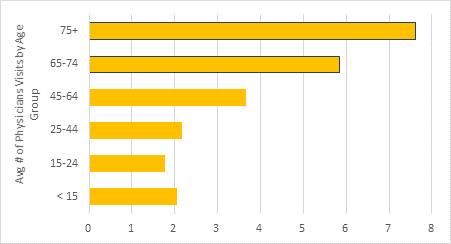
Source: CDC/NCHS, National Ambulatory Medical Care Survey, 20122015
Evolution of the U.S. Healthcare Model. Rising healthcare costs create pressure within the healthcare industry to move from an inpatient to an outpatient delivery setting in order to provide service more efficiently and contain costs. The outpatient model of healthcare services results in declining hospital admissions and overnight stays with a focus toward performing certain procedures and diagnostic services in a more consumer-centric, cost-effective setting. According to the Urban Land Institute Report, almost 65% of all surgeries today do not require an overnight hospital stay, compared with only 16% of all surgeries in 1980. Technology advances are also driving patient demand for more medical services and the space in which to deliver them. The shift to outpatient surgeries also continues to be encouraged by technological advances that involve smaller incisions, improved anesthetics, less risk of infection and faster recoveries. The increase in outpatient procedures drives greater demand for medical office buildings and other healthcare properties in which such procedures can be performed.
The following graph depicts the increase in outpatient surgeries vs. inpatient surgeries in the United StatesU.S. under the new, evolving U.S. healthcare model:

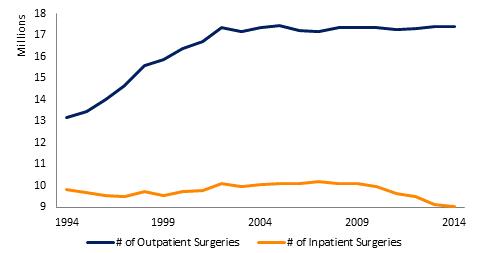
Source: Trendwatch Chartbook 2016: American Hospital Association
Consumer-Driven Healthcare Model. Today’s patients often select their doctors based not only on the quality of care offered but also on the ease of access to such doctors. Hospitals are therefore expanding into community-based settings and encouraging large practices to open satellite offices. According to the “Medical Office Research Report” published by Marcus & Millichap in 2013, this bodes well for medical office building owners, as many providers, including physician practices affiliated with or owned by major health systems, will favor well-located, multi-tenant medical office buildings, particularly those with tenant rosters that promote cross-referrals. At the same time, however, some share of tenant demand will be diverted to storefront clinics and large ambulatory care centers.
Medical Office Buildings and Acute Care Property Asset Classes
Based on the increased numbers of insured Americans, increased healthcare visits by a growing, aging U.S. population and an evolving U.S. healthcare model driving a need for additional healthcare properties, we may investhave invested in or develop the following classes of medical office buildings, acute care properties and other healthcare-related properties:
Medical Office Buildings. These properties include traditional medical office buildings, specialty medical and diagnostic service facilities, surgery centers, outpatient rehabilitation facilities and other facilities designated for clinical services. The buildings may be located on the campus of a hospital, adjacent to campus, or as a “hub and spoke” location whereby the hospital desires to establish a presence in a particular market. Medical office buildings may also be unaffiliated with a health system and could be multi-tenant or single-tenant in nature.
Acute Care Properties. These properties include specialty hospitals which are primarily or exclusively engaged in the care and treatment of patients having a cardiac or orthopedic condition or patients undergoing a surgical procedure. General acute care hospitals also fall within the category of acute care properties and offer a variety of services including operating and recovery rooms, imaging and diagnostic services, delivery and neonatal care, oncology services, clinical laboratory services, physical therapy and other outpatient services.
Other Healthcare-Related Properties
Other healthcare-related properties in which we believe there are opportunities based on current supply and demand factors are pharmaceutical and medical supply manufacturing facilities, laboratories, life-science and research facilities.
Liquidity and Capital Resources
General
Our primary source of capital for items other than acquisitions of real estate, through the close of our Offerings on September 30, 2015, was proceeds we received from our Offerings. While our Offerings closed on September 30, 2015, we continue to provide existing stockholders the opportunity to designate their cash distributions for reinvestment through our Reinvestment Plan. Other potential future sources of capital include proceeds from collateralized or uncollateralized financings from banks or other lenders and undistributed operating cash flows, and to a lesser extent, proceeds from the sale of properties or other assets and undistributed operating cash flows.assets. If necessary, we may use financings or other sources of capital in the event of unforeseen significant capital expenditures. As of December 31, 2016,2017, we have approximately $11.1$28.4 million of available proceeds remainingundrawn availability under our senior unsecured revolving line of credit (“Revolving Credit Facility”).
We substantially completed our acquisition phase in 2016 and expect future acquisition activity to be limited. Prior to completion of our acquisition phase, our principal demand for funds has been for acquisitions, the payment of debt service on our outstanding indebtedness and the payment of distributions. Generally, we expect to meet short-term working capital needs from our cash flows from operations and proceeds from our Reinvestment Plan.
Facility.
We may also be negatively impacted by rising interest rates on any unhedged variable rate debt or the timing of when we seek to refinance existing debt. In addition, we will continue to evaluate the need for additional interest rate protection in the form of interest rate swaps or caps on unhedged variable rate debt.
debt or variable rate debt with interest rate protection scheduled to mature.
Sources of Liquidity and Capital Resources
Common Stock Offerings
For the year ended December 31, 2015, and 2014, we received proceeds from our Offerings of approximately $551.9 million and $554.6 million respectively.million.
For the years ended December 31, 2017, 2016 2015 and 2014,2015, we received proceeds from our Reinvestment Plan of approximately $43.2 million, $42.6 million $36.8 million and $17.7$36.8 million respectively.
Borrowings
We have borrowed money to fund ongoing real estate development and intend to continue borrowing money to fund ongoing real estate development and other enhancements to our portfolio, as well as to cover periodic shortfalls between distributions paid and cash flows from operating activities. During the years ended December 31, 2017, 2016 2015 and 2014,2015, we borrowed proceeds of approximately $153.4 million, $142.5 million $549.2 million and $510.3$549.2 million, respectively, net of repayments on the Revolving Credit Facility of $64.9 million, $120.3 million $321.4 million and $259.3$321.4 million, for the years ended December 31, 2017, 2016 2015 and 2014,2015, respectively. These amounts were primarily used to fund real estate under development and acquire additional properties. While we haveWe substantially completed our acquisition phase in 2016 and expect future acquisition activity, if any, to be limited. Prior to completion of our acquisition phase, our principal demand for funds has been for acquisitions or the development of properties, the payment of debt service on our outstanding indebtedness and the payment of distributions. Generally, we may evaluate additional acquisition opportunitiesexpect to meet short-term working capital needs from our cash flows from operations and borrow additional money to fund such acquisitions.
proceeds from our Reinvestment Plan.
In December 2014, we entered into a $230 million Revolving Credit Facility and a $175 million senior unsecured term loan facility (“Term Loan Facility” and, collectively, “Credit Facilities”). Pursuant to the associated credit agreement, we have the ability to increase our borrowing capacity to $700 million under the accordion feature of the Credit Facilities. To date, we have exercised this accordion feature and increased our borrowing capacity to $445 million. In addition, in October 2017, we exercised our first 12-month extension option on the Revolving Credit Facility has an initialresulting in the term throughending December 2017 plus two2018, and we have one remaining 12-month extension optionsoption through which we can extend the term through December 2019; whereas the Term Loan Facility has an initial term through February 2019 plus one 12-month extension option through which we can extend the term through February 2020. We expect to exercise one of our twosecond 12-month extension optionsoption on the Revolving Credit Facility to extend the term through December 2018.2019.
In November 2015, we entered into a $250 million senior unsecured term loan facility (“Second Term Loan Facility”). The Second Term Loan Facility has an initial term through November 2020 and we have the ability to increase our borrowing capacity to $350M$350 million under its accordion feature. To date, we have exercised this accordion feature and increased our borrowing capacity to $275 million.
In MarchOn an ongoing basis, we monitor our debt maturities, engage in dialogues with third-party lenders about various financing scenarios and analyze our overall portfolio borrowings in advance of scheduled maturity dates of the debt obligations to determine the optimal borrowing strategy. As of December 31, 2016, we had approximately $263.8 million of debt obligations maturing in 2017 we obtainedas well as approximately $28$288.9 million of additional debt obligations maturing in 2018. During the year ended December 31, 2017, we completed refinancings and loan extensions on approximately $527.3 million of the aforementioned $552.7 million of debt obligations maturing in 2017 and 2018, which were primarily comprised of the following transactions:
In May 2017, we refinanced approximately $57.4 million of borrowings related to Wellmore of Tega Cay, which was an unencumbered asset as of December 31, 2016. Theour Knoxville Medical Office Properties and our Claremont Medical Office property. This combined mortgage loan has an initiala term of 3660 months, plus one 12-month extension option, an interest rate equal to 30-day LIBORLondon Interbank Offer Rate (“LIBOR”) plus 2.65%2.45% per annum, and a 12-monthmonthly interest only period followed by a 30-year amortizationpayments for the first 30 months and monthly principal and interest payments and for the remaining term of the loan. combined loan using a 30-year amortization period with the remaining principal balance payable at maturity. The previous loan balances totaled approximately $49.6 million collectively, of which approximately $12.4 million was scheduled to mature in January 2018 related to our Claremont Medical Office property and approximately $37.2 million was scheduled to mature in July 2018 related to our Knoxville Medical Office Properties.
In August 2017, we extended the terms of our existing mortgage loans on the Pacific Northwest and Capital Health communities to January 2022, which represented an extension of the maturity dates from December 2018 and January 2020, respectively, on approximately $237.3 million of combined borrowings. In addition, we received approximately $37.5 million of additional borrowings through a supplemental loan with the same lender, which is co-terminus with the existing mortgage loans, collateralized by the communities and matures in January 2022. The supplemental loan further accrues interest at a fixed rate equal to 4.3% per annum and includes monthly interest only payments for the first 12 months followed by monthly principal and interest payments for the remaining term of the loan using a 30-year amortization period with the remaining principal balance payable at maturity. These proceeds were used partially to pay down the Revolving Credit Facility.
As noted above, in October 2017, we exercised a one-year extension option on our Revolving Credit Facility with this borrowing now scheduled to mature in December 2018.
The following table provides details of our indebtedness as of December 31, 2017 and 2016 (in thousands):
|
| As of December 31, |
| |||||
|
| 2017 |
|
| 2016 |
| ||
Mortgages payable and other notes payable: |
|
|
|
|
|
|
|
|
Fixed rate debt |
| $ | 409,607 |
|
| $ | 382,129 |
|
Variable rate debt (1) (2) |
|
| 629,160 |
|
|
| 561,874 |
|
Mortgages and other notes payable (3) |
|
| 1,038,767 |
|
|
| 944,003 |
|
Premium (discount), net (4) |
|
| 102 |
|
|
| (67 | ) |
Loan costs, net |
|
| (6,716 | ) |
|
| (7,213 | ) |
Total mortgages and other notes payable, net |
|
| 1,032,153 |
|
|
| 936,723 |
|
Credit facilities: |
|
|
|
|
|
|
|
|
Revolving Credit Facility (1) (2) (5) |
|
| 182,000 |
|
|
| 194,863 |
|
First Term Loan Facility (1) |
|
| 175,000 |
|
|
| 175,000 |
|
Second Term Loan Facility (1) (2) |
|
| 275,000 |
|
|
| 275,000 |
|
Loan costs, net related to Term Loan Facilities |
|
| (1,934 | ) |
|
| (2,874 | ) |
Total credit facilities, net |
|
| 630,066 |
|
|
| 641,989 |
|
Total borrowings |
| $ | 1,662,219 |
|
| $ | 1,578,712 |
|
FOOTNOTES:
(1) | As of December 31, 2017 and 2016, we had entered into interest rate swaps with notional amounts of approximately $506.4 million and $521.5 million, respectively, which were settling on a monthly basis. Refer to Item 8. “Financial Statements and Supplementary Data” — Note 12. “Derivative Financial Instruments” for additional information. |
(2) | As of December 31, 2017 and 2016, we had entered into interest rate caps with notional amounts of approximately $527.0 million and $410.0 million, respectively. Refer to Item 8. “Financial Statements and Supplementary Data” — Note 12. “Derivative Financial Instruments” for additional information. |
(3) | As of December 31, 2017 and 2016, our mortgages and other notes payable are collateralized by 76 and 75 properties, respectively, with total carrying values of approximately $1.6 billion and $1.6 billion, respectively. |
(4) | Premium (discount), net is reflective of us recording mortgage note payables assumed at fair value on the respective acquisition date. |
(5) | As of December 31, 2017 and 2016, we had undrawn availability under the Revolving Credit Facility of approximately $28.4 million and $11.1 million, respectively, based on the value of the properties in the unencumbered pool of assets supporting the loan. |
We have pledged our properties in connection with our borrowings and may continue to strategically leverage our real estate and use debt financing as a means of providing additional funds for the payment of distributions to stockholders, working capital and for other corporate purposes. Our ability to increase our borrowings could be adversely affected by credit market conditions which result in lenders reducing or limiting funds available for loans, including loans collateralized by real estate. We may also be negatively impacted by rising interest rates on our unhedged variable rate debt or the timing of when we seek to refinance existing debt. In addition, we will continue to evaluate the need for additional interest rate protection in the form of interest rate swaps or caps on unhedged variable rate debt or variable rate debt with interest rate protection scheduled to mature.
We may borrow money to pay distributions to stockholders, for working capital and for other corporate purposes. See “Uses of Liquidity and Capital Resources – Distributions” below for additional information related to the payment of distributions with Other Sources for GAAP purposes. In many cases, we have pledged our assets in connection with our borrowings and intend to encumber assets in connection with additional borrowings. The aggregate amount of long-term financing is not expected to exceed 60% of our total assets on an annual basis. As of December 31, 20162017 and 2015,2016, we had an aggregate debt leverage ratio of approximately 55.8%59.5% and 52.6%55.8%, respectively, of the aggregate carrying value of our assets.
The following table provides details of our indebtedness as of December 31, 2016 and 2015 (in thousands):
|
|
| December 31, | ||||
|
|
| 2016 |
| 2015 | ||
Mortgages payable and other notes payable: |
|
|
|
|
| ||
| Fixed rate debt | $ | 382,129 |
| $ | 391,639 | |
| Variable rate debt (1) |
| 561,874 |
|
| 449,017 | |
|
| Mortgages and other notes payable (2) |
| 944,003 |
|
| 840,656 |
|
| Premium (discount), net (3) |
| (67) |
|
| (221) |
|
| Loan costs, net |
| (7,213) |
|
| (8,610) |
|
| Total mortgages and other notes payable, net |
| 936,723 |
|
| 831,825 |
Credit facilities: |
|
|
|
|
| ||
| Revolving Credit Facility (4) (5) |
| 194,863 |
|
| 225,000 | |
| First Term Loan Facility (1) |
| 175,000 |
|
| 175,000 | |
| Second Term Loan Facility (5) |
| 275,000 |
|
| 260,000 | |
| Loan costs, net related to Term Loan Facilities |
| (2,874) |
|
| (3,716) | |
|
| Total credit facilities, net |
| 641,989 |
|
| 656,284 |
|
| Total borrowings | $ | 1,578,712 |
| $ | 1,488,109 |
_____________
FOOTNOTES:
|
|
|
|
|
|
|
|
|
|
Generally, the loan agreements for our mortgage loans contain customary affirmative, negative and financial covenants, representations, warranties and borrowing conditions, as set forth in the loan agreements. The loan agreements also contain customary events of default and remedies for the lenders. The borrowers are normally direct or indirect subsidiaries of our Operating Partnership.
The Credit Facilities contain affirmative, negative, and financial covenants which are customary for loans of this type, including (but not limited to): (i) maximum leverage, (ii) minimum fixed charge coverage ratio, (iii) minimum consolidated net worth, (iv) restrictions on payments of cash distributions except if required by REIT requirements, (v) maximum secured indebtedness, (vi) maximum secured recourse debt, (vii) minimum unsecured interest coverage and (viii) limitations on certain types of investments and with respect to the pool of properties supporting borrowings under the Credit Facilities,credit facilities, minimum debt service coverage ratio, minimum weighted average occupancy, and remaining lease terms, as well as property type, MSA, operator, and asset value concentration limits. The limitations on distributions include a limitation on the extent of allowable distributions, which are not to exceed the greater of 95% of adjusted FFO (as defined per the Credit Facilities) and the minimum amount of distributions required to maintain our REIT status. We do not expect this limitation to be a limiting factor for our board of directors when determining distribution levels now or in the future. As of December 31, 2016, we were2017, the Company was in compliance with all financial covenants and ratios.covenants.
See Item 8. “Financial Statements and Supplementary Data” — Note 10. “Indebtedness” for additional information on our borrowings, including a schedule of future principal payments and maturity dates. In addition, see “Off-Balance Sheet and Other Arrangements” below for a description of the borrowings of our unconsolidated entities.
In July 2015, an anchor tenant at two of our medical office buildings filed for bankruptcy protection under Chapter 11 of the United States Bankruptcy Code. In May 2016, we signed new lease agreements for a majority of the original leased spaces with the health system that purchased substantially all of the anchor tenant’s operations. In addition, the anchor tenant rejected two of the previous space leases as part of its bankruptcy reorganization, which resulted in us assuming a sublease under the original lease structure with the anchor tenant and recording a loss on lease terminations of approximately $0.8 million related to the vacated space leases. The impact of this workout did not have a material impact on our operating cash flows given that revenues attributable to the anchor tenant represented less than 1.0% of our total revenues for both the years ended December 31, 2016 and 2015.Workout
During 2015, the tenant at two of our specialty hospitals experienced financial difficulty and defaulted on its lease agreements at both properties. During the year ended December 31, 2015,2016, we recorded an impairment provision of approximately $4.7 million related to the lease intangibles and a loss on lease termination of approximately $0.9 million related to deferred rent and other lease related assets.
In September 2015, in connection with consenting to the sale of the operations by our previous tenant to a third-party buyer at our specialty hospital in Beaumont, TX, we signed an amended and restated lease agreement with the buyer that included similar economic terms as the previous lease. The buyer has continued to perform since 2015 under the amended and restated lease agreement and therefore this portion of the tenant workout is deemed to have been completed.
In January 2016, we executed a lease with a new tenant at our specialty hospital in Hurst, TX that included similar economic terms as the previous lease. As incentive for entering into a long-term lease, the tenant was granted six months of “free rent” in 2016. This new lease increased our operating cash flows in 2016 given the loss in revenues as a result of revenues generated by the tenant default on the previous lease in 2015. However, during 2017, the year endednew tenant began to experience financial difficulties, and as a result, we entered into a forbearance agreement with this tenant in July 2017 that resulted in the majority of the remaining 2017 rent payments, which totaled approximately $0.9 million, being deferred until December 31, 2015.2018. We will continue to monitor the performance of this tenant in 2018.
Proceeds from Sale of Real Estate
In November 2016, we completed the sale of Dogwood Forest of Acworth and received sales proceeds of approximately $33.6 million, which were used to pay down the Revolving Credit Facility, as this property was included in the unencumbered pool of assets supporting our availability thereunder, and to fund cash distributions for the year ended December 31, 2016.
In August 2017, the Company committed to a plan to sell the Perennial Communities and classified the associated assets as held for sale. Upon completion of a sale, if any, the proceeds would be used to pay down the Revolving Credit Facility, as these properties are included in the unencumbered pool of assets supporting our availability thereunder, and to fund other general corporate items.
Distributions from Unconsolidated Entities
As of December 31, 2016,2017, we had an investment in five unconsolidated properties through an unconsolidated joint venture. Pursuant to the joint venture agreement, we are entitled to receive quarterly preferred cash distributions to the extent there is cash available to distribute. These distributions are generally received within 45 days after each quarter end. For the years ended December 31, 2017, 2016 and 2015, we received approximately $0.7 million, $0.7 million and $0.9 million of operating distributions from our investment in these unconsolidated entities, respectively. In addition, we received capital distributions from the Windsor Manor joint venture during the year ended December 31, 20152016 of approximately $2.2 million, which resulted from excess proceeds on refinancing the joint venture’s debt.
For the year ended December 31, 2014, we received approximately $1.9 million of operating distributions from our two investments in unconsolidated entities held during the period. In August 2014, we acquired our co-venture partner’s 10% interest in the Montecito joint venture for approximately $1.6 million. As a result of this transaction, we own 100% of the Montecito joint venture and began consolidating all of the assets, liabilities and results of operations in our consolidated financial statements upon acquisition. Refer to Item 8. “Financial Statements and Supplementary Data” — Note 3. “Acquisitions – Purchase of Controlling Interest in Montecito Joint Venture” for additional information.
Net Cash Provided by Operating Activities
We experienced positive cash flow from operating activities for the years ended December 31, 2017, 2016 2015 and 20142015 of approximately $73.4$75.2 million, $43.5$74.5 million and $19.3$43.5 million, respectively. The change in cash flows from operating activities for the year ended December 31, 20162017 as compared to the year ended December 31, 20152016 was primarily the result of the following:
an increase in total revenues and net operating income (“NOI”) for the year ended December 31, 2016,2017, as compared to the year ended December 31, 2015,2016, primarily as the result of having 137 consolidated operating properties in 2017 as compared to 134 consolidated operating properties in 2016, as compared to 132 consolidated operating properties in 2015, some of which were not owned for the entire period;
lower cash flows from operations being used to fund reduced or “free rent” periods for the year ended December 31, 2017, as compared to the year ended December 31, 2016, primarily reflective of timing of rental payments across periods as there was one single tenant property under a decrease“free rent” period for part of 2017; whereas, there were two single tenant properties that were under “free rent” periods for part of 2016; and
an increase in net cash flows from operations resulting from favorable changes in operating assets and liabilities and lower acquisition fees and expenses;
offset by an increase in asset management fees resulting primarily from lower expense support amounts across periods, the acquisition of Cobalt Rehabilitation Hospital of New Orleans in October 2016 and the completion of seven development properties and one expansion project subsequent to September 30, 2016;
an increase in lease incentives paid in connection with the build-out of space for certain tenants entering into new leases or extending existing leases at our MOBs in which we paid $5.4 million during the year ended December 31, 20162017, as compared to $13.2 million during the year ended December 31, 2015; and
a decrease in acquisition fees and expenses for the year ended December 31, 2016, as we acquired one operating property for approximately $28.6 million, compared to the year ended December 31, 2015, in which we acquired 39 operating properties totaling $880.9 million. We consider acquisition2016;
payment of financing coordination fees, legal fees and expensesother third-party costs associated to the refinancing of our Bonaventure and Capital Health mortgage loans which were expensed for the year ended December 31, 2017 as the refinancing was determined to be funded from Other Sources, buta loan modification for accounting purposes. There were no similar such amounts are treated as an operating activityexpenses recognized in accordance with GAAP;
|
|
a net increase in asset management fees resulting from higher average assets under management across periods; and
an increase in general and administrative expensesinterest expense paid resulting from higher average assets under management across periods.debt outstanding as well as higher interest rates for the year ended December 31, 2017, as compared to the year ended December 31, 2016
Expense Support Agreements
Pursuant to the expense support agreements, our Advisor and Property Manager agreed to forgo the payment of fees in cash and accept forfeitable restricted common stock (“Restricted Stock”) for services in an amount equal to the positive excess, if any, of (a) aggregate stockholder cash distributions declared for the applicable quarter, over (b) our aggregate modified funds from operations, as defined (“Original Expense Support Agreements”). The Advisor expense support amount was determined for each calendar quarter, on a non-cumulative basis, on each quarter-end date ("Original Determination Date”). The Property Manager expense support amount was determined for each calendar quarter, on a non-cumulative basis, after the calculation of the Advisor expense support amount pursuant to the Property Manager Expense Support Agreement on each quarter-end date. The Restricted Stock is subordinated and forfeited to the extent that shareholders do not receive their invested capital plus a 6% cumulative noncompounded annual return upon ultimate liquidity of the Company. Any amounts settled, and for which restricted stock shares were issued, pursuant to the Original Expense Support Agreements have been permanently settled and we have no further obligation to pay such amounts to the Advisor or the Property Manager.
In March 2016,February 2017, our board of directors approved the thirdfourth amended and restated expense support agreements with both the Advisor and Property Manager that werebecame effective January 1, 2016 ("Amended Expense Support Agreements”)2017. These amendments limit the annual expense support amount, in the aggregate, to an annualized four percent of the weighted average of the Board’s most recent determination of estimated NAV per share and changedchange the calculation to exclude the impact of completed development properties for a specified period of time after the property is placed into service (as defined in the agreements). These amendments, along with the original agreements and determination date ofprevious amendments govern the respective affiliate’s expense support amounts from each calendar quarter on a non-cumulative basis,fees and expenses charged by the Advisor and Property Manager to each calendar year on a cumulative year-to-date basis ("Amended Determination Date”). the Company.
Under the terms of the Amended Expense Support Agreements,expense support agreements, for each quarter within a calendar expense support year, we will record a proportional estimate of the cumulative year-to-date period based on an estimate of expense support amounts for the calendar expense support year. Moreover, in exchange for services rendered and in consideration of the expense support provided under the Amended Expense Support Agreements,expense support agreements, we shallwill issue, within 90 days following each Amended Determination Date,the determination date, a number of shares of forfeitable restricted common stock (“Restricted StockStock”) equal to the quotient of the expense support amounts provided by theour Advisor and Property Manager for the preceding calendar year divided by theour then-current estimated NAV per share of common stock. The terms of the Amended Expense Support Agreementsexpense support agreements automatically renew for consecutive one year periods, subject to the right of theour Advisor or Property Manager to terminate their respective agreements upon 30 days’ written notice.
For the yearyears ended December 31, 2016 our cash from operating activities was positively impacted by approximately $2.9 million of a reduction in asset management fees resulting from the annual expense support amount expected to be settled in accordance with the terms of the Amended Expense Support Agreements. For the year ended December 31,and 2015, and 2014, our cash from operating activities were positively impacted by approximately $4.4$2.9 million and $4.9$4.4 million, respectively, of reductions in asset management fees resulting from the annual expense support amount settled in accordance with the terms of the Original Expense Support Agreements. The decrease in asset management fees settled in accordance with the applicable expense support agreements is generally reflective of our growth in NOI outpacingagreements. We did not recognize any expense support for the growth in our distributions, interest expense and other expense items.year ended
December 31, 2017. There have not been any amounts settled under the Property Manager Expense Support Agreement since its inception. Refer to Item 8. “Financial Statements and Supplementary Data” — Note 11. “Related Party Arrangements” for additional information.
In February 2017, our board of directors approved the fourth amended and restated expense support agreements with both the Advisor and Property Manager that are effective January 1, 2017. These amendments limit the annual expense support amount to four percent of the then-current estimated NAV per share and change the calculation to exclude the impact of completed development properties for a specified period of time after the property is placed into service (as defined in the agreement).
Uses of Liquidity and Capital Resources
Acquisitions
WeWhile we substantially completed our acquisition phase during 2016.2016, we acquired a five-acre parcel of unimproved land adjacent to one of our existing operating properties for approximately $1.1 million, including closing costs, during the year ended December 31, 2017. During the years ended December 31, 2016 2015 and 2014,2015, we acquired one 39, and 3539 consolidated operating properties, respectively, for an aggregate purchase price paid of approximately $28.1 million $866.3 million, and $869.5$866.3 million, respectively, net of liabilities assumed. The acquired operating properties were spread across our targeted asset classes and located in one, 20, and 14 different states, respectively, which allowed us to expand both the variety of our asset classes and the geographical diversification of our healthcare investment portfolio. During the years ended December 31, 2016, 2015 and 2014, our total leasable square footage increased by approximately 0.1 million, 2.0 million, and 1.6 million, respectively, related to acquisitions. There was no increase in total units in the current year as a result of acquisitions. During the years ended December 31, 2015 and 2014, our total units increased by approximately 1,786, and 1,509, respectively, related to acquisitions.
Development Properties
In connection with our seniors housing and post-acute care developments, we funded approximately $47.9 million, $95.1 million $73.6 million and $47.2$73.6 million in development costs during the years ended December 31, 2017, 2016 and 2015, and 2014, respectively. Pursuant toDuring the development agreements for the active properties under development as ofyear ended December 31, 2016,2017, we completed the construction and placed into service the Welbrook Transitional Care Grand Junction, Waterstone on Augusta, Wellmore of Lexington and Dogwood Forest of Grayson development properties, as well as the Brookridge Heights Assisted Living & Memory Care and Tranquility of Fredericktowne expansion projects. We expect to fund approximately $47.0$1.4 million of additional development, and other costs. We expect to fund the remaining developmentpre-leasing, marketing and other costs primarily from construction loans on eachas our properties with recently completed development or other cash flows from financing activities.
In Februaryduring the year ended December 31, 2017 we received certificatescontinue through their respective lease-up phases in 2018. On certain of occupancy at the Welbrook Senior Living Grand Junction and Waterstone on Augustathese development properties, and are inwe have the processability to fund up to approximately $1.4 million of obtaining licensure at both properties in order to open to residents, which is expected to occur by April 2017. We expect to incursuch additional pre-leasing and marketing activities as these properties continue throughcosts from the lease-up phase in 2017 and 2018.related construction loans.
As a result of our completed seniors housing developments continuing to movelease-up towards and/or achieving stabilization, we expect to pay additional amounts in future periods to the respective third-party developers as holders of a promoted interest in these properties. We continue to monitor the lease-up of these properties to determine whether the established performance metrics of their respective promoted interest agreements have been met. During the year ended December 31, 2017, we paid an approximate $2.0 million distribution to the holder of a promoted interest related to the Dogwood Forest of Acworth development, and in January 2018 we paid an approximate $1.0 million distribution to the holder of a promoted interest related to the HarborChase of Villages Crossing development, which was accrued as of December 31, 2017. During the year ended December 31, 2016, we paid distributions to the holders of promoted interest of the Dogwood Forest of Acworth and Wellmore of Tega Cay developments of approximately $1.9 million and $2.8 million, respectively. In addition,We expect to pay additional amounts in future periods to the respective third-party developers as holders of a promoted interest in these properties to the extent the established performance metrics are met. However, no other performance metrics were met or probable of being met during the year ended December 31, 2016, we have accrued approximately $2.0 million related to Dogwood Forest of Acworth that will be retained until the completion of the Dogwood Forest of Grayson development, which is expected to occur in the third quarter of 2017. Our obligation to pay the promoted interest on the Dogwood Forest of Acworth property is not impacted by the sale of the property in November 2016.
Debt Repayments
During the year ended December 31, 2014,2017, we made distributionspaid approximately $136.4 million of approximately $2.0total repayments which was comprised of $64.9 million in repayments on our Revolving Credit Facility, $49.6 million in repayments on our mortgage loans for Knoxville Medical Office Properties and the Claremont Medical Office property prior to a third-party developer, who is a holdertheir scheduled maturities and $21.9 million of promoted interest related to our HarborChase of Villages Crossing.
Debt Repayments
scheduled repayments. During the year ended December 31, 2016, we paid approximately $174.5 million of total repayments which was comprised of $120.3 million in repayments on our Revolving Credit Facility, $34.4 million in repayments on our mortgage loans for the Wellmore of Tega Cay Property and Raider Ranch Community, prior to the scheduled maturities, and $19.8 million of scheduled repayments. During the year ended December 31, 2015, we paid approximately $437.2 million of total repayments which was comprised of $321.4 million in debt repayments on our Revolving Credit Facility, $93.5 million in repayments on our mortgage loans for the Perennial Communities, Medical Portfolio I Properties, Dogwood Forest of Acworth and HarborChase of Villages Crossing prior to their scheduled maturities, $4.4 million of prepayments on our mortgage loan for the Capital Health Communities related to monies received under a yield guaranty agreement and $17.9 million of scheduled repayments. During the year ended December 31, 2014, we paid approximately $286.3 million of total repayments which was comprised of $259.3 million in repayments on our Revolving Credit Facility, $15.0 million in repayments on our unsecured bridge loan financing, $9.4 million of scheduled repayments and $2.6 million of prepayments on our Capital Health mortgage loan related to monies received under a yield guaranty agreement. Refer to Item 8. “Financial Statements and Supplementary Data” – Note 9. “Contingent Purchase Price Consideration” for additional information.
As of December 31, 2016,2017, we have approximately $263.8$254.3 million of debt obligations coming due in the latter part of 2017;2018, of which approximately $194.9$182.0 million relates to the Revolving Credit Facility and approximately $6.8 million relates to Northwest Medical Park pursuant to which we hold two 12-month extension options and we currently anticipate exercising one of our options. The remaining $68.9$65.5 million of debt obligations coming due in 2018 is comprised of the following: (1) approximately $19.9$22.8 million of scheduled repayments on various properties; (2) an approximate $18.1$25.1 million debt maturity in August 2018 related to Calvert Medical Office Properties; and (3) an approximate $17.6 million debt maturity in September 20172018 related to Lee Hughes Medical Building for whichBuilding. While the combination of the undrawn availability under our Revolving Credit Facility of approximately $28.4 million as of December 31, 2017 and our forecasted 2018 cash flows from operations are expected to be in excess of the $65.5 million of remaining debt obligations coming due in 2018, we hold a 12-month extension option that we currently anticipate exercising; (3) an approximate $6.9 million debt maturity in October 2017 relatedcontinue to Northwest Medical Park for which we hold a 12-month extension option that we currently anticipate exercising; and (4) an approximate $24.0 million debt maturity in December 2017 related to the development of our Watercrest at Katy community. On an ongoing basis, we monitor our debt maturities, engage in dialogues with third-party lenders aboutexplore various financing scenarios andwhich include, but are currently working and analyzing our overall portfolio borrowings in advance ofnot limited to, the maturity datesfollowing: (1) add certain of the aforementioned properties to the unencumbered pool of assets supporting our Credit Facilities, which would increase the undrawn availability under our Revolving Credit Facility as there is approximately $59.6 million of additional borrowing capacity as of December 31, 2017, (2) use proceeds from the sale of real estate discussed above in order to repay certain debt obligations coming due, and/or (3) obtain proceeds from Other Sources, including, but not limited to, determine the optimal borrowing strategy.refinancing of existing debt obligations.
Stock Issuance and Offering Costs
Under the terms of the Offerings, certain affiliates and third-party broker dealers were entitled to receive selling commissions of up to 7% of gross offering proceeds on all shares sold, a marketing support fee of up to 3% of gross offering proceeds, and reimbursement of actual expenses incurred in connection with the Offerings. In accordance with our articles of incorporation and the advisory agreement, the total amount of selling commissions, marketing support fees, due diligence expense reimbursements, and organizational and other offering costs to be paid by us may not exceed 15% of the gross aggregate proceeds of our Offerings.
During the years ended December 31, 2016 2015 and 2014,2015, we paid approximately $0.03 million, $59.0 million, and $58.9$59.0 million, respectively, of stock issuance and offering costs. There were no stock offering and issuance costs paid during the year ended December 31, 2017.
Lease Incentives
During the years ended December 31, 2017, 2016 2015 and 2014,2015, we paid approximately $7.6 million, $5.4 million, $13.2 million, and $1.0$13.2 million, respectively, of costs on behalf of our tenants as lease incentives in connection with the build-out of space for certain tenants entering into new leases or extending existing leases at our MOBs. Lease incentives are capitalized as deferred rent and amortized as straight-line rent over the respective lease terms. While we expect the impact of these lease incentives to adversely impact our cash flows from operations in the near term, we anticipate that the new leasing activity will contribute to same-store NOI growth in future periods and that the extension of existing lease terms could increase the value of our properties.
Common Stock Redemptions
We redeem shares pursuant to our redemption plan, which is designed to provide eligible stockholders with limited interim liquidity. During the year ended December 31, 2017, we received redemption requests for 4.7 million shares at an average redemption price of $9.99 per share of which approximately $46.0 million was paid and approximately $11.7 million was payable as of December 31, 2017. During the year ended December 31, 2016, we received redemption requests for 3.7 million shares at an average redemption price of $9.73 per share of which approximately $28.6 million was paid and approximately $10.4 million was payable as of December 31, 2016. During the year ended December 31, 2015, we received redemption requests for 1.0 million shares at an average redemption price of $9.51 per share of which approximately $7.4 million was paid and approximately $2.7 million was payable as of December 31, 2015. During
The redemption requests received during the year ended December 31, 2014, we2017 exceeded proceeds received from our Reinvestment Plan by approximately $4.1 million, however, our board of directors approved the excess redemptions. We expect redemption requests received during the quarter ended March 31, 2018 will exceed proceeds received from our Reinvestment Plan by approximately $6.3 million and intend to seek approval from our board of directors to approve the excess redemptions. There is no guarantee that any funds will be set aside under the Reinvestment Plan or otherwise made available for 0.3 millionthe redemption plan during any period during which redemptions may be requested.
We are not obligated to redeem shares at an averageunder our redemption priceplan. Our board of $9.24 per sharedirectors will continue to evaluate the aggregate amount of which approximately $2.2 million was paidfunds that will be used to redeem shares pursuant to the redemption plan on a quarterly basis and approximately $0.9 million was payablewill determine the amount of shares to be redeemed based on what it believes to be in the best interest of the Company and our stockholders as the redemption of December 31, 2014.shares dilutes the amount of cash available for other corporate purposes.
See Item 5. “Market for Registrant’s Common Equity, Related Stockholder Matters and Issuer Purchases of Equity Securities – Redemption Plan” for additional information related to the redemption of common stock.
Distributions
In order to qualify as a REIT, we are required to make distributions, other than capital gain distributions, to our stockholders each year in the amount of at least 90% of our taxable income. We may make distributions in the form of cash or other property, including distributions of our own securities. While we generally expect to pay distributions from cash flows provided by operating activities, we have and may continue to cover periodic shortfalls between distributions paid and cash flows from operating activities with proceeds from Other Sources.
In September 2017, the Company’s board of directors approved an increase in the Company’s quarterly cash distribution, from $0.10581 to $0.11639 per share, effective beginning the third quarter of 2017.
The following table represents total cash distributions declared, distributions reinvested and cash distributions per share for years ended December 31, 2017, 2016 2015 and 20142015 (in thousands, except per share data):
|
|
|
| Distributions Paid (1) |
|
|
|
|
|
|
|
|
|
|
|
|
|
| Distributions Paid (1) |
|
|
|
|
|
|
|
|
|
|
|
|
|
|
|
|
| ||||||||||||||||||||
Periods |
| Cash Distributions per Share |
| Total Cash Distributions Declared |
| Reinvested via Reinvestment Plan |
| Cash Distributions net of Reinvestment Proceeds |
| Stock Distributions Declared (Shares) |
| Stock Distributions Declared (at then-current offering price) |
|
| Total Cash and Stock Distributions Declared (2) |
| Cash Flows Provided by Operating Activities (3) |
| Cash Distributions per Share |
|
| Total Cash Distributions Declared |
|
| Reinvested via Reinvestment Plan |
|
| Cash Distributions net of Reinvestment Proceeds |
|
| Stock Distributions Declared (Shares) |
|
| Stock Distributions Declared (at then-current offering price) |
|
| Total Cash and Stock Distributions Declared (2) |
|
| Cash Flows Provided by Operating Activities (3)(4) |
| |||||||||||||||
2017 Quarters |
|
|
|
|
|
|
|
|
|
|
|
|
|
|
|
|
|
|
|
|
|
|
|
|
|
|
|
|
|
|
|
| ||||||||||||||||||||||||
First |
| $ | 0.10581 |
|
| $ | 18,525 |
|
| $ | 10,412 |
|
| $ | 8,113 |
|
| ― |
|
| $ | — |
|
| $ | 18,525 |
|
| $ | 18,667 |
| |||||||||||||||||||||||||
Second |
|
| 0.10581 |
|
|
| 18,515 |
|
|
| 10,305 |
|
|
| 8,210 |
|
|
| — |
|
|
| — |
|
|
| 18,515 |
|
|
| 22,815 |
| ||||||||||||||||||||||||
Third |
|
| 0.11639 |
|
|
| 20,363 |
|
|
| 11,271 |
|
|
| 9,092 |
|
|
| — |
|
|
| — |
|
|
| 20,363 |
|
|
| 15,460 |
| ||||||||||||||||||||||||
Fourth |
|
| 0.11639 |
|
|
| 20,329 |
|
|
| 11,232 |
|
|
| 9,097 |
|
|
| — |
|
|
| — |
|
|
| 20,329 |
|
|
| 18,304 |
| ||||||||||||||||||||||||
Total |
| $ | 0.44440 |
|
| $ | 77,732 |
|
| $ | 43,220 |
|
| $ | 34,512 |
|
|
| — |
|
| $ | — |
|
| $ | 77,732 |
|
| $ | 75,246 |
| ||||||||||||||||||||||||
2016 Quarters |
|
|
|
|
|
|
|
|
|
|
|
|
|
|
|
|
|
|
|
|
|
|
|
|
|
|
|
|
|
|
|
|
|
|
|
|
|
|
|
|
|
|
|
|
|
|
|
|
|
|
|
|
|
|
|
|
First |
| $ | 0.1058 |
| $ | 18,454 |
| $ | 10,725 |
| $ | 7,729 |
| ― |
| $ | ― |
|
| $ | 18,454 |
| $ | 16,008 |
| $ | 0.10581 |
|
| $ | 18,454 |
|
| $ | 10,725 |
|
| $ | 7,729 |
|
|
| — |
|
| $ | — |
|
| $ | 18,454 |
|
| $ | 16,008 |
|
Second |
|
| 0.1058 |
|
| 18,538 |
|
| 10,658 |
|
| 7,880 |
| ― |
|
| ― |
|
|
| 18,538 |
|
| 18,741 |
|
| 0.10581 |
|
|
| 18,538 |
|
|
| 10,658 |
|
|
| 7,880 |
|
|
| — |
|
|
| — |
|
|
| 18,538 |
|
|
| 18,741 |
|
Third |
|
| 0.1058 |
|
| 18,496 |
|
| 10,607 |
|
| 7,889 |
| ― |
|
| ― |
|
|
| 18,496 |
|
| 22,235 |
|
| 0.10581 |
|
|
| 18,496 |
|
|
| 10,607 |
|
|
| 7,889 |
|
|
| — |
|
|
| — |
|
|
| 18,496 |
|
|
| 23,362 |
|
Fourth |
|
| 0.1058 |
|
| 18,520 |
|
| 10,564 |
|
| 7,956 |
| ― |
|
| ― |
|
|
| 18,520 |
|
| 16,420 |
|
| 0.10581 |
|
|
| 18,520 |
|
|
| 10,564 |
|
|
| 7,956 |
|
|
| — |
|
|
| — |
|
|
| 18,520 |
|
|
| 16,420 |
|
Total |
| $ | 0.4232 |
| $ | 74,008 |
| $ | 42,554 |
| $ | 31,454 |
| ― |
| $ | ― |
|
| $ | 74,008 |
| $ | 73,404 |
| $ | 0.42324 |
|
| $ | 74,008 |
|
| $ | 42,554 |
|
| $ | 31,454 |
|
|
| — |
|
| $ | — |
|
| $ | 74,008 |
|
| $ | 74,531 |
|
|
|
|
|
|
|
|
|
|
|
|
|
|
|
|
|
|
|
|
|
|
|
|
|
| ||||||||||||||||||||||||||||||||
2015 Quarters |
|
|
|
|
|
|
|
|
|
|
|
|
|
|
|
|
|
|
|
|
|
|
|
|
|
|
|
|
|
|
|
|
|
|
|
|
|
|
|
|
|
|
|
|
|
|
|
|
| |||||||
First |
| $ | 0.1058 |
| $ | 13,248 |
| $ | 7,648 |
| $ | 5,600 |
| 943 |
| $ | 9,977 |
|
| $ | 23,225 |
| $ | 11,317 |
| $ | 0.10581 |
|
| $ | 13,248 |
|
| $ | 7,648 |
|
| $ | 5,600 |
|
|
| 943 |
|
| $ | 9,977 |
|
| $ | 23,225 |
|
| $ | 11,317 |
|
Second |
|
| 0.1058 |
|
| 14,895 |
|
| 8,619 |
|
| 6,276 |
| 1,060 |
|
| 11,215 |
|
|
| 26,110 |
|
| 10,757 |
|
| 0.10581 |
|
|
| 14,895 |
|
|
| 8,619 |
|
|
| 6,276 |
|
|
| 1,060 |
|
|
| 11,215 |
|
|
| 26,110 |
|
|
| 10,757 |
|
Third |
|
| 0.1058 |
|
| 16,748 |
|
| 9,808 |
|
| 6,940 |
| 1,193 |
|
| 12,620 |
|
|
| 29,368 |
|
| 10,319 |
|
| 0.10581 |
|
|
| 16,748 |
|
|
| 9,808 |
|
|
| 6,940 |
|
|
| 1,193 |
|
|
| 12,620 |
|
|
| 29,368 |
|
|
| 10,319 |
|
Fourth |
|
| 0.1058 |
|
| 18,310 |
|
| 10,753 |
|
| 7,557 |
| ― |
|
| ― |
|
|
| 18,310 |
|
| 11,124 |
|
| 0.10581 |
|
|
| 18,310 |
|
|
| 10,753 |
|
|
| 7,557 |
|
|
| — |
|
|
| — |
|
|
| 18,310 |
|
|
| 11,124 |
|
Total |
| $ | 0.4232 |
| $ | 63,201 |
| $ | 36,828 |
| $ | 26,373 |
| 3,196 |
| $ | 33,812 |
|
| $ | 97,013 |
| $ | 43,517 |
| $ | 0.42324 |
|
| $ | 63,201 |
|
| $ | 36,828 |
|
| $ | 26,373 |
|
|
| 3,196 |
|
| $ | 33,812 |
|
| $ | 97,013 |
|
| $ | 43,517 |
|
|
|
|
|
|
|
|
|
|
|
|
|
|
|
|
|
|
|
|
|
|
|
|
|
| ||||||||||||||||||||||||||||||||
2014 Quarters |
|
|
|
|
|
|
|
|
|
|
|
|
|
|
|
|
| |||||||||||||||||||||||||||||||||||||||
First |
| $ | 0.1014 |
| $ | 6,147 |
| $ | 3,349 |
| $ | 2,798 |
| 455 |
| $ | 4,614 |
|
| $ | 10,761 |
| $ | 6,277 | ||||||||||||||||||||||||||||||||
Second |
|
| 0.1014 |
|
| 7,145 |
|
| 3,916 |
|
| 3,229 |
| 529 |
|
| 5,364 |
|
|
| 12,509 |
|
| 5,035 | ||||||||||||||||||||||||||||||||
Third |
|
| 0.1014 |
|
| 8,385 |
|
| 4,630 |
|
| 3,755 |
| 621 |
|
| 6,295 |
|
|
| 14,680 |
|
| 7,361 | ||||||||||||||||||||||||||||||||
Fourth |
|
| 0.1029 |
|
| 10,242 |
|
| 5,821 |
|
| 4,421 |
| 751 |
|
| 7,946 | (4) |
|
| 18,188 |
|
| 599 | ||||||||||||||||||||||||||||||||
Total |
| $ | 0.4071 |
| $ | 31,919 |
| $ | 17,716 |
| $ | 14,203 |
| 2,356 |
| $ | 24,219 |
|
| $ | 56,138 |
| $ | 19,272 | ||||||||||||||||||||||||||||||||
_____________
FOOTNOTES:
(1) | Represents the amount of cash used to fund distributions and the amount of distributions paid which were reinvested in additional shares through our Reinvestment Plan. |
| For the years ended December 31, 2017, 2016 |
| Cash flows from operating activities calculated in accordance with GAAP are not necessarily indicative of the amount of cash available to pay distributions and as such our board of directors also uses other measures such as FFO and MFFO in order to evaluate the level of distributions. |
(4) |
|
Refer to Item 5. “Market for Registrant’s Common Equity, Related Stockholder Matters and Issuer Purchases of Equity Securities - Distributions” for additional information regarding our monthly cash and stock distributions as well as the tax composition of our distributions.
We are not aware of any material trends or uncertainties, favorable or unfavorable that may be reasonably anticipated to have a material impact on either capital resources or the revenues or income to be derived from the acquisition and operation of properties, loans and other permitted investments, other than those referred to in the risk factors identified in Item 1A. “Risk Factors”.
Results of Operations
The following discussion and analysis should be read in conjunction with the accompanying consolidated financial statements and the notes thereto.
Fiscal year ended December 31, 2017 as compared to the fiscal year ended December 31, 2016
As of December 31, 2017, we owned 137 consolidated real estate investment properties, which excludes unconsolidated investments and unimproved land, and our portfolio consisted of 5,984 units operated under management agreements with third-party operators and approximately 5.5 million rentable square feet that was 96.3% leased to third-party tenants.
|
| Investment count |
| |||||
|
| as of December 31, |
| |||||
Consolidated operating investment types: |
| 2017 |
|
| 2016 |
| ||
Seniors housing leased |
|
| 15 |
|
|
| 16 |
|
Seniors housing managed |
|
| 51 |
|
|
| 48 |
|
Medical office leased |
|
| 54 |
|
|
| 54 |
|
Post-acute care leased |
|
| 12 |
|
|
| 11 |
|
Acute care leased |
|
| 5 |
|
|
| 5 |
|
|
|
| 137 |
|
|
| 134 |
|
Rental Income and Tenant Reimbursements. Rental income and tenant reimbursements was approximately $149.5 million for the year ended December 31, 2017 as compared to $144.7 million for the year ended December 31, 2016. The increase in rental income and tenant reimbursements across periods primarily resulted from: (1) the transition of Wellmore of Tega Cay in August 2016 from being managed pursuant to a third-party management contract under a RIDEA structure to being leased to a third-party operator under a triple-net lease arrangement (“Tega Cay Managed to Lease Transition”); (2) the acquisition of Cobalt Rehabilitation Hospital of New Orleans in October 2016; (3) the completion of Welbrook Transitional Care Grand Junction development and the commencement of the related lease in March 2017; and (4) the completion of Wellmore of Lexington development and the commencement of the related lease in July 2017. These were offset by the transition of the Parc Communities in July 2017 from being leased to a third-party operator under a triple-net lease arrangement to being managed pursuant to a third-party management contract under a RIDEA structure (“Parc Communities Leased to Managed Transition”).
Resident Fees and Services. Resident fees and services income was approximately $248.9 million for the year ended December 31, 2017 as compared to approximately $232.4 million for the year ended December 31, 2016. The increase in resident fees and services is primarily a result of year-over-year growth in occupancy rates at our value-add seniors housing properties, the completion of three seniors housing developments in 2016, the completion of our four remaining developments and expansions in 2017, increased revenues from the Parc Communities Leased to Managed Transition, as well as increased revenues from the lease-up of additional assisted living units in 2017 that resulted from our conversion of skilled nursing units to assisted living units at our Isle at Cedar Ridge and Isle at Watercrest - Bryan communities in 2016; offset by the sale of Dogwood Forest of Acworth in November 2016 and the Tega Cay Managed to Lease Transition.
Property Operating Expenses. Property operating expenses were approximately $195.1 million for the year ended December 31, 2017 as compared to approximately $184.6 million for the year ended December 31, 2016. The increase in property operating expenses is primarily a result of increased property operating expenses at our value-
add seniors housing properties due to year-over-year growth in occupancy rates, our completed developments either becoming operational in 2017 or being operational for the entirety of 2017 as compared with a partial year in 2016, the Parc Communities Leased to Managed Transition, as well as the conversion of skilled nursing units to assisted living units at our Isle at Cedar Ridge and Isle at Watercrest - Bryan communities; offset by the sale of Dogwood Forest of Acworth in November 2016 and the Tega Cay Managed to Lease Transition.
General and Administrative. General and administrative expenses for the year ended December 31, 2017 were approximately $13.0 million as compared to approximately $12.8 million for the year ended December 31, 2016. General and administrative expenses were comprised primarily of personnel expenses of affiliates of our Advisor, directors’ and officers’ insurance, franchise taxes, accounting and legal fees, and board of director fees. The increase in general and administrative expenses were primarily attributed to the increase in third-party costs associated with the refinancing of mortgage loans on some of our properties that were determined to be loan modifications for accounting purposes.
Acquisition Fees and Expenses. Acquisition fees and expenses for the year ended December 31, 2017 were approximately $0.2 million of which approximately $0.2 million was capitalized as a component of the cost of the assets acquired and allocated on a relative fair value basis. Acquisition fees and expenses for the year ended December 31, 2016 were approximately $1.2 million of which approximately $0.2 million was capitalized as a component of the cost of the assets acquired and allocated on a relative fair value basis. We expect acquisition fees and expenses to remain at low levels in future periods as we anticipate additional purchases of real estate will be limited.
Asset Management Fees. We incurred approximately $30.2 million in asset management fees payable to our Advisor during the year ended December 31, 2017 as compared to approximately $29.1 million for the year ended December 31, 2016. For the years ended December 31, 2017 and 2016, approximately $0.5 million and $0.8 million, respectively, of asset management fees were capitalized as a component of the cost of the assets acquired and allocated on a relative fair value basis. We did not recognize expense support during the year ended December 31, 2017. For the year ended December 31, 2016, approximately $2.9 million in asset management fees were settled in accordance with the terms of the expense support agreements. As described in Item 8. “Financial Statements and Supplementary Data” – Note 11. “Related Party Arrangements,” our 2016 asset management fees were reduced because the shares of Restricted Stock issued to the Advisor as payment for asset management services rendered, were valued at zero— the lowest possible value estimated at vesting. Monthly asset management fees equal to 0.08334% of invested assets are paid to the Advisor for management of our real estate assets, including our pro rata share of our investments in unconsolidated entities, loans and other permitted investments.
Financing Coordination Fees. Financing coordination fees payable to the Advisor were approximately $3.6 million for the year ended December 31, 2017, of which approximately $0.9 million was capitalized as loan costs and reduced mortgages and other notes payable, net in the accompanying consolidated balance sheets. Financing coordination fees associated with the refinancing of debt are either expensed or capitalized based on whether such refinancings are determined to represent loan modifications or loan extinguishments for accounting purposes. There were no financing coordination fees for the year ended December 31, 2016.
Depreciation and Amortization. Depreciation and amortization expenses for the year ended December 31, 2017 were approximately $107.9 million and approximately $123.0 million for the year ended December 31, 2016. Depreciation and amortization expenses are comprised of depreciation and amortization of the buildings, equipment, land improvements and in-place leases related to our real estate portfolio. The decrease in depreciation and amortization expense across periods resulted from several intangible assets related to our seniors housing investments being fully amortized by the end of 2016.
Interest Expense and Loan Cost Amortization. Interest expense and loan cost amortization for the year ended December 31, 2017 was approximately $68.3 million of which $2.1 million was capitalized as development costs relating to our real estate under development. Interest expense and loan cost amortization for the year ended December 31, 2016 was approximately $61.1 million of which approximately $2.8 million was capitalized as development costs relating to our real estate under development. Approximately $7.0 million of the increase for the year ended December 31, 2017 was primarily the result of an increase in our average debt outstanding to approximately $1.6 billion as compared to approximately $1.5 billion for the year ended December 31, 2016 and the increase in LIBOR for the year ended December 31, 2017 as compared to year ended December 31, 2016. In addition, during the year ended December 31, 2017, we incurred a loss on the extinguishment of debt of
approximately $0.2 million related to the refinancing of our mortgage loans on the Knoxville Medical Office Properties and the Claremont Medical Office property.
Income Tax Benefit (Expense). For each of the years ended December 31, 2017 and 2016, we recognized federal and state income tax benefit related to our properties of approximately $8.4 million and expense of approximately $0.4 million, respectively. The Company’s TRS entities have historically generated net operating loss carry-forwards for federal and state purposes since inception. However, due to increases in resident fees and services discussed above as well as the resetting in 2017 of certain leases between our TRS entities and the REIT, our TRS entities generated taxable income for the year ended December 31, 2017 and are expected to generate taxable income in future periods. As such, the tax provision for 2017 includes an approximate $9.1 million reversal of a previously recorded valuation allowance on our TRS entities’ deferred tax assets.
Net Loss Attributable to Noncontrolling Interests. During the years ended December 31, 2017 and 2016, net loss attributable to our co-venture partners was approximately $0.4 million and $0.1 million, respectively. In accordance with the provisions of each joint venture agreement, we allocate loss from operations to our co-venture partners based on their percentage ownership in each joint venture. These losses are primarily related to our Watercrest at Katy and Fieldstone at Pear Orchard joint ventures, which both completed construction in 2016 and are in the lease-up phase.
Fiscal year ended December 31, 2016 as compared to the fiscal year ended December 31, 2015
As of December 31, 2016, we owned 134 consolidated real estate investment properties and our portfolio consisted of 5,432 units operated under management agreements with third-party operators and approximately 5.8 million leasable square feet that was 95.3% leased to third-party tenants.
|
| Investment count as of |
| |||||
|
| December 31, |
| |||||
Consolidated operating investment types: |
| 2016 |
|
| 2015 |
| ||
Seniors housing leased |
|
| 16 |
|
|
| 15 |
|
Seniors housing managed |
|
| 48 |
|
|
| 48 |
|
Medical office leased |
|
| 54 |
|
|
| 54 |
|
Post-acute care leased |
|
| 11 |
|
|
| 10 |
|
Acute care leased |
|
| 5 |
|
|
| 5 |
|
|
|
| 134 |
|
|
| 132 |
|
Rental Income from Operating Leases.and Tenant Reimbursements. Rental income from operating leasesand tenant reimbursements was approximately $124.9$144.7 million for the year ended December 31, 2016 as compared to $101.1$117.1 million for the year ended December 31, 2015. The increase in rental income from operating leasesand tenant reimbursements resulted from the leased properties acquired during 2015 being held for the entire year as well as the increased rental income resulting from the tenant workouts described above in “Liquidity and Capital Resources – Tenant Workouts.Workout.”
Resident Fees and Services. Resident fees and services income was approximately $232.4 million for the year ended December 31, 2016 as compared to approximately $183.4 million for the year ended December 31, 2015. The increase in resident fees and services iswas a result of the managed properties acquired during 2015 held for entire year as well as the continued lease-up of completed developments and value-add properties across periods. The increase in revenue for the year was partially offset by our decision to convert certain skilled nursing units to assisted living units at our Isle at Cedar Ridge and Isle at Watercrest - Bryan communities.
Tenant Reimbursement Income. Tenant reimbursement income was approximately $19.8 million for the year ended December 31, 2016 as compared to $16.0 million for the year ended December 31, 2015. This amount is comprised of common area maintenance (“CAM”) revenue which increased as a result of the medical office leased properties acquired during 2015 being held for the entire year.
Property Operating Expenses. Property operating expenses were approximately $184.6 million for the year ended December 31, 2016 as compared to approximately $149.7 million for the year ended December 31, 2015. This increase iswas a result of the properties acquired during 2015 being held for the entire year.
General and Administrative. General and administrative expenses for the year ended December 31, 2016 were approximately $12.8 million as compared to approximately $10.1 million for the year ended December 31, 2015. General and administrative expenses were comprised primarily of personnel expenses of affiliates of our Advisor, directors’ and officers’ insurance, franchise taxes, accounting and legal fees, and board of director fees. The increase in general and administrative expense was primarily attributed to increased costs as a result of the growth of
our portfolio from the prior comparable periods. Specifically, we incurred increased personnel expenses reimbursable to the Advisor due to increased accounting, legal and administrative activity as a result of the growth of the portfolio and related reporting.
Acquisition Fees and Expenses. Acquisition fees and expenses for the year ended December 31, 2016 were approximately $1.2 million of which approximately $0.2 million was capitalized as real estate under development. We incurred approximately $25.7 million for the year ended December 31, 2015 of which approximately $4.2 million was capitalized as real estate under development. During the year ended December 31, 2016, we completed the acquisition of the Cobalt Rehabilitation Hospital of New Orleans. Acquisition fees and expenses for the year ended December 31, 2015 related to the acquisition of 39 operating properties totaling approximately $880.9 million. We expect acquisition fees and expenses to remain at low levels in future periods as we anticipate additional purchases of real estate will be limited.
Asset Management Fees. We incurred approximately $29.1 million in asset management fees payable to our Advisor during the year ended December 31, 2016 as compared to approximately $22.9 million for the year ended December 31, 2015. For years ended December 31, 2016 and 2015, approximately $2.9 million and $4.4 million, respectively, in asset management fees were settled in
accordance with the terms of the Amended Expense Support Agreements and the Original Expense Support Agreements, respectively,expense support agreements and approximately $0.8 million and $0.6 million, respectively, were capitalized as real estate under development. As described in Item 8. “Financial Statements and Supplementary Data” – Note 11. “Related Party Arrangements,” asset management fees were reduced because the shares of Restricted Stock which will be accepted byissued to the Advisor as payment for asset management services rendered, were valued at zero— the lowest possible value estimated at vesting. Monthly asset management fees equal to 0.08334% of invested assets are paid to the Advisor for management of our real estate assets, including our pro rata share of our investments in unconsolidated entities, loans and other permitted investments.
Property Management Fees. We incurred approximately $21.2 million in property management fees for the year ended December 31, 2016 and approximately $18.4 million for the year ended December 31, 2015. For the years ended December 31, 2016 and 2015, approximately $2.7 million and $3.6 million, respectively, were capitalized as real estate under development. Property management fees generally range from 2% to 5% of property revenues for leased properties, depending on the type of property, and are paid to third-party managers. However, an oversight fee equal to 1% of property revenues is paid to the Property Manager for those properties managed by a third-party. Overall property management fees primarily increased as a result of the increases in rental income from operating leases and tenant reimbursements as well as resident fees and services properties acquired during 2015 being operational for a full period.
Contingent purchase price consideration adjustment. For the years ended December 31, 2016 and 2015, adjustments for contingent purchase price consideration were approximately $0.3 million and $0.6 million, respectively. The adjustments in 2016 were related to Shores of Lake Phalen, Siena Pavilion VI and Superior Residences of Panama City. Refer to Item 8. “Financial Statements and Supplementary Data” — Note 9. “Contingent Purchase Price Consideration” for additional information. The adjustments in 2015 were related to the expiration of the Chestnut Commons Earn-out agreement and our Capital Health Yield Guaranty.
Impairment Provision. As described in “Liquidity and Capital Resources – Tenant Workouts,Workout,” during the year ended December 31, 2015, we recorded an impairment provision of $4.7 million to write-off the lease intangibles related to two of our specialty hospitals, as it was determined that the carrying value of these assets would not be recoverable. There were no impairments during the year ended December 31, 2016.
Loss on Lease Termination. During the year ended December 31, 2016, we recorded a loss on lease termination of approximately $0.8 million related to the bankruptcy reorganization of an anchor tenant at two of our medical office buildings as it was determined that certain deferred rents and other lease related assets would not be recoverable; refer to Item 7. “Management’s Discussion and Analysis of Financial Condition and Results of Operations – Tenant Workouts” for additional information. During the year ended December 31, 2015, we recorded a loss on lease termination of $0.9 million related to two of our specialty hospitals, as it was determined that the carrying value of certain deferred rent and lease incentives would not be recoverable.
Depreciation and Amortization. Depreciation and amortization expenses for the year ended December 31, 2016 were approximately $123.0 million and approximately $105.9 million for the year ended December 31, 2015. Depreciation and amortization expenses are comprised of depreciation and amortization of the buildings, equipment, land improvements and in-place leases related to our real estate portfolio. The increase in depreciation and amortization expense across periods resulted from the acquisition of properties during 2015 that were owned for the entire period and the result of development properties that became operational in 2016.
Interest Expense and Loan Cost Amortization. Interest expense and loan cost amortization for the year ended December 31, 2016 was approximately $61.1 million of which $2.8 million was capitalized as development costs relating to our real estate under development. Interest expense and loan cost amortization for the year ended December 31, 2015 was approximately $45.3 million of which approximately $2.3 million was capitalized as development costs relating to our real estate under development. Approximately $14.6 million of the increase for the year ended December 31, 2016 was primarily the result of an increase in our average debt outstanding to approximately $1.5 billion as compared to approximately $1.3 billion for the year ended December 31, 2015. In addition, during the year ended December 31, 2016, we incurred approximately $0.2 million in additional loan costs amortization related to debt obtained during the year ended December 31, 2016. Additionally, during the year ended December 31, 2016, we recorded a write-off of approximately $0.4 million in loan costs and paid an exit fee of approximately $1.1 million in connection with an early extinguishment of debt. During the year ended December 31, 2015, we recorded a write-off of approximately $0.7 million in loan costs and paid approximately $0.3 million on the derecognition of cash flow hedges in connection with the early extinguishment of debt.
Equity in Earnings (Loss) of Unconsolidated Entities. Our unconsolidated entities generated earnings of approximately $0.3 million for the year ended December 31, 2016, as compared to losses of approximately ($0.6) million for the year ended December 31, 2015 relating to our investment in the Windsor Manor joint venture. Equity in earnings (loss) of unconsolidated entities is determined using the hypothetical liquidation method book value (“HLBV”) method of accounting, which can create significant variability in earnings or loss from the joint venture while the preferred cash distributions that we anticipate to receive from the joint venture may be more consistent as result of our distribution preferences. The improved financial results across periods iswas partially attributable to the decision to transition the property manager in April 2016 at the five properties owned through the Windsor Manor joint venture.
Income Tax Expense. For each of the years ended December 31, 2016 and 2015, we recognized state income tax expense related to our properties of approximately $0.4 million.
Net Loss Attributable to Noncontrolling Interests. During the years ended December 31, 2016 and 2015, net loss attributable to our co-venture partners was approximately $0.1 million and $0.04 million, respectively. In accordance with the provisions of each joint venture agreement, we allocate loss from operations to our co-venture partners based on their percentage ownership in each joint venture. These losses are primarily related to our Watercrest at Katy joint venture, which completed the final phase of construction in July 2016.
Fiscal year ended December 31, 2015 as compared to the fiscal year ended December 31, 2014
As of December 31, 2015, we owned 132 consolidated real estate investment properties and our portfolio consisted of 5,253 units operated under management agreements with third-party operators and approximately 5.5 million leasable square feet that was 95.7% leased to third-party tenants.
|
| Investment count as of |
| ||
|
| December 31, |
| ||
Consolidated operating investment types: |
| 2015 |
| 2014 |
|
Seniors housing leased |
| 15 |
| 10 |
|
Seniors housing managed |
| 48 |
| 36 |
|
Medical office leased |
| 54 |
| 32 |
|
Post-acute care leased |
| 10 |
| 9 |
|
Acute care leased |
| 5 |
| 4 |
|
|
| 132 |
| 91 |
|
Rental Income from Operating Leases. Rental income from operating leases was approximately $101.1 million for the year ended December 31, 2015 as compared to $49.3 million for the year ended December 31, 2014. The increase in rental income from operating leases resulted from our acquisition of five leased seniors housing communities, 22 MOBs, one post-acute care hospital and one acute care hospital for the year ended December 31, 2015 as well as the 15 MOBs, three post-acute care hospitals and three acute care hospitals during the year ended December 31, 2014 being owned for the entire period.
Resident Fees and Services. Resident fees and services income was approximately $183.4 million for the year ended December 31, 2015 as compared to approximately $123.8 million for the year ended December 31, 2014. The increase in resident fees and services is a result of the 10 managed seniors housing communities acquired during the year ended December 31, 2015 as well as 14 managed seniors housing communities acquired during the year ended December 31, 2014 being owned for the entire period. In addition, Dogwood Forest of Acworth and HarborChase of Villages Crossing represent two of our completed developments that have reached stabilization during 2015. Moreover, HarborChase of Shorewood and Wellmore of Tega Cay were placed into service in November 2015 and June 2015, respectively.
Tenant Reimbursement Income. Tenant reimbursement income was approximately $16.0 million for the year ended December 31, 2015 as compared to $7.5 million for the year ended December 31, 2014. This amount is comprised of CAM revenue and the increase resulted from our acquisition of 22 MOBs, one post-acute care hospital and one acute care hospital acquired during the year ended December 31, 2015 as well as the 15 MOBs, three post-acute care hospitals and three acute care hospitals acquired during the year ended December 31, 2014 being owned for the entire period.
Interest Income on Note Receivable from Related Party. Interest income on note receivable from related party was approximately $0.5 million for the year ended December 31, 2014. This amount is comprised of interest income on the acquisition, development and construction loan (“ADC loan”) made to C4 Development, LLC for the HCA Rutland development in June 2013, which was fully repaid in August 2014. We recorded no interest income on note receivable from related party for the year ended December 31, 2015.
Property Operating Expenses. Property operating expenses were approximately $149.7 million for the year ended December 31, 2015 as compared to approximately $93.5 million for the year ended December 31, 2014. This increase is a result of our acquisition of 10 managed seniors housing communities, 22 MOBs, one post-acute care hospital and one acute care hospital for the year ended December 31, 2015 as well as 14 managed seniors housing communities, 15 MOBs, three post-acute care hospitals and three acute care hospitals acquired during the year ended December 31, 2014 being owned for the entire period. In addition, Dogwood Forest of Acworth and HarborChase of Villages Crossing represent two of our completed developments that have reached stabilization during 2015. Moreover, HarborChase of Shorewood and Wellmore of Tega Cay were placed into service in November 2015 and June 2015, respectively.
General and Administrative. General and administrative expenses for the year ended December 31, 2015 were approximately $10.1 million as compared to approximately $6.9 million for the year ended December 31, 2014. General and administrative expenses were comprised primarily of personnel expenses of affiliates of our Advisor, directors’ and officers’ insurance, franchise taxes, accounting and legal fees, and board of director fees and will continue to grow as our asset base increases. The increase in general and administrative expense was primarily attributed to increased costs as a result of the growth of our portfolio. Specifically, we incurred increased personnel expenses reimbursable to the Advisor due to increased accounting, legal and administrative activity as a result of the growth of the portfolio and related reporting.
Acquisition Fees and Expenses. Acquisition fees and expenses for the year ended December 31, 2015 were approximately $25.7 million of which approximately $4.2 million was capitalized as real estate under development. We incurred approximately $27.5 million for the year ended December 31, 2014 of which approximately $3.6 million was capitalized as real estate under development. The decrease in acquisition fees and expenses resulted from the acquisition of 39 operating properties totaling approximately $880.9 million in investments during the year ended December 31, 2015 as compared with the acquisition of 35 operating properties totaling approximately $905.3 million in investments during the year ended December 31, 2014.
Asset Management Fees. We incurred approximately $22.9 million in asset management fees payable to our Advisor during the year ended December 31, 2015 as compared to approximately $13.6 million for the year ended December 31, 2014. For years ended December 31, 2015 and 2014, approximately $4.4 million and $4.9 million, respectively, in asset management fees were settled in accordance with the terms of the Original Expense Support Agreements and approximately $0.6 million and $0.3 million, respectively, were capitalized as real estate under development. Monthly asset management fees equal to 0.08334% of invested assets are paid to the Advisor for management of our real estate assets, including our pro rata share of our investments in unconsolidated entities, loans and other permitted investments.
Property Management Fees. We incurred approximately $18.4 million in property management fees for the year ended December 31, 2015 and approximately $10.8 million for the year ended December 31, 2014. For the years ended December 31, 2015 and 2014, approximately $3.6 million and $1.9 million, respectively, were capitalized as real estate under development. Property management fees generally range from 2% to 5% of property revenues for leased properties depending on the type of property and are generally paid to third-party managers. In addition, an oversight fee equal to 1% of property revenues is paid to the Property Manager for those properties managed by a third-party. Overall property management fees increased as a result of the increases in rental income from operating leases and resident fees and services from acquisitions for the year ended December 31, 2015 as well as the properties acquired during 2014 being owned for the entire year ended December 31, 2015.
Impairment Provision. During the year ended December 31, 2015, we recorded an impairment provision of $4.7 million to write-off the lease intangibles related to two of our specialty hospitals, as it was determined that the carrying value of these assets would not be recoverable; refer to Item 7. “Management’s Discussion and Analysis of Financial Condition and Results of Operations – Tenant Workouts” for additional information. There were no impairments during the year ended December 31, 2014.
Loss on Lease Termination. During the year ended December 31, 2015, we recorded a loss on lease termination of $0.9 million related to two of our specialty hospitals, as it was determined that the carrying value of certain deferred rent and lease incentives would not be recoverable; refer to Item 7. “Management’s Discussion and Analysis of Financial Condition and Results of Operations – Tenant Workouts” for additional information. There were no losses on lease terminations during the year ended December 31, 2014.
Contingent purchase price consideration adjustment. For the years ended December 31, 2015 and 2014, the adjustments for contingent purchase price consideration were both approximately $0.6 million. The adjustment in 2015 relates primarily to two separate acquisitions. Based on lower than expected occupancy and revised projections of future net operating income, our fair value estimate for our Capital Health yield guaranty receivable was increased by approximately $0.3 million and we recorded a reduction to our operating loss in the accompanying consolidated statements of operations for year ended December 31, 2015. In addition, as a result of the expiration of the Chestnut Commons Earn-Out agreement, we recorded a fair value adjustment of approximately $0.3 million during 2015. Based on lower than expected occupancy and revised projections of future net operating income, our fair value estimate for our Capital Health Yield Guaranty receivable was increased by approximately $2.2 million and we recorded a reduction to our operating loss in the accompanying consolidated statements of operations for year ended December 31, 2014. Additionally, based on exceeding certain NOI targets on one of the South Bay II communities, we have recognized $1.8 million of expense during the year ended December 31, 2014.
Depreciation and Amortization. Depreciation and amortization expenses for the year ended December 31, 2015 were approximately $105.9 million and approximately $63.1 million for the year ended December 31, 2014. Depreciation and amortization expenses are comprised of depreciation and amortization of the buildings, equipment, land improvements and in-place leases related to our real estate portfolio. The increase in depreciation and amortization expense across periods resulted from our acquisition of five leased seniors housing communities, 10 managed seniors housing communities, 22 MOBs, one post-acute care hospital and one acute care hospital for the year ended December 31, 2015 as well as 14 managed seniors housing communities, 15 MOBs, three post-acute care hospitals and three acute care hospitals acquired during the year ended December 31, 2014 being owned for the entire period. In addition, HarborChase of Shorewood, Wellmore of Tega Cay, Dogwood Forest of Acworth and HarborChase of Villages Crossing were placed into service in November 2015, June 2015, June 2014 and December 2013, respectively.
Interest Expense and Loan Cost Amortization. Interest expense and loan cost amortization for the year ended December 31, 2015 was approximately $45.3 million of which $2.3 million was capitalized as development costs relating to our real estate under development. Interest expense and loan cost amortization for the year ended December 31, 2014 was approximately $31.5 million of which approximately $1.0 million was capitalized as development costs relating to our real estate under development. Approximately $9.8 million of the increase for the year ended December 31, 2015 was primarily the result of an increase in our average debt outstanding to approximately $1.3 billion as compared to approximately $0.8 billion for the year ended December 31, 2014. In addition, during the year ended December 31, 2015, we incurred approximately $0.8 million in additional loan costs amortization relating to debt obtained during the year ended December 31, 2015, as well as approximately $0.9 million relating to debt obtained on properties acquired during the year ended December 31, 2014. In addition, during the year ended December 31, 2015, we recorded a write-off of approximately $0.7 million in loan costs and paid approximately $0.3 million on the derecognition of cash flow hedges in connection with the early extinguishment of debt on the Perennial Communities, Medical Portfolio I Properties, Dogwood Forest of Acworth and HarborChase of Villages Crossing.
Equity in Earnings (Loss) of Unconsolidated Entities. Our unconsolidated entities generated losses of approximately $0.6 million for the year ended December 31, 2015 relating to our investment in the Windsor Manor joint venture, as compared to earnings of approximately $1.4 million for the year ended December 31, 2014 relating to our investments in the Windsor Manor and Montecito joint ventures. Equity in loss from unconsolidated entities is determined using the HLBV method of accounting, which can create significant variability in earnings or loss from the joint venture while the preferred cash distributions that we anticipate to receive from the joint venture may be more consistent as result of our distribution preferences.
Gain from Purchase of Controlling Interest of Investment in Unconsolidated Entity. During the year ended December 31, 2014, we recognized a gain of approximately $2.8 million related to the purchase of our co-venture partner’s 10% interest in the Montecito joint venture which resulted in us controlling the property. There was no purchase of any controlling interest of unconsolidated entities during the year ended December 31, 2015.
Income Tax Expense. For each of the years ended December 31, 2015 and 2014, we recognized state income tax expense related to our properties of approximately $0.4 million.
Net Operating Income
We generally expect to meet future cash needs for general and administrative expenses, debt service and distributions from NOI. We define NOI, a non-GAAP measure, as rental income from operating leases, resident fees and services, tenant reimbursement income and interest incometotal revenues less the property operating expenses and property management fees. We use NOI as a key performance metric for internal monitoring and planning purposes, including the preparation of annual operating budgets and monthly operating reviews, as well as to facilitate analysis of future investment and business decisions. It does not represent cash flows provided by operating activities in accordance with GAAP and should not be considered to be an alternative to net income or loss (determined in accordance with GAAP) as an indication of our operating performance or to be an alternative to cash flows provided by operating activities (determined in accordance with GAAP) as a measure of our liquidity. We believe the presentation of this non-GAAP measure is important to the understanding of our operating results for the periods presented because it is an indicator of the return on property investment and provides a method of comparing property performance over time. In addition, we have aggregated NOI on a “same-store” basis only for comparable properties that we have owned during the entirety of all periods presented. As such, Non-same-storenon-same-store NOI represents aggregated NOI from acquisitions made after the first day of the period presented (i.e. January 1, 20152016 or January 1, 2014)2015), which are excluded from Same-storesame-store NOI, as we did not own those properties during the entirety of all periods presented. In understanding
The chart below illustrates our operating resultsnet losses and NOI for the years ended December 31, 2017 and 2016 (in thousands) and the amount invested in properties as of December 31, 2017 and 2016 (in millions):
|
| Years Ended December 31, |
|
| Change |
| ||||||||||
|
| 2017 |
|
| 2016 |
|
|
| $ |
|
| % |
| |||
Net loss |
| $ | (26,312 | ) |
| $ | (31,784 | ) |
|
|
|
|
|
|
|
|
Adjusted to exclude: |
|
|
|
|
|
|
|
|
|
|
|
|
|
|
|
|
General and administrative expenses |
|
| 13,010 |
|
|
| 12,847 |
|
|
|
|
|
|
|
|
|
Acquisition fees and expenses |
|
| — |
|
|
| 974 |
|
|
|
|
|
|
|
|
|
Asset management fees |
|
| 29,642 |
|
|
| 25,443 |
|
|
|
|
|
|
|
|
|
Financing coordination fees |
|
| 2,748 |
|
|
| — |
|
|
|
|
|
|
|
|
|
Contingent purchase price consideration adjustments |
|
| 47 |
|
|
| (290 | ) |
|
|
|
|
|
|
|
|
Loss on lease terminations |
|
| — |
|
|
| 785 |
|
|
|
|
|
|
|
|
|
Depreciation and amortization |
|
| 107,944 |
|
|
| 122,985 |
|
|
|
|
|
|
|
|
|
Other expenses, net of other income |
|
| 65,730 |
|
|
| 57,995 |
|
|
|
|
|
|
|
|
|
Income tax (benefit) expense |
|
| (8,363 | ) |
|
| 351 |
|
|
|
|
|
|
|
|
|
Gain on sale of real estate |
|
| — |
|
|
| (15,415 | ) |
|
|
|
|
|
|
|
|
NOI |
|
| 184,446 |
|
|
| 173,891 |
|
| $ | 10,555 |
|
|
| 6.1 | % |
Less: Non-same-store NOI |
|
| (4,571 | ) |
|
| (1,375 | ) |
|
|
|
|
|
|
|
|
Same-store NOI |
| $ | 179,875 |
|
| $ | 172,516 |
|
| $ | 7,359 |
|
|
| 4.3 | % |
Invested in operating properties, end of period (in millions) |
| $ | 3,016 |
|
| $ | 2,883 |
|
|
|
|
|
|
|
|
|
Overall, our NOI for the year ended December 31, 2017 increased by approximately $10.6 million as compared to the same period in the accompanying consolidatedprior year. Our non-same-store NOI of approximately $4.6 million for the year ended December 31, 2017 primarily related to the acquisition of Cobalt Rehabilitation Hospital of New Orleans in October 2016, as well as the completion of seven development properties and two expansion projects after January 1, 2016. Our same-store NOI for the year ended December 31, 2017 increased by approximately $7.4 million, or 4.3%, as compared to the same period in the prior year due primarily to the following properties:
The transition of our Wellmore of Tega Cay property in August 2016 from being managed by a third-party under a RIDEA structure to being leased to a third-party operator under a triple-net lease arrangement;
The lease-up of additional assisted living units that resulted from our conversion of certain skilled nursing units to assisted living units at our Isle at Cedar Ridge and Isle at Watercrest - Bryan communities, which was completed in the third quarter of 2016; and
Improved financial statements, it is important to understand how theresults and year-over-year occupancy growth inat our assets has impacted our results. Pacific Northwest Communities, which represent value-add properties.
The chart below illustrates our net losses and NOI for the years ended December 31, 2016 and 2015 (in thousands), and the amount invested in properties as of December 31, 2016 and 2015 (in millions):
|
| Years Ended December 31, |
| Change |
| Years Ended December 31, |
|
| Change |
| |||||||||||||||||
|
| 2016 |
| 2015 |
| $ |
| % |
| 2016 |
|
| 2015 |
|
|
| $ |
|
| % |
| ||||||
Net loss | Net loss | $ | (31,784) |
| $ | (68,093) |
|
|
|
|
|
| $ | (31,784 | ) |
| $ | (68,093 | ) |
|
|
|
|
|
|
|
|
Adjusted to exclude: | Adjusted to exclude: |
|
|
|
|
|
|
|
|
|
|
|
|
|
|
|
|
|
|
|
|
|
|
|
|
| |
| General and administrative expenses |
| 12,847 |
| 10,088 |
|
|
|
| ||||||||||||||||||
| Acquisition fees and expenses |
| 974 |
| 21,526 |
|
|
|
| ||||||||||||||||||
| Asset management fees |
| 25,443 |
| 17,892 |
|
|
|
| ||||||||||||||||||
| Contingent purchase price consideration adjustment |
| (290) |
| (589) |
|
|
|
| ||||||||||||||||||
| Impairment provision |
| ― |
| 4,661 |
|
|
|
| ||||||||||||||||||
| Loss on lease terminations |
| 785 |
| 863 |
|
|
|
| ||||||||||||||||||
| Depreciation and amortization |
| 122,985 |
| 105,945 |
|
|
|
| ||||||||||||||||||
| Other expenses, net of other income |
| 42,580 |
| 43,407 |
|
|
|
| ||||||||||||||||||
| Income tax expense |
| 351 |
|
| 378 |
|
|
|
| |||||||||||||||||
General and administrative expenses |
|
| 12,847 |
|
|
| 10,088 |
|
|
|
|
|
|
|
|
| |||||||||||
Acquisition fees and expenses |
|
| 974 |
|
|
| 21,526 |
|
|
|
|
|
|
|
|
| |||||||||||
Asset management fees |
|
| 25,443 |
|
|
| 17,892 |
|
|
|
|
|
|
|
|
| |||||||||||
Contingent purchase price consideration adjustments |
|
| (290 | ) |
|
| (589 | ) |
|
|
|
|
|
|
|
| |||||||||||
Impairment provision |
|
| — |
|
|
| 4,661 |
|
|
|
|
|
|
|
|
| |||||||||||
Loss on lease terminations |
|
| 785 |
|
|
| 863 |
|
|
|
|
|
|
|
|
| |||||||||||
Depreciation and amortization |
|
| 122,985 |
|
|
| 105,945 |
|
|
|
|
|
|
|
|
| |||||||||||
Other expenses, net of other income |
|
| 57,995 |
|
|
| 43,407 |
|
|
|
|
|
|
|
|
| |||||||||||
Gain on sale of real estate |
|
| (15,415 | ) |
|
| — |
|
|
|
|
|
|
|
|
| |||||||||||
Income tax expense |
|
| 351 |
|
|
| 378 |
|
|
|
|
|
|
|
|
| |||||||||||
NOI | NOI |
| 173,891 |
|
| 136,078 |
| $ | 37,813 |
| 27.8% |
|
| 173,891 |
|
|
| 136,078 |
|
| $ | 37,813 |
|
|
| 27.8 | % |
Less: Non-same-store NOI | Less: Non-same-store NOI |
| (54,010) |
|
| (20,009) |
|
|
|
|
|
| (54,010 | ) |
|
| (20,009 | ) |
|
|
|
|
|
|
|
| |
Same-store NOI | Same-store NOI | $ | 119,881 |
| $ | 116,069 |
| $ | 3,812 |
| 3.3% |
| $ | 119,881 |
|
| $ | 116,069 |
|
| $ | 3,812 |
|
|
| 3.3 | % |
Invested in operating properties, end of period (in millions) | Invested in operating properties, end of period (in millions) | $ | 2,883 |
| $ | 2,746 |
|
|
|
|
| $ | 2,883 |
|
| $ | 2,746 |
|
|
|
|
|
|
|
|
| |
Overall, our NOI for the year ended December 31, 2016 increased by approximately $37.8 million, of which $34.0 million was related to 40 operating properties acquired after January 1, 2015, five developments completed after January 1, 2015 and the Dogwood Forest of Acworth property, which was sold in November 2016. Our same-store NOI for the year ended December 31, 2016 increased by approximately $3.8 million, or 3.3%, as compared to the same period in the prior year. The increase in same-store NOI is primarily attributable to year-over-year revenue and occupancy growth within our seniors housing properties — specifically, our Pacific Northwest Communities and Capital Health Communities. However, the overall increase in same-store NOI at the aforementioned properties was partially offset by our decision to convert certain skilled nursing units to assisted living units at our Isle at Cedar Ridge and Isle at Watercrest - Bryan communities. While this decision adversely impacted same-store NOI for the year ended December 31, 2016, we anticipate that the converted units, which were completed in the third quarter of 2016, will contribute to same-store NOI growth in future periods (as noted above for the year ended December 31, 2017) and could increase the value of the properties.
The chart below illustrates our net losses and NOI for the years ended December 31, 2015 and 2014 (in thousands), and the amount invested in properties as of December 31, 2015 and 2014 (in millions):
|
| Years Ended December 31, |
| Change | |||||||
|
| 2015 |
| 2014 |
| $ |
| % | |||
Net loss | $ | (68,093) |
| $ | (52,511) |
|
|
|
|
| |
Adjusted to exclude: |
|
|
|
|
|
|
|
|
|
| |
| General and administrative expenses |
| 10,088 |
|
| 6,877 |
|
|
|
|
|
| Acquisition fees and expenses |
| 21,526 |
|
| 23,931 |
|
|
|
|
|
| Asset management fees |
| 17,892 |
|
| 8,481 |
|
|
|
|
|
| Contingent purchase price consideration adjustment |
| (589) |
|
| (630) |
|
|
|
|
|
| Impairment provision |
| 4,661 |
|
| ― |
|
|
|
|
|
| Loss on lease terminations |
| 863 |
|
| ― |
|
|
|
|
|
| Depreciation and amortization |
| 105,945 |
|
| 63,112 |
|
|
|
|
|
| Other expenses, net of other income |
| 43,407 |
|
| 28,972 |
|
|
|
|
|
| Income tax expense |
| 378 |
|
| 361 |
|
|
|
|
|
NOI |
| 136,078 |
|
| 78,593 |
| $ | 57,485 |
| 73.1% | |
Less: Non-same-store NOI |
| (75,852) |
|
| (23,300) |
|
|
|
|
| |
Same-store NOI | $ | 60,226 |
| $ | 55,293 |
| $ | 4,933 |
| 8.9% | |
Invested in operating properties, |
|
|
|
|
|
|
|
|
|
| |
| end of period (in millions) | $ | 2,746 |
| $ | 1,865 |
|
|
|
|
|
Overall, our NOI for the year ended December 31, 2015 increased by approximately $57.5 million, of which $52.6 million was related to 74 operating properties acquired between January 1, 2014 and December 31, 2015 as well as three developments completed between January 1, 2014 and December 31, 2015. Our same-store NOI for the year ended December 31, 2015 increased by approximately $4.9 million, or 8.9%, as compared to the same period in the prior year. The increase in same-store NOI was primarily attributable to year-over-year revenue and occupancy growth within our seniors housing properties – specifically, our Pacific Northwest Communities and HarborChase of Villages Crossing, which represents a development completed in 2013 that reached stabilization during 2015.
Funds from Operations and Modified Funds from Operations
Due to certain unique operating characteristics of real estate companies, as discussed below, the NAREIT promulgated a measure known as FFO, which we believe to be an appropriate supplemental measure to reflect the operating performance of a REIT. The use of FFO is recommended by the REIT industry as a supplemental performance measure. FFO is not equivalent to net income or loss as determined under GAAP.
We define FFO, a non-GAAP measure, consistent with the standards approved by the Board of Governors of NAREIT. NAREIT defines FFO as net income or loss computed in accordance with GAAP, excluding gains or losses from sales of property, real estate asset impairment write-downs, plus depreciation and amortization of real estate related assets, and after adjustments for unconsolidated partnerships and joint ventures. Our FFO calculation complies with NAREIT’s policy described above.
The historical accounting convention used for real estate assets requires straight-line depreciation of buildings and improvements, which implies that the value of real estate assets diminishes predictably over time, especially if such assets are not adequately maintained or repaired and renovated as required by relevant circumstances and/or is requested or required by lessees for operational purposes in order to maintain the value of the property. We believe that, because real estate values historically rise and fall with market conditions, including inflation, interest rates, the business cycle, unemployment and consumer spending, presentations of operating results for a REIT using historical accounting for depreciation may be less informative. Historical accounting for real estate involves the use of
GAAP. Any other method of accounting for real estate such as the fair value method cannot be construed to be any more accurate or relevant than the comparable methodologies of real estate valuation found in GAAP. Nevertheless, we believe that the use of FFO, which excludes the impact of real estate related depreciation and amortization, provides a more complete understanding of our performance to investors and to management, and when compared year over year, reflects the impact on our operations from trends in occupancy rates, rental rates, operating costs, general and administrative expenses, and interest costs, which may not be immediately apparent from net income or loss. However, FFO and MFFO, as described below, should not be construed to be more relevant or accurate than the current GAAP methodology in calculating net income or loss in its applicability in evaluating operating performance. The method utilized to evaluate the value and performance of real estate under GAAP should be construed as a more relevant measure of operational performance and considered more prominently than the non-GAAP FFO and MFFO measures and the adjustments to GAAP in calculating FFO and MFFO.
Changes in the accounting and reporting promulgations under GAAP (for acquisition fees and expenses for business combinations from a capitalization/depreciation model) to an expensed-as-incurred model that were put into effect in 2009, and other changes to GAAP accounting for real estate subsequent to the establishment of NAREIT’s definition of FFO, have prompted an increase in cash-settled expenses, specifically acquisition fees and expenses, as items that are expensed under GAAP and accounted for as operating expenses. Our management believes these fees and expenses do not affect our overall long-term operating performance. Publicly registered, non-listed REITs typically have a significant amount of acquisition activity and are substantially more dynamic during their initial years of investment and operation. While other start up entities may also experience significant acquisition activity during their initial years, we believe that non-listed REITs are unique in that they have a limited life with targeted exit strategies within a relatively limited time frame after acquisition activity ceases. Due to the above factors and other unique features of publicly registered, non-listed REITs, the IPA has standardized a measure known as MFFO which the IPA has recommended as a supplemental measure for publicly registered, non-listed REITs and which we believe to be another appropriate supplemental measure to reflect the operating performance of a non-listed REIT. MFFO is not equivalent to our net income or loss as determined under GAAP, and MFFO may not be a useful measure of the impact of long-term operating performance on value if we do not continue to operate with a limited life and targeted exit strategy, as currently intended. We believe that because MFFO excludes costs that we consider more reflective of investing activities and other non-operating items included in FFO and also excludes acquisition fees and expenses that affect our operations only in periods in which properties are acquired, MFFO can provide, on a going forward basis, an indication of the sustainability (that is, the capacity to continue to be maintained) of our operating performance after the period in which we acquired our properties and once our portfolio is in place. By providing MFFO, we believe we are presenting useful information that assists investors and analysts to better assess the sustainability of our operating performance after our properties have been acquired. We also believe that MFFO is a recognized measure of sustainable operating performance by the non-listed REIT industry.
We define MFFO, a non-GAAP measure, consistent with the IPA’s Guideline 2010-01, Supplemental Performance Measure for Publicly Registered, Non-Listed REITs: MFFO, or the Practice Guideline, issued by the IPA in November 2010. The Practice
Guideline defines MFFO as FFO further adjusted for the following items, as applicable, included in the determination of GAAP net income or loss: acquisition fees and expenses; amounts relating to deferred rent receivables and amortization of above and below market leases and liabilities (which are adjusted from a GAAP accrual basis in order to reflect such payments on a cash basis of amounts expected to be received for such lease and rental payments); contingent purchase price consideration adjustments; accretion of discounts and amortization of premiums on debt investments; mark-to-market adjustments included in net income or loss; gains or losses included in net income from the extinguishment or sale of debt, hedges, foreign exchange, derivatives or securities holdings where trading of such holdings is not a fundamental attribute of the business plan; and unrealized gains or losses resulting from consolidation from, or deconsolidation to, equity accounting and after adjustments for consolidated and unconsolidated partnerships and joint ventures, with such adjustments calculated to reflect MFFO on the same basis. The accretion of discounts and amortization of premiums on debt investments, unrealized gains and losses on hedges, foreign exchange, derivatives or securities holdings, unrealized gains and losses resulting from consolidations, as well as other listed cash flow adjustments are adjustments made to net income or loss in calculating the cash flows provided by operating activities and, in some cases, reflect gains or losses which are unrealized and may not ultimately be realized.
Our MFFO calculation complies with the IPA’s Practice Guideline described above. In calculating MFFO, we exclude acquisition related expenses. Under GAAP, acquisition fees and expenses are characterized as operating
expenses in determining operating net income or loss. These expenses are paid in cash by us. All paid and accrued acquisition fees and expenses will have negative effects on returns to investors, the potential for future distributions, and cash flows generated by us, unless earnings from operations or net sales proceeds from the disposition of other properties are generated to cover the purchase price of the property.
Our management uses MFFO and the adjustments used to calculate it in order to evaluate our performance against other non-listed REITs which have limited lives with short and defined acquisition periods and targeted exit strategies shortly thereafter. As noted above, MFFO may not be a useful measure of the impact of long-term operating performance on value if we do not continue to operate in this manner. We believe that our use of MFFO and the adjustments used to calculate it allow us to present our performance in a manner that reflects certain characteristics that are unique to non-listed REITs, such as their limited life, limited and defined acquisition period and targeted exit strategy, and hence that the use of such measures is useful to investors. For example, acquisition costs are funded from our subscription proceeds and other financing sources and not from operations. By excluding expensed acquisition costs, the use of MFFO provides information consistent with management’s analysis of the operating performance of the properties.
Presentation of this information is intended to provide useful information to investors as they compare the operating performance of different non-listed REITs, although it should be noted that not all REITs calculate FFO and MFFO the same way and as such comparisons with other REITs may not be meaningful. Furthermore, FFO and MFFO are not necessarily indicative of cash flows available to fund cash needs and should not be considered as an alternative to net income or loss, or income or loss from continuing operations as an indication of our performance, as an alternative to cash flows from operations, as an indication of our liquidity, or indicative of funds available to fund our cash needs including our ability to make distributions to our stockholders. FFO and MFFO should be reviewed in conjunction with other GAAP measurements as an indication of our performance. MFFO is useful in assisting management and investors in assessing the sustainability of operating performance in future operating periods, and in particular, after the offering and acquisition stages are complete and NAV is disclosed. FFO and MFFO are not useful measures in evaluating NAV because impairments are taken into account in determining NAV but not in determining FFO and MFFO.
Neither the SEC, NAREIT nor any other regulatory body has passed judgment on the acceptability of the adjustments we use to calculate FFO or MFFO. In the future, the SEC, NAREIT or another regulatory body may decide to standardize the allowable adjustments across the non-listed REIT industry and we would have to adjust our calculation and characterization of FFO or MFFO.
The following table presents a reconciliation of net loss to FFO and MFFO for the years ended December 31, 2017, 2016 2015 and 20142015 (in thousands, except per share data):
|
| Years Ended December 31, |
| Years Ended December 31, |
| ||||||||||||||||
|
| 2016 |
| 2015 |
| 2014 |
| 2017 |
|
| 2016 |
|
| 2015 |
| ||||||
Net loss attributable to common stockholders | Net loss attributable to common stockholders | $ | (31,667) |
| $ | (68,055) |
| $ | (52,511) |
| $ | (25,962 | ) |
| $ | (31,667 | ) |
| $ | (68,055 | ) |
Adjustments: | Adjustments: |
|
|
|
|
|
|
|
|
|
|
|
|
|
|
|
|
|
|
|
|
| Depreciation and amortization |
| 122,985 |
|
| 105,945 |
|
| 63,112 | ||||||||||||
| Impairment provision |
| ― |
|
| 4,661 |
|
| ― | ||||||||||||
| FFO adjustments from unconsolidated entities (1) |
| 657 |
|
| 1,508 |
|
| 2,994 | ||||||||||||
| Gain on sale of real estate |
| (15,415) |
|
| ― |
| ― | |||||||||||||
| Gain on purchase of controlling interest of investment in unconsolidated entity |
| ― |
|
| ― |
|
| (2,798) | ||||||||||||
| Total funds from operations |
| 76,560 |
|
| 44,059 |
|
| 10,797 | ||||||||||||
Depreciation and amortization |
|
| 107,944 |
|
|
| 122,985 |
|
|
| 105,945 |
| |||||||||
Impairment provision |
|
| — |
|
|
| — |
|
|
| 4,661 |
| |||||||||
Gain on sale of real estate |
|
| — |
|
|
| (15,415 | ) |
|
| — |
| |||||||||
FFO adjustments attributable to noncontrolling interests |
|
| (244 | ) |
|
| — |
|
|
| — |
| |||||||||
FFO adjustments from unconsolidated entities (1) |
|
| 509 |
|
|
| 657 |
|
|
| 1,508 |
| |||||||||
FFO attributable to common stockholders |
|
| 82,247 |
|
|
| 76,560 |
|
|
| 44,059 |
| |||||||||
Acquisition fees and expenses (2) | Acquisition fees and expenses (2) |
| 974 |
|
| 21,526 |
|
| 23,931 |
|
| — |
|
|
| 974 |
|
|
| 21,526 |
|
Straight-line rent adjustments (3) | Straight-line rent adjustments (3) |
| (6,251) |
|
| (4,309) |
|
| (2,472) |
|
| (979 | ) |
|
| (6,251 | ) |
|
| (4,309 | ) |
Amortization of above and below market intangibles (4) | Amortization of above and below market intangibles (4) |
| 753 |
|
| 915 |
|
| 345 |
|
| 620 |
|
|
| 753 |
|
|
| 915 |
|
Unrealized loss from mark-to-market adjustments on swaps (5) | Unrealized loss from mark-to-market adjustments on swaps (5) |
| (18) |
|
| 33 |
|
| ― |
|
| (43 | ) |
|
| (18 | ) |
|
| 33 |
|
Loss on extinguishment of debt (6) | Loss on extinguishment of debt (6) |
| 1,495 |
|
| 986 |
|
| ― |
|
| 239 |
|
|
| 1,495 |
|
|
| 986 |
|
Loss on lease terminations (7) | Loss on lease terminations (7) |
| 785 |
|
| 863 |
|
| ― |
|
| — |
|
|
| 785 |
|
|
| 863 |
|
Contingent purchase price consideration adjustment (8) |
| (290) |
|
| (589) |
|
| (630) | |||||||||||||
MFFO adjustments from unconsolidated entities (1) |
| ― |
|
| ― |
|
| 46 | |||||||||||||
| Modified funds from operations | $ | 74,008 |
| $ | 63,484 |
| $ | 32,017 | ||||||||||||
Weighted average number of shares of common |
|
|
|
|
|
|
|
| |||||||||||||
| stock outstanding (basic and diluted) (9) |
| 175,121 |
|
| 153,804 |
|
| 85,710 | ||||||||||||
Realized loss on extinguishment of hedges or other derivatives (8) |
|
| 318 |
|
|
| — |
|
|
| — |
| |||||||||
Contingent purchase price consideration adjustment (9) |
|
| 47 |
|
|
| (290 | ) |
|
| (589 | ) | |||||||||
MFFO adjustments attributable to noncontrolling interests |
|
| (3 | ) |
|
| — |
|
|
| — |
| |||||||||
MFFO attributable to common stockholders |
| $ | 82,446 |
|
| $ | 74,008 |
|
| $ | 63,484 |
| |||||||||
Weighted average number of shares of common stock outstanding (basic and diluted) (10) |
|
| 175,151 |
|
|
| 175,121 |
|
|
| 153,804 |
| |||||||||
Net loss per share (basic and diluted) | Net loss per share (basic and diluted) | $ | (0.18) |
| $ | (0.44) |
| $ | (0.61) |
| $ | (0.15 | ) |
| $ | (0.18 | ) |
| $ | (0.44 | ) |
FFO per share (basic and diluted) | FFO per share (basic and diluted) | $ | 0.44 |
| $ | 0.29 |
| $ | 0.13 |
| $ | 0.47 |
|
| $ | 0.44 |
|
| $ | 0.29 |
|
MFFO per share (basic and diluted) | MFFO per share (basic and diluted) | $ | 0.42 |
| $ | 0.41 |
| $ | 0.37 |
| $ | 0.47 |
|
| $ | 0.42 |
|
| $ | 0.41 |
|
________________
FOOTNOTES:
(1) | This amount represents our share of the FFO or MFFO adjustments allowable under the NAREIT or IPA definitions, respectively, calculated using the HLBV method. |
(2) | In evaluating investments in real estate, management differentiates the costs to acquire the investment from the operations derived from the investment. By adding back acquisition expenses, management believes MFFO provides useful supplemental information of its operating performance and will also allow comparability between different real estate entities regardless of their level of acquisition activities. Acquisition expenses include payments to our Advisor or third parties. Acquisition expenses for business combinations under GAAP are considered operating expenses and as expenses included in the determination of net income (loss) and income (loss) from continuing operations, both of which are performance measures under GAAP. All paid or accrued acquisition expenses will have negative effects on returns to investors, the potential for future distributions, and cash flows generated by us, unless earnings from operations or net sales proceeds from the disposition of properties are generated to cover the purchase price of the property. |
(3) | Under GAAP, rental receipts are allocated to periods using various methodologies. This may result in income recognition that is significantly different than underlying contract terms. By adjusting for these items (from a GAAP accrual basis in order to reflect such payments on a cash basis of amounts expected to be received for such lease and rental payments), MFFO provides useful supplemental information on the realized economic impact of lease terms and debt investments, providing insight on the contractual cash flows of such lease terms and debt investments, and aligns results with management’s analysis of operating performance. |
(4) | Under GAAP, certain intangibles are accounted for at cost and reviewed at least annually for impairment, and certain intangibles are assumed to diminish predictably in value over time and are amortized, similar to depreciation and amortization of other real estate-related assets that are excluded from FFO. However, because real estate values and market lease rates historically rise or fall with market conditions, management believes that by excluding charges relating to amortization of these intangibles, MFFO provides useful supplemental information on the performance of the real estate. |
(5) | Management believes that adjusting for the unrealized gains from mark-to-market adjustments on swaps is appropriate because the adjustments are not reflective of our ongoing operating performance and, as a result, the adjustments better align results with management’s analysis of operating performance. |
(7) | Management believes that adjusting for loss on lease terminations is appropriate because the adjustments are not reflective of our ongoing operating performance and, as a result, the adjustments better align results with management’s analysis of operating performance. |
(8) | Management believes that adjusting for the realized loss on the extinguishment of hedges or other derivatives is appropriate because the adjustments are not reflective of our ongoing operating performance and, as a result, the adjustments better align results with management’s analysis of operating performance. |
(9) | Management believes that the elimination of contingent purchase price consideration adjustments included in operating income (expense) for GAAP purposes is appropriate because the adjustments are not reflective of our ongoing operating performance and, as a result, the adjustments better align results with management’s analysis of operating performance. |
| For purposes of determining the weighted average number of shares of common stock outstanding, stock distributions are treated as if they were outstanding as of the beginning of the periods presented. |
Contractual Obligations
The following table presents our contractual obligations and the relatedby payment periods as of December 31, 2016:2017 (in thousands):
|
| Payments Due by Period |
|
| Payments Due by Period |
| ||||||||||||||||||||||||||||||
|
| 2017 |
| 2018-2019 |
| 2020-2021 |
| Thereafter |
| Total |
|
| 2018 |
|
| 2019-2020 |
|
| 2021-2022 |
|
| Thereafter |
|
| Total |
| ||||||||||
Mortgage and other notes payable (principal and interest) |
| $ | 102,556 |
| $ | 640,663 |
| $ | 177,987 |
| $ | 124,180 |
| $ | 1,045,386 |
|
| $ | 114,185 |
|
| $ | 565,948 |
|
| $ | 449,471 |
|
| $ | 37,713 |
|
| $ | 1,167,317 |
|
Credit Facilities (principal and interest) |
| 210,872 |
|
| 199,175 |
|
| 281,762 |
|
| ― |
|
| 691,809 |
| |||||||||||||||||||||
Credit facilities (principal and interest) |
|
| 202,393 |
|
|
| 467,304 |
|
|
| — |
|
|
| — |
|
|
| 669,697 |
| ||||||||||||||||
Development contracts on development properties (1) |
| 59,480 |
| ― |
| ― |
| ― |
| 59,480 |
|
|
| 2,519 |
|
|
| — |
|
|
| — |
|
|
| — |
|
|
| 2,519 |
| |||||
Ground and air rights leases (2) |
|
| 1,984 |
|
| 4,055 |
|
| 4,153 |
|
| 111,467 |
|
| 121,659 |
|
|
| 2,016 |
|
|
| 4,099 |
|
|
| 4,214 |
|
|
| 109,345 |
|
|
| 119,674 |
|
|
| $ | 374,892 |
| $ | 843,893 |
| $ | 463,902 |
| $ | 235,647 |
| $ | 1,918,334 |
|
| $ | 321,113 |
|
| $ | 1,037,351 |
|
| $ | 453,685 |
|
| $ | 147,058 |
|
| $ | 1,959,207 |
|
_________________
FOOTNOTES:
(1) | These amounts represent our expected timing of such development costs, which include both accrued development costs as of December 31, |
| Ground and air rights leases are operating leases with scheduled payments over the life of the respective leases and with expirations ranging from 2045 to 2082. |
Off-Balance Sheet Arrangements
In June 2014, our Windsor Manor joint venture in which we hold a 75% membership interest refinanced approximately $18.0 million of its then-current outstanding debt related to five seniors housing communities in Iowa of which approximately $11.6 million related to a bridge loan maturing on June 30, 2014 and the approximate $6.4 million remaining related to the extinguishment of our Windsor Manor joint venture’s otherIowa. The refinanced mortgage loans prior to the scheduled expirations. In connection therewith, the joint venture paid an exit fee of approximately $0.5 million upon extinguishment of the mortgage loans. The new loan included an initial five year term with monthly principal and interest payments based upon a 25-year amortization, and a variable interest rate equal to London Interbank Offer Rate (“LIBOR”)LIBOR plus 3.5%. In addition, in connection with and is collateralized by the refinancing,five seniors housing communities. As of December 31, 2017, our Windsor Manor joint venture received aggregate proceeds of $22.0had approximately $20.3 million of which approximately $0.4 million were used to pay loan costs associated with the refinancing and the remaining $3.6 million were available for capital distribution to the members. Our Windsor Manor joint venture declared capital distributions of $2.2 million and $1.4 million, respectively, to us and our joint venture partner as a return of capital. These capital distributions were paid to the respective members in the third quarter of 2014.
During 2015 and through the second quarter of 2016, the Windsor Manor joint venture did not meet its quarterlyoutstanding debt service coverage requirement per the loan agreement as the debt service coverage ratio fell below the 1.35 minimum requirement and the Windsor Manor joint venture obtained waivers from the lender for each reporting period during such period.
As of December 31, 2016, approximately $20.8 million remained outstanding under the loan agreement, which is schedulescheduled to mature in June 2019.
In August 2014, we acquired our joint venture partner’s 10% interest in the Montecito joint venture; refer Refer to Item 8. “Financial Statements and Supplemental Data” – Note 3. “Acquisitions – Purchase of Controlling Interest in Montecito Joint Venture”2. “Properties” for additional information.information related to the five seniors housing communities owned through our Windsor Manor joint venture.
We have entered into agreements with our Advisor and its affiliates, whereby we agree to pay certain fees to, or reimburse certain expenses of, our Advisor or its affiliates for acquisition and advisory services, organization and offering costs, selling commissions, marketing support fees, asset and property management fees and reimbursement of operating costs. See Item 8. “Financial Statements and Supplemental Data” – Note 11. “Related Party Arrangements” in the accompanying consolidated financial statements for additional information.
Critical Accounting Policies and Estimates
Below is a discussion of the accounting policies that management believes are critical. We consider these policies critical because they involve difficult management judgments and assumptions, require estimates about matters that are inherently uncertain and because they are important for understanding and evaluating our reported financial results. These judgments will affect the reported amounts of assets and liabilities and our disclosure of contingent assets and liabilities at the dates of the financial statements and the reported amounts of revenue and expenses during the reporting periods. With different estimates or assumptions, materially different amounts could be reported in our financial statements. Additionally, other companies may utilize different estimates that may impact the comparability of our results of operations to those of companies in similar businesses. Our most sensitive estimates will involve the allocation of the purchase price of acquired properties and evaluating our real estate-related investments for impairment.
Basis of Presentation and Consolidation. Our consolidated financial statements will include our accounts, the accounts of our wholly owned subsidiaries or subsidiaries for which we have a controlling interest, the accounts of variable interest entities (“VIEs”) in which we are the primary beneficiary, and the accounts of other subsidiaries over which we have a controlling financial interest. All material intercompany accounts and transactions will be eliminated in consolidation.
We are required to identify entities for which control is achieved through means other than voting rights and to determine the primary beneficiary of our VIEs. We qualitatively assess whether we are the primary beneficiary of a VIE and consider various factors including, but not limited to, the design of the entity, its organizational structure including decision-making ability and financial agreements, our ability and the rights of others to participate in policy making decisions, as well as our ability to replace the VIE manager and/or liquidate the entity.
Use of Estimates. The preparation of financial statements in conformity with GAAP requires us to make estimates and assumptions that affect the reported amounts of assets and liabilities as of the date of the consolidated financial statements, the reported amounts of revenues and expenses during the reporting periods and the disclosure of contingent liabilities. For example, significant assumptions are made in the analysis of real estate impairments, the analysis of residual value and economic lives for leased properties, the valuation of contingent assets and liabilities, and the valuation of restricted stock shares issued to the Advisor or Property Manager. Accordingly, actual results could differ from those estimates.
Impairment of Real Estate Assets. Real estate assets are reviewed on an ongoing basis to determine whether there are any indicators that the value of the real estate properties (including any related amortizable intangible assets or liabilities) may be impaired. Factors that could trigger an impairment analysis include, among others: (i) significant underperformance relative to historical or projected future operating results; (ii) significant changes in the manner of use of our real estate assets or the strategy of our overall business; (iii) a significant increase in competition; (iv) a significant adverse change in legal factors or an adverse action or assessment by a regulator, which could affect the value of our real estate assets; or (v) significant negative industry or economic trends. When such events or changes in circumstances are present, we will assess potential impairment by comparing estimated future undiscounted operating cash flows expected to be generated over the life of the asset group, and from its eventual disposition, to the carrying amount of the asset group. Generally, an asset group is considered impaired if management’s estimate of current and projected cash flows (undiscounted and unleveraged) of the asset group over its estimated holding period is less than the net carrying value of the asset group. Such cash flow projections consider factors such as expected future operating income, trends and prospects, as well as the effects of demand, competition and other factors. To the extent impairment has occurred, the carrying value of the asset group is adjusted to an amount to reflect the estimated fair value of the asset group.
For real estate we indirectly own through an investment in a joint venture, tenant-in-common interest or other similar investment structure and account for under the equity method, at each reporting date, we will compare the estimated fair value of our investment to the carrying value. An impairment charge will be recorded to the extent the fair value of our investment is less than the carrying amount and the decline in value is determined to be other than a temporary decline.
Income Taxes. To qualify as a REIT, we are subject to certain organizational and operational requirements, including a requirement to distribute to stockholders at least 90% of our annual REIT taxable income (which is computed without regard to the dividends-paid deduction or net capital gain and which does not necessarily equal net income as calculated in accordance with GAAP). As a REIT, we generally will not be subject to U.S. federal income tax on income that we distribute as dividends to our stockholders. If we fail to qualify as a REIT in any taxable year, we will be subject to U.S. federal income tax on our taxable income at regular corporate income tax rates and generally will not be permitted to qualify for treatment as a REIT for federal income tax purposes for the four taxable years following the year during which qualification is lost, unless the Internal Revenue ServiceIRS grants us relief under certain statutory provisions. Such an event could materially adversely affect our net income and net cash available for distribution to stockholders. However, we believe that we are organized and will operate in such a manner as to qualify for treatment as a REIT. Notwithstanding our intent to be treated as a REIT, we may be subject to U.S. federal taxes on our TRS entities and will be subject to taxes in other jurisdictions such as state, local or foreign jurisdictions.
Shares Based Payments to Non-Employees. In connection with the Amended Expense Support Agreements, we may issue Restricted Stock to the Advisor or the Property Manager on an annual basis in exchange for providing expense support in the event that cash distributions declared exceed modified funds from operations as defined by the Amended Expense Support Agreements.
The Restricted Stock is forfeited if shareholders do not ultimately receive their original invested capital back with at least a 6% annualized return of investment upon a future liquidity or disposition event. Upon issuance of Restricted Stock, we measure the fair value at our then-current lowest aggregate fair value pursuant to the Accounting Standards Codification (“ASC”) 505-50. On the date in which the Advisor or the Property Manager satisfies the vesting criteria, we remeasure the fair value of the Restricted Stock pursuant to ASC 505-50 and record expense equal to the difference between the original fair value and that of the remeasurement date. In addition, given that performance is outside the control of the Advisor or the Property Manager and involves both market conditions and counterparty performance conditions, the shares are treated as unissued for accounting purposes and we only include the Restricted Stock in the calculation of diluted earnings per share to the extent their effect is dilutive and the vesting conditions have been satisfied as of the reporting date.
Pursuant to the Expense Support Agreements, the Advisor or the Property Manager shall be the record owner of the Restricted Stock until the shares of common stock are sold or otherwise disposed of, and shall be entitled to all of the rights of a stockholder including, without limitation, the right to vote such shares (to the extent permitted by the Articles) and receive all dividends and other distributions paid with respect to such shares. All dividends or other distributions actually paid to the Advisor or the Property Manager in connection with the Restricted Stock shall vest immediately and will not be subject to forfeiture. We recognize expense related to the dividends on the Restricted Stock shares as declared.
Revenue Recognition. Rental income from operating leasesand tenant reimbursements includes rental income that is recorded on the straight-line basis over the terms of the leases. Ourleases for new leases and the remaining terms of existing leases for those acquired as part of a property acquisition. The straight-line method records the periodic average amount of base rent earned over the term of a lease, taking into account contractual rent increases over the lease term. We record the difference between base rent revenues earned and amounts due per the respective lease agreements, as applicable, as an increase or decrease to deferred rent and lease incentives in the accompanying consolidated balance sheets.
Some of our leases require the tenants to pay certain additional contractual amounts that arewe set aside by us for replacements of fixed assets and other improvements to the properties. These amounts are and will remain our property during and after the term of the lease. The amounts are recorded as capital improvement reserve income at the time that they are earned and are included in rental income from operating leasesand tenant reimbursements in the accompanying consolidated statement of operations. Additional percentage rent that is due contingent upon tenant performance thresholds, such as gross revenues, is deferred until the underlying performance thresholds have been achieved.
Resident feesRental income and services consist of monthly services, which include rent, assistance and other related services. Agreements with residents are generally for an initial term of three months and are cancelable by the residents with 30 days’ notice.
Tenant reimbursement income representstenant reimbursements also includes tenant reimbursements that represent amounts tenants are required to reimburse us for expenses incurred on behalf of the tenants, in accordance with the terms of the leases and are recognized in the period in which the related reimbursable expenses are incurred.incurred, such as real estate taxes, common area maintenance, and similar items.
Interest income is recognized on an accrual basis when earned. Any deferredResident fees and services are recorded in the period in which the services are performed and generally consist of (1) monthly rent, which covers occupancy of the residents’ unit as well as basic services, such as utilities, meals and certain housekeeping services, and (2) service level charges, such as assisted living care, memory care and ancillary services. Resident agreements are generally short-term in nature, billed monthly in advance and cancelable by the residents with a 30-day notice. Resident agreements may require the payment of upfront fees prior to moving into the community with any non-refundable portion of contractual interest is recognized on a straight-line basissuch fees being recorded as deferred revenue and amortized over the term of the corresponding note receivable. Loan origination fees incurred are recognized as a reduction in interest income over the term of the note receivable.estimated resident stay.
Impact of Accounting Pronouncements
See Item 8. “Financial Statements and Supplemental Data” – Note 2. “Significant Accounting Policies” for additional information about the impact of accounting pronouncements.
We may be exposed to interest rate changes primarily as a result of the long-term debt we used to acquire properties and other permitted investments. Our management objectives related to interest rate risk is to limit the impact of interest rate changes on earnings and cash flows and to lower our overall borrowing costs. To achieve our objectives, we borrow at fixed rates or variable rates with the lowest margins available, and in some cases, with the ability to convert from variable rates to fixed rates. With regard to variable rate financing, we assess interest rate cash flow risk by continually identifying and monitoring changes in interest rate exposures that may adversely impact expected future cash flows and by evaluating hedging opportunities.
The following is a schedule as of December 31, 2016,2017, of our fixed and variable rate debt maturities for each of the next five years and thereafter (principal maturities only) (in thousands):
|
| Expected Maturities |
|
|
|
| Expected Maturities |
|
|
|
|
|
|
|
|
| |||||||||||||||||||||||||||||||||
|
| 2017 |
| 2018 |
| 2019 |
| 2020 |
| 2021 |
| Thereafter |
| Total |
| Fair Value (1) |
| 2018 |
|
| 2019 |
|
| 2020 |
|
| 2021 |
|
| 2022 |
|
| Thereafter |
|
| Total |
|
| Fair Value(1) |
| |||||||||
Fixed rate debt |
| 9,984 |
| 204,191 |
| 5,152 |
| 73,653 |
| 2,650 |
| 86,630 |
| 382,260 |
| 383,000 |
| $ | 10,869 |
|
| $ | 12,010 |
|
| $ | 51,071 |
|
| $ | 11,971 |
|
| $ | 289,186 |
|
| $ | 34,602 |
|
| $ | 409,709 |
|
| $ | 410,000 |
| |
Weighted average interest rate on fixed rate debt |
| 4.25 | % | 4.30 | % | 4.14 | % | 3.96 | % | 4.24 | % | 4.25 | % | 4.22 | % |
|
|
| 4.24 | % |
|
| 4.23 | % |
|
| 3.84 | % |
|
| 4.28 | % |
|
| 4.25 | % |
|
| 4.52 | % |
|
| 4.22 | % |
|
|
|
| |
Variable rate debt |
| 253,772 |
| 84,747 |
| 473,480 |
| 327,043 |
| 36,839 |
| 30,658 |
| 1,206,539 |
| 1,205,000 |
| $ | 243,436 |
|
| $ | 519,297 |
|
| $ | 374,250 |
|
| $ | 37,587 |
|
| $ | 86,590 |
|
| $ | ― |
|
| $ | 1,261,160 |
|
| $ | 1,257,000 |
| |
Average interest rate on variable rate debt |
| LIBOR+2.38 | % | LIBOR+2.33 | % | LIBOR+2.32 | % | LIBOR+2.34 | % | LIBOR+2.37 | % | LIBOR+2.52 | % | LIBOR+2.35 | % |
|
| LIBOR +2.44 | % |
| LIBOR +2.42 | % |
| LIBOR +2.51 | % |
| LIBOR +2.87 | % |
| LIBOR +3.13 | % |
| ― | % |
| LIBOR +2.51 | % |
|
|
|
| ||||||||
____________
FOOTNOTE:FOOTNOTE:
(1) | The estimated fair value of our fixed and variable rate debt was determined using discounted cash flows based on market interest rates as of December 31, |
Assuming no interest rate protection, management estimates that a one-percentage point increase or decrease in LIBOR in 20172018 compared to LIBOR rates as of December 31, 20162017 would result in fluctuation of interest expense on our variable rate debt of approximately $12.1$12.6 million for the year ending December 31, 2017.2018. This sensitivity analysis contains certain simplifying assumptions, and although it gives an indication of our exposure to changes in interest rates, it is not intended to predict future results and actual results will likely vary given that our sensitivity analysis on the effects of changes in LIBOR does not factor in a potential change in variable rate debt levels, any offsetting gains on interest rate swap contracts, or the impact of any LIBOR floors or caps.
As of December 31, 2016,2017, the Company’s debt is comprised of approximately 24.0%24.5% in fixed rate debt, approximately 58.6%62.7% in variable rate debt with current interest rate protection and approximately 17.4%12.8% of unhedged variable rate debt. The remaining unhedged variable rate debt primarily relates to our construction loans and the Revolving Credit Facility. Overall, we believe longer term fixed rate debt could be beneficial in a rising interest rate or rising inflation rate environment and as such we continue to evaluate the need for additional interest rate protection on unhedged variable rate debt.
debt or variable rate debt with interest rate protection scheduled to mature.
Item 8.FINANCIAL STATEMENTS AND SUPPLEMENTARY DATA
INDEX TO CONSOLIDATED FINANCIAL STATEMENTS
CNL HEALTHCARE PROPERTIES, INC. AND SUBSIDIARIES
| Page |
|
|
Report of Independent Registered |
|
|
|
| |
|
|
| |
|
|
| |
|
|
Consolidated Statements of Stockholders’ Equity and Redeemable Noncontrolling Interest |
|
|
|
| |
|
|
| |
156 | |
157 | |
166 |
Report of Independent RegisteredRegistCertifiedered Public Accounting Firm
To the Board of Directors and Stockholders of CNL Healthcare Properties, Inc. and Subsidiaries::
Opinion on the Financial Statements
In our opinion, the consolidated financial statements listed inWe have audited the accompanying index present fairly, in all material respects, the financial positionconsolidated balance sheets of CNL Healthcare Properties, Inc. and its subsidiaries as of December 31, 2017 and 2016, and 2015,the related consolidated statements of operations, of comprehensive loss, of stockholders’ equity and redeemable noncontrolling interest and of cash flows for each of the three years in the period ended December 31, 2017, including the related notes and financial statement schedules listed in the index appearing under Item 15(a)(2) (collectively referred to as the “consolidated financial statements”). In our opinion, the consolidated financial statements present fairly, in all material respects, the financial position of the Company as of December 31, 2017 and 2016, and the results of their operations and their cash flows for each of the three years in the period ended December 31, 20162017 in conformity with accounting principles generally accepted in the United States of America. In addition, in our opinion, the financial statement schedules listed in the index appearing under Item 15(a)(2) present fairly, in all material respects, the information set forth therein when read in conjunction with the related
Basis for Opinion
These consolidated financial statements. These financial statements and financial statement schedules are the responsibility of the Company's management. Our responsibility is to express an opinion on thesethe Company’s consolidated financial statements and financial statement schedules based on our audits. We are a public accounting firm registered with the Public Company Accounting Oversight Board (United States) (“PCAOB”) and are required to be independent with respect to the Company in accordance with the U.S. federal securities laws and the applicable rules and regulations of the Securities and Exchange Commission and the PCAOB.
We conducted our audits of these consolidated financial statements in accordance with the standards of the Public Company Accounting Oversight Board (United States).PCAOB. Those standards require that we plan and perform the audit to obtain reasonable assurance about whether the consolidated financial statements are free of material misstatement. Anmisstatement, whether due to error or fraud. The Company is not required to have, nor were we engaged to perform, an audit includesof its internal control over financial reporting. As part of our audits we are required to obtain an understanding of internal control over financial reporting but not for the purpose of expressing an opinion on the effectiveness of the Company's internal control over financial reporting. Accordingly, we express no such opinion.
Our audits included performing procedures to assess the risks of material misstatement of the consolidated financial statements, whether due to error or fraud, and performing procedures that respond to those risks. Such procedures included examining, on a test basis, evidence supportingregarding the amounts and disclosures in the consolidated financial statements, assessingstatements. Our audits also included evaluating the accounting principles used and significant estimates made by management, andas well as evaluating the overall presentation of the consolidated financial statement presentation.statements. We believe that our audits provide a reasonable basis for our opinion.
/s/ PricewaterhouseCoopers LLP
Certified Public Accountants
Orlando, Florida
March 16, 20172018
We have served as the Company's auditor since 2010.
CNL HEALTHCARE PROPERTIES, INC. AND SUBSIDIARIES
(in thousands, except per share data)
|
| December 31, |
|
| December 31, |
| ||||||||||
ASSETS |
| 2016 |
|
| 2015 |
|
| 2017 |
|
| 2016 |
| ||||
Real estate assets: |
|
|
|
|
|
|
|
|
|
|
|
|
|
|
|
|
Real estate investment properties, net (including VIEs $112,929 and $103,691, respectively) |
| $ | 2,466,993 |
|
| $ | 2,451,538 |
| ||||||||
Real estate under development, including land (including VIEs $80,473 and $58,994 respectively) |
|
| 97,164 |
|
|
| 62,521 |
| ||||||||
Real estate investment properties, net (including VIEs $213,938 and $112,929, respectively) |
| $ | 2,488,085 |
|
| $ | 2,419,815 |
| ||||||||
Real estate under development, including land (including VIEs $0 and $80,473 respectively) |
|
| — |
|
|
| 97,164 |
| ||||||||
Total real estate assets, net |
|
| 2,564,157 |
|
|
| 2,514,059 |
|
|
| 2,488,085 |
|
|
| 2,516,979 |
|
Intangibles, net (including VIEs $2,891 and $4,015 respectively) |
|
| 131,502 |
|
|
| 172,452 |
| ||||||||
Cash (including VIEs $916 and $3,904 respectively) |
|
| 58,517 |
|
|
| 68,922 |
| ||||||||
Deferred rent and lease incentives (including VIEs $3,061 and $3,096 respectively) |
|
| 36,325 |
|
|
| 23,477 |
| ||||||||
Other assets (including VIEs $1,130 and $1,000 respectively) |
|
| 24,470 |
|
|
| 23,334 |
| ||||||||
Real estate held for sale, net |
| ― |
|
|
| 18,638 |
| |||||||||
Restricted cash (including VIEs $20 and $974 respectively) |
|
| 12,721 |
|
|
| 10,287 |
| ||||||||
Intangibles, net (including VIEs $1,895 and $2,891 respectively) |
|
| 99,512 |
|
|
| 130,609 |
| ||||||||
Cash (including VIEs $2,203 and $916 respectively) |
|
| 64,522 |
|
|
| 58,517 |
| ||||||||
Deferred rent and lease incentives (including VIEs $6,332 and $3,061 respectively) |
|
| 42,792 |
|
|
| 31,045 |
| ||||||||
Other assets (including VIEs $1,025 and $1,130 respectively) |
|
| 35,687 |
|
|
| 24,470 |
| ||||||||
Assets held for sale, net |
|
| 52,774 |
|
|
| 53,351 |
| ||||||||
Restricted cash (including VIEs $1,242 and $20 respectively) |
|
| 10,169 |
|
|
| 12,721 |
| ||||||||
Total assets |
| $ | 2,827,692 |
|
| $ | 2,831,169 |
|
| $ | 2,793,541 |
|
| $ | 2,827,692 |
|
LIABILITIES AND EQUITY |
|
|
|
|
|
|
|
|
|
|
|
|
|
|
|
|
Liabilities: |
|
|
|
|
|
|
|
|
|
|
|
|
|
|
|
|
Mortgages and other notes payable, net (including VIEs $104,890 and $85,093 respectively) |
| $ | 936,723 |
|
| $ | 831,825 |
| ||||||||
Mortgages and other notes payable, net (including VIEs $153,409 and $104,890 respectively) |
| $ | 1,032,153 |
|
| $ | 936,723 |
| ||||||||
Credit facilities |
|
| 641,989 |
|
|
| 656,284 |
|
|
| 630,066 |
|
|
| 641,989 |
|
Accounts payable and accrued liabilities (including VIEs $16,830 and $11,412 respectively) |
|
| 51,752 |
|
|
| 40,217 |
| ||||||||
Other liabilities (including VIEs $976 and $1,387 respectively) |
|
| 38,946 |
|
|
| 41,938 |
| ||||||||
Due to related parties (including VIEs $107 and $136 respectively) |
|
| 3,465 |
|
|
| 1,803 |
| ||||||||
Accounts payable and accrued liabilities (including VIEs $4,469 and $16,830 respectively) |
|
| 46,702 |
|
|
| 51,752 |
| ||||||||
Other liabilities (including VIEs $1,322 and $976 respectively) |
|
| 28,019 |
|
|
| 38,946 |
| ||||||||
Due to related parties (including VIEs $0 and $107 respectively) |
|
| 3,941 |
|
|
| 3,465 |
| ||||||||
Total liabilities |
|
| 1,672,875 |
|
|
| 1,572,067 |
|
|
| 1,740,881 |
|
|
| 1,672,875 |
|
Commitments and contingencies (Note 15) |
|
|
|
|
|
|
|
|
|
|
|
|
|
|
|
|
Redeemable noncontrolling interest |
|
| 472 |
|
|
| 551 |
|
|
| 425 |
|
|
| 472 |
|
Stockholders' equity: |
|
|
|
|
|
|
|
|
|
|
|
|
|
|
|
|
Preferred stock, $0.01 par value per share, 200,000 shares authorized; none issued or outstanding |
| ― |
|
| ― |
| ||||||||||
Excess shares, $0.01 par value per share, 300,000 shares authorized; none issued or outstanding |
| ― |
|
| ― |
| ||||||||||
Common stock, $0.01 par value per share, 1,120,000 shares authorized, 180,188 and 175,824 shares issued, and 175,070 and 174,430 shares outstanding, respectively |
|
| 1,751 |
|
|
| 1,744 |
| ||||||||
Preferred stock, $0.01 par value per share, |
|
|
|
|
|
|
|
| ||||||||
200,000 shares authorized; none issued or outstanding |
| ― |
|
| ― |
| ||||||||||
Excess shares, $0.01 par value per share, |
|
|
|
|
|
|
|
| ||||||||
300,000 shares authorized; none issued or outstanding |
| ― |
|
| ― |
| ||||||||||
Common stock, $0.01 par value per share, 1,120,000 shares authorized, |
|
|
|
|
|
|
|
| ||||||||
184,493 and 180,188 shares issued, and 174,634 and 175,070 shares outstanding, respectively |
|
| 1,747 |
|
|
| 1,751 |
| ||||||||
Capital in excess of par value |
|
| 1,528,435 |
|
|
| 1,528,781 |
|
|
| 1,523,372 |
|
|
| 1,528,435 |
|
Accumulated loss |
|
| (182,813 | ) |
|
| (151,146 | ) |
|
| (208,775 | ) |
|
| (182,813 | ) |
Accumulated distributions |
|
| (186,551 | ) |
|
| (112,543 | ) |
|
| (264,283 | ) |
|
| (186,551 | ) |
Accumulated other comprehensive loss |
|
| (7,863 | ) |
|
| (9,747 | ) |
|
| (985 | ) |
|
| (7,863 | ) |
Total stockholders' equity |
|
| 1,152,959 |
|
|
| 1,257,089 |
|
|
| 1,051,076 |
|
|
| 1,152,959 |
|
Noncontrolling interest |
|
| 1,386 |
|
|
| 1,462 |
|
|
| 1,159 |
|
|
| 1,386 |
|
Total equity |
|
| 1,154,817 |
|
|
| 1,259,102 |
|
|
| 1,052,660 |
|
|
| 1,154,817 |
|
Total liabilities and equity |
| $ | 2,827,692 |
|
| $ | 2,831,169 |
|
| $ | 2,793,541 |
|
| $ | 2,827,692 |
|
The abbreviation VIEs above means variable interest entities. |
|
|
|
|
|
|
|
| ||||||||
The abbreviation VIEs above means variable interest entities.
See accompanying notes to consolidated financial statements.
CNL HEALTHCARE PROPERTIES, INC. AND SUBSIDIARIES
CONSOLIDATED STATEMENTS OF OPERATIONS
(in thousands, except per share data)
|
| Years Ended December 31, |
|
| Years Ended December 31, |
| ||||||||||||||||||
|
| 2016 |
|
| 2015 |
|
| 2014 |
|
| 2017 |
|
| 2016 |
|
| 2015 |
| ||||||
Revenues: |
|
|
|
|
|
|
|
|
|
|
|
|
|
|
|
|
|
|
|
|
|
|
|
|
Rental income from operating leases |
| $ | 124,868 |
|
| $ | 101,125 |
|
| $ | 49,305 |
| ||||||||||||
Rental income and tenant reimbursements |
| $ | 149,516 |
|
| $ | 144,692 |
|
| $ | 117,118 |
| ||||||||||||
Resident fees and services |
|
| 232,363 |
|
|
| 183,407 |
|
|
| 123,777 |
|
|
| 248,900 |
|
|
| 232,363 |
|
|
| 183,407 |
|
Tenant reimbursement income |
|
| 19,824 |
|
|
| 15,993 |
|
|
| 7,504 |
| ||||||||||||
Interest income on note receivable from related party |
|
| — |
|
|
| — |
|
|
| 498 |
| ||||||||||||
Total revenues |
|
| 377,055 |
|
|
| 300,525 |
|
|
| 181,084 |
|
|
| 398,416 |
|
|
| 377,055 |
|
|
| 300,525 |
|
Operating expenses: |
|
|
|
|
|
|
|
|
|
|
|
|
|
|
|
|
|
|
|
|
|
|
|
|
Property operating expenses |
|
| 184,632 |
|
|
| 149,688 |
|
|
| 93,549 |
|
|
| 195,120 |
|
|
| 184,632 |
|
|
| 149,688 |
|
General and administrative |
|
| 12,847 |
|
|
| 10,088 |
|
|
| 6,877 |
|
|
| 13,010 |
|
|
| 12,847 |
|
|
| 10,088 |
|
Acquisition fees and expenses |
|
| 974 |
|
|
| 21,526 |
|
|
| 23,931 |
|
| ― |
|
|
| 974 |
|
|
| 21,526 |
| |
Asset management fees |
|
| 25,443 |
|
|
| 17,892 |
|
|
| 8,481 |
|
|
| 29,642 |
|
|
| 25,443 |
|
|
| 17,892 |
|
Property management fees |
|
| 18,532 |
|
|
| 14,759 |
|
|
| 8,942 |
|
|
| 18,850 |
|
|
| 18,532 |
|
|
| 14,759 |
|
Contingent purchase price consideration adjustment |
|
| (290 | ) |
|
| (589 | ) |
|
| (630 | ) | ||||||||||||
Financing coordination fees |
|
| 2,748 |
|
| ― |
|
| ― |
| ||||||||||||||
Contingent purchase price consideration adjustments |
|
| 47 |
|
|
| (290 | ) |
|
| (589 | ) | ||||||||||||
Impairment provision |
|
| — |
|
|
| 4,661 |
|
|
| — |
|
| ― |
|
| ― |
|
|
| 4,661 |
| ||
Loss on lease terminations |
|
| 785 |
|
|
| 863 |
|
|
| — |
|
| ― |
|
|
| 785 |
|
|
| 863 |
| |
Depreciation and amortization |
|
| 122,985 |
|
|
| 105,945 |
|
|
| 63,112 |
|
|
| 107,944 |
|
|
| 122,985 |
|
|
| 105,945 |
|
Total operating expenses |
|
| 365,908 |
|
|
| 324,833 |
|
|
| 204,262 |
|
|
| 367,361 |
|
|
| 365,908 |
|
|
| 324,833 |
|
Operating income (loss) |
|
| 11,147 |
|
|
| (24,308 | ) |
|
| (23,178 | ) |
|
| 31,055 |
|
|
| 11,147 |
|
|
| (24,308 | ) |
Other income (expense): |
|
|
|
|
|
|
|
|
|
|
|
|
|
|
|
|
|
|
|
|
|
|
|
|
Interest and other income |
|
| 64 |
|
|
| 158 |
|
|
| 104 |
|
|
| 60 |
|
|
| 64 |
|
|
| 158 |
|
Interest expense and loan cost amortization |
|
| (58,317 | ) |
|
| (42,969 | ) |
|
| (30,487 | ) |
|
| (66,193 | ) |
|
| (58,317 | ) |
|
| (42,969 | ) |
Equity in earnings (loss) of unconsolidated entities |
|
| 258 |
|
|
| (596 | ) |
|
| (1,387 | ) | ||||||||||||
Gain on purchase of controlling interest of investment in unconsolidated entity |
|
| — |
|
|
| — |
|
|
| 2,798 |
| ||||||||||||
Equity in earnings (loss) of unconsolidated entity |
|
| 403 |
|
|
| 258 |
|
|
| (596 | ) | ||||||||||||
Total other expense |
|
| (57,995 | ) |
|
| (43,407 | ) |
|
| (28,972 | ) |
|
| (65,730 | ) |
|
| (57,995 | ) |
|
| (43,407 | ) |
Income tax expense |
|
| (351 | ) |
|
| (378 | ) |
|
| (361 | ) | ||||||||||||
Income tax benefit (expense) |
|
| 8,363 |
|
|
| (351 | ) |
|
| (378 | ) | ||||||||||||
Loss before gain on sale of real estate |
|
| (47,199 | ) |
|
| (68,093 | ) |
|
| (52,511 | ) |
|
| (26,312 | ) |
|
| (47,199 | ) |
|
| (68,093 | ) |
Gain on sale of real estate |
|
| 15,415 |
|
|
| — |
|
|
| — |
|
| ― |
|
|
| 15,415 |
|
| ― |
| ||
Net loss |
|
| (31,784 | ) |
|
| (68,093 | ) |
|
| (52,511 | ) |
|
| (26,312 | ) |
|
| (31,784 | ) |
|
| (68,093 | ) |
Less: Net loss attributable to noncontrolling interest |
|
| (117 | ) |
|
| (38 | ) |
|
| — |
|
|
| (350 | ) |
|
| (117 | ) |
|
| (38 | ) |
Net loss attributable to common stockholders |
| $ | (31,667 | ) |
| $ | (68,055 | ) |
| $ | (52,511 | ) |
| $ | (25,962 | ) |
| $ | (31,667 | ) |
| $ | (68,055 | ) |
Net loss per share of common stock (basic and diluted) |
| $ | (0.18 | ) |
| $ | (0.44 | ) |
| $ | (0.61 | ) | ||||||||||||
Weighted average number of shares of common stock outstanding (basic and diluted) |
|
| 175,121 |
|
|
| 153,804 |
|
|
| 85,710 |
| ||||||||||||
Net loss per share of common stock |
|
|
|
|
|
|
|
|
|
|
|
| ||||||||||||
(basic and diluted) |
| $ | (0.15 | ) |
| $ | (0.18 | ) |
| $ | (0.44 | ) | ||||||||||||
Weighted average number of shares of |
|
|
|
|
|
|
|
|
|
|
|
| ||||||||||||
common stock outstanding (basic and diluted) |
|
| 175,151 |
|
|
| 175,121 |
|
|
| 153,804 |
| ||||||||||||
Distributions declared per share of common stock |
| $ | 0.4232 |
|
| $ | 0.4232 |
|
| $ | 0.4071 |
|
| $ | 0.4444 |
|
| $ | 0.4232 |
|
| $ | 0.4232 |
|
See accompanying notes to consolidated financial statements.
CNL HEALTHCARE PROPERTIES, INC. AND SUBSIDIARIES
CONSOLIDATED STATEMENTS OF COMPREHENSIVE LOSS
(in thousands)
|
| Years Ended December 31, |
|
| Years Ended December 31, |
| ||||||||||||||||||
|
| 2016 |
|
| 2015 |
|
| 2014 |
|
| 2017 |
|
| 2016 |
|
| 2015 |
| ||||||
Net loss |
| $ | (31,784 | ) |
| $ | (68,093 | ) |
| $ | (52,511 | ) |
| $ | (26,312 | ) |
| $ | (31,784 | ) |
| $ | (68,093 | ) |
Other comprehensive income (loss): |
|
|
|
|
|
|
|
|
|
|
|
|
|
|
|
|
|
|
|
|
|
|
|
|
Unrealized gain (loss) on derivative financial instruments, net |
|
| 1,903 |
|
|
| (5,143 | ) |
|
| (3,915 | ) |
|
| 6,586 |
|
|
| 1,903 |
|
|
| (5,143 | ) |
Reclassification of cash flow hedges upon derecognition |
|
| — |
|
|
| 236 |
|
|
| — |
|
|
| 318 |
|
| ― |
|
|
| 236 |
| |
Reclassification of cash flow hedges due to ineffectiveness |
|
| (18 | ) |
| 33 |
|
|
| — |
|
|
| (26 | ) |
|
| (18 | ) |
|
| 33 |
| |
Unrealized gain (loss) on derivative financial instruments of equity method investments |
|
| (1 | ) |
|
| (9 | ) |
|
| 10 |
| ||||||||||||
Unrealized loss on derivative financial instruments |
|
|
|
|
|
|
|
|
|
|
|
| ||||||||||||
of equity method investments |
| ― |
|
|
| (1 | ) |
|
| (9 | ) | |||||||||||||
Total other comprehensive income (loss) |
|
| 1,884 |
|
|
| (4,883 | ) |
|
| (3,905 | ) |
|
| 6,878 |
|
|
| 1,884 |
|
|
| (4,883 | ) |
Comprehensive loss |
| $ | (29,900 | ) |
| $ | (72,976 | ) |
| $ | (56,416 | ) |
|
| (19,434 | ) |
|
| (29,900 | ) |
|
| (72,976 | ) |
Less: Comprehensive loss attributable to noncontrolling interest |
|
| (117 | ) |
|
| (38 | ) |
|
| — |
|
|
| (350 | ) |
|
| (117 | ) |
|
| (38 | ) |
Comprehensive loss attributable to common stockholders |
| $ | (29,783 | ) |
| $ | (72,938 | ) |
| $ | (56,416 | ) |
| $ | (19,084 | ) |
| $ | (29,783 | ) |
| $ | (72,938 | ) |
See accompanying notes to consolidated financial statements.
CNL HEALTHCARE PROPERTIES, INC. AND SUBSIDIARIES
CONSOLIDATED STATEMENTS OF STOCKHOLDERS’ EQUITY AND REDEEMABLE NONCONTROLLING INTEREST
(in thousands, except per share data)
|
|
|
|
|
|
|
|
|
|
|
|
|
|
|
|
|
|
|
|
| Accumulated |
|
|
|
|
|
|
|
|
|
|
|
|
| ||||||
|
| Redeemable |
|
| Common Stock |
|
| Capital in |
|
|
|
|
|
|
|
|
|
| Other |
|
| Total |
|
| Non- |
|
|
|
|
| ||||||||||
|
| Noncontrolling |
|
| Number |
|
| Par |
|
| Excess of |
|
| Accumulated |
|
| Accumulated |
|
| Comprehensive |
|
| Stockholders' |
|
| controlling |
|
| Total |
| ||||||||||
|
| Interest |
|
| of Shares |
|
| Value |
|
| Par Value |
|
| Loss |
|
| Distributions |
|
| Loss |
|
| Equity |
|
| Interest |
|
| Equity |
| ||||||||||
Balance at December 31, 2013 |
| $ | — |
|
|
| 58,218 |
|
| $ | 582 |
|
| $ | 500,361 |
|
| $ | (30,580 | ) |
| $ | (17,423 | ) |
| $ | (959 | ) |
| $ | 451,981 |
|
| $ | — |
|
| $ | 451,981 |
|
Subscriptions received for common stock through public offering and reinvestment plan |
|
| — |
|
|
| 56,006 |
|
| 560 |
|
|
| 571,764 |
|
|
| — |
|
|
| — |
|
|
| — |
|
|
| 572,324 |
|
|
| — |
|
|
| 572,324 |
| |
Stock distributions |
|
| — |
|
|
| 2,356 |
|
| 24 |
|
|
| (24 | ) |
|
| — |
|
|
| — |
|
|
| — |
|
|
| — |
|
|
| — |
|
|
| — |
| |
Redemptions of common stock |
|
| — |
|
|
| (324 | ) |
|
| (3 | ) |
|
| (2,993 | ) |
|
| — |
|
|
| — |
|
|
| — |
|
|
| (2,996 | ) |
|
| — |
|
|
| (2,996 | ) |
Stock issuance and offering costs |
|
| — |
|
|
| — |
|
|
| — |
|
|
| (59,782 | ) |
|
| — |
|
|
| — |
|
|
| — |
|
|
| (59,782 | ) |
|
| — |
|
|
| (59,782 | ) |
Net loss |
|
| — |
|
|
| — |
|
|
| — |
|
|
| — |
|
|
| (52,511 | ) |
|
| — |
|
|
| — |
|
|
| (52,511 | ) |
|
| — |
|
|
| (52,511 | ) |
Other comprehensive loss |
|
| — |
|
|
| — |
|
|
| — |
|
|
| — |
|
|
| — |
|
|
| — |
|
|
| (3,905 | ) |
|
| (3,905 | ) |
|
| — |
|
|
| (3,905 | ) |
Distribution to holder of promoted interest |
|
| — |
|
|
| — |
|
|
| — |
|
|
| (2,000 | ) |
|
| — |
|
|
| — |
|
|
| — |
|
|
| (2,000 | ) |
|
| — |
|
|
| (2,000 | ) |
Cash distributions declared and paid or reinvested |
|
| — |
|
|
| — |
|
|
| — |
|
|
| — |
|
|
| — |
|
|
| (31,919 | ) |
|
| — |
|
|
| (31,919 | ) |
|
| — |
|
|
| (31,919 | ) |
Contribution from noncontrolling interests |
|
| 568 |
|
|
| — |
|
|
| — |
|
|
| — |
|
|
| — |
|
|
| — |
|
|
| — |
|
|
| — |
|
|
| 400 |
|
|
| 968 |
|
Balance at December 31, 2014 |
| $ | 568 |
|
|
| 116,256 |
|
| $ | 1,163 |
|
| $ | 1,007,326 |
|
| $ | (83,091 | ) |
| $ | (49,342 | ) |
| $ | (4,864 | ) |
| $ | 871,192 |
|
| $ | 400 |
|
| $ | 872,160 |
|
Subscriptions received for common stock through public offering and reinvestment plan |
|
| — |
|
|
| 55,956 |
|
| 561 |
|
|
| 588,143 |
|
|
| — |
|
|
| — |
|
|
| — |
|
|
| 588,704 |
|
|
| — |
|
|
| 588,704 |
| |
Stock distributions |
|
| — |
|
|
| 3,196 |
|
| 32 |
|
|
| (32 | ) |
|
| — |
|
|
| — |
|
|
| — |
|
|
| — |
|
|
| — |
|
|
| — |
| |
Redemptions of common stock |
|
| — |
|
|
| (978 | ) |
|
| (12 | ) |
|
| (9,297 | ) |
|
| — |
|
|
| — |
|
|
| — |
|
|
| (9,309 | ) |
|
| — |
|
|
| (9,309 | ) |
Stock issuance and offering costs |
|
| — |
|
|
| — |
|
|
| — |
|
|
| (57,359 | ) |
|
| — |
|
|
| — |
|
|
| — |
|
|
| (57,359 | ) |
|
| — |
|
|
| (57,359 | ) |
Net loss |
|
| (17 | ) |
|
| — |
|
|
| — |
|
|
| — |
|
|
| (68,055 | ) |
|
| — |
|
|
| — |
|
|
| (68,055 | ) |
|
| (21 | ) |
|
| (68,093 | ) |
Other comprehensive loss |
|
| — |
|
|
| — |
|
|
| — |
|
|
| — |
|
|
| — |
|
|
| — |
|
|
| (4,883 | ) |
|
| (4,883 | ) |
|
| — |
|
|
| (4,883 | ) |
Distribution to holder of noncontrolling interest |
|
| — |
|
|
| — |
|
|
| — |
|
|
| — |
|
|
| — |
|
|
| — |
|
|
| — |
|
|
| — |
|
|
| (23 | ) |
|
| (23 | ) |
Cash distributions declared and paid or reinvested |
|
| — |
|
|
| — |
|
|
| — |
|
|
| — |
|
|
| — |
|
|
| (63,201 | ) |
|
| — |
|
|
| (63,201 | ) |
|
| — |
|
|
| (63,201 | ) |
Contribution from noncontrolling interests |
|
| — |
|
|
| — |
|
|
| — |
|
|
| — |
|
|
| — |
|
|
| — |
|
|
| — |
|
|
| — |
|
|
| 1,106 |
|
|
| 1,106 |
|
Balance at December 31, 2015 |
| $ | 551 |
|
|
| 174,430 |
|
| $ | 1,744 |
|
| $ | 1,528,781 |
|
| $ | (151,146 | ) |
| $ | (112,543 | ) |
| $ | (9,747 | ) |
| $ | 1,257,089 |
|
| $ | 1,462 |
|
| $ | 1,259,102 |
|
See accompanying notes to consolidated financial statements.
CNL HEALTHCARE PROPERTIES, INC. AND SUBSIDIARIES
CONSOLIDATED STATEMENTS OF STOCKHOLDERS’ EQUITY AND REDEEMABLE NONCONTROLLING INTEREST
(in thousands, except per share data)
|
|
|
|
|
|
|
|
|
|
|
|
|
|
|
|
|
|
|
|
| Accumulated |
|
|
|
|
|
|
|
|
|
|
|
|
|
|
|
|
|
|
|
|
|
|
|
|
|
|
|
|
|
|
|
|
|
|
|
|
|
| Accumulated |
|
|
|
|
|
|
|
|
|
|
|
|
| |||||||
|
| Redeemable |
|
| Common Stock |
|
| Capital in |
|
|
|
|
|
|
|
|
|
| Other |
|
| Total |
|
| Non- |
|
|
|
|
|
| Redeemable |
|
| Common Stock |
|
| Capital in |
|
|
|
|
|
|
|
|
|
| Other |
|
| Total |
|
| Non- |
|
|
|
|
| ||||||||||||||||||||
|
| Noncontrolling |
|
| Number |
|
| Par |
|
| Excess of |
|
| Accumulated |
|
| Accumulated |
|
| Comprehensive |
|
| Stockholders' |
|
| controlling |
|
| Total |
|
| Noncontrolling |
|
| Number |
|
| Par |
|
| Excess of |
|
| Accumulated |
|
| Accumulated |
|
| Comprehensive |
|
| Stockholders' |
|
| controlling |
|
| Total |
| ||||||||||||||||||||
|
| Interest |
|
| of Shares |
|
| Value |
|
| Par Value |
|
| Loss |
|
| Distributions |
|
| Loss |
|
| Equity |
|
| Interest |
|
| Equity |
|
| Interest |
|
| of Shares |
|
| Value |
|
| Par Value |
|
| Loss |
|
| Distributions |
|
| Income (Loss) |
|
| Equity |
|
| Interest |
|
| Equity |
| ||||||||||||||||||||
Balance at December 31, 2014 |
| $ | 568 |
|
|
| 116,256 |
|
| $ | 1,163 |
|
| $ | 1,007,326 |
|
| $ | (83,091 | ) |
| $ | (49,342 | ) |
| $ | (4,864 | ) |
| $ | 871,192 |
|
| $ | 400 |
|
| $ | 872,160 |
| ||||||||||||||||||||||||||||||||||||||||
Subscriptions received for common stock |
|
|
|
|
|
|
|
|
|
|
|
|
|
|
|
|
|
|
|
|
|
|
|
|
|
|
|
|
|
|
|
|
|
|
|
|
|
|
|
| ||||||||||||||||||||||||||||||||||||||||
through public offering and reinvestment plan |
| ― |
|
|
| 55,956 |
|
|
| 561 |
|
|
| 588,143 |
|
|
| ― |
|
|
| ― |
|
| ― |
|
|
| 588,704 |
|
| ― |
|
|
| 588,704 |
| |||||||||||||||||||||||||||||||||||||||||||
Stock distributions |
| ― |
|
|
| 3,196 |
|
|
| 32 |
|
|
| (32 | ) |
| ― |
|
| ― |
|
| ― |
|
| ― |
|
| ― |
|
| ― |
| |||||||||||||||||||||||||||||||||||||||||||||||
Redemptions of common stock |
| ― |
|
|
| (978 | ) |
|
| (12 | ) |
|
| (9,297 | ) |
| ― |
|
| ― |
|
| ― |
|
|
| (9,309 | ) |
| ― |
|
|
| (9,309 | ) | |||||||||||||||||||||||||||||||||||||||||||||
Stock issuance and offering costs |
| ― |
|
| ― |
|
| ― |
|
|
| (57,359 | ) |
| ― |
|
| ― |
|
| ― |
|
|
| (57,359 | ) |
| ― |
|
|
| (57,359 | ) | |||||||||||||||||||||||||||||||||||||||||||||||
Net loss |
|
| (17 | ) |
| ― |
|
| ― |
|
| ― |
|
|
| (68,055 | ) |
| ― |
|
| ― |
|
|
| (68,055 | ) |
|
| (21 | ) |
|
| (68,093 | ) | |||||||||||||||||||||||||||||||||||||||||||||
Other comprehensive loss |
| ― |
|
| ― |
|
| ― |
|
| ― |
|
| ― |
|
| ― |
|
|
| (4,883 | ) |
|
| (4,883 | ) |
| ― |
|
|
| (4,883 | ) | |||||||||||||||||||||||||||||||||||||||||||||||
Distribution to noncontrolling interest |
| ― |
|
| ― |
|
| ― |
|
| ― |
|
| ― |
|
| ― |
|
| ― |
|
| ― |
|
|
| (23 | ) |
|
| (23 | ) | ||||||||||||||||||||||||||||||||||||||||||||||||
Cash distributions declared ($0.4232 per share) |
| ― |
|
| ― |
|
| ― |
|
| ― |
|
| ― |
|
|
| (63,201 | ) |
| ― |
|
|
| (63,201 | ) |
| ― |
|
|
| (63,201 | ) | |||||||||||||||||||||||||||||||||||||||||||||||
Contribution from noncontrolling interests |
| ― |
|
| ― |
|
| ― |
|
| ― |
|
| ― |
|
| ― |
|
| ― |
|
| ― |
|
|
| 1,106 |
|
|
| 1,106 |
| ||||||||||||||||||||||||||||||||||||||||||||||||
Balance at December 31, 2015 |
| $ | 551 |
|
|
| 174,430 |
|
| $ | 1,744 |
|
| $ | 1,528,781 |
|
| $ | (151,146 | ) |
| $ | (112,543 | ) |
| $ | (9,747 | ) |
| $ | 1,257,089 |
|
| $ | 1,462 |
|
| $ | 1,259,102 |
|
| $ | 551 |
|
|
| 174,430 |
|
| $ | 1,744 |
|
| $ | 1,528,781 |
|
| $ | (151,146 | ) |
| $ | (112,543 | ) |
| $ | (9,747 | ) |
| $ | 1,257,089 |
|
| $ | 1,462 |
|
| $ | 1,259,102 |
|
Subscriptions received for common stock through reinvestment plan |
|
| — |
|
|
| 4,365 |
|
|
| 44 |
|
|
| 42,510 |
|
|
| — |
|
|
| — |
|
|
| — |
|
|
| 42,554 |
|
|
| — |
|
|
| 42,554 |
| ||||||||||||||||||||||||||||||||||||||||
Subscriptions received for common stock |
|
|
|
|
|
|
|
|
|
|
|
|
|
|
|
|
|
|
|
|
|
|
|
|
|
|
|
|
|
|
|
|
|
|
|
|
|
|
|
| ||||||||||||||||||||||||||||||||||||||||
through reinvestment plan |
| ― |
|
|
| 4,365 |
|
|
| 44 |
|
|
| 42,510 |
|
|
| ― |
|
| ― |
|
| ― |
|
|
| 42,554 |
|
| ― |
|
|
| 42,554 |
| ||||||||||||||||||||||||||||||||||||||||||||
Redemptions of common stock |
|
| — |
|
|
| (3,725 | ) |
|
| (37 | ) |
|
| (36,206 | ) |
|
| — |
|
|
| — |
|
|
| — |
|
|
| (36,243 | ) |
|
| — |
|
|
| (36,243 | ) |
| ― |
|
|
| (3,725 | ) |
|
| (37 | ) |
|
| (36,206 | ) |
| ― |
|
| ― |
|
| ― |
|
|
| (36,243 | ) |
| ― |
|
|
| (36,243 | ) | |||||
Net loss |
|
| (79 | ) |
|
| — |
|
|
| — |
|
|
| — |
|
|
| (31,667 | ) |
|
| — |
|
|
| — |
|
|
| (31,667 | ) |
|
| (38 | ) |
|
| (31,784 | ) |
|
| (79 | ) |
| ― |
|
| ― |
|
| ― |
|
|
| (31,667 | ) |
| ― |
|
| ― |
|
|
| (31,667 | ) |
|
| (38 | ) |
|
| (31,784 | ) | |||||
Other comprehensive income |
|
| — |
|
|
| — |
|
|
| — |
|
|
| — |
|
|
| — |
|
|
| — |
|
|
| 1,884 |
|
|
| 1,884 |
|
|
| — |
|
|
| 1,884 |
|
| ― |
|
| ― |
|
| ― |
|
| ― |
|
| ― |
|
| ― |
|
|
| 1,884 |
|
|
| 1,884 |
|
| ― |
|
|
| 1,884 |
| |||||||
Distribution to holder of noncontrolling interest |
|
| — |
|
|
| — |
|
|
| — |
|
|
| — |
|
|
| — |
|
|
| — |
|
|
| — |
|
|
| — |
|
|
| (38 | ) |
|
| (38 | ) | ||||||||||||||||||||||||||||||||||||||||
Distribution to noncontrolling interest |
| ― |
|
| ― |
|
| ― |
|
| ― |
|
| ― |
|
| ― |
|
| ― |
|
| ― |
|
|
| (38 | ) |
|
| (38 | ) | ||||||||||||||||||||||||||||||||||||||||||||||||
Distributions to holders of promoted interest |
|
| — |
|
|
| — |
|
|
| — |
|
|
| (6,650 | ) |
|
| — |
|
|
| — |
|
|
| — |
|
|
| (6,650 | ) |
|
| — |
|
|
| (6,650 | ) |
| ― |
|
| ― |
|
| ― |
|
|
| (6,650 | ) |
| ― |
|
| ― |
|
| ― |
|
|
| (6,650 | ) |
| ― |
|
|
| (6,650 | ) | |||||||
Cash distributions declared and paid or reinvested |
|
| — |
|
|
| — |
|
|
| — |
|
|
| — |
|
|
| — |
|
|
| (74,008 | ) |
|
| — |
|
|
| (74,008 | ) |
|
| — |
|
|
| (74,008 | ) | ||||||||||||||||||||||||||||||||||||||||
Cash distributions declared ($0.4232 per share) |
| ― |
|
| ― |
|
| ― |
|
| ― |
|
| ― |
|
|
| (74,008 | ) |
| ― |
|
|
| (74,008 | ) |
| ― |
|
|
| (74,008 | ) | |||||||||||||||||||||||||||||||||||||||||||||||
Balance at December 31, 2016 |
| $ | 472 |
|
|
| 175,070 |
|
| $ | 1,751 |
|
| $ | 1,528,435 |
|
| $ | (182,813 | ) |
| $ | (186,551 | ) |
| $ | (7,863 | ) |
| $ | 1,152,959 |
|
| $ | 1,386 |
|
| $ | 1,154,817 |
|
| $ | 472 |
|
|
| 175,070 |
|
| $ | 1,751 |
|
| $ | 1,528,435 |
|
| $ | (182,813 | ) |
| $ | (186,551 | ) |
| $ | (7,863 | ) |
| $ | 1,152,959 |
|
| $ | 1,386 |
|
| $ | 1,154,817 |
|
Subscriptions received for common stock |
|
|
|
|
|
|
|
|
|
|
|
|
|
|
|
|
|
|
|
|
|
|
|
|
|
|
|
|
|
|
|
|
|
|
|
|
|
|
|
| ||||||||||||||||||||||||||||||||||||||||
through reinvestment plan |
| ― |
|
|
| 4,304 |
|
|
| 43 |
|
|
| 43,177 |
|
|
| ― |
|
| ― |
|
| ― |
|
|
| 43,220 |
|
| ― |
|
|
| 43,220 |
| ||||||||||||||||||||||||||||||||||||||||||||
Redemptions of common stock |
| ― |
|
|
| (4,740 | ) |
|
| (47 | ) |
|
| (47,285 | ) |
| ― |
|
| ― |
|
| ― |
|
|
| (47,332 | ) |
| ― |
|
|
| (47,332 | ) | |||||||||||||||||||||||||||||||||||||||||||||
Net loss |
|
| (97 | ) |
| ― |
|
| ― |
|
| ― |
|
|
| (25,962 | ) |
| ― |
|
| ― |
|
|
| (25,962 | ) |
|
| (253 | ) |
|
| (26,312 | ) | |||||||||||||||||||||||||||||||||||||||||||||
Other comprehensive income |
| ― |
|
| ― |
|
| ― |
|
| ― |
|
| ― |
|
| ― |
|
|
| 6,878 |
|
|
| 6,878 |
|
| ― |
|
|
| 6,878 |
| |||||||||||||||||||||||||||||||||||||||||||||||
Distribution to noncontrolling interest |
| ― |
|
| ― |
|
| ― |
|
| ― |
|
| ― |
|
| ― |
|
| ― |
|
| ― |
|
|
| (34 | ) |
|
| (34 | ) | ||||||||||||||||||||||||||||||||||||||||||||||||
Distributions to holders of promoted interest |
| ― |
|
| ― |
|
| ― |
|
|
| (955 | ) |
| ― |
|
| ― |
|
| ― |
|
|
| (955 | ) |
| ― |
|
|
| (955 | ) | |||||||||||||||||||||||||||||||||||||||||||||||
Cash distributions declared ($0.4444 per share) |
| ― |
|
| ― |
|
| ― |
|
| ― |
|
| ― |
|
|
| (77,732 | ) |
| ― |
|
|
| (77,732 | ) |
| ― |
|
|
| (77,732 | ) | |||||||||||||||||||||||||||||||||||||||||||||||
Contribution from noncontrolling interests |
|
| 50 |
|
| ― |
|
| ― |
|
| ― |
|
| ― |
|
|
|
|
|
| ― |
|
| ― |
|
|
| 60 |
|
|
| 110 |
| ||||||||||||||||||||||||||||||||||||||||||||||
Balance at December 31, 2017 |
| $ | 425 |
|
|
| 174,634 |
|
| $ | 1,747 |
|
| $ | 1,523,372 |
|
| $ | (208,775 | ) |
| $ | (264,283 | ) |
| $ | (985 | ) |
| $ | 1,051,076 |
|
| $ | 1,159 |
|
| $ | 1,052,660 |
| ||||||||||||||||||||||||||||||||||||||||
See accompanying notes to consolidated financial statements.
CNL HEALTHCARE PROPERTIES, INC. AND SUBSIDIARIES
CONSOLIDATED STATEMENTS OF CASH FLOWS
(in thousands)
|
| Years Ended December 31, |
|
| Years Ended December 31, |
| ||||||||||||||||||
|
| 2016 |
|
| 2015 |
|
| 2014 |
|
| 2017 |
|
| 2016 |
|
| 2015 |
| ||||||
Operating activities: |
|
|
|
|
|
|
|
|
|
|
|
|
|
|
|
|
|
|
|
|
|
|
|
|
Net loss |
| $ | (31,784 | ) |
| $ | (68,093 | ) |
| $ | (52,511 | ) |
| $ | (26,312 | ) |
| $ | (31,784 | ) |
| $ | (68,093 | ) |
Adjustments to reconcile net loss to net cash provided by operating activities: |
|
|
|
|
|
|
|
|
|
|
|
|
|
|
|
|
|
|
|
|
|
|
|
|
Depreciation and amortization |
|
| 122,985 |
|
|
| 105,945 |
|
|
| 63,112 |
|
|
| 107,944 |
|
|
| 122,985 |
|
|
| 105,945 |
|
Amortization of loan costs |
|
| 4,082 |
|
|
| 3,762 |
|
|
| 2,921 |
|
|
| 4,727 |
|
|
| 4,082 |
|
|
| 3,762 |
|
Accretion of note origination costs |
| ― |
|
| ― |
|
|
| 60 |
| ||||||||||||||
Amortization of above and below market intangibles |
|
| 753 |
|
|
| 915 |
|
|
| 345 |
|
|
| 620 |
|
|
| 753 |
|
|
| 915 |
|
Straight-line rent adjustments |
|
| (6,251 | ) |
|
| (4,309 | ) |
|
| (2,472 | ) |
|
| (979 | ) |
|
| (6,251 | ) |
|
| (4,309 | ) |
Unrealized (gain) loss from mark-to-market adjustments on swaps |
|
| (18 | ) |
|
| 33 |
|
| ― |
| |||||||||||||
Deferred income tax benefit |
|
| (9,131 | ) |
| ― |
|
| ― |
| ||||||||||||||
Loss on extinguishment of debt |
|
| 368 |
|
|
| 986 |
|
| ― |
|
|
| 239 |
|
|
| 1,495 |
|
|
| 986 |
| |
Contingent purchase price consideration adjustment |
|
| (290 | ) |
|
| (589 | ) |
|
| (630 | ) | ||||||||||||
Equity in earnings of unconsolidated entities, net of distributions |
|
| 460 |
|
|
| 1,486 |
|
|
| 2,931 |
| ||||||||||||
Impairment provision |
| ― |
|
|
| 4,661 |
|
| ― |
|
| ― |
|
| ― |
|
|
| 4,661 |
| ||||
Loss on lease termination |
|
| 785 |
|
|
| 863 |
|
| ― |
|
| ― |
|
|
| 785 |
|
|
| 863 |
| ||
Gain on sale of real estate |
|
| (15,415 | ) |
| ― |
|
| ― |
|
| ― |
|
|
| (15,415 | ) |
| ― |
| ||||
Gain on purchase of controlling interest in unconsolidated entity |
| ― |
|
| ― |
|
|
| (2,798 | ) | ||||||||||||||
Bad debt expense |
|
| 346 |
|
|
| 1,170 |
|
| ― |
| |||||||||||||
Other operating activities |
|
| 87 |
|
|
| 498 |
|
|
| 2,100 |
| ||||||||||||
Changes in operating assets and liabilities: |
|
|
|
|
|
|
|
|
|
|
|
|
|
|
|
|
|
|
|
|
|
|
|
|
Other assets |
|
| (2,024 | ) |
|
| 1,406 |
|
|
| (1,791 | ) |
|
| (1,660 | ) |
|
| (2,024 | ) |
|
| 1,406 |
|
Deferred rent and lease incentives |
|
| (5,386 | ) |
|
| (13,156 | ) |
|
| (1,016 | ) |
|
| (7,646 | ) |
|
| (5,386 | ) |
|
| (13,156 | ) |
Due from related parties |
| ― |
|
| ― |
|
|
| (155 | ) | ||||||||||||||
Accounts payable and accrued liabilities |
|
| (1,272 | ) |
|
| 6,423 |
|
|
| 7,235 |
|
|
| 7,715 |
|
|
| (1,272 | ) |
|
| 6,423 |
|
Other liabilities |
|
| 4,350 |
|
|
| 1,586 |
|
|
| 5,038 |
|
|
| (834 | ) |
|
| 4,350 |
|
|
| 1,586 |
|
Due to related parties |
|
| 1,715 |
|
|
| 428 |
|
|
| (997 | ) |
|
| 476 |
|
|
| 1,715 |
|
|
| 428 |
|
Net cash flows provided by operating activities |
|
| 73,404 |
|
|
| 43,517 |
|
|
| 19,272 |
|
|
| 75,246 |
|
|
| 74,531 |
|
|
| 43,517 |
|
Investing activities: |
|
|
|
|
|
|
|
|
|
|
|
|
|
|
|
|
|
|
|
|
|
|
|
|
Acquisition of properties |
|
| (28,088 | ) |
|
| (866,340 | ) |
|
| (869,458 | ) |
|
| (1,056 | ) |
|
| (28,088 | ) |
|
| (866,340 | ) |
Development of properties |
|
| (95,142 | ) |
|
| (73,552 | ) |
|
| (47,150 | ) |
|
| (47,887 | ) |
|
| (95,142 | ) |
|
| (73,552 | ) |
Proceeds from sale of real estate |
|
| 33,629 |
|
| ― |
|
| ― |
|
| ― |
|
|
| 33,629 |
|
| ― |
| ||||
Issuance of note receivable to related party |
| ― |
|
| ― |
|
|
| (2,065 | ) | ||||||||||||||
Collection of note receivable from related party |
| ― |
|
| ― |
|
|
| 5,591 |
| ||||||||||||||
Distribution from unconsolidated entities |
| ― |
|
| ― |
|
|
| 2,206 |
| ||||||||||||||
Purchase of controlling interest in unconsolidated entity |
| ― |
|
| ― |
|
|
| (1,584 | ) | ||||||||||||||
Investment in unconsolidated entities |
| ― |
|
| ― |
|
|
| (220 | ) | ||||||||||||||
Receipt of contingent purchase price consideration |
|
| 367 |
|
| ― |
|
| ― |
| ||||||||||||||
Changes in restricted cash |
|
| (2,435 | ) |
|
| 466 |
|
|
| (7,914 | ) | ||||||||||||
Capital expenditures |
|
| (7,362 | ) |
|
| (8,029 | ) |
|
| (4,021 | ) |
|
| (13,643 | ) |
|
| (7,362 | ) |
|
| (8,029 | ) |
Payment of leasing costs |
|
| (2,846 | ) |
|
| (2,806 | ) |
|
| (543 | ) | ||||||||||||
Deposits on real estate |
| ― |
|
|
| (500 | ) |
|
| (500 | ) | |||||||||||||
Other investing activities |
|
| (1,959 | ) |
|
| (2,480 | ) |
|
| (3,306 | ) | ||||||||||||
Net cash used in investing activities |
| $ | (101,877 | ) |
| $ | (950,761 | ) |
| $ | (925,658 | ) |
|
| (64,545 | ) |
|
| (99,443 | ) |
|
| (951,227 | ) |
Financing activities: |
|
|
|
|
|
|
|
|
|
|
|
| ||||||||||||
Subscriptions received for common stock through public offering |
| ― |
|
| ― |
|
|
| 551,876 |
| ||||||||||||||
Payment of stock issuance and offering costs |
| ― |
|
|
| (32 | ) |
|
| (58,983 | ) | |||||||||||||
Distributions to stockholders, net of distribution reinvestments |
|
| (34,512 | ) |
|
| (31,454 | ) |
|
| (26,373 | ) | ||||||||||||
Redemptions of common stock |
|
| (46,019 | ) |
|
| (28,585 | ) |
|
| (7,441 | ) | ||||||||||||
Distribution to holder of promoted interest |
|
| (2,000 | ) |
|
| (4,650 | ) |
| ― |
| |||||||||||||
Draws under credit facilities |
|
| 52,000 |
|
|
| 105,113 |
|
|
| 775,000 |
| ||||||||||||
Repayments on credit facilities |
|
| (64,863 | ) |
|
| (120,250 | ) |
|
| (321,403 | ) | ||||||||||||
Proceeds from mortgage and other notes payable |
|
| 166,306 |
|
|
| 157,620 |
|
|
| 95,570 |
| ||||||||||||
Principal payments on mortgage and other notes payable |
|
| (71,543 | ) |
|
| (54,272 | ) |
|
| (115,818 | ) | ||||||||||||
Contingent purchase price consideration payments |
|
| (3,645 | ) |
|
| (2,992 | ) |
| ― |
| |||||||||||||
Payment of loan costs |
|
| (2,988 | ) |
|
| (1,805 | ) |
|
| (5,414 | ) | ||||||||||||
Payment on extinguishment of debt |
| ― |
|
|
| (1,127 | ) |
| ― |
| ||||||||||||||
Other financing activities |
|
| 16 |
|
|
| (625 | ) |
|
| (2,203 | ) | ||||||||||||
Net cash flows provided by (used in) financing activities |
| $ | (7,248 | ) |
| $ | 16,941 |
|
| $ | 884,811 |
| ||||||||||||
CNL HEALTHCARE PROPERTIES, INC. AND SUBSIDIARIES
CONSOLIDATED STATEMENTS OF CASH FLOWS (CONTINUED)
(in thousands)
|
| Years Ended December 31, |
| |||||||||
|
| 2016 |
|
| 2015 |
|
| 2014 |
| |||
Financing activities: |
|
|
|
|
|
|
|
|
|
|
|
|
Subscriptions received for common stock through public offering |
| $ | — |
|
| $ | 551,876 |
|
| $ | 554,608 |
|
Payment of stock issuance and offering costs |
|
| (32 | ) |
|
| (58,983 | ) |
|
| (58,880 | ) |
Distributions to stockholders, net of distribution reinvestments |
|
| (31,454 | ) |
|
| (26,373 | ) |
|
| (14,203 | ) |
Redemptions of common stock |
|
| (28,585 | ) |
|
| (7,441 | ) |
|
| (2,246 | ) |
Contribution from redeemable noncontrolling interest |
| ― |
|
| ― |
|
|
| 568 |
| ||
Contribution from noncontrolling interest |
| ― |
|
|
| 71 |
|
|
| 400 |
| |
Distributions to holder of noncontrolling interest |
|
| (38 | ) |
|
| (23 | ) |
| ― |
| |
Distribution to holder of promoted interest |
|
| (4,650 | ) |
| ― |
|
|
| (2,000 | ) | |
Draws under revolving credit facilities |
|
| 105,113 |
|
|
| 775,000 |
|
|
| 367,223 |
|
Repayments on revolving credit facilities |
|
| (120,250 | ) |
|
| (321,403 | ) |
|
| (259,320 | ) |
Proceeds from mortgage and other notes payable |
|
| 157,620 |
|
|
| 95,570 |
|
|
| 402,438 |
|
Principal payments on mortgage and other notes payable |
|
| (54,272 | ) |
|
| (115,818 | ) |
|
| (27,012 | ) |
Lender deposits |
| ― |
|
| ― |
|
|
| (150 | ) | ||
Contingent purchase price consideration payment |
|
| (2,992 | ) |
| ― |
|
| ― |
| ||
Purchase of interest rate cap |
|
| (587 | ) |
|
| (2,251 | ) |
| ― |
| |
Payment of loan costs |
|
| (1,805 | ) |
|
| (5,414 | ) |
|
| (7,894 | ) |
Net cash flows provided by financing activities |
|
| 18,068 |
|
|
| 884,811 |
|
|
| 953,532 |
|
Net increase (decrease) in cash |
|
| (10,405 | ) |
|
| (22,433 | ) |
|
| 47,146 |
|
Cash at beginning of period |
|
| 68,922 |
|
|
| 91,355 |
|
|
| 44,209 |
|
Cash at end of period |
| $ | 58,517 |
|
| $ | 68,922 |
|
| $ | 91,355 |
|
Supplemental disclosure of cash flow information: |
|
|
|
|
|
|
|
|
|
|
|
|
Cash paid during the period for interest, net of capitalized interest of approximately $2.5 million, $2.0 million and $0.9 million, respectively |
| $ | 50,762 |
|
| $ | 37,621 |
|
| $ | 26,724 |
|
Cash paid for income taxes |
| $ | 1,140 |
|
| $ | 702 |
|
| $ | 545 |
|
Supplemental disclosure of non-cash investing and financing activities: |
|
|
|
|
|
|
|
|
|
|
|
|
Amounts incurred but not paid (including amounts due to related parties): |
|
|
|
|
|
|
|
|
|
|
|
|
Stock issuance and offering costs |
| $ | — |
|
| $ | 32 |
|
| $ | 1,656 |
|
Loan costs |
| $ | 26 |
|
| $ | 136 |
|
| $ | 310 |
|
Accrued development costs |
| $ | 12,497 |
|
| $ | 11,251 |
|
| $ | 7,951 |
|
Redemptions payable |
| $ | 10,397 |
|
| $ | 2,739 |
|
| $ | 872 |
|
Noncontrolling interests non-cash contributions |
| $ | — |
|
| $ | 1,035 |
|
| $ | — |
|
Contingent purchase price consideration |
| $ | 4,644 |
|
| $ | 7,500 |
|
| $ | 268 |
|
Loan cost amortization capitalized on development properties |
| $ | 320 |
|
| $ | 382 |
|
| $ | 73 |
|
Distribution to holder of promoted interest |
| $ | 2,000 |
|
| $ | — |
|
| $ | — |
|
Assumption of liabilities on acquired property |
| $ | — |
|
| $ | 6,905 |
|
| $ | 1,000 |
|
Assumption of mortgage note payable on acquired property |
| $ | — |
|
| $ | 7,128 |
|
| $ | 27,657 |
|
|
| Years Ended December 31, |
| |||||||||
|
| 2017 |
|
| 2016 |
|
| 2015 |
| |||
Net increase (decrease) in cash and restricted cash |
| $ | 3,453 |
|
| $ | (7,971 | ) |
| $ | (22,899 | ) |
Cash and restricted cash at beginning of period |
|
| 71,238 |
|
|
| 79,209 |
|
|
| 102,108 |
|
Cash and restricted cash at end of period |
| $ | 74,691 |
|
| $ | 71,238 |
|
| $ | 79,209 |
|
Supplemental disclosure of cash flow information: |
|
|
|
|
|
|
|
|
|
|
|
|
Cash paid for interest, net of capitalized interest of approximately $1.9 million, $2.5 million and $2.0 million, respectively |
| $ | 60,306 |
|
| $ | 50,762 |
|
| $ | 37,621 |
|
Cash paid for income taxes |
| $ | 1,186 |
|
| $ | 1,140 |
|
| $ | 702 |
|
Supplemental disclosure of non-cash investing and financing activities: |
|
|
|
|
|
|
|
|
|
|
|
|
Amounts incurred but not paid (including amounts due to related parties): |
|
|
|
|
|
|
|
|
|
|
|
|
Accrued development costs |
| $ | 450 |
|
| $ | 12,497 |
|
| $ | 11,251 |
|
Redemptions payable |
| $ | 11,711 |
|
| $ | 10,397 |
|
| $ | 2,739 |
|
Contingent purchase price consideration |
| $ | — |
|
| $ | 4,644 |
|
| $ | 7,500 |
|
Distribution to holder of promoted interest |
| $ | 955 |
|
| $ | 2,000 |
|
| $ | — |
|
Assumption of liabilities on acquired property |
| $ | — |
|
| $ | — |
|
| $ | 6,905 |
|
Assumption of mortgage note payable on acquired property |
| $ | — |
|
| $ | — |
|
| $ | 7,128 |
|
See accompanying notes to consolidated financial statements.
CNL HEALTHCARE PROPERTIES, INC. AND SUBSIDIARIES
NOTES TO CONSOLIDATED FINANCIAL STATEMENTS
YEAR ENDED DECEMBER 31, 20162017
1. | Organization |
CNL Healthcare Properties, Inc. was incorporated on June 8, 2010 and elected to be taxed as a REIT for U.S. federal income tax purposes beginning with the year ended December 31, 2012. The Company is externally advised by CNL Healthcare Corp. and its property manager is CNL Healthcare Manager Corp., each of which is a wholly owned subsidiaryan affiliate of CNL Financial Group, LLC, the Company’s Sponsor. The Sponsor is an affiliate of CNL Financial Group, Inc. and CNL Securities Corp., the managing dealer of the Company’s Offerings and a wholly owned subsidiary of CNL. The Advisor is responsible for managing the Company’s affairs on a day-to-day basis and for identifying and making acquisitions and investments on behalf of the Company pursuant to an advisory agreement among the Company, the Operating Partnership and the Advisor. Substantially all of the Company’s acquisition, operating, administrative and certain property management services are provided by affiliates of the Advisor and the Property Manager. In addition, third-party sub-property managers have been engaged to provide certain property management services.
The Company contributed the net proceeds from its Offerings to the Operating Partnership in exchange for partnership interests. The Company conducts substantially all of its operations either directly or indirectly through: (1) an operating partnership, CHP Partners, LP, in which the Company is the sole limited partner and its wholly-owned subsidiary, CHP GP, LLC, is the sole general partner; (2) a wholly-owned TRS, CHP TRS Holding, Inc.; (3) property owner and lender subsidiaries, which are single purpose entities; and (4) investments in joint ventures.
On September 30, 2015, the Company completed its Offerings pursuant to a registration statement on Form S-11 under the Securities Act of 1933 with the SEC. In October 2015, the Company deregistered the unsold shares of its common stock under its previous registration statement on Form S-11, except for 20,000,000 shares that the Company concurrently registered on Form S-3 under the Securities Exchange Act of 1933 with the SEC for the sale of additional shares of common stock through its Reinvestment Plan.
With the completion of the Offerings and substantial completion of its acquisition phase, the Company’s focus is on actively managing a diversified portfolio of healthcare real estate and real estate-related assets within the seniors housing, medical office, post-acute care and acute care asset classes. The types of seniors housing that the Company has acquired include independent and assisted living facilities, continuing care retirement communities, and Alzheimer’s / memory care facilities. The types of medical offices that the Company has acquired include MOBs, specialty medical and diagnostic service facilities, surgery centers, outpatient rehabilitation facilities, and other facilities designed for clinical services. The types of post-acute care facilities that the Company has acquired include skilled nursing facilities and inpatient rehabilitative hospitals. The types of acute care facilities that the Company has acquired include specialty surgical hospitals. The Company views, manages and evaluates its portfolio homogeneously as one collection of healthcare assets with a common goal of maximizing revenues and property income regardless of the asset class or asset type.
The Company has primarily leased its seniors housing properties to wholly owned TRS entities and engaged independent third-party managers under management agreements to operate the properties under RIDEA structures; however, the Company has also leased its properties to third-party tenants under triple-net or similar lease structures, where the tenant bears all or substantially all of the costs (including cost increases, for real estate taxes, utilities, insurance and ordinary repairs). Medical office, post-acute care and acute care properties have been leased on a triple-net, net or modified gross basis to third-party tenants. In addition, most of the Company’s investments have been wholly owned, although, it has invested through partnerships with other entities where it is believed to be appropriate and beneficial. The Company has and continues to invest in existing property developments or properties that have not reached full stabilization.
120
CNL HEALTHCARE PROPERTIES, INC. AND SUBSIDIARIES
NOTES TO CONSOLIDATED FINANCIAL STATEMENTS
YEAR ENDED DECEMBER 31, 2017
Basis of Presentation and Consolidation — The accompanying consolidated financial statements include the Company’s accounts, the accounts of wholly owned subsidiaries or subsidiaries for which the Company has a controlling interest, the accounts of VIEs in which the Company is the primary beneficiary, and the accounts of other subsidiaries over which the Company has a controlling financial interest. All material intercompany accounts and transactions have been eliminated in consolidation.
In accordance with the guidance for the consolidation of a variable interest entity (“VIE”),VIE, the Company is required to identify entities for which control is achieved through means other than voting rights and to determine the primary beneficiary of its VIEs. The Company qualitatively assesses whether it is the primary beneficiary of a VIE and considers various factors including, but not limited to, the design of the entity, its organizational structure including decision-making ability and financial agreements, its ability and the rights of others to participate in policy making decisions, as well as its ability to replace the VIE manager and/or liquidate the entity.
110
CNL HEALTHCARE PROPERTIES, INC. AND SUBSIDIARIES
NOTES TO CONSOLIDATED FINANCIAL STATEMENTS
YEAR ENDED DECEMBER 31, 2016
Use of Estimates — The preparation of financial statements in conformity with U.S. GAAP requires management to make estimates and assumptions that affect the reported amounts of assets and liabilities as of the date of the consolidated financial statements, the reported amounts of revenues and expenses during the reporting periods and the disclosure of contingent liabilities. For example, significant assumptions are made in the allocation of purchase price, the analysis of real estate impairments, the valuation of contingent assets and liabilities, and the valuation of restricted stock shares issued to the Advisor or Property Manager. Accordingly, actual results could differ from those estimates.
Allocation of Purchase Price for Real Estate Acquisitions — Upon acquisition of properties,real estate, the Company first determines whether substantially all of the fair value of the gross assets acquired is concentrated in a single identifiable asset or a group of similar identifiable assets in order to determine whether the acquisition should be accounted for as an asset acquisition. If the substantially all threshold is not met, the Company then determines whether the acquisition meets the definition of a business (i.e. does it include, at a minimum, an input and a substantive process that together significantly contribute to the ability to create outputs).
The Company estimates the fair value of acquired tangible assets (consisting of land, building and improvements, tenant improvements and equipment), intangible assets (consisting of in-place leases and above- or below-market leases), liabilities assumed and any contingent assets or liabilities in order to allocate the purchase price. In estimating the fair value of the assets acquired and liabilities assumed, the Company considers information obtained about each property as a result of its due diligence and utilizes various valuation methods, such as estimated cash flow projections using appropriate discount and capitalization rates, estimates of replacement costs net of depreciation and available market information.
The fair value of the tangible assets of an acquired leased property is determined by valuing the property as if it were vacant, and the “as-if-vacant” value is then allocated to land and building based on the relative fair values of these assets.building.
The purchase price is allocated to in-place lease intangibles based on management’s evaluation of the specific characteristics of the acquired lease(s). Factors considered include estimates of carrying costs during hypothetical expected lease-up periods, including estimates of lost rental income during the expected lease-up periods, and costs to execute similar leases such as leasing commissions, legal and other related expenses. Above- and below-market lease intangibles are recorded based on the present value of the difference between the contractual rents to be paid pursuant to the lease and management’s estimate of the fair market lease rates for each in-place lease and may include assumptions for lease renewals of below-market leases.
The Company also enters into contingent purchase price consideration arrangements in connection with acquisitions, which result in either an asset or liability being recognized as part of the purchase price allocation. In calculating the estimated fair value of contingent purchase price consideration arrangements, the Company considers information obtained during the due diligence and budget process as well as discount rates to determine the fair value. The Company evaluates the fair value of the arrangements at each reporting period and records any adjustments to the fair value as a component of operating income (expense) in the consolidated statement of operations. Refer to Note 9. “Contingent Purchase Price Consideration” for additional information on fair value measurements of contingent purchase price consideration arrangements.
121
CNL HEALTHCARE PROPERTIES, INC. AND SUBSIDIARIES
NOTES TO CONSOLIDATED FINANCIAL STATEMENTS
YEAR ENDED DECEMBER 31, 2017
Depreciation and Amortization — Real estate costs related to the acquisition and improvement of properties are capitalized. Repair and maintenance costs are charged to expense as incurred and significant replacements and improvements are capitalized. Repair and maintenance costs include all costs that do not extend the useful life of the real estate asset. The Company considers the period of future benefit of an asset to determine its appropriate useful life. Real estate assets are stated at cost less accumulated depreciation, which is computed using the straight-line method of accounting over the estimated useful lives of the related assets. Buildings and improvements are depreciated on the straight-line method over their estimated useful lives, which generally are the lesser of 39 and 15 years, respectively, or the remaining life of the ground lease.
Amortization of intangible assets is computed using the straight-line method of accounting over the shorter of the respective lease term or estimated useful life. If a lease is terminated or modified prior to its scheduled expiration, the Company recognizes a loss on lease termination related to the unamortized lease-related costs not deemed to be recoverable.
Impairment of Real Estate Assets — Real estate assets are reviewed on an ongoing basis to determine whether there are any indicators, including property operating performance and general market conditions, that the value of the real estate properties (including any related amortizable intangible assets or liabilities) may be impaired. To assess if an asset group is potentially impaired, management compares the estimated current and projected undiscounted cash flows, including estimated net sales proceeds, of the asset group over its remaining useful life to the net carrying value of the asset group. Such cash flow projections consider factors such as expected future operating income, trends and prospects, as well as the effects of demand, competition and other factors. In the event that the carrying value exceeds the undiscounted operating cash flows, the Company would recognize an impairment provision to adjust the carrying value of the asset group to the estimated fair value of the asset group.
111
CNL HEALTHCARE PROPERTIES, INC. AND SUBSIDIARIES
NOTES TO CONSOLIDATED FINANCIAL STATEMENTS
YEAR ENDED DECEMBER 31, 2016
When impairment indicators are present for real estate indirectly owned, through an investment in a joint venture or other similar investment structure accounted for under the equity method, the Company compares the estimated fair value of its investment to the carrying value. An impairment charge will be recorded to the extent fair value of the investment is less than the carrying amount and the decline in value is determined to be other than a temporary decline.
Real Estate Under Development — The Company records real estate under development at cost, including acquisition fees and closing costs incurred. The cost of the real estate under development includes direct and indirect costs of development, including interest and miscellaneous costs incurred during the development period until the project is substantially complete and available for occupancy. In addition, during active development, all operating expenses related to the project, including property expenses such as real estate taxes and insurance, are capitalized rather than expensed and incidental revenue is recorded as a reduction of capitalized development costs. Preleasing costs are expensed as incurred.
Real Estate Held For Sale — The Company classifies the assets associated with any property as held for sale once management has the authority to approve and commits to a plan to sell the property, the property is available for immediate sale, there is an active program to locate a buyer, the sale of the property is probable and the transfer of the property is expected to occur within one year. Upon the determination to classify a property as held for sale, the Company ceases recording further depreciation and amortization relating to the associated assets and those assets are measured at the lower of its carrying amount or fair value less disposition costs and are presented separately in the consolidated balance sheets for all periods presented. In addition, the Company classifies real estate held for sale as discontinued operations if the disposal represents a strategic shift that has (or will have) a major effect on the Company’s operations and financial results.
122
CNL HEALTHCARE PROPERTIES, INC. AND SUBSIDIARIES
NOTES TO CONSOLIDATED FINANCIAL STATEMENTS
YEAR ENDED DECEMBER 31, 2017
Capitalized Interest — Interest and loan cost amortization attributable to funds used to finance real estate under development is capitalized as additional costs of development. The Company capitalizes interest at the weighted average interest rate of the Company’s outstanding indebtedness and based on its weighted average expenditures for the period. Capitalization of interest on a specific project ceases when the project is substantially complete and ready for occupancy. During the years ended December 31, 2017, 2016 2015 and 2014,2015, the Company incurred interest expense and loan cost amortization of approximately $68.3 million, $61.1 million $45.3 million and $31.5$45.3 million, respectively, of which approximately $2.1 million, $2.8 million $2.3 million and $1.0$2.3 million, respectively, was capitalized according to this policy.
Cash — Cash consists of demand deposits at commercial banks. The Company also invests in cash equivalents consisting of highly liquid investments in money market funds with original maturities of three months or less during the year. As of December 31, 2016,2017, certain of the Company’s cash deposits exceeded federally insured amounts. However, the Company continues to monitor the third-party depository institutions that hold the Company’s cash, primarily with the goal of safeguarding principal. The Company attempts to limit cash investments to financial institutions with high credit standing; therefore, the Company believes it is not exposed to any significant credit risk on cash.
Restricted Cash — Certain amounts of cash are escrowed to fund capital expenditures, property taxes and/or insurance as required by the loan or lease terms, and certain security deposits represent restricted use funds.
Loan Costs — Financing costs paid in connection with obtaining debt are deferred and amortized over the estimated life of the debt using the effective interest method. As of December 31, 20162017 and 2015,2016, the accumulated amortization of loan costs was approximately $10.3$14.7 million and $7.8$10.3 million, respectively.
Deferred Lease-Related Costs – The Company defers lease-related costs that it incurs to obtain new or extend existing leases. The Company amortizes these costs using the straight-line method of accounting over the shorter of the respective lease term or estimated useful life. If a lease is terminated or modified prior to its scheduled expiration, the Company recognizes a loss on lease termination related to the unamortized deferred lease-related costs not deemed to be recoverable.
Revenue Recognition — Rental income from operating leasesand tenant reimbursements includes rental income that is recorded on the straight-line basis over the terms of the leases for new leases and the remaining terms of existing leases for those acquired as part of a property acquisition. The straight-line method records the periodic average amount of base rent earned over the term of a lease, taking into account contractual rent increases over the lease term. The Company records the difference between base rent revenues earned and amounts due per the respective lease agreements, as applicable, as an increase or decrease to deferred rent and lease incentives in the accompanying consolidated balance sheets.
112
CNL HEALTHCARE PROPERTIES, INC. AND SUBSIDIARIES
NOTES TO CONSOLIDATED FINANCIAL STATEMENTS
YEAR ENDED DECEMBER 31, 2016
Some of the Company’s leases require the tenants to pay certain additional contractual amounts that are set aside by the Company for replacements of fixed assets and other improvements to the properties. These amounts are and will remain the property of the Company during and after the term of the lease. The amounts are recorded as capital improvement reserve income at the time that they are earned and are included in rental income from operating leasesand tenant reimbursements in the accompanying consolidated statement of operations. Additional percentage rent that is due contingent upon tenant performance thresholds, such as gross revenues, is deferred until the underlying performance thresholds have been achieved.
Resident fees Rental income and services consist of monthly services, which include rent, assistance and other related services. Agreements with residents are generally for an initial term of three months and are generally cancelable by the residents with a 30-day notice.
Tenant reimbursement income representstenant reimbursements also includes tenant reimbursements that represent amounts tenants are required to reimburse the Company for expenses incurred on behalf of the tenants, in accordance with the terms of the leases and are recognized in the period in which the related reimbursable expenses are incurred.incurred, such as real estate taxes, common area maintenance, and similar items.
Interest income is recognized on an accrual basis when earned. Any deferred123
CNL HEALTHCARE PROPERTIES, INC. AND SUBSIDIARIES
NOTES TO CONSOLIDATED FINANCIAL STATEMENTS
YEAR ENDED DECEMBER 31, 2017
Resident fees and services are recorded in the period in which the services are performed and generally consist of (1) monthly rent, which covers occupancy of the residents’ unit as well as basic services, such as utilities, meals and certain housekeeping services, and (2) service level charges, such as assisted living care, memory care and ancillary services. Resident agreements are generally short-term in nature, billed monthly in advance and cancelable by the residents with a 30-day notice. Resident agreements may require the payment of upfront fees prior to moving into the community with any non-refundable portion of contractual interest is recognized on a straight-line basissuch fees being recorded as deferred revenue and amortized over the term of the corresponding note receivable. Loan origination fees incurred are recognized as a reduction to interest income over the term of the note receivable.estimated resident stay.
Reclassifications – Certain amounts in the prior year’s consolidated balance sheet have been reclassified to conform to the current year’s presentation with no effect on the other previously reported consolidated financial statements.
Derivative Financial Instruments — The Company and certainan unconsolidated equity method investmentsinvestment held by the Company use or have used derivative financial instruments to partially offset the effect of fluctuating interest rates on the cash flows associated with its variable-rate debt. Upon entry into a derivative, the Company or its unconsolidated equity method investment formally designates and documents the financial instrument as a hedge of a specific underlying exposure, as well as the risk management objectives and strategies for undertaking the hedge transaction. The Company or its unconsolidated equity method investment accounts for derivatives through the use of a fair value concept whereby the derivative positions are stated at fair value in the accompanying consolidated balance sheets. The fair value of derivatives used to hedge or modify risk fluctuates over time. As such, the fair value amounts should not be viewed in isolation, but rather in relation to the cash flows or fair value of the underlying hedged transaction and to the overall reduction in the exposure relating to adverse fluctuations in interest rates on the Company’s or its unconsolidated equity method investment’s variable-rate debt. Realized and unrealized gain (loss) on derivative financial instruments designated by either the Company or its unconsolidated equity method investment as cash flow hedges are reported as a component of other comprehensive income (loss), a component of stockholders’ equity, in the accompanying consolidated statements of comprehensive income (loss) to the extent they are effective; reclassified into earnings on the same line item associated with the hedged transaction and in the same period the hedged transaction affects earnings. Any ineffective portions of cash flow hedges are reported in the accompanying consolidated statements of operations as derivative gain (loss).
Realized and unrealized gain (loss) on derivative financial instruments designated as cash flow hedges that are entered into by the Company’s equity method investmentsinvestment are reported as a component of the Company’s other comprehensive income (loss) in proportion to the Company’s ownership percentage in the investment, with reclassifications and ineffective portions being included in equity in earnings (loss) of unconsolidated entitiesentity in the accompanying consolidated statements of operations.
Fair Value Measurements — Fair value assumptions are based on the framework established in the fair value accounting guidance under GAAP. The framework specifies a hierarchy of valuation inputs which was established to increase consistency, clarity and comparability in fair value measurements and related disclosures. The guidance describes the following fair value hierarchy based upon three levels of inputs that may be used to measure fair value, two of which are considered observable and one that is considered unobservable:
Level 1 — Quoted prices (unadjusted) in active markets for identical assets or liabilities that the Company has the ability to access.
Level 2 — Inputs, other than quoted prices included in Level 1, that are observable for the asset or liability either directly or indirectly; such as, quoted prices for similar assets or liabilities or other inputs that can be corroborated by observable market data.
Level 3 — Unobservable inputs for the asset or liability, which are typically based on the Company’s own assumptions, as there is little, if any, related market activity.
113124
CNL HEALTHCARE PROPERTIES, INC. AND SUBSIDIARIES
NOTES TO CONSOLIDATED FINANCIAL STATEMENTS
YEAR ENDED DECEMBER 31, 20162017
When market data inputs are unobservable, the Company utilizes inputs that it believes reflects the Company’s best estimate of the assumptions market participants would use in pricing the asset or liability. When inputs used to measure fair value fall within different levels of the hierarchy, the level within which the fair value measurement is categorized is based on the lowest level input that is significant to the fair value measurement.
Mortgages and Other Notes Payable — Mortgages and other notes payable are recorded at the stated principal amount and are generally collateralized by the Company’s properties. Mortgages and other notes payable assumed in connection with an acquisition are recorded at fair market value as of the date of the acquisition.
Redemptions — Under the Company’s stock redemption plan, a stockholder’s shares are deemed to have been redeemed as of the date that the Company accepts the stockholder’s request for redemption. From and after such date, the stockholder by virtue of such redemption is no longer entitled to any rights as a stockholder in the Company. Shares redeemed are retired and not available for reissue.
Net Loss per Share — Net loss per share is calculated based upon the weighted average number of shares of common stock outstanding during the period in which the Company was operational. For the purposes of determining the weighted average number of shares of common stock outstanding, stock distributions are treated as if they were issued and outstanding for the full periods presented. Therefore, the weighted average number of shares outstanding for the yearsyear ended December 31, 2015 and 2014 havehas been revised to include stock distributions declared and issued as if they were outstanding as of the beginning of eachthe period presented.
Shares Based Payments to Non-Employees — In connection with the Amended Expense Support Agreementsexpense support agreements described in Note 11. “Related Party Arrangements,” the Company may issue Restricted Stock to the Advisor or the Property Manager on an annual basis in exchange for providing expense support in the event that cash distributions declared exceed modified funds from operations as defined by the Amended Expense Support Agreements.expense support agreements.
The Restricted Stock is forfeited if shareholders do not ultimately receive their original invested capital back with at least a 6% annualized return of investment upon a future liquidity or disposition event of the Company. Upon issuance of Restricted Stock, the Company measures the fair value at its then-current lowest aggregate fair value pursuant to ASC 505-50. On the date in which the Advisor or the Property Manager satisfies the vesting criteria, the Company remeasures the fair value of the Restricted Stock pursuant to ASC 505-50 and records expense equal to the difference between the original fair value and that of the remeasurement date. In addition, given that performance is outside the control of the Advisor or the Property Manager and involves both market conditions and counterparty performance conditions, the shares are treated as unissued for accounting purposes and the Company only includes the Restricted Stock in the calculation of diluted earnings per share to the extent their effect is dilutive and the vesting conditions have been satisfied as of the reporting date.
Pursuant to the expense support agreements, the Advisor or the Property Manager shall be the record owner of the Restricted Stock until the shares of common stock are sold or otherwise disposed of, and shall be entitled to all of the rights of a stockholder of the Company including, without limitation, the right to vote such shares (to the extent permitted by the Company’s articles of incorporation) and receive all dividends and other distributions paid with respect to such shares. All dividends or other distributions actually paid to the Advisor or the Property Manager in connection with the Restricted Stock shall vest immediately and will not be subject to forfeiture. The Company recognizes expense related to the dividends on the Restricted Stock shares as declared.
Segment Information — Operating segments are components of an enterprise for which separate financial information is available and is evaluated regularly by the chief operating decision maker in deciding how to allocate resources and assess performance. The Company has determined that it operates in one operating segment, real estate ownership. The Company’s chief operating decision maker evaluates the Company’s operations from a number of different operational perspectives including, but not limited to, a property-by-property basis, and by tenant or by operator.
125
CNL HEALTHCARE PROPERTIES, INC. AND SUBSIDIARIES
NOTES TO CONSOLIDATED FINANCIAL STATEMENTS
YEAR ENDED DECEMBER 31, 2017
The Company derives all significant revenues from a single reportable operating segment of business, healthcare real estate, regardless of the type (seniors housing, medical office, etc.) or ownership structure (leased or managed). Accordingly, the Company does not report segment information; nevertheless, management periodically evaluates whether the Company continues to have one single reportable segment of business.
114
CNL HEALTHCARE PROPERTIES, INC. AND SUBSIDIARIES
NOTES TO CONSOLIDATED FINANCIAL STATEMENTS
YEAR ENDED DECEMBER 31, 2016
Redeemable Noncontrolling Interest – The Company classifies redeemable equity securities in accordance with Accounting Standard Update (“ASU”) No. 2009-04, “Liabilities (Topic 480): Accounting for Redeemable Equity Instruments,” which requires that equity securities redeemable at the option of the holder be classified outside of permanent stockholders’ equity. The Company classifies redeemable equity securities as redeemable noncontrolling interest within the accompanying consolidated balance sheets and consolidated statements of stockholders’ equity and redeemable noncontrolling interest. The Company evaluates the probability that these equity securities will become redeemable at each reporting period and, if determined probable, the Company measures the redemption value and records an adjustment to the carrying value of the equity securities as a component of redeemable noncontrolling interest.
Promoted Interest – The Company accounts for promoted interests with third-party developers in a manner similar to redeemable noncontrolling interests discussed above. The Company records the initial carrying value of the promoted interest at its issuance date fair value. Subsequently, as the completed developments stabilize and it becomes probable that the promoted interest thresholds will be met, the Company records a liability equal to the estimated redemption value at the end of each reporting period based on the conditions that exist as of the balance sheet date. In connection with the measurement of this liability, the Company records, as a reduction to capital in excess of par value, an amount equal to the difference between the promoted interests’ carrying value and the consideration paid or payable.
Acquisition Fees and Expenses — Acquisition fees, including investment services fees and expenses associated with transactions deemed to be business combinations (including investment transactions that are no longer under consideration), are expensed as incurred. Acquisition fees and expenses associated with making loans and with transactions deemed to be an asset purchase are capitalized. The following table summarizes the Company’s acquisition fees and expenses for the years ended December 31, 2017, 2016 2015 and 20142015 (in millions):
|
| December 31, |
|
| Years Ended December 31, |
| ||||||||||||||||||
|
| 2016 |
|
| 2015 |
|
| 2014 |
|
| 2017 |
|
| 2016 |
|
| 2015 |
| ||||||
Capitalized as real estate under development |
| $ | 0.2 |
|
| $ | 4.2 |
|
| $ | 3.4 |
| ||||||||||||
Capitalized as a component of the related assets |
| $ | 0.2 |
|
| $ | 0.2 |
|
| $ | 4.2 |
| ||||||||||||
Acquisition costs expensed |
|
| 1.0 |
|
|
| 21.5 |
|
|
| 23.9 |
|
| ― |
|
|
| 1.0 |
|
|
| 21.5 |
| |
Total acquisition costs incurred |
| $ | 1.2 |
|
| $ | 25.7 |
|
| $ | 27.3 |
|
| $ | 0.2 |
|
| $ | 1.2 |
|
| $ | 25.7 |
|
Income Taxes — The Company has elected to be taxed as a REIT under Sections 856 through 860 of the Internal Revenue Code of 1986, as amended and related regulations beginning with the year ended December 31, 2012. In order to be taxed as a REIT, the Company is subject to certain organizational and operational requirements, including the requirement to make distributions to its stockholders each year of at least 90% of its REIT taxable income (which is computed without regard to the dividends-paid deduction or net capital gain and which does not necessarily equal net income as calculated in accordance with GAAP). If the Company qualifies for taxation as a REIT, the Company generally will not be subject to U.S. federal income tax on income that the Company distributes as dividends. If the Company fails to quality as a REIT in any taxable year, the Company will be subject to U.S. federal income tax on its taxable income at regular corporate income tax rates and generally will not be permitted to qualify for treatment as a REIT for federal income tax purposes for the four taxable years following the year during which qualification is lost, unless the Internal Revenue ServiceIRS grants the Company relief under certain statutory provisions. Even if the Company qualifies for taxation as a REIT, it may be subject to certain state and local taxes on its income and property, and U.S. federal income and excise taxes on its undistributed income. The Company may also be subject to foreign taxes on investments outside of the U.S. based on the jurisdictions in which the Company conducts business.
126
CNL HEALTHCARE PROPERTIES, INC. AND SUBSIDIARIES
NOTES TO CONSOLIDATED FINANCIAL STATEMENTS
YEAR ENDED DECEMBER 31, 2017
The Company has and will continue to form subsidiaries which may elect to be taxed as a TRS for U.S. federal income tax purposes. Under the provisions of the Internal Revenue Code and applicable state laws, a TRS will be subject to tax on its taxable income from its operations. The Company will account for federal and state income taxes with respect to a TRS using the asset and liability method. Deferred tax assets and liabilities are recognized for the future tax consequences attributable to differences between the consolidated financial statement carrying amounts of existing assets and liabilities, the respective tax bases, operating losses and/or tax-credit carryforwards.
Prior to the Company’s REIT election, it was subject to corporate federal and state income taxes. Prior to and including the year ended December 31, 2011, the Company did not have earnings. The tax years from 2011 to 2015 remain subject to examination by taxing authorities throughout the U.S. The Company analyzed its material tax positions and determined that it has not taken any uncertain tax positions.
115
CNL HEALTHCARE PROPERTIES, INC. AND SUBSIDIARIES
NOTES TO CONSOLIDATED FINANCIAL STATEMENTS
YEAR ENDED DECEMBER 31, 2016
Investment in Unconsolidated Entity — The Company accounts for its investment in an unconsolidated joint venture under the equity method of accounting as the Company exercises significant influence, but does not maintain a controlling financial interest over these entities. The investment is recorded initially at cost and subsequently adjusted for cash contributions, distributions and equity in earnings (loss) of the unconsolidated entity. Based on the joint venture’s structure and any preference the Company receives on distributions and liquidation, the Company records its equity in earnings (loss) of the unconsolidated entity under the HLBV method of accounting. Under this method, the Company recognizes income or loss in each period as if the net book value of the assets in the venture were hypothetically liquidated at the end of each reporting period pursuant to the provisions of the joint venture agreement. In any given period, the Company could be recording more or less equity in earnings (loss) than actual cash distributions received or an investment balance that is more or less than what the Company may receive in the event of an actual liquidation. The Company determines whether distributions are classified as returns on investment or returns of investment based on the nature of the distribution. The Company’s investment in the unconsolidated entity was accounted for as an asset acquisition in which acquisition fees and expenses were capitalized as part of the basis in the investment in unconsolidated entity. These capitalized acquisition fees and expenses create an outside basis difference that are allocated to the assets of the investee and, if assigned to depreciable or amortizable assets, the basis differences are then amortized as a component of equity in earnings (loss) of unconsolidated entities.entity.
Adopted Accounting Pronouncements — In February 2015,August 2016, the FASBFinancial Accounting Standards Board issued ASU 2015-02, “Amendments to the Consolidation Analysis,2016-15, “Statement of Cash Flows (Topic 230): Classification of Certain Cash Receipts and Cash Payments,” which requires amendmentsmade eight targeted changes to bothhow cash receipts and cash payments are presented and classified in the VIEstatement of cash flows. The ASU further clarified how the predominance principle should be applied to cash receipts and voting models.payments relating to more than one class of cash flows. The amendments (i) modify the identification of variable interests (fees paid to a decision maker or service provider), the VIE characteristics for a limited partnership or similar entity and primary beneficiary determination under the VIE model, and (ii) eliminate the presumption within the current voting model that a general partner controls a limited partnership or similar entity. The new guidanceASU is effective for annual reporting periods, and interim periods within those annual periods, beginning after December 15, 2015 with early adoption permitted.2017. The amendments mayASU is to be applied using either a modified retrospective or full retrospective approach. The Company retrospectively adopted ASU 2015-02 on January 1, 2016; the adoption of which modified the Company’s identification and conclusions for certain entities from variable interest entities to voting interest entities and resultedeach period presented. Subsequently, in the removal of the required disclosures related to those entities, but did not have a material impact to the Company’s consolidated financial position, results of operations or cash flows as the Company’s consolidation determinations for all of its VIEs remained unchanged.
In April 2015,November 2016, the FASB issued ASU 2015-03, “Interest-Imputation2016-18, “Statement of Interest (Subtopic 835-30)Cash Flows (Topic 230): Simplifying the Presentation of Debt Issuance Costs,Restricted Cash,” which modifies the presentation of the statement of cash flows and requires that loan costs relatedreconciliation to a recognized debt liability be presentedthe overall change in the balance sheet astotal of cash, cash equivalents, restricted cash and restricted cash equivalents. As a direct deduction fromresult, the carrying amountstatement of that debt liability, consistent with debt discounts or premiums.cash flows will no longer present transfers between cash and cash equivalents and restricted cash and restricted cash equivalents. The new guidanceASU is effective for annual reporting periods, and interim periods within those annual periods, beginning after December 15, 2015 with early adoption permitted.2017. The ASU is to be applied retrospectively for each period presented. Upon adoption, an entity is required to comply with the applicable disclosures for a change in an accounting principle.
The FASB subsequently issued ASU 2015-15, “Presentation and Subsequent Measurement of Debt Issuance Costs Associated with Line-of-Credit Arrangements,” which clarifies that, given the absence of authoritative guidance in ASU 2015-03 regarding presentation and subsequent measurement of loan costs related to line-of-credit arrangements, the SEC Staff would not object to an entity deferring and presenting loan costs as an asset and subsequently amortizing the loan costs ratably over the term of the line-of-credit arrangement, regardless of whether there are any outstanding borrowings on the line-of-credit arrangement.
The Company early adopted both ASU 2015-032016-15 and ASU 2016-18 on January 1, 2016;2017; the adoption of which impacted the Company’s presentation of its consolidated financial positionstatement of cash flows, but did not have a material impact on the Company’s consolidated balance sheet or consolidated results of operations or cash flows.operations. Accordingly, the Company has retrospectively adjusted the presentation of loan costsits consolidated statement of cash flows for all periods presented.
127
CNL HEALTHCARE PROPERTIES, INC. AND SUBSIDIARIES
NOTES TO CONSOLIDATED FINANCIAL STATEMENTS
YEAR ENDED DECEMBER 31, 2017
The following table provides additional details by financial statement line item of the adjusted presentation in the Company’s consolidated balance sheet asstatement of cash flows for the years ended December 31, 2016 and 2015 (in thousands):
|
| As Filed December 31, |
|
|
|
|
|
| Adjusted December 31, |
| ||
|
| 2015 |
|
| Adjustments |
|
| 2015 |
| |||
Other assets |
| $ | 21,302 |
|
| $ | 2,032 |
|
| $ | 23,334 |
|
Loan costs, net |
| $ | 14,358 |
|
| $ | (14,358 | ) |
| $ | — |
|
Mortgages and other notes payable, net |
| $ | 840,435 |
|
| $ | (8,610 | ) |
| $ | 831,825 |
|
Credit facilities |
| $ | 660,000 |
|
| $ | (3,716 | ) |
| $ | 656,284 |
|
|
| As Filed |
|
|
|
|
|
| Adjusted |
| ||
|
| December 31, |
|
|
|
|
|
| December 31, |
| ||
|
| 2016 |
|
| Adjustments |
|
| 2016 |
| |||
Operating activities: |
|
|
|
|
|
|
|
|
|
|
|
|
Loss on extinguishment of debt |
| $ | 368 |
|
| $ | 1,127 |
|
| $ | 1,495 |
|
Net cash provided by operating activities |
| $ | 73,404 |
|
| $ | 1,127 |
|
| $ | 74,531 |
|
Investing activities: |
|
|
|
|
|
|
|
|
|
|
|
|
Changes in restricted cash |
| $ | (2,434 | ) |
| $ | 2,434 |
|
| $ | — |
|
Net cash used in investing activities |
| $ | (101,877 | ) |
| $ | 2,434 |
|
| $ | (99,443 | ) |
Financing activities: |
|
|
|
|
|
|
|
|
|
|
|
|
Payment on extinguishment of debt |
| $ | — |
|
| $ | (1,127 | ) |
| $ | (1,127 | ) |
Net cash provided by financing activities |
| $ | 18,068 |
|
| $ | (1,127 | ) |
| $ | 16,941 |
|
Cash and restricted cash at end of period |
| $ | 58,517 |
|
| $ | 12,721 |
|
| $ | 71,238 |
|
|
| As Filed |
|
|
|
|
|
| Adjusted |
| |||
|
| December 31, |
|
|
|
|
|
| December 31, |
| |||
|
| 2015 |
|
| Adjustments |
|
| 2015 |
| ||||
Net cash provided by operating activities |
| $ | 43,517 |
|
| $ | ― |
|
| $ | 43,517 |
| |
Investing activities: |
|
|
|
|
|
|
|
|
|
|
|
| |
Changes in restricted cash |
| $ | 466 |
|
| $ | (466 | ) |
| $ | — |
| |
Net cash used in investing activities |
| $ | (950,761 | ) |
| $ | (466 | ) |
| $ | (951,227 | ) | |
Net cash provided by financing activities |
| $ | 884,811 |
|
| $ | ― |
|
| $ | 884,811 |
| |
Cash and restricted cash at end of period |
| $ | 68,922 |
|
| $ | 10,287 |
|
| $ | 79,209 |
| |
116
CNL HEALTHCARE PROPERTIES, INC. AND SUBSIDIARIES
NOTES TO CONSOLIDATED FINANCIAL STATEMENTS
YEAR ENDED DECEMBER 31,In October 2016,
In September 2015, the FASB issued ASU 2015-16, “Business Combinations2016-17, “Consolidation (Topic 805)810): Simplifying the Accounting for Measurement-Period Adjustments,Interests Held Through Related Parties that are under Common Control,” which requires an acquirerentity to recognize provisional amountsconsider its indirect interests held by related parties that are identified duringunder common control on a proportionate basis when evaluating whether the measurement period in the reporting period in which the adjustment amounts are determined.entity is a primary beneficiary of a VIE. The amendments require that the acquirer record, in the same period’s financial statements, the effect on earnings of changes in depreciation, amortization, or other income effects, if any, as a result of the change to the provisional amounts, calculated as if the accounting had been completed at the acquisition date. The new guidanceASU is effective for annual reporting periods, and interim periods within those annual periods, beginning after December 15, 2015 with early adoption permitted.2016. The Company has adopted ASU 2015-162016-17 on January 1, 2016;2017; the adoption of which did not have a material impact to its consolidated financial position, results of operations or cash flows.
In January 2017, the FASB issued ASU 2017-01, “Business Combinations (Topic 805): Clarifying the Definition of a Business,” which clarifies the definition of a business and provides a framework by which to evaluate whether transactions should be accounted for as acquisitions (or disposals) of assets or businesses. The ASU is effective for annual reporting periods, and interim periods within those annual periods, beginning after December 15, 2017. The ASU is to be applied prospectively for each period presented. The Company early adopted ASU 2017-01 on January 1, 2017; the adoption of which did not have a material impact to its consolidated financial position, results of operations or cash flows.
128
CNL HEALTHCARE PROPERTIES, INC. AND SUBSIDIARIES
NOTES TO CONSOLIDATED FINANCIAL STATEMENTS
YEAR ENDED DECEMBER 31, 2017
Recent Accounting Pronouncements— In May 2014, the FASB issued ASU No. 2014-09, “Revenue from Contracts with Customers,” as a new ASC topic (Topic 606). The core principle of this ASU is that an entity should recognize revenue to depict the transfer of promised goods or services to customers in an amount that reflects the consideration to which the entity expects to be entitled in exchange for those goods or services. The ASU further provides guidance for any entity that either enters into contracts with customers to transfer goods or services or enters into contracts for the transfer of nonfinancial assets, unless those contracts are within the scope of other standards (for example, lease contracts). The FASB subsequently issued ASU 2015-14 to defer the effective date of ASU 2014-09 until annual reporting periods beginning after December 15, 2017, including interim periods within that reporting period, with earlier adoption permitted. In addition, in December 2016, the FASB issued ASU 2016-20,2017-05, "Other Income - Gains and Losses from the Derecognition of Nonfinancial Assets (Subtopic 610-20)," which provides technical correctionsclarifies the scope of subtopic 610-20, that was issued as a part of ASU 2014-09, as it relates to in-substance nonfinancial assets and improvements tomust be adopted concurrently with ASC 606 based on questions that stakeholders have raised while working through the implementation. ASC 606606. Both ASUs can be adopted using one of two retrospective transition methods: (i) retrospectively to each prior reporting period presented or (ii) as a cumulative-effect adjustment as of the date of adoption. The Company continuesadopted these ASUs using the modified retrospective approach as its transition method effective January 1, 2018; the adoption of which will not have a material impact to develop and execute on its implementation plan for ASC 606 and is in the process of finalizing its assessment of the impact that adoption will have on the Company’s consolidated financial statements; specifically, as it relates to non-lease components of revenue and the impact adoption of ASC 606 could have on the Company’s consolidated results of operations and cash flows. As such, the Company has not yet selected a transition method for adoption on January 1, 2018.statements.
In February 2016, the FASB issued ASU 2016-02, “Leases (Topic 842): Accounting for Leases,” which sets out the principles for the recognition, measurement, presentation and disclosure of leases for both parties to a contract (i.e. lessees and lessors). The ASU requires lessees to recognize assets and liabilities on the balance sheet for the rights and obligations created by all leases with terms of more than 12 months. The ASU further modifies lessors’ classification criteria for leases and the accounting for sales-type and direct financing leases. The ASU will also require qualitative and quantitative disclosures designed to give financial statement users additional information on the amount, timing, and uncertainty of cash flows arising from leases. The ASU is effective for annual reporting periods, and interim periods within those annual periods, beginning after December 15, 2018 with early adoption permitted. The ASU is to be applied using a modified retrospective approach. The Company continues to execute on its implementation plan for ASC 842 and expects to early adopt this ASU on January 1, 2018 and2019. The Company expects that adoption will impact the Company’s consolidated financial statements;statements and related financial statement disclosures; specifically, (1) the Company’s consolidated financial position as it relates to the required presentation for arrangements such as ground and air rights leases in which the Company is the lessee, and (2) the required presentationallocation of groundconsideration between lease and air rights leases in its consolidated financial position. However, as it relates to arrangementnon-lease components for arrangements in which the Company is the lessor,lessor. However, the Company does not expect the adoption of this ASU to have a material impact on the Company’s consolidated results of operations or cash flows. In addition, while still in exposure draft, the FASB has proposed a practical expedient for lessors allowing them to elect to not separate lease and non-lease components in a contract for the purpose of revenue recognition and disclosure if certain criteria are met. If the proposed practical expedient is finalized, the Company plans to elect the practical expedient.
In August 2016,2017, the FASB issued ASU 2016-15, “Statement of Cash Flows2017-12 “Derivatives and Hedging (Topic 230)815): Classification of Certain Cash Receipts and Cash Payments,Targeted Improvements to Accounting for Hedging Activities,” which will make eight targeted changesamended the hedge accounting model to how cash receiptsbetter reflect an entity’s risk management activities. The ASU expands an entities ability to hedge nonfinancial and cash payments are presented and classified infinancial risk components as well as reduce the statementcomplexity related to fair value hedges of cash flows.interest rate risk. The ASU further clarifies howeliminates the predominance principle shouldrequirement to separately measure and report hedge ineffectiveness and generally requires the entire change in the fair value of a hedging instrument to be applied to cash receipts and payments relating to more than one class of cash flows.presented in the same income statement line as the hedged item. The ASU is effective for annual reporting periods, and interim periods within those annual periods, beginning after December 15, 2017. The ASU is to be applied retrospectively for each period presented.2018. The Company has determined that it willexpects to early adopt this ASU on January 1, 20172018 and thatdoes not expect the adoption will not materiallyof this ASU to have a material impact the presentation ofon the Company’s consolidated cash flows.
In October 2016, the FASB issued ASU 2016-17, “Consolidation (Topic 810): Interests Held Through Related Parties that are under Common Control,” which requires an entity to consider its indirect interests held by related parties that are under common control on a proportionate basis when evaluating whether the entity is a primary beneficiary of a VIE. The ASU is effective for annual reporting periods, and interim periods within those annual periods, beginning after December 15, 2016. The Company will adopt this ASU on January 1, 2017 and has determined that adoption will not materially impact the presentation of the Company’s consolidated financial position, results of operations or cash flows.
117129
CNL HEALTHCARE PROPERTIES, INC. AND SUBSIDIARIES
NOTES TO CONSOLIDATED FINANCIAL STATEMENTS
YEAR ENDED DECEMBER 31, 20162017
In November 2016, the FASB issued ASU 2016-18, “Statement of Cash Flows (Topic 230): Restricted Cash,” which modifies the presentation of the statement of cash flows and requires reconciliation to the overall change in the total of cash, cash equivalents, restricted cash and restricted cash equivalents. As a result, the statement of cash flows will no longer present transfers between cash and cash equivalents and restricted cash and restricted cash equivalents. The ASU is effective for annual reporting periods, and interim periods within those annual periods, beginning after December 15, 2017. The ASU is to be applied retrospectively for each period presented. The Company has determined that it will early adopt this ASU on January 1, 2017 and that adoption will not materially impact the presentation of the Company’s consolidated cash flows.
In January 2017, the FASB issued ASU 2017-01, “Business Combinations (Topic 805): Clarifying the Definition of a Business,” which clarifies the definition of a business and provides a framework by which to evaluate whether transactions should be accounted for as acquisitions (or disposals) of assets or businesses. The ASU is effective for annual reporting periods, and interim periods within those annual periods, beginning after December 15, 2017. The ASU is to be applied prospectively for each period presented. The Company expects to early adopt this ASU on January 1, 2017 and that adoption will not materially impact the Company’s consolidated financial position, results of operations and cash flows as its acquisition activity is expected to be limited.
Real Estate Investment Properties — During the year ended December 31, 2017, the Company did not acquire any real estate investment properties, except for the purchase of a parcel of unimproved land discussed below. During the year ended December 31, 2016, the Company acquired the following post-acute care facility:
|
|
|
| Date |
| Purchase Price |
| |
Name and Location |
| Structure |
| Acquired |
| (in thousands) |
| |
Post-Acute Care |
|
|
|
|
|
|
|
|
Cobalt Rehabilitation Hospital New Orleans |
| Triple-net Lease |
| 10/19/2016 |
| $ | 28,588 |
|
New Orleans, LA |
|
|
|
|
|
|
|
|
|
|
|
|
|
| $ | 28,588 |
|
118
CNL HEALTHCARE PROPERTIES, INC. AND SUBSIDIARIES
NOTES TO CONSOLIDATED FINANCIAL STATEMENTS
YEAR ENDED DECEMBER 31, 2016
During the year ended December 31, 2015, the Company acquired the following 39 properties, which were comprised of 15 senior housing communities, 22 MOBs, one post-acute care facility and one acute care hospital as follows:
|
|
|
| Date |
| Purchase Price |
| |
Name and Location |
| Structure |
| Acquired |
| (in thousands) |
| |
Acute care |
|
|
|
|
|
|
|
|
Triangle Orthopaedic |
|
|
|
|
|
|
|
|
North Carolina Specialty Hospital |
| Modified Lease |
| 6/29/2015 |
| $ | 31,830 |
|
Durham, NC |
|
|
|
|
|
|
|
|
Medical Office |
|
|
|
|
|
|
|
|
Novi Orthopaedic Center |
| Modified Lease |
| 2/13/2015 |
|
| 30,500 | (1) |
Novi, MI |
|
|
|
|
|
|
|
|
Southeast Medical Office Properties |
|
|
|
|
|
|
|
|
UT Cancer Institute Building |
| Modified Lease |
| 2/20/2015 |
|
| 33,660 |
|
Knoxville, TN |
|
|
|
|
|
|
|
|
Bend Memorial Clinic MOB |
| Modified Lease |
| 5/11/2015 |
|
| 36,000 | (1) |
Bend, OR |
|
|
|
|
|
|
|
|
Stoneterra Medical Plaza |
| Modified Lease |
| 5/29/2015 |
|
| 15,050 | (1) |
San Antonio, TX |
|
|
|
|
|
|
|
|
Triangle Orthopaedic |
|
|
|
|
|
|
|
|
Triangle Orthopaedic Durham |
| Modified Lease |
| 6/29/2015 |
|
| 21,275 |
|
Durham, NC |
|
|
|
|
|
|
|
|
Triangle Orthopaedic Oxford |
| Modified Lease |
| 6/29/2015 |
|
| 4,728 |
|
Oxford, NC |
|
|
|
|
|
|
|
|
Triangle Orthopaedic Chapel Hill |
| Modified Lease |
| 6/29/2015 |
|
| 3,258 |
|
Chapel Hill, NC |
|
|
|
|
|
|
|
|
Triangle Orthopaedic Roxboro |
| Modified Lease |
| 6/29/2015 |
|
| 2,067 |
|
Roxboro, NC |
|
|
| �� |
|
|
|
|
Doctor's Park |
|
|
|
|
|
|
|
|
Doctor's Park Building B |
| Modified Lease |
| 6/30/2015 |
|
| 5,000 | (1) |
Chula Vista, CA ("San Diego") |
|
|
|
|
|
|
|
|
Doctor's Park Building C |
| Modified Lease |
| 6/30/2015 |
|
| 10,000 | (1) |
Chula Vista, CA ("San Diego") |
|
|
|
|
|
|
|
|
540 New Waverly Place |
| Modified Lease |
| 7/20/2015 |
|
| 15,000 | (1) |
Cary, NC ("Raleigh") |
|
|
|
|
|
|
|
|
MedHelp |
| Modified Lease |
| 7/31/2015 |
|
| 15,000 | (1) |
Birmingham, AL |
|
|
|
|
|
|
|
|
119
CNL HEALTHCARE PROPERTIES, INC. AND SUBSIDIARIES
NOTES TO CONSOLIDATED FINANCIAL STATEMENTS
YEAR ENDED DECEMBER 31, 2016
|
| |||||||
|
|
|
| |||||
| ||||||||
|
|
|
|
| ||||
| ||||||||
|
|
|
|
| ||||
| ||||||||
| ||||||||
|
|
|
|
| ||||
| ||||||||
|
|
|
|
| ||||
| ||||||||
|
|
|
|
| ||||
| ||||||||
|
|
|
|
| ||||
| ||||||||
|
|
|
|
| ||||
| ||||||||
| ||||||||
|
|
|
| |||||
| ||||||||
|
|
|
| |||||
| ||||||||
|
|
|
| |||||
| ||||||||
| ||||||||
|
|
|
|
| ||||
| ||||||||
| ||||||||
|
|
|
|
| ||||
| ||||||||
| ||||||||
|
|
|
| |||||
| ||||||||
|
|
|
| |||||
| ||||||||
|
|
|
| |||||
| ||||||||
|
|
|
|
| ||||
| ||||||||
| ||||||||
|
|
|
| |||||
| ||||||||
|
|
|
| |||||
| ||||||||
|
|
|
| |||||
| ||||||||
|
|
|
| |||||
| ||||||||
|
|
|
| |||||
| ||||||||
120
CNL HEALTHCARE PROPERTIES, INC. AND SUBSIDIARIES
NOTES TO CONSOLIDATED FINANCIAL STATEMENTS
YEAR ENDED DECEMBER 31, 2016
|
|
|
| Date |
| Purchase Price |
| |
Name and Location |
| Structure |
| Acquired |
| (in thousands) |
| |
Palmilla Senior Living |
| Managed |
| 9/30/2015 |
|
| 47,600 |
|
Albuquerque, NM |
|
|
|
|
|
|
|
|
Cedar Lake Assisted Living and Memory Care |
| Managed |
| 9/30/2015 |
|
| 30,000 |
|
Lake Zurich, IL ("Chicago") |
|
|
|
|
|
|
|
|
The Shores of Lake Phalen |
| Managed |
| 11/10/2015 |
|
| 29,250 | (1) |
Maplewood, MN ("St. Paul") |
|
|
|
|
|
|
|
|
Park Place Senior Living at WingHaven |
| Managed |
| 12/17/2015 |
|
| 54,000 |
|
O'Fallon, MO ("St. Louis") |
|
|
|
|
|
|
|
|
Hearthside Senior Living of Collierville |
| Managed |
| 12/29/2015 |
|
| 17,000 | (1) |
Collierville, TN ("Memphis") |
|
|
|
|
|
|
|
|
|
|
|
|
|
| $ | 880,873 |
|
FOOTNOTE:
|
|
The following summarizes the purchase price allocation for the above properties,property, and the estimated fair values of the assets acquired and liabilities assumed (in thousands):
|
| December 31, |
| |||||
|
| 2016 |
|
| 2015 |
| ||
Land and land improvements |
| $ | 3,283 |
|
| $ | 91,419 |
|
Buildings and building improvements |
|
| 20,142 |
|
|
| 702,611 |
|
Furniture, fixtures and equipment |
|
| — |
|
|
| 11,746 |
|
Intangibles (1) |
|
| 5,163 |
|
|
| 86,601 |
|
Other liabilities |
|
| — |
|
|
| (5,175 | ) |
Liabilities assumed |
|
| — |
|
|
| (6,905 | ) |
Assumed mortgage note payable (2) |
|
| — |
|
|
| (6,976 | ) |
Net assets acquired |
|
| 28,588 |
|
|
| 873,321 |
|
Contingent purchase price consideration |
|
| — |
|
|
| (6,481 | ) |
Total purchase price consideration |
| $ | 28,588 |
|
| $ | 866,840 |
|
Land and land improvements |
| $ | 3,283 |
|
Buildings and building improvements |
|
| 20,142 |
|
Intangibles (1) |
|
| 5,163 |
|
Total purchase price consideration |
| $ | 28,588 |
|
_____________
FOOTNOTES:FOOTNOTE:
| (1) | There were no acquisitions of lease intangibles made by the Company during the year ended December 31, 2017. At the acquisition date, the weighted-average amortization period on the acquired lease intangibles for the |
|
|
The revenues and net loss (including deductions for acquisition fees and expenses and depreciation and amortization expense) attributable to the Company’s material acquisitions were approximately $0.6 million and $0.4 million, respectively, for the year ended December 31, 2016; and approximately $18.0 million and $8.8 million, respectively, for the year ended December 31, 2015.2016.
121
CNL HEALTHCARE PROPERTIES, INC. AND SUBSIDIARIES
NOTES TO CONSOLIDATED FINANCIAL STATEMENTS
YEAR ENDED DECEMBER 31, 2016
The following table presents the unaudited pro forma results of operations for the Company as if the 2016 acquisition noted above was acquired as of January 1, 2015 and the unaudited pro forma results of operations for the Company as if each of the 2015 material acquisitions noted above were acquired as of January 1, 2014 (in thousands except per share data):
|
| Years ended December 31, |
|
| Years ended December 31, |
| ||||||||||||||||||
|
| (Unaudited) |
|
| (Unaudited) |
|
| (Unaudited) |
|
| (Unaudited) |
|
| (Unaudited) |
|
| (Unaudited) |
| ||||||
|
| 2016 |
|
| 2015 |
|
| 2014 |
|
| 2017 |
|
| 2016 |
|
| 2015 |
| ||||||
Total revenues |
| $ | 379,145 |
|
| $ | 348,684 |
|
| $ | 307,552 |
|
| $ | 398,416 |
|
| $ | 379,145 |
|
| $ | 348,684 |
|
Net loss (1) |
| $ | (31,708 | ) |
| $ | (70,864 | ) |
| $ | (62,071 | ) |
| $ | (26,312 | ) |
| $ | (31,708 | ) |
| $ | (70,864 | ) |
Loss per share of common stock (basic and diluted) |
| $ | (0.18 | ) |
| $ | (0.42 | ) |
| $ | (0.42 | ) |
| $ | (0.15 | ) |
| $ | (0.18 | ) |
| $ | (0.42 | ) |
Weighted average number of shares of common stock outstanding (basic and diluted) |
|
| 175,121 |
|
|
| 170,735 |
|
|
| 148,443 |
|
|
| 175,151 |
|
|
| 175,121 |
|
|
| 170,735 |
|
_____________
FOOTNOTES:FOOTNOTE:
130
CNL HEALTHCARE PROPERTIES, INC. AND SUBSIDIARIES
NOTES TO CONSOLIDATED FINANCIAL STATEMENTS
YEAR ENDED DECEMBER 31, 2017
3. |
|
Real Estate Under Development — There were no acquisitions of real estate for development made by the Company during the yearyears ended December 31, 2017 or 2016.
Unimproved Land — In August 2015,2017, the Company acquired a five acre tract of unimproved land adjacent to Pamilla Senior Living in Greenville, South CarolinaAlbuquerque, New Mexico for $2.3approximately $1.0 million (“Waterstone on Augusta”). In connection with theand incurred approximately $0.1 million of acquisition the Company entered intocosts that have been capitalized as a development agreement with a third-party developer for the construction and development of an assisted living and memory care community with a maximum development budget of approximately $27.0 million, including the allocated purchase pricecomponent of the land. The Company determined that Waterstone on Augusta is a VIE because it believes there is insufficient equity at risk due to the development nature of the property. The Company is the primary beneficiary while the developer or its affiliates manage the development, construction and certain day-to-day operations of the property subject to the Company’s oversight. Under a promoted interest agreement with the developer, certain net operating income targets have been established which, upon meeting such targets, result in the developer being entitled to additional payments based on enumerated percentages of the assumed net proceeds of a deemed sale, subject to achievement of an established internal rate of return on the Company’s investment in the development.
In September 2015, the Company acquired a tract of land in Grand Junction, Colorado for $1.1 million (“Welbrook Senior Living Grand Junction”). In connection with the acquisition, the Company entered into a development agreement with a third-party developer for the construction and development of a transitional rehabilitation facility with a maximum development budget of approximately $13.1 million, including the allocated purchase price of the land. The Company determined that Welbrook Senior Living Grand Junction is not a VIE because the Company’s equity investment is sufficient to finance the activities of the entity without a construction loan and the Company will receive substantially all expected residual returns.
In September 2015, the Company acquired a tract of land in Lexington, South Carolina for $2.3 million (“Wellmore of Lexington”), which is a suburb of Columbia, South Carolina. In connection with the acquisition, the Company entered into a development agreement with a third-party developer for the construction and development of a continuing care retirement facility with a maximum development budget of approximately $53.9 million, including the allocated purchase price of the land. The Company determined that Wellmore of Lexington is a VIE because it believes there is insufficient equity at risk due to the development nature of the property. The Company is the primary beneficiary while the developer or its affiliates manage the development, construction and certain day-to-day operations of the property subject to the Company’s oversight. Under a promoted interest agreement with the developer, certain net operating income targets have been established which, upon meeting such targets, result in the developer being entitled to additional payments based on enumerated percentages of the assumed net proceeds of a deemed sale, subject to achievement of an established internal rate of return on the Company’s investment in the development.
122
CNL HEALTHCARE PROPERTIES, INC. AND SUBSIDIARIES
NOTES TO CONSOLIDATED FINANCIAL STATEMENTS
YEAR ENDED DECEMBER 31, 2016
In October 2015, the Company entered into a joint venture agreement with a third-party and acquired a 75% membership interest a tract of land in Yakima, Washington for $1.0 million (“Fieldstone at Pear Orchard”). The joint venture plans to construct and develop an independent and assisted living facility with a maximum development budget of approximately $15.3 million, including the allocated purchase price of the land. The Company determined that Fieldstone at Pear Orchard is a VIE because it believes there is insufficient equity at risk due to the development nature of the joint venture. The Company is the primary beneficiary and managing member while the joint venture partner or its affiliates manage the development, construction and certain day-to-day operations of the property subject to the Company’s oversight. The Company’s joint venture partner acquired a 25% noncontrolling interest. Pursuant to the joint venture agreement, distributions of operating cash flow will be distributed pro rata based on each member’s ownership interest.
In November 2015, the Company acquired a tract of land in Grayson, Georgia for $1.8 million (“Dogwood Forest of Grayson”), which is approximately 35 miles from downtown Atlanta, Georgia. In connection with the acquisition, the Company entered into a development agreement with a third-party developer for the construction and development of an assisted living and memory care facility with a maximum development budget of approximately $26.0 million, including the allocated purchase price of the land. The Company determined that Dogwood Forest of Grayson is a VIE because it believes there is insufficient equity at risk due to the development nature of the property. The Company is the primary beneficiary while the developer or its affiliates manage the development, construction and certain day-to-day operations of the property subject to the Company’s oversight. Under a promoted interest agreement with the developer, certain net operating income targets have been established which, upon meeting such targets, result in the developer being entitled to additional payments based on enumerated percentages of the assumed net proceeds of a deemed sale, subject to achievement of an established internal rate of return on the Company’s investment in the development.
Purchase of Controlling Interest in Montecito Joint Venture — In January 2013, the Company acquired a 90% membership interest in a two-story MOB in Claremont, California for approximately $7.0 million in equity through a joint venture (“Montecito Joint Venture”) formed by the Company and its co-venture partner, an unrelated party, that initially held the remaining 10% interest. The Montecito Joint Venture was previously recorded under the equity method of accounting because the decisions that significantly impacted the entity were shared between the Company and its co-venture partner, but it was not determined to be a VIE.
In August 2014, the Company acquired its co-venture partner’s 10% interest in the Montecito Joint Venture for approximately $1.6 million. As a result of this transaction, the Company owns 100% of the Montecito Joint Venture, and began consolidating all of the assets, liabilities and results of operations in the Company’s consolidated financial statements upon acquisition. Accordingly, the Company recorded a step up from its carrying value of the investment in the Montecito Joint Venture to the estimated fair value of the net assets acquired and liabilities assumed. The following summarizes the allocation of the purchase price, and the estimated fair values of the assets acquired and liabilities assumed as of the acquisition date (in thousands):
Land and land improvements |
| $ | 6,324 |
|
Buildings and building improvements |
|
| 13,533 |
|
Intangibles (1) |
|
| 2,691 |
|
Working capital, net |
|
| 87 |
|
Other liabilities |
|
| (175 | ) |
Mortgage note payable assumed (2) |
|
| (12,331 | ) |
Net assets acquired |
| $ | 10,129 |
|
FOOTNOTES:
|
|
|
|
123
CNL HEALTHCARE PROPERTIES, INC. AND SUBSIDIARIES
NOTES TO CONSOLIDATED FINANCIAL STATEMENTS
YEAR ENDED DECEMBER 31, 2016
The fair value of the Company’s equity interest in the Montecito Joint Venture immediately before the acquisition date was approximately $5.7 million. The Company recorded a gain of approximately $2.8 million based on the acquisition date fair value of its equity interest in the Montecito Joint Venture. The following summarizes the gain that resulted from the change of control in the equity method investment for the year ended December 31, 2014 (in thousands):
Fair value of net assets acquired |
| $ | 10,129 |
|
Less: Previous investment in Montecito Joint Venture |
|
| (5,747 | ) |
Less: Cash paid to acquire co-venture partner's interest |
|
| (1,584 | ) |
Gain on purchase of controlling interest of investment in unconsolidated entity |
| $ | 2,798 |
|
The gross carrying amount and accumulated depreciation of the Company’s real estate assets as of December 31, 20162017 and 20152016 are as follows (in thousands):
|
| December 31, |
|
| As of December 31, |
| ||||||||||
|
| 2016 |
|
| 2015 |
|
| 2017 |
|
| 2016 |
| ||||
Land and land improvements |
| $ | 238,121 |
|
| $ | 227,019 |
|
| $ | 251,879 |
|
| $ | 235,543 |
|
Building and building improvements |
|
| 2,356,789 |
|
|
| 2,281,342 |
|
|
| 2,417,972 |
|
|
| 2,306,071 |
|
Furniture, fixtures and equipment |
|
| 67,299 |
|
|
| 58,825 |
|
|
| 82,759 |
|
|
| 64,939 |
|
Less: accumulated depreciation |
|
| (195,216 | ) |
|
| (115,648 | ) |
|
| (264,525 | ) |
|
| (186,738 | ) |
Real estate investment properties, net |
|
| 2,466,993 |
|
|
| 2,451,538 |
|
|
| 2,488,085 |
|
|
| 2,419,815 |
|
Real estate under development, including land |
|
| 97,164 |
|
|
| 62,521 |
|
|
| — |
|
|
| 97,164 |
|
Total real estate assets, net |
| $ | 2,564,157 |
|
| $ | 2,514,059 |
|
| $ | 2,488,085 |
|
| $ | 2,516,979 |
|
Depreciation expense on the Company’s real estate investment properties, net was approximately $78.8 million, $80.0 million $63.6 million and $39.1$63.6 million for the years ended December 31, 2017, 2016 2015 and 2014,2015, respectively. These amounts include depreciation through the determination date on real estateassets held for sale (discussed below).sale.
During 2016,The following development properties and expansion projects were completed during the Company completed the construction on the final phase of the Raider Ranch community in Lubbock, Texas, all phases of the Watercrest at Katy community in Katy, Texas,year ended December 31, 2017 and the Fieldstone at Pear Orchard community in Yakima, Washington. During 2015, the Company completed the development of a seniors housing community in Tega Cay, South Carolina (“Wellmore of Tega Cay”), which is a suburb of Charlotte, North Carolina, and the development of a seniors housing community in Shorewood, Wisconsin (“Harborchase of Shorewood”), which is north of Milwaukee. Asas such the related asset values related to these completed developments are included in real estate investment properties, net in the accompanying consolidated balance sheet as of December 31, 2016.2017:
Real Estate Held For Sale
Property Name | Location | Substantial Completion Date | ||
Development Properties | ||||
Welbrook Transitional Care Grand Junction | Grand Junction, CO | March 2017 | ||
Waterstone on Augusta | Greenville, SC | March 2017 | ||
Wellmore of Lexington | Lexington, SC | June 2017 | ||
Dogwood Forest of Grayson | Grayson, GA | June 2017 | ||
Expansion Projects | ||||
Brookridge Heights Assisted Living & Memory Care | Marquette, MI | June 2017 | ||
Tranquillity at Fredericktowne | Frederick, MD | December 2017 |
In June 2016, the Company committed to a plan to sell the Dogwood Forest of Acworth property and classified the associated real estate as held for sale. In November 2016, the Company completed the sale and recognized a gain on the sale of approximately $15.4 million. The sale of the Dogwood Forest of Acworth Property did not cause a strategic shift in the Company nor was it considered individually significant; therefore, it did not qualify as discontinued operations under ASU 2014-08.
124131
CNL HEALTHCARE PROPERTIES, INC. AND SUBSIDIARIES
NOTES TO CONSOLIDATED FINANCIAL STATEMENTS
YEAR ENDED DECEMBER 31, 2016
As of December 31, 2016 and 2015, real estate held for sale consisted of the following (in thousands):
|
| December 31, |
| |||||
|
| 2016 |
|
| 2015 |
| ||
Land and land improvements |
| $ | ― |
|
| $ | 2,027 |
|
Building and building improvements |
|
| ― |
|
|
| 15,994 |
|
Furniture, fixtures and equipment |
|
| ― |
|
|
| 1,776 |
|
Less: accumulated depreciation |
|
| ― |
|
|
| (1,159 | ) |
Real estate held for sale, net |
| $ | ― |
|
| $ | 18,638 |
|
Real Estate Under Development
As of December 31, 2016, five of the Company’s seniors housing communities and one post-acute care facility have real estate under development or expansion projects with third-party developers as follows (in thousands):
Property Name (and Location) |
| Developer |
| Real Estate Development Costs Incurred (1) |
|
| (Unaudited) Remaining Development Budget (2) |
| ||
Development Properties |
|
|
|
|
|
|
|
|
|
|
Welbrook Senior Living Grand Junction (Grand Junction, CO) |
| Embree Asset Group, Inc. |
| $ | 12,894 |
|
| $ | 1,888 |
|
Waterstone on Augusta (Greenville, SC) |
| T&D Greenville, LLC |
|
| 24,155 |
|
|
| 5,046 |
|
Wellmore of Lexington (Lexington, SC) |
| Maxwell Group, Inc. |
|
| 38,972 |
|
|
| 19,984 |
|
Dogwood Forest of Grayson (Grayson, GA) |
| Solomon Development Services, LLC |
|
| 17,345 |
|
|
| 12,933 |
|
Expansion Projects |
|
|
|
|
|
|
|
|
|
|
Tranquillity at Fredericktowne (Frederick, MD) |
| Capital Health Partners |
|
| 1,407 |
|
|
| 4,542 |
|
Brookridge Heights Assisted Living & Memory Care (Marquette, MI) |
| Capital Health Partners |
|
| 2,391 |
|
|
| 2,638 |
|
|
|
|
| $ | 97,164 |
|
| $ | 47,031 |
|
FOOTNOTES:
|
|
|
|
The development budgets include the cost of the land, construction costs, development fees, financing costs, start-up costs and initial operating deficits of the respective properties. Generally, the Company has delegated to an affiliate of the developer of the respective community the management and administration of the development and construction. In most cases, the developer is generally responsible for cost overruns beyond the approved development budget for the applicable project pursuant to a cost overrun guarantee. Some of these developments were deemed to be VIEs; refer to Note 7. “Variable Interest Entities” for additional information.
125
CNL HEALTHCARE PROPERTIES, INC. AND SUBSIDIARIES
NOTES TO CONSOLIDATED FINANCIAL STATEMENTS
YEAR ENDED DECEMBER 31, 20162017
The gross carrying amount and accumulated amortization of the Company’s intangible assets and liabilities as of December 31, 20162017 and 20152016 are as follows (in thousands):
|
| December 31, |
|
| As of December 31, |
| ||||||||||
|
| 2016 |
|
| 2015 |
|
| 2017 |
|
| 2016 |
| ||||
In-place lease intangibles |
| $ | 225,246 |
|
| $ | 220,917 |
|
| $ | 223,854 |
|
| $ | 223,854 |
|
Above-market lease intangibles |
|
| 13,974 |
|
|
| 13,960 |
|
|
| 13,974 |
|
|
| 13,974 |
|
Below-market ground lease intangibles |
|
| 12,470 |
|
|
| 12,470 |
|
|
| 12,470 |
|
|
| 12,470 |
|
Less: accumulated amortization |
|
| (120,188 | ) |
|
| (74,895 | ) |
|
| (150,786 | ) |
|
| (119,689 | ) |
Intangible assets, net |
| $ | 131,502 |
|
| $ | 172,452 |
|
| $ | 99,512 |
|
| $ | 130,609 |
|
Below-market lease intangibles |
| $ | (12,060 | ) |
| $ | (12,095 | ) |
| $ | (12,060 | ) |
| $ | (12,060 | ) |
Above-market ground lease intangibles |
|
| (3,488 | ) |
|
| (3,488 | ) |
|
| (3,488 | ) |
|
| (3,488 | ) |
Less: accumulated amortization |
|
| 4,247 |
|
|
| 2,581 |
|
|
| 5,718 |
|
|
| 4,247 |
|
Intangible liabilities, net (1) |
| $ | (11,301 | ) |
| $ | (13,002 | ) |
| $ | (9,830 | ) |
| $ | (11,301 | ) |
____________
FOOTNOTE:
|
| Intangible liabilities, net are included in other liabilities in the accompanying consolidated balance sheets. |
Amortization on the Company’s intangible assets was approximately $31.2 million for the year ended December 31, 2017, of which approximately $1.7 million was treated as a reduction of rental income and tenant reimbursements, approximately $0.3 million was treated as an increase of property operating expenses and approximately $29.1 million was included in depreciation and amortization. Amortization on the Company’s intangible assets was approximately $45.3 million for the year ended December 31, 2016, of which approximately $2.0 million was treated as a reduction of rental income from operating leases,and tenant reimbursements, approximately $0.3 million was treated as an increase of property operating expenses and approximately $43.0 million was included in depreciation and amortization. Amortization expense on the Company’s intangible assets was approximately $44.6 million for the year ended December 31, 2015, of which approximately $2.0 million was treated as a reduction of rental income from operating leases,and tenant reimbursements, approximately $0.3 million was treated as an increase of property operating expenses and approximately $42.3 million was included in depreciation and amortization.
Amortization expense on the Company’s intangible assetsliabilities was approximately $25.1$1.5 million for the year ended December 31, 2014,2017, of which approximately $1.0$1.4 million was treated as an increase of rental income and tenant reimbursements and approximately $0.1 million was treated as a reduction of rental income from operating leases, approximately $0.1 million was treated as an increase of property operating expenses and approximately $24.0 million was included in depreciation and amortization.
expenses. Amortization on the Company’s intangible liabilities was approximately $1.7 million for the year ended December 31, 2016, of which approximately $1.6 million was treated as an increase of rental income from operating leasesand tenant reimbursements and approximately $0.1 million was treated as a reduction of property operating expenses. Amortization on the Company’s intangible liabilities was approximately $1.6 million for the year ended December 31, 2015, of which approximately $1.5 million was treated as an increase of rental income from operating leases and approximately $0.08 million was treated as a reduction of property operating expenses. For the year ended December 31, 2014, amortization2015, Amortization on the Company’s intangible liabilities was approximately $0.8$1.6 million, of which approximately $1.5 million was treated as an increase of rental income from operating leasesand tenant reimbursements and approximately eight thousand dollars$0.08 million was treated as a reduction of property operating expenses.
During the year ended December 31, 2016, as a result of the bankruptcy reorganization of an anchor tenant at two of our medical office buildings, the Company recorded a loss on lease termination of approximately $0.8 million related to the lease intangibles as it was determined that the carrying value of certain deferred rent and other lease-related assets would not be recoverable.
During the year ended December 31, 2015, as a result of a tenant default at two of the Company’s specialty hospitals, the Company recorded an impairment provision of approximately $4.7 million related to the lease intangibles and a loss on lease termination of approximately $0.8 million related to certain deferred rent and other lease-related assets as it was determined that the carrying value of these assets would more than likely not be recoverable.
126132
CNL HEALTHCARE PROPERTIES, INC. AND SUBSIDIARIES
NOTES TO CONSOLIDATED FINANCIAL STATEMENTS
YEAR ENDED DECEMBER 31, 20162017
The estimated future amortization on the Company’s intangibles for each of the next five years and thereafter, in the aggregate, as of December 31, 20162017 is as follows (in thousands):
|
| In-place Lease Intangibles |
|
| Above- market Leases |
|
| Below- market Ground Leases |
|
| Total Assets |
|
| Below- market Leases |
|
| Above- market Ground Leases |
|
| Total Liabilities |
|
| In-place Lease Intangibles |
|
| Above- market Leases |
|
| Below- market Ground Leases |
|
| Total Assets |
|
| Below- market Leases |
|
| Above- market Ground Leases |
|
| Total Liabilities |
| ||||||||||||||
2017 |
| $ | 29,222 |
|
|
| 1,741 |
|
|
| 320 |
|
| $ | 31,283 |
|
| $ | 1,396 |
|
|
| 89 |
|
| $ | 1,485 |
| ||||||||||||||||||||||||||||
2018 |
|
| 17,749 |
|
|
| 1,569 |
|
|
| 320 |
|
|
| 19,638 |
|
|
| 1,254 |
|
|
| 89 |
|
|
| 1,343 |
|
| $ | 17,609 |
|
|
| 1,569 |
|
|
| 320 |
|
| $ | 19,498 |
|
| $ | 1,254 |
|
|
| 89 |
|
| $ | 1,343 |
|
2019 |
|
| 12,499 |
|
|
| 1,269 |
|
|
| 320 |
|
|
| 14,088 |
|
|
| 1,094 |
|
|
| 89 |
|
|
| 1,183 |
|
|
| 12,354 |
|
|
| 1,269 |
|
|
| 320 |
|
|
| 13,943 |
|
|
| 1,093 |
|
|
| 89 |
|
|
| 1,182 |
|
2020 |
|
| 10,481 |
|
|
| 1,059 |
|
|
| 320 |
|
|
| 11,860 |
|
|
| 866 |
|
|
| 89 |
|
|
| 955 |
|
|
| 10,347 |
|
|
| 1,059 |
|
|
| 320 |
|
|
| 11,726 |
|
|
| 866 |
|
|
| 89 |
|
|
| 955 |
|
2021 |
|
| 9,312 |
|
|
| 976 |
|
|
| 320 |
|
|
| 10,608 |
|
|
| 750 |
|
|
| 89 |
|
|
| 839 |
|
|
| 9,175 |
|
|
| 976 |
|
|
| 320 |
|
|
| 10,471 |
|
|
| 750 |
|
|
| 89 |
|
|
| 839 |
|
2022 |
|
| 8,485 |
|
|
| 937 |
|
|
| 320 |
|
|
| 9,742 |
|
|
| 656 |
|
|
| 89 |
|
|
| 745 |
| ||||||||||||||||||||||||||||
Thereafter |
|
| 31,755 |
|
|
| 2,194 |
|
|
| 10,076 |
|
|
| 44,025 |
|
|
| 2,633 |
|
|
| 2,863 |
|
|
| 5,496 |
|
|
| 23,102 |
|
|
| 1,268 |
|
|
| 9,762 |
|
|
| 34,132 |
|
|
| 1,993 |
|
|
| 2,773 |
|
|
| 4,766 |
|
|
| $ | 111,018 |
|
|
| 8,808 |
|
|
| 11,676 |
|
| $ | 131,502 |
|
| $ | 7,993 |
|
|
| 3,308 |
|
| $ | 11,301 |
|
| $ | 81,072 |
|
|
| 7,078 |
|
|
| 11,362 |
|
| $ | 99,512 |
|
| $ | 6,612 |
|
|
| 3,218 |
|
| $ | 9,830 |
|
Weighted average remaining useful life as of December 31, 20162017 (in years):
|
| In-place Lease Intangibles |
|
| Above- market Leases |
|
| Below- market Ground Leases |
|
|
|
|
| Below- market Leases |
|
| Above- market Ground Leases |
|
|
|
| |||||||
|
|
| 4.3 |
|
|
| 5.2 |
|
|
| 36.6 |
|
|
|
|
|
|
| 4.9 |
|
|
| 37.1 |
|
|
|
|
|
In-place Lease Intangibles |
|
| Above-market Leases |
|
| Below-market Ground Leases |
|
| Below-market Leases |
|
| Above-market Ground Leases |
| |||||
| 3.8 |
|
|
| 4.8 |
|
|
| 35.5 |
|
|
| 5.9 |
|
|
| 36.0 |
|
As of December 31, 2016,2017, the Company owned 86 properties that were leased to tenants on a triple-net, net or modified gross basis, and accounted for as operating leases; of which, 42 are single-tenant properties that are 100% leased under operating leases and the remaining 44 are multi-tenant properties that are leased under operating leases. The Company’s leases had a weighted average remaining lease term of 7.16.8 years based on annualized base rents expiring between 20172018 and 2038, subject to the tenants’ options to extend the lease periods ranging from two to ten years. In addition, certain tenants hold options to extend their leases for multiple periods.
Under the terms of the Company’s triple-net lease agreements, each tenant is responsible for the payment of property taxes, general liability insurance, utilities, repairs and maintenance, including structural and roof maintenance expenses. Each tenant is expected to pay real estate taxes directly to taxing authorities. However, if the tenant does not pay, the Company will be liable. The total annualized property tax assessed on these properties is approximately $4.6$4.5 million.
Under the terms of the multi-tenant lease agreements that have third-party property managers, each tenant is responsible for the payment of their proportionate share of property taxes, general liability insurance, utilities, repairs and common area maintenance. These amounts are billed monthly and recorded as tenant reimbursement income in the accompanying consolidated statements of operations.
133
CNL HEALTHCARE PROPERTIES, INC. AND SUBSIDIARIES
NOTES TO CONSOLIDATED FINANCIAL STATEMENTS
YEAR ENDED DECEMBER 31, 2017
The following are future minimum lease payments to be received under non-cancellable operating leases for the next five years and thereafter, in the aggregate, as of December 31, 20162017 (in thousands):
2017 |
| $ | 120,086 |
| ||||
2018 |
|
| 112,757 |
|
| $ | 119,726 |
|
2019 |
|
| 103,959 |
|
|
| 114,575 |
|
2020 |
|
| 96,167 |
|
|
| 108,654 |
|
2021 |
|
| 91,606 |
|
|
| 102,890 |
|
2022 |
|
| 89,796 |
| ||||
Thereafter |
|
| 437,557 |
|
|
| 396,319 |
|
|
| $ | 962,132 |
|
| $ | 931,960 |
|
The above future minimum lease payments to be received excludes tenant reimbursements, straight-line rent adjustments, amortization of above- and below-market lease intangibles and base rent attributable to any renewal options exercised by the tenants in the future.
7. | Ground and Air Rights Leases |
Under the terms of its ground and air rights lease agreements, the Company is responsible for the monthly rental payments. These amounts are billed monthly and recorded as property operating expenses in the accompanying consolidated statements of operations. In some cases, the Company is able to pass this expense through to its tenants as tenant reimbursement income. The Company incurred approximately $2.0 million, $1.9 million and $1.7 million in ground and air rights lease expense for the years ended December 31, 2017, 2016 and 2015, respectively, excluding straight-line rent adjustments and amortization of above- or below-market lease intangibles.
127The following is a schedule of future minimum lease payments to be paid under the ground and air rights leases for each of the next five years and thereafter, in the aggregate, as of December 31, 2017 (in thousands):
2018 | $ | 2,016 |
|
2019 |
| 2,038 |
|
2020 |
| 2,061 |
|
2021 |
| 2,092 |
|
2022 |
| 2,122 |
|
Thereafter |
| 109,345 |
|
| $ | 119,674 |
|
134
CNL HEALTHCARE PROPERTIES, INC. AND SUBSIDIARIES
NOTES TO CONSOLIDATED FINANCIAL STATEMENTS
YEAR ENDED DECEMBER 31, 20162017
The aggregate carrying amount and major classifications of the consolidated assets that can be used to settle obligations of the VIEs and liabilities of the consolidated VIEs that are non-recourse to the Company as of December 31, 20162017 and 20152016 are as follows (in thousands):
|
| December 31, |
|
| As of December 31, |
| ||||||||||
|
| 2016 |
|
| 2015 |
|
| 2017 |
|
| 2016 |
| ||||
Assets: |
|
|
|
|
|
|
|
|
|
|
|
|
|
|
|
|
Real estate investment properties, net |
| $ | 112,929 |
|
| $ | 103,691 |
|
| $ | 213,938 |
|
| $ | 112,929 |
|
Real estate under development, including land |
| $ | 80,473 |
|
| $ | 58,994 |
|
| $ | — |
|
| $ | 80,473 |
|
Intangibles, net |
| $ | 2,891 |
|
| $ | 4,015 |
|
| $ | 1,895 |
|
| $ | 2,891 |
|
Cash |
| $ | 916 |
|
| $ | 3,904 |
|
| $ | 2,203 |
|
| $ | 916 |
|
Deferred rent and lease incentives |
| $ | 3,061 |
|
| $ | 3,096 |
|
| $ | 6,332 |
|
| $ | 3,061 |
|
Other assets |
| $ | 1,130 |
|
| $ | 1,000 |
|
| $ | 1,025 |
|
| $ | 1,130 |
|
Restricted cash |
| $ | 20 |
|
| $ | 974 |
|
| $ | 1,242 |
|
| $ | 20 |
|
Liabilities: |
|
|
|
|
|
|
|
|
|
|
|
|
|
|
|
|
Mortgages and other notes payable, net |
| $ | 104,890 |
|
| $ | 85,093 |
|
| $ | 153,409 |
|
| $ | 104,890 |
|
Accounts payable and accrued liabilities |
| $ | 1,461 |
|
| $ | 743 |
|
| $ | 3,560 |
|
| $ | 1,461 |
|
Accrued development costs |
| $ | 15,369 |
|
| $ | 10,669 |
|
| $ | 909 |
|
| $ | 15,369 |
|
Other liabilities |
| $ | 976 |
|
| $ | 1,387 |
|
| $ | 1,322 |
|
| $ | 976 |
|
Due to related parties |
| $ | 107 |
|
| $ | 136 |
|
| $ | — |
|
| $ | 107 |
|
The Company’s maximum exposure to loss as a result of its involvement with these VIEs is limited to its net investment in these entities which totaled approximately $76.6$65.7 million as of December 31, 2016.2017. The Company’s exposure is limited because of the non-recourse nature of the borrowings of the VIEs.
As of December 31, 20162017 and 2015,2016, the Company had 10 and 12 subsidiaries respectively, which are classified as VIEs due to the following factors and circumstances as of December 31, 2016:2017:
Three of these subsidiaries are single property entities, designed to own and lease their respective properties to multiple tenants, which are subject to either a ground lease or an air rights lease that include buy-out and put options held by either the tenant or landlord under the applicable lease.
Four of these subsidiaries are entities with completed real estate under development or completed developments in which there is either insufficient equity at risk due to the development nature of each entity.
Two of these subsidiaries are joint ventures with recently completed real estate under development in which there is insufficient equity at risk due to the development nature of each joint venture.
One of these subsidiaries is a joint venture with equity interest that consists of non-substantive protective voting rights, but not any participating or kick-out rights.
Two reconsideration events occurred during the year ended December 31, 2016 that resulted in the associated entities no longer being considered VIEs as of December 31, 2016. The Company determined it is the primary beneficiary and holds a controlling financial interest in each of the aforementioned property and development entities due to its power to direct the activities that most significantly impact the economic performance of the entities, as well as its obligation to absorb the losses and its right to receive benefits from these entities that could potentially be significant to these entities. As such, the transactions and accounts of these VIEs are included in the accompanying consolidated financial statements.
128135
CNL HEALTHCARE PROPERTIES, INC. AND SUBSIDIARIES
NOTES TO CONSOLIDATED FINANCIAL STATEMENTS
YEAR ENDED DECEMBER 31, 20162017
Under the terms of its ground and air rights lease agreements, the Company is responsible for the monthly rental payments. These amounts are billed monthly and recorded as property operating expenses in the accompanying consolidated statements of operations. In some cases, the Company is able to pass this expense through to its tenants as tenant reimbursement income. The Company incurred approximately $1.9 million, $1.7 million and $0.5 million in ground and air rights lease expense for the years ended December 31, 2016, 2015 and 2014, respectively, excluding straight-line rent adjustments and amortization of above- or below-market lease intangibles.
The following is a schedule of future minimum lease payments to be paid under the ground and air rights leases for each of the next five years and thereafter, in the aggregate, as of December 31, 2016 (in thousands):
2017 | $ | 1,984 |
2018 |
| 2,016 |
2019 |
| 2,039 |
2020 |
| 2,061 |
2021 |
| 2,092 |
Thereafter |
| 111,467 |
| $ | 121,659 |
The following table provides a roll-forward of the fair value of the Company’s aggregate contingent purchase price consideration for the years ended December 31, 2017, 2016 2015 and 2014:2015:
| Year Ended December 31, 2016 | |||||||||
Property |
| Beginning asset (liability) as of December 31, 2015 |
| Contingent Consideration Payment (Receipt) |
| Change in Fair Value |
| Contingent Consideration in Connection with Acquisition |
| Ending asset (liability) as of December 31, 2016 |
Superior Residences of Panama City (1) | $ | (3,000) |
| ― |
| (1,000) |
| ― |
| (4,000) |
The Shores of Lake Phalen (2) |
| (750) |
| ― |
| 750 |
| ― |
| ― |
Siena Pavilion VI (3) |
| (3,750) |
| 2,992 |
| 113 |
| ― |
| (645) |
Center One (4) |
| 1,019 |
| (367) |
| 427 |
| ― |
| 1,079 |
| $ | (6,481) |
| 2,625 |
| 290 |
| ― |
| (3,566) |
|
| Year Ended December 31, 2017 |
| |||||||||||||||||
Property |
| Beginning asset (liability) as of December 31, 2016 |
|
| Contingent Consideration Payment (Receipt) |
|
| Change in Fair Value |
|
| Contingent Consideration in Connection with Acquisition |
|
| Ending asset (liability) as of December 31, 2017 |
| |||||
Superior Residences of Panama City (1) |
| $ | (4,000 | ) |
| $ | 4,000 |
|
| $ | — |
|
| $ | — |
|
| $ | — |
|
Siena Pavilion VI (2) |
|
| (645 | ) |
|
| 645 |
|
| ― |
|
|
| — |
|
| ― |
| ||
Center One (3) |
|
| 1,079 |
|
|
| (1,032 | ) |
|
| (47 | ) |
|
| — |
|
| ― |
| |
|
| $ | (3,566 | ) |
| $ | 3,613 |
|
| $ | (47 | ) |
| $ | — |
|
| $ | — |
|
| Year Ended December 31, 2015 | |||||||||
Property |
| Beginning asset (liability) as of December 31, 2014 |
| Contingent Consideration Payment (Receipt) |
| Change in Fair Value |
| Contingent Consideration in Connection with Acquisition |
| Ending asset (liability) as of December 31, 2015 |
Capital Health (5) | $ | 4,078 |
| (4,399) |
| 321 |
| ― |
| ― |
Medical Portfolio I (6) |
| (268) |
| ― |
| 268 |
| ― |
| ― |
Superior Residences of Panama City (1) |
| ― |
| ― |
| ― |
| (3,000) |
| (3,000) |
The Shores of Lake Phalen (2) |
| ― |
| ― |
| ― |
| (750) |
| (750) |
Siena Pavilion VI (3) |
| ― |
| ― |
| ― |
| (3,750) |
| (3,750) |
Center One (4) |
| ― |
| ― |
| ― |
| 1,019 |
| 1,019 |
| $ | 3,810 |
| (4,399) |
| 589 |
| (6,481) |
| (6,481) |
129
CNL HEALTHCARE PROPERTIES, INC. AND SUBSIDIARIES
NOTES TO CONSOLIDATED FINANCIAL STATEMENTS
YEAR ENDED DECEMBER 31, 2016
|
|
| Year Ended December 31, 2016 |
| |||||||||||||||||
Property |
| Beginning asset (liability) as of December 31, 2015 |
|
| Contingent Consideration Payment (Receipt) |
|
| Change in Fair Value |
|
| Contingent Consideration in Connection with Acquisition |
|
| Ending asset (liability) as of December 31, 2016 |
| |||||
Superior Residences of Panama City (1) |
| $ | (3,000 | ) |
| $ | — |
|
| $ | (1,000 | ) |
| $ | — |
|
| $ | (4,000 | ) |
Siena Pavilion VI (2) |
|
| (3,750 | ) |
|
| 2,992 |
|
|
| 113 |
|
|
| — |
|
|
| (645 | ) |
Center One (3) |
|
| 1,019 |
|
|
| (367 | ) |
|
| 427 |
|
|
| — |
|
|
| 1,079 |
|
The Shores of Lake Phalen (4) |
|
| (750 | ) |
|
| — |
|
|
| 750 |
|
|
| — |
|
|
| — |
|
|
| $ | (6,481 | ) |
| $ | 2,625 |
|
| $ | 290 |
|
| $ | — |
|
| $ | (3,566 | ) |
| Year Ended December 31, 2014 |
| Year Ended December 31, 2015 |
| ||||||||||||||||||||||||||
Property |
| Beginning asset (liability) as of December 31, 2013 |
| Contingent Consideration Payment (Receipt) |
| Change in Fair Value |
| Contingent Consideration in Connection with Acquisition |
| Ending asset (liability) as of December 31, 2014 |
| Beginning asset (liability) as of December 31, 2014 |
|
| Contingent Consideration Payment (Receipt) |
|
| Change in Fair Value |
|
| Contingent Consideration in Connection with Acquisition |
|
| Ending asset (liability) as of December 31, 2015 |
| |||||
Superior Residences of Panama City (1) |
| $ | — |
|
| $ | — |
|
| $ | — |
|
| $ | (3,000 | ) |
| $ | (3,000 | ) | ||||||||||
Siena Pavilion VI (2) |
| ― |
|
| ― |
|
| ― |
|
|
| (3,750 | ) |
|
| (3,750 | ) | |||||||||||||
Center One (3) |
| ― |
|
| ― |
|
| ― |
|
|
| 1,019 |
|
|
| 1,019 |
| |||||||||||||
The Shores of Lake Phalen (4) |
| ― |
|
| ― |
|
| ― |
|
|
| (750 | ) |
|
| (750 | ) | |||||||||||||
Capital Health (5) | $ | 4,488 |
| (2,601) |
| 2,191 |
| ― |
| 4,078 |
|
| 4,078 |
|
|
| (4,399 | ) |
|
| 321 |
|
| ― |
|
| ― |
| ||
Medical Portfolio I (6) |
| (507) |
| ― |
| 239 |
| ― |
| (268) |
|
| (268 | ) |
| ― |
|
|
| 268 |
|
| ― |
|
| ― |
| |||
South Bay II Communities (7) |
| ― |
| 14,195 |
| (1,800) |
| (12,395) |
| ― | ||||||||||||||||||||
| $ | 3,981 |
| 11,594 |
| 630 |
| (12,395) |
| 3,810 |
| $ | 3,810 |
|
| $ | (4,399 | ) |
| $ | 589 |
|
| $ | (6,481 | ) |
| $ | (6,481 | ) |
______________
FOOTNOTES:
| (1) | In connection with the purchase of Superior Residences of Panama City, the Company entered into an earn-out agreement with the seller whereby up to $4 million in additional consideration is owed in the event that certain performance targets are met (“Panama City Earn-Out”) during the immediate 36 months post-closing. As of December 31, 2017, the Company has no remaining obligations pursuant to the Panama City Earn-Out agreement. |
136
CNL HEALTHCARE PROPERTIES, INC. AND SUBSIDIARIES
NOTES TO CONSOLIDATED FINANCIAL STATEMENTS
YEAR ENDED DECEMBER 31, 2017
| (2) |
|
| In conjunction with the acquisition of Siena Pavilion VI, the Company entered into an earn-out agreement with the seller whereby up to $3.3 million in additional consideration and $0.5 million of additional tenant improvements are owed in the event that the seller is able to lease-up additional space at the property during the immediate 6 months post-closing (“Siena Pavilion VI Earn-Out”). As of December 31, 2017, the Company has no remaining obligations pursuant to the Siena Pavilion VI Earn-Out agreement. |
|
| In connection with the purchase of Center One, the Company required that approximately $2.8 million of the purchase price be placed in an escrow account as the seller provided a rent guarantee to the Company in connection with two seller leased spaces at the property for a term equal to the earlier of five years or at such time as a suitable replacement tenant can be found (“Center One Rent Guarantee”). As of December 31, 2017, the remaining escrow under the Center One Rent Guarantee was released to the seller as the two spaces had been leased to third-party replacement tenants. |
| (4) | In connection with the purchase of Shores of Lake Phalen, the Company entered into an earn-out agreement with the seller whereby up to $0.8 million in additional consideration was owed in the event that certain net operating income targets are met (“Shores of Lake Phalen Earn-Out”) during the immediate 12 months post-closing. The Shores of Lake Phalen Earn-Out expired as of December 31, 2016. |
(5) | In connection with the acquisition of the Capital Health Communities in 2012, the Company required that approximately $7.0 million of the purchase price be placed in an escrow account as the seller guaranteed the Company an annual return of at least $6.9 million, $7.0 million, and $7.1 million of net operating income on the acquired properties during 2013, 2014 and 2015, respectively (“Capital Health Yield Guaranty”). As of December 31, 2015, the Company had received the maximum amount of $7.0 million available under the Capital Health Yield Guaranty. |
| (6) | During 2013, in conjunction with the acquisition of Medical Portfolio I, the Company entered into an earn-out agreement with the seller related to Cleveland Clinic, the tenant at Chestnut Commons, whereby the tenant maintains an exercisable right to expand the leased space by an additional 10,000 square feet within 24 months of the property acquisition closing (“Chestnut Commons Earn-Out”). The Chestnut Commons Earn-Out fee was equal to (a) the base rent due for the first full year of the lease applicable to the expansion space divided by 8% minus (b) the costs incurred by the Company in connection with the exercise by Cleveland Clinic of its option for the expansion space, including tenant improvement costs, multiplied by 50%. The Chestnut Commons Earn-Out expired in August 2015. |
|
|
Fair Value Measurements
The fair value of the contingent purchase price consideration was based on a then-current income approach that is primarily determined based on the present value and probability of future cash flows using internal underwriting models. The income approach further includes estimates of risk-adjusted rate of return and capitalization rates for each property. Since this methodology includes inputs that are less observable by the public and are not necessarily reflected in active markets, the measurements of the estimated fair value related to the Company’s contingent purchase price consideration are categorized as Level 3 on the three-level fair value hierarchy.
130137
CNL HEALTHCARE PROPERTIES, INC. AND SUBSIDIARIES
NOTES TO CONSOLIDATED FINANCIAL STATEMENTS
YEAR ENDED DECEMBER 31, 20162017
The following table provides details of the Company’s indebtedness as of December 31, 20162017 and 20152016 (in thousands):
|
| December 31, |
|
| As of December 31, |
| ||||||||||
|
| 2016 |
|
| 2015 |
|
| 2017 |
|
| 2016 |
| ||||
Mortgages payable and other notes payable: |
|
|
|
|
|
|
|
|
|
|
|
|
|
|
|
|
Fixed rate debt |
| $ | 382,129 |
|
| $ | 391,639 |
|
| $ | 409,607 |
|
| $ | 382,129 |
|
Variable rate debt (1) |
|
| 561,874 |
|
|
| 449,017 |
| ||||||||
Mortgages and other notes payable (2) |
|
| 944,003 |
|
|
| 840,656 |
| ||||||||
Variable rate debt (1) (2) |
|
| 629,160 |
|
|
| 561,874 |
| ||||||||
Mortgages and other notes payable (3) |
|
| 1,038,767 |
|
|
| 944,003 |
| ||||||||
Premium (discount), net |
|
| (67 | ) |
|
| (221 | ) |
|
| 102 |
|
|
| (67 | ) |
Loan costs, net |
|
| (7,213 | ) |
|
| (8,610 | ) |
|
| (6,716 | ) |
|
| (7,213 | ) |
Total mortgages and other notes payable, net |
|
| 936,723 |
|
|
| 831,825 |
|
|
| 1,032,153 |
|
|
| 936,723 |
|
Credit facilities: |
|
|
|
|
|
|
|
|
|
|
|
|
|
|
|
|
Revolving Credit Facility (4) (5) |
|
| 194,863 |
|
|
| 225,000 |
| ||||||||
Revolving Credit Facility (1) (2) (5) |
|
| 182,000 |
|
|
| 194,863 |
| ||||||||
First Term Loan Facility (1) |
|
| 175,000 |
|
|
| 175,000 |
|
|
| 175,000 |
|
|
| 175,000 |
|
Second Term Loan Facility (5) |
|
| 275,000 |
|
|
| 260,000 |
| ||||||||
Second Term Loan Facility (1) (2) |
|
| 275,000 |
|
|
| 275,000 |
| ||||||||
Loan costs, net related to Term Loan Facilities |
|
| (2,874 | ) |
|
| (3,716 | ) |
|
| (1,934 | ) |
|
| (2,874 | ) |
Total credit facilities, net |
|
| 641,989 |
|
|
| 656,284 |
|
|
| 630,066 |
|
|
| 641,989 |
|
Total borrowings |
| $ | 1,578,712 |
|
| $ | 1,488,109 |
|
| $ | 1,662,219 |
|
| $ | 1,578,712 |
|
FOOTNOTES:
| (1) | As of December 31, |
(2) | As of December 31, |
|
| As of December 31, |
|
| Premium (discount), net is reflective of the Company recording mortgage note payables assumed at fair value on the respective acquisition dates. |
|
| As of December 31, |
|
|
The following is a schedule of future principal payments and maturity for the Company’s total borrowingsindebtedness for the next five years and thereafter, in the aggregate, as of December 31, 2017 (in thousands):
2018 |
| $ | 254,305 |
|
2019 |
|
| 531,307 |
|
2020 |
|
| 425,321 |
|
2021 |
|
| 49,558 |
|
2022 |
|
| 375,776 |
|
Thereafter |
|
| 34,602 |
|
|
| $ | 1,670,869 |
|
138
CNL HEALTHCARE PROPERTIES, INC. AND SUBSIDIARIES
NOTES TO CONSOLIDATED FINANCIAL STATEMENTS
YEAR ENDED DECEMBER 31, 2017
The following table provides additional details of the Company’s mortgages and other notes payable as of December 31, 2017 and 2016 (in thousands):
2017 |
| $ | 263,756 |
|
2018 |
|
| 288,938 |
|
2019 |
|
| 478,632 |
|
2020 |
|
| 400,696 |
|
2021 |
|
| 39,489 |
|
Thereafter |
|
| 117,288 |
|
|
| $ | 1,588,799 |
|
|
| Interest Rate at |
|
|
|
|
|
|
|
|
|
|
|
|
| |
|
| December 31, |
|
|
|
|
|
| December 31, |
| ||||||
Property and Loan Type |
| 2017 (1) |
|
| Payment Terms |
| Maturity Date (2) |
| 2017 |
|
| 2016 |
| |||
Primrose II Communities; Mortgage Loan |
| 3.81% per annum |
|
| Monthly principal and interest payments based on a 30-year amortization schedule |
| 6/1/20 |
| $ | 21,541 |
|
| $ | 22,017 |
| |
Novi Orthopaedic Center; Mortgage Loan |
| 3.61% per annum |
|
| Monthly interest only payments through June 2018; principal and interest payments thereafter based on a 25-year amortization schedule |
| 6/15/20 |
|
| 19,825 |
|
|
| 19,825 |
| |
Pacific Northwest Communities; Mortgage Loans (3) |
| 4.30% per annum |
|
| Monthly principal and interest payments based on a 25-year amortization schedule |
| 1/5/22 |
|
| 208,990 |
|
|
| 205,197 |
| |
Capital Health Communities; Mortgage Loans (4) |
|
| (4) |
|
| Monthly principal and interest payments based on a 25-year amortization schedule |
| 1/5/22 |
|
| 62,767 |
|
|
| 36,395 |
|
ProMed Medical Building I; Mortgage Loan |
| 3.64% per annum (5) |
|
| Monthly principal and interest payments based upon a 25-year amortization schedule |
| 1/15/22 |
|
| 6,673 |
|
|
| 6,865 |
| |
Primrose I Communities; Mortgage Loan (6) |
| 4.11% per annum |
|
| Monthly principal and interest payments based on a 30-year amortization schedule |
| 9/1/22 |
|
| 49,899 |
|
|
| 51,000 |
| |
Watercrest at Mansfield; Mortgage Loan (7) |
| 4.68% per annum |
|
| Monthly principal and interest payments based on a total payment of $143,330 |
| 6/1/23 |
|
| 25,676 |
|
|
| 26,165 |
| |
540 New Waverly Place; Mortgage Loan (8) |
| 4.08% per annum |
|
| Monthly principal and interest payments based upon a 25-year amortization schedule |
| 5/31/28 |
|
| 6,665 |
|
|
| 6,868 |
| |
LaPorte Cancer Center; Mortgage Loan |
| 4.25% per annum (through 2020) |
|
| Monthly principal and interest payments based on a 25-year amortization schedule |
| 6/14/28 |
|
| 7,571 |
|
|
| 7,797 |
| |
|
|
|
|
|
| Total fixed rate debt |
|
|
|
| 409,607 |
|
|
| 382,129 |
|
Calvert Medical Office Properties; Mortgage Loan (9) |
| 30-day LIBOR plus 2.50% per annum |
|
| Monthly interest only payments for the first 18 months; principal and interest payments thereafter based on a 30-year amortization schedule |
| 8/29/18 |
|
| 25,121 |
|
|
| 25,546 |
| |
Lee Hughes Medical Building; Mortgage Loan |
| 30-day LIBOR plus 1.85% per annum |
|
| Monthly principal and interest payments based on a 30-year amortization schedule |
| 9/5/18 |
|
| 17,572 |
|
|
| 18,102 |
| |
Northwest Medical Park; Mortgage Loan |
| 30-day LIBOR plus 2.30% per annum |
|
| Monthly principal and interest payments based upon a 25-year amortization schedule |
| 10/31/18 |
|
| 6,765 |
|
|
| 6,886 |
| |
139
CNL HEALTHCARE PROPERTIES, INC. AND SUBSIDIARIES
NOTES TO CONSOLIDATED FINANCIAL STATEMENTS
YEAR ENDED DECEMBER 31, 2017
|
| Interest Rate at |
|
|
|
|
|
|
|
|
|
|
|
|
|
| December 31, |
|
|
|
|
| December 31, |
| |||||
Property and Loan Type |
| 2017 (1) |
| Payment Terms |
| Maturity Date (2) |
| 2017 |
|
| 2016 |
| ||
MHOSH; Mortgage Loan (10) |
| 90-day LIBOR plus 2.85% at 0.4% LIBOR floor |
| Monthly principal and interest payments based on a 25-year amortization schedule |
| 6/2/19 |
| $ | 47,072 |
|
| $ | 47,983 |
|
Medical Portfolio II Properties; Mortgage Loan (11) |
| 90-day LIBOR plus 2.35% at 0.25% LIBOR floor |
| Monthly principal and interest payments based on a 25-year amortization schedule |
| 7/14/19 |
|
| 79,295 |
|
|
| 81,365 |
|
HarborChase of Shorewood; Construction Loan |
| 30-day LIBOR plus 3.0% per annum |
| Monthly interest only payments through June 2017; principal and interest payments thereafter based on a 25-year amortization schedule |
| 7/15/19 |
|
| 14,706 |
|
|
| 14,755 |
|
Wellmore of Lexington; Construction Loan |
| 30-day LIBOR plus 2.5% per annum |
| Monthly interest only payments through September 2019 |
| 9/13/19 |
|
| 33,423 |
|
|
| 13,542 |
|
Southeast Medical Office Properties; Mortgage Loan (12) |
| 30-day LIBOR plus 2.0% per annum |
| Monthly principal and interest payments based on a 25-year amortization schedule |
| 12/22/19 |
|
| 149,864 |
|
|
| 155,090 |
|
Watercrest at Katy; Construction Loan |
| 30-day LIBOR plus 2.75% per annum |
| Monthly interest only payments through December 2017 |
| 12/27/19 |
|
| 26,300 |
|
|
| 24,047 |
|
Wellmore of Tega Cay; Mortgage Loan (13) |
| 30-day LIBOR plus 2.65% per annum |
| Monthly interest only payments for the first 12 months; principal and interest payments thereafter based on a 30-year amortization schedule |
| 3/1/20 |
|
| 28,000 |
|
| ― |
| |
Palmilla Senior Living; Mortgage Loan (13) |
| 30-day LIBOR plus 2.0% per annum |
| Interest only payments through April 2017; principal payments thereafter based on a 30-year amortization schedule |
| 3/22/20 |
|
| 26,799 |
|
|
| 27,000 |
|
Waterstone on Augusta; Construction Loan |
| 30-day LIBOR plus 3.0% per annum |
| Monthly interest only payments through September 2018; principal payments thereafter based on a 30-year amortization schedule |
| 9/1/20 |
|
| 18,302 |
|
|
| 12,698 |
|
Fieldstone at Pear Orchard; Construction Loan |
| 30-day LIBOR plus 2.9% per annum |
| Monthly interest only payments through September 2018; principal payments thereafter based on a 25-year amortization schedule |
| 10/15/20 |
|
| 10,900 |
|
|
| 8,861 |
|
Dogwood Forest of Grayson; Construction Loan |
| 30-day LIBOR plus 3.0% per annum |
| Monthly interest only payments through December 2018; principal payments thereafter based on a 30-year amortization schedule |
| 12/1/20 |
|
| 15,628 |
|
|
| 3,351 |
|
140
CNL HEALTHCARE PROPERTIES, INC. AND SUBSIDIARIES
NOTES TO CONSOLIDATED FINANCIAL STATEMENTS
YEAR ENDED DECEMBER 31, 2017
|
| Interest Rate at |
|
|
|
|
|
|
|
|
|
| ||
|
| December 31, |
|
|
|
|
| December 31, | ||||||
Property and Loan Type |
| 2017 (1) |
| Payment Terms |
| Maturity Date (2) |
| 2017 |
|
| 2016 | |||
Triangle Orthopaedic; Mortgage Loan (13) |
| 30-day LIBOR plus 2.25% per annum |
| Interest only payments through March 2017; principal payments thereafter based on a 30-year amortization schedule |
| 4/11/21 |
| $ | 37,475 |
|
| $ | 37,800 | |
Cobalt Rehabilitation Hospital Surprise; Mortgage Loan |
| 30-day LIBOR plus 2.6% per annum at 0.4% LIBOR floor |
| Monthly interest only payments through May 2017; principal payments thereafter based on a 25-year amortization schedule |
| 5/19/22 |
|
| 15,167 |
|
|
| 15,379 | |
Knoxville Medical Office Properties and Claremont Medical Office; Mortgage Loan (14) |
| 30-day LIBOR plus 2.45% per annum |
| Monthly principal and interest payments based on a 30-year amortization schedule |
| 5/24/22 |
|
| 57,350 |
|
|
| 49,969 | |
Cobalt Rehabilitation Hospital New Orleans; Mortgage Loan |
| 30-day LIBOR plus 2.45% per annum at 0.55% LIBOR floor |
| Monthly interest only payments through October 2017; principal payments thereafter based on a 25-year amortization schedule |
| 10/19/22 |
|
| 19,421 |
|
|
| 19,500 | |
|
|
|
| Total variable rate debt |
|
|
|
| 629,160 |
|
|
| 561,874 | |
|
|
|
| Total debt |
|
|
| $ | 1,038,767 |
|
| $ | 944,003 | |
FOOTNOTES:
(1) | The 30-day and 90-day LIBOR were approximately 1.56% and 1.70%, respectively, as of December 31, 2017 and approximately 0.77% and 1.00%, respectively, as of December 31, 2016. |
(2) | Represents the initial maturity date (or, as applicable, the maturity date as extended). Certain of the Company’s mortgages and other notes payable agreements include extension options held by the Company under which the maturity dates may be extended beyond the date presented, subject to certain lender conditions and/or related fees. |
(3) | In August 2017, the Company extended the maturity date on the existing loan of approximately $201.9 million from December 2018 to January 2022. In addition, the Company received approximately $9.5 million of additional borrowings through a supplemental loan with the same lender, which is co-terminus with the existing mortgage loans, collateralized by the communities and matures in January 2022. The supplemental loan further accrues interest at a fixed rate equal to 4.3% per annum and includes monthly interest only payments for the first 12 months followed by monthly principal and interest payments for the remaining term of the loan using a 30-year amortization period with the remaining principal balance payable at maturity. The loan may be prepaid, in whole or in part, with a prepayment premium equal to the greater of: (i) one percent (1%) of the principal amount being prepaid, multiplied by the quotient of the number of full months remaining until the maturity date of the loan (calculated as of the prepayment date) divided by the number of full months comprising the term of the loan; or (b) a “make-whole” payment equal to the present value of the loan less the amount of principal and accrued interest being prepaid calculated as of the prepayment date for the period between that date and the maturity date. |
141
CNL HEALTHCARE PROPERTIES, INC. AND SUBSIDIARIES
NOTES TO CONSOLIDATED FINANCIAL STATEMENTS
YEAR ENDED DECEMBER 31, 2017
(4) | In August 2017, the Company extended the maturity date on the existing loan of approximately $35.4 million from January 2020 to January 2022. In addition, the Company received approximately $28.0 million of additional borrowings through a supplemental loan with the same lender, which is co-terminus with the existing mortgage loans, collateralized by the communities and matures in January 2022. The existing loan accrues interest at a fixed rate equal to 4.25% per annum. The supplemental loan accrues interest at a fixed rate equal to 4.3% per annum and includes monthly interest only payments for the first 12 months followed by monthly principal and interest payments for the remaining term of the loan using a 30-year amortization period with the remaining principal balance payable at maturity. The loan may be prepaid, in whole or in part, with a prepayment premium equal to the greater of: (i) one percent (1%) of the principal amount being prepaid, multiplied by the quotient of the number of full months remaining until the maturity date of the loan (calculated as of the prepayment date) divided by the number of full months comprising the term of the loan; or (b) a “make-whole” payment equal to the present value of the loan less the amount of principal and accrued interest being prepaid calculated as of the prepayment date for the period between that date and the maturity date. |
(5) | Beginning January 2020, the interest rate transitions to variable rate based on 30-day LIBOR plus 2.20% per annum. |
(6) | If prepaid prior to March 1, 2022, the Primrose I Communities Mortgage Loan is subject to a prepayment penalty in an amount equal to the greater of (i) 1% of the principal being repaid, or (ii) an amount calculated on the principal being repaid, multiplied by the difference between the Primrose I Communities Mortgage Loan interest rate, and a calculated yield rate tied to the rates on applicable U.S. Treasuries. If prepayment is made between March 1, 2022, and May 31, 2022, the prepayment penalty will be 1% of the outstanding principal balance of the Primrose I Communities Mortgage Loan. No prepayment fee is required if the Primrose I Communities Mortgage Loan is prepaid between June 1, 2022 and maturity. Partial prepayment of a loan is not permitted. The loan is transferable upon sale of the assets subject to lender approval. |
(7) | The balance for this loan excludes a remaining premium of $0.2 million related to the mortgage note payable assumed being recorded at fair value on the acquisition date. |
(8) | The balance for this loan excludes a remaining discount of $0.1 million related to the mortgage note payable assumed being recorded at fair value on the acquisition date. |
(9) | The Company entered into an interest rate swap with a remaining notional amount of $25.1 million; see Note 12. “Derivative Financial Instruments” for additional information. |
(10) | The Company entered into an interest rate swap with a remaining notional amount of $47.1 million; see Note 12. “Derivative Financial Instruments” for additional information. |
(11) | The Company entered into an interest rate swap with a remaining notional amount of $80.8 million; see Note 12. “Derivative Financial Instruments” for additional information. |
(12) | The Company entered into an interest rate swap with a remaining notional amount of $129.7 million; see Note 12. “Derivative Financial Instruments” for additional information. |
(13) | The Company entered into an interest rate cap with a remaining notional amount of $117.0 million; see Note 12. “Derivative Financial Instruments” for additional information. |
(14) | In May 2017, the Company refinanced the loans related to the Claremont Medical Office property and the Knoxville Medical Office Properties of approximately $12.4 million and $37.2 million, respectively, into a combined loan. The original loans were scheduled to mature January 2018 and July 2018, respectively. The Company entered into interest rate swaps with remaining notional amounts of $11.8 million and $36.8 million, respectively; see Note 12. “Derivative Financial Instruments” for additional information. |
142
CNL HEALTHCARE PROPERTIES, INC. AND SUBSIDIARIES
NOTES TO CONSOLIDATED FINANCIAL STATEMENTS
YEAR ENDED DECEMBER 31, 2017
The following table provides the details of the fair market value and carrying value of the Company’s indebtedness as of December 31, 20162017 and 20152016 (in millions):
|
| December 31, 2016 |
|
| December 31, 2015 |
|
| December 31, 2017 |
|
| December 31, 2016 |
| ||||||||||||||||||||
|
| Fair Value |
|
| Carrying Value |
|
| Fair Value |
|
| Carrying Value |
|
| Fair Value |
|
| Carrying Value |
|
| Fair Value |
|
| Carrying Value |
| ||||||||
Mortgages and other notes payable, net |
| $ | 943.4 |
|
| $ | 936.7 |
|
| $ | 844.6 |
|
| $ | 831.8 |
|
| $ | 1,034.9 |
|
| $ | 1,032.2 |
|
| $ | 943.4 |
|
| $ | 936.7 |
|
Credit facilities |
| $ | 644.9 |
|
| $ | 642.0 |
|
| $ | 660.0 |
|
| $ | 656.3 |
|
| $ | 632.0 |
|
| $ | 630.1 |
|
| $ | 644.9 |
|
| $ | 642.0 |
|
131
CNL HEALTHCARE PROPERTIES, INC. AND SUBSIDIARIES
NOTES TO CONSOLIDATED FINANCIAL STATEMENTS
YEAR ENDED DECEMBER 31, 2016
These fair market values are based on current rates and spreads the Company would expect to obtain for similar borrowings. Since this methodology includes inputs that are less observable by the public and are not necessarily reflected in active markets, the measurement of the estimated fair values related to the Company’s mortgage notes payable is categorized as Level 3 on the three-level valuation hierarchy. The estimated fair value of accounts payable and accrued liabilities approximates the carrying value as of December 31, 20162017 and 20152016 because of the relatively short maturities of the obligations.
In December 2014, the Company amended and restated the terms of the credit agreement with KeyBank, as administrative agent, by enteringentered into a $230 million Revolving Credit Facility and a $175 million Term Loan Facility. Pursuant to the amendedassociated credit agreement, the Company has the ability to increase the collective borrowing capacity of the Credit Facilities to $700 million under anthe accordion feature. Asfeature of December 31, 2016, the Credit Facilities. The Company has exercised this accordion feature and increased itsour borrowing capacity to $445 million. In addition, in October 2017, the Revolving Credit Facility has an initial termCompany exercised one of 36 months plus twothe 12-month extension options, (i.e. initialresulting in the term ending December 2018. There is one remaining 12-month extension option through which the Company can extend the term through December 2017 with the ability to extend through December 2019 at the Company’s option);2019; whereas the Term Loan Facility has an initial term of 50 monthsthrough February 2019 plus one 12-month extension option (i.e. initialthrough which the term can be extended through February 2019 with the ability to extend through February 2020 at the Company’s option).2020. The Credit Facilities bear interest based on 30-day LIBOR and a spread that varies with the Company’s leverage ratio. In addition, the Company is required to make interest only payments until the respective maturity dates of the Credit Facilities as well as to pay fees ranging from 0.15% to 0.25% for unused commitments on the Revolving Credit Facility.
In November 2015, the Company entered into a $250 million Second Term Loan Facility which haswith an initial term of 60 months (i.e. initial term through November 2020)2020 and the ability to increase the Company’s borrowing capacity to $350 million under its accordion feature. The Second Term Loan bears interest based on the 30-day LIBOR and a spread that varies with the Company’s leverage ratio. In addition,To date, the Company is required to make interest only payments until the maturity date. The Second Term Loan Facility further provides the Company with the ability to increase its borrowing capacity to $350 million under an accordion feature. As of December 31, 2016, the Company hadhas exercised this accordion feature and increased itsthe borrowing capacity to $275 million.
All of the Company’s mortgage and construction loans contain customary financial covenants and ratios; including (but not limited to) the following: debt service coverage ratio, minimum occupancy levels, limitations on incurrence of additional indebtedness, etc.
The Credit Facilities contain affirmative, negative, and financial covenants which are customary for loans of this type, including (but not limited to): (i) maximum leverage, (ii) minimum fixed charge coverage ratio, (iii) minimum consolidated net worth, (iv) restrictions on payments of cash distributions except if required by REIT requirements, (v) maximum secured indebtedness, (vi) maximum secured recourse debt, (vii) minimum unsecured interest coverage and (viii) limitations on certain types of investments and with respect to the pool of properties supporting borrowings under the Credit Facilities, minimum debt service coverage ratio, minimum weighted average occupancy, and remaining lease terms, as well as property type, MSA, operator, and asset value concentration limits. The limitations on distributions include a limitation on the extent of allowable distributions, which are not to exceed the greater of 95% of adjusted FFO (as defined per the Credit Facilities) and the minimum amount of distributions required to maintain the Company’s REIT status. As of December 31, 2016,2017, the Company was in compliance with all financial covenants and ratios.covenants.
132
143
CNL HEALTHCARE PROPERTIES, INC. AND SUBSIDIARIES
NOTES TO CONSOLIDATED FINANCIAL STATEMENTS
YEAR ENDED DECEMBER 31, 20162017
The following table provides additional details of the Company’s mortgages and other notes payable as of December 31, 2016 and 2015 (in thousands):
Property and Loan Type |
| Interest Rate at |
| Payment Terms |
| Maturity Date (2) |
| December 31, | ||||
| December 31, |
|
|
| ||||||||
| 2016 (1) |
|
|
| 2016 |
| 2015 | |||||
|
|
|
|
|
|
|
|
|
|
|
|
|
Pacific Northwest Communities; Mortgage Loan (3) |
| 4.30% per annum |
| Monthly principal and interest payments based on a 25-year amortization schedule |
| 12/5/18 |
| $ | 205,197 |
| $ | 210,665 |
|
|
|
|
|
|
|
|
|
|
|
|
|
Capital Health Communities; Mortgage Loan |
| 4.25% per annum |
| Monthly principal and interest payments based on a 25-year amortization schedule |
| 1/5/20 |
|
| 36,395 |
|
| 37,889 |
|
|
|
|
|
|
|
|
|
|
|
|
|
Primrose II Communities; Mortgage Loan |
| 3.81% per annum |
| Monthly principal and interest payments based on a 30-year amortization schedule |
| 6/1/20 |
|
| 22,017 |
|
| 22,473 |
|
|
|
|
|
|
|
|
|
|
|
|
|
Novi Orthopaedic Center; Mortgage Loan |
| 3.61% per annum |
| Monthly interest only payments through June 2018; principal and interest payments thereafter based on a 25-year amortization schedule |
| 6/15/20 |
|
| 19,825 |
|
| 19,825 |
|
|
|
|
|
|
|
|
|
|
|
|
|
ProMed Medical Building I; Mortgage Loan |
| 3.64% per annum (4) |
| Monthly principal and interest payments based upon a 25-year amortization schedule |
| 1/15/22 |
|
| 6,865 |
|
| 7,050 |
|
|
|
|
|
|
|
|
|
|
|
|
|
Primrose I Communities; Mortgage Loan (5) |
| 4.11% per annum |
| Monthly principal and interest payments based on a 30-year amortization schedule |
| 9/1/22 |
|
| 51,000 |
|
| 52,048 |
|
|
|
|
|
|
|
|
|
|
|
|
|
Watercrest at Mansfield; Mortgage Loan (6) |
| 4.68% per annum |
| Monthly principal and interest payments based on a total payment of $143,330 |
| 6/1/23 |
|
| 26,165 |
|
| 26,628 |
|
|
|
|
|
|
|
|
|
|
|
|
|
540 New Waverly Place; Mortgage Loan (7) |
| 4.08% per annum |
| Monthly principal and interest payments based upon a 25-year amortization schedule |
| 5/31/28 |
|
| 6,868 |
|
| 7,048 |
|
|
|
|
|
|
|
|
|
|
|
|
|
LaPorte Cancer Center; Mortgage Loan |
| 4.25% per annum (through 2020) |
| Monthly principal and interest payments based on a 25-year amortization schedule |
| 6/14/28 |
|
| 7,797 |
|
| 8,013 |
|
|
|
|
|
|
|
|
|
|
|
|
|
|
|
|
| Total fixed rate debt |
|
|
|
| 382,129 |
|
| 391,639 |
|
|
|
|
|
|
|
|
|
|
|
|
|
Lee Hughes Medical Building; Mortgage Loan |
| 30-day LIBOR plus 1.85% per annum |
| Monthly principal and interest payments based on a 30-year amortization schedule |
| 9/5/17 |
|
| 18,102 |
|
| 18,632 |
|
|
|
|
|
|
|
|
|
|
|
|
|
133
CNL HEALTHCARE PROPERTIES, INC. AND SUBSIDIARIES
NOTES TO CONSOLIDATED FINANCIAL STATEMENTS
YEAR ENDED DECEMBER 31, 2016
Property and Loan Type |
| Interest Rate at |
| Payment Terms |
| Maturity Date (2) |
| December 31, | ||||
| December 31, |
|
|
| ||||||||
| 2016 (1) |
|
|
| 2016 |
| 2015 | |||||
|
|
|
|
|
|
|
|
|
|
|
|
|
Raider Ranch Development; Construction Loan |
| (8) |
| (8) |
| (8) |
| $ | ― |
| $ | 7,528 |
|
|
|
|
|
|
|
|
|
|
|
|
|
Northwest Medical Park; Mortgage Loan (9) |
| 30-day LIBOR plus 2.30% per annum |
| Monthly principal and interest payments based upon a 25-year amortization schedule |
| 10/31/17 |
|
| 6,886 |
|
| 7,008 |
|
|
|
|
|
|
|
|
|
|
|
|
|
Watercrest at Katy; Construction Loan |
| 30-day LIBOR plus 2.75% per annum |
| Monthly interest only payments through December 2017 |
| 12/27/17 |
|
| 24,047 |
|
| 10,632 |
|
|
|
|
|
|
|
|
|
|
|
|
|
Claremont Medical Office; Mortgage Loan (10) |
| 30-day LIBOR plus 2.60% per annum |
| Monthly principal and interest payments based on a 30-year amortization schedule |
| 1/16/18 |
|
| 12,478 |
|
| 12,683 |
|
|
|
|
|
|
|
|
|
|
|
|
|
Knoxville Medical Office Properties; Mortgage Loan (11) |
| 30-day LIBOR plus 2.50% per annum |
| Monthly interest only payments for the first 18 months; principal and interest payments thereafter based on a 30-year amortization schedule |
| 7/10/18 |
|
| 37,491 |
|
| 38,087 |
|
|
|
|
|
|
|
|
|
|
|
|
|
Calvert Medical Office Properties; Mortgage Loan (12) |
| 30-day LIBOR plus 2.50% per annum |
| Monthly interest only payments for the first 18 months; principal and interest payments thereafter based on a 30-year amortization schedule |
| 8/29/18 |
|
| 25,546 |
|
| 25,950 |
|
|
|
|
|
|
|
|
|
|
|
|
|
Wellmore of Tega Cay; Construction Loan |
| (13) |
| (13) |
| (13) |
|
| ― |
|
| 23,695 |
|
|
|
|
|
|
|
|
|
|
|
|
|
MHOSH MOB; Mortgage Loan (14) |
| 90-day LIBOR plus 2.85% at 0.4% LIBOR floor |
| Monthly principal and interest payments based on a 25-year amortization schedule |
| 6/2/19 |
|
| 47,983 |
|
| 48,832 |
|
|
|
|
|
|
|
|
|
|
|
|
|
Medical Portfolio II Properties; Mortgage Loan (15) |
| 90-day LIBOR plus 2.35% at 0.25% LIBOR floor |
| Monthly principal and interest payments based on a 25-year amortization schedule |
| 7/14/19 |
|
| 81,365 |
|
| 83,295 |
|
|
|
|
|
|
|
|
|
|
|
|
|
HarborChase of Shorewood; Construction Loan |
| 30-day LIBOR plus 3.0% |
| Monthly interest only payments through June 2017; principal and interest payments thereafter based on a 25-year amortization schedule |
| 7/15/19 |
|
| 14,755 |
|
| 12,469 |
|
|
|
|
|
|
|
|
|
|
|
|
|
Wellmore of Lexington; Construction Loan |
| 30-day LIBOR plus 2.5% per annum |
| Monthly interest only payments through September 2019 |
| 9/13/19 |
|
| 13,542 |
|
| ― |
134
CNL HEALTHCARE PROPERTIES, INC. AND SUBSIDIARIES
NOTES TO CONSOLIDATED FINANCIAL STATEMENTS
YEAR ENDED DECEMBER 31, 2016
Property and Loan Type |
| Interest Rate at |
| Payment Terms |
| Maturity Date (2) |
| December 31, | ||||
| December 31, |
|
|
| ||||||||
| 2016 (1) |
|
|
| 2016 |
| 2015 | |||||
|
|
|
|
|
|
|
|
|
|
|
|
|
Southeast Medical Office Properties; Mortgage Loan (16) |
| 30-day LIBOR plus 2.0% per annum |
| Monthly principal and interest payments based on a 25-year amortization schedule |
| 12/22/19 |
| $ | 155,090 |
| $ | 160,206 |
|
|
|
|
|
|
|
|
|
|
|
|
|
Palmilla Senior Living; Mortgage Loan |
| 30-day LIBOR plus 2.0% per annum |
| Interest only payments through April 2017; principal payments thereafter based on a 30-year amortization schedule |
| 3/22/20 |
|
| 27,000 |
|
| ― |
|
|
|
|
|
|
|
|
|
|
|
|
|
Waterstone on Augusta; Construction Loan |
| 30-day LIBOR plus 3.0% per annum |
| Monthly interest only payments through September 2018; principal payments thereafter based on a 30-year amortization schedule |
| 9/1/20 |
|
| 12,698 |
|
| ― |
|
|
|
|
|
|
|
|
|
|
|
|
|
Fieldstone at Pear Orchard; Construction Loan |
| 30-day LIBOR plus 2.9% per annum |
| Monthly interest only payments through September 2018; principal payments thereafter based on a 25-year amortization schedule |
| 10/15/20 |
|
| 8,861 |
|
| ― |
|
|
|
|
|
|
|
|
|
|
|
|
|
Dogwood Forest of Grayson; Construction Loan |
| 30-day LIBOR plus 3.0% per annum |
| Monthly interest only payments through December 2018; principal payments thereafter based on a 30-year amortization schedule |
| 12/1/20 |
|
| 3,351 |
|
| ― |
|
|
|
|
|
|
|
|
|
|
|
|
|
Triangle Orthopaedic; Mortgage Loan |
| 30-day LIBOR plus 2.25% per annum |
| Interest only payments through March 2017; principal payments thereafter based on a 30-year amortization schedule |
| 4/11/21 |
|
| 37,800 |
|
| ― |
|
|
|
|
|
|
|
|
|
|
|
|
|
Cobalt Rehabilitation Hospital Surprise; Mortgage Loan |
| 30-day LIBOR plus 2.6% per annum at 0.4% LIBOR floor |
| Monthly interest only payments through May 2017; principal payments thereafter based on a 25-year amortization schedule |
| 5/19/22 |
|
| 15,379 |
|
| ― |
|
|
|
|
|
|
|
|
|
|
|
|
|
Cobalt Rehabilitation Hospital New Orleans; Mortgage Loan |
| 30-day LIBOR plus 2.45% per annum at 0.55% LIBOR floor |
| Monthly interest only payments through October 2017; principal payments thereafter based on a 25-year amortization schedule |
| 10/19/22 |
|
| 19,500 |
|
| ― |
|
|
|
|
|
|
|
|
|
|
|
|
|
|
|
|
| Total variable rate debt |
|
|
|
| 561,874 |
|
| 449,017 |
|
|
|
| Total debt |
|
|
| $ | 944,003 |
| $ | 840,656 |
FOOTNOTES:
|
|
|
|
|
|
|
|
135
CNL HEALTHCARE PROPERTIES, INC. AND SUBSIDIARIES
NOTES TO CONSOLIDATED FINANCIAL STATEMENTS
YEAR ENDED DECEMBER 31, 2016
|
|
|
|
|
|
|
|
|
|
|
|
|
|
|
|
|
|
|
|
|
|
|
|
The Company is externally advised and has no direct employees. Certain of the Company’s executive officers are executive officers of, or are on the board of managers of the Advisor. In addition, certain directors and officers hold similar positions with CNL Securities Corp. (“Managing Dealer”), the Managing Dealer of the Offerings and a wholly owned subsidiary of CNL.
In connection with services provided to the Company, affiliates are entitled to the following fees:
Managing Dealer — The Managing Dealer received selling commissions and marketing support fees of up to 7% and 3%, respectively, of gross offering proceeds for shares sold, excluding shares sold pursuant to the Company’s Reinvestment Plan, all or a portion of which may be paid to participating broker dealers by the Managing Dealer.
136
CNL HEALTHCARE PROPERTIES, INC. AND SUBSIDIARIES
NOTES TO CONSOLIDATED FINANCIAL STATEMENTS
YEAR ENDED DECEMBER 31, 2016
Advisor — The Advisor and certain affiliates are entitled to receive fees and compensation in connection with the acquisition, management and sale of the Company’s assets, as well as the refinancing of debt obligations of the Company or its subsidiaries. In addition, the Advisor and its affiliates are entitled to reimbursement of actual costs incurred on behalf of the Company in connection with the Company’s organizational, offering, acquisition and operating activities. Pursuant to the advisory agreement, as amended in 2013, the Advisor receives investment services fees equal to 1.85% of the purchase price of properties (including its proportionate share of properties acquired through joint ventures) for services rendered in connection with the selection, evaluation, structure and purchase of assets. In addition, the Advisor is entitled to receive a monthly asset management fee of 0.08334% of the average real estate asset value (as defined in the advisory agreement) of the Company’s properties, including its proportionate share of properties owned through joint ventures. The Advisor will also receive a financing coordination fee for services rendered with respect to refinancing of any debt obligations of the Company or its subsidiaries equal to 1.0% of the gross amount of the refinancing.
The Company will pay the Advisor a disposition fee in an amount equal to (i) in the case of the sale of real property, the lesser of (A) one-half of a competitive real estate commission, or (B) 1% of the sales price of such property, and (ii) in the case of the sale of any asset other than real property or securities, 1% of the sales price of such asset, if the Advisor, its affiliates or related parties provide a substantial amount of services, as determined by the Company’s independent directors, in connection with the sale of one or more assets (including a sale of all of its assets or the sale of it or a portion thereof). The Company will not pay its Advisor a disposition fee in connection with the sale of investments that are securities; however, a disposition fee in the form of a usual and customary brokerage fee may be paid to an affiliate or related party of the Advisor, if such affiliate is properly licensed.
Under the advisory agreement and the Company’s articles of incorporation, the Advisor will be entitled to receive certain subordinated incentive fees upon (a) sales of assets and/or (b) a listing (which would also include the receipt by the Company’s stockholders of securities that are approved for trading on a national securities exchange in exchange for shares of the Company’s common stock as a result of a merger, share acquisition or similar transaction). However, once a listing occurs, the Advisor will not be entitled to receive an incentive fee on subsequent sales of assets. The incentive fees are calculated pursuant to formulas set forth in both the advisory agreement and the Company’s articles of incorporation. All incentive fees payable to the Advisor are subordinated to the return to investors of their invested capital plus a 6% cumulative, noncompounded annual return on their invested capital. Upon termination or non-renewal of the advisory agreement by the Advisor for good reason (as defined in the advisory agreement) or by the Company other than for cause (as defined in the advisory agreement), a listing or sale of assets after such termination or non-renewal will entitle the Advisor to receive a pro-rated portion of the applicable subordinated incentive fee.
In addition, the Advisor or its affiliates may be entitled to receive fees that are usual and customary for comparable services in connection with the financing, development, construction or renovation of a property, subject to approval of the Company’s board of directors, including a majority of its independent directors.
144
CNL HEALTHCARE PROPERTIES, INC. AND SUBSIDIARIES
NOTES TO CONSOLIDATED FINANCIAL STATEMENTS
YEAR ENDED DECEMBER 31, 2017
Pursuant to the advisory agreement, the Advisor shall reimburse the Company the amount by which the total operating expenses paid or incurred by the Company exceed, in any four consecutive fiscal quarters commencing with the Expense Year ending June 30, 2013, the greater of 2% of average invested assets or 25% of net income (as defined in the advisory agreement) (“Limitation”), unless a majority of the Company’s independent directors determines that such excess expenses are justified based on unusual and non-recurring factors (“Expense Cap Test”). In performing the Expense Cap Test, the Company uses operating expenses on a GAAP basis after making adjustments for the benefit of expense support under the Expense Support Agreements. For the Expense Year ended December 31, 2017, the Company did not incur operating expenses in excess of the Limitation.
Property Manager — Pursuant to a property management agreement, as amended in 2012, the Property Manager receives property management fees of (a) 2% of annual gross rental revenues from single tenant properties, and (b) 4% of annual gross rental revenues from multi-tenant properties. In the event that the Company contracts directly with a third-party property manager, the Company may pay the Property Manager an oversight fee of up to 1% of annual gross revenues of the property managed; however, in no event will the Company pay both a property management fee and an oversight fee with respect to the same property. The Company will pay to the Property Manager a construction management fee equal to 5% of hard and soft costs associated with the initial construction or renovation of a property, or with the management and oversight of expansion projects and other capital improvements, in those cases in which the value of the construction, renovation, expansion or improvements exceeds (i) 10% of the initial purchase price of the property, and (ii) $1.0 million, which fee will be due and payable upon completion of such projects.
Expense Support Agreements — In March 2013,Pursuant to the Company entered into the advisororiginal expense support agreements, the Company’s Advisor and restricted stock agreement (“Advisor Expense Support Agreement”), whereby the AdvisorProperty Manager agreed to provide expense support to the Company through forgoingforgo the payment of fees in cash and acceptance of Restricted Stock for services rendered and specified expenses incurred in an amount equal to the positive excess, if any, of (a) aggregate stockholder cash distributions declared for the applicable quarter, over (b) the Company’s aggregate modified funds from operations (as defined in the Advisor Expense Support Agreement). The Advisor expense support amount was determined, on a non-cumulative basis, on each Original Determination Date.
137
CNL HEALTHCARE PROPERTIES, INC. AND SUBSIDIARIES
NOTES TO CONSOLIDATED FINANCIAL STATEMENTS
YEAR ENDED DECEMBER 31, 2016
In August 2013, the Company entered into the property manager expense support and restricted stock agreement (“Property Manager Expense Support Agreement”), whereby the Property Manager agreed to provide expense support to the Company through forgoing the payment of fees in cash and acceptingaccept Restricted Stock for services in an amount equal to the positive excess, if any, of (a) aggregate stockholder cash distributions declared for the applicable quarter, over (b) the Company’s aggregate modified funds from operations, (as defined in the Property Manager Expense Support Agreement)defined. The Advisor expense support amount was determined for each calendar quarter, on a non-cumulative basis, on each quarter-end date ("Original Determination Date”). The Property Manager expense support amount was determined for each calendar quarter, on a non-cumulative basis, after the calculation of the Advisor expense support amount pursuant to the Property Manager Expense Support Agreement on each Original Determination Date.
In exchange for services renderedquarter-end date. The Restricted Stock is subordinated and in considerationforfeited to the extent that shareholders do not receive their invested capital plus a 6% cumulative noncompounded annual return upon ultimate liquidity of the expense support provided, the Company issued, within 45 days following each Original Determination Date, a number of shares of restricted stock equal to the quotient of the expense support amounts provided by the Advisor and Property Manager for the preceding quarter divided by either: (1) the then-current public offering price per share of common stock during the Offerings or (2) the Company’s then-current net asset value (“NAV”) per share of common stock subsequent to the Offerings, on the terms and conditions and subject to the restrictions set forth in the Advisor Expense Support Agreement and the Property Manager Expense Support Agreement (“Original Expense Support Agreements”).Company. Any amounts settled, and for which restricted stock shares were issued, pursuant to the Original Expense Support Agreements have been permanently settled and the Company has no further obligation to pay such amounts to the Advisor or the Property Manager. The Restricted Stock is subordinated and forfeited to the extent that stockholders do not receive their invested capital plus a 6% cumulative, noncompounded annual return upon the ultimate liquidity of the Company. Since the vesting criteria is outside the control of the Advisor and Property Manager and involves both market conditions and counterparty performance conditions, the Restricted Stock shares are treated as unissued for financial reporting purposes until the vesting criteria are met.amounts.
In March 2016, the Company’s board of directors approved the Amended Expense Support Agreementsthird amended and restated expense support agreements with both the Advisor and Property Manager that were effective January 1, 2016 and2016. These amendments changed the calculation and determination date of the respective affiliate’s expense support amounts from each calendar quarter on a non-cumulative basis, to each calendar year on a cumulative year-to-date basis. Underbasis ("Amended Determination Date”).
In February 2017, the termsCompany’s board of directors approved the fourth amended and restated expense support agreements with both the Advisor and Property Manager that were effective January 1, 2017. These amendments limit the annual expense support amount, in the aggregate, to an annualized four percent of the Amended Expense Support Agreements,weighted average of the Board’s most recent determination of NAV per share and change the calculation to exclude the impact of completed development properties for a specified period of time after the property is placed into service (as defined in the agreements).
145
CNL HEALTHCARE PROPERTIES, INC. AND SUBSIDIARIES
NOTES TO CONSOLIDATED FINANCIAL STATEMENTS
YEAR ENDED DECEMBER 31, 2017
The aforementioned amendments, along with the original expense support agreements and previous amendments govern the fees and expenses charged by the Advisor and Property Manager to the Company. For each quarter within a calendar expense support year, the Company will recordrecords a proportional estimate of the cumulative year-to-date period based on an estimate of expense support amounts for the calendar expense support year. Moreover, in exchange for services rendered and in consideration of the expense support provided, under the Amended Expense Support Agreements, the Company willshall issue, within 90 days following theeach Amended Determination Date, a number of shares of Restricted Stock equal to the quotient of the expense support amounts provided by the Advisor and Property Manager for the preceding calendar year divided by the Company’s then-current estimated NAV per share of common stock. The terms of the Amended Expense Support Agreementsexpense support agreements automatically renew for consecutive one year periods, subject to the right of the Advisor or Property Manager to terminate their respective agreements upon 30 days’ written notice to the Company. In February 2017, the Company’s board of directors approved the fourth amendment to the expense support agreements; refer to Note 18. “Subsequent Events” for additional information.notice.
CNL Capital Markets Corp — CNL Capital Markets Corp., an affiliate of CNL, receives a sliding flat annual rate (payable monthly) based on the average number of investor accounts that will be open over the term of the agreement. For the years ended December 31, 2017, 2016 2015 and 2014,2015, the Company incurred approximately $0.9 million, $0.6$0.9 million and $0.4$0.6 million in such fees, respectively. These amounts are included in general and administrative expenses in the accompanying consolidated statements of operations.
Co-venture partners — The Company paid certain amounts on behalf of its co-venture partner, Windsor Manor, of approximately $2,000 during the year ended December 31, 2015. The Company recorded a receivable balance as of December 31, 2015, which is included in other assets in the accompanying consolidated balance sheet. There were no such amounts recorded as of December 31, 2016.
The—The Company incurs operating expenses which, in general, relate to administration of the Company on an ongoing basis. Pursuant to the advisory agreement, the Advisor shall reimburse the Company the amount by which the total operating expenses paid or incurred by the Company exceed, in any four consecutive fiscal quarters commencing with the Expense Year ending June 30, 2013, the greater of 2% of average invested assets or 25% of net income (as defined in the advisory agreement) (“Limitation”), unless a majority of the Company’s independent directors determines that such excess expenses are justified based on unusual and non-recurring factors (“Expense Cap Test”). In performing the Expense Cap Test, the Company uses operating expenses on a GAAP basis after making adjustments for the benefit of expense support under the Expense Support Agreements. For the Expense Year ended December 31, 2016, the Company did not incur operating expenses in excess of the Limitation.
138
CNL HEALTHCARE PROPERTIES, INC. AND SUBSIDIARIES
NOTES TO CONSOLIDATED FINANCIAL STATEMENTS
YEAR ENDED DECEMBER 31, 2016
The Company maintained accounts totaling approximately $0.1 million as of December 31, 2015, at a bank in which the Company’s chairman served as a director through December 2015.
In March 2015, the Company acquired Fieldstone Memory Care for a purchase price of $12.4 million from a related party of the Company’s Sponsor.
In June 2013, the Company originated an ADC Loan in the amount of $6.2 million to C4 Development, LLC, a related party by virtue of a family relationship between a principal of the borrower and the Company’s vice chairman who recused himself from review and approval of the investment. As of December 31, 2014, the Company’s ADC Loan had been fully repaid. The Company recorded interest income for the year ended December 31, 2014 which is included in interest income on note receivable from related party in the accompanying consolidated statements of operations.
The fees incurred by and reimbursable to the Managing Dealer in connection with the Company’s Offerings for the years ended December 31, 2017, 2016 2015 and 2014,2015, and related amounts unpaid as of December 31, 20162017 and 20152016 are as follows (in thousands):
|
|
|
|
|
|
|
|
|
|
|
|
|
| Unpaid amounts (1) |
|
|
|
|
|
|
|
|
|
|
|
|
|
| Unpaid amounts (1) |
| ||||||||||
|
| Years Ended December 31, |
|
| as of December 31, |
|
| Years Ended December 31, |
|
| as of December 31, |
| ||||||||||||||||||||||||||||
|
| 2016 |
|
| 2015 |
|
| 2014 |
|
| 2016 |
|
| 2015 |
|
| 2017 |
|
| 2016 |
|
| 2015 |
|
| 2017 |
|
| 2016 |
| ||||||||||
Selling commissions (2) |
| $ | — |
|
| $ | 12,507 |
|
| $ | 18,387 |
|
| $ | — |
|
| $ | — |
|
| $ | — |
|
| $ | — |
|
| $ | 12,507 |
|
| $ | — |
|
| $ | — |
|
Marketing support fees (2) |
|
| — |
|
|
| 16,242 |
|
|
| 16,429 |
|
|
| — |
|
|
| — |
|
| ― |
|
| ― |
|
|
| 16,242 |
|
| ― |
|
| ― |
| ||||
|
| $ | — |
|
| $ | 28,749 |
|
| $ | 34,816 |
|
| $ | — |
|
| $ | — |
|
| $ | — |
|
| $ | — |
|
| $ | 28,749 |
|
| $ | — |
|
| $ | — |
|
The expenses and fees incurred by and reimbursable to the Company’s related parties for the years ended December 31, 2017, 2016 2015 and 2014,2015, and related amounts unpaid as of December 31, 20162017 and 20152016 are as follows (in thousands):
|
|
|
|
|
|
|
|
| Unpaid amounts (1) |
|
|
|
|
|
|
|
|
|
|
|
|
|
| Unpaid amounts (1) |
| |||||||||||||||
|
| Years Ended December 31, |
|
| as of December 31, |
|
|
|
|
|
| Years Ended December 31, |
|
| as of December 31, |
| ||||||||||||||||||||||||
|
| 2016 |
|
| 2015 |
|
| 2014 |
|
| 2016 |
|
| 2015 |
|
| 2017 |
|
| 2016 |
|
| 2015 |
|
| 2017 |
|
| 2016 |
| ||||||||||
Reimbursable expenses: |
|
|
|
|
|
|
|
|
|
|
|
|
|
|
|
|
|
|
|
|
|
|
|
|
|
|
|
|
|
|
|
|
|
|
|
|
|
|
|
|
Offering costs (2) |
| $ | — |
|
| $ | 3,446 |
|
| $ | 5,151 |
|
| $ | — |
|
| $ | 32 |
|
| $ | — |
|
| $ | — |
|
| $ | 3,446 |
|
| $ | — |
|
| $ | — |
|
Operating expenses (3) |
|
| 5,966 |
|
|
| 5,214 |
|
|
| 3,863 |
|
|
| 1,072 |
|
|
| 935 |
|
|
| 5,791 |
|
|
| 5,966 |
|
|
| 5,214 |
|
|
| 1,042 |
|
|
| 1,072 |
|
Acquisition fees and expenses |
|
| 104 |
|
|
| 613 |
|
|
| 614 |
|
|
| 3 |
|
|
| 12 |
|
|
| 6 |
|
|
| 104 |
|
|
| 613 |
|
|
| 2 |
|
|
| 3 |
|
|
|
| 6,070 |
|
|
| 9,273 |
|
|
| 9,628 |
|
|
| 1,075 |
|
|
| 979 |
|
|
| 5,797 |
|
|
| 6,070 |
|
|
| 9,273 |
|
|
| 1,044 |
|
|
| 1,075 |
|
Investment services fees (4) |
|
| 739 |
|
|
| 18,561 |
|
|
| 18,553 |
|
|
| 17 |
|
|
| 182 |
|
|
| 126 |
|
|
| 739 |
|
|
| 18,561 |
|
| ― |
|
|
| 17 |
| |
Disposition fee (5) |
|
| 343 |
|
|
| — |
|
|
| — |
|
|
| — |
|
|
| — |
|
| ― |
|
|
| 343 |
|
| ― |
|
| ― |
|
| ― |
| ||||
Financing coordination fees (6) |
|
| — |
|
|
| — |
|
|
| 220 |
|
|
| — |
|
|
| — |
|
|
| 3,601 |
|
| ― |
|
| ― |
|
| ― |
|
| ― |
| ||||
Property management fees (7) |
|
| 5,059 |
|
|
| 3,894 |
|
|
| 2,982 |
|
|
| 417 |
|
|
| 418 |
|
|
| 4,807 |
|
|
| 5,059 |
|
|
| 3,894 |
|
|
| 381 |
|
|
| 417 |
|
Asset management fees (8) |
|
| 29,121 |
|
|
| 22,837 |
|
|
| 13,612 |
|
|
| 1,956 |
|
|
| 224 |
|
|
| 30,157 |
|
|
| 29,121 |
|
|
| 22,837 |
|
|
| 2,516 |
|
|
| 1,956 |
|
|
| $ | 41,332 |
|
| $ | 54,565 |
|
| $ | 44,995 |
|
| $ | 3,465 |
|
| $ | 1,803 |
|
| $ | 44,488 |
|
| $ | 41,332 |
|
| $ | 54,565 |
|
| $ | 3,941 |
|
| $ | 3,465 |
|
146
CNL HEALTHCARE PROPERTIES, INC. AND SUBSIDIARIES
NOTES TO CONSOLIDATED FINANCIAL STATEMENTS
YEAR ENDED DECEMBER 31, 2017
FOOTNOTES:
| (1) | Amounts are |
| (2) | Amounts are recorded as stock issuance and offering costs in the accompanying consolidated statements of stockholders’ equity and redeemable noncontrolling interest. Amounts include approximately $25,000 |
| (3) | Amounts are recorded as general and administrative expenses in the accompanying consolidated statements of operations. Amounts include approximately $0.1 million, $0.1 million and |
139
CNL HEALTHCARE PROPERTIES, INC. AND SUBSIDIARIES
NOTES TO CONSOLIDATED FINANCIAL STATEMENTS
YEAR ENDED DECEMBER 31, 2016
| (4) | For the year ended December 31, 2017, the Company incurred approximately $0.1 million in investment services fees of which approximately $0.1 million, was capitalized and included in real estate assets, net in the accompanying consolidated balance sheets. For the year ended December 31, 2016, the Company incurred approximately $0.7 million in investment |
| (5) | Amounts are recorded as a reduction to gain on sale of real estate in the accompanying consolidated statements of operations. |
| (6) | For the year ended December 31, |
| (7) | For the years ended December 31, 2017, 2016 |
| (8) | For the years ended December 31, 2017, 2016 |
147
CNL HEALTHCARE PROPERTIES, INC. AND SUBSIDIARIES
NOTES TO CONSOLIDATED FINANCIAL STATEMENTS
YEAR ENDED DECEMBER 31, 2017
The following fees have been or are expected to be or were settled and paid in the form of Restricted Stock in connectionaccordance with the Amended Expense Support Agreements for the year ended December 31, 2016 and the Original Expense Support Agreementsexpense support agreements for the years ended December 31, 20152017 and 2014,2016, and cumulatively as of December 31, 20162017 (in thousands, except offering price)per share data):
|
| Years Ended |
|
| As of |
|
| Years Ended |
|
| As of |
| ||||||||||||||||||||
|
| December 31, |
|
| December 31, |
|
| December 31, |
|
| December 31, |
| ||||||||||||||||||||
|
| 2016 |
|
| 2015 |
|
| 2014 |
|
| 2016 |
|
| 2017 |
|
| 2016 |
|
| 2015 |
|
| 2017 |
| ||||||||
Asset management fees (1) |
| $ | 2,918 |
|
| $ | 4,379 |
|
| $ | 4,867 |
|
| $ | 13,565 |
|
| $ | — |
|
| $ | 2,918 |
|
| $ | 4,379 |
|
| $ | 13,565 |
|
Then-current offering price or NAV (2) |
| $ | 10.04 |
|
| $ | 10.19 |
|
| $ | 10.24 |
|
| $ | 9.75 |
|
| $ | 10.32 |
|
| $ | 10.04 |
|
| $ | 10.19 |
|
| $ | 10.32 |
|
Restricted stock shares (3) |
|
| 291 |
|
|
| 423 |
|
|
| 478 |
|
|
| 1,332 |
|
| ― |
|
|
| 291 |
|
|
| 423 |
|
|
| 1,332 |
| |
Cash distributions on Restricted Stock (4) |
| $ | 427 |
|
| $ | 281 |
|
| $ | 98 |
|
| $ | 810 |
|
| $ | 571 |
|
| $ | 427 |
|
| $ | 281 |
|
| $ | 1,381 |
|
Stock distributions on Restricted Stock (5) |
|
| — |
|
|
| 14 |
|
|
| 7 |
|
|
| 21 |
|
| ― |
|
| ― |
|
|
| 14 |
|
|
| 21 |
| ||
_____________
FOOTNOTES:
| (1) | No other amounts have been settled in connection with the |
| (2) | The number of restricted stock shares granted to the Advisor in lieu of payment in cash is determined by dividing the expense support amount for the respective determination date by the then-current public offering price |
| (3) | Restricted stock shares are comprised of approximately |
| (4) | The cash distributions have been recognized as compensation expense as issued and included in general and administrative expense in the accompanying consolidated statements of operations. |
| (5) | This represents the number of shares issued to the Advisor as stock distributions on its restricted stock shares. The par value of the stock distributions has been recognized as compensation expense as issued and included in general and administrative expense in the accompanying consolidated statements of operations. |
140148
CNL HEALTHCARE PROPERTIES, INC. AND SUBSIDIARIES
NOTES TO CONSOLIDATED FINANCIAL STATEMENTS
YEAR ENDED DECEMBER 31, 20162017
The following summarizes the terms of the Company’s, or its equity method investments’,investment’s, derivative financial instruments and the corresponding asset (liability) as of December 31, 20162017 and 20152016 (in thousands):
|
|
|
|
|
|
|
|
|
|
|
|
|
|
|
|
|
| Fair value asset (liability) as of |
|
|
|
|
|
|
|
|
|
|
|
|
|
|
|
|
|
|
| Fair value asset (liability) as of |
| ||||||||||
Notional Amount | Notional Amount |
|
| Strike (1) |
|
| Credit Spread (1) |
|
| Trade date |
| Forward date |
| Maturity date |
| December 31, 2016 |
|
| December 31, 2015 |
| Notional Amount |
|
|
| Strike (1) |
|
| Credit Spread (1) |
|
| Trade date |
| Forward date |
| Maturity date |
| December 31, 2017 |
|
| December 31, 2016 |
| ||||||||
$ | 12,050 |
| (2) |
| 1.3 | % |
|
| 2.6 | % |
| 1/17/2013 |
| 1/15/2015 |
| 1/16/2018 |
| $ | (44 | ) |
| $ | (85 | ) | 11,842 |
| (2) |
|
| 1.3 | % |
|
| 2.6 | % |
| 1/17/2013 |
| 1/15/2015 |
| 1/16/2018 |
| $ | 1 |
|
| $ | (44 | ) |
$ | 37,446 |
| (2) |
| 2.7 | % |
|
| 2.5 | % |
| 9/6/2013 |
| 8/17/2015 |
| 7/10/2018 |
| $ | (878 | ) |
| $ | (1,472 | ) | 36,839 |
| (2) |
|
| 2.7 | % |
|
| 2.5 | % |
| 9/6/2013 |
| 8/17/2015 |
| 7/10/2018 |
| $ | (213 | ) |
| $ | (878 | ) |
$ | 25,516 |
| (2) |
| 2.8 | % |
|
| 2.5 | % |
| 9/6/2013 |
| 8/17/2015 |
| 8/29/2018 |
| $ | (667 | ) |
| $ | (1,086 | ) | 25,103 |
| (2) |
|
| 2.8 | % |
|
| 2.5 | % |
| 9/6/2013 |
| 8/17/2015 |
| 8/29/2018 |
| $ | (182 | ) |
| $ | (667 | ) |
$ | 10,422 |
| (3) |
| 3.0 | % |
| ― | % |
| 6/27/2014 |
| 6/30/2014 |
| 6/30/2017 |
| $ | — |
|
| $ | 1 |
| 47,072 |
| (2) |
|
| 2.4 | % |
|
| 2.9 | % |
| 8/15/2014 |
| 6/1/2016 |
| 6/2/2019 |
| $ | (280 | ) |
| $ | (949 | ) | |
$ | 47,983 |
| (2) |
| 2.4 | % |
|
| 2.9 | % |
| 8/15/2014 |
| 6/1/2016 |
| 6/2/2019 |
| $ | (949 | ) |
| $ | (1,066 | ) | 80,841 |
| (2) |
|
| 2.3 | % |
|
| 2.4 | % |
| 9/12/2014 |
| 8/1/2015 |
| 7/15/2019 |
| $ | (424 | ) |
| $ | (1,512 | ) |
$ | 82,370 |
| (2) |
| 2.3 | % |
|
| 2.4 | % |
| 9/12/2014 |
| 8/1/2015 |
| 7/15/2019 |
| $ | (1,512 | ) |
| $ | (2,283 | ) | 175,000 |
| (2) |
|
| 1.6 | % |
|
| 2.0 | % |
| 12/23/2014 |
| 12/19/2014 |
| 2/19/2019 |
| $ | 464 |
|
| $ | (992 | ) |
$ | 6,876 |
| (2) |
| 1.2 | % |
|
| 2.3 | % |
| 11/12/2014 |
| 11/15/2014 |
| 10/15/2017 |
| $ | (17 | ) |
| $ | (37 | ) | 129,722 |
| (2) |
|
| 1.7 | % |
|
| 2.0 | % |
| 1/9/2015 |
| 12/10/2015 |
| 12/22/2019 |
| $ | 516 |
|
| $ | (976 | ) |
$ | 175,000 |
| (2) |
| 1.6 | % |
|
| 2.0 | % |
| 12/23/2014 |
| 12/19/2014 |
| 2/19/2019 |
| $ | (992 | ) |
| $ | (1,694 | ) | 260,000 |
| (3) |
|
| 1.5 | % |
| ― | % |
| 11/19/2015 |
| 11/19/2015 |
| 11/30/2018 |
| $ | 681 |
|
| $ | 600 |
| |
$ | 134,258 |
| (2) |
| 1.7 | % |
|
| 2.0 | % |
| 1/9/2015 |
| 12/10/2015 |
| 12/22/2019 |
| $ | (976 | ) |
| $ | (1,795 | ) | 150,000 |
| (3) |
|
| 1.5 | % |
| ― | % |
| 3/1/2016 |
| 3/1/2016 |
| 11/30/2018 |
| $ | 393 |
|
| $ | 346 |
| |
$ | 260,000 |
| (3) |
| 1.5 | % |
| ― | % |
| 11/19/2015 |
| 11/19/2015 |
| 11/30/2018 |
| $ | 600 |
|
| $ | 1,988 |
| 117,000 |
| (3) |
|
| 2.3 | % |
| ― | % |
| 8/29/2017 |
| 8/29/2017 |
| 9/1/2019 |
| $ | 95 |
|
| $ | — |
| ||
$ | 150,000 |
| (3) |
| 1.5 | % |
| ― | % |
| 3/1/2016 |
| 3/1/2016 |
| 11/30/2018 |
| $ | 346 |
|
| $ | — |
| ||||||||||||||||||||||||||
The following summarizes the gross and net presentation of amounts related to the Company’s, or its equity method investments’,investment’s, derivative financial instruments as of December 31, 20162017 (in thousands):
|
|
|
| Gross and net amounts of asset (liability) as of December 31, 2016 |
|
| Gross amounts as of December 31, 2016 |
|
|
|
|
| Gross and net amounts of asset (liability) as of December 31, 2017 |
|
| Gross amounts as of December 31, 2017 |
| ||||||||||||||||||||||||||||||||||||
Notional amount | Notional amount |
|
| Gross amount |
|
| Offset amount |
|
| Net amount |
|
| Financial Instruments |
|
| Cash Collateral |
|
| Net Amount |
| Notional amount |
|
|
| Gross amount |
|
| Offset amount |
|
| Net amount |
|
| Financial Instruments |
|
| Cash Collateral |
|
| Net Amount |
| ||||||||||||
$ | 12,050 |
| (2) | $ | (44 | ) |
| $ | — |
|
| $ | (44 | ) |
| $ | (44 | ) |
| $ | — |
|
| $ | (44 | ) | 11,842 |
| (2) |
| $ | 1 |
|
| $ | — |
|
| $ | 1 |
|
| $ | 1 |
|
| $ | — |
|
| $ | 1 |
|
$ | 37,446 |
| (2) | $ | (878 | ) |
| $ | — |
|
| $ | (878 | ) |
| $ | (878 | ) |
| $ | — |
|
| $ | (878 | ) | 36,839 |
| (2) |
| $ | (213 | ) |
| $ | — |
|
| $ | (213 | ) |
| $ | (213 | ) |
| $ | — |
|
| $ | (213 | ) |
$ | 25,516 |
| (2) | $ | (667 | ) |
| $ | — |
|
| $ | (667 | ) |
| $ | (667 | ) |
| $ | — |
|
| $ | (667 | ) | 25,103 |
| (2) |
| $ | (182 | ) |
| $ | — |
|
| $ | (182 | ) |
| $ | (182 | ) |
| $ | — |
|
| $ | (182 | ) |
$ | 10,422 |
| (3) | $ | — |
|
| $ | — |
|
| $ | — |
|
| $ | — |
|
| $ | — |
|
| $ | — |
| 47,072 |
| (2) |
| $ | (280 | ) |
| $ | — |
|
| $ | (280 | ) |
| $ | (280 | ) |
| $ | — |
|
| $ | (280 | ) |
$ | 47,983 |
| (2) | $ | (949 | ) |
| $ | — |
|
| $ | (949 | ) |
| $ | (949 | ) |
| $ | — |
|
| $ | (949 | ) | 80,841 |
| (2) |
| $ | (424 | ) |
| $ | — |
|
| $ | (424 | ) |
| $ | (424 | ) |
| $ | — |
|
| $ | (424 | ) |
$ | 82,370 |
| (2) | $ | (1,512 | ) |
| $ | — |
|
| $ | (1,512 | ) |
| $ | (1,512 | ) |
| $ | — |
|
| $ | (1,512 | ) | 175,000 |
| (2) |
| $ | 464 |
|
| $ | — |
|
| $ | 464 |
|
| $ | 464 |
|
| $ | — |
|
| $ | 464 |
|
$ | 6,876 |
| (2) | $ | (17 | ) |
| $ | — |
|
| $ | (17 | ) |
| $ | (17 | ) |
| $ | — |
|
| $ | (17 | ) | 129,722 |
| (2) |
| $ | 516 |
|
| $ | — |
|
| $ | 516 |
|
| $ | 516 |
|
| $ | — |
|
| $ | 516 |
|
$ | 175,000 |
| (2) | $ | (992 | ) |
| $ | — |
|
| $ | (992 | ) |
| $ | (992 | ) |
| $ | — |
|
| $ | (992 | ) | 260,000 |
| (3) |
| $ | 681 |
|
| $ | — |
|
| $ | 681 |
|
| $ | 681 |
|
| $ | — |
|
| $ | 681 |
|
$ | 134,258 |
| (2) | $ | (976 | ) |
| $ | — |
|
| $ | (976 | ) |
| $ | (976 | ) |
| $ | — |
|
| $ | (976 | ) | 150,000 |
| (3) |
| $ | 393 |
|
| $ | — |
|
| $ | 393 |
|
| $ | 393 |
|
| $ | — |
|
| $ | 393 |
|
$ | 260,000 |
| (3) | $ | 600 |
|
| $ | — |
|
| $ | 600 |
|
| $ | 600 |
|
| $ | — |
|
| $ | 600 |
| 117,000 |
| (3) |
| $ | 95 |
|
| $ | — |
|
| $ | 95 |
|
| $ | 95 |
|
| $ | — |
|
| $ | 95 |
|
$ | 150,000 |
| (3) | $ | 346 |
|
| $ | — |
|
| $ | 346 |
|
| $ | 346 |
|
| $ | — |
|
| $ | 346 |
| |||||||||||||||||||||||||||
141149
CNL HEALTHCARE PROPERTIES, INC. AND SUBSIDIARIES
NOTES TO CONSOLIDATED FINANCIAL STATEMENTS
YEAR ENDED DECEMBER 31, 20162017
The following summarizes the gross and net presentation of amounts related to the Company’s, or its equity method investments’,investment’s, derivative financial instruments as of December 31, 20152016 (in thousands):
|
|
|
| Gross and net amounts of asset (liability) as of December 31, 2015 |
|
| Gross amounts as of December 31, 2015 |
|
|
|
|
| Gross and net amounts of asset (liability) as of December 31, 2016 |
|
| Gross amounts as of December 31, 2016 |
| ||||||||||||||||||||||||||||||||||||
Notional amount | Notional amount |
|
| Gross amount |
|
| Offset amount |
|
| Net amount |
|
| Financial Instruments |
|
| Cash Collateral |
|
| Net Amount |
| Notional amount |
|
|
| Gross amount |
|
| Offset amount |
|
| Net amount |
|
| Financial Instruments |
|
| Cash Collateral |
|
| Net Amount |
| ||||||||||||
$ | 12,248 |
| (2) | $ | (85 | ) |
| $ | — |
|
| $ | (85 | ) |
| $ | (85 | ) |
| $ | — |
|
| $ | (85 | ) | 12,050 |
| (2) |
| $ | (44 | ) |
| $ | — |
|
| $ | (44 | ) |
| $ | (44 | ) |
| $ | — |
|
| $ | (44 | ) |
$ | 38,052 |
| (2) | $ | (1,472 | ) |
| $ | — |
|
| $ | (1,472 | ) |
| $ | (1,472 | ) |
| $ | — |
|
| $ | (1,472 | ) | 37,446 |
| (2) |
| $ | (878 | ) |
| $ | — |
|
| $ | (878 | ) |
| $ | (878 | ) |
| $ | — |
|
| $ | (878 | ) |
$ | 25,929 |
| (2) | $ | (1,086 | ) |
| $ | — |
|
| $ | (1,086 | ) |
| $ | (1,086 | ) |
| $ | — |
|
| $ | (1,086 | ) | 25,516 |
| (2) |
| $ | (667 | ) |
| $ | — |
|
| $ | (667 | ) |
| $ | (667 | ) |
| $ | — |
|
| $ | (667 | ) |
$ | 10,699 |
| (3) | $ | 1 |
|
| $ | — |
|
| $ | 1 |
|
| $ | 1 |
|
| $ | — |
|
| $ | 1 |
| 47,983 |
| (2) |
| $ | (949 | ) |
| $ | — |
|
| $ | (949 | ) |
| $ | (949 | ) |
| $ | — |
|
| $ | (949 | ) |
$ | 48,415 |
| (2) | $ | (1,066 | ) |
| $ | — |
|
| $ | (1,066 | ) |
| $ | (1,066 | ) |
| $ | — |
|
| $ | (1,066 | ) | 82,370 |
| (2) |
| $ | (1,512 | ) |
| $ | — |
|
| $ | (1,512 | ) |
| $ | (1,512 | ) |
| $ | — |
|
| $ | (1,512 | ) |
$ | 83,797 |
| (2) | $ | (2,283 | ) |
| $ | — |
|
| $ | (2,283 | ) |
| $ | (2,283 | ) |
| $ | — |
|
| $ | (2,283 | ) | 6,876 |
| (2) |
| $ | (17 | ) |
| $ | — |
|
| $ | (17 | ) |
| $ | (17 | ) |
| $ | — |
|
| $ | (17 | ) |
$ | 6,998 |
| (2) | $ | (37 | ) |
| $ | — |
|
| $ | (37 | ) |
| $ | (37 | ) |
| $ | — |
|
| $ | (37 | ) | 175,000 |
| (2) |
| $ | (992 | ) |
| $ | — |
|
| $ | (992 | ) |
| $ | (992 | ) |
| $ | — |
|
| $ | (992 | ) |
$ | 175,000 |
| (2) | $ | (1,694 | ) |
| $ | — |
|
| $ | (1,694 | ) |
| $ | (1,694 | ) |
| $ | — |
|
| $ | (1,694 | ) | 134,258 |
| (2) |
| $ | (976 | ) |
| $ | — |
|
| $ | (976 | ) |
| $ | (976 | ) |
| $ | — |
|
| $ | (976 | ) |
$ | 138,698 |
| (2) | $ | (1,795 | ) |
| $ | — |
|
| $ | (1,795 | ) |
| $ | (1,795 | ) |
| $ | — |
|
| $ | (1,795 | ) | 260,000 |
| (3) |
| $ | 600 |
|
| $ | — |
|
| $ | 600 |
|
| $ | 600 |
|
| $ | — |
|
| $ | 600 |
|
$ | 260,000 |
| (3) | $ | 1,988 |
|
| $ | — |
|
| $ | 1,988 |
|
| $ | 1,988 |
|
| $ | — |
|
| $ | 1,988 |
| 150,000 |
| (3) |
| $ | 346 |
|
| $ | — |
|
| $ | 346 |
|
| $ | 346 |
|
| $ | — |
|
| $ | 346 |
|
FOOTNOTES:
| (1) | The all-in rates are equal to the sum of the Strike and Credit Spread detailed above. |
| (2) | Amounts related to interest rate swaps held by the Company, or its equity method |
| (3) | Amounts related to the interest rate caps held by the Company, or its equity method |
Although the Company has determined that the majority of the inputs used to value its derivative financial instruments fall within Level 2 of the fair value hierarchy, the credit valuation adjustments associated with its derivatives utilize Level 3 inputs, such as estimates of current credit spreads, to evaluate the likelihood of default by the Company and its counterparties. The Company has assessed the significance of the impact of the credit valuation adjustments on the overall valuation of its derivative financial instruments and has determined that the credit valuation adjustments on the overall valuation adjustments are not significant to the overall valuation of its derivative financial instruments. As a result, the Company determined that its derivative financial instruments valuation in its entirety is classified in Level 2 of the fair value hierarchy. Determining fair value requires management to make certain estimates and judgments. Changes in assumptions could have a positive or negative impact on the estimated fair values of such instruments which could, in turn, impact the Company’s or its joint venture’s results of operations.
150
CNL HEALTHCARE PROPERTIES, INC. AND SUBSIDIARIES
NOTES TO CONSOLIDATED FINANCIAL STATEMENTS
YEAR ENDED DECEMBER 31, 2017
Redeemable Noncontrolling Interest:
In connection with the Watercrest at Katy joint venture, the Company’s joint venture partner acquired a 5% noncontrolling interest that includes a put option of its membership to the Company at any time commencing on the date on which Watercrest at Katy development opens to residents and concluding on the fifth anniversary thereof, when NOI is: (a) equal to or greater than the NOI threshold established in the joint venture agreement, and (b) has been equal to or greater than the NOI threshold established in the joint venture agreement for the three calendar months immediately preceding the calendar month during which the joint venture partner exercises the put option. The put option is redeemable for cash at a price equal to the appraised market value (less certain transaction-related costs) at the time the put option is exercised (“Put Price”). The Company’s maximum redemption exposure, as a result of these redeemable equity securities, is limited to the Put Price multiplied by the joint venture partner’s 5% membership interest.
142
CNL HEALTHCARE PROPERTIES, INC. AND SUBSIDIARIES
NOTES TO CONSOLIDATED FINANCIAL STATEMENTS
YEAR ENDED DECEMBER 31, 2016
Stockholders’ Equity:
Public Offerings — Through the close of the Company’s Offerings on September 30, 2015, the Company had received aggregate proceeds of approximately $1.7 billion. While the Company’s Offerings closed on September 30, 2015, the Company continues to provide existing stockholders the opportunity to designate their cash distributions for reinvestment through the Company’s Reinvestment Plan. For the years ended December 31, 2017, 2016 2015 and 2014,2015, the Company received proceeds of approximately $43.2 million (4.3 million shares), $42.6 million (4.4 million shares), and $36.8 million (3.7 million shares) and $17.7 million (1.8 million shares), respectively, through the Reinvestment Plan.
Stock Issuance and Offering Costs – The Company incurred costs in connection with the offering and issuance of shares, including selling commissions, marketing support fees, filing fees, legal, accounting, printing and due diligence expense reimbursements, which are recorded as stock issuance and offering costs and deducted from stockholders’ equity. In accordance with the Company’s articles of incorporation, the total amount of selling commissions, marketing support fees, and other organizational and offering costs to be paid by the Company may not exceed 15% of the aggregate gross offering proceeds. Offering costs are generally funded by the Managing Dealer and subsequently reimbursed by the Company subject to this limitation. For the yearsyear ended December 31, 2015, and 2014, the Company incurred approximately $57.4 million and $59.8 million, respectively, in stock issuance and other offering costs, as described in Note 11. “Related Party Arrangements.”
Distributions — For the years ended December 31, 2017, 2016 2015 and 2014,2015, the Company declared cash distributions of $77.7 million, $74.0 million $63.2 million and $31.9$63.2 million, respectively, of which $31.4$34.5 million, $26.4$31.5 million and $14.2$26.4 million, respectively, were paid in cash to stockholders and $43.2 million, $42.6 million $36.8 million and $17.7$36.8 million, respectively, were reinvested pursuant to the Reinvestment Plan. In addition, for the yearsyear ended December 31, 2015, and 2014, the Company declared and made stock distributions of approximately 3.2 million and 2.4 million shares of common stock, respectively.stock.
The tax composition of the Company’s distributions declared for the years ended December 31, 2017, 2016 2015 and 20142015 were as follows:
|
| December 31, |
|
| Years Ended December 31, |
| ||||||||||||||||||
|
| 2016 |
|
| 2015 |
|
| 2014 |
|
| 2017 |
|
| 2016 |
|
| 2015 |
| ||||||
Ordinary income |
|
| 21.5 | % |
|
| 37.8 | % |
|
| 30.8 | % |
|
| 0.0 | % |
|
| 21.5 | % |
|
| 37.8 | % |
Capital gain |
|
| 14.4 | % |
|
| 0.0 | % |
|
| 0.0 | % |
|
| 0.0 | % |
|
| 14.4 | % |
|
| 0.0 | % |
Unrecaptured Sec. 1250 gain |
|
| 1.2 | % |
|
| 0.0 | % |
|
| 0.0 | % |
|
| 0.0 | % |
|
| 1.2 | % |
|
| 0.0 | % |
Return of capital |
|
| 62.9 | % |
|
| 62.2 | % |
|
| 69.2 | % |
|
| 100.0 | % |
|
| 62.9 | % |
|
| 62.2 | % |
151
CNL HEALTHCARE PROPERTIES, INC. AND SUBSIDIARIES
NOTES TO CONSOLIDATED FINANCIAL STATEMENTS
YEAR ENDED DECEMBER 31, 2017
Redemptions — For the years ended December 31, 2017, 2016 2015 and 2014,2015, the Company received requests for the redemption of common stock of approximately 4.7 million, 3.7 million 1.0 million and 0.31.0 million shares, respectively, all of which were approved for redemption at an average price of $9.99, $9.73 $9.51 and $9.24,$9.51, respectively, and for a total of approximately $47.3 million, $36.2 million $9.3 million and $3.0$9.3 million, respectively.
Promoted Interest — For the years ended December 31, 2017, 2016 2015 and 2014,2015, the Company recorded, as a reduction to capital in excess of par value, the following distributions to holders of promoted interest (in thousands):
|
| December 31, |
|
| Years Ended December 31, |
| ||||||||||||||||||
|
| 2016 |
|
| 2015 |
|
| 2014 |
|
| 2017 |
|
| 2016 |
|
| 2015 |
| ||||||
Dogwood Forest of Acworth |
| $ | (3,850 | ) |
| $ | — |
|
| $ | — |
|
| $ | — |
|
| $ | (3,850 | ) |
| $ | — |
|
Wellmore of Tega Cay |
|
| (2,800 | ) |
|
| — |
|
|
| — |
|
| ― |
|
|
| (2,800 | ) |
| ― |
| ||
HarborChase of Villages Crossing |
| ― |
|
|
| — |
|
|
| (2,000 | ) |
|
| (955 | ) |
| ― |
|
| ― |
| |||
|
| $ | (6,650 | ) |
| $ | — |
|
| $ | (2,000 | ) |
| $ | (955 | ) |
| $ | (6,650 | ) |
| $ | — |
|
143
CNL HEALTHCARE PROPERTIES, INC. AND SUBSIDIARIES
NOTES TO CONSOLIDATED FINANCIAL STATEMENTS
YEAR ENDED DECEMBER 31, 2016
Other comprehensive income (loss) — The following table reflects the effect of derivative financial instruments held by the Company, or its equity method investments,investment, and included in the consolidated statements of comprehensive loss for the years ended December 31, 2017, 2016 2015 and 20142015 (in thousands):
Derivative Financial Instruments |
| Gain (loss) recognized in other comprehensive loss on derivative financial instruments |
|
| Location of gain (loss) reclassified into earnings |
| Gain (loss) reclassified from accumulated other comprehensive loss into earnings |
| ||||||||||||||||||
|
| Years Ended |
|
|
|
| Years Ended |
| ||||||||||||||||||
|
| December 31, |
|
|
|
| December 31, |
| ||||||||||||||||||
|
| 2016 |
|
| 2015 |
|
| 2014 |
|
|
|
| 2016 |
|
| 2015 |
|
| 2014 |
| ||||||
Interest rate swaps |
| $ | 3,487 |
|
| $ | (4,881 | ) |
| $ | (3,915 | ) |
| Interest expense and loan cost amortization |
| $ | (7,150 | ) |
| $ | (4,110 | ) |
| $ | (98 | ) |
Interest rate caps |
|
| (1,584 | ) |
|
| (262 | ) |
| ― |
|
| Interest expense and loan cost amortization |
|
| (45 | ) |
| ― |
|
| ― |
| |||
Reclassification of interest rate swaps upon derecognition |
| ― |
|
|
| 236 |
|
| ― |
|
| Interest expense and loan cost amortization |
| ― |
|
|
| (236 | ) |
| ― |
| ||||
Reclassification of interest rate swaps due to ineffectiveness |
|
| (18 | ) |
|
| 33 |
|
| ― |
|
| Interest expense and loan cost amortization |
|
| 18 |
|
|
| (33 | ) |
| ― |
| ||
Interest rate cap held by unconsolidated joint venture |
|
| (1 | ) |
|
| (9 | ) |
|
| 10 |
|
| Not applicable |
| ― |
|
| ― |
|
| ― |
| |||
Total |
| $ | 1,884 |
|
| $ | (4,883 | ) |
| $ | (3,905 | ) |
|
|
| $ | (7,177 | ) |
| $ | (4,379 | ) |
| $ | (98 | ) |
Derivative financial instruments |
| Gain (loss) recognized in other comprehensive loss on derivative financial instruments |
|
| Location of gain (loss) reclassified into earnings |
| Gain (loss) reclassified from accumulated other comprehensive loss into earnings |
| ||||||||||||||||||
|
| Years Ended |
|
|
|
| Years Ended |
| ||||||||||||||||||
|
| December 31, |
|
|
|
| December 31, |
| ||||||||||||||||||
|
| 2017 |
|
| 2016 |
|
| 2015 |
|
|
|
| 2017 |
|
| 2016 |
|
| 2015 |
| ||||||
Interest rate swaps |
| $ | 5,573 |
|
| $ | 3,487 |
|
| $ | (4,881 | ) |
| Interest expense and loan cost amortization |
| $ | (3,902 | ) |
| $ | (7,150 | ) |
| $ | (4,110 | ) |
Interest rate caps |
|
| 1,013 |
|
|
| (1,584 | ) |
|
| (262 | ) |
| Interest expense and loan cost amortization |
|
| (849 | ) |
|
| (45 | ) |
| ― |
| |
Reclassification of interest rate swaps upon derecognition |
|
| 318 |
|
| ― |
|
|
| 236 |
|
| Interest expense and loan cost amortization |
|
| (318 | ) |
| ― |
|
|
| (236 | ) | ||
Reclassification of interest rate swaps due to ineffectiveness |
|
| (26 | ) |
|
| (18 | ) |
|
| 33 |
|
| Interest expense and loan cost amortization |
|
| 26 |
|
|
| 18 |
|
|
| (33 | ) |
Interest rate cap held by unconsolidated joint venture |
| ― |
|
|
| (1 | ) |
|
| (9 | ) |
| Not applicable |
| ― |
|
| ― |
|
| ― |
| ||||
Total |
| $ | 6,878 |
|
| $ | 1,884 |
|
| $ | (4,883 | ) |
|
|
| $ | (5,043 | ) |
| $ | (7,177 | ) |
| $ | (4,379 | ) |
152
CNL HEALTHCARE PROPERTIES, INC. AND SUBSIDIARIES
NOTES TO CONSOLIDATED FINANCIAL STATEMENTS
YEAR ENDED DECEMBER 31, 2017
For the years ended December 31, 2017, 2016 2015 and 2014,2015, the Company recorded net current tax expense and current deferred tax assets related to deferred income at its TRSs. The components of the income tax expensebenefit (expense) for the years ended December 31, 2017, 2016 2015 and 20142015 were as follows (in thousands):
|
| Years Ended December 31, |
|
| Years Ended December 31, |
| ||||||||||||||||||
|
| 2016 |
|
| 2015 |
|
| 2014 |
|
| 2017 |
|
| 2016 |
|
| 2015 |
| ||||||
Current: |
|
|
|
|
|
|
|
|
|
|
|
|
|
|
|
|
|
|
|
|
|
|
|
|
Federal |
| $ | — |
|
| $ | — |
|
| $ | — |
|
| $ | (245 | ) |
| $ | — |
|
| $ | — |
|
State |
|
| (351 | ) |
|
| (378 | ) |
|
| (361 | ) |
|
| (523 | ) |
|
| (351 | ) |
|
| (378 | ) |
Total current expense |
|
| (351 | ) |
|
| (378 | ) |
|
| (361 | ) |
|
| (768 | ) |
|
| (351 | ) |
|
| (378 | ) |
|
|
|
|
|
|
|
|
|
|
|
|
| ||||||||||||
Deferred: |
|
|
|
|
|
|
|
|
|
|
|
|
|
|
|
|
|
|
|
|
|
|
|
|
Federal |
| ― |
|
| ― |
|
| ― |
|
|
| 8,826 |
|
| ― |
|
| ― |
| |||||
State |
| ― |
|
| ― |
|
| ― |
|
|
| 305 |
|
| ― |
|
| ― |
| |||||
Total deferred expense |
| ― |
|
| ― |
|
| ― |
| |||||||||||||||
Income tax expense |
| $ | (351 | ) |
| $ | (378 | ) |
| $ | (361 | ) | ||||||||||||
Total deferred benefit |
|
| 9,131 |
|
| ― |
|
| ― |
| ||||||||||||||
Income tax benefit |
| $ | 8,363 |
|
| $ | (351 | ) |
| $ | (378 | ) | ||||||||||||
Deferred income taxes reflect the tax effects of temporary differences between the carrying amounts of assets and liabilities for financial reporting purposes and the amounts used for income tax purposes. Significant components of the Company’s deferred tax assets as of years ended December 31, 20162017 and 20152016 are as follows:
| 2016 |
|
| 2015 |
|
| 2017 |
|
| 2016 |
| |||||
Carryforwards of net operating loss |
| $ | 9,110 |
|
| $ | 5,220 |
|
| $ | 9,381 |
|
| $ | 9,110 |
|
Minimum tax credit carryforward (1) |
|
| 189 |
|
| ― |
| |||||||||
Prepaid rent |
|
| 442 |
|
|
| 619 |
|
|
| 648 |
|
|
| 442 |
|
Valuation allowance |
|
| (9,552 | ) |
|
| (5,839 | ) | ||||||||
Net deferred tax assets |
| $ | — |
|
| $ | — |
| ||||||||
Valuation allowance (2) |
|
| (1,087 | ) |
|
| (9,552 | ) | ||||||||
Deferred tax assets, net |
| $ | 9,131 |
|
| $ | — |
| ||||||||
144
CNL HEALTHCARE PROPERTIES, INC. AND SUBSIDIARIES
NOTES TO CONSOLIDATED FINANCIAL STATEMENTS
YEAR ENDED DECEMBER 31, 2016
FOOTNOTES:
| The Company expects to be refunded the full minimum tax credit carryforward over the next four years, beginning in the year ending December 31, 2018 through the year ending December 31, 2021. |
| (2) | The decrease in the valuation allowance across periods relates primarily to a change in judgment about the Company’s ability to realize deferred tax assets in future years, due to its current and foreseeable operations. |
A reconciliation of the income tax expensebenefit (expense) computed at the statutory federal tax rate on income before income taxes is as follows (in thousands):
|
| Years Ended December 31, |
|
| Years Ended December 31, |
| ||||||||||||||||||||||||||||||||||||||||||
|
| 2016 |
|
| 2015 |
|
| 2014 |
|
| 2017 |
|
| 2016 |
|
| 2015 |
| ||||||||||||||||||||||||||||||
Tax benefit computed at federal statutory rate |
| $ | 11,002 |
|
|
| 35.00 | % |
| $ | 23,701 |
|
|
| 35.00 | % |
| $ | 18,253 |
|
|
| 35.00 | % |
| $ | 12,136 |
|
|
| 35.00 | % |
| $ | 11,002 |
|
|
| 35.00 | % |
| $ | 23,701 |
|
|
| 35.00 | % |
Impact of REIT election |
|
| (11,002 | ) |
|
| (35.00 | )% |
|
| (23,701 | ) |
|
| (35.00 | )% |
|
| (18,253 | ) |
|
| (35.00 | )% |
|
| (13,459 | ) |
|
| (38.82 | )% |
|
| (11,002 | ) |
|
| (35.00 | )% |
|
| (23,701 | ) |
|
| (35.00 | )% |
State income tax expense |
|
| (351 | ) |
|
| (1.12 | )% |
|
| (378 | ) |
|
| (0.56 | )% |
|
| (361 | ) |
|
| (0.69 | )% | ||||||||||||||||||||||||
Income tax expense |
| $ | (351 | ) |
|
| (1.12 | )% |
| $ | (378 | ) |
|
| (0.56 | )% |
| $ | (361 | ) |
|
| (0.69 | )% | ||||||||||||||||||||||||
State income tax expense net of federal benefit |
|
| (406 | ) |
|
| (1.17 | )% |
|
| (351 | ) |
|
| (1.12 | )% |
|
| (378 | ) |
|
| (0.56 | )% | ||||||||||||||||||||||||
Effect of change in future tax rates |
|
| 1,861 |
|
|
| 5.37 | % |
| ― |
|
| ― |
|
| ― |
|
| ― |
| ||||||||||||||||||||||||||||
Effect of change in valuation allowance |
|
| 8,231 |
|
|
| 23.74 | % |
| ― |
|
| ― |
|
| ― |
|
| ― |
| ||||||||||||||||||||||||||||
Income tax benefit (expense) |
| $ | 8,363 |
|
|
| 24.12 | % |
| $ | (351 | ) |
|
| (1.12 | )% |
| $ | (378 | ) |
|
| (0.56 | )% | ||||||||||||||||||||||||
153
CNL HEALTHCARE PROPERTIES, INC. AND SUBSIDIARIES
NOTES TO CONSOLIDATED FINANCIAL STATEMENTS
YEAR ENDED DECEMBER 31, 2017
The Company’s TRS entities had net operating loss carry-forwards for federal and state purposes of approximately $39.0 million and $48.6 million as of year ended December 31, 2017 and 2016, respectively, to offset future taxable income with approximately $11.5 million, $16.6 million, and $19.6 million ofincome. If not utilized, the estimatedfederal net operating loss carry-forwards setwill begin to expire in 2034, 2035 and 2036, respectively.the state net operating loss carry-forwards will begin to expire in 2019. The Company analyzed its material tax positions and determined that it has not taken any uncertain tax positions. The tax years 20132014 through 20162017 remain subject to examination by taxing authorities. The Company did not identify items for which the income tax effects of the Tax Cuts and Jobs Act have not been completed and a reasonable estimate could not be determined as of December 31, 2017.
15. | Commitments and Contingencies |
From time to time, the Company may be a party to legal proceedings in the ordinary course of, or incidental to the normal course of, its business, including proceedings to enforce its contractual or statutory rights. While the Company cannot predict the outcome of these legal proceedings with certainty, based upon currently available information, the Company does not believe the final outcome of any pending or threatened legal proceeding will have a material adverse effect on its results of operations or financial condition.
Refer to Note 4. “Real Estate Assets, net” for additional information on theThe Company has approximately $2.5 million remaining development budgets for the Company’s real estate undercompleted developments and expansions.
As a result of the Company’s completed seniors housing developments continuing to move towards or achieving stabilization, the Company monitors the lease-up of these properties to determine whether the established performance metrics have been met as of each reporting period. As of December 31, 2017, one property had met its established performance metrics, and the Company accrued $1.0 million as a distribution to the holder of promoted interest in the accompanying consolidated balance sheet. The Company has six remaining promoted interest agreements with third-party developers pursuant to which certain operating targets have been established that, upon meeting such targets, result in the developer being entitled to additional payments based on enumerated percentages of the assumed net proceeds of a deemed sale, subject to achievement of an established internal rate of return on the Company’s investment in the development. For the remaining six promoted interest agreements, the established performance metrics were not met nor probable of being met as of December 31, 2017.
Refer to Note 8.7. “Ground and Air Rights Leases” for information on commitments under its ground and air rights lease agreements.
Refer to Note 9. “Contingent Purchase Price Consideration” for information on potential contingent purchase price considerations related to property acquisitions.
Refer to Note 11. “Related Party Arrangements” for information on contingent restricted stock shares due to the Company’s Advisor and Property Manager in connection with the Expense Support Agreements.expense support agreements.
16. | Concentration of Credit Risk |
For the years ended December 31, 2017, 2016 2015 and 20142015 the Company had the following geographical concentration that individually accounted for 10% or more of total revenues:
| Type of |
| December 31, | |||||||
| Concentration |
| 2016 |
|
| 2015 |
|
| 2014 |
|
State of Texas (1) | Geographical |
| 18.4 | % |
| 16.5 | % |
| 22.1 | % |
|
| Type of |
| Years Ended December 31, |
| |||||||||
|
| Concentration |
| 2017 |
|
| 2016 |
|
| 2015 |
| |||
State of Texas (1) |
| Geographical |
|
| 18.6 | % |
|
| 18.4 | % |
|
| 16.5 | % |
_______________
FOOTNOTE:
| (1) | Includes rental income |
145154
CNL HEALTHCARE PROPERTIES, INC. AND SUBSIDIARIES
NOTES TO CONSOLIDATED FINANCIAL STATEMENTS
YEAR ENDED DECEMBER 31, 20162017
The following table presents selected unaudited quarterly financial data for the years ended December 31, 20162017 and 20152016 (in thousands, except per share data):
2017 Quarters |
| First |
|
| Second |
|
| Third |
|
| Fourth |
|
| Full Year |
| |||||||||||||||||||||||||
Total revenues |
| $ | 95,698 |
|
| $ | 97,780 |
|
| $ | 101,687 |
|
| $ | 103,251 |
|
| $ | 398,416 |
| ||||||||||||||||||||
Operating income |
|
| 7,463 |
|
|
| 8,491 |
|
|
| 6,270 |
|
|
| 8,831 |
|
|
| 31,055 |
| ||||||||||||||||||||
Net income (loss) attributable to common stockholders |
|
| (7,324 | ) |
|
| (7,901 | ) |
|
| (11,170 | ) |
|
| 433 |
|
|
| (25,962 | ) | ||||||||||||||||||||
Weighted average number of shares outstanding (basic and diluted) |
|
| 175,277 |
|
|
| 175,221 |
|
|
| 175,190 |
|
|
| 174,918 |
|
|
| 175,151 |
| ||||||||||||||||||||
Net income (loss) per share of common stock (basic and diluted) |
| $ | (0.04 | ) |
| $ | (0.05 | ) |
| $ | (0.06 | ) |
| $ | 0.00 |
|
| $ | (0.15 | ) | ||||||||||||||||||||
|
|
|
|
|
|
|
|
|
|
|
|
|
|
|
|
|
|
|
|
| ||||||||||||||||||||
2016 Quarters |
| First |
|
| Second |
|
| Third |
|
| Fourth |
|
| Full Year |
|
| First |
|
| Second |
|
| Third |
|
| Fourth |
|
| Full Year |
| ||||||||||
Total revenues |
| $ | 92,960 |
|
| $ | 94,041 |
|
| $ | 95,511 |
|
| $ | 94,543 |
|
| $ | 377,055 |
|
| $ | 92,960 |
|
| $ | 94,041 |
|
| $ | 95,511 |
|
| $ | 94,543 |
|
| $ | 377,055 |
|
Operating income (loss) |
|
| (991 | ) |
|
| 2,714 |
|
|
| 3,660 |
|
|
| 5,764 |
|
|
| 11,147 |
|
|
| (991 | ) |
|
| 2,714 |
|
|
| 3,660 |
|
|
| 5,764 |
|
|
| 11,147 |
|
Net income (loss) attributable to common stockholders |
|
| (14,442 | ) |
|
| (12,072 | ) |
|
| (11,992 | ) |
|
| 6,839 |
|
|
| (31,667 | ) |
|
| (14,442 | ) |
|
| (12,072 | ) |
|
| (11,992 | ) |
|
| 6,839 |
|
|
| (31,667 | ) |
Weighted average number of shares outstanding(basic and diluted) |
|
| 174,681 |
|
|
| 175,489 |
|
|
| 175,033 |
|
|
| 175,328 |
|
|
| 175,121 |
| ||||||||||||||||||||
Income (loss) per share of common stock(basic and diluted) |
| $ | (0.08 | ) |
| $ | (0.07 | ) |
| $ | (0.07 | ) |
| $ | 0.04 |
|
| $ | (0.18 | ) | ||||||||||||||||||||
Weighted average number of shares outstanding (basic and diluted) |
|
| 174,681 |
|
|
| 175,489 |
|
|
| 175,033 |
|
|
| 175,328 |
|
|
| 175,121 |
| ||||||||||||||||||||
Net income (loss) per share of common stock (basic and diluted) |
| $ | (0.08 | ) |
| $ | (0.07 | ) |
| $ | (0.07 | ) |
| $ | 0.04 |
|
| $ | (0.18 | ) | ||||||||||||||||||||
2015 Quarters |
| First |
|
| Second |
|
| Third |
|
| Fourth |
|
| Full Year |
| |||||
Total revenues |
| $ | 65,033 |
|
| $ | 67,476 |
|
| $ | 79,904 |
|
| $ | 88,112 |
|
| $ | 300,525 |
|
Operating loss |
|
| (7,909 | ) |
|
| (3,650 | ) |
|
| (7,925 | ) |
|
| (4,824 | ) |
|
| (24,308 | ) |
Net loss attributable to common stockholders |
|
| (18,000 | ) |
|
| (13,410 | ) |
|
| (19,225 | ) |
|
| (17,420 | ) |
|
| (68,055 | ) |
Weighted average number of shares outstanding(basic and diluted) (1) |
|
| 131,880 |
|
|
| 146,257 |
|
|
| 162,730 |
|
|
| 173,766 |
|
|
| 153,804 |
|
Loss per share of common stock(basic and diluted) |
| $ | (0.14 | ) |
| $ | (0.09 | ) |
| $ | (0.12 | ) |
| $ | (0.10 | ) |
| $ | (0.44 | ) |
FOOTNOTE:
|
|
18. |
|
Expense Support Agreement Amendment
In FebruaryAugust 2017, the Company’s boardCompany committed to a plan to sell the Perennial Communities, which are comprised of directors approvedsix skilled nursing facilities located in Arkansas, and classified the fourth amendedassociated assets as held for sale as of December 31, 2017. The sale of these properties would not cause a strategic shift in the Company nor would it be considered individually significant; therefore, it does not qualify as discontinued operations.
As of December 31, 2017 and restated expense support agreements with both the Advisor and Property Manager that are effective January 1, 2017. These amendments limit the annual expense support amount to four percent2016, assets held for sale consisted of the then-current estimated NAV per share and change the calculation to exclude the impact of completed development properties for a specified period of time after the property is placed into service (as defined in the agreement).following (in thousands):
|
| As of December 31, |
| |||||
|
| 2017 |
|
| 2016 |
| ||
Real estate assets, net |
| $ | 47,004 |
|
| $ | 47,178 |
|
Intangibles, net |
|
| 800 |
|
|
| 893 |
|
Deferred rent and lease incentives |
|
| 4,970 |
|
|
| 5,280 |
|
Real estate held for sale, net |
| $ | 52,774 |
|
| $ | 53,351 |
|
CNL HEALTHCARE PROPERTIES, INC. AND SUBSIDIARIES
SCHEDULE II – VALUATION AND QUALIFYING ACCOUNTS
YEARS ENDED DECEMBER 31, 2017, 2016 2015 AND 20142015 (in thousands)
Year |
| Description |
| Balance at Beginning of Year |
|
| Charged to Costs and Expenses |
|
| Charged to Other Accounts |
|
| Balance at End of Year |
|
| Description |
| Balance at Beginning of Year |
|
| Charged to Costs and Expenses |
|
| Charged to Other Accounts |
|
| Balance at End of Year |
| ||||||||
2014 |
| Deferred tax asset valuation allowance |
| $ | (597 | ) |
| $ | (2,201 | ) |
| $ | — |
|
| $ | (2,798 | ) | ||||||||||||||||||
|
|
|
| $ | (597 | ) |
| $ | (2,201 | ) |
| $ | — |
|
| $ | (2,798 | ) | ||||||||||||||||||
|
|
|
|
|
|
|
|
|
|
|
|
|
|
|
|
|
|
| ||||||||||||||||||
2015 |
| Deferred tax asset valuation allowance |
| $ | (2,798 | ) |
| $ | (3,041 | ) |
| $ | — |
|
| $ | (5,839 | ) |
| Deferred tax asset valuation allowance |
| $ | (2,798 | ) |
| $ | (3,041 | ) |
| $ | — |
|
| $ | (5,839 | ) |
|
| Allowance for doubtful accounts |
| ― |
|
|
| (1,170 | ) |
| ― |
|
|
| (1,170 | ) | ||||||||||||||||||||
|
|
|
| $ | (2,798 | ) |
| $ | (4,211 | ) |
| $ | — |
|
| $ | (7,009 | ) |
| Allowance for doubtful accounts |
| ― |
|
|
| (1,170 | ) |
|
| — |
|
|
| (1,170 | ) | |
|
|
|
|
|
|
|
|
|
|
|
|
|
|
|
|
|
|
|
|
|
| $ | (2,798 | ) |
| $ | (4,211 | ) |
| $ | — |
|
| $ | (7,009 | ) |
2016 |
| Deferred tax asset valuation allowance |
| $ | (5,839 | ) |
| $ | (3,713 | ) |
| $ | — |
|
| $ | (9,552 | ) |
| Deferred tax asset valuation allowance |
| $ | (5,839 | ) |
| $ | (3,713 | ) |
| $ | — |
|
| $ | (9,552 | ) |
|
| Allowance for doubtful accounts |
|
| (1,170 | ) |
|
| (346 | ) |
| ― |
|
|
| (1,516 | ) |
| Allowance for doubtful accounts |
|
| (1,170 | ) |
|
| (346 | ) |
|
| — |
|
|
| (1,516 | ) | |
|
|
|
| $ | (7,009 | ) |
| $ | (4,059 | ) |
| $ | — |
|
| $ | (11,068 | ) |
|
|
| $ | (7,009 | ) |
| $ | (4,059 | ) |
| $ | — |
|
| $ | (11,068 | ) |
2017 |
| Deferred tax asset valuation allowance |
| $ | (9,552 | ) |
| $ | 8,465 |
|
| $ | — |
|
| $ | (1,087 | ) | ||||||||||||||||||
|
| Allowance for doubtful accounts |
|
| (1,516 | ) |
|
| (834 | ) |
|
| — |
|
|
| (2,350 | ) | ||||||||||||||||||
|
|
|
| $ | (11,068 | ) |
| $ | 7,631 |
|
| $ | — |
|
| $ | (3,437 | ) | ||||||||||||||||||
CNL HEALTHCARE PROPERTIES, INC. AND SUBSIDIARIES
SCHEDULE III – REAL ESTATE AND ACCUMULATED DEPRECIATION
AS OF DECEMBER 31, 20162017 (in thousands)
|
|
|
| Initial Costs |
| Costs Capitalized Subsequent to Acquisition |
| Gross Amounts at which Carried at Close of Period (2) |
|
|
|
|
|
|
|
|
|
|
|
|
|
|
| Initial Costs |
|
| Costs Capitalized Subsequent to Acquisition |
|
| Gross Amounts at which Carried at Close of Period (2) |
|
|
|
|
|
|
|
|
|
| Life on which |
| ||||||||||||||||||||||||||||||||||||||||||||||||||
Property/Location | Encum- brances |
| Land & Land Improve- ments |
| Building and Building Improve- ments |
| Land & Land Improve- ments |
| Building and Building Improve- ments |
| Construc- tion in Process |
| Land & Land Improve- ments |
| Building and Building Improve- ments |
| Construc- tion in Process |
| Total |
| Accumu-lated Depreci-ation |
|
| Date of Construction |
| Date Acquired |
| Life on which depreciation in latest income statement is computed |
| Encum- brances |
|
| Land & Land Improve- ments |
|
| Building and Building Improve- ments |
|
| Land & Land Improve- ments |
|
| Building and Building Improve- ments |
|
| Construc- tion in Process |
|
| Land & Land Improve- ments |
|
| Building and Building Improve- ments |
|
| Construc- tion in Process |
|
| Total |
|
| Accumu-lated Depreci-ation |
|
| Date of Construction |
| Date Acquired |
| depreciation in latest income statement is computed |
| ||||||||||||||||||||||||
Primrose Retirement Community of Casper |
|
|
|
|
|
|
|
|
|
|
|
|
|
|
|
|
|
|
|
|
|
|
|
|
|
|
|
|
|
|
|
|
|
|
|
|
|
|
|
|
|
|
|
|
|
|
|
|
|
|
|
|
|
|
|
|
|
|
|
|
|
|
|
|
|
|
|
|
|
|
|
|
|
|
|
|
|
|
|
|
|
|
|
|
|
|
|
|
|
|
| |
Casper, Wyoming | $ | 11,789 |
| $ | 1,910 |
| $ | 16,310 |
| $ | — |
| 296 |
| ― |
| 1,910 |
| 16,606 |
| ― |
| 18,516 |
| (2,099 | ) |
| 2004 |
| 2/16/2012 |
| (1) |
| $ | 11,535 |
|
| $ | 1,910 |
|
| $ | 16,310 |
|
| $ | 30 |
|
| $ | 296 |
|
| $ | — |
|
| $ | 1,940 |
|
| $ | 16,606 |
|
| $ | — |
|
| $ | 18,546 |
|
| $ | (2,552 | ) |
| 2004 |
| 2/16/2012 |
|
| (1) |
| ||||||||
|
|
|
|
|
|
|
|
|
|
|
|
|
|
|
|
|
|
|
|
|
|
|
|
|
|
|
|
|
|
|
|
| ||||||||||||||||||||||||||||||||||||||||||||||||||||||||||||
Primrose Retirement Community of Grand Island |
|
|
|
|
|
|
|
|
|
|
|
|
|
|
|
|
|
|
|
|
|
|
|
|
|
|
|
|
|
|
|
|
|
|
|
|
|
|
|
|
|
|
|
|
|
|
|
|
|
|
|
|
|
|
|
|
|
|
|
|
|
|
|
|
|
|
|
|
|
|
|
|
|
|
|
|
|
|
|
|
|
|
|
| ||||||||
Grand Island, Nebraska | $ | 8,316 |
| $ | 719 |
| $ | 12,140 |
| $ | 25 |
| ― |
| ― |
| 744 |
| 12,140 |
| ― |
| 12,884 |
| (1,620 | ) |
| 2005 |
| 2/16/2012 |
| (1) |
| $ | 8,137 |
|
| $ | 719 |
|
| $ | 12,140 |
|
| $ | 35 |
|
| $ | — |
|
| $ | — |
|
| $ | 754 |
|
| $ | 12,140 |
|
| $ | — |
|
| $ | 12,894 |
|
| $ | (1,957 | ) |
| 2005 |
| 2/16/2012 |
|
| (1) |
| ||||||||
|
|
|
|
|
|
|
|
|
|
|
|
|
|
|
|
|
|
|
|
|
|
|
|
|
|
|
|
|
|
|
|
| ||||||||||||||||||||||||||||||||||||||||||||||||||||||||||||
Primrose Retirement Community of Mansfield |
|
|
|
|
|
|
|
|
|
|
|
|
|
|
|
|
|
|
|
|
|
|
|
|
|
|
|
|
|
|
|
|
|
|
|
|
|
|
|
|
|
|
|
|
|
|
|
|
|
|
|
|
|
|
|
|
|
|
|
|
|
|
|
|
|
|
|
|
|
|
|
|
|
|
|
|
|
|
|
|
|
|
|
| ||||||||
Mansfield, Ohio | $ | 11,315 |
| $ | 650 |
| $ | 16,720 |
| $ | 229 |
| 71 |
| ― |
| 879 |
| 16,791 |
| ― |
| 17,670 |
| (2,231 | ) |
| 2007 |
| 2/16/2012 |
| (1) |
| $ | 11,071 |
|
| $ | 650 |
|
| $ | 16,720 |
|
| $ | 229 |
|
| $ | 71 |
|
| $ | — |
|
| $ | 879 |
|
| $ | 16,791 |
|
| $ | — |
|
| $ | 17,670 |
|
| $ | (2,706 | ) |
| 2007 |
| 2/16/2012 |
|
| (1) |
| ||||||||
|
|
|
|
|
|
|
|
|
|
|
|
|
|
|
|
|
|
|
|
|
|
|
|
|
|
|
|
|
|
|
|
| ||||||||||||||||||||||||||||||||||||||||||||||||||||||||||||
Primrose Retirement Community of Marion |
|
|
|
|
|
|
|
|
|
|
|
|
|
|
|
|
|
|
|
|
|
|
|
|
|
|
|
|
|
|
|
|
|
|
|
|
|
|
|
|
|
|
|
|
|
|
|
|
|
|
|
|
|
|
|
|
|
|
|
|
|
|
|
|
|
|
|
|
|
|
|
|
|
|
|
|
|
|
|
|
|
|
|
| ||||||||
Marion, Ohio | $ | 9,385 |
| $ | 889 |
| $ | 16,305 |
| $ | — |
| ― |
| ― |
| 889 |
| 16,305 |
| ― |
| 17,194 |
| (2,150 | ) |
| 2006 |
| 2/16/2012 |
| (1) |
| $ | 9,183 |
|
| $ | 889 |
|
| $ | 16,305 |
|
| $ | — |
|
| $ | — |
|
| $ | — |
|
| $ | 889 |
|
| $ | 16,305 |
|
| $ | — |
|
| $ | 17,194 |
|
| $ | (2,595 | ) |
| 2006 |
| 2/16/2012 |
|
| (1) |
| ||||||||
|
|
|
|
|
|
|
|
|
|
|
|
|
|
|
|
|
|
|
|
|
|
|
|
|
|
|
|
|
|
|
|
| ||||||||||||||||||||||||||||||||||||||||||||||||||||||||||||
Sweetwater Retirement Community |
|
|
|
|
|
|
|
|
|
|
|
|
|
|
|
|
|
|
|
|
|
|
|
|
|
|
|
|
|
|
|
|
|
|
|
|
|
|
|
|
|
|
|
|
|
|
|
|
|
|
|
|
|
|
|
|
|
|
|
|
|
|
|
|
|
|
|
|
|
|
|
|
|
|
|
|
|
|
|
|
|
|
|
| ||||||||
Billings, Montana |
| 10,193 |
| $ | 1,578 |
| $ | 14,205 |
| $ | 19 |
| ― |
| ― |
| 1,597 |
| 14,205 |
| ― |
| 15,802 |
| (1,827 | ) |
| 2006 |
| 2/16/2012 |
| (1) |
| $ | 9,973 |
|
| $ | 1,578 |
|
| $ | 14,205 |
|
| $ | 19 |
|
| $ | — |
|
| $ | — |
|
| $ | 1,597 |
|
| $ | 14,205 |
|
| $ | — |
|
| $ | 15,802 |
|
| $ | (2,205 | ) |
| 2006 |
| 2/16/2012 |
|
| (1) |
| ||||||||
|
|
|
|
|
|
|
|
|
|
|
|
|
|
|
|
|
|
|
|
|
|
|
|
|
|
|
|
|
|
|
|
| ||||||||||||||||||||||||||||||||||||||||||||||||||||||||||||
HarborChase of Villages Crossing |
|
|
|
|
|
|
|
|
|
|
|
|
|
|
|
|
|
|
|
|
|
|
|
|
|
|
|
|
|
|
|
|
|
|
|
|
|
|
|
|
|
|
|
|
|
|
|
|
|
|
|
|
|
|
|
|
|
|
|
|
|
|
|
|
|
|
|
|
|
|
|
|
|
|
|
|
|
|
|
|
|
|
|
| ||||||||
Lady Lake, Florida ("The Villages") | $ | — |
| $ | 2,165 |
| $ | — |
| $ | 986 |
| 15,424 |
| ― |
| 3,151 |
| 15,424 |
| ― |
| 18,575 |
| (1,264 | ) |
| 2013 |
| 8/29/2012 |
| (1) |
| $ | — |
|
| $ | 2,165 |
|
| $ | — |
|
| $ | 986 |
|
| $ | 15,424 |
|
| $ | — |
|
| $ | 3,151 |
|
| $ | 15,424 |
|
| $ | — |
|
| $ | 18,575 |
|
| $ | (1,685 | ) |
| 2013 |
| 8/29/2012 |
|
| (1) |
| ||||||||
|
|
|
|
|
|
|
|
|
|
|
|
|
|
|
|
|
|
|
|
|
|
|
|
|
|
|
|
|
|
|
|
| ||||||||||||||||||||||||||||||||||||||||||||||||||||||||||||
Primrose Retirement Community Cottages |
|
|
|
|
|
|
|
|
|
|
|
|
|
|
|
|
|
|
|
|
|
|
|
|
|
|
|
|
|
|
|
|
|
|
|
|
|
|
|
|
|
|
|
|
|
|
|
|
|
|
|
|
|
|
|
|
|
|
|
|
|
|
|
|
|
|
|
|
|
|
|
|
|
|
|
|
|
|
|
|
|
|
|
| ||||||||
Aberdeen, South Dakota | $ | — |
| $ | 311 |
| $ | 3,794 |
| $ | — |
| ― |
| ― |
| 311 |
| 3,794 |
| ― |
| 4,105 |
| (421 | ) |
| 2005 |
| 12/19/2012 |
| (1) |
| $ | — |
|
| $ | 311 |
|
| $ | 3,794 |
|
| $ | — |
|
| $ | — |
|
| $ | — |
|
| $ | 311 |
|
| $ | 3,794 |
|
| $ | — |
|
| $ | 4,105 |
|
| $ | (526 | ) |
| 2005 |
| 12/19/2012 |
|
| (1) |
| ||||||||
|
|
|
|
|
|
|
|
|
|
|
|
|
|
|
|
|
|
|
|
|
|
|
|
|
|
|
|
|
|
|
|
| ||||||||||||||||||||||||||||||||||||||||||||||||||||||||||||
Primrose Retirement Community of Council Bluffs |
|
|
|
|
|
|
|
|
|
|
|
|
|
|
|
|
|
|
|
|
|
|
|
|
|
|
|
|
|
|
|
|
|
|
|
|
|
|
|
|
|
|
|
|
|
|
|
|
|
|
|
|
|
|
|
|
|
|
|
|
|
|
|
|
|
|
|
|
|
|
|
|
|
|
|
|
|
|
|
|
|
|
|
| ||||||||
Council Bluffs, Iowa ("Omaha") | $ | — |
| $ | 1,144 |
| $ | 11,117 |
| $ | 5 |
| ― |
| ― |
| 1,149 |
| 11,117 |
| ― |
| 12,266 |
| (1,268 | ) |
| 2008 |
| 12/19/2012 |
| (1) |
| $ | — |
|
| $ | 1,144 |
|
| $ | 11,117 |
|
| $ | 5 |
|
| $ | — |
|
| $ | — |
|
| $ | 1,149 |
|
| $ | 11,117 |
|
| $ | — |
|
| $ | 12,266 |
|
| $ | (1,585 | ) |
| 2008 |
| 12/19/2012 |
|
| (1) |
| ||||||||
|
|
|
|
|
|
|
|
|
|
|
|
|
|
|
|
|
|
|
|
|
|
|
|
|
|
|
|
|
|
|
|
| ||||||||||||||||||||||||||||||||||||||||||||||||||||||||||||
Primrose Retirement Community of Decatur |
|
|
|
|
|
|
|
|
|
|
|
|
|
|
|
|
|
|
|
|
|
|
|
|
|
|
|
|
|
|
|
|
|
|
|
|
|
|
|
|
|
|
|
|
|
|
|
|
|
|
|
|
|
|
|
|
|
|
|
|
|
|
|
|
|
|
|
|
|
|
|
|
|
|
|
|
|
|
|
|
|
|
|
| ||||||||
Decatur, Illinois | $ | 10,344 |
| $ | 513 |
| $ | 16,706 |
| $ | — |
| 154 |
| ― |
| 513 |
| 16,860 |
| ― |
| 17,373 |
| (1,824 | ) |
| 2009 |
| 12/19/2012 |
| (1) |
| $ | 10,120 |
|
| $ | 513 |
|
| $ | 16,706 |
|
| $ | — |
|
| $ | 154 |
|
| $ | — |
|
| $ | 513 |
|
| $ | 16,860 |
|
| $ | — |
|
| $ | 17,373 |
|
| $ | (2,287 | ) |
| 2009 |
| 12/19/2012 |
|
| (1) |
| ||||||||
|
|
|
|
|
|
|
|
|
|
|
|
|
|
|
|
|
|
|
|
|
|
|
|
|
|
|
|
|
|
|
|
| ||||||||||||||||||||||||||||||||||||||||||||||||||||||||||||
Primrose Retirement Community of Lima |
|
|
|
|
|
|
|
|
|
|
|
|
|
|
|
|
|
|
|
|
|
|
|
|
|
|
|
|
|
|
|
|
|
|
|
|
|
|
|
|
|
|
|
|
|
|
|
|
|
|
|
|
|
|
|
|
|
|
|
|
|
|
|
|
|
|
|
|
|
|
|
|
|
|
|
|
|
|
|
|
|
|
|
| ||||||||
Lima, Ohio | $ | — |
| $ | 944 |
| $ | 17,115 |
| $ | 8 |
| 4 |
| ― |
| 952 |
| 17,119 |
| ― |
| 18,071 |
| (1,864 | ) |
| 2006 |
| 12/19/2012 |
| (1) |
| $ | — |
|
| $ | 944 |
|
| $ | 17,115 |
|
| $ | 8 |
|
| $ | 4 |
|
| $ | — |
|
| $ | 952 |
|
| $ | 17,119 |
|
| $ | — |
|
| $ | 18,071 |
|
| $ | (2,330 | ) |
| 2006 |
| 12/19/2012 |
|
| (1) |
| ||||||||
|
|
|
|
|
|
|
|
|
|
|
|
|
|
|
|
|
|
|
|
|
|
|
|
|
|
|
|
|
|
|
|
| ||||||||||||||||||||||||||||||||||||||||||||||||||||||||||||
Primrose Retirement Community of Zanesville |
|
|
|
|
|
|
|
|
|
|
|
|
|
|
|
|
|
|
|
|
|
|
|
|
|
|
|
|
|
|
|
|
|
|
|
|
|
|
|
|
|
|
|
|
|
|
|
|
|
|
|
|
|
|
|
|
|
|
|
|
|
|
|
|
|
|
|
|
|
|
|
|
|
|
|
|
|
|
|
|
|
|
|
| ||||||||
Zanesville, Ohio | $ | 11,674 |
| $ | 1,184 |
| $ | 17,292 |
| $ | — |
| 67 |
| ― |
| 1,184 |
| 17,359 |
| ― |
| 18,543 |
| (1,887 | ) |
| 2008 |
| 12/19/2012 |
| (1) |
| $ | 11,421 |
|
| $ | 1,184 |
|
| $ | 17,292 |
|
| $ | — |
|
| $ | 67 |
|
| $ | — |
|
| $ | 1,184 |
|
| $ | 17,359 |
|
| $ | — |
|
| $ | 18,543 |
|
| $ | (2,362 | ) |
| 2008 |
| 12/19/2012 |
|
| (1) |
| ||||||||
|
|
|
|
|
|
|
|
|
|
|
|
|
|
|
|
|
|
|
|
|
|
|
|
|
|
|
|
|
|
|
|
| ||||||||||||||||||||||||||||||||||||||||||||||||||||||||||||
Symphony Manor |
|
|
|
|
|
|
|
|
|
|
|
|
|
|
|
|
|
|
|
|
|
|
|
|
|
|
|
|
|
|
|
|
|
|
|
|
|
|
|
|
|
|
|
|
|
|
|
|
|
|
|
|
|
|
|
|
|
|
|
|
|
|
|
|
|
|
|
|
|
|
|
|
|
|
|
|
|
|
|
|
|
|
|
| ||||||||
Baltimore, Maryland | $ | 11,683 |
| $ | 2,319 |
| $ | 19,444 |
| $ | — |
| 78 |
| ― |
| 2,319 |
| 19,522 |
| ― |
| 21,841 |
| (2,089 | ) |
| 2011 |
| 12/21/2012 |
| (1) |
| $ | 14,697 |
|
| $ | 2,319 |
|
| $ | 19,444 |
|
| $ | — |
|
| $ | 79 |
|
| $ | — |
|
| $ | 2,319 |
|
| $ | 19,523 |
|
| $ | — |
|
| $ | 21,842 |
|
| $ | (2,614 | ) |
| 2011 |
| 12/21/2012 |
|
| (1) |
| ||||||||
|
|
|
|
|
|
|
|
|
|
|
|
|
|
|
|
|
|
|
|
|
|
|
|
|
|
|
|
|
|
|
|
| ||||||||||||||||||||||||||||||||||||||||||||||||||||||||||||
Curry House Assisted Living & Memory Care |
|
|
|
|
|
|
|
|
|
|
|
|
|
|
|
|
|
|
|
|
|
|
|
|
|
|
|
|
|
|
|
|
|
|
|
|
|
|
|
|
|
|
|
|
|
|
|
|
|
|
|
|
|
|
|
|
|
|
|
|
|
|
|
|
|
|
|
|
|
|
|
|
|
|
|
|
|
|
|
|
|
|
|
| ||||||||
Cadillac, Michigan | $ | 6,008 |
| $ | 995 |
| $ | 11,072 |
| $ | 9 |
| ― |
| ― |
| 1,004 |
| 11,072 |
| ― |
| 12,076 |
| (1,202 | ) |
| 1966 |
| 12/21/2012 |
| (1) |
| $ | 7,743 |
|
| $ | 995 |
|
| $ | 11,072 |
|
| $ | 8 |
|
| $ | — |
|
| $ | — |
|
| $ | 1,003 |
|
| $ | 11,072 |
|
| $ | — |
|
| $ | 12,075 |
|
| $ | (1,503 | ) |
| 1966 |
| 12/21/2012 |
|
| (1) |
| ||||||||
|
|
|
|
|
|
|
|
|
|
|
|
|
|
|
|
|
|
|
|
|
|
|
|
|
|
|
|
|
|
|
|
| ||||||||||||||||||||||||||||||||||||||||||||||||||||||||||||
Tranquillity at Fredericktowne |
|
|
|
|
|
|
|
|
|
|
|
|
|
|
|
|
|
|
|
|
|
|
|
|
|
|
|
|
|
|
|
|
|
|
|
|
|
|
|
|
|
|
|
|
|
|
|
|
|
|
|
|
|
|
|
|
|
|
|
|
|
|
|
|
|
|
|
|
|
|
|
|
|
|
|
|
|
|
|
|
|
|
|
| ||||||||
Frederick, Maryland | $ | 5,779 |
| $ | 808 |
| $ | 14,291 |
| $ | — |
| 32 |
| 1,407 |
| 808 |
| 14,323 |
| 1,407 |
| 16,538 |
| (1,534 | ) |
| 2000 |
| 12/21/2012 |
| (1) |
| $ | 20,501 |
|
| $ | 808 |
|
| $ | 14,291 |
|
| $ | — |
|
| $ | 5,747 |
|
| $ | — |
|
| $ | 808 |
|
| $ | 20,038 |
|
| $ | — |
|
| $ | 20,846 |
|
| $ | (1,918 | ) |
| 2000 |
| 12/21/2012 |
|
| (1) |
| ||||||||
|
|
|
|
|
|
|
|
|
|
|
|
|
|
|
|
|
|
|
|
|
|
|
|
|
|
|
|
|
|
|
|
| ||||||||||||||||||||||||||||||||||||||||||||||||||||||||||||
Brookridge Heights Assisted Living & Memory Care |
|
|
|
|
|
|
|
|
|
|
|
|
|
|
|
|
|
|
|
|
|
|
|
|
|
|
|
|
|
|
|
|
|
|
|
|
|
|
|
|
|
|
|
|
|
|
|
|
|
|
|
|
|
|
|
|
|
|
|
|
|
|
|
|
|
|
|
|
|
|
|
|
|
|
|
|
|
|
|
|
|
|
|
| ||||||||
Marquette, Michigan | $ | 5,925 |
| $ | 595 |
| $ | 11,339 |
| $ | — |
| 11 |
| 2,391 |
| 595 |
| 11,350 |
| 2,391 |
| 14,336 |
| (1,213 | ) |
| 1998 |
| 12/21/2012 |
| (1) |
| $ | 13,039 |
|
| $ | 595 |
|
| $ | 11,339 |
|
| $ | — |
|
| $ | 4,674 |
|
| $ | — |
|
| $ | 595 |
|
| $ | 16,013 |
|
| $ | — |
|
| $ | 16,608 |
|
| $ | (1,672 | ) |
| 1998 |
| 12/21/2012 |
|
| (1) |
| ||||||||
|
|
|
|
|
|
|
|
|
|
|
|
|
|
|
|
|
|
|
|
|
|
|
|
|
|
|
|
|
|
|
|
| ||||||||||||||||||||||||||||||||||||||||||||||||||||||||||||
Woodholme Gardens Assisted Living & Memory Care |
|
|
|
|
|
|
|
|
|
|
|
|
|
|
|
|
|
|
|
|
|
|
|
|
|
|
|
|
|
|
|
|
|
|
|
|
|
|
|
|
|
|
|
|
|
|
|
|
|
|
|
|
|
|
|
|
|
|
|
|
|
|
|
|
|
|
|
|
|
|
|
|
|
|
|
|
|
|
|
|
|
|
|
| ||||||||
Pikesville, Maryland ("Baltimore") | $ | 7,000 |
| $ | 1,603 |
| $ | 13,472 |
| $ | 11 |
| ― |
| ― |
| 1,614 |
| 13,472 |
| ― |
| 15,086 |
| (1,457 | ) |
| 2010 |
| 12/21/2012 |
| (1) |
| $ | 6,788 |
|
| $ | 1,603 |
|
| $ | 13,472 |
|
| $ | 54 |
|
| $ | — |
|
| $ | — |
|
| $ | 1,657 |
|
| $ | 13,472 |
|
| $ | — |
|
| $ | 15,129 |
|
| $ | (1,826 | ) |
| 2010 |
| 12/21/2012 |
|
| (1) |
| ||||||||
|
|
|
|
|
|
|
|
|
|
|
|
|
|
|
|
|
|
|
|
|
|
|
|
|
|
|
|
|
|
|
|
| ||||||||||||||||||||||||||||||||||||||||||||||||||||||||||||
Batesville Healthcare Center |
|
|
|
|
|
|
|
|
|
|
|
|
|
|
|
|
|
|
|
|
|
|
|
|
|
|
|
|
|
|
|
|
|
|
|
|
|
|
|
|
|
|
|
|
|
|
|
|
|
|
|
|
|
|
|
|
|
|
|
|
|
|
|
|
|
|
|
|
|
|
|
|
|
|
|
|
|
|
|
|
|
|
|
| ||||||||
Batesville, Arkansas | $ | — |
| $ | 397 |
| $ | 5,382 |
| $ | — |
| ― |
| ― |
| 397 |
| 5,382 |
| ― |
| 5,779 |
| (502 | ) |
| 1975 |
| 5/31/2013 |
| (1) |
| $ | — |
|
| $ | 397 |
|
| $ | 5,382 |
|
| $ | 113 |
|
| $ | 75 |
|
| $ | — |
|
| $ | 510 |
|
| $ | 5,457 |
|
| $ | — |
|
| $ | 5,967 |
|
| $ | (598 | ) |
| 1975 |
| 5/31/2013 |
|
| (1) |
| ||||||||
|
|
|
|
|
|
|
|
|
|
|
|
|
|
|
|
|
|
|
|
|
|
|
|
|
|
|
|
|
|
|
|
| ||||||||||||||||||||||||||||||||||||||||||||||||||||||||||||
Broadway Healthcare Center |
|
|
|
|
|
|
|
|
|
|
|
|
|
|
|
|
|
|
|
|
|
|
|
|
|
|
|
|
|
|
|
|
|
|
|
|
|
|
|
|
|
|
|
|
|
|
|
|
|
|
|
|
|
|
|
|
|
|
|
|
|
|
|
|
|
|
|
|
|
|
|
|
|
|
|
|
|
|
|
|
|
|
|
| ||||||||
West Memphis, Arkansas | $ | — |
| $ | 438 |
| $ | 10,560 |
| $ | — |
| 77 |
| ― |
| 438 |
| 10,637 |
| ― |
| 11,075 |
| (1,002 | ) |
| 1994 |
| 5/31/2013 |
| (1) |
| $ | — |
|
| $ | 438 |
|
| $ | 10,560 |
|
| $ | — |
|
| $ | 77 |
|
| $ | — |
|
| $ | 438 |
|
| $ | 10,637 |
|
| $ | — |
|
| $ | 11,075 |
|
| $ | (1,189 | ) |
| 1994 |
| 5/31/2013 |
|
| (1) |
| ||||||||
148
CNL HEALTHCARE PROPERTIES, INC. AND SUBSIDIARIES
SCHEDULE III – REAL ESTATE AND ACCUMULATED DEPRECIATION
AS OF DECEMBER 31, 20162017 (in thousands)
|
|
|
| Initial Costs |
| Costs Capitalized Subsequent to Acquisition |
| Gross Amounts at which Carried at Close of Period (2) |
|
|
|
|
|
|
|
|
|
|
|
|
|
|
| Initial Costs |
|
| Costs Capitalized Subsequent to Acquisition |
|
| Gross Amounts at which Carried at Close of Period (2) |
|
|
|
|
|
|
|
|
|
| Life on which |
| |||||||||||||||||||||||||||||||||||||||||||||||
Property/Location | Encum- brances |
| Land & Land Improve- ments |
| Building and Building Improve- ments |
| Land & Land Improve- ments |
| Building and Building Improve- ments |
| Construc- tion in Process |
| Land & Land Improve- ments |
| Building and Building Improve- ments |
| Construc- tion in Process |
| Total |
| Accumu-lated Depreci-ation |
|
| Date of Construction |
| Date Acquired |
| Life on which depreciation in latest income statement is computed |
| Encum- brances |
|
| Land & Land Improve- ments |
|
| Building and Building Improve- ments |
|
| Land & Land Improve- ments |
|
| Building and Building Improve- ments |
|
| Construc- tion in Process |
|
| Land & Land Improve- ments |
|
| Building and Building Improve- ments |
|
| Construc- tion in Process |
|
| Total |
|
| Accumu-lated Depreci-ation |
|
| Date of Construction |
| Date Acquired |
| depreciation in latest income statement is computed |
| |||||||||||||||||||||
Jonesboro Healthcare Center |
|
|
|
|
|
|
|
|
|
|
|
|
|
|
|
|
|
|
|
|
|
|
|
|
|
|
|
|
|
|
|
|
|
|
|
|
|
|
|
|
|
|
|
|
|
|
|
|
|
|
|
|
|
|
|
|
|
|
|
|
|
|
|
|
|
|
|
|
|
|
|
|
|
|
|
|
|
|
|
|
|
|
|
|
| ||||
Jonesboro, Arkansas | $ | — |
| $ | 527 |
| $ | 13,493 |
| $ | — |
| 5 |
| ― |
|
| 527 |
| 13,498 |
| ― |
|
| 14,025 |
| (1,260 | ) |
| 2012 |
| 5/31/2013 |
| (1) |
| $ | — |
|
| $ | 527 |
|
| $ | 13,493 |
|
| $ | — |
|
| $ | 5 |
|
| $ | — |
|
| $ | 527 |
|
| $ | 13,498 |
|
| $ | — |
|
| $ | 14,025 |
|
| $ | (1,494 | ) |
| 2012 |
| 5/31/2013 |
|
| (1) |
| |||
|
|
|
|
|
|
|
|
|
|
|
|
|
|
|
|
|
|
|
|
|
|
|
|
|
|
|
|
|
|
|
|
|
|
| |||||||||||||||||||||||||||||||||||||||||||||||||||||||
Magnolia Healthcare Center |
|
|
|
|
|
|
|
|
|
|
|
|
|
|
|
|
|
|
|
|
|
|
|
|
|
|
|
|
|
|
|
|
|
|
|
|
|
|
|
|
|
|
|
|
|
|
|
|
|
|
|
|
|
|
|
|
|
|
|
|
|
|
|
|
|
|
|
|
|
|
|
|
|
|
|
|
|
|
|
|
|
|
|
|
|
| |||
Magnolia, Arkansas | $ | — |
| $ | 421 |
| $ | 10,454 |
| $ | — |
| ― |
| ― |
|
| 421 |
| 10,454 |
| ― |
|
| 10,875 |
| (992 | ) |
| 2009 |
| 5/31/2013 |
| (1) |
| $ | — |
|
| $ | 421 |
|
| $ | 10,454 |
|
| $ | — |
|
| $ | — |
|
| $ | — |
|
| $ | 421 |
|
| $ | 10,454 |
|
| $ | — |
|
| $ | 10,875 |
|
| $ | (1,177 | ) |
| 2009 |
| 5/31/2013 |
|
| (1) |
| |||
|
|
|
|
|
|
|
|
|
|
|
|
|
|
|
|
|
|
|
|
|
|
|
|
|
|
|
|
|
|
|
|
|
|
| |||||||||||||||||||||||||||||||||||||||||||||||||||||||
Mine Creek Healthcare Center |
|
|
|
|
|
|
|
|
|
|
|
|
|
|
|
|
|
|
|
|
|
|
|
|
|
|
|
|
|
|
|
|
|
|
|
|
|
|
|
|
|
|
|
|
|
|
|
|
|
|
|
|
|
|
|
|
|
|
|
|
|
|
|
|
|
|
|
|
|
|
|
|
|
|
|
|
|
|
|
|
|
|
|
|
|
| |||
Nashville, Arkansas | $ | — |
| $ | 135 |
| $ | 2,942 |
| $ | 11 |
| 10 |
| ― |
|
| 146 |
| 2,952 |
| ― |
|
| 3,098 |
| (291 | ) |
| 1978 |
| 5/31/2013 |
| (1) |
| $ | — |
|
| $ | 135 |
|
| $ | 2,942 |
|
| $ | 11 |
|
| $ | 36 |
|
| $ | — |
|
| $ | 146 |
|
| $ | 2,978 |
|
| $ | — |
|
| $ | 3,124 |
|
| $ | (347 | ) |
| 1978 |
| 5/31/2013 |
|
| (1) |
| |||
|
|
|
|
|
|
|
|
|
|
|
|
|
|
|
|
|
|
|
|
|
|
|
|
|
|
|
|
|
|
|
|
|
|
| |||||||||||||||||||||||||||||||||||||||||||||||||||||||
Searcy Healthcare Center |
|
|
|
|
|
|
|
|
|
|
|
|
|
|
|
|
|
|
|
|
|
|
|
|
|
|
|
|
|
|
|
|
|
|
|
|
|
|
|
|
|
|
|
|
|
|
|
|
|
|
|
|
|
|
|
|
|
|
|
|
|
|
|
|
|
|
|
|
|
|
|
|
|
|
|
|
|
|
|
|
|
|
|
|
|
| |||
Searcy, Arkansas | $ | — |
| $ | 648 |
| $ | 6,017 |
| $ | — |
| 50 |
| ― |
|
| 648 |
| 6,067 |
| ― |
|
| 6,715 |
| (584 | ) |
| 1973 |
| 5/31/2013 |
| (1) |
| $ | — |
|
| $ | 648 |
|
| $ | 6,017 |
|
| $ | — |
|
| $ | 222 |
|
| $ | — |
|
| $ | 648 |
|
| $ | 6,239 |
|
| $ | — |
|
| $ | 6,887 |
|
| $ | (710 | ) |
| 1973 |
| 5/31/2013 |
|
| (1) |
| |||
|
|
|
|
|
|
|
|
|
|
|
|
|
|
|
|
|
|
|
|
|
|
|
|
|
|
|
|
|
|
|
|
|
|
| |||||||||||||||||||||||||||||||||||||||||||||||||||||||
LaPorte Cancer Center |
|
|
|
|
|
|
|
|
|
|
|
|
|
|
|
|
|
|
|
|
|
|
|
|
|
|
|
|
|
|
|
|
|
|
|
|
|
|
|
|
|
|
|
|
|
|
|
|
|
|
|
|
|
|
|
|
|
|
|
|
|
|
|
|
|
|
|
|
|
|
|
|
|
|
|
|
|
|
|
|
|
|
|
|
|
| |||
Westville, Indiana | $ | 7,797 |
| $ | 433 |
| $ | 10,846 |
| $ | — |
| ― |
| ― |
|
| 433 |
| 10,846 |
| ― |
|
| 11,279 |
| (1,040 | ) |
| 2010 |
| 6/14/2013 |
| (1) |
| $ | 7,571 |
|
| $ | 433 |
|
| $ | 10,846 |
|
| $ | 96 |
|
| $ | — |
|
| $ | — |
|
| $ | 529 |
|
| $ | 10,846 |
|
| $ | — |
|
| $ | 11,375 |
|
| $ | (1,330 | ) |
| 2010 |
| 6/14/2013 |
|
| (1) |
| |||
|
|
|
|
|
|
|
|
|
|
|
|
|
|
|
|
|
|
|
|
|
|
|
|
|
|
|
|
|
|
|
|
|
|
| |||||||||||||||||||||||||||||||||||||||||||||||||||||||
Jefferson Medical Commons |
|
|
|
|
|
|
|
|
|
|
|
|
|
|
|
|
|
|
|
|
|
|
|
|
|
|
|
|
|
|
|
|
|
|
|
|
|
|
|
|
|
|
|
|
|
|
|
|
|
|
|
|
|
|
|
|
|
|
|
|
|
|
|
|
|
|
|
|
|
|
|
|
|
|
|
|
|
|
|
|
|
|
|
|
|
| |||
Jefferson City, Tennessee ("Knoxville") | $ | 7,598 |
| $ | 151 |
| $ | 10,236 |
| $ | — |
| 162 |
| ― |
|
| 151 |
| 10,398 |
| ― |
|
| 10,549 |
| (954 | ) |
| 2001 |
| 7/10/2013 |
| (1) |
| $ | 8,354 |
|
| $ | 151 |
|
| $ | 10,236 |
|
| $ | — |
|
| $ | 195 |
|
| $ | — |
|
| $ | 151 |
|
| $ | 10,431 |
|
| $ | — |
|
| $ | 10,582 |
|
| $ | (1,226 | ) |
| 2001 |
| 7/10/2013 |
|
| (1) |
| |||
|
|
|
|
|
|
|
|
|
|
|
|
|
|
|
|
|
|
|
|
|
|
|
|
|
|
|
|
|
|
|
|
|
|
| |||||||||||||||||||||||||||||||||||||||||||||||||||||||
Physicians Plaza A at North Knoxville Medical Center |
|
|
|
|
|
|
|
|
|
|
|
|
|
|
|
|
|
|
|
|
|
|
|
|
|
|
|
|
|
|
|
|
|
|
|
|
|
|
|
|
|
|
|
|
|
|
|
|
|
|
|
|
|
|
|
|
|
|
|
|
|
|
|
|
|
|
|
|
|
|
|
|
|
|
|
|
|
|
|
|
|
|
|
|
|
| |||
Powell, Tennessee ("Knoxville") | $ | 11,855 |
| $ | 262 |
| $ | 16,976 |
| $ | — |
| 9 |
| ― |
|
| 262 |
| 16,985 |
| ― |
|
| 17,247 |
| (1,585 | ) |
| 2005 |
| 7/10/2013 |
| (1) |
| $ | 13,673 |
|
| $ | 262 |
|
| $ | 16,976 |
|
| $ | — |
|
| $ | 29 |
|
| $ | — |
|
| $ | 262 |
|
| $ | 17,005 |
|
| $ | — |
|
| $ | 17,267 |
|
| $ | (2,037 | ) |
| 2005 |
| 7/10/2013 |
|
| (1) |
| |||
|
|
|
|
|
|
|
|
|
|
|
|
|
|
|
|
|
|
|
|
|
|
|
|
|
|
|
|
|
|
|
|
|
|
| |||||||||||||||||||||||||||||||||||||||||||||||||||||||
Physicians Plaza B at North Knoxville Medical Center |
|
|
|
|
|
|
|
|
|
|
|
|
|
|
|
|
|
|
|
|
|
|
|
|
|
|
|
|
|
|
|
|
|
|
|
|
|
|
|
|
|
|
|
|
|
|
|
|
|
|
|
|
|
|
|
|
|
|
|
|
|
|
|
|
|
|
|
|
|
|
|
|
|
|
|
|
|
|
|
|
|
|
|
|
|
| |||
Powell, Tennessee ("Knoxville") | $ | 14,260 |
| $ | 303 |
| $ | 18,754 |
| $ | — |
| 318 |
| ― |
|
| 303 |
| 19,072 |
| ― |
|
| 19,375 |
| (1,758 | ) |
| 2008 |
| 7/10/2013 |
| (1) |
| $ | 16,614 |
|
| $ | 303 |
|
| $ | 18,754 |
|
| $ | — |
|
| $ | 318 |
|
| $ | — |
|
| $ | 303 |
|
| $ | 19,072 |
|
| $ | — |
|
| $ | 19,375 |
|
| $ | (2,261 | ) |
| 2008 |
| 7/10/2013 |
|
| (1) |
| |||
|
|
|
|
|
|
|
|
|
|
|
|
|
|
|
|
|
|
|
|
|
|
|
|
|
|
|
|
|
|
|
|
|
|
| |||||||||||||||||||||||||||||||||||||||||||||||||||||||
Physicians Regional Medical Center - Central Wing Annex |
|
|
|
|
|
|
|
|
|
|
|
|
|
|
|
|
|
|
|
|
|
|
|
|
|
|
|
|
|
|
|
|
|
|
|
|
|
|
|
|
|
|
|
|
|
|
|
|
|
|
|
|
|
|
|
|
|
|
|
|
|
|
|
|
|
|
|
|
|
|
|
|
|
|
|
|
|
|
|
|
|
|
|
|
|
| |||
Knoxville, Tennessee | $ | 3,778 |
| $ | 73 |
| $ | 5,285 |
| $ | — |
| ― |
| ― |
|
| 73 |
| 5,285 |
| ― |
|
| 5,358 |
| (491 | ) |
| 2004 |
| 7/10/2013 |
| (1) |
| $ | 4,067 |
|
| $ | 73 |
|
| $ | 5,285 |
|
| $ | — |
|
| $ | — |
|
| $ | — |
|
| $ | 73 |
|
| $ | 5,285 |
|
| $ | — |
|
| $ | 5,358 |
|
| $ | (632 | ) |
| 2004 |
| 7/10/2013 |
|
| (1) |
| |||
|
|
|
|
|
|
|
|
|
|
|
|
|
|
|
|
|
|
|
|
|
|
|
|
|
|
|
|
|
|
|
|
|
|
| |||||||||||||||||||||||||||||||||||||||||||||||||||||||
HarborChase of Jasper |
|
|
|
|
|
|
|
|
|
|
|
|
|
|
|
|
|
|
|
|
|
|
|
|
|
|
|
|
|
|
|
|
|
|
|
|
|
|
|
|
|
|
|
|
|
|
|
|
|
|
|
|
|
|
|
|
|
|
|
|
|
|
|
|
|
|
|
|
|
|
|
|
|
|
|
|
|
|
|
|
|
|
|
|
|
| |||
Jasper, Alabama | $ | — |
| $ | 355 |
| $ | 6,358 |
| $ | — |
| 1 |
| ― |
|
| 355 |
| 6,359 |
| ― |
|
| 6,714 |
| (577 | ) |
| 1998 |
| 7/31/2013 |
| (1) |
| $ | — |
|
| $ | 355 |
|
| $ | 6,358 |
|
| $ | — |
|
| $ | 36 |
|
| $ | — |
|
| $ | 355 |
|
| $ | 6,394 |
|
| $ | — |
|
| $ | 6,749 |
|
| $ | (747 | ) |
| 1998 |
| 7/31/2013 |
|
| (1) |
| |||
|
|
|
|
|
|
|
|
|
|
|
|
|
|
|
|
|
|
|
|
|
|
|
|
|
|
|
|
|
|
|
|
|
|
| |||||||||||||||||||||||||||||||||||||||||||||||||||||||
Chestnut Commons MOB |
|
|
|
|
|
|
|
|
|
|
|
|
|
|
|
|
|
|
|
|
|
|
|
|
|
|
|
|
|
|
|
|
|
|
|
|
|
|
|
|
|
|
|
|
|
|
|
|
|
|
|
|
|
|
|
|
|
|
|
|
|
|
|
|
|
|
|
|
|
|
|
|
|
|
|
|
|
|
|
|
|
|
|
|
|
| |||
Elyria, Ohio ("Cleveland") | $ | — |
| $ | 2,053 |
| $ | 15,650 |
| $ | 38 |
| ― |
| ― |
|
| 2,091 |
| 15,650 |
| ― |
|
| 17,741 |
| (1,539 | ) |
| 2008 |
| 8/16/2013 |
| (1) |
| $ | — |
|
| $ | 2,053 |
|
| $ | 15,650 |
|
| $ | 59 |
|
| $ | — |
|
| $ | — |
|
| $ | 2,112 |
|
| $ | 15,650 |
|
| $ | — |
|
| $ | 17,762 |
|
| $ | (2,003 | ) |
| 2008 |
| 8/16/2013 |
|
| (1) |
| |||
|
|
|
|
|
|
|
|
|
|
|
|
|
|
|
|
|
|
|
|
|
|
|
|
|
|
|
|
|
|
|
|
|
|
| |||||||||||||||||||||||||||||||||||||||||||||||||||||||
Doctors Specialty Hospital |
|
|
|
|
|
|
|
|
|
|
|
|
|
|
|
|
|
|
|
|
|
|
|
|
|
|
|
|
|
|
|
|
|
|
|
|
|
|
|
|
|
|
|
|
|
|
|
|
|
|
|
|
|
|
|
|
|
|
|
|
|
|
|
|
|
|
|
|
|
|
|
|
|
|
|
|
|
|
|
|
|
|
|
|
|
| |||
Leawood, Kansas ("Kansas City") | $ | — |
| $ | 924 |
| $ | 5,771 |
| $ | 16 |
| ― |
| ― |
|
| 940 |
| 5,771 |
| ― |
|
| 6,711 |
| (550 | ) |
| 2001 |
| 8/16/2013 |
| (1) |
| $ | — |
|
| $ | 924 |
|
| $ | 5,771 |
|
| $ | 63 |
|
| $ | — |
|
| $ | — |
|
| $ | 987 |
|
| $ | 5,771 |
|
| $ | — |
|
| $ | 6,758 |
|
| $ | (716 | ) |
| 2001 |
| 8/16/2013 |
|
| (1) |
| |||
|
|
|
|
|
|
|
|
|
|
|
|
|
|
|
|
|
|
|
|
|
|
|
|
|
|
|
|
|
|
|
|
|
|
| |||||||||||||||||||||||||||||||||||||||||||||||||||||||
Escondido Medical Arts Center |
|
|
|
|
|
|
|
|
|
|
|
|
|
|
|
|
|
|
|
|
|
|
|
|
|
|
|
|
|
|
|
|
|
|
|
|
|
|
|
|
|
|
|
|
|
|
|
|
|
|
|
|
|
|
|
|
|
|
|
|
|
|
|
|
|
|
|
|
|
|
|
|
|
|
|
|
|
|
|
|
|
|
|
|
|
| |||
Escondido, California ("San Diego") | $ | — |
| $ | 1,863 |
| $ | 12,199 |
| $ | — |
| 23 |
| ― |
|
| 1,863 |
| 12,222 |
| ― |
|
| 14,085 |
| (1,078 | ) |
| 1994 |
| 8/16/2013 |
| (1) |
| $ | — |
|
| $ | 1,863 |
|
| $ | 12,199 |
|
| $ | — |
|
| $ | 23 |
|
| $ | — |
|
| $ | 1,863 |
|
| $ | 12,222 |
|
| $ | — |
|
| $ | 14,085 |
|
| $ | (1,402 | ) |
| 1994 |
| 8/16/2013 |
|
| (1) |
| |||
|
|
|
|
|
|
|
|
|
|
|
|
|
|
|
|
|
|
|
|
|
|
|
|
|
|
|
|
|
|
|
|
|
|
| |||||||||||||||||||||||||||||||||||||||||||||||||||||||
John C. Lincoln Medical Office Plaza I |
|
|
|
|
|
|
|
|
|
|
|
|
|
|
|
|
|
|
|
|
|
|
|
|
|
|
|
|
|
|
|
|
|
|
|
|
|
|
|
|
|
|
|
|
|
|
|
|
|
|
|
|
|
|
|
|
|
|
|
|
|
|
|
|
|
|
|
|
|
|
|
|
|
|
|
|
|
|
|
|
|
|
|
|
|
| |||
Phoenix, Arizona | $ | — |
| $ | 233 |
| $ | 2,779 |
| $ | — |
| 22 |
| ― |
|
| 233 |
| 2,801 |
| ― |
|
| 3,034 |
| (286 | ) |
| 1980 |
| 8/16/2013 |
| (1) |
| $ | — |
|
| $ | 233 |
|
| $ | 2,779 |
|
| $ | — |
|
| $ | 96 |
|
| $ | — |
|
| $ | 233 |
|
| $ | 2,875 |
|
| $ | — |
|
| $ | 3,108 |
|
| $ | (394 | ) |
| 1980 |
| 8/16/2013 |
|
| (1) |
| |||
|
|
|
|
|
|
|
|
|
|
|
|
|
|
|
|
|
|
|
|
|
|
|
|
|
|
|
|
|
|
|
|
|
|
| |||||||||||||||||||||||||||||||||||||||||||||||||||||||
John C. Lincoln Medical Office Plaza II |
|
|
|
|
|
|
|
|
|
|
|
|
|
|
|
|
|
|
|
|
|
|
|
|
|
|
|
|
|
|
|
|
|
|
|
|
|
|
|
|
|
|
|
|
|
|
|
|
|
|
|
|
|
|
|
|
|
|
|
|
|
|
|
|
|
|
|
|
|
|
|
|
|
|
|
|
|
|
|
|
|
|
|
|
|
| |||
Phoenix, Arizona | $ | — |
| $ | 138 |
| $ | 1,908 |
| $ | — |
| 15 |
| ― |
|
| 138 |
| 1,923 |
| ― |
|
| 2,061 |
| (197 | ) |
| 1984 |
| 8/16/2013 |
| (1) |
| $ | — |
|
| $ | 138 |
|
| $ | 1,908 |
|
| $ | — |
|
| $ | 66 |
|
| $ | — |
|
| $ | 138 |
|
| $ | 1,974 |
|
| $ | — |
|
| $ | 2,112 |
|
| $ | (234 | ) |
| 1984 |
| 8/16/2013 |
|
| (1) |
| |||
|
|
|
|
|
|
|
|
|
|
|
|
|
|
|
|
|
|
|
|
|
|
|
|
|
|
|
|
|
|
|
|
|
|
| |||||||||||||||||||||||||||||||||||||||||||||||||||||||
North Mountain Medical Plaza |
|
|
|
|
|
|
|
|
|
|
|
|
|
|
|
|
|
|
|
|
|
|
|
|
|
|
|
|
|
|
|
|
|
|
|
|
|
|
|
|
|
|
|
|
|
|
|
|
|
|
|
|
|
|
|
|
|
|
|
|
|
|
|
|
|
|
|
|
|
|
|
|
|
|
|
|
|
|
|
|
|
|
|
|
|
| |||
Phoenix, Arizona | $ | — |
| $ | 297 |
| $ | 4,079 |
| $ | — |
| 78 |
| ― |
|
| 297 |
| 4,157 |
| ― |
|
| 4,454 |
| (415 | ) |
| 1994 |
| 8/16/2013 |
| (1) |
| $ | — |
|
| $ | 297 |
|
| $ | 4,079 |
|
| $ | — |
|
| $ | 168 |
|
| $ | — |
|
| $ | 297 |
|
| $ | 4,247 |
|
| $ | — |
|
| $ | 4,544 |
|
| $ | (541 | ) |
| 1994 |
| 8/16/2013 |
|
| (1) |
| |||
|
|
|
|
|
|
|
|
|
|
|
|
|
|
|
|
|
|
|
|
|
|
|
|
|
|
|
|
|
|
|
|
|
|
| |||||||||||||||||||||||||||||||||||||||||||||||||||||||
Raider Ranch |
|
|
|
|
|
|
|
|
|
|
|
|
|
|
|
|
|
|
|
|
|
|
|
|
|
|
|
|
|
|
|
|
|
|
|
|
|
|
|
|
|
|
|
|
|
|
|
|
|
|
|
|
|
|
|
|
|
|
|
|
|
|
|
|
|
|
|
|
|
|
|
|
|
|
|
|
|
|
|
|
|
|
|
|
|
| |||
Lubbock, Texas | $ | — |
| $ | 4,992 |
| $ | 48,818 |
| $ | 436 |
| 12,077 |
| ― |
|
| 5,428 |
| 60,895 |
| ― |
|
| 66,323 |
| (4,628 | ) |
| 2009 |
| 8/29/2013 |
| (1) |
| $ | — |
|
| $ | 4,992 |
|
| $ | 48,818 |
|
| $ | 481 |
|
| $ | 12,077 |
|
| $ | — |
|
| $ | 5,473 |
|
| $ | 60,895 |
|
| $ | — |
|
| $ | 66,368 |
|
| $ | (6,256 | ) |
| 2009 |
| 8/29/2013 |
|
| (1) |
| |||
149
CNL HEALTHCARE PROPERTIES, INC. AND SUBSIDIARIES
SCHEDULE III – REAL ESTATE AND ACCUMULATED DEPRECIATION
AS OF DECEMBER 31, 20162017 (in thousands)
|
|
|
| Initial Costs |
| Costs Capitalized Subsequent to Acquisition |
| Gross Amounts at which Carried at Close of Period (2) |
|
|
|
|
|
|
|
|
|
|
|
|
|
|
| Initial Costs |
|
| Costs Capitalized Subsequent to Acquisition |
|
| Gross Amounts at which Carried at Close of Period (2) |
|
|
|
|
|
|
|
|
|
| Life on which depreciation in latest income statement is computed |
| |||||||||||||||||||||||||||||||||||||||||||||||
Property/Location | Encum- brances |
| Land & Land Improve- ments |
| Building and Building Improve- ments |
| Land & Land Improve- ments |
| Building and Building Improve- ments |
| Construc- tion in Process |
| Land & Land Improve- ments |
| Building and Building Improve- ments |
| Construc- tion in Process |
| Total |
| Accumu-lated Depreci-ation |
|
| Date of Construction |
| Date Acquired |
| Life on which depreciation in latest income statement is computed |
| Encum- brances |
|
| Land & Land Improve- ments |
|
| Building and Building Improve- ments |
|
| Land & Land Improve- ments |
|
| Building and Building Improve- ments |
|
| Construc- tion in Process |
|
| Land & Land Improve- ments |
|
| Building and Building Improve- ments |
|
| Construc- tion in Process |
|
| Total |
|
| Accumu- lated Depreci- ation |
|
| Date of Construction |
| Date Acquired |
|
| ||||||||||||||||||||||
Town Village |
|
|
|
|
|
|
|
|
|
|
|
|
|
|
|
|
|
|
|
|
|
|
|
|
|
|
|
|
|
|
|
|
|
|
|
|
|
|
|
|
|
|
|
|
|
|
|
|
|
|
|
|
|
|
|
|
|
|
|
|
|
|
|
|
|
|
|
|
|
|
|
|
|
|
|
|
|
|
|
|
|
|
|
|
|
|
| ||
Oklahoma City, Oklahoma | $ | — |
| $ | 1,020 |
| $ | 19,847 |
| $ | — |
| 1,356 |
| ― |
|
| 1,020 |
|
| 21,203 |
| ― |
|
| 22,223 |
| (1,738 | ) |
| 2004 |
| 8/29/2013 |
| (1) |
| $ | — |
|
| $ | 1,020 |
|
| $ | 19,847 |
|
| $ | 76 |
|
| $ | 1,271 |
|
| $ | — |
|
| $ | 1,096 |
|
| $ | 21,118 |
|
| $ | — |
|
| $ | 22,214 |
|
| $ | (2,348 | ) |
| 2004 |
| 8/29/2013 |
|
| (1) |
| ||
|
|
|
|
|
|
|
|
|
|
|
|
|
|
|
|
|
|
|
|
|
|
|
|
|
|
|
|
|
|
|
|
|
|
|
| ||||||||||||||||||||||||||||||||||||||||||||||||||||||
Calvert Medical Arts Center |
|
|
|
|
|
|
|
|
|
|
|
|
|
|
|
|
|
|
|
|
|
|
|
|
|
|
|
|
|
|
|
|
|
|
|
|
|
|
|
|
|
|
|
|
|
|
|
|
|
|
|
|
|
|
|
|
|
|
|
|
|
|
|
|
|
|
|
|
|
|
|
|
|
|
|
|
|
|
|
|
|
|
|
|
|
|
| ||
Prince Frederick, Maryland ("Washington D.C.") | $ | 12,233 |
| $ | 20 |
| $ | 17,838 |
| $ | 1 |
| 86 |
| ― |
|
| 21 |
|
| 17,924 |
| ― |
|
| 17,945 |
| (1,541 | ) |
| 2009 |
| 8/30/2013 |
| (1) |
| $ | 12,030 |
|
| $ | 20 |
|
| $ | 17,838 |
|
| $ | 1 |
|
| $ | 86 |
|
| $ | — |
|
| $ | 21 |
|
| $ | 17,924 |
|
| $ | — |
|
| $ | 17,945 |
|
| $ | (2,004 | ) |
| 2009 |
| 8/30/2013 |
|
| (1) |
| ||
|
|
|
|
|
|
|
|
|
|
|
|
|
|
|
|
|
|
|
|
|
|
|
|
|
|
|
|
|
|
|
|
|
|
|
| ||||||||||||||||||||||||||||||||||||||||||||||||||||||
Calvert MOBs I, II & III |
|
|
|
|
|
|
|
|
|
|
|
|
|
|
|
|
|
|
|
|
|
|
|
|
|
|
|
|
|
|
|
|
|
|
|
|
|
|
|
|
|
|
|
|
|
|
|
|
|
|
|
|
|
|
|
|
|
|
|
|
|
|
|
|
|
|
|
|
|
|
|
|
|
|
|
|
|
|
|
|
|
|
|
|
|
|
| ||
Prince Frederick, Maryland ("Washington D.C.") | $ | 10,390 |
| $ | 51 |
| $ | 14,334 |
| $ | — |
| 273 |
| ― |
|
| 51 |
|
| 14,607 |
| ― |
|
| 14,658 |
| (1,278 | ) |
| 1991/1999/2000 |
| 8/30/2013 |
| (1) |
| $ | 10,217 |
|
| $ | 51 |
|
| $ | 14,334 |
|
| $ | — |
|
| $ | 286 |
|
| $ | — |
|
| $ | 51 |
|
| $ | 14,620 |
|
| $ | — |
|
| $ | 14,671 |
|
| $ | (1,667 | ) |
| 1991/1999/2000 |
| 8/30/2013 |
|
| (1) |
| ||
|
|
|
|
|
|
|
|
|
|
|
|
|
|
|
|
|
|
|
|
|
|
|
|
|
|
|
|
|
|
|
|
|
|
|
| ||||||||||||||||||||||||||||||||||||||||||||||||||||||
Dunkirk Medical Center |
|
|
|
|
|
|
|
|
|
|
|
|
|
|
|
|
|
|
|
|
|
|
|
|
|
|
|
|
|
|
|
|
|
|
|
|
|
|
|
|
|
|
|
|
|
|
|
|
|
|
|
|
|
|
|
|
|
|
|
|
|
|
|
|
|
|
|
|
|
|
|
|
|
|
|
|
|
|
|
|
|
|
|
|
|
|
| ||
Dunkirk, Maryland ("Washington D.C.") | $ | 2,923 |
| $ | 351 |
| $ | 2,991 |
| $ | 20 |
| 25 |
| ― |
|
| 371 |
|
| 3,016 |
| ― |
|
| 3,387 |
| (337 | ) |
| 1997 |
| 8/30/2013 |
| (1) |
| $ | 2,875 |
|
| $ | 351 |
|
| $ | 2,991 |
|
| $ | 20 |
|
| $ | 25 |
|
| $ | — |
|
| $ | 371 |
|
| $ | 3,016 |
|
| $ | — |
|
| $ | 3,387 |
|
| $ | (441 | ) |
| 1997 |
| 8/30/2013 |
|
| (1) |
| ||
|
|
|
|
|
|
|
|
|
|
|
|
|
|
|
|
|
|
|
|
|
|
|
|
|
|
|
|
|
|
|
|
|
|
|
| ||||||||||||||||||||||||||||||||||||||||||||||||||||||
Prestige Senior Living Beaverton Hills |
|
|
|
|
|
|
|
|
|
|
|
|
|
|
|
|
|
|
|
|
|
|
|
|
|
|
|
|
|
|
|
|
|
|
|
|
|
|
|
|
|
|
|
|
|
|
|
|
|
|
|
|
|
|
|
|
|
|
|
|
|
|
|
|
|
|
|
|
|
|
|
|
|
|
|
|
|
|
|
|
|
|
|
|
|
|
| ||
Beaverton, Oregon ("Portland") | $ | 8,994 |
| $ | 1,387 |
| $ | 10,324 |
| $ | — |
| ― |
| ― |
|
| 1,387 |
|
| 10,324 |
| ― |
|
| 11,711 |
| (857 | ) |
| 2000 |
| 12/2/2013 |
| (1) |
| $ | 9,010 |
|
| $ | 1,387 |
|
| $ | 10,324 |
|
| $ | — |
|
| $ | — |
|
| $ | — |
|
| $ | 1,387 |
|
| $ | 10,324 |
|
| $ | — |
|
| $ | 11,711 |
|
| $ | (1,135 | ) |
| 2000 |
| 12/2/2013 |
|
| (1) |
| ||
|
|
|
|
|
|
|
|
|
|
|
|
|
|
|
|
|
|
|
|
|
|
|
|
|
|
|
|
|
|
|
|
|
|
|
| ||||||||||||||||||||||||||||||||||||||||||||||||||||||
Prestige Senior Living High Desert |
|
|
|
|
|
|
|
|
|
|
|
|
|
|
|
|
|
|
|
|
|
|
|
|
|
|
|
|
|
|
|
|
|
|
|
|
|
|
|
|
|
|
|
|
|
|
|
|
|
|
|
|
|
|
|
|
|
|
|
|
|
|
|
|
|
|
|
|
|
|
|
|
|
|
|
|
|
|
|
|
|
|
|
|
|
|
| ||
Bend, Oregon | $ | 7,780 |
| $ | 835 |
| $ | 11,252 |
| $ | 13 |
| ― |
| ― |
|
| 848 |
|
| 11,252 |
| ― |
|
| 12,100 |
| (971 | ) |
| 2003 |
| 12/2/2013 |
| (1) |
| $ | 7,887 |
|
| $ | 835 |
|
| $ | 11,252 |
|
| $ | 13 |
|
| $ | — |
|
| $ | — |
|
| $ | 848 |
|
| $ | 11,252 |
|
| $ | — |
|
| $ | 12,100 |
|
| $ | (1,286 | ) |
| 2003 |
| 12/2/2013 |
|
| (1) |
| ||
|
|
|
|
|
|
|
|
|
|
|
|
|
|
|
|
|
|
|
|
|
|
|
|
|
|
|
|
|
|
|
|
|
|
|
| ||||||||||||||||||||||||||||||||||||||||||||||||||||||
MorningStar of Billings |
|
|
|
|
|
|
|
|
|
|
|
|
|
|
|
|
|
|
|
|
|
|
|
|
|
|
|
|
|
|
|
|
|
|
|
|
|
|
|
|
|
|
|
|
|
|
|
|
|
|
|
|
|
|
|
|
|
|
|
|
|
|
|
|
|
|
|
|
|
|
|
|
|
|
|
|
|
|
|
|
|
|
|
|
|
|
| ||
Billings, Montana | $ | 19,161 |
| $ | 4,067 |
| $ | 41,373 |
| $ | 14 |
| 68 |
| ― |
|
| 4,081 |
|
| 41,441 |
| ― |
|
| 45,522 |
| (3,616 | ) |
| 2009 |
| 12/2/2013 |
| (1) |
| $ | 19,732 |
|
| $ | 4,067 |
|
| $ | 41,373 |
|
| $ | 17 |
|
| $ | 80 |
|
| $ | — |
|
| $ | 4,084 |
|
| $ | 41,453 |
|
| $ | — |
|
| $ | 45,537 |
|
| $ | (4,793 | ) |
| 2009 |
| 12/2/2013 |
|
| (1) |
| ||
|
|
|
|
|
|
|
|
|
|
|
|
|
|
|
|
|
|
|
|
|
|
|
|
|
|
|
|
|
|
|
|
|
|
|
| ||||||||||||||||||||||||||||||||||||||||||||||||||||||
MorningStar of Boise |
|
|
|
|
|
|
|
|
|
|
|
|
|
|
|
|
|
|
|
|
|
|
|
|
|
|
|
|
|
|
|
|
|
|
|
|
|
|
|
|
|
|
|
|
|
|
|
|
|
|
|
|
|
|
|
|
|
|
|
|
|
|
|
|
|
|
|
|
|
|
|
|
|
|
|
|
|
|
|
|
|
|
|
|
|
|
| ||
Boise, Idaho | $ | 20,453 |
| $ | 1,663 |
| $ | 35,752 |
| $ | 12 |
| ― |
| ― |
|
| 1,675 |
|
| 35,752 |
| ― |
|
| 37,427 |
| (2,947 | ) |
| 2007 |
| 12/2/2013 |
| (1) |
| $ | 21,142 |
|
| $ | 1,663 |
|
| $ | 35,752 |
|
| $ | 12 |
|
| $ | 80 |
|
| $ | — |
|
| $ | 1,675 |
|
| $ | 35,832 |
|
| $ | — |
|
| $ | 37,507 |
|
| $ | (3,904 | ) |
| 2007 |
| 12/2/2013 |
|
| (1) |
| ||
|
|
|
|
|
|
|
|
|
|
|
|
|
|
|
|
|
|
|
|
|
|
|
|
|
|
|
|
|
|
|
|
|
|
|
| ||||||||||||||||||||||||||||||||||||||||||||||||||||||
Prestige Senior Living Huntington Terrace |
|
|
|
|
|
|
|
|
|
|
|
|
|
|
|
|
|
|
|
|
|
|
|
|
|
|
|
|
|
|
|
|
|
|
|
|
|
|
|
|
|
|
|
|
|
|
|
|
|
|
|
|
|
|
|
|
|
|
|
|
|
|
|
|
|
|
|
|
|
|
|
|
|
|
|
|
|
|
|
|
|
|
|
|
|
|
| ||
Gresham, Oregon ("Portland") | $ | 9,962 |
| $ | 1,236 |
| $ | 12,083 |
| $ | 2 |
| 11 |
| ― |
|
| 1,238 |
|
| 12,094 |
| ― |
|
| 13,332 |
| (1,019 | ) |
| 2000 |
| 12/2/2013 |
| (1) |
| $ | 10,107 |
|
| $ | 1,236 |
|
| $ | 12,083 |
|
| $ | 2 |
|
| $ | 45 |
|
| $ | — |
|
| $ | 1,238 |
|
| $ | 12,128 |
|
| $ | — |
|
| $ | 13,366 |
|
| $ | (1,350 | ) |
| 2000 |
| 12/2/2013 |
|
| (1) |
| ||
|
|
|
|
|
|
|
|
|
|
|
|
|
|
|
|
|
|
|
|
|
|
|
|
|
|
|
|
|
|
|
|
|
|
|
| ||||||||||||||||||||||||||||||||||||||||||||||||||||||
MorningStar of Idaho Falls |
|
|
|
|
|
|
|
|
|
|
|
|
|
|
|
|
|
|
|
|
|
|
|
|
|
|
|
|
|
|
|
|
|
|
|
|
|
|
|
|
|
|
|
|
|
|
|
|
|
|
|
|
|
|
|
|
|
|
|
|
|
|
|
|
|
|
|
|
|
|
|
|
|
|
|
|
|
|
|
|
|
|
|
|
|
|
| ||
Idaho Falls, Idaho | $ | 17,498 |
| $ | 2,006 |
| $ | 40,397 |
| $ | 5 |
| 68 |
| ― |
|
| 2,011 |
|
| 40,465 |
| ― |
|
| 42,476 |
| (3,398 | ) |
| 2009 |
| 12/2/2013 |
| (1) |
| $ | 17,617 |
|
| $ | 2,006 |
|
| $ | 40,397 |
|
| $ | 5 |
|
| $ | 159 |
|
| $ | — |
|
| $ | 2,011 |
|
| $ | 40,556 |
|
| $ | — |
|
| $ | 42,567 |
|
| $ | (4,506 | ) |
| 2009 |
| 12/2/2013 |
|
| (1) |
| ||
|
|
|
|
|
|
|
|
|
|
|
|
|
|
|
|
|
|
|
|
|
|
|
|
|
|
|
|
|
|
|
|
|
|
|
| ||||||||||||||||||||||||||||||||||||||||||||||||||||||
Prestige Senior Living Arbor Place |
|
|
|
|
|
|
|
|
|
|
|
|
|
|
|
|
|
|
|
|
|
|
|
|
|
|
|
|
|
|
|
|
|
|
|
|
|
|
|
|
|
|
|
|
|
|
|
|
|
|
|
|
|
|
|
|
|
|
|
|
|
|
|
|
|
|
|
|
|
|
|
|
|
|
|
|
|
|
|
|
|
|
|
|
|
|
| ||
Medford, Oregon | $ | 8,009 |
| $ | 355 |
| $ | 14,083 |
| $ | — |
| ― |
| ― |
|
| 355 |
|
| 14,083 |
| ― |
|
| 14,438 |
| (1,157 | ) |
| 2003 |
| 12/2/2013 |
| (1) |
| $ | 8,306 |
|
| $ | 355 |
|
| $ | 14,083 |
|
| $ | — |
|
| $ | — |
|
| $ | — |
|
| $ | 355 |
|
| $ | 14,083 |
|
| $ | — |
|
| $ | 14,438 |
|
| $ | (1,532 | ) |
| 2003 |
| 12/2/2013 |
|
| (1) |
| ||
|
|
|
|
|
|
|
|
|
|
|
|
|
|
|
|
|
|
|
|
|
|
|
|
|
|
|
|
|
|
|
|
|
|
|
| ||||||||||||||||||||||||||||||||||||||||||||||||||||||
Prestige Senior Living Orchard Heights |
|
|
|
|
|
|
|
|
|
|
|
|
|
|
|
|
|
|
|
|
|
|
|
|
|
|
|
|
|
|
|
|
|
|
|
|
|
|
|
|
|
|
|
|
|
|
|
|
|
|
|
|
|
|
|
|
|
|
|
|
|
|
|
|
|
|
|
|
|
|
|
|
|
|
|
|
|
|
|
|
|
|
|
|
|
|
| ||
Salem, Oregon | $ | 12,030 |
| $ | 545 |
| $ | 15,544 |
| $ | 6 |
| 71 |
| ― |
|
| 551 |
|
| 15,615 |
| ― |
|
| 16,166 |
| (1,270 | ) |
| 2002 |
| 12/2/2013 |
| (1) |
| $ | 12,122 |
|
| $ | 545 |
|
| $ | 15,544 |
|
| $ | 6 |
|
| $ | 81 |
|
| $ | — |
|
| $ | 551 |
|
| $ | 15,625 |
|
| $ | — |
|
| $ | 16,176 |
|
| $ | (1,686 | ) |
| 2002 |
| 12/2/2013 |
|
| (1) |
| ||
|
|
|
|
|
|
|
|
|
|
|
|
|
|
|
|
|
|
|
|
|
|
|
|
|
|
|
|
|
|
|
|
|
|
|
| ||||||||||||||||||||||||||||||||||||||||||||||||||||||
Prestige Senior Living Southern Hills |
|
|
|
|
|
|
|
|
|
|
|
|
|
|
|
|
|
|
|
|
|
|
|
|
|
|
|
|
|
|
|
|
|
|
|
|
|
|
|
|
|
|
|
|
|
|
|
|
|
|
|
|
|
|
|
|
|
|
|
|
|
|
|
|
|
|
|
|
|
|
|
|
|
|
|
|
|
|
|
|
|
|
|
|
|
|
| ||
Salem, Oregon | $ | 7,311 |
| $ | 653 |
| $ | 10,753 |
| $ | 31 |
| ― |
| ― |
|
| 684 |
|
| 10,753 |
| ― |
|
| 11,437 |
| (896 | ) |
| 2001 |
| 12/2/2013 |
| (1) |
| $ | 7,560 |
|
| $ | 653 |
|
| $ | 10,753 |
|
| $ | 34 |
|
| $ | 2 |
|
| $ | — |
|
| $ | 687 |
|
| $ | 10,755 |
|
| $ | — |
|
| $ | 11,442 |
|
| $ | (1,189 | ) |
| 2001 |
| 12/2/2013 |
|
| (1) |
| ||
|
|
|
|
|
|
|
|
|
|
|
|
|
|
|
|
|
|
|
|
|
|
|
|
|
|
|
|
|
|
|
|
|
|
|
| ||||||||||||||||||||||||||||||||||||||||||||||||||||||
MorningStar of Sparks |
|
|
|
|
|
|
|
|
|
|
|
|
|
|
|
|
|
|
|
|
|
|
|
|
|
|
|
|
|
|
|
|
|
|
|
|
|
|
|
|
|
|
|
|
|
|
|
|
|
|
|
|
|
|
|
|
|
|
|
|
|
|
|
|
|
|
|
|
|
|
|
|
|
|
|
|
|
|
|
|
|
|
|
|
|
|
| ||
Sparks, Nevada ("Reno") | $ | 23,191 |
| $ | 3,986 |
| $ | 47,968 |
| $ | 3 |
| 23 |
| ― |
|
| 3,989 |
|
| 47,991 |
| ― |
|
| 51,980 |
| (4,070 | ) |
| 2009 |
| 12/2/2013 |
| (1) |
| $ | 23,435 |
|
| $ | 3,986 |
|
| $ | 47,968 |
|
| $ | 3 |
|
| $ | 23 |
|
| $ | — |
|
| $ | 3,989 |
|
| $ | 47,991 |
|
| $ | — |
|
| $ | 51,980 |
|
| $ | (5,392 | ) |
| 2009 |
| 12/2/2013 |
|
| (1) |
| ||
|
|
|
|
|
|
|
|
| �� |
|
|
|
|
|
|
|
|
|
|
|
|
|
|
|
|
|
|
|
|
|
|
|
|
|
| ||||||||||||||||||||||||||||||||||||||||||||||||||||||
Prestige Senior Living Five Rivers |
|
|
|
|
|
|
|
|
|
|
|
|
|
|
|
|
|
|
|
|
|
|
|
|
|
|
|
|
|
|
|
|
|
|
|
|
|
|
|
|
|
|
|
|
|
|
|
|
|
|
|
|
|
|
|
|
|
|
|
|
|
|
|
|
|
|
|
|
|
|
|
|
|
|
|
|
|
|
|
|
|
|
|
|
|
|
| ||
Tillamook, Oregon | $ | 7,536 |
| $ | 1,298 |
| $ | 14,064 |
| $ | 5 |
| 49 |
| ― |
|
| 1,303 |
|
| 14,113 |
| ― |
|
| 15,416 |
| (1,241 | ) |
| 2002 |
| 12/2/2013 |
| (1) |
| $ | 7,752 |
|
| $ | 1,298 |
|
| $ | 14,064 |
|
| $ | 5 |
|
| $ | 125 |
|
| $ | — |
|
| $ | 1,303 |
|
| $ | 14,189 |
|
| $ | — |
|
| $ | 15,492 |
|
| $ | (1,644 | ) |
| 2002 |
| 12/2/2013 |
|
| (1) |
| ||
|
|
|
|
|
|
|
|
|
|
|
|
|
|
|
|
|
|
|
|
|
|
|
|
|
|
|
|
|
|
|
|
|
|
|
| ||||||||||||||||||||||||||||||||||||||||||||||||||||||
Prestige Senior Living Riverwood |
|
|
|
|
|
|
|
|
|
|
|
|
|
|
|
|
|
|
|
|
|
|
|
|
|
|
|
|
|
|
|
|
|
|
|
|
|
|
|
|
|
|
|
|
|
|
|
|
|
|
|
|
|
|
|
|
|
|
|
|
|
|
|
|
|
|
|
|
|
|
|
|
|
|
|
|
|
|
|
|
|
|
|
|
|
|
| ||
Tualatin, Oregon ("Portland") | $ | 4,372 |
| $ | 1,028 |
| $ | 7,429 |
| $ | — |
| 38 |
| ― |
|
| 1,028 |
|
| 7,467 |
| ― |
|
| 8,495 |
| (642 | ) |
| 1999 |
| 12/2/2013 |
| (1) |
| $ | 4,576 |
|
| $ | 1,028 |
|
| $ | 7,429 |
|
| $ | — |
|
| $ | 80 |
|
| $ | — |
|
| $ | 1,028 |
|
| $ | 7,509 |
|
| $ | — |
|
| $ | 8,537 |
|
| $ | (852 | ) |
| 1999 |
| 12/2/2013 |
|
| (1) |
| ||
|
|
|
|
|
|
|
|
|
|
|
|
|
|
|
|
|
|
|
|
|
|
|
|
|
|
|
|
|
|
|
|
|
|
|
| ||||||||||||||||||||||||||||||||||||||||||||||||||||||
Chula Vista Medical Arts Center - Plaza II |
|
|
|
|
|
|
|
|
|
|
|
|
|
|
|
|
|
|
|
|
|
|
|
|
|
|
|
|
|
|
|
|
|
|
|
|
|
|
|
|
|
|
|
|
|
|
|
|
|
|
|
|
|
|
|
|
|
|
|
|
|
|
|
|
|
|
|
|
|
|
|
|
|
|
|
|
|
|
|
|
|
|
|
|
|
|
| ||
Chula Vista, California ("San Diego") | $ | — |
| $ | 2,462 |
| $ | 7,453 |
| $ | 9 |
| 369 |
| ― |
|
| 2,471 |
|
| 7,822 |
| ― |
|
| 10,293 |
| (632 | ) |
| 1985 |
| 12/23/2013 |
| (1) |
| $ | — |
|
| $ | 2,462 |
|
| $ | 7,453 |
|
| $ | 9 |
|
| $ | 369 |
|
| $ | — |
|
| $ | 2,471 |
|
| $ | 7,822 |
|
| $ | — |
|
| $ | 10,293 |
|
| $ | (846 | ) |
| 1985 |
| 12/23/2013 |
|
| (1) |
| ||
|
|
|
|
|
|
|
|
|
|
|
|
|
|
|
| �� |
|
|
|
|
|
|
|
|
|
|
|
|
|
|
|
|
|
|
| ||||||||||||||||||||||||||||||||||||||||||||||||||||||
Coral Springs MOB I |
|
|
|
|
|
|
|
|
|
|
|
|
|
|
|
|
|
|
|
|
|
|
|
|
|
|
|
|
|
|
|
|
|
|
|
|
|
|
|
|
|
|
|
|
|
|
|
|
|
|
|
|
|
|
|
|
|
|
|
|
|
|
|
|
|
|
|
|
|
|
|
|
|
|
|
|
|
|
|
|
|
|
|
|
|
|
| ||
Coral Springs, Florida | $ | — |
| $ | 2,614 |
| $ | 11,220 |
| $ | — |
| ― |
| ― |
|
| 2,614 |
|
| 11,220 |
| ― |
|
| 13,834 |
| (956 | ) |
| 2005 |
| 12/23/2013 |
| (1) |
| $ | — |
|
| $ | 2,614 |
|
| $ | 11,220 |
|
| $ | 1 |
|
| $ | 23 |
|
| $ | — |
|
| $ | 2,615 |
|
| $ | 11,243 |
|
| $ | — |
|
| $ | 13,858 |
|
| $ | (1,327 | ) |
| 2005 |
| 12/23/2013 |
|
| (1) |
| ||
|
|
|
|
|
|
|
|
|
|
|
|
|
|
|
|
|
|
|
|
|
|
|
|
|
|
|
|
|
|
|
|
|
|
|
| ||||||||||||||||||||||||||||||||||||||||||||||||||||||
Coral Springs MOB II |
|
|
|
|
|
|
|
|
|
|
|
|
|
|
|
|
|
|
|
|
|
|
|
|
|
|
|
|
|
|
|
|
|
|
|
|
|
|
|
|
|
|
|
|
|
|
|
|
|
|
|
|
|
|
|
|
|
|
|
|
|
|
|
|
|
|
|
|
|
|
|
|
|
|
|
|
|
|
|
|
|
|
|
|
|
|
| ||
Coral Springs, Florida | $ | — |
| $ | 2,614 |
| $ | 12,130 |
| $ | 1 |
| ― |
| ― |
|
| 2,615 |
|
| 12,130 |
| ― |
|
| 14,745 |
| (1,034 | ) |
| 2008 |
| 12/23/2013 |
| (1) |
| $ | — |
|
| $ | 2,614 |
|
| $ | 12,130 |
|
| $ | 1 |
|
| $ | 23 |
|
| $ | — |
|
| $ | 2,615 |
|
| $ | 12,153 |
|
| $ | — |
|
| $ | 14,768 |
|
| $ | (1,327 | ) |
| 2008 |
| 12/23/2013 |
|
| (1) |
| ||
150
CNL HEALTHCARE PROPERTIES, INC. AND SUBSIDIARIES
SCHEDULE III – REAL ESTATE AND ACCUMULATED DEPRECIATION
AS OF DECEMBER 31, 20162017 (in thousands)
|
|
|
| Initial Costs |
| Costs Capitalized Subsequent to Acquisition |
| Gross Amounts at which Carried at Close of Period (2) |
|
|
|
|
|
|
|
|
|
|
|
|
|
|
| Initial Costs |
|
| Costs Capitalized Subsequent to Acquisition |
|
| Gross Amounts at which Carried at Close of Period (2) |
|
|
|
|
|
|
|
|
|
| Life on which depreciation |
| |||||||||||||||||||||||||||||||||||||||||||||||
Property/Location | Encum- brances |
| Land & Land Improve- ments |
| Building and Building Improve- ments |
| Land & Land Improve- ments |
| Building and Building Improve- ments |
| Construc- tion in Process |
| Land & Land Improve- ments |
| Building and Building Improve- ments |
| Construc- tion in Process |
| Total |
| Accumu-lated Depreci-ation |
|
| Date of Construction |
| Date Acquired |
| Life on which depreciation in latest income statement is computed |
| Encum- brances |
|
| Land & Land Improve- ments |
|
| Building and Building Improve- ments |
|
| Land & Land Improve- ments |
|
| Building and Building Improve- ments |
|
| Construc- tion in Process |
|
| Land & Land Improve- ments |
|
| Building and Building Improve- ments |
|
| Construc- tion in Process |
|
| Total |
|
| Accumu-lated Depreci-ation |
|
| Date of Construction |
| Date Acquired |
| in latest income statement is computed |
| |||||||||||||||||||||
Chula Vista Medical Arts Center - Plaza I |
|
|
|
|
|
|
|
|
|
|
|
|
|
|
|
|
|
|
|
|
|
|
|
|
|
|
|
|
|
|
|
|
|
|
|
|
|
|
|
|
|
|
|
|
|
|
|
|
|
|
|
|
|
|
|
|
|
|
|
|
|
|
|
|
|
|
|
|
|
|
|
|
|
|
|
|
|
|
|
|
|
|
|
|
| ||||
Chula Vista, California ("San Diego") | $ | — |
| $ | 6,130 |
| $ | 10,293 |
| $ | 14 |
| 200 |
| ― |
|
| 6,144 |
| 10,493 |
| ― |
|
| 16,637 |
| (832 | ) |
| 1975 |
| 1/21/2014 |
| (1) |
| $ | — |
|
| $ | 6,130 |
|
| $ | 10,293 |
|
| $ | 14 |
|
| $ | 285 |
|
| $ | — |
|
| $ | 6,144 |
|
| $ | 10,578 |
|
| $ | — |
|
| $ | 16,722 |
|
| $ | (1,124 | ) |
| 1975 |
| 1/21/2014 |
|
| (1) |
| |||
|
|
|
|
|
|
|
|
|
|
|
|
|
|
|
|
|
|
|
|
|
|
|
|
|
|
|
|
|
|
|
|
|
|
| |||||||||||||||||||||||||||||||||||||||||||||||||||||||
Prestige Senior Living Auburn Meadows |
|
|
|
|
|
|
|
|
|
|
|
|
|
|
|
|
|
|
|
|
|
|
|
|
|
|
|
|
|
|
|
|
|
|
|
|
|
|
|
|
|
|
|
|
|
|
|
|
|
|
|
|
|
|
|
|
|
|
|
|
|
|
|
|
|
|
|
|
|
|
|
|
|
|
|
|
|
|
|
|
|
|
|
|
|
| |||
Auburn, Washington ("Seattle") | $ | 10,278 |
| $ | 2,537 |
| $ | 17,261 |
| $ | — |
| 3 |
| ― |
|
| 2,537 |
| 17,264 |
| ― |
|
| 19,801 |
| (1,377 | ) |
| 2003/2010 |
| 2/3/2014 |
| (1) |
| $ | 10,560 |
|
| $ | 2,537 |
|
| $ | 17,261 |
|
| $ | — |
|
| $ | 142 |
|
| $ | — |
|
| $ | 2,537 |
|
| $ | 17,403 |
|
| $ | — |
|
| $ | 19,940 |
|
| $ | (1,855 | ) |
| 2003/2010 |
| 2/3/2014 |
|
| (1) |
| |||
|
|
|
|
|
|
|
|
|
|
|
|
|
|
|
|
|
|
|
|
|
|
|
|
|
|
|
|
|
|
|
|
|
|
| |||||||||||||||||||||||||||||||||||||||||||||||||||||||
Prestige Senior Living Bridgewood |
|
|
|
|
|
|
|
|
|
|
|
|
|
|
|
|
|
|
|
|
|
|
|
|
|
|
|
|
|
|
|
|
|
|
|
|
|
|
|
|
|
|
|
|
|
|
|
|
|
|
|
|
|
|
|
|
|
|
|
|
|
|
|
|
|
|
|
|
|
|
|
|
|
|
|
|
|
|
|
|
|
|
|
|
|
| |||
Vancouver, Washington ("Portland") | $ | 12,849 |
| $ | 1,603 |
| $ | 18,172 |
| $ | — |
| ― |
| ― |
|
| 1,603 |
| 18,172 |
| ― |
|
| 19,775 |
| (1,437 | ) |
| 2001 |
| 2/3/2014 |
| (1) |
| $ | 13,292 |
|
| $ | 1,603 |
|
| $ | 18,172 |
|
| $ | — |
|
| $ | — |
|
| $ | — |
|
| $ | 1,603 |
|
| $ | 18,172 |
|
| $ | — |
|
| $ | 19,775 |
|
| $ | (1,930 | ) |
| 2001 |
| 2/3/2014 |
|
| (1) |
| |||
|
|
|
|
|
|
|
|
|
|
|
|
|
|
|
|
|
|
|
|
|
|
|
|
|
|
|
|
|
|
|
|
|
|
| |||||||||||||||||||||||||||||||||||||||||||||||||||||||
Prestige Senior Living Monticello Park |
|
|
|
|
|
|
|
|
|
|
|
|
|
|
|
|
|
|
|
|
|
|
|
|
|
|
|
|
|
|
|
|
|
|
|
|
|
|
|
|
|
|
|
|
|
|
|
|
|
|
|
|
|
|
|
|
|
|
|
|
|
|
|
|
|
|
|
|
|
|
|
|
|
|
|
|
|
|
|
|
|
|
|
|
|
| |||
Longview, Washington | $ | 17,927 |
| $ | 1,981 |
| $ | 23,056 |
| $ | — |
| ― |
| ― |
|
| 1,981 |
| 23,056 |
| ― |
|
| 25,037 |
| (1,800 | ) |
| 2001/2010 |
| 2/3/2014 |
| (1) |
| $ | 17,752 |
|
| $ | 1,981 |
|
| $ | 23,056 |
|
| $ | — |
|
| $ | — |
|
| $ | — |
|
| $ | 1,981 |
|
| $ | 23,056 |
|
| $ | — |
|
| $ | 25,037 |
|
| $ | (2,418 | ) |
| 2001/2010 |
| 2/3/2014 |
|
| (1) |
| |||
|
|
|
|
|
|
|
|
|
|
|
|
|
|
|
|
|
|
|
|
|
|
|
|
|
|
|
|
|
|
|
|
|
|
| |||||||||||||||||||||||||||||||||||||||||||||||||||||||
Prestige Senior Living Rosemont |
|
|
|
|
|
|
|
|
|
|
|
|
|
|
|
|
|
|
|
|
|
|
|
|
|
|
|
|
|
|
|
|
|
|
|
|
|
|
|
|
|
|
|
|
|
|
|
|
|
|
|
|
|
|
|
|
|
|
|
|
|
|
|
|
|
|
|
|
|
|
|
|
|
|
|
|
|
|
|
|
|
|
|
|
|
| |||
Yelm, Washington | $ | 9,258 |
| $ | 668 |
| $ | 14,564 |
| $ | — |
| ― |
| ― |
|
| 668 |
| 14,564 |
| ― |
|
| 15,232 |
| (1,124 | ) |
| 2004 |
| 2/3/2014 |
| (1) |
| $ | 9,330 |
|
| $ | 668 |
|
| $ | 14,564 |
|
| $ | — |
|
| $ | 26 |
|
| $ | — |
|
| $ | 668 |
|
| $ | 14,590 |
|
| $ | — |
|
| $ | 15,258 |
|
| $ | (1,511 | ) |
| 2004 |
| 2/3/2014 |
|
| (1) |
| |||
|
|
|
|
|
|
|
|
|
|
|
|
|
|
|
|
|
|
|
|
|
|
|
|
|
|
|
|
|
|
|
|
|
|
| |||||||||||||||||||||||||||||||||||||||||||||||||||||||
Wellmore of Tega Cay |
|
|
|
|
|
|
|
|
|
|
|
|
|
|
|
|
|
|
|
|
|
|
|
|
|
|
|
|
|
|
|
|
|
|
|
|
|
|
|
|
|
|
|
|
|
|
|
|
|
|
|
|
|
|
|
|
|
|
|
|
|
|
|
|
|
|
|
|
|
|
|
|
|
|
|
|
|
|
|
|
|
|
|
|
|
| |||
Tega Cay, South Carolina ("Charlotte") | $ | — |
| $ | 2,445 |
| $ | — |
| $ | 2,740 |
| 23,440 |
| ― |
|
| 5,185 |
| 23,440 |
| ― |
|
| 28,625 |
| (1,176 | ) |
| (3) |
| 2/7/2014 |
| (1) |
| $ | 28,000 |
|
| $ | 2,445 |
|
| $ | — |
|
| $ | 2,740 |
|
| $ | 23,440 |
|
| $ | — |
|
| $ | 5,185 |
|
| $ | 23,440 |
|
| $ | — |
|
| $ | 28,625 |
|
| $ | (1,959 | ) |
| 2015 |
| 2/7/2014 |
|
| (1) |
| |||
|
|
|
|
|
|
|
|
|
|
|
|
|
|
|
|
|
|
|
|
|
|
|
|
|
|
|
|
|
|
|
|
|
|
| |||||||||||||||||||||||||||||||||||||||||||||||||||||||
Isle at Cedar Ridge |
|
|
|
|
|
|
|
|
|
|
|
|
|
|
|
|
|
|
|
|
|
|
|
|
|
|
|
|
|
|
|
|
|
|
|
|
|
|
|
|
|
|
|
|
|
|
|
|
|
|
|
|
|
|
|
|
|
|
|
|
|
|
|
|
|
|
|
|
|
|
|
|
|
|
|
|
|
|
|
|
|
|
|
|
|
| |||
Cedar Park, Texas ("Austin") | $ | — |
| $ | 1,525 |
| $ | 16,277 |
| $ | — |
| 185 |
| ― |
|
| 1,525 |
| 16,462 |
| ― |
|
| 17,987 |
| (1,292 | ) |
| 2011 |
| 2/28/2014 |
| (1) |
| $ | — |
|
| $ | 1,525 |
|
| $ | 16,277 |
|
| $ | — |
|
| $ | 185 |
|
| $ | — |
|
| $ | 1,525 |
|
| $ | 16,462 |
|
| $ | — |
|
| $ | 17,987 |
|
| $ | (1,759 | ) |
| 2011 |
| 2/28/2014 |
|
| (1) |
| |||
|
|
|
|
|
|
|
|
|
|
|
|
|
|
|
|
|
|
|
|
|
|
|
|
|
|
|
|
|
|
|
|
|
|
| |||||||||||||||||||||||||||||||||||||||||||||||||||||||
Prestige Senior Living West Hills |
|
|
|
|
|
|
|
|
|
|
|
|
|
|
|
|
|
|
|
|
|
|
|
|
|
|
|
|
|
|
|
|
|
|
|
|
|
|
|
|
|
|
|
|
|
|
|
|
|
|
|
|
|
|
|
|
|
|
|
|
|
|
|
|
|
|
|
|
|
|
|
|
|
|
|
|
|
|
|
|
|
|
|
|
|
| |||
Corvallis, Oregon | $ | 8,589 |
| $ | 842 |
| $ | 12,603 |
| $ | — |
| ― |
| ― |
|
| 842 |
| 12,603 |
| ― |
|
| 13,445 |
| (995 | ) |
| 2002 |
| 3/3/2014 |
| (1) |
| $ | 8,809 |
|
| $ | 842 |
|
| $ | 12,603 |
|
| $ | — |
|
| $ | — |
|
| $ | — |
|
| $ | 842 |
|
| $ | 12,603 |
|
| $ | — |
|
| $ | 13,445 |
|
| $ | (1,346 | ) |
| 2002 |
| 3/3/2014 |
|
| (1) |
| |||
|
|
|
|
|
|
|
|
|
|
|
|
|
|
|
|
|
|
|
|
|
|
|
|
|
|
|
|
|
|
|
|
|
|
| |||||||||||||||||||||||||||||||||||||||||||||||||||||||
HarborChase of Plainfield |
|
|
|
|
|
|
|
|
|
|
|
|
|
|
|
|
|
|
|
|
|
|
|
|
|
|
|
|
|
|
|
|
|
|
|
|
|
|
|
|
|
|
|
|
|
|
|
|
|
|
|
|
|
|
|
|
|
|
|
|
|
|
|
|
|
|
|
|
|
|
|
|
|
|
|
|
|
|
|
|
|
|
|
|
|
| |||
Plainfield, Illinois | $ | — |
| $ | 1,596 |
| $ | 21,832 |
| $ | — |
| ― |
| ― |
|
| 1,596 |
| 21,832 |
| ― |
|
| 23,428 |
| (1,627 | ) |
| 2010 |
| 3/28/2014 |
| (1) |
| $ | — |
|
| $ | 1,596 |
|
| $ | 21,832 |
|
| $ | — |
|
| $ | — |
|
| $ | — |
|
| $ | 1,596 |
|
| $ | 21,832 |
|
| $ | — |
|
| $ | 23,428 |
|
| $ | (2,219 | ) |
| 2010 |
| 3/28/2014 |
|
| (1) |
| |||
|
|
|
|
|
|
|
|
|
|
|
|
|
|
|
|
|
|
|
|
|
|
|
|
|
|
|
|
|
|
|
|
|
|
| |||||||||||||||||||||||||||||||||||||||||||||||||||||||
Legacy Ranch Alzheimer's Special Care Center |
|
|
|
|
|
|
|
|
|
|
|
|
|
|
|
|
|
|
|
|
|
|
|
|
|
|
|
|
|
|
|
|
|
|
|
|
|
|
|
|
|
|
|
|
|
|
|
|
|
|
|
|
|
|
|
|
|
|
|
|
|
|
|
|
|
|
|
|
|
|
|
|
|
|
|
|
|
|
|
|
|
|
|
|
|
| |||
Midland, Texas | $ | — |
| $ | 917 |
| $ | 9,982 |
| $ | 2 |
| ― |
| ― |
|
| 919 |
| 9,982 |
| ― |
|
| 10,901 |
| (759 | ) |
| 2012 |
| 3/28/2014 |
| (1) |
| $ | — |
|
| $ | 917 |
|
| $ | 9,982 |
|
| $ | — |
|
| $ | — |
|
| $ | — |
|
| $ | 917 |
|
| $ | 9,982 |
|
| $ | — |
|
| $ | 10,899 |
|
| $ | (1,035 | ) |
| 2012 |
| 3/28/2014 |
|
| (1) |
| |||
|
|
|
|
|
|
|
|
|
|
|
|
|
|
|
|
|
|
|
|
|
|
|
|
|
|
|
|
|
|
|
|
|
|
| |||||||||||||||||||||||||||||||||||||||||||||||||||||||
The Springs Alzheimer's Special Care Center |
|
|
|
|
|
|
|
|
|
|
|
|
|
|
|
|
|
|
|
|
|
|
|
|
|
|
|
|
|
|
|
|
|
|
|
|
|
|
|
|
|
|
|
|
|
|
|
|
|
|
|
|
|
|
|
|
|
|
|
|
|
|
|
|
|
|
|
|
|
|
|
|
|
|
|
|
|
|
|
|
|
|
|
|
|
| |||
San Angelo, Texas | $ | — |
| $ | 595 |
| $ | 9,658 |
| $ | — |
| ― |
| ― |
|
| 595 |
| 9,658 |
| ― |
|
| 10,253 |
| (734 | ) |
| 2012 |
| 3/28/2014 |
| (1) |
| $ | — |
|
| $ | 595 |
|
| $ | 9,658 |
|
| $ | — |
|
| $ | — |
|
| $ | — |
|
| $ | 595 |
|
| $ | 9,658 |
|
| $ | — |
|
| $ | 10,253 |
|
| $ | (1,000 | ) |
| 2012 |
| 3/28/2014 |
|
| (1) |
| |||
|
|
|
|
|
|
|
|
|
|
|
|
|
|
|
|
|
|
|
|
|
|
|
|
|
|
|
|
|
|
|
|
|
|
| |||||||||||||||||||||||||||||||||||||||||||||||||||||||
Isle at Watercrest - Bryan |
|
|
|
|
|
|
|
|
|
|
|
|
|
|
|
|
|
|
|
|
|
|
|
|
|
|
|
|
|
|
|
|
|
|
|
|
|
|
|
|
|
|
|
|
|
|
|
|
|
|
|
|
|
|
|
|
|
|
|
|
|
|
|
|
|
|
|
|
|
|
|
|
|
|
|
|
|
|
|
|
|
|
|
|
|
| |||
Bryan, Texas | $ | — |
| $ | 714 |
| $ | 18,140 |
| $ | 5 |
| 212 |
| ― |
|
| 719 |
| 18,352 |
| ― |
|
| 19,071 |
| (1,298 | ) |
| 2011 |
| 4/21/2014 |
| (1) |
| $ | — |
|
| $ | 3,223 |
|
| $ | 40,581 |
|
| $ | 23 |
|
| $ | 703 |
|
| $ | — |
|
| $ | 3,246 |
|
| $ | 41,284 |
|
| $ | — |
|
| $ | 44,530 |
|
| $ | (4,197 | ) |
| 2011 |
| 4/21/2014 |
|
| (1) |
| |||
|
|
|
|
|
|
|
|
|
|
|
|
|
|
|
|
|
|
|
|
|
|
|
|
|
|
|
|
|
|
|
|
|
|
| |||||||||||||||||||||||||||||||||||||||||||||||||||||||
Watercrest at Bryan |
|
|
|
|
|
|
|
|
|
|
|
|
|
|
|
|
|
|
|
|
|
|
|
|
|
|
|
|
|
|
|
|
|
| |||||||||||||||||||||||||||||||||||||||||||||||||||||||
Bryan, Texas | $ | — |
| $ | 2,509 |
| $ | 22,441 |
| $ | 4 |
| 96 |
| ― |
|
| 2,513 |
| 22,537 |
| ― |
|
| 25,050 |
| (1,739 | ) |
| 2009 |
| 4/21/2014 |
| (1) | |||||||||||||||||||||||||||||||||||||||||||||||||||||||
|
|
|
|
|
|
|
|
|
|
|
|
|
|
|
|
|
|
|
|
|
|
|
|
|
|
|
|
|
|
|
|
|
|
| |||||||||||||||||||||||||||||||||||||||||||||||||||||||
Isle at Watercrest - Mansfield |
|
|
|
|
|
|
|
|
|
|
|
|
|
|
|
|
|
|
|
|
|
|
|
|
|
|
|
|
|
|
|
|
|
|
|
|
|
|
|
|
|
|
|
|
|
|
|
|
|
|
|
|
|
|
|
|
|
|
|
|
|
|
|
|
|
|
|
|
|
|
|
|
|
|
|
|
|
|
|
|
|
|
|
|
|
| |||
Mansfield, Texas ("Dallas/Fort Worth") | $ | — |
| $ | 997 |
| $ | 24,635 |
| $ | — |
| ― |
| ― |
|
| 997 |
| 24,635 |
| ― |
|
| 25,632 |
| (1,745 | ) |
| 2011 |
| 5/5/2014 |
| (1) |
| $ | — |
|
| $ | 997 |
|
| $ | 24,635 |
|
| $ | — |
|
| $ | — |
|
| $ | — |
|
| $ | 997 |
|
| $ | 24,635 |
|
| $ | — |
|
| $ | 25,632 |
|
| $ | (2,399 | ) |
| 2011 |
| 5/5/2014 |
|
| (1) |
| |||
|
|
|
|
|
|
|
|
|
|
|
|
|
|
|
|
|
|
|
|
|
|
|
|
|
|
|
|
|
|
|
|
|
|
| |||||||||||||||||||||||||||||||||||||||||||||||||||||||
Memorial Hermann Orthopedic & Spine Hospital |
|
|
|
|
|
|
|
|
|
|
|
|
|
|
|
|
|
|
|
|
|
|
|
|
|
|
|
|
|
|
|
|
|
|
|
|
|
|
|
|
|
|
|
|
|
|
|
|
|
|
|
|
|
|
|
|
|
|
|
|
|
|
|
|
|
|
|
|
|
|
|
|
|
|
|
|
|
|
|
|
|
|
|
|
|
| |||
Bellaire, Texas ("Houston") | $ | 30,936 |
| $ | 3,867 |
| $ | 32,761 |
| $ | — |
| ― |
| ― |
|
| 3,867 |
| 32,761 |
| ― |
|
| 36,628 |
| (2,207 | ) |
| 2007 |
| 6/2/2014 |
| (1) |
| $ | 30,349 |
|
| $ | 3,867 |
|
| $ | 32,761 |
|
| $ | — |
|
| $ | — |
|
| $ | — |
|
| $ | 3,867 |
|
| $ | 32,761 |
|
| $ | — |
|
| $ | 36,628 |
|
| $ | (3,061 | ) |
| 2007 |
| 6/2/2014 |
|
| (1) |
| |||
|
|
|
|
|
|
|
|
|
|
|
|
|
|
|
|
|
|
|
|
|
|
|
|
|
|
|
|
|
|
|
|
|
|
| |||||||||||||||||||||||||||||||||||||||||||||||||||||||
MHOSH MOB |
|
|
|
|
|
|
|
|
|
|
|
|
|
|
|
|
|
|
|
|
|
|
|
|
|
|
|
|
|
|
|
|
|
|
|
|
|
|
|
|
|
|
|
|
|
|
|
|
|
|
|
|
|
|
|
|
|
|
|
|
|
|
|
|
|
|
|
|
|
|
|
|
|
|
|
|
|
|
|
|
|
|
|
|
|
| |||
Bellaire, Texas ("Houston") | $ | 17,047 |
| $ | 3,738 |
| $ | 20,525 |
| $ | — |
| 700 |
| ― |
|
| 3,738 |
| 21,225 |
| ― |
|
| 24,963 |
| (1,402 | ) |
| 2007 |
| 6/2/2014 |
| (1) |
| $ | 16,719 |
|
| $ | 3,738 |
|
| $ | 20,525 |
|
| $ | 767 |
|
| $ | 202 |
|
| $ | — |
|
| $ | 4,505 |
|
| $ | 20,727 |
|
| $ | — |
|
| $ | 25,232 |
|
| $ | (1,975 | ) |
| 2007 |
| 6/2/2014 |
|
| (1) |
| |||
|
|
|
|
|
|
|
|
|
|
|
|
|
|
|
|
|
|
|
|
|
|
|
|
|
|
|
|
|
|
|
|
|
|
| |||||||||||||||||||||||||||||||||||||||||||||||||||||||
Watercrest at Katy |
|
|
|
|
|
|
|
|
|
|
|
|
|
|
|
|
|
|
|
|
|
|
|
|
|
|
|
|
|
|
|
|
|
|
|
|
|
|
|
|
|
|
|
|
|
|
|
|
|
|
|
|
|
|
|
|
|
|
|
|
|
|
|
|
|
|
|
|
|
|
|
|
|
|
|
|
|
|
|
|
|
|
|
|
|
| |||
Katy, Texas ("Houston") | $ | 24,047 |
| $ | 4,000 |
| $ | — |
| $ | 90 |
| 32,370 |
| ― |
|
| 4,090 |
| 32,370 |
| ― |
|
| 36,460 |
| (492 | ) |
| (3) |
| 6/27/2014 |
| (1) |
| $ | 26,300 |
|
| $ | 4,000 |
|
| $ | — |
|
| $ | 90 |
|
| $ | 32,358 |
|
| $ | — |
|
| $ | 4,090 |
|
| $ | 32,358 |
|
| $ | — |
|
| $ | 36,448 |
|
| $ | (1,326 | ) |
| 2016 |
| 6/27/2014 |
|
| (1) |
| |||
|
|
|
|
|
|
|
|
|
|
|
|
|
|
|
|
|
|
|
|
|
|
|
|
|
|
|
|
|
|
|
|
|
|
| |||||||||||||||||||||||||||||||||||||||||||||||||||||||
Watercrest at Mansfield |
|
|
|
|
|
|
|
|
|
|
|
|
|
|
|
|
|
|
|
|
|
|
|
|
|
|
|
|
|
|
|
|
|
|
|
|
|
|
|
|
|
|
|
|
|
|
|
|
|
|
|
|
|
|
|
|
|
|
|
|
|
|
|
|
|
|
|
|
|
|
|
|
|
|
|
|
|
|
|
|
|
|
|
|
|
| |||
Mansfield, Texas ("Dallas/Fort Worth") | $ | 26,165 |
| $ | 2,191 |
| $ | 42,740 |
| $ | — |
|
| 56 |
| ― |
|
| 2,191 |
| 42,796 |
| ― |
|
| 44,987 |
| (2,865 | ) |
| 2010 |
| 6/30/2014 |
| (1) |
| $ | 25,676 |
|
| $ | 2,191 |
|
| $ | 42,740 |
|
| $ | — |
|
| $ | 55 |
|
| $ | — |
|
| $ | 2,191 |
|
| $ | 42,795 |
|
| $ | — |
|
| $ | 44,986 |
|
| $ | (4,011 | ) |
| 2010 |
| 6/30/2014 |
|
| (1) |
| ||
151
CNL HEALTHCARE PROPERTIES, INC. AND SUBSIDIARIES
SCHEDULE III – REAL ESTATE AND ACCUMULATED DEPRECIATION
AS OF DECEMBER 31, 20162017 (in thousands)
|
|
|
| Initial Costs |
| Costs Capitalized Subsequent to Acquisition |
| Gross Amounts at which Carried at Close of Period (2) |
|
|
|
|
|
|
|
|
|
|
|
|
|
|
|
|
| Initial Costs |
|
| Costs Capitalized Subsequent to Acquisition |
|
| Gross Amounts at which Carried at Close of Period (2) |
|
|
|
|
|
|
|
|
|
| Life on which depreciation |
| |||||||||||||||||||||||||||||||||||||||||||||||
Property/Location | Encum- brances |
| Land & Land Improve- ments |
| Building and Building Improve- ments |
| Land & Land Improve- ments |
| Building and Building Improve- ments |
| Construc- tion in Process |
| Land & Land Improve- ments |
| Building and Building Improve- ments |
| Construc- tion in Process |
| Total |
| Accumu-lated Depreci-ation |
|
| Date of Construction |
|
| Date Acquired |
| Life on which depreciation in latest income statement is computed |
| Encum- brances |
|
| Land & Land Improve- ments |
|
| Building and Building Improve- ments |
|
| Land & Land Improve- ments |
|
| Building and Building Improve- ments |
|
| Construc- tion in Process |
|
| Land & Land Improve- ments |
|
| Building and Building Improve- ments |
|
| Construc- tion in Process |
|
| Total |
|
| Accumu-lated Depreci-ation |
|
| Date of Construction |
| Date Acquired |
| in latest income statement is computed |
| ||||||||||||||||||||||
HarborChase of Shorewood |
|
|
|
|
|
|
|
|
|
|
|
|
|
|
|
|
|
|
|
|
|
|
|
|
|
|
|
|
|
|
|
|
|
|
|
|
|
|
|
|
|
|
|
|
|
|
|
|
|
|
|
|
|
|
|
|
|
|
|
|
|
|
|
|
|
|
|
|
|
|
|
|
|
|
|
|
|
|
|
|
|
|
|
|
|
| |||||
Shorewood, Wisconsin ("Milwaukee") | $ | 14,755 |
| $ | 2,200 |
| $ | — |
| $ | 296 |
| 19,862 |
| ― |
|
| 2,496 |
| 19,862 |
| ― |
|
| 22,358 |
| (572 | ) |
|
| (3) |
|
| 7/8/2014 |
| (1) |
| $ | 14,706 |
|
| $ | 2,200 |
|
| $ | — |
|
| $ | 296 |
|
| $ | 19,862 |
|
| $ | — |
|
| $ | 2,496 |
|
| $ | 19,862 |
|
| $ | — |
|
| $ | 22,358 |
|
| $ | (1,101 | ) |
| 2015 |
| 7/8/2014 |
|
| (1) |
| |||
|
|
|
|
|
|
|
|
|
|
|
|
|
|
|
|
|
|
|
|
|
|
|
|
|
|
|
|
|
|
|
|
|
|
|
|
| |||||||||||||||||||||||||||||||||||||||||||||||||||||||
Oklahoma City Inpatient Rehabilitation Hospital |
|
|
|
|
|
|
|
|
|
|
|
|
|
|
|
|
|
|
|
|
|
|
|
|
|
|
|
|
|
|
|
|
|
|
|
|
|
|
|
|
|
|
|
|
|
|
|
|
|
|
|
|
|
|
|
|
|
|
|
|
|
|
|
|
|
|
|
|
|
|
|
|
|
|
|
|
|
|
|
|
|
|
|
|
|
|
|
| |||
Oklahoma City, Oklahoma | $ | 15,827 |
| $ | 3,341 |
| $ | 19,249 |
| $ | — |
| ― |
| ― |
|
| 3,341 |
| 19,249 |
| ― |
|
| 22,590 |
| (1,356 | ) |
|
| 2012 |
|
| 7/15/2014 |
| (1) |
| $ | 15,426 |
|
| $ | 3,341 |
|
| $ | 19,249 |
|
| $ | — |
|
| $ | — |
|
| $ | — |
|
| $ | 3,341 |
|
| $ | 19,249 |
|
| $ | — |
|
| $ | 22,590 |
|
| $ | (1,898 | ) |
| 2012 |
| 7/15/2014 |
|
| (1) |
| |||
|
|
|
|
|
|
|
|
|
|
|
|
|
|
|
|
|
|
|
|
|
|
|
|
|
|
|
|
|
|
|
|
|
|
|
|
| |||||||||||||||||||||||||||||||||||||||||||||||||||||||
Las Vegas Inpatient Rehabilitation Hospital |
|
|
|
|
|
|
|
|
|
|
|
|
|
|
|
|
|
|
|
|
|
|
|
|
|
|
|
|
|
|
|
|
|
|
|
|
|
|
|
|
|
|
|
|
|
|
|
|
|
|
|
|
|
|
|
|
|
|
|
|
|
|
|
|
|
|
|
|
|
|
|
|
|
|
|
|
|
|
|
|
|
|
|
|
|
|
|
| |||
Las Vegas, Nevada | $ | 13,835 |
| $ | 2,650 |
| $ | 16,979 |
| $ | — |
| ― |
| ― |
|
| 2,650 |
| 16,979 |
| ― |
|
| 19,629 |
| (1,209 | ) |
|
| 2007 |
|
| 7/15/2014 |
| (1) |
| $ | 13,483 |
|
| $ | 2,650 |
|
| $ | 16,979 |
|
| $ | — |
|
| $ | — |
|
| $ | — |
|
| $ | 2,650 |
|
| $ | 16,979 |
|
| $ | — |
|
| $ | 19,629 |
|
| $ | (1,693 | ) |
| 2007 |
| 7/15/2014 |
|
| (1) |
| |||
|
|
|
|
|
|
|
|
|
|
|
|
|
|
|
|
|
|
|
|
|
|
|
|
|
|
|
|
|
|
|
|
|
|
|
|
| |||||||||||||||||||||||||||||||||||||||||||||||||||||||
South Bend Inpatient Rehabilitation Hospital |
|
|
|
|
|
|
|
|
|
|
|
|
|
|
|
|
|
|
|
|
|
|
|
|
|
|
|
|
|
|
|
|
|
|
|
|
|
|
|
|
|
|
|
|
|
|
|
|
|
|
|
|
|
|
|
|
|
|
|
|
|
|
|
|
|
|
|
|
|
|
|
|
|
|
|
|
|
|
|
|
|
|
|
|
|
|
|
| |||
Mishawaka, Indiana ("South Bend") | $ | 12,562 |
| $ | 2,339 |
| $ | 16,239 |
| $ | 4 |
| ― |
| ― |
|
| 2,343 |
| 16,239 |
| ― |
|
| 18,582 |
| (1,172 | ) |
|
| 2009 |
|
| 7/15/2014 |
| (1) |
| $ | 12,242 |
|
| $ | 2,339 |
|
| $ | 16,239 |
|
| $ | 4 |
|
| $ | — |
|
| $ | — |
|
| $ | 2,343 |
|
| $ | 16,239 |
|
| $ | — |
|
| $ | 18,582 |
|
| $ | (1,641 | ) |
| 2009 |
| 7/15/2014 |
|
| (1) |
| |||
|
|
|
|
|
|
|
|
|
|
|
|
|
|
|
|
|
|
|
|
|
|
|
|
|
|
|
|
|
|
|
|
|
|
|
|
| |||||||||||||||||||||||||||||||||||||||||||||||||||||||
Beaumont Specialty Hospital |
|
|
|
|
|
|
|
|
|
|
|
|
|
|
|
|
|
|
|
|
|
|
|
|
|
|
|
|
|
|
|
|
|
|
|
|
|
|
|
|
|
|
|
|
|
|
|
|
|
|
|
|
|
|
|
|
|
|
|
|
|
|
|
|
|
|
|
|
|
|
|
|
|
|
|
|
|
|
|
|
|
|
|
|
|
|
|
| |||
Beaumont, Texas ("Houston") | $ | 20,852 |
| $ | 2,749 |
| $ | 28,863 |
| $ | — |
| ― |
| ― |
|
| 2,749 |
| 28,863 |
| ― |
|
| 31,612 |
| (1,880 | ) |
|
| 2013 |
|
| 8/15/2014 |
| (1) |
| $ | 20,322 |
|
| $ | 2,749 |
|
| $ | 28,863 |
|
| $ | — |
|
| $ | — |
|
| $ | — |
|
| $ | 2,749 |
|
| $ | 28,863 |
|
| $ | — |
|
| $ | 31,612 |
|
| $ | (2,658 | ) |
| 2013 |
| 8/15/2014 |
|
| (1) |
| |||
|
|
|
|
|
|
|
|
|
|
|
|
|
|
|
|
|
|
|
|
|
|
|
|
|
|
|
|
|
|
|
|
|
|
|
|
| |||||||||||||||||||||||||||||||||||||||||||||||||||||||
Hurst Specialty Hospital |
|
|
|
|
|
|
|
|
|
|
|
|
|
|
|
|
|
|
|
|
|
|
|
|
|
|
|
|
|
|
|
|
|
|
|
|
|
|
|
|
|
|
|
|
|
|
|
|
|
|
|
|
|
|
|
|
|
|
|
|
|
|
|
|
|
|
|
|
|
|
|
|
|
|
|
|
|
|
|
|
|
|
|
|
|
|
|
| |||
Hurst, Texas ("Dallas/Fort Worth") | $ | 18,288 |
| $ | 2,510 |
| $ | 24,091 |
| $ | — |
| ― |
| ― |
|
| 2,510 |
| 24,091 |
| ― |
|
| 26,601 |
| (1,571 | ) |
| 2004/2012 |
|
| 8/15/2014 |
| (1) |
| $ | 17,822 |
|
| $ | 2,510 |
|
| $ | 24,091 |
|
| $ | — |
|
| $ | — |
|
| $ | — |
|
| $ | 2,510 |
|
| $ | 24,091 |
|
| $ | — |
|
| $ | 26,601 |
|
| $ | (2,221 | ) |
| 2004/2012 |
| 8/15/2014 |
|
| (1) |
| ||||
|
|
|
|
|
|
|
|
|
|
|
|
|
|
|
|
|
|
|
|
|
|
|
|
|
|
|
|
|
|
|
|
|
|
|
|
| |||||||||||||||||||||||||||||||||||||||||||||||||||||||
Claremont Medical Office |
|
|
|
|
|
|
|
|
|
|
|
|
|
|
|
|
|
|
|
|
|
|
|
|
|
|
|
|
|
|
|
|
|
|
|
|
|
|
|
|
|
|
|
|
|
|
|
|
|
|
|
|
|
|
|
|
|
|
|
|
|
|
|
|
|
|
|
|
|
|
|
|
|
|
|
|
|
|
|
|
|
|
|
|
|
|
|
| |||
Claremont, CA ("Los Angeles") | $ | 12,478 |
| $ | 6,324 |
| $ | 13,533 |
| $ | — |
| 18 |
| ― |
|
| 6,324 |
| 13,551 |
| ― |
|
| 19,875 |
| (930 | ) |
|
| 2008 |
|
| 8/29/2014 |
| (1) |
| $ | 14,643 |
|
| $ | 6,324 |
|
| $ | 13,533 |
|
| $ | — |
|
| $ | 35 |
|
| $ | — |
|
| $ | 6,324 |
|
| $ | 13,568 |
|
| $ | — |
|
| $ | 19,892 |
|
| $ | (1,329 | ) |
| 2008 |
| 8/29/2014 |
|
| (1) |
| |||
|
|
|
|
|
|
|
|
|
|
|
|
|
|
|
|
|
|
|
|
|
|
|
|
|
|
|
|
|
|
|
|
|
|
|
|
| |||||||||||||||||||||||||||||||||||||||||||||||||||||||
Lee Hughes MOB |
|
|
|
|
|
|
|
|
|
|
|
|
|
|
|
|
|
|
|
|
|
|
|
|
|
|
|
|
|
|
|
|
|
|
|
|
|
|
|
|
|
|
|
|
|
|
|
|
|
|
|
|
|
|
|
|
|
|
|
|
|
|
|
|
|
|
|
|
|
|
|
|
|
|
|
|
|
|
|
|
|
|
|
|
|
|
|
| |||
Glendale, California ("Los Angeles") | $ | 18,102 |
| $ | 69 |
| $ | 22,967 |
| $ | — |
| 22 |
| ― |
|
| 69 |
| 22,989 |
| ― |
|
| 23,058 |
| (1,337 | ) |
|
| 2008 |
|
| 9/29/2014 |
| (1) |
| $ | 17,572 |
|
| $ | 69 |
|
| $ | 22,967 |
|
| $ | — |
|
| $ | 216 |
|
| $ | — |
|
| $ | 69 |
|
| $ | 23,183 |
|
| $ | — |
|
| $ | 23,252 |
|
| $ | (1,932 | ) |
| 2008 |
| 9/29/2014 |
|
| (1) |
| |||
|
|
|
|
|
|
|
|
|
|
|
|
|
|
|
|
|
|
|
|
|
|
|
|
|
|
|
|
|
|
|
|
|
|
|
|
| |||||||||||||||||||||||||||||||||||||||||||||||||||||||
Newburyport Medical Center |
|
|
|
|
|
|
|
|
|
|
|
|
|
|
|
|
|
|
|
|
|
|
|
|
|
|
|
|
|
|
|
|
|
|
|
|
|
|
|
|
|
|
|
|
|
|
|
|
|
|
|
|
|
|
|
|
|
|
|
|
|
|
|
|
|
|
|
|
|
|
|
|
|
|
|
|
|
|
|
|
|
|
|
|
|
|
|
| |||
Newburyport, Massachusetts ("Boston") | $ | — |
| $ | 2,614 |
| $ | 12,135 |
| $ | — |
| ― |
| ― |
|
| 2,614 |
| 12,135 |
| ― |
|
| 14,749 |
| (802 | ) |
|
| 2008 |
|
| 10/31/2014 |
| (1) |
| $ | — |
|
| $ | 2,614 |
|
| $ | 12,135 |
|
| $ | 36 |
|
| $ | — |
|
| $ | — |
|
| $ | 2,650 |
|
| $ | 12,135 |
|
| $ | — |
|
| $ | 14,785 |
|
| $ | (1,173 | ) |
| 2008 |
| 10/31/2014 |
|
| (1) |
| |||
|
|
|
|
|
|
|
|
|
|
|
|
|
|
|
|
|
|
|
|
|
|
|
|
|
|
|
|
|
|
|
|
|
|
|
|
| |||||||||||||||||||||||||||||||||||||||||||||||||||||||
Northwest Medical Park Building |
|
|
|
|
|
|
|
|
|
|
|
|
|
|
|
|
|
|
|
|
|
|
|
|
|
|
|
|
|
|
|
|
|
|
|
|
|
|
|
|
|
|
|
|
|
|
|
|
|
|
|
|
|
|
|
|
|
|
|
|
|
|
|
|
|
|
|
|
|
|
|
|
|
|
|
|
|
|
|
|
|
|
|
|
|
|
|
| |||
Margate, Florida ("Fort Lauderdale") | $ | 6,886 |
| $ | 610 |
| $ | 6,170 |
| $ | — |
| 58 |
| ― |
|
| 610 |
| 6,228 |
| ― |
|
| 6,838 |
| (431 | ) |
|
| 2004 |
|
| 10/31/2014 |
| (1) |
| $ | 6,765 |
|
| $ | 610 |
|
| $ | 6,170 |
|
| $ | — |
|
| $ | 139 |
|
| $ | — |
|
| $ | 610 |
|
| $ | 6,309 |
|
| $ | — |
|
| $ | 6,919 |
|
| $ | (630 | ) |
| 2004 |
| 10/31/2014 |
|
| (1) |
| |||
|
|
|
|
|
|
|
|
|
|
|
|
|
|
|
|
|
|
|
|
|
|
|
|
|
|
|
|
|
|
|
|
|
|
|
|
| |||||||||||||||||||||||||||||||||||||||||||||||||||||||
Fairfield Village of Layton |
|
|
|
|
|
|
|
|
|
|
|
|
|
|
|
|
|
|
|
|
|
|
|
|
|
|
|
|
|
|
|
|
|
|
|
|
|
|
|
|
|
|
|
|
|
|
|
|
|
|
|
|
|
|
|
|
|
|
|
|
|
|
|
|
|
|
|
|
|
|
|
|
|
|
|
|
|
|
|
|
|
|
|
|
|
|
|
| |||
Layton, Utah ("Salt Lake City") | $ | — |
| $ | 5,217 |
| $ | 54,167 |
| $ | — |
| 5 |
| ― |
|
| 5,217 |
| 54,172 |
| ― |
|
| 59,389 |
| (3,206 | ) |
|
| 2010 |
|
| 11/20/2014 |
| (1) |
| $ | — |
|
| $ | 5,217 |
|
| $ | 54,167 |
|
| $ | 12 |
|
| $ | 5 |
|
| $ | — |
|
| $ | 5,229 |
|
| $ | 54,172 |
|
| $ | — |
|
| $ | 59,401 |
|
| $ | (4,745 | ) |
| 2010 |
| 11/20/2014 |
|
| (1) |
| |||
|
|
|
|
|
|
|
|
|
|
|
|
|
|
|
|
|
|
|
|
|
|
|
|
|
|
|
|
|
|
|
|
|
|
|
|
| |||||||||||||||||||||||||||||||||||||||||||||||||||||||
ProMed Building I |
|
|
|
|
|
|
|
|
|
|
|
|
|
|
|
|
|
|
|
|
|
|
|
|
|
|
|
|
|
|
|
|
|
|
|
|
|
|
|
|
|
|
|
|
|
|
|
|
|
|
|
|
|
|
|
|
|
|
|
|
|
|
|
|
|
|
|
|
|
|
|
|
|
|
|
|
|
|
|
|
|
|
|
|
|
|
|
| |||
Yuma, Arizona | $ | 6,865 |
| $ | 2,486 |
| $ | 6,728 |
| $ | — |
| ― |
| ― |
|
| 2,486 |
| 6,728 |
| ― |
|
| 9,214 |
| (402 | ) |
|
| 2006 |
|
| 12/19/2014 |
| (1) |
| $ | 6,673 |
|
| $ | 2,486 |
|
| $ | 6,728 |
|
| $ | — |
|
| $ | 49 |
|
| $ | — |
|
| $ | 2,486 |
|
| $ | 6,777 |
|
| $ | — |
|
| $ | 9,263 |
|
| $ | (603 | ) |
| 2006 |
| 12/19/2014 |
|
| (1) |
| |||
|
|
|
|
|
|
|
|
|
|
|
|
|
|
|
|
|
|
|
|
|
|
|
|
|
|
|
|
|
|
|
|
|
|
|
|
| |||||||||||||||||||||||||||||||||||||||||||||||||||||||
Midtown Medical Plaza |
|
|
|
|
|
|
|
|
|
|
|
|
|
|
|
|
|
|
|
|
|
|
|
|
|
|
|
|
|
|
|
|
|
|
|
|
|
|
|
|
|
|
|
|
|
|
|
|
|
|
|
|
|
|
|
|
|
|
|
|
|
|
|
|
|
|
|
|
|
|
|
|
|
|
|
|
|
|
|
|
|
|
|
|
|
|
|
| |||
Charlotte, North Carolina | $ | 28,438 |
| $ | 10 |
| $ | 51,237 |
| $ | — |
| 12 |
| ― |
|
| 10 |
| 51,249 |
| ― |
|
| 51,259 |
| (2,629 | ) |
|
| 1994 |
|
| 12/22/2014 |
| (1) |
| $ | 27,477 |
|
| $ | 10 |
|
| $ | 51,237 |
|
| $ | — |
|
| $ | 590 |
|
| $ | — |
|
| $ | 10 |
|
| $ | 51,827 |
|
| $ | — |
|
| $ | 51,837 |
|
| $ | (3,943 | ) |
| 1994 |
| 12/22/2014 |
|
| (1) |
| |||
|
|
|
|
|
|
|
|
|
|
|
|
|
|
|
|
|
|
|
|
|
|
|
|
|
|
|
|
|
|
|
|
|
|
|
|
| |||||||||||||||||||||||||||||||||||||||||||||||||||||||
Presbyterian Medical Tower |
|
|
|
|
|
|
|
|
|
|
|
|
|
|
|
|
|
|
|
|
|
|
|
|
|
|
|
|
|
|
|
|
|
|
|
|
|
|
|
|
|
|
|
|
|
|
|
|
|
|
|
|
|
|
|
|
|
|
|
|
|
|
|
|
|
|
|
|
|
|
|
|
|
|
|
|
|
|
|
|
|
|
|
|
|
|
|
| |||
Charlotte, North Carolina | $ | 18,903 |
| $ | 40 |
| $ | 32,345 |
| $ | — |
| 5 |
| ― |
|
| 40 |
| 32,350 |
| ― |
|
| 32,390 |
| (1,664 | ) |
|
| 1989 |
|
| 12/22/2014 |
| (1) |
| $ | 18,264 |
|
| $ | 40 |
|
| $ | 32,345 |
|
| $ | — |
|
| $ | 196 |
|
| $ | — |
|
| $ | 40 |
|
| $ | 32,541 |
|
| $ | — |
|
| $ | 32,581 |
|
| $ | (2,500 | ) |
| 1989 |
| 12/22/2014 |
|
| (1) |
| |||
|
|
|
|
|
|
|
|
|
|
|
|
|
|
|
|
|
|
|
|
|
|
|
|
|
|
|
|
|
|
|
|
|
|
|
|
| |||||||||||||||||||||||||||||||||||||||||||||||||||||||
Metroview Professional Building |
|
|
|
|
|
|
|
|
|
|
|
|
|
|
|
|
|
|
|
|
|
|
|
|
|
|
|
|
|
|
|
|
|
|
|
|
|
|
|
|
|
|
|
|
|
|
|
|
|
|
|
|
|
|
|
|
|
|
|
|
|
|
|
|
|
|
|
|
|
|
|
|
|
|
|
|
|
|
|
|
|
|
|
|
|
|
|
| |||
Charlotte, North Carolina | $ | 8,979 |
| $ | 11 |
| $ | 15,910 |
| $ | — |
| 14 |
| ― |
|
| 11 |
| 15,924 |
| ― |
|
| 15,935 |
| (817 | ) |
|
| 1971 |
|
| 12/22/2014 |
| (1) |
| $ | 8,676 |
|
| $ | 11 |
|
| $ | 15,910 |
|
| $ | — |
|
| $ | 97 |
|
| $ | — |
|
| $ | 11 |
|
| $ | 16,007 |
|
| $ | — |
|
| $ | 16,018 |
|
| $ | (1,230 | ) |
| 1971 |
| 12/22/2014 |
|
| (1) |
| |||
|
|
|
|
|
|
|
|
|
|
|
|
|
|
|
|
|
|
|
|
|
|
|
|
|
|
|
|
|
|
|
|
|
|
|
|
| |||||||||||||||||||||||||||||||||||||||||||||||||||||||
Physicians Plaza Huntersville |
|
|
|
|
|
|
|
|
|
|
|
|
|
|
|
|
|
|
|
|
|
|
|
|
|
|
|
|
|
|
|
|
|
|
|
|
|
|
|
|
|
|
|
|
|
|
|
|
|
|
|
|
|
|
|
|
|
|
|
|
|
|
|
|
|
|
|
|
|
|
|
|
|
|
|
|
|
|
|
|
|
|
|
|
|
|
|
| |||
Huntersville, North Carolina ("Charlotte") | $ | 15,784 |
| $ | 520 |
| $ | 26,134 |
| $ | — |
| 76 |
| ― |
|
| 520 |
| 26,210 |
| ― |
|
| 26,730 |
| (1,409 | ) |
|
| 2004 |
|
| 12/22/2014 |
| (1) |
| $ | 15,251 |
|
| $ | 520 |
|
| $ | 26,134 |
|
| $ | — |
|
| $ | 112 |
|
| $ | — |
|
| $ | 520 |
|
| $ | 26,246 |
|
| $ | — |
|
| $ | 26,766 |
|
| $ | (2,114 | ) |
| 2004 |
| 12/22/2014 |
|
| (1) |
| |||
|
|
|
|
|
|
|
|
|
|
|
|
|
|
|
|
|
|
|
|
|
|
|
|
|
|
|
|
|
|
|
|
|
|
|
|
| |||||||||||||||||||||||||||||||||||||||||||||||||||||||
Matthews Medical Office Building |
|
|
|
|
|
|
|
|
|
|
|
|
|
|
|
|
|
|
|
|
|
|
|
|
|
|
|
|
|
|
|
|
|
|
|
|
|
|
|
|
|
|
|
|
|
|
|
|
|
|
|
|
|
|
|
|
|
|
|
|
|
|
|
|
|
|
|
|
|
|
|
|
|
|
|
|
|
|
|
|
|
|
|
|
|
|
|
| |||
Matthews, North Carolina ("Charlotte") | $ | 11,075 |
| $ | 350 |
| $ | 19,624 |
| $ | — |
| ― |
| ― |
|
| 350 |
| 19,624 |
| ― |
|
| 19,974 |
| (1,053 | ) |
|
| 1994 |
|
| 12/22/2014 |
| (1) |
| $ | 10,701 |
|
| $ | 350 |
|
| $ | 19,624 |
|
| $ | — |
|
| $ | 25 |
|
| $ | — |
|
| $ | 350 |
|
| $ | 19,649 |
|
| $ | — |
|
| $ | 19,999 |
|
| $ | (1,580 | ) |
| 1994 |
| 12/22/2014 |
|
| (1) |
| |||
|
|
|
|
|
|
|
|
|
|
|
|
|
|
|
|
|
|
|
|
|
|
|
|
|
|
|
|
|
|
|
|
|
|
|
|
| |||||||||||||||||||||||||||||||||||||||||||||||||||||||
Outpatient Care Center |
|
|
|
|
|
|
|
|
|
|
|
|
|
|
|
|
|
|
|
|
|
|
|
|
|
|
|
|
|
|
|
|
|
|
|
|
|
|
|
|
|
|
|
|
|
|
|
|
|
|
|
|
|
|
|
|
|
|
|
|
|
|
|
|
|
|
|
|
|
|
|
|
|
|
|
|
|
|
|
|
|
|
|
|
|
|
|
| |||
Clyde, North Carolina ("Asheville") | $ | 10,359 |
| $ | 1,169 |
| $ | 12,079 |
| $ | 9 |
| ― |
| ― |
|
| 1,178 |
| 12,079 |
| ― |
|
| 13,257 |
| (635 | ) |
|
| 2012 |
|
| 12/22/2014 |
| (1) |
| $ | 10,021 |
|
| $ | 1,169 |
|
| $ | 12,079 |
|
| $ | 9 |
|
| $ | — |
|
| $ | — |
|
| $ | 1,178 |
|
| $ | 12,079 |
|
| $ | — |
|
| $ | 13,257 |
|
| $ | (953 | ) |
| 2012 |
| 12/22/2014 |
|
| (1) |
| |||
152
CNL HEALTHCARE PROPERTIES, INC. AND SUBSIDIARIES
SCHEDULE III – REAL ESTATE AND ACCUMULATED DEPRECIATION
AS OF DECEMBER 31, 20162017 (in thousands)
|
|
|
| Initial Costs |
| Costs Capitalized Subsequent to Acquisition |
| Gross Amounts at which Carried at Close of Period (2) |
|
|
|
|
|
|
|
|
|
|
|
|
|
|
| Initial Costs |
|
| Costs Capitalized Subsequent to Acquisition |
|
| Gross Amounts at which Carried at Close of Period (2) |
|
|
|
|
|
|
|
|
|
| Life on which depreciation |
| |||||||||||||||||||||||||||||||||||||||||||||||
Property/Location | Encum- brances |
| Land & Land Improve- ments |
| Building and Building Improve- ments |
| Land & Land Improve- ments |
| Building and Building Improve- ments |
| Construc- tion in Process |
| Land & Land Improve- ments |
| Building and Building Improve- ments |
| Construc- tion in Process |
| Total |
| Accumu-lated Depreci-ation |
|
| Date of Construction |
| Date Acquired |
| Life on which depreciation in latest income statement is computed |
| Encum- brances |
|
| Land & Land Improve- ments |
|
| Building and Building Improve- ments |
|
| Land & Land Improve- ments |
|
| Building and Building Improve- ments |
|
| Construc- tion in Process |
|
| Land & Land Improve- ments |
|
| Building and Building Improve- ments |
|
| Construc- tion in Process |
|
| Total |
|
| Accumu- lated Depreci- ation |
|
| Date of Construction |
| Date Acquired |
| in latest income statement is computed |
| |||||||||||||||||||||
330 Physicians Center |
|
|
|
|
|
|
|
|
|
|
|
|
|
|
|
|
|
|
|
|
|
|
|
|
|
|
|
|
|
|
|
|
|
|
|
|
|
|
|
|
|
|
|
|
|
|
|
|
|
|
|
|
|
|
|
|
|
|
|
|
|
|
|
|
|
|
|
|
|
|
|
|
|
|
|
|
|
|
|
|
|
|
|
| |||||
Rome, Georgia | $ | 19,262 |
| $ | 12 |
| $ | 26,868 |
| $ | — |
|
| 5 |
| ― |
|
| 12 |
|
| 26,873 |
| ― |
|
| 26,885 |
|
| (1,379 | ) |
| 1987/2005 |
| 12/22/2014 |
| (1) |
| $ | 18,610 |
|
| $ | 12 |
|
| $ | 26,868 |
|
| $ | — |
|
| $ | — |
|
| $ | — |
|
| $ | 12 |
|
| $ | 26,868 |
|
| $ | — |
|
| $ | 26,880 |
|
| $ | (2,069 | ) |
| 1987/2005 |
| 12/22/2014 |
|
| (1) |
|
|
|
|
|
|
|
|
|
|
|
|
|
|
|
|
|
|
|
|
|
|
|
|
|
|
|
|
|
|
|
|
|
|
|
|
|
| |||||||||||||||||||||||||||||||||||||||||||||||||||||
Spivey Station Physicians Center |
|
|
|
|
|
|
|
|
|
|
|
|
|
|
|
|
|
|
|
|
|
|
|
|
|
|
|
|
|
|
|
|
|
|
|
|
|
|
|
|
|
|
|
|
|
|
|
|
|
|
|
|
|
|
|
|
|
|
|
|
|
|
|
|
|
|
|
|
|
|
|
|
|
|
|
|
|
|
|
|
|
|
|
|
|
|
|
| |
Atlanta, Georgia | $ | 9,428 |
| $ | 1,026 |
| $ | 12,246 |
| $ | — |
| ― |
| ― |
|
| 1,026 |
|
| 12,246 |
| ― |
|
| 13,272 |
|
| (689 | ) |
| 2007 |
| 12/22/2014 |
| (1) |
| $ | 9,114 |
|
| $ | 1,026 |
|
| $ | 12,246 |
|
| $ | — |
|
| $ | — |
|
| $ | — |
|
| $ | 1,026 |
|
| $ | 12,246 |
|
| $ | — |
|
| $ | 13,272 |
|
| $ | (1,033 | ) |
| 2007 |
| 12/22/2014 |
|
| (1) |
| |
|
|
|
|
|
|
|
|
|
|
|
|
|
|
|
|
|
|
|
|
|
|
|
|
|
|
|
|
|
|
|
|
|
|
|
|
| |||||||||||||||||||||||||||||||||||||||||||||||||||||
Spivey Station ASC Building |
|
|
|
|
|
|
|
|
|
|
|
|
|
|
|
|
|
|
|
|
|
|
|
|
|
|
|
|
|
|
|
|
|
|
|
|
|
|
|
|
|
|
|
|
|
|
|
|
|
|
|
|
|
|
|
|
|
|
|
|
|
|
|
|
|
|
|
|
|
|
|
|
|
|
|
|
|
|
|
|
|
|
|
|
|
|
|
| |
Atlanta, Georgia | $ | 12,046 |
| $ | 929 |
| $ | 13,769 |
| $ | — |
| ― |
| ― |
|
| 929 |
|
| 13,769 |
| ― |
|
| 14,698 |
|
| (761 | ) |
| 2009 |
| 12/22/2014 |
| (1) |
| $ | 11,635 |
|
| $ | 929 |
|
| $ | 13,769 |
|
| $ | — |
|
| $ | — |
|
| $ | — |
|
| $ | 929 |
|
| $ | 13,769 |
|
| $ | — |
|
| $ | 14,698 |
|
| $ | (1,142 | ) |
| 2009 |
| 12/22/2014 |
|
| (1) |
| |
|
|
|
|
|
|
|
|
|
|
|
|
|
|
|
|
|
|
|
|
|
|
|
|
|
|
|
|
|
|
|
|
|
|
|
|
| |||||||||||||||||||||||||||||||||||||||||||||||||||||
Novi Orthopaedic Center |
|
|
|
|
|
|
|
|
|
|
|
|
|
|
|
|
|
|
|
|
|
|
|
|
|
|
|
|
|
|
|
|
|
|
|
|
|
|
|
|
|
|
|
|
|
|
|
|
|
|
|
|
|
|
|
|
|
|
|
|
|
|
|
|
|
|
|
|
|
|
|
|
|
|
|
|
|
|
|
|
|
|
|
|
|
|
|
| |
Novi, Michigan | $ | 19,825 |
| $ | 1,314 |
| $ | 26,239 |
| $ | 30 |
| ― |
| ― |
|
| 1,344 |
|
| 26,239 |
| ― |
|
| 27,583 |
|
| (1,460 | ) |
| 2008 |
| 2/13/2015 |
| (1) |
| $ | 19,825 |
|
| $ | 1,314 |
|
| $ | 26,239 |
|
| $ | 30 |
|
| $ | 26 |
|
| $ | — |
|
| $ | 1,344 |
|
| $ | 26,265 |
|
| $ | — |
|
| $ | 27,609 |
|
| $ | (2,222 | ) |
| 2008 |
| 2/13/2015 |
|
| (1) |
| |
|
|
|
|
|
|
|
|
|
|
|
|
|
|
|
|
|
|
|
|
|
|
|
|
|
|
|
|
|
|
|
|
|
|
|
|
| |||||||||||||||||||||||||||||||||||||||||||||||||||||
UT Cancer Institute Building |
|
|
|
|
|
|
|
|
|
|
|
|
|
|
|
|
|
|
|
|
|
|
|
|
|
|
|
|
|
|
|
|
|
|
|
|
|
|
|
|
|
|
|
|
|
|
|
|
|
|
|
|
|
|
|
|
|
|
|
|
|
|
|
|
|
|
|
|
|
|
|
|
|
|
|
|
|
|
|
|
|
|
|
|
|
|
|
| |
Knoxville, Tennessee | $ | 20,817 |
| $ | 421 |
| $ | 27,621 |
| $ | — |
| 66 |
| ― |
|
| 421 |
|
| 27,687 |
| ― |
|
| 28,108 |
|
| (1,350 | ) |
| 2012 |
| 2/20/2015 |
| (1) |
| $ | 20,116 |
|
| $ | 421 |
|
| $ | 27,621 |
|
| $ | — |
|
| $ | 66 |
|
| $ | — |
|
| $ | 421 |
|
| $ | 27,687 |
|
| $ | — |
|
| $ | 28,108 |
|
| $ | (2,086 | ) |
| 2012 |
| 2/20/2015 |
|
| (1) |
| |
|
|
|
|
|
|
|
|
|
|
|
|
|
|
|
|
|
|
|
|
|
|
|
|
|
|
|
|
|
|
|
|
|
|
|
|
| |||||||||||||||||||||||||||||||||||||||||||||||||||||
Fieldstone Memory Care |
|
|
|
|
|
|
|
|
|
|
|
|
|
|
|
|
|
|
|
|
|
|
|
|
|
|
|
|
|
|
|
|
|
|
|
|
|
|
|
|
|
|
|
|
|
|
|
|
|
|
|
|
|
|
|
|
|
|
|
|
|
|
|
|
|
|
|
|
|
|
|
|
|
|
|
|
|
|
|
|
|
|
|
|
|
|
|
| |
Yakima, Washington | $ | — |
| $ | 1,297 |
| $ | 9,965 |
| $ | — |
| — |
| ― |
|
| 1,297 |
|
| 9,965 |
| ― |
|
| 11,262 |
|
| (494 | ) |
| 2014 |
| 3/31/2015 |
| (1) |
| $ | — |
|
| $ | 1,297 |
|
| $ | 9,965 |
|
| $ | — |
|
| $ | — |
|
| $ | — |
|
| $ | 1,297 |
|
| $ | 9,965 |
|
| $ | — |
|
| $ | 11,262 |
|
| $ | (777 | ) |
| 2014 |
| 3/31/2015 |
|
| (1) |
| |
|
|
|
|
|
|
|
|
|
|
|
|
|
|
|
|
|
|
|
|
|
|
|
|
|
|
|
|
|
|
|
|
|
|
|
|
| |||||||||||||||||||||||||||||||||||||||||||||||||||||
Bend Memorial Clinic MOB |
|
|
|
|
|
|
|
|
|
|
|
|
|
|
|
|
|
|
|
|
|
|
|
|
|
|
|
|
|
|
|
|
|
|
|
|
|
|
|
|
|
|
|
|
|
|
|
|
|
|
|
|
|
|
|
|
|
|
|
|
|
|
|
|
|
|
|
|
|
|
|
|
|
|
|
|
|
|
|
|
|
|
|
|
|
|
|
| |
Bend, Oregon | $ | — |
| $ | 9,069 |
| $ | 19,867 |
| $ | — |
| ― |
| ― |
|
| 9,069 |
|
| 19,867 |
| ― |
|
| 28,936 |
|
| (1,025 | ) |
| 1976 |
| 5/11/2015 |
| (1) |
| $ | — |
|
| $ | 9,069 |
|
| $ | 19,867 |
|
| $ | — |
|
| $ | — |
|
| $ | — |
|
| $ | 9,069 |
|
| $ | 19,867 |
|
| $ | — |
|
| $ | 28,936 |
|
| $ | (1,640 | ) |
| 1976 |
| 5/11/2015 |
|
| (1) |
| |
|
|
|
|
|
|
|
|
|
|
|
|
|
|
|
|
|
|
|
|
|
|
|
|
|
|
|
|
|
|
|
|
|
|
|
|
| |||||||||||||||||||||||||||||||||||||||||||||||||||||
Stoneterra Medical Plaza |
|
|
|
|
|
|
|
|
|
|
|
|
|
|
|
|
|
|
|
|
|
|
|
|
|
|
|
|
|
|
|
|
|
|
|
|
|
|
|
|
|
|
|
|
|
|
|
|
|
|
|
|
|
|
|
|
|
|
|
|
|
|
|
|
|
|
|
|
|
|
|
|
|
|
|
|
|
|
|
|
|
|
|
|
|
|
|
| |
San Antonio, Texas | $ | — |
| $ | 2,864 |
| $ | 10,412 |
| $ | — |
| ― |
| ― |
|
| 2,864 |
|
| 10,412 |
| ― |
|
| 13,276 |
|
| (474 | ) |
| 2006 |
| 5/29/2015 |
| (1) |
| $ | — |
|
| $ | 2,864 |
|
| $ | 10,412 |
|
| $ | — |
|
| $ | 23 |
|
| $ | — |
|
| $ | 2,864 |
|
| $ | 10,435 |
|
| $ | — |
|
| $ | 13,299 |
|
| $ | (773 | ) |
| 2006 |
| 5/29/2015 |
|
| (1) |
| |
|
|
|
|
|
|
|
|
|
|
|
|
|
|
|
|
|
|
|
|
|
|
|
|
|
|
|
|
|
|
|
|
|
|
|
|
| |||||||||||||||||||||||||||||||||||||||||||||||||||||
Primrose Retirement Center of Anderson |
|
|
|
|
|
|
|
|
|
|
|
|
|
|
|
|
|
|
|
|
|
|
|
|
|
|
|
|
|
|
|
|
|
|
|
|
|
|
|
|
|
|
|
|
|
|
|
|
|
|
|
|
|
|
|
|
|
|
|
|
|
|
|
|
|
|
|
|
|
|
|
|
|
|
|
|
|
|
|
|
|
|
|
|
|
|
|
| |
Anderson, Indiana ("Muncie") | $ | — |
| $ | 1,342 |
| $ | 19,083 |
| $ | — |
| ― |
| ― |
|
| 1,342 |
|
| 19,083 |
| ― |
|
| 20,425 |
|
| (852 | ) |
| 2008 |
| 5/29/2015 |
| (1) |
| $ | — |
|
| $ | 1,342 |
|
| $ | 19,083 |
|
| $ | — |
|
| $ | 33 |
|
| $ | — |
|
| $ | 1,342 |
|
| $ | 19,116 |
|
| $ | — |
|
| $ | 20,458 |
|
| $ | (1,393 | ) |
| 2008 |
| 5/29/2015 |
|
| (1) |
| |
|
|
|
|
|
|
|
|
|
|
|
|
|
|
|
|
|
|
|
|
|
|
|
|
|
|
|
|
|
|
|
|
|
|
|
|
| |||||||||||||||||||||||||||||||||||||||||||||||||||||
Primrose Retirement Center of Lancaster |
|
|
|
|
|
|
|
|
|
|
|
|
|
|
|
|
|
|
|
|
|
|
|
|
|
|
|
|
|
|
|
|
|
|
|
|
|
|
|
|
|
|
|
|
|
|
|
|
|
|
|
|
|
|
|
|
|
|
|
|
|
|
|
|
|
|
|
|
|
|
|
|
|
|
|
|
|
|
|
|
|
|
|
|
|
|
|
| |
Lancaster, Ohio ("Columbus") | $ | — |
| $ | 2,840 |
| $ | 21,884 |
| $ | — |
| ― |
| ― |
|
| 2,840 |
|
| 21,884 |
| ― |
|
| 24,724 |
|
| (1,077 | ) |
| 2007 |
| 5/29/2015 |
| (1) |
| $ | — |
|
| $ | 2,840 |
|
| $ | 21,884 |
|
| $ | — |
|
| $ | — |
|
| $ | — |
|
| $ | 2,840 |
|
| $ | 21,884 |
|
| $ | — |
|
| $ | 24,724 |
|
| $ | (1,757 | ) |
| 2007 |
| 5/29/2015 |
|
| (1) |
| |
|
|
|
|
|
|
|
|
|
|
|
|
|
|
|
|
|
|
|
|
|
|
|
|
|
|
|
|
|
|
|
|
|
|
|
|
| |||||||||||||||||||||||||||||||||||||||||||||||||||||
Primrose Retirement Center of Wausau |
|
|
|
|
|
|
|
|
|
|
|
|
|
|
|
|
|
|
|
|
|
|
|
|
|
|
|
|
|
|
|
|
|
|
|
|
|
|
|
|
|
|
|
|
|
|
|
|
|
|
|
|
|
|
|
|
|
|
|
|
|
|
|
|
|
|
|
|
|
|
|
|
|
|
|
|
|
|
|
|
|
|
|
|
|
|
|
| |
Wausau, Wisconsin ("Green Bay") | $ | — |
| $ | 1,089 |
| $ | 18,653 |
| $ | — |
| ― |
| ― |
|
| 1,089 |
|
| 18,653 |
| ― |
|
| 19,742 |
|
| (801 | ) |
| 2008 |
| 5/29/2015 |
| (1) |
| $ | — |
|
| $ | 1,089 |
|
| $ | 18,653 |
|
| $ | — |
|
| $ | — |
|
| $ | — |
|
| $ | 1,089 |
|
| $ | 18,653 |
|
| $ | — |
|
| $ | 19,742 |
|
| $ | (1,307 | ) |
| 2008 |
| 5/29/2015 |
|
| (1) |
| |
|
|
|
|
|
|
|
|
|
|
|
|
|
|
|
|
|
|
|
|
|
|
|
|
|
|
|
|
|
|
|
|
|
|
|
|
| |||||||||||||||||||||||||||||||||||||||||||||||||||||
Triangle Orthopaedic Durham |
|
|
|
|
|
|
|
|
|
|
|
|
|
|
|
|
|
|
|
|
|
|
|
|
|
|
|
|
|
|
|
|
|
|
|
|
|
|
|
|
|
|
|
|
|
|
|
|
|
|
|
|
|
|
|
|
|
|
|
|
|
|
|
|
|
|
|
|
|
|
|
|
|
|
|
|
|
|
|
|
|
|
|
|
|
|
|
| |
Durham, North Carolina | $ | 12,800 |
| $ | 3,191 |
| $ | 14,523 |
| $ | 134 |
| ― |
| ― |
|
| 3,325 |
|
| 14,523 |
| ― |
|
| 17,848 |
|
| (641 | ) |
| 2000 |
| 6/29/2015 |
| (1) |
| $ | 12,690 |
|
| $ | 3,191 |
|
| $ | 14,523 |
|
| $ | 134 |
|
| $ | — |
|
| $ | — |
|
| $ | 3,325 |
|
| $ | 14,523 |
|
| $ | — |
|
| $ | 17,848 |
|
| $ | (1,070 | ) |
| 2000 |
| 6/29/2015 |
|
| (1) |
| |
|
|
|
|
|
|
|
|
|
|
|
|
|
|
|
|
|
|
|
|
|
|
|
|
|
|
|
|
|
|
|
|
|
|
|
| ||||||||||||||||||||||||||||||||||||||||||||||||||||||
Triangle Orthopaedic Roxboro |
|
|
|
|
|
|
|
|
|
|
|
|
|
|
|
|
|
|
|
|
|
|
|
|
|
|
|
|
|
|
|
|
|
|
|
|
|
|
|
|
|
|
|
|
|
|
|
|
|
|
|
|
|
|
|
|
|
|
|
|
|
|
|
|
|
|
|
|
|
|
|
|
|
|
|
|
|
|
|
|
|
|
|
|
|
|
| ||
Roxboro, North Carolina | $ | 1,300 |
| $ | 287 |
| $ | 1,406 |
| $ | — |
| ― |
| ― |
|
| 287 |
| 1,406 |
| ― |
|
| 1,693 |
|
| (66 | ) |
| 2000 |
| 6/29/2015 |
| (1) |
| $ | 1,289 |
|
| $ | 287 |
|
| $ | 1,406 |
|
| $ | — |
|
| $ | — |
|
| $ | — |
|
| $ | 287 |
|
| $ | 1,406 |
|
| $ | — |
|
| $ | 1,693 |
|
| $ | (111 | ) |
| 2000 |
| 6/29/2015 |
|
| (1) |
| ||
|
|
|
|
|
|
|
|
|
|
|
|
|
|
|
|
|
|
|
|
|
|
|
|
|
|
|
|
|
|
|
|
|
|
|
| ||||||||||||||||||||||||||||||||||||||||||||||||||||||
Triangle Orthopaedic Chapel Hill |
|
|
|
|
|
|
|
|
|
|
|
|
|
|
|
|
|
|
|
|
|
|
|
|
|
|
|
|
|
|
|
|
|
|
|
|
|
|
|
|
|
|
|
|
|
|
|
|
|
|
|
|
|
|
|
|
|
|
|
|
|
|
|
|
|
|
|
|
|
|
|
|
|
|
|
|
|
|
|
|
|
|
|
|
|
|
| ||
Chapel Hill, North Carolina | $ | 1,900 |
| $ | 360 |
| $ | 2,306 |
| $ | — |
| ― |
| ― |
|
| 360 |
| 2,306 |
| ― |
|
| 2,666 |
| (99) |
|
| 2011 |
| 6/29/2015 |
| (1) |
| $ | 1,884 |
|
| $ | 360 |
|
| $ | 2,306 |
|
| $ | — |
|
| $ | — |
|
| $ | — |
|
| $ | 360 |
|
| $ | 2,306 |
|
| $ | — |
|
| $ | 2,666 |
|
| $ | (165 | ) |
| 2011 |
| 6/29/2015 |
|
| (1) |
| |||
|
|
|
|
|
|
|
|
|
|
|
|
|
|
|
|
|
|
|
|
|
|
|
|
|
|
|
|
|
|
|
|
|
|
| |||||||||||||||||||||||||||||||||||||||||||||||||||||||
Triangle Orthopaedic Oxford |
|
|
|
|
|
|
|
|
|
|
|
|
|
|
|
|
|
|
|
|
|
|
|
|
|
|
|
|
|
|
|
|
|
|
|
|
|
|
|
|
|
|
|
|
|
|
|
|
|
|
|
|
|
|
|
|
|
|
|
|
|
|
|
|
|
|
|
|
|
|
|
|
|
|
|
|
|
|
|
|
|
|
|
|
|
| |||
Oxford, North Carolina | $ | 2,800 |
| $ | 658 |
| $ | 3,074 |
| $ | — |
| ― |
| ― |
|
| 658 |
| 3,074 |
| ― |
|
| 3,732 |
| (144) |
|
| 2011 |
| 6/29/2015 |
| (1) |
| $ | 2,776 |
|
| $ | 658 |
|
| $ | 3,074 |
|
| $ | — |
|
| $ | — |
|
| $ | — |
|
| $ | 658 |
|
| $ | 3,074 |
|
| $ | — |
|
| $ | 3,732 |
|
| $ | (241 | ) |
| 2011 |
| 6/29/2015 |
|
| (1) |
| |||
|
|
|
|
|
|
|
|
|
|
|
|
|
|
|
|
|
|
|
|
|
|
|
|
|
|
|
|
|
|
|
|
|
|
| |||||||||||||||||||||||||||||||||||||||||||||||||||||||
North Carolina Specialty Hospital |
|
|
|
|
|
|
|
|
|
|
|
|
|
|
|
|
|
|
|
|
|
|
|
|
|
|
|
|
|
|
|
|
|
|
|
|
|
|
|
|
|
|
|
|
|
|
|
|
|
|
|
|
|
|
|
|
|
|
|
|
|
|
|
|
|
|
|
|
|
|
|
|
|
|
|
|
|
|
|
|
|
|
|
|
|
| |||
Durham, North Carolina | $ | 19,000 |
| $ | 3,173 |
| $ | 22,762 |
| $ | — |
| ― |
| ― |
|
| 3,173 |
| 22,762 |
| ― |
|
| 25,935 |
| (945) |
|
| 2004 |
| 6/29/2015 |
| (1) |
| $ | 18,837 |
|
| $ | 3,173 |
|
| $ | 22,762 |
|
| $ | — |
|
| $ | 14 |
|
| $ | — |
|
| $ | 3,173 |
|
| $ | 22,776 |
|
| $ | — |
|
| $ | 25,949 |
|
| $ | (1,575 | ) |
| 2004 |
| 6/29/2015 |
|
| (1) |
| |||
|
|
|
|
|
|
|
|
|
|
|
|
|
|
|
|
|
|
|
|
|
|
|
|
|
|
|
|
|
|
|
|
|
|
| |||||||||||||||||||||||||||||||||||||||||||||||||||||||
Doctor's Park Building B |
|
|
|
|
|
|
|
|
|
|
|
|
|
|
|
|
|
|
|
|
|
|
|
|
|
|
|
|
|
|
|
|
|
|
|
|
|
|
|
|
|
|
|
|
|
|
|
|
|
|
|
|
|
|
|
|
|
|
|
|
|
|
|
|
|
|
|
|
|
|
|
|
|
|
|
|
|
|
|
|
|
|
|
|
|
| |||
Chula Vista, California ("San Diego") | $ | — |
| $ | 1,161 |
| $ | 2,919 |
| $ | — |
| ― |
| ― |
|
| 1,161 |
| 2,919 |
| ― |
|
| 4,080 |
| (128 | ) |
| 2008 |
| 6/30/2015 |
| (1) |
| $ | — |
|
| $ | 1,161 |
|
| $ | 2,919 |
|
| $ | — |
|
| $ | — |
|
| $ | — |
|
| $ | 1,161 |
|
| $ | 2,919 |
|
| $ | — |
|
| $ | 4,080 |
|
| $ | (214 | ) |
| 2008 |
| 6/30/2015 |
|
| (1) |
| |||
|
|
|
|
|
|
|
|
|
|
|
|
|
|
|
|
|
|
|
|
|
|
|
|
|
|
|
|
|
|
|
|
|
|
| |||||||||||||||||||||||||||||||||||||||||||||||||||||||
Doctor's Park Building C |
|
|
|
|
|
|
|
|
|
|
|
|
|
|
|
|
|
|
|
|
|
|
|
|
|
|
|
|
|
|
|
|
|
|
|
|
|
|
|
|
|
|
|
|
|
|
|
|
|
|
|
|
|
|
|
|
|
|
|
|
|
|
|
|
|
|
|
|
|
|
|
|
|
|
|
|
|
|
|
|
|
|
|
|
|
| |||
Chula Vista, California ("San Diego") | $ | — |
| $ | 2,323 |
| $ | 6,351 |
| $ | — |
| ― |
| ― |
|
| 2,323 |
| 6,351 |
| ― |
|
| 8,674 |
| (276 | ) |
| 2006 |
| 6/30/2015 |
| (1) |
| $ | — |
|
| $ | 2,323 |
|
| $ | 6,351 |
|
| $ | — |
|
| $ | — |
|
| $ | — |
|
| $ | 2,323 |
|
| $ | 6,351 |
|
| $ | — |
|
| $ | 8,674 |
|
| $ | (459 | ) |
| 2006 |
| 6/30/2015 |
|
| (1) |
| |||
153
CNL HEALTHCARE PROPERTIES, INC. AND SUBSIDIARIES
SCHEDULE III – REAL ESTATE AND ACCUMULATED DEPRECIATION
AS OF DECEMBER 31, 20162017 (in thousands)
|
|
|
| Initial Costs |
| Costs Capitalized Subsequent to Acquisition |
| Gross Amounts at which Carried at Close of Period (2) |
|
|
|
|
|
|
|
|
|
|
|
|
|
|
| Initial Costs |
|
| Costs Capitalized Subsequent to Acquisition |
|
| Gross Amounts at which Carried at Close of Period (2) |
|
|
|
|
|
|
|
|
|
| Life on which depreciation |
| |||||||||||||||||||||||||||||||||||||||||||||||||
Property/Location | Encum- brances |
| Land & Land Improve- ments |
| Building and Building Improve- ments |
| Land & Land Improve- ments |
| Building and Building Improve- ments |
| Construc- tion in Process |
| Land & Land Improve- ments |
| Building and Building Improve- ments |
| Construc- tion in Process |
| Total |
| Accumu-lated Depreci-ation |
|
| Date of Construction |
| Date Acquired |
| Life on which depreciation in latest income statement is computed |
| Encum- brances |
|
| Land & Land Improve- ments |
|
| Building and Building Improve- ments |
|
| Land & Land Improve- ments |
|
| Building and Building Improve- ments |
|
| Construc- tion in Process |
|
| Land & Land Improve- ments |
|
| Building and Building Improve- ments |
|
| Construc- tion in Process |
|
| Total |
|
| Accumu- lated Depreci- ation |
|
| Date of Construction |
| Date Acquired |
| in latest income statement is computed |
| |||||||||||||||||||||||
Superior Residences of Panama City |
|
|
|
|
|
|
|
|
|
|
|
|
|
|
|
|
|
|
|
|
|
|
|
|
|
|
|
|
|
|
|
|
|
|
|
|
|
|
|
|
|
|
|
|
|
|
|
|
|
|
|
|
|
|
|
|
|
|
|
|
|
|
|
|
|
|
|
|
|
|
|
|
|
|
|
|
|
|
|
|
|
|
|
|
|
|
|
|
|
|
|
Panama City Beach, Florida | $ | — |
| $ | 2,099 |
| $ | 19,367 |
| $ | — |
| $ | — |
| $ | — |
| $ | 2,099 |
| $ | 19,367 |
| $ | — |
| $ | 21,466 |
| $ | (818 | ) |
| 2015 |
| 7/15/2015 |
| (1) |
| $ | — |
|
| $ | 2,099 |
|
| $ | 19,367 |
|
| $ | — |
|
| $ | — |
|
| $ | — |
|
| $ | 2,099 |
|
| $ | 19,367 |
|
| $ | — |
|
| $ | 21,466 |
|
| $ | (1,363 | ) |
| 2015 |
| 7/15/2015 |
|
| (1) |
|
|
|
|
|
|
|
|
|
|
|
|
|
|
|
|
|
|
|
|
|
|
|
|
|
|
|
|
|
|
|
|
|
| |||||||||||||||||||||||||||||||||||||||||||||||||||||||||||
540 New Waverly Place |
|
|
|
|
|
|
|
|
|
|
|
|
|
|
|
|
|
|
|
|
|
|
|
|
|
|
|
|
|
|
|
|
|
|
|
|
|
|
|
|
|
|
|
|
|
|
|
|
|
|
|
|
|
|
|
|
|
|
|
|
|
|
|
|
|
|
|
|
|
|
|
|
|
|
|
|
|
|
|
|
|
|
|
| |||||||
Cary, North Carolina ("Raleigh") | $ | 6,868 |
| $ | 2,476 |
| $ | 11,009 |
| $ | — |
| ― |
| ― |
| 2,476 |
| 11,009 |
| ― |
| 13,485 |
| (463 | ) |
| 2007 |
| 7/20/2015 |
| (1) |
| $ | 6,665 |
|
| $ | 2,476 |
|
| $ | 11,009 |
|
| $ | — |
|
| $ | — |
|
| $ | — |
|
| $ | 2,476 |
|
| $ | 11,009 |
|
| $ | — |
|
| $ | 13,485 |
|
| $ | (789 | ) |
| 2007 |
| 7/20/2015 |
|
| (1) |
| |||||||
|
|
|
|
|
|
|
|
|
|
|
|
|
|
|
|
|
|
|
|
|
|
|
|
|
|
|
|
|
|
|
|
| |||||||||||||||||||||||||||||||||||||||||||||||||||||||||||
MedHelp |
|
|
|
|
|
|
|
|
|
|
|
|
|
|
|
|
|
|
|
|
|
|
|
|
|
|
|
|
|
|
|
|
|
|
|
|
|
|
|
|
|
|
|
|
|
|
|
|
|
|
|
|
|
|
|
|
|
|
|
|
|
|
|
|
|
|
|
|
|
|
|
|
|
|
|
|
|
|
|
|
|
|
|
| |||||||
Birmingham, Alabama | $ | — |
| $ | 2,270 |
| $ | 10,359 |
| $ | — |
| ― |
| ― |
| 2,270 |
| 10,359 |
| ― |
| 12,629 |
| (403 | ) |
| 2015 |
| 7/31/2015 |
| (1) |
| $ | — |
|
| $ | 2,270 |
|
| $ | 10,359 |
|
| $ | — |
|
| $ | — |
|
| $ | — |
|
| $ | 2,270 |
|
| $ | 10,359 |
|
| $ | — |
|
| $ | 12,629 |
|
| $ | (688 | ) |
| 2015 |
| 7/31/2015 |
|
| (1) |
| |||||||
|
|
|
|
|
|
|
|
|
|
|
|
|
|
|
|
|
|
|
|
|
|
|
|
|
|
|
|
|
|
|
|
| |||||||||||||||||||||||||||||||||||||||||||||||||||||||||||
Patriot Professional Center |
|
|
|
|
|
|
|
|
|
|
|
|
|
|
|
|
|
|
|
|
|
|
|
|
|
|
|
|
|
|
|
|
|
|
|
|
|
|
|
|
|
|
|
|
|
|
|
|
|
|
|
|
|
|
|
|
|
|
|
|
|
|
|
|
|
|
|
|
|
|
|
|
|
|
|
|
|
|
|
|
|
|
|
| |||||||
Frederick, Maryland ("Baltimore") | $ | — |
| $ | 3,912 |
| $ | 11,781 |
| $ | — |
| ― |
| ― |
| 3,912 |
| 11,781 |
| ― |
| 15,693 |
| (497 | ) |
| 2006/2014 |
| 7/31/2015 |
| (1) |
| $ | — |
|
| $ | 3,912 |
|
| $ | 11,781 |
|
| $ | — |
|
| $ | — |
|
| $ | — |
|
| $ | 3,912 |
|
| $ | 11,781 |
|
| $ | — |
|
| $ | 15,693 |
|
| $ | (849 | ) |
| 2006/2014 |
| 7/31/2015 |
|
| (1) |
| |||||||
|
|
|
|
|
|
|
|
|
|
|
|
|
|
|
|
|
|
|
|
|
|
|
|
|
|
|
|
|
|
|
|
| |||||||||||||||||||||||||||||||||||||||||||||||||||||||||||
Liberty Professional Center |
|
|
|
|
|
|
|
|
|
|
|
|
|
|
|
|
|
|
|
|
|
|
|
|
|
|
|
|
|
|
|
|
|
|
|
|
|
|
|
|
|
|
|
|
|
|
|
|
|
|
|
|
|
|
|
|
|
|
|
|
|
|
|
|
|
|
|
|
|
|
|
|
|
|
|
|
|
|
|
|
|
|
|
| |||||||
Frederick, Maryland ("Baltimore") | $ | — |
| $ | 1,977 |
| $ | 4,462 |
| $ | 10 |
| ― |
| ― |
| 1,987 |
| 4,462 |
| ― |
| 6,449 |
| (185 | ) |
| 1979/2013 |
| 7/31/2015 |
| (1) |
| $ | — |
|
| $ | 1,977 |
|
| $ | 4,462 |
|
| $ | 10 |
|
| $ | — |
|
| $ | — |
|
| $ | 1,987 |
|
| $ | 4,462 |
|
| $ | — |
|
| $ | 6,449 |
|
| $ | (316 | ) |
| 1979/2013 |
| 7/31/2015 |
|
| (1) |
| |||||||
|
|
|
|
|
|
|
|
|
|
|
|
|
|
|
|
|
|
|
|
|
|
|
|
|
|
|
|
|
|
|
|
| |||||||||||||||||||||||||||||||||||||||||||||||||||||||||||
The Hampton at Meadows Place |
|
|
|
|
|
|
|
|
|
|
|
|
|
|
|
|
|
|
|
|
|
|
|
|
|
|
|
|
|
|
|
|
|
|
|
|
|
|
|
|
|
|
|
|
|
|
|
|
|
|
|
|
|
|
|
|
|
|
|
|
|
|
|
|
|
|
|
|
|
|
|
|
|
|
|
|
|
|
|
|
|
|
|
| |||||||
Meadows Place, Texas ("Houston") | $ | — |
| $ | 715 |
| $ | 24,281 |
| $ | — |
| ― |
| ― |
| 715 |
| 24,281 |
| ― |
| 24,996 |
| (898 | ) |
| 2007/2013/2014 |
| 7/31/2015 |
| (1) |
| $ | — |
|
| $ | 715 |
|
| $ | 24,281 |
|
| $ | — |
|
| $ | 34 |
|
| $ | — |
|
| $ | 715 |
|
| $ | 24,315 |
|
| $ | — |
|
| $ | 25,030 |
|
| $ | (1,533 | ) |
| 2007/2013/2014 |
| 7/31/2015 |
|
| (1) |
| |||||||
|
|
|
|
|
|
|
|
|
|
|
|
|
|
|
|
|
|
|
|
|
|
|
|
|
|
|
|
|
|
|
|
| |||||||||||||||||||||||||||||||||||||||||||||||||||||||||||
The Pavilion at Great Hills |
|
|
|
|
|
|
|
|
|
|
|
|
|
|
|
|
|
|
|
|
|
|
|
|
|
|
|
|
|
|
|
|
|
|
|
|
|
|
|
|
|
|
|
|
|
|
|
|
|
|
|
|
|
|
|
|
|
|
|
|
|
|
|
|
|
|
|
|
|
|
|
|
|
|
|
|
|
|
|
|
|
|
|
| |||||||
Austin, Texas | $ | — |
| $ | 1,783 |
| $ | 29,318 |
| $ | — |
| ― |
| ― |
| 1,783 |
| 29,318 |
| ― |
| 31,101 |
| (1,094 | ) |
| 2010 |
| 7/31/2015 |
| (1) |
| $ | — |
|
| $ | 1,783 |
|
| $ | 29,318 |
|
| $ | — |
|
| $ | — |
|
| $ | — |
|
| $ | 1,783 |
|
| $ | 29,318 |
|
| $ | — |
|
| $ | 31,101 |
|
| $ | (1,867 | ) |
| 2010 |
| 7/31/2015 |
|
| (1) |
| |||||||
|
|
|
|
|
|
|
|
|
|
|
|
|
|
|
|
|
|
|
|
|
|
|
|
|
|
|
|
|
|
|
|
| |||||||||||||||||||||||||||||||||||||||||||||||||||||||||||
The Beacon at Gulf Breeze |
|
|
|
|
|
|
|
|
|
|
|
|
|
|
|
|
|
|
|
|
|
|
|
|
|
|
|
|
|
|
|
|
|
|
|
|
|
|
|
|
|
|
|
|
|
|
|
|
|
|
|
|
|
|
|
|
|
|
|
|
|
|
|
|
|
|
|
|
|
|
|
|
|
|
|
|
|
|
|
|
|
|
|
| |||||||
Gulf Breeze, Florida ("Pensacola") | $ | — |
| $ | 824 |
| $ | 24,106 |
| $ | — |
| ― |
| ― |
| 824 |
| 24,106 |
| ― |
| 24,930 |
| (927 | ) |
| 2008 |
| 7/31/2015 |
| (1) |
| $ | — |
|
| $ | 824 |
|
| $ | 24,106 |
|
| $ | — |
|
| $ | — |
|
| $ | — |
|
| $ | 824 |
|
| $ | 24,106 |
|
| $ | — |
|
| $ | 24,930 |
|
| $ | (1,581 | ) |
| 2008 |
| 7/31/2015 |
|
| (1) |
| |||||||
|
|
|
|
|
|
|
|
|
|
|
|
|
|
|
|
|
|
|
|
|
|
|
|
|
|
|
|
|
|
|
|
| |||||||||||||||||||||||||||||||||||||||||||||||||||||||||||
Parc at Piedmont |
|
|
|
|
|
|
|
|
|
|
|
|
|
|
|
|
|
|
|
|
|
|
|
|
|
|
|
|
|
|
|
|
|
|
|
|
|
|
|
|
|
|
|
|
|
|
|
|
|
|
|
|
|
|
|
|
|
|
|
|
|
|
|
|
|
|
|
|
|
|
|
|
|
|
|
|
|
|
|
|
|
|
|
| |||||||
Marietta, Georgia ("Atlanta") | $ | — |
| $ | 3,529 |
| $ | 43,080 |
| $ | — |
| ― |
| ― |
| 3,529 |
| 43,080 |
| ― |
| 46,609 |
| (1,662 | ) |
| 2001/2011 |
| 7/31/2015 |
| (1) |
| $ | — |
|
| $ | 3,529 |
|
| $ | 43,080 |
|
| $ | — |
|
| $ | 16 |
|
| $ | — |
|
| $ | 3,529 |
|
| $ | 43,096 |
|
| $ | — |
|
| $ | 46,625 |
|
| $ | (2,837 | ) |
| 2001/2011 |
| 7/31/2015 |
|
| (1) |
| |||||||
|
|
|
|
|
|
|
|
|
|
|
|
|
|
|
|
|
|
|
|
|
|
|
|
|
|
|
|
|
|
|
|
| |||||||||||||||||||||||||||||||||||||||||||||||||||||||||||
Parc at Duluth |
|
|
|
|
|
|
|
|
|
|
|
|
|
|
|
|
|
|
|
|
|
|
|
|
|
|
|
|
|
|
|
|
|
|
|
|
|
|
|
|
|
|
|
|
|
|
|
|
|
|
|
|
|
|
|
|
|
|
|
|
|
|
|
|
|
|
|
|
|
|
|
|
|
|
|
|
|
|
|
|
|
|
|
| |||||||
Duluth, Georgia ("Atlanta") | $ | — |
| $ | 5,951 |
| $ | 42,458 |
| $ | — |
| ― |
| ― |
| 5,951 |
| 42,458 |
| ― |
| 48,409 |
| (1,637 | ) |
| 2003/2012 |
| 7/31/2015 |
| (1) |
| $ | — |
|
| $ | 5,951 |
|
| $ | 42,458 |
|
| $ | — |
|
| $ | — |
|
| $ | — |
|
| $ | 5,951 |
|
| $ | 42,458 |
|
| $ | — |
|
| $ | 48,409 |
|
| $ | (2,792 | ) |
| 2003/2012 |
| 7/31/2015 |
|
| (1) |
| |||||||
|
|
|
|
|
|
|
|
|
|
|
|
|
|
|
|
|
|
|
|
|
|
|
|
|
|
|
|
|
|
|
|
| |||||||||||||||||||||||||||||||||||||||||||||||||||||||||||
Broadway Medical Plaza 1 |
|
|
|
|
|
|
|
|
|
|
|
|
|
|
|
|
|
|
|
|
|
|
|
|
|
|
|
|
|
|
|
|
|
|
|
|
|
|
|
|
|
|
|
|
|
|
|
|
|
|
|
|
|
|
|
|
|
|
|
|
|
|
|
|
|
|
|
|
|
|
|
|
|
|
|
|
|
|
|
|
|
|
|
| |||||||
Columbia, Missouri | $ | — |
| $ | 437 |
| $ | 9,281 |
| $ | — |
| ― |
| ― |
| 437 |
| 9,281 |
| ― |
| 9,718 |
| (356 | ) |
| 1994 |
| 8/21/2015 |
| (1) |
| $ | — |
|
| $ | 437 |
|
| $ | 9,281 |
|
| $ | — |
|
| $ | 135 |
|
| $ | — |
|
| $ | 437 |
|
| $ | 9,416 |
|
| $ | — |
|
| $ | 9,853 |
|
| $ | (624 | ) |
| 1994 |
| 8/21/2015 |
|
| (1) |
| |||||||
|
|
|
|
|
|
|
|
|
|
|
|
|
|
|
|
|
|
|
|
|
|
|
|
|
|
|
|
|
|
|
|
| |||||||||||||||||||||||||||||||||||||||||||||||||||||||||||
Broadway Medical Plaza 2 |
|
|
|
|
|
|
|
|
|
|
|
|
|
|
|
|
|
|
|
|
|
|
|
|
|
|
|
|
|
|
|
|
|
|
|
|
|
|
|
|
|
|
|
|
|
|
|
|
|
|
|
|
|
|
|
|
|
|
|
|
|
|
|
|
|
|
|
|
|
|
|
|
|
|
|
|
|
|
|
|
|
|
|
| |||||||
Columbia, Missouri | $ | — |
| $ | 386 |
| $ | 12,460 |
| $ | — |
| ― |
| ― |
| 386 |
| 12,460 |
| ― |
| 12,846 |
| (460 | ) |
| 1999 |
| 8/21/2015 |
| (1) |
| $ | — |
|
| $ | 386 |
|
| $ | 12,460 |
|
| $ | — |
|
| $ | — |
|
| $ | — |
|
| $ | 386 |
|
| $ | 12,460 |
|
| $ | — |
|
| $ | 12,846 |
|
| $ | (806 | ) |
| 1999 |
| 8/21/2015 |
|
| (1) |
| |||||||
|
|
|
|
|
|
|
|
|
|
|
|
|
|
|
|
|
|
|
|
|
|
|
|
|
|
|
|
|
|
|
|
| |||||||||||||||||||||||||||||||||||||||||||||||||||||||||||
Broadway Medical Plaza 4 |
|
|
|
|
|
|
|
|
|
|
|
|
|
|
|
|
|
|
|
|
|
|
|
|
|
|
|
|
|
|
|
|
|
|
|
|
|
|
|
|
|
|
|
|
|
|
|
|
|
|
|
|
|
|
|
|
|
|
|
|
|
|
|
|
|
|
|
|
|
|
|
|
|
|
|
|
|
|
|
|
|
|
|
| |||||||
Columbia, Missouri | $ | — |
| $ | 170 |
| $ | 12,118 |
| $ | — |
| ― |
| ― |
| 170 |
| 12,118 |
| ― |
| 12,288 |
| (429 | ) |
| 2007 |
| 8/21/2015 |
| (1) |
| $ | — |
|
| $ | 170 |
|
| $ | 12,118 |
|
| $ | — |
|
| $ | 86 |
|
| $ | — |
|
| $ | 170 |
|
| $ | 12,204 |
|
| $ | — |
|
| $ | 12,374 |
|
| $ | (751 | ) |
| 2007 |
| 8/21/2015 |
|
| (1) |
| |||||||
|
|
|
|
|
|
|
|
|
|
|
|
|
|
|
|
|
|
|
|
|
|
|
|
|
|
|
|
|
|
|
|
| |||||||||||||||||||||||||||||||||||||||||||||||||||||||||||
Waterstone on Augusta |
|
|
|
|
|
|
|
|
|
|
|
|
|
|
|
|
|
|
|
|
|
|
|
|
|
|
|
|
|
|
|
|
|
|
|
|
|
|
|
|
|
|
|
|
|
|
|
|
|
|
|
|
|
|
|
|
|
|
|
|
|
|
|
|
|
|
|
|
|
|
|
|
|
|
|
|
|
|
|
|
|
|
|
| |||||||
Greenville, South Carolina | $ | 12,698 |
| $ | 2,253 |
| $ | — |
| $ | — |
| ― |
| 21,901 |
| 2,253 |
| ― |
| 21,901 |
| 24,154 |
| ― |
|
| (3) |
| 8/31/2015 |
| (1) |
| $ | 18,302 |
|
| $ | 2,253 |
|
| $ | — |
|
| $ | 2,064 |
|
| $ | 20,770 |
|
| $ | — |
|
| $ | 4,317 |
|
| $ | 20,770 |
|
| $ | — |
|
| $ | 25,087 |
|
| $ | (502 | ) |
| 2017 |
| 8/31/2015 |
|
| (1) |
| |||||||
|
|
|
|
|
|
|
|
|
|
|
|
|
|
|
|
|
|
|
|
|
|
|
|
|
|
|
|
|
|
|
|
| |||||||||||||||||||||||||||||||||||||||||||||||||||||||||||
Welbrook Senior Living Grand Junction |
|
|
|
|
|
|
|
|
|
|
|
|
|
|
|
|
|
|
|
|
|
|
|
|
|
|
|
|
|
|
|
|
|
|
|
|
|
|
|
|
|
|
|
|
|
|
|
|
|
|
|
|
|
|
|
|
|
|
|
|
|
|
|
|
|
|
|
|
|
|
|
|
|
|
|
|
|
|
|
|
|
|
|
| |||||||
Grand Junction, Colorado | $ | — |
| $ | 1,050 |
| $ | — |
| $ | — |
| ― |
| 11,844 |
| 1,050 |
| ― |
| 11,844 |
| 12,894 |
| ― |
|
| (3) |
| 9/4/2015 |
| (1) |
| $ | — |
|
| $ | 1,050 |
|
| $ | — |
|
| $ | 1,348 |
|
| $ | 9,901 |
|
| $ | — |
|
| $ | 2,398 |
|
| $ | 9,901 |
|
| $ | — |
|
| $ | 12,299 |
|
| $ | (286 | ) |
| 2017 |
| 9/4/2015 |
|
| (1) |
| |||||||
|
|
|
|
|
|
|
|
|
|
|
|
|
|
|
|
|
|
|
|
|
|
|
|
|
|
|
|
|
|
|
|
| |||||||||||||||||||||||||||||||||||||||||||||||||||||||||||
Wellmore of Lexington |
|
|
|
|
|
|
|
|
|
|
|
|
|
|
|
|
|
|
|
|
|
|
|
|
|
|
|
|
|
|
|
|
|
|
|
|
|
|
|
|
|
|
|
|
|
|
|
|
|
|
|
|
|
|
|
|
|
|
|
|
|
|
|
|
|
|
|
|
|
|
|
|
|
|
|
|
|
|
|
|
|
|
|
| |||||||
Lexington, South Carolina ("Columbia") | $ | 13,542 |
| $ | 2,300 |
| $ | — |
| $ | — |
| ― |
| 36,673 |
| 2,300 |
| ― |
| 36,673 |
| 38,973 |
| ― |
|
| (3) |
| 9/14/2015 |
| (1) |
| $ | 33,423 |
|
| $ | 2,300 |
|
| $ | — |
|
| $ | 3,143 |
|
| $ | 43,081 |
|
| $ | — |
|
| $ | 5,443 |
|
| $ | 43,081 |
|
| $ | — |
|
| $ | 48,524 |
|
| $ | (657 | ) |
| 2017 |
| 9/14/2015 |
|
| (1) |
| |||||||
|
|
|
|
|
|
|
|
|
|
|
|
|
|
|
|
|
|
|
|
|
|
|
|
|
|
|
|
|
|
|
|
| |||||||||||||||||||||||||||||||||||||||||||||||||||||||||||
Palmilla Senior Living |
|
|
|
|
|
|
|
|
|
|
|
|
|
|
|
|
|
|
|
|
|
|
|
|
|
|
|
|
|
|
|
|
|
|
|
|
|
|
|
|
|
|
|
|
|
|
|
|
|
|
|
|
|
|
|
|
|
|
|
|
|
|
|
|
|
|
|
|
|
|
|
|
|
|
|
|
|
|
|
|
|
|
|
| |||||||
Albuquerque, New Mexico | $ | 27,000 |
| $ | 4,701 |
| $ | 38,321 |
| $ | — |
| ― |
| ― |
| 4,701 |
| 38,321 |
| ― |
| 43,022 |
| (1,312 | ) |
| 2013 |
| 9/30/2015 |
| (1) |
| $ | 26,799 |
|
| $ | 4,701 |
|
| $ | 38,321 |
|
| $ | — |
|
| $ | — |
|
| $ | — |
|
| $ | 4,701 |
|
| $ | 38,321 |
|
| $ | — |
|
| $ | 43,022 |
|
| $ | (2,362 | ) |
| 2013 |
| 9/30/2015 |
|
| (1) |
| |||||||
|
|
|
|
|
|
|
|
|
|
|
|
|
|
|
|
|
|
|
|
|
|
|
|
|
|
|
|
|
|
|
|
| |||||||||||||||||||||||||||||||||||||||||||||||||||||||||||
Cedar Lake Assisted Living and Memory Care |
|
|
|
|
|
|
|
|
|
|
|
|
|
|
|
|
|
|
|
|
|
|
|
|
|
|
|
|
|
|
|
|
|
|
|
|
|
|
|
|
|
|
|
|
|
|
|
|
|
|
|
|
|
|
|
|
|
|
|
|
|
|
|
|
|
|
|
|
|
|
|
|
|
|
|
|
|
|
|
|
|
|
|
| |||||||
Lake Zurich, Illinois ("Chicago") | $ | — |
| $ | 2,412 |
| $ | 25,126 |
| $ | 2 |
| ― |
| ― |
| 2,414 |
| 25,126 |
| ― |
| 27,540 |
| (859 | ) |
| 2014 |
| 9/30/2015 |
| (1) |
| $ | — |
|
| $ | 2,412 |
|
| $ | 25,126 |
|
| $ | — |
|
| $ | — |
|
| $ | — |
|
| $ | 2,412 |
|
| $ | 25,126 |
|
| $ | — |
|
| $ | 27,538 |
|
| $ | (1,546 | ) |
| 2014 |
| 9/30/2015 |
|
| (1) |
| |||||||
154
CNL HEALTHCARE PROPERTIES, INC. AND SUBSIDIARIES
SCHEDULE III – REAL ESTATE AND ACCUMULATED DEPRECIATION
AS OF DECEMBER 31, 20162017 (in thousands)
|
|
|
| Initial Costs |
| Costs Capitalized Subsequent to Acquisition |
| Gross Amounts at which Carried at Close of Period (2) |
|
|
|
|
|
|
|
|
|
|
|
|
|
|
| Initial Costs |
|
| Costs Capitalized Subsequent to Acquisition |
|
| Gross Amounts at which Carried at Close of Period (2) |
|
|
|
|
|
|
|
|
|
| Life on which |
| |||||||||||||||||||||||||||||||||||||||||||||||||
Property/Location | Encum- brances |
| Land & Land Improve- ments |
| Building and Building Improve- ments |
| Land & Land Improve- ments |
| Building and Building Improve- ments |
| Construc- tion in Process |
| Land & Land Improve- ments |
| Building and Building Improve- ments |
| Construc- tion in Process |
| Total |
| Accumu-lated Depreci-ation |
|
| Date of Construction |
| Date Acquired |
| Life on which depreciation in latest income statement is computed |
| Encum- brances |
|
| Land & Land Improve- ments |
|
| Building and Building Improve- ments |
|
| Land & Land Improve- ments |
|
| Building and Building Improve- ments |
|
| Construc- tion in Process |
|
| Land & Land Improve- ments |
|
| Building and Building Improve- ments |
|
| Construc- tion in Process |
|
| Total |
|
| Accumu- lated Depreci-ation |
|
| Date of Construction |
| Date Acquired |
| depreciation in latest income statement is computed |
| |||||||||||||||||||||||
Fieldstone at Pear Orchard |
|
|
|
|
|
|
|
|
|
|
|
|
|
|
|
|
|
|
|
|
|
|
|
|
|
|
|
|
|
|
|
|
|
|
|
|
|
|
|
|
|
|
|
|
|
|
|
|
|
|
|
|
|
|
|
|
|
|
|
|
|
|
|
|
|
|
|
|
|
|
|
|
|
|
|
|
|
|
|
|
|
|
|
|
|
|
|
|
|
|
|
Yakima Washington | $ | 8,861 |
| $ | 1,035 |
| $ | — |
| $ | 87 |
|
| 12,273 |
| ― |
| 1,122 |
| 12,273 |
| ― |
| 13,395 |
| (27 | ) |
| (3) |
| 10/12/2015 |
| (1) |
| $ | 10,900 |
|
| $ | 1,035 |
|
| $ | — |
|
| $ | 96 |
|
| $ | 13,486 |
|
| $ | — |
|
| $ | 1,131 |
|
| $ | 13,486 |
|
| $ | — |
|
| $ | 14,617 |
|
| $ | (379 | ) |
| 2016 |
| 10/12/2015 |
|
| (1) |
| ||||||
|
|
|
|
|
|
|
|
|
|
|
|
|
|
|
|
|
|
|
|
|
|
|
|
|
|
|
|
|
|
|
|
|
| ||||||||||||||||||||||||||||||||||||||||||||||||||||||||||
The Shores at Lake Phalen |
|
|
|
|
|
|
|
|
|
|
|
|
|
|
|
|
|
|
|
|
|
|
|
|
|
|
|
|
|
|
|
|
|
|
|
|
|
|
|
|
|
|
|
|
|
|
|
|
|
|
|
|
|
|
|
|
|
|
|
|
|
|
|
|
|
|
|
|
|
|
|
|
|
|
|
|
|
|
|
|
|
|
|
|
| ||||||
Maplewood, Minnesota ("St. Paul") | $ | — |
| $ | 2,724 |
| $ | 25,093 |
| $ | — |
| ― |
| ― |
| 2,724 |
| 25,093 |
| ― |
| 27,817 |
| (793 | ) |
| 2012 |
| 11/10/2015 |
| (1) |
| $ | — |
|
| $ | 2,724 |
|
| $ | 25,093 |
|
| $ | 10 |
|
| $ | — |
|
| $ | — |
|
| $ | 2,734 |
|
| $ | 25,093 |
|
| $ | — |
|
| $ | 27,827 |
|
| $ | (1,474 | ) |
| 2012 |
| 11/10/2015 |
|
| (1) |
| |||||||
|
|
|
|
|
|
|
|
|
|
|
|
|
|
|
|
|
|
|
|
|
|
|
|
|
|
|
|
|
|
|
|
|
| ||||||||||||||||||||||||||||||||||||||||||||||||||||||||||
Dogwood Forrest of Grayson |
|
|
|
|
|
|
|
|
|
|
|
|
|
|
|
|
|
|
|
|
|
|
|
|
|
|
|
|
|
|
|
|
|
|
|
|
|
|
|
|
|
|
|
|
|
|
|
|
|
|
|
|
|
|
|
|
|
|
|
|
|
|
|
|
|
|
|
|
|
|
|
|
|
|
|
|
|
|
|
|
|
|
|
|
| ||||||
Grayson, Georgia | $ | 3,351 |
| $ | 1,788 |
| $ | — |
| $ | 50 |
| ― |
| 15,506 |
| 1,838 |
| ― |
| 15,506 |
| 17,344 |
| ― |
|
| (3) |
| 11/24/2015 |
| (1) |
| $ | 15,628 |
|
| $ | 1,788 |
|
| $ | — |
|
| $ | 109 |
|
| $ | 22,257 |
|
| $ | — |
|
| $ | 1,897 |
|
| $ | 22,257 |
|
| $ | — |
|
| $ | 24,154 |
|
| $ | (335 | ) |
| 2017 |
| 11/24/2015 |
|
| (1) |
| |||||||
|
|
|
|
|
|
|
|
|
|
|
|
|
|
|
|
|
|
|
|
|
|
|
|
|
|
|
|
|
|
|
|
|
| ||||||||||||||||||||||||||||||||||||||||||||||||||||||||||
Center One |
|
|
|
|
|
|
|
|
|
|
|
|
|
|
|
|
|
|
|
|
|
|
|
|
|
|
|
|
|
|
|
|
|
|
|
|
|
|
|
|
|
|
|
|
|
|
|
|
|
|
|
|
|
|
|
|
|
|
|
|
|
|
|
|
|
|
|
|
|
|
|
|
|
|
|
|
|
|
|
|
|
|
|
|
| ||||||
Jacksonville, Florida | $ | — |
| $ | 8,294 |
| $ | 21,756 |
| $ | — |
| ― |
| ― |
| 8,294 |
| 21,756 |
| ― |
| 30,050 |
| (678 | ) |
| 2006 |
| 11/30/2015 |
| (1) |
| $ | — |
|
| $ | 8,294 |
|
| $ | 21,756 |
|
| $ | 1 |
|
| $ | 153 |
|
| $ | — |
|
| $ | 8,295 |
|
| $ | 21,909 |
|
| $ | — |
|
| $ | 30,204 |
|
| $ | (1,310 | ) |
| 2006 |
| 11/30/2015 |
|
| (1) |
| |||||||
|
|
|
|
|
|
|
|
|
|
|
|
|
|
|
|
|
|
|
|
|
|
|
|
|
|
|
|
|
|
|
|
|
| ||||||||||||||||||||||||||||||||||||||||||||||||||||||||||
Red Bank Professional Office Building |
|
|
|
|
|
|
|
|
|
|
|
|
|
|
|
|
|
|
|
|
|
|
|
|
|
|
|
|
|
|
|
|
|
|
|
|
|
|
|
|
|
|
|
|
|
|
|
|
|
|
|
|
|
|
|
|
|
|
|
|
|
|
|
|
|
|
|
|
|
|
|
|
|
|
|
|
|
|
|
|
|
|
|
|
| ||||||
Cincinnati, Ohio | $ | — |
| $ | 1,721 |
| $ | 7,721 |
| $ | — |
| ― |
| ― |
| 1,721 |
| 7,721 |
| ― |
| 9,442 |
| (236 | ) |
| 2001 |
| 12/14/2015 |
| (1) |
| $ | — |
|
| $ | 1,721 |
|
| $ | 7,721 |
|
| $ | — |
|
| $ | — |
|
| $ | — |
|
| $ | 1,721 |
|
| $ | 7,721 |
|
| $ | — |
|
| $ | 9,442 |
|
| $ | (455 | ) |
| 2001 |
| 12/14/2015 |
|
| (1) |
| |||||||
|
|
|
|
|
|
|
|
|
|
|
|
|
|
|
|
|
|
|
|
|
|
|
|
|
|
|
|
|
|
|
|
|
| ||||||||||||||||||||||||||||||||||||||||||||||||||||||||||
Park Place Senior Living at WingHaven |
|
|
|
|
|
|
|
|
|
|
|
|
|
|
|
|
|
|
|
|
|
|
|
|
|
|
|
|
|
|
|
|
|
|
|
|
|
|
|
|
|
|
|
|
|
|
|
|
|
|
|
|
|
|
|
|
|
|
|
|
|
|
|
|
|
|
|
|
|
|
|
|
|
|
|
|
|
|
|
|
|
|
|
|
| ||||||
O'Fallon, Missouri ("St. Louis") | $ | — |
| $ | 1,283 |
| $ | 48,221 |
| $ | — |
| ― |
| ― |
| 1,283 |
| 48,221 |
| ― |
| 49,504 |
| (1,269 | ) |
| 2006/2014 |
| 12/17/2015 |
| (1) |
| $ | — |
|
| $ | 1,283 |
|
| $ | 48,221 |
|
| $ | — |
|
| $ | — |
|
| $ | — |
|
| $ | 1,283 |
|
| $ | 48,221 |
|
| $ | — |
|
| $ | 49,504 |
|
| $ | (2,539 | ) |
| 2006/2014 |
| 12/17/2015 |
|
| (1) |
| |||||||
|
|
|
|
|
|
|
|
|
|
|
|
|
|
|
|
|
|
|
|
|
|
|
|
|
|
|
|
|
|
|
|
|
| ||||||||||||||||||||||||||||||||||||||||||||||||||||||||||
Siena Pavilion IV |
|
|
|
|
|
|
|
|
|
|
|
|
|
|
|
|
|
|
|
|
|
|
|
|
|
|
|
|
|
|
|
|
|
|
|
|
|
|
|
|
|
|
|
|
|
|
|
|
|
|
|
|
|
|
|
|
|
|
|
|
|
|
|
|
|
|
|
|
|
|
|
|
|
|
|
|
|
|
|
|
|
|
|
|
| ||||||
Henderson, Nevada ("Las Vegas") | $ | — |
| $ | 1,454 |
| $ | 4,786 |
| $ | — |
| ― |
| ― |
| 1,454 |
| 4,786 |
| ― |
| 6,240 |
| (140 | ) |
| 2002 |
| 12/18/2015 |
| (1) |
| $ | — |
|
| $ | 1,454 |
|
| $ | 4,786 |
|
| $ | — |
|
| $ | — |
|
| $ | — |
|
| $ | 1,454 |
|
| $ | 4,786 |
|
| $ | — |
|
| $ | 6,240 |
|
| $ | (280 | ) |
| 2002 |
| 12/18/2015 |
|
| (1) |
| |||||||
|
|
|
|
|
|
|
|
|
|
|
|
|
|
|
|
|
|
|
|
|
|
|
|
|
|
|
|
|
|
|
|
|
| ||||||||||||||||||||||||||||||||||||||||||||||||||||||||||
Siena Pavilion V |
|
|
|
|
|
|
|
|
|
|
|
|
|
|
|
|
|
|
|
|
|
|
|
|
|
|
|
|
|
|
|
|
|
|
|
|
|
|
|
|
|
|
|
|
|
|
|
|
|
|
|
|
|
|
|
|
|
|
|
|
|
|
|
|
|
|
|
|
|
|
|
|
|
|
|
|
|
|
|
|
|
|
|
|
| ||||||
Henderson, Nevada ("Las Vegas") | $ | — |
| $ | 3,944 |
| $ | 20,355 |
| $ | — |
| ― |
| ― |
| 3,944 |
| 20,355 |
| ― |
| 24,299 |
| (584 | ) |
| 2003 |
| 12/18/2015 |
| (1) |
| $ | — |
|
| $ | 3,944 |
|
| $ | 20,355 |
|
| $ | — |
|
| $ | — |
|
| $ | — |
|
| $ | 3,944 |
|
| $ | 20,355 |
|
| $ | — |
|
| $ | 24,299 |
|
| $ | (1,168 | ) |
| 2003 |
| 12/18/2015 |
|
| (1) |
| |||||||
|
|
|
|
|
|
|
|
|
|
|
|
|
|
|
|
|
|
|
|
|
|
|
|
|
|
|
|
|
|
|
|
|
| ||||||||||||||||||||||||||||||||||||||||||||||||||||||||||
Siena Pavilion VI |
|
|
|
|
|
|
|
|
|
|
|
|
|
|
|
|
|
|
|
|
|
|
|
|
|
|
|
|
|
|
|
|
|
|
|
|
|
|
|
|
|
|
|
|
|
|
|
|
|
|
|
|
|
|
|
|
|
|
|
|
|
|
|
|
|
|
|
|
|
|
|
|
|
|
|
|
|
|
|
|
|
|
|
|
| ||||||
Henderson, Nevada ("Las Vegas") | $ | — |
| $ | 2,599 |
| $ | 18,725 |
| $ | — |
| ― |
| ― |
| 2,599 |
| 18,725 |
| ― |
| 21,324 |
| (505 | ) |
| 2005 |
| 12/18/2015 |
| (1) |
| $ | — |
|
| $ | 2,599 |
|
| $ | 18,725 |
|
| $ | — |
|
| $ | 43 |
|
| $ | — |
|
| $ | 2,599 |
|
| $ | 18,768 |
|
| $ | — |
|
| $ | 21,367 |
|
| $ | (1,011 | ) |
| 2005 |
| 12/18/2015 |
|
| (1) |
| |||||||
|
|
|
|
|
|
|
|
|
|
|
|
|
|
|
|
|
|
|
|
|
|
|
|
|
|
|
|
|
|
|
|
|
| ||||||||||||||||||||||||||||||||||||||||||||||||||||||||||
Hearthside Senior Living of Collierville |
|
|
|
|
|
|
|
|
|
|
|
|
|
|
|
|
|
|
|
|
|
|
|
|
|
|
|
|
|
|
|
|
|
|
|
|
|
|
|
|
|
|
|
|
|
|
|
|
|
|
|
|
|
|
|
|
|
|
|
|
|
|
|
|
|
|
|
|
|
|
|
|
|
|
|
|
|
|
|
|
|
|
|
|
| ||||||
Collierville, Tennessee ("Memphis") | $ | — |
| $ | 1,756 |
| $ | 13,379 |
| $ | ― |
| ― |
| ― |
| 1,756 |
| 13,379 |
| ― |
| 15,135 |
| (374 | ) |
| 2014 |
| 12/29/2015 |
| (1) |
| $ | — |
|
| $ | 1,756 |
|
| $ | 13,379 |
|
| $ | 7 |
|
| $ | — |
|
| $ | — |
|
| $ | 1,763 |
|
| $ | 13,379 |
|
| $ | — |
|
| $ | 15,142 |
|
| $ | (748 | ) |
| 2014 |
| 12/29/2015 |
|
| (1) |
| |||||||
|
|
|
|
|
|
|
|
|
|
|
|
|
|
|
|
|
|
|
|
|
|
|
|
|
|
|
|
|
|
|
|
|
| ||||||||||||||||||||||||||||||||||||||||||||||||||||||||||
Cobalt Rehabilitation Hospital Surprise |
|
|
|
|
|
|
|
|
|
|
|
|
|
|
|
|
|
|
|
|
|
|
|
|
|
|
|
|
|
|
|
|
|
|
|
|
|
|
|
|
|
|
|
|
|
|
|
|
|
|
|
|
|
|
|
|
|
|
|
|
|
|
|
|
|
|
|
|
|
|
|
|
|
|
|
|
|
|
|
|
|
|
|
|
| ||||||
Surprise, Arizona ("Phoenix") | $ | 15,379 |
| $ | 2,464 |
| $ | 17,983 |
| $ | — |
| ― |
| ― |
| 2,464 |
| 17,983 |
| ― |
| 20,447 |
| (511 | ) |
| 2015 |
| 12/30/2015 |
| (1) |
| $ | 15,167 |
|
| $ | 2,464 |
|
| $ | 17,983 |
|
| $ | — |
|
| $ | — |
|
| $ | — |
|
| $ | 2,464 |
|
| $ | 17,983 |
|
| $ | — |
|
| $ | 20,447 |
|
| $ | (1,021 | ) |
| 2015 |
| 12/30/2015 |
|
| (1) |
| |||||||
|
|
|
|
|
|
|
|
|
|
|
|
|
|
|
|
|
|
|
|
|
|
|
|
|
|
|
|
|
|
|
|
| |||||||||||||||||||||||||||||||||||||||||||||||||||||||||||
Cobalt Rehabilitation Hospital New Orleans | $ | 19,500 |
| $ | 3,283 |
|
| 20,142 |
| $ | — |
| ― |
| ― |
| 3,283 |
| 20,142 |
| ― |
| 23,425 |
| (91 | ) |
| 2016 |
| 10/19/2016 |
| (1) |
|
|
|
|
|
|
|
|
|
|
|
|
|
|
|
|
|
|
|
|
|
|
|
|
|
|
|
|
|
|
|
|
|
|
|
|
|
|
|
|
|
|
|
|
|
|
|
|
|
|
|
| |||||||
New Orleans, Louisiana |
|
|
|
|
|
|
|
|
|
|
|
|
|
|
|
|
|
|
|
|
|
|
|
|
|
|
|
|
|
|
|
|
|
|
|
|
|
|
|
| $ | 19,421 |
|
| $ | 3,283 |
|
| $ | 20,142 |
|
| $ | — |
|
| $ | — |
|
| $ | — |
|
| $ | 3,283 |
|
| $ | 20,142 |
|
| $ | — |
|
| $ | 23,425 |
|
| $ | (639 | ) |
| 2016 |
| 10/19/2016 |
|
| (1) |
|
Albuquerque, New Mexico - Unimproved Land |
|
|
|
|
|
|
|
|
|
|
|
|
|
|
|
|
|
|
|
|
|
|
|
|
|
|
|
|
|
|
|
|
|
|
|
|
|
|
|
|
|
|
|
|
|
|
|
|
|
|
|
| |||||||||||||||||||||||||||||||||||||||
Albuquerque, New Mexico |
| $ | — |
|
| $ | 1,056 |
|
| $ | ― |
|
| $ | ― |
|
| $ | — |
|
| $ | — |
|
| $ | 1,056 |
|
| $ | — |
|
| $ | — |
|
| $ | 1,056 |
|
| $ | — |
|
| ― |
| 9/7/2017 |
|
|
|
| |||||||||||||||||||||||||||||||||||||||
| $ | 944,003 |
| $ | 240,171 |
|
| 2,235,690 |
|
| 5,392 |
|
| 121,099 |
|
| 89,722 |
|
| 245,563 |
|
| 2,356,789 |
|
| 89,722 |
|
| 2,692,074 |
|
| (153,124 | ) |
|
|
|
|
|
|
| $ | 1,038,767 |
|
| $ | 241,227 |
|
| $ | 2,235,690 |
|
| $ | 13,345 |
|
| $ | 231,543 |
|
| $ | — |
|
| $ | 254,572 |
|
| $ | 2,467,233 |
|
| $ | — |
|
| $ | 2,721,805 |
|
| $ | (219,457 | ) |
|
|
|
|
|
|
|
|
155
CNL HEALTHCARE PROPERTIES, INC. AND SUBSIDIARIES
SCHEDULE III – REAL ESTATE AND ACCUMULATED DEPRECIATION
AS OF DECEMBER 31, 20162017 (in thousands)
Transactions in real estate and accumulated depreciation as of December 31, 20162017 are as follows:
Balance December 31, 2013 |
| $ | 859,877 |
|
| Balance December 31, 2013 |
| $ | (11,011 | ) | ||||||||||
2014 Acquisitions |
|
| 822,305 |
|
| 2014 Depreciation |
|
| (29,456 | ) | ||||||||||
2014 Improvements |
|
| 39,247 |
|
| Balance December 31, 2014 |
|
| (40,467 | ) | ||||||||||
Balance December 31, 2014 |
|
| 1,721,429 |
|
| 2015 Depreciation |
|
| (49,734 | ) |
| $ | 1,721,429 |
|
| Balance December 31, 2014 |
| $ | (40,467 | ) |
2015 Acquisitions |
|
| 802,456 |
|
| Balance December 31, 2015 |
|
| (90,201 | ) |
|
| 802,456 |
|
| 2015 Depreciation |
|
| (49,734 | ) |
2015 Improvements |
|
| 65,018 |
|
| 2016 Depreciation |
|
| (63,745 | ) | ||||||||||
2015Improvements |
|
| 65,018 |
|
| Balance December 31, 2015 |
|
| (90,201 | ) | ||||||||||
Balance December 31, 2015 |
|
| 2,588,903 |
|
| 2016 Accumulated depreciation on dispositions |
|
| 822 |
|
|
| 2,588,903 |
|
| 2016 Depreciation |
|
| (63,745 | ) |
2016 Acquisitions |
|
| 23,425 |
|
| Balance December 31, 2016 |
| $ | (153,124 | ) |
|
| 23,425 |
|
| 2016 Accumulated depreciation on dispositions |
|
| 822 |
|
2016 Improvements |
|
| 97,767 |
|
|
|
|
|
|
|
|
| 97,767 |
|
| Balance December 31, 2016 |
|
| (153,124 | ) |
2016 Dispositions |
|
| (18,021 | ) |
|
|
|
|
|
|
|
| (18,021 | ) |
| 2017 Depreciation |
|
| (66,333 | ) |
Balance December 31, 2016 |
| $ | 2,692,074 |
|
|
|
|
|
|
|
|
| 2,692,074 |
|
| Balance December 31, 2017 |
| $ | (219,457 | ) |
2017 Acquisitions |
|
| 1,056 |
|
|
|
|
|
|
| ||||||||||
2017 Improvements |
|
| 28,675 |
|
|
|
|
|
|
| ||||||||||
Balance December 31, 2017 |
| $ | 2,721,805 |
|
|
|
|
|
|
| ||||||||||
_____________
FOOTNOTES:
(1) | Buildings and building improvements are depreciated over 39 and 15 years, respectively. Tenant improvements are depreciated over the terms of their respective leases. |
(2) | The aggregate cost for federal income tax purposes is approximately $3.0 billion. |
|
|
CNL HEALTHCARE PROPERTIES, INC. AND SUBSIDIARIES
SCHEDULE IV – MORTGAGE LOANS ON REAL ESTATE
YEARS ENDED DECEMBER 31, 2017, 2016 2015 AND 20142015 (in thousands)
The following is a reconciliation of mortgages and other notes receivable on real estate for the years ended December 31, 2017, 2016 2015 and 20142015 (in thousands):
|
| 2016 |
|
| 2015 |
|
| 2014 |
|
| 2017 |
|
| 2016 |
|
| 2015 |
| ||||||
Balance at beginning of year |
| $ | — |
|
| $ | — |
|
| $ | 3,949 |
|
| $ | — |
|
| $ | — |
|
| $ | — |
|
Additions during period: |
|
|
|
|
|
|
|
|
|
|
|
|
|
|
|
|
|
|
|
|
|
|
|
|
New mortgage loans and additional advances |
|
| — |
|
|
| — |
|
|
| 2,065 |
|
|
| 1,168 |
|
| ― |
|
| ― |
| ||
Accrued and deferred interest |
|
| — |
|
|
| — |
|
|
| 288 |
|
|
| 11 |
|
| ― |
|
| ― |
| ||
Deductions during period: |
|
|
|
|
|
|
|
|
|
|
|
|
|
|
|
|
|
|
|
|
|
|
|
|
Collection of principal |
|
| — |
|
|
| — |
|
|
| (6,302 | ) |
| ― |
|
| ― |
|
| ― |
| |||
Balance at end of year |
| $ | — |
|
| $ | — |
|
| $ | — |
|
| $ | 1,179 |
|
| $ | — |
|
| $ | — |
|
There were no changes in or disagreements with our independent registered certified public accountants during the period ended December 31, 2016.2017.
Evaluation of Disclosure Controls and Procedures
Pursuant to Rule 13a-15(b) under the Exchange Act, under the supervision and with the participation of our management, including our principal executive officer and principal financial officer, we conducted an evaluation of the effectiveness of our disclosure controls and procedures (as defined under Rule 13a-15(e) under the Exchange Act) as of the end of the period covered by this report. Based upon that evaluation, our management, including our principal executive officer and principal financial officer, concluded that our disclosure controls and procedures are effective as of the end of the period covered by this report.
Management’s Report on Internal Control Over Financial Reporting
Management is responsible for establishing and maintaining adequate internal control over financial reporting (as defined in Rule 13a-15(f) under the Securities Exchange Act of 1934, as amended). The Company’s internal control over financial reporting is designed to provide reasonable assurance to the Company’s management and board of directors regarding the preparation and fair presentation of published financial statements.
Because of its inherent limitations, internal control over financial reporting may not prevent or detect misstatements. Also, projections of any evaluation of effectiveness to future periods are subject to the risk that controls may become inadequate because of changes in conditions, or that the degree of compliance with the policies or procedures may deteriorate.
Based on management’s assessment, the Company maintained, in all material respects, effective internal control over financial reporting as of December 31, 20162017 using the criteria set forth by the Committee of Sponsoring Organizations of the Treadway Commission (COSO) in “Internal Control Integrated Framework (2013).
Pursuant to rules established by the Securities and Exchange Commission, this annual report does not include an attestation report of the Company’s independent registered public accounting firm regarding internal control over financial reporting.
Changes in Internal Control over Financial Reporting
During the most recent fiscal quarter, there was no change in our internal controls over financial reporting (as defined under Rule 13a-15(f) under the Exchange Act) that has materially affected, or is reasonably likely to materially affect, our internal controls over financial reporting.
None.
Directors and Executive Officers
Our directors and executive officers as of March 16, 2018 were as follows:
Name | Age | Position | ||
James M. Seneff, Jr. | 70 | Director and Chairman of the Board | ||
Stephen H. Mauldin | 49 | Director, Vice Chairman of the Board, President and Chief Executive Officer | ||
James Chandler Martin | 67 | Independent Director and Audit Committee Financial Expert | ||
Michael P. Haggerty | 65 | Independent Director | ||
J. Douglas Holladay | 71 | Independent Director | ||
Ixchell C. Duarte | 51 | Chief Financial Officer, Senior Vice President and Treasurer (Principal Financial Officer) | ||
John F. Starr | 43 | Chief Operating Officer and Senior Vice President | ||
Tracey B. Bracco | 38 | General Counsel, Senior Vice President and Secretary | ||
L. Burke Rainey | 35 | Vice President and Chief Accounting Officer (Principal Accounting Officer) | ||
James M. Seneff, Jr. On December 7, 2017, Mr. Seneff was appointed to serve as chairman of the board and director of the Company, effective January 1, 2018, upon the resignation of Thomas Sittema, who had served as chairman of the board and director, since 2016 and 2012, respectively. Mr. Seneff previously served as chairman of the board of directors of the Company from May 2011, and as a director since the Company’s inception in June 2010, until June 2016, when he declined to stand for re-election to the board of directors. Mr. Seneff has served as the chairman of the Advisor since its inception in June 2010. Mr. Seneff served as chairman of the board of directors and a director of CNL Lifestyle Properties, Inc., a public, non-traded REIT from its inception in 2003 until its dissolution in December 2017 and as a director of its advisor, CNL Lifestyle Advisor Corporation from December 2010 until 2017. Mr. Seneff also served as chairman of the board of directors and a director of CNL Growth Properties, Inc., a public, non-traded REIT, since August 2009 and December 2008, respectively, until June 2016, and served as a manager of its advisor, CNL Global Growth Advisors, LLC, from 2008 to 2017. Mr. Seneff also served as chairman of the board of directors and a director of Global Income Trust, Inc., another public, non-traded REIT, from April 2009 until its dissolution in December 2015 and as manager of its advisor until December 2016. Mr. Seneff is the sole member of CNL Holdings, LLC (“CNL Holdings”) and has served as the chairman, chief executive officer and/or president of several of CNL Holdings’ subsidiaries, including chief executive officer and president (2008 to 2013) of CNL Financial Group, LLC, our sponsor, and as executive chairman (January 2011 to present), chairman (1988 to January 2011), chief executive officer (1995 to January 2011) and president (1980 to 1995) of CNL Financial Group, Inc., a diversified real estate company. Mr. Seneff also serves on the board of directors CNL Securities Corp., a FINRA-registered broker-dealer and the managing dealer of our offerings (1979 to 2013); and CNL Capital Markets Corp. (1990 to present). Mr. Seneff was also the chairman and a principal stockholder of CNLBancshares, Inc. (1999 to 2015), which owned CNLBank until it merged into Valley National Bank in 2015. Mr. Seneff received his B.A. in business administration from Florida State University.
As a result of these professional and other experiences, Mr. Seneff possesses particular knowledge of real estate acquisitions, ownership and dispositions in a variety of public and private real estate investment vehicles, which strengthens the board's collective knowledge, capabilities and experience. Mr. Seneff is principally responsible for overseeing the formulation of our strategic objectives.
Stephen H. Mauldin, Vice Chairman of the Board and Director. Mr. Mauldin has served as our vice chairman of the board of directors and a director since June 2016, as our president since September 2011 and as our chief executive officer since April 2012. Mr. Mauldin has also served as president and chief operating officer of our Advisor since September 2011 and as chief executive officer of our Advisor since January 2018. Mr. Mauldin has served as a director of CNL Healthcare Properties II, Inc., a public, non-traded REIT, since November 2015, as vice chairman of
its board of directors from November 2015 to December 2017, as chairman of its board of directors since January 2018, as its chief executive officer and president since July 2015, as manager, chief operating officer and president of its advisor since July 2015, and as chief executive officer of its advisor since January 2018. Mr. Mauldin also served as president of CNL Growth Properties, Inc., a public, non-traded REIT, from March 2016 and as chief executive officer from August 2016 until its dissolution in October 2017. Mr. Mauldin also served as president (from September 2011), chief executive officer (since April 2012) and chief operating officer (September 2011 to April 2012) of CNL Lifestyle Properties, Inc., a public-non-traded REIT, until its dissolution in December 2017, as well as president and chief operating officer of CNL Lifestyle Advisor Corporation, its advisor, from September 2011 to December 31, 2017.
Prior to joining us, Mr. Mauldin served as a consultant to Crosland, LLC, a privately held real estate development and asset management company headquartered in Charlotte, North Carolina, from March 2011 through August 2011. He previously served as Crosland’s chief executive officer, president and a member of its board of directors from July 2010 until March 2011. Mr. Mauldin originally joined Crosland, LLC in 2006 and served as its chief financial officer from July 2009 to July 2010 and as president of Crosland’s mixed-use and multi-used development division prior to his appointment as chief financial officer. Prior to joining Crosland, LLC, from 1998 to June 2006, Mr. Mauldin was a co-founder and served as a partner of Crutchfield Capital, LLC, a privately held investment and operating company with a focus on small and medium-sized companies in the southeastern United States. Mr. Mauldin graduated with a B.S. in finance from the University of Tampa and received an M.B.A. with majors in real estate, finance, managerial economics and accounting/information systems from the J.L. Kellogg Graduate School of Management at Northwestern University.
As a result of these professional and other experiences, Mr. Mauldin possesses particular knowledge of real estate investment, including acquisition, development, financing, operation, and disposition, which strengthens the board of directors’ collective knowledge, capabilities and experience.
J. Chandler Martin, Independent Director and Audit Committee Financial Expert. Mr. Martin has been an independent director and has served as our audit committee financial expert since July 2012. Mr. Martin has also served as independent director and audit committee financial expert of CNL Healthcare Properties II, Inc., a public-non-traded REIT, since January 2016. Mr. Martin served as Corporate Treasurer of Bank of America, a banking and financial services company, from 2005 until his retirement in March 2008. During his 27 years at Bank of America, Mr. Martin held a number of line and risk management roles, including leadership roles in commercial real estate risk management, capital markets risk management, and private equity investing. As corporate treasurer, he was responsible for funding, liquidity, and interest rate risk management. From 2003 to 2005, Mr. Martin was Bank of America’s enterprise market and operational risk executive, and from 1999 until 2003, he served as the risk management executive for Bank of America’s global corporate and investment banking. From April 2008 through July 2008, following his retirement, Mr. Martin served as a member of the Counterparty Risk Management Policy Group III (“CPMPG III”), co-chaired its Risk Monitoring and Risk Management Working Group, and participated in the production of CPMPG III’s report: “Containing Systemic Risk: The Road to Reform,” a forward-looking and integrated framework of risk management best practices. Mr. Martin returned to Bank of America in October 2008 to assist with the integration process for enterprise risk management following Bank of America’s acquisition of Merrill Lynch. After working on the transition, Mr. Martin served as Bank of America’s enterprise credit and market risk executive until July 2009. Between October 2011 until its acquisition in October 2016, Mr. Martin served as a director of CommunityOne Bancorporation, a community bank holding company headquartered in Asheboro, North Carolina. Mr. Martin also serves on the board of directors of Burroughs & Chapin Company, Inc., a South Carolina based REIT, serving on the audit, personnel and compensation committees. He also serves on the board of directors of Wings Capital Partners LLC, a California based aviation finance company. He serves as a member of the advisory board of Corrum Capital Management, an alternative investment management firm. Mr. Martin attained an M.B.A. from Samford University and a B.A. in economics from Emory University.
As a result of these professional and other experiences, Mr. Martin possesses particular knowledge of, among other things, systems of internal controls, risk management best practices, sound corporate governance, and the relationship between liquidity, leverage and capital adequacy, which strengthens the board of directors’ collective knowledge, capabilities and experience.
Michael P. Haggerty, Independent Director. Mr. Haggerty joined the board of directors as an independent director in April 2012. Mr. Haggerty was a partner at Jackson Walker, LLC, a Dallas-based law firm, for more than 37 years, where he headed the Firm’s finance group. Mr. Haggerty’s commercial real estate practice included the
negotiation, structuring, and documentation of interim and permanent financing of office buildings, shopping centers, retirement facilities, restaurants, industrial properties, and multi-family residential projects. The credit facilities involved both single asset and portfolio transactions; multi-state transactions; partnerships, corporations, REITs, conduits, and pension funds; equity participations; loan participations; letters of credit; multi-creditor facilities; and commercial and residential mortgage warehouse lines of credit. In January 2016, Mr. Haggerty left Jackson Walker, LLC to become the executor of the Estate of Bert Fields, Jr. The estate owns extensive oil and gas properties, the controlling ownership interest of North Dallas Bank & Trust and a ranching operation. Mr. Haggerty is President of Fields Oil & Gas Company, LLC and Fields Cattle Company, LLC and is a director of North Dallas Bank & Trust Co. Mr. Haggerty attained a B.B.A. from the University of Georgia and a J.D. from the University of Virginia School of Law. Since 1978, Mr. Haggerty has been admitted to practice law in the states of both Texas and Georgia.
As a result of these professional and other experiences, Mr. Haggerty possesses particular knowledge of real estate and commercial law, which strengthens the board of directors’ collective knowledge, capabilities and experience.
J. Douglas Holladay, Independent Director. Mr. Holladay has been an independent director since April 2012. Mr. Holladay has served as a general partner of Elgin Capital Partners, a private energy company based in Denver from 2008 to the present. He is an advisor to Alexander Proudfoot, Headwaters, the Business Growth Alliance, and the Case Foundation. From 1999 to 2008, Mr. Holladay was co-founder of a middle market private equity fund, Park Avenue Equity Partners. Since 2011, Mr. Holladay has been a guest columnist for the online Washington Post and is an adjunct professor at Georgetown University. From 2009 to the present, Mr. Holladay has served on the board of directors of Miraval, a privately held luxury resort and spa located in Arizona. From July 2004 to April 2007, Mr. Holladay served as a director of CNL Hotels & Resorts, Inc., a public non-traded REIT affiliated with CNL. From 2004 until July 2008, Mr. Holladay also served as an advisor to Providence Capital (now CNL Opportunity Fund), a hedge fund based in Minnesota. Previously, Mr. Holladay held senior positions at Goldman, Sachs & Co., the U.S. State Department and the White House. While a diplomat, Mr. Holladay was accorded the personal rank of ambassador. Between 2000 and 2009, Mr. Holladay served as a director for Sunrise Senior Living, Inc., a public company that provides senior living services in the United States, Canada and the United Kingdom. Mr. Holladay attained an M.Litt. in political and economic history from Oxford University, an M.A. in theology from Princeton Theological Seminary, and an A.B. in political science from the University of North Carolina, Chapel Hill. He holds honorary doctorates from Morehouse College and Nyack College.
As a result of these professional and other experiences, Mr. Holladay possesses particular knowledge of real estate investment and finance and the capital markets, which strengthens the board of directors’ collective knowledge, capabilities and experience.
Ixchell C. Duarte, Chief Financial Officer, Senior Vice President and Treasurer. Ms. Duarte has served as our chief financial officer and treasurer since February 2018 and as a senior vice president since March 2012. She previously served as the Company’s chief accounting officer from March 2012 to June 2017 and as a vice president from February 2012 to March 2012. Ms. Duarte has served as senior vice president and chief accounting officer of our advisor since November 2013. Ms. Duarte served as senior vice president and chief accounting officer of CNL Lifestyle Properties, Inc., a public, non-traded REIT from March 2012 until its dissolution in December 2017 and as its vice president from February 2012 to March 2012, as well as senior vice president and chief accounting officer of its advisor since November 2013. Ms. Duarte served as senior vice president and chief accounting officer of CNL Growth Properties, Inc., a public non-traded REIT from June 2012 until its dissolution in October 2017 and as senior vice president of its advisor from November 2013 to December 2017. Ms. Duarte also served as senior vice president and chief accounting officer of Global Income Trust, Inc., another public non-traded REIT, from June 2012 until its dissolution in December 2015 and served as a senior vice president of its advisor from November 2013 to December 2016. Ms. Duarte has served as chief financial officer and treasurer of CNL Healthcare Properties II, Inc., a public, non-traded REIT, since February 2018, and has served as senior vice president since January 2016. She also served as chief accounting officer from January 2016 to June 2017 and as senior vice president and chief accounting officer of its advisor, CHP II Advisors, LLC, since July 2015. Ms. Duarte served as controller at GE Capital, Franchise Finance, from February 2007 through January 2012 and served as senior vice president and chief accounting officer of Trustreet Properties, Inc., a publicly traded REIT. Prior to that, she held various other positions with Trustreet and predecessor CNL companies, including senior vice president, chief financial officer, secretary and treasurer. Ms. Duarte began her career in the audit practice of KPMG, LLP and then Coopers & Lybrand. She received a B.S. in accounting from the Wharton School of the University of Pennsylvania and is a certified public accountant.
John F. Starr. Chief Operating Officer and Senior Vice President.Mr. Starr has served as the Company’s chief operating officer since February 2018 and as senior vice president since March 2013. Mr. Starr also has served as chief operating officer of CNL Healthcare Properties II, Inc., a public, non-traded REIT, since February 2018 and as senior vice president since January 2016. Mr. Starr served as Senior Vice President of CNL Lifestyle Properties, Inc., from March 2013 until its dissolution in December 2017. Mr. Starr served as chief portfolio management officer of CNL Growth Properties, Inc., a public, non-traded REIT from December 2012 until its dissolution in October 2017. Mr. Starr served as chief portfolio management officer of Global Income Trust, Inc. from December 2012 until its dissolution in December 2015. Mr. Starr has served as group chief operating officer at CNL Financial Group Investment Management, LLC since February 2018 and as chief portfolio management officer (January 2013 to November 2015) and chief portfolio officer (November 2015 to February 2018) responsible for developing and implementing strategies to maximize the financial performance of CNL’s real estate portfolios. He also served as a senior vice president of CNL Private Equity Corp. from December 2010 until his appointment as the chief portfolio management officer. Between June 2009 and December 2010, he served as CNL Private Equity Corp.’s senior vice president of asset management, responsible for the oversight and day-to-day management of all real estate assets from origination to disposition. At CNL Management Corp., Mr. Starr served as senior vice president of asset management, from June 2007 to December 2010. Between January 2004 and February 2005, Mr. Starr served as vice president of real estate portfolio management at Trustreet, and from February 2005 to February 2007, he served as Trustreet’s vice president of special servicing, and as president of a Trustreet affiliate, where he was responsible for the resolution and value optimization of distressed leases and loans. From February 2007 to May 2007, following the sale of Trustreet to GE Capital, he served as GE Capital, Franchise Finance’s vice president of special servicing, before rejoining CNL affiliates in June 2007. Between May 2002 and January 2004, Mr. Starr was assistant vice president of special servicing at CNL Restaurant Properties, Inc. Prior to joining CNL’s affiliates, Mr. Starr served in various positions in the credit products management group at Wachovia Bank, Orlando, Florida, from December 1997 to May 2002. Mr. Starr received a B.S. in business and an M.B.A. from the University of Florida in 1997 and 2007, respectively.
Tracey B. Bracco., General Counsel, Senior Vice President and Secretary. Ms. Bracco has served as general counsel, senior vice president and secretary of the Company since March 2018. Ms. Bracco has served as assistant general counsel and assistant secretary of the Company since June 2014 and as vice president since March 2013. Ms. Bracco also has served as general counsel and secretary of CNL Healthcare Properties II, Inc., a public, non-traded REIT, since August 23, 2016 and as its vice president since January 2016, as well as vice president of its advisor, CHP II Advisors, LLC, since its inception on July 9, 2015. Ms. Bracco has served as deputy general counsel, real estate of CNL Financial Group Investment Management, LLC since March 2016, and previously served as assistant general counsel (April 2013 to March 2016), where she oversees CNL’s non-traded REITS, as well as supervising the acquisition and asset management functions relating to fund management for CNL. Ms. Bracco served as assistant general counsel and assistant secretary of CNL Lifestyle Properties, Inc., a public, non-traded REIT, from June 2014 and as vice president since March 2013 until its dissolution in December 2017 and as vice president of its advisor since November 2013. Prior to joining CNL Lifestyle Properties, Inc., Ms. Bracco spent six years in private legal practice, primarily at the law firm of Lowndes, Drosdick, Doster, Kantor & Reed, P.A., in Orlando, Florida. Ms. Bracco is licensed to practice law in Florida and is a member of the Florida Bar Association and the Association of Corporate Counsel. She received a B.S. in Journalism from the University of Florida and her J.D. from Boston University School of Law.
L. Burke Rainey.Vice President and Chief Accounting Officer. Mr. Rainey has served as the Company’s vice president and chief accounting officer since June 2017, having served as the Company’s controller from April 2014 to June 2017 and as director of accounting and financial reporting from November 2012 to March 2014. Mr. Rainey also has served in comparable positions at CNL Healthcare Properties II, Inc., a public non-traded REIT, since its inception in July 2015 and Global Income Trust, Inc., a public non-traded REIT, from November 2012 through its dissolution in December 2015. Prior to joining the Company, Mr. Rainey worked in the assurance practice of Ernst & Young LLP’s Miami office, most recently serving as an audit manager on several multinational clients. He is a licensed certified public accountant in the State of Florida and a chartered global management accountant. Mr. Rainey received a B.B.A with a major in accountancy and an M.S.A with a concentration in financial reporting and assurance services from the Mendoza College of Business at the University of Notre Dame.
Board Leadership Structure and Risk Oversight
Separate CEO and Chairman
The information requiredCompany currently operates under a leadership structure in which the positions of chairman of the Board and chief executive officer have been separated, such that each position is held by a different person. Although the Board has no mandatory policy with respect to the separation of the offices of chairman and the chief executive officer, the Board believes that it is appropriate to have these as separate positions at this Item is incorporated by reference to our Definitive Proxy Statement to be filedtime on account of the varying strengths, experiences and relationships of each of these individuals in the real estate industry. Mr. Seneff serves as the chairman of the Board and has unique knowledge, experience and relationships with the Commissionboard of directors and management and within a broad spectrum of the real estate market. Mr. Mauldin serves as our president and chief executive officer, in addition to his position of vice chairman of the Board.
Board Structure and Director Independence
Under our organizational documents, we must have at least three but not more than fifteen directors. The Board of Directors has currently set the number of directors at five. A majority of these directors must be “independent.” An “Independent Director” is defined under our Third Articles of Amendment and Restatement (“Charter”) as one who is not, and within the last two years has not been, directly or indirectly associated with the Sponsor or the Advisor by virtue of (i) ownership of an interest in the Sponsor, the Advisor or any of their affiliates, (ii) employment by the Sponsor, the Advisor or any of their affiliates, (iii) service as an officer or director of the Sponsor, the Advisor or any of their affiliates, (iv) performance of services, other than as a director, for the Company, (v) service as a director or trustee of more than three REITs sponsored by the Sponsor or advised by the Advisor, or (vi) maintenance of a material business or professional relationship with the the Sponsor, Advisor or any of their affiliates. An indirect relationship shall include circumstances in which a director’s spouse, parents, children, siblings, mothers- or fathers-in-law, sons- or daughters-in-law or brothers- or sisters-in-law is or has been associated with the Sponsor, the Advisor, any of their affiliates or the Company. A business or professional relationship is considered material if the gross revenue derived by the director from the Sponsor, the Advisor and any of their affiliates exceeds five percent of either the director’s annual gross revenue during either of the last two years or the director’s net worth on a fair market value basis. The Board annually reviews business and charitable relationships of directors in order to make a determination as to the independence of each director. Only those directors whom the Board determines have no latermaterial relationship with us or our affiliates that would impair their independent judgment are considered independent directors. The Board has considered the independence of each director and nominee for election as a director in accordance with the elements of independence set forth in our Charter and the elements of independence in the listing standards of the New York Stock Exchange (“NYSE”), even though our shares are not listed on the NYSE. After performing such a review, based upon information solicited from each nominee, the Board has affirmatively determined that each of Messrs. Martin, Haggerty and Holladay has no material relationship with the Company (either directly or as a partner, stockholder or officer of an organization that has a relationship with the Company) other than April 30,as a director of the Company and each satisfies the elements of independence set forth in our Charter and in the listing standards of the NYSE, as currently in effect. There are no familial relationships between any of our directors and executive officers.
We believe that our Board leadership structure is effective for the Company and provides for appropriate oversight of the Company’s risk management, by providing balanced leadership through the separated chairman and chief executive officer positions, and by having strong independent leaders on the Board who are fully engaged and provide significant input into Board deliberations and decisions. Below is additional information about our risk oversight procedures.
Board Meetings and Attendance
The Board of Directors held four (4) meetings in 2017. All directors attended 100% of the meetings of the Board. Although the Company does not have a policy on director attendance at the annual meetings of stockholders, directors are encouraged to do so.
Audit Committee
The Company has a standing Audit Committee, the members of which are selected by the Board each year. The Audit Committee, which is composed entirely of Independent Directors, is chaired by an Independent Director. The current membership of the Audit Committee and other descriptive information is summarized below.
Independent Directors | Position | |||
J. Chandler Martin | C, E | |||
Michael P. Haggerty | M | |||
J. Douglas Holladay | M | |||
Number of 2017 Meetings | 4 | |||
FOOTNOTE:
(1) | C – Committee Chair |
(2) | E – Audit Committee Financial Expert |
(3) | M – Committee Member |
The Audit Committee operates under a written charter adopted by the Board, which can be found in the Corporate Governance section of the Investor Relations page of our website, CNLHealthcareProperties.com.
The Audit Committee assists the Board by providing oversight responsibilities relating to the following:
The integrity of financial reporting;
The annual independent audit process;
The independence, qualifications and performance of our independent auditor;
Our systems of internal control over financial reporting and disclosure controls and procedures;
The performance of our internal audit department;
Compliance with management’s audit, accounting and financial reporting policies and procedures;
Our policies and procedures for risk assessment and risk management; and
The process to estimate the Company’s NAV per share on an annual basis.
In addition, the Audit Committee engages and is responsible for the compensation and oversight of the Company’s independent auditors and internal auditors. In performing these functions, the Audit Committee meets periodically with the independent auditors, management and internal auditors (including private sessions) to review the results of their work. During the year ended December 31, 2017, the Audit Committee held a total of four (4) meetings, including four (4) meetings with the Company’s independent auditors, internal auditors and management to discuss the annual and quarterly financial reports prior to the filing of such reports with the SEC (the Commission”). Each member of the Audit Committee attended 100% of the meetings.
The Board has determined that each member of the Audit Committee is independent under our Charter and the listing standards of the NYSE, as currently in effect. In addition, the Audit Committee determined that Mr. Martin is an “audit committee financial expert” under the rules and regulations of the Commission for purposes of Section 407 of the Sarbanes-Oxley Act of 2002.
Other Board Committees
In August 2013, the Board initiated a process to estimate the Company’s NAV per share and created a special committee, comprised solely of independent directors, charged with oversight of the Company’s valuation process (the “Valuation Committee”).
Currently, the Company does not have a nominating committee or a compensation committee. The Board is of the view that it is not necessary to have a nominating committee at this time because the Board is composed of only five members, a majority of whom are “independent” (as defined under our Charter and the listing standards of the NYSE, as currently in effect). The Board does not have a compensation committee because the Company is externally advised and does not have any employees. We do not separately compensate our executive officers for their services as officers. At such time, if any, as the Company’s shares of common stock are listed on a national securities exchange such as the NYSE or the NASDAQ Stock Market, or the Company has employees to whom it directly provides compensation, the Board will form a compensation committee, the members of which will be selected by the full Board annually.
Risk Oversight
The Audit Committee focuses on the adequacy of the Company’s enterprise risk management and risk mitigation processes. The Audit Committee meets regularly to discuss the strategic direction and the issues and opportunities facing the Company in light of trends and developments in the REIT industry and general business environment. Throughout the year, the Board provides guidance to management regarding the Company’s strategy and helps to refine its operating plans to implement the Company’s strategy. Annually, Internal Audit presents the results of the enterprise risk assessment to the Audit Committee. The risk assessment approach includes reviewing the categories of risk the Company faces, including any fraud and business risks, as well as the likelihood of occurrence, the potential impact of those risks and mitigating measures. The involvement of the Audit Committee in setting the Company’s business strategy is critical to the determination of the types and appropriate levels of risk undertaken by the Company. The Board’s role in risk oversight of the Company is consistent with the Company’s leadership structure, with the president and chief executive officer and other members of senior management having responsibility for assessing and managing the Company’s risk exposure, and the Board and the Audit Committee providing oversight of risk management efforts.
Committee Charters and Other Corporate Governance Documents
The Board has adopted corporate governance policies and procedures that the Board believes are in the best interest of the Company and its stockholders as well as compliant with the Sarbanes-Oxley Act of 2002 and the rules and regulations of the Commission, more particularly:
A majority of the Board and all of the members of the Audit Committee are independent, as discussed above in “Board Structure and Director Independence.”
The Board has adopted a charter for the Audit Committee; and one member of the Audit Committee is an “audit committee financial expert” as defined in Commission rules.
The Audit Committee hires, determines compensation of, and decides the scope of services performed by the Company’s independent auditors.
The Company has adopted a Code of Business Conduct that applies to all directors, managers, officers and employees of the Company, as well as all directors, managers, officers and employees of our advisor, CNL Healthcare Corp. (the “Advisor”). The Code of Business Conduct sets forth the basic principles to guide their day-to-day activities.
The Company has adopted a Whistleblower Policy that applies to the Company and all employees of the Advisor, and establishes procedures for the anonymous submission of employee complaints or concerns regarding financial statement disclosures, accounting, internal accounting controls or auditing matters.
The Audit Committee Charter, and the Whistleblower Policy and the Code of Business Conduct are available in the Corporate Governance section of the Forms and Literature page of our website, CNLHealthcareProperties.com, and will be sent to any stockholder who requests them from CNL Client Services, 450 South Orange Avenue, Orlando, Florida 32801, (866) 650-0650.
Board of Directors Report on Compensation
The following report of the Board should not be deemed “filed” with the Commission or incorporated by reference into any other filing the Company makes under the Securities Act or the Exchange Act except to the extent the Company specifically incorporates this report by reference therein.
The Board reviewed and discussed with management the Compensation Discussion and Analysis set forth below (“CD&A”). Based on the Board’s review of the CD&A and the Board’s discussions of the CD&A with management, the Board approved including the CD&A in this Annual Report on Form 10-K for filing with the Commission.
The Board of Directors |
James M. Seneff, Jr. |
Stephen H. Mauldin |
J. Chandler Martin |
Michael P. Haggerty |
J. Douglas Holladay |
Compensation Discussion and Analysis
The Company has no employees and all of its executive officers are officers of the Advisor and/or one or more of the Advisor’s affiliates and are compensated by those entities, in part, for their service rendered to the Company. The Company does not separately compensate its executive officers for their service as officers. The Company did not pay any annual salary or bonus or long-term compensation to its executive officers for services rendered in all capacities to the Company during the year ended December 31, 2017. See “Certain Relationships and Related Transactions” for a description of the fees paid and expenses reimbursed to the Advisor and its affiliates.
If the Company determines to compensate named executive officers in the future, the board of directors will review all forms of compensation and approve all stock option grants, warrants, stock appreciation rights and other current or deferred compensation payable with respect to the current or future value of the Company’s shares.
Compensation of Directors
Two of our directors, Messrs. Seneff and Mauldin, are employed by and receive compensation from affiliates of our Advisor. We do not separately compensate them for their services as directors to the Company. Below is information regarding the compensation program in effect during 2017 for our independent directors.
Annual Board Retainer |
| $ | 45,000 |
|
Annual Audit Committee Retainer |
| $10,000 - Audit Committee Chair |
| |
Board and Committee Meeting Attendance Fees |
| $2,000 for each Board and Committee Meeting attended |
| |
Other Fees |
| $2,000 per day for other meetings and Company related business outside of normally scheduled Board and Committee meetings, however, no compensation is paid for attending Annual Meetings of Stockholders. |
| |
In addition to the above Annual retainers and fees, we pay for or reimburse our independent directors for their meeting-related expenses. The purpose of our independent director compensation program is to allow us to continue to attract and retain qualified Board members and recognize the significant commitment required by this Item is incorporated by referenceof our directors.
The following table gives information regarding the compensation we provided to our Definitive Proxy Statement to be filed with the Commission no later than April 30,directors in 2017.
Director Compensation - 2017 Fiscal Year Name |
| Fees Earned or Paid in Cash |
|
| Total Compensation |
| ||
Thomas K. Sittema (Chairman) (1) |
| $ | — |
|
| $ | — |
|
Stephen H. Mauldin |
| ― |
|
| ― |
| ||
J. Chandler Martin |
|
| 73,000 |
|
|
| 73,000 |
|
Michael P. Haggerty |
|
| 63,000 |
|
|
| 63,000 |
|
J. Douglas Holladay |
|
| 63,000 |
|
|
| 63,000 |
|
FOOTNOTE:
(1) | Mr. Sittema served as Chairman of the Board during 2017 until his resignation effective December 31, 2017. |
Item 12. | SECURITY OWNERSHIP OF CERTAIN BENEFICIAL OWNERS AND MANAGEMENT AND RELATED STOCKHOLDER MATTERS |
The following table sets forth information regarding the shares of the Company’s common stock beneficially owned by each director and nominee, by each executive officer and by all executive officers and directors as a group, based upon information furnished by such stockholders, directors and officers. Unless otherwise noted below, such persons have sole investment and voting power over the shares. The address of the named officers and directors is CNL Center at City Commons, 450 South Orange Avenue, Orlando, Florida 32801.
The information requirednumber of shares of our common stock beneficially owned by this Item is incorporated by referenceany director or executive officer did not exceed 1% of the total shares outstanding at March 16, 2018.
Name | Number of Shares | |||
J. Chandler Martin | ― | |||
Michael P. Haggerty | ― | |||
J. Douglas Holladay | ― | |||
James M. Seneff, Jr (1) | 1,370,820 | |||
Stephen H. Mauldin | 6,064 | |||
John F. Starr | 406 | |||
Ixchell C. Duarte | ― | |||
Tracey B. Bracco | ― | |||
L. Burke Rainey | ― | |||
All directors and executive officers as a group (9 persons) | 1,377,290 | |||
FOOTNOTE:
(1) | Represents shares held of record by our advisor, CNL Healthcare Corp |
Five Percent Stockholders
There are no persons who are known to our Definitive Proxy Statementus to be filed with the Commission no laterbeneficial owners of more than April 30, 2017.5% of our outstanding common stock as of December 31, 2017 or March 16, 2018.
The Company is externally advised and has no direct employees. In addition, certain directors and officers hold similar positions with CNL Securities Corp., the managing dealer of the Company’s offering and a wholly owned subsidiary of CNL, our Advisor and their affiliates. In connection with services provided to the Company, affiliates are entitled to certain fees as described in Note 11 “Related Party Arrangements” in Item 8. “Financial Statements and Supplementary Data.”
During 2017, the Company’s Total Operating Expenses incurred represented approximately 1.38% of Average Invested Assets, as each term is defined in the Company’s Charter. During 2017, the Company’s Total Operating Expenses incurred represented approximately 51.2% of Net Income, as each term is defined in the Company’s Charter.
Item 14.PRINCIPAL ACCOUNTANT FEES AND SERVICES
Auditor Fees
PricewaterhouseCoopers LLP serves as the Company’s principal accounting firm and audited the Company’s consolidated financial statements for the years ended December 31, 2017 and 2016.
The information requiredfollowing table presents fees for professional audit services rendered by this Item is incorporatedPricewaterhouseCoopers LLP for the audit of our annual financial statements for the years ended December 31, 2017 and December 31, 2016, and fees billed for other services rendered (for audit and non-audit services and all “out-of-pocket” costs incurred in connection with these services) by referencePricewaterhouseCoopers LLP during these periods.
|
| Years Ended December 31, |
| |||||
|
| 2017 |
|
| 2016 |
| ||
Audit fees |
| $ | 735,000 |
|
| $ | 994,250 |
|
Audit-related fees |
|
| — |
|
|
| — |
|
Tax fees |
|
| 582,139 |
|
|
| 492,957 |
|
All other fees |
|
| — |
|
|
| — |
|
Total Fees |
| $ | 1,317,139 |
|
| $ | 1,487,207 |
|
Audit Fees – Consists of professional services rendered in connection with the annual audit of the Company’s consolidated financial statements included in the Company’s annual report on Form 10-K and quarterly reviews of the Company’s interim financial statements included in the Company’s quarterly reports on Form 10-Q. Audit fees also include fees for services performed by PricewaterhouseCoopers that are closely related to our Definitive Proxy Statementthe audit and in many cases could only be provided by the Company’s independent auditors. Such services include consents related to bethe Company’s registration statements, assistance with, and review of, other documents filed with the Commission and accounting advice on completed transactions.
Audit-Related Fees – There were no later than April 30, 2017.professional services rendered by PricewaterhouseCoopers that would be classified as audit-related fees during the years ended December 31, 2017 and 2016.
Tax Fees – Consists of services related to corporate tax compliance, including review of corporate tax returns, review of the tax treatments for certain expenses, tax due diligence or other consulting fees.
The information requiredAll Other Fees – There were no professional services rendered by this Item is incorporated by reference to our Definitive Proxy Statement toPricewaterhouseCoopers that would be filed withclassified as other fees during the Commission no later than April 30, 2017.years ended December 31, 2017 and 2016.
(a) | List of Documents Filed as a Part of This Report: |
| (1) | Index to Consolidated Financial |
CNL Healthcare Properties, Inc.
Report of PricewaterhouseCoopers LLP, Independent Registered Certified Public Accounting Firm
Consolidated Balance Sheets as of December 31, 20162017 and 20152016
Consolidated Statements of Operations for the years ended December 31, 2017, 2016 2015 and 20142015
Consolidated Statements of Cash Flows for the years ended December 31, 2017, 2016 2015 and 20142015
Notes to Consolidated Financial Statements
| (2) | Index to Financial Statement Schedules: |
Schedule III – Real Estate and Accumulated Depreciation as of December 31, 20162017
None.
CNL Healthcare Properties, Inc. was formerly known as CNL Healthcare Trust, Inc., CNL Properties
Trust, Inc., and CNL Diversified Lifestyle Properties, Inc.
Exhibits:
1.1 | ||
|
| |
1.2 | ||
|
| |
1.3 | ||
|
| |
3.1 | ||
|
| |
3.2 | ||
|
| |
4.1 | ||
|
| |
4.2 | ||
|
| |
4.3 | ||
|
| |
4.4 | ||
|
| |
10.1 | ||
|
| |
10.2 | ||
|
| |
10.2.1 | ||
|
|
|
| |
10.3 | ||
|
| |
10.3.1 |
|
| |
10.4 | ||
|
| |
10.4.1 | ||
|
| |
10.5 | ||
|
| |
10.5.1 | ||
|
| |
10.5.2 | ||
|
| |
10.5.3 | ||
| ||
10.5.4 | ||
|
| |
10.6 | ||
|
| |
10.6.1 | ||
|
| |
10.6.2 |
|
| |
10.6.3 | ||
|
| |
10.6.4 | ||
|
| |
10.7 | ||
|
| |
|
| |
| ||
| ||
| ||
|
|
|
|
|
|
|
|
|
|
|
|
|
|
|
|
|
|
|
|
|
|
|
|
|
|
|
|
|
|
| |
|
|
|
|
|
|
|
|
|
|
|
|
|
|
|
|
|
|
|
|
|
|
| |
|
|
|
|
|
|
|
|
|
|
|
|
|
|
|
|
|
|
|
|
|
|
| ||
|
| |
|
| |
|
| |
|
| |
|
| |
|
| |
|
| |
|
| |
|
| |
|
| |
|
| |
|
| |
| Third Amendment to Credit Agreement dated as of November 19, 2015 by and between CHP Partners, LP, as borrower, and KeyBank National Association, as agent for itself and the other lenders (Previously filed as Exhibit 10.1 to the Current Report on Form 8-K filed November | |
|
| |
10.60 | ||
|
|
|
| |
10.62 | ||
|
| |
21.1 | ||
|
| |
23.1 | ||
|
| |
31.1 | ||
|
| |
31.2 | ||
|
| |
32.1 | ||
|
| |
101 | The following materials from CNL Healthcare Properties, Inc., Annual Report on Form 10-K for the year ended December 31, |
Pursuant to the requirements of the Securities Exchange Act of 1934, the registrant has duly caused this report to be signed on its behalf by the undersigned thereunto duly authorized, on the 16th day of March 2017.2018.
CNL HEALTHCARE PROPERTIES, INC. | |
|
|
By: | /s/ Stephen H. Mauldin |
| STEPHEN H. MAULDIN |
| Chief Executive Officer and President (Principal Executive Officer) |
|
|
|
|
|
|
By: | /s/ Ixchell C. Duarte |
IXCHELL C. DUARTE | |
| Chief Financial Officer, |
(Principal Financial Officer) | |
Pursuant to the requirements of the Securities Exchange Act of 1934, this report has been signed below by the following persons on behalf of the Registrant and in the capacities and on the dates indicated.
Signature |
| Title |
| Date |
|
|
|
|
|
/s/ |
| Chairman of the Board |
| March 16, |
|
|
|
|
|
|
|
|
|
|
/s/ Michael P. Haggerty |
| Independent Director |
| March 16, |
MICHAEL P. HAGGERTY |
|
|
|
|
|
|
|
|
|
/s/ J. Douglas Holladay |
| Independent Director |
| March 16, |
J. DOUGLAS HOLLADAY |
|
|
|
|
|
|
|
|
|
/s/ J. Chandler Martin |
| Independent Director |
| March 16, |
J. CHANDLER MARTIN |
|
|
|
|
|
|
|
|
|
/s/ Stephen H. Mauldin |
| Vice Chairman of the Board and | ||
|
|
| March 16, | |
STEPHEN H. MAULDIN |
| (Principal Executive Officer) |
|
|
|
|
|
|
|
/s/ Ixchell C. Duarte |
| Chief Financial Officer, | ||
| President and |
| March 16, | |
|
| (Principal Financial Officer) |
|
|
|
|
|
|
|
/s/ L. Burke Rainey |
|
| ||
|
|
| March 16, | |
|
| (Principal Accounting Officer) |
|
|
182
Supplemental Information to be Furnished With Reports Filed Pursuant to Section 15(d) of the Act by Registrants Which Have Not Registered Securities Pursuant to Section 12 of the Act
As of the date of this report, we have not sent any annual reports or proxy materials to our stockholders. We intend to deliver (i) our annual report to stockholders, prepared pursuant to Rule 14a-3 for the fiscal year ended December 31, 2016 (the “Annual Report”) and (ii) our Definitive Proxy Statement and related proxy materials for our 2017 Annual Meeting (collectively the “Proxy Materials”) to our stockholders subsequent to the filing of this report. We will furnish copies of the Annual Report and the Proxy Materials to the SEC when we deliver such materials to our stockholders.
168