UNITED STATES
SECURITIES AND EXCHANGE COMMISSION
WASHINGTON,Washington, D.C. 20549
FORM 10-K10-K/A
(Amendment No. 1)
ANNUAL REPORT PURSUANT TO SECTION 13 OR 15(d)
OF THE SECURITIES EXCHANGE ACT OF 1934
(Mark One)
| ANNUAL REPORT PURSUANT TO SECTION 13 OR 15(d) OF THE SECURITIES EXCHANGE ACT OF 1934 |
For the fiscal year ended January 28, 2017 (Fiscal 2016)
OR
☐ | TRANSITION REPORT PURSUANT TO SECTION 13 OR 15(d) OF THE SECURITIES EXCHANGE ACT OF 1934 FOR THE TRANSITION PERIOD FROM TO |
Commission File Number 01-34219
DESTINATION XL GROUP, INC.
(Exact name of registrantRegistrant as specified in its charter)Charter)
Delaware | 04-2623104 | |
(State or other jurisdiction of incorporation or organization) | (
| |
555 Turnpike Street, Canton, MA | 02021 | |
(Address of principal executive offices) | (Zip Code) |
(781) 828-9300
(Registrant’s telephone number, including area code)code: (781) 828-9300
Securities registered pursuant to Section 12(b) of the Act:
Title of each className of each exchange on which registered
Common Stock, Par Value $0.01 Per Share NASDAQ Stock Market, LLC |
|
| ||||
|
| |||||
Securities registered pursuant to Section 12(g) of the Act:
None
Indicate by check mark if the registrantRegistrant is a well-known seasoned issuer, as defined in Rule 405 of the Securities Act. YesYES ☐ NoNO ☒
Indicate by check mark if the registrantRegistrant is not required to file reports pursuant to Section 13 or Section 15(d) of the Act. YesYES ☐ NoNO ☒
Indicate by check mark whether the registrantRegistrant: (1) has filed all reports required to be filed by Section 13 or 15(d) of the Securities Exchange Act of 1934 during the preceding 12 months (or for such shorter period that the registrantRegistrant was required to file such reports), and (2) has been subject to such filing requirements for the past 90 days. YesYES ☒ NoNO ☐
Indicate by check mark whether the registrantRegistrant has submitted electronically and posted on its corporate Web site, if any, every Interactive Data File required to be submitted and posted pursuant to Rule 405 of Regulation S-T (§232.405 of this chapter) during the preceding 12 months (or for such shorter period that the registrantRegistrant was required to submit and post such files). YesYES ☒ NoNO ☐
Indicate by check mark if disclosure of delinquent filers pursuant to Item 405 of Regulation S-K(§229.405 of this chapter)S-K (§229.405) is not contained herein, and will not be contained, to the best of the registrant’sRegistrant’s knowledge, in definitive proxy or information statements incorporated by reference in Part III of this Form 10-K or any amendment to this Form 10-K. ☐☒
Indicate by check mark whether the registrant is a large accelerated filer, an accelerated filer, a non-accelerated filer, or a smaller reporting company, or an emerging growth company. See the definitions of “large accelerated filer,” “accelerated filer”filer,” “smaller reporting company,” and “smaller reporting“emerging growth company” in Rule 12b-2 of the Exchange Act.
Large accelerated filer |
| ☐ |
| Accelerated filer |
| ☒ | |||||||
|
|
|
| ||||||||||
Non-accelerated filer |
| ☐ (Do not check if a |
|
|
| ☐ | |||||||
Emerging growth company | ☐ | ||||||||||||
If an emerging growth company, indicate by check mark if the registrant has elected not to use the extended transition period for complying with any new or revised financial accounting standards provided pursuant to Section 13(a) of the Exchange Act. ☐
Indicate by check mark whether the registrantRegistrant is a shell company (as defined in Rule 12b-2 of the Exchange Act). YesYES ☐ NoNO ☒
As of July 30, 2016, theThe aggregate market value of the Common Stockvoting and non-voting common equity held by non-affiliates of the registrant was approximately $121.6 million,Registrant, based on the last reported saleclosing price on that date. Shares of Common Stock held by each executive officer and director and by each person who owns 10% or more of the outstandingshares of common stock on The NASDAQ Stock Market on July 30, 2016 was $121.6 million.
The number of shares of Registrant’s Common Stock have been excluded on the basis that such persons may be deemed to be affiliates. This determination of affiliate status is not necessarily determinative for other purposes.
The registrant had 49,988,655 shares of Common Stock, $0.01 par value, outstanding as of March 17, 2017.May 15, 2017 was 49,543,425.
DOCUMENTS INCORPORATED BY REFERENCEDocuments Incorporated by Reference: None.
Portions of the Proxy Statement for the 2017 Annual Meeting of Stockholders are incorporated by reference into Part III.
DESTINATION XL GROUP, INC.EXPLANATORY NOTE
IndexWe are filing this Amendment No. 1 to our Annual Report on Form 10-K
Year Ended10−K for the fiscal year ended January 28, 2017 pursuant to General Instruction G(3) to Form 10−K for the purposes of filing the information required to be disclosed pursuant to Part III of Form 10−K.
Except for the amendments described above, this Form 10−K/A does not modify or update the disclosure in our Annual Report on Form 10−K for the fiscal year ended January 28, 2017 filed with the Securities and Exchange Commission on March 20, 2017.
|
|
|
| ||
|
|
|
| ||
|
| ||||
|
| ||||
|
| ||||
|
| ||||
|
| ||||
|
| ||||
| |||||
|
| ||||
|
| ||||
|
|
| |||
|
| ||||
|
| ||||
|
|
| |||
|
| ||||
|
| ||||
| |||||
|
|
| |||
|
|
| |||
| Security Ownership of Certain Beneficial Owners and Management and Related Stockholder Matters |
|
| ||
| Certain Relationships and Related Transactions, and Director Independence |
|
| ||
|
|
| |||
|
|
|
| ||
|
|
| |||
|
|
| |||
Certain statements contained in this Annual Report on Form 10-K (this “Annual Report”) constitute “forward-looking statements,” including forward-looking statements within the meaning of the Private Securities Litigation Reform Act of 1995. In some cases, forward-looking statements can be identified by the use of forward-looking terminology such as “may,” “will,” “estimate,” “intend,” “plan,” “continue,” “believe,” “expect” or “anticipate” or the negatives thereof, variations thereon or similar terminology. The forward-looking statements contained in this Annual Report are generally located under the headings “Business” and “Management’s Discussion and Analysis of Financial Condition and Results of Operations,” but may be found in other locations as well, and include statements regarding cash flows, gross profit margins, store counts, capital expenditures, sales and earnings expectations for fiscal 2017 and beyond. These forward-looking statements generally relate to plans and objectives for future operations and are based upon management’s reasonable estimates of future results or trends. The forward-looking statements in this Annual Report should not be regarded as a representation by us or any other person that the objectives or plans of the Company will be achieved. Numerous factors could cause our actual results to differ materially from such forward-looking statements, including, without limitation, risks relating to the execution of our corporate strategy and ability to grow our market share and those risks and uncertainties, set forth below under Item 1A, Risk Factors. Readers are encouraged to review these risks and uncertainties carefully.
These forward-looking statements speak only as of the date of the document in which they are made. We disclaim any obligation or undertaking to provide any updates or revisions to any forward-looking statement to reflect any change in its expectations or any change in events, conditions or circumstances in which the forward-looking statement is based.
Item 1.10. BusinessDirectors, Executive Officers and Corporate Governance
Destination XL Group,
Set forth below is certain information regarding our current directors, including information furnished by them as to their principal occupations and business experience for the past five years, certain directorships held by each director within the past five years, their respective ages as of May 15, 2017, committee membership, and the year in which each became a director of our Company:
Name (1) |
| Age |
| Director Since |
| Audit (2) |
| Compensation |
| Nominating and Corporate Governance |
| Cybersecurity and Data Privacy |
Seymour Holtzman, Executive Chairman of the Board and Director |
| 80 |
| 2000 |
|
|
|
|
|
|
|
|
David A. Levin, President and Chief Executive Officer |
| 66 |
| 2000 |
|
|
|
|
|
|
|
|
John E. Kyees, Lead Independent Director (3) |
| 70 |
| 2010 |
|
|
|
|
|
|
| C |
Jesse Choper, Director |
| 80 |
| 1999 |
| C |
|
|
| X |
|
|
Willem Mesdag, Director (4) |
| 63 |
| 2014 |
| X |
| C |
|
|
|
|
Ward K. Mooney, Director |
| 67 |
| 2006 |
| X |
| X |
|
|
|
|
George T. Porter, Jr., Director (4) |
| 69 |
| 1999 |
|
|
| X |
|
|
|
|
Mitchell S. Presser, Director |
| 51 |
| 2007 |
|
|
|
|
| C |
| X |
Ivy Ross, Director (5) |
| 61 |
| 2013 |
|
|
|
|
| X |
| X |
C= current member and committee chairperson
X= current member of the committee
(1) | Alan S. Bernikow was a director of the Company until March 31, 2017 when his resignation was effective. |
(2) | Effective June 1, 2017, Mr. Choper will rotate off of the Audit Committee and Mr. Mooney will succeed Mr. Choper as Chairman of the Audit Committee. Mr. Choper’s seat on the Audit Committee will be filled by Mr. Kyees. |
(3) | Effective February 2, 2017, Mr. Kyees was appointed Lead Independent Director. Mr. Kyees was a member of the Compensation Committee until February 2, 2017, his seat was not filled. |
(4) | Mr. Mesdag succeeded Mr. Porter as Chairman of the Compensation Committee on February 2, 2017. |
(5) | Ms. Ross was appointed to the Nominating and Corporate Governance committee effective April 1, 2017, following Mr. Bernikow’s resignation. |
Seymour Holtzman has served as our Executive Chairman of the Board since August 2014. From April 2000 to August 2014, Mr. Holtzman served as our Chairman of the Board. Mr. Holtzman has been involved in the retail business for over 40 years. For many years, he has been the president and chief executive officer of Jewelcor, Incorporated, a former New York Stock Exchange listed company that operated a chain of retail stores. From 1986 to 1988, Mr. Holtzman was chairman of the board and also chief executive officer of Gruen Marketing Corporation, an American Stock Exchange listed company involved in the nationwide distribution of watches. For at least the last five years Mr. Holtzman has served as chairman and chief executive officer of Jewelcor Management, Inc., togethera company primarily involved in investment and management services. Mr. Holtzman is the chief executive officer and indirectly the owner of C.D. Peacock, Inc., a Chicago, Illinois retail jewelry establishment, the managing member of Luxury Swiss, LLC, a retail Rolex watch establishment. Mr. Holtzman is a successful entrepreneur with extensive experience working with public companies and provides valuable insight to the Board with respect to strategic planning.
David A. Levin has been our subsidiaries (the “Company”)President and Chief Executive Officer since April 10, 2000 and a director since April 11, 2000. From 1999 to 2000, he served as the executive vice president of eOutlet.com. Mr. Levin was president of Camp Coleman, a division of The Coleman Company, from 1998 to 1999. Prior to that, Mr. Levin was president of Parade of Shoes, a division of J. Baker, Inc., isfrom 1995 to 1997. Mr. Levin was also president of Prestige Fragrance & Cosmetics, a division of Revlon, Inc., from 1991 to 1995. Mr. Levin has worked in the retail industry for over 30 years. Since joining us, Mr. Levin has been instrumental in transforming us from a company which exclusively operated Levi Strauss & Co. branded apparel to the largest specialty retailer of big & tall men’s apparelapparel. In May 2017, Mr. Levin joined the board of directors of Lumber Liquidators, a publicly-traded company. Mr. Levin served on the board of directors of Christopher & Banks Corporation, a publicly-traded company, from May 2012 until June 2016. Mr. Levin has extensive knowledge of our Company and valuable experience in merchandising and marketing initiatives. In his role as Chief Executive Officer he also acts as a liaison between the Board and management.
Jesse Choper has been a director since October 8, 1999. Mr. Choper is the Dean Earl Warren Professor of Public Law Emeritus at the University of California at Berkeley School of Law, where he taught Corporate Law and Constitutional Law from 1965 until his retirement in June 2015. From 1960 to 1961, Professor Choper was a law clerk for Supreme Court Chief Justice Earl Warren. Mr.
Choper is a member of the California Horseracing Board. Mr. Choper provides valuable legal expertise to the Board. His specific legal background provides valuable insight with respect to corporate governance and ethics. The knowledge of our Company that Mr. Choper has gained over his ten year tenure as a director is considered a valuable asset to the Board.
John E. Kyees has been a director since May 3, 2010. From February 2, 2014 until May 31, 2014, Mr. Kyees served as Interim Chief Financial Officer of the Company. From 2003 until his retirement in 2010, Mr. Kyees was the chief financial officer of Urban Outfitters, Inc. and also served as the chief of investor relations. Prior to that, from 2002 to 2003, Mr. Kyees was the chief financial officer and chief administrative officer of bebe Stores, Inc. Mr. Kyees serves as lead independent director and chairman of the audit committee of Vera Bradley, Inc., a publicly-traded company. Mr. Kyees is a member of the board of directors of Rackwise, Inc., a publicly-traded company, and is a member of the audit committee. Mr. Kyees is also a director and chairman of the audit committee of Arhaus Furniture, a privately-held retailer. Mr. Kyees previously served as director and a member of the audit committee of Hot Topic, Inc., a formerly publicly-traded company. Mr. Kyees previously served as a director and member of the audit committee of Teavana, a publicly-traded company. Mr. Kyees brings to the Board extensive executive-level retail experience having served as chief financial officer for several prominent retailers. His insight with respect to merchandising, operational activities and direct operationsfinance is an asset to our Board.
Willem Mesdag has been a director since January 29, 2014. Since January 2005, Mr. Mesdag has been the managing partner of Red Mountain Capital Partners LLC, an investment management firm. Prior to founding Red Mountain in 2005, Mr. Mesdag was a partner and managing director of Goldman Sachs & Co., which he joined in 1981. Prior to Goldman Sachs, he was a securities lawyer at Ballard, Spahr, Andrews & Ingersoll, which he joined in 1978. He currently serves on the boards of Encore Capital Group, Inc., a publicly-traded company, and Heidrick & Struggles International, Inc., a publicly-traded company. He previously served on the boards of 3i Group plc, Cost Plus, Inc., Skandia Group AB and Nature’s Sunshine Products, Inc. Having had an extensive career in international investment banking and finance, Mr. Mesdag brings to the Board significant knowledge and experience related to business and financial issues and corporate governance.
Ward K. Mooney has been a director since July 31, 2006. Mr. Mooney is a co-founder of Crystal Financial LLC, formerly Crystal Capital, and has served as its CEO since April 2010. From April 2006 to April 2010, Mr. Mooney was the Senior Managing Partner of Crystal Capital. Prior to April, 2006, Mr. Mooney was the president of Bank of America Retail Finance Group and chief operating officer of Back Bay Capital, both of which were formerly Bank of Boston businesses which Mr. Mooney founded. Mr. Mooney provides the Board with valuable insight with respect to his extensive experience as a lender in the United Statesretail industry. The Board has determined that based on Mr. Mooney’s extensive knowledge and London, England. We operate under the trade namesexperience in finance qualifies him as an audit committee financial expert.
George T. Porter, Jr. has been a director since October 28, 1999. Mr. Porter was president of Destination XL®, DXL®, DXL outlets, Casual Male XL®, Casual Male XL outlets, Rochester Clothing, ShoesXL® and LivingXL®. We operate 192 DXL retail stores, 13 DXL outlet stores, 97 Casual Male XL retail stores, 36 Casual Male XL outlet stores and 5 Rochester Clothing stores. Our direct business includes our DestinationXL.com and bigandtall.com e-commerce sites which support our stores, brands and product extensions. Unless the context indicates otherwise, all references to “we,” “our,” “ours,” “us” and “the Company” refer to Destination XL Group, Inc. and our consolidated subsidiaries. We refer to our fiscal years ended January 28, 2017, January 30, 2016 and January 31, 2015 as “fiscal 2016”, “fiscal 2015” and “fiscal 2014,” respectively.
OUR INDUSTRY
We believe that the men’s big & tall apparel market, which includes pants with a waist size of 42” and greater, as well as tops sized 1XL and greater, generates approximately $3.5 billion to $4.0 billion in sales annually and represents approximately 11% of the overall men’s apparel business. Growth in this segment has historically been driven by rapidly changing market demographics. We estimate that our market share in fiscal 2016 was approximately 12%. We believe that we can increase our market share by catering to the broader target market, attracting customers from various income, age and lifestyle segments and offering the widest selection of sizes and styles that fit well. An opportunity also existsLevi’s USA for market share growth from the lower-size range of our market, that is, men in the 38”-46” waist size. These sizes are usually at the high end of the size range for most retailers and, as a result, the selection is usually limited at such retailers.
HISTORY
Our Company was incorporated in the State of Delaware in 1976 under the name Designs, Inc. Until fiscal 1995, we operated exclusively in Levi Strauss & Co. branded apparel mallfrom 1994 to 1997. Beginning in 1974, Mr. Porter held various positions at Levi Strauss & Co., including president of Levi’s Men’s Jeans Division. Mr. Porter was also corporate vice president and outlet stores.general manager of Nike USA from 1997 until his retirement in 1998. Mr. Porter provides the Board with extensive merchandising experience having worked at two highly prominent companies. Mr. Porter’s tenure and service as a director for over ten years is also considered a valuable asset to the Board.
Mitchell S. Presser has been a director since May 1, 2007. Since July 2014, Mr. Presser has been a partner and the head of U.S. M&A and private equity at Freshfields Bruckhaus Deringer. From January 2014 until July 2014, Mr. Presser was a senior advisor to Paine & Partners, LLC, a private equity firm. From November 2006 to December 2013, Mr. Presser was a founding partner of Paine & Partners, LLC. Prior to that, Mr. Presser was a partner with the law firm of Wachtell, Lipton, Rosen & Katz, specializing in mergers & acquisitions. Mr. Presser has served as a director on the boards of several privately-held companies. Mr. Presser’s extensive experience in private equity and strategic planning provides valuable insight to the Board.
Ivy Ross has been a director since January 31, 2013. In May 2002, we acquired the Casual Male business from Casual Male Corp. at2014, Ms. Ross joined Google X as head of Glass and is currently a bankruptcy court-ordered auction. At the timevice president and head of the acquisition, Casual MaleDesign for all of Google’s Hardware products. From July 2011 until April 2014, Ms. Ross was the largest specialty retailerchief marketing officer of men’s clothing inArt.com from where she oversaw the big & tall market incompany's marketing, branding, merchandising and user-experience functions. Prior to Art.com, from June 2008 to June 2011, Ms. Ross was EVP of marketing for the United States. AsGap brand, and also acted as the creative catalyst for all brands within Gap, Inc. Ms. Ross also has held senior creative and product design positions at Disney Stores North America, Mattel, Calvin Klein, Coach, Liz Claiborne, Swatch Watch and Avon. She also has served on Proctor and Gamble’s design board since its inception. With her industry insight and marketing expertise, Ms. Ross provides a result ofvaluable perspective to the acquisition, on August 8, 2002,Board as we changed our namecontinue to “Casual Male Retail Group, Inc.”
Through fiscal 2010, we primarily operated Casual Male XL retail stores, Casual Male XL outlet stores and Rochester Clothing stores, along with the associated websites and catalogs. We catered to all customers through these three store formats, from our value-oriented customer (Casual Male XL outlets) to our luxury-oriented customer (Rochester Clothing stores). During that year, we tested a new store concept, Destination XL (“DXL”). The DXL store concept merged all of our existing brands under one roof, offering our customers a superior shopping environment with an extensive assortment of product and an increased presence of name brands, without having to shop multiple stores. In addition to offering our customers a wide assortment, we also wanted to provide them with an outstanding and unique shopping experience. We are focused on providing outstanding customer service throughbuild our DXL stores, with everything from larger fitting rooms to professional, trained associates providing both personal attentionbrand.
All directors hold office until the next Annual Meeting of Stockholders and on-site tailoring. With the initial success of this store format, we then made a similar change to our e-commerce business in fiscal 2011 when we
launched our DestinationXL.com website which, like our DXL store, merged all of our previous websites into one consolidated e-commerce site providing our customers the ability to cross-shop our brands easily.
As part of our new direction, in December 2012, we changed our NASDAQ stock ticker symbol to “DXLG” followed by a change in February 2013 of our corporate name to “Destination XL Group, Inc.”
BUSINESS STRATEGY
In fiscal 2012, we began the transition from our Casual Male XL retailuntil their respective successors have been duly elected and Rochester Clothing stores to our DXL store format. Initially, we envisioned that this transition would take three years. Based on the performance of the initial DXL stores, we accelerated the pace in fiscal 2013, closing over 100 Casual Male XL and Rochester Clothing stores and opening 51 DXL stores. This accelerated pace created unexpected hurdles for us in converting our existing customer base to the new DXL stores, which negatively impacted our sales. As a result, in fiscal 2014, we opted to revise our strategy to slow the pace of our transition to take advantage of our existing Casual Male XL stores to help transition our customer base. We also introduced a smaller DXL store format, which has allowed us to penetrate smaller markets that we originally thought were too small for a DXL store, and a DXL outlet store format. In fiscal 2015, we completed a market opportunity study of our existing store portfolio, including the smaller DXL store format and outlet store format, and believe that there is opportunity for additional growth beyond what was initially identified when we began the rollout in fiscal 2012.
During fiscal 2016, we opened our 200th store and, at fiscal year end, we had 192 DXL stores and 13 DXL outlet stores, with a DXL presence in every major metropolitan market in the continental United States.
With the bulk of the Casual Male XL to DXL store transition behind us, in addition to our efforts to maintain the strong in-store experience which our customers enjoy, we are now focusing our efforts on improving traffic to our stores and growing our e-commerce business with emphasis on increasing brand awareness and our customer base. Based on a market study we commissioned in 2016, 6 out of 10 potential customers do not know who we are. We also experienced a slight decrease in our brand awareness in fiscal 2016 and a decrease in store traffic in the second half of fiscal 2016, which may have resulted in part from our decision not to conduct a Fall/holiday media marketing campaign. As a result, in fiscal 2017, we will be revitalizing our marketing program, through a combination of media and digital strategies, including efforts to improve communications with our existing customers through personalization and more targeted mailings. We expect to increase our marketing spend in fiscal 2017 to help create and drive traffic to our stores and e-commerce sites.
While we believe market opportunity exists to support a strategy of opening 30-40 DXL stores per year, given the current weakness in the retail environment, we are taking a more measured approach to store growth in fiscal 2017. In some markets, where a Casual Male XL store performs well, we may look to extend its lease on a short-term basis instead of replacing it with a DXL store at expiration, allowing us time to secure the right location for a DXL store. As such, we currently expect to open 19 DXL retail stores and 1 DXL outlet store in fiscal 2017. We currently anticipate that beyond fiscal 2017, we will continue to open stores at a slower pace for the foreseeable future.
International Growth
In addition to our Rochester Clothing store located in London, England, we also have one franchised DXL store in the Middle East at the Symphony Mall in Kuwait City, Kuwait, which was opened in fiscal 2014 pursuant to a franchise agreement with The Standard Arabian Business & Enterprises Company (SABECO).
Based on our experience to date, we believe that the international big & tall market is currently underserved and, based on the success of our DXL concept in the U.S. and the positive customer response for our Kuwait City franchised store, we see an opportunity for growth internationally in the future.
In the spring of fiscal 2017, we are opening two DXL stores in Toronto, Canada. These will be the first DXL brand stores operated by the Company outside of the United States.
OUR BUSINESS
We operate as an omni-channel retailer. Through our multiple brands, which include both branded apparel and private-label, we offer a broad range of merchandise at varying price points, catering from the value-oriented customer to the luxury-oriented customer. Our objective is to appeal to all of our customers by providing a good, better, best array of product assortments in all primary lifestyles with multiple and convenient ways to shop.
qualified or until their earlier death, resignation or removal.
Our DXL stores caterCurrent Non-Director Executive Officers
Peter H. Stratton, Jr., 45, has been our Senior Vice President, Chief Financial Officer and Treasurer since June 1, 2014. From August 2009 to all income demographicsMay 31, 2014, Mr. Stratton was our Senior Vice President of Finance, Corporate Controller and offerChief Accounting Officer. Mr. Stratton joined us in June 2009 as Vice President of Finance. Prior to joining the Company, Mr. Stratton served as the senior director of corporate accounting at BearingPoint, Inc. from May 2007 to June 2009. Prior to May 2007, Mr. Stratton held various finance and accounting leadership positions at Legal Sea Foods, Inc., Shaw’s Supermarkets, Inc. and Cintas Corporation.
Angela Chan, 50, has been our customers merchandiseSenior Vice President, Chief Sourcing Officer and Global Business Development since January 2017. Prior to that, Ms. Chan was our Senior Vice President and Chief Sourcing Officer since February 2015. From March 2013 to February 2015, Ms. Chan was our Senior Vice President of Global Sourcing and Product Development. Prior to that, from May 2010 to March 2013, Ms. Chan was our Vice President of Global Sourcing. Ms. Chan joined the Company in all lifestylesFebruary 2009 as our Director of Global Sourcing. Prior to joining our Company, from casualOctober 2007 to business, youngDecember 2008 Ms. Chan was the senior product manager for Redcats USA. From 2007 to mature, in all price ranges2009, Ms. Chan was an independent retail consultant and analyst with the Gerson Lehrman Group and in all large sizes2006, she held the positions of director and executive vice president of global sourcing for Rocawear. Prior to that, Ms. Chan was the founder & partner of several apparel manufacturing companies & franchise restaurants. She also held various merchandising management positions with Macy’s corporate in New York and Hong Kong.
Francis Chane, 54, has been our Senior Vice President of Distribution, Logistics and Facilities since June 2011. Mr. Chane joined the Company in June 2008 as our Vice President of Distribution & Logistics. Prior to joining our Company, Mr. Chane was the vice president operations & facilities for Redcats USA, a division of the French multi-national company PPR, from XL1999 to June 2008. Prior to that, Mr. Chane held various leadership positions with WearGuard Corporation, a division of Aramark Corporation.
John F. Cooney, 34, has been our Vice President of Finance and up. OurCorporate Controller since June 2014 and in May 2015 he was also appointed Chief Accounting Officer. From November 2010 until May 2014, Mr. Cooney was our Director of Financial Accounting and Reporting. Prior to joining the Company, Mr. Cooney was an audit manager with PricewaterhouseCoopers LLP, which he joined in August 2004.
Kenneth M. Ederle, 52, has been our Senior Vice President and Chief Merchandising Officer since April 2013 and in April 2015 his role was expanded to include Planning and Allocation. Prior to that, from May 2011 until April 2013, Mr. Ederle was our Senior Vice President – General Merchandising Manager DXL. Mr. Ederle served as our Vice President, General Merchandise Manager of Rochester Clothing from August 2008 until May 2011. From January 2008 to August 2008, Mr. Ederle was our Merchandise Manager of Sportswear for Rochester Clothing and prior to that was one of our Merchandise Managers for Casual Male XL stores primarily carry moderately priced brandedfrom November 2006 to December 2007. Prior to joining the Company in 2006, Mr. Ederle was a senior buyer and private label casual sportswearsenior planner for Limited Brands.
Sahal S. Laher, 41, joined the Company in January 2017 as our Senior Vice President, Chief Digital and dresswear, while our Rochester Clothing stores carry fine quality, designer and branded menswear. We also operate Casual Male XL outlets and DXL outlets for our value-oriented consumer. In addition to our stores, we operate our Destination XL e-commerce site which is similar to our DXL store concept and offersInformation Officer. Mr. Laher has over 20 years of senior operational experience with a brand range of merchandise at each price point, including a complete offering of shoes.
Another critical part of our business operation is managing the number of sizes offered to our customers and optimizing our in-stock position throughout each season. Our best-selling pant has 57 size combinations as compared to an average retailer who may only have 15 different size combinations. We maintain a consolidated inventory across all channels which enables us to manage our in-stock position of all sizes effectively, ultimately improving customer service. Moreover, our planning and allocation methodologies, with respect to store assortment planning, help to optimize each location’s market potential without excessive inventory levels.
MERCHANDISE
A vital component of our business strategy is to offer our customers a broad assortment of apparel that is appropriate to our diverse customer base. Regardless of our customers’ age, socioeconomic status, or lifestyle preference, we are able to assemble a wardrobe to fit our customers’ apparel needs. In addition, we offer such assortments in private-label product, balanced with an array of brand name labels. With over 5,000 styles available, we carry tops in sizes up to 8XL and 6XLT, bottoms with waist sizes 38” to 66”, and shoes in sizes 10W to 18. In addition, we added to our product assortment a smaller fit XL and XLT to appeal to our target “end-of-rack” customer.
Our stores are merchandised to showcase entire outfits by lifestyle, including traditional, active, denim, dress wear and contemporary. This format allows us to merchandise key items and seasonal goods in prominent displays and makes coordinating outfits easier for the customer while encouraging multi-item purchases. This lifestyle layout also allows us to manage store space more effectively in each market to target local demographics. The key item strategy is also fully integrated by lifestyle, allowing us to focus on merchandise presentationdigital and offer our customers a compelling value proposition.
Merchandise assortments in our DXL stores are organized not only by lifestyle, but within each lifestyle, the assortments are shown in a “good”, “better”, “best” and “luxury” visual presentation, again to benefit our customers’ ease of shopping. With the “best” merchandise assortments featured most prominently in the DXL store, our customers are able to visualize current fashion trends and easily select their wardrobes within their desired price points in a convenient manner.
We carry several well-known national brands of merchandiseomni-channel strategies, modernizing applications, as well as a numberdata and technology security. Prior to joining the Company, from March 2013 until January 2017, he served as executive vice president of digital, innovation and technology, global CIO for Brook Brothers Group, where he was responsible for ensuring that the company's information technology investments, resources and project execution were aligned with its strategic business objectives. Prior to that, from April 2009 to February 2013, he was the global chief information officer at Stride Rite Corporation. Mr. Laher also held senior strategic consulting positions at Deloitte Consulting, Anderson Consulting and Data General Corporation.
Mary S. Luttrell, 55, was promoted to Senior Vice President of Marketing in January 2017. From November 2012 until January 2017, Ms. Luttrell was our own private-label lines withinVice President of Brand and Marketing. From April 2006 until November 2012, Ms. Luttrell was our “good”, “better”, “best”Vice President of Advertising. Prior to joining the Company in October 2000, Ms. Luttrell was the manager of media advertising at Hills department stores and “luxury” price points. The penetration of branded apparel inalso worked on the advertising agency side managing many retail accounts.
Robert S. Molloy, 57, has been our DXL stores can range from 15% to 80%, depending on several factors, but on average, our DXL stores carry approximately 47% branded merchandise.
Higher-End Luxury Fashion Apparel -“Best”Senior Vice President and “Luxury” Merchandise
Within this higher-end price range, we carry a broad selection of quality apparel from well-known branded manufacturers such as Bogosse®, Brooks Brothers®,Gran Sasso, John Laing®, Remy, Psycho Bunny®, Derek Rose, Brioni®, Coppley, Eton®, Hickey Freeman®, Jack Victor®, Lucky, Michael Kors®, Pantherella®, Paul & Shark, JOE’S® Jeans, Robert Graham®, Robert Talbot, St. Hillaire, Ted Baker®, Tulliani, True Religion®, Turnbull & Asser®General Counsel since April 2010 and David Donahue.
Moderate-Priced Apparel -“Better” Merchandise
We offer our customer an extensive selection of quality sportswear and dress clothing at moderate prices carrying such well-known brands such as: Junk Food®, Rainforest, Brooks Brothers®, O’Neill®, Retro Brand, Cutter & Buck®, Levis®, Adidas® Golf, Columbia, Berne®, Carhartt®, Callaway®, CK Jeans®, CK Sport®, Jockey®, Lacoste®, Majestic, Polo Ralph Lauren®, Tommy Bahama®, Tommy Hilfiger®, Tallia® and Trafalger®.
In addition, we carry several private-label lines:
Twenty Eight Degrees™ is targeted as a contemporary/modern line offering sportswear and loungewear.
Society of One is a jeanswear brand catering to the needsbecame Secretary of the fashion denim customer.Company on May 15, 2014. From February 2008 until April 2010, Mr. Molloy was our Vice President and General Counsel. Prior to joining the Company, Mr. Molloy served as the vice president, assistant general counsel at Staples, Inc. from May 1999 to February 2008. Prior to May 1999, Mr. Molloy was a trial attorney.
Brian S. Reaves,Rochester isa line that targets traditional luxury styles. We also offer a complete selection of sportcoats, dress shirts and neckwear under 56, has been our Rochester Black Label private label.
Value-Priced Apparel -“Good” Merchandise
For our value-oriented customers, we carry Geoffrey Beene®, Cubavera, Nautica®Senior Vice President and Nautica Jeans®, Dockers, Lee, Perry Ellis, Wrangler, Reebok and PX Clothing. In addition we carry several private label lines:
|
|
Gold Series™ is our core performance offering of tailored-related separates, blazers, dress slacks, dress shirts and neckwear that blends comfort features such as stretch, stain resistance and wrinkle-free fabrications with basic wardrobe essentials.
Synrgy™ targets the customer looking for a contemporary/modern look.
|
|
|
|
|
|
RETAIL CHANNEL
Destination XL stores (“DXL”)
Our DXL store concept brings all of our brands together in one format. Within this format, we can cater to our very diverse customer group, with merchandise representing all price points, from our luxury brands to value-oriented brands, and all lifestyles, from business to denim. The size of our current DXL stores, which contain almost triple the product assortments of a Casual Male XL store, currently averages 8,000 square feet, but is expected to decrease closer to 7,500 square feet as we open future DXL stores. As discussed above, in fiscal 2014, we began opening smaller (5,000-6,500 square feet) DXL stores. Because the size of these stores is smaller, they carry a smaller product offering than our other DXL stores but are representative of the “good, better, best” merchandise variety. The locations of our DXL stores are also an essential aspect of our roll-out. We seek locations where our stores are highly visible, preferably adjacent to regional malls or other high-traffic shopping areas.
With our larger DXL store format, we are able to provide our customers a spacious store with up to three times the product offering of a Casual Male XL store. The merchandise in our DXL stores is organized by lifestyle: active, traditional, modern and denim with a representation of all of our brands and price points, utilizing a “good, better, best” pricing structure. Depending on the customers in each respective market, we can adjust the appropriate mix of merchandise, with varying selections from each of our price points, to cater to each demographic market. This larger store format also provides us the footprint necessary to carry a complete offering of dress wear, including tailored and “made-to-measure” custom clothing, as well as a selection of shoes in extended sizes and a broad assortment of accessories such as belts, ties, and socks.
During fiscal 2016, we opened 26 DXL retail stores and 4 DXL outlet stores, bringing our store count at January 28, 2017 to 192 DXL retail stores and 13 DXL outlet stores. For fiscal 2016, the average sales per square foot for our DXL retail stores increased to $180 as compared to $177 for fiscal 2015 and $165 for fiscal 2014. Once a DXL store matures, which we believe is five years, we expect sales will be approximately $200-220 per square foot. For fiscal 2016, we had 49 DXL retail stores that had sales greater than $200 per square foot. For fiscal 2017, we plan to open 19 DXL retail stores and 1 DXL outlet store resulting in approximately 225 DXL retail and outlet stores operating at the end of fiscal 2017.
Casual Male XL retail stores
At January 28, 2017, we operated 97 Casual Male XL full-price retail stores, located primarily in strip centers, power centers or stand-alone locations. The majority of the merchandise carried in our Casual Male XL stores is moderate-priced basic or fashion-neutral items, such as jeans, casual slacks, t-shirts, polo shirts, dress shirts and suit separates. These stores also carry a full complement of our “better” private label collections. The average Casual Male XL retail store is approximately 3,500 square feet.
DXL outlet /Casual Male XL outlet stores
At January 28, 2017, we operated 36 Casual Male XL and 13 DXL outlet stores designed to offer a wide range of casual clothing for the big & tall customer at prices that are generally 20-25% lower than our moderate-priced merchandise. Much of the merchandise in our outlet stores is offered with the purchasing interests of the value-oriented customer in mind. In addition to private-label and branded merchandise at our “good” price tier, our outlets also carry clearance product obtained from DXL, Casual Male XL and Rochester Clothing stores, offering the outlet customer the ability to purchase branded and fashion product for a reduced price. As we
open our DXL stores, we expect the mix of branded product flowing into the outlets to increase to approximately 30% as we move inventory out of our DXL stores to keep it current while enhancing the branded presence in our outlets.
The average Casual Male XL outlet store is approximately 3,100 square feet and the average DXL outlet is approximately 5,000 square feet.
Rochester Clothing stores
At January 28, 2017, we operated 5 Rochester Clothing stores, located in major cities in the United States and one store in London, England. The Rochester Clothing stores have a wide selection of our “best” merchandise which consists primarily of high-end merchandise from well-recognized brands. In addition, the stores also carry a few private-label lines especially designed for our high-end customer. The average Rochester Clothing store is approximately 10,000 square feet. Although some of our Rochester Clothing stores will close over the next few fiscal years as we open DXL stores in the same geographical market, we currently expect that 3 of our high-traffic Rochester Clothing stores will remain open.
DIRECT CHANNEL
Our direct business, which consists primarily of our e-commerce business, is a vital part of our growing omni-channel business approach, allowing us to service our customers whether it be in-person at a store, over the telephone, or online via a computer, smartphone or tablet. Our direct business bridges that gap for us by encouraging and expecting our store associates to use our e-commerce sites to help fulfill our customers’ clothing needs. If a wider selection of a lifestyle, color or size of an item is not available in our store, then our store associates can order the item for our customer through our direct channel and have it shipped to the store or directly to the customer. Our customers also have the ability to order online and pick-up in store on the same day.
With the ability to showcase all store inventories online, we are seeing an increase in the number of transactions that are initiated online but are ultimately completed in store. Until fiscal 2014, our direct customer was limited to inventory available in our centralized distribution center but we can now fulfill from the store an item that is out-of-stock in our warehouse. This capability has not only resulted in incremental sales, but it has also helped us reduce clearance merchandise at the store level and improve long-term margins.
Destination XL® E-Commerce Site
In fiscal 2013, we combined all of our then-existing web addresses: www.casualmalexl.com, www.rochesterclothing.com, www.btdirect.com, www.livingxl.com and www.shoesxl.com and redirected our users to our new comprehensive Destination XL website. Similar to our DXL store concept, our www.destinationxl.com website allows our customers to shop across all of our brands and product extensions with ease and brings all of our customers to one website. Our customers were previously classified as a “Rochester” customer or a “Casual Male” customer. Now, our customers are all “DXL” customers, which no longer limits a customer’s ability to access our full product assortment.
From the Destination XL homepage, customers can search across all of our brands and, similar to our stores, shop merchandise from value-oriented to luxury price points. In addition, a customer can tailor their search using our “size profile.” Our Destination XL website also offers a complete line of men’s footwear in extended sizes, offering our customers a full range of footwear in hard-to-find sizes. Although our DXL stores all have a selection of footwear available, we are able to offer a full assortment of sizes and styles through our website. The assortment is a reflection of our apparel, with a broad assortment from moderate to luxury and from casual to formal. We currently have a selection of more than 600 styles of shoes, ranging in sizes from 10W to 18M and widths up to 6E. We carry a number of designer brands including Cole Haan®, Allen Edmonds®, Timberland®, Calvin Klein®, Lacoste®, Donald J. Pliner and Bruno Magli®.
In addition to our Destination XL website, our customers can also access our LivingXL website directly from our homepage. LivingXL is an online-only store that specializes in the selling of select high-quality products which help larger people maintain a more comfortable lifestyle. The types of products sold on our website benefit both men and women and include chairs, outdoor accessories, travel accessories, bed and bath and fitness equipment.
In recent years, we have seen a significant increase in the number of visitors to our websites from a mobile device. Our mobile optimized website, m.destinationxl.com, helps our customers browse products, checkout, access our loyalty program information, research inventory in a local store, and find a local store location. For our international customers, upon entering our full site, these visitors are identified based on where they reside globally and are able to shop in their local currency. In addition, checkout is customized based on their location, with local payment methods and a guaranteed cost including shipping and taxes. In fiscal 2016, we launched an effort to ensure that our websites are accessible to the visually impaired. We also launched t.destinationxl.com, an
optimized site for tablet visitors to provide an improved shopping experience for all our DXL online visitors, regardless of the device they are using.
BigandTall.com
Our www.bigandtall.com website is separate from our Destination XL site and caters to a value-oriented customer, exclusively offering an assortment of promotional and clearance merchandise.
MERCHANDISE PLANNING AND ALLOCATION
Our merchandise planning and allocation area is critical to the effective management of our inventory, store assortments, product sizes and overall gross margin profitability. The merchandise planning and allocation team has an array of planning and replenishment tools available to assist in maintaining an appropriate level of inventory, in-stock positions at the store and for the direct channel, and pre-season planning for product assortments for each store and the direct channel. Additionally, in-season reporting identifies opportunities and challenges in inventory performance. Over the past several years, we have made investments in implementing best practice tools and processes for our merchandise planning and allocation.
Our core basic merchandise makes up over 40% of our “better” assortment and over 20% of our “best” assortment. Our planning and allocation team estimates quantity and demand several months in advance to optimize gross margin and minimize end-of-season merchandise for all seasonal merchandise. We have implemented an omni-channel approach towards our assortment planning methodology that customizes each store’s assortment to accentuate lifestyle preferences for each store.
Our merchandising data warehouse provides the merchandising team with standardized reporting for monitoring assortment performance by product category and by store, identifying in-stock positions by size and generally monitoring overall inventory levels relative to selling. At season end, we analyze the overall performance of product categories, overall assortments and specific styles by store to focus on the opportunities and challenges for the next season’s planning cycle.
During each season, we utilize a markdown optimization tool to monitor the selling performance of our fashion assortments and compare against the planned selling curves. When actual selling performance significantly drops below planned selling curves, we make in-season pricing adjustments so that we maintain planned levels of residual fashion product at season’s end.
Utilizing a set of specific universal reporting tools, we are able to fulfill the daily, weekly and monthly roles and responsibilities of the merchandise planning and allocation team. These reporting tools provide focused and actionable views of the business to optimize the overall assortment by category and by store. We believe that by having all members of the merchandise planning and allocation team follow a standardized set of processes with the use of standardized reporting tools, our inventory performance will be optimized.
STORE OPERATIONS
We believe that our store associates are the key to creating the highest quality experience for our customer. Over the past several years, we have extensively worked to change the culture in our stores from an operationally-driven organization to a sales-driven, customer-centric organization. Our overall goal is to assist our associates in becoming less task-oriented and more focused on serving the customer. We want our associates to help our customer meet his apparel needs through building his wardrobe; not just selling our customer a single item. In order to accomplish this, we have invested in educating our associates. Our associates have been trained to be clothing experts, capable of accommodating our customer’s style and fit needs with ready-to-wear clothing. Our stores offer on-site tailoring in order to assist customers in receiving a perfect fit. Our training approach provides product knowledge as well as behavioral training. A key component to the success of this program is finding the right caliber of store associates. Our multi-unit, field management team receives extensive training on recruiting associates with the correct fit for our stores. Our new DXL store management team hires are enrolled in a training program with time spent in one of our two regional training centers.
Each new store management team member spends time in a DXL store, working with certified training managers to solidify their training before they are released to their “home” store. This allows each new store management team to apply the skills learned during training to successfully managing their respective stores.
We are able to gauge the effectiveness of our training through measuring sales productivity at each level of the field organization, including individual sales associates. We believe these educational programs, together with monitoring sales metrics to help identify opportunities for further training, will improve sales productivity and strengthen our customer’s brand loyalty.
Each DXL, Casual Male XL and Rochester Clothing store is staffed with a store manager, assistant managers and associates. The store manager is responsible for achieving certain sales and operational targets. Our DXL, Casual Male XL and Rochester Clothing stores
have an incentive-based commission plan for managers and selling staff to encourage associates to focus on our customer’s wardrobing needs and sales productivity. Our field organization of stores strives to promote from within; a culture that has been building for 7 years, with approximately 90% of the field organization’s multi-unit managers having managed one of our retail stores.
Our field organization is overseen by our Chief Sales Officer (Seniorsince November 2014. From May 2010 until November 2014, Mr. Reaves was our Senior Vice President of Store Sales & Operations) and Regional Sales Managers, who provide management development and guidanceOperations. Prior to individual store managers. Each Regional Sales Manager is responsible for hiring and developing store managers at the stores assigned to that Regional Sales Manager’s market, and for the overall operations and profitability of those stores.
MARKETING AND ADVERTISING
We believe marketing and advertising are key drivers to increase brand awareness, and thereby increase traffic tojoining our stores. Our marketing focus is on increasing the awareness of our DXL brand so that shoppers think of us when they decide to purchase men’s XL clothing or accessories. With only 4 out of every 10 men knowing who we are, we believe we have an opportunity to build our customer base and increase market share. During fiscal 2016, we saw our brand awareness drop to 34% from 38% in fiscal 2015. We believe that our $5.4 million decrease in marketing spend in fiscal 2016 may have contributed to this drop in awareness. Due to the weakness we saw in the retail market and the lack of store traffic we started to see in September 2016, we decided not to run the Fall/Holiday media campaign and instead shifted some of those funds to digital advertising. In fiscal 2017, we will be reinvesting in our marketing initiatives, increasing our marketing spend consistent with previous levels. We expect that our marketing program for fiscal 2017 will include two media campaigns; our Spring campaign, which runs up to Father’s Day, and the return of a Fall/Holiday campaign. In the short-term, for Spring 2017 we will be reusing an older commercial whichCompany, Mr. Reaves was the most productivevice president – outreach and group sales for David’s Bridal from 2007 to 2009. Before that, Mr. Reaves was the senior vice president of our previous campaigns in driving traffic and appearssales for The Bridal Group from 2004 to resonate more with our existing customer.
For fiscal 2016, our active customer count decreased by 2.5%. In fiscal 2017, in addition to adding back media to aid in growing the customer count, we plan to focus more aggressively on customer retention and reactivation programs. Our DXL retail stores have experienced a 28% higher retention rate of customers than our Casual Male XL retail stores. As we open more DXL retail stores and close more Casual Male XL retail stores, we expect that our overall retention rate will continue to improve, but we will be seeking to improve the retention rates in all store formats.
In addition to growing the active customer base within DXL stores, we also see opportunity for growth with our “end-of-rack” customer who is defined as a customer with a 38 to 46 inch waist. For fiscal 2016, the “end of rack” segment contributed twice as much in revenue per customer as consumers with waist sizes above 46 inches and visited us 52% more often than consumers with waist sizes 48 inches and above.
As we close more of our Casual Male XL stores in fiscal 2017, we will continue our efforts to increase awareness of the DXL brand and convert Casual Male XL customers to our DXL stores. Our focus will continue to be on transitioning our best Casual Male XL customers first, followed by other very active, high-sales-contributing tiers of customers. For DXL stores opened in existing Casual Male XL markets, between fiscal 2010 and fiscal 2015, we have converted 51% of our Casual Male XL’s customers to these DXL stores by the end of fiscal 2016. This figure is up from 45% at the start of fiscal 2016.
In fiscal 2016, we decreased our marketing costs by $5.4 million from fiscal 2015. For fiscal 2017, we will be increasing our marketing spend to approximately $25.0 million, similar with levels in fiscal 2014 and fiscal 2015, as compared to $18.2 million for fiscal 2016.
GLOBAL SOURCING
We have strong experience in sourcing internationally, particularly in Asia, where we manufacture a significant percentage of our private-label merchandise. We have established relationships with some of the leading and specialized agents and factories. Our sourcing network consists of over 50 factories in 6 countries. Currently, approximately 61% of all our product needs are sourced directly.
Our global sourcing strategy is a balanced approach considering quality, cost and lead time, depending on the requirements of the program. We believe our current sourcing structure is sufficient to meet our operating requirements and provide capacity for growth. The growth and effectiveness of our global direct sourcing program is a key component to our continued merchandise margin improvement.
In an effort to minimize foreign currency risk, all payments to our direct sourced vendors and buying agents are made in U.S. dollars through the use of letters of credit or payment on account.
2007.
DISTRIBUTIONPeter E. Schmitz, 58, has been our Senior Vice President and Chief Real Estate Officer since June 2013. Prior to that, Mr. Schmitz was our Senior Vice President, Real Estate and Store Development. Prior to joining the Company in August 2007, Mr. Schmitz was the vice president of real estate for Brooks/Eckerd Pharmacy Chain from October 1995 to August 2007.
AllWalter E. Sprague, 68, has been our Senior Vice President of Human Resources since May 2006. From August 2003 through April 2006, Mr. Sprague was our Vice President of Human Resources. Prior to joining our Company, Mr. Sprague was the managing director northeast, for Marc-Allen Associates, a nationwide executive recruiting firm. From 1996 to 2002, Mr. Sprague was the assistant vice president – senior director of human resources for Foot Locker Inc. and, prior to that, the assistant vice president – senior director of human resources for Woolworth Corporation, the predecessor company to Foot Locker Inc.
Former Non-Director Executive Officers
Jack McKinney, 61, was our Senior Vice President and Chief Information Officer from June 2002 until September 30, 2016. Mr. McKinney began his career with Casual Male Corp. in 1997 and joined our Company in May 2002 as part of our distribution operations are centralized at our headquarters located in Canton, Massachusetts. However, if merchandise is available at the store level but not available at the distribution center, our stores are capableacquisition of completing the order and shipping it directly to a customer.
We believe that having one centralized distribution facility minimizes the delivered cost of merchandise and maximizes the in-stock position of our stores. We believe that the centralized distribution system enables our stores to maximize selling space by reducing necessary levels of back-room stock carried in each store. In addition, the distribution center provides order fulfillment services for our e-commerce business.
Since 2003, we have utilized United Parcel Services (“UPS”) for all of our store shipments as well as our domestic customer deliveries. By utilizing UPS, we are able to track all deliveries from the warehouse to our individual stores, including the status of in-transit shipments. In addition, we are able to provide our Direct-to-Consumer customers with Authorized Return Service and Web labels, making returns more convenient for them. Our current contract with UPS is through January 5, 2020.
In order to service our International customers, we have partnered with a global e-commerce company for payment and shipment services. Through this service, international customers view and pay for products in their local currency. Our partner then ships directly to our customer, which we believe helps avoid potential fraud and currency exchange rate risks.
Our warehousing application for our distribution center systems streamlines our distribution processes, enhances our in-transit times, and reduces our distribution costs substantially. Over the past several years, we have made improvements to our software such as automated packing for single piece orders, barcode scanning technologies and scanning technologies for our sortation systems, in order to improve productivity and to lower packing costs.
Our supply chain technology provides visibility for imports, giving our buyers accurate shipping information and allowing the distribution center to plan staffing for arriving freight, resulting in reduced costs and improved receipt efficiency. In fiscal 2017, we plan on improving the domestic routing process by converting from a paper-based to a web-based system that will also help us optimize our domestic inbound transportation costs.
In-bound calls for our direct businesses are currently handled at our Canton facility and are primarily fulfilled by our distribution center. If an order cannot be fulfilled by our distribution center, the order is completed at the store level.
MANAGEMENT INFORMATION SYSTEMS
The infrastructure of our management information systems has consistently been a priority to us. We believe that the investments we have made in this regard have improved our overall efficiency and most importantly have enabled us to manage our inventory more effectively.
Our management information systems consist of a full range of retail merchandising and financial systems which include merchandise planning and reporting, distribution center processing, inventory allocation, sales reporting, and financial processing and reporting. We believe that our current infrastructure provides us the ability and capacity to process transactions more efficiently and provides our management team with comprehensive tools with which to manage our business.
Our business is supported by a POS business application that captures daily transaction information by item, color and size. The POS system includes a multitude of features including CRM tools that enable us to track customer buying habits and provides us with the ability to target customers with specific offers and promotions.
Using a retail business intelligence solution, we are able to integrate data from several sources and provide enterprise-wide analytics reporting. Over the past few years, we have developed a custom Assortment Suite application that leverages business intelligence and predictive analytics to provide high impact insights into core merchandising tasks. In an effort to further improve our inventory management, we have created a standardized set of “best practices” for both our merchandise planning and allocation groups.
Our direct business and retail business maintain a shared inventory system and we operate a single system platform for DXL, Casual Male XLCorp.
Derrick Walker, 48, was our Senior Vice President and Rochester ClothingChief Marketing Officer from May 2012 until January 2017. Prior to deliver improved efficiencies andjoining our Company, Mr. Walker was the vice president of marketing for Lenscrafters from December 2009 to makeNovember 2011. Before that, Mr. Walker was the vice president of marketing for Finish Line from December 2006 to September 2009.
Nancy Youssef, 40, was our full product assortment availableSenior Vice President, International Business Development from November 2015 until January 2017. Prior to all of ourjoining the Company, from April 2009 to October 2015, Ms. Youssef was the vice president, international business formats.
We continually workdevelopment for Genesco, Inc. From June 2007 to improve our web environment. Our mobile optimized site capitalizes on the growing use of mobile devicesMarch 2009, she was senior brand development manager for HSN, Inc. From 2004 to look up store information, review product offerings, and complete purchases. In fiscal 2016, we completed the development and
implementation of a tablet optimized website to further capitalize on the continued growth of mobile e-commerce. In addition, our current website is fully integrated with a global e-commerce company to accommodate international customers by providing multi-currency pricing, payment processing, and international shipping. Functionality was also implemented to support an online custom shirt program and an in-store application to support both a custom suit and custom shirt program.
COMPETITION
Our business faces competition from a variety of sources, including department stores such as Macy’s and Dillard’s, mass merchandisers, other specialty stores and discount and off-price retailers, as well as other retailers that sell big & tall merchandise. While we have successfully competed on the basis of merchandise selection, comfort and fit, customer service and desirable store locations, there can be no assurances that other retailers, including e-commerce retailers, will not adopt purchasing and marketing concepts similar to ours. Discount retailers with significant buying power, such as Wal-Mart and J.C. Penney, represent a source of competition for us. The direct business has several competitors, including the King Size catalog and website.
The United States men’s big & tall apparel market is highly competitive with many national and regional department stores, specialty apparel retailers, single market operators and discount stores offering a broad range of apparel products similar to ours. Besides retail competitors, we consider any casual apparel manufacturer operating in outlet malls throughout the United States to be a competitor2007, Ms. Youssef worked in the casual apparel market. We believe that weMiddle East for SAS –Egypt where she was the international business development director.
There are the only national operator of apparel stores focused on the men’s big & tall market.
SEASONALITY
Historically, and consistent with the retail industry, we have experienced seasonal fluctuations as it relates to our operating income and net income. Traditionally, a significant portion of our operating income and net income is generated in the fourth quarter, as a result of the holiday season.
TRADEMARKS/TRADEMARK LICENSE AGREEMENTS
We own several service marks and trademarks relating to our businesses, including, among others, “Destination XL®”, “DXL®”, “DXL Mens Apparel®”, “Big on Being Better®”, “Casual Male®”, “Casual Male XL®”, “Rochester Clothing®”, “Rochester Big & Tall®”, “Harbor Bay®”, “Oak Hill®”, “Comfort Zone®”, “Synrgy™”, “Twenty-Eight Degrees™”, “Society of One®” and “True Nation®”. We also hold a U.S. patent for an extendable collar system, which is marketed as “Neck-Relaxer®” and a U.S. copyright for a no-iron hang tag.
EMPLOYEES
As of January 28, 2017, we employed approximately 2,625 associates. We hire additional temporary employees during the peak fall and Holiday seasons. None of our employees is represented by any collective bargaining agreement.
AVAILABLE INFORMATION
Our corporate website is www.destinationxl.com. Our investor relations site is http://investor.destinationxl.com. We make available through our website, free of charge, our Annual Reports on Form 10-K, Quarterly Reports on Form 10-Q, Current Reports on Form 8-K and all amendments to such reports filed or furnished pursuant to Section 13(a) of the Securities Exchange Act of 1934, as amended, as soon as reasonably practicable after we have electronically filed such material with, or furnished such materials to, the Securities and Exchange Commission. The SEC maintains an internet site that contains reports, proxy and information statements, and other information for issuers that file electronically with the SEC at http://www.sec.gov.
The following discussion identifies certain important factors that could affect our financial position, our actual results of operations and our actions and could cause our financial position, results of operations and our actions to differ materially from any forward-looking statements made by or on behalf of our Company.
The following risk factors are the important factors of which we are aware that could cause actual results, performance or achievements to differ materially from those expressed inno family relationships between any of our forward-looking statements. We operate in a continually changing business environmentdirectors and new risk factors emerge from time to time. Other unknown or unpredictable factors also could have material adverse effects on our future results, performance or achievements. We cannot assure you that our projected results or events will be achieved or will occur.executive officers.
Risks Related to Our Company and Our IndustrySection 16(a) Beneficial Ownership Reporting Compliance
We may not be successful in executing our DXL strategy and growing our market share.
Through the end of fiscal 2016, we have opened over 200 DXL stores while closing several of our Casual Male XL and Rochester Clothing stores. With the transition substantially complete, we currently anticipate that we will slow the pace of our store openings. However, for us to be successful in the future and maintain growth, we must be able to continue increasing our share of the men’s big & tall apparel market. Our growth and market share are dependent on our ability to successfully continue to build upon our DXL store concept, convert our existing Casual Male and Rochester customers into DXL customers and continue to attract new customers. Our inability to execute successfully the following factors could prevent us from growing our market share and DXL brand, which could have a material adverse effect on our results of operations, cash flows and financial position:
negotiate favorable lease arrangements for new DXL stores;
exit existing lease agreements on favorable terms;
effectively open and close stores within established cost parameters;
coordinate the timing of DXL store openings and Casual Male XL store closings;
hire qualified store management and store associates;
maintain an effective marketing program to build brand and store concept awareness as well as increase store traffic;
predict and respond to fashion trends, while offering our customers a broad selection of merchandise in an extended selection of sizes;
grow our DXL e-commerce business;
maintain our existing customer base as we transition them to the DXL store format;
attract and retain new target customers;
continue to grow and then sustain number of transactions, units-per-transaction and share of wallet; and,
operate at appropriate operating margins.
Our business may be adversely affected by the failure to identify suitable store locations and acceptable lease terms. In addition, some of our new stores may open in locations close enough to our existing stores to negatively impact sales at those locations.
We currently lease all of our store locations. Identifying and securing suitable store locations at acceptable lease terms is critical to our store growth. We generally have been able to negotiate acceptable lease rates and extensions, as needed. However, we cannot be certain that desirable locations at acceptable lease rates and preferred lease terms will continue to be available. Once we decide on a prospective new store or new market and find a suitable location, any delays in opening new stores could impact our financial results. In addition, if we need to pay higher occupancy costs in the future to secure ideal locations, the increased cost may adversely impact our financial performance and liquidity. Recent trends toward increased landlord consolidation could also negatively affect our ability to obtain and retain locations.
As we open additional locations in existing markets, some new stores may open in locations close enough to our existing stores to impact sales and profitability at the store level, which may also adversely affect our profitability.
Our marketing programs and success in maintaining and building our brand awareness, driving traffic and converting that traffic into an increased loyal customer base are critical to achieving market share growth within the big & tall industry.
Our ability to increase our share of the men’s big & tall apparel market is largely dependent on building and maintaining favorable brand recognition for our DXL stores and e-commerce sites and effectively marketing our merchandise to all of our target customers in several diverse market segments so that they will become loyal shoppers who spend a greater portion of their wallet on our product offerings. In order to grow our brand recognition and our market share, we depend on the successful development of our brand through marketing and advertising in a variety of ways, including television and radio advertising, advertising events, direct mail marketing, e-commerce and customer prospecting. Our business is directly impacted by the success of these efforts and those of our vendors. Future advertising efforts by us, our vendors or our other licensors, may be costly and, if not successful, will impact our ability to increase our market share and increase revenues.
Our business is seasonal and is affected by general economic conditions.
Our business is seasonal. Historically, a significant portion of our operating income has been generated during our fourth quarter (November-January). If, for any reason, we miscalculate the demand for our products during our fourth quarter, our sales in this quarter could decline, resulting in higher labor costs as a percentage of sales, lower margins and excess inventory, which could cause our annual operating results to suffer. In addition, our operations may be negatively affected by local, regional or national economic conditions, such as levels of disposable consumer income, consumer debt, interest rates and consumer confidence. Due to our seasonality, the possible adverse impact from such risks is potentially greater if any such risks occur during our fourth quarter.
Our ability to operate and expand our business and to respond to changing business and economic conditions will depend on the availability of adequate capital.
The operation of our business, the rate of our expansion and our ability to respond to changing business and economic conditions depend on the availability of adequate capital, which in turn depends on cash flow generated by our business and, if necessary, the availability of equity or debt capital. We will also need sufficient cash flow to meet our obligations under our existing debt agreements.
The amount that we are able to borrow and have outstanding under our credit facility at any given time is determined using an availability formula based on eligible assets. As a result, our ability to borrow is subject to certain risks and uncertainties, such as advance rates and quality of inventory, which could reduce the funds available to us under our credit facility.
We cannot assure you that our cash flow from operations or cash available under our credit facility will be sufficient to meet our needs. If we are unable to generate sufficient cash flows from operations in the future, we may have to obtain additional financing. If we incur additional indebtedness, that indebtedness may contain significant financial and other covenants that may significantly restrict our operations. We cannot ensure that we could obtain refinancing or additional financing on favorable terms or at all.
Our business may be adversely affected by economic and political issues abroad and changes in U.S. economic policies.
Economic and civil unrest in areas of the world where we source merchandise for our global sourcing program, as well as shipping and docking issues, could adversely impact the availability and cost of such merchandise. Disruptions in the global transportation network, such as political instability, the financial instability of our suppliers, merchandise quality issues, trade restrictions, labor and port strikes, tariffs, currency exchange rates, transport capacity and costs, inflation and other factors relating to foreign trade are beyond our control. In the event of disruptions or delays in deliveries due to economic or political conditions in foreign countries, such disruptions or delays could adversely affect our results of operations unless and until alternative supply arrangements could be made. These and other issues affecting our suppliers could adversely affect our business and financial performance.
In addition, the enactment of any new legislation in the U.S. that would impact current international trade regulations, exports or imports or tax policy with respect to foreign activities, or executive action affecting international trade agreements, including the reevaluation of the trading status of certain countries and/or retaliatory duties, taxes, quotas or other trade sanctions, could increase the cost of merchandise purchased from suppliers in such countries and could adversely affect our business and financial performance.
The loss of, or disruption in, our centralized distribution center could negatively impact our business and operations.
All merchandise for our stores and e-commerce operations is received into our centralized distribution center in Canton, Massachusetts, where the inventory is then processed, sorted and shipped to our stores or directly to our customers. We depend in large part on the orderly operation of this receiving and distribution process, which depends, in turn, on adherence to shipping schedules and effective management of the distribution center. Although we believe that our receiving and distribution process is
efficient and well-positioned to support our strategic plans, events beyond our control, such as disruptions in operations due to fire or other catastrophic events, employee matters or shipping problems, could result in delays in the delivery of merchandise to our stores or directly to our customers.
With all of our management information systems centralized in our corporate headquarters, any disruption or destruction of our system infrastructure could materially affect our business. This type of disaster is mitigated by our offsite storage and disaster recovery plans, but we would still incur business interruption that may impact our business for several weeks.
Although we maintain business interruption and property insurance, we cannot be sure that our insurance will be sufficient, or that insurance proceeds will be timely paid to us, in the event our distribution center is shut down for any reason or if we incur higher costs and longer lead times in connection with a disruption from our distribution center.
If we are unable to develop and implement our omni-channel initiatives successfully, our market share and financial results could be adversely affected.
One of our strategic initiatives has been to move from being a multi-channel retailer to an omni-channel retailer. Our customer’s shopping behavior continues to evolve across multiple channels and we are working to meet his needs. While we now consider ourselves an omni-channel retailer, we continue to make ongoing investments in our information technology systems to support evolving omni-channel capabilities.
Omni-channel retailing is rapidly evolving and our success depends on our ability to anticipate and implement innovations in sales and marketing technology and logistics in order to appeal to existing and potential customers who increasingly rely on multiple channels to meet their shopping needs. In addition, our competitors are also investing in omni-channel initiatives, some of which may be more successful than our initiatives.
If the investment in our omni-channel initiatives is not successful, our systems are unable to support such initiatives, or if our competitors are more successful, our financial results and our market penetration may be adversely affected.
We rely on the continued development of e-commerce and internet infrastructure development, failure of which could disrupt our business and negatively impact our sales.
We continue to have increasing levels of sales made through our e-commerce sites. Growth of our overall sales is dependent on customers continuing to expand their on-line purchases in addition to in-store to purchase our products. We cannot accurately predict the rate at which online purchases will expand.
Our success in growing our e-commerce activities will depend in part upon our development of an increasingly sophisticated e-commerce experience and infrastructure. Increasing customer sophistication requires that we provide additional website features and functionality, in order to be competitive in the marketplace and maintain market share. We will continue to iterate our website features, but we cannot predict future trends and required functionality or our adoption rate for customer preferences. In addition, we are vulnerable to additional risks and uncertainties associated with e-commerce sales, including security breaches, cyber-attacks, consumer privacy concerns, changes in state tax regimes and government regulation of internet activities. Our failure to successfully respond to these risks and uncertainties could reduce our e-commerce sales, increase our costs and diminish our growth prospects, which could negatively impact our results of operations.
If our long-lived assets become impaired, we may need to record significant non-cash impairment charges.
Periodically, we review our long-lived assets for impairment whenever economic events or changes in circumstances indicate that the carrying value of an asset may not be recoverable. Specifically, if an individual store location is unable to generate sufficient future cash flows, we may be required to record a partial or full impairment of that store’s assets. In addition, significant negative industry or general economic trends, disruptions to our business and unexpected significant changes or planned changes in our use of the assets (such as store relocations or closures) may also result in impairment charges. Any such impairment charges, if significant, could adversely affect our financial position and results of operations.
We may not be successful expanding our business internationally.
Our future growth strategy includes plans to open stores internationally, most likely using a franchise and licensing model. Customer demand, as well as a lack of familiarity with our brands, may differ internationally, and as a result, we may have difficulty attracting customers and growing brand awareness. In addition, our ability to conduct business internationally may be adversely impacted by political and economic risks. Our failure to expand internationally may limit our future growth opportunities.
We also have risks related to identifying suitable franchisees. Our franchise arrangements will limit our direct control, such as the ability of these third parties to meet their projections regarding store openings and sales, as well as their compliance with applicable laws and regulations. As such, we cannot ensure our profitability or success in international markets. In addition, the failure of these third parties to operate the stores in a manner consistent with our standards may adversely affect our brands and reputation.
We are dependent on third parties for the manufacture of the merchandise we sell.
We do not own or operate any manufacturing facilities and are therefore entirely dependent on third parties for the manufacture of the merchandise we sell. Without adequate supplies of merchandise to sell to our customers in the merchandise styles and fashions demanded by our particular customer base, sales would decrease materially and our business would suffer. We are dependent on these third parties’ ability to fulfill our merchandise orders and meet our delivery terms. In the event that manufacturers are unable or unwilling to ship products to us in a timely manner or continue to manufacture products for us, we would have to rely on other current manufacturing sources or identify and qualify new manufacturers. We might not be able to identify or qualify such manufacturers for existing or new products in a timely manner and such manufacturers might not allocate sufficient capacity to us in order to meet our requirements. Our inability to secure adequate and timely supplies of private label merchandise would negatively impact proper inventory levels, sales and gross margin rates, and ultimately our results of operations.
In addition, even if our current manufacturers continue to manufacture our products, they may not maintain adequate controls with respect to product specifications and quality and may not continue to produce products that are consistent with our standards. If we are forced to rely on manufacturers who produce products of inferior quality, then our brand recognition and customer satisfaction would likely suffer. These manufacturers may also increase the cost to us of the products we purchase from them.
A significant portion of our merchandise is imported directly from other countries, and U.S. domestic suppliers who source their goods from other countries supply most of our remaining merchandise. If the U.S. Government imposes significant tariffs or other restrictions on foreign imports, we may need to increase our prices which could adversely affect our revenues and merchandise margins.
Furthermore, in the event that commercial transportation is curtailed or substantially delayed, we may not be able to maintain adequate inventory levels of important merchandise on a consistent basis, which would negatively impact our sales and potentially erode the confidence of our customer base, leading to further loss of sales and an adverse impact on our results of operations.
Fluctuations in the price, availability and quality of raw materials and finished goods could increase costs.
Fluctuations in the price, availability and quality of fabrics or other raw materials used in the manufacturing of our merchandise could have a material adverse effect on our gross margin or on our ability to meet our customers’ demands. The prices for fabrics depend on demand and market prices for the raw materials used to produce them. To the extent that we cannot offset these cost increases with other cost reductions or efficiencies, such higher costs will need to be passed on to our customers. Such increased costs could lead to reduced customer demand, which could have a material adverse effect on our results of operations and cash flow.
Our success depends significantly on our key personnel and our ability to attract and retain additional personnel.
Our future success is dependent on the personal efforts, performance and abilities of our key management which includes our executive officer as well as several significant members of our senior management. For example, the loss of the services of David Levin, our President and Chief Executive Officer, who is an integral part of our daily operations and is the primary decision maker in all our important operating matters, could significantly impact our business until an adequate replacement or replacements can be identified and put in place. The loss of any of our senior management may result in a loss of organizational focus, poor operating execution, an inability to identify and execute strategic initiatives, an impairment in our ability to identify new store locations, and an inability to consummate possible acquisitions.
The competition is intense for the type of highly skilled individuals with relevant industry experience that we require and we may not be able to attract and retain new employees of the caliber needed to achieve our objectives.
Our business may be negatively impacted and we may be liable if third parties misappropriate proprietary information of our customers and breach our security systems.
We may be harmed by security risks we face in connection with our electronic processing and transmission of confidential customer information. During fiscal 2016, approximately 85% of our sales were settled through credit and debit card transactions. Any security breach could expose us to risks of loss, litigation and liability and could adversely affect our operations as well as cause our shoppers to stop shopping with us as a result of their lack of confidence in the security of their personally identifiable information, which could
have a negative impact on our sales and profitability. If third parties are able to penetrate our network security or otherwise misappropriate the personal information or credit card information of our customers or if third parties gain unauthorized and improper access to such information, we could be subject to liability. These liabilities could include claims for unauthorized purchases with credit card information, impersonation or other similar fraud claims, or claims for other misuses of personal information, including unauthorized marketing purposes, and could ultimately result in litigation. Liability for misappropriation of this information could be significant.
Further, if a third party were to use this proprietary customer information in order to compete with us, it could have a material adverse impact on our business and could result in litigation.
Our business is highly competitive, and competitive factors may reduce our revenues and profit margins.
The United States men’s big & tall apparel market is highly competitive with many national and regional department stores, mass merchandisers, specialty apparel retailers and discount stores offering a broad range of apparel products similar to the products that we sell. Besides retail competitors, we consider any manufacturer of big & tall merchandise operating in outlet malls throughout the United States to be a competitor. It is also possible that another competitor, either a mass merchant or a men’s specialty store or specialty apparel catalog, could gain market share in men’s big & tall apparel due to more favorable pricing, locations, brand and fashion assortment and size availability. Many of our competitors and potential competitors may have substantially greater financial, manufacturing and marketing resources than we do.
The presence in the marketplace of various fashion trends and the limited availability of shelf space also can affect competition. We may not be able to compete successfully with our competitors in the future and could lose brand recognition and market share. A significant loss of market share would adversely affect our revenues and results of operations.
In addition, we maintain exclusivity arrangements with several of the brands that we carry. If we were to lose any of these exclusivity arrangements or brands altogether, our revenues may be adversely affected.
We may be unable to predict fashion trends and customer preferences successfully.
Customer tastes and fashion trends are volatile and tend to change rapidly. Our success depends in large part upon our ability to predict effectively and respond to changing fashion tastes and consumer demands and to translate market trends to appropriate saleable product offerings. If we are unable to predict or respond to changing styles or trends successfully and misjudge the market for products or any new product lines, our sales will be impacted and we may be faced with a substantial amount of unsold inventory or missed opportunities. In response, we may be forced to rely on additional markdowns or promotional sales to dispose of excess, slow-moving inventory, which would decrease our revenues and margins. In addition, the failure to satisfy consumer demand, specifically in our DXL stores and websites, could have serious longer-term consequences, such as an adverse impact on our brand value and the loss of market share to our competitors.
The loss of any of our key trademarks or licenses could adversely affect demand for our products.
We own and use a number of trademarks and operate under several trademark license agreements. We believe that certain of these trademarks have significant value and are instrumental in our ability to create and sustain demand for and to market our products. We cannot be certain that these trademarks and licensing agreements will remain in effect and enforceable or that any license agreements, upon expiration, can be renewed on acceptable terms or at all. In addition, any future disputes concerning these trademarks and licenses may cause us to incur significant litigation costs or force us to suspend use of the disputed trademarks.
Acts of terrorism or a catastrophic event could negatively impact our operating results and financial condition.
Unforeseen events, including war, terrorism and other international conflicts, public health issues, and natural disasters such as earthquakes, hurricanes or other adverse weather and climate conditions, whether occurring in the U.S. or abroad, could disrupt our operations, or the operations of our vendors and other suppliers, or result in political or economic instability.
The continued threat of terrorism and heightened security measures in response to an act of terrorism may disrupt commerce and undermine consumer confidence which could negatively impact our sales by causing consumer spending to decline. Furthermore, an act of terrorism or war, or the threat thereof, could negatively impact our business by interfering with our ability to obtain merchandise from vendors or substitute suppliers at similar costs in a timely manner.
Our business depends on our ability to meet our labor needs.
Our success depends in part upon our ability to attract, motivate and retain a sufficient number of qualified employees, including store managers and sales associates, who understand and appreciate our product offerings and are able to represent our products to our customers adequately. Qualified individuals of the requisite caliber and number needed to fill these positions may be in short supply in some areas, and the turnover rate in the retail industry is high. If we are unable to hire and retain sales associates capable of consistently providing a high level of customer service, our business could be materially adversely affected. Although none of our employees is currently covered by collective bargaining agreements, our employees may elect to be represented by labor unions in the future, which could increase our labor costs. Additionally, competition for qualified employees could require us to pay higher wages to attract a sufficient number of adequate employees. An inability to recruit and retain a sufficient number of qualified individuals in the future may delay the planned openings of new stores or outlets. Any such delays, any material increases in employee turnover rates at existing stores or outlets or any increases in labor costs could have a material adverse effect on our business, financial condition or operating results.
Failure to comply with laws, rules and regulations could negatively affect our business operations and financial performance.
Our business is subject to federal, state, local and international laws, rules and regulations, such as state and local wage and hour laws, the U.S. Foreign Corrupt Practices Act, the Employee Retirement Income Security Act (“ERISA”), securities laws, import and export laws (including customs regulations), privacy and information security regulations, unclaimed property laws, the Affordable Care Act and many others. The effect of some of these laws and regulations may be to increase the cost of doing business and may have a material impact on our earnings. In addition, the complexity of the regulatory environment in which we operate and the related cost of compliance are both increasing due to legal and regulatory requirements and increased enforcement. In addition, as a result of operating in the U.K., we must comply with that country’s laws and regulations, which may differ substantially from, and may conflict with, corresponding U.S. laws and regulations. We may also be subject to investigations or audits by governmental authorities and regulatory agencies, which can occur in the ordinary course of business or which can result from increased scrutiny from a particular agency towards an industry, country or practice. If we fail to comply with laws, rules and regulations or the manner in which they are interpreted or applied, we may be subject to government enforcement action, class action litigation or other litigation, damage to our reputation, civil and criminal liability, damages, fines and penalties, and increased cost of regulatory compliance, any of which could adversely affect our results of operations and financial performance.
The new administration may make substantial changes to fiscal, tax and international trade policies that may adversely affect our business, financial condition and results of operations.
The new administration has called for substantial change to various fiscal, tax and international trade policies. We cannot predict the impact, if any, of these changes to our business, financial condition and results of operations. However, it is possible that these changes could adversely affect our business. It is likely that some policies adopted by the new administration will benefit us and others will negatively affect us. Until we know what changes are enacted, we will not know whether in total we benefit from, or are negatively affected by, the changes.
Risks Related to Our Corporate Structure and Stock
Our stock price has been and may continue to be extremely volatile due to many factors.
The market price of our common stock has fluctuated in the past and may increase or decrease rapidly in the future depending on news announcements and changes in general market conditions. The following factors, among others, may cause significant fluctuations in our stock price:
overall changes in the economy and general market volatility;
news announcements regarding our quarterly or annual results of operations;
quarterly comparable sales;
acquisitions;
competitive developments;
litigation affecting us; or
market views as to the prospects of the retail industry generally.
Rights of our stockholders may be negatively affected if we issue any of the shares of preferred stock which our Board of Directors has authorized for issuance.
We have available for issuance up to 1,000,000 shares of preferred stock, par value $0.01 per share. Our Board of Directors is authorized to issue any or all of these shares of preferred stock, in one or more series, without any further action on the part of stockholders. The rights of our stockholders may be negatively affected if we issue a series of preferred stock in the future that has preference over our common stock with respect to the payment of dividends or distribution upon our liquidation, dissolution or winding up.
In addition, the issuance of preferred stock by our Board of Directors pursuant to our certificate of incorporation, as amended, could have the effect of making it more difficult for a third party to acquire, or of discouraging a third party from acquiring, a majority of the outstanding voting stock of our Company.
State laws and our certificate of incorporation, as amended, may inhibit potential acquisition bids that could be beneficial to our stockholders.
We are subject to certain provisions of Delaware law, which could also delay or make more difficult a merger, tender offer or proxy contest involving us. In particular, Section 203 of the Delaware General Corporation Law prohibits a Delaware corporation from engaging in certain business combinations with any interested stockholder for a period of three years unless specific conditions are met. In addition, certain provisions of Delaware law could have the effect of delaying, deferring or preventing a change in control of us, including, without limitation, discouraging a proxy contest or making more difficult the acquisition of a substantial block of our common stock. The provisions could also limit the price that investors might be willing to pay in the future for shares of our common stock.
In addition, our certificate of incorporation, as amended, contains provisions that restrict any person or entity from attempting to transfer our stock, without prior permission from the Board of Directors, to the extent that such transfer would (i) create or result in an individual or entity becoming a five-percent shareholder of our stock, or (ii) increase the stock ownership percentage of any existing five-percent shareholder. These provisions provide that any transfer that violates such provisions shall be null and void and would require the purported transferee to, upon demand by us, transfer the shares that exceed the five percent limit to an agent designated by us for the purpose of conducting a sale of such excess shares. These provisions would make the acquisition of our Company more expensive to the acquirer and could significantly delay, discourage, or prevent third parties from acquiring our Company without the approval of our Board of Directors.
Item 1B. Unresolved Staff Comments
None.
Our corporate offices and retail distribution center are located at 555 Turnpike Street in Canton, Massachusetts. The property consists of a 755,992 gross square foot building located on approximately 27.3 acres. We owned the property until January 30, 2006, at which time we entered into a sale-leaseback transaction with Spirit Finance Corporation, a third-party real estate investment trust (“Spirit”), whereby we entered into a twenty-year lease agreement with a wholly-owned subsidiary of Spirit for an initial annual rent payment of $4.6 million, with periodic increases every fifth anniversary of the lease. In fiscal 2006, we realized a gain of approximately $29.3 million on the sale of this property, which was deferred and is being amortized over the initial 20 years of the related lease agreement. Accordingly, our current annual rent expense of $5.2 million is offset by $1.5 million related to the amortization of this deferred gain.
As of January 28, 2017, we operated 192 Destination XL retail stores, 13 Destination XL outlet stores, 97 Casual Male XL retail stores, 36 Casual Male XL outlet stores and 5 Rochester Clothing stores. All of these stores are leased by us directly from owners of several different types of centers, including life-style centers, shopping centers, free standing buildings, outlet centers and downtown locations. The store leases are generally 5 to 10 years in length and contain renewal options extending their terms by between 5 and 10 years. Following this discussion is a listing by state of all store locations open at January 28, 2017.
Sites for store expansion are selected on the basis of several factors, including the demographic profile of the area in which the site is located, the types of stores and other retailers in the area, the location of the store within the center and the attractiveness of the store layout. We also utilize financial models to project the profitability of each location using assumptions such as the center’s sales per square foot averages, estimated occupancy costs and return on investment requirements.
See also “Management’s Discussion and Analysis of Financial Condition and Results of Operation—Liquidity and Capital Resources—Capital Expenditures.”
Store count by state at January 28, 2017
United States |
| DXL retail DXL outlets * |
|
| Casual Male XL and Rochester Clothing stores |
| ||
Alabama |
| 1 |
|
| 2 |
| ||
Arizona |
| 4 |
|
| 1 |
| ||
Arkansas |
|
| — |
|
| 2 |
| |
California * |
| 23 |
|
| 15 |
| ||
Colorado |
| 3 |
|
| 2 |
| ||
Connecticut |
| 4 |
|
| 2 |
| ||
Delaware * |
| 2 |
|
|
| — |
| |
District of Columbia |
|
| — |
|
| 1 |
| |
Florida * |
| 10 |
|
| 11 |
| ||
Georgia |
| 3 |
|
| 4 |
| ||
Idaho |
| 1 |
|
|
| — |
| |
Illinois |
| 11 |
|
| 7 |
| ||
Indiana |
| 5 |
|
| 4 |
| ||
Iowa |
| 2 |
|
| 2 |
| ||
Kansas |
| 3 |
|
|
| — |
| |
Kentucky |
| 2 |
|
| 1 |
| ||
Louisiana |
| 3 |
|
| 1 |
| ||
Maine * |
| 1 |
|
| 1 |
| ||
Maryland |
| 5 |
|
| 5 |
| ||
Massachusetts |
| 5 |
|
| 3 |
| ||
Michigan * |
| 12 |
|
| 3 |
| ||
Minnesota |
| 2 |
|
| 2 |
| ||
Mississippi |
|
| — |
|
| 2 |
| |
Missouri |
| 3 |
|
| 6 |
| ||
Montana |
| 1 |
|
|
| — |
| |
Nebraska |
| 2 |
|
|
| — |
| |
Nevada |
| 3 |
|
|
| — |
| |
New Hampshire * |
| 3 |
|
|
| — |
| |
New Jersey |
| 7 |
|
| 8 |
| ||
New Mexico |
| 1 |
|
|
| — |
| |
New York * |
| 13 |
|
| 10 |
| ||
North Carolina |
| 3 |
|
| 4 |
| ||
North Dakota |
|
| — |
|
| 1 |
| |
Ohio |
| 8 |
|
| 3 |
| ||
Oklahoma |
| 2 |
|
|
| — |
| |
Oregon |
| 2 |
|
| 1 |
| ||
Pennsylvania |
| 8 |
|
| 14 |
| ||
Rhode Island |
| 1 |
|
|
| — |
| |
South Carolina * |
| 4 |
|
|
| — |
| |
South Dakota |
|
| — |
|
| 1 |
| |
Tennessee * |
| 6 |
|
| 1 |
| ||
Texas |
| 20 |
|
| 10 |
| ||
Utah |
| 2 |
|
|
| — |
| |
Vermont |
| 1 |
|
|
| — |
| |
Virginia * |
| 5 |
|
| 3 |
| ||
Washington * |
| 4 |
|
| 1 |
| ||
West Virginia |
|
| — |
|
| 1 |
| |
Wisconsin |
| 4 |
|
| 2 |
| ||
|
|
|
|
|
|
|
|
|
International |
|
|
|
|
|
|
|
|
London, England |
|
| — |
|
| 1 |
| |
From time to time, we are subject to various legal proceedings and claims that arise in the ordinary course of business. Management believes that the resolution of these matters will not have a material adverse impact on our future results of operations or financial position.
Item 4. Mine Safety Disclosure
Not applicable.
Item 5. Market for Registrant’s Common Equity, Related Stockholder Matters and Issuer Purchases of Equity Securities
Market Information
Our common stock is listed for trading on the NASDAQ Global Select Market under the symbol “DXLG”.
The following table sets forth, for the periods indicated, the high and low per share sales prices for the common stock, as reported on Nasdaq.
|
| High |
|
| Low |
| ||
Fiscal Year Ended January 28, 2017 |
|
|
|
|
|
|
|
|
First Quarter |
| $ | 5.88 |
|
| $ | 3.95 |
|
Second Quarter |
|
| 5.54 |
|
|
| 4.05 |
|
Third Quarter |
|
| 5.57 |
|
|
| 3.95 |
|
Fourth Quarter |
|
| 5.00 |
|
|
| 3.15 |
|
|
|
|
|
|
|
|
|
|
Fiscal Year Ended January 30, 2016 |
|
|
|
|
|
|
|
|
First Quarter |
| $ | 5.30 |
|
| $ | 4.28 |
|
Second Quarter |
|
| 5.41 |
|
|
| 4.32 |
|
Third Quarter |
|
| 6.70 |
|
|
| 4.23 |
|
Fourth Quarter |
|
| 6.16 |
|
|
| 4.10 |
|
Holders
As of March 15, 2017, based upon data provided by the transfer agent for our common stock, there were approximately 89 holders of record of our common stock. The number of holders does not include individuals or entities who beneficially own shares but whose shares are held of record by a broker or clearing agent, but does include each such broker or clearing agency as one record holder.
Dividends
We have not paid and do not anticipate paying cash dividends on our common stock. In addition, financial covenants in our loan agreement may restrict dividend payments. For a description of these financial covenants see Note C to the Notes to the Consolidated Financial Statements.
Issuer Purchases of Equity Securities
None.
The following Performance Graph compares our cumulative stockholder return with a broad market index (Standard & Poor’s 500) and one published industry index (Dow Jones U.S. Apparel Retailers) for each of the most recent five years ended January 31. The cumulative stockholder return for shares of our common stock (“DXLG”) and each of the indices is calculated assuming that $100 was invested on January 31, 2012. We paid no cash dividends during the periods shown. The performance of the indices is shown on a total return (dividends reinvested) basis. The graph lines merely connect January 31 of each year and do not reflect fluctuations between those dates. In addition, we have included a chart of the annual percentage return of our common stock, the S&P 500 and the Dow Jones U.S. Apparel Retailers.
Annual Return Percentage
|
| Year ended |
| |||||||||||||||||||
Company/Index |
|
|
| Jan 13 |
|
| Jan 14 |
|
| Jan 15 |
|
| Jan 16 |
|
| Jan 17 |
| |||||
DXLG |
|
| 37.3 | % |
|
| 17.0 | % |
|
| (5.6 | %) |
|
| (15.4 | %) |
|
| (23.3 | %) | ||
S&P 500 |
|
| 13.8 | % |
|
| 19.0 | % |
|
| 11.9 | % |
|
| (2.7 | %) |
|
| 18.3 | % | ||
Dow Jones U.S. Apparel Retailers |
|
| 23.4 | % |
|
| 12.1 | % |
|
| 19.3 | % |
|
| (2.9 | %) |
|
| (4.5 | %) | ||
Indexed Returns
|
| Base Period |
|
|
|
| ||||||||||||||||||
|
| Jan 12 |
|
| Jan 13 |
|
| Jan 14 |
|
| Jan 15 |
|
| Jan 16 |
|
| Jan 17 |
| ||||||
Company/Index |
|
|
|
|
|
|
|
|
|
|
|
|
|
|
|
|
|
|
|
|
|
|
|
|
DXLG |
| $ | 100 |
|
| $ | 137.31 |
|
| $ | 160.60 |
|
| $ | 151.64 |
|
| $ | 128.36 |
|
| $ | 98.51 |
|
S&P 500 |
| $ | 100 |
|
| $ | 113.81 |
|
| $ | 135.42 |
|
| $ | 151.56 |
|
| $ | 147.40 |
|
| $ | 174.32 |
|
Dow Jones U.S. Apparel Retailers |
| $ | 100 |
|
| $ | 123.42 |
|
| $ | 138.38 |
|
| $ | 165.08 |
|
| $ | 160.36 |
|
| $ | 153.12 |
|
The performance graph above shall not be deemed “filed” for purposes of Section 1816(a) of the Securities Exchange Act of 1934, as amended (the “Exchange Act”), requires our executive officers and directors, and persons who own more than 10% of a registered class of our equity securities (collectively, the “Reporting Persons”), to file reports of ownership and changes in ownership with the Securities and Exchange Commission (the “SEC”). The Reporting Persons are required to furnish us with copies of all Section 16(a) reports they file. Based solely upon a review of Forms 3, 4 and 5 and amendments thereto furnished to us by our officers and directors during fiscal 2016, we believe that the Reporting Persons complied with all applicable Section 16(a) reporting requirements and that all required reports were filed in a timely manner, except for Mary Luttrell’s initial Form 4 which was dated as of January 18, 2017 but was not filed until January 26, 2017.
Code of Ethics
We have adopted a Code of Ethics which applies to our directors, Chief Executive Officer, Chief Financial Officer and Chief Accounting Officer, as well as our other senior officers. The full text of the Code of Ethics can be found under “Corporate Governance –Charters & Policies” on the Investor Relations page of the our corporate web site, which is at http://investor.destinationxl.com. We intend to satisfy the disclosure requirement under Item 5.05 of Form 8-K regarding any amendment to, or otherwise subject towaiver from, a provision of our Code of Ethics by posting such information on our website
Audit Committee
We have a separately-designated standing Audit Committee established in accordance with section 3(a)(58)(A) of the liabilityExchange Act. The Audit Committee is currently comprised of that section. This graph will not be deemed incorporated by reference into any filingMessrs. Choper, Mesdag and Mooney. Each of the members of the Audit Committee is independent, as independence for Audit Committee members is defined under the Securities Actrules of 1933,Nasdaq. Mr. Mooney serves as amended, orour audit committee financial expert. Effective June 1, 2017, Mr. Kyees will replace Mr. Choper on the Exchange Act, whether made before or afteraudit committee and Mr. Mooney will become Chairperson.
The Audit Committee operates under a written charter, which can be found under “Corporate Governance - Charters & Policies” on the date hereof, regardlessInvestor Relations page of any general incorporation language in such filing.
our website at http://investor.destinationxl.com.
Item 6.11. Selected Financial DataExecutive Compensation
The following tables set forth selected consolidated financial data of our Company as ofCompensation Discussion and for each of the years in the five-year period ended January 28, 2017 and should be read in conjunction with “Management’sAnalysis
Executive Summary
This Compensation Discussion and Analysis of Financial Condition and Results of Operations” and our accompanying Consolidated Financial Statements and Notes thereto.
We derived the selected financial data presented below for the periods or dates indicated from our consolidated financial statements. Our consolidated financial statements as of and for the years ended January 28, 2017, January 30, 2016, January 31, 2015 and February 1, 2014 were audited by KPMG LLP, an independent registered public accounting firm. Our consolidated financial statements as of and for the year ended February 2, 2013 were audited by Ernst & Young LLP, an independent registered public accounting firm. Our consolidated financial statements as of and for the years ended January 28, 2017, January 30, 2016 and January 31, 2015 are included in this Annual Report.
Forprovides a discussion of certain factors that materially affect the comparability of the selected consolidated financial data or cause the data reflected herein not to be indicativesummary of our future results of operations or financial condition, see Item 1A, “Risk Factors”executive compensation philosophy and Item 7, “Management’s Discussionprograms and Analysis of Financial Conditiondiscusses the compensation paid to our Chief Executive Officer (“CEO”) and Results of Operations.” other named executive officers for fiscal 2016 (collectively, our “Named Executive Officers”).
Our Named Executive Officers for fiscal 2016 were:
|
| Fiscal Years Ended (1)(2) |
|
| |||||||||||||||||
|
| January 28, 2017 (Fiscal 2016) |
|
| January 30, 2016 (Fiscal 2015) |
|
| January 31, 2015 (Fiscal 2014) |
|
| February 1, 2014 (Fiscal 2013) |
|
| February 2, 2013 (Fiscal 2012) |
|
| |||||
|
| (In millions, except per share and operating data) |
|
| |||||||||||||||||
INCOME STATEMENT DATA: |
|
|
|
|
|
|
|
|
|
|
|
|
|
|
|
|
|
|
|
|
|
Sales |
| $ | 450.3 |
|
| $ | 442.2 |
|
| $ | 414.0 |
|
| $ | 386.5 |
|
| $ | 397.6 |
|
|
Gross profit, net of occupancy costs |
|
| 204.9 |
|
|
| 203.8 |
|
|
| 190.0 |
|
|
| 176.4 |
|
|
| 183.7 |
|
|
Selling, general and administrative expenses |
|
| 173.3 |
|
|
| 180.6 |
|
|
| 174.8 |
|
|
| 169.1 |
|
|
| 154.4 |
|
|
Depreciation and amortization |
|
| 30.6 |
| (4) |
| 28.4 |
|
|
| 24.0 |
| (4) |
| 20.8 |
| (4) |
| 15.5 |
|
|
Operating income (loss) |
|
| 1.0 |
|
|
| (5.1 | ) |
|
| (8.8 | ) |
|
| (13.5 | ) |
|
| 13.8 |
|
|
|
|
|
|
|
|
|
|
|
|
|
|
|
|
|
|
|
|
|
|
|
|
Provision for income taxes |
|
| 0.2 |
|
|
| 0.3 |
|
|
| 0.2 |
|
|
| 45.7 |
| (5) |
| 5.2 |
|
|
Income (loss) from continuing operations |
| $ | (2.3 | ) |
| $ | (8.4 | ) |
| $ | (11.2 | ) |
| $ | (60.3 | ) |
| $ | 8.0 |
|
|
Income (loss) from discontinued operations |
|
| — |
|
|
| — |
|
|
| (1.1 | ) |
|
| 0.5 |
|
|
| (1.9 | ) |
|
Net income (loss) |
| $ | (2.3 | ) |
| $ | (8.4 | ) |
| $ | (12.3 | ) |
| $ | (59.8 | ) |
| $ | 6.1 |
|
|
|
|
|
|
|
|
|
|
|
|
|
|
|
|
|
|
|
|
|
|
|
|
Income (loss) from continuing operations per share - diluted |
| $ | (0.05 | ) |
| $ | (0.17 | ) |
| $ | (0.23 | ) |
| $ | (1.24 | ) |
| $ | 0.17 |
|
|
Net income (loss) per share - diluted |
| $ | (0.05 | ) |
| $ | (0.17 | ) |
| $ | (0.25 | ) |
| $ | (1.23 | ) |
| $ | 0.13 |
|
|
|
|
|
|
|
|
|
|
|
|
|
|
|
|
|
|
|
|
|
|
|
|
BALANCE SHEET DATA: |
|
|
|
|
|
|
|
|
|
|
|
|
|
|
|
|
|
|
|
|
|
Working capital(6) |
| $ | 23.3 |
|
| $ | 28.1 |
|
| $ | 42.8 |
|
| $ | 50.6 |
|
| $ | 82.5 |
|
|
Inventories |
|
| 117.4 |
|
|
| 125.0 |
|
|
| 115.2 |
|
|
| 105.6 |
|
|
| 104.2 |
|
|
Property and equipment, net |
|
| 124.3 |
|
|
| 125.0 |
|
|
| 120.3 |
|
|
| 102.9 |
|
|
| 65.9 |
|
|
Total assets(6) |
|
| 269.3 |
|
|
| 274.3 |
|
|
| 259.9 |
|
|
| 236.7 |
|
|
| 245.9 |
|
|
Long term debt, net of current portion(6) |
|
| 12.1 |
|
|
| 19.0 |
|
|
| 26.2 |
|
|
| 12.0 |
|
|
| — |
|
|
Stockholders’ equity |
|
| 88.5 |
|
|
| 88.4 |
|
|
| 92.4 |
|
|
| 105.0 |
|
|
| 161.2 |
|
|
|
|
|
|
|
|
|
|
|
|
|
|
|
|
|
|
|
|
|
|
|
|
OTHER DATA: |
|
|
|
|
|
|
|
|
|
|
|
|
|
|
|
|
|
|
|
|
|
Cash flow provided by operating activities |
| $ | 35.0 |
|
| $ | 18.4 |
|
| $ | 13.8 |
|
| $ | 24.9 |
|
| $ | 29.9 |
|
|
less: capital expenditures, infrastructure projects |
|
| (9.6 | ) |
|
| (13.3 | ) |
|
| (10.5 | ) |
|
| (10.0 | ) |
|
| (6.8 | ) |
|
Free cash flow before DXL capital expenditures(3) (Non-GAAP measure) |
| $ | 25.4 |
|
| $ | 5.1 |
|
| $ | 3.3 |
|
| $ | 14.9 |
|
| $ | 23.1 |
|
|
less: capital expenditures for DXL stores |
|
| (19.6 | ) |
|
| (20.1 | ) |
|
| (30.4 | ) |
|
| (44.1 | ) |
|
| (25.6 | ) |
|
Free cash flow (Non-GAAP measure)(3) |
| $ | 5.8 |
|
| $ | (15.0 | ) |
| $ | (27.1 | ) |
| $ | (29.2 | ) |
| $ | (2.5 | ) |
|
|
|
|
|
|
|
|
|
|
|
|
|
|
|
|
|
|
|
|
|
|
|
OPERATING DATA: |
|
|
|
|
|
|
|
|
|
|
|
|
|
|
|
|
|
|
|
|
|
Comparable sales percentage |
|
| 0.6 | % |
|
| 4.8 | % |
|
| 6.4 | % |
|
| 3.0 | % |
|
| 1.5 | % |
|
Gross profit margins |
|
| 45.5 | % |
|
| 46.1 | % |
|
| 45.9 | % |
|
| 45.6 | % |
|
| 46.2 | % |
|
EBITDA from continuing operations (Non-GAAP measure) (3) |
| $ | 31.6 |
|
| $ | 23.3 |
|
| $ | 15.2 |
|
| $ | 7.3 |
|
| $ | 29.3 |
|
|
EBITDA margin from continuing operations (Non-GAAP measure) (3) |
|
| 7.0 | % |
|
| 5.3 | % |
|
| 3.7 | % |
|
| 1.9 | % |
|
| 7.4 | % |
|
Operating margin |
|
| 0.2 | % |
|
| (1.2 | %) |
|
| (2.1 | %) |
|
| (3.5 | %) |
|
| 3.5 | % |
|
Net sales per square foot (7) |
| $ | 182 |
|
| $ | 183 |
|
| $ | 179 |
|
| $ | 174 |
|
| $ | 179 |
|
|
Number of stores open at fiscal year end |
|
| 343 |
|
|
| 345 |
|
|
| 353 |
|
|
| 359 |
|
|
| 412 |
|
|
|
| David A. Levin, President and CEO |
|
| Peter H. Stratton, Jr., Senior Vice President, Chief Financial Officer and |
|
|
|
| Robert S. Molloy, Senior Vice President, General Counsel and Secretary |
|
| Brian S. Reaves, Senior Vice President and |
|
| Derrick Walker, Former Senior Vice President and Chief Marketing Officer |
➢ | Nancy S. Youssef, Former Senior Vice President, International Business Development |
Fiscal 2016 Highlights
Item 7. Management’s Discussion and AnalysisWe believe that the value of Financial Condition and Results of Operations
FORWARD LOOKING STATEMENTS
As noted above, this Annual Report, including, without limitation, this Item 7, contains “forward-looking statements,” including forward-looking statements withincompensation awarded to our Named Executive Officers should be aligned with the meaningperformance of the Private Securities Litigation Reform Act of 1995. Actual results or developments could differ materially from those projected in such statements asCompany and our compensation packages are aimed to achieve that at the target level. To have a result of numerous factors, including, without limitation those risks and uncertainties set forth in Item 1A, Risk Factors, which you are encouraged to read. The following discussion and analysisfull understanding of our financial condition and resultsexecutives’ compensation in fiscal 2016, we have to look at the performance of operations should be read in light of those risks and uncertainties and in conjunction with our accompanying Consolidated Financial Statements and Notes thereto.
Certain figures discussed below may not add due to rounding.
Segment Reporting
We report our operations as one reportable segment, Big & Tall Men’s Apparel. We consider our retail and direct businesses, especially in our growing omni-channel environment, to be similar in terms of economic characteristics, production processes and operations, and have therefore aggregated them into a single reporting segment.
Comparable Sales Definition
Total comparable sales include our retail stores that have been open for at least 13 months and our direct business. Stores that have been remodeled or re-located duringthe Company over the period are also included in our determination of comparable sales. Storesfrom fiscal 2013 through fiscal 2016. In fiscal 2013, we began a transformation process that have been expanded by more than 25% are considered non-comparable for the first 13 months. Ifreplaced a store becomes a clearance center, it is also removed from the calculation of comparable sales. The method of calculating comparable sales varies across the retail industry and, as a result, our calculation of comparable sales is not necessarily comparable to similarly titled measures reported by other retailers.
Our customer’s shopping experience continues to evolve across multiple channels and we are continually changing to meet his needs. Since fiscal 2014 the majority of our retaillegacy Casual Male XL stores have the capability of fulfilling online orders if merchandise is not available in the warehouse. As a result, we continue to see more transactions that begin online but are ultimately completed at the store level. Similarly, if a customer visits a store and the item is out of stock, the associate can order the item through our websites. A customer also has the ability to order online and pick-up in store. Because this omni-channel approach to retailing is changing the boundaries of where a sale originates and where a sale is ultimately settled, we do not report comparable sales separately for our retail and direct businesses. We have continued to provide specific information onwith our DXL comparable store sales in connectionMen’s Apparel stores. In total, over this four-year period, we opened 156 DXL stores and closed an aggregate of 225 Casual Male XL and Rochester Clothing stores, with our ongoing roll-out. Withtotal store count decreasing by 69 stores. Essentially, over 200 DXL stores at the end of fiscal 2016,this four-year period we are nearing the endconverted more than half of our rollout and for fiscal 2017 we will transition to one comparable sales figure for the Company and will no longer provide specific information on our DXL comparable store sales.base.
Non-GAAP Measures
We monitor certain non-GAAPFrom a financial measures on a regular basis in order to track the progress of our business. These measures include adjusted net loss, adjusted net loss per diluted share, free cash flow before DXL capital expenditures, free cash flow, EBITDA, EBITDA from continuing operations and EBITDA margin from continuing operations. We believe these measures provide helpful information with respect to the Company’s operating performance and that the inclusion of these non-GAAP measures is important to assist investors in comparing our performance in fiscal 2016 to fiscal 2015 and fiscal 2014. We also provide certain forward-looking information with respect to certain of these non-GAAP financial measures. However, these measures may not be comparable to similar measures used by other companies and should not be considered superior to or as a substitute for net loss, loss from continuing operations, net loss per diluted share or cash flows from operating activities in accordance with GAAP. See “Non-GAAP Reconciliations” below for additional information on these non-GAAP financial measures and reconciliations to comparable GAAP measures.
EXECUTIVE OVERVIEW
We are pleased with our continued improvement in fiscal 2016, despite overall weakness of the retail environment. Our net loss for fiscal 2016 was $(2.3) million, or $(0.05) per diluted share, compared with a net loss of $(8.4) million, or $(0.17) per diluted share in fiscal 2015. Sales growth in fiscal 2016 was 1.8% and EBITDA increased 35.8% to $31.6 million as compared to $23.3 million at fiscal 2015. Dueperspective, due to the intensive capital requirements associated with our DXL transitionconversion strategy, depreciation costs have increased sharply over this four-year period. In fiscal 2012, before we initiated the past 3 years. roll-out, total depreciation and amortization costs were $15.5 million as compared to $30.6 million in fiscal 2016. This substantial increase of over $15.0 million directly impacted the Company’s earnings. Despite the significant increase in depreciation, over this four-year period we improved our earnings each year, from a net loss of $(59.8) million in fiscal 2013 to a net loss of $(2.3) million in fiscal 2016. Of note, fiscal 2013 included a charge of $51.3 million to establish a full valuation allowance against our deferred tax asset. Adjusting for the full valuation allowance, to permit a better comparison, the net loss in earnings improved by $6.2 million from fiscal 2013 to fiscal 2016.
As a result we believe EBITDA isof this increase in depreciation expense, Earnings before Income Taxes and Depreciation and Amortization (“EBITDA”), a non-GAAP measure, has been a key performance indicator as to how well our strategy is working.
Our DXL concept has beenworking for our business. Over the principal driver of our sales growth and improvementfour-year period, EBITDA improved from $7.3 million in profitability. For fiscal 2016, our 166 comparable DXL retail stores had a sales increase of 2.4%, which we believe demonstrates that our store associates are able2013 to increase the quality of sale using our proven selling model, despite the lack of store traffic we experienced$31.6 million in the latter half of fiscal 2016. Regionally, sales for our DXL stores located in the central part of the country, which accounted for approximately 40% of our DXL sales during fiscal 2016, trailed sales from our DXL stores located in coastal statesIn addition to EBITDA growth, we increased Sales, on a decreasing store base, and by approximately 600 basis points. We believe that this disparity is due in part to the uncertainty in the U.S. economic and political climate that impacted the retail industry, especially in the second half of fiscal 2016, and contributed to slower than expected top-line growth for us. Sales per square foot for our DXL retail stores increased to $180 in fiscal 2016 from $177 in fiscal 2015 and $165 in fiscal 2014. Of the 192 DXL retail stores open at the end of fiscal 2016 49 had sales per square foot in excessreturned to generating positive free cash flow, enabling us to fund our store growth from operations as opposed to borrowings. Please see “Non-GAAP Financial Measures” below for a reconciliation of $200. Overall, we are converting traffic with number of transactions up 1.9%, dollars per transactions up 0.5%Net Loss to EBITDA and units per transactions up 2.0% over fiscal 2015.
Over the past several years, we have relied on our Spring and Fall television and radio campaignsCash Flow from Operating Activities to build brand awareness and drive traffic. ForFree Cash Flow.
The following charts illustrate the Spring 2016 campaign we made the decision to air our 2015 commercial rather than invest in a new creative campaign. We found that the Spring 2016 television campaign did not drive a meaningful improvement in traffic or customer awareness. As a result, we decided to eliminate our Fall television advertising campaignbusiness over this defined four-year transition period.
4 Years of Continuous Growth
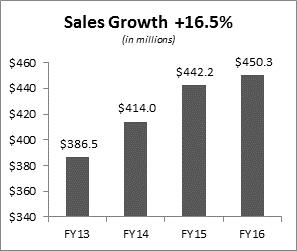
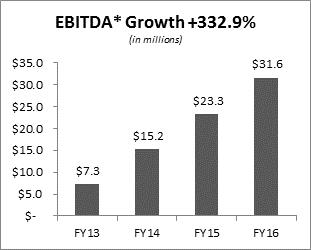
 ��
�� 
* EBITDA for fiscal 2013 and instead redirect some of those funds into digital advertising. There were several factors involved in our decision to eliminatefiscal 2014 reflects EBITDA from continuing operations
** | Free Cash Flow is a Non-GAAP measure. See “Non-GAAP Financial Measures” below for a reconciliation of Cash Flow from Operating Activities to Free Cash Flow. |
Fiscal 2016 Executive Compensation Highlights
Our Named Executive Officers and the Fall campaign: (i) we believed that the regional difference in sales that we started to see in September was an indicator that there may be a larger macro-economic issue, (ii) we believed that the Spring campaign did not provide the increase in store traffic that we were expecting, and (iii) there was uncertainty surrounding the impact the political environment was having on our customer base. Subsequently, customer feedback on our commercial also indicated that we were not connecting on the key points necessary to drive traffic. While this decision likely had a negative impact on our top-line growth, we believed that given the current economic and political environment, eliminating the Fall television campaign and instead redirecting a portionrest of the marketing funds into digital advertising offered a better return on investment this fiscal year. However, we also saw an unexpected drop in customer awareness for the first time since we began opening DXL stores and believe that this was dueexecutive team were integral to the lacksuccess of media advertising. With only 4 out of 10 customers knowing who we are, brand awareness and new customer acquisition is key to our success in driving sales growth and building market share, so we will be reinvesting in our marketing programsthis transition. As such, in fiscal 20172013, the Compensation Committee approved the 2013-2016 Long-Term Incentive Plan (“2013-2016 LTIP”) and expect to spend approximately $25.0 millionsubsequently in fiscal 2017 to help create store traffic and grow brand awareness.
A significant contributor to our DXL sales growth has been our “end-of-rack” customer. We define “end-of-rack” customer as any customer with a waist size 46 inches or less. For fiscal 2016, our end-of-rack customer represented 45.0% of our sales in bottoms, compared with 44.0% for fiscal 2015. Consistent with our overall results, we saw this growth slow during the latter half of fiscal 2016, which we believe is partially attributable to our decision not to run the Fall campaign.
From a liquidity perspective, during fiscal 2016 we achieved our objective of funding the build out of our DXL stores from free cash flow. We also started to pay down our debt levels for the first time since we started our DXL rollout four years ago. Cash flow from operations improved by $16.6 million. This improvement, with a $4.2 million decrease in capital expenditures, resulted in a $20.8 million improvement in free cash flow.
The improvement in cash flow from operations is largely due to the positive results from our inventory optimization project that we implemented in fiscal 2016. We made several improvements to streamline operations at our distribution center, including tighter controls over the number of merchandise weeks of supply and improvements in inventory receipt flow and procurement. This project contributed to inventory levels decreasing by $7.6 million at January 28, 2017 compared to January 30, 2016, which resulted in significant improvement in working capital, thus improving free cash flow. As reflected in our “Fiscal 2017 Outlook” below, we expect these changes to result in a more optimized inventory structure that will continue to improve our working capital position through fiscal 2017. We do not believe these changes have or will jeopardize sales from out-of-stock positions in either our stores or in our direct business.
Our capital expenditures decreased slightly in fiscal 2016 due to fewer store openings, at a lower average square footage, than fiscal 2015. During fiscal 2016, we opened 26 DXL retail stores and 4 DXL outlet stores. In addition, we closed 28 Casual Male XL retail stores and 4 Casual Male XL outlet stores.
Fiscal 2017 Outlook
In light of the difficult retail environment we experienced in the latter half of fiscal 2016, we are taking a watchful approach to fiscal 2017. Our primary objective in fiscal 2017 is to grow our customer base through a revitalized marketing program and to maintain a strong liquidity position by continuing to improve cash flow. We will be reinvesting in our marketing initiatives to help drive brand awareness, store traffic and our digital presence by increasing our marketing plan for fiscal 2017 by approximately $6.8 million to $25.0 million. We will continue to work on our inventory optimization project which was started in fiscal 2016 and, on an annual
basis, our DXL store growth will be funded from operations. As a result, we expect to open 19 DXL retail stores and 1 DXL outlet store in fiscal 2017, while closing 16 Casual Male XL retail stores and 3 Casual Male XL outlet stores.
For fiscal 2017, our outlook, based on a 53-week year, is as follows:
Sales are expected to range from $470.0 million to $480.0 million, with a total company comparable sales increase of approximately 1.0% to 4.0%.
Gross margin rate of approximately 46.0%, an increase of 50 basis points from fiscal 2016.
Net loss, on a GAAP basis, of $(5.7) to $(11.7) million, or $(0.11) to $(0.23) per diluted share.
EBITDA of $24.0 to $30.0 million, a decrease from fiscal 20162014, as a result of increased marketing costs.the Board’s decision to slow down the transition, the 2016 Wrap-Around Plan (“2016 Wrap”). These plans were designed for the specific purpose of retaining and rewarding our executives during the transition to the DXL concept.
Adjusted net loss of $(0.06)Because the 2013-2016 LTIP was a four-year plan intended to $(0.14) per diluted share. Because we expectreward executives for performance during the transition, our executive team had no opportunity to continue providing a full valuation allowance against our deferred tax assets, we do not expect to recognizeearn any income tax benefitlong-term performance-based incentive compensation in fiscal 2017. This non-GAAP net loss was calculated, assuming a normal tax benefit of approximately 40%, by taking the 2017 forecasted earnings of a net loss of $(0.11) to $(0.23) per diluted share and multiplying each by 40% to calculate an estimated income tax benefit of $(0.05)-$(0.09) per diluted share, resulting in an adjusted net loss of $(0.06) to $(0.14) per diluted share.
Capital expenditures of approximately $22.0 million, $13.7 million of which will be for new DXL stores and $8.3 million of which will be for infrastructure projects, partially offset by approximately $5.0 million in tenant allowances. We expect to fund our capital expenditures primarily from our operating cash flow.
At the end of fiscal 2017, we expect cash flow from operating activities of $37.0 million to $42.0 million (including tenant allowances), resulting in positive free cash flow, before DXL capital expenditures, of approximately $28.7 million to $33.7 million. Free cash flow will be approximately $15.0 to $20.0 million.
As discussed more fully below under “Liquidity and Capital Resources,” subsequent to the end of fiscal 2016, our Board of Directors approved a stock repurchase plan, pursuant to which we can purchase up to $12.0 million of our outstanding common stock during fiscal 2017.
Summary of Financial Results
(in millions, except for per share data) |
| Fiscal 2016 |
|
| Fiscal 2015 |
|
| Fiscal 2014 |
| |||
Operating income (loss) (GAAP) |
| $ | 1.0 |
|
| $ | (5.1 | ) |
| $ | (8.8 | ) |
Add back: Depreciation and amortization expense |
|
| 30.6 |
|
|
| 28.4 |
|
|
| 24.0 |
|
EBITDA from continuing operations |
| $ | 31.6 |
|
| $ | 23.3 |
|
| $ | 15.2 |
|
EBITDA |
| $ | 31.6 |
|
| $ | 23.3 |
|
| $ | 14.1 |
|
|
|
|
|
|
|
|
|
|
|
|
|
|
Diluted loss per share: |
|
|
|
|
|
|
|
|
|
|
|
|
On a GAAP basis: |
|
|
|
|
|
|
|
|
|
|
|
|
Net loss from continuing operations |
| $ | (0.05 | ) |
| $ | (0.17 | ) |
| $ | (0.23 | ) |
Loss from discontinued operations |
| $ | — |
|
| $ | — |
|
| $ | (0.02 | ) |
Net loss |
| $ | (0.05 | ) |
| $ | (0.17 | ) |
| $ | (0.25 | ) |
|
|
|
|
|
|
|
|
|
|
|
|
|
On a Non-GAAP basis: |
|
|
|
|
|
|
|
|
|
|
|
|
Adjusted net loss from continuing operations (non-GAAP basis) |
| $ | (0.03 | ) |
| $ | (0.10 | ) |
| $ | (0.13 | ) |
Loss from discontinued operations |
| $ | — |
|
| $ | — |
|
| $ | (0.02 | ) |
Adjusted net loss (Non-GAAP basis) |
| $ | (0.03 | ) |
| $ | (0.10 | ) |
| $ | (0.16 | ) |
RESULTS OF OPERATIONS
Our fiscal year is a 52- or 53-week period ending on the Saturday closest to January 31. Fiscal 2016, fiscal 2015 and2013, fiscal 2014 were all 52-week periods.or fiscal 2015.
|
| Fiscal year |
| |||||
(in millions) |
| 2016 |
|
| 2015 |
| ||
Sales from prior year |
| $ | 442.2 |
|
| $ | 414.0 |
|
Less prior year sales for stores that have closed |
|
| (25.4 | ) |
|
| (34.6 | ) |
|
| $ | 416.8 |
|
| $ | 379.4 |
|
|
|
|
|
|
|
|
|
|
Increase in comparable sales |
|
| 2.5 |
|
|
| 18.0 |
|
Non-comparable sales, primarily DXL stores open less than 13 months |
|
| 30.5 |
|
|
| 44.2 |
|
Other, net |
|
| 0.5 |
|
|
| 0.6 |
|
Sales |
| $ | 450.3 |
|
| $ | 442.2 |
|
SalesTherefore, when evaluating compensation for fiscal 2016, increased 1.8%it is important to $450.3 millionconsider that fiscal 2016 represented the culmination of the past 4 years of transition. Further, fiscal 2016 was heavily weighted by the fact that it was a pivot year with respect to long-term performance plans, with the 2013-2016 LTIP and 2016 Wrap ending and the 2016-2017 LTIP beginning. As such, total compensation as compared to $442.2 million in fiscal 2015. The increase in sales was partly due to sales from DXL stores opened less than 13 months of $30.5 million, offset partially by lost sales of $25.4 million from closed and converted stores. In addition, comparable sales increased $2.5 million, or 0.6%, compared to fiscal 2015.
Includedreflected in the comparable sales increaseSummary Compensation Table for fiscal 2016 includes (i) a partial performance-based award under the 2016 Wrap, which again represents a four-year performance period, that does not vest until fiscal 2017 and (ii) the grant of $2.5 million, areunearned awards associated with our 2016-2017 LTIP, which do not begin to vest until fiscal 2018.
On a comparative basis, the comparable sales from our 166 DXL retail stores, which increased 2.4%, or $5.4 million infollowing table shows total compensation earned for each Named Executive Officer for fiscal 2016 as compared to fiscal 2015. Mr. Walker and Ms. Youssef are excluded from this table due to their terminations of employment.
Named Executive Officer |
| Fiscal 2016 |
|
| Fiscal 2015 |
|
| % Change (1) |
| |||
David A. Levin |
| $ | 2,132,001 |
|
| $ | 2,026,290 |
|
|
| 5.2 | % |
Peter H. Stratton, Jr. |
| $ | 594,569 |
|
| $ | 479,837 |
|
|
| 23.9 | % |
Kenneth M. Ederle |
| $ | 709,610 |
|
| $ | 638,967 |
|
|
| 11.1 | % |
Robert S. Molloy |
| $ | 640,964 |
|
| $ | 574,991 |
|
|
| 11.5 | % |
Brian S. Reaves |
| $ | 564,415 |
|
| $ | 515,288 |
|
|
| 9.5 | % |
|
|
|
|
|
|
|
|
|
|
|
|
|
(1) | As discussed above, the increase in compensation for fiscal 2016 as compared to fiscal 2015 was principally due to the overlap of long-term incentives plans, with the grant of unvested awards earned under the 2016 Wrap and the grant of time-based awards under the 2016-2017 LTIP. Offsetting this increase was the decrease in the percentage payout under the 2016 Annual Incentive Plan (“2016 AIP”) as compared to fiscal 2015. See “Compensation Components, Fiscal 2016 Compensation Decisions, 2017 Annual Incentive Plan Targets and Long-Term Incentive Program.” Messrs. Stratton and Molloy also received salary adjustments in fiscal 2016 of 25% and 3%, respectively, to align their base salary with our peer group. |
Over the past four years, Mr. Levin has led our transformation to DXL and over that same period we discussed above, store traffic was down across the retail industry in the latter half of fiscal 2016, which we believe was due in part to the macroeconomic and political issues the country is currently facing. Regionally, our stores in Coastal states performed better than our stores in Central states, whose comparable sales were, on average, 600 basis points less than our stores in Coastal states. We did, however, see positive performance from our non-comparable DXL stores which performed well against plan and our ‘return on investment’ hurdles,have experienced significant EBITDA growth, which is a good indicator thatkey metric for us while investing in our store openings continuebase with its resulting increased depreciation costs. The following chart shows our EBITDA growth over the past four years in relation to perform well.
In addition to the overall weaknessMr. Levin’s compensation on both a Total Direct Compensation (“TDC”) basis, as reported in the retail industry, weSummary Compensation Table, and also believe that our decision to eliminate our Fall marketing campaign, hadon a negative impact on salesRealized Pay basis. Realized Pay reflects base salary, cash-based Annual Incentive Compensation and on building our customer base in fiscal 2016.
Sales for fiscal 2015 increased 6.8% to $442.2 million as compared to $414.0 million in fiscal 2014. The increasecash-based Long-Term Incentive earned, plus the value realized upon vesting of $28.2 million in sales was primarily due to a comparable sales increase of 4.8%, or $18.0 million. Increase in our non-comparable sales, primarily from our DXL stores that have been opened less than 13 months, of $44.2 millionany Restricted Shares and other revenue of $0.6 million were partially offset by a reduction of $34.6 million in lost sales from closed and converted stores. Comparable sales from our 137 DXL retail stores increased 9.7%, or $16.0 million in fiscal 2015, against a 13.7% comparable sales increase in fiscal 2014. The total number of transactions for these comparable stores increased 6.2% and dollars per transactions increased 3.3% over fiscal 2014.
GROSS MARGIN
Gross margin rate for fiscal 2016 was 45.5% as compared to 46.1% in fiscal 2015 and 45.9% in fiscal 2014.
The gross margin decrease of 60 basis points for fiscal 2016 as compared to fiscal 2015 was driven by a decrease of 40 basis points in merchandise margin and a 20 basis point increase in occupancy costs as a percentage of sales. The decrease in our merchandise margin of 40 basis points was mainly due to higher markdown activity associated with increased promotional activities. The increase in occupancy costs was due to occupancy expense increasing at a greater rate than sales.
Included in the gross margin for fiscal 2014 was a $2.5 million payment we received to exit our San Francisco store prior to the end of its lease term. This payment favorably benefited the gross margin for fiscal 2014 by 60 basis points. Excluding the impact of that lease termination, occupancy costs for fiscal 2015 improved 40 basis points over fiscal 2014, primarilyOptions exercised. Again due to the growing sales base as well as the decrease in the average size of our DXL stores. Merchandise margins for fiscal 2015 increased 40 basis points as a result of strong initial margins, a lower markdown rate and less promotional activities.
Occupancy costs also included DXL transition costs relatedfact that there was no opportunity to preopening rent and landlord terminations of $1.1 million in fiscal 2016, $1.8 million in fiscal 2015 and $2.8 million in fiscal 2014.
SELLING, GENERAL AND ADMINISTRATIVE EXPENSES
SG&A expenses as a percentage of sales for fiscal 2016, 2015 and 2014 were 38.5%, 40.8% and 42.2%, respectively.
SG&A expenses for fiscal 2016 decreased $7.3 million, or 4.0%, to $173.3 million as compared to $180.6 million in fiscal 2015. This decrease was primarily due to a decrease in advertising expense of approximately $5.4 million as well as a reduction in incentive accruals, including stock compensation, of approximately $5.4 million. These decreases were partially offset by increases in store payroll of $1.1 million, associated with the higher sales base, healthcare costs of approximately $1.4 million and other corporate and supporting costs of $1.0 million.
SG&A expenses for fiscal 2015 increased $5.8 million, or 3.3%, to $180.6 million as compared to $174.8 million in fiscal 2014. The increase in SG&A expenses of $5.8 million was due to increased store payroll and other supporting store costs of approximately $5.9 million, associated with the higher sales base, an increase in incentive accruals of $1.4 million, associated with the Company’searn any long-term incentive plans, and other corporate and supporting costs of $0.9 million. These increases were partially offset by a reduction in marketing expenses of $2.4 million.
SG&A expenses included approximately $3.1 million, $3.8 million and $4.0 million of DXL transition costs for increased payroll-related costs, such as pre-opening payroll, training and store operations for fiscal 2016, fiscal 2015 and fiscal 2014, respectively.
DEPRECIATION AND AMORTIZATION
Depreciation and amortization expense was $30.6 million for fiscal 2016 as compared to $28.4 million for fiscal 2015 and $24.0 million for fiscal 2014. The year-over-year increases in depreciation and amortization expense for both fiscal 2016 and fiscal 2015 are primarily related to the opening of 30 DXL retail and outlet stores in fiscal 2016 and 35 stores in fiscal 2015. Included in depreciation and amortization is the amortization of our “Casual Male” trademark of $0.3 million, $0.5 million and $1.0 million for fiscal 2016, 2015 and 2014, respectively.
INTEREST EXPENSE, NET
Net interest expense for fiscal 2016 was $3.1 million as compared to $3.1 million for fiscal 2015 and $2.1 million for fiscal 2014. Our interest costs in fiscal 2016 were flat to fiscal 2015, primarily due to our inventory initiatives undertaken to improve liquidity, EBITDA growth and lower capital expenditures. The increase from fiscal 2014 to fiscal 2015 was due to increased borrowings under our credit facility to finance our DXL store openings.
We have funded a portion of our store growth with equipment financings of $26.4 million, a $15.0 million term loan and borrowings under our credit facility. At January 28, 2017, our total debt, net of unamortized debt issuance costs, has decreased $5.0 million from January 30, 2016. See “Liquidity and Capital Resources” below for more discussion regarding our credit facility, equipment financings and term loan as well as our future liquidity needs.
INCOME TAXES
Pursuant to accounting rules, realization of our deferred tax assets, which relate principally to federal net operating loss carryforwards expiring from 2022 through 2036, is dependent on generating sufficient taxable income in the near term.
At the end of fiscal 2013, we entered a three-year cumulative loss and based on all positive and negative evidence at February 1, 2014, we established a full valuation allowance against our net deferred tax assets. While we expect to return to profitability, generate taxable income and ultimately emerge from a three-year cumulative loss, based on our results for fiscal 2016 and our earnings guidance for fiscal 2017, we believe that a full valuation allowance remains appropriate at this time.
Our tax provision for fiscal 2016, fiscal 2015 and fiscal 2014 is primarily attributable current state margin tax and foreign income tax.
DISCONTINUED OPERATIONS
During fiscal 2014, we exited our direct business with Sears Canada. The loss from discontinued operations for fiscal 2014 included a charge of approximately $0.8 million related primarily to inventory reserves and sales allowances as a result of our decision to exit the business. See Note J to the Notes to the Consolidated Financial Statements for additional disclosure regarding discontinued operations.
The net loss for fiscal 2016 was $(2.3) million, or $(0.05) per diluted share, as compared to $(8.4) million, or $(0.17) per diluted share, in fiscal 2015 and a net loss of $(12.3) million, or $(0.25) per diluted share, in fiscal 2014.
(Certain amounts in the following table do not foot due to rounding)
(in millions) |
| Fiscal 2016 |
|
| Fiscal 2015 |
|
| Fiscal 2014 |
| |||
Operating income (loss) |
| $ | 1.0 |
|
| $ | (5.1 | ) |
| $ | (8.8 | ) |
Interest expense, net |
|
| (3.1 | ) |
|
| (3.1 | ) |
|
| (2.1 | ) |
Loss from continuing operations, before taxes |
| $ | (2.1 | ) |
| $ | (8.1 | ) |
| $ | (10.9 | ) |
Less: Provision for income taxes (1) |
|
| 0.2 |
|
|
| 0.3 |
|
|
| 0.2 |
|
Loss from continuing operations |
| $ | (2.3 | ) |
| $ | (8.4 | ) |
| $ | (11.2 | ) |
Income (loss) from discontinued operations |
| $ | — |
|
| $ | — |
|
| $ | (1.1 | ) |
Net loss |
| $ | (2.3 | ) |
| $ | (8.4 | ) |
| $ | (12.3 | ) |
|
|
|
|
|
|
|
|
|
|
|
|
|
Net loss per diluted share |
| $ | (0.05 | ) |
| $ | (0.17 | ) |
| $ | (0.25 | ) |
|
|
SEASONALITY
A comparison of sales in each quarter of the past three fiscal years is presented below. The amounts shown are not necessarily indicative of actual trends, because such amounts also reflect the addition of new stores and the remodeling and closing of other stores during these periods. Consistent with the retail apparel industry, our business is seasonal. Generally, the majority of our operating income is generated in the fourth quarter as a result of the impact of the holiday selling season. A comparison of quarterly sales, gross profit, and net income per share for the past two fiscal years is presented in Note L of the Notes to the Consolidated Financial Statements.
(in millions, except percentages) |
| Fiscal 2016 |
|
| Fiscal 2015 |
|
| Fiscal 2014 |
| |||||||||||||||
First quarter |
| $ | 107.9 |
|
|
| 24.0 | % |
| $ | 104.4 |
|
|
| 23.6 | % |
| $ | 96.7 |
|
|
| 23.3 | % |
Second quarter |
|
| 117.9 |
|
|
| 26.2 | % |
|
| 114.2 |
|
|
| 25.8 | % |
|
| 104.2 |
|
|
| 25.2 | % |
Third quarter |
|
| 101.9 |
|
|
| 22.6 | % |
|
| 99.6 |
|
|
| 22.5 | % |
|
| 93.6 |
|
|
| 22.6 | % |
Fourth quarter |
|
| 122.6 |
|
|
| 27.2 | % |
|
| 124.0 |
|
|
| 28.1 | % |
|
| 119.5 |
|
|
| 28.9 | % |
|
| $ | 450.3 |
|
|
| 100.0 | % |
| $ | 442.2 |
|
|
| 100.0 | % |
| $ | 414.0 |
|
|
| 100.0 | % |
EFFECTS OF INFLATION
Although our operations are influenced by general economic trends, we do not believe that inflation has had a material effect on the results of our operations in the last three fiscal years.
LIQUIDITY AND CAPITAL RESOURCES
Our primary sources of liquidity are cash generated from operations and availability under our credit facility with Bank of America, N.A., which was most recently amended in October 2014 (“Credit Facility”). Our current cash needs are primarily for working capital (essentially inventory requirements), capital expenditures, growth initiatives, and, as discussed further below, our stock repurchase program which was announced in March 2017. With over 200 DXL stores now open, improved free cash flow and excess liquidity under our Credit Facility, we believe that the repurchase of our stock is a good investment and will enhance shareholder value.
Our capital expenditures for fiscal 2017 are expected to be approximately $22.0 million, primarily related to the planned opening of approximately 20 new DXL retail and outlet stores and information technology projects. However, we expect to receive approximately $5.0 million in tenant allowances to offset these capital expenditures.
We expect to fund our store growth and stock repurchase program in fiscal 2017 primarily through cash flow from operations, with periodic borrowings from our Credit Facility.
The following table sets forth financial data regarding our liquidity position at the end of the past three fiscal years:
(in millions, except ratios) |
| Fiscal 2016 |
|
| Fiscal 2015 |
|
| Fiscal 2014 |
| |||
Cash provided by operations |
| $ | 35.0 |
|
| $ | 18.4 |
|
| $ | 13.8 |
|
Total debt, net of unamortized debt issuance costs |
| $ | 63.1 |
|
| $ | 68.1 |
|
| $ | 52.3 |
|
Unused excess availability under Credit Facility |
| $ | 57.1 |
|
| $ | 66.0 |
|
| $ | 77.9 |
|
Working capital |
| $ | 23.3 |
|
| $ | 28.1 |
|
| $ | 42.8 |
|
Current ratio |
| 1.2:1 |
|
| 1.2:1 |
|
| 1.5:1 |
| |||
For fiscal 2016, cash flow from operating activities improved by $16.6 million as a result of inventory initiatives implemented in fiscal 2016 to improve timing of receipts and reduce weeks of supply on hand. This improvement, along with a decrease in capital expenditures of $4.2 million as a result of less store openings in fiscal 2016 and an overall decrease in the average square footage of a new DXL store as compared to fiscal 2015, resulted in an improvement in free cash flow of $20.8 million to $5.8 million from $(15.0) million for fiscal 2015.
The following is a summary of our total debt outstanding at January 28, 2017, with the associated unamortized debt issuance costs:
(in thousands) |
| Gross Debt Outstanding |
|
| Less Debt Issuance Costs |
|
| Net Debt Outstanding |
| |||
Credit facility |
| $ | 44,436 |
|
| $ | (339 | ) |
| $ | 44,097 |
|
Equipment financing notes |
|
| 6,589 |
|
|
| (41 | ) |
|
| 6,548 |
|
Term loan, due 2019 |
|
| 12,750 |
|
|
| (296 | ) |
|
| 12,454 |
|
Total debt |
| $ | 63,775 |
|
| $ | (676 | ) |
| $ | 63,099 |
|
Credit Facility
Our Credit Facility with Bank of America, N.A. provides for a maximum committed borrowing of $125.0 million, which, pursuant to an accordion feature, may be increased to $175.0 million upon our request and the agreement of the lender(s) participating in the increase. The Credit Facility includes a sublimit of $20.0 million for commercial and standby letters of credit and a sublimit of up to $15.0 million for swingline loans. The maturity date of the Credit Facility is October 29, 2019. Our Credit Facility is described in more detail in Note C to the Notes to the Consolidated Financial Statements.
Borrowings made pursuant to the Credit Facility bear interest at a rate equal to the base rate (determined as the highest of (a) Bank of America N.A.’s prime rate, (b) the Federal Funds rate plus 0.50% and (c) the annual ICE-LIBOR (“LIBOR”) rate for the respective interest period) plus a varying percentage, based on our borrowing base, of 0.50%-0.75% for prime-based borrowings and 1.50%-1.75% for LIBOR-based borrowings.
We had outstanding borrowings of $44.4 million under the Credit Facility at January 28, 2017. Outstanding standby letters of credit were $2.9 million and outstanding documentary letters of credit were $0.5 million. The average monthly borrowing outstanding under the Credit Facility during fiscal 2016 was approximately $52.1 million, resulting in an average unused excess availability of approximately $57.8 million. Unused excess availability at January 28, 2017 was $57.1 million. Our obligations under the Credit Facility are secured by a lien on substantially all of our assets, excluding (i) a first priority lien held by the lenders of the Term Loan Facility described below on certain equipment of the Company and (ii) intellectual property.
Equipment Financing Loans
We have entered into twelve Equipment Security Notes (the “Notes”), whereby we borrowed an aggregate of $26.4 million. The Notes, which were issued between September 2013 and June 2014, were issued pursuant to a Master Loan and Security Agreement with Banc of America Leasing & Capital, LLC, dated July 20, 2007 and most recently amended September 30, 2013. The Notes are secured by a security interest in all of our rights, title and interest in and to certain equipment. The Notes are for 48 months and accrue interest at fixed rates ranging from 3.07% to 3.50%. Principal and interest, in arrears, are payable monthly. We are no longer subject to any prepayment penalties. The Notes are secured by a security interest in all of the Company’s rights, title and interest in and to certain equipment.
Term Loan, Due 2019
We have a $15.0 million senior secured term loan facility with Wells Fargo Bank, National Association as administrative and collateral agent (the “Term Loan Facility”). The Term Loan Facility bears interest at a rate per annum equal to the greater of (a) 1.00% and (b) the one month LIBOR rate, plus 6.50%. Interest payments are payable on the first business day of each calendar month, and
increase by 2% following the occurrence and during the continuance of an “event of default,” as defined in the Term Loan Facility. The Term Loan Facility, which matures October 29, 2019, provides for quarterly principal payments on the first business day of each calendar quarter, which commenced the first business day of January 2015, in an aggregate principal amount equal to $250,000, subject to adjustment, with the balance payable on the termination date.
The Term Loan Facility includes usual and customary mandatory prepayment provisions for transactions of this type that are triggered by the occurrence of certain events. In addition, the amounts advanced under the Term Loan Facility can be optionally prepaid in whole or part. Prepayments are subject to an early termination fee in the amount of 1% of the amount prepaid prior to October 29, 2017. There is no prepayment penalty after October 29, 2017.
The Term Loan Facility is secured by a first priority lien on certain of our equipment, and a second priority lien on substantially all of our remaining assets, excluding intellectual property.
Stock Repurchase Program
Subsequent to the end of fiscal 2016, our Board of Directors approved a stock repurchase plan. Under the stock repurchase plan, we may purchase up to $12.0 million of our common stock through open market and privately negotiated transactions during fiscal 2017. The timing and the amount of any repurchases of common stock will be determined based on the Company’s evaluation of market conditions and other factors. The stock repurchase program is expected to commence in the first quarter of fiscal 2017 and will expire on February 3, 2018, but may be suspended, terminated or modified at any time for any reason. We expect to finance the repurchases from operating funds and/or periodic borrowings on our Credit Facility. Any repurchased common stock will be held as treasury stock.
INVENTORY
At January 28, 2017, total inventories decreased to $117.4 million from $125.0 million at January 30, 2016. The reason for the $7.6 million decrease in inventory is directly attributable to inventory initiatives implemented in fiscal 2016 to improve timing of receipts and reduce weeks of supply on hand. As a result of these initiatives, the average inventory per total built-out square footage of stores at January 28, 2017 decreased 9.5% to $55.60 per square foot as compared to $61.46 per square foot at January 30, 2016. At January 28, 2017, our clearance inventory represented 7.9% of our total inventory, as compared to 8.1% at January 30, 2016.
OFF-BALANCE SHEET ARRANGEMENTS
We have no off-balance sheet arrangements as defined by 303(a)(4) of Regulation S-K.
CONTRACTUAL OBLIGATIONS
The following table summarizes our contractual obligations at January 28, 2017, and the effect such obligations are expected to have on our liquidity and cash flows in future periods (Certain amounts in the following table do not foot due to rounding):
|
| Payments due by period |
| |||||||||||||||||
Contractual Obligations |
| Total |
|
| Less than 1 year |
|
| 1 to 3 years |
|
| 3 to 5 years |
|
| More than 5 years |
| |||||
|
| (in millions) |
| |||||||||||||||||
Operating leases (1) |
| $ | 362.3 |
|
| $ | 58.8 |
|
| $ | 98.0 |
|
| $ | 84.5 |
|
| $ | 121.0 |
|
Long-term debt obligations (2) |
|
| 19.3 |
|
|
| 7.1 |
|
|
| 12.3 |
|
|
| — |
|
|
| — |
|
Interest on long-term debt obligations (3) |
|
| 2.6 |
|
|
| 1.1 |
|
|
| 1.5 |
|
|
| — |
|
|
| — |
|
Non-merchandise purchase obligations (4) |
|
| 0.1 |
|
|
| 0.1 |
|
|
| — |
|
|
| — |
|
|
| — |
|
Merchandise purchase obligations (5) |
|
| 33.0 |
|
|
| 10.5 |
|
|
| 22.5 |
|
|
| — |
|
|
| — |
|
|
|
|
|
|
|
|
|
|
|
|
|
|
|
|
|
|
|
|
|
|
Total Commitments (6) |
| $ | 417.4 |
|
| $ | 77.7 |
|
| $ | 134.3 |
|
| $ | 84.5 |
|
| $ | 121.0 |
|
|
|
|
|
|
|
|
|
|
|
CAPITAL EXPENDITURES
The following table sets forth the open stores and related square footage at January 28, 2017 and January 30, 2016 respectively:
|
| At January 28, 2017 |
|
| At January 30, 2016 |
| ||||||||||
Store Concept |
| Number of Stores |
|
| Square Footage |
|
| Number of Stores |
|
| Square Footage |
| ||||
(square footage in thousands) |
|
|
|
|
|
|
|
|
|
|
|
|
|
|
|
|
DXL Retail |
|
| 192 |
|
|
| 1,542 |
|
|
| 166 |
|
|
| 1,369 |
|
DXL Outlet |
|
| 13 |
|
|
| 66 |
|
|
| 9 |
|
|
| 45 |
|
Casual Male XL Retail |
|
| 97 |
|
|
| 340 |
|
|
| 125 |
|
|
| 443 |
|
Casual Male XL Outlet |
|
| 36 |
|
|
| 113 |
|
|
| 40 |
|
|
| 126 |
|
Rochester Clothing |
|
| 5 |
|
|
| 51 |
|
|
| 5 |
|
|
| 51 |
|
Total Stores |
|
| 343 |
|
|
| 2,112 |
|
|
| 345 |
|
|
| 2,034 |
|
Below is a summary of store openings and closings from January 30, 2016 to January 28, 2017:
Number of Stores: |
| DXL Retail |
|
| DXL Outlet |
|
| Casual Male XL Retail |
|
| Casual Male XL Outlet |
|
| Rochester Clothing |
|
| Total Stores |
| ||||||
At January 30, 2016 |
|
| 166 |
|
|
| 9 |
|
|
| 125 |
|
|
| 40 |
|
|
| 5 |
|
|
| 345 |
|
New stores(1) |
|
|
|
|
|
| 2 |
|
|
|
|
|
|
|
|
|
|
|
|
|
|
| 2 |
|
Replaced stores(2) |
|
| 26 |
|
|
| 2 |
|
|
| (24 | ) |
|
| (2 | ) |
|
|
|
|
|
| 2 |
|
Closed retail stores(3) |
|
|
|
|
|
|
|
|
|
| (4 | ) |
|
| (2 | ) |
|
|
|
|
|
| (6 | ) |
At January 28, 2017 |
|
| 192 |
|
|
| 13 |
|
|
| 97 |
|
|
| 36 |
|
|
| 5 |
|
|
| 343 |
|
|
|
|
|
|
|
Our capital expenditures for fiscal 2016 were $29.2 million, as compared to $33.4 million in fiscal 2015 and $40.9 million in fiscal 2014. Approximately $19.6 million related to the opening of 26 DXL stores, 4 DXL outlets and some costs for DXL stores that are currently under construction that will open in fiscal 2017. In addition, we spent approximately $5.5 million in management information projects, which included continued enhancements for our e-commerce sites and upgrades to our merchandise planning systems, with the remaining $4.1 million for general capital projects in our distribution center and corporate offices.
For fiscal 2017, our capital expenditures are expected to be approximately $22.0 million and we expect to receive approximately $5.0 million in tenant allowances to offset these expenditures. Our budget includes approximately $13.7 million, excluding any allowance, related to the opening of 19 DXL retail stores and 1 DXL outlet stores, and approximately $8.3 million for continued information technology projects and general overhead projects. In addition, we expect to close approximately 16 Casual Male XL stores and 3 Casual Male XL outlet stores, the majority of which are in connection with the opening of the DXL retail and outlet stores in the same geographic market.
Non-GAAP Reconciliations
We monitor certain non-GAAP financial measures on a regular basis in order to track the progress of our business, including the measures below. We believe these measures provide helpful information with respect to the Company’s operating performance to shareholders, investors and analysts, and that the inclusion of these non-GAAP measures is important to assist investors in comparing our performance in fiscal 2016 to fiscal 2015 and fiscal 2014, on a comparable basis. However, these measures may not be
comparable to similar measures used by other companies and should not be considered superior to or as a substitute for operating net loss, loss from continuing operations, net loss per diluted share or cash flows from operating activities in accordance with GAAP.
Adjusted Loss From Continuing Operations and Adjusted Net Loss Per Diluted Share
Adjusted loss from continuing operations and adjusted net loss reflect an adjustment assuming a normal tax rate of 40%. We have fully reserved against our deferred tax assets and, therefore, net loss is not reflective of earnings assuming a “normal” tax position. Adjusted net loss provides investors with a useful indication of the financial performance of the business, on a comparative basis, assuming a normalized tax rate of 40%.
The following table is a reconciliation of loss from continuing operations and net loss (both on a GAAP basis) to adjusted loss from continuing operations and adjusted net loss (both on a non-GAAP basis). (Certain amounts do not foot due to rounding):
|
| Fiscal 2016 |
|
| Fiscal 2015 |
|
| Fiscal 2014 |
| |||||||||||||||
|
| $ |
|
| Per diluted share |
|
| $ |
|
| Per diluted share |
|
| $ |
|
| Per diluted share |
| ||||||
(in millions, except per share data) |
|
|
|
|
|
|
|
|
|
|
|
|
|
|
|
|
|
|
|
|
|
|
|
|
Loss from continuing operations, on a GAAP basis |
| $ | (2.3 | ) |
| $ | (0.05 | ) |
| $ | (8.4 | ) |
| $ | (0.17 | ) |
| $ | (11.2 | ) |
| $ | (0.23 | ) |
|
|
|
|
|
|
|
|
|
|
|
|
|
|
|
|
|
|
|
|
|
|
|
|
|
Add back: |
|
|
|
|
|
|
|
|
|
|
|
|
|
|
|
|
|
|
|
|
|
|
|
|
Actual income tax provision |
|
| 0.2 |
|
|
| — |
|
|
| 0.3 |
|
|
| — |
|
|
| 0.2 |
|
|
| — |
|
Income tax benefit, assuming normal tax rate of 40% |
|
| 0.8 |
|
|
| 0.02 |
|
|
| 3.3 |
|
|
| 0.07 |
|
| $ | 4.4 |
|
|
| 0.09 |
|
Adjusted loss from continuing operations, non-GAAP basis |
| $ | (1.3 | ) |
| $ | (0.03 | ) |
| $ | (4.9 | ) |
| $ | (0.10 | ) |
| $ | (6.6 | ) |
| $ | (0.13 | ) |
Loss from discontinued operations, GAAP basis |
|
| — |
|
|
| — |
|
|
| — |
|
|
| — |
|
|
| (1.1 | ) |
|
| (0.02 | ) |
Adjusted net loss, non-GAAP basis |
| $ | (1.3 | ) |
| $ | (0.03 | ) |
| $ | (4.9 | ) |
| $ | (0.10 | ) |
| $ | (7.7 | ) |
| $ | (0.16 | ) |
|
|
|
|
|
|
|
|
|
|
|
|
|
|
|
|
|
|
|
|
|
|
|
|
|
Weighted average number of common shares outstanding on a diluted basis |
|
|
|
|
|
| 49.5 |
|
|
|
|
|
|
| 49.1 |
|
|
|
|
|
|
| 48.7 |
|
Free Cash Flow
We believe free cash flow before DXL capital expenditures is another important metric because it demonstrates our ability to strengthen liquidity while also contributing to the funding of our DXL store growth. Fiscal 2016 was a turning point for us with respect to liquidity, as our capital expenditures for DXL stores were funded by cash flow from operations resulting in a decrease in total debt outstanding by the end of fiscal 2016. While we expect to use funds from our revolver, by year-end we expect all DXL store growth in fiscal 2017 will have been funded by our operations, which will enable us to reduce our debt levels.
We calculate free cash flow as cash flow provided by operating activities less capital expenditures. We calculate free cash flow before DXL capital expenditures as cash flow provided by operating activities less capital expenditures other than DXL capital expenditures. Free cash flow excludes the mandatory and discretionary repayment of debt.
The following table provides a reconciliation of free cash flow and free cash flow before DXL capital expenditures:
|
|
|
|
| Projected |
| ||||||
(in millions) |
| Fiscal 2016 |
|
| Fiscal 2015 |
|
| Fiscal 2017 |
| |||
Cash flow from operating activities (GAAP) (1) |
| $ | 35.0 |
|
| $ | 18.4 |
|
| $37.0-$42.0 |
| |
Capital expenditures, infrastructure projects |
|
| (9.6 | ) |
|
| (13.3 | ) |
|
| (8.3 | ) |
Free Cash Flow before DXL capital expenditures (non-GAAP) |
| $ | 25.4 |
|
| $ | 5.1 |
|
| $28.7-$33.7 |
| |
Capital expenditures for DXL stores |
|
| (19.6 | ) |
|
| (20.1 | ) |
|
| (13.7 | ) |
Free Cash Flow (non-GAAP) |
| $ | 5.8 |
|
| $ | (15.0 | ) |
| $15.0-$20.0 |
| |
|
|
EBITDA and EBITDA from Continuing Operations
EBITDA and EBITDA from continuing operations are presented because we believe that these measures are useful to investors in evaluating our performance. With the significant capital investment associated with the DXL transformation and, therefore, increasing levels of depreciation and interest, management uses EBITDA as a key metric to measure profitability and economic productivity.
EBITDA is calculated as earnings before interest, taxes, depreciation and amortization. EBITDA from continuing operations is calculated as EBITDA before discontinued operations.
The following table is a reconciliation of net loss on a GAAP basis to EBITDA and EBITDA from continuing operations, on a non-GAAP basis, for each fiscal year. (Certain amounts in the following table do not foot due to rounding):
|
|
|
|
|
|
|
|
|
|
|
|
|
| Projected |
| |
(in millions) |
| Fiscal 2016 |
|
| Fiscal 2015 |
|
| Fiscal 2014 |
|
| Fiscal 2017 |
| ||||
Net loss, on a GAAP basis |
| $ | (2.3 | ) |
| $ | (8.4 | ) |
| $ | (12.3 | ) |
| $(5.7)-$(11.7) |
| |
Add back: |
|
|
|
|
|
|
|
|
|
|
|
|
|
|
|
|
Provision for income taxes |
|
| 0.2 |
|
|
| 0.3 |
|
|
| 0.2 |
|
|
| 0.2 |
|
Interest Expense |
|
| 3.1 |
|
|
| 3.1 |
|
|
| 2.1 |
|
|
| 3.0 |
|
Depreciation and amortization |
|
| 30.6 |
|
|
| 28.4 |
|
|
| 24.0 |
|
|
| 32.5 |
|
EBITDA |
| $ | 31.6 |
|
| $ | 23.3 |
|
| $ | 14.1 |
|
| $24.0-$30.0 |
| |
Loss from discontinued operations |
|
| — |
|
|
| — |
|
|
| (1.1 | ) |
|
| — |
|
EBITDA from continuing operations |
| $ | 31.6 |
|
| $ | 23.3 |
|
| $ | 15.2 |
|
| $24.0-$30.0 |
| |
CRITICAL ACCOUNTING POLICIES; USE OF ESTIMATES
Our financial statements are based on the application of significant accounting policies, many of which require our management to make significant estimates and assumptions (see Note A to the Notes to the Consolidated Financial Statements). We believe that the following items involve some of the more critical judgments in the application of accounting policies that currently affect our financial condition and results of operations.
Stock-Based Compensation
We measure compensation cost for all stock-based awards at fair value on date of grant and recognize compensation over the service period for awards expected to vest.
The fair value of our stock options is determined using the Black-Scholes valuation model, which requires the input of subjective assumptions. These assumptions include estimating the length of time employees will retain their vested stock options before exercising them (the “expected term”), the estimated volatility of our common stock price over the expected term and the number of options that will ultimately not complete their vesting requirements (“forfeitures”). Changes in these subjective assumptions can materially affect the estimate of fair value of stock-based compensation and, consequently, the related amount recognized as an expense on the Consolidated Statements of Operations. As required under the accounting rules, we review our valuation assumptions at each grant date and, as a result, we are likely to change our valuation assumptions used to value employee stock-based awards granted in future periods. The values derived from using the Black-Scholes model are recognized as expense over the service period, net of estimated forfeitures. Actual results, and future changes in estimates, may differ substantially from these current estimates. For performance-based awards no compensation expense is recognized until the performance targets are deemed probable. For fiscal 2016, 2015 and 2014, we recognized total stock-based compensation expense of $1.3 million, $2.2 million and $3.0 million, respectively.
Long-Term Incentive Plans
During fiscal 2016, we had three active Long-Term Incentive Plans (“LTIP”s): 2013-2016 LTIP, 2016 Long-Term Incentive Wrap-Around Plan (“2016 Wrap”) and the 2016-2017 LTIP. See Note F to the Consolidated Financial Statements for a complete discussion of our LTIPs.
All time-based awards granted pursuant to our LTIPs are amortized, net of estimated forfeitures, over each LTIP’s respective vesting periods.
The 2013-2016 LTIP included performance-based equity awards. Based on the Company’s performance over the performance periods and the improbability of achieving performance targets, no stock-based compensation expense had been recognized. At January 28, 2017, the performance targets under our 2013-2016 LTIP were not achieved, and accordingly, subsequent to year-end on March 15, 2017, as a result of the Compensation Committee’s review of the audited consolidated financial statements, all outstanding performance-based awards were forfeited.
Our 2016 Wrap and 2016-2017 LTIP both contain a dollar-denominated performance-based component. Equity awards will only be granted if such performance targets are achieved. Accordingly, each quarter the Company reviews its expected achievement against such performance targets to assess whether an accrual is necessary. All accruals will be recorded as a liability. If performance targets are achieved and equity awards are granted, the related cost of those awards will be reclassed from the accrual to stock-based compensation.
For fiscal 2016, the Company has accrued as a liability approximately $1.9 million based on partial achievement of the performance targets under the 2016 Wrap. Subsequent to year-end, on March 15, 2017, the Company’s Compensation Committee of the Board of Directors reviewed the results for fiscal 2016 and approved for awards totaling $2.3 million to be granted on March 20, 2017. All awards are subject to further vesting through the end of the second quarter of fiscal 2017.
With respect to the performance-based component of the 2016-2017 LTIP, which approximates $1.9 million at target, RSUs will be granted at the end of the performance period if the performance targets are achieved. Through the end of fiscal 2016, we accrued,believe it is more meaningful to analyze Mr. Levin’s compensation over this four-year period, as a liability, approximately $0.3 million in expense relatedopposed to the potential payout of performance awards under the 2016-2017 LTIP.
Inventory
We value inventory at the lower of cost or market, using a weighted-average cost method.three-year average. We reviewbelieve that Mr. Levin’s compensation has been performance-driven and is in line with our inventoryCompany’s growth.

Executive Compensation Philosophy and Objectives
Our Compensation Committee is responsible for establishing, implementing and continually monitoring adherence to identify slow-movingour compensation philosophy, and broken assortments. We use markdownsensuring that the total compensation we pay to clear merchandiseour executives is fair, reasonable, competitive and will record inventory reserves ifconsistent with the estimated future selling priceinterests of the Company’s stockholders. Our Compensation Committee’s compensation guiding principle is less than cost. In addition, an inventory shrink estimate is made each period that reducesto reward our executives for the valueachievement of inventory for lost or stolen merchandise. We perform physical inventories throughoutour primary business objectives: grow our market share within the yearBig & Tall retail industry, increase earnings and adjustoperating margins, complete the shrink reserves accordingly.
Impairment of Long-Lived Assets
We reviewtransformation to our long-lived assets for impairment when indicators of impairment are present and the undiscounted cash flow estimated to be generated by those assets is less than the assets’ carrying amount. We evaluate our long-lived assets for impairment at a store level for all our retail locations. If actual market conditions are less favorable than management’s projections, future write-offs may be necessary.
ForDXL format through fiscal 2016 and, fiscal 2014,ultimately, increase stockholder returns through stock price gains arising from an increase in earnings and operating margins.
The Compensation Committee believes that the most effective executive compensation program is one designed to:
Attract, retain and engage the executive talent we recorded impairment chargesneed to deliver on our performance expectations;
Reward the achievement of $0.4 millionspecific annual, long-term and $0.3 million, respectively,strategic goals through a combination of both cash and stock-based compensation;
Align our executives’ interests with those of our stockholders; and
Deliver a total compensation opportunity competitive with those available to write-down propertysimilarly situated executives at our peer companies.
When reviewing compensation, the Compensation Committee evaluates the pay structure in two primary ways: “total cash compensation” and equipment. The impairments related“total direct compensation.” Total cash compensation consists of an executive’s base salary and annual performance-based cash incentive award, which is tied to stores with carrying values which exceeded fair value. There was no material impairment charge for long-lived assets in fiscal 2015.
Intangibles
In accordance with ASC Topic 350, Intangibles Goodwill and Other, we evaluate our intangible assets with indefinite lives at least annually for impairment by analyzing the estimated fair value.
In the fourth quarter of fiscal 2016, we performed our annual testingperformance targets. Total direct compensation consists of total cash compensation plus target long-term incentive awards. Our current long-term incentives are designed to reward the achievement of our “Rochester” trademark for potential impairment. Utilizing an income approachlong-term financial objectives, which we believe is aligned with appropriate royalty rates applied, we concluded that the “Rochester” trademark, with a carrying value of $1.5 million, was not impaired.
Based on the expected closure of our Casual Male XL retail stores, at January 28, 2012, our “Casual Male” trademark was reclassified as a definite-lived asset. The trademark is being amortized, on an accelerated basis, through fiscal 2018, its estimated useful life. At January 28, 2017, the carrying value of the “Casual Male” trademark was $0.6 million.
stockholder returns.
In accordance with ASC Topic 740, Income Taxes, on a quarterly basis,Our executive compensation program is designed to balance the mix of short- and long-term compensation in order to ensure adequate base compensation and annual incentive opportunities to attract and retain executive talent, while providing meaningful incentives for our executives to create long-term value for our Company and our stockholders. Every year, we assess the effectiveness of our compensation plans and are continually working to strengthen our overall compensation program. We also evaluate the realizabilityfinancial metrics that we use to measure performance and compare them to those used by our peers. Performance targets under our annual incentive plans may change year-to-year as a result of our deferred tax assets and, if needed, establish a valuation allowance against those assets if it is determined that it is more likely than not that the deferred tax assets will not be realized.this continuous review.
In the fourth quarterKey Features of fiscal 2013, we entered into a three-year cumulative loss position and based on forecasts at that time, we expected the cumulative three-year loss to increase as of the end of fiscal 2014. Management determined that this represented significant negative evidence at February 1, 2014 and a full valuation allowance was established against our net deferred tax assets. While we have projected that the Company will return to profitability, generate taxable income and ultimately emerge from a three-year cumulative loss, based on actual results for fiscal 2016 and our forecast for fiscal 2017, we believe that a full allowance remains appropriate at this time.Our Executive Compensation Program
RECENT ACCOUNTING PRONOUNCEMENTS
We have reviewed accounting pronouncements and interpretations thereof that have effective dates during the periods reported and in future periods. We believe that our executive compensation program includes key features that align the following impending standards may have an impact oncompensation for the Named Executive Officers with the strategic goals of the Company and interests of our future filings. shareholders.
What We Do | What We Don’t Do |
üFocus on performance-based pay | ûNo guaranteed bonuses |
üBalance short-term and long-term incentives | ûNo repricing of underwater options |
üUse multiple targets for performance awards | ûNo hedging of Company stock |
üCap all incentive awards at 150% payout | ûNo tax gross up on severance payments |
üRequire “double-trigger” change-in-control provisions | ûNo active supplemental executive retirement plan |
üMaintain a “claw-back” policy in employment agreements | |
üSeek to mitigate undue risk in compensation plans | |
üUtilize a compensation consultant | |
üProvide executives with very limited perquisites |
Use of Compensation Consultants
The applicabilityCompensation Committee has the authority to retain compensation consultants and other outside advisors, without Board or management approval, to assist in carrying out its duties, including the evaluation of any standard willcompensation to be evaluated by us and is still subjectpaid to our review.Named Executive Officers. The Compensation Committee may accept, reject or modify any recommendations by compensation consultants or other outside advisors.
In May 2014,The Compensation Committee periodically consults with Sibson Consulting, an independent firm which specializes in benefits and compensation, to advise the FASB issued ASU 2014-09, “Revenue from ContractsCompensation Committee on the structure and competitiveness of our executive compensation program compared to our peer group. The Compensation Committee has assessed the independence of Sibson Consulting and has concluded that no conflict of interest exists with Customers,” which supersedesrespect to the revenue recognition requirements in ASC 605, “Revenue Recognition,” as well as various other sections of the ASC, such as, butservices that Sibson Consulting performs for our Compensation Committee. Sibson Consulting did not limited to, ASC 340-20, “Other Assets and Deferred Costs - Capitalized Advertising Costs”. The core principle of ASU 2014-09 is that an entity should recognize revenue in a way that depicts the transfer of promised goods orprovide any services to customers in an amount that reflects the considerationCompany other than with respect to which the entity expectsservices provided to be entitled in exchange for those goods or services. ASU 2014-09 will be effective for fiscal years, and interim periods within those years, beginning after December 15, 2017, and is to be applied either retrospectively to each prior reporting period presented orthe Compensation Committee.
Sibson Consulting has worked with the cumulative effect recognized at the date of initial adoption as an adjustment to the opening balance of retained earnings (or other appropriate components of equity or net assetsCompensation Committee on the balance sheet). Early adoption is permitted after December 15, 2016. We expect to adopt ASU 2014-09 in the first quarter of fiscal 2018updating and will not adopt early. We have not yet selected a transition method or completedrevising our assessment of the effect that ASU No. 2014-09 will have on our Consolidated Financial Statements.
In July 2015, the FASB issued ASU 2015-11, "Inventory (Topic 330): Simplifying the Measurement of Inventory,"current annual incentive and long−term incentive plans, which applies to inventory that is measured using first-in, first-out ("FIFO") or average cost. Under thewere most recently updated guidance, an entity should measure inventory that is within scope at the lower of cost and net realizable value, which is the estimated selling price in the ordinary course of business, less reasonably predictable costs of completion, disposal and transportation. This ASU is effective for annual and interim periods beginning after December 15, 2016, and should be applied prospectively with early adoption permitted at the beginning of an interim or annual reporting period. We do not expect the adoption of this pronouncement to have a material impact on our Consolidated Financial Statements.fiscal 2016.
In February 2016,May 2017, the FASB issued ASU 2016-02, “Leases (Topic 842),” whichCompensation Committee authorized the Company to engage Korn Ferry Hay Group, an independent compensation consultant, to review the base salaries and annual incentive program as it pertains to our Senior Executives. Because Mr. Levin’s compensation was recently reviewed by Sibson in fiscal 2014, his compensation was not reviewed by Korn Ferry Hay Group. The Compensation Committee will requirereview recommendations from Korn Ferry Hay Group once their study is complete.
Compensation Setting Process
CEO Compensation. The Compensation Committee’s overall goal is for CEO total direct compensation, assuming incentive target payout levels, to fall within the median of our peer group. This guideline may differ, however, depending on an entity to recognize lease assetsindividual’s qualifications, role content and lease liabilities on its balance sheetscope, overall responsibility, past performance and will increase disclosure requirements on its leasing arrangements. The ASU is effectiveexperience, the demand for annual periods beginning after December 15, 2018, and interim periods therein. Early adoption is permitted. In the financial statements in which the ASU is first applied, leases shall be measured and recognized at the beginning of the earliest comparative period presented with an adjustment to equity. While we are still evaluating and quantifying the impact this pronouncement will have on our Consolidated Financial Statements, we expect the adoption of this pronouncement will have a material impact on our Consolidated Financial Statements.
InMarch 2016, the FASB issued ASU2016-04, “Liabilities—Extinguishments of Liabilities: Recognition of Breakage for Certain Prepaid Stored-Value Products,” which amends exempting gift cards and other prepaid stored-value products from the guidance on extinguishing financial liabilities. Rather, they will be subject to breakage accounting consistentindividuals with the new revenue guidance in Topic 606. However,executive’s specific expertise, the exemption only appliesCompany’s achievement of our financial objectives and the CEO’s contribution to breakage liabilities that are not subject to unclaimed property laws or that are attached to segregated bank accounts (e.g., consumer debit cards). The ASU is effective for fiscal years beginning after December 15, 2017, and interim periods within those fiscal years. Early adoption is permitted. We do not expect the adoption of this pronouncement to have a material impact on our Consolidated Financial Statements.
In March 2016, the FASB issued ASU 2016-09, “Compensation - Stock Compensation (Topic 718) - Improvements to Employee Share-Based Payment Accounting,” which simplifies several aspects of the accounting for share-based payment transactions, including the income tax consequences, classification of awards, and classification on the statement of cash flows. The standard is
effective for fiscal years beginning after December 15, 2016, including interim periods within those fiscal years. We do not expect the adoption of this pronouncement to have a material impact on our Consolidated Financial Statements.
In August 2016, the FASB issued ASU 2016-15, “Statement of Cash Flows (Topic 230): Classification of Certain Cash Receipts and Cash Payments,” which reduces the existing diversity in practice in how certain cash receipts and cash payments are presented and classified in the statement of cash flows under Topic 230. The ASU is effective for fiscal years beginning after December 15, 2017, and interim periods within those fiscal years. We do not expect the adoption of this pronouncement to have a material impact on our Consolidated Financial Statements.
In October 2016, the FASB issued ASU 2016-16, “Income Taxes(Topic 740): Intra-Entity Transfer of Assets Other Than Inventory,” which reduces the existing diversity in practice in how income tax consequences of an intra-entity transfer of an assetsuch achievement, among other than inventory should be recognized. The amendments in criteria.ASU 2016-16 require an entity to recognize such income tax consequences when the intra-entity transfer occurs rather than waiting until such time as the asset has been sold to an outside party. The ASU is effective for fiscal years beginning after December 15, 2017, and interim periods within those fiscal years. We do not expect the adoption of this pronouncement to have a material impact on our Consolidated Financial Statements.
Item 7A. QuantitativeThe Compensation Committee is directly responsible for determining the compensation paid to our CEO. The Compensation Committee, working with Sibson Consulting, compares each element of compensation to published survey data and Qualitative Disclosures About Market Riskproxy data from our peer group for executives with comparable positions and responsibilities.
InOther Named Executive Officers. For our senior executives other than our CEO, the normal courseCompensation Committee’s overall objective is to provide them with a competitive base salary that is within our peer median, while also providing them with an opportunity for short- and long-term compensation if our Company meets or exceeds its financial targets, such as EBITDA and operating margins.
Our CEO and our Senior Vice President of business,Human Resources are primarily responsible for determining the compensation paid to our financial position and results of operations are routinelyother Named Executive Officers, subject to any input the Compensation Committee may provide. For benchmarking purposes, several published industry compensation surveys are utilized when determining compensation packages for our other Named Executive Officers. Through our subscriptions with PayFactors, Salary.com and the National Retail Federation, we have access to the latest compensation data, which includes both base salary and total compensation, inclusive of incentives. While these sites do not identify the specific companies included in the survey, we are able to access information based on industry, size, sales volumes, and regional area, among others. In general, we benchmark compensation against companies in the retail industry which are of similar size, based on comparative sales volumes. As mentioned above, in May 2017, at the request of the Compensation Committee, the Company engaged Korn Ferry Hay Group to complete a varietyreview of risks, includingthe base salaries and annual incentive compensation plan for our senior executives other than our CEO. When recruiting for a senior management position, we will also benchmark against larger or more complex business structures to ensure we attract and retain the best talent to support future growth. A combination of performance, achievement of goals and survey data, among other criteria, is used to determine each Named Executive Officer’s total direct compensation opportunity. Like our CEO, our other Named Executive Officers are provided with a competitive base salary within our retail industry and are provided with an opportunity to earn performance awards each year which are primarily driven by our overall financial targets. See “Compensation Components, Fiscal 2016 Compensation Decisions, 2017 Annual Incentive Plan Targets and Long-Term Incentive Program – Performance–based annual cash incentive plan” and “ – Long-term incentive plans.”
Our Peers
When determining peer companies for use in reviewing and establishing compensation for our Named Executive Officers, we focus primarily on public companies within the specialty retail apparel business with an objective of falling within the median of our peer group with respect to revenue and market risk associated with interest rate movements on borrowingscapitalization. In fiscal 2015, three peers were removed and foreign currency fluctuations. We regularly assess these risksnot replaced until fiscal 2016. In addition, in fiscal 2016 Sport Chalet, Pacific Sunwear and have established policies and business practices to protect against the adverse effectsWet Seal were also removed. In fiscal 2016, we replaced 5 of these peers with the addition of Sportman’s Warehouse, Tilly’s Inc., Boot Barn Holdings, Inc., Blue Nile and other potential exposures.
Interest Rates
We utilize cash from our Credit Facility to fund our working capital needs. Our Credit Facility is not used for trading or speculative purposes. In addition, we have available letters of credit as sources of financing for our working capital requirements. Borrowings underBuild-A-Bear Workshop, Inc. Accordingly, the Credit Facility, which expires October 29, 2019, bear interest at variable rates based on Bank of America’s prime rate or LIBOR. At January 28, 2017, we had outstanding borrowings of approximately $44.4 million, of which approximately $36.0 million werecompanies in LIBOR-based contracts with an interest rate of approximately 2.22%. The remainder were prime-based borrowings, with a rate of 4.25%. We also have a term loan, with an outstanding balance of $12.8 million at January 28, 2017, which bears interest at a variable rate based on one-month LIBOR rates plus 6.5%.
Based upon a sensitivity analysis as of January 28, 2017, assuming average outstanding borrowings duringthe fiscal 2016 of $52.1 million under our Credit Facility and an average outstanding balance under our term loan of $13.3 million, a 50 basis point increase in interest rates would have increased interest expense by approximately $0.3 million on an annualized basis.
Foreign Currency
Our Rochester Clothing store located in London, England conducts business in British pounds. If the value of the British pound against the U.S. dollar weakens, the revenues and earnings of this store will be reduced when theypeer group are translated or re-measured to U.S. dollars. Also, the value of these assets to U.S. dollars may decline. As of January 28, 2017 sales from our London Rochester Clothing store were immaterial to consolidated sales. As such, we believe that movement in foreign currency exchange rates will not have a material adverse effect on our financial position or results of operations.
Item 8. Financial Statements and Supplementary Data
Destination XL Group, Inc.
INDEX TO CONSOLIDATED FINANCIAL STATEMENTSlisted below.
• | bebe, inc. | • | Cato Group | • | MarineMax, Inc |
|
|
| |||
|
| ||||
• | Big 5 Sporting Goods | • | Christopher & Banks | • | Sportsman’s Warehouse |
| |||||
• | Blue Nile | • | Citi Trends | • | Tilly’s Inc. |
• | Boot Barn Holding, Inc. | • | Destination Maternity | • | Zumiez, Inc. |
• | The Buckle | • | Hibbett Sports |
|
|
|
|
| |||
| Build-A-Bear Workshop, Inc. | • | Kirkland’s, Inc. |
|
|
|
|
| |||
|
|
|
We carefully prepare this peer group so that, to the best of our ability, we compile a list of peers within the retail apparel industry, which is also important when comparing executive compensation to total shareholder return (“TSR”). In order to develop an appropriate peer group, the range of revenue and market capitalization may be wider than that used by outside firms, including Institutional Shareholder Services (ISS), but we believe that having peers in the same markets, many with the same brick and mortar/ direct business model that we have, is a more reliable measure of how our stock performs against our peers in our retail apparel industry. For example, an outside firm may include a company as a peer company that falls within the same Standard & Poor’s GICS code (“Global Industry Classification Standard”) with revenue and market capitalization that may be more in line with ours; however, that company’s business model, business risks, geographic locations, customer base and industry traffic trends have nothing in common with our Company and, as a result, it’s stock performance in relation to executive compensation is not comparable.
In evaluating Say-on-Pay performance, ISS uses Relative Degree of Alignment (RDA) as a measure. RDA compares the percentile rank of a company’s CEO pay and TSR performance, relative to a comparison group of 12-24 companies selected by ISS on the basis of size, industry (the “GICS” code referred to above), market capitalization, and other factors, generally measured over a three-year period. While the ISS peer group may be appropriate to determine median compensation, relative to revenue and market capitalization, this same peer group is not always appropriate to compare for purposes of RDA. For example, an internet-only, weight-loss company falls within the same GICS code as us but clearly has a distinctively different business model than we do and would not be affected by the same trends that affect retail apparel.
For illustration purposes, the following chart shows the industry classification under GICS. ISS chooses its peers for us from the broader “2550 Retailing” industry classification as opposed to the more defined sub-industries of “Apparel Retail” or “Specialty Stores.” Retailers across the apparel industry have been significantly impacted over the past nine months by not only macroeconomic and political issues but also by a shift in consumer behavior resulting in an overall decrease in traffic and discretionary spending on apparel. After the 2016 holiday season, many apparel retailers filed bankruptcy or announced restructurings, store closures and liquidations. As a result, the shareholder returns of the retail apparel industry, as a whole, are down. In contrast, other types of retailers, such as automotive part retailers, may not be affected by the same trends as apparel retailers.
The following is an excerpt of Standard & Poor’s Industry Classification which shows the broad range of companies that would fall under the generic Retailing GICS that would not necessarily be an appropriate peer for purposes of measuring RDA:
2550 Retailing | 255010-Distributors | 25501010-Distributors | |
255020-Internet & Direct Marketing Retail | 25502020-Internet & Direct Marketing Retail | ||
255030-Multiline Retail | 25503010-Department Stores | ||
|
| 25503020-General Merchandise Stores | |
|
| 25504010-Apparel Retail | |
|
| ||
| |||
|
| ||
| |||
|
| ||
| |||
|
| 25504050-Automotive Retail | |
|
|
REPORT OF INDEPENDENT REGISTERED PUBLIC ACCOUNTING FIRM
The BoardWhen using our Company-defined peer group to calculate RDA, we would fall within an acceptance range indicating a low area of Directors and Shareholders
Destination XL Group, Inc.
Weconcern for CEO compensation. Given the current volatile retail environment, where many retailers have auditedbeen affected by the accompanying consolidated balance sheetsoverall softness in store traffic, we have performed well against our peers in terms of Destination XL Group, Inc. and subsidiaries (the Company) as of January 28, 2017 and January 30, 2016 and the related consolidated statements of operations, comprehensive income (loss), changes in stockholders’ equity,Sales, EBITDA and cash flowsflow growth. Our 3-year total shareholder return, while down 12.9%, is not outside the range of performance by our peers. Using a similar presentation to ISS’s RDA model that was used in last year’s ISS Proxy Research Report, below is a chart that plots the annualized 3-year performance and pay rankings for each of the years in the three-year period ended January 28, 2017. These consolidated financial statements are the responsibility of the Company’s management. Our responsibility is to express an opinion on these consolidated financial statementsus, as well as our Company-defined peer group, based on publicly-available information. This chart shows that among our audits.peer group, we fall within the corridor (denoted by gray) of acceptable Pay Rank to Performance Risk.
We conductedRelative Pay Rank (using Company-defined Peers)
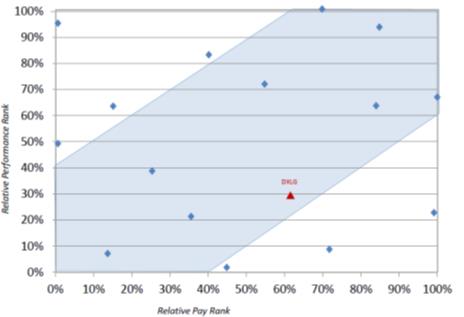
Say-on-Pay Vote
At our audits2011 Annual Meeting, stockholders voted on a non-binding advisory proposal as to the frequency with which we should conduct an advisory vote on executive compensation (a "say-on-pay proposal"). At that meeting, and in accordance with the standardsrecommendation of our Board of Directors, 93.5% of votes cast voted for the “one-year” frequency for advisory votes on executive compensation and we have held such vote every year. At our 2017 Annual Meeting, our stockholders will have another opportunity to vote on the "say-on-pay" frequency proposal.
At our 2016 Annual Meeting, stockholders had an opportunity to cast a non-binding advisory vote on executive compensation as disclosed in the 2016 Proxy Statement. Of the votes cast on the say-on-pay proposal, 88.5% voted in favor of the Public Company Accounting Oversight Board (United States). Those standards requireproposal. The Compensation Committee considered the results of the 2016 advisory vote and believes that it affirms stockholders' support of our approach to executive compensation, namely to align short- and long-term incentives with the Company’s financial performance as we plan and performcontinue to convert to the auditDXL format. We will continue to obtain reasonable assurance about whetherconsider the financial statements are freeoutcome of material misstatement. An audit includes examining, on a test basis, evidence supporting the amounts and disclosures in the financial statements. An audit also includes assessing the accounting principles used and significant estimates made by management, as well as evaluating the overall financial statement presentation. subsequent say-on-pay votes when making future compensation decisions for our executive officers.
Risk Assessment
We believe that our auditscompensation programs do not provide a reasonable basisincentives for unnecessary risk taking by our opinion.
In our opinion, the consolidated financial statements referred to above present fairly, in all material respects, the financial position of Destination XL Group, Inc. and subsidiaries as of January 28, 2017 and January 30, 2016, and the results of their operations and their cash flows foremployees. Our employment agreements with each of our Named Executive Officers include a “claw-back” provision that permits us to demand full repayment of all amounts paid to the yearsexecutive in the three-year period ended January 28, 2017, in conformityevent we learn, after the executive’s termination, that the executive could have been terminated for “justifiable cause.” Our emphasis on performance-based annual and long-term incentive awards is also designed to align executives with U.S. generally accepted accounting principles.
We alsopreserving and enhancing shareholder value. Based on these considerations, among others, we do not believe that our compensation policies and practices create risks that are likely to have audited, in accordance with the standards of the Public Company Accounting Oversight Board (United States), Destination XL Group, Inc.’s internal control over financial reporting as of January 28, 2017, baseda material adverse effect on criteria established in Internal Control—Integrated Framework (2013) issued by the Committee of Sponsoring Organizations of the Treadway Commission (COSO), and our report dated March 20, 2017 expressed an unqualified opinion on the effectiveness of the Company’s internal control over financial reporting.
/s/ KPMG LLP
Boston, Massachusetts
March 20, 2017
Company.
DESTINATION XL GROUP, INC.Compensation Components, Fiscal 2016 Compensation Decisions, 2017 Annual Incentive Plan Targets and Long-Term Incentive Program
January 28, 2017We believe that our executive compensation policies and January 30, 2016
(In thousands, except share data)
|
| January 28, 2017 |
|
| January 30, 2016 |
| ||
|
| (Fiscal 2016) |
|
| (Fiscal 2015) |
| ||
ASSETS |
|
|
|
|
|
|
|
|
Current assets: |
|
|
|
|
|
|
|
|
Cash and cash equivalents |
| $ | 5,572 |
|
| $ | 5,170 |
|
Accounts receivable |
|
| 7,114 |
|
|
| 4,721 |
|
Inventories |
|
| 117,446 |
|
|
| 125,014 |
|
Prepaid expenses and other current assets |
|
| 8,817 |
|
|
| 8,254 |
|
Total current assets |
|
| 138,949 |
|
|
| 143,159 |
|
|
|
|
|
|
|
|
|
|
Property and equipment, net of accumulated depreciation and amortization |
|
| 124,347 |
|
|
| 124,962 |
|
|
|
|
|
|
|
|
|
|
Other assets: |
|
|
|
|
|
|
|
|
Intangible assets |
|
| 2,228 |
|
|
| 2,669 |
|
Other assets |
|
| 3,804 |
|
|
| 3,557 |
|
Total assets |
| $ | 269,328 |
|
| $ | 274,347 |
|
|
|
|
|
|
|
|
|
|
LIABILITIES AND STOCKHOLDERS' EQUITY |
|
|
|
|
|
|
|
|
Current liabilities: |
|
|
|
|
|
|
|
|
Current portion of long-term debt |
| $ | 6,941 |
|
| $ | 7,155 |
|
Current portion of deferred gain on sale-leaseback |
|
| 1,465 |
|
|
| 1,465 |
|
Accounts payable |
|
| 31,258 |
|
|
| 30,684 |
|
Accrued expenses and other current liabilities |
|
| 31,938 |
|
|
| 33,778 |
|
Borrowings under credit facility |
|
| 44,097 |
|
|
| 41,984 |
|
Total current liabilities |
|
| 115,699 |
|
|
| 115,066 |
|
|
|
|
|
|
|
|
|
|
Long-term liabilities: |
|
|
|
|
|
|
|
|
Long-term debt, net of current portion |
|
| 12,061 |
|
|
| 19,003 |
|
Deferred rent and lease incentives |
|
| 35,421 |
|
|
| 30,934 |
|
Deferred gain on sale-leaseback, net of current portion |
|
| 11,723 |
|
|
| 13,189 |
|
Deferred tax liability |
|
| 222 |
|
|
| 196 |
|
Other long-term liabilities |
|
| 5,682 |
|
|
| 7,555 |
|
Total long-term liabilities |
|
| 65,109 |
|
|
| 70,877 |
|
|
|
|
|
|
|
|
|
|
Commitments and contingencies |
|
|
|
|
|
|
|
|
|
|
|
|
|
|
|
|
|
Stockholders' equity: |
|
|
|
|
|
|
|
|
Preferred stock, $0.01 par value, 1,000,000 shares authorized, none issued |
|
| — |
|
|
| — |
|
Common stock, $0.01 par value, 100,000,000 shares authorized, 61,637,164 and 61,692,285 shares issued at January 28, 2017 and January 30, 2016, respectively |
|
| 616 |
|
|
| 617 |
|
Additional paid-in capital |
|
| 304,466 |
|
|
| 302,727 |
|
Treasury stock at cost, 10,877,439 shares at January 28, 2017 and January 30, 2016 |
|
| (87,977 | ) |
|
| (87,977 | ) |
Accumulated deficit |
|
| (122,567 | ) |
|
| (120,311 | ) |
Accumulated other comprehensive loss |
|
| (6,018 | ) |
|
| (6,652 | ) |
Total stockholders' equity |
|
| 88,520 |
|
|
| 88,404 |
|
Total liabilities and stockholders' equity |
| $ | 269,328 |
|
| $ | 274,347 |
|
The accompanying notes are an integral partpractices appropriately balance the interests of our executives with those of our stockholders. Our executive compensation philosophy emphasizes the consolidatedshared responsibility of our executive officers for the Company’s financial statements.
CONSOLIDATED STATEMENTS OF OPERATIONS
Forperformance. Accordingly, the fiscal years ended January 28, 2017, January 30, 2016 and January 31, 2015
(In thousands, except per share data)
|
| January 28, 2017 |
|
| January 30, 2016 |
|
| January 31, 2015 |
| |||
|
| (Fiscal 2016) |
|
| (Fiscal 2015) |
|
| (Fiscal 2014) |
| |||
Sales |
| $ | 450,283 |
|
| $ | 442,221 |
|
| $ | 414,020 |
|
Cost of goods sold including occupancy costs |
|
| 245,402 |
|
|
| 238,382 |
|
|
| 224,006 |
|
Gross profit |
|
| 204,881 |
|
|
| 203,839 |
|
|
| 190,014 |
|
|
|
|
|
|
|
|
|
|
|
|
|
|
Expenses: |
|
|
|
|
|
|
|
|
|
|
|
|
Selling, general and administrative |
|
| 173,283 |
|
|
| 180,570 |
|
|
| 174,814 |
|
Depreciation and amortization |
|
| 30,621 |
|
|
| 28,359 |
|
|
| 24,002 |
|
Total expenses |
|
| 203,904 |
|
|
| 208,929 |
|
|
| 198,816 |
|
|
|
|
|
|
|
|
|
|
|
|
|
|
Operating income (loss) |
|
| 977 |
|
|
| (5,090 | ) |
|
| (8,802 | ) |
|
|
|
|
|
|
|
|
|
|
|
|
|
Interest expense, net |
|
| (3,067 | ) |
|
| (3,058 | ) |
|
| (2,132 | ) |
|
|
|
|
|
|
|
|
|
|
|
|
|
Loss from continuing operations before provision for income taxes |
|
| (2,090 | ) |
|
| (8,148 | ) |
|
| (10,934 | ) |
|
|
|
|
|
|
|
|
|
|
|
|
|
Provision for income taxes |
|
| 166 |
|
|
| 260 |
|
|
| 243 |
|
|
|
|
|
|
|
|
|
|
|
|
|
|
Loss from continuing operations |
|
| (2,256 | ) |
|
| (8,408 | ) |
|
| (11,177 | ) |
|
|
|
|
|
|
|
|
|
|
|
|
|
Loss from discontinued operations, net of taxes |
|
| — |
|
|
| — |
|
|
| (1,118 | ) |
|
|
|
|
|
|
|
|
|
|
|
|
|
Net loss |
| $ | (2,256 | ) |
| $ | (8,408 | ) |
| $ | (12,295 | ) |
|
|
|
|
|
|
|
|
|
|
|
|
|
|
|
|
|
|
|
|
|
|
|
|
|
|
Net loss per share - basic and diluted: |
|
|
|
|
|
|
|
|
|
|
|
|
Loss from continuing operations |
| $ | (0.05 | ) |
| $ | (0.17 | ) |
| $ | (0.23 | ) |
Loss from discontinued operations |
| $ | 0.00 |
|
| $ | 0.00 |
|
| $ | (0.02 | ) |
Net loss per share - basic and diluted |
| $ | (0.05 | ) |
| $ | (0.17 | ) |
| $ | (0.25 | ) |
|
|
|
|
|
|
|
|
|
|
|
|
|
Weighted-average number of common shares outstanding: |
|
|
|
|
|
|
|
|
|
|
|
|
Basic |
|
| 49,544 |
|
|
| 49,089 |
|
|
| 48,740 |
|
Diluted |
|
| 49,544 |
|
|
| 49,089 |
|
|
| 48,740 |
|
The accompanying notes are an integral partcompensation of the consolidated financial statements.
CONSOLIDATED STATEMENTS OF COMPREHENSIVE INCOME (LOSS)
For the fiscal years ended January 28, 2017, January 30, 2016 and January 31, 2015
(In thousands)
|
| January 28, 2017 |
|
| January 30, 2016 |
|
| January 31, 2015 |
| |||
|
| (Fiscal 2016) |
|
| (Fiscal 2015) |
|
| (Fiscal 2014) |
| |||
Net loss |
| $ | (2,256 | ) |
| $ | (8,408 | ) |
| $ | (12,295 | ) |
|
|
|
|
|
|
|
|
|
|
|
|
|
Other comprehensive income (loss) before taxes: |
|
|
|
|
|
|
|
|
|
|
|
|
Foreign currency translation |
|
| (242 | ) |
|
| (96 | ) |
|
| (430 | ) |
Pension plan |
|
| 876 |
|
|
| 1,682 |
|
|
| (3,248 | ) |
Other comprehensive income (loss) before taxes |
|
| 634 |
|
|
| 1,586 |
|
|
| (3,678 | ) |
Tax provision related to items of other comprehensive income (loss) |
|
| — |
|
|
| — |
|
|
| — |
|
Other comprehensive income (loss), net of tax |
|
| 634 |
|
|
| 1,586 |
|
|
| (3,678 | ) |
Comprehensive loss |
| $ | (1,622 | ) |
| $ | (6,822 | ) |
| $ | (15,973 | ) |
The accompanying notes are an integral part of the consolidated financial statements.
CONSOLIDATED STATEMENTS OF CHANGES IN STOCKHOLDERS’ EQUITY
For the fiscal years ended January 28, 2017, January 30, 2016 and January 31, 2015
(In thousands)
|
|
|
|
|
|
|
|
|
|
|
|
|
|
|
|
|
|
|
|
|
|
|
|
|
| Accumulated |
|
|
|
|
| |
|
|
|
|
|
|
|
|
|
| Additional |
|
|
|
|
|
|
|
|
|
|
|
|
|
| Other |
|
|
|
|
| ||
|
| Common Stock |
|
|
|
|
|
| Paid-in |
|
| Treasury Stock |
|
|
|
|
|
| Accumulated |
|
| Comprehensive |
|
|
|
|
| |||||
|
| Shares |
|
| Amounts |
|
| Capital |
|
| Shares |
|
| Amounts |
|
| Deficit |
|
| Income (Loss) |
|
| Total |
| ||||||||
Balance at February 1, 2014 |
|
| 61,473 |
|
| $ | 615 |
|
| $ | 296,501 |
|
|
| (10,877 | ) |
| $ | (87,977 | ) |
| $ | (99,608 | ) |
| $ | (4,560 | ) |
| $ | 104,971 |
|
|
|
|
|
|
|
|
|
|
|
|
|
|
|
|
|
|
|
|
|
|
|
|
|
|
|
|
|
|
|
|
|
|
Stock compensation expense |
|
|
|
|
|
|
|
|
|
| 2,996 |
|
|
|
|
|
|
|
|
|
|
|
|
|
|
|
|
|
|
| 2,996 |
|
Exercises under option program |
|
| 27 |
|
|
| — |
|
|
| 123 |
|
|
|
|
|
|
|
|
|
|
|
|
|
|
|
|
|
|
| 123 |
|
Issuances of restricted stock, net of cancellations |
|
| 20 |
|
|
| — |
|
|
| — |
|
|
|
|
|
|
|
|
|
|
|
|
|
|
|
|
|
|
| — |
|
Board of Directors compensation |
|
| 41 |
|
|
| 1 |
|
|
| 272 |
|
|
|
|
|
|
|
|
|
|
|
|
|
|
|
|
|
|
| 273 |
|
Accumulated other comprehensive income (loss): |
|
|
|
|
|
|
|
|
|
|
|
|
|
|
|
|
|
|
|
|
|
|
|
|
|
|
|
|
|
|
|
|
Unrecognized loss associated with Pension Plan |
|
|
|
|
|
|
|
|
|
|
|
|
|
|
|
|
|
|
|
|
|
|
|
|
|
| (3,248 | ) |
|
| (3,248 | ) |
Foreign currency |
|
|
|
|
|
|
|
|
|
|
|
|
|
|
|
|
|
|
|
|
|
|
|
|
|
| (430 | ) |
|
| (430 | ) |
Net loss |
|
|
|
|
|
|
|
|
|
|
|
|
|
|
|
|
|
|
|
|
|
| (12,295 | ) |
|
|
|
|
|
| (12,295 | ) |
Balance at January 31, 2015 |
|
| 61,561 |
|
| $ | 616 |
|
| $ | 299,892 |
|
|
| (10,877 | ) |
| $ | (87,977 | ) |
| $ | (111,903 | ) |
| $ | (8,238 | ) |
| $ | 92,390 |
|
|
|
|
|
|
|
|
|
|
|
|
|
|
|
|
|
|
|
|
|
|
|
|
|
|
|
|
|
|
|
|
|
|
Stock compensation expense |
|
|
|
|
|
|
|
|
|
| 2,195 |
|
|
|
|
|
|
|
|
|
|
|
|
|
|
|
|
|
|
| 2,195 |
|
Exercises under option program |
|
| 22 |
|
|
| — |
|
|
| 101 |
|
|
|
|
|
|
|
|
|
|
|
|
|
|
|
|
|
|
| 101 |
|
Issuances of restricted stock, net of cancellations |
|
| 25 |
|
|
| — |
|
|
| — |
|
|
|
|
|
|
|
|
|
|
|
|
|
|
|
|
|
|
| — |
|
Board of Directors compensation |
|
| 84 |
|
|
| 1 |
|
|
| 539 |
|
|
|
|
|
|
|
|
|
|
|
|
|
|
|
|
|
|
| 540 |
|
Accumulated other comprehensive income (loss): |
|
|
|
|
|
|
|
|
|
|
|
|
|
|
|
|
|
|
|
|
|
|
|
|
|
|
|
|
|
|
|
|
Unrecognized gain associated with Pension Plan |
|
|
|
|
|
|
|
|
|
|
|
|
|
|
|
|
|
|
|
|
|
|
|
|
|
| 1,682 |
|
|
| 1,682 |
|
Foreign currency |
|
|
|
|
|
|
|
|
|
|
|
|
|
|
|
|
|
|
|
|
|
|
|
|
|
| (96 | ) |
|
| (96 | ) |
Net loss |
|
|
|
|
|
|
|
|
|
|
|
|
|
|
|
|
|
|
|
|
|
| (8,408 | ) |
|
|
|
|
|
| (8,408 | ) |
Balance at January 30, 2016 |
|
| 61,692 |
|
| $ | 617 |
|
| $ | 302,727 |
|
|
| (10,877 | ) |
| $ | (87,977 | ) |
| $ | (120,311 | ) |
| $ | (6,652 | ) |
| $ | 88,404 |
|
|
|
|
|
|
|
|
|
|
|
|
|
|
|
|
|
|
|
|
|
|
|
|
|
|
|
|
|
|
|
|
|
|
Stock compensation expense |
|
|
|
|
|
|
|
|
|
| 1,256 |
|
|
|
|
|
|
|
|
|
|
|
|
|
|
|
|
|
|
| 1,256 |
|
Cancellations of restricted stock, net of issuances |
|
| (123 | ) |
|
| (1 | ) |
|
| 1 |
|
|
|
|
|
|
|
|
|
|
|
|
|
|
|
|
|
|
| — |
|
Board of Directors compensation |
|
| 68 |
|
|
| — |
|
|
| 482 |
|
|
|
|
|
|
|
|
|
|
|
|
|
|
|
|
|
|
| 482 |
|
Accumulated other comprehensive income (loss): |
|
|
|
|
|
|
|
|
|
|
|
|
|
|
|
|
|
|
|
|
|
|
|
|
|
|
|
|
|
|
|
|
Unrecognized gain associated with Pension Plan |
|
|
|
|
|
|
|
|
|
|
|
|
|
|
|
|
|
|
|
|
|
|
|
|
|
| 876 |
|
|
| 876 |
|
Foreign currency |
|
|
|
|
|
|
|
|
|
|
|
|
|
|
|
|
|
|
|
|
|
|
|
|
|
| (242 | ) |
|
| (242 | ) |
Net loss |
|
|
|
|
|
|
|
|
|
|
|
|
|
|
|
|
|
|
|
|
|
| (2,256 | ) |
|
|
|
|
|
| (2,256 | ) |
Balance at January 28, 2017 |
|
| 61,637 |
|
| $ | 616 |
|
| $ | 304,466 |
|
|
| (10,877 | ) |
| $ | (87,977 | ) |
| $ | (122,567 | ) |
| $ | (6,018 | ) |
| $ | 88,520 |
|
The accompanying notes are an integral part of the consolidated financial statements.
DESTINATION XL GROUP, INC.
CONSOLIDATED STATEMENTS OF CASH FLOWS
For the fiscal years ended January 28, 2017, January 30, 2016 and January 31, 2015
(In thousands)
|
| January 28, 2017 |
|
| January 30, 2016 |
|
| January 31, 2015 |
| |||
|
| (Fiscal 2016) |
|
| (Fiscal 2015) |
|
| (Fiscal 2014) |
| |||
Cash flows from operating activities: |
|
|
|
|
|
|
|
|
|
|
|
|
Net loss |
| $ | (2,256 | ) |
| $ | (8,408 | ) |
| $ | (12,295 | ) |
Adjustments to reconcile net loss to net cash provided by operating activities: |
|
|
|
|
|
|
|
|
|
|
|
|
Amortization of deferred gain on sale-leaseback |
|
| (1,466 | ) |
|
| (1,465 | ) |
|
| (1,466 | ) |
Amortization of deferred debt issuance costs |
|
| 276 |
|
|
| 279 |
|
|
| 192 |
|
Depreciation and amortization |
|
| 30,621 |
|
|
| 28,359 |
|
|
| 24,002 |
|
Deferred taxes, net of valuation allowance |
|
| 26 |
|
|
| 105 |
|
|
| 91 |
|
Stock compensation expense |
|
| 1,256 |
|
|
| 2,195 |
|
|
| 2,996 |
|
Issuance of common stock to Board of Directors |
|
| 482 |
|
|
| 540 |
|
|
| 273 |
|
|
|
|
|
|
|
|
|
|
|
|
|
|
Changes in operating assets and liabilities: |
|
|
|
|
|
|
|
|
|
|
|
|
Accounts receivable |
|
| (2,393 | ) |
|
| (1,102 | ) |
|
| 4,728 |
|
Inventories |
|
| 7,568 |
|
|
| (9,794 | ) |
|
| (9,664 | ) |
Prepaid expenses and other current assets |
|
| (563 | ) |
|
| 659 |
|
|
| (1,196 | ) |
Other assets |
|
| (247 | ) |
|
| 350 |
|
|
| (667 | ) |
Accounts payable |
|
| 574 |
|
|
| 705 |
|
|
| (2,966 | ) |
Deferred rent and lease incentives |
|
| 4,487 |
|
|
| 2,084 |
|
|
| 6,015 |
|
Accrued expenses and other liabilities |
|
| (3,405 | ) |
|
| 3,883 |
|
|
| 3,762 |
|
Net cash provided by operating activities |
|
| 34,960 |
|
|
| 18,390 |
|
|
| 13,805 |
|
|
|
|
|
|
|
|
|
|
|
|
|
|
Cash flows from investing activities: |
|
|
|
|
|
|
|
|
|
|
|
|
Additions to property and equipment, net |
|
| (29,239 | ) |
|
| (33,447 | ) |
|
| (40,927 | ) |
Net cash used for investing activities |
|
| (29,239 | ) |
|
| (33,447 | ) |
|
| (40,927 | ) |
|
|
|
|
|
|
|
|
|
|
|
|
|
Cash flows from financing activities: |
|
|
|
|
|
|
|
|
|
|
|
|
Net borrowings under credit facility |
|
| 1,993 |
|
|
| 23,044 |
|
|
| 10,373 |
|
Proceeds from the issuance of long-term debt |
|
| — |
|
|
| — |
|
|
| 23,912 |
|
Principal payments on long-term debt |
|
| (7,312 | ) |
|
| (7,489 | ) |
|
| (6,478 | ) |
Costs associated with debt issuances |
|
| — |
|
|
| (15 | ) |
|
| (766 | ) |
Proceeds from the exercise of stock options |
|
| — |
|
|
| 101 |
|
|
| 123 |
|
Net cash provided by (used for) financing activities |
|
| (5,319 | ) |
|
| 15,641 |
|
|
| 27,164 |
|
Net increase in cash and cash equivalents |
|
| 402 |
|
|
| 584 |
|
|
| 42 |
|
Cash and cash equivalents: |
|
|
|
|
|
|
|
|
|
|
|
|
Beginning of period |
|
| 5,170 |
|
|
| 4,586 |
|
|
| 4,544 |
|
End of period |
| $ | 5,572 |
|
| $ | 5,170 |
|
| $ | 4,586 |
|
The accompanying notes are an integral part of the consolidated financial statements.
NOTES TO CONSOLIDATED FINANCIAL STATEMENTS
JANUARY 28, 2017
A. SUMMARY OF SIGNIFICANT ACCOUNTING POLICIES
Nature of Business
Destination XL Group, Inc. (collectively with its subsidiaries referred to as the “Company”)our Named Executive Officers, in particular our CEO, is the largest specialty retailer in the United States of big & tall men’s apparel. The Company operates under the trade names of Destination XL® (DXL®), DXL Outlets®, Casual Male XL®, Casual Male XL Outlets, Rochester Clothing, ShoesXL® and LivingXL®. At January 28, 2017, the Company operated 192 DXL stores, 97 Casual Male XL, 36 Casual Male XL outlets, 13 DXL outlets and 5 Rochester Clothing stores located throughout the United States, including one store in London, England. The Company also operates a direct business, which includes brand mailers and an aggregated e-commerce site to support its brands and product extensions.
Basis of Presentationheavily weighted toward “at risk,” performance-based compensation.
The consolidated financial statementsprimary components of compensation for our Named Executive Officers include the accountsbase salary (“fixed compensation”) annual performance-based cash incentives and long-term incentives (“at-risk compensation”). The annual weight of the Company and its subsidiaries. All significant intercompany accounts, transactions and profits are eliminated.
The accompanying financial statements have been prepared in accordance with accounting principles generally accepted in the United States. The preparation of financial statements in conformity with generally accepted accounting principles requires management to make estimates and assumptions that affect the reported amounts of assets and liabilities and disclosures of contingent liabilities as of the date of the financial statements and the reported amounts of revenue and expenses during the reporting period. Actual results could differ from estimates.
Subsequent Events
All appropriate subsequent event disclosures, if any, have been made in these Noteseach component leads to the Consolidated Financial Statements.
Segment Reporting
The Company reports its operations as one reportable segment, Big & Tall Men’s Apparel, which consistsfollowing allocation of two principal operating segments: its retail business and its direct business. The Company considers its operating segments to be similar in terms of economic characteristics, production processes and operations, and have therefore aggregated them into a single reporting segment, consistent with its omni-channel business approach. The direct operating segment includes the operating results and assets for LivingXL and ShoesXL.
Fiscal Year
The Company’s fiscal year is a 52-week or 53-week period ending on the Saturday closest to January 31. Fiscal years 2016, 2015 and 2014, which were 52-week periods, ended on January 28, 2017, January 30, 2016 and January 31, 2015, respectively.
Cash and Cash Equivalents
Cash and cash equivalents consist of cash in banks and short-term investments, which have a maturity of ninety days or less when acquired. Included in cash equivalents are credit card and debit card receivables from banks, which generally settle within two to four business days.
Accounts Receivable
Accounts receivable primarily includes amounts due for tenant allowances and rebates from certain vendors. For fiscal 2016, fiscal 2015 and fiscal 2014, the Company has not incurred any losses on its accounts receivable.
Fair Value of Financial Instruments
ASC Topic 825, Financial Instruments, requires disclosure of the fair value of certain financial instruments. The carrying amounts of cash and cash equivalents, accounts receivable, accounts payable, accrued expenses and short-term borrowings approximate fair value because of the short maturity of these instruments.
ASC Topic 820, Fair Value Measurements and Disclosures, defines fair value, establishes a framework for measuring fair value and enhances disclosures about fair value measurements.
The valuation techniques utilized are based upon observable and unobservable inputs. Observable inputs reflect market data obtained from independent sources, while unobservable inputs reflect internal market assumptions. These two types of inputs create the following fair value hierarchy:
Level 1 – Quoted prices in active markets for identical assets or liabilities.
Level 2 – Observable inputs other than Level 1 prices such as quoted prices for similar assets or liabilities; quoted prices in marketspotential compensation that are not active or other inputs that are observable oreach executive can be corroborated by observable market data for substantially the full term of the related asset or liabilities.
Level 3 – Unobservable inputs that are supported by little or no market activity and that are significant to the fair value of assets or liabilities.
The Company utilizes observable market inputs (quoted market prices) when measuring fair value whenever possible.
The fair value of long-term debt at January 28, 2017 approximates the carrying amount based upon terms available to the Company for borrowings with similar arrangements and remaining maturities. See Note C, “Debt Obligations”, for more discussion.
The fair value of indefinite-lived assets, which consists of the Company’s “Rochester” trademark, is measured on a non-recurring basis in connection with the Company’s annual impairment test. The fair value of the trademark is determined using the relief from royalty method based on unobservable inputs and are classified within Level 3 of the valuation hierarchy. See Intangibles below.
Retail stores that have indicators of impairment and fail the recoverability test (based on undiscounted cash flows) are measured for impairment by comparing the fair value of the assets against their carrying value. Fair value of the assets is estimated using a projected discounted cash flow analysis and is classified within Level 3 of the valuation hierarchy. See Impairment of Long-Lived Assets below.
Inventories
All inventories are valued at the lower of cost or market, using a weighted-average cost method.
Property and Equipment
Property and equipment are stated at cost. Major additions and improvements are capitalized while repairs and maintenance are charged to expense as incurred. Upon retirement or other disposition, the cost and related depreciation of the assets are removed from the accounts and the resulting gain or loss, if any, is reflected in income. Depreciation is computed on the straight-line method over the assets’ estimated useful lives as follows:
earn.
|
|
|
|
| |
|
| |
|
|
Intangibles
ASC Topic 805, “Business Combinations”, requires that all business combinations be accounted for under the purchase method. The statement further requires separate recognition of intangible assets that meet one of two criteria set forth in the statement. Under ASC Topic 350, “Intangibles Goodwill and Other”, goodwill and intangible assets with indefinite lives are tested at least annually for impairment. At each reporting period, management analyzes current events and circumstances to determine whether the indefinite life classification for its “Rochester” trademark continues to be valid. If circumstances warrant a change to a finite life, the carrying value of the intangible asset would then be amortized prospectively over the estimated remaining useful life. The Company’s “Casual Male” trademark is considered a finite-lived asset. Other intangible assets with defined lives are amortized over their useful lives.
At least annually, as of the Company’s December month-end, the Company evaluates its “Rochester” trademark. The Company performs an impairment analysis and records an impairment charge for any intangible assets with a carrying value in excess of its fair value.
In the fourth quarter of fiscal 2016, the “Rochester” trademark was tested for potential impairment, utilizing the relief from royalty method to determine the estimated fair value. The Company concluded that the “Rochester” trademark, with a carrying value of $1.5 million at January 28, 2017, was not impaired. Although some of the Rochester locations are closing as part of the DXL expansion, the Rochester Clothing stores that will remain open as well as the Rochester brands that are sold in our DXL stores and website are currently expected to generate more than sufficient cash flows to support the carrying value of $1.5 million for the “Rochester” trademark.
During the fiscal 2011 annual evaluation of intangibles, the Company determined that its “Casual Male” trademark could no longer be considered an indefinite-lived asset. As the Company opens DXL stores, it is closing the majority of its Casual Male XL stores in those respective markets. The carrying value of the trademark is being amortized on an accelerated basis against projected cash flows through fiscal 2018, its estimated remaining useful life.
Below is a table showing the changes in the carrying value of the Company’s intangible assets from January 30, 2016 to January 28, 2017:
(in thousands) |
| January 30, 2016 |
|
| Additions |
|
| Impairment |
|
| Amortization |
|
| January 28, 2017 |
| |||||
"Rochester" trademark |
| $ | 1,500 |
|
| $ | — |
|
| $ | — |
|
| $ | — |
|
| $ | 1,500 |
|
"Casual Male" trademark |
|
| 940 |
|
|
| — |
|
|
| — |
|
|
| (341 | ) |
|
| 599 |
|
Other intangibles (1) |
|
| 229 |
|
|
| — |
|
|
| — |
|
|
| (100 | ) |
|
| 129 |
|
Total intangible assets |
| $ | 2,669 |
|
| $ | — |
|
| $ | — |
|
| $ | (441 | ) |
| $ | 2,228 |
|
|
|
The gross carrying amount and accumulated amortizationcomponents of the customer lists and “Casual Male” trademark, subject to amortization, were $7.7 million and $7.0 million, respectively, at January 28, 2017 and $7.7 million and $6.5 million, respectively, at January 30, 2016. Amortization expense for fiscal 2016, 2015 and 2014 was $0.4 million, $0.6 million and $1.1 million, respectively.
Expected amortization expense for the Company’s “Casual Male” trademark and customer lists, for the next five fiscal years is as follows:
FISCAL YEAR |
| (in thousands) |
| |
2017 |
| $ | 407 |
|
2018 |
| $ | 321 |
|
2019 |
|
| — |
|
2020 |
|
| — |
|
2021 |
|
| — |
|
Pre-opening Costs
The Company expenses all pre-opening costs for its stores as incurred.
Advertising Costs
The Company expenses in-store advertising costs as incurred. Television advertising costs are expensed in the period in which the advertising is first aired. Direct response advertising costs, if any, are deferred and amortized over the period of expected direct marketing revenues, which is less than one year. There were no deferred direct response costs at January 28, 2017 and January 30, 2016. Advertising expense, which is included in selling, general and administrative expenses, was $18.2 million, $23.6 million and $26.0 million for fiscal 2016, 2015 and 2014, respectively.
Revenue Recognition
Revenue from the Company’s retail store operations is recorded upon purchase of merchandise by customers, net of an allowance for sales returns. Revenue from the Company’s e-commerce operations is recognized at the time a customer order is delivered, net of an allowance for sales returns. Revenue is recognized by the operating segment that fulfills a customer’s order. Sales tax collected from customers is excluded from revenue and is included as part of accrued expenses on the Company’s Consolidated Balance Sheets.
Accumulated Other Comprehensive Income (Loss) – (“AOCI”)
Other comprehensive income (loss) includes amounts related to foreign currency and pension plans and is reported in the Consolidated Statements of Comprehensive Income (Loss). Other comprehensive income and reclassifications from AOCI for fiscal 2016, fiscal 2015 and fiscal 2014executive compensation are as follows:
Base salary
| Fiscal 2016 |
|
| Fiscal 2015 |
|
| Fiscal 2014 |
| |||||||||||||||||||||||||||
(in thousands) |
|
|
|
|
|
|
|
|
|
|
|
|
|
| |||||||||||||||||||||
| Pension Plans |
|
| Foreign Currency |
|
| Total |
|
| Pension Plans |
|
| Foreign Currency |
|
| Total |
|
| Pension Plans |
|
| Foreign Currency |
|
| Total |
| |||||||||
Balance at beginning of fiscal year | $ | (6,113 | ) |
| $ | (539 | ) |
| $ | (6,652 | ) |
| $ | (7,795 | ) |
| $ | (443 | ) |
| $ | (8,238 | ) |
| $ | (4,547 | ) |
| $ | (13 | ) |
| $ | (4,560 | ) |
|
|
|
|
|
|
|
|
|
|
|
|
|
|
|
|
|
|
|
|
|
|
|
|
|
|
|
|
|
|
|
|
|
|
|
|
Other comprehensive income (loss) before reclassifications, net of taxes |
| 171 |
|
|
| (242 | ) |
|
| (71 | ) |
|
| 1,035 |
|
|
| (96 | ) |
|
| 939 |
|
|
| (3,506 | ) |
|
| (184 | ) |
|
| (3,690 | ) |
|
|
|
|
|
|
|
|
|
|
|
|
|
|
|
|
|
|
|
|
|
|
|
|
|
|
|
|
|
|
|
|
|
|
|
|
Amounts reclassified from accumulated other comprehensive income (loss), net of taxes (1) |
| 705 |
|
|
| — |
|
|
| 705 |
|
|
| 647 |
|
|
| — |
|
|
| 647 |
|
|
| 258 |
|
|
| (246 | ) |
|
| 12 |
|
|
|
|
|
|
|
|
|
|
|
|
|
|
|
|
|
|
|
|
|
|
|
|
|
|
|
|
|
|
|
|
|
|
|
|
|
Other comprehensive income (loss) for the period |
| 876 |
|
|
| (242 | ) |
|
| 634 |
|
|
| 1,682 |
|
|
| (96 | ) |
|
| 1,586 |
|
|
| (3,248 | ) |
|
| (430 | ) |
|
| (3,678 | ) |
|
|
|
|
|
|
|
|
|
|
|
|
|
|
|
|
|
|
|
|
|
|
|
|
|
|
|
|
|
|
|
|
|
|
|
|
Balance at end of fiscal year | $ | (5,237 | ) |
| $ | (781 | ) |
| $ | (6,018 | ) |
| $ | (6,113 | ) |
| $ | (539 | ) |
| $ | (6,652 | ) |
| $ | (7,795 | ) |
| $ | (443 | ) |
| $ | (8,238 | ) |
|
|
Foreign Currency Translation
At January 28, 2017,Base salary represents the Company has one Rochester Clothing store located in London, England. Assets and liabilities for this store are translated into U.S. dollars at the exchange rates in effect at each balance sheet date. Stockholders’ equity is translated at applicable historical exchange rates. Income, expense and cash flow items are translated at average exchange rates during the period. Resulting translation adjustments are reported as a separatefixed component of stockholders’ equity.
Shipping and Handling Costs
Shipping and handling costs are included in cost of sales for all periods presented. Amounts relatedan executive’s annual compensation. In order to shipping and handling that are billed to customers are recorded in net sales, and the related costs are recorded in Cost of Goods Sold, Including Occupancy Costs,be competitive in the Consolidated Statements of Operations.
Income Taxes
Deferred income taxes are provided to recognizemarketplace and attract the effect of temporary differences between tax and financial statement reporting. Such taxes are provided for using enacted tax rates expected to be in place when such temporary differences are realized. A valuation allowance is recorded to reduce deferred tax assets if it is determinedtop executive talent, we believe that it is more likely than notimportant that our base salary be competitive, generally falling within the full deferred tax asset would not be realized. If it is subsequently determined that a deferred tax asset will more likely than not be realized, a credit to earnings is recorded to reducemedian of our industry peers.
Base salaries are reviewed annually and adjustments are influenced by our performance in the allowance.
ASC Topic 740, Income Taxes (“ASC 740”) clarifies a company’s accounting for uncertain income tax positions that are recognized in its financial statements and also provides guidance on a company’s de-recognition of uncertain positions, financial statement classification, accounting for interest and penalties, accounting for interim periods, and disclosure requirements. In accordance with ASC 740, the Company will recognize the benefit from a tax position only if it is more likely than not that the position would be sustained upon audit based solely on the technical merits of the tax position. The Company’s policy is to recognize accrued interest and penalties related to unrecognized tax benefits as income tax expense in its Consolidated Statement of Operations. The Company has not accrued or paid interest or penalties which were material to its results of operations forprevious fiscal 2016, fiscal 2015 and fiscal 2014.
The Company is subject to U.S. federal income tax as well as income tax of multiple state and foreign jurisdictions. The Company has concluded all U.S. federal income tax matters for years through fiscal 2001, with remaining fiscal years subject to income tax examination by federal tax authorities.
Net Loss Per Share
Basic earnings per share are computed by dividing net income (loss) by the weighted average number of shares of common stock outstanding during the respective period. Diluted earnings per share is determined by giving effect to unvested shares of restricted stockyear and the exercise of stock options using the treasury stock method.executive’s contribution to that performance. The following table provides a reconciliation of the number of shares outstanding for basic and diluted earnings per share:
|
| FISCAL YEARS ENDED |
| |||||||||
|
| January 28, 2017 |
|
| January 30, 2016 |
|
| January 31, 2015 |
| |||
(in thousands) |
|
|
|
|
|
|
|
|
|
|
|
|
Common stock outstanding: |
|
|
|
|
|
|
|
|
|
|
|
|
Basic weighted average common shares outstanding |
|
| 49,544 |
|
|
| 49,089 |
|
|
| 48,740 |
|
Common stock equivalents – stock options, restricted stock and restricted stock units (RSUs) (1) |
|
| — |
|
|
| — |
|
|
| — |
|
Diluted weighted average common shares outstanding |
|
| 49,544 |
|
|
| 49,089 |
|
|
| 48,740 |
|
|
|
The following potential common stock equivalents were excluded from the computation of diluted earnings per share in each year because the exercise price of such options was greater than the average market price per share of common stock for the respective periods or because the unearned compensation associated with either stock options, RSUs, restricted or deferred stock had an anti-dilutive effect.
|
| FISCAL YEARS ENDED |
| |||||||||
|
| January 28, 2017 |
|
| January 30, 2016 |
|
| January 31, 2015 |
| |||
(in thousands, except exercise prices) |
|
|
|
|
|
|
|
|
|
|
|
|
Stock options (time-vested) |
|
| 1,162 |
|
|
| 1,244 |
|
|
| 1,545 |
|
RSUs (time-vested) |
|
| 370 |
|
|
| — |
|
|
| — |
|
Restricted and Deferred stock |
|
| 8 |
|
|
| 22 |
|
|
| — |
|
Range of exercise prices of such options |
| $4.49-$7.52 |
|
| $4.96-$7.52 |
|
| $4.96-$7.52 |
| |||
Excluded from the Company’s computation of basic and diluted earnings per share for fiscal 2016 are 847,998 shares of unvested performance-based restricted stock and 1,059,941 performance-based stock options. The respectiveexecutive’s performance targets for these unvested shares of performance-based restricted stock and stock options were not met in fiscal 2016. Therefore, subsequent to year-end, upon completion of the audited financial statements, all of these performance-based awards were cancelled.
In addition, 8,334 shares of unvested time-based restricted shares and 64,876 shares of deferred stock are excluded from the computation of basic earnings per share until such shares vest.
Although the shares of time-based and performance-based restricted stock are not considered outstanding or common stock equivalents for earnings per share purposes until certain vesting and performance thresholds are achieved, all 856,332 shares of restricted stock are considered issued and outstanding at January 28, 2017. Each share of restricted stock has all of the rights of a holder of the Company’s common stock,is measured by various factors, including, but not limited to, achievement of specific individual and department goals. Additionally, adjustments may consider an individual’s promotion that may have occurred during the right to votefiscal year, and the right to receive dividends, which rights are forfeited if the restricted stock is forfeited. Outstanding shares of deferred stock of 64,876 shares are not considered issued and outstanding until the vesting date of the deferral period.
Stock-based Compensation
ASC Topic 718, Compensation – Stock Compensation, requires measurement of compensation cost for all stock awards at fair value on date of grant and recognition of compensation over the service period for awards expected to vest. The fair value of stock options is
determined using the Black-Scholes valuation model and requires the input of subjective assumptions. These assumptions include estimating the length of time employees will retain their vested stock options before exercising them (the “expected term”), the estimated volatility of the Company’s common stock price over the expected term and the number of options that will ultimately not complete their vesting requirements (“forfeitures”). As required under the accounting rules, the Company reviews its valuation assumptions at each grant date and, as a result, is likely to change its valuation assumptions used to value employee stock-based awards granted in future periods. The values derived from using the Black-Scholes model are recognized as expense over the vesting period, net of estimated forfeitures. The estimation of stock awards that will ultimately vest requires judgment. Actual results, and future changes in estimates, may differ from the Company’s current estimates.
The Company recognized total stock-based compensation expense, with no tax effect, of $1.3 million, $2.2 million and $3.0 million for fiscal 2016, fiscal 2015 and fiscal 2014, respectively.
The total stock-based compensation cost related to time-vested awards not yet recognized as of January 28, 2017 is approximately $1.2 million which will be expensed over a weighted average remaining life of approximately 20 months.
The total grant-date fair value of options vested was $2.9 million, $1.0 million and $1.2 million for fiscal 2016, 2015 and 2014, respectively.
The cumulative compensation cost of stock-based awards is treated as a temporary difference for stock-based awards that are deductible for tax purposes. If a deduction reported on a tax return exceeds the cumulative compensation cost for those awards, any resulting realized tax benefit that exceeds the previously recognized deferred tax asset for those awards (the excess tax benefit) is recognized as additional paid-in capital. If the amount deductible is less than the cumulative compensation cost recognized for financial reporting purposes, the write-off of a deferred tax asset related to that deficiency, net of the related valuation allowance, if any, is first offset to the extent of any remaining additional paid-in capital from excess tax benefits from previous awards with the remainder recognized through income tax expense.
Valuation Assumptions for Stock Options
The fair value of each option grant is estimated on the date of grant using the Black-Scholes option-pricing model with the following weighted-average assumptions used for grants in fiscal 2016, 2015 and 2014:
Fiscal years ended: |
| January 28, 2017 |
|
| January 30, 2016 |
|
| January 31, 2015 |
| |||
Expected volatility |
| 39.3%-42.7% |
|
| 37.0%-39.0% |
|
| 46.0% |
| |||
Risk-free interest rate |
| 0.78%-1.23% |
|
| 0.75%-1.25% |
|
| 0.79%-0.95% |
| |||
Expected life (in years) |
| 2.0 |
|
| 1.8-4.0 |
|
| 2.6-3.5 |
| |||
Dividend rate |
|
| — |
|
|
| — |
|
|
| — |
|
Weighted average fair value of options granted |
| $1.02 |
|
| $1.44 |
|
| $1.71 |
| |||
Expected volatilities are based on historical volatilities of the Company’s common stock; the expected life represents the weighted average period of time that options granted are expected to be outstanding giving consideration to vesting schedules and historical exercise patterns; and the risk-free rate is based on the U.S. Treasury yield curve in effect at the time of grant for periods corresponding with the expected life of the option.
Impairment of Long-Lived Assets
The Company reviews its long-lived assets for events or changes in circumstances that might indicate the carrying amount of the assets may not be recoverable. The Company assesses the recoverability of the assets by determining whether the carrying value of such assets over their respective remaining lives can be recovered through projected undiscounted future cash flows. The amount of impairment, if any, is measured based on projected discounted future cash flows using a discount rate reflecting the Company’s average cost of funds.
For fiscal 2016 and fiscal 2014, the Company recorded impairment charges of $0.4 million and $0.3 million, respectively, for the write-down of property and equipment. Impairment charges related to stores where the carrying value exceeded fair value. The fair value of these assets, based on Level 3 inputs, was determined using estimated discounted cash flows. The impairment charges were included in Depreciation and Amortization on the Consolidated Statement of Operations for fiscal 2014 and fiscal 2016. There was no material impairment of assets in fiscal 2015.
Unredeemed Gift Cards, Gift Certificates, and Credit Vouchers
Upon issuance of a gift card, gift certificate, or credit voucher, a liability is established for its cash value. The liability is relieved and net sales are recorded upon redemption by the customer. Based on our historical redemption patterns, we can reasonably estimate the amount of gift cards, gift certificates, and credit vouchers for which redemption is remote, which is referred to as "breakage." Breakage is recognized over two years in proportion to historical redemption trends and is recorded as net salesmodifications in the Consolidated Statementsindividual's level of Operations. The gift card liability, net of breakage, was $2.4 million at both January 28, 2017responsibility.
As mentioned above, the Compensation Committee reviews our CEO’s overall compensation and January 30, 2016.
Recent Accounting Pronouncements
The Company has reviewed accounting pronouncements and interpretations thereof that have effective dates duringexpects the periods reported and in future periods. The Company believes that the following impending standards may have an impact on its future filings. The applicability of any standard will be evaluated by the Company and is still subjectCEO’s base salary to review by the Company.
In May 2014, the FASB issued ASU 2014-09, “Revenue from Contracts with Customers,” which supersedes the revenue recognition requirements in ASC 605, “Revenue Recognition,” as well as various other sections of the ASC, such as, but not limited to, ASC 340-20, “Other Assets and Deferred Costs - Capitalized Advertising Costs”. The core principle of ASU 2014-09 is that an entity should recognize revenuefall in a way that depicts the transfer of promised goods or services to customers in an amount that reflects the consideration to which the entity expects to be entitled in exchange for those goods or services. ASU 2014-09 will be effective for fiscal years, and interim periods within those years, beginning after December 15, 2017, and is to be applied either retrospectively to each prior reporting period presented or with the cumulative effect recognized at the date of initial adoption as an adjustment to the opening balance of retained earnings (or other appropriate components of equity or net assets on the balance sheet). Early adoption is permitted after December 15, 2016. The Company expects to adopt ASU 2014-09 in the first quarter of fiscal 2018 and will not adopt early. The Company has not yet selected a transition method or completed its assessment of the effect that ASU 2014-09 will have on its Consolidated Financial Statements.
In July 2015, the FASB issued ASU 2015-11, "Inventory (Topic 330): Simplifying the Measurement of Inventory," which applies to inventory that is measured using first-in, first-out ("FIFO") or average cost. Under the updated guidance, an entity should measure inventoryrange that is within scope at the lowerpeer median, with approximately one-third of cost and net realizable value, which is the estimated selling pricehis total direct compensation to be in the ordinary courseform of business, less reasonably predictable costsbase salary. In making base salary decisions for our other Named Executive Officers, our CEO, working with our Senior Vice President of completion, disposalHuman Resources, relies on published industry compensation surveys and transportation. This ASUtargets the market median range. Any recommended change in the base salary of our other Named Executives Officers is effective for annualsubject to the review and interim periods beginning after December 15, 2016, and should be applied prospectively with early adoption permitted at the beginning of an interim or annual reporting period. The Company does not expect the adoption of this pronouncement to have a material impact on its Consolidated Financial Statements.
In February 2016, the FASB issued ASU 2016-02, “Leases (Topic 842),” which will require an entity to recognize lease assets and lease liabilities on its balance sheet and will increase disclosure requirements on its leasing arrangements. The ASU is effective for annual periods beginning after December 15, 2018, and interim periods therein. Early adoption is permitted. In the financial statements in which the ASU is first applied, leases shall be measured and recognized at the beginningapproval of the earliest comparative period presented with an adjustment to equity. WhileCompensation Committee.
Mr. Levin’s total direct compensation was most recently reviewed by Sibson Consulting in May 2014, at which time the Company is still evaluating the impact this pronouncement will have on its Consolidated Financial Statements, the Company expects the adoption of this pronouncement will have a material impact on its Consolidated Financial Statements.
InMarch 2016, the FASB issued ASU2016-04, “Liabilities—Extinguishments of Liabilities: Recognition of Breakage for Certain Prepaid Stored-Value Products,” which amends exempting gift cards and other prepaid stored-value products from the guidance on extinguishing financial liabilities. Rather, they will be subject to breakage accounting consistent with the new revenue guidance in Topic 606. However, the exemption only applies to breakage liabilitiesCompensation Committee determined no adjustments were needed. The Compensation Committee believes that are not subject to unclaimed property laws or that are attached to segregated bank accounts (e.g., consumer debit cards). The ASU is effective for fiscal years beginning after December 15, 2017, and interim periods within those fiscal years. Early adoption is permitted. The Company does not expect the adoption of this pronouncement to have a material impact on its Consolidated Financial Statements.
In March 2016, the FASB issued ASU 2016-09, “Compensation - Stock Compensation (Topic 718) - Improvements to Employee Share-Based Payment Accounting,” which simplifies several aspects of the accounting for share-based payment transactions, including the income tax consequences, classification of awards, and classification on the statement of cash flows. The standard is effective for fiscal years beginning after December 15, 2016, including interim periods within those fiscal years. The Company does not expect that the adoption of this pronouncement will have a material impact on its Consolidated Financial Statements.
In August 2016, the FASB issued ASU 2016-15, “Statement of Cash Flows (Topic 230): Classification of Certain Cash Receipts and Cash Payments,” which reduces the existing diversity in practice in how certain cash receipts and cash payments are presented and classified in the statement of cash flows under Topic 230. The ASU is effective for fiscal years beginning after December 15, 2017,
and interim periods within those fiscal years. The Company does not expect the adoption of this pronouncement to have a material impact on its Consolidated Financial Statements.
In October 2016, the FASB issued ASU 2016-16, “Income Taxes (Topic 740): Intra-Entity Transfer of Assets Other Than Inventory,” which reduces the existing diversity in practice in how income tax consequences of an intra-entity transfer of an asset other than inventory should be recognized. The amendments in ASU 2016-16 require an entity to recognize such income tax consequences when the intra-entity transfer occurs rather than waiting until such time as the asset has been sold to an outside party. The ASU is effective for fiscal years beginning after December 15, 2017, and interim periods within those fiscal years. The Company does not expect the adoption of this pronouncement to have a material impact on its Consolidated Financial Statements.
No other new accounting pronouncements, issued or effective during fiscal 2016, have had or are expected to have a significant impact on the Company’s Consolidated Financial Statements.
B. PROPERTY AND EQUIPMENT
Property and equipment consisted of the following at the dates indicated:
(in thousands) |
| January 28, 2017 |
|
| January 30, 2016 |
| ||
Furniture and fixtures |
| $ | 72,440 |
|
| $ | 67,683 |
|
Equipment |
|
| 20,453 |
|
|
| 18,495 |
|
Leasehold improvements |
|
| 107,470 |
|
|
| 94,767 |
|
Hardware and software |
|
| 76,923 |
|
|
| 70,393 |
|
Construction in progress |
|
| 9,892 |
|
|
| 10,516 |
|
|
|
| 287,178 |
|
|
| 261,854 |
|
Less: accumulated depreciation |
|
| 162,831 |
|
|
| 136,892 |
|
Total property and equipment |
| $ | 124,347 |
|
| $ | 124,962 |
|
Depreciation expense related to continuing operations for fiscal 2016, 2015 and 2014 was $30.2 million, $27.7 million and $22.9 million, respectively.
C. DEBT OBLIGATIONS
Credit Agreement with Bank of America, N.A.
On October 30, 2014, the Company amended its credit facility with Bank of America, N.A., effective October 29, 2014, by executing the Second Amendment to the Sixth Amended and Restated Loan and Security Agreement (as amended, the “Credit Facility”).
The Credit Facility provides for $125 million in committed borrowings. The Credit Facility includes, pursuant to an accordion feature, the ability to increase the Credit Facility by an additional $50 million upon the request of the Company and the agreement of the lender(s) participating in the increase. The Credit Facility includes a sublimit of $20 million for commercial and standby letters of credit and a sublimit of up to $15 million for swingline loans. The Company’s ability to borrow under the Credit Facility is determined using an availability formula based on eligible assets. The maturity date of the Credit Facility is October 29, 2019. The Company’s obligations under the Credit Facility are secured by a lien on substantially all of its assets, excluding (i) a first priority lien held by the lenders of the Term Loan Facility, as described below, on certain equipment of the Company and (ii) intellectual property.
At January 28, 2017, the Company had outstanding borrowings under the Credit Facility of $44.4 million, before unamortized debt issuance costs of $0.3 million. Outstanding standby letters of credit were $2.9 million and documentary letters of credit were $0.5 million. Unused excess availability at January 28, 2017 was $57.1 million. Average monthly borrowings outstanding under the Credit Facility during fiscal 2016 were $52.1 million, resulting in an average unused excess availability of approximately $57.8 million. The Company’s ability to borrow under the Credit Facility is determined using an availability formula based on eligible assets, with increased advance rates based on seasonality. Pursuant to the terms of the Credit Facility, if the Company’s excess availability under the Credit Facility failsMr. Levin’s salary continues to be equal to or greater than the greater of (i) 10% of the Loan Cap (defined in the Credit Facility as the lesser of the revolving credit commitments at such time or the borrowing base at the relevant measurement time)competitive and (ii) $7.5 million, the Company will be required to maintain a minimum consolidated fixed charge coverage ratio of 1.0:1.0 in order to pursue certain transactions, including but not limited to, stock repurchases, payment of dividends and business acquisitions.
Borrowings made pursuant to the Credit Facility will bear interest at a rate equal to the base rate (determined as the highest of (a) Bank of America N.A.’s prime rate, (b) the Federal Funds rate plus 0.50% or (c) the annual ICE-LIBOR rate (“LIBOR”) for the
respective interest period) plus a varying percentage, based on the Company’s borrowing base, of 0.50%-0.75% for prime-based borrowings and 1.50%-1.75% for LIBOR-based borrowings. The Company is also subject to an unused line fee of 0.25%. At January 28, 2017, the Company’s prime-based interest rate was 4.25%.
At January 28, 2017, the Company had approximately $36.0 million of its outstanding borrowings in a LIBOR-based contract with an interest rate of approximately 2.22%. The LIBOR-based contract expired January 31, 2017. When a LIBOR-based borrowing expires, the borrowings revert back to prime-based borrowings unless the Company enters into a new LIBOR-based borrowing arrangement.
The fair value of the amount outstanding under the Credit Facility at January 28, 2017 approximated the carrying value.
Long-Term Debt
Components of long-term debt are as follows:
(in thousands) |
| January 28, 2017 |
|
| January 30, 2016 |
| ||
Equipment financing notes |
| $ | 6,589 |
|
| $ | 12,901 |
|
Term loan, due 2019 |
|
| 12,750 |
|
|
| 13,750 |
|
Less: unamortized debt issuance costs |
|
| (337 | ) |
|
| (493 | ) |
Total long-term debt |
|
| 19,002 |
|
|
| 26,158 |
|
Less: current portion of long-term debt |
|
| 6,941 |
|
|
| 7,155 |
|
Long-term debt, net of current portion |
| $ | 12,061 |
|
| $ | 19,003 |
|
Equipment Financing Loans
Pursuant to a Master Loan and Security Agreement with Banc of America Leasing & Capital, LLC, dated July 20, 2007 and amended September 30, 2013 (the “Master Agreement”), the Company has entered into twelve equipment security notes (in aggregate, the “Notes”). The Company borrowed an aggregate of $26.4 million between September 2013 and June 2014. The Notes are for a term of 48 months and accrue interest at fixed rates ranging from 3.07% and 3.50%. Principal and interest are paid monthly, in arrears.
The Notes are secured by a security interest in all of the Company’s rights, title and interest in and to certain equipment. The Company was subject to prepayment penalties through the second anniversary of each of the Notes. The Company is no longer subject to any prepayment penalties. The Master Agreement includes default provisions that are customary for financings of this type and are similar and no more restrictive than the Company’s existing Credit Facility.
Term Loan
On October 30, 2014, the Company entered into a term loan agreement with respect to a new $15 million senior secured term loan facility with Wells Fargo Bank, National Association as administrative and collateral agent (the “Term Loan Facility”). The effective date of the Term Loan Facility was October 29, 2014 (the “Effective Date”). The proceeds from the Term Loan Facility were used to repay borrowings under the Credit Facility.
The Term Loan Facility bears interest at a rate per annum equal to the greater of (a) 1.00% and (b) the one month LIBOR rate, plus 6.50%. Interest payments are payable on the first business day of each calendar month, and increase by 2% following the occurrence and during the continuance of an “event of default,” as defined in the Term Loan Facility. The Term Loan Facility provides for quarterly principal payments on the first business day of each calendar quarter, which commenced the first business day of January 2015, in an aggregate principal amount equal to $250,000, subject to adjustment, with the balance payable on the termination date.
The Term Loan Facility includes usual and customary mandatory prepayment provisions for transactions of this type that are triggered by the occurrence of certain events. In addition, the amounts advanced under the Term Loan Facility can be optionally prepaid in whole or part. All prepayments are subject to an early termination fee in the amount of 1% of the amount prepaid prior to October 29, 2017. There is no prepayment penalty after October 29, 2017.
The Term Loan Facility matures on October 29, 2019. It is secured by a first priority lien on certain equipment of the Company, and a second priority lien on substantially all of the remaining assets of the Company, excluding intellectual property.
Annual maturities of long-term debt for the next five fiscal years are as follows:
|
| (in thousands) |
| |
Fiscal 2017 |
| $ | 7,088 |
|
Fiscal 2018 |
|
| 1,501 |
|
Fiscal 2019 |
|
| 10,750 |
|
Fiscal 2020 |
|
| — |
|
Fiscal 2021 |
|
| — |
|
|
|
|
|
|
The Company paid interest and fees totaling $2.8 million, $2.8 million and $2.7 million for fiscal 2016, 2015 and 2014, respectively.
D. INCOME TAXES
The Company accounts for income taxes in accordance with ASC Topic 740, Income Taxes. Under ASC Topic 740, deferred tax assets and liabilities are recognized based on temporary differences between the financial statement and tax basis of assets and liabilities using enacted tax rates in effect in the years in which the differences are expected to reverse. The accounting regulation requires current recognition of net deferred tax assets to the extent it is more likely than not such net assets will be realized. To the extent that the Company believes its net deferred tax assets will not be realized, a valuation allowance must be recorded against those assets.
Since the fourth quarter of fiscal 2013, the Company has maintained a valuation allowance against its deferred tax assets. While the Company has projected it will return to profitability, generate taxable income and ultimately emerge from a three-year cumulative loss, based on operating results for fiscal 2016 and the Company’s forecast for fiscal 2017, the Company believes that a full allowance remains appropriate at this time. Realization of the Company’s deferred tax assets, which relate principally to federal net operating loss carryforwards, which expire from 2022 through 2036, is dependent on generating sufficient taxable income in the near term.
As of January 28, 2017, the Company had net operating loss carryforwards of $141.2 million for federal income tax purposes and $84.3 million for state income tax purposes that are available to offset future taxable income through fiscal year 2036. The Company has alternative minimum tax credit carryforwards of $2.3 million, which are available to further reduce income taxes over an indefinite period. Additionally, the Company has $0.1 million and $2.2 million of net operating loss carryforwards related to the Company’s operations in the Hong Kong and Canada, respectively, though both are expected to expire largely unutilized.
The utilization of net operating loss carryforwards and the realization of tax benefits in future years depends predominantly upon having taxable income. Under the provisions of the Internal Revenue Code, certain substantial changes in the Company’s ownership may result in a limitation on the amount of net operating loss carryforwards and tax credit carryforwards which may be used in future years.
Included in the net operating loss carryforwards for both federal and state income tax is approximately $13.3 million relating to stock compensation deductions, the tax benefit from which, if realized, will be credited to additional paid-in capital.
The components of the net deferred tax assets as of January 28, 2017 and January 30, 2016 are as follows (in thousands):
|
| January 28, 2017 |
|
| January 30, 2016 |
| ||
|
|
|
|
|
|
|
|
|
Deferred tax assets: |
|
|
|
|
|
|
|
|
Net operating loss carryforward |
| $ | 50,399 |
|
| $ | 50,199 |
|
Gain on sale-leaseback |
|
| 5,170 |
|
|
| 5,744 |
|
Accrued Expenses and other |
|
| 4,340 |
|
|
| 5,667 |
|
Lease accruals |
|
| 4,358 |
|
|
| 4,732 |
|
Goodwill and intangibles |
|
| 1,513 |
|
|
| 3,694 |
|
Unrecognized loss on pension and pension expense |
|
| 3,311 |
|
|
| 3,379 |
|
Capital loss carryforward |
|
| 3,021 |
|
|
| 3,021 |
|
Inventory reserves |
|
| 2,659 |
|
|
| 2,561 |
|
Alternative minimum tax credit carryforward |
|
| 2,292 |
|
|
| 2,292 |
|
Foreign tax credit carryforward |
|
| 901 |
|
|
| 963 |
|
Federal wage tax credit carryforward |
|
| 707 |
|
|
| 521 |
|
Unrecognized loss on foreign exchange |
|
| 328 |
|
|
| 234 |
|
State tax credits |
|
| 124 |
|
|
| 102 |
|
Excess of tax over book depreciation/amortization |
|
| (15,192 | ) |
|
| (19,977 | ) |
Subtotal |
| $ | 63,931 |
|
| $ | 63,132 |
|
Valuation allowance (1) |
|
| (63,931 | ) |
|
| (63,132 | ) |
Net deferred tax assets |
| $ | — |
|
| $ | — |
|
|
|
|
|
|
|
|
|
|
Deferred tax liabilities: |
|
|
|
|
|
|
|
|
Goodwill and intangibles |
| $ | (222 | ) |
| $ | (196 | ) |
Deferred tax liabilities |
| $ | (222 | ) |
| $ | (196 | ) |
|
|
The provision for income taxes from continuing operations consists of the following:
|
| FISCAL YEARS ENDED |
| |||||||||
|
| January 28, 2017 |
|
| January 30, 2016 |
|
| January 31, 2015 |
| |||
|
|
|
|
|
|
|
|
|
|
|
|
|
(in thousands) |
|
|
|
|
|
|
|
|
|
|
|
|
Current: |
|
|
|
|
|
|
|
|
|
|
|
|
Federal and state |
| $ | 91 |
|
| $ | 104 |
|
| $ | 97 |
|
Foreign |
|
| 49 |
|
|
| 51 |
|
|
| 55 |
|
|
|
| 140 |
|
|
| 155 |
|
|
| 152 |
|
Deferred: |
|
|
|
|
|
|
|
|
|
|
|
|
Federal and state |
|
| 23 |
|
|
| 94 |
|
|
| 91 |
|
Foreign |
|
| 3 |
|
|
| 11 |
|
|
| — |
|
|
|
| 26 |
|
|
| 105 |
|
|
| 91 |
|
|
|
|
|
|
|
|
|
|
|
|
|
|
Total provision (2) |
| $ | 166 |
|
| $ | 260 |
|
| $ | 243 |
|
|
|
The following is a reconciliation between the statutory and effective income tax rates in dollars for the provision for income tax from continuing operations:
|
| FISCAL YEARS ENDED |
| |||||||||
|
| January 28, 2017 |
|
| January 30, 2016 |
|
| January 31, 2015 |
| |||
|
|
|
|
|
|
|
|
|
|
|
|
|
(in thousands) |
|
|
|
|
|
|
|
|
|
|
|
|
Federal income tax at the statutory rate |
| $ | (732 | ) |
| $ | (2,852 | ) |
| $ | (3,827 | ) |
State income and other taxes, net of federal tax benefit |
|
| (1 | ) |
|
| (177 | ) |
|
| (72 | ) |
Permanent items |
|
| 225 |
|
|
| 137 |
|
|
| 141 |
|
Change in uncertain tax provisions |
|
| — |
|
|
| — |
|
|
| — |
|
Charge for valuation allowance |
|
| 775 |
|
|
| 3,200 |
|
|
| 4,034 |
|
Other, net |
|
| (101 | ) |
|
| (48 | ) |
|
| (33 | ) |
Provision for income tax from continuing operations |
| $ | 166 |
|
| $ | 260 |
|
| $ | 243 |
|
As discussed in Note A, the Company’s financial statements reflect the expected future tax consequences of uncertain tax positions that the Company has taken or expects to take on a tax return, based solely on the technical merits of the tax position. The liability for unrecognized tax benefits at January 28, 2017 and January 30, 2016 was approximately $3.1 million, and is associated with a prior tax position related to exiting the Company’s direct business in Europe during fiscal 2013. The amount of unrecognized tax benefits has been presented as a reduction in the reported amounts ofwithin our federal and state net operating losses (“NOL”) carryforwards. No penalties or interest have been accrued on this liability because the carryforwards have not yet been utilized. The reversal of this liability would result in a tax benefit being recognized in the period in which the Company determines the liability is no longer necessary.
The Company made tax payments of $0.1 million, $0.1 million and $0.1 million for fiscal 2016, 2015 and 2014, respectively.
E. COMMITMENTS AND CONTINGENCIES
At January 28, 2017, the Company was obligated under operating leases covering store and office space, automobiles and certain equipment for future minimum rentals, merchandise purchase obligations and a non-merchandise purchase agreement as follows:
|
| Total |
| |
FISCAL YEAR |
| (in millions) |
| |
Fiscal 2017 |
| $ | 69.4 |
|
Fiscal 2018 |
|
| 62.9 |
|
Fiscal 2019 |
|
| 57.6 |
|
Fiscal 2020 |
|
| 43.2 |
|
Fiscal 2021 |
|
| 41.3 |
|
Thereafter |
|
| 121.0 |
|
|
| $ | 395.4 |
|
In addition to future minimum rental payments, many of the store leases include provisions for common area maintenance, mall charges, escalation clauses and additional rents based on a percentage of store sales above designated levels. The store leases are generally 5 to 10 years in length and contain renewal options extending their terms by 5 to 10 years.
Amounts charged to operations for all occupancy costs, automobile and leased equipment expense were $63.9 million, $62.0 million and $56.8 million for fiscal 2016, fiscal 2015 and fiscal 2014, respectively.
In fiscal 2006, as part of a sale-leaseback transaction with a subsidiary of Spirit Finance Corp. (“Spirit”), the Company entered into a twenty-year lease agreement (the “Lease Agreement”) for its corporate headquarters and distribution center whereby the Company agreed to lease the property it sold to Spirit back for an annual rent of $4.6 million. The Company realized a gain of approximately $29.3 million on the sale of this property, which has been deferred and is being amortized over the initial 20 years of the related lease agreement. At the end of the initial term, the Company will have the opportunity to extend the Lease Agreement for six additional successive periods of five years. In addition, on February 1, 2011, the fifth anniversary of the Lease Agreement and for every fifth anniversary thereafter, the base rent will be subject to a rent increase not to exceed the lesser of 7% or a percentage based on changes in the Consumer Price Index. The Company’s current annual rent of $5.2 million will be offset each lease year by $1.5 million related to the amortization of this deferred gain. This lease commitment, excluding the impact of the gain, is included in the above table of expected future minimum rentals obligations.
Included in the table above, is a merchandise purchase obligation for which the Company is contractually committed to meet minimum purchases of $10.5 million in fiscal 2017, $11.0 million in fiscal 2018 and $11.5 million in fiscal 2019.
F. LONG-TERM INCENTIVE PLANSpeer median.
The following is a summary of each Named Executive Officer’s base salary, as of each fiscal year’s annual review:
Fiscal 2017 |
| Fiscal 2016 |
| % change |
| ||||
David A. Levin (1) | $ | 811,200 |
| $ | 811,200 |
| - |
| |
Peter H. Stratton, Jr. (2) | $ | 370,000 |
| $ | 355,000 |
|
| 4% |
|
Kenneth M. Ederle | $ | 390,000 |
| $ | 390,000 |
| - |
| |
Robert S. Molloy | $ | 345,000 |
| $ | 345,000 |
| - |
| |
Brian S. Reaves | $ | 300,000 |
| $ | 300,000 |
| - |
| |
(1) | Mr. Levin has not received an increase in base salary since fiscal 2010. Any increase in total direct or realized compensation has resulted from performance-based incentive programs. |
(2) | Mr. Stratton received a salary adjustment of 4% for fiscal 2017 to align his base salary within the 50th percentile of our peer group. |
The Compensation Committee believes that a substantial portion of each Named Executive Officer’s compensation should tie directly to our Company’s financial performance. Our AIP provides for an annual performance-based cash incentive opportunity for all executives as well as select non-executive employees. The Compensation Committee believes that an executive’s annual compensation package should include a cash incentive component to provide an additional incentive for the executive to help the Company achieve its annual financial goals, which ultimately benefits our stockholders.
Mr. Levin’s participation in the annual incentive plan is at 100% of his annual salary, whereas our other Named Executive Officers participate at 40% of their respective salaries.
2016 AIP
The metrics for achievement under our 2016 AIP reflected the Company’s primary financial goals of increasing top line revenues while protecting merchandise margin and managing expenses. In addition, sales per square foot and comparable sales from our DXL stores were determined to be key metrics for our long-term profitability.
Our established targets for achieving a payout under the 2016 AIP show the rigor of our incentive compensation plans. All equity awards granted underOur sales target of $469.1 million represented an increase of 6.1% from actual sales in fiscal 2015 of $442.2 million, and our EBITDA target of $33.5 million represented a 43.8% increase over actual EBITDA in fiscal 2015.
The 2016 AIP targets approved by the Compensation Committee and actual results against these long-term incentive planstargets are as follows:
2016 Annual Incentive Plan
|
| Metric |
| Award % |
| Minimum/Maximum Potential Payout |
| 2016 Target | 2016 Actual | Payout % |
Target 1 |
| Sales |
| 25.0% |
| 100% payout at set target, with 50% payout at 98.1% of set target and 150% payout at 101.9%.
|
| $469.1 million | $450.3 million | — |
Target 2 |
| EBITDA |
| 30.0% |
| 100% payout out at set target, with 50% payout at 91.0% of set target and 150% payout at 108.9%.
|
| $33.5 million | $31.6 million | 68.3% |
Target 3 |
| Merchandise Margin |
| 15.0% |
| Target must be achieved for a minimum payout of 100%, with 125% payout at 102.7% of target and 150% of payout at 105% of target.
|
| ** | 60 basis points above minimum | 112.1% |
Target 4 |
| DXL Comparable Sales |
| 15.0% |
| 100% payout at set target, with 50% payout at 76.5% of target and 150% of payout at 123.5% of target.
|
| 7.7% | 2.4% | — |
Target 5 |
| DXL Sales per Square Foot |
| 15.0% |
| 100% payout at set target, with 50% payout at 97.7% of target and 150% of payout at 102.3%. |
| $188 | $180 | — |
** Merchandise margin is a component of gross margin, net of occupancy costs and is not disclosed because we believe it would be a competitive disadvantage to disclose.
These targets were issuedderived from the Company’s 2006operating plan for fiscal 2016 and the Compensation Committee believed that it was possible, within an approximate 50% probability, to meet or exceed each of the targets. As a result of achieving some of the performance targets for fiscal 2016, as shown above, on March 31, 2017 the Compensation Committee approved a cash bonus payout of 37.3% under the 2016 AIP and the total cash award paid to 110 participants was approximately $1.6 million, with $607,462 of that amount being paid to the Named Executive Officers (including the payments made as severance to the two former executives). For comparison purposes, the following is the actual amounts earned by our Named Executive Officers under our 2016 AIP and 2015 AIP:
Named Executive Officer |
| Fiscal 2016 Actual Payout |
|
| Fiscal 2015 Actual Payout |
| ||
David A. Levin |
| $ | 302,578 |
|
| $ | 1,012,378 |
|
Peter H. Stratton, Jr. |
| $ | 50,154 |
|
| $ | 142,272 |
|
Kenneth M. Ederle |
| $ | 58,188 |
|
| $ | 190,848 |
|
Robert S. Molloy |
| $ | 51,072 |
|
| $ | 167,232 |
|
Brian S. Reaves |
| $ | 44,760 |
|
| $ | 149,760 |
|
Derrick Walker (1) |
| $ | 44,760 |
|
| $ | 149,760 |
|
Nancy S. Youssef (1) |
| $ | 55,950 |
|
| $ | - |
|
(1) | Mr. Walker and Ms. Youssef’s employments terminated on January 20, 2017; however, they received the amounts they would have earned under the 2016 AIP as part of their severance. |
2017 AIP
For fiscal 2017, we modified the metrics for achievement under the 2017 AIP to mirror our primary objectives of growing our customer base through a revitalized marketing program and maintaining a strong liquidity position by continuing to improve cash flow. With a substantial number of DXL stores now open, a key area of focus for fiscal 2017 is the growth of our direct business, which has remained relatively constant over the past few years. In addition, customer acquisition and customer retention are a key objective for fiscal 2017, which, if successful, will also drive sales and EBITDA. Lastly, in fiscal 2016, we began an inventory optimization project, which has helped us reduce inventory levels and, as it continues into fiscal 2017, we expect to result in improved Free Cash Flow. With these key objectives in mind, we added direct comparable sales, customer counts and free cash flow as metrics to the 2017 AIP to reward performance on these 2017 goals, but we believe will also benefit long-term growth.
The 2017 AIP financial targets and metrics approved by the Compensation Committee are as follows:
2017 Annual Incentive Plan
Metric | Award % | Minimum/Maximum Potential Payout | ||||
Target 1 | Sales | 20.0% | 100% payout at set target, with 50% payout at 98.9% of set target and 150% payout at 102.1% of target | |||
Target 2 | Adjusted EBITDA | 20.0% | 100% payout at set target, with 50% payout at 88.9% of set target and 150% payout at 111.1% of target | |||
Target 3 | Merchandise Margin | 20.0% | Target must be achieved for a minimum payout of 100%, with 125% payout at 102.2% of target and 150% of payout at 104.2% of target. | |||
Target 4 | Free Cash Flow | 20.0% | 100% payout at set target, with 50% payout at 85.7% of target and 150% payout at 114.3% of target | |||
Target 5 | Direct comparable sales | 10.0% | 100% payout at set target, with 50% payout at 65.5% of target and 150% payout at 134.5% of target | |||
Target 6 | Customer Counts | 10.0% | 100% payout at set target, with 50% payout at 99.0%% of target and 150% of payout at 101.0% of target |
The Compensation Plan until July 31, 2016Committee believes that it is possible to meet or exceed the targets set for fiscal 2017. The established targets are intended to be achievable within an approximate 50% probability as a result of executing our operating plan. The target levels are derived from our annual operating plan and budget for the fiscal year. The operating plan and budget set forth our internal goals and objectives for our growth and development, and we expect that achieving these goals and objectives will require substantial efforts by the entire Company. As a result, the likelihood of achieving the 2017 targets reflects the challenges inherent in achieving the goals and objectives in the operating plan and budget. The Compensation Committee considered the likelihood of achieving the target levels when approving the 2006 Incentivetarget amount, including historical achievement by our executive officers.
Assuming we achieve 100% of the above targets for fiscal 2017, we estimate that the total potential payout under the 2017 AIP would be approximately $4.2 million, of which $1.4 million would be paid to our Named Executive Officers as set forth below, and the remaining amount would be paid to the approximately 107 other participants.
Named Executive Officer |
| Fiscal 2017 Potential Payout at Target |
| |
David A. Levin |
| $ | 811,200 |
|
Peter H. Stratton, Jr. |
| $ | 146,200 |
|
Kenneth M. Ederle |
| $ | 156,000 |
|
Robert S. Molloy |
| $ | 138,000 |
|
Brian S. Reaves |
| $ | 120,000 |
|
Long-term incentive plans
Long-term incentive plans (“LTIPs”) are an important component of our executive compensation program, as they are designed to align the interests of our executives with those of our stockholders to create long-term value and to promote long-term retention of our executives. Since the Company adopted its first LTIP in 2008, the Compensation Plan expired. As of August 4, 2016, allCommittee has not made annual discretionary grants of equity awards are issued under the Company’s stockholder-approved 2016 Incentive Compensation Plan. See Note G, “Stock Compensation Plans.”stock options or other equity-based awards.
2013-2016 Long-Term Incentive Plan (“LTIP”)
The 2013-2016 Long-Term Incentive Plan (the “2013-2016 LTIP”) wasIn 2013, the Compensation Committee approved in the second quarter of fiscal 2013. Pursuant to the terms of the 2013-2016 LTIP, onwhich was designed for the datespecific purpose of grant,retaining and rewarding our executives for the efforts required for the Company to transition to the DXL concept, which was originally expected to be four years. In 2013, each participant was granted an unearned and unvested award equal in value to four times his/hertheir annual salary multiplied by the applicabletheir long-term incentive program percentage, which iswas 100% for the Company’s Chief Executive Officer,CEO and 70% for its senior executives and 50% forour other participants in the plan, which the Company refers to as theNamed Executive Officers (the “Projected Benefit Amount.” Each participant was granted 50%Obligation”). This award consisted of the Projected Benefit Amount in sharesa combination of restricted stock, 25% in stock options and the remaining 25% in cash.
Of the total Projected Benefit Amount,award, 50% is subject to time-based vesting and 50% is subject to performance-based vesting.
The time-vested portion of the award (half of the shares of restricted stock, options and cash) vestsvested in three installments with 20% of the time-vested portion having vested at the end of fiscal 2014, 40% having vested at the end of fiscal 2015 and the remaining 40% vesting at the end of fiscal 2016.
In orderFor the performance-based portion of the award to vest, the Company had to achieve revenue of at least $600 million and an operating margin of not less than 8.0% for the participants to receive 100% vesting of the performance-based awards,portion of the Company must achieve revenue of at least $600 million and have an operating margin of not less than 8.0% in fiscal 2016.Projected Benefit Amount. If the Company did not meet the performance target at the end of fiscal 2016, but the Company was able to achieve revenue equal to or greater than $510 million at the end of fiscal 2016 and the operating margin was not less than 8.0%, then the participants could have receivedwould receive a pro-rata portion of the performance-based award based on minimum sales of $510 million (50% payout) and $600 million (100% payout). Because
The targets for the Company did not achieve minimum salesperformance-based portion of at least $510 million or operating income of at least 8.0%, all unvested performance-basedthe awards were forfeited, subsequentbased on having an estimated 215 to year-end. Because230 DXL stores open by the end of fiscal 2015. At the beginning of fiscal 2014, however, the Board approved a strategic change to slow the timing of the transition, which it expected would improve the Company’s liquidity position during the transition while still achieving a successful rollout, although over a longer time period. In light of the strategic shift and the reduced number of DXL stores expected to be opened during the rollout, it became clear that the performance targets were not considered probable during the termcomponent of the 2013-2016 LTIP would most likely not be achievable. As a result, the participants in the 2013-2016 LTIP would likely have no opportunity to earn any performance-based compensation expensefor four years, during which time we significantly transitioned the Company to the DXL concept.
The Compensation Committee did not want to penalize the participants as a result of this strategic shift. After consultation with Sibson Consulting, in late 2014, the Compensation Committee established a supplemental plan, the “Wrap-Around Plan,” that existed at the same time as the 2013-2016 LTIP, but was recognized throughonly triggered at the end of fiscal 2016. See Note G, “Stock Compensation Plans” for a summary2016 when there was no payout on the performance component of the equity awards.2013-2016 LTIP, as further described below.
The Company incurred total compensation expense (cash and equity) of approximately $9.4 million related to the time-vested awards. The cost was expensed over forty-four months through January 28, 2017, based on the respective vesting dates, of which $1.1 million was incurred in fiscal 2016.
2016 Long-Term Incentive Wrap-Around Plan
On November 7, 2014, the Company’s Compensation Committee of the Company’s Board of Directors approved the 2016 Long-Term IncentiveThe Wrap-Around Plan (the “2016(“2016 Wrap”). The 2016 Wrap was a supplemental, performance-based incentive plan that was onlybecame effective if there was no vestingat the end of fiscal 2016 when the performance-based awardsCompany did not meet the performance targets set forth above in the 2013-2016 LTIP. The performance targets under the 2013-2016 LTIP and, as a result, all performance-based awards under2016 Wrap reflected the 2013-2016 LTIP were forfeited. Company’s forecasted operating results for fiscal 2016 given the revised store roll-out.
Under the 2016 Wrap, if the target level performance metrics for fiscal 2016 were met, participants were eligible to receive a payout equal to 80% of the dollar value of the performance-based compensation that they were eligible to receive under the 2013-2016 LTIP. IfThe following is a summary of the target level performance metrics for fiscal 2016Performance Targets under the 2016 Wrap were exceeded, the greatest payout that participants were eligible to receive was 100% of the dollar value of the performance-based compensation they were eligible to receive under the 2013-2016 LTIP.
Thewith actual performance target under the 2016 Wrap consisted of two metrics, Sales and EBITDA, with threshold (50%), target (80%) and maximum (100%) payout levels. Each metric was weighted as 50% of the total performance target. However, in order for there to be any payout under either metric, EBITDA for fiscal 2016 must be equal to or greater than the minimum threshold.achieved.
The 2016 Wrap provided for an opportunity to receive additional shares of restricted stock if the performance targets were achieved and the Company’s closing stock price was $6.75 or higher on the day earnings for fiscal 2016 are publicly released. If the Company’s stock price was $6.75, the 50% payout in restricted shares would be increased by 20% and if the stock price was $7.25 or higher, the 50% payout in restricted shares would be increased by 30%, with a pro-rata payout between $6.75 and $7.25.
Metrics | Weight of each Metric | Threshold 50% | Target 80% | Maximum 100% | Actual Performance Achieved |
EBITDA | 50% | $32.0 million | $39.7 million | $47.6 million | $32.2 million |
Sales | 50% | $478.2 million | $492.3 million | $506.8 million | $450.3 million |
Based on the operating results for fiscal 2016, the Company achieved 50.6% of its EBITDA target. The minimum threshold for the Sales target was not achieved.achieved but the Company did achieve its EBITDA target at a payout of 50.6%. Accordingly, subsequent to year-end, in the first quarter of fiscal 2017, the Compensation Committee of the Board of Directors approved awards totaling $2.3 million, with a grant date of March 20, 2017. On that date, the Company will grantgranted shares of restricted stock, with a fair value of approximately $1.0 million and cash awards totaling approximately $1.3 million. All awards will vest on the last day of the second quarter of fiscal 2017. At January 28, 2017, $1.9 million
The 2016 Wrap also contained a Share Price Bonus, pursuant to which if the closing price on the date earnings for fiscal 2016 were publicly released were $6.75 or higher, there was a potential to earn a share price bonus of 20% to 30% of the $2.3 million payout was accrued. Based onportion of the Company’s closingaward to be settled in shares of restricted stock. Because the stock price of $3.30 at January 28, 2017, the Company does not expect that there will be any additional grant of shares for achieving a stock price greater thanwas below $6.75 per share aton March 20, 2017, no Share Price Bonus was awarded.
The following table illustrates: (1) the closetotal potential cumulative value to each of businessthe Named Executive Officers over the term of the 2013-2016 LTIP assuming that the Company had been able to achieve the performance targets and, therefore, the 2016 Wrap did not become effective and (2) the actual value of awards earned, based on fair value on the daydate of grant, under the Company’s earnings are publicly released. 2013-2016 LTIP and 2016 Wrap, as a result of the performance targets under the 2016 Wrap being partly achieved:
2016-2017 Long-Term Incentive Plan
| Potential Payout under 2013-2016 LTIP (assuming time-based and performance-based targets are met) |
|
| Actual Awards Earned under 2013-2016 LTIP (time-based) and Wrap-Around Plan (performance-based) |
| ||||||||||||||||||||
Named Executive Officer (1) |
| Value of time-vested awards(cash and equity) |
|
| Value of unearned performance-based awards (cash and equity) |
|
| Total potential payout under 2013-2016 LTIP |
|
| Value of time-vested awards(cash and equity) under 2013-2016 LTIP |
| Value of performance-based awards under 2013-2016 LTIP |
| Value of performance-based awards under the Wrap-Around |
| Total actual payout under 2013-2016 LTIP with Wrap-Around |
| |||||||
David A. Levin |
| $ | 1,622,400 |
|
| $ | 1,622,400 |
|
| $ | 3,244,800 |
|
| $ | 1,622,400 |
| $ | - |
| $ | 410,468 |
| $ | 2,032,868 |
|
Peter H. Stratton, Jr. |
| $ | 280,000 |
|
| $ | 280,000 |
|
| $ | 560,000 |
|
| $ | 280,000 |
| $ | - |
| $ | 70,840 |
| $ | 350,840 |
|
Kenneth M. Ederle |
| $ | 455,000 |
|
| $ | 455,000 |
|
| $ | 910,000 |
|
| $ | 455,000 |
| $ | - |
| $ | 115,116 |
| $ | 570,116 |
|
Robert S. Molloy |
| $ | 455,000 |
|
| $ | 455,000 |
|
| $ | 910,000 |
|
| $ | 455,000 |
| $ | - |
| $ | 115,116 |
| $ | 570,116 |
|
Brian S. Reaves |
| $ | 385,000 |
|
| $ | 385,000 |
|
| $ | 770,000 |
|
| $ | 385,000 |
| $ | - |
| $ | 97,406 |
| $ | 482,406 |
|
(1) | Mr. Walker and Ms. Youssef are not included because they forfeited awards as a result of termination. |
WithNew LTIP
On March 15, 2016, with the 2013-2016 LTIP and 2016 Wrap expiring at the end of fiscal 2016, on March 15, 2016, the Compensation Committee approved the Destination XL Group, Inc. Long-Term Incentive Plan, as amended and restated on February 1, 2017 (the “New LTIP”).
As the Company continues with the DXL concept beyond the initial implementation/roll-out phase, the Compensation Committee has adopted the New LTIP to continue to align the Company with the best practices of similar long-term incentive plans of its peers. The New LTIP will continue to support the Company’s ongoing efforts to attract, retain and develop exceptional talent and enable it to provide incentives directly linked to the Company’s short- and long-term objectives as well as increased shareholder value.
Under the terms of the New LTIP, each year the Compensation Committee will establish performance targets which will cover a two-year performance period (each a “Performance Period”), thereby creating overlapping Performance Periods. Each participant in the plan will be entitled to receive an award based on that participant’s “Target Cash Value” which is defined as the participant’s annual base salary (on the participant’s effective date) multiplied by his or her long-term incentive program percentage, which is 100% for the Company’s Chief Executive Officer,executive officer, 70% for its senior executives and 25% for other participants in the plan. Because of the overlapping two-year Performance Periods,Period, the Target Cash Value for any award is based on one year of annual salary, as opposed to two years, to avoid doubling an award payoutcompensation in any given fiscal year.
For each participant, 50% of the Target Cash Value is subject to time-based vesting and 50% is subject to performance-based vesting. TheIn addition to being subject to forfeiture, the time-vested portion of the award will vestvests in two installments with 50% of the time-vested portion vesting on April 1 following the fiscal year end which marks the end of the applicable Performance
Period and 50% vesting on April 1 the succeeding year. The performance-based vesting is subject to the achievement of the performance target(s) for the applicable Performance Period. Any performance award granted will vest on August 31 following the end of the applicable Performance Period. There is no opportunity to earn any performance-based awards in the first year of a performance period.
The Compensation Committee believes that a two-year performance period with a subsequent six-month holding period is appropriate. While a 3-year performance period may be appropriate in the future, in the near term we believe that setting 2-year performance goals, with a subsequent 6 month vesting, is more meaningful because we are still building our DXL concept, retail and direct, and we are continually adjusting as we learn more about our DXL customers. In addition, given the current volatile retail apparel environment, we have to be able to react quickly to changes in consumer behavior. Given the volatility in our industry and our transition to the DXL concept, we are not comparable to a mature company in a stable industry, and to set long-term metrics beyond a 2-year period would not provide the flexibility the Compensation Committee desires to provide meaningful performance targets. For instance, as discussed below, for the 2016-2017 performance period, we established a Cash-Over-Cash Return metric as a performance goal for fiscal 2017 to reflect the rigorous cash flow hurdle that every store opening has to meet. In line with our long-term objective to grow our direct business, under the 2017-2018 performance period, we chose a Modified Return on Invested Capital metric to encompass every capital dollar spent, not just capital specific to store growth.
2016-2017 Performance Period
On March 15, 2016, the Compensation Committee established two performance targets for the 2016-2017 Performance Period under the newNew LTIP (the “2016-2017 LTIP”), each weighted 50%., and further approved that all awards under the 2016-2017 LTIP would be issued in restricted stock units. The first target is performance targets for fiscal 2017 are:
➢ | EBITDA for fiscal 2017, defined as earnings before interest, taxes, depreciation and amortization (minimum threshold 85% of target; maximum award 115% of target). |
➢ | DXL Comparable Store Marginal Cash-Over-Cash Return, defined as the aggregate of each comparable DXL store’s four-wall cash flow for fiscal 2017 divided by the aggregate capital investment, net of any tenant allowance, for each comparable DXL store (minimum threshold 92% of target; maximum award 108% of target). |
As mentioned above, with the substantial new store growth over the past three years, our depreciation costs have increased sharply, which has a short-term impact on net income (loss) and, therefore, EBITDA was a more meaningful measure to determine how well our DXL concept was performing. Due to its importance in measuring our performance, there is some overlap between our short-term and long-term metrics as it relates to EBITDA.
2017-2018 Performance Period
On March 31, 2017, the Compensation Committee established two performance targets under the LTIP (the “2017-2018 LTIP”), each weighted 50%. The performance targets for fiscal 2018 are:
➢ | Total Company Comparable Sales and will be measured based on a two-year stack, which is the sum of the Total Company Comparable Sales for fiscal 2017 and fiscal 2018. |
➢ | Modified ROIC, which is defined as Operating Income divided by Invested Capital (Total Debt plus Stockholders’ Equity and excludes any deduction of Cash). |
For the 2017-2018 Performance Period, the metrics selected complement our current initiatives to drive sales through increased customer acquisition and retention. In addition, as our initial store roll-out is complete, we remain diligent in ensuring that any capital invested in the growth of our DXL brand will meet our expected levels of return.
The Compensation Committee believes that our performance metrics under the LTIPs are rigorous and are established with the expectation that they have a 50% probability of being achieved. To achieve them will require a great deal of focus and effort, which will benefit shareholders and participants alike.
As with our AIP, we will disclose our targets under these plans once the respective performance period has ended.
The following table illustrates the components of the LTIP with the respective vesting dates, illustrating that the time-based portion of the LTIP is truly a retention tool:
|
|
|
|
| Vesting of Awards by Fiscal Year: |
| ||||||||||||||
|
| % of |
|
|
|
|
|
|
|
|
|
|
|
|
| |||||
Approval date | Performance Period | total award |
|
| Fiscal 2016 |
| Fiscal 2017 |
| Fiscal 2018 |
| Fiscal 2019 |
| Fiscal 2020 |
| ||||||
3/15/2016 | 2016-2017 LTIP |
|
|
|
|
|
|
|
|
|
|
|
|
|
|
|
|
|
|
|
| Time-Based Awards, vests April 1, subject to forfeiture |
| 50 | % |
|
| 0 | % |
| 0 | % |
| 50 | % |
| 50 | % |
| 0 | % |
| Performance-Based Awards- vests August 31, if achieved |
| 50 | % |
|
|
|
|
|
|
|
| 100 | % |
|
|
|
|
|
|
|
|
|
|
|
|
|
|
|
|
|
|
|
|
|
|
|
|
|
|
|
3/31/2017 | 2017-2018 LTIP |
|
|
|
|
|
|
|
|
|
|
|
|
|
|
|
|
|
|
|
| Time-Based Awards, vests April 1, subject to forfeiture |
| 50 | % |
| - |
|
| 0 | % |
| 0 | % |
| 50 | % |
| 50 | % | |
| Performance-Based Awards- vests August 31, if achieved |
| 50 | % |
|
|
|
|
|
|
|
|
|
|
| 100 | % |
|
|
|
Discretionary Cash and Equity Awards
There were no discretionary cash or equity awards granted to our Named Executive Officers in fiscal 2016.
In particular circumstances, we may utilize cash signing bonuses and equity-based awards when certain employees join the Company.
Other Compensation
In addition to our life insurance programs available to all of our employees, we also pay the insurance premium for an additional $2.0 million life insurance policy for Mr. Levin to the benefit of his designated beneficiaries.
We offer our senior executives, including our Named Executive Officers, supplemental disability insurance and long-term care and pay a portion of the premiums, which we do not do for our other employees.
Our Named Executive Officers also receive benefits under certain group health, long-term disability and life insurance plans, which are generally available to all of our eligible employees.
After six months of service with us, all of our employees, including our Named Executive Officers, are eligible to participate in our 401(k) Plan and after one year of employment, are eligible to receive a Company match. For fiscal 2016, we matched 100% of the first 1% of deferred compensation and 50% of the next 5% (with a maximum contribution of 3.5% of eligible compensation). Benefits under these plans are not tied to corporate performance.
Termination Based Compensation
We have employment agreements with our CEO and all of our other Named Executive Officers. Upon termination of employment, each executive is entitled to receive severance payments under his/her employment agreement(s) in the event of a termination without justifiable cause. These employment agreements are discussed in detail below in the section “Employment Agreements” following the “Summary Compensation Table.” Our employment agreements do not contain any tax gross-ups pursuant to Section 280(g) of the Internal Revenue Code.
Tax Implications
Under Section 162(m) of the Internal Revenue Code, certain executive compensation in excess of $1 million in any fiscal year is limited and is not deductible by the Company for federal income tax purposes unless the compensation qualifies as "performance-based compensation" under Section 162(m). The Compensation Committee will consider whether a form of compensation will be deductible under Section 162(m) in determining executive compensation, though other factors will also be considered. The Compensation Committee may authorize compensation payments that do not comply with the exemptions to Section 162(m) when it believes that such payments are appropriate to attract and retain executive talent.
Non-GAAP Financial Measures
The above discussion references non-GAAP measures that we use on a regular basis in order to track the progress of our business. These measures include EBITDA (earnings before interest, taxes, depreciation and amortization,amortization) and free cash flow. We believe these measures provide helpful information with respect to the Company’s operating performance and cash flows. We believe that the inclusion of these non-GAAP measures is important to assist investors in comparing our Company’s performance from fiscal 2013 to fiscal 2016. In addition, we use EBITDA because it: (i) measures performance over the periods in which executives can have significant impact, (ii) is directly linked to our annual incentive plan and long-term growth plan, and (iii) is a key metric used by management and the second targetBoard to assess our operating performance. However, these measures may not be comparable to similar measures used by other companies and should not be considered superior to or as a substitute for operating income (loss), net income (loss) or cash flows from operating activities in accordance with GAAP.
The following is “DXL Comparable Store Marginal Cash-Over-Cash Return”, defineda reconciliation of EBITDA from Net Loss, on a GAAP basis:
(in millions) |
| Fiscal 2016 |
|
| Fiscal 2015 |
|
| Fiscal 2014 |
|
| Fiscal 2013 |
| ||||
Net loss, on a GAAP basis |
| $ | (2.3 | ) |
| $ | (8.7 | ) |
| $ | (12.3 | ) |
| $ | (59.8 | ) |
Add back: |
|
|
|
|
|
|
|
|
|
|
|
|
|
|
|
|
Provision for income taxes |
|
| (0.2 | ) |
|
| (0.3 | ) |
|
| (0.2 | ) |
|
| (45.7 | ) |
Interest Expense |
|
| (3.1 | ) |
|
| (3.3 | ) |
|
| (2.1 | ) |
|
| (1.0 | ) |
Depreciation and amortization |
|
| (30.6 | ) |
|
| (28.4 | ) |
|
| (24.0 | ) |
|
| (20.8 | ) |
EBITDA |
|
| 31.6 |
|
|
| 23.3 |
|
|
| 14.1 |
|
|
| 7.8 |
|
Deduct: Income (loss) from discontinuing operations |
| - |
|
|
|
|
|
|
| (1.1 | ) |
|
| 0.5 |
| |
EBITDA from continuing operations |
| $ | 31.6 |
|
| $ | 23.3 |
|
| $ | 15.2 |
|
| $ | 7.3 |
|
(1) | The net loss for fiscal 2013 includes a charge of $51.3 million to establish a full valuation allowance against our deferred tax assets. |
The following is a reconciliation of Free Cash Flow from Cash Flow from Operating Activities:
(in millions) |
| Fiscal 2016 |
|
| Fiscal 2015 |
|
| Fiscal 2014 |
|
| Fiscal 2013 |
| ||||
Cash flow provided by operating activities GAAP measure) |
| $ | 35.0 |
|
| $ | 18.4 |
|
| $ | 13.8 |
|
| $ | 24.9 |
|
less: capital expenditures |
|
| (29.2 | ) |
|
| (33.4 | ) |
|
| (40.9 | ) |
|
| (54.1 | ) |
Free cash flow (Non-GAAP measure) |
| $ | 5.8 |
|
| $ | (15.0 | ) |
| $ | (27.1 | ) |
| $ | (29.2 | ) |
COMPENSATION COMMITTEE REPORT
We, the Compensation Committee of the Company, have reviewed and discussed the Compensation Discussion and Analysis required by Item 402(b) of Regulation S-K with management and, based on this review and discussion, recommend to the Board of Directors that the Compensation Discussion and Analysis be included in this Form 10-K/A.
The Compensation Committee | |
Willem Mesdag, Chairman* | |
John E. Kyees * | |
George T. Porter, Jr. | |
Ward K. Mooney |
* Mr. Mesdag replaced Mr. Porter as Chairman of the aggregateCompensation Committee on February 2, 2017. Mr. Kyees was a member of each comparable DXL store’s four-wall cash flowthe Compensation Committee until February 2, 2017 and participated in the review and discussions relating to compensation for fiscal 2017 divided2016 referred to in the Compensation Discussion and Analysis.
Summary Compensation Table. The following Summary Compensation Table sets forth certain information regarding compensation paid or accrued by us with respect to our "Named Executive Officers" for fiscal 2016.
SUMMARY COMPENSATION TABLE
Name and Principal Position |
| Year |
| Salary ($) |
|
| Bonus ($) |
|
| Stock Awards ($) (1) (2) |
|
| Non-Equity Incentive Plan Compensation ($)(1)(3) |
|
| All Other Compensation ($)(4) |
|
| Total ($) |
|
| ||||||
David A. Levin |
| 2016 |
| $ | 811,200 |
|
|
| — |
|
| $ | 610,834 |
|
| $ | 670,052 |
|
| $ | 39,915 |
|
| $ | 2,132,001 |
|
|
President and Chief Executive |
| 2015 |
| $ | 811,200 |
|
|
| — |
|
|
| — |
|
| $ | 1,174,618 |
|
| $ | 40,472 |
|
| $ | 2,026,290 |
|
|
Officer |
| 2014 |
| $ | 811,200 |
|
|
| — |
|
|
| — |
|
| $ | 936,693 |
|
| $ | 40,470 |
|
| $ | 1,788,363 |
|
|
|
|
|
|
|
|
|
|
|
|
|
|
|
|
|
|
|
|
|
|
|
|
|
|
|
|
|
|
Peter H. Stratton, Jr. |
| 2016 |
| $ | 333,462 |
|
|
| — |
|
| $ | 122,229 |
|
| $ | 113,574 |
|
| $ | 25,305 |
|
| $ | 594,569 |
|
|
Senior Vice President, Chief |
| 2015 |
| $ | 285,000 |
|
|
| — |
|
|
| — |
|
| $ | 170,272 |
|
| $ | 24,565 |
|
| $ | 479,837 |
|
|
Financial Officer and Treasurer |
| 2014 |
| $ | 257,443 |
|
|
| — |
|
|
| — |
|
| $ | 127,462 |
|
| $ | 24,347 |
|
| $ | 409,252 |
|
|
|
|
|
|
|
|
|
|
|
|
|
|
|
|
|
|
|
|
|
|
|
|
|
|
|
|
|
|
Kenneth M. Ederle |
| 2016 |
| $ | 390,000 |
|
|
| — |
|
| $ | 136,500 |
|
| $ | 161,246 |
|
| $ | 21,864 |
|
| $ | 709,610 |
|
|
Senior Vice President and Chief |
| 2015 |
| $ | 380,769 |
|
|
| — |
|
|
| — |
|
| $ | 236,348 |
|
| $ | 21,850 |
|
| $ | 638,967 |
|
|
Merchandising Officer - |
| 2014 |
| $ | 343,269 |
|
|
| — |
|
|
| — |
|
| $ | 172,463 |
|
| $ | 21,662 |
|
| $ | 537,394 |
|
|
Planning and Allocation |
|
|
|
|
|
|
|
|
|
|
|
|
|
|
|
|
|
|
|
|
|
|
|
|
|
|
|
Robert S. Molloy |
| 2016 |
| $ | 341,923 |
|
|
| — |
|
| $ | 117,250 |
|
| $ | 154,130 |
|
| $ | 27,661 |
|
| $ | 640,964 |
|
|
Senior Vice President, General |
| 2015 |
| $ | 335,000 |
|
|
| — |
|
|
| — |
|
| $ | 212,732 |
|
| $ | 27,259 |
|
| $ | 574,991 |
|
|
Counsel and Secretary |
| 2014 |
| $ | 332,308 |
|
|
| — |
|
|
| — |
|
| $ | 163,878 |
|
| $ | 27,486 |
|
| $ | 523,672 |
|
|
|
|
|
|
|
|
|
|
|
|
|
|
|
|
|
|
|
|
|
|
|
|
|
|
|
|
|
|
Brian S. Reaves |
| 2016 |
| $ | 300,000 |
|
|
| — |
|
| $ | 105,000 |
|
| $ | 131,963 |
|
| $ | 27,452 |
|
| $ | 564,415 |
|
|
Senior Vice President and |
| 2015 |
| $ | 300,000 |
|
|
| — |
|
|
| — |
|
| $ | 188,260 |
|
| $ | 27,028 |
|
| $ | 515,288 |
|
|
Chief Sales Officer |
| 2014 |
| $ | 293,269 |
|
|
| — |
|
|
| — |
|
| $ | 141,588 |
|
| $ | 27,219 |
|
| $ | 462,076 |
|
|
|
|
|
|
|
|
|
|
|
|
|
|
|
|
|
|
|
|
|
|
|
|
|
|
|
|
|
|
Derrick Walker |
| 2016 |
| $ | 294,231 |
|
|
| — |
|
| $ | 105,000 |
|
| $ | — |
|
| $ | 408,891 |
|
| $ | 808,122 |
|
|
Former Senior Vice President and |
|
|
|
|
|
|
|
|
|
|
|
|
|
|
|
|
|
|
|
|
|
|
|
|
|
|
|
Chief Marketing Officer |
|
|
|
|
|
|
|
|
|
|
|
|
|
|
|
|
|
|
|
|
|
|
|
|
|
|
|
|
|
|
|
|
|
|
|
|
|
|
|
|
|
|
|
|
|
|
|
|
|
|
|
|
|
|
|
Nancy S. Youssef |
| 2016 |
| $ | 367,789 |
|
|
| — |
|
| $ | 131,250 |
|
| $ | — |
|
| $ | 329,431 |
|
| $ | 828,470 |
|
|
Former Senior Vice President, |
|
|
|
|
|
|
|
|
|
|
|
|
|
|
|
|
|
|
|
|
|
|
|
|
|
|
|
International Business Development |
|
|
|
|
|
|
|
|
|
|
|
|
|
|
|
|
|
|
|
|
|
|
|
|
|
|
|
(1) | The amounts reflect the fair value, as of grant date, of awards computed in accordance with FASB ASC Topic 718, and not the actual amounts paid to or realized by the Named Executive Officers during the applicable fiscal year. Additional information regarding the assumptions used to estimate the fair value of awards is included in Note A to Consolidated Financial Statements contained in our Annual Report on Form 10-K for the fiscal year ended January 28, 2017. |
(2) | The amounts shown in the Stock Award column represent the fair value, as of grant date, of (a) time-based restricted stock units (RSUs) granted pursuant to the 2016-2017 LTIP and (b) unvested restricted stock awards (RSAs) related to the partial achievement of performance targets under the 2016 Wrap. See “Grants of Plan-Based Awards” for more information regarding these equity awards. |
The fair value associated with the aggregate capital investment, netperformance-based component of any tenant allowance, for each comparable DXL store.
Allthe equity awards granted under the 2016-2017 LTIP were in restricted stock units (RSUs). Assuming thatis determined based on the Company achievesprobable outcome of the performance target at target levels and all time-vested awards vest,conditions as of the compensation expense associated withservice-inception date. Because the achievement of the performance targets under the 2016-2017 LTIP was not deemed probable as of the service-inception date, no value was attributed to the performance-based portion of these awards. The following reflects the fair values of the performance-based portion of the 2016-2017 LTIP assuming the highest level of performance conditions will be achieved for each of the Named Executive Officers:
|
|
|
|
David A. Levin | $ | 608,400 |
|
Peter H. Stratton, Jr. | $ | 183,344 |
|
Kenneth M. Ederle | $ | 204,750 |
|
Robert S. Molloy | $ | 175,875 |
|
Brian S. Reaves | $ | 157,500 |
|
Derrick Walker | $ | 157,500 |
|
Nancy S. Youssef | $ | 196,875 |
|
As a result of Mr. Walker and Ms. Youssef’s terminations of employment on January 20, 2017, each received the cash value of $30,287 and $37,897, respectively, for the pro-rata portion of time-based RSUs that would have vested had Mr. Walker and Ms. Youssef been employed as of the first vesting date, the remaining RSUs were forfeited. These amounts are excluded in the amount of severance reported in the All Other Compensation column.
(3) | Represents cash awards earned under the 2016 AIP, the time-vested cash portion of the 2013-2016 LTIP and the cash portion of the 2016 Wrap. See “2016 Non-Equity (Cash) Incentive Plan Compensation” below for additional detail. |
(4) | See table “All Other Compensation” below for a breakdown of 2016 amounts reflected in this column. |
The following table is estimateda supplement to the Summary Compensation Table and provides a breakdown of the non-equity incentive-based awards earned by each Named Executive Officer in fiscal 2016.
2016 Non-Equity (Cash) Incentive Plan Compensation
|
| 2013-2016 Long-Term Incentive Plan (1) |
|
|
|
| 2016 Wrap-Around Plan (2) |
|
| Annual Incentive Plan (3) |
| Totals Non-Equity Incentive Plan Compensation |
| |||||
David A. Levin |
| $ | 162,240 |
|
|
|
| $ | 205,234 |
|
| $ | 302,578 |
|
| $ | 670,052 |
|
Peter H. Stratton, Jr. |
| $ | 28,000 |
|
|
|
| $ | 35,420 |
|
| $ | 50,154 |
|
| $ | 113,574 |
|
Kenneth M. Ederle |
| $ | 45,500 |
|
|
|
| $ | 57,558 |
|
| $ | 58,188 |
|
| $ | 161,246 |
|
Robert S. Molloy |
| $ | 45,500 |
|
|
|
| $ | 57,558 |
|
| $ | 51,072 |
|
| $ | 154,130 |
|
Brian S. Reaves |
| $ | 38,500 |
|
|
|
| $ | 48,703 |
|
| $ | 44,760 |
|
| $ | 131,963 |
|
Derrick Walker (4) |
| $ | — |
|
|
|
| $ | — |
|
| $ | — |
|
| $ | — |
|
Nancy S. Youssef (4) |
| $ | — |
|
|
|
| $ | — |
|
| $ | — |
|
| $ | — |
|
(1) | Each Named Executive Officer, with the exception of Mr. Walker and Ms. Youssef, earned 40% of the time-based portion of the cash award under the 2013-2016 LTIP in fiscal 2016. Nothing was earned with respect to the performance-based portion of the cash award under the 2013-2016 LTIP in fiscal 2016. See “Compensation, Discussion and Analysis-Compensation Components, Fiscal 2016 Compensation Decisions, 2017 Annual Incentive Plan Targets and Long-Term Incentive Program-Long-term incentive plans-2013-2016 Long-Term Incentive Plan” |
(2) | Under the 2016 Wrap, 50% of any award earned was payable in cash, subject to further vesting through July 29, 2017. See “Compensation, Discussion and Analysis-Compensation Components, Fiscal 2016 Compensation Decisions, 2017 Annual Incentive Plan Targets and Long-Term Incentive Program-Long-term incentive plans-Wrap-Around Plan.” |
(3) | Each Named Executive Officer, with the exception of Mr. Walker and Ms. Youssef, earned a cash bonus under the 2016 AIP. See “Compensation, Discussion and Analysis-Compensation Components, Fiscal 2016 Compensation Decisions, 2017 Annual Incentive Plan Targets and Long-Term Incentive Program” for more information about the payouts under the 2016 AIP. |
(4) | As a result of Mr. Walker and Ms. Youssef’s terminations of employment on January 20, 2017, their respective awards under the 2013-2016 LTIP, 2016 Wrap and 2016-2017 LTIP were forfeited. As part of their severance, Mr. Walker and Ms. Youssef received a cash payment which approximated the portion of awards under these programs that would have vested or been earned had they been employed at the end of the fiscal year. |
The following table sets forth the components of 2016 All Other Compensation column listed above in the Summary Compensation Table.
Name | Auto Allowance |
|
| 401(k) Match |
|
| Life Insurance Premiums |
|
| Long-Term Healthcare Premiums |
|
| Supplemental Disability Insurance |
|
| Severance |
|
| Total Other Compensation |
| |||||||
David A. Levin | $ | 10,000 |
|
| $ | 9,275 |
|
| $ | 3,874 |
|
| $ | 6,536 |
|
| $ | 10,230 |
|
| $ | — |
|
| $ | 39,915 |
|
Peter H. Stratton, Jr. | $ | 8,400 |
|
| $ | 9,275 |
|
| $ | — |
|
| $ | 4,370 |
|
| $ | 3,259 |
|
| $ | — |
|
| $ | 25,305 |
|
Kenneth M. Ederle | $ | 8,400 |
|
| $ | 9,275 |
|
| $ | — |
|
| $ | — |
|
| $ | 4,189 |
|
| $ | — |
|
| $ | 21,864 |
|
Robert S. Molloy | $ | 8,400 |
|
| $ | 9,275 |
|
| $ | — |
|
| $ | 5,223 |
|
| $ | 4,763 |
|
| $ | — |
|
| $ | 27,661 |
|
Brian S. Reaves | $ | 8,400 |
|
| $ | 9,275 |
|
| $ | — |
|
| $ | 5,108 |
|
| $ | 4,669 |
|
| $ | — |
|
| $ | 27,452 |
|
Derrick Walker | $ | 8,400 |
|
| $ | 9,275 |
|
| $ | — |
|
| $ | 3,744 |
|
| $ | 3,325 |
|
| $ | 384,147 |
| (1) | $ | 408,891 |
|
Nancy S. Youssef | $ | 8,400 |
|
| $ | 8,798 |
|
| $ | — |
|
| $ | 1,937 |
|
| $ | 2,843 |
|
| $ | 307,453 |
| (2) | $ | 329,431 |
|
(1) | Mr. Walker’s employment was terminated on January 20, 2017. Severance includes (i) a cash payment of $150,000 to be paid bi-weekly over 6 months, (ii) $3,065 of accrued vacation and (iii) a cash value of $231,082 as payment for amounts he would have earned under the Company’s incentive plans had he been employed at January 29, 2017. Severance excludes a cash payment of $30,287 for the value of RSUs that vested on a pro-rata basis under the 2017-2018 LTIP. |
(2) | Ms. Youssef’s employment was terminated on January 20, 2017. Severance includes (i) a cash payment of $187,500 to be paid bi-weekly over 6 months, (ii) $17,931 of accrued vacation and (iii) a cash value of $102,022 as payment for amounts she would have earned under the Company’s incentive plans had she been employed at January 29, 2017. Severance excludes a cash payment of $37,897 for the value of RSUs that vested on a pro-rata basis under the 2017-2018 LTIP. |
Employment Agreements
Chief Executive Officer
We have an employment agreement with Mr. Levin, which was revised and restated as of November 5, 2009. The initial three-year term of Mr. Levin’s employment agreement (the “Employment Agreement”) was January 1, 2009 through December 31, 2011. On January 1, 2011 and thereafter on each anniversary of the employment agreement’s commencement date, the term is extended for a one-year period, making Mr. Levin’s employment agreement a rolling two-year agreement after the initial three-year term.
The Employment Agreement requires Mr. Levin to devote substantially all of his time and attention to our business as necessary to fulfill his duties. The Employment Agreement provides that Mr. Levin would be paid a base salary at annual rate of $811,200, with an annual automobile allowance of $10,000.
Mr. Levin is eligible to participate in our AIP at a target rate of 100% of his actual annual base salary, as defined in that plan, and in our LTIP at a target incentive rate of 100% of his combined actual annual base earnings for the incentive period. The Employment Agreement also provides for the payment of discretionary bonuses in such amounts as may be determined by the Compensation Committee or Board of Directors.
The Employment Agreement provides that in the event Mr. Levin’s employment is terminated by the Company at any time for any reason other than “justifiable cause” (as defined in the Employment Agreements), disability or death, or in the event Mr. Levin resigns with “good reason” (as defined in the Employment Agreement), we are required to pay Mr. Levin the following:
A pro rata bonus under the AIP;
A pro-rata vesting of LTIP awards; and
A severance comprised as the sum of (1) Mr. Levin’s monthly base salary then in effect plus (2) a monthly amount calculated by dividing by twelve the average of the sum of (i) the annual incentive bonuses earned under the AIP and (ii) the cash amounts paid to Mr. Levin pursuant to the LTIP or the cash value of the options or stock issued to Mr. Levin, during each of the two most recent fiscal years, with the monthly sum of (1) plus (2) payable for 24 consecutive months. This severance benefit is conditioned upon Mr. Levin’s execution of a general release.
The above-listed payments are not made if Mr. Levin is terminated with “justifiable cause,” if Mr. Levin resigns and such resignation is not for “good reason”, or Mr. Levin dies or becomes disabled; provided, however, that if Mr. Levin’s employment terminates by reason of death, disability or retirement on or after age 65, Mr. Levin shall be entitled to a pro-rata bonus under the AIP.
In the event Mr. Levin’s employment is terminated at any time within one year following a Change of Control (as defined in the Employment Agreement) other than for "justifiable cause," or if Mr. Levin resigns for “good reason”, Mr. Levin is entitled to receive a lump sum payment equal to the sum of two times his base salary, and two times his target annual incentive bonus under the AIP for the fiscal year in which the Change of Control occurs. Payments made under this provision are to be approximately $3.8 million. Approximately halfreduced if and to the extent necessary to avoid any payments or benefits to executive being treated as “excess parachute payments” within the meaning of Internal Revenue Code Section 280G(b)(i). This payment also is conditioned upon Mr. Levin’s execution of a general release.
The Employment Agreement contains confidentiality provisions pursuant to which Mr. Levin agrees not to disclose confidential information regarding our Company. The Employment Agreement also contains covenants pursuant to which he agrees, during the term of his employment and for a one-year period following the termination of his employment, not to have any connection with any business which is a specialty retailer that primarily distributes, sells or markets so-called “big and tall” apparel of any kind for men or which utilizes the “big and tall” retail or wholesale marketing concept as part of its business.
The Employment Agreement also provides that we will, during the term of employment, pay the insurance premiums under one or more life insurance policies on Mr. Levin’s life pursuant to an arrangement under which $2,000,000 of the compensation expense,death benefit under the
policy or $1.9 million, relatespolicies would be payable to Mr. Levin’s named beneficiary (with the time-vested RSUs, which is being expensed over thirty-six months, basedexecutive officer making the election of the designated beneficiary) upon Mr. Levin’s death.
Senior Executives
We also have employment agreements with each of our Senior Executives (the “Sr. Exec. Employment Agreements”). The term of each employment agreement begins on the respective vesting dates. With respecteffective date and continues until terminated by either party. Our Senior Executives are eligible to participate in our AIP. During fiscal 2015, they participated at a target rate of 40% of their respective average base salaries. Senior Executives are also eligible to participate in our LTIPs at 70% of their respective average base salaries, as defined in the plan, depending on our performance (based on long-term performance goals). Each executive is entitled to vacation and to participate in and receive any other benefits customarily provided by us to our senior executives.
The Sr. Exec. Employment Agreements provide that in the event the executive officer’s employment is terminated by us at any time for any reason other than “justifiable cause” (as defined in the Sr. Exec. Employment Agreements), disability or death, we are required to pay the executive his or her then current base salary for five months after the effective date of such termination. This severance benefit is conditioned upon the senior executive’s execution of a general release. The above-listed payments are not made if the senior executive is terminated with “justifiable cause,” the senior executive resigns, or the senior executive dies or becomes disabled.
In the event the senior executive’s employment is terminated at any time within one year following a Change of Control (as defined in the Sr. Exec. Employment Agreement) other than for "justifiable cause," or if the senior executive resigns for “good reason,” we shall pay the senior executive an amount equal to twelve months of executive’s highest base salary in effect at any time during the six month period ending on the date of the Change of Control. This payment also is conditioned upon the senior executive’s execution of a general release. Payments made under this provision are to be reduced if and to the performance-based component, RSUs will be granted atextent necessary to avoid any payments or benefits to senior executive being treated as “excess parachute payments” within the endmeaning of the performance period if the performance targets are achieved. Through the end of fiscal 2016, the Company has accrued approximately $0.3 million in compensation expense related to the potential payout of performance awards under the 2016-2017 LTIP.
G. STOCK COMPENSATION PLANS
Through the end of the second quarter of fiscal 2016, the Company’s 2006 Incentive Compensation Plan (as amended and restated effective as of August 1, 2013, the “2006 Plan”) was the only stockholder approved plan. The 2006 Plan expired on July 31, 2016. At the Company’s 2016 Annual Meeting of Stockholders held August 4, 2016, the Company’s stockholders approved the adoption of the 2016 Incentive Compensation Plan (the “2016 Plan”)Internal Revenue Code Section 280G(b)(i).
2016 Plan
The share reserve underSr. Exec. Employment Agreements contain confidentiality provisions pursuant to which each senior executive agrees not to disclose confidential information regarding our Company. The Sr. Exec. Employment Agreements also contain covenants pursuant to which each senior executive agrees, during the 2016 Planterm of his employment and for a one-year period following the termination of his employment, not to have any connection with any business which is 5,200,000 sharesa specialty retailer that primarily distributes, sells or markets so-called “big and tall” apparel of our common stock. A grantany kind for men or which utilizes the “big and tall” retail or wholesale marketing concept as part of a stock option award or stock appreciation right reduces the outstanding reserve on a one-for-one basis. A grant of a full-value award, including, but not limited to, restricted stock, restricted stock units and deferred stock, reduces the outstanding reserve by a fixed ratio of 1.9 shares for every share granted.its business.
In addition to the initial share reserve of 5,200,000 shares, the 525,538 shares that remained available under our 2006 Plan were added and became available for issuance under the 2016 Plan on August 4, 2016. In accordance with the terms of their employment agreements, as discussed above, Mr. Walker and Ms. Youssef received a severance equal to six months (including one month of severance in lieu of a notice period) plus accrued vacation. In addition, each received the 2016 Plan, any shares outstandingcash which was equivalent to the value of awards under the 2006 Plan at August 4, 2016Company’s AIP and LTIP programs that subsequently terminate, expire or are canceled for any reason without havingeach would have been exercised or paid are added backawarded had they remained employed as of January 29, 2017. In addition, Mr. Walker and become available for issuanceMs. Youssef received a cash payment equal to the value of RSUs that had vested on a pro-rata basis under the 2016 Plan, with options2017-2018 LTIP. The following is a summary of the severance paid to Mr. Walker and stock appreciationMs. Youssef:
| Severance |
| ||||
| Mr. Walker |
| Ms. Youssef |
| ||
Severance - 6 months | $ | 150,000 |
| $ | 187,500 |
|
Accrued vacation |
| 3,065 |
|
| 17,931 |
|
Cash value for: |
|
|
|
|
|
|
AIP 2016 |
| 44,760 |
|
| 55,950 |
|
LTIP 2013-2016 |
| 88,917 |
|
| 23,625 |
|
2016 Wrap |
| 97,405 |
|
| 22,447 |
|
Total severance per Summary Compensation Table | $ | 384,147 |
| $ | 307,453 |
|
Cash value for RSU under 2017-2018 LTIP (1) |
| 30,287 |
|
| 37,897 |
|
Total severance | $ | 414,434 |
| $ | 345,350 |
|
(1) | The amounts paid for RSUs were excluded from the severance amounts reported in the Summary Compensation Table because the Summary Compensation Table already reflected the total grant-date fair value of the restricted stock units granted in March 2016. The remaining RSUs were forfeited. |
rights being added back onClaw-Back Provision
Our employment agreements contain a one-for-one basis and full-value awards being added back on a 1 to1.9 basis. Accordingly,“claw-back” provision which provides for remedies in the event we learn, after the executive’s termination by us, other than for “justifiable cause,” that his or her termination could have been terminated for “justifiable cause.” Pursuant to the employment agreements, an additional 588,796 shares were addedexecutive shall be required to share availability under the 2016 Plan during fiscal 2016. At January 28, 2017,pay to the Company had 6,233,824 shares available underall amounts paid to the 2016 Plan. executive other
The 2016 Plan is administered by the Compensation Committee. The Compensation Committee is authorized to make all determinations with respect to amountsthan such portion of an executive’s base salary and conditions covering awards. Options are not granted at a price less than fair value onreimbursement of expenses accrued through the date of the grant. Excepttermination; all vested and unvested awards, as defined therein, held by the executive shall immediately expire; and the executive shall be required to pay to the Company an amount equal to any gains resulting from the exercise or payment of any awards.
Subject to the implementation of final rules by the SEC, the Dodd-Frank Act requires that we implement a policy providing for the recovery of erroneously paid incentive-based compensation following a required accounting restatement. Once the final rules are issued by the SEC, we will revise, in a timely manner, the current claw-back provision of our employment agreements. In addition, under the Sarbanes-Oxley Act, our CEO and CFO are required to reimburse the Company for bonuses and other incentive compensation and stock sale profits if the Company is required to restate its financial statements, as a result of misconduct, due to material noncompliance with the financial reporting requirements of the securities laws.
Grants of Plan-Based Awards. The following table sets forth certain information with respect to 5% ofplan-based awards granted to the shares available for awards under the Named Executive Officers in fiscal 2016.
2016 Plan, no award will become exercisable or otherwise forfeitable unless such award has been outstanding for a minimum period of one year from its date of grant.
The following tables summarize the stock option activity and share activity for the Company’s 2006 Plan and 2016 Plan, on a combined basis, during fiscal 2016:
Stock Option Activity
The following table summarizes stock option activity under the plans for fiscal 2016:GRANTS OF PLAN-BASED AWARDS
|
| Number of Shares |
|
| Weighted-average exercise price per option |
|
| Weighted-average remaining contractual term |
| Aggregate intrinsic value |
| |||
Stock Options |
|
|
|
|
|
|
|
|
|
|
|
|
|
|
Outstanding options at beginning of year |
|
| 2,728,621 |
|
| $ | 5.00 |
|
|
|
|
|
|
|
Options granted |
|
| 9,004 |
|
| $ | 4.44 |
|
|
|
|
|
|
|
Options canceled |
|
| (213,079 | ) |
| $ | 5.24 |
|
|
|
|
|
|
|
Options exercised |
|
| — |
|
|
| — |
|
|
|
|
|
|
|
|
|
|
|
|
|
|
|
|
|
|
|
|
|
|
Outstanding options at end of year |
|
| 2,524,546 |
|
| $ | 4.98 |
|
| 5.9 years |
| $ | 11,286 |
|
Options exercisable at end of year |
|
| 1,464,605 |
|
| $ | 4.91 |
|
| 5.6 years |
| $ | 11,286 |
|
Vested and expected to vest at end of year |
|
| 1,464,605 |
|
| $ | 4.91 |
|
| 5.6 years |
| $ | 11,286 |
|
|
|
|
|
| Service Inception/ |
| Estimated Future Payouts Under Non-Equity Incentive Plan Awards |
|
| Estimated Future Payouts Under Equity Incentive Plan Awards |
|
| All Other Stock Awards: Number of Shares of Stock |
|
| All Other Option Awards: Number of Securities Underlying |
|
| Exercise or Base Price of Option |
|
| Grant Date Fair Value of Stock and Option |
| ||||||||||||||||||||||||||
|
|
| Grant |
| Approval |
| Threshold |
|
|
|
| Target |
|
|
|
| Maximum |
|
| Threshold |
|
| Target |
|
| Maximum |
|
| or Units |
|
| Options |
|
| Awards |
|
| Awards |
| ||||||||||
|
|
| Date |
| Date |
| ($) |
|
|
|
| ($) |
|
|
|
| ($) |
|
| ($) (1) |
|
| ($) (1) |
|
| ($) (1) |
|
| (#) |
|
| (#) |
|
| ($ / Sh) |
|
| ($) |
| ||||||||||
|
|
|
|
|
|
|
|
|
|
|
|
|
|
|
|
|
|
|
|
|
|
|
|
|
|
|
|
|
|
|
|
|
|
|
|
|
|
|
|
|
|
|
|
|
|
|
|
|
|
David A. Levin |
|
|
|
|
|
|
|
|
|
|
|
|
|
|
|
|
|
|
|
|
|
|
|
|
|
|
|
|
|
|
|
|
|
|
|
|
|
|
|
|
|
|
|
|
|
|
|
| |
| -2016 AIP (2) |
| 3/15/2016 |
| 3/15/2016 |
| $ | 466,440 |
|
|
|
| $ | 811,200 |
|
|
|
| $ | 1,216,800 |
|
|
| — |
|
|
| — |
|
|
| — |
|
|
| — |
|
|
| — |
|
|
| — |
|
|
| — |
|
| -2016-2017 LTIP (3) |
| 4/14/2016 |
| 4/14/2016 |
|
| — |
|
|
|
|
| — |
|
|
|
|
| — |
|
| $ | 202,800 |
|
| $ | 405,600 |
|
| $ | 608,400 |
|
|
| 78,604 |
|
|
| — |
|
|
| — |
|
| $ | 405,597 |
|
| -2016 Wrap (4) |
| 3/20/2017 |
| 11/7/2014 |
| $ | 405,600 |
|
|
|
| $ | 648,960 |
|
|
|
| $ | 831,200 |
|
| $ | 405,600 |
|
| $ | 648,960 |
|
| $ | 831,200 |
|
|
| — |
|
|
| — |
|
|
| — |
|
|
| — |
|
Peter H. Stratton, Jr. |
|
|
|
|
|
|
|
|
|
|
|
|
|
|
|
|
|
|
|
|
|
|
|
|
|
|
|
|
|
|
|
|
|
|
|
|
|
|
|
|
|
|
|
|
|
|
|
| |
| -2016 AIP (2) |
| 3/15/2016 |
| 3/15/2016 |
| $ | 65,550 |
|
|
|
| $ | 134,462 |
|
|
|
| $ | 201,692 |
|
|
| — |
|
|
| — |
|
|
| — |
|
|
| — |
|
|
| — |
|
|
| — |
|
|
| — |
|
| -2016-2017 LTIP (3) |
| 4/14/2016 |
| 4/14/2016 |
|
| — |
|
|
|
|
| — |
|
|
|
|
| — |
|
| $ | 49,875 |
|
| $ | 99,750 |
|
| $ | 149,625 |
|
|
| 19,331 |
|
|
| — |
|
|
| — |
|
| $ | 99,748 |
|
| -2016-2017 LTIP (3) |
| 5/11/2016 |
| 5/11/2016 |
|
| — |
|
|
|
|
| — |
|
|
|
|
| — |
|
| $ | 11,240 |
|
| $ | 22,479 |
|
| $ | 33,719 |
|
|
| 4,644 |
|
|
| — |
|
|
| — |
|
| $ | 22,477 |
|
| -2016 Wrap (4) |
| 3/20/2017 |
| 11/7/2014 |
| $ | 70,000 |
|
|
|
| $ | 112,000 |
|
|
|
| $ | 140,000 |
|
| $ | 70,000 |
|
| $ | 112,000 |
|
| $ | 140,000 |
|
|
| — |
|
|
| — |
|
|
| — |
|
|
| — |
|
Kenneth M. Ederle |
|
|
|
|
|
|
|
|
|
|
|
|
|
|
|
|
|
|
|
|
|
|
|
|
|
|
|
|
|
|
|
|
|
|
|
|
|
|
|
|
|
|
|
|
|
|
|
| |
| -2016 AIP (2) |
| 3/15/2016 |
| 3/15/2016 |
| $ | 89,700 |
|
|
|
| $ | 156,000 |
|
|
|
| $ | 234,000 |
|
|
| — |
|
|
| — |
|
|
| — |
|
|
| — |
|
|
| — |
|
|
| — |
|
|
| — |
|
| -2016-2017 LTIP (3) |
| 4/14/2016 |
| 4/14/2016 |
|
| — |
|
|
|
|
| — |
|
|
|
|
| — |
|
| $ | 68,250 |
|
| $ | 136,500 |
|
| $ | 204,750 |
|
|
| 26,453 |
|
|
| — |
|
|
| — |
|
| $ | 136,497 |
|
| -2016 Wrap (4) |
| 3/20/2017 |
| 11/7/2014 |
| $ | 113,750 |
|
|
|
| $ | 182,000 |
|
|
|
| $ | 227,500 |
|
| $ | 113,750 |
|
| $ | 182,000 |
|
| $ | 227,500 |
|
|
| — |
|
|
| — |
|
|
| — |
|
|
| — |
|
Robert S. Molloy |
|
|
|
|
|
|
|
|
|
|
|
|
|
|
|
|
|
|
|
|
|
|
|
|
|
|
|
|
|
|
|
|
|
|
|
|
|
|
|
|
|
|
|
|
| �� |
|
| |
| -2016 AIP (2) |
| 3/15/2016 |
| 3/15/2016 |
| $ | 78,731 |
|
|
|
| $ | 136,923 |
|
|
|
| $ | 205,385 |
|
|
| — |
|
|
| — |
|
|
| — |
|
|
| — |
|
|
| — |
|
|
| — |
|
|
| — |
|
| -2016-2017 LTIP (3) |
| 4/14/2016 |
| 4/14/2016 |
|
| — |
|
|
|
|
| — |
|
|
|
|
| — |
|
| $ | 58,625 |
|
| $ | 117,250 |
|
| $ | 175,875 |
|
|
| 22,722 |
|
|
| — |
|
|
| — |
|
| $ | 117,246 |
|
| -2016 Wrap (4) |
| 3/20/2017 |
| 11/7/2014 |
| $ | 113,750 |
|
|
|
| $ | 182,000 |
|
|
|
| $ | 227,500 |
|
| $ | 113,750 |
|
| $ | 182,000 |
|
| $ | 227,500 |
|
|
| — |
|
|
| — |
|
|
| — |
|
|
| — |
|
Brian S. Reaves |
|
|
|
|
|
|
|
|
|
|
|
|
|
|
|
|
|
|
|
|
|
|
|
|
|
|
|
|
|
|
|
|
|
|
|
|
|
|
|
|
|
|
|
|
|
|
|
| |
| -2016 AIP (2) |
| 3/15/2016 |
| 3/15/2016 |
| $ | 69,000 |
|
|
|
| $ | 120,000 |
|
|
|
| $ | 180,000 |
|
|
| — |
|
|
| — |
|
|
| — |
|
|
| — |
|
|
| — |
|
|
| — |
|
|
| — |
|
| -2016-2017 LTIP (3) |
| 4/14/2016 |
| 4/14/2016 |
|
| — |
|
|
|
|
| — |
|
|
|
|
| — |
|
| $ | 52,500 |
|
| $ | 105,000 |
|
| $ | 157,500 |
|
|
| 20,348 |
|
|
| — |
|
|
| — |
|
| $ | 104,996 |
|
| -2016 Wrap (4) |
| 3/20/2017 |
| 11/7/2014 |
| $ | 96,250 |
|
|
|
| $ | 154,000 |
|
|
|
| $ | 192,500 |
|
|
| 96,250 |
|
|
| 154,000 |
|
|
| 192,500 |
|
|
| — |
|
|
| — |
|
|
| — |
|
|
| — |
|
Derrick Walker (5) |
|
|
|
|
|
|
|
|
|
|
|
|
|
|
|
|
|
|
|
|
|
|
|
|
|
|
|
|
|
|
|
|
|
|
|
|
|
|
|
|
|
|
|
|
|
|
|
| |
| -2016 AIP (5) |
| 3/15/2016 |
| 3/15/2016 |
| $ | 69,000 |
|
|
|
| $ | 120,000 |
|
|
|
| $ | 180,000 |
|
|
| — |
|
|
| — |
|
|
| — |
|
|
| — |
|
|
| — |
|
|
| — |
|
|
| — |
|
| -2016-2017 LTIP (5) |
| 4/14/2016 |
| 4/14/2016 |
|
| — |
|
|
|
|
| — |
|
|
|
|
| — |
|
| $ | 52,500 |
|
| $ | 105,000 |
|
| $ | 157,500 |
|
|
| 20,348 |
|
|
|
|
|
|
|
|
|
| $ | 104,996 |
|
Nancy S. Youssef (5) |
|
|
|
|
|
|
|
|
|
|
|
|
|
|
|
|
|
|
|
|
|
|
|
|
|
|
|
|
|
|
|
|
|
|
|
|
|
|
|
|
|
|
|
|
|
|
|
| |
| -2016 AIP (5) |
| 3/15/2016 |
| 3/15/2016 |
| $ | 86,250 |
|
|
|
| $ | 150,000 |
|
|
|
| $ | 225,000 |
|
|
| — |
|
|
| — |
|
|
| — |
|
|
| — |
|
|
| — |
|
|
| — |
|
|
| — |
|
| -2016-2017 LTIP (5) |
| 4/14/2016 |
| 4/14/2016 |
|
| — |
|
|
|
|
| — |
|
|
|
|
| — |
|
| $ | 65,625 |
|
| $ | 131,249 |
|
| $ | 196,874 |
|
|
| 25,436 |
|
|
| — |
|
|
| — |
|
| $ | 131,250 |
|
There were no exercises of options during fiscal 2016 and the intrinsic value of options exercised during fiscal 2015 was immaterial.
Non-Vested Share Activity
The following table summarizes activity for non-vested shares under the plans for fiscal 2016:
|
| Restricted shares |
|
| Restricted Stock Units (1) |
|
| Deferred shares (2) |
|
| Fully-vested shares (3) |
|
| Total number of shares |
|
| Weighted-average grant-date fair value (4) |
| ||||||
Shares |
|
|
|
|
|
|
|
|
|
|
|
|
|
|
|
|
|
|
|
|
|
|
|
|
Outstanding non-vested shares at beginning of year |
|
| 1,320,143 |
|
|
| — |
|
|
| 31,587 |
|
|
| — |
|
|
| 1,351,730 |
|
| $ | 5.09 |
|
Shares granted |
|
| 4,168 |
|
|
| 440,125 |
|
|
| 33,289 |
|
|
| 53,725 |
|
|
| 531,307 |
|
| $ | 5.06 |
|
Shares vested/issued |
|
| (339,539 | ) |
|
| (919 | ) |
|
| — |
|
|
| (53,725 | ) |
|
| (394,183 | ) |
| $ | 5.05 |
|
Shares canceled |
|
| (128,440 | ) |
|
| (69,378 | ) |
|
| — |
|
|
| — |
|
|
| (197,818 | ) |
| $ | 5.13 |
|
Outstanding non-vested shares at end of year |
|
| 856,332 |
|
|
| 369,828 |
|
|
| 64,876 |
|
|
| — |
|
|
| 1,291,036 |
|
| $ | 5.09 |
|
Vested and expected to vest at end of year |
|
| 8,334 |
|
|
| 314,354 |
|
|
| 64,876 |
|
|
| — |
|
|
| 387,564 |
|
|
|
|
|
(1) |
|
(2) | The threshold, target and maximum payouts for each executive were |
executive estimated based on achieving 50%, 100% and 150% of the payout targets set by the Compensation Committee. The remaining 50% represents time-based awards for which each executive received RSUs |
|
|
|
(4) | The |
(5) | On January 20, 2017, Mr. Walker and Ms. Youssef’s employments were terminated. As a result, their awards under the 2013-2016 LTIP and 2016-2017 LTIP were forfeited. |
Total unrecognized
Outstanding Equity Awards at Fiscal Year-End. The following table sets forth certain information with respect to outstanding equity awards held by the Named Executive Officers at the end of fiscal 2016.
2016 OUTSTANDING EQUITY AWARDS AT FISCAL YEAR-END
| Option Awards |
| Stock Awards |
| ||||||||||||||||||||||||||||||
|
| Number of Securities Underlying Unexercised Options (#) |
|
| Number of Securities Underlying Unexercised Options (#) |
|
| Equity Incentive Plan Awards: Number of Securities Underlying Unexercised Unearned Options |
|
| Option Exercise Price |
|
| Option Expiration |
| Number of Shares or Units of Stock That Have Not Vested |
|
| Market Value of Shares or Units of Stock That Have Not Vested |
|
| Equity Incentive Plan Awards: Number of Unearned Shares, Units or Other Rights That Have Not Vested |
|
| Equity Incentive Plan Awards: Market or Payout Value of Unearned Shares, Units or Other Rights That Have Not Vested |
| ||||||||
Name |
| Exercisable |
|
| Unexercisable |
|
| (#) |
|
| ($) |
|
| Date |
| (#) |
|
| ($)(1) |
|
| (#) |
|
| ($)(1) |
| ||||||||
David A. Levin |
|
| 195,942 |
|
|
| — |
|
|
| — |
|
| $ | 5.04 |
|
| 5/28/2023 |
|
| — |
|
|
| — |
|
|
| — |
|
|
| — |
|
|
|
| — |
|
|
| — |
|
|
| — |
|
|
|
|
|
|
|
|
| 78,604 |
| (2) | $ | 259,393 |
|
|
| — |
|
|
| — |
|
|
|
| — |
|
|
| — |
|
|
| — |
|
|
|
|
|
|
|
|
|
|
|
|
|
|
|
|
| 85,514 |
| (3) | $ | 282,196 |
|
Peter H. Stratton, Jr. |
|
| 8,587 |
|
|
| — |
|
|
| — |
|
| $ | 4.19 |
|
| 3/16/2021 |
|
| — |
|
|
| — |
|
|
| — |
|
|
| — |
|
|
|
| 33,816 |
|
|
| — |
|
|
| — |
|
| $ | 5.04 |
|
| 5/28/2023 |
|
| — |
|
|
| — |
|
|
| — |
|
|
| — |
|
|
|
| — |
|
|
| — |
|
|
| — |
|
|
|
|
|
|
|
|
| 19,331 |
| (2) | $ | 63,792 |
|
|
| — |
|
|
| — |
|
|
|
| — |
|
|
| — |
|
|
| — |
|
|
|
|
|
|
|
|
| 4,644 |
| (2) | $ | 15,325 |
|
|
| — |
|
|
| — |
|
|
|
| — |
|
|
| — |
|
|
| — |
|
|
|
|
|
|
|
|
|
|
|
|
|
|
|
|
| 14,758 |
| (3) | $ | 48,701 |
|
Kenneth M. Ederle |
|
| 10,000 |
|
|
| — |
|
|
| — |
|
| $ | 7.52 |
|
| 10/22/2017 |
|
| — |
|
|
| — |
|
|
| — |
|
|
| — |
|
|
|
| 54,951 |
|
|
| — |
|
|
| — |
|
| $ | 5.04 |
|
| 5/28/2023 |
|
| — |
|
|
| — |
|
|
| — |
|
|
| — |
|
|
|
| — |
|
|
| — |
|
|
| — |
|
|
|
|
|
|
|
|
| 26,453 |
| (2) | $ | 87,295 |
|
|
| — |
|
|
| — |
|
|
|
| — |
|
|
| — |
|
|
| — |
|
|
|
|
|
|
|
|
|
|
|
|
|
|
|
|
| 23,982 |
| (3) | $ | 79,141 |
|
Robert S. Molloy |
|
| 20,606 |
|
|
| — |
|
|
| — |
|
| $ | 3.20 |
|
| 3/19/2020 |
|
| — |
|
|
| — |
|
|
| — |
|
|
| — |
|
|
|
| 13,955 |
|
|
| — |
|
|
| — |
|
| $ | 4.19 |
|
| 3/16/2021 |
|
| — |
|
|
| — |
|
|
| — |
|
|
| — |
|
|
|
| 54,951 |
|
|
| — |
|
|
| — |
|
| $ | 5.04 |
|
| 5/28/2023 |
|
| — |
|
|
| — |
|
|
| — |
|
|
| — |
|
|
|
| — |
|
|
| — |
|
|
| — |
|
|
|
|
|
|
|
|
| 22,722 |
| (2) | $ | 74,983 |
|
|
| — |
|
|
| — |
|
|
|
| — |
|
|
| — |
|
|
| — |
|
|
|
|
|
|
|
|
|
|
|
|
|
|
|
|
| 23,982 |
| (3) | $ | 79,141 |
|
Brian S. Reaves |
|
| 17,183 |
|
|
| — |
|
|
| — |
|
| $ | 4.19 |
|
| 3/16/2021 |
|
| — |
|
|
| — |
|
|
| — |
|
|
| — |
|
|
|
| 46,496 |
|
|
| — |
|
|
| — |
|
| $ | 5.04 |
|
| 5/28/2023 |
|
| — |
|
|
| — |
|
|
| — |
|
|
| — |
|
|
|
| — |
|
|
| — |
|
|
| — |
|
|
|
|
|
|
|
|
| 20,348 |
| (2) | $ | 67,148 |
|
|
| — |
|
|
| — |
|
|
|
| — |
|
|
| — |
|
|
| — |
|
|
|
|
|
|
|
|
|
|
|
|
|
|
|
|
| 20,292 |
| (3) | $ | 66,964 |
|
Derrick Walker |
|
| 50,000 |
|
|
| — |
|
|
| — |
|
| $ | 3.12 |
|
| 4/20/2017 |
|
| — |
|
|
| — |
|
|
| — |
|
|
| — |
|
|
|
| 27,896 |
|
|
| — |
|
|
| — |
|
| $ | 5.04 |
|
| 4/20/2017 |
|
| — |
|
|
| — |
|
|
| — |
|
|
| — |
|
Nancy S. Youssef |
|
| 9,561 |
|
|
| — |
|
|
| — |
|
| $ | 5.84 |
|
| 4/20/2017 |
|
| — |
|
|
| — |
|
|
| — |
|
|
| — |
|
(1) | The value of shares was calculated using the closing price of our common stock of $3.30 on January 28, 2017. |
(2) | These awards represent RSUs granted on April 14, 2016 in connection with our 2016-2017 LTIP and represent the unvested portion of these time-based awards. Mr. Stratton received a supplemental grant of RSUs on May 11, 2016 due to an increase in his base salary. |
(3) | These awards represent awards earned under the 2016 Wrap as the result of achieving performance targets under the 2016 Wrap, but that were granted subsequent to year-end on March 31, 2017, subject to further vesting through July 31, 2017. |
Option Exercises and Stock Vested Table. The following table sets forth information for the Named Executive Officers with respect to the exercise of option awards and the vesting of stock awards during fiscal 2016. No options were exercised by any Named Executive Officer in fiscal 2016.
2016 OPTION EXERCISES AND STOCK VESTED
| Stock Awards |
| ||||||
Name |
| Number of shares Vested (#) |
|
| Value Realized on Vesting ($)(1) |
| ||
David A. Levin |
|
| 64,381 |
|
| $ | 212,457 |
|
Peter H. Stratton, Jr. |
|
| 11,111 |
|
| $ | 36,666 |
|
Kenneth M. Ederle |
|
| 18,056 |
|
| $ | 59,585 |
|
Robert S. Molloy |
|
| 18,056 |
|
| $ | 59,585 |
|
Brian S. Reaves |
|
| 15,278 |
|
| $ | 50,417 |
|
Derrick Walker |
|
| — |
|
|
| — |
|
Nancy S. Youssef |
|
| 3,798 |
|
| $ | 15,002 |
|
(1) | The “Value Realized on Exercise” is the difference between the market price of the underlying security at exercise and the exercise price of the option. The “Value Realized on Vesting” is the market price of the underlying security on the date of vesting. The value realized is for informational purposes only and does not purport to represent that such individual actually sold the underlying shares, or that the underlying shares were sold on the date of exercise. Furthermore, such value realized does not take into consideration individual income tax consequences. |
Pension Benefits
None of our Named Executive Officers was a participant in any pension plan and, therefore, none has accumulated benefits.
Non-Qualified Deferred Compensation
We do not offer to our executive officers or employees any defined contribution or similar plan that provides for the deferral of compensation on a basis that is not tax-qualified. We offer a 401(k) saving plan to all of $1.2 million at January 28, 2017our employees eligible to participate, as further described below.
401(k) Plan
The Company has one defined contribution plan, the Destination XL Group, Inc. 401(k) Savings Plan (the “401(k) Plan”). Under the 401(k) Plan, the Company offers a qualified automatic contribution arrangement (“QACA”) with the Company matching 100% of the first 1% of deferred compensation and 50% of the next 5% (with a maximum contribution of 3.5% of eligible compensation). Employees who are 21 years of age or older are eligible to make deferrals after 6 months of employment and are eligible to receive a match from the Company after one year of employment and 1,000 hours.
Our Named Executive Officers are eligible to participate in the 401(k) Plan, and the amount of any Company match to our Named Executive Officers is expected to be recognized overset forth above in the “All Other Compensation” table.
Key Man Insurance
We have a weighted-average periodkey man life insurance policy on the life of 20 months.Mr. Levin in the amount of $2,000,000.
Non-Employee Director Compensation Plan
The Compensation Committee is responsible for reviewing and making recommendations to our Board of Directors with respect to the compensation paid to our non-employee directors.
In January 2010, the Company established a Non-Employee Director Stock Purchase Plan to provide a convenient method for its non-employee directors to acquire shares of the Company’s common stock at fair market value by voluntarily electing to receive shares of common stock in lieu of cash for service as a director. The substance of this plan is now encompassed within the Company’s Third Amendment to the Second Amended and Restated Non-Employee Director Compensation Plan (the “Non-Employee Director Compensation Plan”). There are 500,000 shares authorized for issuance under this plan for the sole purpose of satisfying elections to receive shares of common stock in lieu of cash for service as a director, of which 316,356 shares remain available for future issuances at January 28, 2017. The Non-Employee Director Compensation Plan is a stand-alone plan and is not a sub-plan under our 2016 Incentive Compensation Plan (the “2016 Plan”). Accordingly, shares issued under this plan do not reduce the shares available for issuance under the 2016 Plan.
With respect to the compensation of our non−employee directors, the Compensation Committee’s goal is to maintain a level of compensation paid to our non-employee directors that is in the median of the companies within our peer group as well as similarly-sized companies. The Compensation Committee has historically retained Sibson Consulting, most recently amended subsequentin June 2013, to year end.
Beginning in fiscal 2015, thereview compensation for our non-employee directors are requiredin comparison to take 50%our then peer group. As described above in “Compensation Discussion and Analysis – Use of theirCompensation Consultants,” the Compensation Committee has the authority to retain compensation consultants and other outside advisors, without Board or management approval, to assist it in carrying out its duties, including the evaluation of compensation for our non−employee directors. The Compensation Committee may accept, reject or modify any recommendations by compensation consultants or other outside advisors.
For fiscal 2016, our Non-Employee Director Compensation Plan provided that non-employee directors receive an annual retainer of $102,250, which is paid in quarterly installments of $25,562.50. Each director receives $1,500 for participation in equity. Anyeach in-person meeting of the Board and its committees and $750 for participation in each telephonic meeting. In addition, the Chairmen of the Audit Committee, Compensation Committee, Nominating and Corporate Governance Committee and Cybersecurity and Data Privacy Committee receive an annual payment of $10,000, $5,000, $5,000 and $5,000, respectively, which is paid quarterly. Upon the initial election to the Board, a non-employee director will receive a stock option grant of 15,000 shares under the 2016 Plan.
Each non-employee director is required to receive 50% of his or her annual retainer in equity, in the form of stock deferredoptions, stock or stock optionsdeferred shares. Because the Non-Employee Director Compensation Plan is not a shareholder approved plan and the acquisition of equity must be voluntary under NASDAQ rules, we cannot utilize shares under this plan to satisfy this mandated election. Therefore, in fiscal 2016 any grants of equity to satisfy this required election were issued to a director as partfrom the 2006 Plan through its expiration or through the 2016 Plan thereafter. Any voluntary election of shares, above this 50% retainer requirement, are issued from our equity incentive plans. Only discretionary elections of equity will bewas issued from the Non-Employee Director Compensation Plan. Stock options and deferred shares were issued from either the 2006 Plan or 2016 Plan.
On February 2, 2017, the Board approved the addition of a Lead Independent Director position, if the Chairman of the Board is not independent. Accordingly, the Board approved the Third Amendment to the Non-Employee Director Compensation Plan to establish the role of a Lead Independent Director with an annual retainer of $18,000, to be paid quarterly. On February 2, 2017, the Board appointed Mr. Kyees as Lead Independent Director.
We believe that our Non-Employee Director Compensation Plan will support our ongoing efforts to attract and retain exceptional directors to provide strategic guidance to our Company. We believe that the total compensation that our non-employee directors receive is in line with our current peer group.
Director Compensation Table
The following table sets forth the compensation paid to our directors during fiscal 2016. David A. Levin is not included in the following table as he is a Named Executive Officer and, accordingly, received no compensation for his services as a director. Compensation earned by Mr. Levin is included above in the “Summary Compensation Table.”
2016 DIRECTOR COMPENSATION TABLE
Name |
| Fees Earned or Paid in Cash ($)(1) |
|
| Option Awards ($)(2) |
|
| All Other Compensation ($) |
|
| Total ($) |
| ||||
Seymour Holtzman, Executive Chairman |
| $ | — |
|
| $ | — |
|
| $ | 396,750 |
| (3) | $ | 396,750 |
|
Alan S. Bernikow |
| $ | 108,250 |
|
| $ | — |
|
| $ | — |
|
| $ | 108,250 |
|
Jesse Choper |
| $ | 124,250 |
|
| $ | — |
|
| $ | — |
|
| $ | 124,250 |
|
John E. Kyees |
| $ | 117,000 |
|
| $ | — |
|
| $ | — |
|
| $ | 117,000 |
|
Willem Mesdag |
| $ | 114,250 |
|
| $ | — |
|
| $ | — |
|
| $ | 114,250 |
|
Ward K. Mooney |
| $ | 109,000 |
|
| $ | — |
|
| $ | — |
|
| $ | 109,000 |
|
George T. Porter, Jr. |
| $ | 113,250 |
|
| $ | — |
|
| $ | — |
|
| $ | 113,250 |
|
Mitchell S. Presser |
| $ | 117,000 |
|
| $ | — |
|
| $ | — |
|
| $ | 117,000 |
|
Ivy Ross |
| $ | 109,750 |
|
| $ | — |
|
| $ | 5,000 |
| (4) | $ | 114,750 |
|
(1) | All non-employee directors are required to receive at least 50% of their annual retainer in the form of equity. For fiscal 2016, Messrs. Bernikow, Choper, Mooney and Ms. Ross elected to receive 50% of their retainer in unrestricted shares of our common stock and Messrs. Kyees, Mesdag and Porter elected to receive 50% of their retainer in deferred stock. Mr. Presser elected to receive 100% of his retainer in unrestricted shares of our common stock. Messrs. Bernikow, Choper, Mesdag, Porter and Ms. Ross elected to receive cash for all meetings. Mr. Presser elected to receive shares of unrestricted stock for all meetings. Mr. Kyees elected to receive his fees for meetings in a combination of 50% cash and 50% deferred shares of our common stock and Mr. Mooney elected to receive his fees in a combination of 50% cash and 50% in shares of unrestricted stock. With the exception of Mr. Presser who elected to receive his payment for committee chair in shares of unrestricted stock, all committee chairs elected to receive their payment in cash. The number of shares issued as payment for an earned director fee is determined by taking the director fee earned and dividing by the consolidated closing price of our common stock on the grant date. For quarterly retainer fees, the grant date is the first business day of each respective quarter. For meetings, the grant date is the last business day of the month in which the meeting occurred and for a director’s re-election to the board, the grant date is the last business day of the month in which such re-election occurs. Mr. Holtzman did not receive any payment for director meetings. |
(2) | There were no Stock Awards or Options Awards to any of the directors for fiscal 2016. Each director had the following number of stock options outstanding at January 28, 2017: Mr. Bernikow: 25,000; Mr. Choper: 25,000; Mr. Kyees: 43,648; Mr. Mesdag: 15,000; Mr. Mooney: 25,000; Mr. Porter: 44,136; Mr. Presser: 25,000 and Ms. Ross: 15,000. |
(3) | Mr. Holtzman received compensation from us pursuant to Employment and Chairman Compensation Agreement. See “Chairman Compensation” below for additional information. |
(4) | Ms. Ross received a cash payment of $5,000, paid in quarterly installments, to serve as Chair to the Company’s Interim Marketing Advisory Group. |
Executive Chairman Compensation
As of August 7, 2014, Mr. Holtzman is compensated for his services pursuant to an Employment and Chairman Compensation Agreement. Pursuant to that agreement, Mr. Holtzman serves as both an employee of the Company, reporting to the Board of Directors, and, as Executive Chairman, with the duties of the Chairman of the Board set forth in the Company’s Fourth Amended and Restated By-Laws. The initial term of the agreement is for two years. Commencing August 7, 2015, the agreement can be automatically extended for an additional one-year term on each anniversary date. Accordingly, the current expiration date of the agreement is August 7, 2018. As compensation, Mr. Holtzman receives an annual base salary of $24,000 for his employment services and an annual compensation of $372,750 for his services as Executive Chairman. Sibson Consulting reviewed Mr. Holtzman’s compensation under this agreement and concluded that the total compensation was at the higher end of the range, when compared to our peer group. The Compensation Committee reviewed the Sibson report and approved the agreement and compensation.
Subsequent to the end of fiscal 2016, on May 25, 2017, Mr. Holtzman and the Company entered into the First Amendment to the Employment and Chairman Compensation Agreement under which Mr. Holtzman’s annual compensation for his services as Executive Chairman was reduced from $372,750 to $200,000.
If we engage Mr. Holtzman’s services to assist us in a specific and significant corporate transaction or event, the Compensation Committee, at its discretion, has the right to grant Mr. Holtzman a bonus for his additional services. No such bonus was granted during fiscal 2016.
Section 6.2(A) of our Fourth Amended and Restated By-Laws states that the Chairman of the Board is to preside at all meetings of the Board of Directors and stockholders of the Corporation and perform such other duties and functions as may from time to time be assigned by the Board of Directors.
Compensation Committee Interlocks and Insider Participation
For fiscal 2016, the members of the Compensation Committee were Messrs. Kyees, Mesdag, Mooney and Porter. Mr. Kyees resigned his position as a member of the Compensation Committee effective February 2, 2017 and his seat was not filled. Persons serving on the Compensation Committee had no relationships with our Company in fiscal 2016 other than their relationship to us as directors entitled to the receipt of standard compensation as directors and members of certain committees of the Board and their relationship to us as beneficial owners of shares of our common stock and options exercisable for shares of common stock. No person serving on the Compensation Committee or on the Board of Directors is an executive officer of another entity for which an executive officer of ours serves on such entity’s board of directors or compensation committee.
Item 12. Security Ownership of Certain Beneficial Owners and Management and Related Stockholder Matters
The following table sets forth certain information with respect to persons known to us to be the beneficial owners of more than five percent of the issued and outstanding shares of our common stock as of May 15, 2017. We were informed that, except as indicated, each person has sole voting and investment power with respect to all shares of our common stock shown as beneficially owned by such person, subject to community property laws where applicable.
Name and Address of Beneficial Owner |
| Number of |
| Percent of |
|
Red Mountain Capital Partners, LLC |
| 7,862,469 | (2) | 15.87 | % |
Red Mountain Partners, L.P. |
|
|
|
|
|
RMCP GP LLC |
|
|
|
|
|
Red Mountain Capital Management, Inc. |
|
|
|
|
|
Willem Mesdag |
|
|
|
|
|
10100 Santa Monica Boulevard, Suite 925 |
|
|
|
|
|
Los Angeles, California 90067 |
|
|
|
|
|
|
|
|
|
|
|
RBC Global Asset Management (U.S.) Inc. |
| 6,399,672 | (3) | 12.92 | % |
50 South Sixth Street |
|
|
|
|
|
Suite 2350 |
|
|
|
|
|
Minneapolis, Minnesota 55402 |
|
|
|
|
|
|
|
|
|
|
|
Glenhill Advisors, LLC |
| 5,714,694 | (4) | 11.53 | % |
Glenn J. Krevlin |
|
|
|
|
|
Glenhill Capital Advisors, LLC |
|
|
|
|
|
Glenhill Capital Management, LLC |
|
|
|
|
|
Glenhill Capital Overseas Master Fund, LP |
|
|
|
|
|
600 Fifth Avenue, 11th Floor |
|
|
|
|
|
New York, New York 10020 |
|
|
|
|
|
|
|
|
|
|
|
Seymour Holtzman |
| 4,475,658 | (5) | 9.03 | % |
100 N. Wilkes Barre Blvd. |
|
|
|
|
|
Wilkes Barre, Pennsylvania 18702 |
|
|
|
|
|
|
|
|
|
|
|
Prescott Group Capital Management, LLC |
| 3,471,598 | (6) | 7.01 | % |
1924 South Utica |
|
|
|
|
|
Suite 1120 |
|
|
|
|
|
Tulsa, Oklahoma 74101-6429 |
|
|
|
|
|
|
|
|
|
|
|
BlackRock, Inc. |
| 2,518,154 | (7) | 5.08 | % |
55 East 52nd Street New York, New York 10055 |
|
|
|
|
|
(1) | Beneficial ownership is determined in accordance with the rules of the SEC and generally includes voting or investment power with respect to securities. In computing the number of shares beneficially owned by a person and the percentage ownership of that person, shares of our common stock subject to options and warrants held by that person that are currently exercisable, or that become exercisable within 60 days, are deemed outstanding. Such shares, however, are not deemed outstanding for the purpose of computing the percentage ownership of any other person. Percentage ownership is based on 49,543,425 shares of our common stock outstanding as of May 15, 2017. |
(3) | Based on Amendment No. 8 to Schedule 13G, dated February 10, 2017, stating that RBC Global Asset Management (U.S.) Inc. was the beneficial owner of the number of shares of common stock set forth opposite its name in the table. |
(4) | Based on Amendment No. 10 to Schedule 13G, dated February 14, 2017, stating that Glenhill Advisors, LLC, Glenn J. Krevlin, Glenhill Capital Advisors, LLC, Glenhill Capital Management, LLC and Glenhill Capital Overseas Master Fund, LP were the beneficial owners of the number of shares of common stock set forth opposite their names in the table (except that Glenhill Capital Management, LLC indicates beneficial ownership of only 4,697,731 shares and Glenhill Capital Overseas Master Fund, LP indicates beneficial ownership of only 2,903,116 shares). Glenn J. Krevlin is the managing member and control person of Glenhill Advisors, LLC and is the sole shareholder of Krevlin Management, Inc. Krevlin Management, Inc. is the managing member of Glenhill Capital Advisors, LLC, which is the investment manager of Glenhill Capital Overseas Master Fund, LP, Glenhill Concentrated Long Master Fund LLC, and Glenhill Long Fund, LP, each (along with Mr. Krevlin) a security holder of the Company. Glenhill Advisors, LLC is the managing member of Glenhill Capital Management LLC. Glenhill Capital Management, LLC is the managing member of Glenhill Concentrated Long Master Fund, LLC, and Glenhill Long Fund GP, LLC, and is sole shareholder of Glenhill Capital Overseas GP, Ltd. Glenhill Capital Overseas GP, Ltd. is the general partner of Glenhill Capital Overseas Master Fund, LP. Glenhill Long GP, LCC is the general partner of Glenhill Long Fund, LP. |
(5) | Based on a Form 4, dated April 8, 2013. |
(6) | Based on a Form 13F as of March 31, 2017, which stated Prescott Group Capital Management, LLC’s was the beneficial owner of the number of shares of common stock set forth opposite its name in the table. |
(7) | Based on Amendment No. 1 to Schedule 13G, dated March 9, 2017, stating that BlackRock, Inc. was the beneficial owner of the number of shares of common stock set forth opposite its name in the table. |
Security Ownership of Management
The following table sets forth certain information as of May 15, 2017, with respect to our directors, our Named Executive Officers (as defined above under “Executive Compensation”) and our directors and executive officers as a group. Except as indicated, each person has sole voting and investment power with respect to all shares of our common stock shown as beneficially owned by such person, subject to community property laws where applicable.
Name and Title |
| Number of |
| Percent of |
|
Seymour Holtzman |
| 4,475,658 |
| 9.03 | % |
Executive Chairman of the Board |
|
|
|
|
|
David A. Levin |
| 1,339,491 | (2) | 2.69 | % |
Chief Executive Officer, President and Director |
|
|
|
|
|
Peter H. Stratton, Jr. |
| 106,744 | (3) | * |
|
Senior Vice President, Chief Financial Officer and Treasurer |
|
|
|
|
|
Kenneth M. Ederle |
| 171,656 | (4) | * |
|
Senior Vice President, Chief Merchandising Officer – Planning and Allocation |
|
|
|
|
|
Robert S. Molloy |
| 228,262 | (5) | * |
|
Senior Vice President, General Counsel and Secretary |
|
|
|
|
|
Brian S. Reaves |
| 125,228 | (6) | * |
|
Senior Vice President and Chief Sales Officer |
|
|
|
|
|
Derrick Walker |
| 76,388 |
| * |
|
Former Senior Vice President, Chief Marketing Officer |
|
|
|
|
|
Nancy S. Youssef |
| 15,192 |
| * |
|
Former Senior Vice President, International Business Development |
|
|
|
|
|
John E. Kyees, Lead Independent Director |
| 50,396 | (7) | * |
|
Jesse Choper, Director |
| 135,869 | (8) | * |
|
Willem Mesdag, Director |
| 7,862,469 | (9) | 15.87 | % |
Ward K. Mooney, Director |
| 104,272 | (8) | * |
|
George T. Porter, Jr., Director |
| 134,551 | (10) | * |
|
Mitchell S. Presser, Director |
| 241,556 | (8) | * |
|
Ivy Ross, Director |
| 49,590 | (11) | * |
|
Directors and executive officers as a group (22 persons) |
| 15,778,238 | (12) | 31.28 | % |
* | Less than 1% |
(1) | Beneficial ownership is determined in accordance with the rules of the SEC and generally includes voting or investment power with respect to securities. In computing the number of shares beneficially owned by a person and the percentage ownership of that person, shares of our common stock subject to options and warrants held by that person that are currently exercisable, or that become exercisable within 60 days, are deemed outstanding. Such shares, however, are not deemed outstanding for the purpose of computing the percentage ownership of any other person. Percentage ownership is based on 49,543,425 shares of our common stock outstanding as of May 15, 2017. |
(2) | Includes 195,942 shares subject to stock options exercisable within 60 days and 85,514 shares of unvested restricted stock. |
(3) | Includes 42,403 shares subject to stock options exercisable within 60 days and 14,758 shares of unvested restricted stock. |
(4) | Includes 64,951 shares subject to stock options exercisable within 60 days and 23,982 shares of unvested restricted stock. |
(5) | Includes 89,512 shares subject to stock options exercisable within 60 days and 23,982 shares of unvested restricted stock. |
(6) | Includes 63,679 shares subject to stock options exercisable within 60 days and 20,292 shares of unvested restricted stock. |
(7) | Includes 43,648 shares subject to stock options exercisable within 60 days and excludes 38,820 shares of deferred stock. |
(8) | Includes 25,000 shares subject to stock options exercisable within 60 days. |
(9) | Includes 15,000 shares subject to stock options exercisable within 60 days and excludes 31,674 shares of deferred stock. Mr. Mesdag is the president, sole executive officer, sole director and sole shareholder of Red Mountain Capital Management, Inc. With the exception of the stock options, all shares are held by Red Mountain Partners, L.P., a wholly-owned subsidiary of Red Mountain Capital Management, Inc. Mr. Mesdag, by virtue of his direct or indirect control of Red Mountain Partners, L.P., is deemed to beneficially own all of the securities reported held by Red Mountain Partners, L.P. The shares are held in a margin account. There are currently no margin borrowings on the account, nor have there ever been, and the shares are not otherwise pledged. |
(10) | Includes 44,136 shares subject to stock options exercisable within 60 days and excludes 29,700 shares of deferred stock held by the George Porter Trust. Mr. Porter is the trustee of the trust and has all voting and investment rights. |
(11) | Includes 15,000 shares subject to stock options exercisable within 60 days. |
(12) | Includes 898,417 shares subject to stock options exercisable within 60 days, 315,076 of unvested shares of restricted stock and excludes 100,194 shares of deferred stock. |
EQUITY COMPENSATION PLAN INFORMATION
The following is a summary of information with respect to our equity compensation plans as of January 28, 2017:
Plan category |
| Number of securities to be issued upon exercise of outstanding options, warrants and rights (a) |
|
| Weighted-average exercise price of outstanding options, warrants and rights (b) |
|
| Number of securities remaining available for future issuance under equity compensation plans (excluding securities reflected in column (a)) (c) |
|
| |||
Equity compensation plans approved by security holders (1) |
|
| 2,524,546 |
|
| $ | 4.98 |
|
|
| 6,233,824 |
| (3) |
Equity compensation plans not approved by security holders (2) |
|
| — |
|
|
| — |
|
|
| 316,356 |
|
|
Total |
|
| 2,524,546 |
|
| $ | 4.98 |
|
|
| 6,550,180 |
| (3) |
(1) | Our 2006 Incentive Compensation Plan (as amended, the “2006 Plan”) expired on July 31, 2016. At the Company’s 2016 Annual Meeting of Stockholders held August 4, 2016, the stockholders approved the adoption of the 2016 Incentive Compensation Plan (the “2016 Plan”). In addition to the initial share reserve under the 2016 Plan of 5,200,000 shares, the 525,538 shares that remained available under our 2006 Plan were added and became available for issuance under the 2016 Plan on August 4, 2016. In addition, any shares outstanding under the 2006 Plan at August 4, 2016 that subsequently terminate, expire or are canceled for any reason without having been exercised or paid are added back and become available for issuance under the 2016 Plan, with options and stock appreciation rights being added back on a 1 to 1 basis and full-value awards being added back on a 1 to1.9 basis. Accordingly, an additional 588,796 shares were added to share availability under the 2016 Plan during fiscal 2016. At January 28, 2017, there were 6,233,824 shares available under the 2016 Plan. |
Of the 2,524,546 options outstanding at January 28, 2017, approximately 1,059,941 options are subject to the achievement of performance targets. The respective fair value,performance targets for these performance-based stock options were not met in fiscal 2016. Therefore, subsequent to year-end, upon completion of the audited financial statements, all of these performance-based awards were cancelled. Because these stock options were granted under the 2006 Plan, the shares underlying the stock options were added back and became available for issuance under the 2016 Plan. See “Compensation Discussion and Analysis- Compensation Components, Fiscal 2016 Compensation Decisions, 2017 Annual Incentive Plan Targets and Long-Term Incentive Programs” for more information.
Of the remaining 1,464,605 options outstanding at January 28, 2017, 1,460,103 were issued to its non-employee directors as compensationfrom the 2006 Plan. If any of these options terminate, expire or are cancelled without having been exercised or paid, they will be added back and become available for fiscalissuance under the 2016 fiscal 2015Plan.
(2) | Pursuant to the Third Amendment to the Second Amended and Restated Non-Employee Director Compensation Plan (“Director Plan”), we have 500,000 shares authorized for stock issuances in lieu of cash director fees, of which 316,356 shares remained available at January 28, 2017. |
(3) | Subsequent to the end of fiscal 2016, in March 2017, we granted 434,558 shares of unvested restricted stock awards in connection with the partial achievement of performance targets under the 2016 Wrap-Around Plan. In April 2017, we granted 734,268 time-based restricted stock units in connection with our 2017-2018 LTIP. |
Item 13. Certain Relationships and fiscal 2014:
|
| Number of shares of common stock issued |
|
| Fair value of common stock issued |
| ||
Fiscal 2016 |
|
| 14,509 |
|
| $ | 68,456 |
|
Fiscal 2015 |
|
| 24,947 |
|
| $ | 127,734 |
|
Fiscal 2014 |
|
| 40,910 |
|
| $ | 213,749 |
|
H. RELATED PARTIESRelated Transactions, and Director Independence
Seymour Holtzman and Holtzman/Jewelcor Management, Inc.(JMI)
Seymour Holtzman, the Executive Chairman of the Company’s Board of Directors (the “Board”), is the chairman, chief executive officer and president and, together with his wife, indirectly, the majority shareholder of Jewelcor Management, Inc. (“JMI”). Mr. Holtzman, who was initially appointed Chairman of the Board in April 2000, is the beneficial holder of approximately 8.8% of the outstanding common stock of the Company at January 28, 2017.
From October 1999 through August 7, 2014, the Company had an ongoing consulting agreement with JMIPursuant to provide the Company with services as may be agreed upon, from time to time, between JMI and the Company (the “Consulting Agreement”). In connection with the execution of the Employment and Chairman Compensation Agreement discussed below, on August 7, 2014, the Company terminated the Consulting Agreement. Prior to the execution of the Employment and Chairman Compensation Agreement and through August 7, 2014, Mr. Holtzman was primarily compensated by the Company for his services pursuant to this Consulting Agreement. Under the terms of the Consulting Agreement at the time of its termination, Mr. Holtzman was entitled to receive annual consulting compensation of $372,750 and a salary of $24,000.
On August 7, 2014, the Company entered into an Employment and Chairman Compensation Agreement with Mr. Holtzman. Pursuant to the terms of the agreement,entered into on August 7, 2014, Mr. Holtzman serves as both an employee of the Company, reporting to the Board, and, in his capacity as Executive Chairman of the Board, as Executive Chairman, with the duties of the Chairman of the Board as set forth in the Company’s Fourth Amended and Restated By-Laws. The initial term of the agreement was for two years. Commencing August 7, 2015, on each anniversary date, the agreement is automatically extendsextended for an additional one-year term.term on each anniversary date. Accordingly, the current expiration date of the agreement is August 7, 2018. As compensation for the employment services, Mr. Holtzman receives an annual base salary of $24,000 and, as compensation for his services as Executive Chairman, Mr. Holtzmanhe receives annual compensation of $372,750.
John E. KyeesSubsequent to the end of fiscal 2016, on May 25, 2017, Mr. Holtzman and the Company entered into the First Amendment to the Employment and Chairman Compensation Agreement under which Mr. Holtzman’s annual compensation for his services as Executive Chairman was reduced from $372,750 to $200,000.
John Kyees, a directorA complete summary of all compensation and consulting fees paid to Mr. Holtzman is described above under “Director Compensation- Executive Chairman Compensation.”
Review, Approval or Ratification of Transactions with Related Persons
Due to Mr. Holtzman’s role as our Executive Chairman of the Board of Directors and the relevance of the services he provides on a consulting basis, our Compensation Committee had the primary responsibility for reviewing and approving the Employment and Chairman Compensation Agreement dated August 7, 2014.
Our Audit Committee Charter, which was adopted in June 2003, provides that our Audit Committee shall review all related party transactions on an ongoing basis and all such transactions must be approved by the Audit Committee, to the extent required by the Sarbanes−Oxley Act of 2002, the Securities Exchange Commission and NASDAQ. Because NASDAQ provides that such oversight can be conducted by either a company’s audit committee or another independent body of the board of directors, the Audit Committee determined that due to the nature of Mr. Holtzman’s ownership in the Company since 2010,as well as our previous consulting agreement with JMI the review and approval of all transactions pursuant to any arrangement with Mr. Holtzman would be the primary responsibility of the Compensation Committee.
For all other related party transactions, the review and approval of such transactions is the responsibility of our Audit Committee.
Director Independence
Our Board of Directors is currently comprised of nine members with one vacancy. A majority of the members of the Board are “independent” under the rules of the Nasdaq Global Select Market (“Nasdaq”). The Board has determined that the following directors are independent: Messrs. Choper, Kyees, Mesdag, Mooney, Porter, Presser and Ms. Ross.
Item 14. Principal Accounting Fees and Services
The Audit Committee engaged KPMG LLP to serve as our independent registered public accounting firm during the fiscal year ended January 28, 2017. KPMG LLP has served as the Company’s interim Chief Financial Officer from February 2, 2014 through May 31, 2014. Pursuant to an employment agreement, Mr. Kyees received compensation at a rate of $3,000 per day plus benefits and reimbursement for all business and travel expenses. Mr. Kyees was also eligible to participate in the Company’s annual
incentive program for the period in which he served as interim Chief Financial Officer. For fiscal 2014, Mr. Kyees earned total compensation from the Company of $389,920 for services he provided as interim Chief Financial Officer.independent registered public accounting firm since June 6, 2013.
I. EMPLOYEE BENEFIT PLANS
The Company accounts for its employee benefit plans in accordance with ASC Topic 715 Compensation – Retirement Benefits. ASC Topic 715 requires an employer to: (a) recognize in its statement of financial position an asset for a plan’s over-funded status or a liability for a plan’s under-funded status; (b) measure a plan’s assetsPrincipal Accounting Fees and its obligations that determine its funded status as of the end of the employer’s fiscal year (with limited exceptions); and (c) recognize changes in the funded status of a defined benefit postretirement plan in the year in which the changes occur.
These amounts will be subsequently recognized as net periodic pension cost pursuant to the Company’s historical accounting policy for amortizing such amounts. Further, actuarial gains and losses that arise in subsequent periods and are not recognized as net periodic pension cost in the same periods will be recognized as a component of accumulated other comprehensive income (loss). The amortization of the unrecognized loss included in accumulated other comprehensive income (loss) and expected to be recognized in net periodic pension cost in fiscal 2017 is approximately $788,000.
Noncontributory Pension Plan
In connection with the Casual Male acquisition, the Company assumed the assets and liabilities of the Casual Male Noncontributory Pension Plan “Casual Male Corp. Retirement Plan”, which was previously known as the J. Baker, Inc. Qualified Plan (the “Pension Plan”). Casual Male Corp. froze all future benefits under this plan on May 1, 1997.Services
The following table sets forth the Pension Plan’s funded status at January 28, 2017 and January 30, 2016:
|
| January 28, 2017 |
|
| January 30, 2016 |
| ||
|
| in thousands |
| |||||
Change in benefit obligation: |
|
|
|
|
|
|
|
|
Balance at beginning of period |
| $ | 16,845 |
|
| $ | 18,927 |
|
Benefits and expenses paid |
|
| (733 | ) |
|
| (668 | ) |
Interest costs |
|
| 686 |
|
|
| 634 |
|
Settlements |
|
| (346 | ) |
|
| (21 | ) |
Actuarial (gain) loss |
|
| 4 |
|
|
| (2,027 | ) |
|
|
|
|
|
|
|
|
|
Balance at end of year |
| $ | 16,456 |
|
| $ | 16,845 |
|
|
|
|
|
|
|
|
|
|
Change in fair value of plan assets |
|
|
|
|
|
|
|
|
Balance at beginning of period |
| $ | 11,969 |
|
| $ | 12,945 |
|
Actual return on plan assets |
|
| 844 |
|
|
| (433 | ) |
Employer contributions |
|
| — |
|
|
| 146 |
|
Settlements |
|
| (346 | ) |
|
| (21 | ) |
Benefits and expenses paid |
|
| (733 | ) |
|
| (668 | ) |
|
|
|
|
|
|
|
|
|
Balance at end of period |
| $ | 11,734 |
|
| $ | 11,969 |
|
|
|
|
|
|
|
|
|
|
Reconciliation of Funded Status |
|
|
|
|
|
|
|
|
Projected benefit obligation |
| $ | 16,456 |
|
| $ | 16,845 |
|
Fair value of plan assets |
|
| 11,734 |
|
|
| 11,969 |
|
Unfunded Status |
| $ | (4,722 | ) |
| $ | (4,876 | ) |
|
|
|
|
|
|
|
|
|
Balance Sheet Classification |
|
|
|
|
|
|
|
|
Other long-term liabilities |
| $ | 4,722 |
|
| $ | 4,876 |
|
Total plan expense and other amounts recognized in accumulated other comprehensive lossfees accrued or paid to the Company’s independent registered accounting firm for the fiscal years ended January 28, 2017 January 30, 2016 and January 31, 2015 include the following components:
|
| January 28, 2017 |
|
| January 30, 2016 |
|
| January 31, 2015 |
| |||
Net pension cost: |
| (in thousands) |
| |||||||||
Interest cost on projected benefit obligation |
| $ | 686 |
|
| $ | 634 |
|
| $ | 669 |
|
Expected return on plan assets |
|
| (927 | ) |
|
| (1,013 | ) |
|
| (1,002 | ) |
Amortization of unrecognized loss |
|
| 946 |
|
|
| 1,026 |
|
|
| 591 |
|
Net pension cost |
| $ | 705 |
|
| $ | 647 |
|
| $ | 258 |
|
|
|
|
|
|
|
|
|
|
|
|
|
|
Other changes recognized in other comprehensive loss, before taxes: |
|
|
|
|
|
|
|
|
|
|
|
|
Unrecognized losses at the beginning of the year |
| $ | 8,139 |
|
| $ | 9,746 |
|
| $ | 6,614 |
|
Net periodic pension cost |
|
| (705 | ) |
|
| (647 | ) |
|
| (258 | ) |
Employer contribution |
|
| — |
|
|
| 146 |
|
|
| 468 |
|
Change in plan assets and benefit obligations |
|
| (154 | ) |
|
| (1,106 | ) |
|
| 2,922 |
|
Unrecognized losses at the end of year |
| $ | 7,280 |
|
| $ | 8,139 |
|
| $ | 9,746 |
|
The Company’s contribution for (“fiscal 2017 is estimated to be approximately $586,000.
Assumptions used to determine the benefit obligations as of January 28, 20172016”) and January 30, 2016 include a discount rate of 4.00% for (“fiscal 2016 and 4.16% for fiscal 2015. Assumptions used to determine the net periodic benefit cost for the years ended January 28, 2017, January 30, 2016 and January 31, 2015 included a discount rate of 4.00% for fiscal 2016, 4.16% for fiscal 2015 and 3.42% for fiscal 2014.
The expected long-term rate of return for plan assets was assumed to be 8.00% for both fiscal 2016 and fiscal 2015. The expected long-term rate of return assumption was developed considering historical and future expectations for returns for each asset class.
Estimated Future Benefit Payments
The estimated future benefits for the next ten fiscal years are as follows:2015”):
|
| Total |
| |
FISCAL YEAR |
| (in thousands) |
| |
2017 |
| $ | 804 |
|
2018 |
|
| 836 |
|
2019 |
|
| 867 |
|
2020 |
|
| 945 |
|
2021 |
|
| 977 |
|
2022-2026 |
|
| 5,145 |
|
|
| $ | 9,574 |
|
|
| Fiscal 2016 |
|
| Fiscal 2015 |
| ||
Audit fees (1) |
| $ | 784,385 |
|
| $ | 770,000 |
|
Audit-related fees |
|
| — |
|
|
| — |
|
Tax fees |
|
| — |
|
|
| — |
|
Other fees (2) |
|
| 1,780 |
|
|
| 1,650 |
|
Total fees |
| $ | 786,165 |
|
| $ | 771,650 |
|
(1) | Audit fees relate to professional services rendered in connection with the audits of our financial statements included in our Annual Reports on Form 10-K for fiscal 2016 and fiscal 2015, for services performed related to compliance with Section 404 of the Sarbanes-Oxley Act of 2002, and for reviews of the financial statements included in each of our Quarterly Reports on Form 10-Q. |
(2) | Other fees relate to an annual fee for online accounting research tool. |
The fair valuesPre-Approval of the Company’s noncontributory defined benefit retirement plan assets at the end of fiscal 2016 and fiscal 2015,Services by asset category, were as follows:
|
| Fair Value Measurement |
| |||||||||||||||||||||||||||||
|
| January 28, 2017 |
|
| January 30, 2016 |
| ||||||||||||||||||||||||||
(in thousands) |
| Quoted Prices in Active Markets for Identical Assets (Level 1) |
|
| Significant Observable Inputs (Level 2) |
|
| Significant Unobservable Inputs (Level 3) |
|
| Total |
|
| Quoted Prices in Active Markets for Identical Assets (Level 1) |
|
| Significant Observable Inputs (Level 2) |
|
| Significant Unobservable Inputs (Level 3) |
|
| Total |
| ||||||||
Asset category: |
|
|
|
|
|
|
|
|
|
|
|
|
|
|
|
|
|
|
|
|
|
|
|
|
|
|
|
|
|
|
|
|
Common Stock : |
|
|
|
|
|
|
|
|
|
|
|
|
|
|
|
|
|
|
|
|
|
|
|
|
|
|
|
|
|
|
|
|
U.S. |
| $ | 2,645 |
|
| $ | — |
|
| $ | — |
|
| $ | 2,645 |
|
| $ | 6,537 |
|
| $ | — |
|
| $ | — |
|
| $ | 6,537 |
|
Foreign |
|
| 210 |
|
|
| — |
|
|
| — |
|
|
| 210 |
|
|
| — |
|
|
| — |
|
|
| — |
|
|
| — |
|
Mutual Funds: |
|
|
|
|
|
|
|
|
|
|
|
|
|
|
|
|
|
|
|
|
|
|
|
|
|
|
|
|
|
|
|
|
U.S. Equity |
|
| 2,153 |
|
|
| — |
|
|
| — |
|
|
| 2,153 |
|
|
| 407 |
|
|
| — |
|
|
| — |
|
|
| 407 |
|
International Equity |
|
| 2,039 |
|
|
| — |
|
|
| — |
|
|
| 2,039 |
|
|
| 1,596 |
|
|
| — |
|
|
| — |
|
|
| 1,596 |
|
Bond |
|
| 4,418 |
|
|
| — |
|
|
| — |
|
|
| 4,418 |
|
|
| 2,914 |
|
|
| — |
|
|
| — |
|
|
| 2,914 |
|
Real Estate Investment Trust |
|
| 6 |
|
|
| — |
|
|
| — |
|
|
| 6 |
|
|
| — |
|
|
| — |
|
|
| — |
|
|
| — |
|
Cash |
|
| 263 |
|
|
| — |
|
|
| — |
|
|
| 263 |
|
|
| 515 |
|
|
| — |
|
|
| — |
|
|
| 515 |
|
Total |
| $ | 11,734 |
|
| $ | — |
|
| $ | — |
|
| $ | 11,734 |
|
| $ | 11,969 |
|
| $ | — |
|
| $ | — |
|
| $ | 11,969 |
|
The Company’s target asset allocation for fiscal 2017 and its asset allocation at January 28, 2017 and January 30, 2016 were as follows, by asset category:
|
| Target Allocation |
|
| Percentage of plan assets at |
| ||||||
|
| Fiscal 2017 |
|
| January 28, 2017 |
|
| January 30, 2016 |
| |||
Asset category: |
|
|
|
|
|
|
|
|
|
|
|
|
Equity securities |
|
| 60.0 | % |
|
| 60.1 | % |
|
| 71.4 | % |
Debt securities |
|
| 38.0 | % |
|
| 37.7 | % |
|
| 24.3 | % |
Cash |
|
| 2.0 | % |
|
| 2.2 | % |
|
| 4.3 | % |
Total |
|
| 100.0 | % |
|
| 100.0 | % |
|
| 100.0 | % |
The target policy is set to maximize returns with consideration to the long-term nature of the obligations and maintaining a lower level of overall volatility through the allocation of fixed income. The asset allocation is reviewed throughout the year for adherence to the target policy and is rebalanced periodically towards the target weights.
Supplemental Executive Retirement Plan
In connection with the Casual Male acquisition, the Company also assumed the liability of the Casual Male Supplemental Retirement Plan (the “SERP”).
The following table sets forth the SERP’s funded status at January 28, 2017 and January 30, 2016:
|
| January 28, 2017 |
|
| January 30, 2016 |
| ||
|
| in thousands |
| |||||
Change in benefit obligation: |
|
|
|
|
|
|
|
|
Balance at beginning of period |
| $ | 670 |
|
| $ | 745 |
|
Benefits and expenses paid |
|
| (30 | ) |
|
| (30 | ) |
Interest costs |
|
| 27 |
|
|
| 25 |
|
Actuarial (gain) loss |
|
| (15 | ) |
|
| (70 | ) |
Balance at end of year |
| $ | 652 |
|
| $ | 670 |
|
|
|
|
|
|
|
|
|
|
Change in fair value of plan assets |
|
|
|
|
|
|
|
|
Balance at beginning of period |
| $ | — |
|
| $ | — |
|
Employer contributions |
|
| 30 |
|
|
| 30 |
|
Benefits and expenses paid |
|
| (30 | ) |
|
| (30 | ) |
Balance at end of period |
| $ | — |
|
| $ | — |
|
|
|
|
|
|
|
|
|
|
Projected benefit obligation |
| $ | 652 |
|
| $ | 670 |
|
|
|
|
|
|
|
|
|
|
Reconciliation of Funded Status |
|
|
|
|
|
|
|
|
Projected benefit obligation |
| $ | 652 |
|
| $ | 670 |
|
Fair value of plan assets |
|
| — |
|
|
| — |
|
Unfunded Status |
| $ | (652 | ) |
| $ | (670 | ) |
|
|
|
|
|
|
|
|
|
Balance Sheet Classification |
|
|
|
|
|
|
|
|
Other long-term liabilities |
| $ | 652 |
|
| $ | 670 |
|
Other changes recognized in other comprehensive loss, before taxes (in thousands):
|
| January 28, 2017 |
|
| January 30, 2016 |
|
| January 31, 2015 |
| |||
Other changes recognized in other comprehensive loss, before taxes: |
| in thousands |
| |||||||||
Unrecognized losses at the beginning of the year |
| $ | 178 |
|
| $ | 256 |
|
| $ | 142 |
|
Net periodic pension cost |
|
| (33 | ) |
|
| (34 | ) |
|
| (31 | ) |
Employer contribution |
|
| 30 |
|
|
| 30 |
|
|
| 30 |
|
Change in benefit obligations |
|
| (18 | ) |
|
| (74 | ) |
|
| 115 |
|
Unrecognized losses at the end of year |
| $ | 157 |
|
| $ | 178 |
|
| $ | 256 |
|
Assumptions used to determine the benefit obligations as of January 28, 2017 and January 30, 2016 included a discount rate of 4.00% for fiscal 2016 and 4.16% for fiscal 2015. Assumptions used to determine the net periodic benefit cost for the years ended January 28, 2017, January 30, 2016 and January 31, 2015 included a discount rate of 4.00% for fiscal 2016, 4.16% for fiscal 2015 and 3.42% for fiscal 2014.
Defined Contribution Plan
The Company has one defined contribution plan, the Destination XL Group, Inc. 401(k) Savings Plan (the “401(k) Plan”). Under the 401(k) Plan, the Company offers a qualified automatic contribution arrangement (“QACA”) with the Company matching 100% of the first 1% of deferred compensation and 50% of the next 5% (with a maximum contribution of 3.5% of eligible compensation). As of January 1, 2015, employees who are 21 years of age or older are eligible to make deferrals after 6 months of employment and are eligible to receive a Company match after one year of employment and 1,000 hours.
The Company recognized $2.2 million, $2.0 million and $1.6 million of expense under this plan in fiscal 2016, fiscal 2015 and fiscal 2014, respectively.
Sears Canada
In the second quarter of fiscal 2014, the Company notified Sears Canada of its intent to exit the business and began the process of an orderly wind-down. The Company ceased taking new orders and completed the run-off of operations through a final settlement with Sears during the fourth quarter of fiscal 2014. The loss for fiscal 2014 includes a charge, recorded in the second quarter of fiscal 2014, of approximately $0.8 million related primarily to inventory reserves and sales allowances as a result of our decision to exit the business. The following are the results of operations for fiscal 2014. There were no results of operations for this discontinued business in fiscal 2015 and fiscal 2016.
For the fiscal year ended: |
| January 31, 2015 |
| |
|
| (in thousands) |
| |
Sales |
| $ | (450 | ) |
Gross margin |
|
| (998 | ) |
Selling, general and administrative expenses |
|
| (120 | ) |
Depreciation and amortization |
|
| — |
|
Provision (benefit) from income taxes |
|
| — |
|
Loss from discontinued operations |
| $ | (1,118 | ) |
K. SUBSEQUENT EVENT
On March 17, 2017, the Company’s Board of Directors approved a stock repurchase program. Under the stock repurchase program, the Company may repurchase up to $12.0 million of its common stock through open market and privately negotiated transactions during fiscal 2017.Independent Auditors
The timingAudit Committee has adopted a policy governing the provision of audit and non-audit services by our independent registered public accounting firm. Pursuant to this policy, the amountAudit Committee will consider annually and, if appropriate, approve the provision of any repurchases of common stock will be determined based on the Company’s evaluation of market conditionsaudit services (including audit review and other factors. The stock repurchase program is expected to commence in the first quarter of fiscal 2017 and will expire on February 3, 2018, but may be suspended, terminated or modified at any time for any reason. The Company expects to finance the repurchases from operating funds and/or periodic borrowings on its Credit Facility. Any shares of repurchased common stock will be held as treasury stock.
L. SELECTED QUARTERLY DATA (UNAUDITED)
(Certain columns may not foot due to rounding.)
|
| FIRST QUARTER |
|
| SECOND QUARTER |
|
| THIRD QUARTER |
|
| FOURTH QUARTER |
|
| FULL YEAR |
| |||||
|
| (In Thousands, Except Per Share Data) |
| |||||||||||||||||
FISCAL YEAR 2016 |
|
|
|
|
|
|
|
|
|
|
|
|
|
|
|
|
|
|
|
|
Sales |
| $ | 107,891 |
|
| $ | 117,875 |
|
| $ | 101,871 |
|
| $ | 122,646 |
|
| $ | 450,283 |
|
Gross profit |
|
| 49,766 |
|
|
| 54,843 |
|
|
| 45,238 |
|
|
| 55,034 |
|
|
| 204,881 |
|
Operating income (loss) |
|
| 1,055 |
|
|
| 1,017 |
|
|
| (3,639 | ) |
|
| 2,544 |
|
|
| 977 |
|
Income (loss) before taxes |
|
| 271 |
|
|
| 234 |
|
|
| (4,418 | ) |
|
| 1,823 |
|
|
| (2,090 | ) |
Income tax provision |
|
| 57 |
|
|
| 35 |
|
|
| 34 |
|
|
| 40 |
|
|
| 166 |
|
Net income (loss) |
| $ | 214 |
|
| $ | 199 |
|
| $ | (4,452 | ) |
| $ | 1,783 |
|
| $ | (2,256 | ) |
Earnings (loss) per share – basic and diluted |
| $ | 0.00 |
|
| $ | 0.00 |
|
| $ | (0.09 | ) |
| $ | 0.04 |
|
| $ | (0.05 | ) |
|
|
|
|
|
|
|
|
|
|
|
|
|
|
|
|
|
|
|
|
|
FISCAL YEAR 2015 |
|
|
|
|
|
|
|
|
|
|
|
|
|
|
|
|
|
|
|
|
Sales |
| $ | 104,405 |
|
| $ | 114,147 |
|
| $ | 99,625 |
|
| $ | 124,044 |
|
| $ | 442,221 |
|
Gross profit |
|
| 48,239 |
|
|
| 53,883 |
|
|
| 44,864 |
|
|
| 56,853 |
|
|
| 203,839 |
|
Operating income (loss) |
|
| 248 |
|
|
| (166 | ) |
|
| (4,626 | ) |
|
| (546 | ) |
|
| (5,090 | ) |
Loss before taxes |
|
| (513 | ) |
|
| (912 | ) |
|
| (5,409 | ) |
|
| (1,314 | ) |
|
| (8,148 | ) |
Income tax provision |
|
| 61 |
|
|
| 67 |
|
|
| 63 |
|
|
| 69 |
|
|
| 260 |
|
Net loss |
| $ | (574 | ) |
| $ | (979 | ) |
| $ | (5,472 | ) |
| $ | (1,383 | ) |
| $ | (8,408 | ) |
Earnings (loss) per share – basic and diluted |
| $ | (0.01 | ) |
| $ | (0.02 | ) |
| $ | (0.11 | ) |
| $ | (0.03 | ) |
| $ | (0.17 | ) |
The Company’s fiscal quarters are based on a retail cycle of 13 weeks. Historically, and consistent with the retail industry, the Company has experienced seasonal fluctuations as it relates to its operating income and net income. Traditionally, a significant portion of the Company’s operating income and net income is generated in the fourth quarter, as a result of the holiday selling season.
Item 9. Changes in and Disagreements with Accountants on Accounting and Financial Disclosure
None.
Item 9A. Controls and Procedures
Management’s Conclusions Regarding the Effectiveness of Disclosure Controls and Procedures
As requiredattest services) by Rule 13a-15 under the Securities Exchange Act of 1934, as amended (the “Exchange Act”), our management, under the supervision and with the participation of our Chief Executive Officer and Chief Financial Officer, evaluated the effectiveness of our disclosure controls and procedures (as defined in Rules 13a-15(e) and 15d-15(e) under the Exchange Act) as of January 28, 2017. Based on this evaluation, our Chief Executive Officer and Chief Financial Officer concluded that, as of January 28, 2017, our disclosure controls and procedures were effective.
Management’s Annual Report on Internal Control Over Financial Reporting
Our management is responsible for establishing and maintaining adequate internal control over financial reporting as defined in Rule 13a-15(f) under the Exchange Act. Our internal control over financial reporting is a process designed under the supervision of our Chief Executive Officer and Chief Financial Officer to provide reasonable assurance regarding the reliability of financial reporting and the preparation of financial statements for external purposes in accordance with generally accepted accounting principles. Our internal control over financial reporting includes those policies and procedures that:
(i) pertain to the maintenance of records that, in reasonable detail, accurately and fairly reflect the transactions and dispositions of our assets;
(ii) provide reasonable assurance that transactions are recorded as necessary to permit preparation of financial statements in accordance with generally accepted accounting principles, and that our receipts and expenditures are being made only in accordance with authorizations of our management and directors; and
(iii) provide reasonable assurance regarding prevention or timely detection of unauthorized acquisition, use or disposition of assets that could have a material effect on the financial statements.
There are inherent limitations in the effectiveness of any internal control, including the possibility of human error and the circumvention or overriding of controls. Accordingly, even effective internal controls can provide only reasonable assurances with respect to financial statement preparation. Also, projections of any evaluation of effectiveness to future periods are subject to the risk that controls may become inadequate because of changes in conditions, or that the degree of compliance with the policies or procedures may deteriorate.
Management assessed the design and effectiveness of our internal control over financial reporting as of January 28, 2017. In making this assessment, management used the criteria set forth by the Committee of Sponsoring Organizations of the Treadway Commission (COSO) in Internal Control- Integrated Framework (2013).
Based on management’s assessment and the above mentioned criteria, management determined that we maintained effective internal control over financial reporting as of January 28, 2017.
KPMG, LLP, our independent registered public accounting firm has issued an audit reportand consider and, if appropriate, pre-approve the provision of certain defined permitted non-audit services within a specified dollar limit. It will also consider on our internal control over financial reporting asa case-by-case basis and, if appropriate, approve specific engagements that do not fit within the definition of January 28, 2017, which appears below.pre-approved services or established fee limits.
The policy provides that any proposed engagement that does not fit within the definition of a pre-approved service or is not within the fee limits must be presented to the Audit Committee for consideration at its next regular meeting or to the Chairman of the Audit Committee in time sensitive cases. The Audit Committee will regularly review summary reports detailing all services (and related fees and expenses) being provided to us by the independent registered public accounting firm.
All of the services provided in fiscal 2016 and fiscal 2015 under Audit Fees and Other Fees were pre-approved by the Audit Committee.
REPORT OF INDEPENDENT REGISTERED PUBLIC ACCOUNTING FIRM
The Board of Directors and Shareholders
of Destination XL Group, Inc.
We have audited Destination XL Group, Inc.’s (the Company) internal control over financial reporting as of January 28, 2017, based on criteria established in Internal Control—Integrated Framework (2013) issued by the Committee of Sponsoring Organizations of the Treadway Commission (COSO). Destination XL Group, Inc.’s management is responsible for maintaining effective internal control over financial reporting and for its assessment of the effectiveness of internal control over financial reporting, included in the accompanying Management’s Annual Report on Internal Control Over Financial Reporting. Our responsibility is to express an opinion on the company’s internal control over financial reporting based on our audit.
We conducted our audit in accordance with the standards of the Public Company Accounting Oversight Board (United States). Those standards require that we plan and perform the audit to obtain reasonable assurance about whether effective internal control over financial reporting was maintained in all material respects. Our audit included obtaining an understanding of internal control over financial reporting, assessing the risk that a material weakness exists, and testing and evaluating the design and operating effectiveness of internal control based on the assessed risk. Our audit also included performing such other procedures as we considered necessary in the circumstances. We believe that our audit provides a reasonable basis for our opinion.
A company’s internal control over financial reporting is a process designed to provide reasonable assurance regarding the reliability of financial reporting and the preparation of financial statements for external purposes in accordance with generally accepted accounting principles. A company’s internal control over financial reporting includes those policies and procedures that (1) pertain to the maintenance of records that, in reasonable detail, accurately and fairly reflect the transactions and dispositions of the assets of the company; (2) provide reasonable assurance that transactions are recorded as necessary to permit preparation of financial statements in accordance with generally accepted accounting principles, and that receipts and expenditures of the company are being made only in accordance with authorizations of management and directors of the company; and (3) provide reasonable assurance regarding prevention or timely detection of unauthorized acquisition, use, or disposition of the company’s assets that could have a material effect on the financial statements.
Because of its inherent limitations, internal control over financial reporting may not prevent or detect misstatements. Also, projections of any evaluation of effectiveness to future periods are subject to the risk that controls may become inadequate because of changes in conditions, or that the degree of compliance with the policies or procedures may deteriorate.
In our opinion, Destination XL Group, Inc. maintained, in all material respects, effective internal control over financial reporting as of January 28, 2017, based on the criteria established in Internal Control—Integrated Framework (2013) issued by the Committee of Sponsoring Organizations of the Treadway Commission.
We also have audited, in accordance with the standards of the Public Company Accounting Oversight Board (United States), the consolidated balance sheets of Destination XL Group, Inc. and subsidiaries as of January 28, 2017 and January 30, 2016, and the related consolidated statements of operations, comprehensive income (loss), changes in stockholders’ equity, and cash flows for each of the years in the three-year period ended January 28, 2017, and our report dated March 20, 2017 expressed an unqualified opinion on those consolidated financial statements.
/s/ KPMG LLP
Boston, Massachusetts
March 20, 2017
Changes in Internal Control Over Financial Reporting
No change in our internal control over financial reporting (as defined in Rules 13a-15(f) and 15d-15(f) under the Exchange Act) occurred during the fiscal quarter ended January 28, 2017 that has materially affected, or is reasonably likely to materially affect, our internal control over financial reporting.
None.
Pursuant to Paragraph G(3) of the General Instructions to Form 10-K, the information required by Part III (Items 10, 11, 12, 13 and 14) is being incorporated by reference herein from our definitive proxy statement (or an amendment to this Annual Report on Form 10-K) to be filed with the Securities and Exchange Commission within 120 days of the end of the fiscal year ended January 28, 2017 in connection with our 2017 Annual Meeting of Stockholders.
Item 10. Directors, Executive Officers and Corporate Governance
Information with respect to this item is incorporated by reference from our definitive proxy statement (or amendment to this Annual Report on Form 10-K) to be filed with the SEC within 120 days of the end of the fiscal year ended January 28, 2017.
Item 11. Executive Compensation
Information with respect to this item is incorporated by reference from our definitive proxy statement (or amendment to this Annual Report on Form 10-K) to be filed with the SEC within 120 days of the end of the fiscal year ended January 28, 2017.
Item 12. Security Ownership of Certain Beneficial Owners and Management and Related Stockholder Matters
Information with respect to this item is incorporated by reference from our definitive proxy statement (or amendment to this Annual Report on Form 10-K) to be filed with the SEC within 120 days of the end of the fiscal year ended January 28, 2017.
Item 13. Certain Relationships and Related Transactions, and Director Independence
Information with respect to this item is incorporated by reference from our definitive proxy statement (or amendment to this Annual Report on Form 10-K) to be filed with the SEC within 120 days of the end of the fiscal year ended January 28, 2017.
Item 14. Principal Accounting Fees and Services
Information with respect to this item is incorporated by reference from our definitive proxy statement (or amendment to this Annual Report on Form 10-K) to be filed with the SEC within 120 days of the end of the fiscal year ended January 28, 2017.
Item 15.Exhibits, Financial Statement Schedules
15(a)(1) Financial Statements
The list of consolidated financial statements and notes required by this Item 15(a)(1) is set forth in the “Index to Consolidated Financial Statements” on page 42 of this Annual Report.
15(a)(2) Financial Statement Schedules
All schedules have been omitted because the required information is not applicable or is not present in amounts sufficient to require submission of the schedules, or because the information required is included in the financial statements or notes thereto.
15(a)(3) Exhibits
The list of exhibits required by this Item 15(a)(3) is set forth in the “Index to Exhibits” beginning on page 75 of this Annual Report.
Omitted at registrant’s option.
| ||||
|
|
| ||
|
| |||
|
|
| ||
|
|
| ||
|
|
| ||
|
|
| ||
|
|
| ||
|
|
| ||
|
|
| ||
|
|
| ||
|
|
| ||
|
|
| ||
|
|
| ||
|
|
| ||
|
|
| ||
|
| |||
|
| |||
|
|
| ||
|
|
| ||||
|
| |||
|
| |||
|
| |||
|
| |||
|
| |||
|
| |||
|
| |||
|
| |||
|
| |||
|
| |||
|
| |||
|
| |||
|
| |||
|
|
| ||
|
|
|
| ||||
|
|
| ||
|
|
| ||
|
|
| ||
|
|
| ||
|
|
| ||
|
|
| ||
|
|
| ||
|
|
| ||
|
|
| ||
|
|
| ||
|
|
| ||
|
|
| ||
|
|
| ||
|
|
| ||
|
|
| ||
|
|
| ||
|
|
| ||
|
|
|
| ||||
|
| |||
|
| |||
|
| |||
|
| |||
|
| |||
|
|
| ||
|
|
| ||
31.1 | Certification of Chief Executive Officer of the Company pursuant to Rule 13a-14(a) under the Securities Exchange Act of 1934. |
|
| |
|
|
| ||
31.2 | Certification of Chief Financial Officer of the Company pursuant to Rule 13a-14(a) under the Securities Exchange Act of 1934. |
|
| |
|
|
|
| |
|
|
|
| |
|
|
|
|
|
|
|
|
|
Pursuant to the requirements of Section 13 or 15(d) of the Securities Exchange Act of 1934, the registrant has duly caused this report to be signed on its behalf by the undersigned, thereunto duly authorized.
| ||||||
|
|
|
| |||
| DESTINATION XL GROUP, INC. | |||||
|
|
| ||||
|
| |||||
By: | /s/ DAVID A. LEVIN | |||||
|
| David A. Levin President and Chief Executive Officer | ||||
Pursuant to the requirements of the Securities Exchange Act of 1934, this report has been signed below by the following persons on behalf of the registrant in the capacities and on the dates indicated.
|
|
|
| |||
|
|
|
| |||
Peter H. Stratton, Jr. | ||||||
|
| Senior Vice President, Chief Financial Officer and Treasurer |
| |||
|
|
| ||||
|
|
| ||||
|
|
| ||||
|
|
| ||||
|
|
| ||||
|
|
| ||||
|
|
| ||||
|
|
| ||||
|
|
| ||||
|
|
| ||||
39
79