
UNITED STATES
SECURITIES AND EXCHANGE COMMISSION
Washington, D.C. 20549
FORM 10-K
☒ | ANNUAL REPORT PURSUANT TO SECTION 13 OR 15(d) OF THE SECURITIES EXCHANGE ACT OF 1934 |
For the fiscal year ended SEPTEMBER 30, 2020
OR
☐ | TRANSITION REPORT PURSUANT TO SECTION 13 OR 15(d) OF THE SECURITIES EXCHANGE ACT OF 1934 FOR THE TRANSITION PERIOD FROM TO |
Commission File Number 001-31759
ANNUAL REPORT PURSUANT TO SECTION 13 OR 15(d) OF THE SECURITIES EXCHANGE ACT OF 1934
FOR THE FISCAL YEAR ENDED SEPTEMBER 30, 2017
Commission File Number: 001-31759
PANHANDLE OIL AND GASPHX MINERALS INC.
(Exact name of registrantRegistrant as specified in its charter)Charter)
| oklahoma | 73-1055775 |
(State or other jurisdiction of incorporation | or organization) | (I.R.S. Employer Identification No.) |
| ||
Oklahoma City, OK |
| |
(Address of principal executive offices) | (Zip |
Registrant’s telephone number, including area code: (405) 948-1560
Securities registered pursuant to Section 12(b) of the Act:
Title of each class |
| Trading |
|
| |
| ||
|
| |
|
| |
Class A Common Stock, $0.01666 par value |
| |
| ||
|
| |
| ||
Securities registered pursuant to Section 12(g) of the Act: None
Indicate by check mark if the registrantRegistrant is a well-known seasoned issuer, as defined in Rule 405 of the Securities Exchange Act of 1934. Act. Yes X ☐No☒
Indicate by check mark if the registrantRegistrant is not required to file reports pursuant to Section 13 or Section 15(d) of the Securities Exchange Act of 1934. Act. Yes X ☐No
Indicate by check mark whether the registrantRegistrant: (1) has filed all reports required to be filed by Section 13 or 15(d) of the Securities Exchange Act of 1934 during the preceding 12 months (or for such shorter period that the registrantRegistrant was required to file such reports), and (2) has been subject to such filing requirements for the past 90 days. X Yes☒No☐
Indicate by check mark whether the registrantRegistrant has submitted electronically and posted on its corporate Web site, if any, every Interactive Data File required to be submitted and posted pursuant to Rule 405 of Regulation S-T (§232.405 of this chapter) during the preceding 12 months (or for such shorter period)period that the registrantRegistrant was required to submit and post such files. X files). Yes ☒ No
Indicate by check mark if disclosure of delinquent filers pursuant to Item 405 of Regulation S-K (§229.405 of this chapter) is not contained herein, and will not be contained, to the best of the registrant’s knowledge, in definitive proxy or information statements incorporated by reference in Part III of this Form 10-K or any amendment to this Form 10-K. X ☐
Indicate by check mark whether the registrant is a large accelerated filer, an accelerated filer, or a non-accelerated filer.filer, smaller reporting company, or an emerging growth company. See definitionthe definitions of “large accelerated filer,” “accelerated filer,” “smaller reporting company,” and large accelerated filer”“emerging growth company” in Rule 12b-2 of the Securities Exchange Act of 1934. (Check one):Act.
Large accelerated filer | ☐ |
| Accelerated filer |
| ☒ | |
Non-accelerated filer | ☐ |
| Smaller reporting company | ☒ | ||
Emerging growth company | ☐ |
| ||||
Emerging growth company
If an emerging growth company, indicate by check mark if the registrant has elected not to use the extended transition period for complying with any new or revised financial accounting standards provided pursuant to Section 13(a) of the Exchange Act. Yes No
☐
Indicate by check mark whether the registrantRegistrant has filed a report on and attestation to its management’s assessment of the effectiveness of its internal control over financial reporting under Section 404(b) of the Sarbanes-Oxley Act (15 U.S.C. 7262(b)) by the registered public accounting firm that prepared or issued its audit report. ☒
Indicate by check mark whether the Registrant is a shell company (as defined in Rule 12b-2 of the Securities Exchange Act of 1934)Act). Yes X Noyes☐no☒
The aggregate market value of the voting stock held by non-affiliates of the registrant, computed by using the $19.20$3.69 per share closing price of registrant's Class A Common Stock, as reported by the New York Stock Exchange at March 31, 2017,2020, was $297,276,077. As$56,675,049.
The number of December 1, 2017, 16,678,016 shares of Registrant’s Class A Common Stock were outstanding. Asoutstanding as of December 1, 2017, there were no shares of Class B Common Stock outstanding.
Documents Incorporated By Reference
The information required by Part III of this Report, to the extent not set forth herein, is incorporated by reference from the registrant’s Definitive Proxy Statement relating to the annual meeting of stockholders to be held on March 7, 2018. The definitive proxy statement will be filed with the Securities and Exchange Commission within 120 days after the end of the fiscal year to which this Report relates.3, 2020, was 22,389,194.
DOCUMENTS INCORPORATED BY REFERENCE
Portions of the definitive Proxy Statement of PHX Minerals Inc. (to be filed no later than 120 days after September 30, 2020) relating to the Annual Meeting of Stockholders to be held on March 2, 2021, are incorporated into Part III of this Form 10-K.
T A B L E O F C O N T E N T S
|
|
|
| Page |
PART I | ||||
Item 1 |
|
| 1 | |
Item 1A |
|
|
| |
Item 1B |
|
|
| |
Item 2 |
|
|
| |
Item 3 |
|
|
| |
Item 4 |
|
|
| |
|
|
|
|
|
PART II |
|
|
|
|
Item 5 |
| Market for Common Equity, Related Stockholder Matters and Issuer Purchases of Equity Securities |
|
|
Item 6 |
|
|
| |
Item 7 |
| Management’s Discussion and Analysis of Financial Condition and Results of Operations |
|
|
Item 7A |
|
|
| |
Item 8 |
|
|
| |
Item 9 |
| Changes in and Disagreements with Accountants on Accounting and Financial Disclosure |
|
|
Item 9A |
|
|
| |
Item 9B |
|
|
| |
|
|
|
|
|
PART III |
|
|
|
|
Item 10-14 |
|
|
| |
|
|
|
|
|
PART IV |
|
|
|
|
Item 15 |
| Exhibits, Financial Statement Schedules and Reports on Form 8-K |
|
|
DEFINITIONSSpecial Note Regarding Forward Looking Statements
This report includes “forward-looking statements” within the meaning of Section 27A of the Securities Act of 1933 (the “Securities Act”), as amended, and Section 21E of the Securities Exchange Act of 1934, as amended (the “Exchange Act”). These statements involve known and unknown risks, uncertainties and other factors that may cause our actual results, performance or achievements to be materially different from any future results, performance or achievements expressed or implied by the forward-looking statements. In some cases, you can identify forward-looking statements in this Form 10-K by words such as “anticipate,” “project,” “intend,” “estimate,” “expect,” “believe,” “predict,” “budget,” “projection,” “goal,” “plan,” “forecast,” “target” or similar expressions.
All statements, other than statements of historical facts, included in this report that address activities, events or developments that we expect or anticipate will or may occur in the future are forward-looking statements. Forward-looking statements may include, but are not limited to statements relating to: our ability to execute our business strategies; the volatility of realized natural gas and oil prices; the level of production on our properties; estimates of quantities of natural gas, oil and NGL reserves and their values; general economic or industry conditions; legislation or regulatory requirements; conditions of the securities markets; our ability to raise capital; changes in accounting principles, policies or guidelines; financial or political instability; acts of war or terrorism; title defects in the properties in which we invest; and other economic, competitive, governmental, regulatory or technical factors affecting our properties, operations or prices.
We caution you that the forward-looking statements contained in this Form 10-K are subject to risks and uncertainties, many of which are beyond our control, incident to the exploration for and development, production and sale of natural gas and oil. These risks include, but are not limited to, the risks described in Item 1A of this Annual Report on Form 10-K for the year ended September 30, 2020 (the “2020 Annual Report on Form 10-K” or this “Annual Report”), and all quarterly reports on Form 10-Q filed subsequently thereto.
Should one or more of the risks or uncertainties described above or elsewhere in our 2020 Annual Report on Form 10-K occur, or should underlying assumptions prove incorrect, our actual results and plans could differ materially from those expressed in any forward-looking statements. Any forward-looking statement speaks only as of the date of which such statement is made, and the Company undertakes no obligation to correct or update any forward-looking statement, whether as a result of new information, future events or otherwise, except as required by applicable law.
Except as required by applicable law, all forward-looking statements attributable to us are expressly qualified in their entirety by this cautionary statement. This cautionary statement should also be considered in connection with any subsequent written or oral forward-looking statements that we or persons acting on our behalf may issue.
Glossary of Certain Terms
The following is a glossary of certain accounting, natural gas and oil industry and other defined terms are used in this report:Annual Report:
ASU | Accounting Standards Update. |
Bcf | billion cubic feet. |
Bcfe |
|
Bbl | barrel. |
Board | board of directors of the Company. |
BTU | British Thermal Units. |
Common Stock | the Company’s Class A Common Stock. |
completion | the process of treating a drilled well followed by the installation of permanent equipment for the production of natural gas and/or crude oil. |
conventional | an area believed to be capable of producing crude oil and natural gas occurring in discrete accumulations in structural and stratigraphic traps. |
DD&A | depreciation, depletion and amortization. |
developed acreage | the number of acres allocated or assignable to productive wells or wells capable of production. |
development well | a well drilled within the proved area of a natural gas or crude oil reservoir to the depth of a stratigraphic horizon known to be productive. |
dry hole | exploratory or development well that does not produce natural gas and/or crude oil in economically producible quantities. |
EBITDA | earnings before interest, taxes, depreciation and amortization (including impairment). This is a Non-GAAP measure. |
ESOP | the PHX Minerals Inc. Employee Stock Ownership and 401(k) Plan, a tax qualified, defined contribution plan. |
exploratory well | a well drilled to find a new field or to find a new reservoir in a field previously found to be productive of natural gas or crude oil in another reservoir. |
FASB | the Financial Accounting Standards Board. |
field | an area consisting of a single reservoir or multiple reservoirs all grouped on, or related to, the same individual geological structural feature or stratigraphic condition. The field name refers to the surface area, although it may refer to both the surface and the underground productive formations. |
formation | a layer of rock, which has distinct characteristics that differ from nearby rock. |
G&A | general and administrative costs. |
GAAP | generally accepted accounting principles. |
gross acres or gross wells | the total acres or wells in which an interest is owned. |
held by production or HBP | an oil and gas lease continued in effect into its secondary term for so long as a producing gas and/or oil well is located on any portion of the leased premises or lands pooled therewith. |
horizontal drilling | a drilling technique used in certain formations where a well is drilled vertically to a certain depth and then drilled horizontally within a specified interval. |
hydraulic fracturing | a process involving the high-pressure injection of water, sand and additives into rock formations to stimulate natural gas and crude oil production. |
Independent Consulting Petroleum Engineer(s) | DeGolyer and MacNaughton of Dallas, Texas. |
LOE | lease operating expense. |
Mcf | thousand cubic feet. |
Mcfd | thousand cubic feet per day. |
Mcfe | natural gas stated on an Mcf basis and crude oil and natural gas liquids converted to a thousand cubic feet of natural gas equivalent by using the ratio of one Bbl of crude oil or natural gas liquids to six Mcf of natural gas. |
Mcfed | natural gas stated on an Mcf basis and crude oil and natural gas liquids converted to a thousand cubic feet of natural gas equivalent by using the ratio of one Bbl of crude oil or natural gas liquids to six Mcf of natural gas per day. |
Mmbtu | million BTU. |
Mmcf | million cubic feet. |
Mmcfe | natural gas stated on an Mmcf basis and crude oil and natural gas liquids converted to a million cubic feet of natural gas equivalent by using the ratio of one thousand Bbl of crude oil or natural gas liquids to six Mmcf of natural gas. |
minerals, mineral acres or mineral interests | fee mineral acreage owned in perpetuity by the Company. |
net acres or net wells | the sum of the fractional interests owned in gross acres or gross wells. |
NGL | natural gas liquids. |
NRI | net revenue interest. |
NYMEX | New York Mercantile Exchange. |
OPEC | Organization of Petroleum Exporting Countries. |
overriding royalty interest | an interest in the natural gas and oil produced under a lease, or the proceeds from the sale thereof, apportioned out of the working interest, to be received free and clear of all costs of development, operation or maintenance. |
PDP | proved developed producing. |
play | term applied to identified areas with potential natural gas and/or oil reserves. |
production or produced | volumes of natural gas, oil and NGL that have been both produced and sold. |
proved reserves | the quantities of natural gas and crude oil, which, by analysis of geoscience and engineering data, can be estimated with reasonable certainty to be economically producible from a given date forward, from known reservoirs and under existing economic conditions, operating methods, and government regulations prior to the time at which contracts providing the right to operate expire, unless evidence indicates renewal is reasonably certain. |
proved developed reserves | reserves expected to be recovered through existing wells with existing equipment and operating methods. |
proved undeveloped reserves or PUD | proved reserves expected to be recovered from new wells on undrilled acreage or from existing wells where a relatively major expenditure is required for recompletion. |
PV-10 | estimated pre-tax present value of future net revenues discounted at 10% using SEC rules. |
royalty interest | well interests in which the Company does not pay a share of the costs to drill, complete and operate a well, but receives a smaller proportionate share (as compared to a working interest) of production. |
SEC | the United States Securities and Exchange Commission. |
unconventional | an area believed to be capable of producing natural gas and crude oil occurring in accumulations that are regionally extensive, but may lack readily apparent traps, seals and discrete hydrocarbon water boundaries that typically define conventional reservoirs. These areas tend to have low permeability and may be closely associated with source rock, as is the case with gas and oil shale, tight oil and gas sands, and coalbed methane, and generally require horizontal drilling, fracture stimulation treatments or other special recovery processes in order to achieve economic production. |
undeveloped acreage | acreage on which wells have not been drilled or completed to a point that would permit the production of commercial quantities of natural gas and/or crude oil. |
working interest | well interests in which the Company pays a share of the costs to drill, complete and operate a well and receives a proportionate share of production. |
WTI | West Texas Intermediate. |
As used herein, the “Company,” “PHX,” “we,” “us” and crude oil and natural gas liquids converted“our” refer to a billion cubic feet of natural gas equivalent by using the ratio of one million Bbl of crude oil or natural gas liquids to six Bcf of natural gas.
Board – board of directors.
BTU – British Thermal Units.
CEO – Chief Executive Officer.
CFO – Chief Financial Officer.
Company –PHX Minerals Inc., formerly known as Panhandle Oil and Gas Inc.
completion –, and its predecessors and subsidiaries unless the process of treating a drilled well followed by the installation of permanent equipment for the production of crude oil and/or natural gas.
conventional – an area believed to be capable of producing crude oil and natural gas occurring in discrete accumulations in structural and stratigraphic traps.
DD&A – depreciation, depletion and amortization.
developed acreage – the number of acres allocated or assignable to productive wells or wells capable of production.
development well – a well drilled within the proved area of a crude oil or natural gas reservoir to the depth of a stratigraphic horizon known to be productive.
dry gas – natural gas that remains in a gaseous state in the reservoir and does not produce large quantities of liquid hydrocarbons when brought to the surface. Also may refer to gas that has been processed or treated to remove a majority of natural gas liquids.
dry hole – exploratory or development well that does not produce crude oil and/or natural gas in economically producible quantities.
ESOP – the Panhandle Oil and Gas Inc. Employee Stock Ownership and 401(k) Plan, a tax qualified, defined contribution plan.
exploratory well – a well drilled to find a new field or to find a new reservoir in a field previously found to be productive of crude oil or natural gas in another reservoir.
FASB – the Financial Accounting Standards Board.
field – an area consisting of a single reservoir or multiple reservoirs all grouped on, or related to, the same individual geological structural feature or stratigraphic condition. The field name refers to the surface area, although it may refer to both the surface and the underground productive formations.
formation – a layer of rock, which has distinct characteristics that differ from nearby rock.
G&A – general and administrative expenses.
gross acres or gross wells – the total acres or wells in which a working interest is owned.
held by production or HBP – refers to an oil and gas lease continued into effect into its secondary term for so long as a producing oil and/or gas well is located on any portion of the leased premises or lands pooled therewith.
horizontal drilling – a drilling technique used in certain formations where a well is drilled vertically to a certain depth and then drilled horizontally within a specified interval.
hydraulic fracturing – a process involving the high pressure injection of water, sand and additives into rock formations to stimulate crude oil and natural gas production.
Independent Consulting Petroleum Engineer(s) or Independent Consulting Petroleum Engineering Firm –DeGolyer and MacNaughton of Dallas, Texas.
LOE – lease operating expense.
Mcf – thousand cubic feet.
Mcfd – thousand cubic feet per day.
Mcfe – natural gas stated on an Mcf basis and crude oil and natural gas liquids converted to a thousand cubic feet of natural gas equivalent by using the ratio of one Bbl of crude oil or natural gas liquids to six Mcf of natural gas.
Mmbtu – million BTU.
Mmcf – million cubic feet.
Mmcfe – natural gas stated on an Mmcf basis and crude oil and natural gas liquids converted to a million cubic feet of natural gas equivalent by using the ratio of one thousand Bbl of crude oil or natural gas liquids to six Mmcf of natural gas.
minerals, mineral acres or mineral interests – fee mineral acreage owned in perpetuity by the Company.
net acres or net wells – the sum of the fractional working interests owned in gross acres or gross wells.
NGL – natural gas liquids.
NYMEX – New York Mercantile Exchange.
OPEC – Organization of Petroleum Exporting Countries.
Panhandle – Panhandle Oil and Gas Inc.
PDP – proved developed producing.
play – term applied to identified areas with potential oil, NGL and/or natural gas reserves.
production or produced – volumes of oil, NGL and natural gas that have been both produced and sold.
proved reserves – the quantities of crude oil and natural gas, which, by analysis of geoscience and engineering data, can be estimated with reasonable certainty to be economically producible from a given date forward, from known reservoirs and under existing economic conditions, operating methods, and government regulations prior to the time at which contracts providing the right to operate expire, unless evidence indicates renewal is reasonably certain.
proved developed reserves – reserves expected to be recovered through existing wells with existing equipment and operating methods.
proved undeveloped reserves or PUD – proved reserves expected to be recovered from new wells on undrilled acreage or from existing wells where a relatively major expenditure is required for recompletion.
PV-10 – estimated pre-tax present value of future net revenues discounted at 10% using SEC rules.
royalty interest – well interests in which the Company does not pay a share of the costs to drill, complete and operate a well, but receives a smaller proportionate share (as compared to a working interest) of production.
SEC – the United States Securities and Exchange Commission.
unconventional – an area believed to be capable of producing crude oil and natural gas occurring in accumulations that are regionally extensive, but may lack readily apparent traps, seals and discrete hydrocarbon water boundaries that typically define conventional reservoirs. These areas tend to have low permeability and may be closely associated with
source rock, as is the case with oil and gas shale, tight oil and gas sands, and coalbed methane, and generally require horizontal drilling, fracture stimulation treatments or other special recovery processes in order to achieve economic production.
undeveloped acreage – acreage on which wells have not been drilled or completed to a point that would permit the production of commercial quantities of crude oil and/or natural gas.
working interest – well interests in which the Company pays a share of the costs to drill, complete and operate a well and receives a proportionate share of production.context requires otherwise.
Fiscal year references
All references to years in this report, unless otherwise noted, refer to the Company’s fiscal year end of September 30. For example, references to 20172020 mean the fiscal year ended September 30, 2017.2020.
References to oilnatural gas and natural gasoil properties
References to oilnatural gas and natural gasoil properties inherently include NGL associated with such properties.
GENERALOverview
Panhandle Oil and GasPHX Minerals Inc. was founded in Range, Texas County, Oklahoma, in 1926, as Panhandle Cooperative Royalty Company. The Company operated as a cooperative until 1979, when it merged into Panhandle Royalty Company and its shares became publicly traded. On April 2, 2007, the Company’s name was changed to Panhandle Oil and Gas Inc., and on October 8, 2020, the Company’s name was changed to PHX Minerals Inc.
While operatingPHX Minerals Inc. is an Oklahoma City-based company focused on perpetual natural gas and oil mineral ownership in resource plays in the United States. Prior to a strategy change in 2019, the Company participated with a working interest on some of its mineral and leasehold acreage and as a cooperative,result, the Company distributed moststill has legacy interests in leasehold acreage and non-operated interests in natural gas and oil properties.
Strategic Focus on Mineral Ownership
During fiscal 2019, the Company made the strategic decision to focus on perpetual natural gas and oil mineral ownership and growth through the acquisitions of producing minerals in its core areas of focus and the development of its net income to shareholders as cash dividends. Upon conversion to a public company in 1979, although still paying dividends,significant mineral acreage inventory. In accordance with this new strategy, the Company began to retain a substantial part ofceased taking any working interest positions on its cash flow tomineral and leasehold acreage going forward. During fiscal 2020, the Company did not participate with a working interest in the drilling of wellsany new wells. The Company believes that its strategy to focus on mineral ownership is the best path to giving its mineral acreage and to purchase additional mineral acreage. Several acquisitionsstockholders the greatest risk-weighted returns on their investments going forward.
A “mineral fee” is an interest in real property in which the owner owns all of additional mineral and leasehold acreage and small companies were made from 1980the rights to the present time.minerals under the surface forever, as compared to a mineral lease in which the lessee’s rights end at the expiration of the lease term or after there is no longer production on the lease. Generally, the mineral interest owner of a mineral fee interest reserves a non-cost bearing royalty interest upon the lease of such gas, oil, and other minerals to a gas and oil exploration and development company. Such companies will lease such mineral interest from the fee mineral owner for a term with the expectation of producing natural gas and oil, thereby generating free cash flow from bonuses and royalties to the mineral interest owner.
TheAs referenced above, the Company’s leasehold interests are non-operated working interests on the lease of the minerals from the mineral fee owner. These non-operated working interests require the Company is involvedto contribute its proportionate share of the costs incurred by the operator in the acquisition, management and development of non-operated oilsuch minerals. As discussed above and natural gas properties, including wells located onfurther below, the Company no longer expects to participate with such working interests going forward. The Company’s mineral and leasehold acreage. Panhandle’s mineral and leasehold properties are located primarily in Arkansas, New Mexico,Oklahoma, Texas, North Dakota, OklahomaArkansas and Texas.New Mexico. The majority of the Company’s oil, NGL and natural gas, oil and NGL production is from wells located in Arkansas, Oklahoma, Texas, North Dakota and Texas.Arkansas.
In March 2007, the Company increased its authorized Class A Common Stock from 12 million shares to 24 million shares. On October 8, 2014, the Company split its Class A Common Stock onAlthough a 2-for-1 basis.
The Company’s office is located at Grand Centre, Suite 300, 5400 N. Grand Blvd., Oklahoma City, OK 73112; telephone – (405) 948-1560; facsimile – (405) 948-2038. The Company’s website is www.panhandleoilandgas.com.
The Company files periodic reports with the SEC on Forms 10-Q and 10-K. These forms,significant amount of the Company’s annual report to shareholders and current press releases are available free of charge on our website as soon as reasonably practicable after they are filed with the SEC or made available to the public. Also, the Company posts copies of its various corporate governance documents on the website. From time to time, the Company posts other important disclosures to investors in the “Press Release” or “Upcoming Events” section of the website, as allowed by SEC rules.
Materials filed with the SEC may be read and copied at the SEC’s Public Reference Room at 100 F Street, N.E., Washington, D.C. 20549. Information on the operation of the Public Reference Room may be obtained by calling the SEC at 1-800-SEC-0330. The SEC also maintains an Internet website at www.sec.gov that contains reports, proxy and information statements, and other information regarding the Company that has been filed electronically with the SEC, including this Form 10-K.
(1)
Most of Panhandle’s revenues areis currently derived from the production and sale of oil, NGL and natural gas, (see Item 8 - “Financial Statements and Supplementary Data”). The Company’s oil and NGL on its working interests, a growing portion of its revenues is derived from royalties granted from the production and sale of natural gas, properties, including itsoil and NGL. These royalties are tied to ownership of mineral acreage, leasehold acreageand this ownership is perpetual, unless sold by the Company. Royalties are due and payable to the Company whenever natural gas, oil or NGL is produced and sold from wells located on the Company’s mineral acreage.
As of September 30, 2020, the Company owned approximately 252,443 perpetual mineral acres, as detailed in the table below:
Play |
| Net Acres |
|
| % Producing |
|
| % Leased But Not Producing |
|
| % Unleased |
| |
Arkoma Stack |
|
| 11,576 |
|
| 65% |
|
| 2% |
|
| 33% |
|
Bakken/Three Forks |
|
| 3,094 |
|
| 90% |
|
| 0% |
|
| 10% |
|
Fayetteville |
|
| 9,851 |
|
| 72% |
|
| 0% |
|
| 28% |
|
Permian |
|
| 38,788 |
|
| 8% |
|
| 15% |
|
| 77% |
|
SCOOP |
|
| 4,997 |
|
| 50% |
|
| 15% |
|
| 35% |
|
STACK |
|
| 5,767 |
|
| 89% |
|
| 5% |
|
| 6% |
|
Other |
|
| 178,370 |
|
| 19% |
|
| 3% |
|
| 78% |
|
Total: |
|
| 252,443 |
|
| 24% |
|
| 5% |
|
| 71% |
|
Approximately 71% of the Company’s net mineral position is currently unleased, providing the opportunity to generate additional cash flow from bonus payments and royalties without spending additional capital. The Company also owns leases on 17,091 net acres primarily in Oklahoma and working andinterests, royalty interests or both, in 6,510 producing natural gas and oil wells are located primarilyand 125 wells in Arkansas, New Mexico, North Dakota, Oklahoma and Texas (see Item 2 – “Properties”). the process of being drilled or completed.
Exploration and development of the Company’s oilnatural gas and natural gasoil properties are conducted in association with oil andby natural gas and oil exploration and production companies, primarily larger independent operating companies. The Company does not operate any of its oil and natural gas properties, butand oil properties. While the Company previously has been an active working interest participant for many years in wells drilled on its mineral and leasehold acreage, the Company’s current focus is on growth through mineral acresacquisitions and leasehold. through development of its significant mineral acreage inventory in its core areas of focus.
We intend to maximize value to our stockholders through the acquisition of mineral acreage in the core areas of resource plays with substantial undeveloped opportunities; divestiture of non-core minerals with limited optionality when the amount negotiated exceeds our projected total value; and aggressive leasing of our mineral holdings.
Our Business Strategy
Our principal business objective is to maximize value to our stockholders. At the end of 2019, we made the strategic decision to cease taking any working interest positions on our mineral and leasehold acreage going forward. Our focus is on growth through mineral acquisitions and through development of our significant mineral acreage inventory in our core areas. We believe this is the best path to giving our stockholders the greatest risk-weighted returns on their investment. We intend to accomplish this objective by executing the following corporate strategies:
• | Actively Manage Mineral and Leasehold Assets as a Portfolio to Maximize Value. We plan to manage our mineral and leasehold assets through the following: |
o | Growing our mineral fee holdings by acquiring mineral acreage in the core areas of natural gas and oil resource plays with substantial undeveloped opportunities that meet or exceed our minimum return threshold; |
o | Utilizing in-house technology and engineering expertise as a competitive advantage; |
o | Aggressively leasing our open mineral holdings; |
o | High-grading our asset base by selectively divesting non-core minerals with limited optionality when the amount negotiated exceeds our projected total value, then redeploying proceeds into our core areas of focus; and |
o | Optimizing our leasehold and working interest positions through strategic sales and farmouts for overriding royalty interests or cash payments. |
• | Deleveraging Our Balance Sheet. We plan to reduce debt in order to improve our financial position through the following: |
o | Continue to repay debt using free cash flow to ensure our ability to successfully operate in all business and commodity environments; and |
o | Hedging to manage commodity price risk and to protect our balance sheet and cash flow. |
Our Business Strengths
We believe the following attributes position the Company to achieve our objectives:
• | Focused on Perpetual Mineral Fee Ownership. Our strategic decision to focus on mineral ownership provides us with the perpetual option to benefit from future development and technology. We are focused on generating meaningful revenues through lease bonuses and royalty interests, and these revenues have been a growing proportion of our total revenues when compared to our working interests. We owned approximately 252,443 net mineral acres as of September 30, 2020, held principally in Oklahoma, Texas, North Dakota, Arkansas and New Mexico. We also held leases on 17,091 net acres primarily in Oklahoma; and working interests, royalty interests, or both, in 6,510 producing natural gas and oil wells and 125 wells in the process of being drilled or completed. |
• | Mineral and Leasehold Ownership in Multiple Top-Tier Resource Plays. We own mineral and leasehold interests in multiple top-tier resource plays in the United States, including positions in the SCOOP, STACK, Haynesville, Bakken/Three Forks, Arkoma Woodford, Eagle Ford, Permian Basin and Fayetteville plays. A significant portion of our revenues is derived from the production and sale of natural gas, oil and NGL from these positions. During the fiscal year ended September 30, 2020, production on our acreage averaged 23,479 Mcfed with approximately 69%, 19% and 12% derived from natural gas, oil and NGL, respectively. |
• | Material Undeveloped Mineral Position in Gas and Oil Producing Basins. Over 70% of our mineral fee position is currently not leased or producing, providing us with significant potential value and the opportunity to generate additional cash flows from bonus payments and royalties without deploying additional capital. We have an active program in place focused on leasing open acreage to generate additional lease bonus revenue and future royalty revenue. |
• | Stable and Flexible Financial Position. We maintain a stable and flexible financial position through the management of our debt, cash and working capital. We hedge to manage commodity price risk and to protect our balance sheet and cash flow. |
• | Experienced Management and Technical Team. We have a management and technical team with extensive experience in the oil and gas industry. Our management and technical team average over 20 years of industry experience in each applicable area of the Company, including accounting, land, geology, engineering and mergers and acquisitions. |
Principal Products and Markets
The majority of the Company’s drilling participations areCompany derives revenue through its bonus and royalty payments and from working interests on properties located in unconventional plays in Arkansas, Oklahomaits mineral and Texas.
PRINCIPAL PRODUCTS AND MARKETS
leasehold acreage. The Company’s principal products from the production associated with its royalty and non-operated interests, in order of revenue generated, are crude oil, natural gas crude oil and NGL. These products are generally sold by well operators to various purchasers, including pipeline and marketing companies, which service the areas where the Company’s producing wells are located. Since the Company does not operate any of the wells in which it owns an interest, it relies on the operating expertise of numerous companies that operate wells in which the Company owns interests. This includes expertise in the drilling and completion of new wells, producing well operations and, in most cases, the marketing or purchasing of production from the wells. Oil,Natural gas, oil and NGL and natural gas sales are principally handled by the well operator. Payment for oil, NGL and natural gas, oil and NGL sold is received by the Company from the well operator or the contracted purchaser.
Prices of oil, NGL and natural gas, oil and NGL are dependent on numerous factors beyond the Company’s control, of the Company, including supply and demand, competition, weather, international events and geo-political circumstances, actions taken by OPEC and economic, political and regulatory developments. Since demand for natural gas is subject to weather conditions, prices received for the Company’s natural gas production aremay be subject to seasonal variations.
The Company enters into price risk management financial instruments (derivatives) to reduce the Company’s exposure to short-term fluctuations in the price of natural gas and oil and natural gas.protect its return on investments. The derivative contracts apply only to a portion of the Company’s oil and natural gas and oil production, and provide only partial price protection against declines in oil and natural gas prices. These derivative contracts expose the Company to risk of financial lossand oil prices and may limit the benefit of future increases in oilnatural gas and natural gasoil prices. Please read Item 7A – “Quantitative and Qualitative Disclosures about Market Risk” and Note 112 to the financial statements included in Item 8 – “Financial Statements and Supplementary Data” for additional information regarding the derivative contracts.contracts entered into by the Company.
COMPETITIVE BUSINESS CONDITIONSCompetitive Business Conditions
The oil and natural gas industry is highly competitive, particularly in the search for new oil, NGLfee mineral interests and natural gas, oil and NGL reserves. Many factors affect Panhandle’s competitive position and the market for its products, which are beyond its control.control affect the Company’s competitive position. Some of these factors include: the quantity
(2)
and price of foreign oil imports; domestic supply and deliverability of natural gas, oil NGL and natural gas;NGL; changes in prices received for oil, NGL and natural gas, oil and NGL production; business and consumer demand for refined natural gas, oil products NGL and natural gas;NGL; and the effects of federal, state and local regulation of the exploration for, production of and sales of oil, NGL and natural gas, oil and NGL (see Item 1A – “Risk Factors”). Changes in any of these factors canMany companies have a dramatic influence on the price Panhandle receivessubstantially greater resources than we have, and such companies may have more resources to evaluate, bid for its oil, NGL and natural gas production.purchase more mineral fee, royalty and similar interests than our financial or human resources permit.
The Company does not operate any of the wells in which it has an interest; rather, it relies on companies with greater resources, staff, equipment, research and experience for operation of wells in both the drilling and production phases. The Company’s business strategy is to use its strongstable and flexible financial base and its mineral and leasehold acreage ownership,position, coupled with its own geologic and economic evaluations, either to elect to participate in drilling operations with these companies oracquire new mineral acreage and to lease or farmout its mineral orand leasehold acreage while retaining a royalty interest. Thisownership. We believe this strategy allows the Company to compete effectively in expensive and complex drilling operations it could not undertake on its own with limited capital and staffing.
SOURCES AND AVAILABILITY OF RAW MATERIALS
The existence of economically recoverable oil, NGL and natural gas reserves in commercial quantities is cruciala competitive mineral market; however, our ability to the ultimate realization of value from the Company’s mineral and leasehold acreage. These mineral and leasehold properties are essentially the raw materials to our business. The production and sale of oil, NGL and natural gas from the Company’s properties are essential to provide the cash flow necessary to sustain the ongoing viability of the Company. When it is evaluated to be beneficial to share value, the Company purchases oil and natural gas mineral and leasehold acreage to assure the continued availability of acreage with which to participate in exploration and development drilling operations and, subsequently, to produce and sell oil, NGL and natural gas. This participation in exploration, development and production activities and purchase of additional acreage is necessary to continue to supply the Company with the raw materials with which to generate additional cash flow. Mineral and leasehold acreage purchases are made from many owners. The Company does not rely on any particular companies or persons for the purchases ofacquire additional mineral fee, royalty and
similar interests in the future will depend upon our ability to evaluate and leasehold acreage.select suitable properties and to consummate transactions in a highly competitive environment.
MAJOR CUSTOMERSMajor Customers
The Company’s oil, NGL and natural gas, oil and NGL production is sold, in most cases, through itsour lessees or well operators to manynumerous different purchasers. During 2017, sales through two separate well operators accounted for approximately 18% and 13%
Regulation of the Company’s totalOil and Natural Gas Industry
General
As the owner of mineral fee interests and non-operating working interests, we do not have any employees or contractors in the field, and we are not directly subject to many of the regulations of the oil NGL and gas industry. The following disclosure describes regulations and environmental matters more directly associated with operators of natural gas sales. During 2016, sales through two separate well operators accounted for approximately 23% and 12% ofoil properties, including our current operators. Since the Company’s total oil, NGL and natural gas sales. During 2015, sales through two separate well operators accounted for approximately 23% and 14% of the Company’s total oil, NGL and natural gas sales. Generally, if one purchaser declines to continue purchasing the Company’s production, several other purchasers can be located. Pricing is generally consistent from purchaser to purchaser.
(3)
PATENTS, TRADEMARKS, LICENSES, FRANCHISES AND ROYALTY AGREEMENTS
The Company does not ownoperate any patents, trademarks, licenses or franchises. Royalty agreementswells in which it owns an interest, actual compliance with many laws and regulations is controlled by the well operators, with the Company being responsible only for its proportionate share of the costs, if any, involved on wells producingin which it owns a working interest.
Natural gas and oil NGLoperations are subject to various types of legislation, regulation and natural gas generate a portion ofother legal requirements enacted by governmental authorities. Legislation and regulation affecting the Company’s revenues. These royalties are tied to ownership of mineral acreage, and this ownership is perpetual, unless sold by the Company. Royalties are due and payable to the Company whenever oil, NGL or natural gas is produced and sold from wells located on the Company’s mineral acreage.
REGULATION
All of the Company’s well interests and non-producing properties are located onshore in the contiguous United States. The Company’sentire oil and natural gas propertiesindustry is continuously being reviewed for potential revision. Some of these requirements carry substantial penalties for failure to comply.
Although we are generally not directly subject to various taxes,many of the rules, regulations and limitations impacting the natural gas and oil exploration and production industry as whole, the operators who operate on our properties may be impacted by such as grossrules and regulations and we may be responsible for our proportionate share of costs for wells on which we own a working interest. While this may provide the Company with some insulation from compliance costs applicable to our operator-lessees, we may still be indirectly impacted by operator regulations because our revenue stream depends on operators and the production taxesof natural gas, oil and in some cases, ad valorem taxes.NGL.
StatesRegulation of Drilling and Production
The production of natural gas and oil is subject to regulation under federal, state and local statutes, rules, orders and regulations. These statutes and regulations require that operators obtain permits for drilling operations and drilling bonds, andas well as require reports concerning operationsoperations. Additionally, states where we own mineral and impose otherleasehold interests have enacted regulations relating to the exploration for and production of oil, NGL and natural gas. These states also have regulations addressinggoverning conservation matters, including provisions for the unitization or pooling of oil and natural gas and oil properties, the establishment of maximum allowable rates of production from natural gas and oil wells, the regulation of well spacing and plugging and abandonment of wells. TheseThe effect of these regulations varyis to limit the amount of natural gas and oil that can be produced from wells and to limit the number of wells or the locations which can be drilled. Additionally, some states where we hold mineral or leasehold interests may impose a production or severance tax with respect to the production and sale of natural gas, oil and NGL within its jurisdiction.
Regulation of Transportation of Oil
The sale and transportation of our crude oil is generally undertaken by the operators (or by third parties at the direction of the operators) of our properties. Sales of crude oil, condensate and NGL are not currently regulated and are made at negotiated prices; however, Congress could reenact price controls in the future.
Sales of crude oil are affected by the availability, terms and cost of transportation. The transportation of oil in common carrier pipelines is also subject to rate regulation. The Federal Energy Regulatory Commission (the “FERC”) regulates interstate oil pipeline transportation rates under the Interstate Commerce Act. Intrastate oil pipeline transportation rates are subject to regulation by state regulatory commissions. The basis for intrastate oil pipeline regulation, and the degree of regulatory oversight and scrutiny given to intrastate oil pipeline rates, varies from state to state. As previously discussed,Interstate and intrastate common carrier oil pipelines must provide service on a non-discriminatory basis. Under this open access standard, common carriers must offer service to all shippers requesting service on the Company must rely on its well operators to comply with governmental regulations.
ENVIRONMENTAL MATTERS
Assame terms and under the Companysame rates. When oil pipelines operate at full capacity, access is directly involvedgoverned by pro-rationing provisions set forth in the extractionpipelines’ published tariffs.
Regulation of Transportation and useSale of Natural Gas
The sale and transportation of our natural gas is generally undertaken by the operators (or by third parties at the direction of the operators) of our properties. Historically, the transportation and sale for resale of natural resources, itgas in interstate commerce has been regulated pursuant to the Natural Gas Act of 1938, the Natural Gas Policy Act of 1978 and regulations issued under those Acts by the FERC. In the past, the federal government regulated the prices at which natural gas could be sold. While sales by producers of natural gas can currently be made at uncontrolled market prices, Congress could reenact price controls in the future.
The FERC has endeavored to make natural gas transportation more accessible to natural gas buyers and sellers on an open and non-discriminatory basis. The FERC has stated that open access policies are necessary to improve the competitive structure of the interstate natural gas pipeline industry and to create a regulatory framework that will put natural gas sellers into more direct contractual relations with natural gas buyers by, among other things, unbundling the sale of natural gas from the sale of transportation and storage services. Although the FERC’s orders do not directly regulate natural gas producers, they are intended to foster increased competition within all phases of the natural gas industry.
Intrastate natural gas transportation is subject to variousregulation by state regulatory agencies. The basis for intrastate regulation of natural gas transportation and the degree of regulatory oversight and scrutiny given to intrastate natural gas pipeline rates and services varies from state to state.
Environmental Compliance and Risks
Our operators and properties are impacted by extensive and changing federal, state and local laws and regulations regardingrelating to environmental protection, including the generation, storage, handling, emission, transportation and ecological matters. Compliance with thesedischarge of materials into the environment and relating to safety and health.
Natural gas and oil exploration, development and production operations are subject to stringent federal, state and local laws and regulations governing the discharge of materials into the environment or otherwise relating to environmental protection. Historically, most of the environmental regulation of gas and oil production has been left to state regulatory boards or agencies in those jurisdictions where there is significant natural gas and oil production, with limited direct regulation by such federal agencies as the Environmental Protection Agency. However, there are various regulations issued by the Environmental Protection Agency (“EPA”) and other governmental agencies that would govern significant spills, blow-outs or uncontrolled emissions.
Many states, including states where we own properties, have enacted natural gas and oil regulations that apply to the drilling, completion and operations of wells and the disposal of waste oil and salt water. The operators of our properties are subject to such regulations. There are also procedures incident to the plugging and abandonment of dry holes or other non-operational wells, all as governed by the applicable governing state agency.
At the federal level, among the more significant laws and regulations that may necessitate significant capital outlays.affect our business and the oil and natural gas industry are: The Company does not believeComprehensive Environmental Response, Compensation and Liability Act of 1980, also known as “CERCLA” or “Superfund; the existenceOil Pollution Act of these environmental laws,1990; the Resource Conservation and Recovery Act, also known as currently written and interpreted, will materially hinder or adversely affect“RCRA”; the Company’s business operations; however, there can be no assurances made regarding future events, changes in laws,Clean Air Act; Federal Water Pollution Control Act of 1972, or the interpretationClean Water Act; and the Safe Drinking Water Act of laws governing our industry. For example, current discussions regarding future governance of hydraulic fracturing could have a material impact on the Company. Several states and local municipalities have adopted or are considering adopting regulations that could impose more stringent requirements on hydraulic fracturing operations or otherwise seek to ban fracturing activities altogether. The Oklahoma Corporation Commission has ordered the shut-in of some saltwater disposal wells and reductions of injected volumes in others in northern Oklahoma where these wells are proximal to seismic activity. The Company is currently experiencing insignificant impact and anticipates insignificant future impact from these shut-ins and injection volume reductions due to our minimal working interest ownership in this area. 1974.
Since the Company does not operate any wells in which it owns an interest, actual compliance with environmental laws is controlled by the well operators, with Panhandlethe Company being responsible for its proportionate share of the costs involved.involved on wells in which we own a working interest. As such, the Company has no knowledge of any instances of non-compliance with existing laws and regulations. Absent an extraordinary event, any noncompliance is not likely to have a material adverse effect on the financial condition of the Company. The Company maintains insurance coverage at levels which are customary in the industry, but is not fully insured against all environmental risks.
(4)
Taxes
EMPLOYEESThe Company’s natural gas and oil properties are subject to various taxes, such as gross production taxes and, in some cases, ad valorem taxes. The Company pays ad valorem taxes on minerals owned in ten states.
Employees
At September 30, 2017, Panhandle2020, the Company employed 2117 people, with fourincluding executive officers.
Executive Officers
Chad L. Stephens has served as President, Chief Executive Officer and Director since January 2020. Mr. Stephens served as Interim CEO from October 2019 to December 2019, and he has served as a Director since September 2017. Prior to joining the Company, Mr. Stephens held several positions at Range Resources Corporation starting in 1990, and from 2002 through his retirement in 2018, he served as Senior Vice President – Corporate Development.
Ralph D’Amico has served as Chief Financial Officer and Corporate Secretary since March 2020 and as Vice President – Business Development since January 2019. Prior to joining the Company, Mr. D’Amico served as Managing Director at Seaport Global and held various positions at Stifel Nicolaus, Jefferies, Friedman Billings Ramsey and Salomon Smith Barney.
Freda R. Webb has served as Vice President, Mineral Operations since January 2017. Ms. Webb served the Company as a reservoir engineering consultant from 2011 to 2015. In 2015 she was appointed to the Reservoir Engineering Manager position. Prior to joining the Company, Ms. Webb held various reservoir engineering, acquisitions, corporate planning and management positions for Cities Services, Occidental Petroleum and Southwestern Energy.
Corporate Office
The Company’s office is located at Valliance Bank Tower, Suite 1100, 1601 NW Expressway, Oklahoma City, OK 73118. Our telephone number is (405) 948-1560 and facsimile number is (405) 948-1063. The Company’s website is www.phxmin.com.
Available Information
We make available free of charge on our website (www.phxmin.com) our Annual Report on Form 10-K, Quarterly Reports on Form 10-Q, Current Reports on Form 8-K, and other filings pursuant to Section 13(a) or 15(d) of the employees servingSecurities Exchange Act, and amendments to such filings, as soon as reasonably practicable after each are electronically filed with, or furnished to, the SEC.
We also make available within the “Corporate Governance” section under the “Investors” section of our website our Code of Ethics & Business Practices, Code of Ethics for Senior Financial Officers, Corporate Governance Guidelines, Lead Independent Director Charter and Audit Committee, Corporate Governance and Nominating Committee and Compensation Committee Charters, which have been approved by our Board of Directors. We will make timely disclosure on our website of any change to, or waiver from, the Code of Ethics & Business Practices and Code of Ethics for Senior Financial Officers for our principal executive and senior financial officers. The PresidentCopies of our Code of Ethics & Business Practices and CEO is also a directorCode of the Company.Ethics for Senior Financial Officers are available free of charge by writing us at: PHX Minerals Inc., Attn: Chad True, 1601 NW Expressway, Suite 1100, Oklahoma City, OK 73118.
In addition to the other information included in this Form 10-K, the following risk factors should be considered in evaluating the Company’s business and future prospects. If any of the following risk factors should occur, the Company’s financial condition could be materially impacted, and the holders of our securities could lose part or all of their investment in Panhandle.the Company. As the owner of mineral fee interests and non-operating working interests, we do not operate any natural gas and oil properties, and we do not have any employees or contractors in the field. As such, the risks associated with natural gas and oil operations only affect us indirectly and typically through our non-operating working interests as we proportionately share in the costs of operating such wells. The risk factors described below are not exhaustive, and investors are encouraged to perform their own investigation with respect to the Company and its business. Investors should also read the other information in this Form 10-K, including the financial statements and related notes.
UncertaintyRisks Related to our Business
The volatility of economic conditions, worldwide and in the United States, may have a significant negative effect on operating results, liquidity and financial condition.
Effects of change in domestic and international economic conditions could include: (1) an imbalance in supply and demand for oil, NGL and natural gas resulting in decreasedand oil NGL and natural gas reservesprices due to curtailed drilling activity; (2) a decline in oil, NGLfactors beyond our control greatly affects our financial condition, results of operations and natural gas prices; (3) risk of insolvency of well operators and oil, NGL and natural gas purchasers; (4) limited availability of certain insurance coverage; (5) limited access to derivative instruments; and (6) limited credit availability. A decline in reserves would lead to a decline in production, and either a production decline, or a decrease in oil, NGL and natural gas prices, would have a negative impact on the Company’s cash flow, profitability and value.
Oil, NGL and natural gas prices are volatile. Volatility in these prices can adversely affect operating results and the price of the Company’s common stock. This volatility also makes valuation of oil and natural gas producing properties difficult and can disrupt markets.available for distribution.
The supply of and demand for oil, NGL and natural gas, oil and NGL impact the prices we realize on the sale of these commodities and, in turn, materially affect the Company’s financial results. Oil,Natural gas, oil and NGL and natural gas prices have historically been, and will likely continue to be, volatile. The prices for oil, NGL and natural gas, oil and NGL are subject to wide fluctuation in response to a number of factors beyond our control, including:
worldwide economic conditions
economic, political, regulatory and tax developments
market uncertainty
changes in the supply of and demand for oil, NGL and natural gas
availability and capacity of necessary transportation and processing facilities
commodity futures trading
(5)
differing quality of oil produced (i.e., sweet crude versus heavy or sour crude)
• | economic, political, regulatory and tax developments; |
• | market uncertainty; |
• | changes in the supply of and demand for natural gas, oil and NGL; |
• | the impacts and effects of public health crises, pandemics and epidemics, such as the ongoing COVID-19 pandemic; |
• | availability and capacity of necessary transportation and processing facilities; |
• | commodity futures trading; |
• | regional price differentials; |
• | differing quality of oil produced (i.e., sweet crude versus heavy or sour crude); |
• | differing quality and NGL content of natural gas produced; |
• | weather conditions; |
• | conservation and environmental protection efforts; |
• | the level of imports and exports of natural gas, oil and NGL; |
• | political instability or armed conflicts in major natural gas and oil producing regions; |
• | actions taken by OPEC or other major natural gas, oil and NGL producing or consuming countries; |
• | competition from alternative sources of energy; and |
• | technological advancements affecting energy consumption and energy supply. |
Our revenues, operating results, cash available for distribution and the carrying value of our natural gas and oil properties depend significantly upon the prevailing prices for natural gas and oil. Historically, natural gas and oil prices have been volatile and are subject to fluctuations in response to changes in supply and demand, market uncertainty and a variety of additional factors that are beyond our control, including:
• | the domestic and foreign supply of natural gas and oil; |
• | the level of prices and expectations about future prices of natural gas and oil; |
• | the level of global natural gas and oil exploration and production; |
• | the cost of exploring for, developing, producing and delivering natural gas and oil; |
• | the price and quantity of foreign imports; |
• | political and economic conditions in oil producing countries, including the Middle East, Africa, South America and Russia; |
• | the impacts and effects of public health crises, pandemics and epidemics, such as the ongoing COVID-19 pandemic; |
• | the ability of members of OPEC to agree to and maintain oil price and production controls; |
• | speculative trading in natural gas and crude oil derivative contracts; |
• | the level of consumer product demand; |
• | weather conditions and other natural disasters; |
• | risks associated with operating drilling rigs; |
• | technological advances affecting energy consumption; |
• | the price and availability of alternative fuels; |
• | domestic and foreign governmental regulations and taxes; |
• | the continued threat of terrorism and the impact of military and other action, including U.S. military operations in the Middle East; |
• | the proximity, cost, availability and capacity of natural gas and oil pipelines and other transportation facilities; and |
• | overall domestic and global economic conditions. |
These factors and the volatility of the energy markets make it extremely difficult to predict future natural gas and oil price movements with any certainty. If the prices of natural gas produced
weather conditions
theand oil remain at current levels or decline further, our operations, financial condition and level of imports and exportsexpenditures for the development of oil, NGL and natural gas
political instability or armed conflicts in major oil andour natural gas producing regions
actions taken by OPEC or other majorand oil NGLreserves may be materially and adversely affected. Lower natural gas producing or consuming countries
competition from alternative sources of energy
technological advancements affecting energy consumption and energy supply
Price volatility makes it difficult to budget and project the return on investment in exploration and development projects and to estimate with precision the value of producing properties that are owned or acquired by the Company. In addition, volatile prices often disrupt the market for oil and natural gas properties, as buyers and sellers have more difficulty agreeing on the purchase price of properties. Revenues, results of operations, reserves and capital availability may fluctuate significantly as a result of variations in oil, NGL and natural gas prices and production performance.
Lower oil, NGL and natural gas prices may also trigger significant impairment write-downs onresult in a portionreduction in the borrowing base under our credit agreement, which may be determined at the discretion of the Company’s properties which negatively affect the Company’s results of operations. In addition, the credit available under its credit facility is affected by product prices.our lenders.
Low oil, NGL and natural gas, oil and NGL prices for a prolonged period of time would have a material adverse effect on the Company.
The volatility of the energy markets makes it extremely difficult to predict future natural gas, oil and NGL price movements with any certainty. Natural gas, oil and NGL prices continued to fluctuate in fiscal year 2020 and have fluctuated significantly over the past several months as a result of the ongoing COVID-19 pandemic. The Company’s financial position, results of operations, access to capital and the quantities of oil, NGL and natural gas, oil and NGL that may be economically produced would be negatively impacted if oil, NGL and natural gas, oil and NGL prices arewere low for an extended period of time. The ways in which low prices could have a material negative effect include:
significantly decrease the number of wells drilled by operators on the Company’s acreage, thereby reducing our production and cash flows
cash flow would be reduced, decreasing funds available for capital expenditures employed to replace reserves and maintain or increase production
future undiscounted and discounted net cash flows from producing properties would decrease, possibly resulting in recognition of impairment expense
(6)
| • | significantly decrease the number of wells operators drill on the Company’s acreage, thereby reducing our production and cash flows; |
| • | cash flow would be reduced, decreasing funds available for capital expenditures employed to replace reserves and maintain or increase production; |
• | future undiscounted and discounted net cash flows from producing properties would decrease, possibly resulting in recognition of impairment expense; |
• | certain reserves may no longer be economic to produce, leading to lower proved reserves, production and cash |
access to sources of capital, such as equity and debt markets, could be severely limited or unavailable
• | access to sources of capital, such as equity and debt markets, could be severely limited or unavailable; and |
• | the Company may incur a reduction in the borrowing base on its credit facility. |
The ongoing COVID-19 pandemic may adversely affect our business, financial condition and results of operations.
The global spread of the ongoing COVID-19 pandemic (“COVID-19”) has created significant uncertainty and economic disruption, as well as heightened volatility in the borrowing baseprices of oil and natural gas. The negative impact on its credit facilityworldwide demand for oil and natural gas resulting from COVID-19 led to a precipitous decline in oil prices, further exacerbated by the early March 2020 failure by OPEC+ to reach an agreement over proposed oil production cuts and global storage considerations. Although OPEC+ subsequently agreed to cut oil production and has extended such production cuts through December 2020, crude oil prices remain depressed as a result of an increasingly utilized global storage network and the decrease in crude oil demand due to COVID-19. Oil and natural gas prices are expected to continue to be volatile as a result of these events and COVID-19 outbreak, and as changes in oil and natural gas inventories, oil demand and economic performance are reported. The response to the COVID-19 outbreak is rapidly evolving, and the
ultimate impact of this pandemic is highly uncertain and subject to change. The Company cannot control activities on its properties.
The Company does not operate anyextent of the properties in which it has an interestimpact of COVID-19 on our operational and has very limited abilityfinancial performance will depend on future developments, including the duration and spread of the pandemic, its severity, actions to exercise influence overcontain the third-party operators of these properties. Our dependence ondisease or mitigate its impact and the third-party operators of our properties, and on the cooperation of other working interest owners in these properties, could negatively affect the following:
the Company’s return on capital used in drilling or property acquisition
the Company’s production and reserve growth rates
capital required to drill and complete wells
success and timing of drilling, development and exploitation activities on the Company’s properties
complianceavailability of effective treatments and vaccines, all of which are highly uncertain and cannot be predicted with environmental, safety and other regulations
lease operating expenses
plugging and abandonment costs, including well-site restorations
Dependency on each operator’s judgment, expertise and financial resourcescertainty at this time. Sustained low oil prices due to COVID-19 could result in unexpected future costs, lost revenues and/or capital restrictions, to the extent they would cumulativelyevents discussed in the immediately preceding risk factor, which could have a material adverse effect on our business and financial results. We are unable to predict the ultimate adverse impact of COVID-19 on our business, which will depend on numerous evolving factors and future developments, including the pandemic’s ongoing effect on the demand for oil and natural gas and the response of the overall economy and the financial markets after governmental restrictions are eased or after an effective treatment becomes available.
Lower natural gas, oil and NGL prices or negative adjustments to natural gas, oil and NGL reserves may result in significant impairment charges.
The Company has elected to utilize the successful efforts method of accounting for its natural gas and oil exploration and development activities. Exploration expenses, including geological and geophysical costs, rentals and exploratory dry holes, are charged against income as incurred. Costs of successful wells and related production equipment and development dry holes are capitalized and amortized by property using the unit-of-production method (the ratio of natural gas, oil and NGL volumes produced to total proved or proved developed reserves) as natural gas, oil and NGL are produced.
All long-lived assets, principally the Company’s financial positionnatural gas and oil properties, are monitored for potential impairment when circumstances indicate that the carrying value of the asset on our books may be greater than its future net cash flows. The need to test a property for impairment may result from declines in natural gas, oil and NGL sales prices or unfavorable adjustments to natural gas, oil and NGL reserves. The decision to not participate in future development on our leasehold acreage can trigger a test for impairment. Also, once assets are classified as held for sale, they are reviewed for impairment. Because of the uncertainty inherent in these factors, the Company cannot predict when or if future impairment charges will be recorded. If an impairment charge is recognized, cash flow from operating activities is not impacted, but net income and, consequently, stockholders’ equity are reduced. In periods when impairment charges are incurred, it could have a material adverse effect on our results of operations. See Note 11 to the financial statements included in Item 8 – “Financial Statements and Supplemental Data” for further discussion on impairment under the heading “Impairment.”
Our future success depends on finding, developing or acquiring additional reserves, and failure to find or acquire additional reserves will cause reserves and production to decline materially from their current levels.
The rate of production from natural gas and oil properties generally declines as reserves are depleted. The Company’s proved reserves will decline materially as reserves are produced except to the extent that the Company acquires additional properties containing proved reserves, conducts additional successful exploration and development drilling, successfully applies new technologies or identifies additional behind-pipe zones (different productive zones within existing producing well bores) or secondary recovery reserves.
Drilling for natural gas and oil invariably involves unprofitable efforts, not only from dry wells, but also from wells that are productive but do not produce sufficient reserves to return a profit after deducting drilling, completion, operating and other costs. In addition, wells that are profitable may not achieve a targeted rate of return. The Company relies on third-party operators’ interpretation of seismic data and other advanced technologies in identifying prospects and in conducting exploration and development activities. Nevertheless, prior to drilling a well, the seismic data and other technologies used do not allow operators to know conclusively whether natural gas, oil or NGL is present in commercial quantities.
Cost factors can adversely affect the economics of any project, and the eventual cost of drilling, completing and operating a well is controlled by well operators and existing market conditions. Further, drilling operations may be curtailed, delayed or canceled as a result of numerous factors, including:
• | unexpected drilling conditions; |
• | title problems; |
• | pressure or irregularities in formations; |
• | equipment failures or accidents; |
• | fires, explosions, blowouts and surface cratering; |
• | lack of availability to market production via pipelines or other transportation; |
• | adverse weather conditions; |
• | environmental hazards or liabilities; |
• | lack of water disposal facilities; |
• | governmental regulations; |
• | cost and availability of drilling rigs, equipment and services; and |
• | expected sales price to be received for natural gas, oil or NGL produced from the wells. |
Competition for acquisitions may increase the cost of, or cause us to refrain from, completing acquisitions. Our ability to complete acquisitions is dependent upon, among other things, our ability to obtain debt and equity financing and, in some cases, regulatory approvals. Further, these acquisitions may be in geographic regions in which we do not currently hold properties, which could result in unforeseen operating difficulties. In addition, if we enter into new geographic markets, we may be subject to additional and unfamiliar legal and regulatory requirements. Compliance with regulatory requirements may impose substantial additional obligations on us and our management, cause us to expend additional time and resources in compliance activities and increase our exposure to penalties or fines for non-compliance with such additional legal requirements. Further, the success of any completed acquisition will depend on our ability to effectively integrate the acquired business into our existing operations. The process of integrating acquired businesses may involve unforeseen difficulties and may require a disproportionate amount of our managerial and financial resources. In addition, possible future acquisitions may be larger and for purchase prices significantly higher than those paid for earlier acquisitions.
No assurance can be given that we will be able to identify suitable acquisition opportunities, negotiate acceptable terms, obtain financing for acquisitions on acceptable terms or successfully acquire identified targets. Our failure to achieve consolidation savings, to integrate the acquired businesses and assets into our existing operations successfully or to minimize any unforeseen operational difficulties could have a material adverse effect on our financial condition, results of operations and cash available for distribution. The inability to effectively manage the integration of acquisitions could reduce our focus on subsequent acquisitions and current operations, which, in turn, could negatively impact our growth, results of operations and cash available for distribution.
Any acquisitions of additional mineral and royalty interests that we complete will be subject to substantial risks.
Any acquisition involves potential risks, including, among other things:
• | the validity of our assumptions about estimated proved reserves, future production, prices, revenues, capital expenditures, operating expenses and costs; |
• | a decrease in our liquidity by using a significant portion of our cash generated from operations or borrowing capacity to finance acquisitions; |
• | a significant increase in our interest expense or financial leverage if we incur debt to finance acquisitions; |
• | the assumption of unknown liabilities, losses or costs for which we are not indemnified or for which any indemnity we receive is inadequate; |
• | mistaken assumptions about the overall cost of equity or debt; |
• | our ability to obtain satisfactory title to the assets we acquire; |
• | an inability to hire, train or retain qualified personnel to manage and operate our growing business and assets; and |
• | the occurrence of other significant changes, such as impairment of natural gas and oil properties, goodwill or other intangible assets, asset devaluation or restructuring charges. |
Our estimated proved reserves are based on many assumptions that may prove to be inaccurate. Any inaccuracies in these reserve estimates or underlying assumptions may materially affect the quantities and present value of our reserves.
It is not possible to measure underground accumulations of natural gas, oil and NGL with precision. Natural gas, oil and NGL reserve engineering requires subjective estimates of underground accumulations of natural gas, oil and NGL using assumptions concerning future prices of these commodities, future production levels and operating and development costs. In estimating our reserves, we and our Independent Consulting Petroleum Engineering Firm (DeGolyer and MacNaughton of Dallas, Texas) mustmake various assumptions with respect to many matters that may prove to be incorrect, including:
• | future natural gas, oil and NGL prices; |
• | unexpected complications from offset well development; |
• | production rates; |
• | reservoir pressures, decline rates, drainage areas and reservoir limits; |
• | interpretation of subsurface conditions including geological and geophysical data; |
• | potential for water encroachment or mechanical failures; |
• | levels and timing of capital expenditures, lease operating expenses, production taxes and income taxes, and availability of funds for such expenditures; and |
• | effects of government regulation. |
If any of these assumptions prove to be incorrect, our estimates of reserves, the classifications of reserves based on risk of recovery and our estimates of the future net cash flows from our reserves could change significantly.
The Company’s standardized measure of oil and natural gas reserves is calculated using the 12-month average price calculated as the unweighted arithmetic average of the first-day-of-the-month individual product prices for each month within the 12-month period prior to September 30. These prices and the operating costs in effect as of the date of estimation are held flat over the life of the properties. Production and income tax expenses are deducted from this calculation of future estimated development, with the result discounted at 10% per annum to reflect the timing of future net revenue in accordance with the rules and regulations of the SEC. Over time, we may make material changes to reserve estimates to take into account changes in our assumptions and the results of actual development and production.
The reserve estimates made for fields that do not have a lengthy production history are less reliable than estimates for fields with lengthy records. A lack of production history may contribute to inaccuracy in our estimates of proved reserves, future production rates and the timing of development expenditures. Further, our lack of knowledge of all individual well information known to the well operators such as incomplete well stimulation efforts, restricted production rates for various reasons and up-to-date well production data, etc. may cause differences in our reserve estimates.
Because PUD reserves, under SEC reporting rules, may only be recorded if the wells they relate to are scheduled to be drilled within five years of the date of recording, the removal of PUD reserves that are not developed within this five-year period may be required. Removals of this nature may significantly reduce the quantity and present value of the Company’s natural gas, oil and NGL reserves. Please read Item 2 – “Properties – Proved Reserves” and Note 16 to the financial statements included in Item 8 – “Financial Statements and Supplementary Data.”
Since forward-looking prices and costs are not used to estimate discounted future net cash flows from our estimated proved reserves, the standardized measure of our estimated proved reserves is not necessarily the same as the current market value of our estimated proved natural gas, oil and NGL reserves.
The timing of the development and production on our properties will affect the timing of actual future net cash flows from proved reserves, and thus their actual present value. In addition, the 10% discount factor used when calculating discounted future net cash flows, in compliance with the FASB statement on oil and natural gas producing activities disclosures, may not be the most appropriate discount factor based on interest rates in effect from time to time and risks associated with the Company, or the oil and natural gas industry in general.
Debt level and interest rates may adversely affect our business.
The Company has a credit facility with a group of banks headed by Bank of Oklahoma (BOK), which consists of a revolving loan of $200,000,000. As of September 30, 2020, the Company had a balance of $28,750,000 drawn on the facility. On December 4, 2020, the facility’s borrowing base after Quarterly Commitment Reductions was reaffirmed at $30,000,000, which is secured by all of the Company’s producing gas and oil properties and contains certain restrictive covenants.
Should the Company incur additional indebtedness under its credit facility to fund capital projects or for other reasons, there is risk of it adversely affecting our business operations as follows:
• | cash flows from operating activities required to service indebtedness may not be available for other purposes; |
• | covenants contained in the Company’s borrowing agreement may limit our ability to borrow additional funds, pay dividends and make certain investments; |
• | any limitation on the borrowing of additional funds may affect our ability to fund capital projects and may also affect how we will be able to react to economic and industry changes; |
• | a significant increase in the interest rate on our credit facility will limit funds available for other purposes; and |
• | changes in prevailing interest rates may affect the Company’s capability to meet its interest payments, as its credit facility bears interest at floating rates. |
The borrowing base of our corporate revolving bank credit facility is subject to periodic redetermination and is based in part on natural gas, oil and NGL prices. A lowering of our borrowing base because of lower natural gas, oil or NGL prices, or for other reasons, could require us to repay indebtedness in excess of the newly established borrowing base, or we might need to further secure the debt with additional collateral. Our ability to meet any debt obligations depends on our future performance. General business, economic, financial and product pricing conditions, along with other factors, affect our future performance, and many of these factors are beyond our control. In addition, our failure to comply with the restrictive covenants relating to our credit facility could result in a default, which might adversely affect our business, financial condition, results of operations and cash flows.
We may incur losses as a result of title defects in the properties we own.
Consistent with industry practice, we do not have current abstracts or title opinions on all of our mineral acreage and, therefore, cannot be certain that we have unencumbered title to all of these properties. Our failure to cure any title defects that may exist may adversely impact our ability in the future to increase production and reserves. There is no assurance that we will not suffer a monetary loss from title defects or title failure. Additionally, undeveloped acreage has greater risk of title defects than developed acreage. If there are any title defects or defects in assignment of leasehold rights in properties in which we hold an interest, we may suffer a financial loss.
Competition in the oil and natural gas industry is intense, and most of our competitors have greater financial and other resources than we do.
We compete in the highly competitive areas of natural gas and oil acquisition, development, exploration and production. We face intense competition from both major and independent oil and natural gas companies to acquire desirable producing properties, new properties for future exploration and human resource expertise necessary to effectively develop properties. We also face similar competition in obtaining sufficient capital to maintain or grow production.
We may be subject to information technology system failures, network disruptions, cyber-attacks or other breaches in data security.
The oil and natural gas industry in general has become increasingly dependent upon digital technologies to conduct day-to-day operations, including certain exploration, development and production activities. We use digital technology to estimate quantities
of natural gas, oil and NGL reserves, process and record financial data and communicate with our employees and third parties. Power, telecommunication or other system failures due to hardware or software malfunctions, computer viruses, vandalism, terrorism, natural disasters, fire, human error or by other means could significantly affect the Company’s ability to conduct its business. Though we have implemented complex network security measures, stringent internal controls and maintain offsite backup of all crucial electronic data, there cannot be absolute assurance that a form of system failure or data security breach will not have a material adverse effect on our financial condition and operations results. For instance, unauthorized access to our reserves information or other proprietary or commercially sensitive information could lead to data corruption, communication interruption or other disruptions in our operations or planned business transactions, any of which could have a material adverse impact on our results of operations. Further, as cyber-attacks continue to evolve, we may be required to expend significant additional resources to continue to modify or enhance our protective measures or to investigate and remediate any vulnerability to cyber-attacks.
The Company’s derivative activities may reduce the cash flow received for oilnatural gas and natural gasoil sales.
In order to manage exposure to price volatility on our oil and natural gas and oil production, we currently, and may in the future, enter into oilnatural gas and natural gasoil derivative contracts for a portion of our expected production. OilNatural gas and natural gasoil price derivatives may limit the cash flow we actually realize and therefore reduce the Company’s ability to fund future projects. None of our oilnatural gas and natural gasoil price derivative contracts are designated as hedges for accounting purposes; therefore, all changes in fair value of derivative contracts are reflected in earnings. Accordingly, these fair values may vary significantly from period to period, materially affecting reported earnings. In addition, this type of derivative contract can limit the benefit we would receive from increases in the prices for natural gas and oil. The fair value of our oilnatural gas and natural gasoil derivative instruments outstanding as of September 30, 2017,2020, was a net assetliability of $516,159.$707,647.
(7)
There is risk associated with our derivative contracts that involves the possibility that counterparties may be unable to satisfy contractual obligations to us. If any counterparty to our derivative instruments were to default or seek bankruptcy protection, it could subject a larger percentage of our future oilnatural gas and natural gasoil production to commodity price changes and could have a negative effect on our ability to fund future projects.acquisitions.
Please read Item 7A – “Quantitative and Qualitative Disclosures about Market Risk” and Note 1 and 12 to the financial statements included in Item 8 – “Financial Statements and Supplementary Data” for additional information regarding derivative contracts.
Future legislative or regulatory changes, including those resulting from the United States election in 2020, may result in increased costs and decreased revenues, cash flows and liquidity.
Companies that operate wells in which the Company owns a working interest are subject to extensive federal, state and local regulation. The Company, as a working interest owner, is therefore indirectly subject to these same regulations. New or changed laws and regulations such as those described below could have a material adverse effect on our business. In particular, changes in law or regulation related to hydraulic fracturing or greenhouse gases could potentially increase capital, compliance and operating costs significantly, as well as halt or delay the further development of oil and gas reserves on the Company’s properties.
Federal Income Taxation
We are subject to U.S. federal income tax, as well as income or capital-based taxes in various states, and our operating cash flow is sensitive to the amount of income taxes we must pay. Income taxes are assessed on our revenue after consideration of all allowable deductions and credits. Changes in the types of earnings that are subject to income tax, the types of costs that are considered allowable deductions or the rates assessed on our taxable earnings would all impact our income taxes and resulting operating cash flow.
Congress passed legislation in December 2017, commonly referred to as the Tax Cuts and Jobs Act (the “Tax Reform Legislation”), that significantly affects U.S. tax law. The Tax Reform Legislation contains a number of changes to the manner in which the U.S. imposes income tax on multinational corporations. Although some changes should be positive, such as a permanent reduction to the corporate income tax rate, the repeal of the corporate alternative minimum tax, a temporary increase in the amount of bonus depreciation available for qualified property placed into service between September 27, 2017, and December 31, 2022, and other changes may negatively affect the Company. These provisions include, for example, significant additional limitations on the deductibility of interest expense and net operating losses and the repeal of the domestic production activity deduction. In addition, compliance with the Tax Reform Legislation and ensuing regulations will require complex computations and accumulation of information not previously required or regularly produced.
Further revisions to U.S. tax law, such as a reversal of the corporate income tax rate reduction, the repeal of the percentage depletion allowance, the repeal of expensing for intangible drilling costs or the repeal of enhanced bonus depreciation, could have a materially adverse effect on our business. Moreover, the U.S. Department of Treasury has broad authority to issue regulations and interpretative guidance that may significantly impact how we apply U.S. tax law, with a corresponding impact on the results of our operations for the periods affected.
Oklahoma Taxation
Oklahoma imposes a gross production tax, or severance tax, on the value of natural gas, oil and NGL produced within the state. Under recent changes to Oklahoma law, the gross production tax rate on the first three years of a horizontal well’s production was increased from 2.2% to 5.2%, effective July 1, 2018. This increase in tax will likely decrease the profitability of newer horizontal wells producing natural gas, oil and NGL in Oklahoma, including wells in which the Company owns an interest.
Hydraulic Fracturing and Water Disposal
The vast majority of natural gas and oil wells drilled in recent years have been, and future wells are expected to be, hydraulically fractured as a part of the process of completing the wells and putting them on production. This is true of the wells drilled in which the Company owns an interest. Hydraulic fracturing is a process that involves pumping water, sand and additives at high pressure into rock formations to stimulate natural gas and oil production. In developing plays where hydraulic fracturing, which requires large volumes of water, is necessary for successful development, the demand for water may exceed the supply. A lack of readily available water or a significant increase in the cost of water could cause delays or increased completion costs.
In addition to water, hydraulic fracturing fluid contains chemical additives designed to optimize production. Well operators are being required in certain states to disclose the components of these additives. Additional states and the federal government may follow with similar requirements or may restrict the use of certain additives. This could result in more costly or less effective development of wells.
Once a well has been hydraulically fractured, the fluid produced from the fractured wells must be either treated for reuse or disposed of by injecting the fluid into disposal wells. Injection well disposal processes have been, and continue to be, studied to determine the extent of correlation between injection well disposal and the occurrence of earthquakes. Certain studies have concluded there is a correlation, and this has resulted in the cessation of or the reduction of injection rates in certain water disposal wells, especially in northern Oklahoma.
Efforts to regulate hydraulic fracturing and fluid disposal continue at the local, state and federal level. New regulations are being considered, including limiting water withdrawals and usage, limiting water disposition, restricting which additives may be used, implementing statewide hydraulic fracturing moratoriums and temporary or permanent bans in certain environmentally sensitive areas. Public sentiment against hydraulic fracturing and fluid disposal and shale production could result in more stringent permitting and compliance requirements. In addition, critical declarations made by one or more candidates seeking the office of the President of the United States in 2020 include proposals to ban hydraulic fracturing of oil and gas wells and to ban new leases for production of minerals on federal properties. Consequences of these actions could potentially increase capital, compliance and operating costs significantly, as well as delay or halt the further development of gas and oil reserves on the Company’s properties.
Any of the above factors could have a material adverse effect on our financial position, results of operations or cash flows.
Climate Change
Certain studies have suggested that emission of certain gases, commonly referred to as “greenhouse gases,” may be impacting the earth's climate. Methane, the primary component of natural gas, and carbon dioxide, a byproduct of burning natural gas and oil, are examples of greenhouse gases. Various state governments and regional organizations are considering enacting new legislation and promulgating new regulations governing or restricting the emission of greenhouse gases from stationary sources such as gas and oil production equipment and operations.
Legislation to regulate greenhouse gas emissions has periodically been introduced in the U.S. Congress, and such legislation may be proposed in the future. In addition, in December 2015, the United States joined the international
community at the 21st Conference of the Parties of the United Nations Framework Convention on Climate Change in Paris, France, in preparing an agreement which set greenhouse gas emission reduction goals every five years beginning in 2020. This “Paris Agreement” was signed by the United States in April 2016 and entered into force in November 2016. To help achieve these reductions, federal agencies addressed climate change through a variety of administrative actions. The U.S. Environmental Protection Agency (the “EPA”) issued greenhousegas monitoring and reporting regulations that cover natural gas and oil facilities, among other industries. However, on June 1, 2017, the President of the United States announced that the United States planned to withdraw from the Paris Agreement and to seek negotiations to either reenter the Paris Agreement on different terms or establish a new framework agreement. The Paris Agreement provides for a four-year exit process beginning when it took effect in November 2016, which resulted in an exit in November 2020. The United States’ adherence to the exit process is uncertain and/or the terms on which the United States may reenter the Paris Agreement, or a separately negotiated agreement are unclear at this time. Critical declarations made by one or more candidates seeking the office of the President of the United States in 2020 include a proposal to reverse the United States’ withdrawal from the Paris Agreement.
The direction of future U.S. climate change regulation is difficult to predict given the current uncertainties surrounding the policies of the Trump Administration and the outcome of the United Stated election in 2020. The EPA may or may not continue developing regulations to reduce greenhouse gas emissions from the oil and natural gas industry. Even if federal efforts in this area slow, states may continue pursuing climate regulations. Any laws or regulations that may be adopted to restrict or reduce emissions of greenhouse gases could require our operators to incur additional operating costs, such as costs to purchase and operate emissions controls, to obtain emission allowances or to pay emission taxes and reduce demand.
Seismic Activity
Earthquakes in northern and central Oklahoma and elsewhere have prompted concerns about seismic activity and possible relationships with the energy industry. Legislative and regulatory initiatives intended to address these concerns may result in additional levels of regulation that could lead to operational delays, increase operating and compliance costs or otherwise adversely affect operations.
The adoption of derivatives legislation by the U.S. Congress could have an adverse effect on us and our ability to hedge risks associated with our business.
The Dodd-Frank Act requires the CommoditiesCFTC (the United States Commodity Futures Trading Commission (the “CFTC”)Commission) and the SEC to promulgate rules and regulations establishing federal oversight and regulation of the over-the-counter derivatives market and entities that participate in that market including swap clearing and trade execution requirements. New or modified rules, regulations or requirements may increase the cost and availability to the counterparties of our hedging and swap positions which they can make available to us, as applicable, and may further require the counterparties to our derivative instruments to spin off some of their derivative activities to separate entities which may not be as creditworthy as the current counterparties. Any changes in the regulations of swaps may result in certain market participants deciding to curtail or cease their derivative activities.
While many rules and regulations have been promulgated and are already in effect, other rules and regulations remain to be finalized or effectuated and, therefore, the impact of those rules and regulations on us is uncertain at this time. The Dodd-Frank Act, and the rules promulgated thereunder, could (i) significantly increase the cost, or decrease the liquidity, of energy-related derivatives that we use to hedge against commodity price fluctuations (including through requirements to post collateral), (ii) materially alter the terms of derivative contracts, (iii) reduce the availability of derivatives to protect against risks we encounter and (iv) increase our exposure to less creditworthy counterparties.
Lower oil, NGL and natural gas prices or negative adjustmentsRisks Related to oil, NGL and natural gas reserves may result in significant impairment charges.our Third-Party Operators
The Company has elected to utilize the successful efforts method of accounting forcannot control activities on its oil and natural gas exploration and development activities. Exploration expenses, including geological and geophysical costs, rentals and exploratory dry holes, are charged against income as incurred. Costs of successful wells and related production equipment and development dry holes are capitalized and amortized by property using the unit-of-production method (the ratio of oil, NGL and natural gas volumes produced to total proved or proved developed reserves) as oil, NGL and natural gas are produced.properties.
All long-lived assets, principally the Company’s oil and natural gas properties, are monitored for potential impairment when circumstances indicate that the carrying valueThe Company does not operate any of the assetproperties in which it has an interest and has very limited ability to exercise influence over the third-party operators of these properties. Our dependence on the third-party operators of our books may be greater than its future net cash flows. The need to test a property for
(8)
impairment may result from declines in oil, NGLproperties, and natural gas sales prices or unfavorable adjustments to oil, NGL and natural gas reserves. Also, once assets are classified as held for sale, they are reviewed for impairment. Becauseon the cooperation of the uncertainty inherentother working interest owners in these factors,properties, could negatively affect the Company cannot predict when following:
• | the Company’s return on capital used in drilling or property acquisition; |
• | the Company’s production and reserve growth rates; |
• | capital required to workover or recomplete wells; |
• | success and timing of drilling, development and exploitation activities on the Company’s properties; |
• | compliance with environmental, safety and other regulations; |
• | lease operating expenses; and |
• | plugging and abandonment costs, including well-site restorations. |
Dependency on each operator’s judgment, expertise and financial resources could result in unexpected future costs, lost revenues and/or if future impairment charges will be recorded. If an impairment charge is recognized, cash flow from operating activities is not impacted, but net income and, consequently, shareholders’ equity are reduced. In periods when impairment charges are incurred, it couldcapital restrictions, to the extent they would cumulatively have a material adverse effect on ourthe Company’s financial position and results of operations. See Note 1 to the financial statements included in Item 8 – “Financial Statements and Supplemental Data” for further discussion on impairment under the heading “Depreciation, Depletion, Amortization and Impairment.”
Our estimated proved reserves are based on many assumptions that may prove to be inaccurate. Any inaccuracies in these reserve estimates or underlying assumptions may materially affect the quantities and present value of our reserves.
It is not possible to measure underground accumulations of oil, NGL and The natural gas with precision. Oil, NGL and natural gas reserve engineering requires subjective estimates of underground accumulations of oilNGL and natural gas using assumptions concerning future prices of these commodities, future production levels, and operating and development costs. In estimating our reserves, we and our Independent Consulting Petroleum Engineering Firm must make various assumptions with respect to many matters that may prove to be incorrect, including:
future oil, NGL and natural gas prices
production rates
reservoir pressures, decline rates, drainage areas and reservoir limits
interpretation of subsurface conditions including geological and geophysical data
potential for water encroachment or mechanical failures
levels and timing of capital expenditures, lease operating expenses, production taxes and income taxes, and availability of funds for such expenditures
effects of government regulation
If any of these assumptions prove to be incorrect, our estimates of reserves, the classifications of reserves based on risk of recovery and our estimates of the future net cash flows from our reserves could change significantly.
Our standardized measure of oil and natural gas reserves is calculated using the 12-month average price calculated as the unweighted arithmetic average of the first-day-of-the-month individual product prices for each month within the 12-month period prior to September 30. These prices and the operating costs in effect as of the date of estimation are held flat over the life of the properties. From this calculation of future estimated development, production and
(9)
income tax expenses are deducted with the result discounted at 10% per annum to reflect the timing of future net revenue in accordance with the rules and regulations of the SEC. Over time, we may make material changes to reserve estimates to take into account changes in our assumptions and the results of actual development and production.
The reserve estimates made for fields that do not have a lengthy production history are less reliable than estimates for fields with lengthy production histories. A lack of production history may contribute to inaccuracy in our estimates of proved reserves, future production rates and the timing of development expenditures. Further, our lack of knowledge of all individual well information known to the well operators such as incomplete well stimulation efforts, restricted production rates for various reasons and up-to-date well production data, etc. may cause differences in our reserve estimates.
Because PUD reserves, under SEC reporting rules, may only be recorded if the wells they relate to are scheduled to be drilled within five years of the date of recording, the removal of PUD reserves that are not developed within this five-year period may be required. Removals of this nature may significantly reduce the quantity and present value of the Company’s oil, NGL and natural gas reserves. Please read Item 2 – “Properties – Proved Reserves” and Note 11 to the financial statements included in Item 8 – “Financial Statements and Supplementary Data.”
Because forward-looking prices and costs are not used to estimate discounted future net cash flows from our estimated proved reserves, the standardized measure of our estimated proved reserves is not necessarily the same as the current market value of our estimated proved oil, NGL and natural gas reserves.
The timing of both our production and our incurrence of expenses in connection with the development and production of our properties will affect the timing of actual future net cash flows from proved reserves, and thus their actual present value. In addition, the 10% discount factor used when calculating discounted future net cash flows, in compliance with the FASB statement on oil and natural gas producing activities disclosures, may not be the most appropriate discount factor based on interest rates in effect from time to time and risks associated with the Company, or the oil and natural gas industry in general.
Failure to find or acquire additional reserves will cause reserves and production to decline materially from their current levels.
The rate of production from oil and natural gas properties generally declines as reserves are depleted. The Company’s proved reserves will decline materially as reserves are produced except to the extent that the Company acquires additional properties containing proved reserves, conducts additional successful exploration and development drilling, successfully applies new technologies or identifies additional behind-pipe zones (different productive zones within existing producing well bores) or secondary recovery reserves.
Drilling for oil and natural gas invariably involves unprofitable efforts, not only from dry wells, but also from wells that are productive but do not produce sufficient reserves to return a profit after deducting drilling, completion, operating and other costs. In addition, wells that are profitable may not achieve a targeted rate of return. The Company relies on third-party
(10)
operators’ interpretation of seismic data and other advanced technologies in identifying prospects and in conducting exploration and development activities. Nevertheless, prior to drilling a well, the seismic data and other technologies used do not allow operators to know conclusively whether oil, NGL or natural gas is present in commercial quantities.
Cost factors can adversely affect the economics of any project, and ultimately the cost of drilling, completing and operating a well is controlled by well operators and existing market conditions. Further, drilling operations may be curtailed, delayed or canceled as a result of numerous factors, including:
unexpected drilling conditions
title problems
pressure or irregularities in formations
equipment failures or accidents
fires, explosions, blowouts and surface cratering
lack of availability to market production via pipelines or other transportation
adverse weather conditions
environmental hazards or liabilities
lack of water disposal facilities
governmental regulations
cost and availability of drilling rigs, equipment and services
expected sales price to be received for oil, NGL or natural gas produced from the wells
Oil and natural gas drilling and producing operations of our third-party operators involve various risks.
The Company isBecause we do not operate our properties, our business relies heavily upon our third-party operators and their operational effectiveness. Through our third-party operators, we are subject to all the risks normally incident to the operation and development of oil and natural gas and oil properties, including:
well blowouts, cratering, explosions and human related accidents
mechanical, equipment and pipe failures
adverse weather conditions, earthquakes and other natural disasters
civil disturbances and terrorist activities
(11)
| • |
|
environmental risks stemming from the use, production, handling and disposal of water, waste materials, hydrocarbons and other substances into the air, soil or water
• | mechanical, equipment and pipe failures; |
title problems
• | adverse weather conditions, earthquakes and other natural disasters; |
limited availability of financing
• | civil disturbances and terrorist activities; |
marketing related infrastructure, transportation and processing limitations
• | natural gas, oil and NGL price reductions; |
• | environmental risks stemming from the use, production, handling and disposal of water, waste materials, hydrocarbons and other substances into the air, soil or water; |
regulatory compliance issues
• | title problems; |
• | limited availability of financing; |
• | marketing related infrastructure, transportation and processing limitations; and |
• | regulatory compliance issues. |
As a non-operator, we are also dependent on third-party operators and the contractors they hire for operational safety, environmental safety and compliance with regulations of governmental authorities.
The Company maintains insurance against many potential losses or liabilities arising from well operations in accordance with customary industry practices and in amounts believed by management to be prudent. However, this insurance does not protect the Company against all risks. For example, the Company does not maintain insurance for business interruption, acts of war or terrorism. Additionally, pollution and environmental risks generally are not fully insurable. These risks could give rise to significant uninsured costs that couldmight have a material adverse effect on the Company’s business condition and financial results.
Debt levelWe may experience delays in the payment of royalties and interest ratesbe unable to replace operators that do not make required royalty payments, and we may not be able to terminate our leases with defaulting lessees if any of the operators on those leases declare bankruptcy.
A failure on the part of the operators to make royalty payments gives us the right to terminate the lease, repossess the property and enforce payment obligations under the lease. If we repossessed any of our properties, we would seek a replacement operator. However, we might not be able to find a replacement operator and, if we did, we might not be able to enter into a new lease
on favorable terms within a reasonable period of time. In addition, the outgoing operator could be subject to a proceeding under title 11 of the United States Code (the “Bankruptcy Code”), in which case our right to enforce or terminate the lease for any defaults, including non-payment, may be substantially delayed or otherwise impaired. In general, in a proceeding under the Bankruptcy Code, the bankrupt operator would have a substantial period of time to decide whether to ultimately reject or assume the lease, which could prevent the execution of a new lease or the assignment of the existing lease to another operator. In the event that the operator rejected the lease, our ability to collect amounts owed would be substantially delayed, and our ultimate recovery may be only a fraction of the amount owed or nothing. In addition, if we are able to enter into a new lease with a new operator, the replacement operator may not achieve the same levels of production or sell natural gas or oil at the same price as the operator it replaced.
Shortages of oilfield equipment, services, qualified personnel and resulting cost increases could adversely affect results of operations.
The demand for qualified and experienced field personnel, geologists, geophysicists, engineers and other professionals in the oil and natural gas industry can fluctuate significantly, often in correlation with natural gas, oil and NGL prices, resulting in periodic shortages. When demand for rigs and equipment increases due to an increase in the number of wells being drilled, there have been shortages of drilling rigs, hydraulic fracturing equipment and personnel and other oilfield equipment. Higher natural gas, oil and NGL prices generally stimulate increased demand for, and result in increased prices of, drilling rigs, crews and associated supplies, equipment and services. These shortages or price increases could negatively affect the ability to drill wells and conduct ordinary operations by the operators of the Company’s wells, resulting in an adverse effect on the Company’s financial condition, cash flow and operating results.
The marketability of natural gas and oil production is dependent upon transportation, pipelines and refining facilities, which neither we nor many of our operators’ control. Any limitation in the availability of those facilities could interfere with our or our operators’ ability to market our or our operators’ production and could harm our business.
The Company has a credit facility with a groupmarketability of banks headed by Bank of Oklahoma (BOK), which consists of a revolving loan of $200,000,000. As of September 30, 2017, the Company had a balance of $52,222,000 drawnour or our operators’ production depends in part on the facility.availability, proximity and capacity of pipelines, tanker trucks and other transportation methods and processing and refining facilities owned by third parties. The facility has a current borrowing baseamount of $80,000,000, which is secured by certain of the Company’s propertiesoil that can be produced and contains certain restrictive covenants.
Should the Company incur additional indebtedness under its credit facility to fund capital projects or for other reasons, there is risk of it adversely affecting our business operations as follows:
cash flows from operating activities required to service indebtedness may not be available for other purposes
covenants contained in the Company’s borrowing agreement may limit our ability to borrow additional funds, pay dividends and make certain investments
any limitation on the borrowing of additional funds may affect our ability to fund capital projects and may also affect how we will be able to react to economic and industry changes
(12)
|
|
changes in prevailing interest rates may affect the Company’s capability to meet its interest payments, as its credit facility bears interest at floating rates
The borrowing base of our corporate revolving bank credit facilitysold is subject to periodic redeterminationcurtailment in certain circumstances, such as pipeline interruptions due to scheduled and is based in partunscheduled maintenance, excessive pressure, physical damage or lack of available capacity on oil, NGLthese systems, tanker truck availability and extreme weather conditions. Also, the shipment of our or our operators’ natural gas prices. A lowering of our borrowing base because of lowerand oil NGLon third-party pipelines may be curtailed or natural gas prices, or for other reasons, could require us to repay indebtedness in excessdelayed if it does not meet the quality specifications of the newly established borrowing base,pipeline owners. The curtailments arising from these and similar circumstances may last from a few days to several months. In many cases, we or we might needour operators are provided only with limited, if any, notice as to further secure the debt with additional collateral. Ourwhen these circumstances will arise and their duration. Any significant curtailment in gathering system or transportation, processing or refining-facility capacity could reduce our or our operators’ ability to meet any debt obligations dependsmarket oil production and have a material adverse effect on our future performance. General business,financial condition, results of operations and cash distributions to stockholders. Our or our operators’ access to transportation options and the prices we or our operators receive can also be affected by federal and state regulation—including regulation of oil production, transportation and pipeline safety—as well by general economic financialconditions and product pricing conditions, along with other factors, affect our future performance,changes in supply and many of these factors are beyond our control.demand. In addition, the third parties on whom we or our failureoperators rely for transportation services are subject to comply with the restrictive covenants relating to our credit facility could result in a default, whichcomplex federal, state, tribal and local laws that could adversely affect the cost, manner or feasibility of conducting our business.
Risks Related to the Oil and Gas Industry
Concerns over general economic, business or industry conditions may have a material adverse effect on our results of operations, financial condition and cash available for distribution.
Concerns over global economic conditions, energy costs, geopolitical issues, inflation, the availability and cost of credit in the European, Asian and the U.S. markets contribute to economic uncertainty and diminished expectations for the global economy. These factors, combined with volatile prices of natural gas, oil and NGL, volatility in consumer confidence and job markets, may result in an economic slowdown or recession. In addition, continued hostilities in the Middle East and the occurrence or threat of terrorist attacks in the United States or other countries could adversely affect the economies of the United States and other countries. Concerns about global economic growth have had a significant adverse impact on global financial markets and commodity prices. If the economic climate in the United States or abroad deteriorates, worldwide demand for petroleum products could diminish, which could impact the price at which natural gas, oil and NGL from our properties are sold, affect the ability of vendors, suppliers and customers associated with our properties to continue operations and ultimately adversely impact our results of operations, financial condition and cash available for distribution.
Conservation measures and technological advances could reduce demand for natural gas and oil.
Fuel conservation measures, alternative fuel requirements, increasing consumer demand for alternatives to natural gas and oil, technological advances in fuel economy and energy generation devices could reduce demand for natural gas and oil. The impact of the changing demand for natural gas and oil services and products may have a material adverse effect on our business, financial condition, results of operations and cash flows.available for distribution.
Risks Related to an Investment in our Common Stock
The issuance of additional shares of our common stock could cause the market price of our common stock to decline and may result in dilution to our existing shareholders.stockholders.
The Company has filed a shelf registration statement which was declared effective on November 15, 2017,October 19, 2020, that allowswill allow us to issue up to $75 million in securities including common stock, preferred stock, debt, warrants and units. The shelf registration statement is intended to provide the Company with increased financial flexibility and more efficient access to the capital markets. We expect the SEC to declare the shelf registration to be effective after we file an amended shelf registration and issue the September 30, 2020, financials.
We cannot predict the effect, if any, that market sales of these securities or the availability of the securities will have on the prevailing market price of our common stock prevailing from time to time. Substantial sales of shares of our common stock or other securities in the public market, or the perception that those sales could occur, may cause the market price of our common stock to decline. Such a decrease in our share price could in turn impair our ability to raise capital through the sale of additional equity securities. In addition, any such decline may make it more difficult for youstockholders to sell shares of our common stock at prices youthey deem acceptable.
We are currently authorized to issue an aggregate of 24,000,00024,000,500 shares of common stock of which 16,678,01622,389,194 shares were issued and outstanding on December 1, 2017.3, 2020. Future issuances of our common stock, or other securities convertible into our common stock, may result in significant dilution to our existing shareholders.stockholders. Significant dilution would reduce the proportionate ownership and voting power held by our existing shareholders.stockholders.
Future legislativeWe may reduce or regulatory changes may resultsuspend our dividend in increased costs and decreased revenues, cash flows and liquidity.the future.
Companies that operate wells in which Panhandle ownsWe have paid a working interest are subject to extensive federal, state and local regulation. Panhandle, as a working interest owner, is therefore indirectly subject to these same regulations. New or changed laws and regulations such as those described below could have a material adverse effect on our business.
(13)
The United States House of Representatives and the Senate have each passed their own version of tax reform (the “Tax Bill”) which is a proposed overhaul of the Internal Revenue Code of 1986 and could alter tax ratesquarterly dividend for individuals and businesses and could eliminate several tax deductions, including several deductions utilized by the Company. The house and the senate bills still have to be reconciledmany years. Our most recent quarterly dividend was $0.01 per share, and we do not know ifhave paid a quarterly dividend of $0.01 per share or $0.04 per share for the Tax Bill will be adoptedpast two years. In the future our Board may, without advance notice, determine to reduce or suspend our dividend in whole, in part or not at all. As a result, the impact of the Tax Bill on us is uncertain at this time.
Proposalsorder to repeal the expensing of intangible drilling costs, repeal the percentage depletion allowancemaintain our financial flexibility and increase the amortization period of geological and geophysical expenses, if enacted, would increase and accelerate the Company’s payment of federal income taxes. As a result, these changes would decrease the Company’s cash flows available for developing its oil and natural gas properties.
Hydraulic Fracturing and Water Disposal
The vast majority of oil and natural gas wells drilled in recent years have been, and future wells are expected to be, hydraulically fractured as a part of the process of completing the wells and putting them on production. This is true of the wells drilled in whichbest position the Company owns an interest. Hydraulic fracturing is a process that involves pumping water, sand and additives at high pressure into rock formations to stimulate oil and natural gas production. In developing plays where hydraulic fracturing, which requires large volumes of water, is necessary for successful development, the demand for water may exceed the supply. A lack of readily available water or a significant increase in the cost of water could cause delays or increased completion costs.
In addition to water, hydraulic fracturing fluid contains chemical additives designed to optimize production. Well operators are being required in certain states to disclose the components of these additives. Additional states and the federal government may follow with similar requirements or may restrict the use of certain additives. This could result in more costly or less effective development of wells.
Once a well has been hydraulically fractured, the fluid produced from the fractured wells must be either treated for reuse or disposed of by injecting the fluid into disposal wells. Injection well disposal processes have been, and continue to be, studied to determine the extent of correlation between injection well disposal and the occurrence of earthquakes. Certain studies have concluded there is a correlation, and this has resulted in the cessation of or the reduction of injection rates in certain water disposal wells, especially in northern Oklahoma.
Efforts to regulate hydraulic fracturing and fluid disposal continue at the local, state and federal level. New regulations are being considered, including limiting water withdrawals and usage, limiting water disposition, restricting which additives may be used, implementing state-wide hydraulic fracturing moratoriums and temporary or permanent bans in certain environmentally sensitive areas. Public sentiment against
(14)
hydraulic fracturing and fluid disposal and shale production could result in more stringent permitting and compliance requirements. Consequences of these actions could potentially increase capital, compliance and operating costs significantly, as well as delay or halt the further development of oil and gas reserves on the Company’s properties.
Any of the above factors could have a material adverse effect on our financial position, results of operations or cash flows.
Climate Change
Certain studies have suggested that emission of certain gases, commonly referred to as "greenhouse gases," may be impacting the earth's climate. Methane, the primary component of natural gas, and carbon dioxide, a by-product of burning oil and natural gas, are examples of greenhouse gases. Various state governments and regional organizations are considering enacting new legislation and promulgating new regulations governing or restricting the emission of greenhouse gases from stationary sources such as oil and gas production equipment and operations.
In December 2015, the United States joined the international community at the 21st Conference of the Parties of the United Nations Framework Convention on Climate Change in Paris, France, in preparing an agreement which set greenhouse gas emission reduction goals every five years beginning in 2020. This “Paris Agreement” was signed by the United States in April 2016 and entered into force in November 2016. To help achieve these reductions, federal agencies addressed climate change through a variety of administrative actions.long‑term success. The U.S. Environmental Protection Agency (the “EPA”) issued greenhousegas monitoring and reporting regulations that cover oil and natural gas facilities, among other industries. However, on June 1, 2017, President Trump announced that the United States will withdraw and attempt to negotiate a different agreement.
The direction of future U.S. climate change regulation is difficult to predict given the current uncertainties surrounding the policies of the Trump Administration. The EPA may or may not continue developing regulations to reduce greenhouse gas emissions from the oil and natural gas industry. Even if federal efforts in this area slow, states may continue pursuing climate regulations. Any laws or regulations that may be adopted to restrict or reduce emissions of greenhouse gases could require our operators to incur additional operating costs, such as costs to purchase and operate emissions controls, to obtain emission allowances or to pay emission taxes, and reduce demand.
Seismic Activity
Recent earthquakes in northern and central Oklahoma and elsewhere have prompted concerns about seismic activity and possible relationships with the energy industry. Legislative and regulatory initiatives intended to address these concerns may result in additional levels of regulation that could lead to operational delays, increase operating and compliance costs or otherwise adversely affect operations.
(15)
Shortages of oilfield equipment, services, qualified personnel and resulting cost increases could adversely affect results of operations.
The demand for qualified and experienced field personnel, geologists, geophysicists, engineers and other professionals in the oil and natural gas industry can fluctuate significantly, often in correlation with oil, NGL and natural gas prices, resulting in periodic shortages. When demand for rigs and equipment increases due to an increase in the number of wells being drilled, there have been shortages of drilling rigs, hydraulic fracturing equipment and personnel and other oilfield equipment. Higher oil, NGL and natural gas prices generally stimulate increased demand for, and result in increased prices of, drilling rigs, crews and associated supplies, equipment and services. These shortages or price increases could negatively affect the ability to drill wells and conduct ordinary operations by the operators of the Company’s wells, resulting in an adverse effect on the Company’s financial condition, cash flow and operating results.
Competition in the oil and natural gas industry is intense, and most of our competitors have greater financial and other resources than we do.
We compete in the highly competitive areas of oil and natural gas acquisition, development, exploration and production. We face intense competition from both major and independent oil and natural gas companies to acquire desirable producing properties, new properties for future exploration and human resource expertise necessary to effectively develop properties. We also face similar competition in obtaining sufficient capital to maintain drilling rights in all drilling units.
A substantial number of our competitors have financial and other resources significantly greater than ours, and some of them are fully integrated oil and natural gas companies. These companies are able to pay more for development prospects and productive oil and natural gas properties and are able to define, evaluate, bid for, purchase and subsequently drill a greater number of properties and prospects than our financial or human resources permit, potentially reducing our ability to participate in drilling on certain of our acreage as a working interest owner. Our ability to develop and exploit our oil and natural gas properties and to acquire additional quality properties in the future will depend upon our ability to successfully evaluate, select and acquire suitable properties and join in drilling with reputable operators in this highly competitive environment.
Significant capital expenditures are required to replace our reserves and conduct our business.
The Company funds exploration, development and production activities primarily through cash flows from operations and acquisitions through borrowings under its credit facility. The timingdeclaration and amount of capital necessary to carry out these activities can vary significantly as a resultfuture dividends is at the discretion of product price fluctuations, property acquisitions, drilling resultsour Board and the availability of drilling rigs, equipment, well services and transportation capacity.
(16)
Cash flows from operations and access to capital are subject to a number of variables, including the Company’s:
amount of proved reserves
volume of oil, NGL and natural gas produced
received prices for oil, NGL and natural gas sold
ability to acquire and produce new reserves
ability to obtain financing
We may have limited ability to obtain the capital required to sustain our operations at current levels if our borrowing base under our credit facility is lowered as a result of decreased revenues, lower product prices, declines in reserves or for other reasons. Failure to sustain operations at current levels could have a material adverse effectwill depend on our financial condition, cash flow and results of operations.operations, cash flows, prospects, industry conditions, capital requirements and other factors and restrictions our Board deems relevant. The likelihood that dividends will be reduced or suspended is increased during periods of prolonged market weakness. In addition, our ability to pay dividends may be limited by agreements governing our indebtedness now or in the future. Although we do not currently have plans to reduce or suspend our dividend, there can be no assurance that we will not reduce our dividend or that we will continue to pay a dividend in the future.
WeIf we cannot meet the NYSE continued listing requirements, the NYSE may delist our common stock.
Our common stock is currently listed on the NYSE. In the future, if we are unable to meet the continued listing requirements of the NYSE, including, among other things, (i) the requirement of maintaining a minimum average closing price of $1.00 per share over a consecutive 30 trading-day period and (ii) the requirement of maintaining an average market capitalization of not less than $50 million over a 30 trading-day period with, at the same time, stockholders’ equity not less than $50 million, we would fall below compliance standards and risk having our common stock delisted. In addition, in the event of an abnormally low share price of our common stock and/or we fail to maintain an average market capitalization of at least $15 million over a 30-trading day period, we would be subject to information technology system failures, network disruptions, cyber-attacks orimmediate delisting under the NYSE’s rules without any opportunity to cure. A delisting of our common stock could negatively impact us by, among other breaches in data security.
Power, telecommunication or other system failures due to hardware or software malfunctions, computer viruses, vandalism, terrorism, natural disasters, fire, human error or by other means could significantly affectthings, the Company’s ability to conduct its business. Though we have implemented complex network security measures, stringent internal controls and maintain offsite backup of all crucial electronic data, there cannot be absolute assurance that a form of system failure or data security breach will not have a material adverse effect on our financial condition and operations results.following:
| causing the Company’s shares to be transferred to a more limited market than the NYSE, which could affect the market price, trading volume, liquidity and resale price of such shares; |
• | reducing the number of investors, including institutional investors, willing to hold or acquire our common stock, which could negatively impact our ability to raise equity; |
• | decreasing the amount of news and analyst coverage relating to us; |
• | limiting our ability to issue additional securities, obtain additional financing or pursue strategic restructuring, refinancing or other transactions; and |
• | impacting our reputation and, as a consequence, our business. |
ITEM 1B. | Staff Comments |
None
General Background
The Company is focused on perpetual natural gas and oil mineral ownership in resource plays in the United States. As part of our evolution as a company, we also own interests in leasehold acreage and non-operated working interests in natural gas and oil properties.
At September 30, 2017, Panhandle’s2020, the Company’s principal properties consisted of (1)(i) perpetual ownership of 255,039252,443 net mineral acres, held principally in Arkansas, New Mexico,Oklahoma, Texas, North Dakota, Oklahoma, TexasArkansas and six other states; (2)New Mexico; (ii) leases on 19,35117,091 net acres primarily in Oklahoma:Oklahoma; and (3)(iii) working interests, royalty interests or both in 6,0956,510 producing oil and natural gas and oil wells and 63125 wells in the process of being drilled or completed.
Management’s Business Strategy Related to Properties
During fiscal 2019, the Company made the strategic decision to focus on perpetual natural gas and oil mineral ownership and growth through mineral acquisitions and the development of its significant mineral acreage inventory in its core areas of focus. In accordance with this strategy, the Company will no longer participate in new development on its mineral or leasehold acreage with a cost-bearing working interest. The Company believes that its strategy to focus on mineral ownership is the best path to giving the Company’s stockholders the greatest risk-weighted returns on their investments.
Our goal is to increase stockholder value through the management of our fee mineral and leasehold assets as a portfolio. We plan to grow our mineral fee holdings by acquiring mineral acreage, in the core areas of resource plays with substantial undeveloped opportunities, that meets or exceeds our corporate return threshold. We also plan to aggressively lease our mineral holdings. We have an active program in place focused on leasing open acreage to generate additional lease bonus revenue and future royalty revenue.
Title to Properties
Consistent with industry practice, the Company does not have current abstracts or title opinions on all of its mineral acreage and, therefore, cannot be certain that it has unencumbered title to all of theseits properties. In recent years, a few insignificant challenges have been made against the Company’s fee title to its acreage.
The Company pays ad valorem taxes on minerals owned in nine states.
(17)
Mineral Interests Owned
The following table of mineral acreageinterests owned reflects, in each respective state, the number of (i) net and gross acres owned by the Company, (ii) net and gross producing acres owned by the Company, (iii) net and gross acres leased to others by the Company and (iv) net and gross acres open (unleased) as of September 30, 2017.2020.
State |
| Net Acres |
|
| Gross Acres |
|
| Net Acres Producing (1) |
|
| Gross Acres Producing (1) |
|
| Net Acres Leased to Others (2) |
|
| Gross Acres Leased to Others (2) |
|
| Net Acres Open (3) |
|
| Gross Acres Open (3) |
|
| Net Acres |
|
| Gross Acres |
|
| Net Acres Producing (1) |
|
| Gross Acres Producing (1) |
|
| Net Acres Leased to Others (2) |
|
| Gross Acres Leased to Others (2) |
|
| Net Acres Open (3) |
|
| Gross Acres Open (3) |
| ||||||||||||||||
Arkansas |
|
| 11,963 |
|
|
| 51,641 |
|
|
| 7,166 |
|
|
| 27,026 |
|
|
| - |
|
|
| - |
|
|
| 4,796 |
|
|
| 24,615 |
|
|
| 11,914 |
|
|
| 51,169 |
|
|
| 7,183 |
|
|
| 27,145 |
|
|
| - |
|
|
| - |
|
|
| 4,731 |
|
|
| 24,024 |
|
Colorado |
|
| 8,217 |
|
|
| 39,080 |
|
|
| - |
|
|
| - |
|
|
| 8 |
|
|
| 80 |
|
|
| 8,209 |
|
|
| 39,000 |
| ||||||||||||||||||||||||||||||||
Florida |
|
| 3,832 |
|
|
| 8,212 |
|
|
| - |
|
|
| - |
|
|
| - |
|
|
| - |
|
|
| 3,832 |
|
|
| 8,212 |
| ||||||||||||||||||||||||||||||||
Kansas |
|
| 3,082 |
|
|
| 11,816 |
|
|
| 144 |
|
|
| 1,200 |
|
|
| - |
|
|
| - |
|
|
| 2,938 |
|
|
| 10,616 |
| ||||||||||||||||||||||||||||||||
Montana |
|
| 1,008 |
|
|
| 17,947 |
|
|
| - |
|
|
| - |
|
|
| - |
|
|
| - |
|
|
| 1,008 |
|
|
| 17,947 |
| ||||||||||||||||||||||||||||||||
New Mexico |
|
| 57,374 |
|
|
| 174,300 |
|
|
| 1,366 |
|
|
| 6,965 |
|
|
| 175 |
|
|
| 360 |
|
|
| 55,833 |
|
|
| 166,975 |
|
|
| 56,649 |
|
|
| 171,868 |
|
|
| 821 |
|
|
| 5,310 |
|
|
| 260 |
|
|
| 535 |
|
|
| 55,568 |
|
|
| 166,023 |
|
North Dakota |
|
| 11,179 |
|
|
| 64,286 |
|
|
| 190 |
|
|
| 2,196 |
|
|
| - |
|
|
| - |
|
|
| 10,989 |
|
|
| 62,090 |
|
|
| 14,302 |
|
|
| 78,096 |
|
|
| 2,772 |
|
|
| 14,483 |
|
|
| - |
|
|
| - |
|
|
| 11,530 |
|
|
| 63,613 |
|
Oklahoma |
|
| 113,490 |
|
|
| 953,314 |
|
|
| 42,495 |
|
|
| 338,387 |
|
|
| 7,213 |
|
|
| 47,595 |
|
|
| 63,782 |
|
|
| 567,332 |
|
|
| 109,131 |
|
|
| 916,270 |
|
|
| 45,146 |
|
|
| 359,870 |
|
|
| 6,089 |
|
|
| 40,176 |
|
|
| 57,896 |
|
|
| 516,224 |
|
South Dakota |
|
| 1,825 |
|
|
| 9,300 |
|
|
| - |
|
|
| - |
|
|
| - |
|
|
| - |
|
|
| 1,825 |
|
|
| 9,300 |
| ||||||||||||||||||||||||||||||||
Texas |
|
| 43,043 |
|
|
| 362,274 |
|
|
| 5,502 |
|
|
| 55,621 |
|
|
| 7,684 |
|
|
| 58,203 |
|
|
| 29,856 |
|
|
| 248,450 |
|
|
| 42,436 |
|
|
| 356,212 |
|
|
| 5,200 |
|
|
| 52,864 |
|
|
| 5,807 |
|
|
| 43,979 |
|
|
| 31,429 |
|
|
| 259,369 |
|
Other |
|
| 27 |
|
|
| 262 |
|
|
| - |
|
|
| - |
|
|
| - |
|
|
| - |
|
|
| 27 |
|
|
| 262 |
|
|
| 18,011 |
|
|
| 88,365 |
|
|
| 331 |
|
|
| 3,280 |
|
|
| 8 |
|
|
| 80 |
|
|
| 17,672 |
|
|
| 85,005 |
|
Total: |
|
| 255,039 |
|
|
| 1,692,433 |
|
|
| 56,864 |
|
|
| 431,395 |
|
|
| 15,080 |
|
|
| 106,238 |
|
|
| 183,096 |
|
|
| 1,154,800 |
|
|
| 252,443 |
|
|
| 1,661,980 |
|
|
| 61,453 |
|
|
| 462,952 |
|
|
| 12,164 |
|
|
| 84,770 |
|
|
| 178,826 |
|
|
| 1,114,258 |
|
(1) | “Producing” represents the mineral acres in which |
(2) | “Leased” represents the mineral acres owned by |
(3) | “Open” represents mineral acres owned by |
Leases
The following table reflects the Company’s net mineral acres leased from others, lease expiration dates, and net leased acres held by production as of September 30, 2017.2020.
|
|
|
|
|
| Net Acres Expiring |
|
|
|
|
| |||||||||||||||||||||||||||||||||||||||||||||
State |
| Net Acres |
|
| Net Acres Expiring |
|
| Net Acres Held by Production |
|
| Net Acres |
|
| 2021 |
|
| 2022 |
|
| 2023 |
|
| 2024 |
|
| 2025 |
|
| Net Acres Held by Production |
| ||||||||||||||||||||||||||
|
|
|
|
|
| 2018 |
|
| 2019 |
|
| 2020 |
|
| 2021 |
|
| 2022 |
|
|
|
|
| |||||||||||||||||||||||||||||||||
Arkansas |
|
| 2,159 |
|
|
| 88 |
|
|
| - |
|
|
| - |
|
|
| - |
|
|
| - |
|
|
| 2,071 |
|
|
| 2,159 |
|
|
| - |
|
|
| - |
|
|
| - |
|
|
| - |
|
|
| - |
|
|
| 2,159 |
|
Kansas |
|
| 2,117 |
|
|
| - |
|
|
| - |
|
|
| - |
|
|
| - |
|
|
| - |
|
|
| 2,117 |
| ||||||||||||||||||||||||||||
Oklahoma |
|
| 11,641 |
|
|
| - |
|
|
| - |
|
|
| - |
|
|
| - |
|
|
| - |
|
|
| 11,641 |
|
|
| 11,567 |
|
|
| - |
|
|
| - |
|
|
| - |
|
|
| - |
|
|
| - |
|
|
| 11,567 |
|
Texas |
|
| 2,352 |
|
|
| - |
|
|
| - |
|
|
| - |
|
|
| - |
|
|
| - |
|
|
| 2,352 |
|
|
| 2,282 |
|
|
| - |
|
|
| - |
|
|
| - |
|
|
| - |
|
|
| - |
|
|
| 2,282 |
|
Other |
|
| 1,083 |
|
|
| - |
|
|
| - |
|
|
| - |
|
|
| - |
|
|
| - |
|
|
| 1,083 |
|
|
| 1,083 |
|
|
| - |
|
|
| - |
|
|
| - |
|
|
| - |
|
|
| - |
|
|
| 1,083 |
|
TOTAL |
|
| 19,351 |
|
|
| 88 |
|
|
| - |
|
|
| - |
|
|
| - |
|
|
| - |
|
|
| 19,263 |
|
|
| 17,091 |
|
|
| - |
|
|
| - |
|
|
| - |
|
|
| - |
|
|
| - |
|
|
| 17,091 |
|
(18)Proved Reserves
PROVED RESERVESSummary of Proved Reserves
The following table summarizes estimates of proved reserves of oil, NGL and natural gas, oil and NGL held by Panhandlethe Company as of September 30, 2017,2020, compared to the two preceding year ends.ends, using prices and costs under existing economic conditions. Proved reserves are located onshore within the contiguous United States and are principally made up of small interests in 6,0956,510 wells, which are predominately located in the Mid-Continent region. Other than this report, the Company’s reserve estimates are not filed with any other federal agency.
Summary of Proved Natural Gas and Oil Reserves
|
| Barrels of Oil |
|
| Barrels of NGL |
|
| Mcf of Natural Gas |
|
| Mcfe |
| ||||
Net Proved Developed Reserves |
|
|
|
|
|
|
|
|
|
|
|
|
|
|
|
|
September 30, 2017 |
|
| 2,201,528 |
|
|
| 1,768,425 |
|
|
| 87,861,043 |
|
|
| 111,680,761 |
|
September 30, 2016 |
|
| 1,980,519 |
|
|
| 1,095,256 |
|
|
| 62,929,047 |
|
|
| 81,383,697 |
|
September 30, 2015 |
|
| 2,725,077 |
|
|
| 1,466,834 |
|
|
| 82,899,159 |
|
|
| 108,050,625 |
|
|
|
|
|
|
|
|
|
|
|
|
|
|
|
|
|
|
Net Proved Undeveloped Reserves |
|
|
|
|
|
|
|
|
|
|
|
|
|
|
|
|
September 30, 2017 |
|
| 3,308,139 |
|
|
| 616,274 |
|
|
| 33,334,077 |
|
|
| 56,880,555 |
|
September 30, 2016 |
|
| 3,445,571 |
|
|
| 527,447 |
|
|
| 18,796,551 |
|
|
| 42,634,659 |
|
September 30, 2015 |
|
| 4,313,353 |
|
|
| 1,453,766 |
|
|
| 37,314,885 |
|
|
| 71,917,599 |
|
|
|
|
|
|
|
|
|
|
|
|
|
|
|
|
|
|
Net Total Proved Reserves |
|
|
|
|
|
|
|
|
|
|
|
|
|
|
|
|
September 30, 2017 |
|
| 5,509,667 |
|
|
| 2,384,699 |
|
|
| 121,195,120 |
|
|
| 168,561,316 |
|
September 30, 2016 |
|
| 5,426,090 |
|
|
| 1,622,703 |
|
|
| 81,725,598 |
|
|
| 124,018,356 |
|
September 30, 2015 |
|
| 7,038,430 |
|
|
| 2,920,600 |
|
|
| 120,214,044 |
|
|
| 179,968,224 |
|
|
| Oil |
|
| NGL |
|
| Natural Gas |
|
| Total Proved |
| ||||
|
| (Bbl) |
|
| (Bbl) |
|
| (Mcf) |
|
| (Mcfe) |
| ||||
Net Proved Developed Reserves |
|
|
|
|
|
|
|
|
|
|
|
|
|
|
|
|
September 30, 2020 |
|
| 1,148,989 |
|
|
| 1,135,864 |
|
|
| 40,924,083 |
|
|
| 54,633,201 |
|
September 30, 2019 |
|
| 1,863,096 |
|
|
| 1,747,242 |
|
|
| 67,713,193 |
|
|
| 89,375,221 |
|
September 30, 2018 |
|
| 2,334,587 |
|
|
| 2,085,706 |
|
|
| 83,151,954 |
|
|
| 109,673,712 |
|
|
|
|
|
|
|
|
|
|
|
|
|
|
|
|
|
|
Net Proved Undeveloped Reserves |
|
|
|
|
|
|
|
|
|
|
|
|
|
|
|
|
September 30, 2020 |
|
| 184,668 |
|
|
| 83,993 |
|
|
| 1,448,690 |
|
|
| 3,060,656 |
|
September 30, 2019 |
|
| 516,994 |
|
|
| 226,038 |
|
|
| 12,560,713 |
|
|
| 17,018,905 |
|
September 30, 2018 |
|
| 3,649,835 |
|
|
| 848,484 |
|
|
| 36,910,082 |
|
|
| 63,899,996 |
|
|
|
|
|
|
|
|
|
|
|
|
|
|
|
|
|
|
Net Total Proved Reserves |
|
|
|
|
|
|
|
|
|
|
|
|
|
|
|
|
September 30, 2020 |
|
| 1,333,657 |
|
|
| 1,219,857 |
|
|
| 42,372,773 |
|
|
| 57,693,857 |
|
September 30, 2019 |
|
| 2,380,090 |
|
|
| 1,973,280 |
|
|
| 80,273,906 |
|
|
| 106,394,126 |
|
September 30, 2018 |
|
| 5,984,422 |
|
|
| 2,934,190 |
|
|
| 120,062,036 |
|
|
| 173,573,708 |
|
Exploration and development of our natural gas and oil properties is conducted by natural gas and oil exploration and production companies, primarily larger independent operating companies. We do not operate any of our natural gas and oil properties.
For the year ended September 30, 2020, our net total proved reserves decreased by 48.7 Bcfe, as compared to September 30, 2019. The 44.5 Bcfe increasedecrease in total proved reserves from 20162019 to 20172020 is primarilyattributable to a combination of the following factors:
Positive pricing revisions of 17.9 Bcfe, primarily due to wells reaching their projected economic limits much later than projected in 2016: proved developed revisions of 17.3 Bcfe and PUD revisions of 0.6 Bcfe.
• | Negative pricing revisions of 35.8 Bcfe comprised of (i) proved developed revisions of 20.4 Bcfe due to natural gas and oil wells reaching their economic limits earlier than was projected in 2019 due to lower gas and oil prices and (ii) proved undeveloped revisions of 15.4 Bcfe resulting from the impact of COVID-19 and reduced pricing leading to an unprecedented decrease in operator activity in 2020, and a decision to remove PUD locations not permitted, in progress, or drilled and uncompleted (DUC). |
Negative performance revisions of 0.3 Bcfe.
• | Negative revisions of 10.1 Bcfe, which included (i) proved developed negative revisions of 8.7 Bcfe, principally due to lower performance of high-interest Woodford natural gas wells in the STACK and Arkoma Stack in Oklahoma and, to a lesser extent, lower performance of the Eagle Ford Shale oil properties in southern Texas; and (ii) proved undeveloped negative revisions of 1.4 Bcfe due to changes to scheduled first production date, expected performance, costs, and other reserve parameters. |
• | Production of 8.6 Bcfe from the Company’s natural gas and oil properties. |
• | The sale of 0.7 Bcfe, predominately in the Permian Basin in New Mexico, of which 0.2 Bcfe were proved developed and 0.5 Bcfe were proved undeveloped. |
• | Reserve extensions, discoveries and other additions of 4.1 Bcfe (comprised of 1.7 Bcfe proved developed and 2.4 Bcfe proved undeveloped reserves) principally resulting from: (i) the Company’s royalty interest ownership in the ongoing development of unconventional natural gas, oil and NGL utilizing extended horizontal drilling in the Woodford Shale in the STACK and SCOOP in Oklahoma; (ii) the Company’s royalty interest ownership in the ongoing development of unconventional natural gas, oil and NGL utilizing horizontal drilling in the STACK Meramec play in the Anadarko Basin in western Oklahoma; and (iii) the Company’s royalty interest ownership in ongoing development of unconventional natural gas, oil and NGL utilizing horizontal drilling in the Bakken Shale in North Dakota. |
• | The acquisition of 2.4 Bcfe, predominately in the active drilling program of the Woodford and Mississippian in the SCOOP and STACK plays in Oklahoma and the Bakken in North Dakota, of which 1.1 Bcfe were proved developed and 1.3 Bcfe were proved undeveloped. |
Proved developed reserve extensions, discoveries and other additions of 9.9 Bcfe principally resulting from the Company’s participation in six wells in the liquids-rich portion of the Anadarko Woodford Shale in Canadian County, Oklahoma.
The addition of 29.1 Bcfe of PUD reserves, all are within the Company’s active drilling program areas of the Anadarko Woodford Shale (Cana, STACK and SCOOP) and southeastern Oklahoma Woodford.
The sale of 1.0 Bcfe in marginal properties located in southwestern Oklahoma.
Production of 11.1 Bcfe.
(19)
Undeveloped Reserves
The following details the changes in proved undeveloped reserves for 20172020 (Mcfe):
Beginning proved undeveloped reserves |
|
|
|
|
Proved undeveloped reserves transferred to proved developed |
|
| ( | ) |
Revisions |
|
|
| ) |
Extensions and discoveries |
|
|
|
|
Sales | (479,415 | ) | ||
Purchases |
|
|
|
|
Ending proved undeveloped reserves |
|
|
|
|
BeginningFor the fiscal year ending September 30, 2020, total net PUD reserves were 42.6 Bcfe. Adecreased by 14.0 Bcfe, as compared to September 20, 2019. In 2020, a total of 15.70.4 Bcfe (37%(2% of the beginning balance) was transferred to proved developed producing during 2017.developed. The 0.8remaining approximately 13.6 Bcfe (2%(80% of the beginning balance) of positivenegative revisions to PUD reserves wereconsist of (i) pricing revisions of 0.6-15.4 Bcfe resulting from the impact of COVID-19 and reduced pricing leading to an unprecedented decrease in operator activity in 2020, and a decision to remove PUD locations not permitted, in progress, or drilled and uncompleted (DUC), (ii) sales and performance revisions of -1.8 Bcfe, and performance revision(ii) purchases and extensions of 0.23.6 Bcfe. No PUD locations from 2013 remain in the PUD category.
We anticipate that all the Company’s current PUD locations will be drilled and converted to PDP within five years of the date they were added. However, PUD locations and associated reserves, which are no longer projected to be drilled within five years from the date they were added to PUD reserves, will be removed as revisions at the time that determination is made. In the event that there are undrilled PUD locations at the end of the five-year period, it is our intent to remove the reserves associated with those locations from our proved reserves as revisions. The Company added 29.12.4 Bcfe of PUD reserves in 20172020 within the Company’s active drilling program areas of (i) STACK Meramec and Woodford in western Oklahoma, (ii) the AnadarkoSCOOP Woodford Shale (Cana,in western Oklahoma, (iii) the Arkoma Stack in eastern Oklahoma, (iv) the Bakken in North Dakota. These additions result from continuing development and additional well performance data in each of the referenced plays. Additionally, the Company purchased 1.3 Bcfe in the STACK SCOOP)Meramec and southeasternWoodford in Oklahoma Woodford Shale.and sold 0.5 Bcfe, predominately in the Permian Basin in New Mexico.
Estimated Future Net Cash Flows
Set forth below are estimated future net cash flows with respect to the Company’s net proved reserves (based on the estimated units set forth above in Proved Reserves) for each of the years indicated, and the present value of such estimated future net cash flows, computed by applying a 10% discount factor as required by SEC rules and regulations. The Company follows the SEC rule, Modernization of Oil and Gas Reporting Requirements. In accordance with the SEC rule, the estimated future net cash flows were computed using the 12-month average price calculated as the unweighted arithmetic average of the first-day-of-the-month individual product prices for each month within the 12-month period prior to September 30 held flat over the life of the properties and applied to future production of proved reserves less estimated future development and production expenditures for these reserves. The amounts presented are net of operating costs and production taxes levied by the respective states. Prices used for determining future cash flows from natural gas, oil and NGL as of September 30, 2020, 2019 and 2018, were as follows: in 2020, $1.62/Mcf for natural gas, $40.18/Bbl for oil and $9.95/Bbl for NGL; in 2019, $2.48/Mcf for natural gas, $54.40/Bbl for oil and $19.30/Bbl for NGL; and in 2018, $2.56/Mcf for natural gas, $62.86/Bbl for oil and $26.13/Bbl for NGL. These future net cash flows based on SEC pricing rules should not be construed as the fair market value of the Company’s reserves. A market value determination would need to include many additional factors, including anticipated natural gas, oil and NGL price and production cost increases or decreases, which could affect the economic life of the properties.
Estimated Future Net Cash Flows |
|
|
|
|
|
|
|
|
|
|
|
|
|
| 9/30/2020 |
|
| 9/30/2019 |
|
| 9/30/2018 |
| |||
Proved Developed |
| $ | 57,306,480 |
|
| $ | 161,943,514 |
|
| $ | 236,887,976 |
|
Proved Undeveloped |
|
| 8,779,289 |
|
|
| 48,900,497 |
|
|
| 174,078,883 |
|
Income Tax Expense |
|
| (13,224,535 | ) |
|
| (47,788,416 | ) |
|
| (95,872,182 | ) |
Total Proved |
| $ | 52,861,234 |
|
| $ | 163,055,595 |
|
| $ | 315,094,677 |
|
|
|
|
|
|
|
|
|
|
|
|
|
|
10% Discounted Present Value of Estimated Future Net Cash Flows |
|
|
|
|
|
|
|
|
|
|
|
|
|
| 9/30/2020 |
|
| 9/30/2019 |
|
| 9/30/2018 |
| |||
Proved Developed |
| $ | 33,270,804 |
|
| $ | 86,814,212 |
|
| $ | 125,915,804 |
|
Proved Undeveloped |
|
| 5,659,479 |
|
|
| 23,581,427 |
|
|
| 78,657,354 |
|
Income Tax Expense |
|
| (7,796,130 | ) |
|
| (24,834,110 | ) |
|
| (48,247,304 | ) |
Total Proved |
| $ | 31,134,153 |
|
| $ | 85,561,529 |
|
| $ | 156,325,854 |
|
Evaluation and Review of Reserves
The determination of reserve estimates is a function of testing and evaluating the production and development of oilnatural gas and natural gasoil reservoirs in order to establish a production decline curve. The established production decline curves, in conjunction with oilnatural gas and natural gasoil prices, development costs, production taxes and operating expenses, are used to estimate oilnatural gas and natural gasoil reserve quantities and associated future net cash flows. As information is processed regarding the development of individual reservoirs, and as market conditions change, estimated reserve quantities and future net cash flows will change over time as well. Estimated reserve quantities and future net cash flows are affected by changes in product prices. These prices have varied substantially in recent years and are expected to vary substantially from current pricing in the future.
The Company follows the SEC’s modernized oil and natural gas reporting rules, which were effective for annual reports on Form 10−K10-K for fiscal years ending on or after December 31, 2009. See Note 1116 to the financial statements in Item 8 – “Financial Statements and Supplementary Data” for disclosures regarding our oil and natural gas and oil reserves.
ProvedUnder the SEC rules, oil and natural gas reserves are those quantities of oil and natural gas which, by analysis of geoscience and engineering data, can be estimated with reasonable certainty to be economically producible – from a given date forward, from known reservoirs and under existing economic conditions, operating methods and government regulations – prior to the time at which contracts providing the right to operate expire, unless evidence indicates that renewal is reasonably certain, regardless of whether deterministic or probabilistic methods are used for the estimation. The project to extract the hydrocarbons must have commenced, or the operator must
(20)
be reasonably certain that it will commence the project, within a reasonable time. The area of the reservoir considered as proved includes: (i) the area identified by drilling and limited by fluid contacts, if any, and (ii) adjacent undrilled portions of the reservoir that can, with reasonable certainty, be judged to be continuous with it and to contain economically producible oil or natural gas on the basis of available geoscience and engineering data. In the absence of data on fluid contacts, proved quantities in a reservoir are limited by the lowest known hydrocarbons as seen in a well penetration unless geoscience, engineering or performance data and reliable technology establishes a lower contact with reasonable certainty. Where direct observation from well penetrations has defined a highest known oil elevation and the potential exists for an associated natural gas cap, proved oil reserves may be assigned in the structurally higher portions of the reservoir only if geoscience, engineering or performance data and reliable technology establish the higher contact with reasonable certainty. Reserves, which can be produced economically through application of improved recovery techniques (including, but not limited to, fluid injection), are included in the proved classification when: (i) successful testing by a pilot project in an area of the reservoir with properties no more favorable than in the reservoir as a whole, the operation of an installed program in the reservoir or an analogous reservoir or other evidence using reliable technology establishes the reasonable certainty of the engineering analysis on which the project or program was based; and (ii) the project has been approved for development by all necessary parties and entities, including governmental entities. Existing economic conditions include prices and costs at which economic producibility from a reservoir is to be determined. The price shall be the average price during the 12-month period prior to the ending date of the period covered by the report, determined as an unweighted arithmetic average of the first-day-of-the-month price for each month within such period, unless prices are defined by contractual arrangements, excluding escalations based upon future conditions.
Developed oil and natural gas reserves are reserves of any category that can be expected to be recovered through existing wells with existing equipment and operating methods, or in which the cost of the required equipment is relatively minor, compared to the cost of a new well, and through installed extraction equipment and infrastructure operational at the time of the reserve estimate, if the extraction is by means not involving a well.
Undeveloped oil and natural gas reserves are reserves of any category that are expected to be recovered from new wells on undrilled acreage or from existing wells where a relatively major expenditure is required for recompletion. Reserves on undrilled acreage are limited to those directly offsetting development spacing areas that are reasonably certain of production when drilled, unless evidence using reliable technology exists that establishes reasonable certainty of economic producibility at greater distances. Undrilled locations can be classified as having undeveloped reserves only if a development plan has been adopted indicating that they are scheduled to be drilled within five years, unless the specific circumstances justify a longer time. Under no circumstances shall estimates for undeveloped reserves be attributable to any acreage for which an application of fluid injection or other improved recovery technique is contemplated, unless such techniques have been proved effective by actual projects in the same reservoir or an analogous reservoir or by other evidence using reliable technology establishing reasonable certainty.
(21)
The independent consulting petroleum engineering firm of DeGolyer and MacNaughton of Dallas, Texas, calculatedprepared the Company’s oil, NGL and natural gas, oil and NGL reserves estimates as of September 30, 2017, 20162020, 2019 and 20152018 (see Exhibits 2323.2 and 99). Within DeGolyer and MacNaughton, the technical person primarily responsible for preparing the estimates set forth in the Report of DeGolyer and MacNaughton dated October 6, 2020, filed as Exhibit 99 to this Annual Report on Form 10-K, was Gregory K. Graves. Mr. Graves has a Bachelor of Science degree in Petroleum Engineering from the University of Texas at Austin and is a Registered Professional Engineer in the state of Texas. He is a member or the Society of Petroleum Evaluation Engineers and has over 36 years of experience in oil and gas reservoir studies and reserves evaluations. Mr. Graves meets or exceeds the education, training and experience requirements set forth in the Standards Pertaining to the Estimating and Auditing of Oil and Gas Reserves Information promulgated by the Society of Petroleum Engineers and is proficient in judiciously applying industry standard practices to engineering and geoscience evaluations as well as applying SEC and other industry reserve definitions and guidelines.
All of the reserve estimates are reviewed and approved by our Vice President, Minerals Operations, Freda Webb. Ms. Webb holds a Bachelor of Science degree in Mechanical Engineering from the University of Oklahoma, a Master of Science degree in Petroleum Engineering from the University of Southern California and a Professional Engineering License in Petroleum Engineering in the State of Oklahoma. Ms. Webb has more than 40 years of experience in the oil and gas industry. She is an active member of the Society of Petroleum Engineers (SPE).
Our Vice President, Minerals Operations, and internal staff work closely with our Independent Consulting Petroleum Engineers to ensure the integrity, accuracy and timeliness of data furnished to them for their reserves estimation process. We provide historical information (such as ownership interest, gas and oil production, well test data, commodity prices, operating costs, handling fees, and development costs) for all properties to our Independent Consulting Petroleum Engineers. Throughout the year, our team meets regularly with representatives of our Independent Consulting Petroleum Engineers to review properties and discuss methods and assumptions. The Company’s net proved oil, NGL and natural gas, oil and NGL reserves (including certain undeveloped reserves described above) are located onshore in the contiguous United States. All studies have been prepared in accordance with regulations prescribed by the SEC. The reserve estimates were based on economic and operating conditions existing at September 30, 2017, 20162020, 2019 and 2015.2018. Since the determination and valuation of proved reserves is a function of testing and estimation, the reserves presented should beare expected to change as future information becomes available.
(22)
ESTIMATED FUTURE NET CASH FLOWS
Set forth below are estimated future net cash flows with respect to Panhandle’s net proved reserves (based on the estimated units set forth above in Proved Reserves) for the year indicated, and the present value of such estimated future net cash flows, computed by applying a 10% discount factor as required by SEC rules and regulations. The Company follows the SEC rule, Modernization ofNatural Gas, Oil and Gas Reporting Requirements. In accordance with the SEC rule, the estimated future net cash flows were computed using the 12-month average price calculated as the unweighted arithmetic average of the first-day-of-the-month individual product prices for each month within the 12-month period prior to September 30 held flat over the life of the properties and applied to future production of proved reserves less estimated future development and production expenditures for these reserves. The amounts presented are net of operating costs and production taxes levied by the respective states. Prices used for determining future cash flows from oil, NGL and natural gas as of September 30, 2017, 2016 and 2015, were as follows: $46.31/Bbl, $17.55/Bbl, $2.81/Mcf; $36.77/Bbl, $12.22/Bbl, $1.97/Mcf; $55.27/Bbl, $19.10/Bbl, $2.84/Mcf, respectively. These future net cash flows based on SEC pricing rules should not be construed as the fair market value of the Company’s reserves. A market value determination would need to include many additional factors, including anticipated oil, NGL and natural gas price and production cost increases or decreases, which could affect the economic life of the properties.
Estimated Future Net Cash Flows |
|
|
|
|
|
|
|
|
|
|
|
|
|
| 9/30/2017 |
|
| 9/30/2016 |
|
| 9/30/2015 |
| |||
Proved Developed |
| $ | 206,878,778 |
|
| $ | 98,380,962 |
|
| $ | 233,189,810 |
|
Proved Undeveloped |
|
| 81,303,463 |
|
|
| 26,502,846 |
|
|
| 116,314,237 |
|
Income Tax Expense |
|
| (102,193,819 | ) |
|
| (38,674,100 | ) |
|
| (123,007,909 | ) |
Total Proved |
| $ | 185,988,422 |
|
| $ | 86,209,708 |
|
| $ | 226,496,138 |
|
|
|
|
|
|
|
|
|
|
|
|
|
|
10% Discounted Present Value of Estimated Future Net Cash Flows |
|
|
|
|
|
|
|
|
|
|
|
|
|
| 9/30/2017 |
|
| 9/30/2016 |
|
| 9/30/2015 |
| |||
Proved Developed |
| $ | 112,276,166 |
|
| $ | 55,586,606 |
|
| $ | 126,295,752 |
|
Proved Undeveloped |
|
| 13,746,585 |
|
|
| (7,696,741 | ) |
|
| 17,948,482 |
|
Income Tax Expense |
|
| (45,190,176 | ) |
|
| (18,119,746 | ) |
|
| (62,653,023 | ) |
Total Proved |
| $ | 80,832,575 |
|
| $ | 29,770,119 |
|
| $ | 81,591,211 |
|
(23)
OIL, NGL AND NATURAL GAS PRODUCTIONProduction
The following table sets forth the Company’s net production of oil, NGL and natural gas, oil and NGL for the fiscal periods indicated.
|
| Year Ended |
|
| Year Ended |
|
| Year Ended |
|
| Year Ended |
|
| Year Ended |
|
| Year Ended |
| ||||||
|
| 9/30/2017 |
|
| 9/30/2016 |
|
| 9/30/2015 |
|
| 9/30/2020 |
|
| 9/30/2019 |
|
| 9/30/2018 |
| ||||||
Mcf - Natural Gas |
|
| 5,962,705 |
|
|
| 7,086,761 |
|
|
| 8,721,262 |
| ||||||||||||
Bbls - Oil |
|
| 310,677 |
|
|
| 364,252 |
|
|
| 453,125 |
|
|
| 269,785 |
|
|
| 329,199 |
|
|
| 336,565 |
|
Bbls - NGL |
|
| 173,858 |
|
|
| 171,060 |
|
|
| 210,960 |
|
|
| 168,623 |
|
|
| 216,259 |
|
|
| 255,176 |
|
Mcf - Natural Gas |
|
| 8,194,529 |
|
|
| 8,284,377 |
|
|
| 9,745,223 |
| ||||||||||||
Mcfe |
|
| 11,101,739 |
|
|
| 11,496,249 |
|
|
| 13,729,733 |
|
|
| 8,593,153 |
|
|
| 10,359,509 |
|
|
| 12,271,708 |
|
AVERAGE SALES PRICES AND PRODUCTION COSTSAverage Sales Prices and Production Costs
The following tables set forth unit price and cost data for the fiscal periods indicated.
|
| Year Ended |
|
| Year Ended |
|
| Year Ended |
|
| Year Ended |
|
| Year Ended |
|
| Year Ended |
| ||||||
Average Sales Price |
| 9/30/2017 |
|
| 9/30/2016 |
|
| 9/30/2015 |
|
| 9/30/2020 |
|
| 9/30/2019 |
|
| 9/30/2018 |
| ||||||
Per Mcf, Natural Gas |
| $ | 1.72 |
|
| $ | 2.48 |
|
| $ | 2.49 |
| ||||||||||||
Per Bbl, Oil |
| $ | 46.27 |
|
| $ | 36.70 |
|
| $ | 53.12 |
|
| $ | 41.47 |
|
| $ | 55.07 |
|
| $ | 61.75 |
|
Per Bbl, NGL |
| $ | 19.87 |
|
| $ | 12.60 |
|
| $ | 18.25 |
|
| $ | 11.42 |
|
| $ | 17.10 |
|
| $ | 23.14 |
|
Per Mcf, Natural Gas |
| $ | 2.70 |
|
| $ | 1.92 |
|
| $ | 2.73 |
| ||||||||||||
Per Mcfe |
| $ | 3.60 |
|
| $ | 2.73 |
|
| $ | 3.97 |
|
| $ | 2.72 |
|
| $ | 3.80 |
|
| $ | 3.94 |
|
|
| Year Ended |
|
| Year Ended |
|
| Year Ended |
|
| Year Ended |
|
| Year Ended |
|
| Year Ended |
| ||||||
Average Production (lifting) Costs |
| 9/30/2017 |
|
| 9/30/2016 |
|
| 9/30/2015 |
|
| 9/30/2020 |
|
| 9/30/2019 |
|
| 9/30/2018 |
| ||||||
(Per Mcfe) |
|
|
|
|
|
|
|
|
|
|
|
|
|
|
|
|
|
|
|
|
|
|
|
|
Well Operating Costs (1) |
| $ | 1.14 |
|
| $ | 1.18 |
|
| $ | 1.27 |
|
| $ | 1.12 |
|
| $ | 1.21 |
|
| $ | 1.10 |
|
Production Taxes (2) |
|
| 0.14 |
|
|
| 0.09 |
|
|
| 0.12 |
|
|
| 0.12 |
|
|
| 0.18 |
|
|
| 0.17 |
|
|
| $ | 1.28 |
|
| $ | 1.27 |
|
| $ | 1.39 |
|
| $ | 1.24 |
|
| $ | 1.39 |
|
| $ | 1.27 |
|
(1) | Includes actual well operating costs, compression, handling and marketing fees paid on natural gas sales and other minor expenses associated with well operations. |
(2) | Includes production taxes only. |
In fiscal 2017,2020, approximately 25%45% of the Company’s oil, NGL and natural gas, oil and NGL revenue was generated from royalty payments received on its mineral acreage. Royalty interests bear no share of the field operating costs on those producing wells.wells, but they do bear a share of the handling fees (primarily gathering and transportation).
(24)
GROSS AND NET PRODUCTIVE WELLS AND DEVELOPED ACRESGross and Net Productive Wells and Developed Acres
The following table sets forth Panhandle’sthe Company’s gross and net productive oilnatural gas and natural gasoil wells as of September 30, 2017. Panhandle2020. The Company owns either working interests, royalty interests or both in these wells. The Company does not operate any wells.
|
| Gross Working Interest Wells |
|
| Net Working Interest Wells |
|
| Gross Royalty Only Wells |
|
| Total Gross Wells |
|
| Gross Working Interest Only Wells |
|
| Net Working Interest Only Wells |
|
| Gross Working Interest and Royalty Interest Wells |
|
| Net Working Interest and Royalty Interest Wells |
|
| Gross Royalty Only Wells |
|
| Net Royalty Only Wells |
|
| Total Gross Wells |
| |||||||||||
Natural Gas |
|
| 426 |
|
|
| 11.48 |
|
|
| 1,067 |
|
|
| 44.85 |
|
|
| 3,087 |
|
|
| 20.83 |
|
|
| 4,580 |
| ||||||||||||||||
Oil |
|
| 337 |
|
|
| 26.87 |
|
|
| 1,142 |
|
|
| 1,479 |
|
|
| 117 |
|
|
| 14.27 |
|
|
| 98 |
|
|
| 4.40 |
|
|
| 1,715 |
|
|
| 11.66 |
|
|
| 1,930 |
|
Natural Gas |
|
| 1,717 |
|
|
| 78.62 |
|
|
| 2,899 |
|
|
| 4,616 |
| ||||||||||||||||||||||||||||
Total |
|
| 2,054 |
|
|
| 105.49 |
|
|
| 4,041 |
|
|
| 6,095 |
|
|
| 543 |
|
|
| 25.75 |
|
|
| 1,165 |
|
|
| 49.25 |
|
|
| 4,802 |
|
|
| 32.49 |
|
|
| 6,510 |
|
Panhandle’sThe Company’s average interest in royalty interest only wells is 0.80%0.68%. Panhandle’sThe Company’s average interest in working interest wells is 5.14%4.39% working interest and 4.91%4.28% net revenue interest.
Information on multiple completions is not available from Panhandle’sthe Company’s records, but the number is not believed to be significant. With regard to Gross Royalty Only Wells, some of these wells are in multi-well unitized fields. In such cases, the Company’s ownership in each unitized field is counted as one gross well, as the Company does not have access to the actual well count in all of these unitized fields.
As of September 30, 2017, Panhandle2020, the Company owned 431,395462,952 gross developed mineral acres and 56,864 net(61,453 net) developed mineral acres. PanhandleThe Company has also leased from others 145,828184,840 gross developed acres containing 19,263 net(17,091 net) developed acres.
UNDEVELOPED ACREAGEUndeveloped Acreage
As of September 30, 2017, Panhandle2020, the Company owned 1,261,0381,199,028 gross and 198,176190,990 net undeveloped mineral acres,acres. All of the Company’s leases are held by production (“HBP”), and the Company does not have any leases on 640 gross and 88 net undeveloped acres.
(25)
DRILLING ACTIVITYDrilling Activity
The following table sets forth the Company’s net productive development, exploratory and purchased wells and net dry development, exploratory and purchased wells in which the Company had either a working interest, a royalty interest or both were drilled and completed during the fiscal years indicated.
|
| Net Productive |
|
| Net Productive |
|
| Net Dry |
| |||
|
| Working Interest Wells |
|
| Royalty Interest Wells |
|
| Working Interest Wells |
| |||
Development Wells |
|
|
|
|
|
|
|
|
|
|
|
|
Fiscal years ended: |
|
|
|
|
|
|
|
|
|
|
|
|
September 30, 2017 |
|
| 3.893043 |
|
|
| 0.456612 |
|
|
| - |
|
September 30, 2016 |
|
| 0.541405 |
|
|
| 0.475375 |
|
|
| - |
|
September 30, 2015 |
|
| 5.349843 |
|
|
| 1.372020 |
|
|
| - |
|
|
|
|
|
|
|
|
|
|
|
|
|
|
Exploratory Wells |
|
|
|
|
|
|
|
|
|
|
|
|
Fiscal years ended: |
|
|
|
|
|
|
|
|
|
|
|
|
September 30, 2017 |
|
| 0.001563 |
|
|
| - |
|
|
| - |
|
September 30, 2016 |
|
| 0.002732 |
|
|
| 0.003186 |
|
|
| - |
|
September 30, 2015 |
|
| 0.188489 |
|
|
| 0.060184 |
|
|
| - |
|
|
|
|
|
|
|
|
|
|
|
|
|
|
Purchased Wells |
|
|
|
|
|
|
|
|
|
|
|
|
Fiscal years ended: |
|
|
|
|
|
|
|
|
|
|
|
|
September 30, 2017 |
|
| - |
|
|
| - |
|
|
| - |
|
September 30, 2016 |
|
| - |
|
|
| - |
|
|
| - |
|
September 30, 2015 |
|
| - |
|
|
| - |
|
|
| - |
|
|
| Net Productive |
|
| Net Productive |
|
| Net Dry |
| |||
|
| Working Interest Wells |
|
| Royalty Interest Wells |
|
| Working Interest Wells |
| |||
Development Wells |
|
|
|
|
|
|
|
|
|
|
|
|
Fiscal years ended: |
|
|
|
|
|
|
|
|
|
|
|
|
September 30, 2020 |
|
| - |
|
|
| 0.597278 |
|
|
| - |
|
September 30, 2019 |
|
| 0.939636 |
|
|
| 0.395755 |
|
|
| - |
|
September 30, 2018 |
|
| 0.482972 |
|
|
| 0.994656 |
|
|
| - |
|
|
|
|
|
|
|
|
|
|
|
|
|
|
Exploratory Wells |
|
|
|
|
|
|
|
|
|
|
|
|
Fiscal years ended: |
|
|
|
|
|
|
|
|
|
|
|
|
September 30, 2020 |
|
| - |
|
|
| - |
|
|
| - |
|
September 30, 2019 |
|
| - |
|
|
| - |
|
|
| - |
|
September 30, 2018 |
|
| - |
|
|
| - |
|
|
| - |
|
|
|
|
|
|
|
|
|
|
|
|
|
|
Purchased Wells |
|
|
|
|
|
|
|
|
|
|
|
|
Fiscal years ended: |
|
|
|
|
|
|
|
|
|
|
|
|
September 30, 2020 |
|
| - |
|
|
| 0.364206 |
|
|
| - |
|
September 30, 2019 |
|
| - |
|
|
| 0.516293 |
|
|
| - |
|
September 30, 2018 |
|
| - |
|
|
| 1.566828 |
|
|
| - |
|
PRESENT ACTIVITIESPresent Activities
The following table sets forth the Company’s gross and net oil and natural gas and oil wells drillingbeing drilled or testingwaiting on completion as of September 30, 2017,2020, in which Panhandlethe Company owns either a working interest, a royalty interest or both. These wells were not producing at September 30, 2017.2020.
|
| Gross Working Interest Wells |
|
| Net Working Interest Wells |
|
| Gross Royalty Only Wells |
|
| Total Gross Wells |
|
| Gross Working Interest Wells |
|
| Net Working Interest Wells |
|
| Gross Royalty Only Wells |
|
| Total Gross Wells |
| ||||||||
Natural Gas |
|
| - |
|
|
| - |
|
|
| 46 |
|
|
| 46 |
| ||||||||||||||||
Oil |
|
| 6 |
|
|
| 0.36 |
|
|
| 34 |
|
|
| 40 |
|
|
| - |
|
|
| - |
|
|
| 79 |
|
|
| 79 |
|
Natural Gas |
|
| 10 |
|
|
| 0.06 |
|
|
| 13 |
|
|
| 23 |
| ||||||||||||||||
Total |
|
| - |
|
|
| - |
|
|
| 125 |
|
|
| 125 |
| ||||||||||||||||
OTHER FACILITIESOther Facilities
The Company has aan office lease on 12,3698,776 square feet of office space in Oklahoma City, Oklahoma, which ends April 30, 2020.is scheduled to expire on August 31, 2027.
ITEM 3. | Legal Proceedings |
(26)
This report, including information included in, or incorporated by reference from, future filings byIn the Company with the SEC, as well as information contained in written material, press releases and oral statements, contains, orordinary course of business, we may contain, certain statements that are “forward-looking statements,” within the meaning of the federal securities laws. All statements, other than statements of historical facts, included or incorporated by reference in this report, which address activities, events or developments which are expected to, or anticipated will, or may, occur in the future, are forward-looking statements. The words “believes,” “intends,” “expects,” “anticipates,” “projects,” “estimates,” “predicts” and similar expressions are used to identify forward-looking statements.
These forward-looking statements include, among others, such things as: the amount and nature of our future capital expenditures; wells to be, drilled or reworked; prices for oil, NGL and natural gas; demand for oil, NGL and natural gas; estimates of proved oil, NGL and natural gas reserves; development and infill drilling potential; drilling prospects; business strategy; production of oil, NGL and natural gas reserves; and expansion and growth of our business and operations.
These statements are based on certain assumptions and analyses made by the Company in light of experience and perception of historical trends, current conditions and expected future developments as well as other factors believed appropriate in the circumstances. However, whether actual results and development will conform to our expectations and predictions is subject to a number of risks and uncertainties, which could cause actual results to differ materially from our expectations.
One should not place undue reliance on any of these forward-looking statements. The Company does not currently intend to update forward-looking information and to release publicly the results of any future revisions made to forward-looking statements to reflect events or circumstances, which reflect the occurrence of unanticipated events, after the date of this report.
In order to provide a more thorough understanding of the possible effects of some of these influences on any forward-looking statements made, the following discussion outlines certain factors that in the future could cause results for 2018 and beyond to differ materially from those that may be presented in any such forward-looking statement made by or on behalf of the Company.
Commodity Prices. The prices received for oil, NGL and natural gas production have a direct impact on the Company’s revenues, profitability and cash flows, as well as the ability to meet its projected financial and operational goals. The prices for crude oil, NGL and natural gas are dependent on a number of factors beyond the Company’s control, including: the supply and demand for oil, NGL and natural gas; weather conditions in the continental United States (which can greatly influence the demand for natural gas at any given time as well as the price we receive for such natural gas); and the ability of current distribution systems in the United States to effectively meet the demand for oil, NGL and natural gas at any given time, particularly in times of peak demand, which may result because of adverse weather conditions.
(27)
Oil prices are sensitive to foreign influences based on political, social or economic factors, any one of which could have an immediate and significant effect on the price and supply of oil. In addition, prices of both natural gas and oil are becoming more and more influenced by trading on the commodities markets, which has, at times, increased the volatility associated with these prices.
Uncertainty of Oil, NGL and Natural Gas Reserves. There are numerous uncertainties inherent in estimating quantities of proved reserves and their values, including many factors beyond the Company’s control. The oil, NGL and natural gas reserve data included in this report represents only an estimate of these reserves. Oil and natural gas reservoir engineering is a subjective and inexact process of estimating underground accumulations of oil, NGL and natural gas that cannot be measured in an exact manner. Estimates of economically recoverable oil, NGL and natural gas reserves depend on a number of variable factors, including historical production from the area compared with production from other producing areas and assumptions concerning future oil, NGL and natural gas prices, future operating costs, severance and excise taxes, development costs, and workover and remedial costs.
Some or all of these assumptions may vary considerably from actual results. For these reasons, estimates of the economically recoverable quantities of oil, NGL and natural gas and estimates of the future net cash flows from oil, NGL and natural gas reserves prepared by different engineers or by the same engineers but at different times may vary substantially. Accordingly, oil, NGL and natural gas reserve estimates may be subject to periodic downward or upward adjustments. Actual production, revenues and expenditures with respect to oil, NGL and natural gas reserves will vary from estimates, and those variances can be material.
The Company does not operate any of the properties in which it has an interest and has very limited ability to exercise influence over operations for these properties or their associated costs. Dependence on the operator and other working interest owners for these projects and the limited ability to influence operations and associated costs could materially and adversely affect the realization of targeted returns on capital in drilling or acquisition activities and targeted production growth rates.
Information regarding discounted future net cash flows included in this report is not necessarily the current market value of the estimated oil, NGL and natural gas reserves attributable to the Company’s properties. As required by the SEC, the estimated discounted future net cash flows from proved oil, NGL and natural gas reserves are determined based on the fiscal year’s 12-month average of the first-day-of-the-month individual product prices and costs as of the date of the estimate. Actual future prices and costs may be materially higher or lower. Actual future net cash flows are also affected, in part, by the amount and timing of oil, NGL and natural gas production, supply and demand for oil, NGL and natural gas and increases or decreases in consumption.
In addition, the 10% discount factor required by the SEC used in calculating discounted future net cash flows for reporting purposes is not necessarily the most appropriate discount factor based on interest rates in effect from time to time, and the risks associated with operations of the oil and natural gas industrya claimant or a defendant in general.
(28)
various legal proceedings. There were no material pending legal proceedings involving Panhandlethe Company on September 30, 2017,2020, or at the date of this report.
Not applicable.
(29)
ITEM |
|

Our Common Stock is listed on the New York Stock Exchange (NYSE) under the trading symbol “PHX.”
In March 2007, the Company increased its authorized Common Stock from 12 million shares to 24 million shares. On October 8, 2014, the Company split its Common Stock on a 2-for-1 basis in the form of a stock dividend. We currently have 24 million shares of Common Stock authorized.
Performance Graph
The abovefollowing graph compares the 5-year cumulative total return provided shareholdersstockholders on our Class A Common Stock (“Common Stock”) relative to the cumulative total returns of the S&P Smallcap 600 Index and the S&P Oil & Gas Exploration & Production Index. An investment of $100 (with reinvestment of all dividends) is assumed to have been made in our Common Stock and in each of the indexes on September 30, 2012,2015, and itsthe relative performance of such investment is tracked through and including September 30, 2017.2020. This table is not intended to forecast future performance of our Common Stock.
(30)
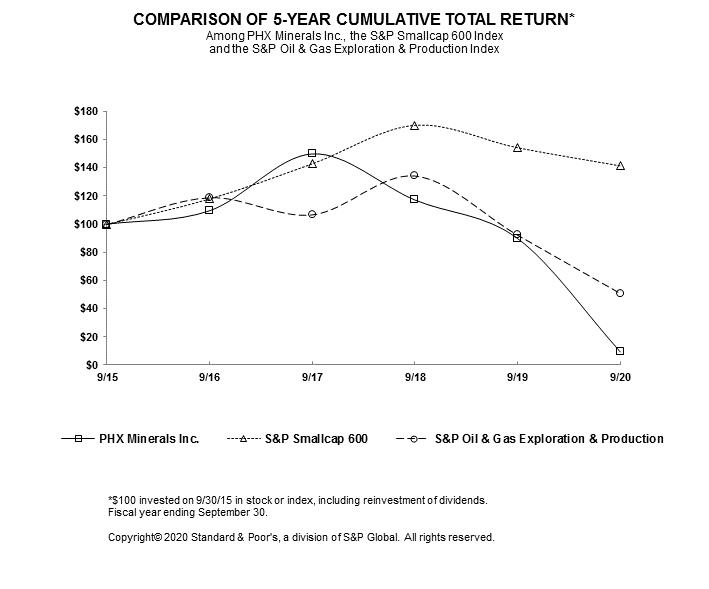
Since July 2008, the Company’s Common Stock has been listed and traded on the New York Stock Exchange (symbol PHX). The following table sets forth the high and low trade prices of the Common Stock during the periods indicated:
Record Holders
Quarter Ended |
| High |
|
| Low |
| ||
December 31, 2015 |
| $ | 20.20 |
|
| $ | 13.18 |
|
March 31, 2016 |
| $ | 18.89 |
|
| $ | 10.82 |
|
June 30, 2016 |
| $ | 19.47 |
|
| $ | 15.34 |
|
September 30, 2016 |
| $ | 19.30 |
|
| $ | 15.45 |
|
December 31, 2016 |
| $ | 27.70 |
|
| $ | 17.10 |
|
March 31, 2017 |
| $ | 24.05 |
|
| $ | 17.55 |
|
June 30, 2017 |
| $ | 24.06 |
|
| $ | 18.15 |
|
September 30, 2017 |
| $ | 25.30 |
|
| $ | 19.20 |
|
At December 1, 2017,3, 2020, there were 1,2891,292 holders of record of Panhandle’s Class Aour Common Stock and approximately 5,1005,000 beneficial owners.
Dividends
During the past two years, the Company has paid quarterly dividends of either $0.04 per share or $0.01 per share on its Common Stock. Approval by the Company’s Board is required before the declaration and payment of any dividends.
Historically, the Company has paid dividends to its stockholders on a quarterly basis. While the Company anticipates it will continue to pay dividends on its Common Stock, the payment and amount of future cash dividends will depend upon, among other things, financial condition, funds from operations, the level of capital and development expenditures, future business prospects, contractual restrictions and any other factors considered relevant by the Board.
The Company’s credit facility also contains a provision limitingloan agreement sets limits on dividend payments and stock repurchases if those payments would cause the paying or declaring of a cash dividend during any fiscal yearleverage ratio to 20% of net cash flow provided by operating activities from the Statement of Cash Flows of the preceding 12-month period. See Note 4go above 2.75 to the financial statements in Item 8 – “Financial Statements and Supplementary Data” for a further discussion of the credit facility.1.0.
(31)
Unregistered SalesPurchases of Equity Securities and Use of Proceedsby the Company
The following table presents information about repurchases of our common stock duringDuring the quarter ended September 30, 2017:2020, the Company did not repurchase any shares of the Company’s common stock.
Period |
| Total Number of Shares Purchased |
|
| Average Price Paid per Share |
|
| Total Number of Shares Purchased as Part of Publicly Announced Program |
|
| Approximate Dollar Value of Shares that May Yet Be Purchased Under the Program |
| ||||
7/1 - 7/31/17 |
|
| - |
|
| $ | - |
|
|
| - |
|
| $ | 594,533 |
|
8/1 - 8/31/17 |
|
| - |
|
| $ | - |
|
|
| - |
|
| $ | 594,533 |
|
9/1 - 9/30/17 |
|
| 8,623 |
|
| $ | 22.52 |
|
|
| 8,623 |
|
| $ | 400,357 |
|
Total |
|
| 8,623 |
|
| $ | 22.52 |
|
|
| 8,623 |
|
|
|
|
|
UponFollowing approval by the shareholdersstockholders of the Company’s 2010 Restricted Stock Plan in March 2010, as amended in May 2018, the Board directedapproved the purchaseCompany’s repurchase program which, as amended, authorizes management to repurchase up to $1.5 million of the Company’s Common Stock from timeat its discretion. The repurchase program has an evergreen provision which authorizes the repurchase of an additional $1.5 million of the Company’s Common Stock when the previous amount is utilized. As part of the amendment, the number of shares allowed to time,be purchased by the Company under the repurchase program is no longer capped at an amount equal to the aggregate number of shares of Common Stock (i) awarded pursuant to the Company’s Amended 2010 Restricted Stock Plan, (ii) contributed by the Company to its ESOPthe PHX Minerals Inc. Employee Stock Ownership and 401(k) Plan, a tax qualified, defined contribution plan (the “ESOP”) and (iii) credited to the accounts of directors pursuant to the Deferred Compensation Plan for Non-Employee Directors. Effective May 2014, the board of directors approved for management to make these purchases of the Company’s Common Stock at their discretion. The Board’s approval included an initial authorization to purchase up to $1.5 million of Common Stock, with a provision for subsequent authorizations without specific action by the Board. As the amount of Common Stock purchased under any authorization reaches $1.5 million, another $1.5 million is automatically authorized for Common Stock purchases unless the Board determines otherwise.
(32)
The following table summarizes financial data of the Company for its last five fiscal years and should be read in conjunction with Item 7 – “Management’s Discussion and Analysis of Financial Condition and Results of Operations” and Item 8 – “Financial Statements and Supplementary Data,” including the Notes thereto, included elsewhere in this report.
|
| As of and for the year ended September 30, |
|
| As of and for the year ended September 30, |
| ||||||||||||||||||||||||||||||||||
|
| 2017 |
|
| 2016 |
|
| 2015 |
|
| 2014 |
|
| 2013 |
|
| 2020 |
|
| 2019 |
|
| 2018 |
|
| 2017 |
|
| 2016 |
| ||||||||||
Revenues |
|
|
|
|
|
|
|
|
|
|
|
|
|
|
|
|
|
|
|
|
|
|
|
|
|
|
|
|
|
|
|
|
|
|
|
|
|
|
|
|
Oil, NGL and natural gas sales |
| $ | 39,935,912 |
|
| $ | 31,411,353 |
|
| $ | 54,533,914 |
|
| $ | 82,846,528 |
|
| $ | 60,605,878 |
| ||||||||||||||||||||
Natural gas, oil and NGL sales |
| $ | 23,370,003 |
|
| $ | 39,410,036 |
|
| $ | 48,385,335 |
|
| $ | 39,935,912 |
|
| $ | 31,411,353 |
| ||||||||||||||||||||
Lease bonuses and rentals |
|
| 5,149,297 |
|
|
| 7,735,785 |
|
|
| 2,010,395 |
|
|
| 423,328 |
|
|
| 938,846 |
|
|
| 690,961 |
|
|
| 1,547,078 |
|
|
| 1,580,997 |
|
|
| 5,149,297 |
|
|
| 7,735,785 |
|
Gains (losses) on derivative contracts |
|
| 1,249,840 |
|
|
| (86,355 | ) |
|
| 13,822,506 |
|
|
| 247,414 |
|
|
| 611,024 |
|
|
| 907,419 |
|
|
| 6,105,145 |
|
|
| (4,932,068 | ) |
|
| 1,249,840 |
|
|
| (86,355 | ) |
Gain on asset sales |
|
| 3,997,436 |
|
|
| 18,973,426 |
|
|
| - |
|
|
| 26,105 |
|
|
| 2,688,408 |
| ||||||||||||||||||||
|
|
| 46,335,049 |
|
|
| 39,060,783 |
|
|
| 70,366,815 |
|
|
| 83,517,270 |
|
|
| 62,155,748 |
|
|
| 28,965,819 |
|
|
| 66,035,685 |
|
|
| 45,034,264 |
|
|
| 46,361,154 |
|
|
| 41,749,191 |
|
Costs and expenses |
|
|
|
|
|
|
|
|
|
|
|
|
|
|
|
|
|
|
|
|
|
|
|
|
|
|
|
|
|
|
|
|
|
|
|
|
|
|
|
|
Lease operating expense |
|
| 12,682,969 |
|
|
| 13,590,089 |
|
|
| 17,472,408 |
|
|
| 13,912,792 |
|
|
| 11,861,403 |
|
|
| 4,841,541 |
|
|
| 6,398,522 |
|
|
| 6,714,448 |
|
|
| 6,488,494 |
|
|
| 8,050,460 |
|
Transportation, gathering and marketing |
|
| 4,812,869 |
|
|
| 6,089,903 |
|
|
| 6,745,830 |
|
|
| 6,194,475 |
|
|
| 5,539,629 |
| ||||||||||||||||||||
Production taxes |
|
| 1,548,399 |
|
|
| 1,071,632 |
|
|
| 1,702,302 |
|
|
| 2,694,118 |
|
|
| 1,834,840 |
|
|
| 1,022,912 |
|
|
| 1,902,636 |
|
|
| 2,089,050 |
|
|
| 1,548,399 |
|
|
| 1,071,632 |
|
Depreciation, depletion and amortization |
|
| 18,397,548 |
|
|
| 24,487,565 |
|
|
| 23,821,139 |
|
|
| 21,896,902 |
|
|
| 21,945,768 |
|
|
| 11,313,783 |
|
|
| 18,196,583 |
|
|
| 18,395,040 |
|
|
| 18,397,548 |
|
|
| 24,487,565 |
|
Provision for impairment |
|
| 662,990 |
|
|
| 12,001,271 |
|
|
| 5,009,191 |
|
|
| 1,096,076 |
|
|
| 530,670 |
|
|
| 29,904,528 |
|
|
| 76,824,337 |
|
|
| - |
|
|
| 662,990 |
|
|
| 12,001,271 |
|
Loss (gain) on asset sales & other |
|
| 105,830 |
|
|
| (2,576,237 | ) |
|
| (685,369 | ) |
|
| (799,559 | ) |
|
| (1,666,536 | ) | ||||||||||||||||||||
Interest expense |
|
| 1,275,138 |
|
|
| 1,344,619 |
|
|
| 1,550,483 |
|
|
| 462,296 |
|
|
| 157,558 |
|
|
| 1,286,788 |
|
|
| 1,995,789 |
|
|
| 1,748,101 |
|
|
| 1,275,138 |
|
|
| 1,344,619 |
|
General and administrative |
|
| 7,441,242 |
|
|
| 7,139,728 |
|
|
| 7,339,320 |
|
|
| 7,433,183 |
|
|
| 6,801,996 |
|
|
| 8,024,901 |
|
|
| 8,565,243 |
|
|
| 7,342,441 |
|
|
| 7,441,242 |
|
|
| 7,139,728 |
|
Other expense (income) |
|
| (466 | ) |
|
| 288,610 |
|
|
| 102,685 |
|
|
| 131,935 |
|
|
| 112,171 |
| ||||||||||||||||||||
|
|
| 42,114,116 |
|
|
| 57,058,667 |
|
|
| 56,209,474 |
|
|
| 46,695,808 |
|
|
| 41,465,699 |
|
|
| 61,206,856 |
|
|
| 120,261,623 |
|
|
| 43,137,595 |
|
|
| 42,140,221 |
|
|
| 59,747,075 |
|
|
|
|
|
|
|
|
|
|
|
|
|
|
|
|
|
|
|
|
|
|
|
|
|
|
|
|
|
|
|
|
|
|
|
|
|
|
|
|
|
|
Income (loss) before provision (benefit) for income taxes |
|
| 4,220,933 |
|
|
| (17,997,884 | ) |
|
| 14,157,341 |
|
|
| 36,821,462 |
|
|
| 20,690,049 |
|
|
| (32,241,037 | ) |
|
| (54,225,938 | ) |
|
| 1,896,669 |
|
|
| 4,220,933 |
|
|
| (17,997,884 | ) |
Provision (benefit) for income taxes |
|
| 689,000 |
|
|
| (7,711,000 | ) |
|
| 4,836,000 |
|
|
| 11,820,000 |
|
|
| 6,730,000 |
|
|
| (8,289,000 | ) |
|
| (13,481,000 | ) |
|
| (12,739,000 | ) |
|
| 689,000 |
|
|
| (7,711,000 | ) |
Net income (loss) |
| $ | 3,531,933 |
|
| $ | (10,286,884 | ) |
| $ | 9,321,341 |
|
| $ | 25,001,462 |
|
| $ | 13,960,049 |
|
| $ | (23,952,037 | ) |
| $ | (40,744,938 | ) |
| $ | 14,635,669 |
|
| $ | 3,531,933 |
|
| $ | (10,286,884 | ) |
|
|
|
|
|
|
|
|
|
|
|
|
|
|
|
|
|
|
|
|
|
|
|
|
|
|
|
|
|
|
|
|
|
|
|
|
|
|
|
|
|
Basic and diluted earnings (loss) per share |
| $ | 0.21 |
|
| $ | (0.61 | ) |
| $ | 0.56 |
|
| $ | 1.49 |
|
| $ | 0.84 |
|
| $ | (1.41 | ) |
| $ | (2.43 | ) |
| $ | 0.86 |
|
| $ | 0.21 |
|
| $ | (0.61 | ) |
Dividends declared per share |
| $ | 0.16 |
|
| $ | 0.16 |
|
| $ | 0.16 |
|
| $ | 0.16 |
|
| $ | 0.14 |
|
| $ | 0.10 |
|
| $ | 0.16 |
|
| $ | 0.16 |
|
| $ | 0.16 |
|
| $ | 0.16 |
|
|
|
|
|
|
|
|
|
|
|
|
|
|
|
|
|
|
|
|
|
|
|
|
|
|
|
|
|
|
|
|
|
|
|
|
|
|
|
|
|
|
Weighted average shares outstanding |
|
|
|
|
|
|
|
|
|
|
|
|
|
|
|
|
|
|
|
|
|
|
|
|
|
|
|
|
|
|
|
|
|
|
|
|
|
|
|
|
Basic and diluted |
|
| 16,900,185 |
|
|
| 16,840,856 |
|
|
| 16,768,904 |
|
|
| 16,727,183 |
|
|
| 16,713,808 |
|
|
| 17,010,934 |
|
|
| 16,743,746 |
|
|
| 16,952,664 |
|
|
| 16,900,185 |
|
|
| 16,840,856 |
|
|
|
|
|
|
|
|
|
|
|
|
|
|
|
|
|
|
|
|
|
|
|
|
|
|
|
|
|
|
|
|
|
|
|
|
|
|
|
|
|
|
Net cash provided by (used in): |
|
|
|
|
|
|
|
|
|
|
|
|
|
|
|
|
|
|
|
|
|
|
|
|
|
|
|
|
|
|
|
|
|
|
|
|
|
|
|
|
Operating activities |
| $ | 20,758,192 |
|
| $ | 22,639,151 |
|
| $ | 47,624,914 |
|
| $ | 53,099,746 |
|
| $ | 38,425,477 |
|
| $ | 11,106,295 |
|
| $ | 21,005,684 |
|
| $ | 26,943,894 |
|
| $ | 20,758,192 |
|
| $ | 22,639,151 |
|
Investing activities |
| $ | (25,107,760 | ) |
| $ | 565,617 |
|
| $ | (31,642,385 | ) |
| $ | (122,428,139 | ) |
| $ | (27,403,043 | ) |
| $ | (6,462,518 | ) |
| $ | 10,325,211 |
|
| $ | (21,829,015 | ) |
| $ | (25,107,760 | ) |
| $ | 565,617 |
|
Financing activities |
| $ | 4,436,146 |
|
| $ | (23,337,470 | ) |
| $ | (15,888,369 | ) |
| $ | 66,970,977 |
|
| $ | (10,139,362 | ) |
| $ | (114,073 | ) |
| $ | (25,702,706 | ) |
| $ | (5,140,168 | ) |
| $ | 4,436,146 |
|
| $ | (23,337,470 | ) |
|
|
|
|
|
|
|
|
|
|
|
|
|
|
|
|
|
|
|
|
|
|
|
|
|
|
|
|
|
|
|
|
|
|
|
|
|
|
|
|
|
Total assets |
| $ | 206,744,219 |
|
| $ | 197,824,326 |
|
| $ | 238,825,273 |
|
| $ | 246,640,604 |
|
| $ | 147,838,430 |
|
| $ | 100,021,835 |
|
| $ | 126,644,947 |
|
| $ | 206,749,686 |
|
| $ | 206,744,219 |
|
| $ | 197,824,326 |
|
Long-term debt |
| $ | 52,222,000 |
|
| $ | 44,500,000 |
|
| $ | 65,000,000 |
|
| $ | 78,000,000 |
|
| $ | 8,262,256 |
| ||||||||||||||||||||
Shareholders' equity |
| $ | 116,707,539 |
|
| $ | 115,191,819 |
|
| $ | 127,004,675 |
|
| $ | 119,188,653 |
|
| $ | 95,655,486 |
| ||||||||||||||||||||
Total debt |
| $ | 28,750,000 |
|
| $ | 35,425,000 |
|
| $ | 51,000,000 |
|
| $ | 52,222,000 |
|
| $ | 44,500,000 |
| ||||||||||||||||||||
Stockholders' equity |
| $ | 62,993,926 |
|
| $ | 79,309,533 |
|
| $ | 128,765,205 |
|
| $ | 116,707,539 |
|
| $ | 115,191,819 |
| ||||||||||||||||||||
(33)
ITEM |
|
BUSINESS OVERVIEWThe following discussion and analysis should be read in conjunction with our accompanying financial statements and the notes to those financial statements included elsewhere in this Annual Report. The following discussion includes forward-looking statements that reflect our plans, estimates and beliefs. Our actual results could differ materially from those discussed in these forward-looking statements as a result of many factors, including those discussed under “Risk Factors” and elsewhere in this Annual Report. The following discussion and analysis generally discuss fiscal year 2020 and 2019 items and fiscal year-to-year comparisons between 2020 and 2019. Discussions of 2018 items and year-to-year comparisons between 2019 and 2018 that are not included in this Form 10-K can be found in "Management's Discussion and Analysis of Financial Condition and Results of Operations" in Part II, Item 7 of our Annual Report on Form 10-K for the fiscal year ended September 30, 2019.
The Company’s principal lineBusiness Overview
We are focused on perpetual natural gas and oil mineral ownership in resource plays in the United States. Prior to a strategy change in 2019, we participated with a working interest on some of our mineral and leasehold acreage and as a result, we still have legacy interests in leasehold acreage and non-operated interests in natural gas and oil properties. Effective October 8, 2020, our corporate name was changed to PHX Minerals Inc. to more accurately reflect our business is to explore for, develop, acquire, produce and sell oil, NGL and natural gas. Resultsstrategy.
Our results of operations are dependent primarily upon the Company’s: existing reserve quantities; costs associated with acquiring, exploring for and developing new reserves; production quantities and related production costs; and oil, NGL and natural gas, sales prices.
Fiscal 2017 oil and NGL sales prices. Although a significant amount of our revenues is currently derived from the production and sale of natural gas, oil and NGL on our working interests, a growing portion of our revenues is derived from royalties granted from the production decreased 15% and 1%, respectively,sale of natural gas, oil and NGL.
Strategic Focus on Mineral Ownership
During fiscal 2019, we made the strategic decision to focus on perpetual natural gas and oil mineral ownership and growth through mineral acquisitions and the development of our significant mineral acreage inventory in our core areas of focus. In accordance with this decision, we ceased taking any working interest positions on our mineral and leasehold acreage going forward. In fiscal 2020, we did not participate with a working interest in the drilling of any new wells. We believe that our strategy to focus on mineral ownership is the best path to giving the Company’s stockholders the greatest risk-weighted returns on their investments.
Market Conditions and Commodity Prices
Commodity prices are affected by many factors outside of our control, including changes in market supply and demand, which are impacted by weather conditions, pipeline capacity constraints, inventory storage levels, basis differentials and other factors. As a result, we cannot accurately predict future commodity prices and, therefore, we cannot determine with any degree of certainty what effect increases or decreases in these prices will have on our production volumes or revenues.
Our working interest and royalty revenues may vary significantly from period to period as a result of changes in commodity prices, production mix and volumes of production sold by our operators.
Production and Operational Update
Our natural gas, oil and NGL production increased 2%for the fiscal year ended September 30, 2020, decreased 16%, 18% and 22%, respectively, from that of 2016.2019. The 2017 higher oil, NGL and2020 fiscal year’s lower natural gas, oil and NGL prices (see(as discussed below), partially offset by and the overall production changes noted above resulted in a 27% increase41% decrease in revenues from the sale of oil, NGL and natural gas. Based on recent forward strip pricing, the Company currently anticipates 2018 average oil, NGL and natural gas, prices will be slightly higher than their corresponding average pricesoil and NGL in 2017.2020.
The Company’s proved developed oil, NGL and natural gas, oil and NGL reserves increaseddecreased to 57.7 Bcfe in 2017,2020, compared to 2016, by 30.3106.4 Bcfe in 2019, a decrease of approximately 48.7 Bcfe, or 37%46%. The increasedecrease was primarily due to positiverevisions and slightly offset by additions, extensions and purchases. The revisions were primarily related to lower gas and oil prices and consisted of natural gas and oil wells reaching their economic limits earlier than was projected in 2019, and the removal of proved undeveloped reserves not permitted, in progress, or drilled and uncompleted as a result of a change in strategy, and the impact of COVID-19 and reduced pricing leading to decreased operator activity in 2020. This was coupled with negative performance revisions conversion from PUD, additionson developed reserves principally due to lower performance of high-interest Woodford natural gas wells in the STACK and extensions.Arkoma Stack in Oklahoma and, to a lesser extent, lower performance of the Eagle Ford Shale oil properties in southern Texas.
As of September 30, 2017,2020, the Company owned an average 1.2%0.3% net revenue interest in 63125 wells, all royalty interest, that were drillingbeing drilled or testing.awaiting completion.
Other than the leaseResults of office space, the Company had no off balance sheet arrangements during 2017 or prior years.Operations
The following table reflects certain operating data for the periods presented:
|
| For the Year Ended September 30, |
| For the Year Ended September 30, | ||||||||||||
|
|
|
| Percent |
|
|
| Percent |
|
|
|
|
|
|
| Percent |
|
| 2017 |
| Incr. or (Decr.) |
| 2016 |
| Incr. or (Decr.) |
| 2015 |
| 2020 |
| 2019 |
| Incr. or (Decr.) |
Production: |
|
|
|
|
|
|
|
|
|
|
|
|
|
|
|
|
Natural Gas (Mcf) |
| 5,962,705 |
| 7,086,761 |
| (16%) | ||||||||||
Oil (Bbls) |
| 310,677 |
| (15%) |
| 364,252 |
| (20%) |
| 453,125 |
| 269,785 |
| 329,199 |
| (18%) |
NGL (Bbls) |
| 173,858 |
| 2% |
| 171,060 |
| (19%) |
| 210,960 |
| 168,623 |
| 216,259 |
| (22%) |
Natural Gas (Mcf) |
| 8,194,529 |
| (1%) |
| 8,284,377 |
| (15%) |
| 9,745,223 | ||||||
Mcfe |
| 11,101,739 |
| (3%) |
| 11,496,249 |
| (16%) |
| 13,729,733 |
| 8,593,153 |
| 10,359,509 |
| (17%) |
Average Sales Price: |
|
|
|
|
|
|
|
|
|
|
|
|
|
|
|
|
Natural Gas (per Mcf) |
| $1.72 |
| $2.48 |
| (31%) | ||||||||||
Oil (per Bbl) |
| $46.27 |
| 26% |
| $36.70 |
| (31%) |
| $53.12 |
| $41.47 |
| $55.07 |
| (25%) |
NGL (per Bbl) |
| $19.87 |
| 58% |
| $12.60 |
| (31%) |
| $18.25 |
| $11.42 |
| $17.10 |
| (33%) |
Natural Gas (per Mcf) |
| $2.70 |
| 41% |
| $1.92 |
| (30%) |
| $2.73 | ||||||
Mcfe |
| $3.60 |
| 32% |
| $2.73 |
| (31%) |
| $3.97 |
| $2.72 |
| $3.80 |
| (28%) |
(34)Production by quarter for 2020 and 2019 was as follows (Mcfe):
|
| For the Year Ended September 30, 2020 |
| |||||||||
|
| Royalty Interest |
|
| Working Interest |
|
| Total |
| |||
First quarter |
|
| 785,431 |
|
|
| 1,493,056 |
|
|
| 2,278,487 |
|
Second quarter |
|
| 971,589 |
|
|
| 1,401,546 |
|
|
| 2,373,135 |
|
Third quarter |
|
| 814,501 |
|
|
| 1,089,251 |
|
|
| 1,903,752 |
|
Fourth quarter |
|
| 776,276 |
|
|
| 1,261,503 |
|
|
| 2,037,779 |
|
Total |
|
| 3,347,797 |
|
|
| 5,245,356 |
|
|
| 8,593,153 |
|
|
| For the Year Ended September 30, 2019 |
| |||||||||
|
| Royalty Interest |
|
| Working Interest |
|
| Total |
| |||
First quarter |
|
| 929,877 |
|
|
| 1,834,653 |
|
|
| 2,764,530 |
|
Second quarter |
|
| 770,455 |
|
|
| 1,651,070 |
|
|
| 2,421,525 |
|
Third quarter |
|
| 788,290 |
|
|
| 1,830,079 |
|
|
| 2,618,369 |
|
Fourth quarter |
|
| 860,177 |
|
|
| 1,694,908 |
|
|
| 2,555,085 |
|
Total |
|
| 3,348,799 |
|
|
| 7,010,710 |
|
|
| 10,359,509 |
|
Fiscal Year 20172020 Compared to Fiscal Year 20162019
Overview
Revenues decreased in 2020 primarily due to lower natural gas, oil and NGL sales, lower gains on asset sales and lower gains on derivative contracts. The Company recorded a net incomeloss of $3,531,933,$23,952,037, or $0.21$1.41 per share, in 2017,2020, compared to net loss of $10,286,884,$40,744,938, or $0.61$2.43 per share, in 2016. Revenues increased in 2017 primarily due to higher oil, NGL and natural gas sales and increased gains on derivative contracts partially offset by decreased lease bonuses received.
2019. Expenses decreased in 2017 mainly from a lower2020, primarily the result of decreases in provision for impairment lower(non-cash), DD&A, LOE and lower LOE partially offset by increases in G&Atransportation, gathering and production taxes and a decrease in gain on sale of assets.marketing expenses.
Oil, NGL and
Natural Gas, Sales
Oil and NGL and natural gas sales increased $8,524,559, or 27%, for 2017, as compared to 2016. Sales
| For the Year Ended September 30, |
| ||||||||
|
|
|
|
|
|
|
|
| Percent |
|
| 2020 |
|
| 2019 |
|
| Incr. or (Decr.) |
| ||
Natural gas, oil and NGL sales | $ | 23,370,003 |
|
| $ | 39,410,036 |
|
| (41%) |
|
The increasedecrease was due to increased oil, NGL anddecreased natural gas, oil and NGL prices of 26%31%, 58%25% and 41%33%, respectively, partially offsetcombined with lower natural gas, oil and natural gasNGL volumes of 15%16%, 18% and 1%22%, respectively, in 2017.
In the first half of 2017, we continued to see the results of expected production decline in oil, NGL and natural gas volumes. The results of our 2017 drilling program are reflected in the third and fourth quarters as first sales of the new wells began to occur.respectively.
The decrease in oil production was primarily thea result of naturalpostponement of workovers due to prevailing economic conditions as well as naturally declining production decline in high interest wells in the Eagle Ford, Shale, which was partiallyand asset sales in 2019 and 2020 in the Permian Basin in Texas and New Mexico. These decreases were slightly offset by 2017a ten-well drilling with first sales from two wellsprogram in the Bakken that came online in November 2019 and mineral acquisitions of Bakken and STACK producing properties in late April2019. Decreased natural gas and four wells in mid-August. To a lesser extent, declining production from various fields in western Oklahoma, the Texas Panhandle, and Bakken contributed to the decrease.
An overall increase in NGL production is the result of six new wells in the Anadarko Woodford Shale and six wells in the Eagle Ford Shale, which offset the natural production decline of existing wells in the Anadarko Woodford Shale in western and central Oklahoma and the Anadarko Basin Granite Wash in western Oklahoma and the Texas Panhandle.
Natural gas production volume decreases werewas primarily the result ofdue to naturally declining production in the Fayetteville Shale. ToArkoma Stack and STACK and, to a much lesser extent, decliningthe Fayetteville, as well as production from the Anadarko Woodford Shaledowntime in western and central Oklahoma, the Anadarko Basin Granite Wash and the southeastern Oklahoma Woodford Shale also contributed to the decrease. The decline was offset as a result of new well drilling in southeastern Oklahoma Woodford Shale, with first sales from four newhigh-interest wells in early Marchthe Arkoma Stack.
Given the Company’s strategic decision to cease participating with working interests, we plan to offset the natural decline of our existing production base by the development of our current inventory of mineral acreage and four more wells in mid-May. Additional contribution to gas production was established in the Anadarko Woodford Shale from six new wells with first sales in mid-July.through acquisitions of additional mineral interests going forward.
(35)
Production by quarter for 2017 and 2016 was as follows (Mcfe):
|
| 2017 |
|
| 2016 |
| ||
First quarter |
|
| 2,517,414 |
|
|
| 3,143,400 |
|
Second quarter |
|
| 2,351,207 |
|
|
| 2,786,303 |
|
Third quarter |
|
| 2,953,915 |
|
|
| 2,887,821 |
|
Fourth quarter |
|
| 3,279,203 |
|
|
| 2,678,725 |
|
Total |
|
| 11,101,739 |
|
|
| 11,496,249 |
|
Lease Bonus and Rentals
Lease bonuses and rentals decreased $2,586,488 in 2017. The decrease was mainly due to the Company leasing fewer acres in 2017 versus 2016. In 2017, the Company leased 2,067 net mineral acres in Oklahoma (mainly in Dewey, Canadian, McClain and Grady Counties), 272 net mineral acres in Texas (mainly in Andrews and Dawson Counties) and 125 net mineral acres in New Mexico (mainly in Lea and Eddy Counties). In 2016, the Company leased 4,057 net mineral acres in Cochran County, Texas, 663 net mineral acres in Blaine, Canadian, Custer and Dewey Counties, Oklahoma, and 706 net mineral acres in Grady and McClain Counties, Oklahoma.
Gains (Losses) on Derivative Contracts
| For the Year Ended September 30, |
| |||||||||
|
|
|
|
|
|
|
|
| Percent |
| |
| 2020 |
|
| 2019 |
|
| Incr. or (Decr.) |
| |||
Cash received (paid) on derivative contracts: |
|
|
|
|
|
|
|
|
|
|
|
Cash received (paid) on derivative contracts, net | $ | 4,109,210 |
|
| $ | 196,985 |
|
| 1,986% |
| |
Non-cash gain (loss) on derivative contracts: |
|
|
|
|
|
|
|
|
|
|
|
Non-cash gain (loss) on derivative contracts, net | $ | (3,201,791 | ) |
| $ | 5,908,160 |
|
| (154%) |
| |
Gains (losses) on derivative contracts, net | $ | 907,419 |
|
| $ | 6,105,145 |
|
| (85%) |
| |
|
|
|
|
|
|
|
|
|
|
|
|
| As of September 30, |
|
|
|
|
| |||||
| 2020 |
|
| 2019 |
|
|
|
|
| ||
Fair value of derivative contracts |
|
|
|
|
|
|
|
|
|
|
|
Net asset (net liability) | $ | (707,647 | ) |
| $ | 2,494,144 |
|
| (128%) |
| |
The fair value of derivative contracts was a net asset of $516,159 as of September 30, 2017, and a net liability of $428,271 as of September 30, 2016. We had achange in net gain on derivative contracts of $1,249,840 in 2017 as compared to a net loss of $86,355 in 2016. The change iswas principally due to the oilnatural gas and natural gasoil collars and fixed price swaps being more beneficial in the 2017, as NYMEX oil and natural gas futures experienced decreases in price2019 in relation to their respective contracted volumes and prices. During the collars and2020 period, we received $4,109,210 on settled derivative contracts as compared to $196,985 received in the fixed prices of the swaps. As of2019 period. The change from a net asset position at September 30, 2017,2019 to a net liability position at September 30, 2020 resulted in an unrealized loss on derivative contracts in the 2020 period of $3,201,791.
The Company’s natural gas and oil costless collar contracts and fixed price swaps havein place at September 30, 2020, had expiration dates of December 2017October 2020 through December 2018.February 2022. The Company utilizes derivative contracts for the purpose of protecting its cash flow and return on investments.
Gains on Asset Sales
In 2020, the Company recorded gain on asset sales of $3,997,436 as compared to $18,973,426 in 2019. During the first quarter of 2020, the Company sold producing mineral acreage in Eddy County, New Mexico, for a gain of $3,272,499. The Company utilized a like-kind exchange under Internal Revenue Code Section 1031 to defer income tax on all of the gain by offsetting it with the STACK/SCOOP mineral acreage acquisition that was purchased during the quarter using qualified exchange accommodation agreements. During the fourth quarter of 2020, the Company sold 5,925 non-producing mineral acres in northwestern Oklahoma for a gain of $717,640. The remaining gain on asset sales in 2020 was due to various asset sales less adjustments.
In 2019, the Company sold mineral acreage in Lea and Eddy Counties, New Mexico, for a gain of $9,096,938; Martin County, Texas, (mineral and leasehold) for a gain of $4,921,656; Loving, Reeves and Ward Counties, Texas, for a gain of $2,704,323; and Reagan and Upton Counties, Texas, for a gain of $2,250,509.
Lease Operating Expenses (LOE)
| For the Year Ended September 30, |
| ||||||||
|
|
|
|
|
|
|
|
| Percent |
|
| 2020 |
|
| 2019 |
|
| Incr. or (Decr.) |
| ||
Lease operating expenses | $ | 4,841,541 |
|
| $ | 6,398,522 |
|
| (24%) |
|
Lease operating expenses per MCFE | $ | 0.56 |
|
| $ | 0.62 |
|
| (10%) |
|
LOE decreased $907,120 or 7% in 2017. LOE costs per Mcfe of production decreased from $1.18 in 2016related to $1.14 in 2017. The total LOE decrease was largely due to decreased field operating costs of $1,561,965decreased $1,556,981 or 24% in 2017,2020, compared to 2016. Field operating costs were $0.58 per Mcfe2019. The decrease in 2017, compared to $0.70 per Mcfe in 2016, a 17% decrease. This decrease inLOE rate was principally the result of significantthe Company’s strategic decision to not participate with a working interest in new low-cost production coming on, decreasedwells, selling some non-core marginal properties which had higher operating costs and operators negotiating lower well service pricing resulting in several fieldslower LOE charges.
Transportation, Gathering and the company selling some high operating cost wellsMarketing
| For the Year Ended September 30, |
| ||||||||
|
|
|
|
|
|
|
|
| Percent |
|
| 2020 |
|
| 2019 |
|
| Incr. or (Decr.) |
| ||
Transportation, gathering and marketing | $ | 4,812,869 |
|
| $ | 6,089,903 |
|
| (21%) |
|
Transportation, gathering and marketing per MCFE | $ | 0.56 |
|
| $ | 0.59 |
|
| (5%) |
|
Transportation, gathering and marketing decreased $1,277,034 or 21% in 2017.
2020, compared to 2019, primarily due to decreased production in 2020. The decrease in LOE related to field operating costs was partially offset with an increase in handling fees (primarilytransportation, gathering transportation and marketing costs) of $654,845 in 2017, as comparedrate was primarily due to 2016. On a per Mcfe basis, these fees increased $0.08 due mainly to a 15% decrease in oil production versus a 1% decrease indecreased natural gas production.production coupled with decreased natural gas prices. Natural gas sales bearcause the large majority of the handling fees.handling. Handling fees are charged either as a percent of sales or based on production volumes.
(36)
| For the Year Ended September 30, |
| ||||||||
|
|
|
|
|
|
|
|
| Percent |
|
| 2020 |
|
| 2019 |
|
| Incr. or (Decr.) |
| ||
Production taxes | $ | 1,022,912 |
|
| $ | 1,902,636 |
|
| (46%) |
|
Production taxes as % of sales |
| 4.4 | % |
|
| 4.8 | % |
| (8%) |
|
Production taxes increased $476,767 or 44% in 2017, as compared to 2016.The increasedecrease in amount was primarily the result of increased oil, NGL anddecreased natural gas, oil and NGL sales of $8,524,559$16,040,033 during 2017. Production taxes as a percentage of oil, NGL and natural gas sales increased from 3.4% in 2016 to 3.9% in 2017. The increase in tax rate was the result of the expiration of production tax discounts on some of the Company’s horizontally drilled wells in Oklahoma and Arkansas. The low overall production tax rate in both years was due to a large proportion of the Company’s oil and natural gas revenues coming from horizontally drilled wells, which are eligible for reduced Oklahoma and Arkansas production tax rates in the first few years of production.2020.
Depreciation, Depletion and Amortization (DD&A)
| For the Year Ended September 30, |
| ||||||||
|
|
|
|
|
|
|
|
| Percent |
|
| 2020 |
|
| 2019 |
|
| Incr. or (Decr.) |
| ||
Depreciation, depletion and amortization | $ | 11,313,783 |
|
| $ | 18,196,583 |
|
| (38%) |
|
Depreciation, depletion and amortization per MCFE | $ | 1.32 |
|
| $ | 1.76 |
|
| (25%) |
|
DD&A decreased $6,090,017$3,108,787 due to natural gas, oil and NGL production volumes decreasing 17% collectively in 2017. DD&A per Mcfe was $1.66 in 2017,2020, compared to $2.13 in 2016. DD&A decreased $5,249,692 as2019. An additional decrease of $3,774,013 was the result of a $0.47$0.44 decrease in the DD&A rate per Mcfe. This was coupled by a decrease of $840,325 due to oil, NGL and natural gas production volumes decreasing 3% collectively in 2017, compared to 2016. The rate
decrease was principally due to higherlarge impairments taken during the fourth quarter of fiscal 2019 and the second quarter of fiscal 2020, which lowered the basis of the assets. The rate decrease was partially offset by lower natural gas, oil NGL and natural gasNGL prices utilized in the reserve calculations during 2017,the 2020 period, as compared to 2016, lengthening2019 period, shortening the economic life of wells thus resultingwells. This resulted in higherlower projected remaining reserves on a significant number of wells. The Company had new high volume wells with low finding costs begin producing in the 2017, which also contributed to the rate decrease.causing increased units of production DD&A.
Provision for Impairment
Provision for impairment decreased $11,338,281was $29,904,528 in 2017,2020, as compared to 2016.$76,824,337 provision for impairment in 2019. During 2017,the 2020 period, impairment of $46,279$29,315,806 was recorded on fiveseven different fields including the Fayetteville and Eagle Ford shales, which represent 89% of our total impairment. The impairment on assets in these seven fields was caused by lower futures prices associated with our products. Futures prices experienced downward pressure resulting in low pricing as of the end of the fiscal 2020 second quarter. The reduced future net value associated with these fields caused the assets to fail the step one test for impairment as their undiscounted cash flows were not high enough to cover the book basis of the assets. These assets were written down to their fair market value as required by GAAP. The Fayetteville assets are dry-gas assets, of which the Company acquired a portion in 2011. Low natural gas prices at March 31, 2020, were the primary reason for impairment in this field. The Company recognized an impairment related to the Eagle Ford at September 30, 2019, of $76,560,376, primarily due to the removal of working interest PUDs from the Company’s reserve report. The further impairment of the Eagle Ford assets at March 31, 2020, was due to the decline in Oklahomacommodity prices over fiscal 2020 at that time. The remaining $588,721 and Texas. Another $616,711$263,961 of impairment was recorded on a group of wells that were held for sale at September 30, 2017. During 2016, impairment of $12,001,271 was recorded on 44 fields, primarilyother assets in Oklahoma, Kansas2020 and Texas. Two fields in western Oklahoma and the Texas Panhandle accounted for $7,548,533 or 63% of the impairment due mainly to declining oil, NGL and natural gas prices.2019, respectively.
Loss (Gain) on Asset Sales and Other
Loss (gain) on asset sales and other was a net loss of $105,830 in 2017, as compared to a net gain of $2,576,237 in 2016. The net loss in 2017 was mainly due to the Company selling some high operating cost wells at a loss during the year. The net gain in 2016 was largely due to the gain on sale of assets from two of the Company’s partnerships.
Interest Expense
| For the Year Ended September 30, |
| ||||||||
|
|
|
|
|
|
|
|
| Percent |
|
| 2020 |
|
| 2019 |
|
| Incr. or (Decr.) |
| ||
Interest Expense | $ | 1,286,788 |
|
| $ | 1,995,789 |
|
| (36%) |
|
Weighted average debt outstanding | $ | 32,290,257 |
|
| $ | 43,092,804 |
|
| (25%) |
|
Interest expense decreased $69,481 in 2017, as compared to 2016. The decrease was due to lower interest rates, on average, and a lower outstanding debt balance during 2017.2020.
(37)
General and Administrative Costs (G&A)
| For the Year Ended September 30, |
| ||||||||
|
|
|
|
|
|
|
|
| Percent |
|
| 2020 |
|
| 2019 |
|
| Incr. or (Decr.) |
| ||
General and administrative | $ | 8,024,901 |
|
| $ | 8,565,243 |
|
| (6%) |
|
G&A increased $301,514 in 2017, as compared to 2016. This increaseThe decrease was primarily the result of higher legallower personnel expenses and lower Board expenses. The decrease in personnel expenses was primarily due to the severance of approximately $670,000 upon the resignation of our former CEO toward the end of fiscal 2019, reductions in work force and lower performance-related compensation. Lower Board expenses are due to fewer Board members in 2020 as compared to 2019. Personnel and Board expenses were partially offset by increased technical consulting feesand legal expenses. The increase in 2017.technical consulting was due to increased cost for our then interim (now current) CEO, geologic and engineering fees. The increase in legal fee increaseexpenses was mainlyprimarily due to additional work done aroundprovided pertaining to the Company filing its first shelf registration. The technical consulting fee increase was due to additional work performed to analyze possible acquisitions.Company’s proxy statement, equity offering and general business advisement.
Provision (Benefit) for Income Taxes
| For the Year Ended September 30, |
| |||||||||
|
|
|
|
|
|
|
|
| Percent |
| |
| 2020 |
|
| 2019 |
|
| Incr. or (Decr.) |
| |||
|
|
|
|
|
|
|
|
|
|
|
|
Provision (benefit) for income taxes | $ | (8,289,000 | ) |
| $ | (13,481,000 | ) |
| (39%) |
| |
Effective tax rate |
| 26 | % |
|
| 25 | % |
| 3% |
| |
In both 2020 and 2019, the tax benefits were the result of a large pretax loss from the impairments in the second quarter of 2020 and the fourth quarter of 2019.
The 2017 provision for income taxes of $689,000 was based on a pre-tax income of $4,220,933, as compared to a benefit for income taxes of $7,711,000 in 2016, based on a pre-tax loss of $17,997,884. The effective tax rate for 2017 and 2016 was a 16% provision and a 43% benefit, respectively. When a provision for income taxes is recorded,expected for the year, federal and Oklahoma excess percentage depletion decreases the effective tax rate, while the effect is to increase the effective tax rate when a benefit for income taxes is recorded, as was the case in 2016. The effective tax rate for 2017 was also impacted by excess tax benefits from stock-based compensation recorded to income tax expense (benefit) during 2017.recorded.
Fiscal Year 2016 Compared to Fiscal Year 2015
Overview
The Company recorded net loss of $10,286,884, or $0.61 per share, in 2016, compared to net income of $9,321,341, or $0.56 per share, in 2015. Revenues decreased in 2016 primarily due to lower oil, NGLLiquidity and natural gas sales and decreased gains on derivative contracts partially offset by increased lease bonuses received.
Expenses increased in 2016, mainly from a larger provision for impairment and higher DD&A partially offset by a decrease in LOE and production taxes and an increase in gain on sale of assets.
Oil, NGL and Natural Gas Sales
Oil, NGL and natural gas sales decreased $23,122,561, or 42%, for 2016, as compared to 2015. The decrease was due to decreased oil, NGL and natural gas prices of 31%, 31% and 30%, respectively, coupled with lower oil, NGL and natural gas volumes of 20%, 19% and 15%, respectively, in 2016.
The decrease in oil production was primarily the result of natural production decline in the Eagle Ford Shale, which was not offset by new production in the play due to significantly reduced drilling activity. To a lesser extent, declining production from various fields in western Oklahoma, the Texas Panhandle and the Northern Oklahoma Mississippian contributed to the decrease.
NGL production volume decreases were largely the result of natural production decline in the Anadarko Woodford Shale in western and central Oklahoma and the Anadarko Basin Granite Wash in western Oklahoma and the Texas Panhandle.
(38)
Natural gas production volume decreases were primarily the result of naturally declining production in the Fayetteville Shale. To a lesser extent, declining production from the Anadarko Basin Granite Wash and the southeastern Oklahoma Woodford Shale also contributed to the decrease.
Production by quarter for 2016 and 2015 was as follows (Mcfe):
|
| 2016 |
|
| 2015 |
| ||
First quarter |
|
| 3,143,400 |
|
|
| 3,737,483 |
|
Second quarter |
|
| 2,786,303 |
|
|
| 3,455,265 |
|
Third quarter |
|
| 2,887,821 |
|
|
| 3,315,899 |
|
Fourth quarter |
|
| 2,678,725 |
|
|
| 3,221,086 |
|
Total |
|
| 11,496,249 |
|
|
| 13,729,733 |
|
Lease Bonus and Rentals
Lease bonuses and rentals increased $5,725,390 in 2016. The increase was mainly due to the Company leasing 4,057 net mineral acres in Cochran County, Texas, 663 net mineral acres in Blaine, Canadian, Custer and Dewey Counties, Oklahoma, and 706 net mineral acres in Grady and McClain Counties, Oklahoma, in 2016. In 2015, the Company leased 2,407 net mineral acres in Andrews and Winkler Counties, Texas.
Gains (Losses) on Derivative Contracts
Gains on derivative contracts decreased $13,908,861 in 2016. The decrease was mainly due to the oil and, to a lesser extent, natural gas collars and fixed price swaps being more beneficial in 2015, as NYMEX oil and natural gas futures had fallen further below the floor of the collars and the fixed prices of the swaps. As of September 30, 2016, the Company’s natural gas costless collar contracts and natural gas fixed price swaps have expiration dates of October 2016 through December 2017; the oil costless collar contracts have expiration dates of October 2016 through March 2017.
Lease Operating Expenses (LOE)
LOE decreased $3,882,319 or 22% in 2016. LOE costs per Mcfe of production decreased from $1.27 in 2015 to $1.18 in 2016. The total LOE decrease was largely due to decreased field operating costs of $2,604,510 in 2016, compared to 2015. Field operating costs were $0.70 per Mcfe in 2016, compared to $0.78 per Mcfe in 2015, a 10% decrease. This decrease in rate was principally the result of operating efficiencies gained in the Eagle Ford Shale field due to the addition of a salt water disposal system and electrification of the field, as well as fewer workovers.
(39)
The decrease in LOE related to field operating costs was coupled with a decrease in handling fees (primarily gathering, transportation and marketing costs) of $1,277,809 in 2016, as compared to 2015. The decrease in the amount in 2016 is the result of decreased oil, NGL and natural gas production and sales. On a per Mcfe basis, these fees decreased $0.01. Natural gas sales bear the large majority of the handling fees. Handling fees are charged either as a percent of sales or based on production volumes.
Production Taxes
Production taxes decreased $630,670 or 37% in 2016, as compared to 2015. The decrease in amount was primarily the result of decreased oil, NGL and natural gas sales of $23,122,561 during 2016. Production taxes as a percentage of oil, NGL and natural gas sales increased slightly from 3.1% in 2015 to 3.4% in 2016. The increase in tax rate was the result of the expiration of production tax discounts on some of the Company’s horizontally drilled wells in Oklahoma and Arkansas, as well as the increased proportionate sales coming from Texas and North Dakota, where initial tax rates are higher. The low overall production tax rate in both years was due to a large proportion of the Company’s oil and natural gas revenues coming from horizontally drilled wells, which are eligible for reduced Oklahoma and Arkansas production tax rates in the first few years of production.
Depreciation, Depletion and Amortization (DD&A)
DD&A increased $666,426 in 2016. DD&A per Mcfe was $2.13 in 2016, compared to $1.74 in 2015. DD&A increased $4,541,529 as the result of a $0.39 increase in the DD&A rate. This rate increase was principally due to lower oil, NGL and natural gas prices utilized in the reserve calculations during 2016, as compared to 2015, shortening the economic life of wells thus resulting in lower projected remaining reserves on a significant number of wells causing increased units of production DD&A. An offsetting decrease of $3,875,103 was due to oil, NGL and natural gas production volumes decreasing 16% collectively in 2016, compared to 2015.
Provision for Impairment
Provision for impairment increased $6,992,080 in 2016, as compared to 2015. During 2016, impairment of $12,001,271 was recorded on 44 fields primarily in Oklahoma, Kansas and Texas. Two fields in western Oklahoma and the Texas Panhandle accounted for $7,548,533 or 63% of the impairment due mainly to declining oil, NGL and natural gas prices. During 2015, impairment of $5,009,191 was recorded on 27 fields primarily in Oklahoma, Kansas and Texas. One oil field in Hemphill County, Texas, accounted for $1,846,488 of the impairment due mainly to declining oil prices.
Loss (Gain) on Asset Sales and Other
Loss (gain) on asset sales and other was a net gain of $2,576,237 in 2016, as compared to a net gain of $685,369 in 2015. The net gain in 2016 was largely due to the gain on sale of assets from two of the Company’s partnerships. The net gain in 2015 was mainly the result of a lawsuit settlement related to participation rights on some of the Company’s mineral acreage in Arkansas and higher income from partnerships.
(40)
Interest expense decreased $205,864 in 2016, as compared to 2015. The decrease was due to a lower outstanding debt balance in 2016.
General and Administrative Costs (G&A)
G&A decreased $199,592 in 2016, as compared to 2015. This decrease was primarily the result of lower legal and technical consulting fees in 2016.
Provision (Benefit) for Income Taxes
The 2016 benefit for income taxes of $7,711,000 was based on a pre-tax loss of $17,997,884, as compared to a provision for income taxes of $4,836,000 in 2015, based on a pre-tax income of $14,157,341. The effective tax rate for 2016 was 43%, compared to an effective tax rate for 2015 of 34%. When a provision for income taxes is recorded, federal and Oklahoma excess percentage depletion decreases the effective tax rate, while the effect is to increase the effective tax rate when a benefit for income taxes is recorded, as was the case in 2016.
LIQUIDITY AND CAPITAL RESOURCESCapital Resources
At September 30, 2017,2020, the Company had positive working capital of $6,451,356,$13,335,880, as compared to positive working capital of $1,787,560$11,378,829 at September 30, 2016.2019. The slight increase in working capital was primarily driven by increased cash as a result of proceeds from the 2020 equity issuance and increased refundable income taxes, partially offset by decreased derivative contract receivables and increased derivative contract liabilities, decreased sales receivables and short-term debt in 2020.
Liquidity
The Company has sufficient liquidity to manage the financial impact of the COVID-19 pandemic. However, the Company can provide no assurance that this will continue to be the case if the impact of COVID-19 is prolonged for an extended period of time or if there is an extended impact on commodity prices or the economy in general.
Cash and cash equivalents were $557,791$10,690,395 as of September 30, 2017,2020, compared to $471,213$6,160,691 at September 30, 2016,2019, an increase of $86,578.$4,529,704. Cash flows for the 12 months ended September 30 are summarized as follows:
|
|
|
|
|
|
|
|
|
|
|
|
|
|
|
|
|
|
|
|
|
|
|
|
|
Net cash provided (used) by: |
|
|
|
|
|
|
|
|
|
|
|
|
|
|
|
|
|
|
|
|
|
|
|
|
|
| 2017 |
|
| 2016 |
|
| Change |
|
| 2020 |
|
| 2019 |
|
| Change |
| ||||||
Operating activities |
| $ | 20,758,192 |
|
| $ | 22,639,151 |
|
| $ | (1,880,959 | ) |
| $ | 11,106,295 |
|
| $ | 21,005,684 |
|
| $ | (9,899,389 | ) |
Investing activities |
|
| (25,107,760 | ) |
|
| 565,617 |
|
|
| (25,673,377 | ) |
|
| (6,462,518 | ) |
|
| 10,325,211 |
|
|
| (16,787,729 | ) |
Financing activities |
|
| 4,436,146 |
|
|
| (23,337,470 | ) |
|
| 27,773,616 |
|
|
| (114,073 | ) |
|
| (25,702,706 | ) |
|
| 25,588,633 |
|
Increase (decrease) in cash and cash equivalents |
| $ | 86,578 |
|
| $ | (132,702 | ) |
| $ | 219,280 |
|
| $ | 4,529,704 |
|
| $ | 5,628,189 |
|
| $ | (1,098,485 | ) |
(41)
Operating activities:activities:
Net cash provided by operating activities decreased $1,880,959$9,899,389 during 2017,2020, as compared to 2016,2019, primarily the result of the following:
Receipts of oil, NGL and natural gas sales (net of production taxes and gathering, transportation and marketing costs) and other increased $2,467,494.
• | Receipts of natural gas, oil and NGL sales (net of production taxes and gathering, transportation and marketing costs) and other decreased $15,194,689; |
Decreased income tax payments of $1,309,905.
• | Increased income tax receipts of $1,445,554; |
Decreased net receipts on derivative contracts of $4,247,270.
• | Increased net receipts on derivative contracts of $3,912,225; |
Decreased payments for interest expense of $152,596.
• | Decreased payments for interest expense of $724,795; |
Decreased payments for G&A and other expense of $205,658.
• | Increased payments for G&A and other expense of $1,210,291, which included severance to former CEO; |
Decreased payments for field operating expenses of $1,085,802.
• | Decreased field operating expenses of $1,286,718; and |
Decreased lease bonus receipts of $2,855,144.
• | Decreased lease bonus receipts of $863,701. |
Investing activities:activities:
Net cash used in investing activities increased $25,673,377$16,787,729 during 2017,2020, as compared to 2016, due to:
Higher drilling and completion activity during 2017 increased capital expenditures by $21,821,662.
Lower proceeds from sale of assets of $3,778,026.
Financing activities:
Net cash used by financing activities decreased $27,773,616 during 2017,2019, primarily as compared to 2016, the result of the following:
• | Lower drilling and completion activity during 2020 decreased our capital expenditures by $3,122,871; |
• | Higher acquisition activity increased our expenditures by $4,625,381; and |
• | Lower proceeds received from the sale of assets of $15,286,867. |
During 2017, net borrowings increased $7,722,000. During 2016, net borrowingsFinancing activities:
Net cash used in financing activities decreased $20,500,000.$25,588,633 during 2020, as compared to 2019, primarily as a result of the following:
• | Increased net proceeds from equity issuance of $8,220,726 during 2020; |
• | Decreased stock repurchases by the Company of $7,446,365 during 2020; and |
• | Decreased net payments on debt of $8,900,000. |
Capital Resources
Capital expenditures to drill and complete wells increased $21,821,662 (547%)decreased $3,122,871 or 89% in 2017, as2020, compared to 2016.2019,as a result of the Company’s strategy to cease participating in any new wells with a working interest at the end of fiscal 2019. The Company received 119 well proposalscurrently has no remaining commitments that would require significant capital to drill and complete wells.
Since the Company has decided to cease any further participation in fiscal 2017, andwells with a working interest participation decisions were as follows: 41 wells met the Company’s participation criteriaon its mineral and elections were made to participate and 78 wells did not meet participation criteria with no participation elected.
(42)
The Company participated in eight BP operated southeastern Oklahoma Woodford wells with an averageleasehold acreage, we anticipate that capital expenditures for working interest properties will be minimal going forward, as the expenditures will be limited to capital workovers to enhance existing wells.
On November 14, 2019, the Company closed on the sale of 20%530 net mineral acres in Eddy County, New Mexico, for $3.4 million. At the time of sale, the assets were mostly amortized and an averagetherefore had minimal net revenue interestbook value. Almost all of 27.4%. All eight wells have been drilled. Fourthe value received was a gain on the sale of those wells were completed and began producing in the second quarterassets of 2017. The remaining four wells have been completed and started producing in the third quarter of 2017.
The Company agreed to participate in six Anadarko Basin Woodford wells, operated by Cimarex Energy, with 17.5% working interest and 16.25% net revenue interest. All six wells have been drilled, completed and started producing in the fourth quarter of 2017.
The Company also participated in a continuous 10-well drilling program utilizing one rig on our Eagle Ford Shale leasehold. All 10 wells in this program have been drilled and the first two wells were completed and started producing in April 2017. The next four wells were completed and started producing in the fourth quarter of 2017. The remaining four wells were completed and began producing$3.3 million in the first quarter of 2018.2020. The Company utilized a like-kind exchange under Internal Revenue Code Section 1031 to defer income tax on all of the gain by offsetting it with the STACK/SCOOP mineral acreage acquisition that was purchased during the quarter using qualified exchange accommodation agreements.
ActivityOn December 18, 2019, the Company closed on the purchase of 700 net mineral acres in Kingfisher, Canadian and Garvin Counties, Oklahoma, for a purchase price of $9.3 million (after customary closing adjustments). This purchase was mostly funded with cash from these three plays significantly increased our capital expenditureslike-kind exchange sales.
On July 28 2020, the Company closed on the sale of 5,925 non-producing mineral acres in fiscal 2017 compared to fiscal 2016. At this time, we do not have any similar material commitmentsnorthwestern Oklahoma for capital expenditures in 2018.$0.8 million and a gain of $0.7 million, with the proceeds applied toward debt reduction.
Oil, NGL and natural gas production volumes decreased 3%On September 1, 2020, the Company closed on an Mcfe basis during 2017, as comparedunderwritten public offering of 5,750,000 common shares (inclusive of overallotment option) with net proceeds of $8.2 million to 2016. Higher drilling activity during 2017 resultedPHX.
On October 8, 2020, the Company closed on the purchase of 297 net royalty acres in new production comingGrady County, Oklahoma, and 257 net mineral acres and 12 net royalty acres in Harrison, Panola and Nacogdoches Counties, Texas, for a purchase price of $5.5 million and 153,375 shares of PHX common stock, subject to customary closing adjustments. This purchase was mostly funded with cash from the common stock offering discussed above.
On November 12, 2020, the Company closed on line that mostly offset the natural declinepurchase of existing wells.134 net mineral acres in San Augustine County, Texas for a purchase price of $750,000.
Oil production decreased 15%, primarilyOn December 4, 2020, the resultCompany signed a purchase and sale agreement to purchase an additional 87 net mineral acres in San Augustine County, Texas for a purchase price of the production decline$1 million, subject to customary closing adjustments. The Company expects this acquisition to close in the Eagle Ford Shale. To a lesser extent, declining production from various fields in western Oklahoma, the Texas Panhandle and Bakken Shale also contributed to the decrease. These decreases were partially offset by new production added in the Eagle Ford Shale on six wells in the second halffirst fiscal quarter of 2017.2021
NGL production increased 2%, largely the result of new production coming online in the Anadarko Woodford and Eagle Ford Shale. This more than offset the natural decline in the Anadarko Woodford Shale in western and central Oklahoma and the Anadarko Basin Granite Wash in western Oklahoma and the Texas Panhandle.
Natural gas production decreased 1%, principally due to declining production in the Fayetteville Shale. To a much lesser extent, declining production from the Anadarko Woodford Shale in western and central Oklahoma, the Anadarko Basin Granite Wash and the southeastern Oklahoma Woodford Shale also contributed to the decrease. The decline was mostly offset as a result of new well drilling in southeastern Oklahoma Woodford Shale and Anadarko Woodford Shale.
Since the Company is not the operator of any of its oil and natural gas properties, it is extremely difficult for us to predict levels of future participation in the drilling and completion of new wells and their associated capital expenditures. This makes 2018 capital expenditures for drilling and completion projects difficult to forecast.
(43)
Net cash provided by all of our operating activities allowed the Company to fund most of the capital expenditures, overhead costs, treasury stock purchases and dividend payments, while only increasing the Company’s outstanding borrowings on the credit facility by $7.7 million during 2017. The Company received lease bonus payments during 2017fiscal 2020 totaling approximately $5.1$0.7 million. Looking forward, the cash flow from bonus payments associated with the leasing of drilling rights on the Company’s mineral acreage is very difficult to project as the Company’s mineral acreage position is so diverse and spread across several states.current economic downturn has decreased demand for new leasing by operators. However, management willplans to continue to strategically evaluate the merit ofactively pursue leasing certain of the Company’s mineral acres.opportunities.
With continued oilnatural gas and natural gasoil price volatility, management continues to evaluate opportunities for product price protection through additional hedging of the Company’s future oilnatural gas and natural gasoil production. See Note 112 to the financial statements included in Item 8 – “Financial Statements and Supplementary Data” for a complete list of the Company’s outstanding derivative contracts.
The use of the Company’s cash provided by operating activities and resultant change to cash is summarized in the table below:
|
| Twelve months ended |
| |
|
| 9/30/2017 |
| |
Cash provided by operating activities |
| $ | 20,758,192 |
|
Cash used for (provided by): |
|
|
|
|
Capital expenditures - drilling and completion of wells |
|
| 25,807,897 |
|
Quarterly dividends of $0.04 per share |
|
| 2,684,001 |
|
Treasury stock purchases |
|
| 601,853 |
|
Net payments (borrowings) on credit facility |
|
| (7,722,000 | ) |
Proceeds from sales of assets |
|
| (723,700 | ) |
Other investing activities |
|
| 23,563 |
|
Net cash used |
|
| 20,671,614 |
|
Net increase (decrease) in cash |
| $ | 86,578 |
|
Twelve months ended | ||||
9/30/2020 | ||||
Cash provided by operating activities | $ | 11,106,295 | ||
Cash used for (provided by): | ||||
Capital expenditures - acquisitions | 10,288,250 | |||
Capital expenditures - drilling and completion of wells | 403,136 | |||
Quarterly dividends totaling $0.10 per share | 1,652,164 | |||
Treasury stock purchases | 7,635 | |||
Net payments (borrowings) on credit facility | 6,675,000 | |||
Proceeds from sales of assets | (4,228,868 | ) | ||
Net proceeds from equity issuance | (8,220,726 | ) | ||
Net cash used | 6,576,591 | |||
Net increase (decrease) in cash | $ | 4,529,704 | ||
Outstanding borrowings on theour credit facility at September 30, 2017,2020, were $52,222,000.$28,750,000, of which $1,750,000 is classified as current debt. As of December 1, 2020, outstanding borrowings were $27,250,000.
Looking forward, the Company intendsexpects to fund overhead costs capital additions related to the drilling and completion of wells, treasury stock purchases, if any, and dividend payments primarily from cash provided by operating activities, cash on hand and borrowings utilizing our bank credit facility. AnyCredit Facility. The Company intends to use any excess cash is intended to be used to reduce existing bank debt.strengthen the Company’s Balance Sheets. The Company had availability of $27,778,000$2,250,000 at September 30, 2020, under its revolving credit facilityCredit Facility and was in compliance with its debt covenants at September 30, 2017. In October,(current ratio, debt to trailing 12-month EBITDA, as defined by the Company renegotiatedCredit Facility, and extended its credit facility.restricted payments limited by leverage ratio). The new maturity date is November 20, 2022. debt covenants limit the maximum ratio of the Company’s debt to EBITDA to no more than 4:1.
The borrowing base under the credit facilityCredit Facility was also redetermined on June 24, 2020, and reduced from $45 million to $32 million. This amendment included a Quarterly Commitment Reduction, whereby the borrowing base is reduced by $1 million each April 15, July 15, October 15 and January 15, commencing on July 15, 2020. The decrease in October 2017the borrowing base was primarily due to the continued decline in natural gas and left unchanged at $80 million, which is a level that is expectedoil futures prices. Despite the reduction in the borrowing base, we do not expect it will impact the liquidity needed to provide ample liquidity for the Company to continue to employ itsmaintain our normal operating strategies.
(44)
On November 6, 2017, the Company filed a shelf registration statement on Form S-3 with the SEC to give us the ability to sell up to $75 million in securities, including common stock, preferred stock, debt securities, warrants and units in amounts to be determined at the time of an offering. Any such offering, if it does occur, may happen in one or more transactions. The specific terms of any securities to be sold will be described in supplemental filings with the SEC. The registration statement will expire on November 6, 2020. The Company has no current plans to issue securitiesborrowing base under the shelf registration statement.Credit Facility after Quarterly Commitment Reductions was reaffirmed on December 4, 2020 at $30 million. This amendment reduced the Quarterly Commitment Reductions from $1,000,000 to $600,000, reduced the consolidated cash balance in the anti-cash hoarding provision from $2,000,000 to $1,000,000, and changed the debt to EBITDA ratio from 4.0:1.00 to 3.50:1.00.
Based on the Company’s expected capital expenditure levels, anticipated cash provided by operating activities for 2018,2021, combined with availability under its credit facility and shelf registration, the Company has sufficient liquidity to fund its ongoing operations.
CONTRACTUAL OBLIGATIONS AND COMMITMENTS
The Company has a credit facility with a group of banks headed by Bank of Oklahoma (BOK) consisting of a revolving loan of $200,000,000, which is subject to a semi-annual borrowing base determination. The current borrowing base is $80,000,000at September 30, 2020, was $31,000,000 and is secured by certainall of the Company’s properties with a carrying value of $152,025,984 at September 30, 2017.producing gas and oil properties. The revolving loan matures on November 30, 2022. Borrowings under the revolving loan are due at maturity. The revolving loan bears interest at the BOK prime rate plus a range of 0.375%1.00% to 1.250%1.75%, or 30 day30-day LIBOR plus a range of 1.875%2.50% to 2.750% annually. At September 30, 2017, the effective rate was 3.72%3.25%. The election of BOK prime or LIBOR is at the Company’s discretion. The interest rate spread from LIBOR or the prime rate increases as the ratio of the loan balance to the borrowing base increases. At September 30, 2020, the effective rate was 4.25%.
Determinations of the borrowing base are made semi-annually (usually June and December) or whenever the banks, in their sole discretion, believe that there has been a material change in the value of the Company’s oil and natural gas and oil properties. In October 2017, duringOn June 24, 2020, the renegotiation of our credit facility,Company entered into the Seventh Amendment to its Credit Facility. The amendment reduced the borrowing base was redeterminedfrom $45,000,000 to $32,000,000 and included a Quarterly Commitment Reduction, whereby the borrowing base is reduced by the banks$1,000,000 each April 15, July 15, October 15 and left unchanged at $80,000,000.January 15, commencing on July 15, 2020. The loan agreementCredit Facility contains customary covenants which, among other things, require periodic financial and reserve reporting and place certain limits on the Company’s incurrence of
indebtedness, liens, payment of dividends and acquisitions of treasury stock. In addition, the Company is required to maintain certain financial ratios, a current ratio (as defined byin the bank agreement – current assets includes availability under outstanding credit facility)Credit Facility) of no less than 1.0 to 1.0 and a funded debt to EBITDA (trailing 12 months as(as defined by bank agreement – traditional EBITDA within the unrealized gain or loss on derivative contracts also removed from earnings)Credit Facility) of no more than 4.0 to 1.0.1.0 based on the trailing twelve months. At September 30, 2017,2020, the Company was in compliance with the covenants of the loan agreementCredit Facility, had $28,750,000 outstanding, of which $1,750,000 is classified as short-term debt due to the Quarterly Commitment Reduction and had $27,778,000$2,250,000 of borrowing base availability under its outstanding credit facility.the Credit Facility.
(45)
The Eighth Amendment to the Credit Facility was signed on December 4, 2020. This amendment reduced the Quarterly Commitment Reductions from $1,000,000 to $600,000, reduced the consolidated cash balance in the anti-cash hoarding provision from $2,000,000 to $1,000,000, and changed the debt to EBITDA ratio from 4.0:1.00 to 3.50:1.00. The borrowing base after Quarterly Commitment Reductions was reaffirmed at $30,000,000.
The table below summarizes the Company’s contractual obligations and commitments as of September 30, 2017:2020:
|
| Payments due by period |
|
| Payments due by period |
| ||||||||||||||||||||||||||||||||||
Contractual Obligations |
|
|
|
|
| Less than |
|
|
|
|
|
|
|
|
|
| More than |
|
|
|
|
|
| Less than |
|
|
|
|
|
|
|
|
|
| More than |
| ||||
and Commitments |
| Total |
|
| 1 Year |
|
| 1-3 Years |
|
| 3-5 Years |
|
| 5 Years |
|
| Total |
|
| 1 Year |
|
| 1-3 Years |
|
| 3-5 Years |
|
| 5 Years |
| ||||||||||
Long-term debt obligations |
| $ | 52,222,000 |
|
| $ | - |
|
| $ | - |
|
| $ | - |
|
| $ | 52,222,000 |
| ||||||||||||||||||||
Debt obligations |
| $ | 28,750,000 |
|
| $ | 1,750,000 |
|
| $ | 27,000,000 |
|
| $ | - |
|
| $ | - |
| ||||||||||||||||||||
Building lease |
| $ | 539,597 |
|
| $ | 206,665 |
|
| $ | 332,932 |
|
| $ |
|
|
| $ | - |
|
| $ | 1,205,968 |
|
| $ | 166,744 |
|
| $ | 334,219 |
|
| $ | 351,771 |
|
| $ | 353,234 |
|
The Company’s building lease is accounted for as an operating lease, and therefore the leaseda related operating lease right-of-use asset and associated liabilities of future rent payments are not includedoperating lease liability has been recognized on the Company’s balance sheets.Balance Sheets.
At September 30, 2017,2020, the Company’s derivative contracts were in a net assetliability position of $516,159.$707,647. The ultimate settlement amounts of the derivative contracts are unknown because they are subject to continuing market risk. Please read Item 7A – “Quantitative and Qualitative Disclosures about Market Risk” and Note 112 to the financial statements included in Item 8 – “Financial Statements and Supplementary Data” for additional information regarding the Company’s derivative contracts.
As of September 30, 2017,2020, the Company’s estimate for asset retirement obligations was $3,196,889.$2,897,522. Asset retirement obligations represent the Company’s share of the future expenditures to plug and abandon the wells in which the Company owns a working interest at the end of their economic lives. These amounts were not included in the schedule above due to the uncertainty of timing of the obligations. Please read Note 111 to the financial statements included in Item 8 – “Financial Statements and Supplementary Data” for additional information regarding the Company’s asset retirement obligations.
Off-Balance Sheet Arrangements
The Company had no off-balance sheet arrangements during 2020. Other than the lease of office space (before the adoption of ASC 842), the Company had no off-balance sheet arrangements during 2019.
We currently do not have any other off-balance sheet arrangement that have or are reasonably likely to have a current or future effect on our financial condition, changes in financial condition, revenues or expenses, results of operations, liquidity, capital expenditures or capital resources that is material to investors.
CRITICAL ACCOUNTING POLICIES
Preparation of financial statements in conformity with accounting principles generally accepted in the United StatesGAAP requires management to make estimates, judgments and assumptions that affect the reported amounts of assets, liabilities, revenues and expenses, and the disclosure of contingent assets and liabilities. However, the accounting principles used by the Company generally do not change the Company’s reported cash flows or liquidity. Existing rules must be interpreted, and judgments made on how the specifics of a given rule apply to the Company.
The more significant reporting areas impacted by management’s judgments and estimates are:include: natural gas, crude oil NGL and natural gasNGL reserve estimation; derivative contracts; impairment of assets; oil, NGL and natural gas, oil and NGL sales revenue accruals; refundable production taxes and provision for income taxes. Management’s judgments and estimates in these areas are based on information available from both internal and external sources, including engineers, geologists, consultants and historical experience in similar matters. Actual results could differ from the estimates as additional information becomes known. The oil, NGL and natural gas, oil and NGL sales revenue accrual is particularly subject to estimate inaccuracies due to the Company’s status as a non-operator on all of its properties. As such, production and price information obtained from well
(46)
operators is substantially delayed. This causes the estimation of recent production and prices used in the oil, NGL and natural gas, oil and NGL revenue accrual to be subject to future change.
Oil, NGL and Natural Gas, Oil and NGL Reserves
Management considers the estimation of the Company’s natural gas, crude oil NGL and natural gasNGL reserves to be the most significant of its judgments and estimates. These estimates affect the unaudited standardized measure disclosures included in Note 1116 to the financial statements in Item 8 – “Financial Statements and Supplementary Data,” as well as DD&A and impairment calculations. Changes in natural gas, crude oil NGL and natural gasNGL reserve estimates affect the Company’s calculation of DD&A, asset retirement obligations and assessment of the need for asset impairments. On an annual basis, with a semi-annual update, theThe Company’s Independent Consulting Petroleum Engineer, with assistance from Company staff, prepares the Company’s estimates of natural gas, crude oil and NGL and natural gas reserves on an annual basis, with a semi-annual update. These estimates are based on available geologic and seismic data, reservoir pressure data, core analysis reports, well logs, analogous reservoir performance history, production data and other available sources of engineering, geological and geophysical information. Between periods in which reserves would normally be calculated, the Company updates the reserve calculations utilizing prices which are updated through the current period. In accordance with the SEC rules, the Company’s reserve estimates were based on average individual product prices during the 12-month period prior to September 30 determined as an unweighted arithmetic average of the first-day-of-the-month price for each month within such period, unless prices were defined by contractual arrangements, excluding escalations based upon future conditions. Based on the Company’s 20172020 DD&A, a 10% change in the DD&A rate per Mcfe would result in a corresponding $1,839,755$1,131,378 annual change in DD&A expense. CrudeNatural gas, crude oil NGL and natural gasNGL prices are volatile and largely affected by worldwide production and consumption and are outside the control of management. However, projectedProjected future natural gas, crude oil NGL and natural gasNGL pricing assumptions are used by management to prepare estimates of natural gas, crude oil NGL and natural gasNGL reserves and future net cash flows used in asset impairment assessments and in formulating management’s overall operating decisions.
Successful Efforts Method of Accounting
The Company has elected to utilize the successful efforts method of accounting for its oilnatural gas and natural gasoil exploration and development activities. This means exploration expenses, including geological and geophysical costs, non-producing lease impairment, rentals and exploratory dry holes, are charged against income as incurred. Costs of successful wells and related production equipment and developmental dry holes are capitalized and amortized by property using the unit-of-production method (the ratio of oil, NGL and natural gas, oil and NGL volumes produced to total proved or proved developed reserves is used to amortize the remaining asset basis on each producing property) as oil, NGL and natural gas, oil and NGL is produced. The Company’s exploratory wells are all on-shoreonshore in the continental United States and primarily located in the Mid-Continent area. Generally, expenditures on exploratory wells comprise less than 10%5% of the Company’s total expenditures for oilnatural gas and natural gasoil properties. This accounting method may yield significantly different operating results than the full cost method.
(47)
The Company has entered into oil and natural gas costless collar contracts and oil and natural gas fixed swap contracts. These instruments are intended to reduce the Company’s exposure to short-term fluctuations in the price of oilnatural gas and natural gas.oil. Collar contracts set a fixed floor price and a fixed ceiling price and provide payments to the Company if the index price falls below the floor or require payments by the Company if the index price rises above the ceiling. Fixed swap contracts set a fixed price and provide for payments to the Company if the index price is below the fixed price or require payments by the Company if the index price is above the fixed price. These contracts cover only a portion of the Company’s oil and natural gas and oil production, and provide only partial price protection against declines in oil and natural gas prices. These derivative instruments expose the Company to risk of financial lossand oil prices and may limit the benefit of future increases in prices. All of theThe Company’s derivative contracts are with Bank of Oklahoma. The derivative contracts with Bank of Oklahoma and are secured under itsthe credit facility with Bank of Oklahoma.
The Company is required to recognize all derivative instruments as either assets or liabilities in the balance sheet at fair value. The accounting for changes in the fair value of a derivative depends on the intended use of the derivative and resulting designation. At September 30, 2017,2020, the Company had no derivative contracts designated as cash flow hedges, and therefore, changes in the fair value of derivatives are reflected in earnings.
Impairment of Assets
All long-lived assets, principally oilnatural gas and natural gasoil properties, are monitored for potential impairment when circumstances indicate that the carrying value of the asset may be greater than its estimated future net cash flows. The evaluations involve significant judgment, since the results are based on estimated future events, such as: inflation rates; future sales prices for natural gas, oil NGL and natural gas;NGL; future production costs; estimates of future oil, NGL and natural gas, oil and NGL reserves to be recovered and the timing thereof; economic and regulatory climates and other factors. The Company estimates future net cash flows on its oilnatural gas and natural gasoil properties utilizing differentially adjusted forward pricing curves for oil, NGL and natural gas, oil and NGL and a discount rate in line with the discount rate we believe is most commonly used by market participants (10% for all periods presented). The need to test a property for impairment may result from significant declines in sales prices or unfavorable adjustments to oil, NGL and natural gas, oil and NGL reserves. A further reduction in natural
gas, oil NGL and natural gasNGL prices (which are reviewed quarterly) or a decline in reserve volumes (which are re-evaluated semi-annually) would likely lead to additional impairment that may be material to the Company. The decision to not participate in future development on our leasehold acreage can trigger a test for impairment. Any assets held for sale are reviewed for impairment when the Company approves the plan to sell (as was the case at September 30, 2017).sell. Estimates of anticipated sales prices are highly judgmental and subject to material revision in future periods. Because of the uncertainty inherent in these factors, the Company cannot predict when or if future impairment charges will be recorded.
Oil, NGL and Natural Gas, Oil and NGL Sales Revenue Accrual
The Company does not operate its oilnatural gas and natural gasoil properties and, therefore, receives actual oil, NGL and natural gas, oil and NGL sales volumes and prices (in the normal course of business) more than a month later than the information is available to the operators of the wells. This being the
(48)
case, on wells with greater significance to the Company, the most current available production data is gathered from the appropriate operators, as well as public and oil, NGLprivate sources, and natural gas, oil and NGL index prices local to each well are used to estimate the accrual of revenue on these wells. Obtaining timely production data on all other wells from the operators is not feasible; therefore, the Company utilizes past production receipts and estimated sales price information to estimate its accrual of revenue on all other wells each quarter. The oil, NGL and natural gas, oil and NGL sales revenue accrual can be impacted by many variables including rapid production decline rates, production curtailments by operators, the shut-in of wells with mechanical problems and rapidly changing market prices for natural gas, oil NGL and natural gas.NGL. These variables could lead to an over or under accrual of oil, NGL and natural gas, oil and NGL sales at the end of any particular quarter. Based on past history, the Company’s estimated accruals have been materially accurate.
Income Taxes
The estimation of the amounts of income tax to be recorded by the Company involves interpretation of complex tax laws and regulations, as well as the completion of complex calculations, including the determination of the Company’s percentage depletion deduction, if any. To calculate the exact excess percentage depletion allowance, a well-by-well calculation is, and can only be, performed at the end of each fiscal year. During interim periods, an estimate is made takingwhich takes into account historical data and current pricing. The Company has certain state and federal net operating loss carry forwards (NOLs) that are recognized as tax assets when assessed as more likely than not to be utilized before their expiration dates. Criteria such as expiration dates, future excess state depletion and reversing taxable temporary differences are evaluated to determine whether the NOLs are more likely than not to be utilized before they expire. If any NOLs are no longer determined to no longer be more likely than not to be utilized, then a valuation allowance is recognized to reduce the tax benefit of such NOLs. As of September 30, 2017,2020, the Company had a $96,000 valuation allowance related to Arkansas NOLs. The Company had no other valuation allowances on NOLs.at September 30, 2020. Although the Company’s management believes its tax accruals are adequate, differences may occur in the future depending on the resolution of pending and new tax matters.
The above description of the Company’s critical accounting policies is not intended to be an all-inclusive discussion of the uncertainties considered and estimates made by management in applying generally accepted accounting principles and policies.GAAP. Results may vary significantly if different policies were used or required and if new or different information becomes known to management.
ITEM |
|
Market Risk
Oil,Natural gas, oil and NGL and natural gas prices historically have been volatile, and this volatility is expected to continue. Uncertainty continues to exist as to the direction of oil, NGL and natural gas, oil and NGL price trends, and there remains a wide divergence in the opinions held in the industry. The Company can be significantly impacted by changes in oilnatural gas and natural gasoil prices. The market price of oil, NGL and natural gas, oil and NGL in 20182021 will impact the amount of cash generated from operating activities, which will in turn impact the level of the Company’s capital expenditures
(49)
for acquisitions and production. Excluding the impact of the Company’s 20182021 derivative contracts (see below), the price sensitivity for each $0.10 per Mcf change in wellhead natural gas price is approximately $819,453$596,271 for operating revenue based on the Company’s prior year natural gas volumes. The price sensitivity in 20182021 for each $1.00 per barrel change in wellhead oil is approximately $310,677$269,785 for operating revenue based on the Company’s prior year oil volumes.
Commodity Price Risk
The Company periodically utilizes derivative contracts to reduce its exposure to unfavorable changes in natural gas and oil prices. The Company does not enter into these derivatives for speculative or trading purposes. All of our outstanding derivative contracts at September 30, 2020, are with Bank of Oklahoma. The derivative contracts with Bank of Oklahoma and are secured.secured under the credit facility with Bank of Oklahoma. These arrangements cover only a portion of the Company’s production, and provide only partial
price protection against declines in natural gas and oil prices. These derivative contracts expose the Company to risk of financial lossprices and limit the benefit of future increases in prices. For the Company’s natural gas fixed price swaps, a change of $0.10 in the NYMEX Henry Hub forward strip pricing would result in a change to pre-tax operating income of approximately $293,000. For the Company’s natural gas collars, a change of $0.10 in the NYMEX Henry Hub forward strip pricing would result in a change to pre-tax operating income of approximately $327,000.$146,000. For the Company’s oil fixed price swaps, a change of $1.00 in the NYMEX WTI forward strip prices would result in a change to pre-tax operating income of approximately $108,000.$136,000. For the Company’s gas collars, a change of $0.10 (below or above the collar) in the NYMEX Henry Hub forward strip pricing would result in a change to pre-tax operating income of approximately $1,635,765. For the Company’s oil collars, a change of $1.00 (below or above the collar) in the NYMEX WTI forward strip prices would result in a change to pre-tax operating income of approximately $141,000.$71,133. See Note 112 to the financial statements included in Item 8 – “Financial Statements and Supplementary Data” for additional information regarding theour derivative contracts.
Financial MarketInterest Rate Risk
Operating income could also be impacted, to a lesser extent, by changes in the market interest rates related to the Company’s credit facility. The revolving loan bears interest at the BOK prime rate plus from 0.375%1.00% to 1.250%1.75%, or 30 day30-day LIBOR plus from 1.875%2.50% to 2.750%3.25%. At September 30, 2017,2020, the Company had $52,222,000$28,750,000 outstanding under this facility and the effective interest rate was 3.72%4.25%. The impact of a 1% increase in the interest rate on this amount of debt would have resulted in an increase in interest expense, and a corresponding decrease in our results of operations, of $287,500 for the year ended September 30, 2020, assuming that our indebtedness remained constant throughout the period. At this point, the Company does not believe that its liquidity has been materially affected by the debt market uncertainties noted in the last few years, and the Company does not believe that its liquidity will be significantly impacted in the near future.
(50)
(51)
Management’s Annual Report on InternalInternal Control Over Financial Reporting
Management of the Company management is responsible for establishing and maintaining adequate internal control over financial reporting. Internal control over financial reporting is defined in Rules 13a-15(f) and 15d-15(f) under the Securities Exchange Act of 1934 (the “Exchange Act”) as a process designed by, or under the supervision of, the Company’s principal executive and principal financial officers and effected by the Company’s board of directors, management and other personnel, to provide reasonable assurance regarding the reliability of financial reporting and the preparation of financial statements for external purposes in accordance with generally accepted accounting principles, and includes those policies and procedures that:
pertain to the maintenance of records that in reasonable detail accurately and fairly reflect the transactions and dispositions of the assets of the Company;
• | pertain to the maintenance of records that in reasonable detail accurately and fairly reflect the transactions and dispositions of the assets of the Company; |
provide reasonable assurance that transactions are recorded as necessary to permit preparation of financial statements in accordance with generally accepted accounting principles in the United States, and that receipts and expenditures of the Company are being made only in accordance with authorizations of management and directors of the Company; and
• | provide reasonable assurance that transactions are recorded as necessary to permit preparation of financial statements in accordance with generally accepted accounting principles in the United States, and that receipts and expenditures of the Company are being made only in accordance with authorizations of management and directors of the Company; and |
provide reasonable assurance regarding prevention or timely detection of unauthorized acquisition, use or disposition of the Company’s assets that could have a material effect on the financial statements.
• | provide reasonable assurance regarding prevention or timely detection of unauthorized acquisition, use or disposition of the Company’s assets that could have a material effect on the financial statements. |
Because of its inherent limitations, internal control over financial reporting may not prevent or detect misstatements. Also, projections of any evaluation of effectiveness to future periods are subject to the risk that controls may become inadequate because of changes in conditions, or that the degree of compliance with the policies or procedures may deteriorate. Internal control over financial reporting cannot provide absolute assurance of achieving financial reporting objectives because of its inherent limitations. Internal control over financial reporting is a process that involves human diligence and compliance and is subject to lapses in judgment and breakdowns resulting from human failures. Internal control over financial reporting also can be circumvented by collusion or improper management override. Because of such limitations, there is a risk that material misstatements may not be prevented or detected on a timely basis by internal control over financial reporting. However, these inherent limitations are known features of the financial reporting process. Therefore, it is possible to design into the process safeguards to reduce, though not eliminate, this risk.
The Company’s management assessed the effectiveness of the Company’s internal control over financial reporting as of September 30, 2017.2020. In making this assessment, the Company’s management used the criteria set forth in Internal Control – Integrated Framework (as updated in 2013) issued by the Committee of Sponsoring Organizations of the Treadway Commission (COSO). Based on our assessment, management has concluded that, as of September 30, 2017,2020, the Company’s internal control over financial reporting was effective based on those criteria.
Our independent registered public accounting firm has issued an attestation report on our internal control over financial reporting. This report appears on the following page.
(52)
Report of IndependentIndependent Registered Public Accounting Firm
on Internal Control Over Financial Reporting
The Board of Directors and Stockholders of
Panhandle Oil and GasPHX Minerals Inc.
Opinion on Internal Control over Financial Reporting
We have audited Panhandle Oil and Gas Inc.’sPHX Minerals Inc’s internal control over financial reporting as of September 30, 2017,2020, based on criteria established in Internal Control—Integrated Framework issued by the Committee of Sponsoring Organizations of the Treadway Commission (2013 framework)Framework) (the COSO criteria). Panhandle OilIn our opinion, PHX Minerals Inc. (the Company) maintained, in all material respects, effective internal control over financial reporting as of September 30, 2020, based on the COSO criteria.
We also have audited, in accordance with the standards of the Public Company Accounting Oversight Board (United States) (PCAOB), the accompanying balance sheets of the Company as of September 30, 2020 and Gas Inc.’s2019, and the related statements of operations, stockholders' equity and cash flows for each of the three years in the period ended September 30, 2020, and the related notes and our report dated December 10, 2020, expressed an unqualified opinion thereon.
Basis for Opinion
The Company’s management is responsible for maintaining effective internal control over financial reporting and for its assessment of the effectiveness of internal control over financial reporting included in the accompanying Management’s Annual Report on Internal Control Over Financial Reporting. Our responsibility is to express an opinion on the Company’s internal control over financial reporting based on our audit. We are a public accounting firm registered with the PCAOB and are required to be independent with respect to the Company in accordance with the U.S. federal securities laws and the applicable rules and regulations of the Securities and Exchange Commission and the PCAOB.
We conducted our audit in accordance with the standards of the Public Company Accounting Oversight Board (United States).PCAOB. Those standards require that we plan and perform the audit to obtain reasonable assurance about whether effective internal control over financial reporting was maintained in all material respects.
Our audit included obtaining an understanding of internal control over financial reporting, assessing the risk that a material weakness exists, testing and evaluating the design and operating effectiveness of internal control based on the assessed risk, and performing such other procedures as we considered necessary in the circumstances. We believe that our audit provides a reasonable basis for our opinion.
Definition and Limitations of Internal Control Over Financial Reporting
A company’s internal control over financial reporting is a process designed to provide reasonable assurance regarding the reliability of financial reporting and the preparation of financial statements for external purposes in accordance with generally accepted accounting principles. A company’s internal control over financial reporting includes those policies and procedures that (1) pertain to the maintenance of records that, in reasonable detail, accurately and fairly reflect the transactions and dispositions of the assets of the company; (2) provide reasonable assurance that transactions are recorded as necessary to permit preparation of financial statements in accordance with generally accepted accounting principles, and that receipts and expenditures of the company are being made only in accordance with authorizations of management and directors of the company; and (3) provide reasonable assurance regarding prevention or timely detection of unauthorized acquisition, use, or disposition of the company’s assets that could have a material effect on the financial statements.
Because of its inherent limitations, internal control over financial reporting may not prevent or detect misstatements. Also, projections of any evaluation of effectiveness to future periods are subject to the risk that controls may become inadequate because of changes in conditions, or that the degree of compliance with the policies or procedures may deteriorate.
In our opinion, Panhandle Oil and Gas Inc. maintained, in all material respects, effective internal control over financial reporting as of September 30, 2017, based on the COSO criteria.
We also have audited, in accordance with the standards of the Public Company Accounting Oversight Board (United States), the balance sheets of Panhandle Oil and Gas Inc. as of September 30, 2017 and 2016, and the related statements of operations, stockholders’ equity, and cash flows for each of the three years in the period ended September 30, 2017 and our report dated December 12, 2017 expressed an unqualified opinion thereon.
/s/ Ernst & Young LLP |
| ||||
|
|
|
| ||
Oklahoma City, Oklahoma |
|
|
| ||
December |
|
|
|
(53)
Report of IndependentIndependent Registered Public Accounting Firm
The Board of Directors and Stockholders of
Panhandle Oil and GasPHX Minerals Inc.
Opinion on the Financial Statements
We have audited the accompanying balance sheets of Panhandle Oil and GasPHX Minerals Inc. (the Company) as of September 30, 20172020 and 2016, and2019, the related statements of operations, stockholders' equity and cash flows for each of the three years in the period ended September 30, 2017. These financial statements are2020, and the responsibility ofrelated notes (collectively referred to as the Company’s management. Our responsibility is to express an opinion on these financial statements based on our audits.
We conducted our audits in accordance with the standards of the Public Company Accounting Oversight Board (United States)“financial statements”). Those standards require that we plan and perform the audit to obtain reasonable assurance about whether the financial statements are free of material misstatement. An audit includes examining, on a test basis, evidence supporting the amounts and disclosures in the financial statements. An audit also includes assessing the accounting principles used and significant estimates made by management, as well as evaluating the overall financial statement presentation. We believe that our audits provide a reasonable basis for our opinion.
In our opinion, the financial statements referred to above present fairly, in all material respects, the financial position of Panhandle Oil and Gas Inc.the Company at September 30, 20172020 and 2016,2019, and the results of its operations and its cash flows for each of the three years in the period ended September 30, 2017,2020, in conformity with U.S. generally accepted accounting principles.
We also have audited, in accordance with the standards of the Public Company Accounting Oversight Board (United States) (PCAOB), Panhandle Oil and Gas Inc.’sthe Company’s internal control over financial reporting as of September 30, 2017,2020, based on criteria established in Internal Control—IntegratedControl-Integrated Framework issued by the Committee of Sponsoring Organizations of the Treadway Commission (2013 framework), and our report dated December 12, 2017,10, 2020 expressed an unqualified opinion thereon.
Basis for Opinion
These financial statements are the responsibility of the Company's management. Our responsibility is to express an opinion on these financial statements based on our audits. We are a public accounting firm registered with the PCAOB and are required to be independent with respect to the Company in accordance with the U.S. federal securities laws and the applicable rules and regulations of the Securities and Exchange Commission and the PCAOB.
We conducted our audits in accordance with the standards of the PCAOB. Those standards require that we plan and perform the audit to obtain reasonable assurance about whether the financial statements are free of material misstatement, whether due to error or fraud. Our audits included performing procedures to assess the risks of material misstatement of the financial statements, whether due to error or fraud, and performing procedures that respond to those risks. Such procedures included examining, on a test basis, evidence regarding the amounts and disclosures in the financial statements. Our audits also included evaluating the accounting principles used and significant estimates made by management, as well as evaluating the overall presentation of the financial statements. We believe that our audits provide a reasonable basis for our opinion.
|
| ||
/s/ Ernst & Young LLP |
| ||
We have served as the Company’s auditor since 1989. |
|
|
|
Oklahoma City, Oklahoma |
|
|
|
December |
|
|
|
PHX Minerals Inc.
(54)
|
| September 30, |
|
| September 30, |
| ||||||||||
|
| 2017 |
|
| 2016 |
|
| 2020 |
|
| 2019 |
| ||||
Assets |
|
|
|
|
|
|
|
|
|
|
|
|
|
|
|
|
Current Assets: |
|
|
|
|
|
|
|
|
|
|
|
|
|
|
|
|
Cash and cash equivalents |
| $ | 557,791 |
|
| $ | 471,213 |
|
| $ | 10,690,395 |
|
| $ | 6,160,691 |
|
Oil, NGL and natural gas sales receivables (net of allowance for uncollectable accounts) |
|
| 7,585,485 |
|
|
| 5,287,229 |
| ||||||||
Natural gas, oil and NGL sales receivables (net of allowance for uncollectable accounts) |
|
| 2,943,220 |
|
|
| 4,377,646 |
| ||||||||
Refundable income taxes |
|
| 489,945 |
|
|
| 83,874 |
|
|
| 3,805,227 |
|
|
| 1,505,442 |
|
Derivative contracts, net |
|
| 544,924 |
|
|
| - |
|
|
| - |
|
|
| 2,256,639 |
|
Assets held for sale |
|
| 557,750 |
|
|
| - |
| ||||||||
Other |
|
| 253,480 |
|
|
| 419,037 |
|
|
| 351,088 |
|
|
| 177,037 |
|
Total current assets |
|
| 9,989,375 |
|
|
| 6,261,353 |
|
|
| 17,789,930 |
|
|
| 14,477,455 |
|
|
|
|
|
|
|
|
|
|
|
|
|
|
|
|
|
|
Properties and equipment at cost, based on successful efforts accounting: |
|
|
|
|
|
|
|
|
|
|
|
|
|
|
|
|
Producing oil and natural gas properties |
|
| 434,571,516 |
|
|
| 434,469,093 |
| ||||||||
Non-producing oil and natural gas properties |
|
| 7,428,927 |
|
|
| 7,574,649 |
| ||||||||
Producing natural gas and oil properties |
|
| 324,886,491 |
|
|
| 354,718,398 |
| ||||||||
Non-producing natural gas and oil properties |
|
| 18,993,814 |
|
|
| 14,599,023 |
| ||||||||
Other |
|
| 1,067,894 |
|
|
| 1,069,658 |
|
|
| 582,444 |
|
|
| 717,121 |
|
|
|
| 443,068,337 |
|
|
| 443,113,400 |
|
|
| 344,462,749 |
|
|
| 370,034,542 |
|
Less accumulated depreciation, depletion and amortization |
|
| (246,483,979 | ) |
|
| (251,707,749 | ) |
|
| (263,590,801 | ) |
|
| (258,607,521 | ) |
Net properties and equipment |
|
| 196,584,358 |
|
|
| 191,405,651 |
|
|
| 80,871,948 |
|
|
| 111,427,021 |
|
|
|
|
|
|
|
|
|
|
|
|
|
|
|
|
|
|
Investments |
|
| 170,486 |
|
|
| 157,322 |
|
|
| 79,308 |
|
|
| 205,076 |
|
Derivative contracts, net |
|
| - |
|
|
| 237,505 |
| ||||||||
Operating lease right-of-use assets |
|
| 690,316 |
|
|
| - |
| ||||||||
Other, net |
|
| 590,333 |
|
|
| 297,890 |
| ||||||||
|
|
|
|
|
|
|
|
|
|
|
|
|
|
|
|
|
Total assets |
| $ | 206,744,219 |
|
| $ | 197,824,326 |
|
| $ | 100,021,835 |
|
| $ | 126,644,947 |
|
|
|
|
|
|
|
|
|
| ||||||||
Liabilities and Stockholders' Equity |
|
|
|
|
|
|
|
| ||||||||
Current Liabilities: |
|
|
|
|
|
|
|
| ||||||||
Accounts payable |
| $ | 997,637 |
|
| $ | 665,160 |
| ||||||||
Derivative contracts, net |
|
| 281,942 |
|
|
| - |
| ||||||||
Current portion of operating lease liability |
|
| 127,108 |
|
|
| - |
| ||||||||
Accrued liabilities and other |
|
| 1,297,363 |
|
|
| 2,433,466 |
| ||||||||
Short-term debt |
|
| 1,750,000 |
|
|
| - |
| ||||||||
Total current liabilities |
|
| 4,454,050 |
|
|
| 3,098,626 |
| ||||||||
|
|
|
|
|
|
|
|
| ||||||||
Long-term debt |
|
| 27,000,000 |
|
|
| 35,425,000 |
| ||||||||
Deferred income taxes |
|
| 1,329,007 |
|
|
| 5,976,007 |
| ||||||||
Asset retirement obligations |
|
| 2,897,522 |
|
|
| 2,835,781 |
| ||||||||
Derivative contracts, net |
|
| 425,705 |
|
|
| - |
| ||||||||
Operating lease liability, net of current portion |
|
| 921,625 |
|
|
| - |
| ||||||||
|
|
|
|
|
|
|
|
| ||||||||
Stockholders' equity: |
|
|
|
|
|
|
|
| ||||||||
Class A voting common stock, $0.01666 par value; 24,000,500 shares authorized; 22,647,306 issued at September 30, 2020, and Class A voting common stock, $0.01666 par value; 24,000,000 shares authorized; 16,897,306 issued at September 30, 2019 |
|
| 377,304 |
|
|
| 281,509 |
| ||||||||
Capital in excess of par value |
|
| 10,649,611 |
|
|
| 2,967,984 |
| ||||||||
Deferred directors' compensation |
|
| 1,874,007 |
|
|
| 2,555,781 |
| ||||||||
Retained earnings |
|
| 56,244,100 |
|
|
| 81,848,301 |
| ||||||||
|
|
| 69,145,022 |
|
|
| 87,653,575 |
| ||||||||
|
|
|
|
|
|
|
|
| ||||||||
Treasury stock, at cost; 411,487 shares at September 30, 2020; 558,051 shares at September 30, 2019 |
|
| (6,151,096 | ) |
|
| (8,344,042 | ) | ||||||||
Total stockholders' equity |
|
| 62,993,926 |
|
|
| 79,309,533 |
| ||||||||
|
|
|
|
|
|
|
|
| ||||||||
Total liabilities and stockholders' equity |
| $ | 100,021,835 |
|
| $ | 126,644,947 |
| ||||||||
(Continued on next page)
See accompanying notes.
PHX Minerals Inc.
(55)
Balance SheetsStatements of Operations
|
| September 30, |
| |||||
|
| 2017 |
|
| 2016 |
| ||
Liabilities and Stockholders' Equity |
|
|
|
|
|
|
|
|
Current Liabilities: |
|
|
|
|
|
|
|
|
Accounts payable |
| $ | 1,847,230 |
|
| $ | 2,351,623 |
|
Derivative contracts, net |
|
| - |
|
|
| 403,612 |
|
Accrued liabilities and other |
|
| 1,690,789 |
|
|
| 1,718,558 |
|
Total current liabilities |
|
| 3,538,019 |
|
|
| 4,473,793 |
|
|
|
|
|
|
|
|
|
|
Long-term debt |
|
| 52,222,000 |
|
|
| 44,500,000 |
|
|
|
|
|
|
|
|
|
|
Deferred income taxes |
|
| 31,051,007 |
|
|
| 30,676,007 |
|
|
|
|
|
|
|
|
|
|
Asset retirement obligations |
|
| 3,196,889 |
|
|
| 2,958,048 |
|
|
|
|
|
|
|
|
|
|
Derivative contracts, net |
|
| 28,765 |
|
|
| 24,659 |
|
|
|
|
|
|
|
|
|
|
Stockholders' equity: |
|
|
|
|
|
|
|
|
Class A voting common stock, $0.0166 par value; 24,000,000 shares authorized; 16,863,004 issued at September 30, 2017 and 2016 |
|
| 280,938 |
|
|
| 280,938 |
|
Capital in excess of par value |
|
| 2,726,444 |
|
|
| 3,191,056 |
|
Deferred directors' compensation |
|
| 3,459,909 |
|
|
| 3,403,213 |
|
Retained earnings |
|
| 113,330,216 |
|
|
| 112,482,284 |
|
|
|
| 119,797,507 |
|
|
| 119,357,491 |
|
|
|
|
|
|
|
|
|
|
Treasury stock, at cost; 184,988 shares at September 30, 2017, and 262,708 shares at September 30, 2016 |
|
| (3,089,968 | ) |
|
| (4,165,672 | ) |
Total stockholders' equity |
|
| 116,707,539 |
|
|
| 115,191,819 |
|
|
|
|
|
|
|
|
|
|
Total liabilities and stockholders' equity |
| $ | 206,744,219 |
|
| $ | 197,824,326 |
|
|
| Year ended September 30, |
| |||||||||
|
| 2020 |
|
| 2019 |
|
| 2018 |
| |||
Revenues: |
|
|
|
|
|
|
|
|
|
|
|
|
Natural gas, oil and NGL sales |
| $ | 23,370,003 |
|
| $ | 39,410,036 |
|
| $ | 48,385,335 |
|
Lease bonuses and rentals |
|
| 690,961 |
|
|
| 1,547,078 |
|
|
| 1,580,997 |
|
Gains (losses) on derivative contracts |
|
| 907,419 |
|
|
| 6,105,145 |
|
|
| (4,932,068 | ) |
Gain on asset sales |
|
| 3,997,436 |
|
|
| 18,973,426 |
|
|
| - |
|
|
|
| 28,965,819 |
|
|
| 66,035,685 |
|
|
| 45,034,264 |
|
Costs and expenses: |
|
|
|
|
|
|
|
|
|
|
|
|
Lease operating expenses |
|
| 4,841,541 |
|
|
| 6,398,522 |
|
|
| 6,714,448 |
|
Transportation, gathering and marketing |
|
| 4,812,869 |
|
|
| 6,089,903 |
|
|
| 6,745,830 |
|
Production taxes |
|
| 1,022,912 |
|
|
| 1,902,636 |
|
|
| 2,089,050 |
|
Depreciation, depletion and amortization |
|
| 11,313,783 |
|
|
| 18,196,583 |
|
|
| 18,395,040 |
|
Provision for impairment |
|
| 29,904,528 |
|
|
| 76,824,337 |
|
|
| - |
|
Interest expense |
|
| 1,286,788 |
|
|
| 1,995,789 |
|
|
| 1,748,101 |
|
General and administrative |
|
| 8,024,901 |
|
|
| 8,565,243 |
|
|
| 7,342,441 |
|
Other expense (income) |
|
| (466 | ) |
|
| 288,610 |
|
|
| 102,685 |
|
|
|
| 61,206,856 |
|
|
| 120,261,623 |
|
|
| 43,137,595 |
|
Income (loss) before provision (benefit) for income taxes |
|
| (32,241,037 | ) |
|
| (54,225,938 | ) |
|
| 1,896,669 |
|
Provision (benefit) for income taxes |
|
| (8,289,000 | ) |
|
| (13,481,000 | ) |
|
| (12,739,000 | ) |
|
|
|
|
|
|
|
|
|
|
|
|
|
Net income (loss) |
| $ | (23,952,037 | ) |
| $ | (40,744,938 | ) |
| $ | 14,635,669 |
|
|
|
|
|
|
|
|
|
|
|
|
|
|
|
|
|
|
|
|
|
|
|
|
|
|
|
Basic and diluted earnings (loss) per common share |
| $ | (1.41 | ) |
| $ | (2.43 | ) |
| $ | 0.86 |
|
See accompanying notes.
(56)
PHX Minerals Inc.
Statements of OperationsStockholders’ Equity
|
| Year ended September 30, |
| |||||||||
|
| 2017 |
|
| 2016 |
|
| 2015 |
| |||
Revenues: |
|
|
|
|
|
|
|
|
|
|
|
|
Oil, NGL and natural gas sales |
| $ | 39,935,912 |
|
| $ | 31,411,353 |
|
| $ | 54,533,914 |
|
Lease bonuses and rentals |
|
| 5,149,297 |
|
|
| 7,735,785 |
|
|
| 2,010,395 |
|
Gains (losses) on derivative contracts |
|
| 1,249,840 |
|
|
| (86,355 | ) |
|
| 13,822,506 |
|
|
|
| 46,335,049 |
|
|
| 39,060,783 |
|
|
| 70,366,815 |
|
Costs and expenses: |
|
|
|
|
|
|
|
|
|
|
|
|
Lease operating expenses |
|
| 12,682,969 |
|
|
| 13,590,089 |
|
|
| 17,472,408 |
|
Production taxes |
|
| 1,548,399 |
|
|
| 1,071,632 |
|
|
| 1,702,302 |
|
Depreciation, depletion and amortization |
|
| 18,397,548 |
|
|
| 24,487,565 |
|
|
| 23,821,139 |
|
Provision for impairment |
|
| 662,990 |
|
|
| 12,001,271 |
|
|
| 5,009,191 |
|
Loss (gain) on asset sales and other |
|
| 105,830 |
|
|
| (2,576,237 | ) |
|
| (685,369 | ) |
Interest expense |
|
| 1,275,138 |
|
|
| 1,344,619 |
|
|
| 1,550,483 |
|
General and administrative |
|
| 7,441,242 |
|
|
| 7,139,728 |
|
|
| 7,339,320 |
|
|
|
| 42,114,116 |
|
|
| 57,058,667 |
|
|
| 56,209,474 |
|
Income (loss) before provision (benefit) for income taxes |
|
| 4,220,933 |
|
|
| (17,997,884 | ) |
|
| 14,157,341 |
|
Provision (benefit) for income taxes |
|
| 689,000 |
|
|
| (7,711,000 | ) |
|
| 4,836,000 |
|
|
|
|
|
|
|
|
|
|
|
|
|
|
Net income (loss) |
| $ | 3,531,933 |
|
| $ | (10,286,884 | ) |
| $ | 9,321,341 |
|
|
|
|
|
|
|
|
|
|
|
|
|
|
|
|
|
|
|
|
|
|
|
|
|
|
|
Basic and diluted earnings (loss) per common share |
| $ | 0.21 |
|
| $ | (0.61 | ) |
| $ | 0.56 |
|
|
| Class A voting |
|
| Capital in |
|
| Deferred |
|
|
|
|
|
|
|
|
|
|
|
| ||||||||||||
|
| Common Stock |
|
| Excess of |
|
| Directors' |
|
| Retained |
|
| Treasury |
|
| Treasury |
|
|
|
|
| ||||||||||
|
| Shares |
|
| Amount |
|
| Par Value |
|
| Compensation |
|
| Earnings |
|
| Shares |
|
| Stock |
|
| Total |
| ||||||||
Balances at September 30, 2017 |
|
| 16,863,004 |
|
| $ | 280,938 |
|
| $ | 2,726,444 |
|
| $ | 3,459,909 |
|
| $ | 113,330,216 |
|
|
| (184,988 | ) |
| $ | (3,089,968 | ) |
| $ | 116,707,539 |
|
Net income (loss) |
|
| - |
|
|
| - |
|
|
| - |
|
|
| - |
|
|
| 14,635,669 |
|
|
| - |
|
|
| - |
|
|
| 14,635,669 |
|
Purchase of treasury stock |
|
| - |
|
|
| - |
|
|
| - |
|
|
| - |
|
|
| - |
|
|
| (63,404 | ) |
|
| (1,219,228 | ) |
|
| (1,219,228 | ) |
Issuance of treasury shares to ESOP |
|
| - |
|
|
| - |
|
|
| 19,509 |
|
|
| - |
|
|
| - |
|
|
| 20,632 |
|
|
| 362,665 |
|
|
| 382,174 |
|
Restricted stock awards |
|
| - |
|
|
| - |
|
|
| 655,414 |
|
|
| - |
|
|
| - |
|
|
| - |
|
|
| - |
|
|
| 655,414 |
|
Dividends declared ($0.16 per share) |
|
| - |
|
|
| - |
|
|
| - |
|
|
| - |
|
|
| (2,698,940 | ) |
|
| - |
|
|
| - |
|
|
| (2,698,940 | ) |
Distribution of restricted stock to officers and directors |
|
| 1,278 |
|
|
| 21 |
|
|
| (845,788 | ) |
|
| - |
|
|
| - |
|
|
| 50,455 |
|
|
| 846,629 |
|
|
| 862 |
|
Distribution of deferred directors' compensation |
|
| 32,599 |
|
|
| 543 |
|
|
| 269,112 |
|
|
| (811,219 | ) |
|
| - |
|
|
| 31,838 |
|
|
| 541,564 |
|
|
| - |
|
Common shares to be issued to directors for services |
|
| - |
|
|
| - |
|
|
| - |
|
|
| 301,715 |
|
|
| - |
|
|
| - |
|
|
| - |
|
|
| 301,715 |
|
|
|
|
|
|
|
|
|
|
|
|
|
|
|
|
|
|
|
|
|
|
|
|
|
|
|
|
|
|
|
|
|
|
Balances at September 30, 2018 |
|
| 16,896,881 |
|
| $ | 281,502 |
|
| $ | 2,824,691 |
|
| $ | 2,950,405 |
|
| $ | 125,266,945 |
|
|
| (145,467 | ) |
| $ | (2,558,338 | ) |
| $ | 128,765,205 |
|
Net income (loss) |
|
| - |
|
|
| - |
|
|
| - |
|
|
| - |
|
|
| (40,744,938 | ) |
|
| - |
|
|
| - |
|
|
| (40,744,938 | ) |
Purchase of treasury stock |
|
| - |
|
|
| - |
|
|
| - |
|
|
| - |
|
|
| - |
|
|
| (515,972 | ) |
|
| (7,454,000 | ) |
|
| (7,454,000 | ) |
Issuance of treasury shares to ESOP |
|
| - |
|
|
| - |
|
|
| (25,830 | ) |
|
| - |
|
|
| - |
|
|
| 26,629 |
|
|
| 398,104 |
|
|
| 372,274 |
|
Restricted stock awards |
|
| - |
|
|
| - |
|
|
| 771,797 |
|
|
| - |
|
|
| - |
|
|
| - |
|
|
| - |
|
|
| 771,797 |
|
Dividends declared ($0.16 per share) |
|
| - |
|
|
| - |
|
|
| - |
|
|
| - |
|
|
| (2,673,706 | ) |
|
| - |
|
|
| - |
|
|
| (2,673,706 | ) |
Distribution of restricted stock to officers and directors |
|
| 425 |
|
|
| 7 |
|
|
| (394,824 | ) |
|
| - |
|
|
| - |
|
|
| 24,360 |
|
|
| 395,230 |
|
|
| 413 |
|
Distribution of deferred directors' compensation |
|
| - |
|
|
| - |
|
|
| (207,850 | ) |
|
| (667,115 | ) |
|
| - |
|
|
| 52,399 |
|
|
| 874,962 |
|
|
| (3 | ) |
Common shares to be issued to directors for services |
|
| - |
|
|
| - |
|
|
| - |
|
|
| 272,491 |
|
|
| - |
|
|
| - |
|
|
| - |
|
|
| 272,491 |
|
|
|
|
|
|
|
|
|
|
|
|
|
|
|
|
|
|
|
|
|
|
|
|
|
|
|
|
|
|
|
|
|
|
Balances at September 30, 2019 |
|
| 16,897,306 |
|
| $ | 281,509 |
|
| $ | 2,967,984 |
|
| $ | 2,555,781 |
|
| $ | 81,848,301 |
|
|
| (558,051 | ) |
| $ | (8,344,042 | ) |
| $ | 79,309,533 |
|
Net income (loss) |
|
| - |
|
|
| - |
|
|
| - |
|
|
| - |
|
|
| (23,952,037 | ) |
|
| - |
|
|
| - |
|
|
| (23,952,037 | ) |
Purchase of treasury stock |
|
| - |
|
|
| - |
|
|
| - |
|
|
| - |
|
|
| - |
|
|
| (632 | ) |
|
| (7,635 | ) |
|
| (7,635 | ) |
Issuance of treasury shares to ESOP |
|
| - |
|
|
| - |
|
|
| (974,806 | ) |
|
| - |
|
|
| - |
|
|
| 72,101 |
|
|
| 1,077,910 |
|
|
| 103,104 |
|
Restricted stock awards |
|
| - |
|
|
| - |
|
|
| 743,897 |
|
|
| - |
|
|
| - |
|
|
| - |
|
|
| - |
|
|
| 743,897 |
|
Dividends declared ($0.10 per share) |
|
| - |
|
|
| - |
|
|
| - |
|
|
| - |
|
|
| (1,652,164 | ) |
|
| - |
|
|
| - |
|
|
| (1,652,164 | ) |
Distribution of restricted stock to officers and directors |
|
| - |
|
|
| - |
|
|
| (82,820 | ) |
|
| - |
|
|
| - |
|
|
| 5,546 |
|
|
| 82,914 |
|
|
| 94 |
|
Distribution of deferred directors' compensation |
|
| - |
|
|
| - |
|
|
| (129,575 | ) |
|
| (910,182 | ) |
|
| - |
|
|
| 69,549 |
|
|
| 1,039,757 |
|
|
| - |
|
Common shares to be issued to directors for services |
|
| - |
|
|
| - |
|
|
| - |
|
|
| 228,408 |
|
|
| - |
|
|
| - |
|
|
| - |
|
|
| 228,408 |
|
Equity offering |
|
| 5,750,000 |
|
|
| 95,795 |
|
|
| 8,124,931 |
|
|
| - |
|
|
| - |
|
|
| - |
|
|
| - |
|
|
| 8,220,726 |
|
|
|
|
|
|
|
|
|
|
|
|
|
|
|
|
|
|
|
|
|
|
|
|
|
|
|
|
|
|
|
|
|
|
Balances at September 30, 2020 |
|
| 22,647,306 |
|
| $ | 377,304 |
|
| $ | 10,649,611 |
|
| $ | 1,874,007 |
|
| $ | 56,244,100 |
|
|
| (411,487 | ) |
| $ | (6,151,096 | ) |
| $ | 62,993,926 |
|
See accompanying notes.
(57)
PHX Minerals Inc.
Statements of Stockholders’ Equity
|
| Class A voting |
|
| Capital in |
|
| Deferred |
|
|
|
|
|
|
|
|
|
|
|
| ||||||||||||
|
| Common Stock |
|
| Excess of |
|
| Directors' |
|
| Retained |
|
| Treasury |
|
| Treasury |
|
|
|
|
| ||||||||||
|
| Shares |
|
| Amount |
|
| Par Value |
|
| Compensation |
|
| Earnings |
|
| Shares |
|
| Stock |
|
| Total |
| ||||||||
Balances at September 30, 2014 |
|
| 16,863,004 |
|
| $ | 280,938 |
|
| $ | 2,861,343 |
|
| $ | 3,110,351 |
|
| $ | 118,794,188 |
|
|
| (372,364 | ) |
| $ | (5,858,167 | ) |
| $ | 119,188,653 |
|
Purchase of treasury stock |
|
| - |
|
|
| - |
|
|
| - |
|
|
| - |
|
|
| - |
|
|
| (12,719 | ) |
|
| (242,313 | ) |
|
| (242,313 | ) |
Issuance of treasury shares to ESOP |
|
| - |
|
|
| - |
|
|
| 3,437 |
|
|
| - |
|
|
| - |
|
|
| 11,455 |
|
|
| 181,676 |
|
|
| 185,113 |
|
Restricted stock awards |
|
| - |
|
|
| - |
|
|
| 895,127 |
|
|
| - |
|
|
| - |
|
|
| - |
|
|
| - |
|
|
| 895,127 |
|
Distribution of restricted stock to officers and directors |
|
| - |
|
|
| - |
|
|
| (782,832 | ) |
|
| - |
|
|
| - |
|
|
| 48,633 |
|
|
| 766,301 |
|
|
| (16,531 | ) |
Distribution of deferred directors' compensation |
|
| - |
|
|
| - |
|
|
| 16,044 |
|
|
| (328,415 | ) |
|
| - |
|
|
| 22,372 |
|
|
| 352,359 |
|
|
| 39,988 |
|
Common shares to be issued to directors for services |
|
| - |
|
|
| - |
|
|
| - |
|
|
| 302,353 |
|
|
| - |
|
|
| - |
|
|
| - |
|
|
| 302,353 |
|
Dividends declared ($0.16 per share) |
|
| - |
|
|
| - |
|
|
| - |
|
|
| - |
|
|
| (2,669,056 | ) |
|
| - |
|
|
| - |
|
|
| (2,669,056 | ) |
Net income (loss) |
|
| - |
|
|
| - |
|
|
| - |
|
|
| - |
|
|
| 9,321,341 |
|
|
| - |
|
|
| - |
|
|
| 9,321,341 |
|
|
|
|
|
|
|
|
|
|
|
|
|
|
|
|
|
|
|
|
|
|
|
|
|
|
|
|
|
|
|
|
|
|
Balances at September 30, 2015 |
|
| 16,863,004 |
|
| $ | 280,938 |
|
| $ | 2,993,119 |
|
| $ | 3,084,289 |
|
| $ | 125,446,473 |
|
|
| (302,623 | ) |
| $ | (4,800,144 | ) |
| $ | 127,004,675 |
|
Purchase of treasury stock |
|
| - |
|
|
| - |
|
|
| - |
|
|
| - |
|
|
| - |
|
|
| (7,477 | ) |
|
| (117,165 | ) |
|
| (117,165 | ) |
Issuance of treasury shares to ESOP |
|
| - |
|
|
| - |
|
|
| 19,068 |
|
|
| - |
|
|
| - |
|
|
| 11,418 |
|
|
| 181,090 |
|
|
| 200,158 |
|
Restricted stock awards |
|
| - |
|
|
| - |
|
|
| 781,479 |
|
|
| - |
|
|
| - |
|
|
| - |
|
|
| - |
|
|
| 781,479 |
|
Distribution of restricted stock to officers and directors |
|
| - |
|
|
| - |
|
|
| (601,779 | ) |
|
| - |
|
|
| - |
|
|
| 35,257 |
|
|
| 559,175 |
|
|
| (42,604 | ) |
Distribution of deferred directors' compensation |
|
| - |
|
|
| - |
|
|
| (831 | ) |
|
| (10,541 | ) |
|
| - |
|
|
| 717 |
|
|
| 11,372 |
|
|
| - |
|
Common shares to be issued to directors for services |
|
| - |
|
|
| - |
|
|
| - |
|
|
| 329,465 |
|
|
| - |
|
|
| - |
|
|
| - |
|
|
| 329,465 |
|
Dividends declared ($0.16 per share) |
|
| - |
|
|
| - |
|
|
| - |
|
|
| - |
|
|
| (2,677,305 | ) |
|
| - |
|
|
| - |
|
|
| (2,677,305 | ) |
Net income (loss) |
|
| - |
|
|
| - |
|
|
| - |
|
|
| - |
|
|
| (10,286,884 | ) |
|
| - |
|
|
| - |
|
|
| (10,286,884 | ) |
|
|
|
|
|
|
|
|
|
|
|
|
|
|
|
|
|
|
|
|
|
|
|
|
|
|
|
|
|
|
|
|
|
Balances at September 30, 2016 |
|
| 16,863,004 |
|
| $ | 280,938 |
|
| $ | 3,191,056 |
|
| $ | 3,403,213 |
|
| $ | 112,482,284 |
|
|
| (262,708 | ) |
| $ | (4,165,672 | ) |
| $ | 115,191,819 |
|
Purchase of treasury stock |
|
| - |
|
|
| - |
|
|
| - |
|
|
| - |
|
|
| - |
|
|
| (25,742 | ) |
|
| (601,853 | ) |
|
| (601,853 | ) |
Issuance of treasury shares to ESOP |
|
| - |
|
|
| - |
|
|
| 93,192 |
|
|
| - |
|
|
| - |
|
|
| 13,125 |
|
|
| 219,188 |
|
|
| 312,380 |
|
Restricted stock awards |
|
| - |
|
|
| - |
|
|
| 597,940 |
|
|
| - |
|
|
| - |
|
|
| - |
|
|
| - |
|
|
| 597,940 |
|
Distribution of restricted stock to officers and directors |
|
| - |
|
|
| - |
|
|
| (1,010,275 | ) |
|
| - |
|
|
| - |
|
|
| 63,121 |
|
|
| 1,010,938 |
|
|
| 663 |
|
Distribution of deferred directors' compensation |
|
| - |
|
|
| - |
|
|
| (145,469 | ) |
|
| (301,962 | ) |
|
| - |
|
|
| 27,216 |
|
|
| 447,431 |
|
|
| - |
|
Common shares to be issued to directors for services |
|
| - |
|
|
| - |
|
|
| - |
|
|
| 358,658 |
|
|
| - |
|
|
| - |
|
|
| - |
|
|
| 358,658 |
|
Dividends declared ($0.16 per share) |
|
| - |
|
|
| - |
|
|
| - |
|
|
| - |
|
|
| (2,684,001 | ) |
|
| - |
|
|
| - |
|
|
| (2,684,001 | ) |
Net income (loss) |
|
| - |
|
|
| - |
|
|
| - |
|
|
| - |
|
|
| 3,531,933 |
|
|
| - |
|
|
| - |
|
|
| 3,531,933 |
|
|
|
|
|
|
|
|
|
|
|
|
|
|
|
|
|
|
|
|
|
|
|
|
|
|
|
|
|
|
|
|
|
|
Balances at September 30, 2017 |
|
| 16,863,004 |
|
| $ | 280,938 |
|
| $ | 2,726,444 |
|
| $ | 3,459,909 |
|
| $ | 113,330,216 |
|
|
| (184,988 | ) |
| $ | (3,089,968 | ) |
| $ | 116,707,539 |
|
See accompanying notes.
(58)
|
|
|
|
|
|
|
|
|
|
|
|
| ||||||||||||
|
| Year ended September 30, |
|
| Year ended September 30, |
| ||||||||||||||||||
|
| 2017 |
|
| 2016 |
|
| 2015 |
|
| 2020 |
|
| 2019 |
|
| 2018 |
| ||||||
Operating Activities |
|
|
|
|
|
|
|
|
|
|
|
|
|
|
|
|
|
|
|
|
|
|
|
|
Net income (loss) |
| $ | (23,952,037 | ) |
| $ | (40,744,938 | ) |
| $ | 14,635,669 |
| ||||||||||||
|
|
|
|
|
|
|
|
|
|
|
|
|
|
|
|
|
|
|
|
|
|
|
|
|
Net income (loss) |
| $ | 3,531,933 |
|
| $ | (10,286,884 | ) |
| $ | 9,321,341 |
| ||||||||||||
Adjustments to reconcile net income (loss) to net cash provided by operating activities: |
|
|
|
|
|
|
|
|
|
|
|
|
|
|
|
|
|
|
|
|
|
|
|
|
Depreciation, depletion and amortization |
|
| 18,397,548 |
|
|
| 24,487,565 |
|
|
| 23,821,139 |
|
|
| 11,313,783 |
|
|
| 18,196,583 |
|
|
| 18,395,040 |
|
Impairment |
|
| 662,990 |
|
|
| 12,001,271 |
|
|
| 5,009,191 |
|
|
| 29,904,528 |
|
|
| 76,824,337 |
|
|
| - |
|
Provision for deferred income taxes |
|
| 375,000 |
|
|
| (9,960,000 | ) |
|
| 2,672,000 |
|
|
| (4,647,000 | ) |
|
| (12,112,000 | ) |
|
| (12,963,000 | ) |
Gain from leasing fee mineral acreage |
|
| (5,147,957 | ) |
|
| (7,732,023 | ) |
|
| (2,007,993 | ) |
|
| (685,927 | ) |
|
| (1,546,298 | ) |
|
| (1,520,262 | ) |
Proceeds from leasing fee mineral acreage |
|
| 5,194,290 |
|
|
| 8,049,434 |
|
|
| 2,053,900 |
|
|
| 701,948 |
|
|
| 1,565,649 |
|
|
| 1,564,225 |
|
Net (gain) loss on sales of assets |
|
| 94,889 |
|
|
| (2,688,408 | ) |
|
| - |
|
|
| (3,973,321 | ) |
|
| (18,730,197 | ) |
|
| 660,597 |
|
Common stock contributed to ESOP |
|
| 312,380 |
|
|
| 200,158 |
|
|
| 185,113 |
| ||||||||||||
Common stock (unissued) to Directors' Deferred Compensation Plan |
|
| 358,658 |
|
|
| 329,465 |
|
|
| 302,353 |
| ||||||||||||
ESOP contribution expense |
|
| 103,104 |
|
|
| 372,274 |
|
|
| 382,174 |
| ||||||||||||
Directors' deferred compensation expense |
|
| 228,408 |
|
|
| 272,491 |
|
|
| 301,715 |
| ||||||||||||
Total (gain) loss on derivative contracts |
|
| (907,419 | ) |
|
| (6,105,145 | ) |
|
| 4,932,068 |
| ||||||||||||
Cash receipts (payments) on settled derivative contracts |
|
| 4,109,210 |
|
|
| 196,985 |
|
|
| (1,001,893 | ) | ||||||||||||
Restricted stock awards |
|
| 597,940 |
|
|
| 781,479 |
|
|
| 895,127 |
|
|
| 743,897 |
|
|
| 771,797 |
|
|
| 655,414 |
|
Other |
|
| (5,783 | ) |
|
| 81,606 |
|
|
| 449,905 |
|
|
| (2,611 | ) |
|
| 19,085 |
|
|
| 6,326 |
|
Cash provided (used) by changes in assets and liabilities: |
|
|
|
|
|
|
|
|
|
|
|
|
|
|
|
|
|
|
|
|
|
|
|
|
Oil, NGL and natural gas sales receivables |
|
| (2,298,256 | ) |
|
| 2,589,146 |
|
|
| 8,151,379 |
| ||||||||||||
Fair value of derivative contracts |
|
| (944,430 | ) |
|
| 4,639,035 |
|
|
| (2,308,922 | ) | ||||||||||||
Natural gas, oil and NGL sales receivables |
|
| 1,434,426 |
|
|
| 2,723,983 |
|
|
| 483,856 |
| ||||||||||||
Refundable income taxes |
|
| (406,071 | ) |
|
| 262,023 |
|
|
| (345,897 | ) |
|
| (2,299,785 | ) |
|
| (1,472,277 | ) |
|
| 456,780 |
|
Other current assets |
|
| 165,557 |
|
|
| 308,980 |
|
|
| 252,807 |
|
|
| (89,931 | ) |
|
| 21,116 |
|
|
| 57,752 |
|
Accounts payable |
|
| (103,389 | ) |
|
| (811,749 | ) |
|
| (343,186 | ) |
|
| 1,308,731 |
|
|
| 105,217 |
|
|
| (140,600 | ) |
Income taxes payable |
|
| - |
|
|
| - |
|
|
| (523,843 | ) | ||||||||||||
Other non-current assets |
|
| (1,044,680 | ) |
|
| 7,166 |
|
|
| (62,295 | ) | ||||||||||||
Accrued liabilities |
|
| (27,107 | ) |
|
| 388,053 |
|
|
| 40,500 |
|
|
| (1,139,029 | ) |
|
| 639,856 |
|
|
| 100,328 |
|
Total adjustments |
|
| 17,226,259 |
|
|
| 32,926,035 |
|
|
| 38,303,573 |
|
|
| 35,058,332 |
|
|
| 61,750,622 |
|
|
| 12,308,225 |
|
Net cash provided by operating activities |
|
| 20,758,192 |
|
|
| 22,639,151 |
|
|
| 47,624,914 |
|
|
| 11,106,295 |
|
|
| 21,005,684 |
|
|
| 26,943,894 |
|
|
|
|
|
|
|
|
|
|
|
|
|
| ||||||||||||
Investing Activities |
|
|
|
|
|
|
|
|
|
|
|
| ||||||||||||
|
|
|
|
|
|
|
|
|
|
|
|
| ||||||||||||
Capital expenditures |
| $ | (403,136 | ) |
| $ | (3,526,007 | ) |
| $ | (11,590,135 | ) | ||||||||||||
Acquisition of minerals and overrides |
|
| (10,288,250 | ) |
|
| (5,662,869 | ) |
|
| (11,327,371 | ) | ||||||||||||
Investments in partnerships |
|
| - |
|
|
| (1,648 | ) |
|
| 3,354 |
| ||||||||||||
Proceeds from sales of assets |
|
| 4,228,868 |
|
|
| 19,515,735 |
|
|
| 1,085,137 |
| ||||||||||||
Net cash (used in) provided by investing activities |
|
| (6,462,518 | ) |
|
| 10,325,211 |
|
|
| (21,829,015 | ) | ||||||||||||
|
|
|
|
|
|
|
|
|
|
|
|
| ||||||||||||
Financing Activities |
|
|
|
|
|
|
|
|
|
|
|
| ||||||||||||
|
|
|
|
|
|
|
|
|
|
|
|
| ||||||||||||
Borrowings under debt agreement |
|
| 6,061,725 |
|
|
| 16,642,481 |
|
|
| 29,017,800 |
| ||||||||||||
Payments of loan principal |
|
| (12,736,725 | ) |
|
| (32,217,481 | ) |
|
| (30,239,800 | ) | ||||||||||||
Net proceeds from equity issuance |
|
| 8,220,726 |
|
|
| - |
|
|
| - |
| ||||||||||||
Purchases of treasury stock |
|
| (7,635 | ) |
|
| (7,454,000 | ) |
|
| (1,219,228 | ) | ||||||||||||
Payments of dividends |
|
| (1,652,164 | ) |
|
| (2,673,706 | ) |
|
| (2,698,940 | ) | ||||||||||||
Net cash provided by (used in) financing activities |
|
| (114,073 | ) |
|
| (25,702,706 | ) |
|
| (5,140,168 | ) | ||||||||||||
Increase (decrease) in cash and cash equivalents |
|
| 4,529,704 |
|
|
| 5,628,189 |
|
|
| (25,289 | ) | ||||||||||||
Cash and cash equivalents at beginning of year |
|
| 6,160,691 |
|
|
| 532,502 |
|
|
| 557,791 |
| ||||||||||||
Cash and cash equivalents at end of year |
| $ | 10,690,395 |
|
| $ | 6,160,691 |
|
| $ | 532,502 |
| ||||||||||||
|
|
|
|
|
|
|
|
|
|
|
|
| ||||||||||||
(Continued on next page)
(59)
Statements of Cash Flows (continued)
|
| Year ended September 30, |
| |||||||||
|
| 2017 |
|
| 2016 |
|
| 2015 |
| |||
Investing Activities |
|
|
|
|
|
|
|
|
|
|
|
|
|
|
|
|
|
|
|
|
|
|
|
|
|
Capital expenditures, including dry hole costs |
| $ | (25,807,897 | ) |
| $ | (3,986,235 | ) |
| $ | (30,800,625 | ) |
Acquisition of working interest properties |
|
| - |
|
|
| - |
|
|
| (308,180 | ) |
Investments in partnerships |
|
| (23,563 | ) |
|
| 50,126 |
|
|
| (533,580 | ) |
Proceeds from sales of assets |
|
| 723,700 |
|
|
| 4,501,726 |
|
|
| - |
|
Net cash used in investing activities |
|
| (25,107,760 | ) |
|
| 565,617 |
|
|
| (31,642,385 | ) |
|
|
|
|
|
|
|
|
|
|
|
|
|
Financing Activities |
|
|
|
|
|
|
|
|
|
|
|
|
|
|
|
|
|
|
|
|
|
|
|
|
|
Borrowings under debt agreement |
|
| 27,809,185 |
|
|
| 12,339,101 |
|
|
| 25,833,116 |
|
Payments of loan principal |
|
| (20,087,185 | ) |
|
| (32,839,101 | ) |
|
| (38,833,116 | ) |
Purchases of treasury stock |
|
| (601,853 | ) |
|
| (117,165 | ) |
|
| (242,313 | ) |
Payments of dividends |
|
| (2,684,001 | ) |
|
| (2,677,305 | ) |
|
| (2,669,056 | ) |
Excess tax benefit on stock-based compensation |
|
| - |
|
|
| (43,000 | ) |
|
| 23,000 |
|
Net cash provided by (used in) financing activities |
|
| 4,436,146 |
|
|
| (23,337,470 | ) |
|
| (15,888,369 | ) |
Increase (decrease) in cash and cash equivalents |
|
| 86,578 |
|
|
| (132,702 | ) |
|
| 94,160 |
|
Cash and cash equivalents at beginning of year |
|
| 471,213 |
|
|
| 603,915 |
|
|
| 509,755 |
|
Cash and cash equivalents at end of year |
| $ | 557,791 |
|
| $ | 471,213 |
|
| $ | 603,915 |
|
|
|
|
|
|
|
|
|
|
|
|
|
|
Supplemental Disclosures of Cash Flow Information |
|
|
|
|
|
|
|
|
|
|
|
|
|
|
|
|
|
|
|
|
|
|
|
|
|
Interest paid (net of capitalized interest) |
| $ | 1,212,878 |
|
| $ | 1,365,474 |
|
| $ | 1,558,885 |
|
Income taxes paid, net of refunds received |
| $ | 720,072 |
|
| $ | 2,029,977 |
|
| $ | 3,009,939 |
|
|
|
|
|
|
|
|
|
|
|
|
|
|
Supplemental schedule of noncash investing and financing activities: |
|
|
|
|
|
|
|
|
|
|
|
|
Additions and revisions, net, to asset retirement obligations |
| $ | 624,893 |
|
| $ | 14,095 |
|
| $ | 70,529 |
|
|
|
|
|
|
|
|
|
|
|
|
|
|
Gross additions to properties and equipment |
| $ | 25,406,894 |
|
| $ | 5,118,733 |
|
| $ | 26,183,115 |
|
Net (increase) decrease in accounts payable for properties and equipment additions |
|
| 401,003 |
|
|
| (1,132,498 | ) |
|
| 4,925,690 |
|
Capital expenditures, including dry hole costs |
| $ | 25,807,897 |
|
| $ | 3,986,235 |
|
| $ | 31,108,805 |
|
See accompanying notes.
Supplemental Disclosures of Cash Flow Information |
|
|
|
|
|
|
|
|
|
|
|
|
|
|
|
|
|
|
|
|
|
|
|
|
|
Interest paid (net of capitalized interest) |
| $ | 1,306,967 |
|
| $ | 2,031,762 |
|
| $ | 1,730,461 |
|
Income taxes paid (net of refunds received) |
| $ | (1,342,275 | ) |
| $ | 103,279 |
|
| $ | (232,782 | ) |
|
|
|
|
|
|
|
|
|
|
|
|
|
Supplemental schedule of noncash investing and financing activities: |
|
|
|
|
|
|
|
|
|
|
|
|
Additions and revisions, net, to asset retirement obligations |
| $ | 4 |
|
| $ | 27,782 |
|
| $ | 17,216 |
|
|
|
|
|
|
|
|
|
|
|
|
|
|
Gross additions to properties and equipment |
| $ | 10,701,284 |
|
| $ | 9,248,415 |
|
| $ | 21,711,279 |
|
Net (increase) decrease in accounts payable for properties and equipment additions |
|
| (9,898 | ) |
|
| (59,539 | ) |
|
| 1,206,227 |
|
Capital expenditures, including dry hole costs |
| $ | 10,691,386 |
|
| $ | 9,188,876 |
|
| $ | 22,917,506 |
|
PHX Minerals Inc.
(60)
September 30, 2017, 20162020, 2019 and 20152018
1. SUMMARY OF SIGNIFICANT ACCOUNTING POLICIES
Nature of Business
Through management of its fee mineral and leasehold acreage, theThe Company’s principal line of business is to explore for, develop, acquire, producemaximizing the value of its existing mineral and sell oil, NGLroyalty assets through active management and natural gas. Panhandle’sexpanding its asset base through acquisitions of additional mineral and royalty interests. The Company owns mineral and leasehold properties and other oil and natural gas and oil interests, which are all located in the contiguous United States, primarily in Oklahoma, Texas, North Dakota, Arkansas and New Mexico, North Dakota, Oklahoma and Texas, with properties located in several other states. The Company’s oil, NGL and natural gas, oil and NGL production is from interests in 6,0956,510 wells located principally in Oklahoma, Texas, Arkansas Oklahoma and Texas.North Dakota. The Company isdoes not the operator ofoperate any wells. Approximately 55%44%, 48% and 8% of oil, NGL and natural gas, oil and NGL revenues were derived from the sale of natural gas, oil and NGL, respectively, in 2017.2020. Approximately 74%69%, 19% and 12% of the Company’s total sales volumes in 20172020 were derived from natural gas.gas, oil and NGL, respectively. Substantially all the Company’s oil, NGL and natural gas, oil and NGL production is sold through the operators of the wells. From time to time, the Company sells certain non-material, non-core or small-interest oilnatural gas and natural gasoil properties in the normal course of business.
Basis of Presentation
Certain amounts (income from partnerships, exploration costs, bad debt expense (recovery) and loss (gain) on asset sales and other in the Statements of Operations) in the prior years have been reclassified to conform to the current year presentation.
Use of Estimates
Preparation of financial statements in conformity with accounting principles generally accepted in the United States requires management to make estimates and assumptions that affect the amounts and disclosures reported in the financial statements and accompanying notes. Actual results could differ from those estimates.
Of these estimates and assumptions, management considers the estimation of natural gas, crude oil NGL and natural gasNGL reserves to be the most significant. These estimates affect the unaudited standardized measure disclosures, as well as DD&A and impairment calculations. On an annual basis, with a semi-annual update, theThe Company’s Independent Consulting Petroleum Engineer, with assistance from the Company, prepares estimates of natural gas, crude oil and NGL and natural gas reserves on an annual basis, with a semi-annual update. These estimates are based on available geologic and seismic data, reservoir pressure data, core analysis reports, well logs, analogous reservoir performance history, production data and other available sources of engineering, geological and geophysical information. For DD&A purposes, and as required by the guidelines and definitions established by the SEC, the reserve estimates were based on average individual product prices during the 12-month period prior to September 30, determined as an unweighted arithmetic average of the first-day-of-the-month price for each month within such period, unless prices were defined by contractual arrangements, excluding escalations based
(61)
Panhandle Oil and Gas Inc.
Notes to Financial Statements (continued)
upon future conditions. For impairment purposes, projected future natural gas, crude oil NGL and natural gasNGL prices as estimated by management are used. CrudeNatural gas, crude oil NGL and natural gasNGL prices are volatile and largely affected by worldwide production and consumption and are outside the control of management. Management uses projected future natural gas, crude oil NGL and natural gasNGL pricing assumptions to prepare estimates of natural gas, crude oil NGL and natural gasNGL reserves used in formulating management’s overall operating decisions.
TheAs a non-operator, the Company does not operate itsreceives actual natural gas, oil and natural gas properties and, therefore, receives actual oil, NGL and natural gas sales volumes and prices (in the normal course of business) more than a month later thanafter the information is available to the operators of the wells. This beingBecause of the case,delay in information on wells with greater significance to the Company, the most current available production data is gathered from the appropriate operators, as well as public and oil, NGLprivate sources, and natural gas, oil and NGL index prices local to each well are used to estimate the accrual of revenue on these wells. Timely obtaining production data on all other wells from the operators is not feasible; therefore, the Company utilizes past production receipts and estimated sales price information to estimate its accrual of revenue on all other wells each quarter. The oil, NGL and natural gas, oil and NGL sales revenue accrual can be impacted by many variables including rapid production decline rates, production curtailments by operators, the shut-in of wells with mechanical problems and rapidly changing market prices for natural gas, oil NGL and natural gas.NGL. These variables could lead to an over or under accrual of oil, NGL and natural gas, salesoil and NGL at the end of any particular quarter. Based on past history, the Company’s estimated accrual has been materially accurate.
Basis of Presentation
51
PHX Minerals Inc.
Notes to Financial Statements (continued)
Certain amounts (lease operating expenses and transportation, gathering and marketing in the Statements of Operations) in the prior years have been reclassified to conform to the current year presentation.
Cash and Cash Equivalents
Cash and cash equivalents consist of all demand deposits and funds invested in short-term investments with original maturities of three months or less.
Oil, NGL and Natural Gas, SalesOil and Natural Gas ImbalancesNGL Sales
The Company sells oil, NGL and natural gas, oil and NGL to various customers, recognizing revenues as oil, NGL and natural gas, oil and NGL is produced and sold. Charges for compression, marketing, gathering and transportation of natural gas are included in lease operating expenses.
The Company uses the sales method of accounting for natural gas imbalances in those circumstances where it has underproduced or overproduced its ownership percentage in a property. Under this method, a receivable or liability is recorded to the extent that an underproduced or overproduced position in a well cannot be recouped through the production of remaining reserves. At September 30, 2017 and 2016, the Company had no material natural gas imbalances.
Accounts Receivable and Concentration of Credit Risk
Substantially all of the Company’s accounts receivable are due from purchasers of oil, NGL and natural gas, oil and NGL or operators of the natural gas and oil properties. Natural gas, oil and natural gas properties. Oil, NGL and natural gas sales receivables are generally unsecured. This industry concentration has the potential to impact our overall exposure to credit risk, in that the purchasers of our oil, NGL and natural gas, oil and NGL and the operators of the properties in which we have an interest may be similarly affected by changes in
(62)
Panhandle Oil and Gas Inc.
Notes to Financial Statements (continued)
economic, industry or other conditions. During 20172020, 2019 and 2016,2018 the Company’s reserve forCompany did 0t have any bad debt expenseexpense. The Company’s allowance for uncollectible accounts as of the Balance Sheet dates was not material.
Oil and Natural Gas and Oil Producing Activities
The Company follows the successful efforts method of accounting for oilnatural gas and natural gasoil producing activities. Intangible drilling and other costs of successful wells and development dry holes are capitalized and amortized. The costs of exploratory wells are initially capitalized, but charged against income, if and when the well does not commercially produce. Oilreach commercial production levels. Natural gas and natural gasoil mineral and leasehold costs are capitalized when incurred.
It is common business practice in the petroleum industry to prepay drilling costs before spudding a well. The Company frequently fulfills these prepayment requirements with cash payments, but at times will utilize letters of credit to meet these obligations. As of September 30, 2017, the Company had no outstanding letters of credit.
Leasing of Mineral Rights
When theThe Company leasesgenerates lease bonuses by leasing its mineral acreageinterests to a third-party company, it retains a royalty interest in any future revenues from theexploration and production and sale of oil, NGL or natural gas, and often receives an up-front, non-refundable, cash payment (lease bonus) in addition to the retained royalty interest.companies. A royalty interest does not bear any portion of the cost of drilling, completing or operating a well; these costs are borne by the working interest owners. The Company sometimes leases only a portion of its mineral acres in a tract and retains the right to participate as a working interest owner with the remainder.
The Company recognizes revenue from mineral lease bonus payments when it has received an executed lease agreement represents the Company's contract with a third-party company transferringthird party and generally conveys the rights to explore for and produce any natural gas, oil or natural gas they may findNGL discovered, grants the Company a right to a specified royalty interest and requires that drilling and completion operations commence within a specified time period. Control is transferred to the term of the lease, the payment has been collected,lessee and the Company has nosatisfied its performance obligation to refundwhen the payment. lease agreement is executed, such that revenue is recognized when the lease bonus payment is received. The Company accounts for its lease bonuses as conveyances in accordance with the guidance set forth in ASC 932, and it recognizes the lease bonus as a cost recovery with any excess above its cost basis in the mineral being treated as a gain.income. The excess of lease bonus above the mineral basis is shown in the lease bonuses and rentals line item on the Company’s Statements of Operations.
Derivatives
The Company has entered into fixed swaputilizes derivative contracts and costless collar contracts. These instruments are intended to reduce the Company’sits exposure to short-term fluctuations in the price of oil and natural gas. Collar contracts set a fixed floor price and a fixed ceiling price and provide payments to the Company if the index price falls below the floor or require payments by the Company if the index price rises above the ceiling. Fixed swap contracts set a fixed price and provide payments to the Company if the index price is below the fixed price, or require payments by the Company if the index price is above the fixed price. These contracts cover only a portion of the Company’s oil and natural gas production and provide only partial price protection against declines in oil and natural gas prices.oil. These derivative instruments expose the Company to risk of financial loss and may limit the benefit of future increases in prices. All of the Company’s
(63)
Panhandle Oil and Gas Inc.
Notes to Financial Statements (continued)
derivative contractsderivates are with Bank of Oklahoma and are secured under its credit facility with Bank of Oklahoma. The derivative instruments have settled or will settle basedrecorded at fair value on the prices below.
(64)
Panhandle Oil and Gas Inc.
Notes to Financial Statements (continued)
Derivative contracts in place as of September 30, 2017
| ||||||
|
|
|
| |||
| ||||||
|
|
|
| |||
|
|
|
| |||
|
|
|
| |||
|
|
|
| |||
|
|
|
| |||
|
|
|
| |||
|
|
|
| |||
|
|
|
| |||
|
|
|
| |||
|
|
|
| |||
|
|
|
| |||
| ||||||
|
|
|
| |||
|
|
|
| |||
|
|
|
| |||
|
|
|
| |||
|
|
|
| |||
|
|
|
| |||
|
|
|
| |||
|
|
|
| |||
|
|
|
| |||
|
|
|
| |||
| ||||||
|
|
|
| |||
|
|
|
| |||
|
|
|
| |||
|
|
|
| |||
|
|
|
| |||
|
|
|
| |||
|
|
|
| |||
|
|
|
| |||
| ||||||
|
|
|
| |||
|
|
|
| |||
|
|
|
| |||
|
|
|
| |||
|
|
|
| |||
|
|
|
|
(65)
Panhandle Oil and Gas Inc.
Notes to Financial Statements (continued)
Derivative contracts in place as of September 30, 2016
| ||||||
|
|
|
| |||
| ||||||
|
|
|
| |||
|
|
|
| |||
|
|
|
| |||
|
|
|
| |||
|
|
|
| |||
|
|
|
| |||
|
|
|
| |||
|
|
|
| |||
|
|
|
| |||
|
|
|
| |||
|
|
|
| |||
| ||||||
|
|
|
| |||
|
|
|
| |||
|
|
|
| |||
|
|
|
| |||
|
|
|
| |||
| ||||||
|
|
|
| |||
|
|
|
| |||
|
|
|
| |||
|
|
|
| |||
|
|
|
|
balance sheet. The Company has elected not to complete the documentation requirements necessary to permit these derivative contracts to be accounted for as cash flow hedges. The Company’s fair value of derivative contracts was a net asset of $516,159 as of September 30, 2017,
Properties and a net liability of $428,271 as of September 30, 2016. RealizedEquipment
Depreciation, Depletion and unrealized gains and (losses) are recorded in gains (losses) on derivative contracts on the Company’s Statement of Operations.Amortization
The fair value amounts recognized for the Company’s derivative contracts executed with the same counterparty under a master netting arrangement may be offset. The Company has the choice to offset or not, but that choice must be applied consistently. A master netting arrangement exists if the reporting entity has multiple contracts with a single counterparty that are subject to a contractual agreement that provides for the net settlement of all contracts through a single payment in a single currency in the event of default on, or termination of, any one contract. Offsetting the fair values recognized for the derivative contracts outstanding with a single counterparty results in the net fair value of the transactions being reported as an asset or a liability in the Balance Sheets. The following table summarizes and reconciles the Company's
(66)52
Panhandle Oil and GasPHX Minerals Inc.
Notes to Financial Statements (continued)
derivative contracts’ fair values at a gross level back to net fair value presentation on the Company's Balance Sheets at September 30, 2017, and September 30, 2016. The Company has offset all amounts subject to master netting agreements in the Company's Balance Sheets at September 30, 2017, and September 30, 2016.
|
| 9/30/2017 |
|
| 9/30/2016 |
| ||||||||||||||||||||||||||
|
| Fair Value (a) |
|
| Fair Value (a) |
| ||||||||||||||||||||||||||
|
| Commodity Contracts |
|
| Commodity Contracts |
| ||||||||||||||||||||||||||
|
| Current Assets |
|
| Current Liabilities |
|
| Non-Current Assets |
|
| Non-Current Liabilities |
|
| Current Assets |
|
| Current Liabilities |
|
| Non-Current Assets |
|
| Non-Current Liabilities |
| ||||||||
Gross amounts recognized |
| $ | 735,702 |
|
| $ | 190,778 |
|
| $ | 9,439 |
|
| $ | 38,204 |
|
| $ | 68,235 |
|
| $ | 471,847 |
|
| $ | 4,759 |
|
| $ | 29,418 |
|
Offsetting adjustments |
|
| (190,778 | ) |
|
| (190,778 | ) |
|
| (9,439 | ) |
|
| (9,439 | ) |
|
| (68,235 | ) |
|
| (68,235 | ) |
|
| (4,759 | ) |
|
| (4,759 | ) |
Net presentation on Balance Sheets |
| $ | 544,924 |
|
| $ | - |
|
| $ | - |
|
| $ | 28,765 |
|
| $ | - |
|
| $ | 403,612 |
|
| $ | - |
|
| $ | 24,659 |
|
|
|
The fair value of derivative assets and derivative liabilities is adjusted for credit risk only if the impact is deemed material. The impact of credit risk was immaterial for all periods presented.
Fair Value Measurements
Fair value is defined as the amount that would be received from the sale of an asset or paid for the transfer of a liability in an orderly transaction between market participants, i.e., an exit price. To estimate an exit price, a three-level hierarchy is used. The fair value hierarchy prioritizes the inputs, which refer broadly to assumptions market participants would use in pricing an asset or a liability, into three levels. Level 1 inputs are unadjusted quoted prices in active markets for identical assets and liabilities. Level 2 inputs are inputs other than quoted prices included within Level 1 that are observable for the asset or liability, either directly or indirectly. If the asset or liability has a specified (contractual) term, a Level 2 input must be observable for substantially the full term of the asset or liability. Level 2 inputs include the following: (i) quoted prices for similar assets or liabilities in active markets; (ii) quoted prices for identical or similar assets or liabilities in markets that are not active; (iii) inputs other than quoted prices that are observable for the asset or liability; or (iv) inputs that are derived principally from, or corroborated by, observable market data by correlation or other means. Level 3 inputs are unobservable inputs for the financial asset or liability.
(67)
Panhandle Oil and Gas Inc.
Notes to Financial Statements (continued)
The following table provides fair value measurement information for financial assets and liabilities measured at fair value on a recurring basis.
|
| Fair Value Measurement at September 30, 2017 |
| |||||||||||||
|
| Quoted Prices in Active Markets |
|
| Significant Other Observable Inputs |
|
| Significant Unobservable Inputs |
|
| Total Fair |
| ||||
|
| (Level 1) |
|
| (Level 2) |
|
| (Level 3) |
|
| Value |
| ||||
Financial Assets (Liabilities): |
|
|
|
|
|
|
|
|
|
|
|
|
|
|
|
|
Derivative Contracts - Swaps |
| $ | - |
|
| $ | 364,606 |
|
| $ | - |
|
| $ | 364,606 |
|
Derivative Contracts - Collars |
| $ | - |
|
| $ | - |
|
| $ | 151,553 |
|
| $ | 151,553 |
|
|
| Fair Value Measurement at September 30, 2016 |
| |||||||||||||
|
| Quoted Prices in Active Markets |
|
| Significant Other Observable Inputs |
|
| Significant Unobservable Inputs |
|
| Total Fair |
| ||||
|
| (Level 1) |
|
| (Level 2) |
|
| (Level 3) |
|
| Value |
| ||||
Financial Assets (Liabilities): |
|
|
|
|
|
|
|
|
|
|
|
|
|
|
|
|
Derivative Contracts - Swaps |
| $ | - |
|
| $ | (111,613 | ) |
| $ | - |
|
| $ | (111,613 | ) |
Derivative Contracts - Collars |
| $ | - |
|
| $ | - |
|
| $ | (316,658 | ) |
| $ | (316,658 | ) |
Level 2 – Market Approach - The fair values of the Company’s swaps are based on a third-party pricing model which utilizes inputs that are either readily available in the public market, such as natural gas curves, or can be corroborated from active markets. These values are based upon future prices, time to maturity and other factors. These values are then compared to the values given by our counterparties for reasonableness.
Level 3 – The fair values of the Company’s costless collar contracts are based on a pricing model which utilizes inputs that are unobservable or not readily available in the public market. These values are based upon future prices, volatility, time to maturity and other factors. These values are then compared to the values given by our counterparties for reasonableness.
The significant unobservable inputs for Level 3 derivative contracts include market volatility and credit risk of counterparties. Changes in these inputs will impact the fair value measurement of our derivative contracts. An increase (decrease) in the forward prices and volatility of oil and natural gas prices will decrease (increase) the fair value of oil and natural gas derivatives, and adverse changes to our counterparties’ creditworthiness will decrease the fair value of our derivatives.
(68)
Panhandle Oil and Gas Inc.
Notes to Financial Statements (continued)
The following table represents quantitative disclosures about unobservable inputs for Level 3 Fair Value Measurements.
Instrument Type |
| Unobservable Input |
| Range |
| Weighted Average |
|
| Fair Value Assets (Liabilities) September 30, 2017 |
| ||
|
|
|
|
|
|
|
|
|
|
|
|
|
Oil Collars |
| Oil price volatility curve |
| 0% - 29.06% |
|
| 14.98 | % |
| $ | (60,331 | ) |
Natural Gas Collars |
| Gas price volatility curve |
| 0% - 29.34% |
|
| 18.13 | % |
| $ | 211,884 |
|
A reconciliation of the Company’s derivative contracts classified as Level 3 measurements is presented below.
|
| Derivatives |
| |
Net Asset (Liability) Balance of Level 3 as of October 1, 2016 |
| $ | (316,658 | ) |
Total gains or (losses): |
|
|
|
|
Included in earnings |
|
| 460,061 |
|
Included in other comprehensive income (loss) |
|
| - |
|
Purchases, issuances and settlements |
|
| 8,150 |
|
Transfers in and out of Level 3 |
|
| - |
|
Net Asset (Liability) Balance of Level 3 as of September 30, 2017 |
| $ | 151,553 |
|
The following table presents impairments associated with certain assets that have been measured at fair value on a nonrecurring basis within Level 3 of the fair value hierarchy.
|
| Year Ended September 30, |
| |||||||||||||
|
| 2017 |
|
| 2016 |
| ||||||||||
|
| Fair Value |
|
| Impairment |
|
| Fair Value |
|
| Impairment |
| ||||
|
|
|
|
|
|
|
|
|
|
|
|
|
|
|
|
|
Producing Properties (a) |
| $ | 567,077 |
|
| $ | 662,990 |
|
| $ | 9,877,905 |
|
| $ | 12,001,271 |
|
|
|
At September 30, 2017, and September 30, 2016, the fair value of financial instruments approximated their carrying amounts. Financial instruments include long-term debt, which valuation is classified as Level 3 and is based on a valuation technique that requires inputs that
(69)
Panhandle Oil and Gas Inc.
Notes to Financial Statements (continued)
are both unobservable and significant to the overall fair value measurement. The fair value measurement of our long-term debt is valued using a discounted cash flow model that calculates the present value of future cash flows pursuant to the terms of the debt agreements and applies estimated current market interest rates. The estimated current market interest rates are based primarily on interest rates currently being offered on borrowings of similar amounts and terms. In addition, no valuation input adjustments relating to nonperformance risk for the debt agreements were considered necessary.
Depreciation, Depletion, Amortization and Impairment
Depreciation, depletion and amortization of the costs of producing oilnatural gas and natural gasoil properties are generally computed using the unit-of-production method primarily on an individual property basis using proved or proved developed reserves, as applicable, as estimated by the Company’s Independent Consulting Petroleum Engineer. The Company’s capitalized costs of drilling and equipping all development wells, and those exploratory wells that have found proved reserves, are amortized on a unit-of-production basis over the remaining life of associated proved developed reserves. LeaseLeasehold costs are amortized on a unit-of-production basis over the remaining life of associated total proved reserves. Depreciation of furniture and fixtures is computed using the straight-line method over estimated productive lives of five to eight years.
Non-producing oilnatural gas and natural gasoil properties include non-producing minerals, which had a net book value of $3,079,008$13,556,020 and $3,349,567$9,673,787 at September 30, 20172020 and 2016,2019, respectively, consisting of perpetual ownership of mineral interests in several states, with 91% of the acreage in Arkansas, New Mexico,Oklahoma, Texas, North Dakota, OklahomaArkansas and Texas.New Mexico. As mentioned, these mineral rights are perpetual and have been accumulated over the 91-year94-year life of the Company. There are approximately 198,176190,990 net acres of non-producing minerals in more than 6,2846,380 tracts owned by the Company. An average tract contains approximately 2930 acres and the average cost per acre is $40.$71. Since inception, the Company has continually generated an interest in several thousand oilnatural gas and natural gasoil wells using its ownership of the fee mineral acres as an ownership basis. There continues to be significant drilling and leasing activity each year on these mineral interests.interests each year. Non-producing minerals are being amortized straight-line over a 33-year period. These assets are considered a long-term investment by the Company, as they do not expire (as do oil and(unlike natural gas and oil leases). Given the above, management concluded that a long-term amortization was appropriate and that 33 years, based on past history and experience, was an appropriate period. Due to the fact that the minerals consistCompany’s mineral ownership consists of a large number of properties, whose costs are not individually significant, and because virtually all are in the Company’s core operating areas, the minerals are being amortized on an aggregate basis.basis (by mineral deed).
The Company recognizes impairment losses for long-lived assets when indicators of impairment are present andWhen a new well is drilled on the undiscounted cash flows are not sufficient to recover the assets’ carrying amount. The impairment loss is measured by comparing the fair valueCompany’s mineral acreage, all of the assetnon-producing mineral costs for the associated mineral deed are transferred to its carrying amount. Fair valuesproducing minerals and are based on discounted cash flowamortized straight-line over a 20-year period (insignificant fields are amortized over 10-year period). Management has historically chosen to move non-producing mineral costs in this manner, as estimated byit is very difficult for the Company, or fair value (sales price) less costas a non-operator, to sell if the property is held for sale. The Company's estimatepredict well spacing and timing of fair value of its oil and natural gas properties at September 30, 2017, is baseddrilling on the best information available asCompany’s minerals, and future development will deplete these assets over a long period. Given that we are moving all of that date, including estimates of forward oil, NGL and natural gas prices and costs. The Company’s oil and natural gas properties were reviewed for impairment on a field-by-field basis, resulting in the recognition of impairment provisions of $662,990,
(70)
Panhandle Oil and Gas Inc.
Notes to Financial Statements (continued)
$12,001,271 and $5,009,191 for 2017, 2016 and 2015, respectively. A further reduction in oil, NGL and natural gas prices or a decline in reserve volumes may lead to additional impairment in future periods that may be materialcosts to the Company.
At September 30, 2017, the Company hadfirst new well drilled on each mineral deed, we believe that a group of 68 non-core marginalstraight-line amortization over a 20-year period is appropriate, as these wells that were held for sale pending a final agreement with the buyer. The sale ofand future development will deplete these assets closed on October 12, 2017, for $557,750. As the selling price was less than the carrying value and these wells met the criteria of held for sale at September 30, 2017, the carrying amount of these assets was written down to fair value less cost to sell and an impairment expense was recognized for $616,711 (included in Provision for impairment line of Statement of Operations). The net amount of assets less accumulated DD&A ($14,929,309 and $14,371,559, respectively) was reclassed from noncurrent assets in Property and equipment to current assets as Assets held for sale on the Balance Sheets as of September 30, 2017.over a fairly long period.
Capitalized Interest
During 2017, 20162020, 2019 and 2015,2018, interest of $168,351, $24,929$0, $38,606 and $148,493,$89,023, respectively, was included in the Company’s capital expenditures. Interest of $1,275,138, $1,344,619$1,286,788, $1,995,789 and $1,550,483,$1,748,101, respectively, was charged to expense during those periods. Interest is capitalized using a weighted average interest rate based on the Company’s outstanding borrowings. These capitalized costs are included with intangible drilling costs and amortized using the unit-of-production method.
Accrued Liabilities
The following table shows the balances for the years ended September 30, 2020 and 2019, relating to the Company’s accrued liabilities:
|
| Year Ended September 30, |
| |||||
|
| 2020 |
|
| 2019 |
| ||
Accrued compensation |
| $ | 481,062 |
|
| $ | 1,446,710 |
|
Revenues payable |
|
| 281,380 |
|
|
| 396,954 |
|
Accrued ad valorem |
|
| 228,010 |
|
|
| 260,550 |
|
Other |
|
| 306,911 |
|
|
| 329,252 |
|
Total accrued liabilities |
| $ | 1,297,363 |
|
| $ | 2,433,466 |
|
The decrease in accrued compensation from 2019 to 2020 is primarily due to the one-time severance with the Company’s former CEO of approximately $670,000 upon his resignation at the end of fiscal 2019 as well as lower performance-related compensation in 2020.
53
PHX Minerals Inc.
Notes to Financial Statements (continued)
Asset Retirement Obligations
The Company owns interests in oilnatural gas and natural gasoil properties, which may require expenditures to plug and abandon the wells upon the end of their economic lives. The fair value of legal obligations to retire and remove long-lived assets is recorded in the period in which the obligation is incurred (typically when the asset is installed at the production location). When the liability is initially recorded, this cost is capitalized by increasing the carrying amount of the related properties and equipment. Over time the liability is increased for the change in its present value, and the capitalized cost in properties and equipment is depreciated over the useful life of the remaining asset. The Company does not have any assets restricted for the purpose of settling the asset retirement obligations.
The following table shows the activity for the years ended September 30, 2017 and 2016, relating to the Company’s asset retirement obligations:
|
| 2017 |
|
| 2016 |
| ||
Asset retirement obligations as of beginning of the year |
| $ | 2,958,048 |
|
| $ | 2,824,944 |
|
Wells acquired or drilled |
|
| 114,766 |
|
|
| 17,338 |
|
Wells sold or plugged |
|
| (548,634 | ) |
|
| (12,956 | ) |
Revisions in estimated cash flows |
|
| 536,536 |
|
|
| - |
|
Accretion of discount |
|
| 136,173 |
|
|
| 128,722 |
|
Asset retirement obligations as of end of the year |
| $ | 3,196,889 |
|
| $ | 2,958,048 |
|
(71)
Panhandle Oil and Gas Inc.
Notes to Financial Statements (continued)
The revisions in estimated cash flows in fiscal 2017 were due to increased plugging charges noted recently that were higher than previously estimated. As a non-operator, we do not control the plugging of wells in which we have a working interest and are not involved in the negotiation of the terms of the plugging contracts. Our estimate relies on information that we receive directly from operators as well as relevant information that we can gather from outside sources.
Environmental Costs
As the Company is directly involved in the extraction and use of natural resources, it is subject to various federal, state and local provisions regarding environmental and ecological matters. Compliance with these laws may necessitate significant capital outlays. The Company does not believe the existence of current environmental laws, or interpretations thereof, will materially hinder or adversely affect the Company’s business operations; however, there can be no assurances of future effects on the Company of new laws or interpretations thereof. Since the Company does not operate any wells where it owns an interest, actual compliance with environmental laws is controlled by the well operators, with Panhandlethe Company being responsible for its proportionate share of the costs involved. Panhandleinvolved (on working interest wells only). The Company carries liability and pollution control insurance. However, all risks are not insured due to the availability and cost of insurance.
Environmental liabilities, which historically have not been material, are recognized when it is probable that a loss has been incurred and the amount of that loss is reasonably estimable. Environmental liabilities, when accrued, are based upon estimates of expected future costs. At September 30, 20172020 and 2016,2019, there were no such costs accrued.
Earnings (Loss) Per Share of Common Stock
Earnings (loss) per share is calculated using net income (loss) divided by the weighted average number of common shares outstanding, plus unissued, vested directors’ deferred compensation shares during the period.
Share-based Compensation
The Company recognizes current compensation costs for its Deferred Compensation Plan for Non-Employee Directors (the “Plan”). Compensation cost is recognized for the requisite directors’ fees as earned and unissued stock is recorded to each director’s account based on the fair market value of the stock at the date earned. The Plan provides that only upon retirement, termination or death of the director or upon a change in control of the Company, the shares accrued under the Plan may be issued to the director.
In accordance with guidance on accounting for employee stock ownership plans, the Company records the fair market value of the stock contributed into its ESOP as expense.
Restricted stock awards to officers provide for cliff vesting at the end of three or five years from the date of the awards. These restricted stock awards can be granted based on service time only (non-performance based) or(time-based), subject to certain share price performance standards (performance based)(market-based) or subject to company performance standards (performance-based). Restricted stock awards to the non-employee directors provide for
(72)
Panhandle Oil and Gas Inc.
Notes to Financial Statements (continued)
quarterly annual vesting during the calendar year of the award. The fair value of the awards on the grant date is ratably expensed over the vesting period in accordance with accounting guidance.
Income Taxes
The estimation of amounts of income tax to be recorded by the Company involves interpretation of complex tax laws and regulations, as well as the completion of complex calculations, including the determination of the Company’s percentage depletion deduction. Although the Company’s management believes its tax accruals are adequate, differences may occur in the future depending on the resolution of pending and new tax regulations. Deferred income taxes are computed using the liability method and are provided on all temporary differences between the financial basis and the tax basis of the Company’s assets and liabilities.
54
PHX Minerals Inc.
Notes to Financial Statements (continued)
The Tax Cuts and Jobs Act was enacted on December 22, 2017. The Act reduced the U.S. federal corporate tax rate from 35% to 21%. As of September 30, 2018, we completed our estimates accounting for the tax effects of the Act. Based on these estimates, we recognized an amount which was included as a component of income tax expense (benefit) from continuing operations in 2018.
We remeasured certain deferred tax assets and liabilities based on the rates at which they are expected to reverse in the future, which is generally 21%. The amount recorded related to the remeasurement of our deferred tax balance in 2018 was $12,464,000 income tax benefit.
The Company’s provision for income taxes differs from the statutory rate primarily due to estimated federal and state benefits generated from estimated excess federal and Oklahoma percentage depletion, which are permanent tax benefits. Excess percentage depletion, both federal and Oklahoma, can only be taken in the amount that it exceeds cost depletion which is calculated on a unit-of-production basis.
Both excess federal percentage depletion, which is limited to certain production volumes and by certain income levels, and excess Oklahoma percentage depletion, which has no limitation on production volume, reduce estimated taxable income or add to estimated taxable loss projected for any year. Federal and Oklahoma excess percentage depletion, when a provision for income taxes is expected for the year, decreases the effective tax rate, while the effect is to increase the effective tax rate when a benefit for income taxes is expected for the year. The benefits of federal and Oklahoma excess percentage depletion and excess tax benefits and deficiencies of stock-based compensation are not directly related to the amount of pre-tax income (loss) recorded in a period. Accordingly, in periods where a recorded pre-tax income or loss is relatively small, the proportional effect of these items on the effective tax rate may be significant. The effective tax rate for the year ended September 30, 2019, was a 25% benefit, as compared to a 26% benefit for the year ended September 30, 2020.
The threshold for recognizing the financial statement effect of a tax position is when it is more likely than not, based on the technical merits, that the position will be sustained by a taxing authority. Recognized tax positions are initially and subsequently measured as the largest amount of tax benefit that is more likely than not to be realized upon ultimate settlement with a taxing authority. The Company files income tax returns in the U.S. federal jurisdiction and various state jurisdictions. Subject to statutory exceptions that allow for a possible extension of the assessment period, the Company is no longer subject to U.S. federal, state, and local income tax examinations for fiscal years prior to 2014.2017.
The Company includes interest assessed by the taxing authorities in interest expense and penalties related to income taxes in general and administrative expense on its Statements of Operations. For fiscal September 30, 2017, 20162020, 2019 and 2015,2018, the Company’s interest and penalties waswere not material. The Company does not believe it has any significantmaterial uncertain tax positions.
Adoption of New Accounting Pronouncements
In April 2015, the FASB issued Accounting Standards Update (“ASU”) 2015-03, Interest—Imputation of Interest (Subtopic 835-30): Simplifying the Presentation of Debt Issuance Costs. The update requires that debt issuance costs related to a recognized debt liability, such as senior notes, term loans and note payables, be presented in the balance sheet as a direct deduction from the carrying amount of that debt liability, consistent with the presentation of debt discounts. Under previous guidance, debt issuance costs were required to be presented in the balance sheet as an asset. The recognition and measurement guidance for debt issuance costs is not affected by the update. For public entities, the guidance is effective for fiscal years beginning after December 15, 2015, including interim periods within those fiscal years.
In August 2015, the FASB issued ASU 2015-15, Interest—Imputation of Interest (Subtopic 835-30): Presentation and Subsequent Measurement of Debt Issuance Costs Associated with Line-of-Credit Arrangements, which allows for line-of-credit arrangements to be handled consistently with the presentation of debt issuance costs prior to ASU 2015-03 issued in April 2015. For public entities, the guidance is effective for fiscal years beginning after December 15, 2015, including interim periods within those fiscal years.
(73)55
Panhandle Oil and GasPHX Minerals Inc.
Notes to Financial Statements (continued)
The Company adopted ASU 2015-03 and ASU 2015-15 as of December 31, 2016. The Company elected to continue to show debt issuance costs associated with its credit facility (Company’s only debt) as assets versus a direct reduction of the debt liability. Therefore, the adoption had no impact on the Company's current and previously reported balance sheets, shareholders' equity, results of operations, or cash flows. In accordance with ASU 2015-15, unamortized debt issuance costs associated with the Company's credit facility, which amounted to $141,956 and $263,584 as of September 30, 2017, and September 30, 2016, respectively, remain reflected in "Other property and equipment" on the balance sheets.
In November 2015, the FASB issued ASU 2015-17, Balance Sheet Classification of Deferred Taxes. The update requires that deferred income tax assets and liabilities be classified as noncurrent in the balance sheet. For public entities, the guidance is effective for fiscal years beginning after December 15, 2016, including interim periods within those fiscal years.
The Company early adopted ASU 2015-17 as of December 31, 2016, on a retrospective basis to all prior balance sheet periods presented. As a result of the adoption, the Company reclassified $310,900 as of September 30, 2016, from "Deferred income taxes" in current assets to “Deferred income tax, net” in long term liabilities on the balance sheets. Adoption of ASU 2015-17 had no impact on the Company's current and previously reported shareholders' equity, results of operations or cash flows. The affected prior period deferred income tax account balances presented throughout this report on Form 10-K have been adjusted to reflect the retroactive adoption of ASU 2015-17.
In August 2016, the FASB issued ASU 2016-15, Classification of Certain Cash Receipts and Cash Payments, which addresses certain issues where diversity in practice was identified and may change how an entity classifies certain cash receipts and cash payments on its statement of cash flows. The new guidance also clarifies how the predominance principle should be applied when cash receipts and cash payments have aspects of more than one class of cash flows. This guidance will generally be applied retrospectively and is effective for public business entities for fiscal years beginning after December 15, 2017, and interim periods within those years. Early adoption is permitted. All of the amendments in ASU 2016-15 are required to be adopted at the same time.
The Company early adopted ASU 2016-15 as of December 31, 2016. As a result of the adoption, the Company reclassified “Proceeds from leasing fee mineral acreage”, which totaled $5,194,290, $8,049,434 and $2,053,900 for the fiscal years ending September 30, 2017, 2016 and 2015, respectively, from Investing Activities to Operating Activities on the Condensed Statements of Cash Flows as these transactions are made in our normal course of business and represent operating activities based on the application of the predominance principle. As another result of this adoption, we are also electing to classify our distributions received from equity method investments using the Cumulative Earnings Approach. Distributions received are considered returns on investment and classified as cash inflows from operating activities, unless the investor’s cumulative distributions received less distributions received in prior periods that were determined to be returns of investment exceed cumulative equity in earnings recognized by the investor. When such an excess occurs, the current-period distribution up to this excess should be considered a return of investment and classified as cash inflows from investing activities. This election did not have any impact on our cash flow statements as the Company was already
(74)
Panhandle Oil and Gas Inc.
Notes to Financial Statements (continued)
applying this approach. Adoption of ASU 2016-15 had no impact on the Company's current and previously reported shareholders' equity, results of operations or balance sheets. The affected prior period balances in the Condensed Statements of Cash Flows presented throughout this report on Form 10-K have been adjusted to reflect the retroactive adoption of ASU 2016-15.
In March 2016, the FASB issued ASU 2016-09, Compensation - Stock Compensation (Topic 718): Improvements to Employee Share-Based Payment Accounting. The new guidance is intended to improve the accounting for employee share-based payments and affect all organizations that issue share-based payment awards to their employees. The guidance changes how companies account for certain aspects of share-based payment awards, including the accounting for income taxes, forfeitures and statutory tax withholding requirements, as well as classification in the statement of cash flows. The standard is effective for interim and annual reporting periods beginning after December 15, 2016, and will be adopted either prospectively, retrospectively or using a modified retrospective transition approach depending on the topic covered in the standard. Early adoption is permitted for any organization in any interim or annual period. On a prospective basis, companies will no longer record excess tax benefits and deficiencies in additional paid-in capital. Instead, excess tax benefits and deficiencies will be recognized as income tax expense or benefit in the income statement. This is expected to result in increased volatility in income tax expense/benefit and corresponding variations in the relationship between income tax expense/benefit and pre-tax income/loss from period to period. Also, companies will have to present excess tax benefits and deficiencies as operating activities on the statement of cash flows (prospectively or retrospectively). The new guidance will also require an employer to classify as a financing activity in its statement of cash flows the cash paid to a tax authority when shares are withheld to satisfy the employer’s statutory income tax withholding obligation.
The Company early adopted ASU 2016-09 as of October 1, 2016. As a result of the adoption, the Company recorded $238,000 of excess tax benefits from stock-based compensation in the “Provision (benefit) for income taxes” on the Condensed Statements of Operations in 2017 versus “Capital in excess of par” on the Condensed Balance Sheets in 2016 as was previously required. This part of the guidance is to be applied prospectively, so the prior period balances have not been reclassified. The Company also presented excess tax benefits from stock-based compensation in the “Operating Activities” section of the Condensed Statements of Cash Flows in the current period versus the “Financing Activities” section of the Condensed Statements of Cash Flows as was previously presented. The Company has elected to apply this part of the guidance prospectively, so the prior period balances have not been reclassified. The guidance also requires that companies present employees taxes paid upon vesting (using shares repurchased) as financing activities on the statement of cash flows (Purchases of Treasury Stock). This requirement had no impact on the Company, as this has been the practice historically. The Company is also electing to account for forfeitures of awards as they occur, instead of estimating a forfeiture amount. A cumulative-effect adjustment to retained earnings was not necessary for this transition as there were no material forfeitures estimated or incurred in the past. The adoption of this ASU could cause volatility in the effective tax rate going forward.
In August 2014, the FASB issued ASU 2014-15, Presentation of Financial Statements – Going Concern (Subtopic 205-40): Disclosure of Uncertainties about an Entity’s Ability to
(75)
Panhandle Oil and Gas Inc.
Notes to Financial Statements (continued)
Continue as a Going Concern. The update defined management’s responsibility to evaluate whether substantial doubt exists about an entity’s ability to continue as a going concern. Professional auditing standards require auditors to evaluate the going concern presumption, but previously there was a lack of guidance in GAAP for financial statement preparers. This update requires management to perform a going concern evaluation effective for annual periods ending after December 15, 2016, and annual and interim periods thereafter. The Company adopted this standard in 2017 and management does not believe there is substantial doubt about the entity’s ability to continue as a going concern.
NewRecent Accounting Pronouncements yet to be Adopted
In February 2016, the FASB issued its new lease accounting guidance in ASU 2016-02, Leases (Topic 842). Under the new guidance, lessees will be required to recognize the following for all leases (with the exception of short-term leases) at the commencement date: 1) a lease liability, which is a lessee’s obligation to make lease payments arising from a lease, measured on a discounted basis; and 2) a right-of-use asset, which is an asset that represents the lessee’s right to use, or control the use of, a specified asset for the lease term. The new lease guidance simplified the accounting for sale and leaseback transactions primarily because lessees must recognize lease assets and lease liabilities. Lessees will no longer be provided with a source of off-balance sheet financing. The guidance is effective for us beginning October 1, 2019, including interim periods within the fiscal year. Early application is permitted for all public business entities upon issuance. Lessees (for capital and operating leases) and lessors (for sales-type, direct financing, and operating leases) must apply a modified retrospective transition approach for leases existing at, or entered into after, the beginning of the earliest comparative period presented in the financial statements. The modified retrospective approach would not require any transition accounting for leases that expired before the earliest comparative period presented. Lessees and lessors may not apply a full retrospective transition approach. We are assessing the potential impact that this update will have on our financial statements.
In January 2016, the FASB issued ASU 2016-01, Financial Instruments – Overall (Subtopic 825-10): Recognition and Measurement of Financial Assets and Financial Liabilities. The new guidance is intended to improve the recognition and measurement of financial instruments. The new guidance is effective for us beginning October 1, 2018, including interim periods within the fiscal year. We are assessing the potential impact that this update will have on our financial statements.
In May 2014, the FASB issued ASU 2014-09, Revenue from Contracts with Customers, which will supersede nearly all existing revenue recognition guidance under GAAP. The standard’s core principle is that a company will recognize revenue when it transfers promised goods or services to customers in an amount that reflects the consideration to which the company expects to be entitled in exchange for those goods or services. We are evaluating our existing revenue recognition policies to determine whether any contracts in the scope of the guidance will be affected by the new requirements. The standard is effective for us on October 1, 2018. The standard allows for either “full retrospective” adoption, meaning the standard is applied to all of the periods presented, or “modified retrospective” adoption, meaning the standard is applied only to the most current period presented in the financial statements. We are currently evaluating the
(76)
Panhandle Oil and Gas Inc.
Notes to Financial Statements (continued)
potential impact that this update will have on our financial statements and the transition method that will be elected.
Standard | Description | Date of Adoption | Impact on Financial Statements or Other Significant Matters | |||
Adoption of New Accounting Pronouncements | ||||||
ASU 2016-02, Leases (Topic 842) | This update will supersede the lease requirements in Topic 840, Leases, by requiring lessees to recognize lease assets and lease liabilities classified as operating leases on the balance sheet. | Q1 2020 | See Note 2: Leases for further details related the Company’s adoption of this standard. | |||
ASU 2018-11, Leases (Topic 842), Targeted Improvements and ASC 842 | This update will allow entities to apply the transition provisions of the new standard at the adoption date instead of at the earliest comparative period presented in the financial statements, and will allow entities to continue to apply the legacy guidance in Topic 840, including disclosure requirements, in the comparative period presented in the year the new leases standard is adopted. Entities that elect this option would still adopt the new leases standard using a modified retrospective transition method, but would recognize a cumulative-effect adjustment to the opening balance of retained earnings in the period of adoption, if any, rather than in the earliest period presented. | Q1 2020 | See Note 2: Leases for further details related the Company’s adoption of this standard. | |||
New Accounting Pronouncements yet to be Adopted | ||||||
ASU 2016-13, Financial Instruments–Credit Losses (Topic 326): Measurement of Credit Losses on Financial Instruments. | This standard changes how entities will measure credit losses for most financial assets and certain other instruments that are not measured at fair value through net income. The standard will replace the currently required incurred loss approach with an expected loss model for instruments measured at amortized cost. | Q1 2021 | The standard is effective for interim and annual periods beginning after December 15, 2019, and shall be applied using a modified retrospective approach resulting in a cumulative effect adjustment to retained earnings upon adoption. The Company evaluated the new standard and determined the impact to not be material. Historically, the Company's credit losses on natural gas, oil and NGL sales receivables have been immaterial. | |||
Other accounting standards that have been issued or proposed by the FASB, or other standards-setting bodies, that do not require adoption until a future date are not expected to have a material impact on the financial statements upon adoption.
2. LEASES AND COMMITMENTS
Impact of ASC 842 Adoption
On October 1, 2019, the Company adopted ASU 2016-02, Leases (Topic 842) using the modified retrospective method. This ASU, as subsequently amended by ASU 2018-01, ASU 2018-10, ASU 2018-11 and ASU 2018-20, requires the recognition of lease assets and lease liabilities by lessees for those leases classified as operating leases under the previous guidance. The Company elected the practical expedient under ASU 2018-11, and used October 1, 2019, the beginning of the period of adoption, as its date of initial application. The Company elected the set of practical expedients upon transition which will retain the lease classification for leases and any unamortized initial direct costs that existed prior to the adoption of the standard.
The Company’s existing operating lease right-of-use (“ROU”) assets and operating lease obligations were less than 1% of the Company's total assets as of December 31, 2019, had remaining terms of less than 12 months and were not considered material to the Company; and therefore, the adoption of the standard had no related impact on the Company’s Balance Sheets as of October 1, 2019. Additionally, there was no related impact on the Company’s Statements of Operations, and the standard had no impact on the Company’s debt covenant compliance under existing agreements.
Assessment of Leases
The Company determines if an arrangement is a lease at inception by considering whether (i) explicitly or implicitly identified assets have been deployed in the agreement and (ii) the Company obtains substantially all of the economic benefits from the use of that underlying asset and directs how and for what purpose the asset is used during the term of the agreement. As of September
56
PHX Minerals Inc.
Notes to Financial Statements (continued)
30, 2020, none of the Company’s leases were classified as financing leases. Operating lease liabilities represent the Company’s obligation to make lease payments arising from the lease. The Company signed a new seven-year lease for office space during the quarter ended March 31, 2020, with a commencement date in Oklahoma City, Oklahoma,August 2020. The associated lease liability and ROU asset at September 30, 2020, were $1,048,733 and $690,316, respectively. The Company has a lease incentive asset of $344,000, which is included in Other, net on the Company’s Balance Sheets.
ROU assets represent the Company’s right to use an underlying asset for the lease term, and operating lease liabilities represent the Company’s obligation to make payments arising from the lease. ROU assets are recognized at commencement date and consist of the present value of remaining lease payments over the lease term, initial direct costs and prepaid lease payments less any lease incentives. Operating lease liabilities are recognized at commencement date based on the present value of remaining lease payments over the lease term. The Company uses the implicit rate, when readily determinable, or its incremental borrowing rate based on the information available at commencement date to determine the present value of lease payments.
The lease terms may include periods covered by options to extend the lease when it is reasonably certain that the Company will exercise that option and periods covered by options to terminate the lease when it is not reasonably certain that the Company will exercise that option. Lease expense for lease payments will be recognized on a straight-line basis over the lease term. The Company made an accounting policy election to not recognize leases with terms, including applicable options, of less than twelve months on the Company’s Balance Sheets and recognize those lease payments in the Company’s Statements of Operations on a straight-line basis over the lease term. In the event that the Company’s assumptions and expectations change, it may have to revise its ROU assets and operating lease liabilities.
The following table represents the maturities of the operating lease liabilities as of September 30, 2020:
2021 | $ | 166,744 |
|
2022 |
| 166,744 |
|
2023 |
| 167,475 |
|
2024 |
| 175,520 |
|
2025 |
| 176,251 |
|
Thereafter |
| 353,234 |
|
Total lease payments | $ | 1,205,968 |
|
Less: Imputed interest |
| (157,235 | ) |
Total | $ | 1,048,733 |
|
3. REVENUES
Lease bonus income
The Company generates lease bonus revenue by leasing its mineral interests to exploration and production companies. A lease agreement represents the Company's contract with a third party and generally conveys the rights to any natural gas, oil or NGL discovered, grants the Company a right to a specified royalty interest and requires that drilling and completion operations commence within a specified time period. Control is transferred to the lessee and the Company has satisfied its performance obligation when the lease agreement is executed, such that revenue is recognized when the lease bonus payment is received. The Company accounts for its lease bonuses as conveyances in accordance with the guidance set forth in Accounting Standards Codification (“ASC”) 932, and it recognizes the lease bonus as a cost recovery with any excess above its cost basis in the mineral being treated as a gain. The excess of lease bonus above the mineral basis is shown in the lease bonuses and rental income line item on the Company’s Statements of Operations.
Natural gas and oil derivative contracts
See Note 12 for discussion of the Company’s accounting for derivative contracts.
Revenues from Contracts with Customers
Natural gas, oil and NGL sales
57
PHX Minerals Inc.
Notes to Financial Statements (continued)
Sales of natural gas, oil and NGL are recognized when production is sold to a purchaser and control has transferred. Oil is priced on the delivery date based upon prevailing prices published by purchasers with certain adjustments related to oil quality and physical location. The price the Company receives for natural gas and NGL is tied to a market index, with certain adjustments based on, among other factors, whether a well delivers to a gathering or transmission line, quality and heat content of natural gas, and prevailing supply and demand conditions, so that the price of natural gas fluctuates to remain competitive with other available natural gas supplies. These market indices are determined on a monthly basis. Each unit of commodity is considered a separate performance obligation; however, as consideration is variable, the Company utilizes the variable consideration allocation exception permitted under the termsstandard to allocate the variable consideration to the specific units of an operating lease expiringcommodity to which they relate.
Disaggregation of natural gas, oil and NGL revenues
The following table presents the disaggregation of the Company's natural gas, oil and NGL revenues for the year ended September 30, 2020.
|
| Year Ended September 30, 2020 |
| |||||||||
|
| Royalty Interest |
|
| Working Interest |
|
| Total |
| |||
Natural gas revenue |
| $ | 3,987,660 |
|
| $ | 6,268,094 |
|
| $ | 10,255,754 |
|
Oil revenue |
|
| 5,691,837 |
|
|
| 5,496,533 |
|
|
| 11,188,370 |
|
NGL revenue |
|
| 776,426 |
|
|
| 1,149,453 |
|
|
| 1,925,879 |
|
Natural gas, oil and NGL sales |
| $ | 10,455,923 |
|
| $ | 12,914,080 |
|
| $ | 23,370,003 |
|
Performance obligations
The Company satisfies the performance obligations under its natural gas and oil sales contracts upon delivery of its production and related transfer of title to purchasers. Upon delivery of production, the Company has a right to receive consideration from its purchasers in April 2020. Future minimum rental payments underamounts that correspond with the value of the production transferred.
Allocation of transaction price to remaining performance obligations
Natural gas, oil and NGL sales
As the Company has determined that each unit of product generally represents a separate performance obligation, future volumes are wholly unsatisfied and disclosure of the transaction price allocated to remaining performance obligations is not required. The Company has utilized the practical expedient in ASC 606, which permits the Company to allocate variable consideration to one or more but not all performance obligations in the contract if the terms of the leasevariable payment relate specifically to the Company’s efforts to satisfy that performance obligation and allocating the variable amount to the performance obligation is consistent with the allocation objective under ASC 606. Additionally, the Company will not disclose variable consideration subject to this practical expedient.
Prior-period performance obligations and contract balances
The Company records revenue in the month production is delivered to the purchaser. As a non-operator, the Company has limited control and visibility into the timing of when new wells start producing, and production statements may not be received for 30 to 90 days or more after the date production is delivered. As a result, the Company is required to estimate the amount of production delivered to the purchaser and the price that will be received for the sale of the product. The expected sales volumes and prices for these properties are $206,665, $210,273estimated and $122,659recorded within the natural gas, oil and NGL sales receivables line item on the Company’s Balance Sheets. The difference between the Company's estimates and the actual amounts received for natural gas, oil and NGL sales is recorded in 2018,the quarter that payment is received from the third party. For the years ended September 30, 2020, 2019 and 2020, respectively. Total rent expense incurred by the Company2018, revenue recognized in these reporting periods related to performance obligations satisfied in prior reporting periods for existing wells was $206,366immaterial and considered a change in 2017, $202,083 in 2016 and $198,238 in 2015.estimate.
58
PHX Minerals Inc.
3.Notes to Financial Statements (continued)
4. INCOME TAXES
The Company’s provision (benefit) for income taxes is detailed as follows:
|
| 2017 |
|
| 2016 |
|
| 2015 |
|
| 2020 |
|
| 2019 |
|
| 2018 |
| ||||||
Current: |
|
|
|
|
|
|
|
|
|
|
|
|
|
|
|
|
|
|
|
|
|
|
|
|
Federal |
| $ | 314,000 |
|
| $ | 2,166,000 |
|
| $ | 2,053,000 |
|
| $ | (3,642,000 | ) |
| $ | (1,388,000 | ) |
| $ | 204,000 |
|
State |
|
| - |
|
|
| 83,000 |
|
|
| 111,000 |
|
|
| - |
|
|
| 19,000 |
|
|
| 20,000 |
|
|
|
| 314,000 |
|
|
| 2,249,000 |
|
|
| 2,164,000 |
|
|
| (3,642,000 | ) |
|
| (1,369,000 | ) |
|
| 224,000 |
|
Deferred: |
|
|
|
|
|
|
|
|
|
|
|
|
|
|
|
|
|
|
|
|
|
|
|
|
Federal |
|
| 390,000 |
|
|
| (8,597,000 | ) |
|
| 2,033,000 |
|
|
| (3,611,000 | ) |
|
| (9,763,000 | ) |
|
| (13,240,000 | ) |
State |
|
| (15,000 | ) |
|
| (1,363,000 | ) |
|
| 639,000 |
|
|
| (1,036,000 | ) |
|
| (2,349,000 | ) |
|
| 277,000 |
|
|
|
| 375,000 |
|
|
| (9,960,000 | ) |
|
| 2,672,000 |
|
|
| (4,647,000 | ) |
|
| (12,112,000 | ) |
|
| (12,963,000 | ) |
|
| $ | 689,000 |
|
| $ | (7,711,000 | ) |
| $ | 4,836,000 |
|
| $ | (8,289,000 | ) |
| $ | (13,481,000 | ) |
| $ | (12,739,000 | ) |
The difference between the provision (benefit) for income taxes and the amount which would result from the application of the federal statutory rate to income before provision (benefit) for income taxes is analyzed below for the years ended September 30:
|
| 2017 |
|
| 2016 |
|
| 2015 |
| |||||||||||||||
|
|
|
|
|
|
|
|
|
|
|
|
|
| 2020 |
|
| 2019 |
|
| 2018 |
| |||
Provision (benefit) for income taxes at statutory rate |
| $ | 1,477,327 |
|
| $ | (6,299,259 | ) |
| $ | 4,955,069 |
|
| $ | (6,765,705 | ) |
| $ | (11,387,447 | ) |
| $ | 465,253 |
|
Percentage depletion |
|
| (570,801 | ) |
|
| (395,649 | ) |
|
| (530,783 | ) |
|
| (258,300 | ) |
|
| (431,340 | ) |
|
| (577,780 | ) |
State income taxes, net of federal provision (benefit) |
|
| 3,900 |
|
|
| (683,800 | ) |
|
| 487,500 |
|
|
| (939,310 | ) |
|
| (1,986,850 | ) |
|
| 36,980 |
|
Effect of graduated rates |
|
| 85,644 |
|
|
| (86,745 | ) |
|
| (62,922 | ) | ||||||||||||
Effect of NOL Carryback Rate |
|
| (610,803 | ) |
|
| - |
|
|
| - |
| ||||||||||||
State NOL Valuation Allowance |
|
| 96,000 |
|
|
| - |
|
|
| - |
| ||||||||||||
Restricted stock tax benefit |
|
| (238,000 | ) |
|
| - |
|
|
| - |
|
|
| 58,000 |
|
|
| 185,000 |
|
|
| (69,000 | ) |
Deferred directors compensation benefit |
|
| (79,000 | ) |
|
| - |
|
|
| - |
| ||||||||||||
Deferred directors’ compensation benefit |
|
| 79,000 |
|
|
| (38,000 | ) |
|
| (134,000 | ) | ||||||||||||
Law change (a) |
|
| - |
|
|
| - |
|
|
| (12,464,000 | ) | ||||||||||||
Other |
|
| 9,930 |
|
|
| (245,547 | ) |
|
| (12,864 | ) |
|
| 52,118 |
|
|
| 177,637 |
|
|
| 3,547 |
|
|
| $ | 689,000 |
|
| $ | (7,711,000 | ) |
| $ | 4,836,000 |
|
| $ | (8,289,000 | ) |
| $ | (13,481,000 | ) |
| $ | (12,739,000 | ) |
(a) | This is the tax effect of the Tax Cuts and Jobs Act (enacted in December 2017) on our deferred tax liabilities. This Act reduced the U.S. federal corporate tax rate from 35% to 21%. |
(77)59
Panhandle Oil and GasPHX Minerals Inc.
Notes to Financial Statements (continued)
Deferred tax assets and liabilities, resulting from differences between the financial statement carrying amounts and the tax basis of assets and liabilities, consist of the following at September 30:
|
| 2017 |
|
| 2016 |
|
| 2020 |
|
| 2019 |
| ||||
Deferred tax liabilities: |
|
|
|
|
|
|
|
|
|
|
|
|
|
|
|
|
Financial basis in excess of tax basis, principally intangible drilling costs capitalized for financial purposes and expensed for tax purposes |
| $ | 38,185,387 |
|
| $ | 33,656,415 |
|
| $ | 3,880,307 |
|
| $ | 8,885,776 |
|
Derivative contracts |
|
| 200,786 |
|
|
| - |
|
|
| - |
|
|
| 619,392 |
|
|
|
| 38,386,173 |
|
|
| 33,656,415 |
|
|
| 3,880,307 |
|
|
| 9,505,168 |
|
Deferred tax assets: |
|
|
|
|
|
|
|
|
|
|
|
|
|
|
|
|
State net operating loss carry forwards |
|
| 655,741 |
|
|
| 259,981 |
| ||||||||
State net operating loss carry forwards, net of valuation allowance |
|
| 391,193 |
|
|
| 431,977 |
| ||||||||
Federal net operating loss carry forwards |
|
| 369,523 |
|
|
| - |
| ||||||||
Statutory depletion carryover |
|
| 346,414 |
|
|
| 85,680 |
| ||||||||
AMT credit carry forwards |
|
| 3,499,320 |
|
|
| - |
|
|
| - |
|
|
| 1,387,042 |
|
Asset retirement obligations |
|
| 499,708 |
|
|
| 459,810 |
| ||||||||
Deferred directors' compensation |
|
| 1,295,333 |
|
|
| 1,273,279 |
|
|
| 436,225 |
|
|
| 602,394 |
|
Restricted stock expense |
|
| 411,019 |
|
|
| 494,776 |
|
|
| 220,301 |
|
|
| 119,697 |
|
Derivative contracts |
|
| - |
|
|
| 166,597 |
|
|
| 176,963 |
|
|
| - |
|
Statutory depletion carry forwards |
|
| 634,405 |
|
|
| - |
| ||||||||
Business interest limitation |
|
| - |
|
|
| 358,110 |
| ||||||||
Other |
|
| 839,348 |
|
|
| 785,775 |
|
|
| 110,973 |
|
|
| 84,451 |
|
|
|
| 7,335,166 |
|
|
| 2,980,408 |
|
|
| 2,551,300 |
|
|
| 3,529,161 |
|
Net deferred tax liabilities |
| $ | 31,051,007 |
|
| $ | 30,676,007 |
|
| $ | 1,329,007 |
|
| $ | 5,976,007 |
|
AtIncluded in state net operating loss carry forwards at September 30, 2017,2020, the Company had a deferred tax asset of $595,526$350,543 related to Oklahoma state income tax net operating loss (OK NOL) carry forwards expiring from 2029 toin 2037. There is no0 valuation allowance for the OK NOL’s,NOLs, as management believes they will be utilized before they expire. The AMTCompany had a deferred tax asset of $95,611 related to Arkansas state income tax net operating loss (AR NOL) carry forwards, which begin to expire in 2022. The Company has a full valuation allowance for the AR NOLs, as it is more likely than not that these will not be utilized before expiration. There is 0 valuation allowance for the federal NOLs, nor do not have an expiration date.they expire.
The federal Coronavirus Aid, Relief, and Economic Security Act (“CARES Act”) was enacted on March 27, 2020. The CARES Act provides relief to corporate taxpayers by permitting a five-year carryback of 2018-2020 Net Operating Losses (“NOLs”), removing the 80% limitation on the carryback of those NOLs, increasing the Section 163(j) 30% limitation on interest expense deductibility to 50% of adjusted taxable income for 2019 and 2020, and accelerates refunds for minimum tax credit carryforwards, along with a few other provisions. On July 28, 2020, final regulations were issued under Section 163(j) which modified the calculation under the previous proposed regulations of adjusted taxable income for purposes of the 50% limitation on interest expense. Under the final regulations, depreciation, amortization, and depletion capitalizable under Section 263A is now added back to tentative taxable income. This change allows all interest expense to be deductible for 2020 and reduces the associated deferred tax asset to 0. During the quarter ended June 30, 2020, the Company filed for a tax refund associated with the AMT credits totaling $1.4 million, which was accelerated due to the CARES Act. Additionally, the Company has a $2.2 million receivable associated with the carryback of the 2020 federal net operating loss.
4. LONG-TERM
5. DEBT
The Company has a $200,000,000 credit facility with a group of banks headed by Bank of Oklahoma (BOK) with a current borrowing base of $80,000,000$31,000,000 as of September 30, 2020, and a maturity date of November 30, 2022.2022 (as amended, the “Credit Facility”). The credit facilityCredit Facility is subject to aat least semi-annual borrowing base determination, wherein BOK applies their commodity pricing forecast to the Company’s reserve forecast and determines a borrowing base. The facilityCredit Facility is secured by certainall of the Company’s properties with a net book value of $152,025,984 at September 30, 2017.producing gas and oil properties. The interest rate is based on BOK prime plus from 0.375%1.00% to 1.250%1.75%, or 30 day30-day LIBOR plus from 1.875%2.50% to 2.750%3.25%. The election of BOK prime or LIBOR is at the Company’s discretion. The interest rate spread from BOK prime or LIBOR will be charged based on the ratio of the loan balance to the borrowing base. The interest rate spread from LIBOR or the prime rate increases as a larger percent of the borrowing base is advanced. At September 30, 2017,2020, the effective interest rate was 3.72%4.25%.
60
PHX Minerals Inc.
Notes to Financial Statements (continued)
The Company’s debt is recorded at the carrying amount on its balance sheet.Balance Sheets. The carrying amount of the Company’s revolving credit facilityCredit Facility approximates fair value because the interest rates are reflective of market rates. Debt issuance costs associated with the Credit Facility are presented in Other, net on the Company’s Balance Sheets. Total debt issuance cost net of amortization as of September 30, 2020, was $246,724. The debt issuance cost is amortized over the life of the credit facility.
(78)
Panhandle Oil and Gas Inc.
Notes to Financial Statements (continued)
Determinations of the borrowing base are made semi-annually (usually June and December) or whenever the banks, in their sole discretion, believe that there has been a material change in the value of the Company’s oil and natural gas and oil properties. In October 2017, duringOn June 24, 2020, the renegotiation of our credit facility,Company entered into the Seventh Amendment to its Credit Facility. The amendment reduced the borrowing base was redeterminedfrom $45,000,000 to $32,000,000 and included a Quarterly Commitment Reduction, whereby the borrowing base is reduced by the banks$1,000,000 each April 15, July 15, October 15 and left unchanged at$80,000,000.January 15, commencing on July 15, 2020. The loan agreementnext redetermination occurred in December 2020. See Note 15: Subsequent Events for further discussion. The Credit Facility contains customary covenants which, among other things, require periodic financial and reserve reporting and place certain limits on the Company’s incurrence of indebtedness, liens, payment of dividends and acquisitions of treasury stock. In addition, the Company is required to maintain certain financial ratios, a current ratio (as defined byin the bank agreement – current assets includes availability under outstanding credit facility)Credit Facility) of no less than 1.0 to 1.0 and a funded debt to EBITDA (trailing 12 months as(as defined by bank agreement – traditional EBITDA within the unrealized gain or loss on derivative contracts also removed from earnings)Credit Facility) of no more than 4.0 to 1.0.1.0 based on the trailing twelve months. At September 30, 2017,2020, the Company was in compliance with the covenants of the loan agreementCredit Facility, had $28,750,000 outstanding, of which $1,750,000 is classified as short-term debt due to the Quarterly Commitment Reduction, and had $27,778,000$2,250,000 of borrowing base availability under its outstanding credit facility.the Credit Facility.
5. SHAREHOLDERS’6. STOCKHOLDERS’ EQUITY
Upon approval by the shareholdersstockholders of the Company’s 2010 Restricted Stock Plan in March 2010, as amended in May 2018, the Boardboard of directors approved purchase ofto continue to allow management to repurchase up to $1.5 million of the Company’s Common Stock, from timecommon stock at their discretion. The repurchase of an additional $1.5 million of the Company’s common stock continues to time,be authorized and approved effective when the previous amount is utilized. The Board added language to clarify that this is intended to be an evergreen provision. The number of shares allowed to be purchased by the Company under the repurchase program is no longer capped at an amount equal to the aggregate number of shares of Common Stockcommon stock (i) awarded pursuant to the Company’s Amended 2010 Restricted Stock Plan, (ii) contributed by the Company to its ESOP, and (iii) credited to the accounts of directors pursuant to the Deferred Compensation Plan for Non-Employee Directors. Effective May 2014,For the board of directors approved for management to make these purchases of the Company’s Common Stock at their discretion. The Board’s approval included an initial authorization to purchase up to $1.5 million of Common Stock, with a provision for subsequent authorizations without specific action by the Board. As the amount of Common Stock purchased under any authorization reaches $1.5 million, another $1.5 million is automatically authorized for Common Stock purchases unless the Board determines otherwise. Pursuant to these resolutions adopted by the Board, the purchase of additional $1.5 million increments of the Company’s Common Stock became authorized and approved effective March 2011, March 2012, and June 2013. As ofyear ended September 30, 2017, $5,599,6432020, $7,635 had been spent under the current program to purchase 370,950632 shares. The shares are held in treasury and are accounted for using the cost method.
(79)
Panhandle Oil and Gas Inc.
Notes to Financial Statements (continued)
6.7. EARNINGS (LOSS) PER SHARE
The following table sets forth the computation of earnings (loss) per share.
|
| Year ended September 30, |
|
| Year Ended September 30, |
| |||||||||||||||||||
|
| 2017 |
|
| 2016 |
|
| 2015 |
|
| 2020 |
|
| 2019 |
|
| 2018 |
| |||||||
Numerator for basic and diluted earnings (loss) per share: |
|
|
|
|
|
|
|
|
|
|
|
|
|
|
|
|
|
|
|
|
|
|
|
| |
Net income (loss) |
| $ | 3,531,933 |
|
| $ | (10,286,884 | ) |
| $ | 9,321,341 |
|
| $ | (23,952,037 | ) |
| $ | (40,744,938 | ) |
| $ | 14,635,669 |
| |
Denominator for basic and diluted earnings per share: |
|
|
|
|
|
|
|
|
|
|
|
|
|
|
|
|
|
|
|
|
|
|
|
| |
Weighted average shares (including for 2017, 2016 and 2015, unissued, vested directors' shares of 253,603, 263,057 and 246,442, respectively) |
|
| 16,900,185 |
|
|
| 16,840,856 |
|
|
| 16,768,904 |
| |||||||||||||
Weighted average shares (including for 2020, 2019 and 2018, unissued, vested directors' shares of 154,142, 168,586 and 205,736, respectively) |
|
| 17,010,934 |
|
|
| 16,743,746 |
|
|
| 16,952,664 |
| |||||||||||||
7.8. EMPLOYEE STOCK OWNERSHIP PLAN
The Company’s ESOP was established in 1984 and is a tax qualified, defined contribution plan that serves as the sole retirement plan for all its employees to which the Company makes contributions. Company contributions are made at the discretion of the Board and, to date, all contributions have been made in shares of Company Common Stock. The Company contributions are allocated to all ESOP participants in proportion to their compensation for the plan year, and 100% vesting occurs after three years of service. Any shares that do not vest are treated as forfeitures and are distributed among other vested employees. For contributions of Common Stock, the Company records as expense the fair market value of the stock contributed. Compensation expense is equal to the contributions for each year. The 252,542 shares of the Company’s Common Stock held by the plan as of September 30, 2017,2020, are allocated to
61
PHX Minerals Inc.
Notes to Financial Statements (continued)
individual participant accounts, are included in the weighted average shares outstanding for purposes of earnings-per-share computations and receive dividends.
Contributions to the plan consisted of:
Year |
| Shares |
|
| Amount |
| ||
2017 |
|
| 13,125 |
|
| $ | 312,380 |
|
2016 |
|
| 11,418 |
|
| $ | 200,158 |
|
2015 |
|
| 11,455 |
|
| $ | 185,113 |
|
Year |
| Shares |
|
| Amount |
| ||
2020 |
|
| 72,101 |
|
| $ | 103,104 |
|
2019 |
|
| 26,629 |
|
| $ | 372,274 |
|
2018 |
|
| 20,632 |
|
| $ | 382,174 |
|
8.9. DEFERRED COMPENSATION PLAN FOR DIRECTORS
Annually, independent directors may elect to be included in the Panhandle Oil and Gas Inc.Company’s Deferred Directors’ Compensation Plan for Non-Employee Directors (the “Plan”). The Plan provides that each independent director may individually elect to be credited with future unissued shares of Company Common Stock rather than cash for all or a portion of the annual retainers, Board meeting fees and committee meeting fees, and may elect to receive shares, if and when issued, over annual time periods up to ten years. These unissued shares are recorded to each director’s deferred compensation account at the closing market price of the shares (i) on the dates of the Board and committee meetings, and (ii) on the payment dates of the annual retainers.
(80)
Panhandle Oil and Gas Inc.
Notes to Financial Statements (continued)
at each quarter end. Only upon a director’s retirement, termination, death or a change-in-control of the Company will the shares recorded for such director under the Plan be issued to the director. The promise to issue such shares in the future is an unsecured obligation of the Company. As of September 30, 2017,2020, there were 261,846177,678 shares (272,564(179,226 shares at September 30, 2016)2019) recorded under the Plan. The deferred balance outstanding at September 30, 2017,2020, under the Plan was $3,459,909$1,874,007 ($3,403,2132,555,781 at September 30, 2016)2019). Expenses totaling $358,658, $329,465$228,408, $272,491 and $302,353$301,715 were charged to the Company’s results of operations for the years ended September 30, 2017, 20162020, 2019 and 2015,2018, respectively, and are included in general and administrative expense in the accompanying StatementStatements of Operations.
9.10. RESTRICTED STOCK PLAN
In March 2010, shareholdersstockholders approved the Panhandle Oil and Gas Inc.Company’s 2010 Restricted Stock Plan (“2010 Stock Plan”), which made available 200,000 shares of Common Stock to provide a long-term component to the Company’s total compensation package for its officers and to further align the interest of its officers with those of its shareholders.stockholders. In March 2014, shareholdersstockholders approved an amendment to increase the number of shares of common stock reserved for issuance under the 2010 Stock Plan from 200,000 shares to 500,000 shares and to allow the grant of shares of restricted stock to our directors. In March 2020, shareholders approved an amendment to increase the number of shares of common stock reserved for issuance under the 2010 Stock Plan to 750,000 shares. The 2010 Stock Plan, as amended, is designed to provide as much flexibility as possible for future grants of restricted stock so the Company can respond as necessary to provide competitive compensation in order to retain, attract and motivate officers of the Company and to align their interests with those of the Company’s shareholders.stockholders.
In June 2010, the Company began awarding shares of the Company’s Common Stock as restricted stock (non-performance based)(time-based) to certain officers. The restricted stock vests at the end of the vesting period and contains nonforfeitable rights to receive dividends and voting rights during the vesting period. The fair value of the shares was based on the closing price of the shares on their award date and will be recognized as compensation expense ratably over the vesting period. Upon vesting, shares are expected to be issued out of shares held in treasury.
In December 2010, the Company also began awarding shares of the Company’s Common Stock, subject to certain share price performance standards (performance based)(market-based), as restricted stock to certain officers. Vesting of these shares is based on the performance of the market price of the Common Stock over the vesting period. The fair value of the performance shares was estimated on the grant date using a Monte Carlo valuation model that factors in information, including the expected price volatility, risk-free interest rate and the probable outcome of the market condition, over the expected life of the performance shares. Compensation expense for the performance shares is a fixed amount determined at the grant date and is recognized over the vesting period regardless of whether performance shares are awarded at the end of the vesting period. Should the sharesawards vest, they are expected to be issued out of shares held in treasury.
PHX Minerals Inc.
Notes to Financial Statements (continued)
In May 2014, the Company also began awarding shares of the Company’s Common Stock as restricted stock (non-performance based)(time-based) to its non-employee directors. The restricted stock vests quarterlyannually during the calendar year of the award and contains nonforfeitable rights to receive dividends and voting rights during the vesting period.year. The fair value of the shares was based on the closing price of the shares on their award date and will be recognized as
(81)
Panhandle Oil and Gas Inc.
Notes to Financial Statements (continued)
compensation expense ratably over the vesting period. Upon vesting, shares are expected to be issued out of shares held in treasury.
Effective in May 2014, the Board adopted stock repurchase resolutions to allow management, at its discretion, to purchase the Company’s common stock as treasury shares up to an amount equal to the aggregate number of shares of common stock awarded pursuant to the Amended 2010 Restricted Stock Plan, contributed by the Company to its ESOP and credited to the accounts of directors pursuant to the Deferred Compensation Plan for Non-Employee Directors.
Effective in May 2018, the Board of directors approved an amendment to the Company’s existing stock repurchase program (the “Repurchase Program”). As amended, the Repurchase Program continues to allow the Company to repurchase up to $1.5 million of the Company’s common stock at management’s discretion. The Board added language to clarify that this is intended to be an evergreen program as the repurchase of an additional $1.5 million of the Company’s common stock is authorized and approved whenever the previous amount is utilized. In addition, the number of shares allowed to be purchased by the Company under the Repurchase Program is no longer capped at an amount equal to the aggregate number of shares of common stock (i) awarded pursuant to the Amended 2010 Stock Plan, (ii) contributed by the Company to its ESOP, and (iii) credited to the accounts of directors pursuant to the Deferred Compensation Plan for Non-Employee Directors.
On December 11, 2019, the Company awarded 10,038 time-based shares and 15,058 market-based shares of the Company’s common stock as restricted stock to certain officers. The restricted stock vests at the end of a three-year period and contains non-forfeitable rights to receive dividends and voting rights during the vesting period. The market-based shares that do not meet certain market performance criteria at a certain date are forfeited. The time-based and market-based shares had fair values on their award date of $122,062 and $160,401, respectively. The fair values for the time-based and the market-based awards will be recognized as compensation expense ratably over the vesting period. The fair value of the market-based shares on their award date is calculated by simulating the Company’s stock prices as compared to the S&P Oil & Gas Exploration & Production ETF (XOP) prices utilizing a Monte Carlo model covering the market performance period (December 11, 2019, through December 11, 2022).
On January 2, 2020, the Company awarded 22,300 time-based shares of the Company’s common stock as restricted stock to its non-employee directors. The restricted stock contains non-forfeitable rights to receive dividends and to vote the shares during the vesting period. The restricted stock vests on December 31, 2020. These time-based shares had a fair value on their award date of $246,640.
On January 16, 2020, upon naming a new Chief Executive Officer, the Company awarded 53,476 time-based shares and 21,988 market-based shares of the Company’s common stock as restricted stock, with the same vesting criteria as the December 11, 2019 awards discussed above. The time-based and market-based shares had fair values on their award date of $500,000 and $179,334, respectively. An additional 37,045 of performance-based shares were awarded to the Company’s officers at that time. Based on the performance criteria linked to return on capital employed it is probable none of these awards will vest, and they have no value as of September 30, 2020.
On March 9, 2020, upon naming a new Chief Financial Officer, the Company awarded 16,340 time-based shares, 2,534 market-based shares and 2,534 performance-based shares of the Company’s common stock as restricted stock, with the same vesting criteria as the December 11, 2019, and January 16, 2020, awards discussed above. The time-based and market-based shares had fair values on their award date of $72,550 and $9,814, respectively. Based on the performance criteria linked to return on capital employed it is probable none of the performance-based share awards will vest, and they have no value as of September 30, 2020.
Compensation expense for the restricted stock awards is recognized in G&A. Forfeitures of awards are recognized when they occur. The dilutive impact of all restricted stock plans is immaterial for all periods presented.
63
PHX Minerals Inc.
Notes to Financial Statements (continued)
The following table summarizes the Company’s pre-tax compensation expense for the years ended September 30, 2017, 20162020, 2019 and 2015,2018, related to the Company’s performance basedmarket-based, time-based and non-performance basedperformance-based restricted stock.stock:
|
| Year Ended September 30, |
| |||||||||
|
| 2017 |
|
| 2016 |
|
| 2015 |
| |||
Performance based, restricted stock |
| $ | 233,122 |
|
| $ | 390,655 |
|
| $ | 480,159 |
|
Non-performance based, restricted stock |
|
| 364,818 |
|
|
| 390,824 |
|
|
| 414,968 |
|
Total compensation expense |
| $ | 597,940 |
|
| $ | 781,479 |
|
| $ | 895,127 |
|
|
| Year Ended September 30, |
| |||||||||
|
| 2020 |
|
| 2019 |
|
| 2018 |
| |||
Market-based, restricted stock |
| $ | 295,397 |
|
| $ | 367,091 |
|
| $ | 276,272 |
|
Time-based, restricted stock |
|
| 448,500 |
|
|
| 404,706 |
|
|
| 379,142 |
|
Performance-based, restricted stock |
|
| - |
|
|
| - |
|
|
| - |
|
Total compensation expense |
| $ | 743,897 |
|
| $ | 771,797 |
|
| $ | 655,414 |
|
A summary of the Company’s unrecognized compensation cost for its unvested performance basedmarket-based, time-based and non-performance basedperformance-based restricted stock and the weighted-average periods over which the compensation cost is expected to be recognized are shown in the following table.table:
|
| Unrecognized Compensation Cost |
|
| Weighted Average Period (in years) |
| ||
Performance based, restricted stock |
| $ | 267,618 |
|
|
| 1.82 |
|
Non-performance based, restricted stock |
|
| 240,126 |
|
|
| 1.44 |
|
Total |
| $ | 507,744 |
|
|
|
|
|
|
| Unrecognized Compensation Cost |
|
| Weighted Average Period (in years) |
| ||
Market-based, restricted stock |
| $ | 67,653 |
|
|
| 1.83 |
|
Time-based, restricted stock |
|
| 562,829 |
|
|
| 1.97 |
|
Performance-based, restricted stock |
|
| - |
|
|
|
|
|
Total |
| $ | 630,482 |
|
|
|
|
|
Upon vesting, shares are expected to be issued out of shares held in treasury.
(82)
Panhandle Oil and Gas Inc.
Notes to Financial Statements (continued)
A summary of the status of, and changes in, unvested shares of restricted stock awards and changes is presented below:
|
| Performance Based Unvested Restricted Shares |
|
| Weighted Average Grant-Date Fair Value |
|
| Non- Performance Based Unvested Restricted Shares |
|
| Weighted Average Grant-Date Fair Value |
|
| Market-Based Unvested Restricted Awards |
|
| Weighted Average Grant-Date Fair Value |
|
| Time-Based Unvested Restricted Awards |
|
| Weighted Average Grant-Date Fair Value |
|
| Performance-Based Unvested Restricted Awards |
|
| Weighted Average Grant-Date Fair Value |
| ||||||||||
Unvested shares as of September 30, 2014 |
|
| 112,184 |
|
| $ | 8.42 |
|
|
| 56,353 |
|
| $ | 15.52 |
| ||||||||||||||||||||||||
Unvested shares as of September 30, 2017 |
|
| 99,090 |
|
| $ | 11.33 |
|
|
| 24,997 |
|
| $ | 19.41 |
|
|
| - |
|
| $ | - |
| ||||||||||||||||
|
|
|
|
|
|
|
|
|
|
|
|
|
|
|
|
|
|
|
|
|
|
|
|
|
|
|
|
|
|
|
|
|
|
| - |
|
|
| - |
|
Granted |
|
| 35,485 |
|
|
| 12.18 |
|
|
| 22,028 |
|
|
| 19.25 |
|
|
| 29,099 |
|
|
| 11.34 |
|
|
| 19,918 |
|
|
| 20.77 |
|
|
| - |
|
|
| - |
|
Vested |
|
| (10,209 | ) |
|
| 9.73 |
|
|
| (38,415 | ) |
|
| 16.58 |
|
|
| (35,485 | ) |
|
| 12.18 |
|
|
| (16,248 | ) |
|
| 19.34 |
|
|
| - |
|
|
| - |
|
Forfeited |
|
| (25,209 | ) |
|
| 9.73 |
|
|
| - |
|
|
| - |
|
|
| - |
|
|
| - |
|
|
| - |
|
|
| - |
|
|
| - |
|
|
| - |
|
Unvested shares as of September 30, 2015 |
|
| 112,251 |
|
| $ | 9.20 |
|
|
| 39,966 |
|
| $ | 16.56 |
| ||||||||||||||||||||||||
Unvested shares as of September 30, 2018 |
|
| 92,704 |
|
| $ | 11.00 |
|
|
| 28,667 |
|
| $ | 20.40 |
|
|
| - |
|
| $ | - |
| ||||||||||||||||
|
|
|
|
|
|
|
|
|
|
|
|
|
|
|
|
|
|
|
|
|
|
|
|
|
|
|
|
|
|
|
|
|
|
|
|
|
|
|
|
|
Granted |
|
| 40,446 |
|
|
| 9.32 |
|
|
| 26,478 |
|
|
| 16.37 |
|
|
| 43,287 |
|
|
| 8.24 |
|
|
| 27,978 |
|
|
| 15.61 |
|
|
| - |
|
|
| - |
|
Vested |
|
| (10,197 | ) |
|
| 7.59 |
|
|
| (23,433 | ) |
|
| 16.91 |
|
|
| - |
|
|
| - |
|
|
| (24,785 | ) |
|
| 18.30 |
|
|
| - |
|
|
| - |
|
Forfeited |
|
| (28,083 | ) |
|
| 7.59 |
|
|
| - |
|
|
| - |
|
|
| (89,321 | ) |
|
| 10.08 |
|
|
| (13,153 | ) |
|
| 18.23 |
|
|
| - |
|
|
| - |
|
Unvested shares as of September 30, 2016 |
|
| 114,417 |
|
| $ | 9.78 |
|
|
| 43,011 |
|
| $ | 16.25 |
| ||||||||||||||||||||||||
Unvested shares as of September 30, 2019 |
|
| 46,670 |
|
| $ | 10.21 |
|
|
| 18,707 |
|
| $ | 17.54 |
|
|
| - |
|
| $ | - |
| ||||||||||||||||
|
|
|
|
|
|
|
|
|
|
|
|
|
|
|
|
|
|
|
|
|
|
|
|
|
|
|
|
|
|
|
|
|
|
|
|
|
|
|
|
|
Granted |
|
| 20,531 |
|
|
| 14.27 |
|
|
| 16,426 |
|
|
| 24.41 |
|
|
| 39,579 |
|
|
| 8.83 |
|
|
| 102,154 |
|
|
| 9.21 |
|
|
| 39,579 |
|
|
| - |
|
Vested |
|
| (34,672 | ) |
|
| 8.07 |
|
|
| (28,449 | ) |
|
| 18.02 |
|
|
| - |
|
|
| - |
|
|
| (20,410 | ) |
|
| 13.35 |
|
|
| - |
|
|
| - |
|
Forfeited |
|
| (1,186 | ) |
|
| 8.07 |
|
|
| (5,991 | ) |
|
| 17.04 |
|
|
| (24,779 | ) |
|
| 11.34 |
|
|
| (9,929 | ) |
|
| 13.93 |
|
|
| (4,765 | ) |
|
| - |
|
Unvested shares as of September 30, 2017 |
|
| 99,090 |
|
| $ | 11.33 |
|
|
| 24,997 |
|
| $ | 19.41 |
| ||||||||||||||||||||||||
Unvested shares as of September 30, 2020 |
|
| 61,470 |
|
| $ | 8.87 |
|
|
| 90,522 |
|
| $ | 9.49 |
|
|
| 34,814 |
|
| $ | - |
| ||||||||||||||||
The intrinsic value of the vested shares in 20172020 was $1,466,415.$85,306.
64
PHX Minerals Inc.
Notes to Financial Statements (continued)
11. PROPERTIES AND EQUIPMENT
Impairment
During the quarter ended March 31, 2020, impairment of $19.3 million and $7.3 million was recorded on our Fayetteville Shale and Eagle Ford fields, respectively. The remaining $2.7 million of impairment was taken on other producing assets. The discounted cash flows of the properties were prepared using NYMEX strip pricing as of March 31, 2020, using a discount rate of 10% for proved developed and assigning 0 value to undeveloped locations. The Fayetteville Shale assets are dry-gas assets of which the Company acquired a portion in 2011. Low natural gas prices at March 31, 2020, were the primary reason for impairment in this field. The Company recognized an impairment related to the Eagle Ford at September 30, 2019, discussed below. The further impairment of the Eagle Ford assets at March 31, 2020, was due to the decline in commodity prices over fiscal 2020.
At the end of 2019, impairment of $76.6 million was recorded on our Eagle Ford assets. The remaining $0.3 million of impairment was taken on other assets. The impairment on the Eagle Ford assets was caused by the Company making the strategic decision to cease participating with a working interest on its mineral and leasehold acreage going forward and therefore removing all working interest PUDs from the Company’s reserve reports. The removal of the PUDs caused the Eagle Ford assets to fail the step one test for impairment, as its undiscounted cash flows were not high enough to cover the book basis of the assets. These assets were written down to their fair market value as required by GAAP. The Company determined the fair value based on discounted cash flows of the properties as well as active market bids received from interested potential buyers. The discounted cash flows of the properties were prepared using NYMEX strip pricing as of year-end, using a discount rate of 10% for proved developed and assigning 0 value to undeveloped locations. Market bids received from interested potential buyers corroborated the fair value of the discounted cash flows as of year-end. The fair value was determined to be $9.1 million based on the discounted cash flows and market quotes. The Company decided not to sell the assets after the marketing process was complete, as we believed that the market conditions were not ideal for selling at that time and that the highest and best use of the assets was to continue to own and produce out the Eagle Ford properties.
A further reduction in natural gas, oil and NGL prices or a decline in reserve volumes may lead to additional impairment in future periods that may be material to the Company.
Divestitures
During the 2020 fiscal year, the Company sold 530 net mineral acres in Eddy County, New Mexico, for $3,376,049 and recorded a net gain on sales of $3,272,499. The total net book value that was removed from the Balance Sheets due to this sale was approximately $104,000. The Company utilized a like-kind exchange under Internal Revenue Code Section 1031 to defer income tax on all of the gain by offsetting it with the STACK/SCOOP mineral acreage acquisition that was purchased during the quarter using qualified exchange accommodation. The Company also sold 5,925 open and non-producing net mineral acres in Northwest Oklahoma for $769,745 and recorded a net gain on sales of $717,640. The total net book value that was removed from the Balance Sheets due to this sale was approximately $52,000. On the Statements of Operations, the net gain is reflected in the Gain on asset sales line item.
During the 2019 fiscal year, the Company sold 112 non-core wells and 890 net mineral and non-participating royalty interest acres for $19,515,735 and recorded a net gain on sales of $18,730,197. The total net book value that was removed from the Balance Sheets due to these sales was approximately $786,000. On the Statements of Operations, the net gain is reflected in the Gain on asset sales line item with a balance of $18,973,426 with an offset to the Loss on asset sales line item in the amount of $243,228.
Acquisitions
During the 2020 fiscal year, the Company closed on the purchase of 700 net mineral acres in Kingfisher, Canadian and Garvin Counties, Oklahoma, for a purchase price of $9,293,384 (after customary closing adjustments). These mineral purchases were accounted for as asset acquisitions.
During the 2019 fiscal year, the Company acquired mineral acreage in the cores of the Bakken in North Dakota and the STACK and SCOOP plays in Oklahoma. The Company acquired a total of 790 net mineral acres for $5,727,257 or an average of approximately $7,200 per net mineral acre. These mineral purchases were accounted for as asset acquisitions.
65
PHX Minerals Inc.
Notes to Financial Statements (continued)
Asset Retirement Obligations
The following table shows the activity for the years ended September 30, 2020 and 2019, relating to the Company’s asset retirement obligations:
|
| 2020 |
|
| 2019 |
| ||
Asset retirement obligations as of beginning of the year |
| $ | 2,835,781 |
|
| $ | 2,809,378 |
|
Wells acquired or drilled |
|
| 4 |
|
|
| 27,783 |
|
Wells sold or plugged |
|
| (68,668 | ) |
|
| (134,090 | ) |
Accretion of discount |
|
| 130,405 |
|
|
| 132,710 |
|
Asset retirement obligations as of end of the year |
| $ | 2,897,522 |
|
| $ | 2,835,781 |
|
As a non-operator, the Company does not control the plugging of wells in which it has a working interest and is not involved in the negotiation of the terms of the plugging contracts. This estimate relies on information gathered from outside sources as well as relevant information received directly from operators.
12. DERIVATIVES
The Company has entered into fixed swap contracts and costless collar contracts. These instruments are intended to reduce the Company’s exposure to short-term fluctuations in the price of natural gas and oil. Collar contracts set a fixed floor price and a fixed ceiling price and provide payments to the Company if the index price falls below the floor or require payments by the Company if the index price rises above the ceiling. Fixed swap contracts set a fixed price and provide payments to the Company if the index price is below the fixed price or require payments by the Company if the index price is above the fixed price. These contracts cover only a portion of the Company’s natural gas and oil production, provide only partial price protection against declines in natural gas and oil prices and may limit the benefit of future increases in prices. All of the Company’s derivative contracts at September 30, 2020, were with Bank of Oklahoma. All of the Company’s derivative contracts at September 30, 2019, were with Bank of Oklahoma and Koch Supply and Trading LP. The Company’s derivative contracts with Bank of Oklahoma are secured under its credit facility with Bank of Oklahoma. The derivative contracts with Koch were unsecured. The derivative instruments have settled or will settle based on the prices below.
66
PHX Minerals Inc.
Notes to Financial Statements (continued)
Derivative contracts in place as of September 30, 2020
Production volume | ||||||
Contract period | covered per month | Index | Contract price | |||
Natural gas costless collars | ||||||
April - October 2020 | 10,000 Mmbtu | NYMEX Henry Hub | $2.20 floor / $2.59 ceiling | |||
November 2020 - December 2021 | 50,000 Mmbtu | NYMEX Henry Hub | $2.30 floor / $2.90 ceiling | |||
November 2020 - December 2021 | 40,000 Mmbtu | NYMEX Henry Hub | $2.30 floor / $3.10 ceiling | |||
November 2020 | 26,500 Mmbtu | NYMEX Henry Hub | $2.30 floor / $2.85 ceiling | |||
December 2020 | 28,000 Mmbtu | NYMEX Henry Hub | $2.30 floor / $2.85 ceiling | |||
January 2021 | 32,000 Mmbtu | NYMEX Henry Hub | $2.30 floor / $2.85 ceiling | |||
February 2021 | 25,500 Mmbtu | NYMEX Henry Hub | $2.30 floor / $2.85 ceiling | |||
March 2021 | 30,500 Mmbtu | NYMEX Henry Hub | $2.30 floor / $2.85 ceiling | |||
April 2021 | 31,500 Mmbtu | NYMEX Henry Hub | $2.30 floor / $2.85 ceiling | |||
May 2021 | 32,500 Mmbtu | NYMEX Henry Hub | $2.30 floor / $2.85 ceiling | |||
June 2021 | 30,500 Mmbtu | NYMEX Henry Hub | $2.30 floor / $2.85 ceiling | |||
July 2021 | 31,500 Mmbtu | NYMEX Henry Hub | $2.30 floor / $2.85 ceiling | |||
August 2021 | 12,500 Mmbtu | NYMEX Henry Hub | $2.30 floor / $2.85 ceiling | |||
September 2021 | 11,000 Mmbtu | NYMEX Henry Hub | $2.30 floor / $2.85 ceiling | |||
October 2021 | 9,000 Mmbtu | NYMEX Henry Hub | $2.30 floor / $2.85 ceiling | |||
November 2021 | 8,000 Mmbtu | NYMEX Henry Hub | $2.30 floor / $2.85 ceiling | |||
December 2021 | 10,000 Mmbtu | NYMEX Henry Hub | $2.30 floor / $2.85 ceiling | |||
January 2022 | 25,500 Mmbtu | NYMEX Henry Hub | $2.30 floor / $2.85 ceiling | |||
November - December 2020 | 53,000 Mmbtu | NYMEX Henry Hub | $2.30 floor / $3.10 ceiling | |||
January 2021 | 72,000 Mmbtu | NYMEX Henry Hub | $2.30 floor / $3.10 ceiling | |||
February 2021 | 48,000 Mmbtu | NYMEX Henry Hub | $2.30 floor / $3.10 ceiling | |||
March 2021 | 61,000 Mmbtu | NYMEX Henry Hub | $2.30 floor / $3.10 ceiling | |||
April 2021 | 63,000 Mmbtu | NYMEX Henry Hub | $2.30 floor / $3.10 ceiling | |||
May 2021 | 69,000 Mmbtu | NYMEX Henry Hub | $2.30 floor / $3.10 ceiling | |||
June 2021 | 61,000 Mmbtu | NYMEX Henry Hub | $2.30 floor / $3.10 ceiling | |||
July 2021 | 83,000 Mmbtu | NYMEX Henry Hub | $2.30 floor / $3.10 ceiling | |||
August - September 2021 | 27,000 Mmbtu | NYMEX Henry Hub | $2.30 floor / $3.10 ceiling | |||
October 2021 | 20,000 Mmbtu | NYMEX Henry Hub | $2.30 floor / $3.10 ceiling | |||
November 2021 | 14,000 Mmbtu | NYMEX Henry Hub | $2.30 floor / $3.10 ceiling | |||
December 2021 | 4,000 Mmbtu | NYMEX Henry Hub | $2.30 floor / $3.10 ceiling | |||
January 2022 | 77,000 Mmbtu | NYMEX Henry Hub | $2.30 floor / $3.10 ceiling | |||
November 2020 | 54,000 Mmbtu | NYMEX Henry Hub | $2.30 floor / $3.00 ceiling | |||
December 2020 | 55,000 Mmbtu | NYMEX Henry Hub | $2.30 floor / $3.00 ceiling | |||
January 2021 | 64,000 Mmbtu | NYMEX Henry Hub | $2.30 floor / $3.00 ceiling | |||
February 2021 | 52,000 Mmbtu | NYMEX Henry Hub | $2.30 floor / $3.00 ceiling | |||
March - April 2021 | 62,000 Mmbtu | NYMEX Henry Hub | $2.30 floor / $3.00 ceiling | |||
May 2021 | 66,000 Mmbtu | NYMEX Henry Hub | $2.30 floor / $3.00 ceiling | |||
June 2021 | 60,000 Mmbtu | NYMEX Henry Hub | $2.30 floor / $3.00 ceiling | |||
July 2021 | 64,000 Mmbtu | NYMEX Henry Hub | $2.30 floor / $3.00 ceiling | |||
August 2021 | 24,000 Mmbtu | NYMEX Henry Hub | $2.30 floor / $3.00 ceiling | |||
September 2021 | 18,000 Mmbtu | NYMEX Henry Hub | $2.30 floor / $3.00 ceiling | |||
October 2021 | 19,000 Mmbtu | NYMEX Henry Hub | $2.30 floor / $3.00 ceiling | |||
November - December 2021 | 20,000 Mmbtu | NYMEX Henry Hub | $2.30 floor / $3.00 ceiling | |||
January - February 2022 | 50,000 Mmbtu | NYMEX Henry Hub | $2.30 floor / $3.00 ceiling |
67
PHX Minerals Inc.
Notes to Financial Statements (continued)
|
| Production volume |
|
|
|
|
|
|
Contract period |
| covered per month |
| Index |
| Contract price |
| |
Natural gas fixed price swaps |
|
|
|
|
|
|
|
|
January - December 2020 |
| 80,000 Mmbtu |
| NYMEX Henry Hub |
| $ | 2.750 |
|
April - October 2020 |
| 10,000 Mmbtu |
| NYMEX Henry Hub |
| $ | 2.405 |
|
November 2020 - March 2021 |
| 10,000 Mmbtu |
| NYMEX Henry Hub |
| $ | 2.661 |
|
January 2021 - February 2022 |
| 50,000 Mmbtu |
| NYMEX Henry Hub |
| $ | 2.729 |
|
January 2021 - December 2021 |
| 10,000 Mmbtu |
| NYMEX Henry Hub |
| $ | 2.765 |
|
November 2020 |
| 26,500 Mmbtu |
| NYMEX Henry Hub |
| $ | 2.582 |
|
December 2020 |
| 28,000 Mmbtu |
| NYMEX Henry Hub |
| $ | 2.582 |
|
January 2021 |
| 32,000 Mmbtu |
| NYMEX Henry Hub |
| $ | 2.582 |
|
February 2021 |
| 25,500 Mmbtu |
| NYMEX Henry Hub |
| $ | 2.582 |
|
March 2021 |
| 30,500 Mmbtu |
| NYMEX Henry Hub |
| $ | 2.582 |
|
April 2021 |
| 31,500 Mmbtu |
| NYMEX Henry Hub |
| $ | 2.582 |
|
May 2021 |
| 32,500 Mmbtu |
| NYMEX Henry Hub |
| $ | 2.582 |
|
June 2021 |
| 30,500 Mmbtu |
| NYMEX Henry Hub |
| $ | 2.582 |
|
July 2021 |
| 31,500 Mmbtu |
| NYMEX Henry Hub |
| $ | 2.582 |
|
August 2021 |
| 12,500 Mmbtu |
| NYMEX Henry Hub |
| $ | 2.582 |
|
September 2021 |
| 11,000 Mmbtu |
| NYMEX Henry Hub |
| $ | 2.582 |
|
October 2021 |
| 9,000 Mmbtu |
| NYMEX Henry Hub |
| $ | 2.582 |
|
November 2021 |
| 8,000 Mmbtu |
| NYMEX Henry Hub |
| $ | 2.582 |
|
December 2021 |
| 10,000 Mmbtu |
| NYMEX Henry Hub |
| $ | 2.582 |
|
January 2022 |
| 25,500 Mmbtu |
| NYMEX Henry Hub |
| $ | 2.582 |
|
Oil costless collars |
|
|
|
|
|
|
|
|
January - December 2020 |
| 2,000 Bbls |
| NYMEX WTI |
| $55.00 floor / $62.00 ceiling |
| |
August - October 2020 |
| 1,000 Bbls |
| NYMEX WTI |
| $36.00 floor / $43.60 ceiling |
| |
November - December 2020 |
| 500 Bbls |
| NYMEX WTI |
| $36.00 floor / $43.60 ceiling |
| |
January 2021 |
| 2,000 Bbls |
| NYMEX WTI |
| $36.00 floor / $43.60 ceiling |
| |
February 2021 |
| 1,500 Bbls |
| NYMEX WTI |
| $36.00 floor / $43.60 ceiling |
| |
March - July 2021 |
| 2,000 Bbls |
| NYMEX WTI |
| $36.00 floor / $43.60 ceiling |
| |
January 2022 |
| 2,500 Bbls |
| NYMEX WTI |
| $36.00 floor / $43.60 ceiling |
| |
August - October 2020 |
| 1,000 Bbls |
| NYMEX WTI |
| $37.00 floor / $44.50 ceiling |
| |
November - December 2020 |
| 500 Bbls |
| NYMEX WTI |
| $37.00 floor / $44.50 ceiling |
| |
January - July 2021 |
| 2,000 Bbls |
| NYMEX WTI |
| $37.00 floor / $44.50 ceiling |
| |
August - September 2021 |
| 500 Bbls |
| NYMEX WTI |
| $37.00 floor / $44.50 ceiling |
| |
January 2022 |
| 3,000 Bbls |
| NYMEX WTI |
| $37.00 floor / $44.50 ceiling |
| |
August 2020 |
| 1,000 Bbls |
| NYMEX WTI |
| $37.00 floor / $45.00 ceiling |
| |
September - November 2020 |
| 500 Bbls |
| NYMEX WTI |
| $37.00 floor / $45.00 ceiling |
| |
December 2020 |
| 1,000 Bbls |
| NYMEX WTI |
| $37.00 floor / $45.00 ceiling |
| |
January 2021 |
| 2,500 Bbls |
| NYMEX WTI |
| $37.00 floor / $45.00 ceiling |
| |
February 2021 |
| 1,500 Bbls |
| NYMEX WTI |
| $37.00 floor / $45.00 ceiling |
| |
March - April 2021 |
| 2,000 Bbls |
| NYMEX WTI |
| $37.00 floor / $45.00 ceiling |
| |
May 2021 |
| 2,500 Bbls |
| NYMEX WTI |
| $37.00 floor / $45.00 ceiling |
| |
June - July 2021 |
| 2,000 Bbls |
| NYMEX WTI |
| $37.00 floor / $45.00 ceiling |
| |
August 2021 |
| 500 Bbls |
| NYMEX WTI |
| $37.00 floor / $45.00 ceiling |
| |
January 2022 |
| 2,500 Bbls |
| NYMEX WTI |
| $37.00 floor / $45.00 ceiling |
| |
February 2022 |
| 5,000 Bbls |
| NYMEX WTI |
| $37.00 floor / $45.00 ceiling |
| |
Oil fixed price swaps |
|
|
|
|
|
|
|
|
January - December 2020 |
| 2,000 Bbls |
| NYMEX WTI |
| $ | 55.28 |
|
January - December 2020 |
| 2,000 Bbls |
| NYMEX WTI |
| $ | 58.65 |
|
January - December 2020 |
| 2,000 Bbls |
| NYMEX WTI |
| $ | 60.00 |
|
January - December 2020 |
| 2,000 Bbls |
| NYMEX WTI |
| $ | 58.05 |
|
10.68
PHX Minerals Inc.
Notes to Financial Statements (continued)
July - December 2020 |
| 2,000 Bbls |
| NYMEX WTI |
| $ | 58.10 |
|
January - December 2021 |
| 8,000 Bbls |
| NYMEX WTI |
| $ | 37.00 |
|
The Company’s fair value of derivative contracts was a net liability of $707,647 as of September 30, 2020, and a net asset of $2,494,144 as of September 30, 2019. Realized and unrealized gains and (losses) are recorded in gains (losses) on derivative contracts on the Company’s Statement of Operations. Cash receipts in the following table reflect the gain or loss on derivative contracts which settled during the respective periods, and the non-cash gain or loss reflect the change in fair value of derivative contracts as of the end of the respective periods.
| For the Year Ended September 30, |
| |||||||||
| 2020 |
|
| 2019 |
|
| 2018 |
| |||
Cash received (paid) on derivative contracts: |
|
|
|
|
|
|
|
|
|
|
|
Natural gas costless collars | $ | 28,510 |
|
| $ | (191,200 | ) |
| $ | 451,700 |
|
Natural gas fixed price swaps |
| 1,687,600 |
|
|
| 817,160 |
|
|
| 748,125 |
|
Oil costless collars |
| 1,011,472 |
|
|
| (169,256 | ) |
|
| (822,893 | ) |
Oil fixed price swaps |
| 1,381,628 |
|
|
| (259,719 | ) |
|
| (1,378,825 | ) |
Cash received (paid) on derivative contracts, net | $ | 4,109,210 |
|
| $ | 196,985 |
|
| $ | (1,001,893 | ) |
Non-cash gain (loss) on derivative contracts: |
|
|
|
|
|
|
|
|
|
|
|
Natural gas costless collars | $ | (706,015 | ) |
| $ | 10,453 |
|
| $ | (222,337 | ) |
Natural gas fixed price swaps |
| (1,535,122 | ) |
|
| 1,350,909 |
|
|
| (425,865 | ) |
Oil costless collars |
| (538,022 | ) |
|
| 1,687,685 |
|
|
| (1,026,163 | ) |
Oil fixed price swaps |
| (422,632 | ) |
|
| 2,859,113 |
|
|
| (2,255,810 | ) |
Non-cash gain (loss) on derivative contracts, net | $ | (3,201,791 | ) |
| $ | 5,908,160 |
|
| $ | (3,930,175 | ) |
Gains (losses) on derivative contracts, net | $ | 907,419 |
|
| $ | 6,105,145 |
|
| $ | (4,932,068 | ) |
The fair value amounts recognized for the Company’s derivative contracts executed with the same counterparty under a master netting arrangement may be offset. The Company has the choice to offset or not, but that choice must be applied consistently. A master netting arrangement exists if the reporting entity has multiple contracts with a single counterparty that are subject to a contractual agreement that provides for the net settlement of all contracts through a single payment in a single currency in the event of default on, or termination of, any one contract. Offsetting the fair values recognized for the derivative contracts outstanding with a single counterparty results in the net fair value of the transactions being reported as an asset or a liability in the Balance Sheets. The following table summarizes and reconciles the Company's derivative contracts’ fair values at a gross level back to net fair value presentation on the Company's Balance Sheets at September 30, 2020, and September 30, 2019. The Company has offset all amounts subject to master netting agreements in the Company's Balance Sheets at September 30, 2020, and September 30, 2019.
|
| 9/30/2020 |
|
| 9/30/2019 |
| ||||||||||||||
|
| Fair Value |
|
| Fair Value |
| ||||||||||||||
|
| Commodity Contracts |
|
| Commodity Contracts |
| ||||||||||||||
|
| Current Assets |
|
| Current Liabilities |
|
| Non-Current Liabilities |
|
| Current Assets |
|
| Non-Current Assets |
| |||||
Gross amounts recognized |
| $ | 864,466 |
|
| $ | 1,146,408 |
|
| $ | 425,705 |
|
| $ | 2,256,639 |
|
| $ | 237,505 |
|
Offsetting adjustments |
|
| (864,466 | ) |
|
| (864,466 | ) |
|
| - |
|
|
| - |
|
|
| - |
|
Net presentation on Balance Sheets |
| $ | - |
|
| $ | 281,942 |
|
| $ | 425,705 |
|
| $ | 2,256,639 |
|
| $ | 237,505 |
|
The fair value of derivative assets and derivative liabilities is adjusted for credit risk. The impact of credit risk was immaterial for all periods presented.
13. FAIR VALUE MEASUREMENTS
Fair value is defined as the amount that would be received from the sale of an asset or paid for the transfer of a liability in an orderly transaction between market participants, i.e., an exit price. To estimate an exit price, a three-level hierarchy is used. The fair value hierarchy prioritizes the inputs, which refer broadly to assumptions market participants would use in pricing an asset or a liability, into three levels.
69
PHX Minerals Inc.
Notes to Financial Statements (continued)
Level 1: | Unadjusted quoted prices in active markets that are accessible at the measurement date for identical, unrestricted assets or liabilities. The Company considers active markets as those in which transactions for the assets or liabilities occur with sufficient frequency and volume to provide pricing information on an ongoing basis. |
Level 2: | Quoted prices in markets that are not active, or inputs that are observable, either directly or indirectly, for substantially the full term of the asset or liability. This category includes those derivative instruments that the Company values using observable market data. Substantially all of these inputs are observable in the marketplace throughout the full term of the derivative instrument, can be derived from observable data or are supported by observable levels at which transactions are executed in the marketplace. Instruments in this category include non-exchange traded derivatives such as over-the-counter commodity fixed-price swaps and commodity options (i.e. price collars). |
The Company uses an option pricing valuation model for option derivative contracts that considers various inputs including: future prices, time value, volatility factors, counterparty credit risk and current market and contractual prices for the underlying instruments. The values calculated are then compared to the values given by counterparties for reasonableness.
Level 3: | Measured based on prices or valuation models that require inputs that are both significant to the fair value measurement and unobservable (or less observable) from objective sources (supported by little or no market activity). |
The following table provides fair value measurement information for financial assets and liabilities measured at fair value on a recurring basis.
|
| Fair Value Measurement at September 30, 2020 |
| |||||||||||||
|
| Quoted Prices in Active Markets |
|
| Significant Other Observable Inputs |
|
| Significant Unobservable Inputs |
|
| Total Fair |
| ||||
|
| (Level 1) |
|
| (Level 2) |
|
| (Level 3) |
|
| Value |
| ||||
Financial Assets (Liabilities): |
|
|
|
|
|
|
|
|
|
|
|
|
|
|
|
|
Derivative Contracts - Swaps |
| $ | - |
|
| $ | (64,801 | ) |
| $ | - |
|
| $ | (64,801 | ) |
Derivative Contracts - Collars |
| $ | - |
|
| $ | (642,846 | ) |
| $ | - |
|
| $ | (642,846 | ) |
|
| Fair Value Measurement at September 30, 2019 |
| |||||||||||||
|
| Quoted Prices in Active Markets |
|
| Significant Other Observable Inputs |
|
| Significant Unobservable Inputs |
|
| Total Fair |
| ||||
|
| (Level 1) |
|
| (Level 2) |
|
| (Level 3) |
|
| Value |
| ||||
Financial Assets (Liabilities): |
|
|
|
|
|
|
|
|
|
|
|
|
|
|
|
|
Derivative Contracts - Swaps |
| $ | - |
|
| $ | 1,892,954 |
|
| $ | - |
|
| $ | 1,892,954 |
|
Derivative Contracts - Collars |
| $ | - |
|
| $ | 601,190 |
|
| $ | - |
|
| $ | 601,190 |
|
The following table presents impairments associated with certain assets that have been measured at fair value on a nonrecurring basis within Level 3 of the fair value hierarchy.
|
| Year Ended September 30, |
| |||||||||||||||||||||
|
| 2020 |
|
| 2019 |
|
| 2018 |
| |||||||||||||||
|
| Fair Value |
|
| Impairment |
|
| Fair Value |
|
| Impairment |
|
| Fair Value |
|
| Impairment |
| ||||||
|
|
|
|
|
|
|
|
|
|
|
|
|
|
|
|
|
|
|
|
|
|
|
|
|
Producing Properties (a) |
| $ | 5,288,710 |
|
| $ | 29,315,807 |
|
| $ | 9,101,032 |
|
| $ | 76,824,337 |
|
| $ | - |
|
| $ | - |
|
70
PHX Minerals Inc.
Notes to Financial Statements (continued)
(a) | At the end of each quarter, the Company assessed the carrying value of its producing properties for impairment. This assessment utilized estimates of future cash flows or fair value (selling price) less cost to sell if the property is held for sale. Significant judgments and assumptions in these assessments include estimates of future natural gas, oil and NGL prices using a forward NYMEX curve adjusted for projected inflation, locational basis differentials, drilling plans, expected capital costs and an applicable discount rate commensurate with risk of the underlying cash flow estimates. These assessments identified certain properties with carrying value in excess of their calculated fair values. This table excludes $588,721 of impairments on properties that were written off during 2020. |
At September 30, 2020, and September 30, 2019, the carrying values of cash and cash equivalents, receivables, and payables are considered to be representative of their respective fair values due to the short-term maturities of those instruments. Financial instruments include debt, which the valuation is classified as Level 2 as the carrying amount of the Company’s revolving credit facility approximates fair value because the interest rates are reflective of market rates. The estimated current market interest rates are based primarily on interest rates currently being offered on borrowings of similar amounts and terms. In addition, no valuation input adjustments were considered necessary relating to nonperformance risk for the debt agreements.
14. INFORMATION ON OIL AND NATURAL GAS AND OIL PRODUCING ACTIVITIES
Virtually all oil andThe natural gas and oil producing activities of the Company are conducted within the contiguous United States (principally in Oklahoma, Texas, Arkansas Oklahoma and Texas)North Dakota) and represent substantially all of the business activities of the Company.
The following table shows sales, by percentage, through various operators/purchasers during 2017, 20162020, 2019 and 2015.2018.
|
| 2017 |
|
| 2016 |
|
| 2015 |
| |||||||||||||||
|
|
|
|
|
|
|
|
|
|
|
|
|
| 2020 |
|
| 2019 |
|
| 2018 |
| |||
Company A |
|
| 18 | % |
|
| 23 | % |
|
| 23 | % |
|
| 23 | % |
|
| 23 | % |
|
| 24 | % |
Company B |
|
| 13 | % |
|
| 12 | % |
|
| 14 | % |
|
| 6 | % |
|
| 8 | % |
|
| 16 | % |
Company C |
|
| 5 | % |
|
| 8 | % |
|
| 11 | % | ||||||||||||
The loss of any of these major purchasers of natural gas, oil and NGL production could have a material adverse effect on the ability of the Company to produce and sell its natural gas, oil and NGL production.
(83)
15. SUBSEQUENT EVENTS
Name Change
Effective October 8, 2020, the Company officially changed its name to PHX Minerals Inc. to more accurately reflect its business strategy.
Acquisitions
On October 8, 2020, the Company closed on the purchase of 297 net royalty acres in Grady County, Oklahoma, and 257 net mineral acres and 12 net royalty acres in Harrison, Panola and Nacogdoches Counties, Texas, for a purchase price of $5.5 million and 153,375 shares of PHX common stock. This purchase was largely funded with cash from the common stock offering that closed on September 1, 2020.
On November 12, 2020, the Company closed on the purchase of 134 net mineral acres in San Augustine County, Texas for a purchase price of $750,000.
On December 4, 2020, the Company signed a purchase and sale agreement to purchase an additional 87 net mineral acres in San Augustine County, Texas for a purchase price of $1 million, subject to customary closing adjustments. The Company expects this acquisition to close in the first fiscal quarter of 2021.
Borrowing Base Redetermination
The Eighth Amendment to the Credit Facility was signed on December 4, 2020. This amendment reduced the Quarterly Commitment Reductions from $1,000,000 to $600,000, reduced the consolidated cash balance in the anti-cash hoarding provision
71
Panhandle Oil and GasPHX Minerals Inc.
Notes to Financial Statements (continued)
11.from $2,000,000 to $1,000,000, and changed the debt to EBITDA ratio from 4.0:1.00 to 3.50:1.00. The borrowing base after Quarterly Commitment Reductions was reaffirmed at $30,000,000.
Derivative Contracts
Subsequent to September 30, 2020, the Company entered into new derivative contracts as summarized in the table below:
|
| Production volume |
|
|
|
|
|
|
Contract period |
| covered per month |
| Index |
| Contract price |
| |
Natural gas costless collars |
|
|
|
|
|
|
|
|
August 2021 - July 2022 |
| 100,000 Mmbtu |
| NYMEX Henry Hub |
| $2.50 floor / $3.17 ceiling |
| |
February - June 2022 |
| 100,000 Mmbtu |
| NYMEX Henry Hub |
| $2.50 floor / $3.15 ceiling |
| |
Oil costless collars |
|
|
|
|
|
|
|
|
August 2021 - July 2022 |
| 1,500 Bbls |
| NYMEX WTI |
| $37.00 floor / $47.10 ceiling |
| |
Oil fixed price swaps |
|
|
|
|
|
|
|
|
February - June 2022 |
| 4,000 Bbls |
| NYMEX WTI |
| $ | 39.51 |
|
July - December 2022 |
| 1,500 Bbls |
| NYMEX WTI |
| $ | 39.51 |
|
March - December 2022 |
| 1,000 Bbls |
| NYMEX WTI |
| $ | 43.78 |
|
March - December 2022 |
| 1,000 Bbls |
| NYMEX WTI |
| $ | 43.50 |
|
March - December 2022 |
| 1,000 Bbls |
| NYMEX WTI |
| $ | 43.05 |
|
16. SUPPLEMENTARY INFORMATION ON OIL, NGL AND NATURAL GAS, OIL AND NGL RESERVES (UNAUDITED)
Aggregate Capitalized Costs
The aggregate amount of capitalized costs of oilnatural gas and natural gasoil properties and related accumulated depreciation, depletion and amortization as of September 30 is as follows:
|
| 2017 |
|
| 2016 |
| ||||||||||
|
|
|
|
|
|
|
|
|
| 2020 |
|
| 2019 |
| ||
Producing properties |
| $ | 434,571,516 |
|
| $ | 434,469,093 |
|
| $ | 324,886,491 |
|
| $ | 354,718,398 |
|
Non-producing minerals |
|
| 7,243,802 |
|
|
| 7,364,630 |
|
|
| 18,808,689 |
|
|
| 14,413,899 |
|
Non-producing leasehold |
|
| 185,125 |
|
|
| 204,101 |
|
|
| 185,125 |
|
|
| 185,124 |
|
Exploratory wells in progress |
|
| - |
|
|
| 5,917 |
| ||||||||
|
|
| 442,000,443 |
|
|
| 442,043,741 |
|
|
| 343,880,305 |
|
|
| 369,317,421 |
|
Accumulated depreciation, depletion and amortization |
|
| (245,640,247 | ) |
|
| (251,004,735 | ) |
|
| (263,277,422 | ) |
|
| (258,063,849 | ) |
Net capitalized costs |
| $ | 196,360,196 |
|
| $ | 191,039,006 |
|
| $ | 80,602,883 |
|
| $ | 111,253,572 |
|
Costs Incurred
For the years ended September 30, the Company incurred the following costs in oilnatural gas and natural gasoil producing activities:
|
| 2017 |
|
| 2016 |
|
| 2015 |
| |||||||||||||||
|
|
|
|
|
|
|
|
|
|
|
|
|
| 2020 |
|
| 2019 |
|
| 2018 |
| |||
Property acquisition costs |
| $ | 20,190 |
|
| $ | - |
|
| $ | 146,261 |
|
| $ | 10,453,119 |
|
| $ | 6,235,905 |
|
| $ | 11,409,673 |
|
Exploration costs |
|
| - |
|
|
| 21,049 |
|
|
| 898,818 |
|
|
| - |
|
|
| - |
|
|
| - |
|
Development costs |
|
| 25,382,377 |
|
|
| 5,075,710 |
|
|
| 24,931,571 |
|
|
| 273,825 |
|
|
| 3,012,095 |
|
|
| 10,291,476 |
|
|
| $ | 25,402,567 |
|
| $ | 5,096,759 |
|
| $ | 25,976,650 |
|
| $ | 10,726,944 |
|
| $ | 9,248,000 |
|
| $ | 21,701,149 |
|
72
PHX Minerals Inc.
Notes to Financial Statements (continued)
Estimated Quantities of Proved Oil, NGL and Natural Gas, Oil and NGL Reserves
The following unaudited information regarding the Company’s oil, NGL and natural gas, oil and NGL reserves is presented pursuant to the disclosure requirements promulgated by the SEC and the FASB.
Proved oil and natural gas and oil reserves are those quantities of oilnatural gas and natural gasoil which, by analysis of geosciencesgeoscience and engineering data, can be estimated with reasonable certainty to be economically producible – from a given date forward, from known reservoirs, and under existing economic conditions, operating methods and government regulations – prior to the time at which contracts providing the right to operate expire, unless evidence indicates that renewal is reasonably certain, regardless of whether deterministic or probabilistic methods are used for the estimation. Existing economic conditions include prices and costs at which economic producibility from a reservoir is to be determined. The price shall be the average price during the 12-month period prior to the ending date of the period covered by the report, determined as an
(84)
Panhandle Oil and Gas Inc.
Notes to Financial Statements (continued)
unweighted arithmetic average of the first-day-of-the-month price for each month within such period, unless prices are defined by contractual arrangements, excluding escalations based upon future conditions. The project to extract the hydrocarbons must have commenced, or the operator must be reasonably certain that it will commence the project within a reasonable time. The area of the reservoir considered as proved includes: (i) the area identified by drilling and limited by fluid contacts, if any, and (ii) adjacent undrilled portions of the reservoir that can, with reasonable certainty, be judged to be continuous with it and to contain economically producible oilnatural gas or natural gasoil on the basis of available geoscience and engineering data. In the absence of data on fluid contacts, proved quantities in a reservoir are limited by the lowest known hydrocarbons as seen in a well penetration unless geoscience, engineering or performance data and reliable technology establishes a lower contact with reasonable certainty. Where direct observation from well penetrations has defined a highest known oil elevation and the potential exists for an associated natural gas cap, proved oil reserves may be assigned in the structurally higher portions of the reservoir only if geoscience, engineering or performance data and reliable technology establish the higher contact with reasonable certainty. Reserves which can be produced economically through application of improved recovery techniques (including, but not limited to, fluid injection) are included in the proved classification when: (i) successful testing by a pilot project in an area of the reservoir with properties no more favorable than in the reservoir as a whole, the operation of an installed program in the reservoir or an analogous reservoir, or other evidence using reliable technology establishes the reasonable certainty of the engineering analysis on which the project or program was based; and (ii) the project has been approved for development by all necessary parties and entities, including governmental entities.
The independent consulting petroleum engineering firm of DeGolyer and MacNaughton of Dallas, Texas, calculatedprepared the Company’s oil, NGL and natural gas, oil and NGL reserves estimates as of September 30, 2017, 20162020, 2019 and 2015.2018.
The Company’s net proved oil, NGL and natural gas, oil and NGL reserves, which are located in the contiguous United States, as of September 30, 2017, 20162020, 2019 and 2015,2018, have been estimated by the Company’s Independent Consulting Petroleum Engineering Firm. Estimates of reserves were prepared by the use of appropriate geologic, petroleum engineering and evaluation principles and techniques that are in accordance with practices generally recognized by the petroleum industry as presented in the publication of the Society of Petroleum Engineers entitled “Standards Pertaining to the Estimating and Auditing of Oil and Gas Reserves Information (Revision as of February 19, 2007).” The method or combination of methods used in the analysis of each reservoir was tempered by experience with similar reservoirs, stage of development, quality and completeness of basic data and production history.
All of the reserve estimates are reviewed and approved by our Vice President, ofMinerals Operations, Freda Webb, who reports directly to our President and CEO.Webb. Ms. Webb holds a Bachelor of Science Degreedegree in Mechanical Engineering from the University of Oklahoma, a Master of Science Degreedegree in Petroleum Engineering from the University of Southern California and a Professional Engineering License in Petroleum Engineering in the State of Oklahoma. Ms. Webb has more than 3540 years of experience in the oil and gas industry. Before joining the Company, she was sole proprietor of a consulting petroleum engineering firm and a mineral acquisition company. Ms. Webb held various positions of increasing responsibility at
(85)
Panhandle Oil and Gas Inc.
Notes to Financial Statements (continued)
Southwestern Energy Company and Occidental Petroleum Corporation, with reservoir engineering assignments in several field locations across the United States. She is an active member of the Society of Petroleum Engineers (SPE).
Our Vice President, ofMinerals Operations, and internal staff work closely with our Independent Consulting Petroleum Engineers to ensure the integrity, accuracy and timeliness of data furnished to them for their reserves estimation process. We provide historical information (such as ownership interest, oilgas and gasoil production, well test data, commodity prices, operating costs, and handling fees and development costs) for all properties to our Independent Consulting Petroleum Engineers. Throughout the year, our team meets regularly with representatives of our Independent Consulting Petroleum Engineers to review properties and discuss methods and assumptions.
When applicable, the volumetric method was used73
PHX Minerals Inc.
Notes to estimate the original oil in place (OOIP) and the original gas in place (OGIP). Structure and isopach maps were constructed to estimate reservoir volume. Electrical logs, radioactivity logs, core analyses and other available data were used to prepare these maps as well as to estimate representative values for porosity and water saturation. When adequate data was available and when circumstances justified, material balance and other engineering methods were used to estimate OOIP or OGIP.Financial Statements (continued)
Estimates of ultimate recoveryreserves were obtained after applying recovery factors to OOIP or OGIP. These recovery factors were based on considerationprepared by the use of appropriate geologic, petroleum engineering and evaluation principles and techniques that are in accordance with the reserves definitions of Rules 4–10(a) (1)–(32) of Regulation S–X of the type of energy inherentSEC and with practices generally recognized by the petroleum industry as presented in the reservoirs, analysespublication of the petroleum,Society of Petroleum Engineers (SPE) entitled “Standards Pertaining to the structural positionsEstimating and Auditing of Oil and Gas Reserves Information (revised June 2019) Approved by the propertiesSPE Board on 25 June 2019” and in Monograph 3 and Monograph 4 published by the production histories. When applicable, material balance and other engineeringSociety of Petroleum Evaluation Engineers. The method or combination of methods were used to estimate recovery factors. An analysis of reservoir performance, including production rate, reservoir pressure and gas-oil ratio behavior, was used in the estimationanalysis of reserves.
For depletion-typeeach reservoir was tempered by experience with similar reservoirs, stage of development, quality and completeness of basic data, and production history. Based on the current stage of field development, production performance, development plans and analyses of areas offsetting existing wells with test or those whose performance disclosed a reliable decline in producing-rate trends or other diagnostic characteristics,production data, reserves were classified as proved. The proved undeveloped reserves were estimated for locations that have been permitted, are currently drilling, are drilled but not yet completed, or locations where the operator has indicated to the Company its intention to drill.
For the evaluation of unconventional reservoirs, a performance-based methodology integrating the appropriate geology and petroleum engineering data was utilized. Performance-based methodology primarily includes (1) production diagnostics, (2) decline-curve analysis, and (3) model-based analysis (if necessary, based on availability of data). Production diagnostics include data quality control, identification of flow regimes and characteristic well performance behavior. These analyses were performed for all well groupings (or type-curve areas). Characteristic rate-decline profiles from diagnostic interpretation were translated to modified hyperbolic rate profiles, including one or multiple b-exponent values followed by an exponential decline. Based on the availability of data, model-based analysis may be integrated to evaluate long-term decline behavior, the effect of dynamic reservoir and fracture parameters on well performance, and complex situations sourced by the applicationnature of appropriate decline curves or other performance relationships.unconventional reservoirs. In the analysesevaluation of production-decline curves,undeveloped reserves, type-well analysis was performed using well data from analogous reservoirs for which more complete historical performance data were estimated only to the limits of economic production or to the limit of the production licenses as appropriate.available.
Accordingly, these estimates should be expected to change, and such changes could be material and occur in the near term as future information becomes available.
(86)
Panhandle Oil and Gas Inc.
Notes to Financial Statements (continued)
Net quantities of proved, developed and undeveloped oil, NGL and natural gas, oil and NGL reserves are summarized as follows:
|
| Proved Reserves |
|
| Proved Reserves |
| ||||||||||||||||||||||||||
|
| Oil |
|
| NGL |
|
| Natural Gas |
|
| Total |
|
| Natural Gas |
|
| Oil |
|
| NGL |
|
| Total |
| ||||||||
|
| (Barrels) |
|
| (Barrels) |
|
| (Mcf) |
|
| Bcfe |
|
| (Mcf) |
|
| (Barrels) |
|
| (Barrels) |
|
| Bcfe |
| ||||||||
September 30, 2014 |
|
| 7,569,579 |
|
|
| 3,040,181 |
|
|
| 142,492,360 |
|
|
| 206.2 |
| ||||||||||||||||
September 30, 2017 |
|
| 121,195,120 |
|
|
| 5,509,667 |
|
|
| 2,384,699 |
|
|
| 168.6 |
| ||||||||||||||||
|
|
|
|
|
|
|
|
|
|
|
|
|
|
|
|
|
|
|
|
|
|
|
|
|
|
|
|
|
|
|
|
|
Revisions of previous estimates |
|
| (1,697,309 | ) |
|
| (425,300 | ) |
|
| (31,273,207 | ) |
|
| (44.0 | ) |
|
| (29,247 | ) |
|
| (1,407,995 | ) |
|
| 303,728 |
|
|
| (6.7 | ) |
Acquisitions (divestitures) |
|
| - |
|
|
| - |
|
|
| - |
|
|
| - |
|
|
| (1,782,949 | ) |
|
| 236,690 |
|
|
| 24,765 |
|
|
| (0.2 | ) |
Extensions, discoveries and other additions |
|
| 1,619,285 |
|
|
| 516,679 |
|
|
| 18,740,114 |
|
|
| 31.6 |
|
|
| 9,400,374 |
|
|
| 1,982,624 |
|
|
| 476,174 |
|
|
| 24.2 |
|
Production |
|
| (453,125 | ) |
|
| (210,960 | ) |
|
| (9,745,223 | ) |
|
| (13.7 | ) |
|
| (8,721,262 | ) |
|
| (336,564 | ) |
|
| (255,176 | ) |
|
| (12.3 | ) |
September 30, 2015 |
|
| 7,038,430 |
|
|
| 2,920,600 |
|
|
| 120,214,044 |
|
|
| 180.0 |
| ||||||||||||||||
September 30, 2018 |
|
| 120,062,036 |
|
|
| 5,984,422 |
|
|
| 2,934,190 |
|
|
| 173.6 |
| ||||||||||||||||
|
|
|
|
|
|
|
|
|
|
|
|
|
|
|
|
|
|
|
|
|
|
|
|
|
|
|
|
|
|
|
|
|
Revisions of previous estimates |
|
| (1,552,010 | ) |
|
| (1,192,143 | ) |
|
| (47,068,144 | ) |
|
| (63.5 | ) |
|
| (35,644,135 | ) |
|
| (3,266,351 | ) |
|
| (890,046 | ) |
|
| (60.6 | ) |
Acquisitions (divestitures) |
|
| - |
|
|
| - |
|
|
| - |
|
|
| - |
|
|
| (948,496 | ) |
|
| (322,023 | ) |
|
| (18,881 | ) |
|
| (3.0 | ) |
Extensions, discoveries and other additions |
|
| 303,922 |
|
|
| 65,306 |
|
|
| 16,864,075 |
|
|
| 19.1 |
|
|
| 3,891,262 |
|
|
| 313,241 |
|
|
| 164,276 |
|
|
| 6.8 |
|
Production |
|
| (364,252 | ) |
|
| (171,060 | ) |
|
| (8,284,377 | ) |
|
| (11.5 | ) |
|
| (7,086,761 | ) |
|
| (329,199 | ) |
|
| (216,259 | ) |
|
| (10.4 | ) |
September 30, 2016 |
|
| 5,426,090 |
|
|
| 1,622,703 |
|
|
| 81,725,598 |
|
|
| 124.0 |
| ||||||||||||||||
September 30, 2019 |
|
| 80,273,906 |
|
|
| 2,380,090 |
|
|
| 1,973,280 |
|
|
| 106.4 |
| ||||||||||||||||
|
|
|
|
|
|
|
|
|
|
|
|
|
|
|
|
|
|
|
|
|
|
|
|
|
|
|
|
|
|
|
|
|
Revisions of previous estimates |
|
| 253,481 |
|
|
| 407,250 |
|
|
| 13,651,501 |
|
|
| 17.6 |
|
|
| (34,666,426 | ) |
|
| (1,094,923 | ) |
|
| (774,214 | ) |
|
| (45.9 | ) |
Acquisitions (divestitures) |
|
| (37,724 | ) |
|
| (12,953 | ) |
|
| (669,064 | ) |
|
| (1.0 | ) |
|
| 911,853 |
|
|
| 57,721 |
|
|
| 70,933 |
|
|
| 1.7 |
|
Extensions, discoveries and other additions |
|
| 178,497 |
|
|
| 541,557 |
|
|
| 34,681,614 |
|
|
| 39.0 |
|
|
| 1,816,144 |
|
|
| 260,555 |
|
|
| 118,480 |
|
|
| 4.1 |
|
Production |
|
| (310,677 | ) |
|
| (173,858 | ) |
|
| (8,194,529 | ) |
|
| (11.1 | ) |
|
| (5,962,704 | ) |
|
| (269,786 | ) |
|
| (168,622 | ) |
|
| (8.6 | ) |
September 30, 2017 |
|
| 5,509,667 |
|
|
| 2,384,699 |
|
|
| 121,195,120 |
|
|
| 168.6 |
| ||||||||||||||||
September 30, 2020 |
|
| 42,372,773 |
|
|
| 1,333,657 |
|
|
| 1,219,857 |
|
|
| 57.7 |
| ||||||||||||||||
The prices used to calculate reserves and future cash flows from reserves for oil, NGL and natural gas, oil and NGL, respectively, were as follows: September 30, 20172020 - $46.31/$1.62/Mcf, $40.18/Bbl $17.55/, $9.95/Bbl $2.81/Mcf;; September 30, 20162019 - $36.77/$2.48/Mcf, $54.40/Bbl $12.22/, $19.30/Bbl $1.97/Mcf;; September 30, 20152018 - $55.27/$2.56/Mcf, $62.86/Bbl $19.10/, $26.13/Bbl $2.84/Mcf..
The revisions of previous estimates from 2016 to 2017 were primarily the result of:
Positive pricing revisions of 17.9 Bcfe, resulting from the extension of projected economic limits than projected in 2016: proved developed revisions of 17.3 Bcfe and PUD revisions of 0.6 Bcfe.
Negative performance revisions of 0.3 Bcfe.
The divestiture of 1.0 Bcfe in marginal properties located in southwestern Oklahoma.
(87)74
Panhandle Oil and GasPHX Minerals Inc.
Notes to Financial Statements (continued)
The revisions of previous estimates from 2019 to 2020 were primarily the result of:
• | Negative pricing revisions of 35.8 Bcfe due to natural gas and oil wells reaching their economic limits earlier than was projected in 2019 due lower gas and oil prices and decreased operator activity in 2019 and a change in strategy to remove PUD locations not permitted, in progress, or drilled and uncompleted (DUC); proved developed revisions of 20.4 Bcfe and PUD revisions of 15.4 Bcfe. |
• | Negative revisions of 10.1 Bcfe. Proved developed negative revisions of 8.7 Bcfe were the result of lower performance of high-interest Woodford natural gas wells in the STACK and Arkoma Stack in Oklahoma and, to a lesser extent, lower performance of the Eagle Ford Shale oil properties in southern Texas. Proved undeveloped revisions were negative 1.4 Bcfe, due to changes to scheduled first production date, expected performance, costs and other reserve parameters. |
Acquisitions and divestitures were the result of:
• | The acquisition of 2.4 Bcfe, predominately in the active drilling program of the Woodford and Mississippian in the SCOOP and STACK plays in Oklahoma and the Bakken in North Dakota, of which 1.1 Bcfe were proved developed and 1.3 Bcfe were proved undeveloped. |
• | The sale of 0.7 Bcfe, predominately in the Permian Basin in New Mexico, of which 0.2 Bcfe were proved developed and 0.5 Bcfe were proved undeveloped. |
Extensions, discoveries and other additions from 20162019 to 20172020 are principally attributable to:
• | Proved developed reserve extensions, discoveries and other additions of 4.1 Bcfe, of which 1.7 Bcfe were proved developed and 2.4 Bcfe were proved undeveloped reserves, resulting from: |
a) | The Company’s royalty interest ownership in the ongoing development of unconventional natural gas, oil and NGL utilizing extended horizontal drilling in the Woodford Shale in the STACK and SCOOP in Oklahoma. |
b) | The Company’s royalty interest ownership in ongoing development of unconventional natural gas, oil and NGL utilizing horizontal drilling in the STACK Meramec play in the Anadarko Basin in western Oklahoma. |
c) | The Company’s royalty interest ownership in ongoing development of unconventional natural gas, oil and NGL utilizing horizontal drilling in the Bakken Shale in North Dakota. |
Production of 9.98.6 Bcfe principally resulting from the Company’s participation in six wells in the liquids rich portion of the Anadarko Woodford Shale in Canadian County, Oklahoma.
The addition of 29.1 Bcfe of PUD reserves, all are within the Company’s active drilling program areas of the Anadarko Woodford Shale (Cana, STACKnatural gas and SCOOP) and southeastern Oklahoma Woodford.oil properties.
|
| Proved Developed Reserves |
|
| Proved Undeveloped Reserves |
| ||||||||||||||||||
|
| Oil |
|
| NGL |
|
| Natural Gas |
|
| Oil |
|
| NGL |
|
| Natural Gas |
| ||||||
|
| (Barrels) |
|
| (Barrels) |
|
| (Mcf) |
|
| (Barrels) |
|
| (Barrels) |
|
| (Mcf) |
| ||||||
|
|
|
|
|
|
|
|
|
|
|
|
|
|
|
|
|
|
|
|
|
|
|
|
|
September 30, 2015 |
|
| 2,725,077 |
|
|
| 1,466,834 |
|
|
| 82,899,159 |
|
|
| 4,313,353 |
|
|
| 1,453,766 |
|
|
| 37,314,885 |
|
September 30, 2016 |
|
| 1,980,519 |
|
|
| 1,095,256 |
|
|
| 62,929,047 |
|
|
| 3,445,571 |
|
|
| 527,447 |
|
|
| 18,796,551 |
|
September 30, 2017 |
|
| 2,201,528 |
|
|
| 1,768,425 |
|
|
| 87,861,043 |
|
|
| 3,308,139 |
|
|
| 616,274 |
|
|
| 33,334,077 |
|
|
| Proved Developed Reserves |
|
| Proved Undeveloped Reserves |
| ||||||||||||||||||
|
| Natural Gas |
|
| Oil |
|
| NGL |
|
| Natural Gas |
|
| Oil |
|
| NGL |
| ||||||
|
| (Mcf) |
|
| (Barrels) |
|
| (Barrels) |
|
| (Mcf) |
|
| (Barrels) |
|
| (Barrels) |
| ||||||
September 30, 2018 |
|
| 83,151,954 |
|
|
| 2,334,587 |
|
|
| 2,085,706 |
|
|
| 36,910,082 |
|
|
| 3,649,835 |
|
|
| 848,484 |
|
September 30, 2019 |
|
| 67,713,193 |
|
|
| 1,863,096 |
|
|
| 1,747,242 |
|
|
| 12,560,713 |
|
|
| 516,994 |
|
|
| 226,038 |
|
September 30, 2020 |
|
| 40,924,083 |
|
|
| 1,148,989 |
|
|
| 1,135,864 |
|
|
| 1,448,690 |
|
|
| 184,668 |
|
|
| 83,993 |
|
The following details the changes in proved undeveloped reserves for 20172020 (Mcfe):
Beginning proved undeveloped reserves |
|
|
|
|
Proved undeveloped reserves transferred to proved developed |
|
| ( | ) |
Revisions |
|
|
| ) |
Extensions and discoveries |
|
|
|
|
Sales | (479,415 | ) | ||
Purchases |
|
|
|
|
Ending proved undeveloped reserves |
|
|
|
|
Beginning75
PHX Minerals Inc.
Notes to Financial Statements (continued)
For the fiscal year ending September 30, 2020, our beginning PUD reserves were 42.617.0 Bcfe. ATotal net PUD reserves decreased by 14.0 Bcfe, as compared to September 30, 2019. In 2020, a total of 15.70.4 Bcfe (37%(2% of the beginning balance) was transferred to proved developed producing during 2017.developed. The 0.8remaining 13.6 Bcfe (2%(80% of the beginning balance) of positivenegative revisions to PUD reserves wereconsist of (i) pricing revisions of 0.6-15.4 Bcfe resulting from the impact of COVID-19 and reduced pricing leading to an unprecedented decrease in operator activity in 2020, and a decision to remove PUD locations not permitted, in progress, or drilled and uncompleted (DUC), (ii) sales and performance revisions of -1.8 Bcfe, and performance revision(iii) purchases and extensions of 0.23.6 Bcfe. No PUD locations from 2013 remain in the PUD category. We anticipate that all the Company’s current PUD locations will be drilled and converted to PDP within five years of the date they were added. However, PUD locations and associated reserves, which are no longer projected to be drilled within five years from the date they were added to PUD reserves, will be removed as revisions at the time that determination is made. In the event that there are undrilled PUD locations at the end of the five-year period, it is our intent to remove the reserves associated with those locations from our proved reserves as revisions. The Company added 29.12.4 Bcfe of PUD reserves in 20172020 within the Company’s active drilling program areas of (i) STACK Meramec and Woodford in western Oklahoma, (ii) the AnadarkoSCOOP Woodford Shale (Cana,in western Oklahoma’s Anadarko Basin, (iii) the Arkoma Stack in eastern Oklahoma, (iv) the Bakken in North Dakota. These additions result from continuing development and additional well performance data in each of the referenced plays. Additionally, the Company purchased 1.3 Bcfe in the STACK SCOOP)Meramec and southeasternWoodford in Oklahoma Woodford Shale.
(88)
Panhandle Oil and Gas Inc.
Notes to Financial Statements (continued)sold 0.5 Bcfe, predominately in the Permian Basin in New Mexico.
Standardized Measure of Discounted Future Net Cash Flows
Accounting Standards prescribe guidelines for computing a standardized measure of future net cash flows and changes therein relating to estimated proved reserves. The Company has followed these guidelines, which are briefly discussed below.
Future cash inflows and future production and development costs are determined by applying the trailing unweighted 12-month arithmetic average of the first-day-of-the-month individual product prices and year-end costs to the estimated quantities of oil, NGL and natural gas, oil and NGL to be produced. Actual future prices and costs may be materially higher or lower than the unweighted 12-month arithmetic average of the first-day-of-the-month individual product prices and year-end costs used. For each year, estimates are made of quantities of proved reserves and the future periods during which they are expected to be produced, based on continuation of the economic conditions applied for such year.
Estimated future income taxes are computed using current statutory income tax rates, including consideration for the current tax basis of the properties and related carry forwards, giving effect to permanent differences and tax credits. The resulting future net cash flows are reduced to present value amounts by applying a 10% annual discount factor. The assumptions used to compute the standardized measure are those prescribed by the FASB and, as such, do not necessarily reflect our expectations of actual revenue to be derived from those reserves nor their present worth. The limitations inherent in the reserve quantity estimation process, as discussed previously, are equally applicable to the standardized measure computations since these estimates affect the valuation process.
|
| 2017 |
|
| 2016 |
|
| 2015 |
| |||||||||||||||
|
|
|
|
|
|
|
|
|
|
|
|
|
| 2020 |
|
| 2019 |
|
| 2018 |
| |||
Future cash inflows |
| $ | 637,509,599 |
|
| $ | 380,263,695 |
|
| $ | 786,295,155 |
|
| $ | 134,179,216 |
|
| $ | 366,697,321 |
|
| $ | 759,899,074 |
|
Future production costs |
|
| (256,193,675 | ) |
|
| (182,948,045 | ) |
|
| (311,933,151 | ) |
|
| (66,136,222 | ) |
|
| (153,935,373 | ) |
|
| (259,413,766 | ) |
Future development and asset retirement costs |
|
| (93,133,683 | ) |
|
| (72,431,842 | ) |
|
| (124,857,957 | ) |
|
| (1,957,225 | ) |
|
| (1,917,937 | ) |
|
| (89,518,449 | ) |
Future income tax expense |
|
| (102,193,819 | ) |
|
| (38,674,100 | ) |
|
| (123,007,909 | ) |
|
| (13,224,535 | ) |
|
| (47,788,416 | ) |
|
| (95,872,182 | ) |
Future net cash flows |
|
| 185,988,422 |
|
|
| 86,209,708 |
|
|
| 226,496,138 |
|
|
| 52,861,234 |
|
|
| 163,055,595 |
|
|
| 315,094,677 |
|
|
|
|
|
|
|
|
|
|
|
|
|
|
|
|
|
|
|
|
|
|
|
|
|
|
10% annual discount |
|
| (105,155,847 | ) |
|
| (56,439,589 | ) |
|
| (144,904,927 | ) |
|
| (21,727,081 | ) |
|
| (77,494,066 | ) |
|
| (158,768,823 | ) |
Standardized measure of discounted future net cash flows |
| $ | 80,832,575 |
|
| $ | 29,770,119 |
|
| $ | 81,591,211 |
|
| $ | 31,134,153 |
|
| $ | 85,561,529 |
|
| $ | 156,325,854 |
|
(89)76
Panhandle Oil and GasPHX Minerals Inc.
Notes to Financial Statements (continued)
Changes in the standardized measure of discounted future net cash flows are as follows:
|
| 2017 |
|
| 2016 |
|
| 2015 |
|
| 2020 |
|
| 2019 |
|
| 2018 |
| ||||||
Beginning of year |
| $ | 29,770,119 |
|
| $ | 81,591,211 |
|
| $ | 204,782,504 |
|
| $ | 85,561,529 |
|
| $ | 156,325,854 |
|
| $ | 80,832,575 |
|
Changes resulting from: |
|
|
|
|
|
|
|
|
|
|
|
|
|
|
|
|
|
|
|
|
|
|
|
|
Sales of oil, NGL and natural gas, net of production costs |
|
| (25,783,055 | ) |
|
| (16,749,632 | ) |
|
| (35,359,204 | ) | ||||||||||||
Sales of natural gas, oil and NGL, net of production costs |
|
| (12,692,681 | ) |
|
| (25,072,122 | ) |
|
| (32,836,007 | ) | ||||||||||||
Net change in sales prices and production costs |
|
| 37,186,619 |
|
|
| (86,198,778 | ) |
|
| (211,336,729 | ) |
|
| (46,499,344 | ) |
|
| (76,588,460 | ) |
|
| 47,533,281 |
|
Net change in future development and asset retirement costs |
|
| (7,939,156 | ) |
|
| 21,636,258 |
|
|
| 9,569,985 |
|
|
| (20,571 | ) |
|
| 43,607,535 |
|
|
| 1,580,942 |
|
Extensions and discoveries |
|
| 38,582,908 |
|
|
| 11,640,704 |
|
|
| 34,327,400 |
|
|
| 2,841,807 |
|
|
| 7,074,245 |
|
|
| 34,667,557 |
|
Revisions of quantity estimates |
|
| 15,282,587 |
|
|
| (41,716,689 | ) |
|
| (51,375,950 | ) |
|
| (28,332,653 | ) |
|
| (60,308,497 | ) |
|
| (8,391,223 | ) |
Acquisitions (divestitures) of reserves-in-place |
|
| (962,667 | ) |
|
| - |
|
|
| - |
|
|
| 1,169,819 |
|
|
| (3,134,783 | ) |
|
| (307,472 | ) |
Accretion of discount |
|
| 4,789,294 |
|
|
| 14,424,032 |
|
|
| 37,000,855 |
|
|
| 11,039,792 |
|
|
| 20,457,930 |
|
|
| 12,602,209 |
|
Net change in income taxes |
|
| (27,070,430 | ) |
|
| 44,533,277 |
|
|
| 102,592,290 |
|
|
| 17,037,980 |
|
|
| 23,413,194 |
|
|
| (3,057,128 | ) |
Change in timing and other, net |
|
| 16,976,356 |
|
|
| 609,736 |
|
|
| (8,609,940 | ) |
|
| 1,028,475 |
|
|
| (213,367 | ) |
|
| 23,701,120 |
|
Net change |
|
| 51,062,456 |
|
|
| (51,821,092 | ) |
|
| (123,191,293 | ) |
|
| (54,427,376 | ) |
|
| (70,764,325 | ) |
|
| 75,493,279 |
|
End of year |
| $ | 80,832,575 |
|
| $ | 29,770,119 |
|
| $ | 81,591,211 |
|
| $ | 31,134,153 |
|
| $ | 85,561,529 |
|
| $ | 156,325,854 |
|
12.17. QUARTERLY RESULTS OF OPERATIONS (UNAUDITED)
The following is a summary of the Company’s unaudited quarterly results of operations.
|
| Fiscal 2017 |
|
| Fiscal 2020 |
| ||||||||||||||||||||||||||
|
| Quarter Ended |
|
| Quarter Ended |
| ||||||||||||||||||||||||||
|
| December 31 |
|
| March 31 |
|
| June 30 |
|
| September 30 |
|
| December 31 |
|
| March 31 |
|
| June 30 |
|
| September 30 |
| ||||||||
Revenues |
| $ | 7,036,643 |
|
| $ | 13,964,288 |
|
| $ | 12,437,186 |
|
| $ | 12,896,932 |
|
| $ | 10,576,531 |
|
| $ | 11,311,287 |
|
| $ | 2,705,383 |
|
| $ | 4,372,618 |
|
Income (loss) before provision for income taxes |
| $ | (3,345,392 | ) |
| $ | 4,273,433 |
|
| $ | 1,827,758 |
|
| $ | 1,465,134 |
|
| $ | 2,146,114 |
|
| $ | (27,441,814 | ) |
| $ | (4,433,155 | ) |
| $ | (2,512,182 | ) |
Net income (loss) |
| $ | (2,238,392 | ) |
| $ | 3,470,433 |
|
| $ | 1,260,758 |
|
| $ | 1,039,134 |
|
| $ | 1,892,114 |
|
| $ | (20,454,814 | ) |
| $ | (3,555,215 | ) |
| $ | (1,834,122 | ) |
Earnings (loss) per share |
| $ | (0.13 | ) |
| $ | 0.21 |
|
| $ | 0.07 |
|
| $ | 0.06 |
|
| $ | 0.11 |
|
| $ | (1.24 | ) |
| $ | (0.21 | ) |
| $ | (0.07 | ) |
|
|
|
|
|
|
|
|
|
|
|
|
|
|
|
|
|
|
|
|
|
|
|
|
|
|
|
|
|
|
|
|
|
|
| Fiscal 2016 |
|
| Fiscal 2019 |
| ||||||||||||||||||||||||||
|
| Quarter Ended |
|
| Quarter Ended |
| ||||||||||||||||||||||||||
|
| December 31 |
|
| March 31 |
|
| June 30 |
|
| September 30 |
|
| December 31 |
|
| March 31 |
|
| June 30 |
|
| September 30 |
| ||||||||
Revenues |
| $ | 11,445,856 |
|
| $ | 7,592,852 |
|
| $ | 9,864,090 |
|
| $ | 10,157,985 |
|
| $ | 26,328,994 |
|
| $ | 7,636,213 |
|
| $ | 16,342,394 |
|
| $ | 15,728,084 |
|
Income (loss) before provision for income taxes |
| $ | (5,167,118 | ) |
| $ | (12,013,161 | ) |
| $ | (1,730,795 | ) |
| $ | 913,190 |
|
| $ | 16,306,940 |
|
| $ | (2,061,334 | ) |
| $ | 5,919,236 |
|
| $ | (74,390,780 | ) |
Net income (loss) |
| $ | (2,799,118 | ) |
| $ | (7,438,161 | ) |
| $ | (786,795 | ) |
| $ | 737,190 |
|
| $ | 12,735,940 |
|
| $ | (1,931,334 | ) |
| $ | 4,604,236 |
|
| $ | (56,153,780 | ) |
Earnings (loss) per share |
| $ | (0.17 | ) |
| $ | (0.44 | ) |
| $ | (0.05 | ) |
| $ | 0.05 |
|
| $ | 0.75 |
|
| $ | (0.11 | ) |
| $ | 0.28 |
|
| $ | (3.35 | ) |
(90)
ITEM 9 | CHANGES IN AND |
None
(a) EVALUATION OF DISCLOSURE CONTROLS AND PROCEDURES
The Company maintains “disclosure controls and procedures,” as such term is defined in Rule 13a-15(e) under the Exchange Act, that are designed to ensure that information required to be disclosed in reports the Company files or submits under the Exchange Act is recorded, processed, summarized and reported within the time periods specified in SEC rules and forms, and that such information is collected and communicated to management, including the Company’s President/CEOChief Executive Officer and Vice President/CFO,Chief Financial Officer, as appropriate, to allow timely decisions regarding required disclosure. In designing and evaluating its disclosure controls and procedures, management recognized that no matter how well conceived and operated, disclosure controls and procedures can provide only reasonable, not absolute, assurance that the objectives of the disclosure controls and procedures are met. The Company’s disclosure controls and procedures have been designed to meet, and management believes that they do meet, reasonable assurance standards. Based on their evaluation as of the end of the fiscal period covered by this report, the Chief Executive Officer and Chief Financial Officer have concluded that, subject to the limitations noted above, the Company’s disclosure controls and procedures were effective.
(b) MANAGEMENT’S REPORT ON INTERNAL CONTROL OVER FINANCIAL REPORTING
The Company’s management is responsible for establishing and maintaining adequate “internal control over financial reporting,” as such term is defined in Exchange Act Rule 13a-15(f). Our internal control structure is designed to provide reasonable assurance to our management and Board of Directors regarding the reliability of financial reporting and the preparation and fair presentation of our financial statements prepared for external purposes in accordance with U.S. generally accepted accounting principles. The Company’s management, including the President/CEOChief Executive Officer and Vice President/CFO,Chief Financial Officer, conducted an evaluation of the effectiveness of its internal control over financial reporting based on the Internal Control – Integrated Framework issued by the Committee of Sponsoring Organizations of the Treadway Commission. Based on the results of this evaluation, the Company’s management concluded that its internal control over financial reporting was effective as of September 30, 2017.2020.
Because of its inherent limitations, internal control over financial reporting can provide only reasonable assurance that the objectives of the control system are met and may not prevent or detect misstatements. In addition, any evaluation of the effectiveness of internal controls over financial reporting in future periods is subject to risk that those internal controls may become inadequate because of changes in conditions, or that the degree of compliance with the policies or procedures may deteriorate.
The Company’s independent registered public accounting firm, Ernst & Young LLP, has issued an attestation report regarding its assessment of the Company’s internal control over financial reporting as of September 30, 2020, presented preceding the Company’s financial statements included in this Form 10-K. Additionally, the financial statements for the years ended September 30, 2019 and 2018, covered in this 2020 Annual Report on Form 10-K, have also been audited by the Company’s independent registered public accounting firm, whose report is presented preceding their report on the Company’s internal control over financial reporting.
(c) CHANGES IN INTERNAL CONTROL OVER FINANCIAL REPORTING
Certain changes were made to the Company’s internal controls during the fiscal fourth quarter for validating the Company’s interest in new wells to remediate the material weakness identified in the second quarter. There were no other changes in the Company’s internal control over financial reporting that have materially affected, or are reasonably likely to materially affect, the Company’s internal control over financial reporting made during the fiscal quarter ended September 30, 2017,2020, or subsequent to the date the assessment was completed.
None
(91)
The information called for by Part III of Form 10-K (Item 10 – Directors and Executive Officers of the Registrant,and Corporate Governance, Item 11 – Executive Compensation, Item 12 – Security Ownership of Certain Beneficial Owners and Management and Related Stockholder Matters, Item 13 – Certain Relationships and Related Transactions, and Item 14 – Principal AccountantAccounting Fees and Services), is incorporated by reference from the Company’s definitive proxy statement, which will be filed with the SEC within 120 days after the end of the fiscal year to which this report relates.
(92)
FINANCIAL STATEMENT SCHEDULES
The Company has omitted all schedules because the conditions requiring their filing do not exist or because the required information appears in the Company’s Financial Statements, including the notes to those statements.
EXHIBITS
(1.1) | ||
(3) |
| |
|
| |
(3.1) | ||
(4) |
| Instruments defining the rights of security holders (incorporated by reference to Certificate of Incorporation and By-Laws listed above) |
(5.1) | Opinion of Derrick & Briggs, LLP (incorporated by reference to Form 8-K dated September 1, 2020) | |
*(10.1) |
| |
*(10.2) |
| |
(10.3) |
| |
(10.4) |
| |
(10.5) |
| |
(10.6) |
| |
|
| |
(10.8) | ||
(10.9) | ||
(10.10) | ||
*(10.11) | ||
*(10.12) | ||
*(10.13) | ||
(10.14) | ||
(10.15) |
(93)
(32.2) |
| Certification of Chief Financial Officer pursuant to Section 906 of the
|
| Report of DeGolyer and MacNaughton, Independent Petroleum Engineering Consultants | |
(101.INS) |
| XBRL Instance Document |
(101.SCH) |
| XBRL Taxonomy Extension Schema Document |
(101.CAL) |
| XBRL Taxonomy Extension Calculation Linkbase Document |
(101.LAB) |
| XBRL Taxonomy Extension Labels Linkbase Document |
(101.PRE) |
| XBRL Taxonomy Extension Presentation Linkbase Document |
(101.DEF) |
| XBRL Taxonomy Extension Definition Linkbase Document |
(104) | Cover Page Interactive Data File (formatted as Inline XBRL and contained in Exhibit 101) | |
|
|
|
* |
| Indicates management contract or compensatory plan or arrangement |
REPORTS ON FORM 8-K
Form 8-K dated October 26, 2017; item 1.01 – Enter Into a Material Definitive Agreement
Form 8-K dated November 6, 2017; item 8.01 – Other Events
SIGNATURES
Pursuant to the requirements of Section 13 of the Securities Exchange Act of 1934, the registrant caused this Report to be signed on its behalf by the undersigned, thereunto duly authorized.
|
|
By: /s/ |
|
President and Chief Executive Officer |
|
Date: December |
(94)
In accordance withPursuant to the requirements of the Securities Exchange Act of 1934, this report has been signed below by the following persons on behalf of the registrant and in the capacities and on the dates indicated.
Signature |
| Title |
| Date | |
|
|
|
|
| |
/s/
|
| President and Chief Executive Officer |
| December | |
|
|
|
|
| |
/s/
|
| Vice President and Chief Financial Officer |
| December | |
|
|
|
|
| |
/s/ Mark T. Behrman Mark T. Behrman |
| Lead Independent Director |
| December | |
|
|
|
|
| |
/s/ Lee M. Canaan Lee M. Canaan |
| Director |
| December | |
|
|
|
|
| |
/s/
|
|
|
| December | |
|
|
|
|
| |
/s/
|
| Director |
| December | |
|
|
|
|
| |
|
|
| |||
|
|
|
|
| |
|
|
| |||
|
|
|
(95)82