UNITED STATES
SECURITIES AND EXCHANGE COMMISSION
Washington, D.C. 20549
FORM 10-K
☒
| ANNUAL REPORT PURSUANT TO SECTION 13 OR 15(d) OF THE SECURITIES EXCHANGE ACT OF 1934
|
☒ ANNUAL REPORT PURSUANT TO SECTION 13 OR 15(d) OF THE SECURITIES EXCHANGE ACT OF 1934
For the fiscal year ended December 31 2017, 2023
OR
☐
| TRANSITION REPORT PURSUANT TO SECTION 13 OR 15(d) OF THE SECURITIES EXCHANGE ACT OF 1934
|
☐ TRANSITION REPORT PURSUANT TO SECTION 13 OR 15(d) OF THE SECURITIES EXCHANGE ACT OF 1934
For the transition period fromto
Commission File Number 000-24435
MICROSTRATEGY INCORPORATED
(Exact Name of Registrant as Specified in Its Charter)
| | |
Delaware | 1850 Towers Crescent Plaza, Tysons Corner, VA22182 | 51-0323571 |
(State of Incorporation) | (Address of Principal Executive Offices) (Zip Code) | (I.R.S. Employer Identification No.) |
Registrant’s Telephone Number, Including Area Code: (703) (703) 848-8600
Securities registered pursuant to Section 12(b) of the Act:
| | | | |
Title of each classEach Class |
| Trading Symbol |
| Name of each exchangeEach Exchange on which registeredRegistered |
Class A common stock, par value $0.001 per share |
| MSTR |
| The NASDAQNasdaq Global Select Market |
Securities registered pursuant to Section 12(g) of the Act: Not applicable
Indicate by check mark if the registrant is a well-known seasoned issuer, as defined in Rule 405 of the Securities Act. Yes☒ No ☐
Indicate by check mark if the registrant is not required to file reports pursuant to Section 13 or Section 15(d) of the Act. Yes ☐No☒
Indicate by check mark whether the registrant: (1) has filed all reports required to be filed by Section 13 or 15(d) of the Securities Exchange Act of 1934 during the preceding 12 months (or for such shorter period that the registrant was required to file such reports), and (2) has been subject to such filing requirements for the past 90 days. Yes☒ No ☐
Indicate by check mark whether the registrant has submitted electronically and posted on its corporate website, if any, every Interactive Data File required to be submitted and posted pursuant to Rule 405 of Regulation S-T (§232.405 of this chapter) during the preceding 12 months (or for such shorter period that the registrant was required to submit and post such files). Yes☒ No ☐
Indicate by check mark if disclosure of delinquent filers pursuant to Item 405 of Regulation S-K is not contained herein, and will not be contained, to the best of registrant’s knowledge, in definitive proxy or information statements incorporated by reference in Part III of this Form 10-K or any amendment to this Form 10-K. ☒
Indicate by check mark whether the registrant is a large accelerated filer, an accelerated filer, a non-accelerated filer, a smaller reporting company, or an emerging growth company. See the definitions of “large accelerated filer,” “accelerated filer,” “smaller reporting company,” and “emerging growth company” in Rule 12b-2 of the Exchange Act. (Check one):
| | | |
Large accelerated filer | ☒ | Accelerated filer | ☐ |
Non-accelerated filer | ☐(Do not check if a smaller reporting company) | Smaller reporting company | ☐ |
|
| Emerging growth company | ☐ |
If an emerging growth company, indicate by check mark if the registrant has elected not to use the extended transition period for complying with any new or revised financial accounting standards provided pursuant to Section 13(a) of the Exchange Act. ☐
Indicate by check mark whether the registrant has filed a report on and attestation to its management’s assessment of the effectiveness of its internal control over financial reporting under Section 404(b) of the Sarbanes-Oxley Act (15 U.S.C. 7262(b)) by the registered public accounting firm that prepared or issued its audit report. ☒
If securities are registered pursuant to Section 12(b) of the Act, indicate by check mark whether the financial statements of the registrant included in the filing reflect the correction of an error to previously issued financial statements. ☐
Indicate by check mark whether any of those error corrections are restatements that required a recovery analysis of incentive-based compensation received by any of the registrant’s executive officers during the relevant recovery period pursuant to §240.10D-1(b). ☐
Indicate by check mark whether the registrant is a shell company (as defined in Rule 12b-2 of the Act). Yes ☐ No ☒
The aggregate market value of the voting and non-voting common equity held by non-affiliates of the registrant (based on the last reported sale price of the registrant’s class A common stock on June 30, 20172023 on the NASDAQNasdaq Global Select Market) was approximately $1,807.9 million.$4.133 billion.
The numberAs of February 1, 2024, the registrant had 15,004,100 and 1,964,025 shares of the registrant’s class A common stock and class B common stock outstanding, on January 26, 2018 was 9,411,810 and 2,035,184, respectively.
Documents incorporated by reference: Portions of the definitive proxy statement for the 20182024 Annual Meeting of Stockholders of the Registrant to be filed subsequently with the SEC are incorporated by reference into Part III of this Annual Report on Form 10-K to the extent indicated herein.
| | | | | |
Auditor Firm Id: | 185 | Auditor Name: | KPMG LLP | Auditor Location: | McLean, Virginia |
MICROSTRATEGY INCORPORATED
TABLE OF CONTENTS
The trademarks and registered trademarks of MicroStrategy Incorporated and its subsidiaries referred to herein include, but are not limited to, MicroStrategy, MicroStrategy 10,ONE, MicroStrategy 10.9, MicroStrategy Cloud, MicroStrategy Analytics, MicroStrategy Mobile, MicroStrategy Desktop, MicroStrategy Web, MicroStrategy Server, MicroStrategy Distribution Services, MicroStrategy Data Mining Services, MicroStrategy Library, MicroStrategy Services,Auto, Intelligence Everywhere, HyperIntelligence, MicroStrategy Consulting, MicroStrategy Education, Usher, Usher Professional, Usher Analytics, Usher Network Manager, Usher Security, Dossier, IntelligentMicroStrategy Cloud, Enterprise andSemantic Graph, MicroStrategy Services, Global Delivery Center.Center, and Intelligent Enterprise. Third-party product and company names mentioned herein may be the trademarks of their respective owners.
CERTAIN DEFINITIONS
All references in this Annual Report on Form 10-K (“Annual Report”) to “MicroStrategy,” the “Company,” “we,” “us,” and “our” refer to MicroStrategy Incorporated and its consolidated subsidiaries (unless the context otherwise indicates).
FORWARD-LOOKING INFORMATION AND RISK FACTOR SUMMARY
This Annual Report on Form 10-K contains forward-looking statements within the meaning of Section 21E of the Securities Exchange Act of 1934, as amended (the “Exchange Act”). For this purpose, any statements contained herein that are not statements of historical fact, including, without limitation, certain statements under “Item 1. Business,” “Item 1A. Risk Factors,” and “Item 7. Management’s Discussion and Analysis of Financial Condition and Results of Operations” and located elsewhere herein regarding industry prospects andconcerning our plans, objectives, goals, beliefs, business strategies, future events, business conditions, results of operations, or financial position, business outlook, business trends and other information, may be deemed to be forward-looking statements. Without limiting the foregoing, the words “believes,such as “might,” “will,” “may,” “should,” “estimates,” “expects,” “continues,” “contemplates,” “anticipates,” “projects,” “plans,” “expects,“potential,” “predicts,” “intends,” “believes,” “forecasts,” “future,” “targeted,” “goal” and variations of such words or similar expressions are intended to identify forward-looking statements. The forward-looking statements are not historical facts, and are based upon our current expectations, beliefs, estimates and projections, and various assumptions, many of which, by their nature, are inherently uncertain and beyond our control. Our expectations, beliefs, estimates and projections are expressed in good faith and we believe there is a reasonable basis for them. However, there can be no assurance that management’s expectations, beliefs, estimates and projections will be achieved and actual results may vary materially from what is expressed in or indicated by the forward-looking statements.
There are a number of risks, uncertainties and other important factors, discussed under “Item 1A. Risk Factors,” among others,many of which are beyond our control, that could cause our actual results to differ materially from those indicated bythe forward-looking statements madecontained herein and presented elsewhere by management from time to time. Such forward-looking statements represent management’s current expectationsThese principal risks, uncertainties and other important factors are discussed more fully under “Item 1A. Risk Factors” and include, but are not limited to, the following:
Risks Related to Our Business in General
•Our quarterly operating results, revenues, and expenses may fluctuate significantly, which could have an adverse effect on the market price of our stock;
•We may have exposure to greater than anticipated tax liabilities;
Risks Related to Our Bitcoin Acquisition Strategy and Holdings
•Our bitcoin acquisition strategy exposes us to various risks associated with bitcoin;
•Bitcoin is a highly volatile asset, and fluctuations in the price of bitcoin have in the past influenced and are inherently uncertain. Investorslikely to continue to influence our financial results and the market price of our class A common stock;
•Our historical financial statements do not reflect the potential variability in earnings that we may experience in the future relating to our bitcoin holdings;
•The availability of spot bitcoin ETPs may adversely affect the market price of our class A common stock;
•Our bitcoin acquisition strategy subjects us to enhanced regulatory oversight;
•The concentration of our bitcoin holdings enhances the risks inherent in our bitcoin acquisition strategy;
•Our bitcoin holdings are warned that actualless liquid than our existing cash and cash equivalents and may not be able to serve as a source of liquidity for us to the same extent as cash and cash equivalents;
•If we or our third-party service providers experience a security breach or cyberattack and unauthorized parties obtain access to our bitcoin, or if our private keys are lost or destroyed, or other similar circumstances or events occur, we may lose some or all of our bitcoin and our financial condition and results may differof operations could be materially adversely affected;
•Our bitcoin acquisition strategy exposes us to risk of non-performance by counterparties;
Risks Related to Our Enterprise Analytics Software Business Strategy
•We depend on revenue from
management’s expectations.
PART I
Overview
MicroStrategy® is a leading worldwide provider of enterprise analytics and mobility software. Our mission is to provide enterprise customers with a world-classsingle software platform and expertrelated services so they can deploy unique intelligence applications.
MicroStrategy 10™, our flagship platform offering, consolidates analytics and mobility in a single unified platform. The MicroStrategy 10 platform is available on Windows®, Linux and Amazon Web Services (“AWS”), and as a hosted service offering through MicroStrategy Cloud™. Our platform offers a comprehensive suite of business intelligence functionality, from data discovery to mobile analytics, data mining, Big Data analytics, enterprise reporting and powerful identity intelligence generated by digital credentials. MicroStrategy 10 builds on proven enterprise capabilities to make sophisticated, high-performance analytics more accessible, easier to use, and faster. MicroStrategy 10 consists of MicroStrategy Analytics™, MicroStrategy Mobile™, and Usher®.
MicroStrategy Analytics empowers large organizations to analyze vast amounts of data and securely distribute actionable business insight throughout an enterprise, while also being able to cater to smaller workgroups and departmental use via MicroStrategy Desktop™. MicroStrategy Analytics delivers reports and dashboards, and enables users to conduct ad hoc analysis and share insights anywhere, anytime, via mobile devices (via MicroStrategy Mobile) or the web (via MicroStrategy Web™). It also combines the agility and productivity of self-service visual data discovery with the security, scalability, and governance features of enterprise-grade business intelligence. Additionally, MicroStrategy Analytics delivers powerful identity intelligence on user behavior and resource utilization (via Usher).
MicroStrategy Web is the primary interface for analysts, data scientists, consumers and developers, offering interactive reporting, dashboarding, and ad-hoc data discovery capabilities through a web browser. With MicroStrategy Web, users can design and deliver reports and dashboards across various styles of business intelligence, including scorecards, pixel-perfect documents and invoices, and interactive reports and dashboards, as well as revenue from our installed customer base;
•As our customers increasingly shift from a product license model to a cloud subscription model, we could face higher future rates of attrition, and such a shift could continue to affect the timing of revenue recognition or reduce product licenses and product support revenues, which could materially adversely affect our operating results;
•We use channel partners and if we are unable to maintain successful relationships with them, our business, operating results, and financial condition could be materially adversely affected;
•Our recognition of deferred revenue and advance payments is subject to future performance obligations and may not be representative of revenues for visualsucceeding periods;
•Our results in any particular period may depend on the number and volume of large transactions in that period and these transactions may involve lengthier, more complex, and more unpredictable sales cycles than other transactions;
Risks Related to Our Technology and Intellectual Property
•If we are unable to develop and release new software product offerings or enhancements to our existing offerings in a timely and cost-effective manner, our business, operating results, and financial condition could be materially adversely affected;
•The nature of our software makes it particularly susceptible to undetected errors, bugs, or security vulnerabilities, which could cause problems with how the software performs and, in turn, reduce demand for our software, reduce our revenue, and lead to litigation claims against us;
Risks Related to Our Operations
•Business disruptions, including interruptions, delays, or failures of our systems, third-party data discovery.center hosting facility, or other third-party services, as a result of geopolitical tensions, acts of terrorism, natural disasters, pandemics (like the COVID-19 pandemic), and similar events, could materially adversely affect our operating results or result in a material weakness in our internal controls that could adversely affect the market price of our stock;
•Our international operations are complex and expose us to risks that could have a material adverse effect on our business, operating results, and financial condition;
•We face a variety of risks in doing business with U.S. and foreign federal, state, and local governments and government agencies, including risks related to the procurement process, budget constraints and cycles, termination of contracts, and compliance with government contracting requirements;
•Changes in laws or regulations relating to privacy or the collection, processing, disclosure, storage, localization, or transmission of personal data, or any actual or perceived failure by us or our third-party service providers to comply with such laws and regulations, contractual obligations, or applicable privacy policies, could materially adversely affect our business;
•If we or our third-party service providers experience a disruption due to a cybersecurity attack or security breach and unauthorized parties obtain access to our customers’, prospects’, vendors’, or channel partners’ data, our data, our networks or other systems, or the cloud environments we manage, our offerings may be perceived as not being secure, our reputation may be harmed, demand for our offerings may be reduced, our operations may be disrupted, we may incur significant legal and financial liabilities, and our business could be materially adversely affected;
Risks Related to Our Class A Common Stock
•The market price of our class A common stock has been and may continue to be volatile;
•Because of the rights of our two classes of common stock and because we are controlled by Michael J. Saylor, who beneficially owns the majority of our class B common stock, Mr. Saylor could transfer control of MicroStrategy Webto a third party without the approval of our Board of Directors or our other stockholders, prevent a third party from acquiring us, or limit the ability of our other stockholders to influence corporate matters;
•Future sales, or the perception of future sales, of our class A common stock, convertible debt instruments or other convertible securities could depress the price of our class A common stock;
Risks Related to Our Outstanding and Potential Future Indebtedness
•Our level and terms of indebtedness could adversely affect our ability to raise additional capital to further execute on our bitcoin acquisition strategy, fund our enterprise analytics software operations, and take advantage of new business opportunities;
•We may be unable to service our indebtedness, which could cause us to default on our debt obligations and could force us into bankruptcy or liquidation;
•We may be required to repay the 2028 Secured Notes prior to their stated maturity date, if the springing maturity feature is triggered;
•We may not have the ability to raise the funds necessary to settle for cash conversions of the Convertible Notes; and
•The conditional conversion feature of the Convertible Notes, if triggered, may adversely affect our financial condition and operating results.
We caution you that the foregoing list of important factors may not contain all of the material factors that are important to you. In addition, in light of these risks and uncertainties, the matters referred to in the forward-looking statements contained herein may not in fact occur. The forward-looking statements made herein relate only to events as of the date on which the statements were made. Except as may be required by law, we undertake no obligation to update our forward-looking statements to reflect events and circumstances after the date on which the statements were made or to reflect the occurrence of unanticipated events.
PART I
Item 1. Business
Overview
MicroStrategy® recently announced that it considers itself the world’s first Bitcoin development company. We are a publicly-traded operating company committed to the continued development of the Bitcoin network through our activities in the financial markets, advocacy and technology innovation. As an operating business, we are able to use cash flows as well as proceeds from equity and debt financings to accumulate bitcoin, which serves as our primary treasury reserve asset. We also develop and provide industry-leading AI-powered enterprise analytics software that promotes our vision of Intelligence Everywhere™, and are using our software development capabilities to develop bitcoin applications. Our software business, which we have operated for over 30 years, is our predominant operational focus, providing cash flows and enabling us to pursue our bitcoin strategy. We believe that the combination of our operating structure, bitcoin strategy and focus on technology innovation differentiates us in the digital assets industry.
Bitcoin Strategy
Our bitcoin strategy includes (i) acquiring bitcoin using cash flows from operations and proceeds from equity and debt financings, (ii) developing product innovations that leverage Bitcoin blockchain technology, and (iii) periodically engaging in advocacy and educational activities regarding the continued acceptance and value of bitcoin as an open, secure protocol for an internet-native digital asset and the Lightning Network.
Bitcoin Acquisition Strategy
We believe that bitcoin is an attractive asset because it can serve as a store of value, supported by a robust and public open-source architecture, that is untethered to sovereign monetary policy. We also connectbelieve that, due to its limited supply, bitcoin offers the potential to serve as a hedge against inflation in the long-term and, if its adoption increases, the opportunity for appreciation in value.
In September 2020, our Board of Directors adopted a Treasury Reserve Policy (as amended to date, the “Treasury Reserve Policy”) that updated our treasury management and capital allocation strategies, under which our treasury reserve assets will consist of:
•cash and cash equivalents and short-term investments (“Cash Assets”) held by us that exceed working capital requirements; and
•bitcoin held by us, with bitcoin serving as the primary treasury reserve asset on an ongoing basis, subject to market conditions and anticipated needs of the business for Cash Assets.
In the first quarter of 2021, we adopted, in addition to and in conjunction with our Treasury Reserve Policy, a corporate strategy of acquiring and holding bitcoin, and from time to time, subject to market conditions, issuing debt or equity securities or engaging in other capital raising transactions with the objective of using the proceeds to purchase bitcoin.
Our bitcoin acquisition strategy generally involves acquiring bitcoin with our liquid assets that exceed working capital requirements, and from time to time, subject to market conditions, issuing debt or equity securities or engaging in other capital raising transactions with the objective of using the proceeds to purchase bitcoin. We view our bitcoin holdings as long-term holdings and expect to continue to accumulate bitcoin. We have not set any specific target for the amount of bitcoin we seek to hold, and we will continue to monitor market conditions in determining whether to engage in additional financings to purchase additional bitcoin. This overall strategy also contemplates that we may (i) periodically sell bitcoin for general corporate purposes, including to generate cash for treasury management (which may include debt repayment), or in connection with strategies that generate tax benefits in accordance with applicable law, (ii) enter into additional capital raising transactions that are collateralized by our bitcoin holdings, and (iii) consider pursuing strategies to create income streams or otherwise generate funds using our bitcoin holdings.
Bitcoin-Related Innovations
We believe the Bitcoin network provides the infrastructure and opportunity for the development of financial and technological innovations, such as the Lighting Network (a decentralized second-layer payment protocol built on top of the Bitcoin blockchain that is intended to enable fast and less costly transactions). We are working to develop software products and service offerings that leverage the Lightning Network and exploring additional opportunities to develop offerings that leverage Bitcoin blockchain-based technology.
Bitcoin Advocacy and Education
Through various initiatives, such as our Bitcoin for Corporations sessions at MicroStrategy World, we seek to engage with and educate others about the opportunities available if they adopt bitcoin as a treasury reserve asset and to develop tools that leverage the Bitcoin blockchain and Lightning Network. In 2023, we also provided comments to the Financial Accounting Standards Board (“FASB”) on their published proposal with respect to the accounting treatment of digital assets. The FASB published the final standard in December 2023.
Our Bitcoin Holdings
During 2023, we purchased a total of approximately 56,650 bitcoins at an aggregate purchase price of approximately $1.902 billion for an average purchase price of approximately $33,580 per bitcoin, inclusive of fees and expenses. We did not sell any bitcoin during 2023. During 2022, we purchased a total of approximately 8,813 bitcoins at an aggregate purchase price of approximately $287.9 million for an average purchase price of approximately $32,670 per bitcoin, inclusive of fees and expenses, and sold a total of approximately 704 bitcoins for cash proceeds of approximately $11.8 million at an average sale price of approximately $16,786 per bitcoin, net of fees and expenses. During the period between January 1, 2024 and February 14, 2024, we purchased a total of approximately 850 bitcoins at an aggregate purchase price of approximately $37.2 million for an average purchase price of approximately $43,723 per bitcoin, inclusive of fees and expenses. We did not sell any bitcoins during the period between January 1, 2024 and February 14, 2024. Refer to the “Our Bitcoin Acquisition Strategy” section under “Item 7. Management’s Discussion and Analysis of Financial Condition and Results of Operations” for further information regarding our bitcoin purchases, including the source of capital used to purchase bitcoin.
At December 31, 2023, we carried $3.626 billion of digital assets on our balance sheet, consisting of approximately 189,150 bitcoins and reflecting $2.269 billion in cumulative impairment losses attributable to bitcoin trading price fluctuations, and held $46.8 million in cash and cash equivalents. At December 31, 2022, we carried $1.840 billion of digital assets on our balance sheet, consisting of approximately 132,500 bitcoins and reflecting $2.153 billion in cumulative impairment losses attributable to bitcoin trading price fluctuations, and held $43.8 million in cash and cash equivalents.
As of February 14, 2024, we held approximately 190,000 bitcoins that were acquired at an aggregate purchase price of $5.933 billion and an average purchase price of approximately $31,224 per bitcoin, inclusive of fees and expenses. As of February 14, 2024, at 4:00 p.m. Eastern Time, the market price of one bitcoin reported on the Coinbase exchange (our principal market) was $51,744.68.
Overview of the Bitcoin Industry and Market
Bitcoin is a digital asset that is issued by and transmitted through an open-source protocol, known as the Bitcoin protocol, collectively maintained by a peer-to-peer network of decentralized user nodes. This network hosts a public transaction ledger, known as the Bitcoin blockchain, on which bitcoin holdings and all validated transactions that have ever taken place on the Bitcoin network are recorded. Balances of bitcoin are stored in individual “wallet” functions, which associate network public addresses with one or more “private keys” that control the transfer of bitcoin. The Bitcoin blockchain can be updated without any single entity owning or operating the network.
Creation of New Bitcoin and Limits on Supply
New bitcoin is created and allocated by the Bitcoin protocol through a “mining” process that rewards users that validate transactions in the Bitcoin blockchain. Validated transactions are added in “blocks” approximately every 10 minutes. The mining process serves to validate transactions and secure the Bitcoin network. Mining is a competitive and costly operation that requires a large amount of computational power to solve complex mathematical algorithms. This expenditure of computing power is known as “proof of work.” To incentivize miners to incur the costs of mining bitcoin, the Bitcoin protocol rewards miners that successfully validate a block of transactions with newly generated bitcoin.
The Bitcoin protocol limits the total number of bitcoin that can be generated over time to 21 million. The current reward for miners that successfully validate a block of transactions is 6.25 bitcoin per mined block. Based on current mining rates, we anticipate the reward will decrease by half to 3.125 bitcoin per mined block sometime in April 2024. This decrease in mining reward is referred to as a bitcoin halving, and it occurs after every 210,000 blocks are mined, which has historically occurred approximately every four years.
Modifications to the Bitcoin Protocol
Bitcoin is an open-source network that has no central authority, so no one person can unilaterally make changes to the software that runs the network. However, there is a core group of developers that maintain the code for the Bitcoin protocol, and they can propose changes to the source code and release periodic updates and other changes. Unlike most software that has a central entity that can push updates to users, bitcoin is a peer-to-peer network in which individual network participants, called nodes, decide whether to upgrade the software and accept the new changes. As a practical matter, a modification becomes part of the Bitcoin protocol only if the proposed changes are accepted by participants collectively having the most processing power, known as hash rate, on the network. If a certain percentage of the nodes reject the changes, then a “fork” takes place and participants can choose the version of the software they want to run.
Forms of Attack Against the Bitcoin Network and Wallets
Blockchain technology has many built-in security features that make it difficult for hackers and other malicious actors to corrupt the protocol or blockchain. However, as with any computer network, the Bitcoin network may be subject to certain attacks. Some forms of attack include unauthorized access to wallets that hold bitcoin and direct attacks, like “51% attacks” or “denial-of-service attacks” on the Bitcoin protocol.
Bitcoin is controllable only by the possessor of both the unique public key and private key(s) relating to the local or online digital wallet in which the bitcoin is held. Private keys used to access bitcoin balances are not widely distributed and are typically held on hardware
(which can be physically controlled by the holder or by a third party such as a custodian) or via software programs on third-party servers. One form of obtaining unauthorized access to a wallet occurs following a phishing attack where the attacker deceives the victim and manipulates them into sharing their private keys for their digital wallet or other sensitive information. Other similar attacks may also result in the loss of private keys and the inability to access, and effective loss of, the corresponding bitcoin. See “Item 1A. Risk Factors – Risks Related to Our Bitcoin Acquisition Strategy and Holdings – We face risks relating to the custody of our bitcoin, including the loss or destruction of private keys required to access our bitcoin and cyberattacks or other data loss relating to our bitcoin.”
A “51% attack” may occur when a group of miners attain more than 50% of the Bitcoin network’s mining power, thereby enabling them to control the Bitcoin network and protocol and manipulate the blockchain. A “denial-of-service attack” occurs when legitimate users are unable to access information systems, devices, or other network resources due to the actions of a malicious actor flooding the network with traffic until the network is unable to respond or crashes. The Bitcoin network has been, and can be in the future, subject to denial-of-service attacks, which can result in temporary delays in block creation and in the transfer of bitcoin. See “Item 1A. Risk Factors – Risks Related to Our Bitcoin Acquisition Strategy and Holdings – Bitcoin and other digital assets are novel assets, and are subject to significant legal, commercial, regulatory and technical uncertainty.”
Bitcoin Industry Participants
The primary Bitcoin industry participants are miners, investors and traders, digital asset exchanges and service providers, including custodians, brokers, payment processors, wallet providers and financial institutions.
Miners. Miners range from bitcoin enthusiasts to professional mining operations that design and build dedicated mining machines and data centers, including mining pools, which are groups of miners that act cohesively and combine their processing power to mine bitcoin blocks. See“—Creation of New Bitcoin and Limits on Supply”above.
Investors and Traders. Bitcoin investors and traders include individuals and institutional investors who, directly or indirectly, purchase, hold, and sell bitcoin or bitcoin-based derivatives. On January 10, 2024, the Securities and Exchange Commission (“SEC”) issued an order approving several applications for the listing and trading of shares of spot bitcoin exchange-traded products (“ETPs”) on U.S. national securities exchanges. While the SEC had previously approved exchange-traded funds where the underlying assets were bitcoin futures contracts, this order represents the first time the SEC has approved the listing and trading of ETPs that acquire, hold and sell bitcoin directly. ETPs can be bought and sold on a stock exchange like traditional stocks, and provide investors with another means of gaining economic exposure to bitcoin through traditional brokerage accounts.
Digital Asset Exchanges. Digital asset exchanges provide trading venues for purchases and sales of bitcoin in exchange for fiat or other digital assets. Bitcoin can be exchanged for fiat currencies, such as the U.S. dollar, at rates of exchange determined by market forces on bitcoin trading platforms, which are not regulated in the same manner as traditional securities exchanges. In addition to these platforms, over-the-counter markets and derivatives markets for bitcoin also exist. The value of bitcoin within the market is determined, in part, by the supply of and demand for bitcoin in the global bitcoin market, market expectations for the adoption of bitcoin as a store of value, the number of merchants that accept bitcoin as a form of payment, and the volume of peer-to-peer transactions, among other factors. For a discussion of risks associated with digital asset exchanges, see “Item 1A. Risk Factors—Risks Related to Our Bitcoin Acquisition Strategy and Holdings—Due to the unregulated nature and lack of transparency surrounding the operations of many bitcoin trading venues, bitcoin trading venues may experience greater fraud, security failures or regulatory or operational problems than trading venues for more established asset classes, which may result in a loss of confidence in bitcoin trading venues and adversely affect the value of our bitcoin.”
Service providers. Service providers offer a multitude of services to other participants in the Bitcoin industry, including custodial and trade execution services, commercial and retail payment processing, loans secured by bitcoin collateral, and financial advisory services. If adoption of the Bitcoin network continues to materially increase, we anticipate that service providers may expand the currently available range of services and that additional parties will enter the service sector for the Bitcoin network.
Other Digital Assets
As of the date of this Annual Report, bitcoin was the largest digital asset by market capitalization. However, there are numerous alternative digital assets and many entities, including consortia and financial institutions, are researching and investing resources into private or permissioned blockchain platforms or digital assets that do not use proof-of-work mining like the Bitcoin network. For example, in late 2022, the Ethereum network transitioned to a “proof-of-stake” mechanism for validating transactions that requires significantly less computing power than proof-of-work mining. Other alternative digital assets that compete with bitcoin in certain ways include “stablecoins,” which are designed to maintain a constant price because of their issuers’ promise to hold high-quality liquid assets (such as U.S. dollar deposits and short-term U.S. treasury securities) equal to the total value of stablecoins in circulation. Stablecoins have grown rapidly as an alternative to bitcoin and other digital assets as a medium of exchange and store of value, particularly on digital asset trading platforms. As of December 31, 2023, two of the seven largest digital assets by market capitalization are U.S. dollar-backed stablecoins.
Additionally, central banks in some countries have started to introduce digital forms of legal tender. For example, China’s central bank digital currency (“CBDC”) project was made available to consumers in January 2022, and governments including the United States and
the European Union have been discussing the potential creation of new CBDCs. For a discussion of risks relating to the emergence of other digital assets, see “Item 1A. Risk Factors – Risks Related to Our Bitcoin Acquisition Strategy and Holdings—The emergence or growth of other digital assets, including those with significant private or public sector backing, could have a negative impact on the price of bitcoin and adversely affect our business.”
Custody of our Bitcoin
We hold substantially all of our bitcoin in custody accounts at U.S.-based, institutional-grade custodians that have demonstrated records of regulatory compliance and information security. As a result, the primary counterparty risk we are exposed to with respect to our bitcoin is performance obligations under the various custody arrangements into which we have entered. We custody our bitcoin across multiple custodians to diversify our potential risk exposure to any one custodian. Our custodial services contracts do not restrict our ability to reallocate our bitcoin among our custodians, and our bitcoin holdings may be concentrated with a single custodian from time to time. In light of the significant amount of bitcoin we hold, we continually seek to engage additional digital asset custodians to further diversify the custody of our bitcoin.
We carefully select the custodians that custody our bitcoin after undertaking a due diligence process. As part of our custodian selection process, we evaluate for and select custodians that can demonstrate that they operate with strict security protocols, including multifactor authentication procedures designed to safekeep our bitcoin. In addition, our custodial services agreements generally specify that the private keys that control our bitcoin will be held in offline or “cold” storage, which is designed to mitigate risks that a system may be susceptible to when connected to the internet, including the risks associated with unauthorized network access and cyberattacks. We also negotiate liability provisions in our custodial contracts, pursuant to which our custodians are held liable for their failure to safekeep our bitcoin. In addition to our custodial arrangements, we also utilize affiliates of our bitcoin custodians to execute bitcoin acquisition and disposition transactions on our behalf. We leverage the due diligence we conduct in connection with our custodial arrangements when conducting due diligence of these trade execution service providers.
We also conduct due diligence reviews during the custodial relationship to monitor the safekeeping of our bitcoin. As part of our process, we obtain and review our custodians’ Services Organization Controls reports. We are also contractually entitled to review our custodians’ relevant internal controls through a variety of methods. We have in the past conducted, and expect to conduct in the future, supplemental due diligence when we believe it is warranted by market circumstances or otherwise. For example, we obtained supporting documentation to verify certain factual information, including documentation and analysis regarding financial solvency, exposure to troubled exchanges, regulatory compliance, security protocols and our ownership of our bitcoin.
We negotiate specific contractual terms and conditions with our custodians that we believe will help establish, under existing law, that our property interest in the bitcoin held by our custodians is not subject to the claims of the custodian’s creditors in the event the custodian enters bankruptcy, receivership or similar insolvency proceedings. All of our custodians are subject to regulatory regimes intended to protect customers in the event that a custodian enters bankruptcy, receivership or similar insolvency proceedings. Based on existing law and the terms and conditions of our contractual arrangements with our custodians, we believe that the bitcoin held on our behalf by our custodians would not be considered part of a custodian’s bankruptcy estate were one or more of our custodians to enter bankruptcy, receivership or similar insolvency proceedings. For a discussion of risks relating to the custody of our bitcoin, see “Item 1A. Risk Factors—Risks Related to Our Bitcoin Acquisition Strategy and Holdings—Our bitcoin acquisition strategy exposes us to various risks associated with bitcoin,” and “—Our bitcoin acquisition strategy exposes us to risk of non-performance by counterparties.”
Potential Advantages and Disadvantages of Holding Bitcoin
We believe that bitcoin is an attractive asset because it can serve as a store of value, supported by a robust and public open-source architecture, that is untethered to sovereign monetary policy. We also believe that, due to its limited supply, bitcoin offers the potential to serve as a hedge against inflation in the long-term and, if its adoption increases, the opportunity for appreciation in value.
Bitcoin exists entirely in electronic form, as virtually irreversible public transaction ledger entries on the blockchain, and transactions in bitcoin are recorded and authenticated not by a central repository, but by a decentralized peer-to-peer network. This decentralization mitigates the risks of certain threats common to centralized computer networks, such as denial-of-service attacks, and reduces the dependency of the bitcoin network on any single system. The decentralization of user nodes and miners also mitigates the risk of a 51% attack, which would be very costly and difficult to execute with respect to bitcoin because the Bitcoin network is open source and widely distributed, and transactions on the blockchain require significant computing power to be validated. However, while the Bitcoin network as a whole is decentralized, the private keys used to access bitcoin balances are not widely distributed and are susceptible to phishing and other attacks designed to obtain sensitive information or gain access to password-protected systems. Loss of such private keys can result in an inability to access, and effective loss of, the corresponding bitcoin. Consequently, bitcoin holdings are susceptible to all of the risks inherent in holding any electronic data, such as power failure, data corruption, security breach, communication failure and user error, among others. These risks, in turn, make bitcoin substantially more susceptible to theft, destruction, or loss of value from hackers, corruption, viruses and other technology-specific factors as compared to conventional fiat currency or other conventional financial assets. See “Item 1A. Risk Factors—Risks Related to Our Bitcoin Acquisition Strategy and Holdings—If we or our third-party service providers experience a security breach or cyberattack and unauthorized parties obtain access to our bitcoin, or if our private keys are
lost or destroyed, or other similar circumstances or events occur, we may lose some or all of our bitcoin and our financial condition and results of operations could be materially adversely affected.”
In addition, the Bitcoin network relies on open-source developers to maintain and improve the Bitcoin protocol. Accordingly, bitcoin may be subject to protocol design changes, governance disputes such as “forked” protocols, competing protocols, and other open source-specific risks that do not affect conventional proprietary software.
We believe that in the context of the economic uncertainty precipitated by escalating geopolitical tensions and central banks having adopted inflationary measures at various times in recent history, as well as the breakdown of trust in and between political institutions and political parties in the United States and globally, bitcoin represents an attractive store of value, and that opportunity for appreciation in the value of bitcoin exists in the event that such factors lead to more widespread adoption of the use and acceptance of bitcoin and the adoption of bitcoin as a treasury reserve alternative by institutions.
Government Regulation
The laws and regulations applicable to bitcoin and digital assets are evolving and subject to interpretation and change.
Governments around the world have reacted differently to digital assets; certain governments have deemed them illegal, and others have allowed their use and trade without restriction, while in some jurisdictions, such as the U.S., digital assets are subject to overlapping, uncertain and evolving regulatory requirements.
As digital assets have grown in both popularity and market size, the U.S. Executive Branch, Congress and a number of U.S. federal and state agencies, including the Financial Crimes Enforcement Network, the Commodity Futures Trading Commission (“CFTC”), the SEC, the Financial Industry Regulatory Authority, the Consumer Financial Protection Bureau, the Department of Justice, the Department of Homeland Security, the Federal Bureau of Investigation, the IRS and state financial regulators, have been examining the operations of digital asset networks, digital asset users and digital asset exchanges, with particular focus on the extent to which digital assets can be used to violate state or federal laws, including to facilitate the laundering of proceeds of illegal activities or the funding of criminal or terrorist enterprises, and the safety and soundness and consumer-protective safeguards of exchanges or other service-providers that hold, transfer, trade or exchange digital assets for users. Many of these state and federal agencies have issued consumer advisories regarding the risks posed by digital assets to investors. In addition, federal and state agencies, and other countries have issued rules or guidance regarding the treatment of digital asset transactions and requirements for businesses engaged in activities related to digital assets.
Depending on the regulatory characterization of bitcoin, the markets for bitcoin in general, and our activities in particular, our business and our bitcoin acquisition strategy may be subject to regulation by one or more regulators in the United States and globally. Ongoing and future regulatory actions may alter, to a materially adverse extent, the nature of digital assets markets, the participation of industry participants, including service providers and financial institutions in these markets, and our ability to pursue our bitcoin strategy. Additionally, U.S. state and federal and foreign regulators and legislatures have taken action against industry participants, including digital assets businesses, and enacted restrictive regimes in response to adverse publicity arising from hacks, consumer harm, or criminal activity stemming from digital assets activity. U.S. federal and state energy regulatory authorities are also monitoring the total electricity consumption of cryptocurrency mining, and the potential impacts of cryptocurrency mining to the supply and dispatch functionality of the wholesale grid and retail distribution systems. Many state legislative bodies have passed, or are actively considering, legislation to address the impact of cryptocurrency mining in their respective states.
The CFTC takes the position that some digital assets, including bitcoin, fall within the definition of a “commodity” under the Commodities Exchange Act of 1936, as amended (the “CEA”). Under the CEA, the CFTC has broad enforcement authority to police market manipulation and fraud in spot digital assets markets in which we may transact. Beyond instances of fraud or manipulation, the CFTC generally does not oversee cash or spot market exchanges or transactions involving digital asset commodities that do not utilize margin, leverage, or financing. In addition, CFTC regulations and CFTC oversight and enforcement authority apply with respect to futures, swaps, other derivative products and certain retail leveraged commodity transactions involving digital asset commodities, including the markets on which these products trade.
The SEC and its staff have taken the position that certain other digital assets fall within the definition of a “security” under the U.S. federal securities laws. Public statements made by senior officials and senior members of the staff at the SEC indicate that the SEC does not consider bitcoin to be a security under the federal securities laws. However, such statements are not official policy statements by the SEC and reflect only the speakers’ views, which are not binding on the SEC or any other agency or court and cannot be generalized to any other digital assets.
In addition, since transactions in bitcoin provide a degree of anonymity, they are susceptible to misuse for criminal activities, such as money laundering. This misuse, or the perception of such misuse, could lead to greater regulatory oversight of bitcoin and Bitcoin platforms, and there is the possibility that law enforcement agencies could close bitcoin platforms or other bitcoin-related infrastructure with little or no notice and prevent users from accessing or retrieving bitcoin held via such platforms or infrastructure. For example, in her January 2021 nomination hearing before the Senate Finance Committee, Treasury Secretary Janet Yellen noted that cryptocurrencies have the potential to improve the efficiency of the financial system but that they can be used to finance terrorism, facilitate money
laundering, and support activities that threaten U.S. national security interests and the integrity of the U.S. and international financial systems. The U.S. Treasury Department’s Office of Foreign Assets Control has issued updated advisories regarding the use of virtual currencies, added a number of digital asset exchanges and service providers to the Specially Designated Nationals and Blocked Persons list and engaged in several enforcement actions, including a series of enforcement actions that have either shut down or significantly curtailed the operations of several smaller digital asset exchanges associated with Russian and/or North Korean nationals.
As noted above, activities involving bitcoin and other digital assets may fall within the jurisdiction of more than one financial regulator and various courts and such laws and regulations are rapidly evolving and increasing in scope. On March 9, 2022, President Biden signed an executive order relating to cryptocurrencies. While the executive order did not mandate the adoption of any specific regulations, it instructed various federal agencies to consider potential regulatory measures, including the evaluation of the creation of a U.S. CBDC. On September 16, 2022, the White House released a framework for digital asset development, based on reports from various government agencies, including the U.S. Department of Treasury, the Department of Justice, and the Department of Commerce. Among other things, the framework encourages regulators to pursue enforcement actions, issue guidance and rules to address current and emergent risks, support the development and use of innovative technologies by payment providers to increase access to instant payments, consider creating a federal framework to regulate nonbank payment providers, and evaluate whether to call upon Congress to amend the Bank Secrecy Act and laws against unlicensed money transmission to apply explicitly to digital asset service providers. There have also been several bills introduced in Congress that propose to establish additional regulation and oversight of the digital asset markets.
Enterprise Analytics Software Strategy
MicroStrategy is a pioneer in AI-powered business intelligence (BI), and a global leader in enterprise analytics solutions. We provide software and services designed to turn complex, chaotic data environments into rich, reliable, and convenient information feeds for our customers. Our vision is to make every worker a domain expert by delivering Intelligence Everywhere™.
Our cloud-native flagship, MicroStrategy ONE™, powers some of the largest analytics deployments in the world for customers spanning a wide range of data sources,industries, including retail, banking, technology, manufacturing, insurance, consulting, healthcare, telecommunications, and be used to build sophisticated advanced analytical models that may be inserted within reports and dashboards. MicroStrategy reports and dashboards can be personalized and automatically delivered to thousands of users with MicroStrategy Server™’s advanced distribution capabilities. Web applications can also be extensively customized and embedded into other applications using MicroStrategy Web SDK for a branded experience.the public sector.
MicroStrategy Desktop is a free, standalone, on-premise, single-user tool for fast, powerful, and easy-to-use self-service visual data discovery. It enables business users to analyze and gain valuable insight and understanding into their organizations’ data by quickly creating stunning and useful visualizations, without assistance from the IT department. MicroStrategy Desktop can be readily downloaded and installed on a PC or Mac, making the power of MicroStrategy 10 easily available. MicroStrategy Desktop can be used while offline and while not connected to MicroStrategy Server. MicroStrategy Desktop connects to MicroStrategy Server when needed, allowing for governance workflows that deliver data discovery capabilitiesIntegral to the enterprise at scale.
MicroStrategy Mobile is fully integrated into the MicroStrategy AnalyticsONE platform so it is easy to leverage existing reports and dashboards to instantly deploy mobile business intelligence. In addition, MicroStrategy Mobile extends beyond analytics to enable organizations to rapidly build custom enterprise mobility applicationsare Generative AI capabilities that deliver analytics combined with transactions, multimedia, and mapping to support business workflows. The robust code-free application development platform isare designed to reduce development costsautomate and accelerate the deployment of native mobile business apps optimizedAI-enabled applications across our customers’ enterprises. By making advanced analytics accessible through conversational AI, MicroStrategy ONE provides non-technical users with the ability to directly access novel and actionable insights for both iOS®decision-making.
The MicroStrategy ONE Platform
MicroStrategy ONE combines the flexibility and Android™. Companies can build fully native iOSscalability afforded by a modern, cloud application with the reliability and Android apps that take advantagesecurity of the unique deviceour robust data governance model. It empowers users by making rich analytics easily accessible and operating system capabilities (e.g., GPS/location, calendar, and camera) on those devices. MicroStrategy Mobile is an easy, fast, and cost-effective vehicle for mobilizing an organization’s information systems, including its data warehouses, business intelligence, ERP, CRM, and web applications that are currently accessible only on the desktop. With MicroStrategy Mobile, businesses can transform their entire workforce into a connected and more productive mobile workforce. With mobile access to
critical corporate data and systems that drive the business, employees can have a virtual office in their hands at all times. MicroStrategy Mobile also enables companies to deploy customized, white-labeled mobile apps to business partners and customers. These apps can serve as new or enhanced offerings that differentiate an organization’s product or service to business partners or customers.
Usher delivers to its users unique mobile identity badges, each cryptographically linked to its owner’s smartphone and dynamically linked to the enterprise’s existing identity repositories, that are highly secure and convenient for organizations to deploy. Usher badges work on standard smartphones running on iOS or the Android platform and include an Apple Watch® integration. Through the use of Bluetooth®, QR codes, biometrics, push notifications, time-limited PIN codes, and other authentication methods, Usher badge users can log into applications, VPNs, and workstations, unlock doors and other physical gateways, and validate each other’s identities. Usher badge users are also able to scan barcodes for asset tracking applications. Usher can additionally serve as a powerful enterprise productivity tool with Usher Professional™, a dynamic and searchable employee directory that facilitates communication among users, and gives managers insight into the location and activity of their distributed workforce. Usher Professional users can view badge user activity on a nearly real-time map and manage or direct their workforce by engaging in two-way communication with badge users. In the Enterprise Internet of Things (“EIoT”) paradigm, interactions between Usher users and enterprise resources generate real-time telemetry, which can be efficiently harnessed in Usher Analytics™, creating actionable intelligence. By delivering strong yet convenient authentication that can be extended to nearly every corporate system, Usher can uncover insights, reduce infrastructure complexity, and secure assets -- all to help businesses flourish in the age of connected devices and connected people. Usher addresses some of the biggest challenges facing corporations today, including authentication, identity and access management, and resource authorization,personalized, while applying industry-leading business intelligence and analytics to an enterprise’s infrastructure.
MicroStrategy on AWS allowsenabling organizations to harness the power of data through our enterprise solutions via the cloud. Compared to traditional on-premise approaches, MicroStrategy on AWS is architected to deliver best-of-breed MicroStrategy software via the cloud, with pre-configured, ready-to-go servers, coupled with the required supporting infrastructure. With MicroStrategy on AWS, customers can launch enterprise analytics environments within minutes via a web-based provisioning tool, and use the full MicroStrategy 10 offering. MicroStrategy on AWS deploys MicroStrategy directly into the customer’s AWS account where the customer maintains and manages the environment.
For customers looking for a Platform-as-a-Service (PaaS) experience, MicroStrategy Cloud offers managed services that deliver the full breadth of platform capabilities along with a dedicated cloud operations team to deploy the platform in the cloud. MicroStrategy Cloud is well suited for organizations without extensive IT resources to maintain and manage the cloud infrastructure on their own. MicroStrategy Cloud offers a 99.9% Service Level Agreement for availability, and is backed by a team of experts and dedicated tech support staff that provides continuous monitoring and alerting. MicroStrategy Cloud maintains and keeps up to date on compliance and security certifications to help ensure the environments adhere to the Service Organization Control 2, ISO 27001, Payment Card Industry, Health Insurance Portability and Accountability Act (“HIPAA”), and Privacy Shield standards.
System integrators, value-added resellers, and original equipment manufacturers (“OEMs”) around the world rely on the capabilities of the MicroStrategy platform, including its functionality, workflows, report presentation, user management, security, administration, system configuration, and monitoring, to build branded and custom applicationsvalue of their own. data wherever it is needed.
Key Capabilities and Competitive Differentiators:
Our platform’s openkey capabilities and competitive differentiators include the following:
1.Built for the cloud. Our cloud-native, containerized architecture has been optimized for all three hyperscalers – AWS, Azure, and APIs make it especially suitable for developing custom functionality or integrating with other applications. Organizations seeking to add analytics features to their own offerings can easilyGCP – giving our customers freedom of choice and directly embed the platform into their business applications or portals with white labeling and single sign-on options.We were incorporated as a Delaware corporation on November 17, 1989. Today, with operations in 28 countries worldwide, we are one of the largest independent publicly-traded analytics vendors as measured by annual revenue.
MicroStrategy 10
MicroStrategy 10 transforms data into business insights through highly visual, interactive reports and dashboards that can be securely distributed to hundreds of thousands of users throughout an enterprise. In MicroStrategy 10.9™, MicroStrategy introduced the Dossier™ feature, which enables users to consolidate reports and dashboards into an easy-to-consume and intuitive analytics book referred to as a dossier. With dossiers, users can utilize built-in collaboration capabilities, tables of contents, powerfulfiltering options, and proactive alerts and push notifications on top of existing reports and dashboards.
Five key business needs have driven demand for powerful analytics solutions:
Increased consumption of analytics. In the past, dissemination of information was limited to a few power-users or analysts. Now, a wide range of information users – from customer service representatives to the CEO within a company, and from customers to suppliers outside the organization – can benefit from the insight that analytics provides. The wide acceptance of the Internet as an information source also has fueled demand for enterprise data to be accessible over the web to tens of thousands of users across an enterprise. In addition, demand for analytics on mobile devices is being driven by the growth of the mobile Internet and by the accelerating proliferation of mobile devices.
Increased data scalability. Increasing information generation, and in particular, the ability to capture and store electronically every business transaction and interaction, have made terabyte-size data warehouses commonplace. Due to very large data volumes at some organizations, such as data volumes generated by social media, data warehouses can now reach sizes in excess of tens of petabytes (1,000 terabytes). While transaction- and interaction-level information is now routinely captured, organizations often struggle to make productive use of such massive data stores. Organizations need to view data within its operational context – making even the most detailed information meaningful to business users. As a result, users want the ability to easily discover trends hidden in these very large databases and to verify these trends by reviewing the underlying detail.
Improved analytics system performance.The increase in user population sizes and data volumes puts a strain on analytics infrastructures. Business users expect to retrieve the information they are requesting within seconds of making the request. Mobile devices have set this expectation even higher by increasing demand for near instantaneous responses to requests. Analytics administrators need to systematically monitor and tune the analytics environment to provide the expected service levels.
Improved data comprehension and visualization. As data volumes have increased, the growing work demands placed on business users have meant progressively less time available to users to monitor and improve their businesses and make informed decisions. As a result, business users need to view the data in a summarized, easy-to-grasp format and navigate to areas of concern for additional insight. Presenting the data in a highly visual, accessible, and interactive format to collate, view, and explore information with agility and ease of use improves the overall comprehension of the business and speeds up the decision-making process.
Increased demand for personalized, one-to-one customer and/or supplier experience. Many companies have implemented strategies that establish personalized relationships with each customer and/or supplier based on individual needs and preferences. They earn loyalty by providing superior service, security, and convenience. In order to successfully acquire, retain, and upgrade customers, these organizations need to understand their customers’ profiles, transaction histories, past responses to marketing campaigns, and interactions with customer service. This information is often stored in widely dispersed and complex data sources, and obtaining a holistic view of the customer can be challenging.
The volume of data available to enterprises is growing at a very high rate, being driven by greater transaction detail, more sensors, more external data, and more data from mobile and social media platforms. MicroStrategy 10 helps organizations worldwide take advantage of this explosive growth in enterprise data by equipping managers and employees with timely, actionable information to make data-driven business decisions.
Solutions built on MicroStrategy 10 can give analysts, managers, and executives the critical insight they need to reduce costs, better allocate resources, improve efficiencies, and optimize operations. MicroStrategy 10 can also be used to build stronger relationships with business partners and suppliers by providing insights for managing inventory levels, analyzing supply chains, and tracking vendor performance. MicroStrategy 10 also includes predictive capabilities that enable organizations to leverage their historical data to project future business outcomes.
MicroStrategy 10 provides IT professionals with a powerful, highly automated mechanism for delivering insightful reports and dashboards to employees throughout an organization. In addition, MicroStrategy 10 offers self-service capabilities, which enable business users to upload, prepare, and explore enterprise data on their own, without any coding or IT expertise. With these self-service capabilities, business users can spot trends and outliers in a completely visual and interactive way, thereby eliminating much of the need for IT to create reports and dashboards for them.
MicroStrategy 10 is available in two distinct end user products: MicroStrategy Analytics and MicroStrategy Desktop. MicroStrategy Analytics is designed for enterprise-scale business intelligence, supporting high performance analytics on gigabytes, terabytes, or petabytes of data. Organizations can deploy MicroStrategy Analytics on-premise or access the same functionality within the MicroStrategy on AWS or MicroStrategy Cloud offerings. MicroStrategy Desktop puts the power of MicroStrategy 10 into the hands of individual users for self-service visual analytics and data discovery. The two products share a common user experience — making it easy to start small with self-serviceembed analytics into custom or third-party cloud and grow into the production-grade features of MicroStrategy Analytics.
MicroStrategy Analytics
MicroStrategy Analytics is our flagship analytics software. It is a comprehensive, enterprise-grade solution featuring sophisticated analytics, scalable performance, multi-level security, and rigorous data governance. It also combines the agility and productivity of self-service data visualization (also known as visual data discovery), which bridges the gap between fast, elegant, interactive visual analytics and powerful, large-scale enterprise business intelligence.
Key benefits of MicroStrategy Analytics include:
Flexibility to report, analyze, and monitor. MicroStrategy Analytics unifies reporting, analysis, and real-time business monitoring into one seamless experience for the business user, one efficient and scalable architecture for the IT professional, and one economical and extensible utility for the CIO.
mobile applications.2.Single platform for enterpriseAuto, the AI assistant. Our AI bot automates a variety of complex functions using a natural language interface, including SQL generation, dashboard creation, data discovery and analytics. MicroStrategy Analytics supports both business useradvanced analytics like forecasting and traditional IT user needs by offering various styles of BI bundled into a single comprehensive analytics platform. Business users have access to the data discovery toolset via MicroStrategy Web, MicroStrategy Desktop and MicroStrategy Mobile, and these user interfaces also allow them to consume other styles of analytics that their IT organizations have deployed, including pixel-perfect dashboards, enterprise reports and statements, scorecards, and more. Organizations do not need to resort to other point data discovery tools to gain access to agile data discovery capabilities, as they are available as an integrated part of MicroStrategy Analytics.
| •
| Industrial-strength analytics. MicroStrategy Analyticskey driver analysis. Our AI assistant tool enables industrial-strength analytics with enterprise-caliber technology and high user- and data-scalability. It enables centralized administration, operations, and maintenance in a unified interface and from within a unified hardware environment. Users can connect through their mobile devices, a zero-footprint web offering, a desktop-based client for offline analysis and by directly injecting analytics into Microsoft® Office products — expanding the reach of business intelligence across the enterprise.
|
| •
| Data discovery at scale. MicroStrategy Analytics offers data discovery capabilities and is available to the end user across all standard user interfaces. With its HTML5 interface, users are able to connect to most data sources, ranging from personal spreadsheets to enterprise warehouses and cloud hosted sources, and can blend and prepare the data on their own without any IT support. This fully self-service work flow also allows the extension of the software to integrate with other third-party capabilities. For instance, although MicroStrategy Analytics includes a variety of out-of-the-box visualizations, it also provides the ability to include other third-party visualizations like D3 and high charts, as well as the
|
| | ability to include native and third-party advanced analytics into native workflows. The dashboards that include all of these components can also be personalized and shared with thousands of users across the organization using our powerful MicroStrategy Distribution Services™.
|
Data to insight in minutes without IT involvement. MicroStrategy Analytics gives business users a simple, powerful, and fast way to analyze data with minimal set-up requirements. It is designed to allow business users to answer business questions on their own, avoiding the lengthy process of report specification and design. By using a variety of graphical visualizations to represent the entire analysis, users can easily and rapidly spot trends and outliers in large data sets, creating a user experience that seems to unfold in real time. In addition to this, MicroStrategy Analytics also supports traditional centralized BI through its metadata based architecture, from which MicroStrategy Analytics gains its ability to design highly reusable objects that deliver both high performance and scale. The combination of enterprise scalability along with data discovery features brings the power of enterprise analytics to the personal level, making it easy to extend the power of the entire MicroStrategy Analytics platform to everyone in the organization.
Actionable insight. MicroStrategy Analytics helps organizations accelerate the speed and productivity of their businesses by building mobile apps and web reports and dashboards that connect to back-end transactional systems and databases to include data entry and action-taking features, including: submitting orders, one-click approvals and denials, notes for tracking and directing business activity, and write-back to data sources.
Governed data discovery. MicroStrategy Analytics enables organizations to achieve data consistency and governance across every report, dashboard, and user within the system through a trusted and centralized metadata store. By leveraging our reusable metadata to define, manage, and maintain common definitions for metrics, attributes, data sets, and other objects through governed data discovery, organizations can lower the overall cost of developing new analytical outputs (such as reports or dashboards), while helping to ensure that the information delivered in those outputs is accurate, governed, and timely. MicroStrategy Analytics not only provides governance via centralized IT deployments where the reports and dashboards are based around a centralized metadata store, but also offers the ability to promote desktop-based reports and dashboards created by business users to MicroStrategy Server, and to map external data assets to certified data systems.
| •
| Heterogeneous access, joining and preparation of data from across the enterprise. MicroStrategy Analytics enables organizations to create integrated views of data across heterogeneous data stores. By mapping conforming dimensions from multiple sources within the MicroStrategy object model, the platform automatically joins data from multiple sources in the same table, chart, or visualization. Additionally, MicroStrategy Analytics also offers self-service data connect options to business users, who do not need to rely on data modeling or architecting to access any data source. Data can come from any source including most relational and columnar data warehouses, data marts, Apache™ Hadoop®, SAP® Business Information Warehouse (SAP BW), Microsoft SQL Server® Analysis Services, IBM® Cognos® TM1®, Oracle® Essbase, Salesforce®, social media sources such as Twitter and Facebook, and many other operational system databases. In addition to allowing users to connect to these data sources, MicroStrategy Analytics offers data preparation and wrangling capabilities that allow business users to transform their data for improved analysis.
|
| •
| Integration of advanced analytics into mainstream reporting and dashboarding. MicroStrategy Analytics’ analytic engine includes predictive capabilities in MicroStrategy reports and dashboards. The analytic engine can train and calculate many of the primary data mining functions, including time-series, association rules, clustering, regression, and decision-tree algorithms. Hand-in-hand with this calculation capability, MicroStrategy Analytics also includes the ability to import data mining models directly from data mining products from vendors like IBM SPSS®, Teradata®, and SAS® using the predictive modeling mark-up language (PMML) standard, and by embedding R statistical packages in the platform. With this capability, data mining models, such as neural network algorithms, rule set algorithms, and support vector machines, as well as ensembles of models, can be imported through a single click and automatically converted into a standard MicroStrategy metric. After that, the MicroStrategy Data Mining Services™ extension enables these metrics to be used freely and calculated quickly in reports, dashboards, and alerts. A key capability of MicroStrategy Analytics is that business
|
| | users can now readily tap into over 350 advanced analytics and statistical functions for data discovery purposes, and these functions are included within an easily accessible library.
|
Support for large data volumes and all major relational database/hardware combinations. MicroStrategy Analytics supports systems with very large data volumes and is specifically optimized to support all major relational database platforms, Hadoop distributions, and data appliances commonly used for business intelligence systems, as well as multi-dimensional databases, such as SAP BW. Important features of our solution in this area include:
| o
| Native connectors to HDFS, in addition to the hive options to connect to Cloudera®, Hortonworks®, and MapR®, among other Big Data sources;
|
| o
| Available with MicroStrategy 10, and included as an integrated part of the MicroStrategy Server product are highly scalable, in-memory cubes that can now be partitioned and support parallel processing. This new advancement in in-memory architecture allows organizations to store a greater volume of data in memory and offers faster processing;
|
| o
| Dynamically generated SQL, multidimensional expressions (MDX), and Hadoop queries that optimize the performance of each major database;
|
| o
| Very Large Database (VLDB) parameters that allow individual reports or dashboards to be tuned for performance;
|
| o
| Support for hand-written SQL, Hadoop, and XQuery queries;
|
| o
| Ability to support very large user populations; and
|
| o
| Highly reliable up-time, even in high volume applications.
|
Powerful distribution engine for information delivery. Our technology offers a high performance, personalized distribution engine for delivering periodic and alert-based information to users via email, web, and mobile devices. The distribution engine is able to deliver report and dashboard applications in a highly automated and personalized manner to all major device types used in both domestic and international markets, enabling the delivery of information to users when and where it is needed.
Customizable applications and Embedded BI. MicroStrategy Analytics applications can be customized extensively using proprietary SDK capabilities. This allows organizations to brand web and mobile-based applications, and embed these applications directly into other corporate applications. White labeling for portal integration, single sign-on, and direct integration into other software increase the deployment options of MicroStrategy Analytics and allow IT groups to roll out analytics to the entire organization in a customizable manner, while still being able to leverage investments made in other technologies.
MicroStrategy’s Metadata Architecture
The core differentiator of our platform stems from its metadata-based centralized architecture, which has been built and refined over many years and provides access to enterprise data using familiar business terms, rules, and logic. The portable, flexible, reusable, object-oriented and dynamic nature of the metadata provides an efficient BI application and mobile app development platform while maximizing maintainability and enforcing enterprise-wide consistency. The dynamic behavior of metadata in our platform helps ensure consistency across business definitions, and minimizes the number of objects created, stored, and managed. Other BI technologies are limited in their reuse capabilities, forcing developers to create the same components over and over again for use in each individual report or dashboard.
MicroStrategy Server
MicroStrategy Server is the architectural foundation of MicroStrategy 10. It provides the core analytical processing and job management for all reporting, analysis, and monitoring applications. It provides a powerful, comprehensive set of features necessary for a scalable, fault-tolerant, enterprise-wide business intelligence system.
As the central contact point to metadata, MicroStrategy Server dynamically assembles the metadata objects to create optimized, multi-pass SQL queries for every major relational database, HiveQL queries for Hadoop distributions like Cloudera, MapR, Hortonworks, and Amazon EMR, interactive queries for real-time distributed SQL processing, optimized connectivity for NoSQL sources like Apache Cassandra™, HBase™, and MongoDB®, native connectivity to HDFS via MicroStrategy Hadoop Gateway, and MDX queries for multidimensional data sources. MicroStrategy Server retrieves the data, performs any additional analytical calculations not available in the databases, formats the report, and delivers the reports to business users via the MicroStrategy Web, Mobile, Office, or Desktop interfaces.
MicroStrategy Server is a highly scalable, parallel-processing, self-tuning analytic server. It manages high performance interactions involving terabytes of data accessed by tens of thousands of users using in-memory intelligent cubes, caching, load balancing, resource prioritization, and connection pooling. It accesses and joins data from multiple data sources, such as data warehouses, operational databases, multidimensional (cube) databases, and even web services and flat files. MicroStrategy Server also manages users, system security, data security, and user functionality access. A clustering option is available with MicroStrategy Server that increases scalability, and provides fault tolerance with automatic failover.
MicroStrategy Web
MicroStrategy Web is great for business users or consumers looking to interact with data, or to even simply view a static overview report. At the same time, MicroStrategy Web is where savvy analysts put all of the pieces together to design highly formatted and customized reports and dashboards.
MicroStrategy Web is the primary reporting interface for analysts, offering interactive reporting, dashboarding, and analysis through a web browser. It provides enterprise analytical functionality with access to extensive report and dashboard creation, manipulation, and formatting capabilities in an easy-to-use web interface.
MicroStrategy Web architecture provides a single, consistent interface to users whether the BI application is departmental and internal, or an extranet application deployed to hundreds of thousands of users. MicroStrategy Web allows business users of any skill level to move fluidly between various styles of BI to satisfy their reporting, analysis, and monitoring needs.
MicroStrategy Desktop
MicroStrategy Desktop is a free, standalone, on-premise, single-user tool for fast, powerful, and easy-to-use self-service visual data discovery. It enables business users to analyze and gain valuable insight and understanding into their organizations’ data by quickly creating stunning and useful visualizations, without assistance from the IT department. MicroStrategy Desktop can be readily downloaded and installed on a PC or Mac, making the power of MicroStrategy 10 easily available. MicroStrategy Desktop can be used while offline and while not connected to MicroStrategy Server, and can connect to MicroStrategy Server when needed. This user interface can help introduce MicroStrategy 10 to smaller departments that are looking for quick and easy deployment options. It offers easy migration options to the Enterprise edition of MicroStrategy Analytics, and all analytical content developed with MicroStrategy Desktop may be promoted to MicroStrategy Server and can be consumed by the other user interfaces offered with MicroStrategy, such as MicroStrategy Web and MicroStrategy Mobile.
MicroStrategy Analytics Releases in 2017
MicroStrategy Analytics includes the following significant functional enhancements made during 2017:
Dossier.A new way of consuming analytics in the form of interactive books with built-in collaboration capabilities, tables of contents, powerful filtering options, and proactive alerts and push notifications. Dossiers are organized in chapters and pages, making it easy to navigate and find insight from analytics across the enterprise.
| •
| MicroStrategy Library™.A personalized portal for users to access their reports, dashboards, and dossiers. Each dossier is represented by a customized thumbnail image within MicroStrategy Library, making it easy to visually identify content.
|
Expanded filters within dossiers.Use any visualization, chart, or graph within the filter panel of a dossier for more intuitive and modern filtering options. In addition, dossiers can include filters and target other visualizations within the main interface.
Embedding API for dossiers.A new API that leverages JavaScript to easily embed interactive dossiers into third-party applications.
Data Connector SDK.Developers and analysts can build almost any data connector with the Data Connector SDK by leveraging HTML and JavaScript, thus getting access to data sources without waiting for them to be certified by the platform.
Gallery for custom data connectors.Customers and business partners can access a public gallery of custom data connectors on MicroStrategy Community, where they can download the connectors for their own use or enhance them further prior to integration. The available connectors include Fitbit, SurveyMonkey, Jethro, Solr, Elasticsearch, and more.
Revamped MicroStrategy Desktop.Redesigned and overhauled with a new, modern interface for data access, data preparation, visualization, sharing, and authoring and designing reports and dashboards with responsive design options.
MicroStrategy Workstation.A unified product that makes it faster to build and maintain scalable enterprise content, manage users and groups, assign security roles, create data models, and much more.
| •
| Intelligent narratives for analytics with NLG integration.Through technology partnerships with NLG platform providers, Automated Insights and Narrative Science, MicroStrategy Analytics supports the use of artificial intelligence to interpret charts and graphs into clear, meaningful, and intelligent narratives that explain the context of the data.
|
Enhanced native Hadoop Gateway.A new and re-architected Hadoop Gateway that leverages Spark to increase scalability and performance, and can access data file types such as CSV, Text, JSON, AVRO, and Parquet directly from HDFS.
R Analytics bundled and installed with platform.Customers can leverage R capabilities without having to go through a separate installation process.
Hierarchy reporting.Analysts can view and interact with ragged hierarchies with data sourced from MDX sources like MSAS and Essbase, with the ability to apply dynamic filters, create custom MDX queries, apply advanced sorting, and optimize performance.
Support for more data sources. MicroStrategy Analytics allows business users to readily connect to Microsoft Azure Cosmos DB. MicroStrategy Analytics also offers certifications for new data sources such as Maria DB 10.x, Apache Hive 2.x, SparkSQL 2.0, MapR 5.2, Druid, Amazon Athena, Oracle 12c R2, Azure SQL Database, and SAP Hana 2.x.
Improved PDF export. Analysts have more options to customize PDF versions of reports and dashboards prior to exporting them, such as selecting the page orientation, paper size, and header/footer details. Analysts can also export large grid reports, charts, and graphs that have data expanding over a page into highly formatted PDFs, ensuring no information is cut off.
MicroStrategy Analytics Technology Strategy
Our technology strategy is focused on delivering comprehensive platform-based solutions to enable any organization to create immediate value from analytics and then quickly grow its analytics effort to encompass more advanced capabilities as well as larger user and data scale. This strategy includes: expanding support for large information stores, improving performance and administration, enhancing our analysis capabilities, and enhancing report and dashboard delivery via the web and mobile devices. We continue to enhance our products for use with a broad range of operating systems and databases to enable our customers to leveragebuild their existing technology investments to
achieve faster query times with fewer required resources. We continue to enhance usability and visual data exploration to increase easeown fully customized bot for any application in a matter of use and functionality, and thus further decrease the need for IT intervention. We are working to further differentiate our products by increasing:
Visual analysis and user self-service. Ease of use and visual exploration and analysis capabilities on small to extremely large data sets, in conjunction with the enterprise capabilities also offered by our platforms;
minutes.3.Data capacity. The volume of information thatHyperIntelligence™. This innovative feature presents context-based, click-free insights to the user by hovering over keywords on the screen. It can be efficiently analyzedimplemented on mobile, web, or custom applications to enrich understanding and utilized;
streamline workflows. 4.User concurrency. The numberOur Enterprise Semantic Graph™ is a powerful metadata layer that helps ensure data insights are trustworthy regardless of users that can be supported simultaneously;
Analytic sophistication. The range of analytical methods available tohow far-reaching the application designer;
Performance. The throughputapplications and response time of the system, measured in seconds;
Database flexibility. The rangeusers of data sources, data warehouses, and online transaction processing databases that the software is capable of efficiently querying without modification;
may reside.5.Robustness. The reliability and availability of the software in mission-critical environments;
Deployability. The ease with which applicationsFlexible deployment. Customers can be securely deployed, modified, upgraded, and tuned;
Personalization. The quality and sophistication of a one-to-one user experience;
Content flexibility. The range of content, both structured and unstructured, that can be efficiently utilized;
Media channel and interface flexibility. The range of media channels (including mobile devices), interface options, and display features supported; and
Transaction capabilities. The ability to efficiently initiate actions and transactions from mobile devices and web-based reports and dashboards.
MicroStrategy Mobile
Our consistently highly-rated mobile offering extends beyond basic mobile analytics to deliver an innovative mobile app platform that makes building a variety of mobile business apps easier and faster.
MicroStrategy Mobile is fully integrated into the MicroStrategy Analytics platform, so it is easy to leverage existing reports and dashboards to instantly deploy mobile business intelligence. In addition, MicroStrategy Mobile extends beyond analytics to enable organizations to rapidly build custom mobile applications that deliver analytics combined with transactions, multimedia, and mapping to support business workflows. The robust code-free application development platform is designed to reduce development costs and accelerate the deployment of native mobile business apps—optimized for both iOS and Android. Companies can build fully native iOS and Android apps that take advantage of the unique device and operating system capabilities (e.g., GPS/location, calendar, and camera) on those devices. MicroStrategy Mobile is an easy, fast, and cost-effective vehicle for mobilizing an organization’s information systems, including its data warehouses, business intelligence, ERP, CRM, and web applications that are currently accessible only on the desktop. With MicroStrategy Mobile, businesses can transform their entire workforce into a connected and more productive mobile workforce using information-driven mobile apps that are significantly more robust and secure than their web-only counterparts. With mobile access to critical corporate data and systems that drive the business, employees can have a virtual office in their hands at all times.
MicroStrategy Mobile is available both as on-premise software and as a hosted service offering in MicroStrategy Cloud.
Key benefits of MicroStrategy Mobile include:
Increased employee productivity by gaining new efficiencies and cutting decision times. MicroStrategy Mobile computing can dramatically improve personal productivity, changing how people work today. MicroStrategy Mobile puts materials, information, and system access on devices that can be always on, always connected, and always in reach. MicroStrategy Mobile enables write-back to systems of record (e.g., ERP and CRM), providing users with an interactive two-way mobile experience. Users can change data on the fly, insert new information, and view updated reports and dashboards. Users can access transactional inputs and forms regardless of internet connectivity. When offline, transactions are queued for submission and executed when the user next connects.
Extending information throughout an organization. MicroStrategy Mobile can help run a business more effectively by extending the reach of critical enterprise systems to all constituents in all locations. It can provide real-time access to the latest information and data-driven reports and dashboards that fuel spontaneous conversations and more effective decision making.
Enabling field workforces with multimedia materials and training. Mobile workforces can access anything from product brochures and sales presentations to instructional videos and training manuals, when and where they’re needed. MicroStrategy Mobile supports in-app viewing of multimedia content, such as videos, PDFs, images, presentations, spreadsheets, documents, email, and web content—all seamlessly embedded within a mobile app. As with other app content, multimedia content can be pre-cached or stored for convenient, offline access. When the mobile device is offline, users can still view files that have been previously downloaded and stored on their mobile device.
Proactive alerting of potential business problems. MicroStrategy Mobile supports personalized mobile alerts—informing users of potential business problems so they can take timely corrective action. The 24/7 alerting engine is based on a robust distribution server that can be set up to monitor multiple data sources in near real time, creating personalized alerts—distributed through the mobile device’s native push notification system—when a preset condition (threshold) has been met.
Conducting business in newer and faster ways. MicroStrategy Mobile context-aware apps that leverage native mobile device functionality (e.g., GPS, camera, etc.) allow users to complete tasks significantly faster or in more efficient ways than web or desktop-bound apps.
Fast app development. MicroStrategy Mobile is one of the fastest ways to create new mobile apps and mobile front-ends to existing analytics applications. Its click-to-configure features allow the development of mobile apps in a code free environment without requiring an organization’s IT resources. It also allows for the deployment of native apps across multiple operating systems with a single design and lets a user make an app multi-lingual with a few configuration clicks.
High performance mobilization. MicroStrategy Mobile provides compelling and high-performance MicroStrategy Mobile powered apps that can help maximize impact, durability, and adoption.
MicroStrategy Mobile Releases in 2017
MicroStrategy Mobile includes the following significant functional enhancements made during 2017:
Support for .SHP files for custom shapes on iOS. Previously, MicroStrategy Mobile allowed users to add custom shapes using .KML shapes in the map widget. Users can now also use .SHP fileschoose to deploy custom shapesour platform on premises, using their own cloud environment, or through our fully managed MicroStrategy Cloud Environment (MCE).
6.Open and areas maps. This parity with MicroStrategy Web provides consistent user experienceinteroperable.Developers can leverage scripts, APIs, and behavior across different web200+ connectors (local and iOS interfaces.
Best-fit image auto-selected based on device resolution on Android. Android app designers can now define multiple resolutions for images in their dashboards and allowcloud) to embed the Android device to auto-select the best-fit image depending on its own resolution. With so many different Android devices in the market, this responsive design capability makes it easier for Android app developers to optimize user experience.
| •
| Enterprise Mobility Management (EMM) support via AppConfig (formerly known as ACE) on Android. In addition to our native integration support with AirWatch, MicroStrategy Mobile now
|
| | provides native integration to configure and help secure Android apps based on AppConfig guidelines. The integration with AppConfig provides more consistent, open and simple ways to configure and help secure mobile apps.
|
App Transport Security (ATS) on iOS. Apple’s new ATS policy improves user security and privacy by requiring apps to use secure network connections over HTTPS instead of HTTP. MicroStrategy Mobile developers can enable Apple’s ATS policy when Apple requires it to help ensure connections from the app adhere to the HTTPS standard. This feature helps app developers secureplatform or build predictive, machine learning-enhanced data in transit through additional encryption.
MicroStrategy Mobile SDK for Blackberry Dynamics Library. Following Blackberry’s integration of Good Dynamics into its EMM platform, the MicroStrategy Mobile iOS SDK for Blackberry Dynamics now reflects Blackberry’s branding changes, including color schemes, icons, and much more. These changes improve user experience and enhance integration of the Good Dynamics and Blackberry libraries. Through the new SDK, MicroStrategy Mobile customers can continue to natively integrate with the former Good Dynamics.
Custom properties for D3 visualizations on Android. Custom properties are now supported in D3 visualizations. This feature provides greater parity with iOS and web report and dashboard functionality. App designers have the flexibility to add different properties to attribute elements and metrics. For example, app designers can use shape or text color to differentiate various components of their visualizations.
Embedded images during Android app compilation. The Android framework supports bundling images as part of the app resources to boost performance. Bundling images during app compilation eliminates requests for downloading images that are not expected to change in the short term. This feature accelerates app performance through better image loading. This is especially helpful when users are located in a remote area with weak network conditions.
MicroStrategy Library for iPad and Android tablet. Users can consume reports, dashboards, and dossiers via native mobile clients for iPad and Android tablets.
| o
| Quickly toggle between different MicroStrategy Library environments. Instead of re-configuring the app each time, users can store multiple environment configurations in the MicroStrategyLibrary app. With two quick taps, users can easily switch between the different environments. For users that regularly access reports, dashboards, and dossiers in separate libraries, this feature provides significant convenience and time savings. The MicroStrategyLibrary app also includes folders to access downloaded .mstr files and PDF exports. Instead of saving these files outside of the app, the folders provide a convenient place to store and view downloaded reports, dashboards, and dossiers within the app.
|
| o
| Export to PDF. Users can export entire dossiers or single chapters of dossiers to PDF.
|
| o
| Share via native extensions. Users can share links to dossiers, .mstr files and PDFs from the Dossier app using native OS extensions. iOS and Android users can share by emailing, printing, copying, using communicators such as Slack and AirDrop (only iOS users), or importing to other apps (e.g., iBook, Dropbox).
|
| o
| Enhance workflows with native touch-optimized controls. Users can take advantage of native touch-optimized gestures to manipulate content within their dossiers. Using long swipes, users can sort charts in ascending or descending order. Long and/or double taps display a filtering menu with “keep only,” “exclude,” or “drill” options. Users can also use free form lasso options to multi-select elements in visualizations. Native touch-optimized controls provide users with more advanced options to interact with dossiers.
|
| o
| Search within maps.Users can search for attribute elements on maps directly from their iPads or Android tablets. The searched element is highlighted on the map and provides users with location and other information instantly. If the searched element is within a cluster, the whole cluster is highlighted and the number of elements found within the cluster is specified. This feature—
|
| | previously available only on MicroStrategy Web—adds parity between MicroStrategy Web and MicroStrategy Mobile applications, providing users with a seamless map search interface.
|
| o
| Automatically align to various form factors with enhanced responsive design capabilities. The Dossier mobile app provides significantly enhanced responsive design capabilities, making the experience seamless when switching between interfaces, devices and form factors. Dossier components, such as visualizations, filters, images, and notification panels are automatically resized and arranged for optimal display on iPads and Android tablets. Though there are several form factors and aspect ratios, MicroStrategy Mobile prioritizes the visualizations view by adjusting spacing and padding and object alignment.
|
| o
| Leverage AppConfig on iOS and Android.The MicroStrategy Library apps for iOS and Android have been compiled using AppConfig guidelines. Without employing an SDK, customers can deploy the application to their users securely as well as configure it remotely via any of the leading EMM vendors compatible with AppConfig standards.
|
MicroStrategy Mobile Technology Strategy
We continue to invest in enhancing MicroStrategy Mobile to empower our customers with the ability to build apps that drive their businesses forward and deliver revolutionary applications to their employees, business partners, prospects, and customers. We continue to invest in enhancing MicroStrategy Mobile’s overall performance and security as well as its three core capability areas: analytics, transactions, and multimedia. We remain focused on delivering the most compelling native end user experience on devices that are adopted by enterprises. New features specific to supported operating systems will take advantage of the native API’s and incorporate new OS capabilities into apps built by our customers.
We also continue to invest in bringing to life mobile apps in an easy, fast, and flexible way. We will continue to enhance our MicroStrategy Mobile technology to deliver an experience that is philosophically “user first” by combining a powerful user experiencemodels on top of a dynamicsecure and accessible development infrastructure.trusted foundation.
FedRAMP Authorization
UsherThe MicroStrategy Cloud for Government service (“MCG Service”) is authorized to operate under the Federal Risk and Authorization Management Program (“FedRAMP”) guidelines, which certifies compliance with essential cloud security and data protection standards set by the U.S. Federal government. The solution offers always-on threat monitoring that meets the rigorous technical and regulatory needs of governments and financial institutions worldwide. The MCG Service achieved this designation through collaboration with the U.S. Department of Health and Human Services.
UsherMicroStrategy Professional Services™
Through our MicroStrategy Support, MicroStrategy Consulting, and MicroStrategy Education services, we help customers deploy and customize our solutions to facilitate adoption and maximize returns on data investments.
MicroStrategy Support
Our global network of MicroStrategy-certified technical support experts help our customers achieve their system availability and usage goals through highly responsive troubleshooting and assistance. Standard Support is a digital credentialincluded in every maintenance plan or subscription license. Premium support options are also available for extended coverage and identityenhanced service at each touchpoint.
MicroStrategy Consulting
Many companies lack the internal expertise needed to design solutions for managing and optimizing their data stores. MicroStrategy Consultants deliver architecture and implementation services to help customers realize their desired results. With thousands of successful projects delivered to customers worldwide, our consultants apply industry best practices to define, develop, and deliver AI-powered analytics solutions for virtually any business intelligence offering that provides a highly secure, convenient way forneed.
MicroStrategy Education
To help organizations to dematerialize traditional forms of identity verification (such as passwords, tokens,maximize the adoption and physical badges) and replace them with unique mobile identity badges, each cryptographically linked to its owner’s smartphone and dynamically linked to the enterprise’s existing identity repositories. Usher can be used as a powerful enterprise productivity and workforce management resource because it is designed to enable managers to gain an almost real-time window into the location and activityperformance of their distributed workforces, while providing powerful interactive features to manage or direct them. With the additionMicroStrategy solutions, MicroStrategy Education offers free and paid learning options, available worldwide in multiple languages and a variety of Usher Professional, administrators can track user activityformats—both in person and online, live and on-demand.
Sales and Marketing
Licensing Models
MicroStrategy sells its software platform under two pricing models: (i) traditional enterprise software licensing for on a nearly real-time map using access telemetry. They can also engage in two-way communications with users from the Usher application. Usher badges work on standard smartphones running on iOS or the Android platformpremise deployments, and (ii) subscriptions for cloud-based deployments. Enterprise software license terms are often perpetual, but term licenses typically extend for between 12 and 36 months and include an Apple Watch integration. Throughstandard support and maintenance for the use of Bluetooth, QR codes, biometrics, push notifications, time-limited PIN codes, and other authentication methods, Usher users can log into applications, VPNs, and workstations, unlock doors and other physical gateways, and validate each other’s identities. By delivering strong, multi-factor authentication that can be extended to nearly every corporate system, Usher’s digital credential solution addresses someterm of the biggest challenges facing corporations today, including authentication, identitylicense. Subscriptions for cloud-based deployments typically are for 36 months and access management, and resource authorization, while applying industry leading business intelligence and analytics to an enterprise’s infrastructure. Usher is available both as on-premise software and as a hosted service offering in MicroStrategy Cloud.
Usher can appeal to businesses, universities, associations, governments, and other organizations because it adds a layer of security to their systems, physical spaces, and transactions that would otherwise be technically difficult or cost-prohibitive. Usher is designed to secure an enterprise by offering an alternative to existing forms of identification and authentication. Usher is designed to provide a more secure alternative to passwords, which can be stolen or cracked. Usher is also designed to help reduce identity-related fraud by replacing physical ID cards that can be counterfeited and stolen.
Key benefits of Usher include:
Identity protection.Usher mobile identities are designed to be more secure than traditional physical forms of identity, which can be stolen and counterfeited.
Authentication. Usher is designed to provide a more secure alternative to passwords — which can be the weak link exploited by cybercrime attacks — with secure mobile identities.
Physical access control.Usher users can unlock doors by tapping on a “digital key” or by scanning a QR code. If a device is Bluetooth-enabled, a user can unlock a door simply by approaching it.
Workforce management. Usher can collect data about the locations of users’ Usher activity, enabling managers to remotely monitor and direct distributed workforces.
Activity analysis.Usher uses MicroStrategy 10 to monitor and analyze Usher user activity.
Convenience and cost-effectiveness. Usher allows users to carry their business credentials in digital form on their smartphones. Enterprises can reduce costs associated with the distribution and management of physical badges, cards, and keys, as well as the costs associated with identity-related fraud and cybercrime.
Usher Releases in 2017
Usher includes the following significant functional enhancements made during 2017:
Usher privacy controls. Administrators can tailor their deployments to protect their users’ privacy, giving organizations the flexibility to balance desired functionality with required data collection. Usher privacy controls include transaction location information, Bluetooth discovery, and the Usher telemetry feed to Usher Analytics.
Shared kiosk capability for multi-user authentication. Usher now enables rapid authentication of multiple users in a shared workstation (terminal) or tablet environment. Multiple users can be paired with a single browser or web application for use cases as diverse as reception areas, retail stores, healthcare providers, and utility workers.
NFC for iOS devices. Now both Android and iOS device owners can enjoy the security and convenience of using NFC tags to access resources, which has the advantage of explicitly signaling the user’s intent to access the resource due to its very short range. Usher supports NFC tags on iPhone 7, iPhone 7 Plus, and iPhone 8 devices running iOS 11. Type 1, 2, 3, 4, and 5 NFC tags are supported.
Usher master administrator role. Usher Network Manager™ adds a new master administrator role, supporting separation of duties and improved user administrator capabilities.
Search and filter on directory attribute groups. Increase the value of Usher Professional as an enterprise directory and communications tool, while leveraging existing directories. All directory gateway attributes mapped in Usher Network Manager are searchable, including directory groups and distribution lists.
Universal scanner. The Usher Security™ badge client’s integrated QR scanner can now read non-Usher barcodes and QR codes (e.g., Aztec codes). The scanning transaction can be stored in the Usher server and linked to the user performing the scan, the time of the scan, and the location at which the scan took place (if locationstandard support. Premium support services are enabled). This barcode data can be used in Usher Analytics to parse barcode data, create derived attributes from the parsed barcode data, and link to third-party and legacy-backend logical systems to generate custom reports and dashboards.
Usher Network Manager: Okta Universal Directory support.Usher now supports Okta Universal Directory as an identity management source. This is in addition to existing support for Microsoft Active Directory, OpenLDAP, AWS Directory Services, Novell NDS (NetIQ eDirectory), Apple Open Directory, and Apache Directory.
| •
| Usher Analytics: Badge properties reporting. With a new out-of-the-box dashboard and schema, badge properties set by Usher Network Manager can require and report on end-user action or compliance, such
|
| | as location services and Bluetooth enablement, photo uploads, multiple device installations, and acceptance of the Terms of Use.
|
Usher inbox. With the debut of the Usher inbox, communications sent from managers and administrators via Usher Professional are accessible to recipients in an inbox within the app, so users can read and respond to queries at their leisure. Users can even review messages that they have already replied to in the past. The Usher inbox enhances user convenience and the overall communications usability of Usher Professional messaging for purposes such as safety and productivity.
Usher Analytics: New out-of-the-box dashboard. Visualize Usher badge-generated telemetry through a set of KPI intensive grids. As users move about and interact with a corporate environment using their Usher badges, data flows into the dashboard sorted under categories such as users, historical telemetry log, timesheet, floors, spaces, beacons, actions, applications, cities, and devices. These grids can be used as a basis for creating custom visualizations based on business questions surrounding user access and presence.
Nearby user auto-discovery. Usher Professional users can control the manner in which lists of nearby Usher badge users are discovered and/or refreshed. Usher Professional may be configured to display location-based lists of Usher badge users that are either dynamic or static. When configured for dynamic display, Usher Professional provides a list of nearby Usher users (based on selected filter criteria) and automatically updates this list over time.
Usher Network Manager: Approver role for badge issuance / reactivation. Enterprises require separation of duties across many roles to mitigate the danger of a single employee taking unauthorized actions. Badge issuance approvers are responsible for reviewing badges that are ready to be issued prior to their issuance. Before approving or rejecting a badge issuance, they can review the identity record, including biographic and biometric data, and enter notes (e.g., a case number, background check results, etc.) to explain their decision.
Usher Technology Strategy
Our technology strategy for Usher is focused on taking advantage of developments in mobile and cloud technology to provide more flexible and powerful user identity-based security and analytics solutions. This involves continued development in the following areas:
Logical access. We continue to explore new techniques with which Usher can provide identity to applications and systems and provide alternatives to passwords, keys, and fobs. Our focus is on seamless, zero-click access based on proximity. Additionally, we continue to monitor the market and test new biometric measurement systems that can be integrated into Usher, such as Apple’s Touch ID, voice authentication, and facial recognition.
Physical access. We continue to expand on the integration of Usher with physical access control systems and hardware, so that users with adequate credentials and digital keys can unlock secure doorways.
Action-oriented intelligence. We are focusing on enhancing Usher’s ability to determine Usher member location and activities so that trends and anomalies can be used to provide better security or better workforce management.
MicroStrategy on AWS
MicroStrategy on AWS is a self-service, customer-managed solution that offers customers instant access to a comprehensive enterprise cloud platform. Organizations can launch fully configured and ready-to-use MicroStrategy analytics and mobility projects on their own. Administrators have total control of their environments, making it easy to start, stop, resize, and terminate as needed. MicroStrategy on AWS provides access to the latest features and capabilities, while delivering a low total cost of ownership.
Key benefits of MicroStrategy on AWS include:
Simplified enterprise deployment. With just a few clicks, organizations can deploy fully configured enterprise environments. Most instances can be up and running in just 30 minutes. This saves users time and money by eliminating the need to download, install, and configure environments themselves. Users can choose from different instance types and sizes based on their budget and usage requirements.
Centralized administration. Customers that deploy a project using MicroStrategy on AWS can dynamically start, stop, restart, and resize their environments. Organizations can reduce costs by stopping their environments during non-peak hours.
Scalability. Scaling MicroStrategy on AWS environments is quick and easy. Customers can choose from six different instance size options ranging from 4 vCPU and 15.25 GiB to 64 vCPU and 488 GiB of memory. Environments can be scaled on demand or on a preset schedule based on usage patterns or data size. Organizations can add new users at any time, deploy multiple environments and projects as they see fit, and pay only for what they use.
API-enabled operations. APIs are available with MicroStrategy on AWS to provide broad flexibility for organizations to create customized workflows. Developers can build personalized user interfaces for deploying, managing, and automating their cloud environments. The APIs also easily integrate with other automation tools and work with any programming language. With the APIs, it is possible to launch multiple MicroStrategy instances with a single line of code, resize them as needed, and terminate them when they are no longer required.
Global availability. Leveraging AWS, MicroStrategy Analytics is now available in all AWS data centers.
MicroStrategy on AWS Releases in 2017
MicroStrategy on AWS includes the following significant functional enhancements made during 2017:
Web-based provisioning console. New to MicroStrategy on AWS, a web-based provisioning console allows administrators to quickly and easily deploy and manage a fully configured MicroStrategy project using a simple and intuitive web-based deployment manager.
Seamless hotfix upgrades. With the general availability of any hotfix release, the hotfix will be automatically available on the MicroStrategy on AWS provisioning tool. An upgrade button will appear on the main administrative page, and clicking on it will automatically validate the upgrade process and administrators can then choose to upgrade at that time or schedule the upgrade at an off-peak time.
Deploy MicroStrategy on AWS into existing Virtual Private Cloud (VPC). Customers can deploy, manage, upgrade and resize their MicroStrategy on AWS environments within their own VPC and still leverage the powerful deployment and management tool. Deploying MicroStrategy on AWS into existing VPC accounts gives customers full control of their own AWS security settings.
Deploy applications directly into data centers around the world. MicroStrategy on AWS now allows organizations to deploy the application directly into data centers in North America, Europe, Australia, and Asia. The availability of data centers in these new regions allows organizations to deploy in a data center close to home, so they can deliver faster response times for mission-critical KPIs.
Available in nine languages. In addition to expanding the list of data centers around the world, the MicroStrategy on AWS provisioning tool is now available in nine different languages: English, French, Italian, Portuguese, Spanish, Dutch, Japanese, Korean, and Chinese.
Automatic architecture updates.Each time MicroStrategy pushes out a new architectural design, we automatically upgrade the underlying AWS CloudFormation template so the next time an organization deploys a new environment, it’s on the latest MicroStrategy architecture.
Now deployed on Amazon Linux. MicroStrategy on AWS is now deployed on Amazon Linux. Amazon Linux offers better support, costs less and is highly integrated within the AWS ecosystem.
| •
| Center for Internet Security (CIS) baselines. MicroStrategy follows CIS best practices to help mitigate cyber risks and protect customer data.
|
MicroStrategy Cloud
MicroStrategy Cloud offers an integrated and optimized cloud business analytics platform that combines infrastructure, technology, people, and processes to offer analytics as a service to our customers. MicroStrategy Cloud builds on MicroStrategy 10, and adds class-leading ETL and database technology to provide an agile, high performance, elastic, and cost-effective analytics platform.
MicroStrategy Cloud provides our customers MicroStrategy 10 offerings through a Platform-as-a-Service (PaaS) solution hosted in the cloud. In addition to MicroStrategy Analytics and MicroStrategy Mobile, MicroStrategy Cloud also offers data integration ETL and data hosting services. The MicroStrategy Cloud PaaS provides customers with infrastructure (data center space, rack space, power, cooling, and servers), technology platforms (analytics, mobile data integration, and data hosting), operations, support, and expert analytics practitioners for a subscription fee with no upfront capital investment. MicroStrategy Cloud can offer improved time to market, higher performance, and lower overall total cost of ownership compared to traditional on-premise deployments.
Key benefits of MicroStrategy Cloud include:
Agile rapid application development and secure deployment.MicroStrategy Cloud provides the infrastructure, technology, processes, and experts that a customer needs to develop and securely deploy applications quickly. The entire service has been pre-packaged and optimized, and is supported by expert analytics practitioners. This solution allows our customers to get to market much more quickly than traditional approaches and react to business changes as they happen.
High performance analytics applications. MicroStrategy Cloud combines the high performance characteristics of MicroStrategy Analytics and MicroStrategy Mobile with high performance servers and network infrastructure. This integration allows our customers to deploy analytics and mobile applications on demand, allowing them to serve their customers more quickly and efficiently.
Elastic capacity with no capital investment. MicroStrategy Cloud allows customers to get started with no upfront capital investment in infrastructure. Customers can start small and increase their capacity on demand.
Low overall total cost of ownership.IT application costs are driven by capital investments and the personnel cost associated with hiring a staff of experts to build, maintain, and tune a large-scale environment. MicroStrategy Cloud delivers this high performance, tuned, and monitored environment as a service, lowering overall total cost of ownership.
MicroStrategy on AWS and MicroStrategy Cloud Technology Strategy
MicroStrategy on AWS and MicroStrategy Cloud each offers organizations an alternate purchase and deploymenteither licensing model for business analytics, compared to traditional on-premise deployments. Instead of making large upfront capital investmentsadded fees.
Dedicated Sales and building large support teams, MicroStrategy on AWS and MicroStrategy Cloud allow organizations to purchase analytics as a service with no upfront capital investments and offer payment structures that scale with business requirements.
Our MicroStrategy on AWS and MicroStrategy Cloud technology strategy is focused on continuing to enhance the reliability, self-service, performance, and scalability of our offerings. We also seek to differentiate our offerings by investing in enhancing the security process and infrastructure around our services, monitoring existing security and compliance certifications, and obtaining new certifications.
MicroStrategy Services™
MicroStrategy Services consists of MicroStrategy Consulting™, MicroStrategy Education™, and MicroStrategy Technical Support. MicroStrategy Services advises, assists and supports our customers in successfully leveraging
the MicroStrategy platform to achieve enterprise intelligence. Through this three-pronged combination, we help our customers realize the vision of the Intelligent Enterprise™ and the creation of an intelligence platform.
MicroStrategy Consulting
MicroStrategy Consulting provides our customers with assessment, advisory, architecture, and deployment expertise to help drive critical analytics and mobile solutions across key industries. We utilize our deep expertise, thought leadership, and extensive MicroStrategy resources to guide our customers in defining, developing, and delivering core business analytics solutions for their enterprises. These solutions provide our customers with greater access to critical business information and help them make better business decisions faster. MicroStrategy consultants work with the backing of the MicroStrategy product engineering, technical support and account teams to continue to partner with customers to help ensure a high adoption rate, positive ROI, and increased BI maturity. Our team is rigorously trained and certified on capabilities of the MicroStrategy platform.
MicroStrategy Consulting is a worldwide organization with operations in North America, South America, Europe, Middle East, Africa and Asia Pacific, delivering projects to customers across all major industries. Our Global Delivery Center™ (“GDC”), located in Warsaw, Poland, is a hub of several hundred consultants who support analytics and mobile projects directly at customer sites around the world or remotely. With functional and business management practices, the appropriate experts can transition on and off projects as needed. The GDC can quickly scale up or down to meet unique technical and industry requirements. Integrating the GDC with on-site project resources is a flexible and cost-efficient way to receive highly specialized services.
MicroStrategy Education
MicroStrategy Education offers users a personalized plan to expand their knowledge and skill sets and help them build and optimize their organization’s intelligence center. Key Education initiatives include:
Free education. We offer free education through our Jump Start program. 30,000 registrations later, the program continues to attract users interested in learning about business intelligence and MicroStrategy. Each day of the five-day program is structured to stand on its own, allowing users to attend any one or all five days. Currently, the program is available in nine languages in over 40 cities worldwide and online.
Quarterly updated educational content. We update educational content to reflect our quarterly software releases, customer feedback and best practices to help ensure users are learning how to leverage the latest MicroStrategy features and functionalities. As our platform evolves, we continuously improve our suite of courses and certifications so users have access to the latest information.
Certifying intelligence centers. We provide role-specific project certifications for employees within an organization’s intelligence center so they can serve as trusted MicroStrategy advisors. We offer the following options to help users get trained and certified:
Certify at your own pace: Our course schedule delivers the most popular certifications and certification projects on a frequent basis, enabling organizations to build a training and certification schedule that works for their specific enterprise requirements.
Fast track: An efficient and expedited certification program that compresses a lot of knowledge into a short amount of time. Depending on a user’s role, level and certification need, a user can expect to become certified in five to ten days.
Self-paced E-courseware learning. For organizations wanting to get a large number of analysts up and running within a few hours of training, we offer E-courseware modules. Our E-courseware modules are the most cost-effective and efficient option to get users proficient on MicroStrategy. We have made significant investments in our portfolio of E-courseware modules with 10 of our most popular courses now available as self-paced modules.
Course customization. We can customize course content around an organization’s data and how it uses the data to make decisions. Content can be personalized to reflect a customer’s brand and its datasets, and tie it into real-world applications and benefits. Customized courses offer users the information and specific skill sets they need to boost their performance and help ensure their organization is making the most of its training.
MicroStrategy Technical Support
MicroStrategy Technical Support is focused on improving the overall customer experience through proactive technical product support for customers and business partners across MicroStrategy’s software products. Additionally, it is responsible for negotiating and maintaining support contracts with our customers and business partners alike, including support services for MicroStrategy Cloud customers. MicroStrategy Technical Support includes the following groups:
Customer Support Group (CSG). CSG is a team of Technical Support Engineers responsible for providing first level technical support to customers, business partners, and prospects.
Premium Support. Premium Support is a team of Premium Support Engineers that provides dedicated technical support to our elite customers and business partners.
Customer Success Management (CSM). CSM managesTeams
We sell our support renewal business and our process for renewing software maintenance contracts with customers worldwide. It also helps answer questions from customers while working with those customers on renewing their maintenance contracts. The team also works with customers quarterly to ascertain the customer’s on-going satisfaction level.
Sales and Services Strategy
We primarily sell through our dedicated sales force, as well as through channel partners in order to increase market coverage in both domestic and international markets. We provide financial incentives for our channel partners to market and distribute our products and services. We also offer a comprehensive set of educational programs that enhance our potential customers’ and channel partners’ understanding of our software. Furthermore, we offer a wide range of services that provide support in the discovery, planning, development, and deployment stages of a MicroStrategy product or service.
Dedicated sales force. We market our software and servicesofferings chiefly through our direct sales force. We haveforce, with sales offices in locations throughout the world. We use distributors in several countries where we do not have sales offices.also support customers post-sale through a dedicated Customer Success team that manages the customer lifecycle, from onboarding and training through license renewal and expansion. This separation allows our Sales team to focus on new business development and acquisition, while our Customer Success team focuses on customer experience, satisfaction, and lifetime value.
Channel partners.Strategic Partnerships
We have established strategic alliancespartnerships with third partya wide variety of third-party vendors, to help ensure the success of our customers’ business intelligence initiatives. Our channel partners areincluding cloud hosting providers (AWS, Microsoft, and Google), system integrators, consulting firms, value added resellers solution providers,(VARs), managed service providers OEMs,(MSPs), and technology companies.independent software vendors (ISVs). These firms utilizeresell, support, or extend the MicroStrategy platformsplatform for a variety of commercial purposes, and our agreements with them generally provide non-exclusive rights to market our products and services and allow access to oursoftware, marketing materials, product training, and direct sales force for field-level assistance.
We make significant commitments tofinancial investments with our channel partners, including investments in joint development including technical training, and certifications, pre-sales and sales enablement, and marketingco-marketing programs. Through our joint efforts, we believe customers are able tocan minimize their risk and maximize the return on their business intelligence projects. We believe that ourOur channel partners allow us to leverageextend sales and service resources, as well as marketingcoverage and industry-specific expertise to expand our user baseacross regions, languages, and increase our market coverage.business types.
Marketing Strategy
Our marketing programs target the following principal constituencies:audiences:
•Our historical base of corporatetechnology and line-of-business executives across large, global enterprises and mid-size organizations;
•government technology buyers and departmental technology buyers across FORTUNE™ Global 2000 enterprises. We also target senior executives and other leaders in these companies for MicroStrategy Mobile and Usher;vendors to the government community;
•Corporate and departmental technology buyers in mid-sized enterprises;
| •
| Government technology buyers and the vendors to the government community;
|
Independent software vendorsISVs that want to embed ouranalytics technology tools in their solutions;applications; and
•Systemsystem integrators that have technology relationships with the largestlarge enterprises, governments, and information-intensive businesses.
We continually seek to increase our brand awareness by focusing our messaging on the possibilities for value creation and the benefits of using our platforms, and competitive differentiators. The channels we use to communicate with these constituencies include:
Freereach prospective buyers and evaluation software;
Mobile application downloads;
Word of mouthpartners include digital and peer references.
Each quarter in 2017, wesocial media, search and display advertising, industry and hosted symposia events, in cities across North America, Europe, the Middle East, Asia, Africa,webinars, email, partner co-marketing activities, and South America. These events offered IT and business users an opportunity to network, attend workshops, and learn about real-world MicroStrategy 10 applications from our customers. These events also featured topics on analytics and mobile applications in retail, banking, higher education, healthcare and other sectors being transformed by Big Data. We will continue to host symposia events where we will highlight opportunities to drive the adoption of business intelligence across organizations, reduce costs through tool consolidation, and empower the workforce to be more productive – all of which can help attendees plan and achieve their analytics goals.educational forums.
CustomersCompetition
Our customers include leading companies from a wide range of industries, as well as the public sector. These industries include retail, consulting, technology, manufacturing, finance, banking, insurance, healthcare, education, telecommunications, and many more.
Competition
MicroStrategy Analytics, MicroStrategy on AWS and MicroStrategy Cloud Competitors
The analytics market is highly competitive and subject to rapidly changing technology paradigms. Within theand market conditions. For enterprise analytics, space, we compete with many different vendors, including (i) large software vendors,global ISVs, such as IBM, (Cognos), SAP (BO), Microsoft, (Power BI™),Oracle, Salesforce, and Oracle (OBIEE), that provide one or more products that directlySAP. Our ability to compete with our products, (ii) open source analytics vendors such as OpenText™ Analytics and Hitachi (Pentaho®), (iii) various other analytics software providers, such as Qlik™, Tableau Software®, TIBCO®, Information Builders®, and the SAS Institute, and (iv) other vendors offering cloud-based offerings, such as GoodData and Birst, an Infor Company. Our future successsuccessfully depends on a number of factors within and outside of our control. Some of these factors include software quality, performance and reliability; the effectiveness with which we can differentiatequality of our service and compete with these vendorssupport teams; marketing and prospecting effectiveness; the ability to incorporate artificial intelligence and other potential competitors across analytics implementation projects of varying sizes.technically advanced features; and our ability to differentiate our products. Failure to maintain adequate technology differentiation fromperform in these competitors couldor other areas may reduce the demand for our offerings and materially adversely affect our revenue from both existing and prospective customers.
MicroStrategy Mobile Competitors
Government Regulation
Aspects of our business involve collecting, processing, disclosing, storing, and transmitting personal data, which are subject to certain privacy policies, contractual obligations, and U.S. and foreign laws, regulations, and directives relating to privacy and data protection. We store a substantial amount of customer and employee data, including personal data, on our networks and other systems and the cloud environments we manage. In addition, the types of data subject to protection as personal data in the European Union, the United States, and elsewhere have been expanding. In recent years, the collection and use of personal data by companies have come under increased regulatory and public scrutiny, especially in relation to the collection and processing of sensitive data, such as healthcare, biometric, genetic, financial services, and children’s data, precise location data, and data regarding a person’s race or ethnic origins, political opinions, or religious beliefs. For example, in the United States, protected health information is subject to the Health Insurance Portability and Accountability Act of 1996 (“HIPAA”), which can provide for civil and criminal penalties for noncompliance. Entities (such as us) that engage in creating, receiving, maintaining, or transmitting protected health information provided by covered entities and other business associates are subject to enforcement under HIPAA. Our access to protected health information triggers obligations to comply with certain privacy rules and data security requirements under HIPAA.
There are a broad variety of other data protection laws in the United States that are applicable to our activities, and a wide range of enforcement agencies at both the state and federal levels that can review companies for privacy and data security concerns based on general consumer protection laws. The marketFederal Trade Commission and state Attorneys General all are aggressive in reviewing privacy and data security protections for mobile analytics is rapidly evolving.consumers. New mobile deviceslaws also are being considered at both the state and federal levels. A broad range of legislative measures also have been introduced at the federal level. Accordingly, failure to comply with federal and state laws (both those currently in effect and future legislation) regarding privacy and security of personal information could expose us to fines and penalties under such laws. In the event of a security breach, we also may have obligations to notify our customers or other parties or individuals about this breach, and this can lead to significant costs and the risk of potential enforcement and/or litigation. There is also a threat of consumer class actions related to these laws and the overall protection of personal data. Even if we are not determined to have violated these laws, government investigations into these issues typically require the expenditure of significant resources and generate negative publicity, which could harm our reputation and our business.
In the European Union, the General Data Protection Regulation (“GDPR”) imposes requirements regarding the handling and security of personal data, requires disclosure of data breaches to individuals, customers, and data protection authorities in certain circumstances, requires companies to honor data subjects’ requests relating to their personal data, permits regulators to impose fines of up to €20,000,000 or 4% of global annual revenue, whichever is higher, and establishes a private right of action. Furthermore, a new ePrivacy Regulation, regulating electronic communications, was proposed in 2017 and is under consideration by the European Commission, the European Parliament, and the European Council. More recently, the Court of Justice of the European Union (“CJEU”) invalidated the U.S.-EU Privacy Shield in July 2020. The U.S.-EU Privacy Shield provided a mechanism to lawfully transfer personal data from the European Union to the United States and certain other countries. In the wake of the invalidation of the U.S.-EU Privacy Shield, we have transitioned to reliance on the EU Standard Contractual Clauses (“SCCs”) to lawfully transfer certain personal data from the European Union to the United States.
In June 2021, the European Data Protection Board (“EDPB”) issued formal recommendations on measures to ensure compliance with the EU data protection requirements when transferring personal data outside of the European Economic Area (the “EDPB Recommendations”). In summary, if “problematic legislation” or practices are identified in the market atdestination country which impinge on
the effectiveness of the appropriate safeguards of the transfer tool(s), the EDPB now recommends the data exporter to consider whether the laws/practices will be applied in practice to the relevant data, taking into account the importer’s experience and sector.
In addition, the EDPB issued a rapid pace,new set of SCCs in June 2021, which were required to be adopted for new transfers of personal data from September 2021 and enhancementsreplace those used for existing transfers of personal data by December 2022. The new SCCs place obligations on us as a data importer in relation to mobile operating systemsgovernment authorities’ access requests in respect of personal data transferred under the SCCs. The EDPB Recommendations are being made at an even faster rate. The rapidly changing technology landscape creates opportunities for both existing competitors and new vendorsdesigned to introduce innovative new products. Within the mobile analytics space, we predominantly competebe read in tandem with the samenew SCCs and set of analytics vendors that we compete without requirements for organizations to assess third countries and identify appropriate data protection supplementary measures to be implemented on a case-by-case basis where needed.
The rules involving this alternative SCC data transfer option are continually undergoing revision and this transfer mechanism may also be declared invalid (or require us to change our business practices) in the analytics market. Our competitivenessfuture, requiring us to provide an alternative means of data transfer or implement significant changes in this marketour data security and protection practices.
On July 10, 2023, the European Commission formally adopted an adequacy decision in respect of the EU-U.S. Data Privacy Framework (“DPF”). The DPF provides for safe transfers of personal data from the EU to U.S. companies which have joined the DPF and have agreed to comply with the DPF principles. The DPF replaces the previous EU-U.S. Privacy Shield and contains new U.S. data privacy principles. The DPF will dependbe administered by the U.S. Department of Commerce, which will process applications for certification and monitor whether participating companies continue to meet their certification criteria and the U.S. Federal Trade Commission will enforce compliance with the DPF. Organizations like MicroStrategy that retained their certifications under the previous EU-U.S. Privacy Shield may begin relying on how quickly we can adaptDPF immediately and will be provided with guidance to facilitate transition to DPF. Similar to the changing technology landscapeSCCs, the requirements under the DPF are subject to change and this transfer mechanism may also be declared invalid (or require us to change our business practices) in the future. In addition, given the uncertainty surrounding the long-term validity of the new DPF, there is some resistance to formal adoption of the DPF as a data transfer mechanism by certain entities, including some of our customers and vendors, which may require us to evaluate alternative means of data transfer or implement significant changes in our data security and protection practices.
As with other issues related to the withdrawal of the United Kingdom from the European Union, commonly referred to as “Brexit,” there are open questions about how effectivelypersonal data will be protected in the UK and whether personal information can transfer from the EU to the UK. Following the withdrawal of the UK from the EU, the UK Data Protection Act of 2018 applies to the processing of personal data that takes place in the UK and includes parallel obligations to those set forth by GDPR. While the Data Protection Act of 2018 in the United Kingdom that “implements” and complements GDPR achieved Royal Assent on May 23, 2018, and is now effective in the United Kingdom, it is still unclear whether transfer of data from the European Economic Area, or EEA, to the United Kingdom will remain lawful under GDPR. The United Kingdom government has already determined that it considers all European Union and EEA member states to be adequate for the purposes of data protection, ensuring that data flows from the United Kingdom to the European Union/EEA remain unaffected. The UK and EEA recently announced that personal data may flow between the EU/EEA and the UK without the need for SCCs. However, in response to concerns expressed primarily about changes to the UK data protection framework and human rights legislation, Europe’s adequacy decision will sunset and require renewal four years after entry.
In addition, on June 8, 2023, the UK and U.S. reached a commitment to establish a UK Extension to the DPF that will create a ‘data bridge’ between the two countries. The UK Government subsequently adopted regulations recognizing the U.S. as providing an adequate level of protection, allowing personal data in the scope of the DPF to be transferred to organizations in the U.S. which participate in the UK Extension to the EU-U.S. DPF beginning on October 12, 2023.
Brazil also enacted the Lei Geral de Proteção de Dados (the “Brazilian General Data Protection Law”), which became effective in August 2020 and imposes requirements largely similar to GDPR on products and services offered to users in Brazil. We may also be subject in China to the Cybersecurity Law that went into effect in June 2017 and a revision of the Personal Information Security Specification that went into effect in October 2020, which have uncertain but broad application and impose a number of new privacy and data security obligations. In the summer of 2021, China passed the Data Security Law of the P.R.C (“DSL”), which came into effect on September 1, 2021. China also passed the Personal Information Protection Law of the P.R.C. (“PIPL”), which came into effect on November 1, 2021. The PIPL resembles GDPR in many aspects but will create new and challenging obligations for companies doing business in China. Under these new regulations, if an entity operating in China violates the law, regulators may order it to take corrective actions, issue warnings, confiscate illegal income, suspend services, revoke operating permits or business licenses, or issue a fine. The fine can be up to ¥50 million or 5 percent of an organization’s annual revenue for the prior financial year. A broad range of other countries continue to explore either new privacy and data security laws or changes to existing laws.
In addition to these specific laws, we sell, market,also are subject to other privacy, security, and differentiatedata protection laws around the world. In addition to the laws in place already, other countries are also considering new or expanded laws governing privacy and data security that may impact our offering.business practices. These laws may impact our ongoing business activities and our relationships with our business partners, customers and service providers.
Usher CompetitorsIn the United States there also are specific state laws that may impact our business activities. For example, the state of California adopted a comprehensive privacy law, the California Consumer Privacy Act (“CCPA”), which took effect in January 2020 and became enforceable in July 2020. We have been and will continue to be required to devote substantial resources to implement and maintain
compliance with the CCPA, and noncompliance could result in regulatory investigations and fines or private litigation. Moreover, in November 2020, California voters approved a privacy law, the California Privacy Rights Act (“CPRA”), which amends the CCPA to create privacy rights and obligations in California. More than 12 other states already have passed similar state privacy laws, which already have gone into effect or will go into effect in the future. In addition, the state of Washington passed the My Health My Data Act in 2023 which specifically regulates health information that is not otherwise regulated by the HIPAA rules. Other states have already passed similar laws and other states may do so in the future. All of these privacy laws may impact our business activities and our relationships with business partners, customers and service providers.
Usher competes with companies with technologies categorized as user authentication products. These competitors focus primarily on traditional formsFurthermore, the U.S. Congress is considering comprehensive privacy legislation. At this time, it is unclear whether Congress will pass such a law and if so, when and what it will require and prohibit. Moreover, it is not clear whether any such legislation would give the Federal Trade Commission (“FTC”) any new authority to impose civil penalties for violations of identity verification such as smart cards, tokens,the Federal Trade Commission Act in the first instance, whether Congress will grant the FTC rulemaking authority over privacy and password managers. These companies have significant name recognitioninformation security, or whether Congress will vest some or all privacy and offer solutions withdata security architectures that are familiarregulatory authority and enforcement power in a new agency, akin to IT buyers. Usher also competes with companies with newer solutions, often involving mobile technology.EU data protection authorities.
Employees
As of December 31, 2017,2023, we had a total of 2,2161,934 employees, of whom 1,100642 were based in the United States and 1,1161,292 were based internationally. Of our 2,216 employees, 652 were engaged in sales and marketing, 559 in research and development, 707 in subscription, product support, consulting, and education services, and 298 in finance, administration, and corporate operations. None of our employees in the United States is represented by a labor union; however, inemployees of certain of our foreign subsidiaries some employees are members of trade or local unions. InFor example, in France, our employees are represented by a works council as required by local law. We have not experienced any work stoppages and generally consider our relations with our employees to be good.
The following table summarizes employee headcount as of the dates indicated:
| | | December 31, | | | December 31, | | | December 31, | | | December 31, | | | December 31, | | | December 31, | |
| | 2015 | | | 2016 | | | 2017 | | | 2023 | | | 2022 | | | 2021 | |
Subscription services | | | 37 | | | | 48 | | | | 53 | | | | 100 | | | | 110 | | | | 72 | |
Product support | | | 131 | | | | 171 | | | | 172 | | | | 154 | | | | 183 | | | | 174 | |
Consulting | | | 467 | | | | 453 | | | | 441 | | | | 399 | | | | 447 | | | | 413 | |
Education | | | 28 | | | | 39 | | | | 41 | | | | 13 | | | | 16 | | | | 36 | |
Sales and marketing | | | 513 | | | | 587 | | | | 652 | | | | 390 | | | | 434 | | | | 470 | |
Research and development | | | 461 | | | | 512 | | | | 559 | | | | 642 | | | | 688 | | | | 699 | |
General and administrative | | | 310 | | | | 323 | | | | 298 | | | | 236 | | | | 274 | | | | 257 | |
Total headcount | | | 1,947 | | | | 2,133 | | | | 2,216 | | | | 1,934 | | | | 2,152 | | | | 2,121 | |
ResearchWe recognize and Product Development
We maintain a dedicated performance engineering team and conduct research and development focused on providing our customers withvalue the highest levels of performance for analytics applicationscontribution of all sizesour employees. Due to their dedication, hard work, loyalty, and security solutions. The descriptioncommitment, we have had continued success as a company. Our philosophy is to create an agile, evolving environment that allows all of researchour employees to grow and development expenses in “Item 7. Management’s Discussionthrive, with initiatives and Analysis of Financial Conditionplatforms that reward and Results of Operations” includes a breakdown of such expenses. We believe that our future performance will depend in large partrecognize employees for their hard work and commitment to delivering personal excellence and creativity at MicroStrategy.
Our human capital management objectives are to attract, retain, and develop leading talent to deliver on our abilitybusiness strategies. To accomplish these objectives, we constantly strive to maintainunderstand the drivers of talent attraction, retention, and sustainable engagement with our employees in each of the geographies in which we operate. As part of this process, we regularly benchmark the benefits we offer our employees against those offered within our industry generally and the local markets in which we operate. During 2023, we continued to expand our equity compensation programs worldwide to provide our employees with greater opportunities to share in any appreciation of our class A common stock. In addition, we pride ourselves on preparing a highly skilled workforce through technical boot camps, regular training workshops, and a variety of other learning experiences. Our initiative-driven teams work with a modern technology stack, and they meet and learn from some of the most experienced innovators in their field. Through these efforts we seek to create an environment in which our employees can flourish, respond quickly to client demand and enhance our current product line, develop new products that achieve market acceptance, maintain technological competitiveness,their connections with colleagues and meet an expanding rangetowards the communities they are a part of customer requirements.globally.
Available Information
Our website is located at www.microstrategy.com.www.microstrategy.com. We make available free of charge, on or through the Investor Relations section of our website (http:(http://ir.microstrategy.com)ir.microstrategy.com), our annual reports on Form 10-K, quarterly reports on Form 10-Q, current reports on Form 8-K, and all amendments to those reports filed or furnished pursuant to Section 13(a) or 15(d) of the Exchange Act, as soon as reasonably practicable after electronically filing or furnishing such reports with the Securities and Exchange Commission (“SEC”).SEC. Information found on our website is not part of this Annual Report or any other report filed with the SEC. The public may read and copy any materials filed by the Company with the SEC at the SEC’s Public Reference Room at 100 F Street, NE, Washington, DC 20549. The public may obtain information on the operation of the Public Reference Room by calling the SEC at 1-800-SEC-0330. The SEC maintains an Internet site that contains reports, proxy and information statements, and other information regarding issuers, including us, that file or furnish electronically with the SEC at www.sec.gov.
Item 1A. Risk Factors
You should carefully consider the risks described below before making an investment decision. The risks and uncertainties described below are not the only ones we face. Additional risks and uncertainties not presently known to us or that we currently deem immaterial may also impair our business operations.
If any of the following risks occurs,occur, our business, financial condition, or results of operations could be materially adversely affected. In such case, the market price of our class A common stock could decline, and you may lose all or part of your investment.
Risks Related to Our Business in General
Our quarterly operating results, revenues, and expenses may fluctuate significantly, which could have an adverse effect on the market price of our stock
For many reasons, including those described below, our operating results, revenues, and expenses have varied in the past and may vary significantly in the future from quarter to quarter. These fluctuations could have an adverse effect on the market price of our class A common stock.
Fluctuations in Quarterly Operating Results. Our quarterly operating results may fluctuate, in part, as a result of:
•fluctuations in the price of bitcoin, of which we have significant holdings and with respect to which we expect to continue to make significant future purchases, and potential material impairment charges that may be associated therewith;
•any sales by us of our bitcoin at prices above their then-current carrying costs, which would result in our recording gains upon sale of our digital assets;
•regulatory, commercial, and technical developments related to bitcoin or the Bitcoin blockchain, or digital assets more generally;
•the size, timing, volume, and execution of significant orders and shipments;deliveries;
•the mix of products and servicesour offerings ordered by customers, including product licenses and subscription offerings,cloud subscriptions, which can affect the extent to which revenue is recognized immediately or over future quarterly periods;
•the timing of the release or delivery of new or enhanced offerings which may affect the period in which we can recognize revenue;
and market acceptance of new and enhanced offerings; •the timing of announcements of new offerings by us or our competitors;
•changes in our pricing policies or those of our competitors;
•market acceptance of new and enhanced versions of our products and services;
the length of our sales cycles;
•seasonal or other buying patterns of our customers;
•changes in our operating expenses;
•planned major maintenance activities relatedthe impact of war, terrorism, infectious diseases (such as COVID-19), natural disasters and other global events, and government responses to such events, on the global economy and on our corporate aircraft;
customers, suppliers, employees, and business; •the timing of research and development projects and the capitalization of software development costs;
projects; our use of channel partners;
utilization of our consulting and education services, which can be affected by delays or deferrals of customer implementation of our software products;
software;•changesfluctuations in foreign currency exchange rates;
•bilateral or multilateral trade tensions, which could affect our offerings in particular foreign markets;
•our profitability and expectations for future profitability and their effect on our deferred tax assets and net income for the period in which any adjustment to our net deferred tax asset valuation allowance may be made;
•increases or decreases in our liability for unrecognized tax benefits; and
•changes in customer decision makingdecision-making processes or customer budgets.
Limited Ability to Adjust Expenses. We base our operating expense budgets on expected revenue trends and strategic objectives. Many of our expenses, such as interest expense on our long-term debt, office leases and certain personnel costs, are relatively fixed. We may be unable to adjust spending quickly enough to offset any unexpected revenue shortfall.shortfall or impairment losses related to our digital assets. Accordingly, any shortfall in revenue from our enterprise analytics software business or impairment losses related to our digital assets may cause significant variation in operating results in any quarter. For example, if our revenues in the future are not sufficient to offset our operating expenses, or we are unable to adjust our operating expenses in a timely manner in response to any shortfall in anticipated revenue, we may incur operating losses.
Based on the above factors, we believe that quarter-to-quarter comparisons of our operating results are not a good indication of our future performance. It is possible that in one or more future quarters, our operating results may be below the expectations of public market analysts and investors. In that event, the market price of our class A common stock may fall.
The market price of our class A common stock has been and may continue to be volatile
The market price of our class A common stock historically has been volatile and may continue to be volatile. The market price of our class A common stock may fluctuate widely in response to various factors, some of which are beyond our control. These factors include, but are not limited to:
quarterly variations in our results of operations or those of our competitors;
announcements about our earnings that are not in line with analyst expectations, the likelihood of which may be enhanced because it is our policy not to give guidance relating to our anticipated financial performance in future periods;
announcements by us or our competitors of acquisitions, dispositions, new offerings, significant contracts, commercial relationships, or capital commitments;
the emergence of new sales channels in which we are unable to compete effectively;
our ability to develop, market, and deliver new and enhanced offerings on a timely basis;
commencement of, or our involvement in, litigation;
any major change in our Board of Directors, management, or governing documents;
changes in government regulations or in the status of our regulatory approvals;
recommendations by securities analysts or changes in earnings estimates and our ability to meet those estimates;
investor perception of our Company;
announcements by our competitors of their earnings that are not in line with analyst expectations;
the volume of shares of our class A common stock available for public sale;
sales or purchases of stock by us or by our stockholders, and issuances of awards under our stock incentive plan;
short sales, hedging, and other derivative transactions involving shares of our class A common stock; and
general economic conditions and slow or negative growth of related markets.
In addition, the stock market in general, and the market for technology companies in particular, have experienced extreme price and volume fluctuations that have often been unrelated or disproportionate to the operating performance of companies in those markets. These broad market and industry factors may seriously harm the market price of our class A common stock, regardless of our actual operating performance.
We may not be able to sustain or increaseachieve profitability in the future periods
We generated net income for each of the fiscal yearsyear ended December 31, 2017, 2016,2023, due in part to a $553.6 million tax benefit generated primarily from the release of the valuation allowance on our deferred tax asset related to the impairment on our bitcoin holdings (attributable to the increase in market value of bitcoin as of December 31, 2023 compared to December 31, 2022) and 2015;a $44.7 million gain on debt extinguishment resulting from the repayment of the 2025 Secured Term Loan, however, we may not be able to sustain or increaseachieve profitability on a quarterly or annual basis in the future.future periods. If our revenues are not sufficient to offset our operating expenses, or we are unable to adjust our operating expenses in a timely manner in response to any shortfall in anticipated revenue, or we incur additional significant impairment losses related to our digital assets, we may incur operating losses in future periods, our profitability may decrease, or we may cease to be profitable, or we may incur operating losses.profitable. As a result, our business, results of operations, and financial condition may be materially adversely affected.
As of December 31, 2017,2023, we had $13.4$757.6 million of deferred tax assets, net ofwhich reflects a $1.0$1.4 million valuation allowance. IfThe largest deferred tax asset relates to the impairment on our bitcoin holdings. Changes to the valuation allowance against the deferred tax asset are largely dependent on the change in the market value of bitcoin from the previous reporting date. During 2023, the value of bitcoin increased substantially which allowed us to release the valuation allowance recorded against the bitcoin holding; however, if the market value of bitcoin at a future reporting date is less than the average cost basis of our bitcoin holdings at such reporting date, we are unablemay be required to sustainestablish a valuation allowance against our U.S. deferred tax assets. Additionally, if we do not achieve profitability in the future, we may also be required to increase the valuation allowance against thesethe remaining deferred tax assets, whichassets. A significant increase in the valuation allowance could result in a charge that would materially adversely affect net income in the period in which the charge is incurred.
Economic uncertainty and increased competition for our customers, particularly in the retail industry, could materially adversely affect our business and results of operations
The U.S. and other significant markets have experienced cyclical downturns and worldwide economic conditions remain uncertain. Economic uncertainty and associated macroeconomic conditions make it extremely difficult for our customers and us to accurately forecast and plan future business activities, and could cause our customers to slow spending on our products and services, which could delay and lengthen sales cycles. Furthermore, during uncertain economic times, our customers may face issues gaining timely access to sufficient credit, which could result in an impairment of their ability to make timely payments to us. If that were to occur, we may be required to increase our allowance for doubtful accounts and our results would be negatively impacted.
Furthermore, we have a significant number of customers in the retail industry, which has recently experienced intense competition and structural changes. A significant downturn or the intensification of competition in this industry may cause organizations to reduce their capital expenditures in general or specifically reduce their spending on information technology. In addition, customers in this industry may delay or cancel information technology projects or seek to lower their costs by renegotiating vendor contracts. Customers with excess information technology resources may choose to develop in-house software solutions rather than obtain those solutions from us. In recent years, consumers have increasingly migrated toward large e-commerce platforms and other online applications. As a result, the retail industry has experienced consolidation and other ownership changes. In the future, retailers may further consolidate, undergo restructurings or reorganizations, or realign their affiliations, any of which could decrease the number of competitors within the retail industry, reducing the number of potential customers for our offerings. Moreover, our competitors may respond to challenging market conditions by lowering prices and attempting to lure away our customers.
We cannot predict the timing, strength, or duration of any economic slowdown or any subsequent recovery generally, or competitive and structural changes in the retail industry. If the conditions in the general economy and the markets in which we operate worsen from present levels, our business, financial condition, and results of operations could be materially adversely affected.
We may have exposure to greater than anticipated tax liabilities
We are subject to income taxes and non-income taxes in a variety of domestic and foreign jurisdictions. Our future income taxestax liability could be materially adversely affected by earnings that are lower than anticipated in jurisdictions where we have lower statutory rates, earnings that are higher than anticipated in jurisdictions where we have higher statutory rates, changes in the valuation of our deferred tax assets and liabilities, changes in the amount of our unrecognized tax benefits, or changes in tax laws, regulations, accounting principles, or interpretations thereof. In addition, if we sold any of our bitcoin at prices greater than the cost basis of the bitcoin sold, we would incur a tax liability with respect to any gain recognized, and such tax liability could be material.
Further changesChanges in the tax laws of foreign jurisdictions could arise, including as a result of the base erosion and profit shifting (“BEPS”) project undertaken by the Organisation for Economic Co-operation and Development (“OECD”) to combat base erosion and profit shifting (“BEPS”). The OECD, which represents a coalition of member countries, has issued recommendations that, in some cases, make substantial changes to numerous long-standing tax positions and principles. These changes, many of which have been adopted or are under active consideration by OECD members and/or other countries, could
increase tax uncertainty and may adversely affect our provision for income taxes. In addition,
After enactment of the U.S. Tax Cuts and Jobs Act, most of our income is taxable in the United States, legislation bringing about broad changesU.S. with a significant portion taxable under the Global Intangible Low-Taxed Income (“GILTI”) regime. Beginning in fiscal year 2027, the existingdeduction allowable under the GILTI regime will decrease from 50% to 37.5%, which will increase the effective tax rate imposed on our income. The U.S. also enacted the Inflation Reduction Act of 2022 (“IRA”) in August 2022. The IRA applies to tax years beginning after December 31, 2022 and introduces a 15% corporate alternative minimum tax system was recently enacted, with some retroactive effects. For example, duringfor corporations whose average annual adjusted financial statement income for any consecutive three-tax-year period preceding the fourth quarter of 2017, we estimatedtax year exceeds $1 billion and recorded a one-time transition1% excise tax expense of $40.3 million dueon certain stock repurchases made by publicly traded U.S. corporations after December 31, 2022. Subject to the recently enacted U.S. corporaterelease and content of the final regulations by the IRS with respect to the application of the minimum tax reform legislation that effected a deemed repatriationand treatment of certain foreignunrealized fair value gains, upon our adoption of Accounting Standards Update No. 2023-08, Intangibles—Goodwill and Other—Crypto Assets (Subtopic 350-60): Accounting for and Disclosure of Crypto Assets (“ASU 2023-08”), we could become subject to the alternative minimum tax if, for example, we experience significant unrealized gains on our bitcoin holdings. If we become subject to these new taxes under the IRA for these or any other reasons, it could materially affect our financial results, including our earnings and profits.cash flow, and our financial condition.
Our determination of our tax liability is subject to review by applicable domestic and foreign tax authorities. Any adverse outcome of such reviews could have an adverse effect on our operating results and financial condition. The determination of our worldwide provision for income taxes and other tax liabilities requires significant judgment and in the ordinary course of business, there are many transactions and calculations,
including in respect of transactions involving bitcoin, where the ultimate tax determination is uncertain. Moreover, as a multinational business, we have subsidiaries that engage in many intercompany transactions in a variety of tax jurisdictions where the ultimate tax determination is uncertain.
We also have contingent tax liabilities that, in management’s judgment, are not probable of assertion. If such unasserted contingent liabilities were to be asserted, or become probable of assertion, we may be required to record significant expenses and liabilities in the period in which these liabilities are asserted or become probable of assertion.
As a result of these and other factors, the ultimate amount of tax obligations owed may differ from the amounts recorded in our financial statements and any such difference may materially affect our financial results in future periods in which we change our estimates of our tax obligations or in which the ultimate tax outcome is determined.
Risks Related to Our Bitcoin Acquisition Strategy and Holdings
Our bitcoin acquisition strategy exposes us to various risks associated with bitcoin
Our bitcoin acquisition strategy exposes us to various risks associated with bitcoin, including the following:
Bitcoin is a highly volatile asset. Bitcoin is a highly volatile asset that has traded below $20,000 per bitcoin and above $50,000 per bitcoin on the Coinbase exchange (our principal market for bitcoin) in the 12 months preceding the date of this Annual Report. The trading price of bitcoin significantly decreased during prior periods, and such declines may occur again in the future.
Bitcoin does not pay interest or dividends. Bitcoin does not pay interest or other returns and we can only generate cash from our bitcoin holdings if we sell our bitcoin or implement strategies to create income streams or otherwise generate cash by using our bitcoin holdings. Even if we pursue any such strategies, we may be unable to create income streams or otherwise generate cash from our bitcoin holdings, and any such strategies may subject us to additional risks.
Our bitcoin holdings significantly impact our financial results and the market price of our class A common stock. Our bitcoin holdings have significantly affected our financial results and if we continue to increase our overall holdings of bitcoin in the future, they will have an even greater impact on our financial results and the market price of our class A common stock. See “Risks Related to Our Bitcoin Acquisition Strategy and Holdings – Our historical financial statements do not reflect the potential variability in earnings that we may experience in the future relating to our bitcoin holdings.”
Our bitcoin acquisition strategy has not been tested over an extended period of time or under different market conditions. We are continually examining the risks and rewards of our bitcoin acquisition strategy. This strategy has not been tested over an extended period of time or under different market conditions. For example, although we believe bitcoin, due to its limited supply, has the potential to serve as a hedge against inflation in the long term, the short-term price of bitcoin declined in recent periods during which the inflation rate increased. Some investors and other market participants may disagree with our bitcoin acquisition strategy or actions we undertake to implement it. If bitcoin prices were to decrease or our bitcoin acquisition strategy otherwise proves unsuccessful, our financial condition, results of operations, and the market price of our class A common stock would be materially adversely impacted.
We are subject to counterparty risks, including in particular risks relating to our custodians. Although we have implemented various measures that are designed to mitigate our counterparty risks, including by storing substantially all of the bitcoin we own in custody accounts at U.S.-based, institutional-grade custodians and negotiating contractual arrangements intended to establish that our property interest in custodially-held bitcoin is not subject to claims of our custodians’ creditors, applicable insolvency law is not fully developed with respect to the holding of digital assets in custodial accounts. If our custodially-held bitcoin were nevertheless considered to be the property of our custodians’ estates in the event that any such custodians were to enter bankruptcy, receivership or similar insolvency proceedings, we could be treated as a general unsecured creditor of such custodians, inhibiting our ability to exercise ownership rights with respect to such bitcoin and this may ultimately result in the loss of the value related to some or all of such bitcoin. Even if we are able to prevent our bitcoin from being considered the property of a custodian’s bankruptcy estate as part of an insolvency proceeding, it is possible that we would still be delayed or may otherwise experience difficulty in accessing our bitcoin held by the affected custodian during the pendency of the insolvency proceedings. Any such outcome could have a material adverse effect on our financial condition and the market price of our class A common stock.
The broader digital assets industry is subject to counterparty risks, which could adversely impact the adoption rate, price, and use of bitcoin. A series of recent high-profile bankruptcies, closures, liquidations, regulatory enforcement actions and other events relating to companies operating in the digital asset industry, including the filings for bankruptcy protection by Three Arrows Capital, Celsius Network, Voyager Digital, FTX Trading and Genesis Global Capital, the closure or liquidation of certain financial institutions that provided lending and other services to the digital assets industry, including Signature Bank and Silvergate Bank, SEC enforcement actions against Coinbase, Inc. and Binance Holdings Ltd., the placement of Prime Trust, LLC into receivership following a cease-and-desist order issued by Nevada’s Department of Business and Industry, and the filing and subsequent settlement of a civil fraud lawsuit by the New York Attorney General against Genesis Global Capital, its parent company Digital Currency Group, Inc., and former partner Gemini Trust Company, have highlighted the counterparty risks applicable to owning and transacting in digital assets. Although these
bankruptcies, closures, liquidations and other events have not resulted in any loss or misappropriation of our bitcoin, nor have such events adversely impacted our access to our bitcoin, they have, in the short-term, likely negatively impacted the adoption rate and use of bitcoin. Additional bankruptcies, closures, liquidations, regulatory enforcement actions or other events involving participants in the digital assets industry in the future may further negatively impact the adoption rate, price, and use of bitcoin, limit the availability to us of financing collateralized by bitcoin, or create or expose additional counterparty risks.
Changes in our ownership of bitcoin could have accounting, regulatory and other impacts. While we currently own bitcoin directly and through our wholly owned subsidiaries, we may investigate other potential approaches to owning bitcoin, including indirect ownership (for example, through ownership interests in a fund that owns bitcoin). If we were to own all or a portion of our bitcoin in a different manner, the accounting treatment for our bitcoin, our ability to use our bitcoin as collateral for additional borrowings, and the regulatory requirements to which we are subject, may correspondingly change.
Changes in the accounting treatment of our bitcoin holdings could have significant accounting impacts, including increasing the volatility of our results. In December 2023, the FASB issued ASU 2023-08, which upon our adoption will require us to measure in-scope crypto assets (including our bitcoin holdings) at fair value in our statement of financial position, and to recognize gains and losses from changes in the fair value of our bitcoin in net income each reporting period. ASU 2023-08 will also require us to provide certain interim and annual disclosures with respect to our bitcoin holdings. The standard is effective for our interim and annual periods beginning January 1, 2025, with a cumulative-effect adjustment to the opening balance of retained earnings as of the beginning of the annual reporting period in which we adopt the guidance. Early adoption is permitted in any interim or annual period for which our financial statements have not been issued as of the beginning of the annual reporting period. Due in particular to the volatility in the price of bitcoin, we expect the adoption of ASU 2023-08 to have a material impact on our financial results in future periods, increase the volatility of our financial results, and affect the carrying value of our bitcoin on our balance sheet, and could have adverse tax consequences, which in turn could have a material adverse effect on our financial results and the market price of our class A common stock. Additionally, as a result of ASU 2023-08 requiring a cumulative-effect adjustment to our opening balance of retained earnings as of the beginning of the annual period in which we adopt the guidance and not permitting retrospective restatement of our historical financial statements, our future results will not be comparable to results from periods prior to our adoption of the guidance.
The broader digital assets industry, including the technology associated with digital assets, the rate of adoption and development of, and use cases for, digital assets, market perception of digital assets, and the legal, regulatory, and accounting treatment of digital assets are constantly developing and changing, and there may be additional risks in the future that are not possible to predict.
Bitcoin is a highly volatile asset, and fluctuations in the price of bitcoin have in the past influenced and are likely to continue to influence our financial results and the market price of our class A common stock
Bitcoin is a highly volatile asset, and fluctuations in the price of bitcoin have in the past influenced and are likely to continue to influence our financial results and the market price of our class A common stock. Our financial results and the market price of our class A common stock would be adversely affected, and our business and financial condition would be negatively impacted, if the price of bitcoin decreased substantially (as it has in the past, including during 2022), including as a result of:
•decreased user and investor confidence in bitcoin, including due to the various factors described herein;
•investment and trading activities, such as (i) trading activities of highly active retail and institutional users, speculators, miners and investors, (ii) actual or expected significant dispositions of bitcoin by large holders, including the expected liquidation of digital assets associated with entities that have filed for bankruptcy protection, such as FTX, which in September 2023 received approval to sell up to $3 billion worth of digital assets, including bitcoin, and the transfer and sale of bitcoins associated with the hacked cryptocurrency exchange Mt. Gox, and (iii) actual or perceived manipulation of the spot or derivative markets for bitcoin or spot bitcoin ETPs;
•negative publicity, media or social media coverage, or sentiment due to events in or relating to, or perception of, bitcoin or the broader digital assets industry, for example, (i) public perception that bitcoin can be used as a vehicle to circumvent sanctions, including sanctions imposed on Russia or certain regions related to the ongoing conflict between Russia and Ukraine, or to fund criminal or terrorist activities, such as the purported use of digital assets by Hamas to fund its terrorist attack against Israel in October 2023; (ii) expected or pending civil, criminal, regulatory enforcement or other high profile actions against major participants in the bitcoin ecosystem, including the SEC’s enforcement actions against Coinbase, Inc. and Binance Holdings Ltd.; (iii) additional filings for bankruptcy protection or bankruptcy proceedings of major digital asset industry participants, such as the bankruptcy proceeding of FTX Trading and its affiliates; and (iv) the actual or perceived environmental impact of bitcoin and related activities, including environmental concerns raised by private individuals, governmental and non-governmental organizations, and other actors related to the energy resources consumed in the bitcoin mining process;
•changes in consumer preferences and the perceived value or prospects of bitcoin;
•competition from other digital assets that exhibit better speed, security, scalability, or energy efficiency, that feature other more favored characteristics, that are backed by governments, including the U.S. government, or reserves of fiat currencies, or that represent ownership or security interests in physical assets;
•a decrease in the price of other digital assets, including stablecoins, or the crash or unavailability of stablecoins that are used as a medium of exchange for bitcoin purchase and sale transactions, such as the crash of the stablecoin Terra USD in 2022, to the extent the decrease in the price of such other digital assets or the unavailability of such stablecoins may cause a decrease in the price of bitcoin or adversely affect investor confidence in digital assets generally;
•the identification of Satoshi Nakamoto, the pseudonymous person or persons who developed bitcoin, or the transfer of substantial amounts of bitcoin from bitcoin wallets attributed to Mr. Nakamoto;
•disruptions, failures, unavailability, or interruptions in service of trading venues for bitcoin, such as, for example, the announcement by the digital asset exchange FTX Trading that it would freeze withdrawals and transfers from its accounts and subsequent filing for bankruptcy protection and the recent SEC enforcement action brought against Binance Holdings Ltd., which initially sought to freeze all of its assets during the pendency of the enforcement action;
•the filing for bankruptcy protection by, liquidation of, or market concerns about the financial viability of digital asset custodians, trading venues, lending platforms, investment funds, or other digital asset industry participants, such as the filing for bankruptcy protection by digital asset trading venues FTX Trading and BlockFi and digital asset lending platforms Celsius Network and Voyager Digital Holdings in 2022, the ordered liquidation of the digital asset investment fund Three Arrows Capital in 2022, the announced liquidation of Silvergate Bank in 2023, the government-mandated closure and sale of Signature Bank in 2023, the placement of Prime Trust, LLC into receivership following a cease-and-desist order issued by the Nevada Department of Business and Industry in 2023, and the exit of Binance from the U.S. market as part of its settlement with the Department of Justice and other federal regulatory agencies;
•regulatory, legislative, enforcement and judicial actions that adversely affect the price, ownership, transferability, trading volumes, legality or public perception of bitcoin, or that adversely affect the operations of or otherwise prevent digital asset custodians, trading venues, lending platforms or other digital assets industry participants from operating in a manner that allows them to continue to deliver services to the digital assets industry;
•further reductions in mining rewards of bitcoin, including block reward halving events, which are events that occur after a specific period of time that reduce the block reward earned by “miners” who validate bitcoin transactions, or increases in the costs associated with bitcoin mining, including increases in electricity costs and hardware and software used in mining, that may cause a decline in support for the Bitcoin network;
•transaction congestion and fees associated with processing transactions on the Bitcoin network;
•macroeconomic changes, such as changes in the level of interest rates and inflation, fiscal and monetary policies of governments, trade restrictions, and fiat currency devaluations;
•developments in mathematics or technology, including in digital computing, algebraic geometry and quantum computing, that could result in the cryptography used by the Bitcoin blockchain becoming insecure or ineffective; and
•changes in national and international economic and political conditions, including, without limitation, the adverse impact attributable to the economic and political instability caused by the current conflict between Russia and Ukraine and the economic sanctions adopted in response to the conflict, and the potential broadening of the Israel-Hamas conflict to other countries in the Middle East.
Bitcoin and other digital assets are novel assets, and are subject to significant legal, commercial, regulatory and technical uncertainty
Bitcoin and other digital assets are relatively novel and are subject to significant uncertainty, which could adversely impact their price. The application of state and federal securities laws and other laws and regulations to digital assets is unclear in certain respects, and it is possible that regulators in the United States or foreign countries may interpret or apply existing laws and regulations in a manner that adversely affects the price of bitcoin.
The U.S. federal government, states, regulatory agencies, and foreign countries may also enact new laws and regulations, or pursue regulatory, legislative, enforcement or judicial actions, that could materially impact the price of bitcoin or the ability of individuals or institutions such as us to own or transfer bitcoin. For example:
•On March 9, 2022, President Biden signed an executive order relating to cryptocurrencies. While the executive order did not mandate the adoption of any specific regulations, it instructed various federal agencies to consider potential regulatory measures, including the evaluation of the creation of a U.S. CBDC. A number of reports issued pursuant to the executive order have focused on various risks related to the digital asset ecosystem, and have recommended additional legislation and
regulatory oversight. On September 16, 2022, the White House released a framework for digital asset development, based on reports from various government agencies, including the U.S. Department of Treasury, the Department of Justice, and the Department of Commerce. Among other things, the framework encourages regulators to pursue enforcement actions, issue guidance and rules to address current and emergent risks, support the development and use of innovative technologies by payment providers to increase access to instant payments, consider creating a federal framework to regulate nonbank payment providers, and evaluate whether to call upon Congress to amend the Bank Secrecy Act and laws against unlicensed money transmission to apply explicitly to digital asset service providers. There have also been several bills introduced in Congress that propose to establish additional regulation and oversight of the digital asset markets.
•On April 4, 2022, SEC Chair Gary Gensler announced that he has asked SEC staff to work (i) to register and regulate digital asset platforms like securities exchanges; (ii) with the Commodity Futures Trading Commission on how to jointly address digital asset platforms that trade both securities and non-securities; (iii) on segregating out digital asset platforms’ custody of customer assets, if appropriate; and (iv) on segregating out the market making functions of digital asset platforms, if appropriate. Similarly, foreign government authorities have recently expanded their efforts to restrict certain activities related to bitcoin and other digital assets.
•On September 8, 2022, the White House Office of Science and Technology Policy issued a report in coordination with other federal agencies relating to the climate and energy implications of digital assets, including bitcoin, in the United States. Among its finding are that digital assets are energy intensive and drive significant environmental impacts, and the report recommends further study of the environmental impact of digital assets and the development of environmental performance regulations for digital asset miners, which may include limiting or eliminating digital assets that use high energy intensity consensus mechanisms, including the proof-of-work consensus mechanisms on which the Bitcoin blockchain is based.
•On March 1, 2023, the U.S. Under Secretary for Domestic Finance provided an update on the development of a U.S. CBDC, indicating that the U.S. Department of Treasury would be providing an initial set of findings and recommendations regarding the development and adoption of a U.S. CBDC in the coming months.
•On April 14, 2023, the SEC reopened the comment period for its proposal to amend the definition of “exchange” under Exchange Act Rule 3b-16 to encompass trading and communication protocol systems for digital asset securities and trading systems that use distributed ledger or blockchain technology, including both so-called “centralized” and “decentralized” trading systems. The comment period is now closed. The SEC may determine whether to adopt the revised definition after an evaluation of comments provided during the comment period. If adopted in its proposed form, the new definition would have a sweeping impact on digital asset trading venues and other digital asset industry participants.
•The European Union’s Markets in Crypto Assets Regulation (“MiCA”), a comprehensive digital asset regulatory framework for the issuance and use of digital assets, like bitcoin, became effective in June 2023, with various requirements phasing into effect through 2024. MiCA also requires the European Commission (i) to provide a report on the environmental impact of crypto-assets and (ii) based upon such report, introduce mandatory minimum sustainability standards for consensus mechanisms, including the proof-of-work consensus mechanisms on which the Bitcoin blockchain is based.
•On June 5, 2023, the SEC filed a complaint against Binance Holdings Ltd. and other affiliated entities in federal district court for the District of Columbia, alleging, among other claims related to the operation of the affiliates and their platforms, that: (i) the Binance entities commingled and diverted customer assets; (ii) various affiliates of Binance Holdings Ltd. operated as exchanges, brokers, dealers and clearing agencies without registration under the Exchange Act; (iii) Binance Holdings Ltd. engaged in the unregistered offer and sale of securities; (iv) affiliates of Binance Holdings Ltd. operated in a manner to evade U.S. federal securities laws, and (v) affiliates of Binance Holdings Ltd. misled customers and investors concerning the existence and adequacy of market surveillance and controls to detect and prevent manipulative trading.
•On June 6, 2023, the SEC filed a complaint against Coinbase, Inc. and other affiliated entities in federal district court in the Southern District of New York, alleging, among other claims: (i) that Coinbase, Inc. violated the Exchange Act by failing to register with the SEC as a national securities exchange, broker-dealer, and clearing agency, in connection with activities involving certain identified digital assets that the SEC’s complaint alleges are securities, (ii) that Coinbase, Inc. violated the Securities Act by failing to register with the SEC the offer and sale of securities in connection with its staking program, and (iii) that Coinbase Global Inc. is jointly and severally liable as a control person under the Exchange Act for Coinbase Inc.’s violations of the Exchange Act to the same extent as Coinbase Inc.
•In the United Kingdom, on June 29, 2023, the Financial Services and Markets Act 2023 (“FSMA 2023”) became law. FSMA 2023 (i) clarifies that “cryptoassets” are subject to the regulated activities and financial promotion orders and (ii) establishes that digital assets firms, including exchanges and custodians, operating in or providing services to the United Kingdom carrying out certain activities involving “cryptoassets” are performing a regulated activity that needs to be authorized by the Financial Conduct Authority and may also be subject to oversight from the Bank of England. Several additional pieces of proposed legislation in the United Kingdom, including The Public Offers and Admissions to Trading Regulations 2023, may
subject “cryptoassets” to further regulation. FSMA 2023 gave the UK Treasury powers to create financial market infrastructure sandboxes. The legislative framework for the UK’s Digital Securities Sandbox will take effect in January 2024.
•On November 20, 2023, the SEC filed a complaint against Payward Inc. and Payward Ventures Inc., together known as Kraken, alleging, among other claims, that Kraken’s crypto trading platform was operating as an unregistered securities exchange, broker, dealer, and clearing agency. The SEC’s complaint also alleges that Kraken’s business practices, deficient internal controls, and poor recordkeeping practices present a range of risks for its customers.
•On November 21, 2023, Binance Holdings Ltd. and its then chief executive officer reached a settlement with the U.S. Department of Justice, CFTC, the U.S. Department of Treasury’s Office of Foreign Asset Control, and the Financial Crimes Enforcement Network to resolve a multi-year investigation by the agencies and a civil suit brought by the CFTC, pursuant to which Binance agreed to, among other things, pay $4.3 billion in penalties across the four agencies and to discontinue its operations in the United States. Binance Holdings Ltd. also acknowledged that it willfully operated an unlicensed money transmitting business, pleaded guilty to criminal charges of not having adequate anti-money laundering protocols in place and committed violations of the International Emergency Economic Powers Act, and its then chief executive officer pleaded guilty to failing to maintain an effective anti-money laundering program and resigned as chief executive officer of Binance. This settlement does not include any settlement of the SEC’s complaint against Binance referenced above.
•In China, the People’s Bank of China and the National Development and Reform Commission have outlawed cryptocurrency mining and declared all cryptocurrency transactions illegal within the country.
It is not possible to predict whether, or when, any of these developments will lead to Congress granting additional authorities to the SEC or other regulators, or whether, or when, any other federal, state or foreign legislative bodies will take any similar actions. It is also not possible to predict the nature of any such additional authorities, how additional legislation or regulatory oversight might impact the ability of digital asset markets to function or the willingness of financial and other institutions to continue to provide services to the digital assets industry, nor how any new regulations or changes to existing regulations might impact the value of digital assets generally and bitcoin specifically. The consequences of increased regulation of digital assets and digital asset activities could adversely affect the market price of bitcoin and in turn adversely affect the market price of our class A common stock.
Moreover, the risks of engaging in a bitcoin acquisition strategy are relatively novel and have created, and could continue to create, complications due to the lack of experience that third parties have with companies engaging in such a strategy, such as increased costs of director and officer liability insurance or the potential inability to obtain such coverage on acceptable terms in the future.
The growth of the digital assets industry in general, and the use and acceptance of bitcoin in particular, may also impact the price of bitcoin and is subject to a high degree of uncertainty. The pace of worldwide growth in the adoption and use of bitcoin may depend, for instance, on public familiarity with digital assets, ease of buying, accessing or gaining exposure to bitcoin, institutional demand for bitcoin as an investment asset, the participation of traditional financial institutions in the digital assets industry, consumer demand for bitcoin as a means of payment, and the availability and popularity of alternatives to bitcoin. Even if growth in bitcoin adoption occurs in the near or medium-term, there is no assurance that bitcoin usage will continue to grow over the long-term.
Because bitcoin has no physical existence beyond the record of transactions on the Bitcoin blockchain, a variety of technical factors related to the Bitcoin blockchain could also impact the price of bitcoin. For example, malicious attacks by miners, inadequate mining fees to incentivize validating of bitcoin transactions, hard “forks” of the Bitcoin blockchain into multiple blockchains, and advances in digital computing, algebraic geometry, and quantum computing could undercut the integrity of the Bitcoin blockchain and negatively affect the price of bitcoin. The liquidity of bitcoin may also be reduced and damage to the public perception of bitcoin may occur, if financial institutions were to deny or limit banking services to businesses that hold bitcoin, provide bitcoin-related services or accept bitcoin as payment, which could also decrease the price of bitcoin. Recent actions by U.S. banking regulators have reduced the ability of bitcoin-related services provides to access to banking services, including (i) the issuance of the February 23, 2023 “Interagency Liquidity Risk Statement” by the Federal banking agencies cautioning banks on contagion risks posed by providing services to digital assets customers, (ii) the Federal Reserve Board’s denial of Custodia Bank’s application of a Federal Reserve account, and (iii) the inclusion of crypto-related divestiture conditions in recent merger transaction approvals. Additionally, in August 2023, the Federal Reserve established a Novel Activities Supervision Program to enhance the supervision of novel activities conducted by banking organizations supervised by the Federal Reserve. The program will focus on novel activities related to crypto-assets, distributed ledger technology, and complex, technology-driven partnerships with nonbanks to deliver financial services to customers. Liquidity of bitcoin may also be impacted to the extent that changes in applicable laws and regulatory requirements negatively impact the ability of exchanges and trading venues to provide services for bitcoin and other digital assets.
Our historical financial statements do not reflect the potential variability in earnings that we may experience in the future relating to our bitcoin holdings
Our historical financial statements do not fully reflect the potential variability in earnings that we may experience in the future from holding or selling significant amounts of bitcoin.
The price of bitcoin has historically been subject to dramatic price fluctuations and is highly volatile. As explained more fully in Note 2(g) to the Consolidated Financial Statements included in this Annual Report on Form 10-K for the year ended December 31, 2023, we determine the fair value of our bitcoin based on quoted (unadjusted) prices on the Coinbase exchange (our principal market for bitcoin). We perform an analysis each quarter to identify whether events or changes in circumstances, principally decreases in the quoted (unadjusted) prices on the active exchange, indicate that it is more likely than not that any of our bitcoin assets are impaired. In determining if an impairment has occurred, we consider the lowest price of one bitcoin quoted on the active exchange at any time since acquiring the specific bitcoin held. If the carrying value of a bitcoin exceeds that lowest price at any time during the quarter, an impairment loss is deemed to have occurred with respect to that bitcoin in the amount equal to the difference between its carrying value and such lowest price, and subsequent increases in the price of bitcoin will not affect the carrying value of our bitcoin. Gains (if any) are not recorded until realized upon sale, at which point they would be presented net of any impairment losses. In determining the gain to be recognized upon sale, we calculate the difference between the sale price and carrying value of the specific bitcoin sold immediately prior to sale.
As a result, any decrease in the fair value of bitcoin below our carrying value for such assets at any time since their acquisition requires us to incur an impairment charge, and such charge could be material to our financial results for the applicable reporting period, which may create significant volatility in our reported earnings and decrease the carrying value of our digital assets, which in turn could have a material adverse effect on the market price of our class A common stock. Conversely, any sale of bitcoins at prices above our carrying value for such assets creates a gain for financial reporting purposes even if we would otherwise incur an economic or tax loss with respect to such transaction, which also may result in significant volatility in our reported earnings.
In December 2023, the FASB issued ASU 2023-08, which upon our adoption will require us to measure our bitcoin holdings at fair value in our statement of financial position, and to recognize gains and losses from changes in the fair value of our bitcoin in net income each reporting period. ASU 2023-08 will also require us to provide certain interim and annual disclosures with respect to our bitcoin holdings. The standard is effective for our interim and annual periods beginning January 1, 2025, with a cumulative-effect adjustment to the opening balance of retained earnings as of the beginning of the annual reporting period in which we adopt the guidance. Early adoption is permitted in any interim or annual period for which our financial statements have not been issued as of the beginning of the annual reporting period. Due in particular to the volatility in the price of bitcoin, we expect the adoption of ASU 2023-08 to increase the volatility of our financial results and significantly affect the carrying value of our bitcoin on our balance sheet. Additionally, as a result of ASU 2023-08 requiring a cumulative-effect adjustment to our opening balance of retained earnings as of the beginning of the annual period in which we adopt the guidance and not permitting retrospective restatement of prior period, our future results will not be comparable to results from periods prior to our adoption of the guidance.
At December 31, 2023, we carried $3.626 billion of digital assets on our balance sheet, consisting of approximately 189,150 bitcoins and reflecting $2.269 billion in cumulative impairment losses attributable to bitcoin trading price fluctuations, and held $46.8 million in cash and cash equivalents, compared to a carrying value of $1.840 billion of digital assets, consisting of approximately 132,500 bitcoins, and $43.8 million in cash and cash equivalents at December 31, 2022. Digital asset impairment losses, net of gains on sale, of $1.286 billion incurred during the year ended December 31, 2022 represented 76.9% of our operating expenses for such year, contributing to our net loss of $1.470 billion for the year ended December 31, 2022.
Because we intend to purchase additional bitcoin in future periods and increase our overall holdings of bitcoin, we expect that the proportion of our total assets represented by our bitcoin holdings will increase in the future. As a result, and in particular with respect to the quarterly periods and full fiscal year with respect to which ASU 2023-08 will apply, and for all future periods, volatility in our earnings may be significantly more than what we experienced in prior periods.
The availability of spot bitcoin ETPs may adversely affect the market price of our class A common stock
Although bitcoin and other digital assets have experienced a surge of investor attention since bitcoin was invented in 2008, until recently investors in the United States had limited means to gain direct exposure to bitcoin through traditional investment channels, and instead generally were only able to hold bitcoin through “hosted” wallets provided by digital asset service providers or through “unhosted” wallets that expose the investor to risks associated with loss or hacking of their private keys. Given the relative novelty of digital assets, general lack of familiarity with the processes needed to hold bitcoin directly, as well as the potential reluctance of financial planners and advisers to recommend direct bitcoin holdings to their retail customers because of the manner in which such holdings are custodied, some investors have sought exposure to bitcoin through investment vehicles that hold bitcoin and issue shares representing fractional undivided interests in their underlying bitcoin holdings. These vehicles, which were previously offered only to “accredited investors” on a private placement basis, have in the past traded at substantial premiums to net asset value (“NAV”), possibly due to the relative scarcity of traditional investment vehicles providing investment exposure to bitcoin.
On January 10, 2024, the SEC approved the listing and trading of spot bitcoin ETPs, the shares of which can be sold in public offerings and are traded on U.S. national securities exchanges. The approved ETPs commenced trading directly to the public on January 11, 2024, with a trading volume of $4.6 billion on the first trading day. On January 11, 2024, and in the subsequent days following the SEC’s approval of the listing and trading of spot bitcoin ETPs, the trading price of our shares of class A common stock declined significantly relative to the value of our bitcoin. To the extent investors view our class A common stock as providing exposure to
bitcoin, it is possible that the value of our class A common stock may also have included a premium over the value of our bitcoin due to the prior scarcity of traditional investment vehicles providing investment exposure to bitcoin, and that the value declined due to investors now having a greater range of options to gain exposure to bitcoin and investors choosing to gain such exposure through ETPs rather than our class A common stock.
Although we are an operating company, and we believe we offer a different value proposition than a passive bitcoin investment vehicle such as a spot bitcoin ETP, investors may nevertheless view our class A common stock as an alternative to an investment in an ETP, and choose to purchase shares of a spot bitcoin ETP instead of our class A common stock. They may do so for a variety of reasons, including if they believe that ETPs offer a “pure play” exposure to bitcoin that is generally not subject to federal income tax at the entity level as we are, or the other risk factors applicable to an operating business, such as ours. Additionally, unlike spot bitcoin ETPs, we (i) do not seek for our shares of Class A common stock to track the value of the underlying bitcoin we hold before payment of expenses and liabilities, (ii) do not benefit from various exemptions and relief under the Securities Exchange Act of 1934, as amended, including Regulation M, and other securities laws, which enable spot bitcoin ETPs to continuously align the value of their shares to the price of the underlying bitcoin they hold through share creation and redemption, (iii) are a Delaware corporation rather than a statutory trust, and do not operate pursuant to a trust agreement that would require us to pursue one or more stated investment objectives, and (iv) are not required to provide daily transparency as to our bitcoin holdings or our daily NAV. Furthermore, recommendations by broker-dealers to buy, hold, or sell complex products and non-traditional ETPs, or an investment strategy involving such products, may be subject to additional or heightened scrutiny that would not be applicable to broker-dealers making recommendations with respect to our class A common stock. Based on how we are viewed in the market relative to ETPs, and other vehicles which offer economic exposure to bitcoin, such as bitcoin futures ETFs and leveraged bitcoin futures ETFs, any premium or discount in our class A common stock relative to the value of our bitcoin holdings may increase or decrease in different market conditions.
As a result of the foregoing factors, availability of spot bitcoin ETPs on U.S. national securities exchanges could have a material adverse effect on the market price of our class A common stock.
Our bitcoin acquisition strategy subjects us to enhanced regulatory oversight
As noted above, several spot bitcoin ETPs have received approval from the SEC to list their shares on a U.S. national securities exchange with continuous share creation and redemption at NAV. Even though we are not, and do not function in the manner of, a spot bitcoin ETP, it is possible that we nevertheless could face regulatory scrutiny from the SEC or other federal or state agencies due to our bitcoin holdings.
In addition, there has been increasing focus on the extent to which digital assets can be used to launder the proceeds of illegal activities, fund criminal or terrorist activities, or circumvent sanctions regimes, including those sanctions imposed in response to the ongoing conflict between Russia and Ukraine. While we have implemented and maintain policies and procedures reasonably designed to promote compliance with applicable anti-money laundering and sanctions laws and regulations and take care to only acquire our bitcoin through entities subject to anti-money laundering regulation and related compliance rules in the United States, if we are found to have purchased any of our bitcoin from bad actors that have used bitcoin to launder money or persons subject to sanctions, we may be subject to regulatory proceedings and any further transactions or dealings in bitcoin by us may be restricted or prohibited.
As of February 14, 2024, approximately 16,931 bitcoins serve as part of the collateral securing our 2028 Secured Notes and we may consider issuing additional debt or other financial instruments that may be collateralized by our bitcoin holdings. We may also consider pursuing strategies to create income streams or otherwise generate funds using our bitcoin holdings. These types of bitcoin-related transactions are the subject of enhanced regulatory oversight. These and any other bitcoin-related transactions we may enter into, beyond simply acquiring and holding bitcoin, may subject us to additional regulatory compliance requirements and scrutiny, including under federal and state money services regulations, money transmitter licensing requirements and various commodity and securities laws and regulations.
Additional laws, guidance and policies may be issued by domestic and foreign regulators following the filing for Chapter 11 bankruptcy protection by FTX, one of the world’s largest cryptocurrency exchanges, in November 2022. While the financial and regulatory fallout from FTX’s collapse did not directly impact our business, financial condition or corporate assets, the FTX collapse may have increased regulatory focus on the digital assets industry. For example, the SEC has recently proposed a number of rules with implications for digital assets. Notably, on April 14, 2023, the SEC reopened the comment period for its proposal to significantly expand the definition of “exchange” under Exchange Act Rule 3b-16 to encompass trading and communication protocol systems for digital asset securities and trading systems that use distributed ledger or blockchain technology, including both so-called “centralized” and “decentralized” trading systems. If adopted in its proposed form, the proposed rule would have a sweeping impact on digital asset trading venues and other digital asset industry participants. U.S. and foreign regulators have also increased, and are highly likely to continue to increase, enforcement activity, and are likely to adopt new regulatory requirements in response to FTX’s collapse. Increased enforcement activity and changes in the regulatory environment, including changing interpretations and the implementation of new or varying regulatory requirements by the government or any new legislation affecting bitcoin, as well as enforcement actions involving or impacting our trading venues, counterparties and custodians, may impose significant costs or significantly limit our ability to hold and transact in bitcoin.
In addition, private actors that are wary of bitcoin or the regulatory concerns associated with bitcoin have in the past taken and may in the future take further actions that may have an adverse effect on our business or the market price of our class A common stock. For example, an affiliate of HSBC Holdings has prohibited customers of its HSBC InvestDirect retail investment platform from buying shares of our class A common stock after determining that the value of our stock is related to the performance of bitcoin, indicating that it did not want to facilitate exposure to virtual currencies.
Due to the unregulated nature and lack of transparency surrounding the operations of many bitcoin trading venues, bitcoin trading venues may experience greater fraud, security failures or regulatory or operational problems than trading venues for more established asset classes, which may result in a loss of confidence in bitcoin trading venues and adversely affect the value of our bitcoin
Bitcoin trading venues are relatively new and, in many cases, unregulated. Furthermore, there are many bitcoin trading venues which do not provide the public with significant information regarding their ownership structure, management teams, corporate practices and regulatory compliance. As a result, the marketplace may lose confidence in bitcoin trading venues, including prominent exchanges that handle a significant volume of bitcoin trading and/or are subject to regulatory oversight, in the event one or more bitcoin trading venues cease or pause for a prolonged period the trading of bitcoin or other digital assets, or experience fraud, significant volumes of withdrawal, security failures or operational problems.
In 2019 there were reports claiming that 80-95% of bitcoin trading volume on trading venues was false or non-economic in nature, with specific focus on unregulated exchanges located outside of the United States. The SEC also alleged as part of its June 5, 2023, complaint that Binance Holdings Ltd. committed strategic and targeted “wash trading” through its affiliates to artificially inflate the volume of certain digital assets traded on its exchange. Such reports and allegations may indicate that the bitcoin market is significantly smaller than expected and that the United States makes up a significantly larger percentage of the bitcoin market than is commonly understood. Any actual or perceived false trading in the bitcoin market, and any other fraudulent or manipulative acts and practices, could adversely affect the value of our bitcoin. Negative perception, a lack of stability in the broader bitcoin markets and the closure, temporary shutdown or operational disruption of bitcoin trading venues, lending institutions, institutional investors, institutional miners, custodians, or other major participants in the bitcoin ecosystem, due to fraud, business failure, cybersecurity events, government-mandated regulation, bankruptcy, or for any other reason, may result in a decline in confidence in bitcoin and the broader bitcoin ecosystem and greater volatility in the price of bitcoin. For example, in 2022, each of Celsius Network, Voyager Digital, Three Arrows Capital, FTX, and BlockFi filed for bankruptcy, following which the market prices of bitcoin and other digital assets significantly declined. In addition, in June 2023, the SEC announced enforcement actions against Coinbase, Inc., and Binance Holdings Ltd., two providers of large trading venues for digital assets, which similarly was followed by a decrease in the market price of bitcoin and other digital assets. These were followed in November 2023, by an SEC enforcement action against Payward Inc. and Payward Ventures Inc., together known as Kraken, another large trading venue for digital assets. As the price of our class A common stock is affected by the value of our bitcoin holdings, the failure of a major participant in the bitcoin ecosystem could have a material adverse effect on the market price of our class A common stock.
The concentration of our bitcoin holdings enhances the risks inherent in our bitcoin acquisition strategy
As of February 14, 2024, we held approximately 190,000 bitcoins that were acquired at an aggregate purchase price of $5.933 billion and we intend to purchase additional bitcoin and increase our overall holdings of bitcoin in the future.The concentration of our bitcoin holdings limits the risk mitigation that we could take advantage of by purchasing a more diversified portfolio of treasury assets, and the absence of diversification enhances the risks inherent in our bitcoin acquisition strategy. The price of bitcoin experienced a significant decline in 2022, and this had, and any future significant declines in the price of bitcoin would have, a more pronounced impact on our financial condition than if we used our cash to purchase a more diverse portfolio of assets.
The emergence or growth of other digital assets, including those with significant private or public sector backing, could have a negative impact on the price of bitcoin and adversely affect our business
As a result of our bitcoin acquisition strategy, the majority of our assets are concentrated in our bitcoin holdings. Accordingly, the emergence or growth of digital assets other than bitcoin may have a material adverse effect on our financial condition. As of December 31, 2023, bitcoin was the largest digital asset by market capitalization. However, there are numerous alternative digital assets and many entities, including consortiums and financial institutions, are researching and investing resources into private or permissioned blockchain platforms or digital assets that do not use proof-of-work mining like the Bitcoin network. For example, in late 2022, the Ethereum network transitioned to a “proof-of-stake” mechanism for validating transactions that requires significantly less computing power than proof-of-work mining. The Ethereum network has completed another major upgrade since then and may undertake additional upgrades in the future. If the mechanisms for validating transactions in Ethereum and other alternative digital assets are perceived as superior to proof-of-work mining, those digital assets could gain market share relative to bitcoin.
Other alternative digital assets that compete with bitcoin in certain ways include “stablecoins,” which are designed to maintain a constant price because of, for instance, their issuers’ promise to hold high-quality liquid assets (such as U.S. dollar deposits and short-term U.S.
treasury securities) equal to the total value of stablecoins in circulation. Stablecoins have grown rapidly as an alternative to bitcoin and other digital assets as a medium of exchange and store of value, particularly on digital asset trading platforms. As of December 31, 2023, two of the seven largest digital assets by market capitalization are U.S. dollar-backed stablecoins.
Additionally, central banks in some countries have started to introduce digital forms of legal tender. For example, China’s CBDC project was made available to consumers in January 2022, and governments including the United States, the European Union, and Israel have been discussing the potential creation of new CBDCs. Whether or not they incorporate blockchain or similar technology, CBDCs, as legal tender in the issuing jurisdiction, could also compete with, or replace, bitcoin and other digital assets as a medium of exchange or store of value. As a result, the emergence or growth of these or other digital assets could cause the market price of bitcoin to decrease, which could have a material adverse effect on our business, prospects, financial condition, and operating results.
Our bitcoin holdings are less liquid than our existing cash and cash equivalents and may not be able to serve as a source of liquidity for us to the same extent as cash and cash equivalents
In September 2020, we adopted bitcoin as our primary treasury reserve asset. Historically, the bitcoin markets have been characterized by significant volatility in price, limited liquidity and trading volumes compared to sovereign currencies markets, relative anonymity, a developing regulatory landscape, potential susceptibility to market abuse and manipulation, compliance and internal control failures at exchanges, and various other risks inherent in its entirely electronic, virtual form and decentralized network. During times of market instability, we may not be able to sell our bitcoin at favorable prices or at all. For example, a number of bitcoin trading venues temporarily halted deposits and withdrawals in 2022, although the Coinbase exchange (our principal market for analytics products failsbitcoin) has, to growdate, not done so. As a result, our bitcoin holdings may not be able to serve as a source of liquidity for us to the same extent as cash and cash equivalents. Further, bitcoin we expecthold with our custodians and transact with our trade execution partners does not enjoy the same protections as are available to cash or securities deposited with or transacted by institutions subject to regulation by the Federal Deposit Insurance Corporation or the Securities Investor Protection Corporation. Additionally, we may be unable to enter into term loans or other capital raising transactions collateralized by our unencumbered bitcoin or otherwise generate funds using our bitcoin holdings, including in particular during times of market instability or when the price of bitcoin has declined significantly. If we are unable to sell our bitcoin, enter into additional capital raising transactions using bitcoin as collateral, or otherwise generate funds using our bitcoin holdings, or if businesses failwe are forced to adoptsell our offerings,bitcoin at a significant loss, in order to meet our working capital requirements, our business operating results, and financial condition could be materially adversely affectednegatively impacted.
NearlyIf we or our third-party service providers experience a security breach or cyberattack and unauthorized parties obtain access to our bitcoin, or if our private keys are lost or destroyed, or other similar circumstances or events occur, we may lose some or all of our revenuesbitcoin and our financial condition and results of operations could be materially adversely affected
Substantially all of the bitcoin we own is held in custody accounts at institutional-grade digital asset custodians. Security breaches and cyberattacks are of particular concern with respect to our bitcoin. Bitcoin and other blockchain-based cryptocurrencies and the entities that provide services to participants in the bitcoin ecosystem have been, and may in the future be, subject to security breaches, cyberattacks, or other malicious activities. For example, in October 2021 it was reported that hackers exploited a flaw in the account recovery process and stole from the accounts of at least 6,000 customers of the Coinbase exchange (our principal market for bitcoin), although the flaw was subsequently fixed and Coinbase reimbursed affected customers. Similarly, in November 2022, hackers exploited weaknesses in the security architecture of the FTX Trading digital asset exchange and reportedly stole over $400 million in digital assets from customers. A successful security breach or cyberattack could result in:
•a partial or total loss of our bitcoin in a manner that may not be covered by insurance or the liability provisions of the custody agreements with the custodians who hold our bitcoin;
•harm to our reputation and brand;
•improper disclosure of data and violations of applicable data privacy and other laws; or
•significant regulatory scrutiny, investigations, fines, penalties, and other legal, regulatory, contractual and financial exposure.
Further, any actual or perceived data security breach or cybersecurity attack directed at other companies with digital assets or companies that operate digital asset networks, regardless of whether we are directly impacted, could lead to a general loss of confidence in the broader Bitcoin blockchain ecosystem or in the use of the Bitcoin network to conduct financial transactions, which could negatively impact us.
Attacks upon systems across a variety of industries, including industries related to bitcoin, are increasing in frequency, persistence, and sophistication, and, in many cases, are being conducted by sophisticated, well-funded and organized groups and individuals, including state actors. The techniques used to obtain unauthorized, improper or illegal access to systems and information (including personal data and digital assets), disable or degrade services, or sabotage systems are constantly evolving, may be difficult to detect quickly, and often are not recognized or detected until after they have been launched against a target. These attacks may occur on our systems or those of our third-party service providers or partners. We may experience breaches of our security measures due to human error, malfeasance,
insider threats, system errors or vulnerabilities or other irregularities. In particular, unauthorized parties have attempted, and we expect that they will continue to attempt, to gain access to our systems and facilities, as well as those of our partners and third-party service providers, through various means, such as hacking, social engineering, phishing and fraud. In the past, hackers have successfully employed a social engineering attack against one of our service providers and misappropriated our digital assets, although, to date, such events have not been material to our financial condition or operating results. Threats can come from a variety of sources, including criminal hackers, hacktivists, state-sponsored intrusions, industrial espionage, and insiders. In addition, certain types of attacks could harm us even if our systems are left undisturbed. For example, certain threats are designed to remain dormant or undetectable, sometimes for extended periods of time, or until launched against a target and we may not be able to implement adequate preventative measures. Further, there has been an increase in such activities due to the increase in work-from-home arrangements since the onset of the COVID-19 pandemic. The risk of cyberattacks could also be increased by cyberwarfare in connection with the ongoing Russia-Ukraine and Israel-Hamas conflicts, or other future conflicts, including potential proliferation of malware into systems unrelated to such conflicts. Any future breach of our operations or those of others in the bitcoin industry, including third-party services on which we rely, could materially and adversely affect our business.
We face risks relating to the custody of our bitcoin, including the loss or destruction of private keys required to access our bitcoin and cyberattacks or other data loss relating to our bitcoin
We hold our bitcoin with regulated custodians that have duties to safeguard our private keys. Our custodial services contracts do not restrict our ability to reallocate our bitcoin among our custodians, and our bitcoin holdings may be concentrated with a single custodian from time to time. In light of the significant amount of bitcoin we hold, we continually seek to engage additional custodians to achieve a greater degree of diversification in the custody of our bitcoin as the extent of potential risk of loss is dependent, in part, on the degree of diversification. If there is a decrease in the availability of digital asset custodians that we believe can safely custody our bitcoin, for example, due to regulatory developments or enforcement actions that cause custodians to discontinue or limit their services in the United States, we may need to enter into agreements that are less favorable than our current agreements or take other measures to custody our bitcoin, and our ability to seek a greater degree of diversification in the use of custodial services would be materially adversely affected.
As of December 31, 2023, the insurance that covers losses of our bitcoin holdings covers only a small fraction of the value of the entirety of our bitcoin holdings, and there can be no guarantee that such insurance will be maintained as part of the custodial services we have or that such coverage will cover losses with respect to our bitcoin. Moreover, our use of custodians exposes us to the risk that the bitcoin our custodians hold on our behalf could be subject to insolvency proceedings and we could be treated as a general unsecured creditor of the custodian, inhibiting our ability to exercise ownership rights with respect to such bitcoin. Any loss associated with such insolvency proceedings is unlikely to be covered by any insurance coverage we maintain related to our bitcoin.
Bitcoin is controllable only by the possessor of both the unique public key and private key(s) relating to the local or online digital wallet in which the bitcoin is held. While the Bitcoin blockchain ledger requires a public key relating to a digital wallet to be published when used in a transaction, private keys must be safeguarded and kept private in order to prevent a third party from accessing the bitcoin held in such wallet. To the extent the private key(s) for a digital wallet are lost, destroyed, or otherwise compromised and no backup of the private key(s) is accessible, neither we nor our custodians will be able to access the bitcoin held in the related digital wallet. Furthermore, we cannot provide assurance that our digital wallets, nor the digital wallets of our custodians held on our behalf, will not be compromised as a result of a cyberattack. The bitcoin and blockchain ledger, as well as other digital assets and blockchain technologies, have been, and may in the future be, subject to security breaches, cyberattacks, or other malicious activities.
Regulatory change reclassifying bitcoin as a security could lead to our classification as an “investment company” under the Investment Company Act of 1940 and could adversely affect the market price of bitcoin and the market price of our class A common stock
While senior SEC officials have stated their view that bitcoin is not a “security” for purposes of the federal securities laws a contrary determination by the SEC could lead to our classification as an “investment company” under the Investment Company Act of 1940, which would subject us to significant additional regulatory controls that could have a material adverse effect on our business and operations and may also require us to substantially change the manner in which we conduct our business.
In addition, if bitcoin is determined to constitute a security for purposes of the federal securities laws, the additional regulatory restrictions imposed by such a determination could adversely affect the market price of bitcoin and in turn adversely affect the market price of our class A common stock.
A significant decrease in the market value of our bitcoin holdings could adversely affect our ability to service our indebtedness
As a result of our bitcoin acquisition strategy and our Treasury Reserve Policy, the majority of our assets are concentrated in our bitcoin holdings. The concentration of our assets in bitcoin limits our ability to mitigate risk that could otherwise be achieved by purchasing a more diversified portfolio of treasury assets. Accordingly, a significant decline in the market value of bitcoin could have a material adverse effect on our financial condition. Any material adverse effect on our financial condition caused by a significant decline in the market value of our bitcoin holdings may create liquidity and credit risks for our business operations, as we would have limited means
to obtain cash beyond the revenues generated by our enterprise analytics software business. To the extent that the cash generated by our enterprise analytics software business is insufficient to satisfy our debt service obligations, and to the extent that the liquidation of our bitcoin holdings would be insufficient to satisfy our debt service obligations, we may be unable to make scheduled payments on our current or future indebtedness, which could cause us to default on our debt obligations. Any default on our current or future indebtedness may have a material adverse effect on our financial condition. See “Risks Related to Our Outstanding and Potential Future Indebtedness” for additional details about the risks which may impact us if we are unable to service our indebtedness.
Our bitcoin acquisition strategy exposes us to risk of non-performance by counterparties
Our bitcoin acquisition strategy exposes us to the risk of non-performance by counterparties, whether contractual or otherwise. Risk of non-performance includes inability or refusal of a counterparty to perform because of a deterioration in the counterparty’s financial condition and liquidity or for any other reason. For example, our execution partners, custodians, or other counterparties might fail to perform in accordance with the terms of our agreements with them, which could result in a loss of bitcoin, a loss of the opportunity to generate funds, or other losses.
Our primary counterparty risk with respect to our bitcoin is custodian performance obligations under the various custody arrangements we have entered into. A series of recent high-profile bankruptcies, closures, liquidations, regulatory enforcement actions and other events relating to companies operating in the digital asset industry, including the filings for bankruptcy protection by Three Arrows Capital, Celsius Network, Voyager Digital, FTX Trading and Genesis Global Capital, the closure or liquidation of certain financial institutions that provided lending and other services to the digital assets industry, including Signature Bank and Silvergate Bank, SEC enforcement actions against Coinbase, Inc., Binance Holdings Ltd., and Kraken, the placement of Prime Trust, LLC into receivership following a cease-and-desist order issued by Nevada’s Department of Business and Industry, and the filing and subsequent settlement of a civil fraud lawsuit by the New York Attorney General against Genesis Global Capital, its parent company Digital Currency Group, Inc., and former partner Gemini Trust Company have highlighted the perceived and actual counterparty risk applicable to digital asset ownership and trading. Although these bankruptcies, closures and liquidations have not resulted in any loss or misappropriation of our bitcoin, nor have such events adversely impacted our access to our bitcoin, legal precedent created in these bankruptcy and other proceedings may increase the risk of future rulings adverse to our interests in the event one or more of our custodians becomes a debtor in a bankruptcy case or is the subject of other liquidation, insolvency or similar proceedings.
While all of our custodians are subject to regulatory regimes intended to protect customers in the event of a custodial bankruptcy, receivership or similar insolvency proceeding, no assurance can be provided that our custodially-held bitcoin will not become part of the custodian’s insolvency estate if one or more of our custodians enters bankruptcy, receivership or similar insolvency proceedings. Additionally, if we pursue any strategies to create income streams or otherwise generate funds using our bitcoin holdings, we would become subject to additional counterparty risks. Any significant non-performance by counterparties, including in particular the custodians with which we custody substantially all of our bitcoin, could have a material adverse effect on our business, prospects, financial condition, and operating results.
Risks Related to Our Enterprise Analytics Software Business Strategy
We depend on revenue from a single software platform and related services as well as revenue from our installed customer base
Our revenue is derived from sales of our analytics productssoftware platform and related technical support, consulting, and education services. We expect these sales to account for a large portion of our revenues for the foreseeable future. Although demand for analytics productssoftware has grown in recent years,continued to grow, the market for analytics offerings continues to evolve. Resistance from consumer and privacy groups to increased commercial collection, use, and sharing of personal data has grown in recent years and our customers, potential customers, or the general public may perceive that use of data on spending patterns and other personal behavior,our analytics software could violate individual privacy rights. In addition, increasing government restrictions on the collection, use, and transfer of personal data and other developments maycould impair the further growth of this market. We cannot be sure that this market will continue to grow or, even if it does grow, that businesses will adopt our solutions.
We have spent, and intend to keep spending, considerable resources to educate potential customers about analytics offerings in general and our offerings in particular. However, we cannot be sure that these expenditures will help any of our offerings achieve any additional market acceptance. If the market fails to grow or grows more slowly than we currently expect or businesses fail to adopt our offerings, our business, operating results, and financial condition could be materially adversely affected.
Our products face intense competition, which may lead to lower prices for our products and services, reduced gross margins, loss of market share, and reduced revenue
The analytics market is highly competitive and subject to rapidly changing technology paradigms. Within the analytics space, we compete with many different types of vendors, including (i) large software vendors, such as IBM (Cognos), SAP (BO), Microsoft (Power BI), and Oracle (OBIEE), that provide one or more products that directly compete with our products, (ii) open source analytics vendors, such as OpenText Analytics and Hitachi (Pentaho), (iii) various other analytics software, providers, such as Qlik, Tableau Software, TIBCO, Information Builders, and the SAS Institute, (iv) other vendors offering cloud-based offerings, such as GoodData and Birst, an Infor Company, and (v) companies with EIoT technologies or technologies categorized as user authentication products that are primarily focused on traditional forms of identity verification such as smart cards, tokens, and password managers. Our future success depends on the effectiveness with whichespecially in foreign markets. Because we can differentiate and compete with these vendors and other potential competitors across analytics implementation projects of varying sizes. Failure to maintain adequate technology differentiation from these competitors could materially adversely affect our revenue from both existing and prospective customers.
Some of our competitors have longer operating histories and significantly greater financial, technical, and marketing resources than we do. As a result, they may be able to respond more quickly to new or emerging technologies and changes in customer requirements or devote greater resources to the development, promotion, sale, and marketing of their offerings than we can, such as offering certain analytics products free of charge when bundled with other software offerings. In addition, many of our competitors have strong relationships with current and potential customers, extensive industry and specialized business knowledge, as well as corresponding proprietary technologies that they can leverage, such as multidimensional databases and ERP repositories. As a result, they may be able to prevent us from penetrating new accounts or expanding within existing accounts.
Increased competition may lead to price cuts, reduced gross margins, and loss of market share. We may not be able to compete successfully against current and future competitors, and the failure to meet the competitive pressures we face may have a material adverse effect on our business, operating results, and financial condition.
Current and future competitors may also make strategic acquisitions or establish cooperative relationships among themselves or with others. By doing so, these competitors may increase their ability to meet the needs of our potential customers by their expanded offerings. Our current or prospective channel partners may establish cooperative relationships with our current or future competitors. These relationships may limit our ability to sell our analytics offerings through specific distribution channels. Accordingly, new competitors or alliances among current and future competitors may emerge and rapidly gain significant market share. These developments could limit our ability to obtain revenues from new customers and to sustain software maintenance revenues from our installed customer base. In addition, basic office productivity software suites, such as Microsoft Office, could evolve to offer advanced analysis and reporting capabilities that may reduce the demand for our analytics offerings.
We depend on revenue from a single suite of products and related services as well as revenue from our installed customer base
Our MicroStrategy 10software platform and related services, account for a substantial portion of our revenue. Because of this revenue concentration, our business could be harmed by a decline in demand for, or in the adoption or prices of, these productsour platform and related services as a result of, among other factors, any change in our pricing or packaging model, increased competition, maturation in the markets for these products,our platform, or other risks described in this Annual Report.
In addition, the adoption of our bitcoin acquisition strategy and the increase in our indebtedness has caused and may in the future cause certain of our existing or prospective customers to form negative perceptions regarding our corporate risk profile or our financial viability as a commercial counterparty, and such negative perceptions could negatively impact sales of our analytics software platform and related services to current or prospective customers. Such risks can also be exacerbated if the price of bitcoin declines or due to adverse developments in the digital assets industry including, for example, the high-profile filings for bankruptcy protection by companies operating in that industry, such as the recent bankruptcy filings by Three Arrows Capital, Voyager Digital, BlockFi and FTX Trading, and the SEC enforcement actions against Coinbase, Inc., Binance Holdings Ltd., and Kraken. We also depend on our installed customer base for a substantial portion of our revenue. We have contracts with our license customers for ongoing support and maintenance, as well as contracts for cloud-based subscription services that provide recurring revenues to us. In addition, our installed customer base has historically generated additional new license and services revenues for us. If our existing customers cancel or fail to renew their service contracts or fail to purchasemake additional products or services,purchases from us for any reason, including due to the risks inherent in our bitcoin acquisition strategy, our revenue could decrease and our operating results could be materially adversely affected.
If we are unable to develop and release product enhancements and new offerings to respond to rapid technological change in a timely and cost-effective manner,29
As our business, operating results, and financial condition could be materially adversely affected
The market for our offerings is characterized by rapid technological change, frequent new product introductions and enhancements, changing customer demands, and evolving industry standards. The introduction of offerings embodying new technologies can quickly make existing offerings obsolete and unmarketable. We believe that our future success depends largely on our ability to:
continue to support a number of popular operating systems and databases;
maintain and improve our current offerings;
rapidly develop new offerings and product enhancements that achieve market acceptance;
maintain technological competitiveness; and
meet an expanding range of customer requirements.
Analytics applications are inherently complex, and it can take a long time and require significant research and development expenditures to develop and test new offerings and product enhancements. In addition, customers may delay their purchasing decisions because they anticipate that new or enhanced versions of our offerings will soon become available. We cannot be sure that we will succeed in developing, marketing, and delivering, on a timely and cost-effective basis, new or enhanced offerings that respond to technological change or new customer requirements, nor can we be sure that any new or enhanced offerings will achieve market acceptance. Moreover, even if we introduce a new offering, we may experience a decline in revenues of our existing offerings that is not fully matched by the new offering’s revenue. For example, customers may delay making purchases of a new offering to permit them to make a more thorough evaluation of the offering, or until industry and marketplace reviews become widely available. Some customers may hesitate migrating to a new offering due to concerns regarding the complexity of migration and product infancy issues on performance. In addition, we may lose existing customers who choose a competitor’s offering rather than migrate to our new offering. This could result in a temporary or permanent revenue shortfall and materially adversely affect our business.
A substantial customerincreasingly shift in the deployment of MicroStrategy Analytics from a perpetual softwareproduct license model to oura cloud servicessubscription model, we could face higher future rates of attrition, and such a shift could continue to affect the timing of revenue recognition or reduce product licenses and product support revenues, which could materially adversely affect our operating results
We offer our analytics platform in the form of a perpetual softwareproduct license or a cloud subscription. Given that it is relatively easy for customers to migrate on and a cloud-based subscription. Theoff our cloud subscription platform, as we continue to shift our customers toward our cloud platform, we could face higher future rates of attrition among our customers. In addition, the payment streams and revenue recognition timing for our perpetual softwareproduct licenses are different from those for our cloud-basedcloud subscriptions. For perpetual softwareproduct licenses, customers typically pay us a lump sum soon after entering into a software license agreement, and we typically recognize product licenses revenue is typically recognized upon deliverywhen control of the softwarelicense is transferred to the customer. For cloud-basedcloud subscriptions, customers typically make periodic payments over the subscription period and revenue is typically recognizedwe recognize subscription services revenues ratably over the subscription period. As a result, if a substantial number of currentas our customers increasingly shift to, or new customers shift to subscribing to ourpurchase, cloud services offeringssubscriptions instead of purchasing perpetual softwareproduct licenses, for MicroStrategy Analytics, the resulting change in payment terms and revenue recognition may result in our recognizing less revenue in the reporting period in which the sale transactions are consummated than has been the case in prior periods, with more revenue being recognized in future periods. This change in the timing of revenue recognition could materially adversely affect our operating results and cash flows for the reporting periods during which such a shift occurs.
Our investmentor change in new business strategiespurchasing occurs. Accordingly, in any particular reporting period, cloud subscription sales could negatively impact product license sales to our existing and initiativesprospective customers, which could disruptreduce product licenses and product support revenues. Additionally, our ability to accelerate our cloud strategy could be negatively impacted by any inability to provide necessary sales and sales engineering support, including the operationssupport of channel partners, our internal sales team, and digital marketing. Finally, if we are not able to successfully grow sales of our ongoing business and present risks that we have not adequately anticipated
We have invested, and in the future may invest, in new business strategies and initiatives. For example, in recent years we have introduced a number of innovative technologies designed to enable companies to capitalize on Big Data, mobile applications, cloud-based services, security, and Internet of Things trends in the marketplace. These endeavors may involve significant risks and uncertainties, including distraction of management from other business operations, the dedication of significant research and development, sales and marketing, and other resources to these new initiatives at the expense of our other business operations, generation of insufficient revenue to offset expenses associated with new initiatives, incompatibility of our new technologies with third-party platforms, inadequate return of capital, and other risks thatcloud subscription platform, we may not have adequately anticipated. Because new strategies and initiatives are inherently risky, these strategies and initiatives may not be successful and could materially adversely affect our financial condition andable to achieve the scale necessary to achieve increased operating results.margins.
Business disruptions, including interruptions, delays, or failures of our systems, third-party data center hosting facilities or other third-party services, could materially adversely affect our operating results or result in a material weakness in our internal controls that could adversely affect the market price of our stock
A significant portion of our research and development activities or certain other critical business operations are concentrated in facilities in Northern Virginia, China, and Poland. In addition, we serve our customers, and manage certain critical internal processes, using third-party data center hosting facilities located in the United States and England and other third-party services, including AWS and other cloud services. We could experience a disruption or failure of our systems, or the third-party hosting facilities or other services that we use. Such disruptions or failures could include a natural disaster, fire, cyber-attack, act of terrorism, geopolitical conflict, or other catastrophic event, as well as power outages or telecommunications infrastructure outages, or a decision by one of our third-party service providers to close facilities that we use without adequate notice or to materially change the
pricing or terms of their services, or other unanticipated problems with the third-party services that we use, including a failure to meet service standards.
We are a highly automated business and any such disruptions or failures could (i) result in the destruction or disruption of any of our critical business operations, controls or procedures, or information technology systems, (ii) severely affect our ability to conduct normal business operations, including delaying completion of sales and provision of services, (iii) result in a material weakness in our internal control over financial reporting, (iv) cause our customers to terminate their subscriptions, (v) result in our issuing credits to customers or paying penalties or fines, (vi) harm our reputation, (vii) adversely affect our attrition rates or our ability to attract new customers, or (viii) cause our offerings to be perceived as not being secure, any of which could materially adversely affect our future operating results.
We use channel partners and if we are unable to maintain successful relationships with them, our business, operating results, and financial condition could be materially adversely affected
In addition to our direct sales force, we use channel partners, such as resellers, value-added resellers, system integrators, consulting firms, resellers, solution providers, managed service providers, OEMs, and technology partnerscompanies, to license and support our products.offerings. For the year ended December 31, 2017,2023, transactions by channel partners for which we recognized revenuesrevenue accounted for 21.7%27.2% of our total product licenses revenues. Our channel partners may offer customers the productsrevenues, and services of several different companies, including offerings that compete with ours. Because our channel partners generally do not have exclusive relationships with us, we cannot be certain that they will prioritize or devote adequate resources to selling our products. Moreover, divergence in strategy or contract defaults by any of these channel partners may materially adversely affect our ability to develop, market, sell, or support our offerings.
Although we believe that direct sales will continue to account for a majority of our product licenses revenues, we seek to maintain a significant level of sales activities through our channel partners. There can be no assurance that our channel partners will continue to cooperate with us. In addition, actions taken or not taken by such parties may materially adversely affect us. Our ability to achieve revenue growth in the future will depend in part on our ability to maintain successful relationships withthese relationships. Our channel partners may offer customers the products and services of several different companies, including competing offerings, and we cannot be certain that they will prioritize or devote adequate resources to selling our channel partners.offerings. If we are unable to maintain our relationships with theseour channel partners, or if we experience a reduction in sales by our channel partners, our business, operating results, and financial condition could be materially adversely affected.
In addition, we rely on our channel partners to operate in accordance with applicable laws and regulatory requirements. If they fail to do so, we may need to incur significant costs in responding to investigations or enforcement actions or paying penalties assessed by the applicable authorities. We also rely on our channel partners to operate in accordance with the terms of their contractual agreements with us. For example, some of our agreements with our channel partners prescribe the terms and conditions pursuant to which they are authorized to resell or distribute our software and offer technical support and related services. If our channel partners do not comply with their contractual obligations to us, our business, operating results, and financial condition may be materially adversely affected.
Our recognition of deferred revenue and advance payments is subject to future performance obligations and may not be representative of revenues for succeeding periods
Our gross current and non-current deferred revenue and advance payments totaled $218.7$236.7 million as of December 31, 2017. We offset our accounts receivable and deferred revenue for any unpaid items, which totaled $95.9 million, resulting in net current and non-current deferred revenue and advance payments of $122.8 million as of December 31, 2017.2023. The timing and ultimate recognition of our deferred revenue and advance payments depend on various factors, including our performance of various service obligations.
Because of the possibility of customer changes or delays in customer development or implementation schedules or budgets, and the need for us to satisfactorily perform product support and other services, deferred revenue and advance payments at any particular date may not be representative of actual revenue for any succeeding period.
In addition, we had $103.0 million of other remaining performance obligations as of December 31, 2023, consisting of the portions of multi-year contracts that will be invoiced in the future that are not reflected on our balance sheet. As with deferred revenue and advance payments, these other remaining performance obligations at any particular date may not be representative of actual revenue for any succeeding period.
We may lose sales, or sales may be delayed, due to the long sales and implementation cycles of certain of our offerings, which could materially adversely affect our revenues and operating results
The decision to purchase our offerings typically requires our customers to invest substantial time, money, personnel, and other resources, which can result in long sales cycles that can exceed nine months. These long sales cycles increase the risk that intervening events, such as the introduction of new offerings and changes in customer budgets and purchasing priorities, will affect the size, timing, and completion of an order. Even if an order is completed, the time and resources required to implement and integrate our offerings vary
widely depending on customer needs and the complexity of deployment. If we lose sales or sales are delayed due to these long sales and implementation cycles, our revenues and operating results for that period may be materially adversely affected.
Our results in any particular period may depend on the number and volume of large transactions in that period and these transactions may involve lengthier, more complex, and more unpredictable sales cycles than other transactions
Larger, enterprise-level transactions often require considerably more resources, are often more complex to implement, and typically require additional management approval, which may result in a lengthier, more complex, and less predictable sales cycle and may increase the risk that an order is delayed or not brought to completion. We may also encounter greater competition and pricing pressure on these larger transactions, and our sales and delivery efforts may be more costly. The presence or absence of one or more large transactions in a particular period may have a material effect on our revenues and operating results for that period and may result in lower estimated revenues and earnings in future periods. For the year ended December 31, 2023, our top three product licenses transactions with recognized revenue totaled $8.9 million, or 11.8% of total product licenses revenues, compared to $13.1 million, or 15.1% of total product licenses revenues, for the year ended December 31, 2022.
Our offerings face intense competition, which may lead to lower prices for our offerings, reduced gross margins, loss of market share, and reduced revenue
The analytics market is highly competitive and subject to rapidly changing technology and market conditions. For enterprise analytics, we compete with global ISVs, such as IBM, Microsoft, Oracle, Salesforce, and SAP. Our ability to compete successfully depends on a number of factors within and outside of our control. Some of these factors include software quality, performance and reliability; the quality of our service and support teams; marketing and prospecting effectiveness, the ability to incorporate artificial intelligence (“AI”) and other technically advanced features; and our ability to differentiate our products. Failure to perform in these or other areas may reduce the demand for our offerings and materially adversely affect our revenue from both existing and prospective customers.
Some of our competitors have longer operating histories, more focused business strategies and significantly greater financial, technical, and marketing resources than we do. As a result, they may be able to respond more quickly to new or emerging technologies and changes in customer requirements or devote greater resources to the development, promotion, sale, and marketing of their offerings than we can, such as offering certain analytics products free of charge when bundled with other products. In addition, many of our competitors have strong relationships with current and potential customers, extensive industry and specialized business knowledge, and corresponding proprietary technologies that they can leverage. As a result, they may be able to prevent us from penetrating new accounts or expanding existing accounts.
Increased competition may lead to price cuts, reduced gross margins, and loss of market share. The failure to compete successfully and meet the competitive pressures we face may have a material adverse effect on our business, operating results, and financial condition.
Current and future competitors may also make strategic acquisitions or establish cooperative relationships among themselves or with others. By doing so, these competitors may increase their ability to meet the needs of our potential customers by their expanded offerings and rapidly gain significant market share, which could limit our ability to obtain revenues from new customers and to sustain software maintenance revenues from our installed customer base. In addition, basic office productivity software suites, such as Microsoft Office, could evolve to offer advanced analysis and reporting capabilities that may reduce the demand for our analytics offerings.
Integration of artificial intelligence into our enterprise analytics product offerings and our use of artificial intelligence in our operations could result in reputational or competitive harm, legal liability, and other adverse effects on our business
We have integrated, and plan to further integrate, AI capabilities into certain components of our enterprise analytics product offerings and we expect to use AI in our operations. Such integration and use of AI may become more important in our product offerings and operations over time. These AI-related initiatives, whether successful or not, could cause us to incur substantial costs and could result in delays in our software release cadence. Our competitors or other third parties may incorporate AI into their products or operations more quickly or more successfully than we do, which could impair our ability to compete effectively. Additionally, AI algorithms may be flawed and datasets underlying AI algorithms may be insufficient or contain biased information. If the AI tools integrated into our products or that we use in our operations produce analyses or recommendations that are or are alleged to be deficient, inaccurate, or biased, our reputation, business, financial condition, and results of operations may be adversely affected.
Other companies have experienced cybersecurity incidents that implicate confidential and proprietary company data and/or the personal data of end users of AI applications integrated into their software offerings or used in their operations. If we were to experience a cybersecurity incident, whether related to the integration of AI capabilities into our product offerings or our use of AI applications in our operations, our business and results of operations could be adversely affected. AI also presents various emerging legal, regulatory and ethical issues, and the incorporation of AI into our product offerings and our use of AI applications in our operations could require us to expend significant resources in developing, testing and maintaining our product offerings and may cause us to experience brand, reputational, or competitive harm, or incur legal liability. On October 30, 2023, the Biden administration issued an Executive Order to, among other things, establish extensive new standards for AI safety and security. Other jurisdictions may decide to adopt similar or
more restrictive legislation that may render the use of such technologies challenging. These restrictions may make it harder for us to conduct our business using AI, lead to regulatory fines or penalties, require us to change our product offerings or business practices, or prevent or limit our use of AI.
Risks Related to Our Technology and Intellectual Property
If we are unable to develop and release new software product offerings or enhancements to our existing offerings in a timely and cost-effective manner, our business, operating results, and financial condition could be materially adversely affected
The software market is characterized by frequent new offerings and enhancements in response to rapid technological change, new customer requirements, and evolving industry standards. The introduction of new or enhanced offerings can quickly make existing ones obsolete. We believe our future success depends largely on our ability to continue to rapidly develop new and innovative product offerings and enhancements to our existing offerings that achieve market acceptance, maintain and improve our current offerings, support popular operating systems and databases, maintain technological competitiveness, and meet an expanding range of customer requirements.
Analytics applications, and applications that leverage the Bitcoin blockchain and Lighting Network, can be complex, and research and development for these types of applications can be costly and time consuming. In addition, customers may delay their purchasing decisions because they anticipate that new or enhanced versions of our offerings will soon become available or because of concerns regarding the complexity of migration or performance issues related to new offerings. We cannot be sure that we will succeed in developing, marketing, and delivering, on a timely and cost-effective basis, new or enhanced offerings that will achieve market acceptance. Moreover, even if our new offerings achieve market acceptance, we may experience a decline in revenues of our existing offerings that is not fully matched by the new offering’s revenue. This could result in a temporary or permanent revenue shortfall and materially adversely affect our business, operating results, and financial condition.
We depend on technology licensed to us by third parties, and changes in or discontinuances of such licenses could impair our software, delay implementation of our offerings, or force us to pay higher license fees
We license third-party technologies that are incorporated into or utilized by our existing offerings. These licenses may be terminated, or we may be unable to license third-party technologies for future offerings. In addition, we may be unable to renegotiate acceptable third-party license terms, or we may be subject to infringement liability if third-party technologies that we license are found to infringe intellectual property rights of others. Changes in or discontinuance of third-party licenses could lead to a material increase in our costs or to our offerings becoming inoperable or their performance being materially reduced. As a result, we may need to incur additional development costs to help ensure continued performance of our offerings, and we may experience a decreased demand for our offerings.
Changes in third-party software or systems or the emergence of new industry standards could materially adversely affect the operation of and demand for our existing software
The functionalities of our software depend in part on the ability of our software to interface with our customers’ information technology (“IT”) infrastructure and cloud environments, including software applications, network infrastructure, and end user devices, which are supplied to our customers by various other vendors. When new or updated versions of these third-party software or systems are introduced, or new industry standards in related fields emerge, we may be required to develop updated versions of or enhancements to our software to help ensure that it continues to effectively interoperate with our customers’ IT infrastructure and cloud environments. If new or modified operating systems are introduced or new web standards and technologies or new standards in the field of database access technology emerge that are incompatible with our software, development efforts to maintain the interoperability of our software with our customers’ IT infrastructure and cloud environments could require substantial capital investment and employee resources. If we are unable to update our software in a timely manner, cost-effectively, or at all, the ability of our software to perform key functions could be impaired, which may impact our customers’ satisfaction with our software, potentially result in breach of warranty or other claims, and materially adversely affect demand for our software.
The nature of our software makes it particularly susceptible to undetected errors, bugs, or security vulnerabilities, which could cause problems with how the software performs and, in turn, reduce demand for our software, reduce our revenue, and lead to litigation claims against us
Despite extensive testing by us and our current and potential customers, we have in the past discovered software errors, bugs, or security vulnerabilities (including the log4j and SpringShell vulnerabilities which surfaced in December 2021 and March 2022, respectively, and affected companies worldwide) in our offerings after commercial shipments began and they may be found in future offerings or releases. This could result in lost revenue, damage to our reputation, or delays in market acceptance, which could have a material adverse effect on our business, operating results, and financial condition. We may also need to expend resources and capital to correct these defects if they occur.
Our customer agreements typically contain provisions designed to limit our exposure to product liability, warranty, and other claims. It is possible these provisions are unenforceable in certain domestic or international jurisdictions, and we may be exposed to such claims. A successful claim against us could have a material adverse effect on our business, operating results, and financial condition.
Our intellectual property is valuable, and any inability to protect it could reduce the value of our offerings and brand
Unauthorized third parties may try to copy or reverse engineer portions of our software or otherwise obtain and use our intellectual property. Copyrights, patents, trademarks, trade secrets, confidentiality procedures, and contractual commitments can only provide limited protection. Any intellectual property owned by us may be invalidated, circumvented, or challenged. Any of our pending or future intellectual property applications, whether or not currently being challenged, may not be issued with the scope we seek, if at all. Moreover, amendments to and developing jurisprudence regarding U.S. and international law may affect our ability to protect our intellectual property and defend against claims of infringement. In addition, although we generally enter into confidentiality agreements with our employees and contractors, the confidential nature of our intellectual property may not be maintained. Furthermore, the laws of some countries do not provide the same level of protection of our intellectual property as do the laws of the United States. If we cannot protect our intellectual property against unauthorized copying or use, we may not remain competitive.
We may be obligated to disclose our proprietary source code to our customers, which may limit our ability to protect our intellectual property and could reduce the renewals of our support services
Certain of our customer agreements contain provisions permitting the customer to become a party to, or a beneficiary of, a source code escrow agreement under which we place the proprietary source code for our applicable services and products in escrow with a third party. Under these escrow agreements, the source code to the applicable product may be released to the customer, typically for its use to maintain, modify, and enhance the product, upon the occurrence of specified events, such as our filing for bankruptcy, discontinuance of our support services, and/or ceasing our business operations generally.
Disclosing the content of our source code may limit the intellectual property protection we can obtain or maintain for that source code or the services and products containing that source code. It also could permit a customer to which a product’s source code is disclosed to support and maintain that software product without being required to purchase our support services. Each of these could harm our business, results of operations, and financial condition.
Third parties may claim we infringe their intellectual property rights
We periodically receive notices from third parties claiming we are infringing their intellectual property rights. The frequency of such claims may increase as we expand our offerings and branding, the number of offerings and level of competition in our industry grow, the functionality of offerings overlaps, and the volume of issued patents, patent applications, and copyright and trademark registrations continues to increase. Responding to any infringement claim, regardless of its validity, could:
•be time-consuming, costly, and/or result in litigation;
•divert management’s time and attention from developing our business;
•require us to pay monetary damages or enter into royalty or licensing agreements that we would normally find unacceptable;
•require us to stop selling certain of our offerings;
•require us to redesign certain of our offerings using alternative non-infringing technology or practices, which could require significant effort and expense;
•require us to rename certain of our offerings or entities; or
•require us to satisfy indemnification obligations to our customers or channel partners.
Additionally, while we monitor our use of third-party software, including open-source software, our processes for controlling such use in our offerings may not be effective. If we fail to comply with the terms or conditions associated with third-party software that we use, if we inadvertently embed certain types of third-party software into one or more of our offerings, or if third-party software that we license is found to infringe the intellectual property rights of others, we could become subject to infringement liability and be required to re-engineer our offerings, discontinue the sale of our offerings, or make available to certain third parties or generally available, in source code form, our proprietary code, any of which could materially adversely affect our business, operating results, and financial condition.
If a successful infringement claim is made against us and we fail to develop or license a substitute technology or brand name, as applicable, our business, results of operations, financial condition, or cash flows could be materially adversely affected.
Risks Related to Our Operations
Business disruptions, including interruptions, delays, or failures of our systems, third-party data center hosting facility, or other third-party services, as a result of geopolitical tensions, acts of terrorism, natural disasters, pandemics (like the COVID-19 pandemic), and similar events, could materially adversely affect our operating results or result in a material weakness in our internal controls that could adversely affect the market price of our stock
A significant portion of our research and development activities or certain other critical business operations are concentrated in facilities in Northern Virginia, China, Argentina, and Poland. In addition, we serve our customers and manage certain critical internal processes using a third-party data center hosting facility located in the United States and other third-party services, including AWS, Azure, and other cloud services. Any disruptions or failures of our systems or the third-party hosting facility or other services that we use, including as a result of a natural disaster, fire, cyberattack (including the potential increase in risk for such attacks due to cyberwarfare in connection with the ongoing Russia-Ukraine and Israel-Hamas conflicts), act of terrorism, geopolitical conflict (including due to the ongoing Russia-Ukraine and Israel-Hamas conflicts and any potential conflict involving China and Taiwan), pandemic (including the COVID-19 pandemic), the effects of climate change, or other catastrophic event, as well as power outages, telecommunications infrastructure outages, a decision by one of our third-party service providers to close facilities that we use without adequate notice or to materially change the pricing or terms of their services, host country restrictions on the conduct of our business operations or the availability of our offerings, or other unanticipated problems with our systems or the third-party services that we use, such as a failure to meet service standards, could severely impact our ability to conduct our business operations or to attract new customers or maintain existing customers, or result in a material weakness in our internal control over financial reporting, any of which could materially adversely affect our future operating results.
Our international operations are complex and expose us to risks that could have a material adverse effect on our business, operating results, and financial condition
We receive a significant portion of our total revenues from international sales and conduct our business activities in various foreign countries, including some emerging markets where we have limited experience, where the challenges of conducting our business can be significantly different from those we have faced in more developed markets, and where business practices may create internal control risks. International revenues accounted for 41.9%42.7%, 39.3%41.0%, and 38.3%44.7% of our total revenues for the years ended December 31, 2017, 2016,2023, 2022, and 2015,2021, respectively. Our international operations require significant management attention and financial resources.
There are certainresources and expose us to additional risks, inherent in our international business activities, including:
•fluctuations in foreign currency exchange rates;
•new, or changes in, regulatory requirements;
•tariffs, export and import restrictions, restrictions on foreign investments, tax laws, sanctions, laws and policies that favor local competitors (such as mandatory technology transfers), and other trade barriers or protection measures;
•costs of localizing offerings;
lack of acceptance of localized offerings;
difficulties in and costs of staffing, managing, and operating our international operations;
tax issues, including restrictions on repatriating earnings;
weaker intellectual property protection;
economic weakness or currency related crises;
the burden of complyingcompliance with a wide variety of laws, including those relating to labor matters, antitrust, procurement and contracting, consumer and data protection, privacy, data localization, governmental access to data, network security, and encryption;
•costs of localizing offerings and lack of acceptance of localized offerings;
•difficulties in and costs of staffing, managing, and operating our international operations;
•economic weakness or currency-related crises;
•generally longer payment cycles and greater difficulty in collecting accounts receivable;
•weaker intellectual property protection;
•increased risk of corporate espionage or misappropriation, theft, or misuse of intellectual property, particularly in foreign countries where we have significant software development operations that have access to product source code, such as China;
•our ability to adapt to sales practices and customer requirements in different cultures;
•corporate espionage;natural disasters, acts of war (including risks relating to the ongoing conflict between Russia and
Ukraine, a potential broadening of the Israel-Hamas conflict to other countries in the Middle East, and any potential conflict involving China and Taiwan), terrorism, or pandemics (including the COVID-19 pandemic); and •political instability and security risks in the countries where we are doing business.
We may face heightened risksbusiness, including, without limitation, political and economic instability caused by the current conflict between Russia and Ukraine and economic sanctions adopted in connection with our international operations asresponse to the conflict, and a resultpotential broadening of the impending withdrawal ofIsrael-Hamas conflict to other countries in the United Kingdom from the European Union, commonly referred to as “Brexit.” The future effects of Brexit are uncertain and will depend on any agreements the United Kingdom makes to retain access to E.U. markets either during a transitional period or more permanently. Brexit could, among other outcomes, disrupt the free movement of goods, services and people between the United Kingdom and the European Union, and significantly disrupt trade between the United Kingdom and the European Union. In addition, Brexit could lead to legal uncertainty and potentially divergent national laws and regulations, including tax laws and regulations, as the United Kingdom determines which E.U. laws to replace or replicate. Middle East.
Disruptions to trade, weakening of economic conditions, economic and legal uncertainties, or changes in currency rates may adversely affect our business, financial condition, operating results, and cash flows. The United States has put in place higher tariffs and other restrictions on trade with China, the European Union, Canada, and Mexico, among other countries, including limiting trade and/or
imposing tariffs on imports from such countries. In addition, China, the European Union, Canada, and Mexico, among others, have either threatened or put into place retaliatory tariffs of their own. These tariffs and any further escalation of protectionist trade measures could adversely affect the markets in which we sell our offerings and, in turn, our business, financial condition, operating results, and cash flows. It is unclear whether and to what extent such measures will be reversed in the future or whether the Biden administration will make additional changes to U.S. trade policy that may result in further impacts on our business.
On December 22, 2017,Changes to the U.S. government enacted comprehensivetaxation of our international income, or changes in foreign tax legislation commonly referred to aslaws, could have a material effect on our future operating results. For example, the Tax Cuts and Jobs Act (the “Tax Act”), with some retroactive effects. This legislation brings about, among other items,led to corporate income tax rate changes, the modification or elimination of certain tax incentives, changes to the existing regime for taxing overseas earnings, (including modifications to the current regime for repatriating such earnings), and measures to prevent BEPS. Although the overall impact that the legislation may have on our future effective tax rate is unclear at this time, the changes to the U.S. taxation of our international income could have a material effect on our future operating results.
From time to time, we may undertake various potential intercompany transactions and legal entity restructurings that involve our international subsidiaries. We consider various factors in evaluating these potential transactions and restructurings, including the alignment of our corporate structure with our organizational objectives, the operational and tax efficiency of our corporate structure,BEPS, and the long-term cash flows and cash needsUnited Kingdom adopted legislation imposing a tax related to offshore receipts in respect of our business. Such transactions and restructurings could negatively impact our overallintangible property held in low tax rate and result in additional tax liabilities.jurisdictions.
In addition,Moreover, compliance with foreign and U.S. laws and regulations that are applicable to our international operations is complex and may increase our cost of doing business in international jurisdictions,jurisdictions. Our failure to comply with these laws and our international operations couldregulations has exposed, and may in the future expose, us to fines and penalties if we fail to comply with these regulations.penalties. These laws and regulations include anti-bribery laws, such as the U.S. Foreign Corrupt Practices Act, the U.K.UK Bribery Act, and local laws prohibiting corrupt payments to government officials.officials, and local laws relating to procurement, contracting, and antitrust. These laws and regulations also include import and export requirements and economic and trade sanctions administered by the Office of Foreign Assets Control and the U.S. Department of Commerce Department based on U.S. foreign policy and national security goals against targeted foreign states, organizations, and individuals. Although we have implemented policies and procedures designed to help ensure compliance with these laws, there can be no assurance that our employees, channel partners, and other persons with whom we do business will notmay take actions in violation of our policies or these laws. For example, following an internal review initiated in 2018, we believe our Brazilian subsidiary failed or likely failed to comply with local procurement regulations in conducting business with certain Brazilian government entities and these matters are the subject of investigation by Brazilian authorities. Any violationsviolation of these laws could subject us to civil or criminaladministrative penalties, including substantial fines, prohibitions, or prohibitionsother limitations on our ability to offersell our products and servicesofferings to one or more countries, and could also materially damage our reputation and our brand.
These factors may have a material adverse effect on our future sales, and, consequently, on our business, operating results, and financial condition.
We may lose sales, or sales may be delayed, due to the long sales and implementation cycles of certain of our products and services, which could reduce our revenues
To date, our customers have typically invested substantial time, money, and other resources, and involved many people in the decision to license our software products and purchase our related services. As a result, we may wait nine months or more after the first contact with a customer for that customer to place an order while it seeks internal approval for the purchase of our products or services. During this long sales cycle, events may occur that affect the size and/or timing of the order or even cause it to be canceled. For example, our competitors may introduce new offerings, or the customer’s own budget and purchasing priorities may change.
Even after an order is placed, the time it takes to deploy our products and complete services engagements can vary widely. Implementing some of our offerings can take several months, depending on the customer’s needs, and may begin only with a pilot program. It may be difficult to deploy our products if the customer has complicated deployment requirements, which typically involve integrating databases, hardware, and software from different vendors. If a customer hires a third party to deploy our products, we cannot be sure that our products will be deployed successfully.
Our results in any particular period may depend on the number and volume of large transactions in that period and these transactions may involve lengthier, more complex, and more unpredictable sales cycles than other transactions
As existing and potential customers seek to standardize on a single analytics vendor or require greater vendor capacity to meet their growing analytics needs, our business may experience larger transactions at the enterprise level and larger transactions may account for a greater proportion of our business. The presence or absence of one or more large transactions in a particular period may have a material positive or negative effect on our revenue and operating results for that period. For the years ended December 31, 2017, 2016, and 2015, our top three product licenses transactions with recognized revenue totaled $4.5 million, $9.2 million, and $7.4 million, respectively, or 4.8%, 8.1%, and 6.2% of total product licenses revenues, respectively. These transactions represent significant business and financial decisions for our customers, require considerable effort on the part of customers to assess alternative products, and often require additional levels of management approval. In addition, large transactions are often more complex than smaller transactions. These factors generally lengthen the typical sales cycle and increase the risk that customers may postpone or delay purchasing decisions from one period to another subsequent or later period, or that customers will alter their purchasing requirements. We may also encounter greater competition and pricing pressure in larger transactions, and the sales effort and service delivery scope for larger transactions may
require us to use additional resources to execute the transaction. These factors could result in lower than anticipated revenue and earnings for a particular period or in lower estimated revenue and earnings in future periods.
We face a variety of risks in doing business with U.S., and foreign federal, state, and local governments and government agencies, including risks related to the procurement process, budget constraints and cycles, termination of contracts, and compliance with government contracting requirements
Our customers include the U.S. government, and a number of state and local governments and government agencies. There are a variety of risks in doing business with government entities, including:
Procurement. Contracting with public sector customers is highly competitive and can be time-consuming and expensive, requiring us to incur significant up-front time and expense without any assurance that we will win a contract. Further, even if we win a contract, it may be placed on hold, or reversed, due to a post-award protest.
Budgetary Constraints and Cycles. Demand and payment for our products and services are impacted by publicPublic sector budgetary cycles and funding availability, with funding reductions or delays adversely impacting public sectorimpact demand and payment for our products and services.offerings.
Termination of Contracts. Public sector customers often have contractual or other legal rights to terminate current contracts for convenience or due to a default. If a contract is terminated for convenience, which can occur if the customer’s needs change,convenience, we may only be able to collect fees for productssoftware or services delivered prior to termination and settlement expenses. If a contract is terminated due to aour default, we may not recover even those amounts, and we may be liable for excess costs incurred by the customer for procuring alternative productssoftware or services.
Compliance with Government Contracting Requirements. Government contractors are required to comply with a variety of complex laws, regulations, and contractual provisions relating to the formation, administration, or performance of government contracts that give public sector customers substantial rights and remedies, many of which are not typically found intypical for commercial contracts. These may include rights with respect toregarding price protection, the accuracy of information provided to the government, contractor compliance with socio-economic policies, and other terms that are particularunique to government contracts. Federal, state, and local governmentsGovernments and government agencies routinely investigate and audit contractors for compliance with these requirements. If, as a result of an audit or review, it is determined that we have failed to comply with these requirements, we may be subject to civil and criminal penalties andor administrative sanctions, including contract termination, of contracts, forfeiture of profits, cost associated with the triggering of price reduction clauses, fines, treble damages, and suspensions or debarment from future government business and we may suffer harm to our reputation.
Our customers also include a number of foreign governments and government agencies. Similar procurement, budgetary, contract, and audit risks also apply to our doing business with these entities. In addition, compliance with complex regulations and contracting provisions in a variety of jurisdictions can be expensive and consume significant management resources. In certain jurisdictions, our ability to win business may be constrained by political and other factors unrelated to our competitive position in the market. Each of these difficulties could materially adversely affect our business and results of operations.
We depend on technology licensed to us by third parties, and the loss of this technology could impair our software, delay implementation of our offerings, or force us to pay higher license fees
We license third-party technologies that are incorporated into or utilized by our existing offerings. There can be no assurance that the licenses for such third-party technologies will not be terminated or that we will be able to license third-party software for future offerings. In addition, we may be unable to renegotiate acceptable third-party license terms, or we may be subject to infringement liability if third-party software that we license is found to infringe intellectual property rights of others. Changes in or the loss of third-party licenses could lead to a material increase in our costs, or to our software offerings becoming inoperable or their performance being materially reduced. As a result, we may need to incur additional development costs to help ensure continued performance of our offerings, and we may experience a decreased demand for our offerings.
If we are unable to recruit or retain skilled personnel, or if we lose the services of our Chairman of the Board of Directors, President & Chief Executive Officer,Michael J. Saylor, our business, operating results, and financial condition could be materially adversely affected
Our future success depends on our continuing ability to attract, train, assimilate, and retain highly skilled personnel. CompetitionThere has historically been significant competition for thesequalified employees is intense,in the technology industry, and such competition may be further amplified by evolving restrictions on immigration, travel, or availability of visas for skilled technology workers. We may not be able to retain our current key employees or attract, train, assimilate, and retain other highly skilled personnel in the future. Our future success also depends in large part on the continued service of Michael J. Saylor, our Chairman of the Board of Directors President & Chiefand Executive Officer.Chairman. If we lose the services of Mr. Saylor, or if we are unable to attract, train, assimilate, and retain the highly skilled personnel we need, our business, operating results, and financial condition could be materially adversely affected.
The emergence of new industry standards may materially adversely affect the demand for our existing offerings
The emergence of new industry standards in related fields may materially adversely affect the demand for our existing offerings. This could happen if new web standards and technologies or new standards in the field of operating system support emerge that are incompatible with customer deployments of our software offerings. For example, if we are unable to adapt our software offerings on a timely basis to new standards in database access technology, the ability of our software offerings to access customer databases could be impaired.
The nature of our software offerings makes them particularly susceptible to undetected errors, bugs, or security vulnerabilities, which could cause problems with how the offerings perform and which could, in turn, reduce demand for our offerings, reduce our revenue, and lead to product liability claims against us
Software as complex as ours may contain undetected errors, bugs, or security vulnerabilities. Although we test our software offerings extensively, we have in the past discovered software errors, bugs, or security vulnerabilities in our offerings after their introduction. Despite testing by us and our current and potential customers, errors, bugs, or security vulnerabilities may be found in new offerings or releases after commercial shipments begin. This could result in lost revenue, damage to our reputation, or delays in market acceptance, which could have a material adverse effect on our business, operating results, and financial condition. We may also need to expend resources and capital to correct these defects.
Our agreements with customers typically contain provisions designed to limit our exposure to product liability, warranty, and other claims. It is possible, however, that these provisions may not be effective under the laws of certain domestic or international jurisdictions and we may be exposed to product liability, warranty, and other claims. A successful product liability claim against us could have a material adverse effect on our business, operating results, and financial condition.
Changes in laws or regulations relating to privacy or the collection, processing, disclosure, storage, localization, or transmission of personal data, or any actual or perceived failure by us or our third-party service providers to comply with such laws and regulations, contractual obligations, or applicable privacy policies, could materially adversely affect our business
Aspects of our business including our cloud services offerings and Usher, involve collecting, processing, disclosing, storing, and transmitting personal data, which are subject to certain privacy policies, contractual obligations, and certain federal, state,U.S. and foreign laws, regulations, and directives relating to privacy and data protection. TheWe store a substantial amount of customer and employee data, that we store throughincluding personal data, on our cloud services offerings, networks and other systems including personal data, is increasing.and the cloud environments we manage. In addition, the types of data subject to protection as personal data in the European Union, China, the United States, and elsewhere have been expanding. In recent years, the collection and use of personal data by companies have come under increased regulatory and public scrutiny, especially in relation to the collection and processing of sensitive data, such as healthcare, biometric, genetic, financial services, and government data.children’s data, precise location data, and data regarding a person’s race or ethnic origins, political opinions, or religious beliefs. For example, in the United States, protected health information is subject to HIPAA. HIPAA, has been supplemented by the Health Information Technologywhich can provide for Economic and Clinical Health Act with the result of increased civil and criminal penalties for noncompliance. Entities performing certain functions(such as us) that engage in creating, receiving, maintaining, or
transmitting protected health information provided by covered entities and other business associates are directly subject to enforcement under HIPAA. Our access to protected health information through our cloud services offerings triggers obligations to comply with certain privacy rules and data security requirements under HIPAA.
In addition to potential enforcement by the United States Department of Health and Human Services for potential HIPAA violations, we are also potentially subject to privacy enforcement from the FTC. The FTC has been particularly focused on certain activities related to the processing of sensitive data, including the unpermitted processing of health and genetic data through its recent enforcement actions and is expanding the types of privacy violations that it interprets to be “unfair” under Section 5 of the FTC Act, as well as the types of activities it views to trigger the Health Breach Notification Rule (which the FTC also has the authority to enforce). The agency is also in the process of developing rules related to commercial surveillance and data security that may impact our business. We will need to account for the FTC’s evolving rules and guidance for proper privacy and data security practices in order to mitigate our risk for a potential enforcement action, which may be costly. If we are subject to a potential FTC enforcement action, we may be subject to a settlement order that requires us to adhere to very specific privacy and data security practices, which may impact our business. We may also be required to pay fines as part of a settlement (depending on the nature of the alleged violations). If we violate any consent order that we reach with the FTC, we may be subject to additional fines and compliance requirements. We face risks of similar enforcement from State Attorneys General and, potentially, other regulatory agencies.
Any systems failure or security breach that results in the release of, or unauthorized access to, personal data, or any failure or perceived failure by us or our third-party service providers to comply with applicable privacy policies, contractual obligations, or any applicable laws or regulations relating to privacy or data protection, could result in proceedings against us by domestic or foreign government entities or others, including private plaintiffs in litigation. Such proceedings could result in the imposition of sanctions, fines, penalties, liabilities, government orders, and/or government orders requiring that we change our data practices, any of which could have a material adverse effect on our business, operating results, reputation, and financial condition.
Various federal, state,U.S. and foreign legislative, regulatory, or other government bodies may enact new or additional laws or regulations, or issue rulings that invalidate prior laws or regulations, concerning privacy, data storage, data protection, and cross-border transfer of data that could materially adversely impact our business. For example, in October 2015, the Court of Justice ofIn the European Union, issuedGDPR took effect in May 2018. GDPR establishes requirements regarding the handling and security of personal data, requires disclosure of data breaches to individuals, customers, and data protection authorities in certain circumstances, requires companies to honor data subjects’ requests relating to their personal data, permits regulators to impose fines of up to €20,000,000 or 4% of global annual revenue, whichever is higher, and establishes a ruling that declared the U.S.-EU Safe Harbor Framework invalid. Following this ruling, U.S.private right of action. Furthermore, a new ePrivacy Regulation, regulating electronic communications, was proposed in 2017 and European authorities agreed to, and in July 2016is under consideration by the European Commission, formally adopted,the European Parliament, and the European Council. In July 2020, the CJEU invalidated the U.S.-EU Privacy Shield, which provided a new mechanism forto lawfully transferringtransfer personal data from the European Union to the United States referredand certain other countries. In the wake of the invalidation of the U.S.-EU Privacy Shield, we transitioned to reliance on SCCs to lawfully transfer certain personal data from the European Union to the United States. The CJEU decision also drew into question the long-term viability of the SCCs for transfers of personal data from the EU and European Economic Area to the U.S. As a result, in October 2022, President Biden signed an executive order to implement the EU-U.S. Data Privacy Framework, which would serve as a replacement to the “Privacy EU-U.S. Privacy
Shield.” The European Union initiated the process to adopt an adequacy decision for the EU-U.S. Data Privacy Framework in December 2022 and the European Commission adopted the adequacy decision on July 10, 2023. The adequacy decision will permit U.S. companies who self-certify to the EU-U.S. Data Privacy Framework to rely on it as a valid data transfer mechanism for data transfers from the EU to the U.S. and will also provide support for the use of standard contractual clauses. However, some privacy advocacy groups have already suggested that they will be challenging the EU-U.S. Data Privacy Framework. If these challenges are successful, they may not only impact the EU-U.S. Data Privacy Framework, but they may also further limit the viability of the standard contractual clauses and other data transfer mechanisms. The uncertainty around this issue has the potential to impact our business internationally. Because the rules involving this data transfer mechanism are also undergoing revision and this transfer mechanism may also be declared invalid (or require us to change our business practices) in the future, these developments may require us to provide an alternative means of data transfer. In addition, the required terms for contracts containing SCCs along with recommended supplemental provisions are changing and may require us to assume additional obligations, otherwise inhibit or restrict our ability to undertake certain activities, or incur additional costs related to data protection.
In addition, in April 2016,June 2021, the EDPB issued the EDPB Recommendations. The new SCCs were required to be in place for new transfers of personal data as of September 27, 2021 and to replace those being used for existing transfers of personal data by December 27, 2022. The new SCCs place obligations on us in relation to government authorities’ access requests in respect of personal data transferred under the SCCs, and other obligations to bring the SCCs in line with the requirements of the GDPR. The EDPB Recommendations are designed to be read in tandem with the new SCCs and set out new requirements for organizations to assess third countries and identify appropriate supplementary data protection and security measures to be implemented on a case-by-case basis where needed.
Moreover, due to Brexit, the SCCs issued by the European ParliamentCommission are no longer automatically adopted in the United Kingdom post-Brexit. In response, the UK’s Information Commissioner’s Office (“ICO”) published a template Addendum to the new EU SCCS which adapts the new EU SCCs for UK use. In the alternative, the ICO also published the international data transfer agreement (“IDTA”). The IDTA replaces the current set of SCCs being used in the UK. The UK SCCs Addendum and IDTA, after having been put before UK parliament, have been in force as of March 2022 and UK-based organizations were required to start using the UK IDTA or Addendum for new data transfer arrangements starting in September 2022. The UK and the CouncilU.S. also agreed to a U.S.-UK “data bridge,” which went into effect on October 12, 2023. This functions similarly to the EU-U.S. Data Privacy Framework and provides an additional legal mechanism for companies to transfer data from the UK to the U.S.
The rules involving these alternative SCC data transfer options are continually undergoing revision and these transfer mechanisms may also be declared invalid (or require us to change our business practices) in the future, requiring us to provide an alternative means of data transfer or implement significant changes in our data security and protection practices. In addition, the required terms for contracts containing SCCs along with recommended supplemental provisions are changing and may require us to assume additional obligations, otherwise inhibit or restrict our ability to undertake certain activities, or incur additional costs related to data protection.
Similar requirements are also coming into force in other countries. Brazil enacted the Brazilian General Data Protection Law, which became effective in August 2020 and imposes requirements largely similar to GDPR on products and services offered to users in Brazil. In China, we may also be subject to the Cybersecurity Law that went into effect in June 2017 and the revision of the European Union formallyPersonal Information Security Specification that went into effect in October 2020, which have broad but uncertain application and impose a number of new privacy and data security obligations. China also adopted new legislation on the protection of privacy and personal data in November 2021, including the PIPL and Data Security Law that impose new data processing obligations on us. Under these new regulations, if an entity operating in China violates the law, regulators may order it to take corrective actions, issue warnings, confiscate illegal income, suspend services, revoke operating permits or business licenses, or issue a fine. The fine can be up to ¥50 million or 5 percent of an organization’s annual revenue for the prior financial year.
Further, in connection with cross-border transfer of personal information under the PIPL in China, China regulators published the Draft Rules on Standard Contracts Regarding Export of Personal Information and, under the PIPL, the adoption of standard contractual clauses between the data controller (the entity which transfers personal information to a location outside the PRC) and the offshore recipient is required to lawfully facilitate the offshore transfer of personal information from China. These requirements apply to companies operating in China and seeking to transfer personal data outside of China and organizations which do not satisfy these conditions may be required to satisfy additional regulatory requirements and/or be subject to penalties or fines.
Other countries are considering new or expanded laws governing privacy and data security that may impact our business practices. These developments, including in Brazil and China, may impact our activities with our customers, other MicroStrategy entities and vendors, and require us to take additional and appropriate steps in light of data transfers between the U.S. and the EU (and the UK), as well as transfers and onward transfers of personal data from the EU to other non-EU countries.
State privacy laws in the United States also may impact our business operations. The state of California has adopted a comprehensive generalprivacy law, the CCPA, which took effect in January 2020 and became enforceable in July 2020. We have been required to devote substantial resources to implement and maintain compliance with the CCPA, and noncompliance could result in regulatory investigations and fines or private litigation. Moreover, in November 2020, California voters approved a privacy law, the CPRA, which amends the CCPA to create additional privacy rights and obligations in California, and went into effect on January 1, 2023. Numerous other states
have passed laws similar to the CCPA, which will go into effect in 2023 and beyond. More states may follow. These laws may impose additional costs and obligations on us. Similarly, in March 2022, the U.S. federal government also passed the Cyber Incident Reporting for Critical Infrastructure Act of 2022, which will require companies deemed to be part of U.S. critical infrastructure to report any substantial cybersecurity incidents or ransom payments to the federal government within 72 and 24 hours, respectively. The implementing regulations are not expected for another two-to-three years. The Securities and Exchange Commission also has issued new regulations related to cybersecurity that may require additional reporting and other compliance obligations, as well as creating additional risks related to public notifications concerning cyber incidents.
Furthermore, the U.S. Congress is considering comprehensive privacy legislation. At this time, it is unclear whether Congress will pass such a law and if so, when and what it will require and prohibit. Moreover, it is not clear whether any such legislation would give the FTC any new authority to impose civil penalties for violations of the Federal Trade Commission Act in the first instance, whether Congress will grant the FTC rulemaking authority over privacy and information security, or whether Congress will vest some or all privacy and data security regulatory authority and enforcement power in a new agency, akin to EU data protection regulation, which will take effect in May 2018. The new law governs data practices and privacy, and establishes new requirements regarding the handling of personal data. Furthermore, a new ePrivacy regulation, regulating electronic communications, is also slated to take effect in the European Union in 2018. authorities.
Complying with these and other changing requirements could cause us or our customers to incur substantial costs or pay substantial fines or penalties, require us to change our business practices, require us to take on more onerous obligations in our contracts, or limit our ability to provide certain products and servicesofferings in certain jurisdictions, any of which could materially adversely affect our business and operating results. In addition, the Privacy Shield, as well as other mechanisms for lawfully transferring personal data from the European Union to the United States and certain other countries, are being challenged in European courts, which could lead to uncertainty about the legality of such transfers, or burdensome or inconsistent legal requirements. The Privacy Shield is also subject to annual review by the European Commission and the U.S. Department of Commerce, which could result in modifications to the Privacy Shield or its enforcement, or even its invalidation. In addition, we may be subject to a cybersecurity law that went into effect in China on June 1, 2017 that has uncertain but broad application and imposes a number of new privacy and data security obligations. New laws or regulations restricting or limiting the collection or use of mobile data could also reduce demand for certain of our servicesofferings or require changes to our business practices, which could materially adversely affect our business and operating results.
If we or our third-party service providers experience a disruption due to a cybersecurity attack or security breach and unauthorized parties obtain access to our customers’, prospects’, vendors’, or channel partners’ data, our data, or our cloud services offerings, networks or other systems, or the cloud environments we manage, our offerings may be perceived as not being secure, our reputation may be harmed, demand for our offerings may be reduced, our operations may be disrupted, we may incur significant legal and financial liabilities, and our business could be materially adversely affected
As part of our business, we process, store, and transmit our customers’, prospects’, vendors’, and channel partners’ information and data as well as our own, including in our cloud services offerings, networks and other systems. There can be no assurance that any security measures thatsystems and the cloud environments we or our third-party service providers have implemented will be effective against all current or future security threats. For example, security measuresmanage. Security breaches may be breached as a result ofoccur due to technological error, computer viruses, or third-party action, including intentional misconduct by computer hackers or state actors, physical break-ins, the actions of state actors, industrial espionage, fraudulent inducement of employees, customers, or channel partners to disclose sensitive information such as user namesusernames or passwords, and employee, customer, or channel partner error or malfeasance. High-profile security breaches at other companies have increased in recent years. A security breach could result in unauthorized access to or disclosure, modification, misuse, loss, or destruction of our customers’, prospects’, vendors’, or channel partners’ data, our data (including our proprietary information, intellectual property, or trade secrets), or our cloud services offerings, networks or other systems, or the cloud environments we manage. Third parties may also conduct attacks designed to prevent access to critical data or systems through ransomware or temporarily deny customers access to our cloud environments.
We, and our service providers, have experienced and may in the future experience attempts by third parties to identify and exploit software and service vulnerabilities, penetrate or bypass our security measures, and gain unauthorized access to our or our customers’ or service providers’ cloud environments, networks, and other systems. Security measures that we or our third-party service providers have implemented may not be effective against all current or future security threats. Because there are many different security breach techniques and such techniques continue to evolve, we may be unable to anticipate, detect, or mitigate attempted security breaches and implement adequate preventative measures. Third parties may
also conduct attacks designed to temporarily deny customers access to our cloud services. Any security breach, ransomware attack, or successful denial of service attack could result in a loss of customer confidence in the security of our offerings and damage to our brand, reduce the demand for our offerings, disrupt our normal business operations, require us to spend material resources to investigate or correct the breach, require us to notify affected customers or individuals and/or applicable regulators and others, provide identity theft protection services to individuals, expose us to legal liabilities, including litigation, regulatory enforcement actions, and indemnity obligations, and materially adversely affect our revenuerevenues and operating results. Our software operates in conjunction with and is dependent on third-party products and components across a broad ecosystem. If there is a security vulnerability in one of these products or components, and if there is a security exploit targeting it, we could face increased costs, liability claims, customer dissatisfaction, reduced revenue, or harm to our reputation or competitive position. Our insurance policies may not be adequate to compensate us for the potential losses arising from any cybersecurity breach or incident. In addition, such insurance may not be available to us in the future on economically reasonable terms, or at all. Further, our insurance may not cover all claims made against us and could have high deductibles in any event, and defending a suit, regardless of its merit, could be costly and divert management attention.
These risks will increase as we continue to grow the number and scale of our cloud-based offerings,cloud subscriptions and process, store, and transmit increasingly large amounts of our customers’, prospects’, vendors’, channel partners’, and our own informationdata. In particular, as remote working conditions have led businesses to increasingly rely on virtual environments and data, which may include proprietary or confidential data or personal or identifying information.communication systems, there has been an increase in cyberattacks and other malicious activities.
Our intellectual property is valuable,having entered into an indemnification agreement with Michael J. Saylor, our Chairman of the Board of Directors and any inability to protect itExecutive Chairman, that supplements our conventional director and officer liability insurance provided by third-party insurance carriers could reducenegatively affect our business and the valuemarket price of our products, services, and brandclass A common stock
We rely on a combination of copyrights, patents, trademarks, trade secrets, confidentiality procedures, and contractual commitments to protecthave entered into an indemnification agreement with Michael J. Saylor, our intellectual property. Despite our efforts, these measures can only provide limited protection. Unauthorized third parties may try to copy or reverse engineer portions of our products or otherwise obtain and use our intellectual property. Any patents owned by us may be invalidated, circumvented, or challenged. Any of our pending or future patent applications, whether or not currently being challenged, may not be issued with the scopeChairman of the Board of Directors and Executive Chairman, pursuant to which Mr. Saylor has agreed to personally indemnify our directors and officers with respect to certain claims and expenses excluded from the insurance coverage provided by our commercial director and officer insurance carriers, for which we seek, if at all. Moreover, amendmentsagreed to and developing jurisprudence regarding U.S. patent law may affect our ability to protect our intellectual property and defend against claims of patent infringement. In addition, although we generally enterpay Mr. Saylor an applicable annual fee. Our having entered into confidentiality agreementsthis indemnification agreement with our employees, our former employees may seek employment withMr. Saylor could have adverse effects on our business, partners, customers, or competitors,including making it more difficult to attract and there can be no assuranceretain qualified directors and officers due to the unconventional nature of the arrangement and potential concerns that the confidential nature of our intellectual property will be maintained. Furthermore, the laws of some countries doindemnification arrangement might not provide the same level of protection that might otherwise be provided by coverage obtained entirely through conventional director and officer insurance. In addition, our indemnification arrangement with Mr. Saylor may result in some investors perceiving that our independent directors are not sufficiently independent from Mr. Saylor due to their entitlement to personal indemnification from him, which may have an adverse effect on the market price of our intellectual propertyclass A common stock.
Volatile and significantly weakened global economic conditions have in the past and may in the future adversely affect our industry, business and results of operations
Our overall performance depends in part on worldwide economic and geopolitical conditions. The United States and other key international economies have experienced significant economic and market downturns in recent periods, which have been characterized by restricted credit, poor liquidity, reduced corporate profitability, volatility in credit, equity and foreign exchange markets, inflation, bank failures, bankruptcies and overall uncertainty with respect to the economy. In addition, geopolitical and domestic political developments, such as doexisting and potential trade wars and other events beyond our control, including the lawsconflicts in Ukraine and the Middle East, can increase levels of political and economic unpredictability globally and increase the United States. If we cannot protect our intellectual property against unauthorized copying or use, wevolatility of global financial markets. Moreover, these conditions have affected and may not remain competitive.
Third parties may claim we infringe their intellectual property rights
We periodically receive notices from third parties claiming we are infringing their intellectual property rights, principally patent and trademark rights. We expect the number of such claims will increase as we continue to expandaffect the rate of IT spending; could adversely affect our offeringscustomers’ ability or willingness to attend our events or to purchase our software and branding,service offerings; have delayed and may delay customer purchasing decisions; have reduced and may in the numberfuture reduce the value and duration of offeringscustomer subscription contracts; and levelwe expect these conditions will adversely affect our customer attrition rates. All of competition in our industry segments grow, the functionality of offerings overlaps,these risks and the volume of issued patents, patent applications, and trademark registrations continues to increase. Responding to any infringement claim, regardless of its validity, could:
be time-consuming, costly, and/or result in litigation;
divert management’s time and attention from developing our business;
require us to pay monetary damages or enter into royalty and licensing agreements that we would not normally find acceptable;
require us to stop selling certain of our offerings;
require us to redesign certain of our offerings using alternative non-infringing technology or practices, which could require significant effort and expense;
require us to rename certain of our offerings or entities; or
require us to satisfy indemnification obligations to our customers and channel partners.
Additionally, while we monitor our use of third-party software, including open source software, we cannot assure you that our processes for controlling such use in our products will be effective. If we inadvertently embed certain types of open source software into one or more of our products, or if third-party software that we license is found to infringe intellectual property rights of others, we could subject ourselves to infringement liability and be required to re-engineer our products, discontinue the sale of our products if re-engineering could not be accomplished on a timely or cost-effective basis, or make available to certain third parties or generally available, in source code form, our proprietary code, any of whichconditions could materially adversely affect our business,future sales and operating results,results.
Risks Related to Our Class A Common Stock
The market price of our class A common stock has been and financial condition.may continue to be volatile
The market price of our class A common stock has historically been volatile and this volatility has been significant in recent periods. Since August 11, 2020, the date on which we announced our initial purchase of bitcoin, the closing price of our class A common stock has increased from $123.62 as of August 10, 2020, the last trading day before our announcement, to $769.88 as of February 14, 2024. The market price of our class A common stock may fluctuate widely in response to various factors, some of which are beyond our control. These factors include, but are not limited to:
If a successful infringement claim is made against us•fluctuations in the price of bitcoin, of which we have significant holdings, and in which we failexpect we will continue to developmake significant purchases and announcements about our transactions in bitcoin;
•changes to our bitcoin acquisition strategy;
•announcement of additional capital raising transactions;
•regulatory, commercial and technical developments related to bitcoin or license a substitute technology or brand name, as applicable,the Bitcoin blockchain;
•quarterly variations in our business, results of operations or those of our competitors;
•announcements about our earnings that are not in line with analyst expectations, the likelihood of which may be enhanced because it is our policy not to give guidance relating to our anticipated financial condition,performance in future periods;
•announcements by us or cash flows could be materially adversely affected.our competitors of acquisitions, dispositions, new offerings, significant contracts, commercial relationships, or capital commitments;
•our ability to develop, market, and deliver new and enhanced offerings on a timely basis;
•commencement of, or our involvement in, litigation;
•recommendations by securities analysts or changes in earnings estimates and our ability to meet those estimates;
•investor perception of our Company, including as compared to investment vehicles that are designed to track the price of bitcoin, such as spot bitcoin ETPs;
•announcements by our competitors of their earnings that are not in line with analyst expectations;
•the volume of shares of our class A common stock available for public sale;
•sales or purchases of stock by us or by our stockholders and issuances of awards under our equity incentive plan; and
•general economic conditions and slow or negative growth of related markets, including as a result of war, terrorism, infectious diseases (such as COVID-19), natural disasters and other global events, and government responses to such events.
In addition, the stock market and the markets for both bitcoin-influenced and technology companies have experienced extreme price and volume fluctuations that have often been unrelated or disproportionate to the operating performance of companies in those markets. These market and industry factors may seriously harm the market price of our class A common stock, regardless of our actual operating performance.
Because of the rights of our two classes of common stock and because we are controlled by Michael J. Saylor, who beneficially owns the majority of our class B common stock, Mr. Saylor could transfer control of MicroStrategy to a third party without the approval of our Board of Directors or our other stockholders, prevent a third party from acquiring us, or limit yourthe ability of our other stockholders to influence corporate matters
We have two classes of common stock: class A common stock and class B common stock. Holders of our class A common stock generally have the same rights as holders of our class B common stock, except that holders of class A common stock have one vote per share while holders of class B common stock have ten votes per share. As of January 26, 2018, holders of our class B common stock owned 2,035,184February 1, 2024, there are 1,964,025 shares of class B common stock or 68.4%outstanding, which accounts for approximately 56.7% of the total voting power.power of our outstanding common stock. As of January 26, 2018,February 1, 2024, Mr. Saylor, our Chairman of the Board of Directors President & Chiefand Executive Officer,Chairman, beneficially owned 2,011,6681,961,668 shares of class B common stock, or 67.6%56.6% of the total voting power. Accordingly, Mr. Saylor can control MicroStrategy through his ability to determine the outcome of elections of our directors, amend our certificate of incorporation and by-laws, and take other actions requiring the vote or consent of stockholders, including mergers, going-private transactions, and other extraordinary transactions and their terms.
Our certificate of incorporation allows holders of class B common stock to transfer shares of class B common stock, subject to the approval of stockholders holding a majority of the outstanding class B common stock. Mr. Saylor or a group of stockholders holding a majority of the outstanding class B common stock could, without the approval of our Board of Directors or our other stockholders, transfer voting control of MicroStrategy to a third party. Such a transfer of control could have a material adverse effect on our business, operating results, and financial condition. Mr. Saylor or a group of stockholders holding a majority of the outstanding class B common stock could also prevent a change of control of MicroStrategy, regardless of whether holders of class A common stock might otherwise receive a premium for their shares over the then current market price. In addition, this concentrated control limits stockholders’ ability to influence corporate matters and, as a result, we may take actions that our non-controlling stockholders do not view as beneficial or that conflict with their interests. As a result, the market price of our class A common stock could be materially adversely affected.
Our status as a “controlled company” could make our class A common stock less attractive to some investors or otherwise materially adversely affect our stock price
Because we qualify as a “controlled company” under theNasdaq corporate governance rules, for NASDAQ-listed companies, we are not required to have independent directors comprise a majority of our Board of Directors. Additionally, our Board of Directors is not required to have an independent compensation or nominating committee or to have the independent directors exercise the nominating function. We are also not required to have the compensation of our executive officers be determined by a compensation committee of independent directors. In addition, we are not required to empower our Compensation Committee with the authority to engage the services of any compensation consultants, legal counsel, or other advisors, or to have the Compensation Committee assess the independence of compensation consultants, legal counsel, and other advisors that it engages.
In light of our status as a controlled company, our Board of Directors has determined not to establish an independent nominating committee or have its independent directors exercise the nominating function and has elected instead to have the Board of Directors be directly responsible for nominating members of the Board. A majority of our Board of Directors is currently comprised of independent directors, and our Board of Directors has established a Compensation Committee comprised entirely of independent directors. The Compensation Committee determines the compensation of our Chief Executive Officer.Officer and Executive Chairman. However, our Board of Directors has authorized our Chief Executive Officer to determine the compensation of executive officers other than himself rather than having such compensation determined byand the Compensation Committee,Executive Chairman, except that certain executive officerequity-based compensation that is intended to qualify as performance-based compensation for purposes of Section 162(m) of the Internal Revenue Code is determined by the Compensation Committee pursuantCommittee. Awards made to directors and officers subject to Section 16 of the requirements of Section 162(m). AwardsExchange Act under our 2013 Stock Incentivethe 2023 Equity Plan (as amended, the “2013 Equity Plan”) are also approved by the Compensation Committee. Additionally, while our Compensation Committee is empowered with the authority to retain and terminate outside counsel, compensation consultants, and other experts or consultants, it is not required to assess their independence.
Although currently a majority of our Board of Directors is comprised of independent directors and the Compensation Committee is comprised entirely of independent directors, we may elect in the future not to have independent directors constitute a majority of the Board of Directors or the Compensation Committee, have our Executive Chairman’s and Chief Executive Officer’s compensation determined by a compensation committee of independent directors, or have a compensation committee of the Board of Directors at all.
Accordingly, should the interests of our controlling stockholder differ from those of other stockholders, the other stockholders may not have the same protections that are afforded to stockholders of companies that are required to follow all of the Nasdaq corporate governance rules for NASDAQ-listed companies.rules. Our status as a controlled company could make our class A common stock less attractive to some investors or otherwise materially adversely affect our stock price.
Revenue recognitionFuture sales, or the perception of future sales, of our class A common stock, convertible debt instruments or other convertible securities could depress the price of our class A common stock
We may issue and sell additional shares of class A common stock, convertible notes, or other securities in subsequent offerings to raise capital or issue shares for other purposes, including in connection with the acquisition of additional bitcoin. For example, since January 1, 2023, we have sold $2.029 billion of shares of class A common stock through at-the-market equity offering programs, and we may sell class A common stock having an aggregate offering price of up to an additional $137.8 million from time to time, through Cowen and Company LLC, Canaccord Genuity LLC, and BTIG, LLC, as agents (the “November 2023 Sales Agents”) under the November 2023 Sales Agreement described in Note 13, At-the-Market Equity Offerings, to our Consolidated Financial Statements. We cannot predict:
•the size of future issuances of equity securities;
•the size and terms of future issuances of convertible debt instruments or other convertible securities; or
•the effect, if any, that future issuances and sales of our securities will have on the market price of our class A common stock.
Transactions involving newly issued class A common stock, convertible debt instruments, or other convertible securities could result in possibly substantial dilution to holders of our class A common stock.
Our amended and restated by-laws provide that the Court of Chancery of the State of Delaware (or, if the Court of Chancery of the State of Delaware does not have jurisdiction, then any other state court located in the State of Delaware, or if no state court located within the State of Delaware has jurisdiction, the federal district court for the District of Delaware) is the exclusive forum for certain litigation that may be initiated by our stockholders, which could limit our stockholders’ ability to obtain a favorable judicial forum for such disputes with us or our directors, officers or employees
Our amended and restated by-laws provide that, unless we consent in writing to the selection of an alternative forum, the Court of Chancery of the State of Delaware (or, if the Court of Chancery of the State of Delaware does not have jurisdiction, then any other state court located in the State of Delaware, or if no state court located within the State of Delaware has jurisdiction, the federal district court for the District of Delaware) shall, to the fullest extent permitted by law, be the sole and exclusive forum for (i) any derivative action or proceeding brought on behalf of the Company, (ii) any action asserting a claim of breach of a fiduciary duty owed by any director, officer, other employee or stockholder of the Company to the Company or the Company’s stockholders, (iii) any action asserting a claim arising pursuant to any provision of the General Corporation Law of the State of Delaware or the Company’s certificate of incorporation or by-laws (in each case, as they may be amended from time to time), or (iv) any action asserting a claim governed by the internal affairs doctrine. This exclusive forum provision would not apply to suits brought to enforce a duty or liability created by the Exchange Act, which provides for exclusive jurisdiction of the federal courts. It could apply, however, to a suit that falls within one or more of the categories enumerated in the choice of forum provision and asserts claims under the Securities Act, inasmuch as Section 22 of the Securities Act creates concurrent jurisdiction for federal and state courts over all suits brought to enforce any duty or liability created by the Securities Act or the rules and regulations thereunder. There is uncertainty as to whether a court would enforce such provision with respect to claims under the Securities Act, and our stockholders will not be deemed to have waived our compliance with the federal securities laws and the rules and regulations thereunder.
The choice of forum provision may limit a stockholder’s ability to bring a claim in a judicial forum that it finds favorable for disputes with us or our directors, officers or other employees, which may discourage such lawsuits against us and our directors, officers and other employees. Alternatively, if a court were to find the choice of forum provision contained in our amended and restated by-laws to be inapplicable or unenforceable in an action, we may incur additional costs associated with resolving such action in other jurisdictions.
Risks Related to Our Outstanding and Potential Future Indebtedness
Our level and terms of indebtedness could adversely affect our ability to raise additional capital to further execute on our bitcoin acquisition strategy, fund our enterprise analytics software operations, and take advantage of new business opportunities
As of December 31, 2023, we had $2.210 billion aggregate indebtedness, consisting of $650.0 million aggregate principal amount of 0.750% Convertible Senior Notes due 2025 (the “2025 Convertible Notes”), $1.05 billion aggregate principal amount of 0% Convertible Senior Notes due 2027 (the “2027 Convertible Notes”, and collectively with the 2025 Convertible Notes, the “Convertible Notes”), $500.0 million aggregate principal amount of 6.125% Senior Secured Notes due 2028 (the “2028 Secured Notes”), and $10.3 million of other long-term indebtedness.
Our substantial indebtedness and interest expense could have important consequences to us, including:
•limiting our ability to use a substantial portion of our cash flow from operations in other areas of our business, including for acquisition of additional bitcoin, working capital, research and development, expanding our infrastructure, capital expenditures, and other general business activities and investment opportunities in our company, because we must dedicate a substantial portion of these funds to pay interest on and/or service our debt;
•limiting our ability to obtain additional financing in the future for acquisition of additional bitcoin, working capital, capital expenditures, debt service, acquisitions, execution of our strategy, and other expenses or investments planned by us;
•limiting our flexibility and our ability to capitalize on business opportunities and to react to competitive pressures and adverse changes in government regulation, our business, and our industry;
•increasing our vulnerability to a downturn in our business and to adverse economic and industry conditions generally;
•placing us at a competitive disadvantage as compared to our competitors that are less leveraged; and
•limiting our ability, or increasing the costs, to refinance indebtedness.
We may be unable to service our indebtedness, which could cause us to default on our debt obligations and could force us into bankruptcy or liquidation
Our ability to make scheduled payments on and to refinance our indebtedness depends on and is subject to our financial and operating performance, which is influenced, in part, by general economic, financial, competitive, legislative, regulatory, counterparty business, and other risks that are beyond our control, including the availability of financing in the U.S. banking and capital markets. If our cash flows and capital resources are insufficient to fund our debt service obligations, we may be forced to reduce or delay capital expenditures, sell assets, seek additional capital, or restructure or refinance our indebtedness. We cannot assure you that future borrowings will be available to us in an amount sufficient to enable us to service our indebtedness, to refinance our indebtedness, or to fund our other liquidity needs. Even if refinancing indebtedness is available, any refinancing of our indebtedness could be at higher interest rates and may require us to comply with more onerous covenants that could further restrict our business operations. In addition, our bitcoin acquisition strategy anticipates that we may issue additional debt in future periods to finance additional purchases of bitcoin, but if we are unable to generate sufficient cash flow to service our debt and make necessary capital expenditures, we may be required to sell bitcoin. These alternative measures may not be successful and may not permit us to meet our scheduled debt service obligations or our financial covenants, which could cause us to default on our debt obligations. In addition, any failure to make payments of interest and principal on our outstanding indebtedness on a timely basis would likely result in a reduction of our credit rating, which could harm our ability to incur additional indebtedness.
Upon the occurrence of an event of default under any of MicroStrategy’s indebtedness, the holders of the defaulted indebtedness could elect to declare all the funds borrowed to be due and payable, together with accrued and unpaid interest and, in the case of our 2028 Secured Notes, enforce their security interests on substantially all of MicroStrategy’s assets and the assets of our subsidiary guarantors, but excluding bitcoins that are currently owned by MacroStrategy LLC, a wholly-owned subsidiary of MicroStrategy Incorporated, (“MacroStrategy”), or acquired by MacroStrategy in future periods in transactions permitted by the terms of the 2028 Secured Notes. Any of these events could in turn result in cross-defaults under our other indebtedness. We may not have sufficient funds available to pay the amounts due upon any such default, particularly in the event that there has been a decrease in the market value of our bitcoin holdings, and we may not be able to raise additional funds to pay such amounts on a timely basis, on terms we find acceptable, or at all. Any financing that we may undertake under such circumstances could result in substantial dilution of our existing stockholders, and in the absence of being able to obtain such financing, we could be forced into bankruptcy or liquidation.
The indenture governing our 2028 Secured Notes imposes significant operating and financial restrictions on us and certain subsidiaries of ours, which may prevent us from capitalizing on business opportunities
The indenture governing our 2028 Secured Notes imposes significant operating and financial restrictions on us and certain designated Restricted Subsidiaries (as defined in the indenture for the 2028 Secured Notes). These restrictions limit our ability, and the ability of such restricted subsidiaries, to, among other things:
•incur or guarantee additional debt or issue disqualified stock or certain preferred stock;
•pay dividends, redeem stock, or make certain other distributions;
•make certain investments;
•create restrictions on the ability of our Restricted Subsidiaries to pay dividends to us or make other intercompany transfers;
•transfer or sell assets;
•merge or consolidate; and
•enter into certain transactions with affiliates.
As a result of these restrictions, we are limited as to how we conduct our business and we may be unable to raise additional indebtedness or conduct equity financing to compete effectively or to take advantage of new business opportunities. The terms of any future indebtedness we may incur could include more restrictive covenants. We cannot assure you that we will be able to maintain compliance with these covenants in the future and, if we fail to do so, that we will be able to obtain waivers from the lenders or amend the covenants.
Our failure to comply with the restrictive covenants described above, as well as other terms of our indebtedness or the terms of any future indebtedness from time to time could result in an event of default, which, if not cured or waived, could result in our being required to repay these borrowings before their due date, the liquidation of our assets serving as collateral and/or potential insolvency proceedings. If we are forced to refinance these borrowings on less favorable terms or if we cannot refinance these borrowings, our results of operations and financial condition could be adversely affected.
We may be required to repay the 2028 Secured Notes prior to their stated maturity date, if the springing maturity feature is triggered
The 2028 Secured Notes have a stated maturity date of June 15, 2028, but include a springing maturity feature that will cause the stated maturity date to spring ahead to the date that is (i) 91 days prior to the existing maturity date of the 2025 Convertible Notes (which is September 15, 2025), (ii) 91 days prior to the existing maturity date of the 2027 Convertible Notes (which is November 16, 2026), or (iii) the maturity date of any future convertible debt that we may issue that is then outstanding, unless on such dates we meet specified liquidity requirements or less than $100,000,000 of aggregate principal amount of the 2025 Convertible Notes, the 2027 Convertible Notes, or such future convertible debt, as applicable, remains outstanding. If such springing maturity feature is triggered, we will be required to pay all amounts outstanding under the 2028 Secured Notes sooner than they would otherwise be due, we may not have sufficient funds available to pay such amounts at that time, and we may not be able to raise additional funds to pay such amounts on a timely basis, on terms we find acceptable, or at all.
We may not be able to finance required repurchases of the 2028 Secured Notes or the Convertible Notes upon a change of control or a fundamental change
Upon a change of control or a fundamental change as defined in the indentures governing the 2028 Secured Notes and the Convertible Notes, the holders of such notes will have the right to require us to offer to purchase all of the applicable notes then outstanding at a price equal to 101% of the principal amount of the 2028 Secured Notes and 100% of the principal amount of the Convertible Notes, respectively, plus, in each case, accrued and unpaid interest, if any, to, but excluding, the repurchase date. In order to obtain sufficient funds to pay the purchase price of such notes, we expect that we would have to refinance the notes and we may not be able to refinance the notes on reasonable terms, if at all. Our failure to offer to purchase all applicable notes or to purchase all validly tendered notes would be an event of default under the indentures governing the 2028 Secured Notes and the Convertible Notes.
If a change of control or a fundamental change occurs, we may not have enough assets to satisfy all obligations under the indentures governing the 2028 Secured Notes and the Convertible Notes. Upon the occurrence of a change of control or a fundamental change we could seek to refinance the indebtedness under the 2028 Secured Notes or the Convertible Notes or obtain a waiver from the applicable note holders. However, we may not be able to obtain a waiver or refinance the applicable notes on commercially reasonable terms, if at all. Moreover, the exercise by holders of the 2028 Secured Notes or the Convertible Notes of their right to require us to repurchase such notes could cause a default under future debt agreements, even if the change of control or fundamental change itself does not, due to the financial effect of such repurchase on us.
We may not have the ability to raise the funds necessary to settle for cash conversions of the Convertible Notes
Upon conversion of the 2025 Convertible Notes or the 2027 Convertible Notes, unless we elect (or have previously irrevocably elected) to deliver solely shares of our class A common stock to settle the conversion of such Convertible Notes (other than paying cash in lieu of delivering any fractional share), we will be required to make cash payments in respect of the applicable Convertible Notes being converted as described in the applicable indenture. However, we may not have enough available cash or be able to obtain financing at the time we are required to pay cash with respect to such notes being converted. In addition, our ability to pay cash upon conversions of the Convertible Notes may be limited by law, regulatory authority, the covenants contained in the indenture governing the 2028 Secured Notes, or agreements governing any future indebtedness. Our failure to pay any cash payable on future conversions of the Convertible Notes as required by the respective indentures would constitute a default under the indenture for that series of Convertible Notes and could also lead to a default under the indenture for the other series of Convertible Notes or the 2028 Secured Notes. A default under any indenture could also lead to a default under agreements governing any future indebtedness. If the repayment of the related indebtedness were to be accelerated after any applicable notice or grace periods, we may not have sufficient funds to repay the indebtedness.
The conditional conversion feature of the Convertible Notes, if triggered, may adversely affect our financial condition and operating results
In the event the conditional conversion feature of either the 2025 Convertible Notes or the 2027 Convertible Notes is triggered, holders of the applicable Convertible Notes will be entitled to convert such notes at any time during specified periods at their option. If one or more holders elect to convert their Convertible Notes, unless we elect to satisfy our conversion obligation by delivering solely shares of our class A common stock (other than paying cash in lieu of delivering any fractional share), we would be required to settle a portion or all of our conversion obligation through the payment of cash, which could adversely affect our liquidity. In addition, even if holders do not elect to convert their Convertible Notes, we could be required under applicable accounting pronouncementsrules to reclassify all or a portion of the outstanding principal of the applicable Convertible Notes as a current rather than long-term liability, which would result in a material reduction of our net working capital.
We rely on the receipt of funds from our subsidiaries in order to meet our cash needs and service our indebtedness, including the 2028 Secured Notes, the Convertible Notes, and our other long-term indebtedness, and certain of our subsidiaries holding digital assets may not provide any dividends, distributions, or other payments to us to fund our obligations and meet our cash needs
We depend on dividends, distributions, and other payments from our subsidiaries to fund our obligations, including those arising under the 2028 Secured Notes, the Convertible Notes, and our other long-term indebtedness, and meet our cash needs. The operating results of our subsidiaries at any given time may not be sufficient to make dividends, distributions, or other payments to us in order to allow us to make payments on the 2028 Secured Notes, the Convertible Notes, and our other long-term indebtedness. Our wholly-owned subsidiary, MacroStrategy, which holds the bitcoin that we owned prior to the issuance of the 2028 Secured Notes, the bitcoin that MacroStrategy acquired using the proceeds from the 2025 Secured Term Loan, and the bitcoin that MacroStrategy acquired from the proceeds of the sale of our class A shares pursuant to the sales agreements with various sales agents, is not obligated to provide and may in the future be prohibited from providing any dividends, distributions, or other payments to us to fund our obligations and meet our cash needs under such indebtedness. MacroStrategy holds approximately 173,069 bitcoins that, as of December 31, 2023, had a carrying value of $3.363 billion on our Consolidated Balance Sheet, representing 70.6% of our consolidated total assets at such date. In addition, dividends, distributions, or other payments, as well as other transfers of assets, between our subsidiaries and from our subsidiaries to us may be subject to legal, regulatory, or contractual restrictions, which may materially adversely affect our reportedability to transfer cash within our consolidated companies and our ability to meet our cash needs and service our indebtedness.
Despite our current level of indebtedness, we may be able to incur substantially more indebtedness and enter into other transactions in the future which could further exacerbate the risks related to our indebtedness
Although the indenture governing our 2028 Secured Notes contains, and future debt instruments may contain, restrictions on the incurrence of additional indebtedness and entering into certain types of other transactions, these restrictions are subject to a number of qualifications and exceptions and we may be able to incur significant additional indebtedness in the future. For example, these restrictions do not prevent us from incurring obligations, such as certain trade payables and operating leases, which do not constitute indebtedness as defined under our debt instruments. To the extent we incur additional indebtedness or other obligations, the risks described herein with respect to our indebtedness may increase significantly.
None.
Item 1C. Cybersecurity
As part of our cybersecurity risk management framework, we have implemented comprehensive Corporate Incident Response Plans (IRPs) and other policies and procedures designed to ensure the assessment, identification, and management of material risks from cybersecurity threats, and to facilitate timely disclosure of material cybersecurity incidents in accordance with SEC rules. Our policies provide for cybersecurity awareness training for employees and engagement in due diligence processes in accordance with industry best practices for third-party vendors, including those handling critical services or sensitive data on our behalf. Our policies also provide for regular, senior management-led table-top exercises simulating cyberattack scenarios to ensure preparedness and response agility. We undertake an annual review of our policies to help ensure their effectiveness and relevance in light of evolving cybersecurity threats. Additionally, we maintain cyber insurance to help cover costs associated with the occurrence of certain cybersecurity events. We do not currently engage any other third parties as part of our cybersecurity risk management framework, but we do use third party services and products in the ordinary course with respect to certain common cybersecurity threats.
Our IRPs, which are tailored to address potential cybersecurity threats in both our product and corporate infrastructure technology environments, are designed to provide a comprehensive, structured response to cybersecurity incidents, and apply to all MicroStrategy personnel, including employees, directors, temporary staff, and contractors. In accordance with our IRPs, we train our personnel to
report any cybersecurity incidents to our Information Security Team (IST). Upon identification of a cybersecurity incident, the IRPs mandate that the IST conduct an immediate evaluation and assign a severity rating to the incident and, depending on the severity, report the incident to our Chief Information Security Officer (CISO). Based on the severity of the incident, a Security Incident Response Team (SIRT), the members of which include our Chief Information Officer (CIO), the CISO, and personnel from various departments, including legal, is convened. The SIRT, with assistance from the IST, is tasked with executing a timely and effective response to the incident, and SIRT members are assigned specific roles and responsibilities, including assessment of the incident's materiality for disclosure purposes.
Our CIO and CISO oversee our cybersecurity preparedness. Our CIO has over 25 years of experience in the technology sector, including specifically in the cybersecurity industry, and held various leadership positions prior to joining MicroStrategy in 2018. Our CISO, who joined MicroStrategy as CISO in 2021, has over 20 years of experience with cybersecurity and privacy, and has experience with IT infrastructure technologies, including cloud, network, server, endpoint, and mobile technologies. Our CISO holds a master’s degree in computer science and multiple industry-recognized cybersecurity certifications. The IST operates under our CISO’s leadership, who in turn reports to our CIO.
We administer our cybersecurity risk management framework separately from our other risk management systems and processes, under the direct oversight of our board of directors and senior management. MicroStrategy's management, including our CIO and CISO, provides the board of directors with regular updates on cybersecurity incidents and emerging threats. The board actively engages with management on the development and implementation of cybersecurity policies and practices, offering insights and guidance. Board members with significant experience in software technology, such as Michael J. Saylor and Leslie J. Rechan, each with over 30 years of software industry experience, and Phong Le, our Chief Executive Officer, contribute their expertise to our cybersecurity risk management.
Unauthorized parties have attempted, and we expect that they will continue to attempt, to gain access to our systems and facilities, as well as those of our third-party vendors, through various means, such as hacking, social engineering, phishing, and fraud. However, such incidents have not materially affected, nor are they reasonably likely to materially affect, our business strategy, results of operations, or financial condition. See “Item 1A. Risk Factors – Risks Related to Our Bitcoin Acquisition Strategy and Holdings – If we or our third-party service providers experience a security breach or cyberattack and unauthorized parties obtain access to our bitcoin, or if our private keys are lost or destroyed, or other similar circumstances or events occur, we may lose some or all of our bitcoin and our financial condition and results of operations could be materially adversely affected” and “Item 1A. Risk Factors – Risks Related to Our Operations – If we or our third-party service providers experience a disruption due to a cybersecurity attack or security breach and unauthorized parties obtain access to our customers’, prospects’, vendors’, or channel partners’ data, our data, our networks or other systems, or the cloud environments we manage, our offerings may be perceived as not being secure, our reputation may be harmed, demand for our offerings may be reduced, our operations may be disrupted, we may incur significant legal and financial liabilities, and our business could be materially adversely affected.”
We continuously review our compliance with all new and existing revenue recognition accounting pronouncements. In May 2014, the Financial Accounting Standards Board issued Accounting Standards Update No. 2014-09, Revenue from Contracts with Customers (Topic 606) (“ASU 2014-09”), which supersedes nearly all existing revenue recognition guidance. We will adopt this guidance and its subsequent amendments effective as of January 1, 2018 and will adjust prior period consolidated financial statements to reflect full retrospective adoption, beginning with our Quarterly Report on Form 10-Q for the first quarter of 2018. We currently estimate that the adoption of this guidance will result in earlier recognition of revenue from term license sales and sales to channel partners and will result in the capitalization of certain variable costs (such as sales commissions) that we had previously expensed as incurred. See Note 3, Recent Accounting Standards, to the Consolidated Financial Statements for further information regarding ASU 2014-09. Item 2. Properties
Item 1B.
| Unresolved Staff Comments
|
None.
As of December 31, 2017,2023, we leased approximately 214,000190,000 square feet of office space at a location in Northern Virginia that began servingserves as our corporate headquarters in October 2010headquarters. This lease provides for certain tenant allowances and was toincentives and will expire in December 2020.2030. In December 2020, we exercised an option to early terminate approximately 24,000 square feet of space at our corporate headquarters at the beginning of January 2018, we amended the lease to extend the lease term through December 2030. See Note 17, Subsequent Events, to the Consolidated Financial Statements for further information. 2022.
In addition, we leaseutilize offices in U.S. and foreign locations for our services and support, sales and marketing, research and development, and administrative personnel. As of December 31, 2017,2023, we leasedutilized approximately 28,00023,000 square feet of office and other space in the United States, in addition to our corporate headquarters, and approximately 181,00097,000 square feet of office space in various foreign locations.
Item 3. Legal Proceedings
In December 2011, DataTern, Inc. (“DataTern”) filed a complaint for patent infringement against the Company in the United States District Court for the District of Massachusetts (the “District Court”). The complaint alleged that the Company infringes U.S. Patent No. 6,101,502 (the “’502 Patent”), allegedly owned by DataTern, by making, selling, or offering for sale several of the Company’s products and services, including MicroStrategy 9™, MicroStrategy Intelligence Server™, MicroStrategy Business Intelligence Platform™, MicroStrategy Cloud Personal, and other MicroStrategy applications for creating or using data mining, dashboards, business analytics, data storage and warehousing, and web hosting support. The complaint accused the Company of willful infringement and sought an unspecified amount of damages, an award of attorneys’ fees, and preliminary and permanent injunctive relief. In light of a judgment in a separate action involving DataTern in another jurisdiction, in February 2013, MicroStrategy and DataTern filed motions for summary judgment of non-infringement and the District Court entered summary judgment against DataTern. In March 2013, DataTern filed a notice of appeal with
the United States Court of Appeals for the Federal Circuit (the “Federal Circuit”). In December 2014, the Federal Circuit issued an opinion vacating the District Court’s summary judgment, stating that the claim construction on which the summary judgment was based was incorrect. In January 2015, the case was remanded to the District Court for further proceedings. A claim construction ruling was issued in February 2017. In August 2017, counsel for DataTern filed a motion to withdraw from the lawsuit. The District Court initially gave DataTern a deadline of September 18, 2017 to find replacement counsel, which was later extended to October 20, 2017. On October 20, 2017, the District Court dismissed the case for failure to prosecute when DataTern failed to identify substitute counsel. We have received indemnification requests from certain of our channel partners and customers who were sued by DataTern in the District Court in lawsuits alleging infringement of the ‘502 Patent. The proceedings against these channel partners and customers were stayed pending the resolution of DataTern’s lawsuit against the Company. On October 30, 2017, the District Court dismissed with prejudice these channel partner and customer proceedings.
We are also involved in various other legal proceedings arising in the normal course of business.business, including the matter referred to below. Although the outcomes of these other legal proceedings are inherently difficult to predict, we do not expect the resolution of these other legal proceedings to have a material adverse effect on our financial position, results of operations, or cash flows.
The information required by this Item is provided under the subheading “False Claims Act Matter” in section (b) of Note 9, Commitments and Contingencies to our Consolidated Financial Statements and incorporated herein by reference.
Item 4. Mine Safety Disclosures
Item 4.
| Mine Safety Disclosures
|
Not applicable.
PART II
PART II
Item 5. Market for Registrant’s Common Equity, Related Stockholder Matters and Issuer Purchases of Equity Securities
Item 5.
| Market for Registrant’s Common Equity, Related Stockholder Matters and Issuer Purchases of Equity Securities
|
Our class A common stock is traded on the NASDAQNasdaq Global Select Market under the symbol “MSTR.” The following table sets forth the high and low sales prices for the class A common stock for the periods indicated as reported by the NASDAQ Global Select Market:
| | High | | | Low | |
Year ended December 31, 2017 | | | | | | | | |
First Quarter | | $ | 205.96 | | | $ | 182.22 | |
Second Quarter | | | 194.58 | | | | 177.50 | |
Third Quarter | | | 196.35 | | | | 122.91 | |
Fourth Quarter | | | 143.37 | | | | 128.00 | |
Year ended December 31, 2016 | | | | | | | | |
First Quarter | | $ | 182.30 | | | $ | 141.01 | |
Second Quarter | | | 195.99 | | | | 165.02 | |
Third Quarter | | | 191.76 | | | | 161.90 | |
Fourth Quarter | | | 207.28 | | | | 162.72 | |
There is no established public trading market for our class B common stock. As of January 26, 2018,February 1, 2024, there were approximately 1,426958 stockholders of record of our class A common stock and threetwo stockholders of record of our class B common stock.
Holders of our class A common stock generally have the same rights as holders of our class B common stock, except that holders of class A common stock have one vote per share while holders of class B common stock have ten votes per share.
We have never declared or paid any cash dividends on either our class A or class B common stock and have no current plans to declare or pay any such dividends.
Information regarding our equity compensation plans and the securities authorized for issuance thereunder is incorporated herein by reference into “Part III. Item 12. Security Ownership of Certain Beneficial Owners and Management and Related Stockholder Matters.”
The following table provides information about our repurchases of equity securities that are registered by us pursuant to Section 12 of the Exchange Act during the periods indicated:
| | | (a) | | | (b) | | | (c) | | | (d) | | |
Period | | | Total Number of Shares (or Units) Purchased | | | Average Price Paid per Share (or Unit) (1) | | | Total Number of Shares (or Units) Purchased as Part of Publicly Announced Plans or Programs (1) | | | Maximum Number (or Approximate Dollar Value) of Shares (or Units) that May Yet Be Purchased Under the Plans or Programs (1) | | |
October 1, 2017 – October 31, 2017 | | | 0 | | | N/A | | | 0 | | | $ | 454,708,615 | | |
November 1, 2017 – November 30, 2017 | | | 0 | | | N/A | | | 0 | | | $ | 454,708,615 | | |
December 1, 2017 – December 31, 2017 | | | 0 | | | N/A | | | 0 | | | $ | 454,708,615 | | |
Total: | | | 0 | | | N/A | | | 0 | | | $ | 454,708,615 | | |
(1)
| On July 28, 2005, we announced that the Board of Directors authorized us to repurchase up to an aggregate of $300.0 million of our class A common stock from time to time on the open market (the “2005 Share Repurchase Program”). On April 29, 2008, the Board of Directors amended the 2005 Share Repurchase Program to increase the amount of class A common stock that we are authorized to repurchase from $300.0 million to $800.0 million and extended the term of the 2005 Share Repurchase Program to April 29, 2013. On
|
| April 25, 2013, the Board of Directors extended the term of the 2005 Share Repurchase Program through April 29, 2018, although the program may be suspended or discontinued by us at any time. The timing and amount of any shares repurchased will be determined by management based on its evaluation of market conditions and other factors. The 2005 Share Repurchase Program may be funded using our working capital, as well as proceeds from any other funding arrangements that we may enter into in the future. As of December 31, 2017, pursuant to the 2005 Share Repurchase Program, we had repurchased an aggregate of 3,826,947 shares of our class A common stock at an average price per share of $90.23 and an aggregate cost of $345.3 million. As of December 31, 2017, $454.7 million of our class A common stock remained available for repurchase pursuant to the 2005 Share Repurchase Program. The average price per share and aggregate cost amounts disclosed above include broker commissions.
|
Performance Graph
The following graph compares the cumulative total stockholder return on our class A common stock from December 31, 20122018 (the last trading day before the beginning of our fifth preceding fiscal year) to December 29, 20172023 (the last trading day of the fiscal year ended December 31, 2017)2023) with the cumulative total return of (i) the Total Return Index for The NASDAQNasdaq Stock Market (U.S. Companies) (the “NASDAQ“Nasdaq Composite Index”) and (ii) the NASDAQNasdaq Computer Index. The graph assumes the investment of $100.00 on December 31, 20122018 in our class A common stock, the NASDAQNasdaq Composite Index, and the NASDAQNasdaq Computer Index, and assumes that any dividends are reinvested. Measurement points are December 31, 2012,2018, December 31, 2013,2019, December 31, 2014,2020, December 31, 2015,2021, December 30, 2016,2022, and December 29, 2017.2023.
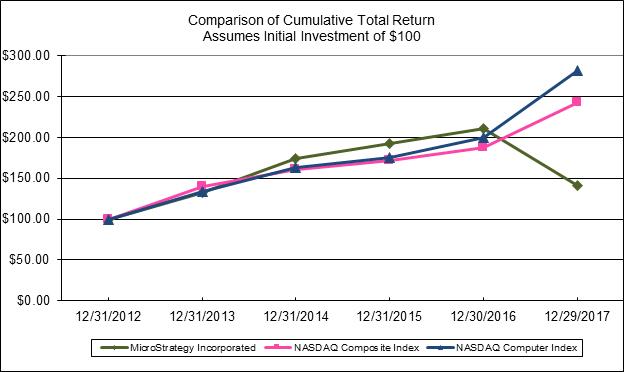

| | | | | | | | | | | | | | | | | | | | | | | | |
| | 12/31/2018 | | | 12/31/2019 | | | 12/31/2020 | | | 12/31/2021 | | | 12/30/2022 | | | 12/29/2023 | |
MicroStrategy Incorporated | | $ | 100.00 | | | $ | 111.63 | | | $ | 304.07 | | | $ | 426.05 | | | $ | 110.76 | | | $ | 494.10 | |
Nasdaq Composite Index | | $ | 100.00 | | | $ | 136.69 | | | $ | 198.10 | | | $ | 242.03 | | | $ | 163.28 | | | $ | 236.17 | |
Nasdaq Computer Index | | $ | 100.00 | | | $ | 151.95 | | | $ | 227.90 | | | $ | 314.18 | | | $ | 201.78 | | | $ | 335.90 | |
NOTE: Prepared by Zacks Investment Research, Inc. Used with permission. All rights reserved. Copyright 1980-2024.
NOTE: Index Data: Copyright NASDAQ OMX, Inc. Used with permission. All rights reserved.
Item 6. [Reserved]
| | 12/31/12 | | | 12/31/13 | | | 12/31/14 | | | 12/31/15 | | | 12/30/16 | | | 12/29/17 | |
MicroStrategy Incorporated | | $ | 100.00 | | | $ | 133.05 | | | $ | 173.91 | | | $ | 192.00 | | | $ | 211.39 | | | $ | 140.61 | |
NASDAQ Composite Index | | $ | 100.00 | | | $ | 140.12 | | | $ | 160.78 | | | $ | 171.97 | | | $ | 187.22 | | | $ | 242.71 | |
NASDAQ Computer Index | | $ | 100.00 | | | $ | 134.07 | | | $ | 163.15 | | | $ | 175.66 | | | $ | 200.32 | | | $ | 281.21 | |
46
Item 6. | Selected Financial Data
|
The following selected consolidated financial data should be read in conjunction with “Item 7. Management’s Discussion and Analysis of Financial Condition and Results of Operations” the Consolidated Financial Statements
Forward-Looking Information
The following discussion and analysis provides information which our management believes is relevant to an assessment and understanding of our financial condition and results of operations. This discussion and analysis should be read together with our consolidated financial statements and related notes thereto, and other financial information appearingthat are included elsewhere in this Annual Report on Form 10-K.
We previously operated Angel.com, a provider In addition to historical financial information, this discussion and analysis contains forward-looking statements that are based upon our current expectations, beliefs, estimates and projections, and various assumptions, many of cloud-based Customer Experience Management solutions for Interactive Voice Responsewhich, by their nature, are inherently uncertain and contact centers. In 2013, we completedbeyond our control. See the salesection of our equity interest in Angel.com and have classified the gain on sale and preceding operations of the Angel.com business as discontinued operations in the following selected consolidated financial data.
| | Years Ended December 31, | |
| | 2017 | | | 2016 | | | 2015 | | | 2014 | | | 2013 | |
| | (in thousands, except per share data) | |
Statements of Operations Data | | | | | | | | | | | | | | | | | | | | |
Total revenues | | $ | 504,543 | | | $ | 512,161 | | | $ | 529,869 | | | $ | 579,830 | | | $ | 575,888 | |
Income from continuing operations, net of tax | | $ | 17,643 | | | $ | 90,908 | | | $ | 105,931 | | | $ | 5,035 | | | $ | 26,550 | |
Discontinued operations, net of tax | | $ | 0 | | | $ | 0 | | | $ | 0 | | | $ | 0 | | | $ | 56,782 | |
Net income | | $ | 17,643 | | | $ | 90,908 | | | $ | 105,931 | | | $ | 5,035 | | | $ | 83,332 | |
Earnings per share (1)(2): | | | | | | | | | | | | | | | | | | | | |
Basic, from continuing operations | | $ | 1.54 | | | $ | 7.96 | | | $ | 9.33 | | | $ | 0.45 | | | $ | 2.35 | |
Basic, from discontinued operations | | 0.00 | | | 0.00 | | | 0.00 | | | | 0.00 | | | | 5.02 | |
Basic earnings per share | | $ | 1.54 | | | $ | 7.96 | | | $ | 9.33 | | | $ | 0.45 | | | $ | 7.37 | |
Diluted, from continuing operations | | $ | 1.53 | | | $ | 7.89 | | | $ | 9.18 | | | $ | 0.44 | | | $ | 2.35 | |
Diluted, from discontinued operations | | 0.00 | | | 0.00 | | | 0.00 | | | | 0.00 | | | | 5.02 | |
Diluted earnings per share | | $ | 1.53 | | | $ | 7.89 | | | $ | 9.18 | | | $ | 0.44 | | | $ | 7.37 | |
| | As of December 31, | |
| | 2017 | | | 2016 | | | 2015 | | | 2014 | | | 2013 | |
| | (in thousands) | |
Balance Sheet Data | | | | | | | | | | | | | | | | | | | | |
Total assets, excluding held-for-sale | | $ | 835,728 | | | $ | 768,319 | | | $ | 656,894 | | | $ | 558,797 | | | $ | 585,514 | |
Long-term liabilities, excluding deferred revenue, advance payments, and held-for-sale | | $ | 50,150 | | | $ | 16,741 | | | $ | 19,960 | | | $ | 26,208 | | | $ | 32,699 | |
Total stockholders’ equity | | $ | 590,539 | | | $ | 552,177 | | | $ | 455,281 | | | $ | 324,471 | | | $ | 310,326 | |
(1)
| Basic and fully diluted earnings per share for class A and class B common stock are the same.
|
(2)
| We have never declared or paid any cash dividends on either class A or class B common stock.
|
Item 7.
| Management’s Discussion and Analysis of Financial Condition and Results of Operations
|
Forward-Looking Information
Thisthis Annual Report on Form 10-K containsentitled “Forward Looking Information and Risk Factor Summary.” Actual results and timing of selected events may differ materially from those anticipated in these forward-looking statements within the meaningas a result of Section 21E of the Exchange Act. For this purpose, any statements contained herein that are not statements of historical fact,various factors, including without limitation, certain statements regarding industry prospects and our results of operations or financial position, may be deemed to be forward-looking statements. Without limiting the foregoing, the words “believes,” “anticipates,” “plans,” “expects,” and similar expressions are intended to identify forward-looking statements. The important factors discussedthose set forth under “Part I. Item 1A. Risk Factors,” among others, could cause actualFactors” or elsewhere in this Annual Report on Form 10-K.
Management’s Discussion and Analysis for the Year Ended December 31, 2021
Management’s discussion and analysis of financial condition and results of operations for the year ended December 31, 2021, including comparison of our results for the years ended December 31, 2022 and 2021, is included in Item 7 of our Annual Report on Form 10-K for the year ended December 31, 2022.
Business Overview
MicroStrategy® recently announced that it considers itself the world’s first Bitcoin development company. We are a publicly-traded operating company committed to differ materiallythe continued development of the Bitcoin network through our activities in the financial markets, advocacy and technology innovation. As an operating business, we are able to use cash flows as well as proceeds from those indicated by forward-looking statements made hereinequity and presented elsewhere by management from timedebt financings to time. Such forward-looking statements represent management’s current expectationsaccumulate bitcoin, which serves as our primary treasury reserve asset. We also develop and provide industry-leading AI-powered enterprise analytics software that promotes our vision of Intelligence Everywhere™, and are inherently uncertain. Investors are warnedusing our software development capabilities to develop bitcoin applications. Our software business, which we have operated for over 30 years, is our predominant operational focus, providing cash flows and enabling us to pursue our bitcoin strategy. We believe that actual results may differthe combination of our operating structure, bitcoin strategy and focus on technology innovation differentiates us in the digital assets industry.
Bitcoin Strategy
Our bitcoin strategy includes (i) acquiring bitcoin using cash flows from management’s expectations.operations and proceeds from equity and debt financings, (ii) developing product innovations that leverage Bitcoin blockchain technology, and (iii) periodically engaging in advocacy and educational activities regarding the continued acceptance and value of bitcoin as an open, secure protocol for an internet-native digital asset and the Lightning Network.
OverviewEnterprise Analytics Software Strategy
MicroStrategy is a leading worldwide provider ofpioneer in AI-powered business intelligence (BI), and a global leader in enterprise analytics solutions. We provide software and mobility software.services designed to turn complex, chaotic data environments into rich, reliable, and convenient information feeds for our customers. Our missionvision is to provide enterprisemake every worker a domain expert by delivering Intelligence Everywhere™.
Our cloud-native flagship, MicroStrategy ONE™, powers some of the largest analytics deployments in the world for customers with a world-class software platform and expert services so they can deploy unique intelligence applications.
MicroStrategy 10, our flagship platform offering, consolidates analytics and mobility in a single unified platform. The MicroStrategy 10 platform is available on Windows, Linux and AWS, and as a hosted service offering through MicroStrategy Cloud. Our platform offers a comprehensive suite of business intelligence functionality, from data discovery to mobile analytics, data mining, Big Data analytics, enterprise reporting and powerful identity intelligence generated by digital credentials. MicroStrategy 10 builds on proven enterprise capabilities to make sophisticated, high-performance analytics more accessible, easier to use, and faster. MicroStrategy 10 consists of MicroStrategy Analytics, MicroStrategy Mobile, and Usher.
MicroStrategy Analytics empowers large organizations to analyze vast amounts of data and securely distribute actionable business insight throughout an enterprise, while also being able to cater to smaller workgroups and departmental use via MicroStrategy Desktop. MicroStrategy Analytics delivers reports and dashboards, and enables users to conduct ad hoc analysis and share insights anywhere, anytime, via mobile devices (via MicroStrategy Mobile) or the web (via MicroStrategy Web). It also combines the agility and productivity of self-service visual data discovery with the security, scalability, and governance features of enterprise-grade business intelligence. Additionally, MicroStrategy Analytics delivers powerful identity intelligence on user behavior and resource utilization (via Usher).
MicroStrategy Web is the primary interface for analysts, data scientists, consumers and developers, offering interactive reporting, dashboarding, and ad-hoc data discovery capabilities through a web browser. With MicroStrategy Web, users can design and deliver reports and dashboards across various styles of business intelligence, including scorecards, pixel-perfect documents and invoices, and interactive reports and dashboards, as well as for visual data discovery. MicroStrategy Web can also connect tospanning a wide range of data sources,industries, including retail, banking, technology, manufacturing, insurance, consulting, healthcare, telecommunications, and be used to build sophisticated advanced analytical models that may be inserted within reports and dashboards. MicroStrategy reports and dashboards can be personalized and automatically delivered to thousands of users with MicroStrategy Server’s advanced distribution capabilities. Web applications can also be extensively customized and embedded into other applications using MicroStrategy Web SDK for a branded experience.the public sector.
MicroStrategy Desktop is a free, standalone, on-premise, single-user tool for fast, powerful, and easy-to-use self-service visual data discovery. It enables business users to analyze and gain valuable insight and understanding into their organizations’ data by quickly creating stunning and useful visualizations, without assistance from the IT department. MicroStrategy Desktop can be readily downloaded and installed on a PC or Mac, making the power of MicroStrategy 10 easily available. MicroStrategy Desktop can be used while offline and while not connected to MicroStrategy Server. MicroStrategy Desktop connects to MicroStrategy Server when needed, allowing for governance workflows that deliver data discovery capabilitiesIntegral to the enterprise at scale.
MicroStrategy Mobile is fully integrated into the MicroStrategy AnalyticsONE platform so it is easy to leverage existing reports and dashboards to instantly deploy mobile business intelligence. In addition, MicroStrategy Mobile extends beyond analytics to enable organizations to rapidly build custom enterprise mobility applicationsare Generative AI capabilities that deliver analytics combined with transactions, multimedia, and mapping to support business workflows. The robust code-free application development platform isare designed to reduce development costsautomate and accelerate the deployment of native mobileAI-enabled applications across our customers’ enterprises. By making advanced analytics accessible through conversational AI, MicroStrategy ONE provides non-technical users with the ability to directly access novel and actionable insights for decision-making.
The analytics market is highly competitive and subject to rapidly changing technology and market conditions. Our ability to compete successfully depends on a number of factors within and outside of our control. Some of these factors include software quality, performance and reliability; the quality of our service and support teams; marketing and prospecting effectiveness, the ability to incorporate artificial intelligence and other technically advanced features; and our ability to differentiate our products.
As we continue to transition our business apps optimizedstrategy and product offerings to a cloud-native model, we are enhancing our go-to-market and sales strategies with the goal of focusing on acquiring new customers, driving revenue growth, increasing margins, and streamlining our operations. As part of this strategic transformation, we have taken and will continue to take measures to reorganize and optimize
efficiency across our business functions, including sales, marketing, consulting, product, engineering, as well as other corporate functions.
Our Bitcoin Acquisition Strategy
Our bitcoin acquisition strategy generally involves acquiring bitcoin with our liquid assets that exceed working capital requirements, and from time to time, subject to market conditions, issuing debt or equity securities or engaging in other capital raising transactions with the objective of using the proceeds to purchase bitcoin. We view our bitcoin holdings as long-term holdings and expect to continue to accumulate bitcoin. We have not set any specific target for both iOSthe amount of bitcoin we seek to hold, and Android. Companies can build fully native iOSwe will continue to monitor market conditions in determining whether to engage in additional financings to purchase additional bitcoin. This overall strategy also contemplates that we may (i) periodically sell bitcoin for general corporate purposes, including to generate cash for treasury management (which may include debt repayment), or in connection with strategies that generate tax benefits in accordance with applicable law, (ii) enter into additional capital raising transactions that are collateralized by our bitcoin holdings, and Android apps(iii) consider pursuing strategies to create income streams or otherwise generate funds using our bitcoin holdings.
Under our Treasury Reserve Policy, our treasury reserve assets consist of:
•Cash Assets held by us that take advantageexceed working capital requirements; and
•bitcoin held by us, with bitcoin serving as the primary treasury reserve asset on an ongoing basis, subject to market conditions and anticipated needs of the unique devicebusiness for Cash Assets.
During 2022 and 2023, we used proceeds from various capital raising transactions to purchase bitcoin. As of December 31, 2023, we held an aggregate of approximately 189,150 bitcoins, with 16,081 bitcoins held directly by MicroStrategy Incorporated and 173,069 bitcoins held by MacroStrategy. As of December 31, 2023, all of the approximately 16,081 bitcoins held directly by MicroStrategy Incorporated, which had a market value of $683.9 million based on the $42,531.41 market price of one bitcoin on the Coinbase exchange at 4:00 p.m. Eastern Time on December 31, 2023, are held in a separate custodial account from those held by MacroStrategy and serve as part of the collateral securing the 2028 Secured Notes. See below for further disclosure surrounding market value calculations of our bitcoin.
The following table presents a roll-forward of our bitcoin holdings, including additional information related to our bitcoin purchases, sales, and digital asset impairment losses within the respective periods:
| | | | | | | | | | | | | | | | | | | | | | |
| | Source of Capital Used to Purchase Bitcoin | | Digital Asset Original Cost Basis
(in thousands) | | | Digital Asset Impairment Losses
(in thousands) | | | Digital Asset Carrying Value
(in thousands) | | | Approximate Number of
Bitcoins Held (Disposed) | | | Approximate Average Purchase or Sale Price Per Bitcoin | |
Balance at December 31, 2021 | | | | $ | 3,751,529 | | | $ | (901,319 | ) | | $ | 2,850,210 | | | | 124,391 | | | $ | 30,159 | |
Digital asset purchases | | (a) | | | 287,921 | | | | | | | 287,921 | | | | 8,813 | | | | 32,670 | |
Digital asset impairment losses | | | | | | | | (1,287,213 | ) | | | (1,287,213 | ) | | | | | | |
Digital asset sales * | | | | | (46,260 | ) | | | 35,370 | | | | (10,890 | ) | | | (704 | ) | | | 16,786 | |
Balance at December 31, 2022 | | | | $ | 3,993,190 | | | $ | (2,153,162 | ) | | $ | 1,840,028 | | | | 132,500 | | | $ | 30,137 | |
Digital asset purchases | | (b) | | | 1,902,299 | | | | | | | 1,902,299 | | | | 56,650 | | | | 33,580 | |
Digital asset impairment losses | | | | | | | | (115,851 | ) | | | (115,851 | ) | | | | | | |
Balance at December 31, 2023 | | | | $ | 5,895,489 | | | $ | (2,269,013 | ) | | $ | 3,626,476 | | | | 189,150 | | | $ | 31,168 | |
* During 2022, we sold approximately 704 bitcoins having an original cost basis of $46.3 million and cumulative digital asset impairment losses of $35.4 million, resulting in a carrying value of $10.9 million at the time of sale. The approximately 704 bitcoins were sold for cash proceeds of $11.8 million, net of fees and expenses, resulting in gains on sale of $0.9 million.
(a)During 2022, we purchased bitcoin using $190.5 million of the net proceeds from the issuance of the 2025 Secured Term Loan, $44.6 million of the net proceeds from our sale of class A common stock under an at-the-market equity offering program, $11.8 million in proceeds from sales of bitcoin, and Excess Cash.
(b)During 2023, we purchased bitcoin using $1.864 billion of the net proceeds from our sale of class A common stock under at-the-market equity offering programs, and Excess Cash.
Excess Cash refers to cash in excess of the minimum Cash Assets that we are required to hold under our Treasury Reserve Policy, which may include cash generated by operating system capabilities (e.g., GPS/location, calendar,activities and camera)cash from the proceeds of financing activities.
The following table shows the approximate number of bitcoins held at the end of each respective period, as well as market value calculations of our bitcoin holdings based on those devices. MicroStrategy Mobile is an easy, fast,the lowest, highest, and cost-effective vehicleending market prices of one bitcoin on the Coinbase exchange (our principal market) for mobilizing an organization’s information systems, including its data warehouses, business intelligence, ERP, CRM,each respective year, as further defined below:
| | | | | | | | | | | | | | | | | | | | | | | | | | | | |
| | Approximate Number of Bitcoins Held at End of Year | | | Lowest Market Price Per Bitcoin During Year (a) | | | Market Value of Bitcoin Held at End of Year Using Lowest Market Price (in thousands) (b) | | | Highest Market Price Per Bitcoin During Year (c) | | | Market Value of Bitcoin Held at End of Year Using Highest Market Price (in thousands) (d) | | | Market Price Per Bitcoin at End of Year (e) | | | Market Value of Bitcoin Held at End of Year Using Ending Market Price (in thousands) (f) | |
December 31, 2021 | | | 124,391 | | | $ | 27,678.00 | | | $ | 3,442,894 | | | $ | 69,000.00 | | | $ | 8,582,979 | | | $ | 45,879.97 | | | $ | 5,707,055 | |
December 31, 2022 | | | 132,500 | | | $ | 15,460.00 | | | $ | 2,048,450 | | | $ | 48,240.00 | | | $ | 6,391,800 | | | $ | 16,556.32 | | | $ | 2,193,712 | |
December 31, 2023 | | | 189,150 | | | $ | 16,490.00 | | | $ | 3,119,084 | | | $ | 45,000.00 | | | $ | 8,511,750 | | | $ | 42,531.41 | | | $ | 8,044,816 | |
(a)The “Lowest Market Price Per Bitcoin During Year” represents the lowest market price for one bitcoin reported on the Coinbase exchange during the respective year, without regard to when we purchased any of our bitcoin.
(b)The “Market Value of Bitcoin Held Using Lowest Market Price” represents a mathematical calculation consisting of the lowest market price for one bitcoin reported on the Coinbase exchange during the respective year multiplied by the number of bitcoins held by us at the end of the applicable year.
(c)The “Highest Market Price Per Bitcoin During Year” represents the highest market price for one bitcoin reported on the Coinbase exchange during the respective year, without regard to when we purchased any of our bitcoin.
(d)The “Market Value of Bitcoin Held Using Highest Market Price” represents a mathematical calculation consisting of the highest market price for one bitcoin reported on the Coinbase exchange during the respective year multiplied by the number of bitcoins held by us at the end of the applicable year.
(e)The “Market Price Per Bitcoin at End of Year” represents the market price of one bitcoin on the Coinbase exchange at 4:00 p.m. Eastern Time on the last day of the respective year.
(f)The “Market Value of Bitcoin Held at End of Year Using Ending Market Price” represents a mathematical calculation consisting of the market price of one bitcoin on the Coinbase exchange at 4:00 p.m. Eastern Time on the last day of the respective year multiplied by the number of bitcoins held by us at the end of the applicable year.
The amounts reported as “Market Value” in the above table represent only a mathematical calculation consisting of the price for one bitcoin reported on the Coinbase exchange (our principal market) in each scenario defined above multiplied by the number of bitcoins held by us at the end of the applicable year. Bitcoin and web applicationsbitcoin markets may be subject to manipulation and the spot price of bitcoin may be subject to fraud and manipulation. Accordingly, the Market Value amounts reported above may not accurately represent fair market value, and the actual fair market value of our bitcoin may be different from such amounts and such deviation may be material. Moreover, (i) the bitcoin market historically has been characterized by significant volatility in price, limited liquidity and trading volumes compared to sovereign currencies markets, relative anonymity, a developing regulatory landscape, potential susceptibility to market abuse and manipulation, compliance and internal control failures at exchanges, and various other risks that are, currently accessible onlyor may be, inherent in its entirely electronic, virtual form and decentralized network and (ii) we may not be able to sell our bitcoins at the Market Value amounts indicated above, at the market price as reported on the desktop. With MicroStrategy Mobile, businesses can transform their entire workforce into a connected and more productive mobile workforce. With mobile access to critical corporate data and systems that drive the business, employees can have a virtual office in their hands at all times. MicroStrategy Mobile also enables companies to deploy customized, white-labeled mobile apps to business partners and customers. These apps can serve as new or enhanced offerings that differentiate an organization’s product or service to business partners or customers.
Usher delivers to its users unique mobile identity badges, each cryptographically linked to its owner’s smartphone and dynamically linked to the enterprise’s existing identity repositories, that are highly secure and convenient for organizations to deploy. Usher badges work on standard smartphones running on iOS or the Android platform and include an Apple Watch integration. Through the use of Bluetooth, QR codes, biometrics, push notifications, time-limited PIN codes, and other authentication methods, Usher badge users can log into applications, VPNs, and workstations, unlock doors and other physical gateways, and validate each other’s identities. Usher badge users are also able to scan barcodes for asset tracking applications. Usher can additionally serve as a powerful enterprise productivity tool with Usher Professional, a dynamic and searchable employee directory that facilitates communication among users, and gives managers insight into the location and activity of their distributed workforce. Usher Professional users can view badge user activity on a nearly real-time map and manage or direct their workforce by engaging in two-way communication with badge users. In the EIoT paradigm, interactions between Usher users and enterprise resources generate real-time telemetry, which can be efficiently harnessed in Usher Analytics, creating actionable intelligence. By delivering strong yet convenient authentication that can be extended to nearly every corporate system, Usher can uncover insights, reduce infrastructure complexity, and secure assets -- all to help businesses flourish in the age of connected devices and connected people. Usher addresses some of the biggest challenges facing corporations today, including authentication, identity and access management, and resource authorization, while applying industry-leading business intelligence and analytics to an enterprise’s infrastructure.
MicroStrategy on AWS allows organizations to harness the power of data through our enterprise solutions via the cloud. Compared to traditional on-premise approaches, MicroStrategy on AWS is architected to deliver best-of-breed MicroStrategy software via the cloud, with pre-configured, ready-to-go servers, coupled with the required supporting infrastructure. With MicroStrategy on AWS, customers can launch enterprise analytics environments within minutes via a web-based provisioning tool, and use the full MicroStrategy 10 offering. MicroStrategy on AWS deploys MicroStrategy directly into the customer’s AWS account where the customer maintains and manages the environment.
For customers looking for a Platform-as-a-Service (PaaS) experience, MicroStrategy Cloud offers managed services that deliver the full breadth of platform capabilities along with a dedicated cloud operations team to deploy the platform in the cloud. MicroStrategy Cloud is well suited for organizations without extensive IT resources to maintain and manage the cloud infrastructure on their own. MicroStrategy Cloud offers a 99.9% Service Level Agreement for availability, and is backed by a team of experts and dedicated tech support staff that provides continuous monitoring and alerting. MicroStrategy Cloud maintains and keeps up to date on compliance and security certifications to help ensure the environments adhere to the Service Organization Control 2, ISO 27001, Payment Card Industry, HIPAA, and Privacy Shield standards.
System integrators, value-added resellers, and OEMs around the world relyCoinbase exchange (our principal market) on the capabilitiesdate of sale, or at all.
Our digital asset impairment losses, net of gains on sale, have significantly contributed to our operating expenses. During 2023, digital asset impairment losses of $115.9 million represented 23.1% of our operating expenses, compared to digital asset impairment losses, net of gains on sale, of $1.286 billion during 2022, representing 76.9% of our operating expenses and contributing to our net loss of $1.470 billion for 2022.
As of February 14, 2024, we held approximately 190,000 bitcoins that were acquired at an aggregate purchase price of $5.933 billion and an average purchase price of approximately $31,224 per bitcoin, inclusive of fees and expenses. As of February 14, 2024, at 4:00 p.m. Eastern Time, the MicroStrategy platform, including its functionality, workflows, report presentation, user management, security, administration, system configuration, and monitoring, to build branded and custom applicationsmarket price of their own. Our platform’s open architecture and APIs make it especially suitable for developing custom functionality or integrating with other applications. Organizations seeking to add analytics features to their own offerings can easily and directly embedone bitcoin reported on the platform into their business applications or portals with white labeling and single sign-on options.Coinbase exchange was $51,744.68.
Operating Highlights
The following table sets forth certain operating highlights (in thousands) for the years ended December 31, 2017, 2016,2023 and 2015:2022:
| | | Years Ended December 31, | | | Years Ended December 31, | |
| | 2017 | | | 2016 | | | 2015 | | | 2023 | | | 2022 | |
Revenues | | | | | | | | | | | | | | | | | |
Product licenses | | $ | 93,969 | | | $ | 113,503 | | | $ | 119,143 | | | $ | 75,351 | | | $ | 86,498 | |
Subscription services | | | 32,368 | | | | 30,574 | | | | 27,839 | | | | 81,179 | | | | 60,746 | |
Total product licenses and subscription services | | | 126,337 | | | | 144,077 | | | | 146,982 | | | | 156,530 | | | | 147,244 | |
Product support | | | 289,174 | | | | 285,079 | | | | 281,740 | | | | 263,888 | | | | 266,521 | |
Other services | | | 89,032 | | | | 83,005 | | | | 101,147 | | | | 75,843 | | | | 85,499 | |
Total revenues | | | 504,543 | | | | 512,161 | | | | 529,869 | | | | 496,261 | | | | 499,264 | |
Cost of revenues | | | | | | | | | | | | | | | | | |
Product licenses | | | 7,176 | | | | 8,573 | | | | 8,118 | | | | 1,929 | | | | 1,672 | |
Subscription services | | | 13,435 | | | | 12,765 | | | | 13,051 | | | | 31,776 | | | | 24,770 | |
Total product licenses and subscription services | | | 20,611 | | | | 21,338 | | | | 21,169 | | | | 33,705 | | | | 26,442 | |
Product support | | | 17,481 | | | | 15,001 | | | | 12,748 | | | | 22,434 | | | | 21,264 | |
Other services | | | 58,557 | | | | 56,808 | | | | 67,191 | | | | 53,805 | | | | 55,283 | |
Total cost of revenues | | | 96,649 | | | | 93,147 | | | | 101,108 | | | | 109,944 | | | | 102,989 | |
Gross profit | | | 407,894 | | | | 419,014 | | | | 428,761 | | | | 386,317 | | | | 396,275 | |
Operating expenses | | | | | | | | | | | | | | | | | |
Sales and marketing | | | 174,612 | | | | 158,740 | | | | 148,522 | | | | 149,671 | | | | 146,882 | |
Research and development | | | 78,766 | | | | 73,142 | | | | 65,206 | | | | 120,530 | | | | 127,428 | |
General and administrative | | | 80,161 | | | | 79,462 | | | | 80,732 | | | | 115,312 | | | | 111,421 | |
Restructuring costs | | | 0 | | | | 45 | | | | 279 | |
Digital asset impairment losses (gains on sale), net | | | | 115,851 | | | | 1,286,286 | |
Total operating expenses | | | 333,539 | | | | 311,389 | | | | 294,739 | | | | 501,364 | | | | 1,672,017 | |
Income from operations | | $ | 74,355 | | | $ | 107,625 | | | $ | 134,022 | |
Loss from operations | | | $ | (115,047 | ) | | $ | (1,275,742 | ) |
The analytics market is highly competitiveWe have incurred and our results of operations depend on our ability to market and sell offerings that provide customers with greater value than those offered by our competitors. Our success depends on the effectiveness with which we can differentiate our products from both large software vendors that provide products across multiple lines of business, including one or more products that directly compete with our products, and other analytics vendors across large, mid-sized, and small opportunities. A key differentiator that we believe distinguishes our offerings is that we offer a single platform with comprehensive analytics that supports both the needs of IT and business users, by delivering easy-to-use data discovery combined with enterprise governance.
Organizations recently have sought, and we expect may continue to seek,incur significant impairment losses on our digital assets, and we have recognized and may continue to standardize their various analytics applications around a single software platform. This trend presents both opportunities and challenges for our business. It offers us the opportunity to increase the size of transactions with new customers and to expand the sizerecognize gains upon sale of our analytics installations with existing customers. Ondigital assets in the other hand, it presents the challenge that we may not be able to penetrate accounts that a competitor has penetrated or infuture, which a competitor is the incumbent analytics provider.
are presented net of any impairment losses within operating expenses. In addition, there is increased market demand for analysis of a wider variety of data sources, including sensor data, social data, web log data, and other data types. These new data sources are driving massive increases in the volume of data that can potentially be analyzed (these large-scale data sets are known as “Big Data”), which in turn is accelerating development of new storage technologies like Hadoop and NoSQL databases. The demand for analytics on Big Data represents an opportunity for us, as it opens up new potential applications and use cases for our technology. It also creates a challenge as we will need to continually enhance our technology to support emerging data sources, deliver faster performance necessary to support analysis of Big Data, and support analysis of a wider variety of data types, such as unstructured, semi-structured, and streaming data.
The market for enterprise mobility apps is rapidly changing, highly competitive, and complex with many competitors and different offerings ranging from fully custom-coded applications to plug-and-play solutions. While organizations vary greatly in their approach to, and pace of adoption of, mobile solutions, they are increasingly accelerating the transition of their businesses onto mobile devices, such as tablets and smartphones. Over the next few years, we expect that organizations will continue to construct their information and systems to take advantage of the efficiencies and cost savings of mobile computing. Ultimately, we expect that the majority of routine business tasks and workflows will become available as mobile-optimized touch-enabled apps.
We have undertaken multiple initiatives to address these opportunities and challenges, including:
introducing Dossier, a new way to consume analytics on MicroStrategy 10 using an interactive book of reports and dashboards that combines relevant analytics into a single place, with a new streamlined interface that goes beyond reports and dashboards and brings key data into a format that users can understand and use to make better, actionable decisions and identify new opportunities (available on MicroStrategy Web and tablets via native apps for both iOS and Android);
releasing MicroStrategy on AWS, which allows customers to spin up their own instance of the full MicroStrategy platform in the cloud, and expanding support for MicroStrategy on AWS in more locations (such as London, Sydney, Frankfurt, Tokyo, Ireland, Ohio, Oregon, and Northern Virginia) and in nine different languages (English, French, Italian, Portuguese, Spanish, Dutch, Japanese, Korean, and Chinese);
improving access to MicroStrategy 10 via easy-to-access trial and evaluation versions of products on our website, including a free 30-day trial to MicroStrategy on AWS that lets prospects experience our enterprise capabilities and allows existing customers to try new features;
making our MicroStrategy Desktop product freely available to new and existing users, which helps to (i) increase public awareness, (ii) increase the adoption of the product into existing accounts by empowering MicroStrategy Web users to seamlessly connect MicroStrategy Desktop to their existing projects, upload and download reports and dashboards from the server, work offline, and try new functionality such as data blending and wrangling, and (iii) generate upsell opportunities for us by seeding the need for bigger enterprise capabilities like pixel-perfect dashboards, automated distribution, governance and security, all of which are available with our platform;
offering new collaboration tools that allow more users to interact and collaborate on analytics content, which can ultimately drive adoption to more users across the enterprise; and
•
| delivering new out-of-the-box connectors that help analysts visualize log files and semi-structured data, such as Solr, Box, One Drive, Elasticsearch and others, introducing greater flexibility to visualize and interact with multi-level or ragged hierarchy reports against MDX (Multidimensional Expressions) sources such as Essbase and MSAS, and delivering enhancements such as dynamic filtering and support for derived attributes and metrics.
|
As part of our efforts to take greater advantage of the opportunities in the market and grow our market share, we expect to increase our sales and marketing expenditures and increase our research and development expenditures as we invest in our technology products and personnel in future periods.
As discussed in Note 11, Share-based Compensation, to the Consolidated Financial Statements, we have outstanding stock options to purchase shares of our class A common stock under our 2013 Equity Plan. Share-based compensation expense (in thousands) from these stock option awards was recognized in the following operating expense line items in our Consolidated Statements of Operations for the periods indicated:
| | Years Ended December 31, | |
| | 2017 | | | 2016 | | | 2015 | |
Sales and marketing | | $ | 2,294 | | | $ | 2,971 | | | $ | 2,842 | |
Research and development | | | 1,650 | | | | 1,000 | | | | 1,112 | |
General and administrative | | | 10,323 | | | | 7,846 | | | | 13,345 | |
Total share-based compensation expense | | $ | 14,267 | | | $ | 11,817 | | | $ | 17,299 | |
As of December 31, 2017, we estimated that approximately $19.8 million of additional share-based compensation expense for options granted under the 2013 Equity Plan will be recognized over a remaining weighted average period of 2.3 years.
We base our internal operating expense forecasts on expected revenue trends and strategic objectives.objectives in our enterprise analytics software business. Many of our expenses, such as office leases and certain personnel costs, are relatively fixed. Accordingly, any decrease in the price of bitcoin during any quarter, any sales by us of our bitcoin at prices above their then current carrying costs or any shortfall in revenue in our software business may cause significant variation in our operating results. We therefore believe that quarter-to-quarter comparisons of our operating results may not be a good indication of our future performance.
Non-GAAPShare-based Compensation Expense
As discussed in Note 11, Share-based Compensation, to the Consolidated Financial Measures
We are providing supplemental financial measures for income from operations that excludesStatements, under our 2013 Stock Incentive Plan (as amended, the impact“2013 Equity Plan”) and 2023 Equity Incentive Plan (the “2023 Equity Plan”, and together with the 2013 Equity Plan, the “Stock Incentive Plans”), we have awarded stock options to purchase shares of our share-basedclass A common stock, restricted stock units, performance stock units, and certain other stock-based awards. Each restricted stock unit and performance stock unit represents a contingent right to receive a share of our class A common stock upon the satisfaction of applicable vesting requirements. We also provide opportunities for eligible employees to purchase shares of our class A common stock under our 2021 Employee Stock Purchase Plan (the “2021 ESPP”). Share-based compensation arrangements and restructuring activities, and for net income and diluted earnings per share that exclude the impactexpense (in thousands) from the Tax Act. These supplemental financial measures are not measurements of financial performance under generally accepted accounting principlesthese awards was recognized in the United States (“GAAP”)following cost of revenues and as a result, these supplemental financial measures may not be comparable to similarly titled measures of other companies. Management uses these non-GAAP financial measures internally to help understand, manage, and evaluate our business performance and to help make operating decisions. We believe that these non-GAAP financial measures are also useful to investors and analystsexpense line items for the periods indicated:
| | | | | | | | |
| | Years Ended December 31, | |
| | 2023 | | | 2022 | |
Cost of subscription services revenues | | $ | 361 | | | $ | 304 | |
Cost of product support revenues | | | 2,156 | | | | 2,039 | |
Cost of consulting revenues | | | 1,940 | | | | 1,754 | |
Cost of education revenues | | | 99 | | | | 177 | |
Sales and marketing | | | 18,022 | | | | 18,274 | |
Research and development | | | 13,549 | | | | 13,896 | |
General and administrative | | | 33,444 | | | | 27,175 | |
Total share-based compensation expense | | $ | 69,571 | | | $ | 63,619 | |
The $6.0 million increase in comparing our performance across reporting periods on a consistent basis because in the case of the supplemental measure for income from continuing operations, it excludes a significant non-cash expense that we believe is not reflective of our general business performance and restructuring charges that we believe are not reflective of ongoing operating results, and in the case of the supplemental measures for net income and diluted earnings per share, they exclude one-time tax charges resulting from the Tax Act. In addition, accounting for share-based compensation arrangements requires significant management judgment and the resulting expense could vary significantly in comparison to other companies. Therefore, we believe the use of these non-GAAP financial measures can also facilitate comparison of our operating results to those of our competitors.
Non-GAAP financial measures are subject to material limitations as they are not in accordance with, or a substitute for, measurements prepared in accordance with GAAP. For example, we expect that share-based compensation expense whichduring 2023, as compared to the prior year, is excluded from our non-GAAP financial measure, will continueprimarily due to be a significant recurring expense over the coming years and is an importantgrant of additional awards under the Stock Incentive Plans as part of the compensation provided to certain employees, officers, and directors. Our non-GAAP financial measures are not meant to be considered in isolation and should be read only in conjunction with our Consolidated Financial Statements, which have been prepared in accordance with GAAP. We rely primarily on such Consolidated Financial Statements to understand, manage, and evaluate our business performance, and use the non-GAAP financial measures only supplementally.
The following is a reconciliationexpansion of our non-GAAP financial measures to their most directly comparable GAAP measures (in thousands, except per share data) forequity award program worldwide and the periods indicated:revaluation of certain liability-classified stock-based awards, partially offset by the forfeiture of certain stock awards and certain awards that became fully vested. As of December 31, 2023, we estimated that an aggregate of approximately $131.7 million of additional share-based compensation expense associated with the Stock Incentive Plans and the 2021 ESPP will be recognized over a remaining weighted average period of 2.3 years.
| | | |
| | Years Ended December 31, | |
| | 2017 | | | 2016 | | | 2015 | |
Reconciliation of non-GAAP income from operations: | | | | | | | | | | | | |
Income from operations | | $ | 74,355 | | | $ | 107,625 | | | $ | 134,022 | |
Share-based compensation expense | | | 14,267 | | | | 11,817 | | | | 17,299 | |
Restructuring costs | | | 0 | | | | 45 | | | | 279 | |
Non-GAAP income from operations | | $ | 88,622 | | | $ | 119,487 | | | $ | 151,600 | |
| | | | | | | | | | | | |
Reconciliation of non-GAAP net income: | | | | | | | | | | | | |
Net income | | $ | 17,643 | | | $ | 90,908 | | | $ | 105,931 | |
Tax charge due to the U.S. corporate tax reform legislation | | | 44,018 | | | | 0 | | | | 0 | |
Non-GAAP net income | | $ | 61,661 | | | $ | 90,908 | | | $ | 105,931 | |
| | | | | | | | | | | | |
Reconciliation of non-GAAP diluted earnings per share: | | | | | | | | | | | | |
Diluted earnings per share | | $ | 1.53 | | | $ | 7.89 | | | $ | 9.18 | |
Impact of tax charge due to the U.S. corporate tax reform legislation (per diluted share) | | | 3.81 | | | | 0.00 | | | | 0.00 | |
Non-GAAP diluted earnings per share | | $ | 5.34 | | | $ | 7.89 | | | $ | 9.18 | |
Critical Accounting PoliciesEstimates
Our discussion and analysis of our financial condition and results of operations are based on our Consolidated Financial Statements, which have been prepared in accordance with GAAP.
The See Note 2, Summary of Significant Accounting Policies, to the Consolidated Financial Statements for a description of our significant accounting policies. As described in Note 2, the preparation of our Consolidated Financial Statements requires us to make estimates and judgments that affect the reported amounts of assets, liabilities, and equity, the disclosure of contingent assets and liabilities at the date of the financial statements, and the reported amounts of revenues and expenses during the reporting period. In particular, estimates relating to revenue recognition have a material impact on our financial statements. Actual results and outcomes could differ from these estimates and assumptions.
Revenue Recognition. Under existingCritical accounting estimates involve a significant level of estimation uncertainty and are estimates that have had or are reasonably likely to have a material impact on our financial condition or results of operations. We consider certain estimates and judgments related to revenue recognition guidance applicable to the financial statements set forth in this Annual Report on Form 10-K, we recognize revenue from sales of software licenses to end users upon:
| 1)
| persuasive evidence of an arrangement, as provided by agreements, contracts, purchase orders or other arrangements, generally executed by both parties;
|
| 2)
| existence of a fixed or determinable fee;
|
| 3)
| delivery of the software; and
|
| 4)
| determination that collection is reasonably assured.
|
When the fees for software upgrades and enhancements, technical support, consulting, and education are bundled with the license fee, they are unbundled for revenue recognition purposes using vendor specific objective evidence (“VSOE”) of fair value of the elements.
Product support or post-contract support (“PCS”) revenue is derived from providing technical software support and software updates and upgrades to customers. PCS revenue is recognized ratably over the term of the contract, which in most cases is one year. Our VSOE for PCS, which includes updates, upgrades, and enhancements, is determined based on the optional stated renewal fee for PCS in the contract, which is the price the customer is required to pay when PCS is renewed. Additionally, the optional stated renewal fee used to establish VSOE for PCS in a software
transaction must be above our minimum substantive VSOE rate for PCS. If a stated renewal rate is considered non-substantive, VSOE of PCS has not been established, and we recognize all revenue under the arrangement ratably over the PCS period. A minimum substantive VSOE rate is determined based on an analysis of historical sales of PCS. For a renewal rate to be non-substantive, we believe it must be significantly lower than our minimum VSOE rate. We consider a 10% variance below our minimum VSOE rate to be significant. It is rarecritical accounting estimates for us, to have an arrangement that includes a renewal rate that is below the minimum VSOE rate.as discussed further below.
Revenue from consulting, education, and subscription services is recognized as the services are performed. Our VSOE for services other than PCS is determined based on an analysis of our historical sales of each element when sold separately from software.Recognition
For new offerings of services other than PCS or service offerings that have not had a sufficient history of sales activity, we initially establish VSOE based on the list price as determined by management with the relevant authority. Each service offering has a single list price in each country where sold.
If VSOE exists for all undelivered elements and there is no such evidence of fair value established for delivered elements, the arrangement fee is first allocated to the elements where evidence of fair value has been established and the residual amount is allocated to the delivered elements. If evidence of fair value for any undelivered element of an arrangement does not exist, all revenue from the arrangement is deferred until such time that evidence of fair value exists for undelivered elements or until all elements of the arrangement are delivered, subject to certain limited exceptions.
If an arrangement includes acceptance criteria, revenue is not recognized until we can objectively demonstrate that the software or service can meet the acceptance criteria or the acceptance period lapses, whichever occurs earlier. If a software license arrangement obligates us to deliver specified future products or upgrades, revenue is recognized when the specified future product or upgrades are delivered or when the obligation to deliver specified future products expires, whichever occurs earlier. If a software license arrangement obligates us to deliver unspecified future products, then revenue is recognized on a subscription basis, ratably over the term of the contract.
License revenue derived from sales to resellers or OEMs who purchase our products for resale is recognized upon sufficient evidence that the products have been sold to the end user, provided all other revenue recognition criteria have been met. Our standard software license and reseller agreements do not include any return rights other than the right to return non-conforming products for repair or replacement under our standard product warranties. During the last three fiscal years, we have not experienced any product returns related to warranty claims.
We generally offer either commercial discounts or referral fees to our channel partners, depending on the nature of services performed. Revenue recognized from transactions with channel partners involved in resale or distribution activities is recorded net of any commercial discounts provided to them. Referral fees paid to channel partners not involved in resale or distribution activities are expensed as cost of revenues and, during the last three fiscal years, were not significant.
Our standard software license agreements do not include any price protection provisions. However, transactions under our General Services Administration Federal Supply Schedule contract must comply with the Price Reductions clause. In addition, certain government agencies have the right to cancel contracts for “convenience.” During the last three fiscal years, there were no material amounts refunded under the Price Reductions clause and there were no material contracts cancelled for convenience.
Amounts collected prior to satisfying our revenue recognition criteria are included in net deferred revenue and advance payments in the accompanying Consolidated Balance Sheets.
Software revenue recognition requires judgment, including determinations about whether collectability is reasonably assured, the fee is fixed and determinable, a software arrangement includes multiple elements, and if so, whether VSOE exists for those elements. Judgment is also required to assess whether future releases of certain software represent new products or upgrades and enhancements to existing products.
We also generate subscription services revenues primarily from our cloud services offerings. Subscription services revenues include subscription fees from customers for access to the full breadth of MicroStrategy Analytics and MicroStrategy Mobile capabilities, database services, and data integration services. Our standard arrangements with customers generally do not provide the customer with the right to take possession of the software supporting the cloud-based application service at any time. As such, these arrangements are considered service contracts and revenue is recognized ratably over the service period of the contract, following completion of the set-up service. Any related set-up service fees are recognized ratably over the longer of the contract period or the estimated average life of the customer relationship.
Our subscription services are generally offered as standalone arrangements or as part of arrangements that include professional services. If deliverables in a multiple-element arrangement have standalone value upon delivery, we account for each such deliverable separately. We have concluded that our subscription services and our professional services each have standalone value. When we enter into multiple-element arrangements that include subscription services and professional services, the total arrangement consideration is allocated to each of the deliverables based on the relative selling price hierarchy. We determine the relative selling price for each deliverable using VSOE of selling price, if available, or our best estimate of selling price (“BESP”), if VSOE is not available. We have determined that third-party evidence of selling price is not a practical alternative due to differences in our services offerings as compared to other companies and the lack of availability of third-party pricing information. For professional services, we have established VSOE because a consistent number of standalone sales of this deliverable have been priced within a reasonably narrow range. For subscription services, we have not established VSOE because, among other factors, the offering is relatively new and our pricing model continues to evolve. Accordingly, we use BESP to determine the relative selling price of our subscription services.
We determine BESP by reviewing historical transactions and by considering the service’s pricing models and objectives that take into account factors such as gross margin, the size and volume of the transactions, perceived pricing sensitivity, and growth strategies. The determination of BESP is made through consultation with, and approval by, our management team, taking into consideration our go-to-market strategy. As our pricing and go-to-market strategies evolve, we may modify our pricing practices in the future, which could result in changes to the determination of VSOE and BESP.
Amounts, upon invoicing, are recorded in accounts receivable and either gross deferred revenue or revenue, depending on whether the applicable revenue recognition criteria have been met.
In May 2014, the Financial Accounting Standards Board (“FASB”) issued Accounting Standards Update No. 2014-09, Revenue from Contracts with Customers (Topic 606) (“ASU 2014-09”), which supersedes nearly all existing revenue recognition guidance under GAAP. The standard’s core principle is that an entity should recognize revenue when it transfers promised goods or services to customers in an amount that reflects the consideration to which the entity expects to be entitled in exchange for those goods or services. ASU 2014-09 defines a five-step process to implement this core principle. In implementing this new principle, it is possible more judgment and estimates may be required within the revenue recognition process than are required under existing revenue recognition guidance. We plan to adopt ASU 2014-09 with full retrospective adoption effective January 1, 2018. See Note 3, Recent2(n), Summary of Significant Accounting Standards,Policies – Revenue Recognition, to the Consolidated Financial Statements for furtherinformation regarding our significant accounting policies over revenue recognition.
Many of our contracts with customers include multiple performance obligations, and we make estimates and judgments to allocate the transaction price to each performance obligation based on an observable or estimated standalone selling price (“SSP”). The SSP is the price, or estimated price, of the software or service when sold on a standalone basis at contract inception. We consider our evaluation of SSP to be a critical accounting estimate.
An observable price of a good or service sold separately provides the best evidence of SSP. However, in many situations, SSP will not be readily observable, but must still be estimated using reasonably available information. We have observable standalone selling prices of our product support, consulting services, and education services, and therefore use historical transaction data on a standalone basis, along with our judgment, to establish SSP ranges for each of these services, as described in Note 2(n). However, SSP is not directly observable for product licenses (product licenses are not sold on a standalone basis and pricing is highly variable) and subscription services (the selling price of subscription services is highly variable), and we use a residual approach to establish SSP for these revenue streams. As such, the establishment of SSP of our product support, consulting services, and education services directly impacts the amount of product licenses and subscription services revenues recognized, and therefore also impacts the overall timing of revenue recognition.
We review and analyze the SSP ranges we have established for product support, consulting services, and education services semi-annually, and these SSP ranges do not change significantly year to year.We also perform analyses on a semi-annual basis using historical pricing data for both product license and subscription services transactions to assess whether the selling price is highly variable in order to support our conclusion that the residual method to estimate SSP of our product licenses and subscription services continues to be a fair allocation of the transaction price.
In the future, SSP for our software and services could be impacted by various factors, including potential changes in our pricing practices, customer demand for our products and services, and various market or economic conditions. However, we consider the risk of significant volatility in our established SSP to be small given our historical transaction experience and internal processes to monitor SSP ranges on an ongoing basis and work with management in the event a trend that could impact the future ranges is detected.
Impact of Foreign Currency Exchange Rate Fluctuations on Results of Operations
We conduct a significant portion of our business in currencies other than the U.S. dollar, the currency in which we report our Consolidated Financial Statements. As currency rates change from quarter over quarter and year over year, our results of operations may be impacted. The table below summarizes the impact (in thousands) of fluctuations in foreign currency exchange rates on certain components of our Consolidated Statements of Operations by showing the increase (decrease) in revenues or expenses, as applicable, from the prior year. The term “international” refers to operations outside of the United States and Canada.
| | | |
| | Years Ended December 31, | |
| | 2017 | | | 2016 | | | 2015 | |
International product licenses revenues | | $ | 1,129 | | | $ | (1,588 | ) | | $ | (8,008 | ) |
International subscription services revenues | | | (120 | ) | | | (325 | ) | | | (408 | ) |
International product support revenues | | | 1,089 | | | | (4,513 | ) | | | (19,606 | ) |
International other services revenues | | | 372 | | | | (1,113 | ) | | | (7,357 | ) |
Cost of product support revenues | | | (41 | ) | | | (327 | ) | | | (543 | ) |
Cost of other services revenues | | | 664 | | | | (950 | ) | | | (6,420 | ) |
Sales and marketing expenses | | | 621 | | | | (2,021 | ) | | | (9,817 | ) |
Research and development expenses | | | (220 | ) | | | (944 | ) | | | (218 | ) |
General and administrative expenses | | | 5 | | | | (1,396 | ) | | | (2,458 | ) |
For example, if there had been no change to foreign currency exchange rates from 2016 to 2017, international product licenses revenues would have been $46.5 million rather than $47.6 million for the year ended December 31, 2017. If there had been no change to foreign currency exchange rates from 2016 to 2017, international product support revenues would have been $113.8 million rather than $114.9 million for the year ended December 31, 2017. If there had been no change to foreign currency exchange rates from 2016 to 2017, sales and marketing expenses would have been $174.0 million rather than $174.6 million for the year ended December 31, 2017.
Results of Operations
Comparison of the years endedYears Ended December 31, 2017, 2016,2023 and 20152022
Revenues
Except as otherwise indicated herein, the term “domestic” refers to operations in the United States and Canada and the term “international” refers to operations outside of the United States and Canada.
Product licenses and subscription services revenues. The following table sets forth product licenses and subscription services revenues (in thousands) and related percentage changes for the periods indicated:
| | | | | | | | | | | |
| | Years Ended December 31, | | | % Change | | | % Change | | | Years Ended December 31, | | | | |
| | 2017 | | | 2016 | | | 2015 | | | in 2017 | | | in 2016 | | | 2023 | | | 2022 | |
| % Change | |
Product Licenses and Subscription Services Revenues: | | | | | | | | | | | | | | | | | | | | | | | | | | | |
Product Licenses | | | | | | | | | | | | | | | | | | | | | | | | | | | |
Domestic | | $ | 46,329 | | | $ | 69,307 | | | $ | 70,127 | | | | -33.2 | % | | | -1.2 | % | | $ | 39,193 | | | $ | 54,794 | | | | -28.5 | % |
International | | | 47,640 | | | | 44,196 | | | | 49,016 | | | | 7.8 | % | | | -9.8 | % | | | 36,158 | | | | 31,704 | | | | 14.0 | % |
Total product licenses revenues | | | 93,969 | | | | 113,503 | | | | 119,143 | | | | -17.2 | % | | | -4.7 | % | | | 75,351 | | | | 86,498 | | | | -12.9 | % |
Subscription Services | | | | | | | | | | | | | | | | | | | | | | | | | | | |
Domestic | | | 25,848 | | | | 26,359 | | | | 24,332 | | | | -1.9 | % | | | 8.3 | % | | | 52,528 | | | | 42,428 | | | | 23.8 | % |
International | | | 6,520 | | | | 4,215 | | | | 3,507 | | | | 54.7 | % | | | 20.2 | % | | | 28,651 | | | | 18,318 | | | | 56.4 | % |
Total subscription services revenues | | | 32,368 | | | | 30,574 | | | | 27,839 | | | | 5.9 | % | | | 9.8 | % | | | 81,179 | | | | 60,746 | | | | 33.6 | % |
Total product licenses and subscription services revenues | | $ | 126,337 | | | $ | 144,077 | | | $ | 146,982 | | | | -12.3 | % | | | -2.0 | % | | $ | 156,530 | | | $ | 147,244 | | | | 6.3 | % |
The following table sets forth a summary, grouped by size, of the number of recognized productProduct licenses transactions for the periods indicated:
| | | |
| | Years Ended December 31, | |
| | 2017 | | | 2016 | | | 2015 | |
Product Licenses Transactions with Recognized Licenses Revenue in the Applicable Period: | | | | | | | | | | | | |
More than $1.0 million in licenses revenue recognized | | | 10 | | | | 13 | | | | 15 | |
Between $0.5 million and $1.0 million in licenses revenue recognized | | | 17 | | | | 23 | | | | 34 | |
Total | | | 27 | | | | 36 | | | | 49 | |
Domestic: | | | | | | | | | | | | |
More than $1.0 million in licenses revenue recognized | | | 6 | | | | 10 | | | | 12 | |
Between $0.5 million and $1.0 million in licenses revenue recognized | | | 7 | | | | 14 | | | | 17 | |
Total | | | 13 | | | | 24 | | | | 29 | |
International: | | | | | | | | | | | | |
More than $1.0 million in licenses revenue recognized | | | 4 | | | | 3 | | | | 3 | |
Between $0.5 million and $1.0 million in licenses revenue recognized | | | 10 | | | | 9 | | | | 17 | |
Total | | | 14 | | | | 12 | | | | 20 | |
The following table sets forth the recognized revenue (in thousands) attributable to product licenses transactions, grouped by size, and related percentage changes for the periods indicated:
| | | | | | | | | | | |
| | Years Ended December 31, | | | % Change | | | % Change | |
| | 2017 | | | 2016 | | | 2015 | | | in 2017 | | | in 2016 | |
Product Licenses Revenue Recognized in the Applicable Period: | | | | | | | | | | | | | | | | | | | | |
More than $1.0 million in licenses revenue recognized | | $ | 12,860 | | | $ | 22,963 | | | $ | 25,462 | | | | -44.0 | % | | | -9.8 | % |
Between $0.5 million and $1.0 million in licenses revenue recognized | | | 11,478 | | | | 14,317 | | | | 23,296 | | | | -19.8 | % | | | -38.5 | % |
Less than $0.5 million in licenses revenue recognized | | | 69,631 | | | | 76,223 | | | | 70,385 | | | | -8.6 | % | | | 8.3 | % |
Total | | | 93,969 | | | | 113,503 | | | | 119,143 | | | | -17.2 | % | | | -4.7 | % |
Domestic: | | | | | | | | | | | | | | | | | | | | |
More than $1.0 million in licenses revenue recognized | | | 7,824 | | | | 19,314 | | | | 20,350 | | | | -59.5 | % | | | -5.1 | % |
Between $0.5 million and $1.0 million in licenses revenue recognized | | | 4,846 | | | | 8,627 | | | | 12,503 | | | | -43.8 | % | | | -31.0 | % |
Less than $0.5 million in licenses revenue recognized | | | 33,659 | | | | 41,366 | | | | 37,274 | | | | -18.6 | % | | | 11.0 | % |
Total | | | 46,329 | | | | 69,307 | | | | 70,127 | | | | -33.2 | % | | | -1.2 | % |
International: | | | | | | | | | | | | | | | | | | | | |
More than $1.0 million in licenses revenue recognized | | | 5,036 | | | | 3,649 | | | | 5,112 | | | | 38.0 | % | | | -28.6 | % |
Between $0.5 million and $1.0 million in licenses revenue recognized | | | 6,632 | | | | 5,690 | | | | 10,793 | | | | 16.6 | % | | | -47.3 | % |
Less than $0.5 million in licenses revenue recognized | | | 35,972 | | | | 34,857 | | | | 33,111 | | | | 3.2 | % | | | 5.3 | % |
Total | | $ | 47,640 | | | $ | 44,196 | | | $ | 49,016 | | | | 7.8 | % | | | -9.8 | % |
revenues. Product licenses revenues decreased $19.5 million and $5.6$11.1 million during 2017 and 2016, respectively, as compared to the prior year. For the years ended December 31, 2017, 2016, and 2015, product licenses transactions with more than $0.5 million in recognized revenue represented 25.9%, 32.8%, and 40.9%, respectively, of our product licenses revenues. During 2017, our top three product licenses transactions totaled $4.5 million in recognized revenue, or 4.8% of total product licenses revenues, compared to $9.2 million and $7.4 million, or 8.1% and 6.2% of total product licenses revenues, during 2016 and 2015, respectively.
Domestic product licenses revenues. Domestic product licenses revenues decreased $23.0 million during 2017, as compared to the prior year, primarily due to a decrease in the number and average deal size of transactions with more than $1.0 million in recognized revenue, and a decrease in the number of transactions with less than $1.0 million in recognized revenue.
Domestic product licenses revenues decreased $0.8 million during 2016, as compared to the prior year, primarily due to a decrease in the number and average deal size of transactions with recognized revenue between $0.5 million and $1.0 million, and a decrease in the number of transactions with more than $1.0 million in recognized revenue, partially offset by an increase in the number of transactions with less than $0.5 million in recognized revenue.
International product licenses revenues. International product licenses revenues increased $3.4 million during 2017,2023, as compared to the prior year, primarily due to an increaseoverall decrease in the numbervolume and average size of deals, with two particularly large deals occurring during 2022. During 2023, our top three product licenses transactions with more than $0.5totaled $8.9 million in recognized revenue, and a $1.1 million favorable foreign currency exchange impact.
Internationalor 11.8% of total product licenses revenues, decreased $4.8compared to $13.1 million, or 15.1% of total product licenses revenues, during 2022. Our product licenses revenues may continue to experience declines in future periods as we continue to promote our cloud offering to new and existing customers.
Subscription services revenues. Subscription services revenues are derived from our MCE cloud subscription service and are recognized ratably over the service period in the contract. Subscription services revenues increased $20.4 million during 2016,2023, as compared to the prior year, primarily due to conversions to cloud-based subscriptions from existing on-premises customers, a decrease in the number of transactions with recognized revenue between $0.5 million and $1.0 million and a $1.6 million unfavorable foreign currency exchange impact, partially offset by an increase in the number of transactions with less than $0.5 million in recognized revenue.
Subscription services revenues. Subscription services revenues are primarily derived from our cloud services offerings that are recognized on a subscription basis over the service period of the contract. Subscription services revenues increased $1.8 million and $2.7 million during 2017 and 2016, respectively, as compared to the prior year, primarily due to new subscription services customers and annet increase in the use of subscription services by existing customers, and sales contracts with new customers. We expect our subscription services revenues to continue to grow in future periods as we continue to promote our cloud offering to new and existing customers.
Product support revenues. The following table sets forth product support revenues (in thousands) and related percentage changes for the periods indicated:
| | | | | | | | | | | |
| | Years Ended December 31, | | | % Change | | | % Change | | | Years Ended December 31, | | | | |
| | 2017 | | | 2016 | | | 2015 | | | in 2017 | | | in 2016 | | | 2023 | | | 2022 | |
| % Change | |
Product Support Revenues: | | | | | | | | | | | | | | | | | | | | | | | | | | | |
Domestic | | $ | 174,316 | | | $ | 172,695 | | | $ | 171,832 | | | | 0.9 | % | | | 0.5 | % | | $ | 158,308 | | | $ | 159,385 | | | | -0.7 | % |
International | | | 114,858 | | | | 112,384 | | | | 109,908 | | | | 2.2 | % | | | 2.3 | % | | | 105,580 | | | | 107,136 | | | | -1.5 | % |
Total product support revenues | | $ | 289,174 | | | $ | 285,079 | | | $ | 281,740 | | | | 1.4 | % | | | 1.2 | % | | $ | 263,888 | | | $ | 266,521 | | | | -1.0 | % |
Product support revenues are derived from providing technical software support and software updates and upgrades to customers. Product support revenues are recognized ratably over the term of the contract, which is generally one year. Product support revenues increased $4.1decreased $2.6 million during 2017,2023, as compared to the prior year, primarily due to newcertain existing customers converting from perpetual product and premiumlicenses with separate support contracts andto our subscription services or term product licenses offerings, partially offset by a $1.1$1.5 million favorable foreign currency exchange impact. ProductOur product support revenues increased $3.3 million during 2016,may experience declines in future periods as comparedwe continue to the prior year, primarily duepromote our cloud offering to new product and premium support contracts, partially offset by a $4.5 million unfavorable foreign currency exchange impact.existing customers.
Other services revenues. The following table sets forth other services revenues (in thousands) and related percentage changes for the periods indicated:
| | | | | | | | | | | |
| | Years Ended December 31, | | | % Change | | | % Change | | | Years Ended December 31, | | | | |
| | 2017 | | | 2016 | | | 2015 | | | in 2017 | | | in 2016 | | | 2023 | | | 2022 | |
| % Change | |
Other Services Revenues: | | | | | | | | | | | | | | | | | | | | | | | | | | | |
Consulting | | | | | | | | | | | | | | | | | | | | | | | | | | | |
Domestic | | $ | 40,561 | | | $ | 35,935 | | | $ | 54,159 | | | | 12.9 | % | | | -33.6 | % | | $ | 35,261 | | | $ | 39,147 | | | | -9.9 | % |
International | | | 39,257 | | | | 37,465 | | | | 37,906 | | | | 4.8 | % | | | -1.2 | % | | | 36,814 | | | | 41,697 | | | | -11.7 | % |
Total consulting revenues | | | 79,818 | | | | 73,400 | | | | 92,065 | | | | 8.7 | % | | | -20.3 | % | | | 72,075 | | | | 80,844 | | | | -10.8 | % |
Education | | | 9,214 | | | | 9,605 | | | | 9,082 | | | | -4.1 | % | | | 5.8 | % | | | 3,768 | | | | 4,655 | | | | -19.1 | % |
Total other services revenues | | $ | 89,032 | | | $ | 83,005 | | | $ | 101,147 | | | | 7.3 | % | | | -17.9 | % | | $ | 75,843 | | | $ | 85,499 | | | | -11.3 | % |
Consulting revenues. Consulting revenues are derived from helping customers plan and execute the deployment of our software. Consulting revenues increased $6.4decreased $8.8 million during 2017, as compared to the prior year, primarily due to an increase in the average bill rate and a $0.4 million favorable foreign currency exchange impact. Consulting revenues decreased $18.7 million during 2016,2023, as compared to the prior year, primarily due to a decrease in billable hours worldwide, and a $1.0 million unfavorable foreign currency exchange impact, partially offset by an increase in the average bill rate.rates.
Education revenues. Education revenues are derived from the education and training that we provide to our customers to enhance their ability to fully utilize the features and functionality of our software. These offerings include self-tutorials, custom course development, joint training with customers’ internal staff, and standard course offerings, with pricing dependent on the specific offering delivered. Education revenues decreased $0.4$0.9 million during 2017,2023, as compared to the prior year, primarily due to lower overall contract values and a decrease in onsite course delivery. Education revenues increased $0.5 million during 2016, as comparedsales of annual subscriptions to the prior year, primarily due to higher overall contract values and an increase in onsite and online course delivery.training courses.
Costs and Expenses
Cost of revenues. The following table sets forth cost of revenues (in thousands) and related percentage changes for the periods indicated:
| | | | | | | | | | | |
| | Years Ended December 31, | | | % Change | | | % Change | | | Years Ended December 31, | | |
| | 2017 | | | 2016 | | | 2015 | | | in 2017 | | | in 2016 | | | 2023 | | | 2022 | | | % Change | |
Cost of Revenues: | | | | | | | | | | | | | | | | | | | | | | | | | | | |
Product licenses and subscription services: | | | | | | | | | | | | | | | | | | | | | | | | | | | |
Product licenses | | $ | 7,176 | | | $ | 8,573 | | | $ | 8,118 | | | | -16.3 | % | | | 5.6 | % | | $ | 1,929 | | | $ | 1,672 | | | | 15.4 | % |
Subscription services | | | 13,435 | | | | 12,765 | | | | 13,051 | | | | 5.2 | % | | | -2.2 | % | | | 31,776 | | | | 24,770 | | | | 28.3 | % |
Total product licenses and subscription services | | | 20,611 | | | | 21,338 | | | | 21,169 | | | | -3.4 | % | | | 0.8 | % | | | 33,705 | | | | 26,442 | | | | 27.5 | % |
Product support | | | 17,481 | | | | 15,001 | | | | 12,748 | | | | 16.5 | % | | | 17.7 | % | | | 22,434 | | | | 21,264 | | | | 5.5 | % |
Other services: | | | | | | | | | | | | | | | | | | | | | | | | | | | |
Consulting | | | 52,018 | | | | 50,866 | | | | 63,344 | | | | 2.3 | % | | | -19.7 | % | | | 51,311 | | | | 50,820 | | | | 1.0 | % |
Education | | | 6,539 | | | | 5,942 | | | | 3,847 | | | | 10.0 | % | | | 54.5 | % | | | 2,494 | | | | 4,463 | | | | -44.1 | % |
Total other services | | | 58,557 | | | | 56,808 | | | | 67,191 | | | | 3.1 | % | | | -15.5 | % | | | 53,805 | | | | 55,283 | | | | -2.7 | % |
Total cost of revenues | | $ | 96,649 | | | $ | 93,147 | | | $ | 101,108 | | | | 3.8 | % | | | -7.9 | % | | $ | 109,944 | | | $ | 102,989 | | | | 6.8 | % |
Cost of product licenses revenues. Cost of product licenses revenues consists of amortization of capitalized software development costs, referral fees paid to channel partners, the costs of product manuals and media, and royalties paid to third-party software vendors. Capitalized software development costs are generally amortized over a useful life of three years.
Cost of product licenses revenues decreased $1.4 milliondid not materially change during 2017,2023 as compared to the prior year, primarily due to a $1.4 million decrease in amortization of capitalized software development costs related to MicroStrategy 9.4, which became fully amortized in September 2016, and a $0.3 million decrease in referral fees related to channel partners. We expect to amortize the remaining balance of our products’ capitalized software development costs as of December 31, 2017 ratably over the applicable remaining amortization periods as follows:year.
| | Capitalized Software | | | | | |
| | Development Costs, Net, | | | Remaining | |
| | as of December 31, 2017 | | | Amortization Period | |
| | (in thousands) | | | (in months) | |
MicroStrategy 10 | | | 2,499 | | | | 5 | |
Total capitalized software development costs, net | | $ | 2,499 | | | | | |
Cost of product licenses revenues increased $0.5 million during 2016, as compared to the prior year, primarily due to a $2.5 million increase in amortization of capitalized software development costs related to MicroStrategy 10, which was made generally available in June 2015, and a $0.2 million increase in referral fees related to channel partners, partially offset by a $1.9 million decrease in amortization of capitalized software development costs related to MicroStrategy 9.3, which became fully amortized in September 2015, and a $0.5 million decrease in amortization of capitalized software development costs related to MicroStrategy 9.4, which became fully amortized in September 2016.
Cost of subscription services revenues. Cost of subscription services revenues consists of equipment, facility and other related support costs (including cloud hosting infrastructure costs), and personnel and related overhead costs. Cost of subscription services revenues increased $0.7$7.0 million during 2017,2023, as compared to the prior year, primarily due to (i) a $5.7 million increase in cloud hosting infrastructure costs, which is a result of the increased usage by new and existing cloud subscription services customers, (ii) a $0.5 million increase in employee salaries primarily attributable to an increase in average staffing levels and wage increases, and (iii) a $0.4 million increase in variable compensation.
Cost of product support revenues. Cost of product support revenues consists of personnel and related overhead costs, including those under our Enterprise Support program. Our Enterprise Support program utilizes primarily consulting personnel to provide product support to our customers at our discretion. Compensation related to personnel providing Enterprise Support services is reported as cost of product support revenues. Cost of product support revenues increased $1.2 million during 2023, as compared to the prior year, primarily due to a $1.9 million increase in third-party hosting service provider fees, partially offset by a $0.6 million decrease in compensation and related costs, and a $0.4 million decrease in equipment, facility, and other related support costs. Subscription services headcount increased 10.4% to 53 at December 31, 2017 from 48 at December 31, 2016.
Cost of subscription services revenues decreased $0.3 million during 2016, as compared to the prior year, primarily due to a $2.1 million decrease in equipment, facility, and other related support costs, a $0.3 million decrease in compensation and related costs, and a $0.3 million decrease in consulting and advisory costs, partially offset by a $2.3 million increase in third-party hosting service provider fees. Subscription services headcount increased 29.7% to 48 at December 31, 2016 from 37 at December 31, 2015.
Cost of product support revenues. Cost of product support revenues consists of product support personnel and related overhead costs. Cost of product support revenues increased $2.5 million during 2017, as compared to the prior year, primarily due to a $2.4$1.7 million increase in compensation and related costs dueattributable to non-product support personnel providing an increase in average staffing levels, a $0.2 million increase in travel and entertainment expenditures, and a $0.2 million increase in facility and other related support costs, partially offset by a $0.3 million decrease in subcontractor costs. Product support headcount increased 0.6% to 172 at December 31, 2017 from 171 at December 31, 2016.level of Enterprise Support services.
Cost of product support revenues increased $2.3 million during 2016, as compared to the prior year, primarily due to a $1.8 million increase in compensation and related costs due to an increase in staffing levels, a $0.3 million increase in subcontractor costs, and a $0.2 million increase in recruiting costs. Product support headcount increased 30.5% to 171 at December 31, 2016 from 131 at December 31, 2015.
Cost of consulting revenues. Cost of consulting revenues consists of personnel and related overhead costs.costs, excluding those under our Enterprise Support program which are allocated to cost of product support revenues. Cost of consulting revenues increased $1.2$0.5 million during 2017,2023, as compared to the prior year, primarily due to (i) a $1.5$1.8 million increase in variable compensation, and related costs and(ii) a $0.9$1.6 million increase in travelseverance costs associated with streamlining our organization, (iii) a $0.6 million increase in facility and entertainment expenditures,other related support costs, and (iv) a $0.5 million increase in employee salaries primarily attributable to wage increases, partially offset by a $1.4shift in staffing levels to lower cost regions, partially offset by (v) a $2.0 million decrease in subcontractor costs. Included in the above components is an aggregate $0.6 million unfavorable foreign currency exchange impact. Consulting headcount decreased 2.6% to 441 at December 31, 2017 from 453 at December 31, 2016.
Cost of consulting revenues decreased $12.5 million during 2016, as compared to the prior year, primarily due tocosts and (vi) a $6.8$1.8 million decrease in compensation and related costs dueattributable to a decrease in average staffing levels, a $3.7 million decrease in subcontractor costs, a $1.4 million decrease in travel and entertainment expenditures, a $1.1 million decrease in facility and other related support costs, partially offset by a $0.4 million increase in recruiting costs.consulting personnel providing an increased level of Enterprise Support services. Included in the above componentscost of consulting revenues for 2023 is an aggregate $0.9$0.7 million favorableunfavorable foreign currency exchange impact. Consulting headcount decreased 3.0% to 453 at December 31, 2016 from 467 at December 31, 2015.
Cost of education revenues. Cost of education revenues consists of personnel and related overhead costs. Cost of education revenues increased $0.6decreased $2.0 million during 2017,2023, as compared to the prior year, primarily due to (i) a $0.7$1.2 million increasedecrease in compensation and related costs dueemployee salaries primarily attributable to an increasea decrease in average staffing levels and (ii) a $0.2 million increase in dues and subscriptions, partially offset by a $0.3$0.4 million decrease in facility and other related support costs. Education headcount increased 5.1% to 41 at December 31, 2017 from 39 at December 31, 2016.variable compensation.
Cost of education revenues increased $2.1 million during 2016, as compared to the prior year, primarily due to a $0.9 million increase in compensation and related costs due to an increase in staffing levels, a $0.7 million increase in facility and other related support costs, and a $0.3 million increase in subcontractor costs. Education headcount increased 39.3% to 39 at December 31, 2016 from 28 at December 31, 2015.
Sales and marketing expenses. Sales and marketing expenses consist of personnel costs, commissions, office facilities, travel, advertising, public relations programs, and promotional events, such as trade shows, seminars, and technical conferences. The following table sets forth sales and marketing expenses (in thousands) and related percentage changes for the periods indicated:
| | | | | | | | | | | |
| | Years Ended December 31, | | | % Change | | | % Change | |
| | 2017 | | | 2016 | | | 2015 | | | in 2017 | | | in 2016 | |
Sales and marketing expenses | | $ | 174,612 | | | $ | 158,740 | | | $ | 148,522 | | | | 10.0 | % | | | 6.9 | % |
| | | | | | | | | | | | |
| | Years Ended December 31, | | |
| | 2023 | | | 2022 | | | % Change | |
Sales and marketing expenses | | $ | 149,671 | | | $ | 146,882 | | | | 1.9 | % |
Sales and marketing expenses increased $15.9$2.8 million during 2017,2023, as compared to the prior year, primarily due to an $8.4(i) a $3.0 million increase in marketing and advertisingseverance costs associated with streamlining our organization, (ii) a $4.4 million increase in compensation and related costs due to an increase in staffing levels, a $2.7$2.3 million increase in travel and entertainment expenditures due to the return of in-person events and meetings, (iii) a $0.7$1.9 million increase in recruitingmarketing costs due to the return of in-person events and meetings, and (iv) a $0.5$0.8 million increase in facility and other related support costs, partially offset by (v) a $0.7$2.8 million decrease in employee salaries primarily attributable to a decrease in average staffing levels, partially offset by wage increases, (vi) a $2.4 million decrease in variable compensation primarily attributable to a decrease in commissions earned, partially offset by a decrease in net capitalized commissions and increases in other personnel costs and employee relations expenses, and (vii) a $0.2 million net decrease in share-based compensation expense related primarily attributable to the departureforfeiture of an executive employee incertain awards, being substantially offset by the first quartergrant of 2017,additional awards under the Stock Incentive Plans and a $0.2 million decrease in consulting and advisory costs.the fair value remeasurement of certain liability-classified awards at the end of the reporting period. Included in the above componentssales and marketing expenses for 2023 is an aggregate $0.6$0.7 million unfavorable foreign currency exchange impact. Sales
Research and marketing headcount increased 11.1% to 652 at December 31, 2017 from 587 at December 31, 2016. We expect to increase our salesdevelopment expenses. Research and marketingdevelopment expenses in future periods as described in the “Overview” section above.
As a resultconsist of the grant of stock options under the 2013 Equity Plan, we expect that share-based compensation expense, a portion of which is recognized as sales and marketing expense, will continue to be a significant recurring expense. As of December 31, 2017, we estimated that approximately $6.6 million of additional share-based compensation expense will be recognized as sales and marketing expense over a remaining weighted average period of 2.8 years. See “Overview” and Note 11, Share-based Compensation, to the Consolidated Financial Statementspersonnel costs for further information regarding the 2013 Equity Planour software engineering personnel and related share-based compensation expense.overhead costs. The following table summarizes research and development expenses (in thousands) and related percentage changes for the periods indicated:
Sales
| | | | | | | | | | | | |
| | Years Ended December 31, | | |
| | 2023 | | | 2022 | | | % Change | |
Research and development expenses | | $ | 120,530 | | | $ | 127,428 | | | | -5.4 | % |
Research and marketingdevelopment expenses increased $10.2decreased $6.9 million during 2016,2023, as compared to the prior year, primarily due to (i) a $4.5$3.9 million increasedecrease in compensation and related costs dueemployee salaries primarily attributable to an increasea decrease in average staffing levels, partially offset by wage increases, (ii) a $1.8$2.0 million increasedecrease in marketing and advertising costs,variable compensation, (iii) a $1.0$0.6 million increasedecrease in recruiting costs, (iv) a $0.9$0.6 million increase in travel and entertainment expenditures, a $0.9 million increasedecrease in facility and other related support costs, (v) a $0.7$0.5 million decrease in subcontractor costs, and (vi) a $0.3 million net decrease in share-based compensation expense primarily attributable to the forfeiture of certain awards, being substantially offset by the grant of additional awards under the Stock Incentive Plans and the fair value remeasurement of certain liability-classified awards at the end of the reporting period, partially offset by (vii) a $1.7 million increase in consulting and advisoryseverance costs and a $0.2 million increase in non-income taxes.associated with streamlining our organization. Included in the above componentsresearch and development expenses for 2023 is an aggregate $2.0$1.2 million favorable foreign currency exchange impact. Sales and marketing headcount increased 14.4% to 587 at December 31, 2016 from 513 at December 31, 2015.
General and administrative expenses. General and administrative expenses consist of personnel and related overhead costs, and other costs of our executive, finance, human resources, information systems, and administrative departments, as well as third-party consulting, legal, and other professional fees. The following table sets forth general and administrative expenses (in thousands) and related percentage changes for the periods indicated:
| | | | | | | | | | | |
| | Years Ended December 31, | | | % Change | | | % Change | |
| | 2017 | | | 2016 | | | 2015 | | | in 2017 | | | in 2016 | |
General and administrative expenses | | $ | 80,161 | | | $ | 79,462 | | | $ | 80,732 | | | | 0.9 | % | | | -1.6 | % |
| | | | | | | | | | | | |
| | Years Ended December 31, | | |
| | 2023 | | | 2022 | | | % Change | |
General and administrative expenses | | $ | 115,312 | | | $ | 111,421 | | | | 3.5 | % |
General and administrative expenses increased $0.7$3.9 million during 2017,2023, as compared to the prior year, primarily due to (i) a $2.5$6.3 million net increase in share-based compensation expense primarily attributable to the grant of additional awards under the Stock Incentive Plans, partially offset by certain awards that became fully vested, (ii) a $0.6$1.2 million increase in other aircraft-related operating costs, a $0.5 million increase in recruiting costs, and a $0.3 million increase in travel and entertainment expenditures, partially offset by a $1.9 million decrease in severance costs associatedthe estimated minimum loss with the streamlining of our finance organization, a $0.8 million decrease in compensation and related costs due to a decrease in staffing levels, a $0.4 million decrease in legal, consulting, and other advisory costs, and a $0.3 million decrease in facility and other related support costs. The $2.5 million net increase in share-based compensation expense is primarily duerespect to the inclusion,Brazilian matters noted in the share-based compensation expense in the first quarter of 2016, of a reversal of $1.6 million of previously recorded share-based compensation expense due to pre-vesting forfeitures of certain stock options of two executives who departed during the 2016 executive management reorganization,Note 9, Commitments and the grant of stock options in 2017 under the 2013 Equity Plan. General and administrative headcount decreased 7.7% to 298 at December 31, 2017 from 323 at December 31, 2016.
As a result of the grant of stock options under the 2013 Equity Plan, we expect that share-based compensation expense, a portion of which is recognized as general and administrative expense, will continue to be a significant recurring expense. As of December 31, 2017, we estimated that approximately $9.8 million of additional share-based compensation expense will be recognized as general and administrative expense over a remaining weighted average period of 2.0 years. See “Overview” and Note 11, Share-based Compensation,Contingencies, to the Consolidated Financial Statements, for further information regarding the 2013 Equity Plan and related share-based compensation expense.
General and administrative expenses decreased $1.3 million during 2016, as compared to the prior year, primarily due to(iii) a $5.5 million net decrease in share-based compensation expense, a $1.2 million decrease in compensation and related costs primarily due to a reduction in compensation expenses associated with two executives who departed during the 2016 executive management reorganization, a $0.7 million decrease in facility and other related support costs, and a $0.2 million decrease in non-income taxes, partially offset by a $1.9 million increase in severance costs associated with the streamlining of our finance organization, and (iv) a $1.7$0.5 million increase in legal, consulting,directors and other advisoryofficers liability insurance expense, partially offset by (v) a $2.3 million decrease in costs related to the maintenance and operations of our corporate aircraft, (vi) a $1.2$0.9 million increasedecrease in travel and entertainment expenditures, a $1.0 million increase in other aircraft-related operatingrecruiting costs, and(vii) a $0.6 million increase in recruiting costs. The $5.5 million net decrease in share-based compensation expense is primarily due to a $1.6 million reversal of previously recorded share-based compensation expense due to pre-vesting forfeitures of certain stock options of two executives who departed during the 2016 executive management reorganization, and a decrease of $4.3 million in share-based compensation no longer being recognized due to their departures. Included in the above components is an aggregate $1.4 million favorable foreign currency exchange impact. General and administrative headcount increased 4.2% to 323 at December 31, 2016 from 310 at December 31, 2015.
Research and development expenses. Research and development expenses consist of the personnel costs for our software engineering personnel, depreciation of equipment,legal, consulting, advisory, and other related costs.third-party costs, and (viii) a $0.5 million decrease in variable compensation.
Digital asset impairment losses, (gains on sale), net. Digital asset impairment losses are recognized when the carrying value of our digital assets exceeds their lowest fair value at any time since their acquisition. Impaired digital assets are written down to fair value at the time of impairment, and such impairment loss cannot be recovered for any subsequent increases in fair value. Gains (if any) are not recorded until realized upon sale. The following table summarizes research and development expenses and amortization of capitalized software development costssets forth digital asset impairment losses (gains on sale), net (in thousands) and related percentage changes for the periods indicated:
| | | | | | | | | | | |
| | Years Ended December 31, | | | % Change | | | % Change | |
| | 2017 | | | 2016 | | | 2015 | | | in 2017 | | | in 2016 | |
Gross research and development expenses before capitalized software development costs | | $ | 78,766 | | | $ | 73,142 | | | $ | 74,804 | | | | 7.7 | % | | | -2.2 | % |
Capitalized software development costs | | | 0 | | | | 0 | | | | (9,598 | ) | | | 0.0 | % | | | -100.0 | % |
Total research and development expenses | | $ | 78,766 | | | $ | 73,142 | | | $ | 65,206 | | | | 7.7 | % | | | 12.2 | % |
Amortization of capitalized software development costs included in cost of product licenses revenues | | $ | 5,998 | | | $ | 7,357 | | | $ | 7,212 | | | | -18.5 | % | | | 2.0 | % |
| | | | | | | | | | | | |
| | Years Ended December 31, | | |
| | 2023 | | | 2022 | | | % Change | |
Digital asset impairment losses | | $ | 115,851 | | | $ | 1,287,213 | | | | -91.0 | % |
Gains on sale of digital assets | | | 0 | | | | 927 | | | | -100.0 | % |
Digital asset impairment losses (gains on sale), net | | $ | 115,851 | | | $ | 1,286,286 | | | | -91.0 | % |
ResearchWe may continue to incur significant digital asset impairment losses in the future. For example, we have incurred at least $28.9 million in digital asset impairment losses during the first quarter of 2024 on bitcoin we held as of December 31, 2023.
Interest Expense, Net
In 2023, interest expense, net, was comprised primarily of contractual interest expense and development expenses, before capitalizationamortization of software developmentissuance costs increased $5.6related to our long-term debt arrangements and contractual interest expense incurred on short-term trade credits to purchase bitcoin, partially offset by interest income earned on cash and cash equivalents. In 2022, interest expense, net, was comprised primarily of contractual interest expense and amortization of issuance costs related to our long-term debt arrangements. Interest expense, net, decreased $4.2 million during 2017,2023, as compared to the prior year, primarily dueand is expected to a $2.5 million increasecontinue to decrease in compensation and related costs due to an increase in staffing levels, a $1.0 million increase in facility and other related support costs, a $0.8 million increase in consulting and advisory costs, a $0.6 million net increase in share-based compensation expense relatedthe first quarter of 2024 compared to the grant of stock options under the 2013 Equity Plan, a $0.2 million increasesame period in employee relations expenses, and a $0.2 million increase in travel and entertainment expenditures. Research and development headcount increased 9.2% to 559 at December 31, 2017 from 512 at December 31, 2016. We expect to increase our investment in our technology products and personnel in future periods2023, as described in the “Overview” section above. We have significantly accelerated the pace of our software development efforts and increased the frequency of our software releases subsequent to the release of MicroStrategy 10, which has resulted in our software development costs in recent periods being expensed as incurred. We do not expect to capitalize a material amount of software development costs in the near term.
As a result of the grantrepayment of stock options under the 2013 Equity Plan, we expect that share-based compensation expense, a portion of which is recognized as research and development expense, will continue2025 Secured Term Loan in March 2023. Refer to be a significant recurring expense. As of December 31, 2017, we estimated that approximately $3.4 million of additional share-based compensation expense will be recognized as research and development expense over a remaining weighted average period of 2.3 years. See “Overview”Note 8, Long-term Debt, and Note 11, Share-based Compensation,4, Digital Assets, to the Consolidated Financial Statements for further information regardinginformation.
Gain on Debt Extinguishment
In 2023, the 2013 Equity Plan and related share-based compensation expense.
Research and development expenses, before capitalization$44.7 million gain on debt extinguishment resulted from the repayment of software development costs, decreased $1.7 million during 2016, as comparedthe 2025 Secured Term Loan. Refer to Note 8, Long-term Debt, to the prior year, primarily due to a $0.8 million decrease in compensation and related costs, a $0.6 million decrease in facility and other related support costs, and a $0.3 million decrease in consulting and advisory costs, partially offset by a $0.2 million increase in travel and entertainment expenditures. Research and development headcount increased 11.1% to 512 at December 31, 2016 from 461 at December 31, 2015.Consolidated Financial Statements for further information.
Other (Expense) Income, Net
Other (expense) income, net is comprised primarily of foreign currency transaction gains and losses and gains and losses on our foreign currency forward contracts. During 2017, other expense, net, of $7.0$5.2 million in 2023 was comprised primarily of foreign currency transaction net losses, arising mainly from the revaluation of U.S. dollar denominated cash balances held at international locations. During 2016, otherlosses. Other income, net, of $3.2$6.4 million in 2022 was comprised primarily of foreign currency transaction net gains, arising mainly from the revaluation of U.S. dollar denominated cash balances held at international locations, in addition to outstanding balances denominated in the British Pound, which had declined in value as compared to the U.S. dollar. During 2015, other income, net, of $3.6 million was comprised primarily of $2.4 million in foreign currency transaction net gains, arising mainly from the revaluation of U.S. dollar denominated cash balances held at international locations, $0.5 million in net gains from the settlement of certain foreign currency forward contracts, and the reclassification of a $0.3 million foreign currency translation gain from other comprehensive income as a result of the completion of the liquidation of one of our foreign subsidiaries.gains.
(Benefit from) Provision for Income Taxes
During 2017,2023, we recorded a provision forbenefit from income taxes of $55.0$553.6 million on a pre-tax loss of $124.5 million that resulted in an effective tax rate of 75.7%444.6%, as compared to a provision for income taxes of $22.1$147.3 million on a pre-tax loss of $1.322 billion that resulted in an effective tax rate of 19.6%(11.1)% during 2016. The change in our effective tax rate in 2017, as2022. Our benefit from income taxes increased compared to the prior year was primarily due to an estimated one-time tax provision of $44.0 million as a result(i) the release of the Tax Act. Thisvaluation allowance during 2023 on our deferred tax provision is comprised of a $40.3 million tax expenseasset related to the impairment on our bitcoin holdings, attributable to the increase in market value of bitcoin as of December 31, 2023 compared to December 31, 2022, compared to (ii) the establishment of a valuation allowance during 2022 on our deferred tax asset related to the impairment on our bitcoin holdings, attributable to the decrease in market value of bitcoin as of December 31, 2022 compared to December 31, 2021.
The U.S. Tax Cuts and Jobs Act imposed a mandatory deemed repatriation transition tax (“Transition Tax”) and a $3.7 million charge related to the re-measurement of net deferred tax assets arising from the new lower corporate tax rate effected by the Tax Act.
The Tax Act imposes a Transition Tax on previously untaxed accumulated and current earnings and profits (“E&P”) of certain of our foreign subsidiaries. To determine the amountAs of December 31, 2023, $16.6 million of the Transition Tax we must determine, among other things, the amount of post-1986 E&P of the relevant subsidiaries, as well as the amount of non-U.S. income taxes paid on such earnings. We made a reasonable estimate of the Transition Tax and recorded a provisional Transition Tax obligation of $40.3 million,was unpaid, of which $36.8$9.2 million is recordedincluded in “other“Other long-term liabilities” and $7.4 million is netted against certain tax overpayments within “Prepaid expenses and other current assets” in our Consolidated Balance Sheets. However, we continue to gather additional information to compute more precisely the post-1986 E&P and related non-U.S. income taxes paid.Sheet.
The Tax Act also reduced the U.S. corporate tax rate from 35% to 21%, effective January 1, 2018. Consequently, we have recorded a decrease related to our U.S. deferred tax assets and liabilities, with a corresponding net deferred income tax expense of $3.7 million for the year ended December 31, 2017 as a result of re-measuring net deferred tax assets at the new lower corporate tax rate of 21%.
Additionally, the Tax Act requires certain Global Intangible Low Taxed Income (“GILTI”) earned by controlled foreign corporations (“CFCs”) to be included in the gross income of the CFCs’ U.S. shareholder. GAAP allows us to either: (i) treat taxes due on future U.S. inclusions in taxable income related to GILTI as a current-period expense when incurred (the “period cost method”); or (ii) factor such amounts into our measurement of deferred taxes (the “deferred method”). We elected the period cost method. The GILTI tax rules will become effective for the 2018 tax year and therefore we have not made any adjustments related to the potential GILTI tax in our financial statements for the year ended December 31, 2017. We continue to evaluate the impact of the new GILTI tax rules and the application of ASC 740 on our financial statements.
As of December 31, 2017,2023, we had no U.S. federal NOLnet operating loss (“NOL”) carryforwards and had$3.0 million of foreign NOL carryforwards of $2.5 million.carryforwards. As of December 31, 2017, foreign NOL carryforwards,2023, we also had gross state NOLs of $10.1 million of which $9.1 million will expire by 2042 and the remainder can be carried forward indefinitely. As of December 31, 2023, digital asset impairment losses, other temporary differences and carryforwards and credits resulted in deferred tax assets, net of valuation allowances and deferred tax liabilities, of $13.4$757.2 million.
As of December 31, 2017,2023, we had a valuation allowance of $1.0$1.4 million primarily related to certainour deferred tax assets related to foreign tax credit carryforwards that,credits in our present estimation, more likely than not will not be realized. We assessed whether ourcertain jurisdictions. This is a significant change from the valuation allowance analysesas of December 31, 2022 of $511.4 million. The largest deferred tax asset relates to the impairment on our bitcoin holdings. During 2023, the value of bitcoin increased substantially which allowed us to release the valuation allowance recorded against the deferred tax asset for impairment on our bitcoin holdings. Changes to the valuation allowance against the deferred tax asset are affected by various aspectslargely dependent on the change in the market value of bitcoin from the Tax Act (e.g., deemed repatriationprevious reporting date. If the market value of deferred foreign income, GILTI inclusions, new categories of foreign tax credits) and concluded that they were not significantly affected by the Tax Act.
Ifbitcoin declines or we are unable to sustainregain profitability in future periods, we may be required to increase the valuation allowance against our deferred tax assets, which could result in a charge that would materially adversely affect net income (loss) in the period in which the charge is incurred. We routinely consider actions necessary to preserve or utilize tax attributes. We will continue to regularly assess the realizability of deferred tax assets.
Except as discussed below,As of December 31, 2023, we intend tohave not indefinitely reinvestreinvested any of our undistributed foreign earnings of all of our foreign subsidiaries. However, under the Tax Act, those undistributed earnings (as computed for U.S. federal income tax purposes, and with due regard to the discussion below regarding Subpart F deemed dividends) are subject to the Transition Tax, which was recorded at a provisional amount of $40.3 million during the year ended December 31, 2017.
In addition, U.S. federal tax laws require us to include in our U.S. taxable income certain investment income earned outside of the United States in excess of certain limits (“Subpart F deemed dividends”). Because Subpart F deemed dividends are already required to be recognized in our U.S. federal income tax return, we regularly repatriate
Subpart F deemed dividends to the United States and no additional tax is incurred on the distribution. We repatriated Subpart F deemed dividends of $1.8 million and $1.9 million in 2017 and 2016, respectively, with no additional tax. We did not repatriate any Subpart F deemed dividends in 2015 because we did not report any Subpart F income on our 2014 U.S. tax return.
During 2015, wehave recorded a provision fordeferred tax liability of $2.9 million on undistributed foreign earnings related to foreign withholding tax and U.S. state income taxes of $31.9 million, resulting in an effective tax rate of 23.2%. The change in our effective tax rate in 2016, as compared to the prior year, was primarily due to the 2016 change in the proportion of U.S. versus foreign income and certain discrete tax benefits recorded in 2016.taxes.
Deferred Revenue and Advance Payments
Deferred revenue and advance payments represent subscription services, product support, and other services fees that are collectedamounts received or due from our customers in advance of our transferring our software or services to the customer. In the case of multi-year service contract arrangements, we generally do not invoice more than one year in advance of services and do not record deferred revenue for amounts that have not been invoiced. Revenue is subsequently recognized overin the contract service period, and product licenses revenues relatingperiod(s) in which control of the software or services is transferred to multiple-element software arrangements that include future deliverables.the customer.
The following table summarizes deferred revenue and advance payments (in thousands), as of:
| | | December 31, | | | December 31, | |
| | 2017 | | | 2016 | | | 2015 | | | 2023 | | | 2022 | |
Current: | | | | | | | | | | | | | | | | | |
Deferred product licenses revenue | | $ | 11,113 | | | $ | 13,023 | | | $ | 13,506 | | | $ | 3,579 | | | $ | 2,825 | |
Deferred subscription services revenue | | | 17,324 | | | | 18,303 | | | | 15,763 | | | | 65,512 | | | | 51,861 | |
Deferred product support revenue | | | 168,043 | | | | 162,781 | | | | 158,738 | | | | 152,012 | | | | 155,366 | |
Deferred other services revenue | | | 9,465 | | | | 10,015 | | | | 9,149 | | | | 7,059 | | | | 7,376 | |
Gross current deferred revenue and advance payments | | | 205,945 | | | | 204,122 | | | | 197,156 | |
Less: unpaid deferred revenue | | | (93,296 | ) | | | (98,587 | ) | | | (96,461 | ) |
Net current deferred revenue and advance payments | | $ | 112,649 | | | $ | 105,535 | | | $ | 100,695 | |
Total current deferred revenue and advance payments | | | $ | 228,162 | | | $ | 217,428 | |
Non-current: | | | | | | | | | | | | | | | | | |
Deferred product licenses revenue | | $ | 7,169 | | | $ | 9,118 | | | $ | 5,397 | | | $ | 0 | | | $ | 2,742 | |
Deferred subscription services revenue | | | 126 | | | | 1,307 | | | | 2,138 | | | | 3,097 | | | | 3,030 | |
Deferred product support revenue | | | 4,826 | | | | 5,751 | | | | 7,607 | | | | 4,984 | | | | 6,387 | |
Deferred other services revenue | | | 628 | | | | 690 | | | | 795 | | | | 443 | | | | 604 | |
Gross non-current deferred revenue and advance payments | | | 12,749 | | | | 16,866 | | | | 15,937 | |
Less: unpaid deferred revenue | | | (2,568 | ) | | | (2,951 | ) | | | (6,942 | ) |
Net non-current deferred revenue and advance payments | | $ | 10,181 | | | $ | 13,915 | | | $ | 8,995 | |
Total non-current deferred revenue and advance payments | | | $ | 8,524 | | | $ | 12,763 | |
Total current and non-current: | | | | | | | | | | | | | | | | | |
Deferred product licenses revenue | | $ | 18,282 | | | $ | 22,141 | | | $ | 18,903 | | | $ | 3,579 | | | $ | 5,567 | |
Deferred subscription services revenue | | | 17,450 | | | | 19,610 | | | | 17,901 | | | | 68,609 | | | | 54,891 | |
Deferred product support revenue | | | 172,869 | | | | 168,532 | | | | 166,345 | | | | 156,996 | | | | 161,753 | |
Deferred other services revenue | | | 10,093 | | | | 10,705 | | | | 9,944 | | | | 7,502 | | | | 7,980 | |
Gross current and non-current deferred revenue and advance payments | | | 218,694 | | | | 220,988 | | | | 213,093 | |
Less: unpaid deferred revenue | | | (95,864 | ) | | | (101,538 | ) | | | (103,403 | ) |
Net current and non-current deferred revenue and advance payments | | $ | 122,830 | | | $ | 119,450 | | | $ | 109,690 | |
Total current and non-current deferred revenue and advance payments | | | $ | 236,686 | | | $ | 230,191 | |
We offset our accountsThe portions of multi-year contracts that will be invoiced in the future are not presented on the balance sheet in “Accounts receivable, net” and deferred revenue for any unpaid items included in deferred“Deferred revenue and advance payments.
payments” and instead are included in the remaining performance obligation disclosure below. Total gross deferred revenue and advance payments decreased $2.3increased $6.5 million in 2017, as compared to the prior year, primarily due to the recognition of previously deferred product licenses, subscription services, and other services revenues, partially offset by an increase in product support contracts. Total gross deferred revenue and advance
payments increased $7.9 million in 2016,2023, as compared to the prior year, primarily due to an increase in deferred revenue from new and renewed subscription services contracts, partially offset by (i) a decrease in deferred product support revenue from an increase in conversions from on-premises to subscription services contracts, and (ii) a decrease in deferred licenses revenue from the recognition of an early renewal of a large term license deal at the end of 2022.
Our remaining performance obligation represents all future revenue under contract and includes deferred revenue and advance payments and billable non-cancelable amounts that will be invoiced and recognized as revenue in future periods. The remaining performance obligation excludes contracts that are billed in arrears, such as certain time and materials contracts. As of December 31, 2023, we had an aggregate transaction price of $339.7 million allocated to the remaining performance obligation related to product support, subscription services, product licenses, and other services contracts.
We expect to recognize approximately $205.9$255.5 million of deferred revenue and advance paymentsthe remaining performance obligation over the next 12 months.months and the remainder thereafter. However, the timing and ultimate recognition of our deferred revenue and advance payments and other remaining performance obligations depend on our performancesatisfaction of various serviceperformance obligations, and the amount of deferred revenue and advance payments and remaining performance obligations at any date should not be considered indicative of revenues for any succeeding period.
Liquidity and Capital Resources
Liquidity.
Our principal sources of liquidity are cash and cash equivalents and on-going collection of our accounts receivable. Cash and cash equivalents may include holdings in bank demand deposits, money market instruments, certificates of deposit, and U.S. Treasury securities. We also periodically investUnder our Treasury Reserve Policy and bitcoin acquisition strategy, we use a significant portion of our excess cash, in short-term investments with stated maturity dates between three monthsincluding cash generated from capital raising transactions, to acquire bitcoins. In 2023 and one year from the purchase date.2022, we issued and sold 5,097,890 shares and 218,575 shares, respectively, of our class A common stock under our at-the-market equity offering programs for aggregate net proceeds (net of sales commissions and expenses) of $2.020 billion and $46.2 million, respectively. For additional information, see “—At-the-Market Equity Offerings” below.
As of December 31, 20172023 and 2016,2022, the amount of cash and cash equivalents and short-term investments held by our U.S. entities was $293.8$10.5 million and $279.8$14.8 million, respectively, and by our non-U.S. entities was $381.4$36.3 million and $309.6$29.0 million, respectively. We earn a significant amount of our revenues outside the United States and except for Subpart F deemed dividends, we intend to indefinitely reinvest undistributedrepatriated foreign earnings and profits of all of our non-U.S. entities. We do not anticipate needing to repatriate$20.3 million during 2023 and $44.7 million during 2022.
Our material contractual obligations (explained in further detail in the cash or cash equivalents held by non-U.S. entitiesNotes to the United StatesConsolidated Financial Statements, as referenced below) and cash requirements consist of:
•principal and interest payments related to finance our U.S. operations. However,long-term debt (Note 8, Long-term Debt);
•rent payments under the Tax Act, those undistributed earnings (as computed for U.S. federal income tax purposes) are subjectnoncancellable operating leases (Note 7, Leases);
•payments related to the Transition Tax which was recorded at a provisional amount of $40.3 million during the year ended December 31, 2017. We intend(Note 9, Commitments and Contingencies);
•payments under various purchase agreements, primarily related to elect to pay this tax over an eight-year period beginning in 2018. If we were to elect to actually repatriate these amounts, after taking into account the Transition Tax described above, we do not expect such repatriation to generate any additional U.S. federal taxable income to us.third-party cloud hosting services and third-party software supporting our products, marketing, and operations (Note 9, Commitments and Contingencies); and
•ongoing personnel-related expenditures and vendor payments.
We believe that existing cash and cash equivalents and short-term investments held by us and cash and cash equivalents anticipated to be generated by us are sufficient to meet working capital requirements, anticipated capital expenditures, and contractual obligations for at least the next 12 months. Beyond the next 12 months, our long-term cash requirements are primarily for obligations related to our long-term debt. We have principal due upon maturity of our long-term debt instruments in the aggregate of $2.208 billion in addition to $2.4 million in coupon interest due each semi-annual period for the 2025 Convertible Notes, $15.3 million in coupon interest due each semi-annual period for the 2028 Secured Notes, and $0.1 million due monthly in principal and interest related to our other long-term secured debt. We also have long-term cash requirements for obligations related to our operating leases, the Transition Tax, and our various purchase agreements. As of December 31, 2023, we do not expect cash and cash equivalents generated by our enterprise analytics software business to be sufficient to satisfy these obligations. As a result, we would seek to satisfy these obligations through various options that we expect to be available to us, such as refinancing our debt or generating cash from other sources, which may include the issuance and sale of shares of our class A common stock, borrowings collateralized by bitcoin, or the sale of our bitcoin. Furthermore, we may elect to settle the Convertible Notes upon a conversion of such Convertible Notes in cash, shares of our class A common stock, or a combination of cash and shares of class A common stock, which may enable us to reduce the amount of our cash obligations under the Convertible Notes.
The 2028 Secured Notes have a stated maturity date of June 15, 2028, but include a springing maturity feature that will cause the stated maturity date to spring ahead to the date that is (i) 91 days prior to the existing maturity date of the 2025 Convertible Notes (which is September 15, 2025), (ii) 91 days prior to the existing maturity date of the 2027 Convertible Notes (which is November 16, 2026), or (iii) 91 days prior to the maturity date of any future convertible debt that we may issue that is then outstanding, unless on such dates we meet specified liquidity requirements or less than $100,000,000 of aggregate principal amount of the 2025 Convertible Notes, the 2027 Convertible Notes, or such future convertible debt, as applicable, remains outstanding.
As of December 31, 2023, we held approximately 189,150 bitcoins, of which approximately 173,069 are unencumbered. We do not believe we will need to sell or engage in other transactions with respect to any of our bitcoins within the next twelve months to meet our
working capital requirements, although we may from time to time sell or engage in other transactions with respect to our bitcoins as part of treasury management operations, as noted above. The bitcoin market historically has been characterized by significant volatility in its price, limited liquidity and trading volumes compared to sovereign currencies markets, relative anonymity, a developing regulatory landscape, susceptibility to market abuse and manipulation, compliance and internal control failures at exchanges, and various other risks inherent in its entirely electronic, virtual form and decentralized network. During times of instability in the bitcoin market, we may not be able to sell our bitcoins at reasonable prices or at all. As a result, our bitcoins are less liquid than our existing cash and cash equivalents and may not be able to serve as a source of liquidity for us to the same extent as cash and cash equivalents. In addition, upon sale of our bitcoin, we may incur additional taxes related to any realized gains or we may incur capital losses as to which the tax deduction may be limited.
The following table sets forth a summary of our cash flows (in thousands) and related percentage changes for the periods indicated:
| | | | | | | | | | | |
| | Years Ended December 31, | | | % Change | | | % Change | |
| | 2017 | | | 2016 | | | 2015 | | | in 2017 | | | in 2016 | |
Net cash provided by operating activities | | $ | 78,322 | | | $ | 110,589 | | | $ | 149,699 | | | | -29.2 | % | | | -26.1 | % |
Net cash (used in) provided by investing activities | | $ | (69,730 | ) | | $ | 4,344 | | | $ | (7,661 | ) | | | -1705.2 | % | | | -156.7 | % |
Net cash provided by (used in) financing activities | | $ | 1,656 | | | $ | (1,004 | ) | | $ | 9,178 | | | | -264.9 | % | | | -110.9 | % |
| | | | | | | | | | | | |
| | Years Ended December 31, | | | | |
| | 2023 | | | 2022 | | | % Change | |
Net cash provided by operating activities | | $ | 12,712 | | | $ | 3,211 | | | | 295.9 | % |
Net cash used in investing activities | | $ | (1,905,237 | ) | | $ | (278,590 | ) | | | 583.9 | % |
Net cash provided by financing activities | | $ | 1,889,886 | | | $ | 265,188 | | | | 612.7 | % |
Net cash provided by operating activities. The primary source of our cash provided by operating activities is cash collections of our accounts receivable from customers following the sales and renewals of our softwareproduct licenses, technical softwaresubscription services and product support, software updates and upgrades, as well as consulting education, and subscriptioneducation services. Our primary uses of cash in operating activities are for personnel relatedpersonnel-related expenditures for software development, personnel relatedpersonnel-related expenditures for providing consulting, education, and subscription services, and for sales and marketing costs, general and administrative costs, interest expense related to our long-term debt arrangements, and income taxes.
Net cash provided by operating activities was $78.3 million, $110.6 million, In 2023 and $149.7 million during 2017, 2016, and 2015, respectively. The decrease in2022, non-cash items to further reconcile net income (loss) to net cash provided by operating activities during 2017, as compared to the prior year, was due to a $73.3 million decrease in net income, offset by a $36.5 million increase from changes in operating assets and liabilities and a $4.5 million increase from changes in non-cash items. The decrease in net cash provided by operating activities during 2016, as compared to the prior year, was due to a $25.7 million decrease from changes in non-cash items and a $15.0 million decrease in net income, offset by a $1.6 million increase from changes in operating assets and liabilities. Non-cash items generally consist primarily of depreciation and amortization, bad
debt expense,reduction in the carrying amount of operating lease right-of-use assets, credit losses and sales allowances, deferred taxes, release of liabilities for unrecognized tax benefits, share-based compensation expense, digital asset impairment losses, net of gains on sale, amortization of the issuance costs on our long-term debt, and in prior periods only, excess tax benefits from share-based compensation arrangements.gain on extinguishment of debt.
Net cash (used in) provided by investing activities. Theoperating activities increased $9.5 million during 2023, as compared to the prior year, due to a $1.899 billion increase in net income and a $15.6 million increase from changes in netoperating assets and liabilities, partially offset by a $1.905 billion decrease in non-cash items (principally related to digital asset impairment losses and deferred taxes and gain on extinguishment of debt).
Net cash (used in)used in investing activities. In 2023 and 2022, the changes in cash used in and provided by investing activities primarily relate to purchases and redemptionssales of short-term investments,digital assets and expenditures on property and equipment, and capitalized software development costs.equipment. Net cash used in investing activities was $69.7 million and $7.7 millionincreased $1.627 billion during 2017 and 2015, respectively. Net cash provided by investing activities was $4.3 million during 2016. The increase in net cash used in investing activities during 2017,2023, as compared to the prior year, wasprimarily due to a $101.5 million$1.614 billion increase in purchases of short-term investmentsbitcoins and a $1.6an $11.8 million increasedecrease in purchasessales of property and equipment, offset by a $29.0 million increase inbitcoins. During 2023, we purchased $1.902 billion of bitcoin using net proceeds from the redemptionsale of short-term investments. The increase inclass A common stock under our at-the-market offering programs, and Excess Cash. During 2022, we purchased $287.9 million of bitcoin using net proceeds from the issuance of the 2025 Secured Term Loan, net proceeds from the sale of class A common stock under our at-the-market offering program, proceeds from sales of bitcoin, and Excess Cash.
Net cash provided by investingfinancing activities. In 2023 and 2022, the changes in cash provided by and used in financing activities primarily relate to the sale of class A common stock under our at-the-market equity offering program, the issuance and subsequent repayment of our long-term debt, the exercise or vesting of certain awards under the 2013 Equity Plan, and the sales of class A common stock under the 2021 ESPP. Net cash provided by financing activities increased $1.625 billion during 2016,2023, as compared to the prior year, wasprimarily due to (i) a $118.8 million decrease$1.974 billion increase in purchases of short-term investments, a $9.6 million decrease in capitalized software development costs, and a $1.1 million decrease in purchases of property and equipment, offset by a $117.5 million decrease innet proceeds from the redemptionsale of short-term investments.
Net cash provided by (used in) financing activities. The changes in net cash provided by (used in) financing activities primarily relate to the exercise ofclass A common stock options under the 2013 Equity Plan, payments on capital lease and other financing arrangements, and, in prior periods only, excess tax benefits from share-based compensation arrangements. Net cash provided by financing activities was $1.7 million and $9.2 millionour at-the-market equity offering program during 2017 and 2015, respectively. Net cash used in financing activities was $1.0 million during 2016. The increase in net cash provided by financing activities during 2017,2023 as compared to the prior year, was primarily due to2022, (ii) a $3.7$29.1 million payment in 2016 to tax authorities for shares withheld for taxes related to the net exercise of a stock option under the 2013 Equity Plan and a $0.2 million decrease in payments on capital lease and other financing arrangements, partially offset by a $1.2 million decrease in excess tax benefits from share-based compensation arrangements. The increase in net cash used in financing activities during 2016, as compared to the prior year, was primarily due to a $7.9 million decrease in proceeds from the exercise of stock options under the 2013 Equity Plan during 2023 compared to 2022, partially offset by (iii) a $215.4 million decrease in long-term debt proceeds, net of lender fees and issuance costs during 2023 as compared to 2022, (iv) the $160.0 million repayment of the 2025 Secured Term Loan and related third-party extinguishment costs during 2023, which was repaid using proceeds from our sale of class A common stock offered under our at-the-market equity offering program, (v) a $3.7$2.0 million increase in payment of withholding tax on vesting of restricted stock units during 2023 compared to tax authorities2022 and (vi) a $0.5 million decrease in proceeds from the sales of class A common stock under the 2021 ESPP during 2023 compared to 2022.
Long-term Debt
The terms of each of the long-term debt instruments described below are discussed more fully in Note 8, Long-term Debt, to the Consolidated Financial Statements.
In December 2020, we issued $650.0 million aggregate principal amount of the 2025 Convertible Notes and in February 2021, we issued $1.050 billion aggregate principal amount of the 2027 Convertible Notes. We used the net proceeds from the issuance of the Convertible
Notes to acquire bitcoin. During 2023 and 2022, we paid $4.9 million and $4.9 million, respectively, in interest to holders of the 2025 Convertible Notes. The 2027 Convertible Notes do not bear regular interest and we have not paid any special interest to holders of the 2027 Convertible Notes to date.
In June 2021, we issued $500.0 million aggregate principal amount of the 2028 Secured Notes. We used the net proceeds from the issuance of the 2028 Secured Notes to acquire bitcoin. As of December 31, 2023, approximately 16,081 bitcoins held by MicroStrategy Incorporated serve as part of the collateral for shares withheldthe 2028 Secured Notes. During 2023 and 2022, we paid $30.6 million and $30.6 million, respectively, in interest to holders of the 2028 Secured Notes.
In March 2022, MacroStrategy, our wholly-owned subsidiary, entered into a Credit and Security Agreement with Silvergate Bank, pursuant to which Silvergate Bank issued the $205.0 million 2025 Secured Term Loan to MacroStrategy. We used $190.5 million of the net proceeds from the issuance of the 2025 Secured Term Loan to acquire bitcoin, $5.0 million of the net proceeds to establish a reserve account that served as collateral for taxesthe 2025 Secured Term Loan, and the remaining net proceeds to pay fees, interest, and expenses related to the net exercise2025 Secured Term Loan. On March 24, 2023, MacroStrategy and Silvergate Bank entered into a Prepayment, Waiver and Payoff to Credit and Security Agreement, pursuant to which MacroStrategy voluntarily prepaid Silvergate approximately $161.0 million (the “Payoff Amount”), in full repayment, satisfaction, and discharge of a stock optionthe 2025 Secured Term Loan and all other obligations under the 2013Credit and Security Agreement. Upon Silvergate’s receipt of the Payoff Amount on March 24, 2023, the Credit and Security Agreement was terminated, and Silvergate released its security interest in all of MacroStrategy’s assets collateralizing the 2025 Secured Term Loan, including the bitcoin that was serving as collateral. During the first quarter of 2023, we made a final $5.1 million interest payment to Silvergate, $1.1 million of which was included in the Payoff Amount. During 2022 we paid $7.7 million in interest to Silvergate.
In June 2022, we, through one of our wholly-owned subsidiaries, entered into a secured term loan agreement in the amount of $11.1 million, bearing interest at an annual rate of 5.2%, and maturing in June 2027. During 2023 and 2022, we paid $1.1 million and $0.5 million, respectively, in principal and interest to the lender.
At-the-Market Equity Plan, partially offset by a $1.3 million decrease in payments on capital leaseOfferings
During 2022 and other financing arrangements.2023, we entered into various sales agreements with sales agents pursuant to which we could issue and sell shares of our class A common stock through at-the-market equity offering programs. See Note 13, At-the-Market Equity Offerings, to the Consolidated Financial Statements for the terms and provisions of each sales agreement.
Share repurchases. Our BoardThe following table sets forth shares sold and net proceeds received (net of Directors has authorized us to repurchase up to an aggregatesales commissions and expenses) from shares sold under each sales agreement during the years ended December 31, 2023 and 2022 (in thousands, except number of $800.0shares):
| | | | | | | | | | | | | | | | |
| | Years Ended December 31, | |
| | 2023 | | | 2022 | |
| | Shares | | | Net proceeds | | | Shares | | | Net proceeds | |
2022 Sales Agreement | | | 1,348,855 | | | $ | 338,962 | | | | 218,575 | | | $ | 46,219 | |
May 2023 Sales Agreement | | | 1,079,170 | | | | 333,494 | | | n/a | | | n/a | |
August 2023 Sales Agreement | | | 1,592,950 | | | | 737,760 | | | n/a | | | n/a | |
November 2023 Sales Agreement | | | 1,076,915 | | | | 609,873 | | | n/a | | | n/a | |
Total | | | 5,097,890 | | | $ | 2,020,089 | | | | 218,575 | | | $ | 46,219 | |
As of December 31, 2023, approximately $137.8 million of our class A common stock from timeremained available for issuance and sale pursuant to time on the open market through April 29, 2018 (the “2005 Share Repurchase Program”), althoughNovember 2023 Sales Agreement. The remaining sales agreements have been terminated as of December 31, 2023.
Debt repurchases and repayments. During the program may be suspended or discontinued by us at any time. The timingfirst quarter of 2023, MacroStrategy voluntarily prepaid Silvergate the Payoff Amount in full repayment, satisfaction, and amountdischarge of any shares repurchased will be determined by management based on its evaluation of market conditionsthe 2025 Secured Term Loan and all other factors. The 2005 Share Repurchase Program may be funded using working capital, as well as proceeds from any other funding arrangements that we may enter into inobligations under the future.Credit and Security Agreement. During the years ended December 31, 2017, 2016,2023 and 2015,2022, we did not repurchase or prepay any sharesof our other outstanding debt. We or our affiliates may, at any time and from time to time, seek to retire or purchase our outstanding debt through cash purchases and/or exchanges for equity or debt, in open-market purchases, privately negotiated transactions or otherwise. Such repurchases or exchanges, if any, will be upon such terms and at such prices as we may determine, and will depend on prevailing market conditions, our liquidity requirements, contractual restrictions and other factors. We may also prepay our outstanding indebtedness. The amounts involved in any such repurchase or repayment may be material. We may effect debt repurchases or prepayments using proceeds from the sale of our class A common stock pursuant to the 2005 Share Repurchase Program.
Contractual obligations. As disclosed in Note 9, Commitments and Contingencies, to the Consolidated Financial Statements, we lease office space and computer and other equipment under operating lease agreements. Under the lease agreements, in addition to base rent, we are generally responsibleNovember 2023 Sales Agreement (under which approximately $137.8 million remains available for certain taxes, utilities and maintenance costs, and other fees. Several of these leases include options for renewal or purchase. We do not have any material capital leases.
As a resultsale as of the Tax Act, we estimated and recorded a one-time Transition Tax of $40.3 million during the year ended December 31, 2017, and intend to elect to pay this tax over an eight-year period beginning in 2018. See Note 10, Income Taxes, to the Consolidated Financial Statements for further information.date hereof).
The following table shows future minimum rent payments under noncancellable operating leases and agreements with initial terms of greater than one year, net of total future minimum rent payments to be received under noncancellable sublease agreements, and anticipated payments related to the one-time Transition Tax resulting from the Tax Act, based on the expected due dates of the various installments as of December 31, 2017 (in thousands):
| | Payments due by period ended December 31, | |
| | Total | | | 2018 | | | 2019-2020 | | | 2021-2022 | | | Thereafter | |
Contractual Obligations: | | | | | | | | | | | | | | | | | | | | |
Operating leases | | $ | 71,990 | | | $ | 24,508 | | | $ | 38,838 | | | $ | 4,368 | | | $ | 4,276 | |
Transition tax | | | 40,250 | | | | 3,450 | | | | 6,400 | | | | 6,400 | | | | 24,000 | |
Total | | $ | 112,240 | | | $ | 27,958 | | | $ | 45,238 | | | $ | 10,768 | | | $ | 28,276 | |
The above table does not include estimated payments related to the renewal of our corporate headquarters office lease in January 2018. See Note 17, Subsequent Events, to the Consolidated Financial Statements for further information about our corporate headquarters office lease.
Unrecognized tax benefits. As of December 31, 2017,2023, we had $4.0$8.3 million of total gross unrecognized tax benefits, including accrued interest, accrued,all of which was recorded in other“Other long-term liabilities.” The timing of any payments that could result from these unrecognized tax benefits will depend on a number of factors, and accordingly the amount and period of any future payments cannot be estimated. We do not expect any significant tax payments related to unrecognized tax benefits during 2024.
Recent Accounting Standards
See Note 3, Recent Accounting Standards, to the Consolidated Financial Statements for further information.
Non-GAAP Financial Measures
We are providing supplemental non-GAAP financial measures below which management uses internally to help understand, manage, and evaluate our business performance and to help make operating decisions. We believe that these obligations during 2018.non-GAAP financial measures are also useful to investors and analysts in comparing our performance across reporting periods on a consistent basis. We also believe the use of these non-GAAP financial measures can facilitate comparison of our operating results to those of our competitors. These supplemental financial measures are not measurements of financial performance under generally accepted accounting principles in the United States (“GAAP”) and, as a result, these supplemental financial measures may not be comparable to similarly titled measures of other companies.
Off-balance sheet arrangements. AsNon-GAAP financial measures are subject to material limitations as they are not measurements prepared in accordance with GAAP, and are not a substitute for such measurements. For example, we expect that share-based compensation expense, which is excluded from certain of December 31, 2017,the non-GAAP financial measures below, will continue to be a significant recurring expense over the coming years and is an important part of the compensation provided to certain employees, officers, and directors. Similarly, we did not have any off-balance sheet arrangementsexpect that had or were reasonably likely to have a current or future material impactinterest expense arising from the amortization of debt issuance costs on our long-term debt, which is excluded from certain of the non-GAAP financial condition, revenues or expenses, resultsmeasures below, will continue to be a recurring expense over the terms of our long-term debt arrangements. Our non-GAAP financial measures are not meant to be considered in isolation and should be read only in conjunction with our Consolidated Financial Statements, which have been prepared in accordance with GAAP. We rely primarily on such Consolidated Financial Statements to understand, manage, and evaluate our business performance and use the non-GAAP financial measures only supplementally.
Non-GAAP loss from operations
Non-GAAP loss from operations liquidity, capital expenditures, or capital resources.
Recent Accounting Standards
Share-basedexcludes share-based compensation accounting
In March 2016,expense, which is a significant non-cash expense that we believe is not reflective of our general business performance, and for which the FASB issued Accounting Standards Update No. 2016-09, Compensation – Stock Compensation (Topic 718): Improvements to Employee Share-Based Payment Accounting (“ASU 2016-09”), to simplify certain aspects ofaccounting requires management judgment. Consequently, our accounting for share-based payment transactions. Under ASU 2016-09, all excesscompensation expense could vary significantly in comparison to other companies. The following is a reconciliation of our non-GAAP loss from operations to loss from operations, its most directly comparable GAAP measure, (in thousands) for the periods indicated:
| | | | | | | | |
| | Years Ended December 31, | |
| | 2023 | | | 2022 | |
Reconciliation of non-GAAP loss from operations: | | | | | | |
Loss from operations | | $ | (115,047 | ) | | $ | (1,275,742 | ) |
Share-based compensation expense | | | 69,571 | | | | 63,619 | |
Non-GAAP loss from operations | | $ | (45,476 | ) | | $ | (1,212,123 | ) |
Non-GAAP net income (loss) and non-GAAP diluted earnings (loss) per share
Non-GAAP net income (loss) and non-GAAP diluted earnings (loss) per share each exclude the impact of (i) share-based compensation expense, (ii) interest expense arising from the amortization of debt issuance costs on our long-term debt, (iii) gain on extinguishment of debt, and (iv) related income taxes. We believe non-GAAP net income (loss) and non-GAAP diluted earnings (loss) per share offer management and investors insight as they exclude significant non-cash expenses, gains on debt extinguishment, and their related income tax effects. The following are reconciliations of our non-GAAP net income (loss) and non-GAAP diluted earnings (loss) per share to net income (loss) and diluted earnings (loss) per share, respectively, their most directly comparable GAAP measures (in thousands, except per share data), for the periods indicated:
| | | | | | | | |
| | Years Ended December 31, | |
| | 2023 | | | 2022 | |
Reconciliation of non-GAAP net income (loss): | | | | | | |
Net income (loss) | | $ | 429,121 | | | $ | (1,469,797 | ) |
Share-based compensation expense | | | 69,571 | | | | 63,619 | |
Interest expense arising from amortization of debt issuance costs | | | 8,808 | | | | 8,694 | |
Gain on debt extinguishment | | | (44,686 | ) | | | 0 | |
Income tax effects (1) | | | (6,062 | ) | | | (13,250 | ) |
Non-GAAP net income (loss) | | $ | 456,752 | | | $ | (1,410,734 | ) |
| | | | | | |
Reconciliation of non-GAAP diluted earnings (loss) per share (2): | | | | | | |
Diluted earnings (loss) per share | | $ | 26.42 | | | $ | (129.83 | ) |
Share-based compensation expense (per diluted share) | | | 4.20 | | | | 5.62 | |
Interest expense arising from amortization of debt issuance costs (per diluted share) (3) | | | 0.10 | | | | 0.77 | |
Gain on debt extinguishment (per diluted share) | | | (2.70 | ) | | | 0.00 | |
Income tax effects (per diluted share) (3) | | | (0.24 | ) | | | (1.17 | ) |
Non-GAAP diluted earnings (loss) per share | | $ | 27.78 | | | $ | (124.61 | ) |
(1)Income tax effects reflect the net tax effects of share-based compensation expense, which includes tax benefits should be recognizedand expenses on exercises of stock options and vesting of share-settled restricted stock units, interest expense for amortization of debt issuance costs, and gain on debt extinguishment.
(2)For reconciliation purposes, the non-GAAP diluted earnings (loss) per share calculations use the same weighted average shares outstanding as income tax expense or benefitthat used in the income statement, regardlessGAAP diluted earnings (loss) per share calculations for the same period. For example, in periods of whetherGAAP net loss, otherwise dilutive potential shares of common stock from our share-based compensation arrangements and Convertible Notes are excluded from the benefit reduces taxes payableGAAP diluted loss per share calculation as they would be antidilutive, and therefore are also excluded from the non-GAAP diluted earnings or loss per share calculation.
(3)For the year ended December 31, 2023, interest expense from the amortization of issuance costs of the Convertible Notes has been added back to the numerator in the current period. The excess tax benefits will be combined with other income tax cash flows within operating activities in the statement of cash flows. In addition, excess tax benefits or tax deficiencies will no longer be included in the calculation of assumed proceeds under the treasury stock method of computingGAAP diluted earnings per share. ASU 2016-09 also allows companies to make an accounting policy election to either estimate the number of awards expected to vest or to account for forfeitures as they occur, when accruing share-based compensation expense. Lastly, ASU 2016-09 permits employers to withhold upshare calculation (as disclosed in Note 12, Basic and Diluted Earnings (Loss) per Share, to the employee’s maximum statutoryConsolidated Financial Statements), and therefore the per diluted share effects of the amortization of issuance costs of the Convertible Notes have been excluded from the “Interest expense arising from amortization of debt issuance costs (per diluted share)” and “Income tax rateeffects (per diluted share)” lines in applicable jurisdictions and still qualifythe above reconciliation for the exceptionyear ending December 31, 2023.
Non-GAAP Constant Currency Revenues, Cost of Revenues, and Operating Expenses
We present certain of our revenues, cost of revenues, and operating expenses on a non-GAAP constant currency basis, which excludes certain changes resulting from fluctuations in foreign currency exchange rates. These non-GAAP constant currency metrics allow our management and investors to liability classification. Cash paid by an employer when directly withholding shares for tax-withholding purposes should be classified as a financing activity incompare operating results to prior years without the statementeffects of cash flows. We adopted this guidance on January 1, 2017 and have:
| (i)
| recognized excess tax benefits as part of the “Provision for income taxes” line item in our Consolidated Statements of Operations, on a prospective basis.
|
| (ii)
| combined the impact of excess tax benefits with the “Deferred taxes” line item within operating activities in our Consolidated Statements of Cash Flows, on a prospective basis.
|
| (iii)
| excluded excess tax benefits or tax deficiencies in the calculation of our diluted earnings per share, on a prospective basis; and
|
| (iv)
| made an accounting policy election to account for forfeitures as they occur, on a modified retrospective basis, the impact of which is generally consistent with our previous method of estimating forfeitures.
|
No prior periods have been adjusted in connection with our adoption of ASU 2016-09. In addition, no cumulative-effect adjustments to retained earnings have been recorded as of January 1, 2017 because there were no unrecognized excess tax benefits or tax deficiencies outstanding and no expected forfeitures applied to our share-
based compensation expense as of the end of the preceding year. The remaining amendments under ASU 2016-09 did not have a material impact on our consolidated financial position, results of operations, and cash flows.
Statement of cash flows
In November 2016, the FASB issued Accounting Standards Update No. 2016-18, Statement of Cash Flows (Topic 230): Restricted Cash (a consensus of the FASB Emerging Issues Task Force) (“ASU 2016-18”), to address the diversity in practice that currently exists regarding the classification and presentation ofcertain changes in restricted cashforeign currency exchange rates, which are not reflective of our general business performance and may vary significantly between periods. The following are reconciliations of our non-GAAP constant currency revenues, cost of revenues, and operating expenses to their most directly comparable GAAP measures (in thousands) for the periods indicated:
| | | | | | | | | | | | | | | | | | | | | | | | |
| | Years Ended | |
| | December 31, | |
| | GAAP | | | Foreign
Currency
Exchange Rate
Impact (1) | | | Non-GAAP
Constant
Currency (2) | | | GAAP | | | GAAP %
Change | | | Non-GAAP
Constant
Currency %
Change (3) | |
| | 2023 | | | 2023 | | | 2023 | | | 2022 | | | 2023 | | | 2023 | |
Product licenses revenues | | $ | 75,351 | | | $ | 300 | | | $ | 75,051 | | | $ | 86,498 | | | | -12.9 | % | | | -13.2 | % |
Subscription services revenues | | | 81,179 | | | | 296 | | | | 80,883 | | | | 60,746 | | | | 33.6 | % | | | 33.1 | % |
Product support revenues | | | 263,888 | | | | 1,514 | | | | 262,374 | | | | 266,521 | | | | -1.0 | % | | | -1.6 | % |
Other services revenues | | | 75,843 | | | | 186 | | | | 75,657 | | | | 85,499 | | | | -11.3 | % | | | -11.5 | % |
Cost of product support revenues | | | 22,434 | | | | 46 | | | | 22,388 | | | | 21,264 | | | | 5.5 | % | | | 5.3 | % |
Cost of other services revenues | | | 53,805 | | | | 666 | | | | 53,139 | | | | 55,283 | | | | -2.7 | % | | | -3.9 | % |
Sales and marketing expenses | | | 149,671 | | | | 694 | | | | 148,977 | | | | 146,882 | | | | 1.9 | % | | | 1.4 | % |
Research and development expenses | | | 120,530 | | | | (1,163 | ) | | | 121,693 | | | | 127,428 | | | | -5.4 | % | | | -4.5 | % |
General and administrative expenses | | | 115,312 | | | | 235 | | | | 115,077 | | | | 111,421 | | | | 3.5 | % | | | 3.3 | % |
| | | | | | | | | | | | | | | | | | |
| | GAAP | | | Foreign
Currency
Exchange Rate
Impact (1) | | | Non-GAAP
Constant
Currency (2) | | | GAAP | | | GAAP %
Change | | | Non-GAAP
Constant
Currency %
Change (3) | |
| | 2022 | | | 2022 | | | 2022 | | | 2021 | | | 2022 | | | 2022 | |
Product licenses revenues | | $ | 86,498 | | | $ | (2,762 | ) | | $ | 89,260 | | | $ | 101,804 | | | | -15.0 | % | | | -12.3 | % |
Subscription services revenues | | | 60,746 | | | | (2,118 | ) | | | 62,864 | | | | 43,069 | | | | 41.0 | % | | | 46.0 | % |
Product support revenues | | | 266,521 | | | | (11,261 | ) | | | 277,782 | | | | 281,209 | | | | -5.2 | % | | | -1.2 | % |
Other services revenues | | | 85,499 | | | | (5,140 | ) | | | 90,639 | | | | 84,680 | | | | 1.0 | % | | | 7.0 | % |
Cost of product support revenues | | | 21,264 | | | | (745 | ) | | | 22,009 | | | | 19,254 | | | | 10.4 | % | | | 14.3 | % |
Cost of other services revenues | | | 55,283 | | | | (3,956 | ) | | | 59,239 | | | | 54,033 | | | | 2.3 | % | | | 9.6 | % |
Sales and marketing expenses | | | 146,882 | | | | (5,698 | ) | | | 152,580 | | | | 160,141 | | | | -8.3 | % | | | -4.7 | % |
Research and development expenses | | | 127,428 | | | | (2,249 | ) | | | 129,677 | | | | 117,117 | | | | 8.8 | % | | | 10.7 | % |
General and administrative expenses | | | 111,421 | | | | (1,567 | ) | | | 112,988 | | | | 95,501 | | | | 16.7 | % | | | 18.3 | % |
(1)The “Foreign Currency Exchange Rate Impact” reflects the estimated impact of fluctuations in foreign currency exchange rates on the statementinternational components of cash flows. Under ASU 2016-18, entities will be required to include restricted cash and restricted cash equivalents with total cash and cash equivalents when reconciling the beginning and end of period amounts on the statement of cash flows. Entities will also be required to disclose information about the nature of their restricted cash and restricted cash equivalents. Additionally, if cash, cash equivalents, restricted cash and restricted cash equivalents are presented in more than one line item in the statement of financial position, entities will be required to present a reconciliation, either on the face of the statement of cash flows or disclosed in the notes, of the totals in the statement of cash flows to the related line item captions in the statement of financial position. We adopted this guidance on January 1, 2017 and retrospectively applied the required updates to our Consolidated Statements of Cash Flows for allOperations. It shows the increase (decrease) in material international revenues or expenses, as applicable, from the same period in the prior year, based on comparisons to the prior year quarterly average foreign currency exchange rates. Beginning in the third quarter of 2023, the term “international” refers to operations outside of the United States and Canada only where the functional currency is the local currency (i.e., excluding any location whose economy is considered highly inflationary). Prior year comparative periods presented. We do not consider our restricted cash balanceshave been recast to be material for further disclosure or reconciliation. conform to current period presentation.
(2)The
adoption of this guidance did not impact our consolidated financial position, results of operations, or footnote disclosures.Revenue from contracts with customers
In May 2014, the FASB issued Accounting Standards Update No. 2014-09, Revenue from Contracts with Customers (Topic 606) (“ASU 2014-09”), which supersedes nearly all existing revenue recognition guidance. The standard’s core principle is that an entity should recognize revenue when it transfers promised goods or services to customers in an amount that“Non-GAAP Constant Currency” reflects the consideration to whichcurrent period GAAP amount, less the entity expects to be entitled in exchange for those goods or services. Foreign Currency Exchange Rate Impact.
(3)The
standard also requires disclosure of additional information to enable users of financial statements to understand“Non-GAAP Constant Currency % Change” reflects the
nature,percentage change between the current period Non-GAAP Constant Currency amount
timing, and
uncertainty of revenue and cash flows arising from contracts with customers.We will adopt this guidance and its subsequent amendments effective as of January 1, 2018 and will adjust prior period consolidated financial statements to reflect full retrospective adoption, beginning with the Quarterly Report on Form 10-QGAAP amount for the first quarter of 2018. We have substantially completed the implementation of key system changes and changes to internal controls over financial reporting to allow us to timely compile the information needed to account for transactions under this new guidance and to adjust our prior periods’ consolidated financial statements.
In adopting ASU 2014-09, we expect the following significant changes in accounting principles:
| (i)
| Timing of revenue recognition for term license sales. Under ASU 2014-09, we will recognize product license revenue from term licenses upon delivery of the software. Previously, this revenue was recognized over the term of the arrangement.
|
| (ii)
| Timing of revenue recognition for sales to channel partners. Under ASU 2014-09, we will recognize revenue from sales made to resellers and OEMs when control of the products transfers to the reseller or OEM, less adjustments for returns or price protection. Previously, this revenue was not recognized until the product was sold by the reseller or OEM to the end user.
|
| (iii)
| Allocating the transaction price to the performance obligations in the contract. Under ASU 2014-09, we will allocate the transaction price to the various performance obligations in the contract based on their relative standalone selling price (“SSP”). Except for SSP of product support, our methodologies for estimating SSP of our various performance obligations will be generally consistent with our previous methodologies used to establish VSOE of fair value on multiple element arrangements. The SSP of product support will result in a difference in the allocation of the transaction price between product support and product license performance obligations. We expect the impact from SSP-based allocations to be immaterial to the financial statements.
|
| (iv)
| Material rights. Our contracts with customers may include options to acquire additional goods and services at a discount. Under ASU 2014-09, certain of these options may be considered material rights if sold below SSP and would be treated as separate performance obligations and included in the allocation of the transaction price. Previously, none of our options were considered material rights. We expect the impact from material rights to be immaterial to the financial statements.
|
| (v)
| Presentation of accounts receivable, contract assets, and contract liabilities (deferred revenue). Under ASU 2014-09, our rights to consideration are presented separately depending on whether those rights are conditional or unconditional. We will present our unconditional rights to consideration as “accounts receivable” in our Consolidated Balance Sheets. In contrast, separate “contract assets” will represent rights to consideration that are subject to a condition other than the passage of time, and will be comprised primarily of accrued sales- and usage- based royalty revenue. Previously, this revenue was not recognized until quarterly royalty reporting had been received from the OEM. Under ASU 2014-09, once quarterly royalty reporting has been received, the related contract assets will be transferred to accounts receivable. Current and non-current contract assets will be included under “Prepaid expenses and other current assets” and “Deposits and other assets,” respectively, on our Consolidated Balance Sheets. Further, contract assets will be netted against “contract liabilities” at the contract level. Contract liabilities will be presented as “deferred revenue” on our Consolidated Balance Sheets and will be comprised of consideration received, or accounts receivable recorded, prior to the transfer of goods or services to the customer. Under ASU 2014-09, we cannot net accounts receivable with deferred revenue and we will no longer offset our accounts receivable and deferred revenue balances for unpaid items that are included in the deferred revenue balance. Previously, this offsetting of accounts receivable and deferred revenue balances for unpaid amounts was applied in our financial statements.
|
| (vi)
| Deferral of incremental direct costs to obtaining a contract with a customer. Under ASU 2014-09, we will capitalize certain variable compensation (i.e., sales commissions) payable to our sales force and subsequently amortize the capitalized costs over asame period of time that is consistent with the transfer of the related good or service to the customer, which we have determined to be three years. Capitalized costs, net of accumulated amortization, will be included in “Deposits and other assets” on our Consolidated Balance Sheets. Previously, we elected to expense these incremental direct costs as incurred.
|
We currently estimate the adoption of ASU 2014-09 will increase our 2016 beginning retained earnings balance by approximately $13.0 million, offset by a $13.0 million decrease in gross deferred revenues, a $5.0 million decrease in deferred tax assets, net of deferred tax liabilities, a $4.0 million increase in other non-current assets, and a $1.0 million increase in other current assets. In addition, net accounts receivable and net deferred revenues as of December 31, 2017 and 2016 will each further increase by approximately $95.9 million and $101.5 million, respectively, due to no longer offsetting these balances for unpaid amounts included in the gross deferred revenue balances. For the years ended December 31, 2017prior year.
Item 7A. Quantitative and 2016, we estimate $2.5 million and $3.0 million, respectively, of previously expensed variable compensation will be capitalized and amortized over a three-year period. We estimate that product licenses revenues will decrease by approximately $0.5 million and increase by approximately $1.5 million for the years ended December 31, 2017 and 2016, respectively. We also estimate our provision for income taxes will decrease by approximately $1.5 million and increase by approximately $0.5 million for the years ended December 31, 2017 and 2016, respectively.Qualitative Disclosures About Market Risk
Intra-entity asset transfers
In October 2016, the FASB issued Accounting Standards Update No. 2016-16, Income Taxes (Topic 740): Intra-Entity Transfers of Assets Other Than Inventory (“ASU 2016-16”), to improve the accounting for income tax effects of intra-entity transfers of assets other than inventory. Under ASU 2016-16, the deferral of the income tax consequences of intra-entity transfers of assets other than inventory is eliminated. Entities will be required to recognize the income tax consequences of intra-entity transfers of assets other than inventory when the transfers occur. The standard requires a cumulative-effect adjustment directly to retained earnings as of the beginning of the period of adoption using a modified retrospective approach. We will adopt this guidance effective as of January 1, 2018. The adoption of this guidance is not expected to have a material impact on our consolidated financial position, results of operations, or cash flows.
Lease accounting
In February 2016, the FASB issued Accounting Standards Update No. 2016-02, Leases (Topic 842) (“ASU 2016-02”), which requires lease assets and lease liabilities be recognized for all leases, in addition to the disclosure of key information to enable users of financial statements to assess the amount, timing, and uncertainty of cash flows arising from an entity’s leasing arrangements. ASU 2016-02 defines a lease as a contract, or part of a contract, that conveys both (i) the right to obtain economic benefits from and (ii) direct the use of an identified asset for a period of time in exchange for consideration. Under ASU 2016-02, leases are classified as either finance or operating leases. For finance leases, a lessee shall recognize in profit or loss the amortization of the lease asset and interest on the lease liability. For operating leases, a lessee shall recognize in profit or loss a single lease cost, calculated so that the remaining cost of the lease is allocated over the remaining lease term, generally on a straight-line basis. ASU 2016-02 requires the recognition and measurement of leases at the beginning of the earliest period presented using a modified retrospective approach and is effective for interim and annual periods beginning January 1, 2019. Early adoption is permitted. We are currently evaluating the impact of this guidance on our consolidated financial position, results of operations, and cash flows.
Item 7A.
| Quantitative and Qualitative Disclosures About Market Risk
|
The following discussion about our market risk exposures involves forward-looking statements. Actual results could differ materially from those projected in the forward-looking statements.
We are exposed to the impact of both interest ratemarket price changes in bitcoin and foreign currency fluctuations.
Interest Rate Risk.Market Price Risk of Bitcoin. We face exposurehave used a significant portion of our cash, including cash generated from capital raising transactions, to changesacquire bitcoin and, as of December 31, 2023, we held approximately 189,150 bitcoins. The carrying value of our bitcoins as of December 31, 2023 was $3.626 billion, which reflects cumulative impairments of $2.269 billion, on our Consolidated Balance Sheet. As discussed in interest rates primarily relatingNote 2(g), Summary of Significant Accounting Policies – Digital Assets, to the Consolidated Financial Statements, we account for our investments. We generally invest our excess cash in short-term, highly-rated, fixed-rate financial instruments. These fixed-rate instrumentsbitcoin as indefinite-lived intangible assets, which are subject to interest rate risk and may fallimpairment losses if the fair value of our bitcoin decreases below their carrying value at any time since their acquisition. Impairment losses cannot be recovered for any subsequent increase in value if interest rates increase. We do not hold or invest in these fixed-rate instrumentsfair value. For example, the market price of one bitcoin on the Coinbase exchange (our principal market for trading purposes or speculation. Asbitcoin) ranged from a low of $16,490.00 to a high of $45,000.00 during the year ended December 31, 2017,2023, but the carrying value of each bitcoin we held approximately $254.9at the end of the reporting period reflects the lowest price of one bitcoin quoted on the active exchange at any time since its acquisition. Therefore, negative swings in the market price of bitcoin could have a material impact on our earnings and on the carrying value of our digital assets. Positive swings in the market price of bitcoin are not reflected in the carrying value of our digital assets and impact earnings only when the bitcoin is sold at a gain. For the year ended December 31, 2023, we incurred impairment losses of $115.9 million of investments in U.S. Treasury securities and certificates of deposit with stated maturity dates between three months and one year from the purchase date, and we intend to hold these investments until maturity.on our bitcoin.
Foreign Currency Risk. We conduct a significant portion of our business in currencies other than the U.S. dollar, the currency in which we report our Consolidated Financial Statements. International revenues accounted for 41.9%42.7%, 39.3%41.0%, and 38.3%44.7% of our total revenues for the years ended December 31, 2017, 2016,2023, 2022, and 2015,2021, respectively. We anticipate that international revenues will continue to account for a significant portion of our total revenues. The functional currency of each of our foreign subsidiaries is generally the local currency.
Assets and liabilities of our foreign subsidiaries are translated into U.S. dollars at exchange rates in effect as of the applicable balance sheetBalance Sheet date and any resulting translation adjustments are included as an adjustment to stockholders’ equity. Revenues and expenses generated from these subsidiaries are translated at average monthly exchange rates during the quarter in which the transactions occur. GainsTransaction gains and losses arising from transactions denominated in local currenciesa currency other than the functional currency of the entity involved are included in net income.the results of operations.
As a result of transacting in multiple currencies and reporting our financial statementsConsolidated Financial Statements in U.S. dollars, our operating results may be adversely impacted by currency exchange rate fluctuations in the future. The impact of foreign currency exchange rate fluctuations on current and comparable periods is described in Item 7, “Management’sthe “Non-GAAP Financial Measures” section under “Item 7. Management’s Discussion and Analysis of Financial Condition and Results of Operations.”
We cannot predict the effect of exchange rate fluctuations upon our future results. We attempt to minimize our foreign currency risk by converting our excess foreign currency held in foreign jurisdictions to U.S. dollar denominateddollar-denominated cash and investment accounts. Although we were not party to any foreign currency forward contracts as of December 31, 2017, from time to time we have entered into foreign currency forward contracts to hedge certain risks associated with foreign currency exchange rate exposure, and may do so again in the future. We manage the use of foreign exchange derivative instruments centrally, and we do not hold or enter into derivative financial instruments for trading purposes or speculation. See Note 4, Fair Value Measurements, to the Consolidated Financial Statements for further information on foreign currency forward contracts. We cannot be
certain that any future hedging techniques will be successful or that our business, results of operations, financial condition, and cash flows will not be materially adversely affected by exchange rate fluctuations.
As of December 31, 2017,2023, a 10% adverse change in foreign currency exchange rates versus the U.S. dollar would have decreased our aggregate reported cash and cash equivalents and short-term investments by 0.3%5.4%. If average exchange rates during the year ended December 31, 20172023 had changed unfavorably by 10%, our revenues for the year ended December 31, 20172023 would have decreased by 3.9%3.6%. During the year ended December 31, 2017,2023, our revenues were higher by 0.5% as a result of a 1.0%1.5% favorable change in weighted average exchange rates, as compared to the prior year.
Item 8. Financial Statements and Supplementary Data
Item 8.
| Financial Statements and Supplementary Data
|
Our Consolidated Financial Statements, together with the related notes and the associated Reports of Independent Registered Public Accounting Firm, are set forth on the pages indicated in Item 15.
Item 9. Changes in and Disagreements with Accountants on Accounting and Financial Disclosure
None.
Item 9.
63
| Changes in and Disagreements with Accountants on Accounting and Financial Disclosure
|
None.Item 9A. Controls and Procedures
Item 9A.
| Controls and Procedures
|
Evaluation of Disclosure Controls and Procedures
Our management, with the participation of our Chief Executive Officer and Chief Financial Officer, evaluated the effectiveness of our disclosure controls and procedures (as defined in Rules 13a-15(e) and 15d-15(e) under the Exchange Act) as of the end of the period covered by this Annual Report. Management recognizes that any controls and procedures, no matter how well designed and operated, can provide only reasonable assurance of achieving their objectives, and management necessarily applies its judgment in evaluating the cost-benefit relationship of possible controls and procedures. Our disclosure controls and procedures are designed to provide reasonable assurance of achieving their control objectives. Based on the evaluation of our disclosure controls and procedures as of the end of the period covered by this Annual Report, our Chief Executive Officer and Chief Financial Officer concluded that, as of such date, our disclosure controls and procedures were effective at the reasonable assurance level.
Management’s Report on Internal Control Over Financial Reporting
Our management is responsible for establishing and maintaining adequate internal control over financial reporting. Internal control over financial reporting is defined in Rules 13a-15(f) and 15d-15(f) promulgated under the Exchange Act as a process designed by, or under the supervision of, the Company’s principal executive and principal financial officers and effected by the Company’s Board of Directors, management, and other personnel, to provide reasonable assurance regarding the reliability of financial reporting and the preparation of financial statements for external purposes in accordance with generally accepted accounting principles.GAAP. Such internal control includes those policies and procedures that:
Pertainthat (i) pertain to the maintenance of records that, in reasonable detail, accurately and fairly reflect the transactions and dispositions of the assets of the Company;
ProvideCompany, (ii) provide reasonable assurance that transactions are recorded as necessary to permit preparation of financial statements in accordance with generally accepted accounting principles,GAAP, and that receipts and expenditures of the Company are being made only in accordance with authorizations of management and directors of the Company;Company, and
Provide (iii) provide reasonable assurance regarding prevention or timely detection of unauthorized acquisition, use, or disposition of the Company’s assets that could have a material effect on the financial statements.
Because of its inherent limitations, internal control over financial reporting may not prevent or detect misstatements. Projections of any evaluation of effectiveness to future periods are subject to the risk that the control may become
inadequate because of changes in conditions, or that the degree of compliance with the policies or procedures may deteriorate.
OurUnder the oversight of our Chief Executive Officer and Chief Financial Officer, our management assessedconducted an assessment of the effectiveness of our internal control over financial reporting as of December 31, 2017. In making this assessment, our management used2023 based on the criteria set forth in Internal Control-Integrated Framework (2013) issued by the Committee of Sponsoring Organizations of the Treadway Commission (COSO). Based on its assessment, our management has determined that, as of December 31, 2017,2023, our internal control over financial reporting is effective based on those criteria.
Our independent registered public accounting firm, KPMG LLP, which audited the Consolidated Financial Statements included in this Annual Report, has issued an attestation report on our internal control over financial reporting. This report is included in the Reports of Independent Registered Public Accounting Firm in Item“Item 15. Exhibits, Financial Statement Schedules.”
Changes in Internal Control Over Financial Reporting
During the third quarter of 2016, we began implementing a plan to transformNo change in our worldwide finance and accounting organization. Previously, our finance and accounting activities relating to each of the countries where we operate were decentralized, and conducted by personnel based within each respective country. As of the end of the second quarter of 2017, we had completed this transformation. The transformation resulted in the consolidation of our worldwide finance and accounting functions into three geographically based centers of excellence. While the nature and operation of our key transaction-level controls did not materially change as a result of the transformation, the personnel executing the controls and the locations where the controls are performed have changed. Additionally, during the second quarter of 2017, we implemented a new professional service automation system to track billable time used to invoice customers, as well as process internal business travel and entertainment expenses. The implementation of this new system did not change the underlying internal controls.
Throughout 2017, in order to facilitate our adoption of the new revenue recognition accounting standard on January 1, 2018, we implemented internal controls to help ensure we properly evaluated our customer contracts, executed key system changes, and assessed the impact to our consolidated financial statements. We expect to continue to implement additional internal controls related to the adoption of this standard in the first quarter of 2018.
We also continue to evaluate the impact of the Tax Act on our internal controls over financial reporting, but do not currently expect this new legislation will require us to make significant changes to our existing internal controls related to income taxes.
We believe that we have maintained appropriate internal control over financial reporting (as defined in Rules 13a-15(f) and 15d-15(f) under the Exchange Act) occurred during the fiscal yearthree months ended December 31, 2017.2023 that has materially affected, or is reasonably likely to materially affect, our internal control over financial reporting.
Item 9B.
64
| Other Information
|
None.Item 9B. Other Information
2023 Cash Bonus Determinations for Certain Executive Officers
On February 13, 2024, the Company’s Compensation Committee determined a cash bonus award for the following executive officer of the Company in the amount set forth opposite his name, with respect to his performance in 2023:
| | | | |
Phong Le |
| $ | 680,000 | |
President & Chief Executive Officer |
|
|
| |
The Company’s Compensation Committee determined the foregoing award based on its subjective evaluation of the Company’s Chief Executive Officer’s performance in the context of general economic and industry conditions and Company performance during 2023.
On February 13, 2024, the Company’s Chief Executive Officer determined cash bonus awards for the following executive officers of the Company in the amounts set forth opposite their respective names, in each case with respect to the executive’s performance in 2023:
| | | | |
Andrew Kang |
| $ | 425,000 | |
Senior Executive Vice President & Chief Financial Officer |
|
|
| |
W. Ming Shao |
| $ | 425,000 | |
Senior Executive Vice President & General Counsel |
|
|
| |
The Chief Executive Officer determined the foregoing awards based on his subjective evaluation of the applicable executive’s performance in the context of general economic and industry conditions and Company performance during 2023.
Salary Determinations for Certain Executive Officers
On February 13, 2024, the Company’s Compensation Committee approved the annual salaries of the following executive officers of the Company, in the amounts set forth opposite their names, effective January 1, 2024:
| | | | |
Michael Saylor Executive Chairman |
| $ | 1 | |
Phong Le |
| $ | 1,000,000 |
|
On February 13, 2024, the Company’s Chief Executive Officer approved the annual salaries of the following executive officers of the Company, resulting in the amounts set forth opposite their respective names, effective January 1, 2024:
| | | | |
Andrew Kang |
| $ | 640,000 | |
W. Ming Shao |
| $ | 640,000 |
|
Annual Discretionary Cash Bonus Targets for Certain Executive Officers
On February 13, 2024, the Company’s Compensation Committee established an annual discretionary cash bonus target for 2024 for the following executive officer of the Company in the amount set forth opposite his name:
An award pursuant to the foregoing discretionary cash bonus target will be determined by the Company’s Compensation Committee based on its subjective evaluation of Mr. Le’s performance in the context of general economic and industry conditions and the Company’s performance and achievement of its operational objectives during the year.
On February 13, 2024, the Company’s Chief Executive Officer established annual discretionary cash bonus targets for 2024 for the following executive officers of the Company in the amounts set forth opposite their respective names:
| | | | |
Andrew Kang |
| $ | 500,000 | |
W. Ming Shao |
| $ | 500,000 |
|
Awards pursuant to the foregoing discretionary cash bonus targets will be determined by the Company’s Chief Executive Officer based on his subjective evaluation of the applicable executive’s performance in the context of general economic and industry conditions and Company performance and achievement of its operational objectives during the year.
PART IIIRule 10b5-1 Information
None of our directors or officers adopted or terminated a Rule 10b5-1 trading arrangement or a non-Rule 10b5-1 trading arrangement (as defined in Item 408(c) of Regulation S-K) during the fourth quarter of 2023.
Item 9C. Disclosure Regarding Foreign Jurisdictions that Prevent Inspections
None.
Item 10.
66
| Directors, Executive Officers and Corporate Governance
|
PART III
Item 10. Directors, Executive Officers and Corporate Governance
The information required by this Item is incorporated herein by reference to the information provided under the headings “Executive Officers of the Company,” “Election of Directors – Nominees,” and “Corporate Governance and the Board of Directors and its Committees” in our definitive proxy statement to be filed with the SEC not later than 120 days after the fiscal year ended December 31, 20172023 (the “2018“2024 Proxy Statement”).
Item 11.
| Executive Compensation
|
Item 11. Executive Compensation
The information required by this Item (other than the information required by Item 402(v) of Regulation S-K) is incorporated herein by reference to the information provided under the headings “Executive and Director Compensation,” “Compensation Committee Report,” and “Corporate Governance and the Board of Directors and its Committees – Compensation Committee” in the 20182024 Proxy Statement.
Item 12.
| Security Ownership of Certain Beneficial Owners and Management and Related Stockholder Matters
|
Item 12. Security Ownership of Certain Beneficial Owners and Management and Related Stockholder Matters
The information required by this Item is incorporated herein by reference to the information provided under the headings “Security Ownership of Certain Beneficial Owners and Management,”Management” and “Executive and Director Compensation” in the 20182024 Proxy Statement.
Item 13.
| Certain Relationships and Related Transactions, and Director Independence
|
Item 13. Certain Relationships and Related Transactions, and Director Independence
The information required by this Item is incorporated herein by reference to the information provided under the heading “Corporate Governance and the Board of Directors and its Committees” in the 20182024 Proxy Statement.
Item 14.
| Principal Accountant Fees and Services
|
Item 14. Principal Accountant Fees and Services
The information required by this Item is incorporated herein by reference to the information provided under the heading “Independent Registered Public Accounting Firm Fees and Services” in the 20182024 Proxy Statement.
PART IV
Item 15.
| Exhibits, Financial Statement Schedules
|
(a)
| The following documents are filed as part of this Annual Report on Form 10-K:
|
Item 15. Exhibits, Financial Statement Schedules
(a) The following documents are filed as part of this Annual Report:
(b) Exhibits
We hereby file as part of this Annual Report on Form 10‑K the exhibits listed in the Index to Exhibits.
(c)
| Financial Statement Schedule
|
(c) Financial Statement Schedule
The following financial statement schedule is filed herewith:
Schedule II—Valuation and Qualifying Accounts
All other items included in an Annual Report on Form 10‑K are omitted because they are not applicable or the answers thereto are none.
Item 16. Form 10-K Summary
None.
Report of Independent RegisteredRegistered Public Accounting Firm
To the stockholdersStockholders and boardBoard of directors
Directors of MicroStrategy Incorporated:
Opinion on Internal Control Over Financial Reporting
We have audited MicroStrategy Incorporated and subsidiaries’subsidiaries' (the “Company”)Company) internal control over financial reporting as of December 31, 2017,2023, based on criteria established in Internal Control —– Integrated Framework (2013) issued by the Committee of Sponsoring Organizations of the Treadway Commission. In our opinion, the Company maintained, in all material respects, effective internal control over financial reporting as of December 31, 2017,2023, based on criteria established in Internal Control – Integrated Framework (2013) issued by the Committee of Sponsoring Organizations of the Treadway Commission.
We also have audited, in accordance with the standards of the Public Company Accounting Oversight Board (United States) (“PCAOB”)(PCAOB), the consolidated balance sheets of the Company as of December 31, 20172023 and 2016,2022, the related consolidated statements of operations, comprehensive income (loss), stockholders’ equity (deficit), and cash flows for each of the years in the three-year period ended December 31, 2017,2023, and the related notes and the financial statement schedule, listed in the index appearing under Item 15(a)(3)Schedule II, Valuation and Qualifying Accounts (collectively, the “consolidatedconsolidated financial statements”)statements), and our report dated February 7, 201815, 2024 expressed an unqualified opinion on those consolidated financial statements.
Basis for Opinion
The Company’s management is responsible for maintaining effective internal control over financial reporting and for its assessment of the effectiveness of internal control over financial reporting, included in the accompanying Management’s Report on Internal Control Over Financial Reporting. Our responsibility is to express an opinion on the Company’s internal control over financial reporting based on our audit. We are a public accounting firm registered with the PCAOB and are required to be independent with respect to the Company in accordance with the U.S. federal securities laws and the applicable rules and regulations of the Securities and Exchange Commission and the PCAOB.
We conducted our audit in accordance with the standards of the PCAOB. Those standards require that we plan and perform the audit to obtain reasonable assurance about whether effective internal control over financial reporting was maintained in all material respects. Our audit of internal control over financial reporting included obtaining an understanding of internal control over financial reporting, assessing the risk that a material weakness exists, and testing and evaluating the design and operating effectiveness of internal control based on the assessed risk. Our audit also included performing such other procedures as we considered necessary in the circumstances. We believe that our audit provides a reasonable basis for our opinion.
Definition and Limitations of Internal Control Over Financial Reporting
A company’s internal control over financial reporting is a process designed to provide reasonable assurance regarding the reliability of financial reporting and the preparation of financial statements for external purposes in accordance with generally accepted accounting principles. A company’s internal control over financial reporting includes those policies and procedures that (1) pertain to the maintenance of records that, in reasonable detail, accurately and fairly reflect the transactions and dispositions of the assets of the company; (2) provide reasonable assurance that transactions are recorded as necessary to permit preparation of financial statements in accordance with generally accepted accounting principles, and that receipts and expenditures of the company are being made only in accordance with authorizations of management and directors of the company; and (3) provide reasonable assurance regarding prevention or timely detection of unauthorized acquisition, use, or disposition of the company’s assets that could have a material effect on the financial statements.
Because of its inherent limitations, internal control over financial reporting may not prevent or detect misstatements. Also, projections of any evaluation of effectiveness to future periods are subject to the risk that controls may become inadequate because of changes in conditions, or that the degree of compliance with the policies or procedures may deteriorate.
/s/ KPMG LLP
McLean, Virginia
February 7, 201815, 2024
Report of Independent Registered Public Accounting Firm
To the stockholdersStockholders and boardBoard of directors
Directors of MicroStrategy Incorporated:
Opinion on the Consolidated Financial Statements
We have audited the accompanying consolidated balance sheets of MicroStrategy Incorporated and subsidiaries (the “Company”)Company) as of December 31, 20172023 and 2016,2022, the related consolidated statements of operations, comprehensive income (loss), stockholders’ equity (deficit), and cash flows for each of the years in the three yearthree-year period ended December 31, 2017,2023, and the related notes and the financial statement schedule, listed in the index appearing under Item 15(a)(3)Schedule II, Valuation and Qualifying Accounts, (collectively, the “consolidatedconsolidated financial statements”)statements). In our opinion, the consolidated financial statements present fairly, in all material respects, the financial position of the Company as of December 31, 20172023 and 2016,2022, and the results of its operations and its cash flows for each of the years in the three yearthree-year period ended December 31, 2017,2023, in conformity with U.S. generally accepted accounting principles.
We also have audited, in accordance with the standards of the Public Company Accounting Oversight Board (United States) (“PCAOB”)(PCAOB), the Company’s internal control over financial reporting as of December 31, 2017,2023, based on criteria established in Internal Control – Integrated Framework (2013) issued by the Committee of Sponsoring Organizations of the Treadway Commission, and our report dated February 7, 201815, 2024 expressed an unqualified opinion on the effectiveness of the Company’s internal control over financial reporting.
Basis for Opinion
These consolidated financial statements are the responsibility of the Company’s management. Our responsibility is to express an opinion on these consolidated financial statements based on our audits. We are a public accounting firm registered with the PCAOB and are required to be independent with respect to the Company in accordance with the U.S. federal securities laws and the applicable rules and regulations of the Securities and Exchange Commission and the PCAOB.
We conducted our audits in accordance with the standards of the PCAOB. Those standards require that we plan and perform the audit to obtain reasonable assurance about whether the consolidated financial statements are free of material misstatement, whether due to error or fraud. Our audits included performing procedures to assess the risks of material misstatement of the consolidated financial statements, whether due to error or fraud, and performing procedures that respond to those risks. Such procedures included examining, on a test basis, evidence regarding the amounts and disclosures in the consolidated financial statements. Our audits also included evaluating the accounting principles used and significant estimates made by management, as well as evaluating the overall presentation of the consolidated financial statements. We believe that our audits provide a reasonable basis for our opinion.
Critical Audit Matters
The critical audit matters communicated below are matters arising from the current period audit of the consolidated financial statements that were communicated or required to be communicated to the audit committee and that: (1) relate to accounts or disclosures that are material to the consolidated financial statements and (2) involved our especially challenging, subjective, or complex judgments. The communication of critical audit matters does not alter in any way our opinion on the consolidated financial statements, taken as a whole, and we are not, by communicating the critical audit matters below, providing separate opinions on the critical audit matters or on the accounts or disclosures to which they relate.
Evaluation of standalone selling price for standard product support
As discussed in Note 2(n) to the consolidated financial statements, the Company typically sells its software licenses (product licenses) together with technical support services and rights to when-and-if available software upgrades (standard product support). Product license revenue is recognized at the point when control to the license is transferred to the customer while standard product support revenue is recognized ratably over the term of the product support period. The accounting for revenue from contracts with multiple performance obligations requires the transaction price to be allocated to each distinct performance obligation based on their respective relative standalone selling price (SSP). Because product licenses are not sold on a standalone basis and because pricing is highly variable, the Company establishes SSP of product licenses using a residual approach after first establishing the SSP of standard product support based on observable standalone sales with pricing within a narrow range as a percentage of the net license fee.
We identified the evaluation of the SSP for standard product support as a critical audit matter. Especially subjective auditor judgment was required in evaluating the range of prices used to establish the SSP for standard product support which directly affects the amount of product license revenue recognized using a residual approach. Changes to the product support fee range could have a significant impact on the determination of the SSP for standard product support, impacting the amount and timing of revenues recognized.
The following are the primary procedures we performed to address this critical audit matter. We evaluated the design and tested the operating effectiveness of certain internal controls over the Company’s revenue process, including controls over the methodology used to determine the standard product support SSP and controls over the Company’s validation of the underlying data used in the SSP analysis. We assessed the range of prices based on observable inputs the Company used to determine SSP of standard product support by comparing them to the selling prices of standalone renewals for standard product support and evaluating whether the standalone prices were sufficiently clustered within a narrow range.
Evaluation of audit evidence pertaining to the existence and control of the digital assets
As discussed in Notes 2(g) and 4 to the consolidated financial statements, the Company accounts for its digital assets as indefinite-lived intangible assets. The digital assets are recorded at cost, net of any impairment losses incurred since acquisition. As of December 31, 2023, the carrying value of the Company’s digital assets was $3.626 billion, net of $2.269 billion in cumulative impairments.
We identified the evaluation of audit evidence pertaining to the existence of the digital assets and whether the Company controls the digital assets as a critical audit matter. Especially subjective auditor judgment was involved in determining the nature and extent of evidence required to assess the existence of the digital assets and whether the Company controls the digital assets, as control over the digital assets is provided through private cryptographic keys stored using third-party custodial services at multiple locations that are geographically dispersed. In addition, information technology (IT) professionals with specialized skills and knowledge in blockchain technology were needed to assist in the evaluation of the sufficiency of certain audit procedures.
The following are the primary procedures we performed to address this critical audit matter. We evaluated the design and tested the operating effectiveness of certain internal controls over the digital assets process, including a control over the comparison of the Company’s records of digital assets held to the custodial records. We involved IT professionals with specialized skills and knowledge in blockchain technology, who assisted in evaluating certain internal controls over the digital assets process performed at the custodial locations, related specifically to the generation of the private cryptographic keys, the storing of these keys, and the reconciliation of digital assets per the custodial service ledgers to the public blockchain. We obtained confirmation of the Company’s digital assets in custody as of December 31, 2023 and compared the total digital assets confirmed to the Company’s record of digital asset holdings. We also compared the Company’s record of digital asset transactions to the records on the public blockchain using a software audit tool. We applied auditor judgment in determining the nature and extent of audit evidence required, especially related to assessing the existence of the digital assets and whether the Company controls the digital assets. We evaluated the sufficiency and appropriateness of audit evidence obtained by assessing the results of procedures performed over the digital assets.
/s/ KPMG LLP
We have served as the Company’s auditor since 2013.
McLean, Virginia
February 7, 2018
15, 2024
MICROSTRATEGY INCORPORATED
CONSOLIDATED BALANCE SHEETS
(in thousands, except per share data)
| | | | December 31, | | December 31, | |
| | December 31, | | | December 31, | | | 2023 | | | 2022 | |
| | 2017 | | | 2016 | | | | | | |
Assets | | | | | | | | | | | | | |
Current assets: | | | | | | | | | | | | | |
Cash and cash equivalents | | $ | 420,244 | | | $ | 401,975 | | | $ | 46,817 | | | $ | 43,835 | |
Restricted cash | | | 938 | | | | 737 | | | | 1,856 | | | | 7,033 | |
Short-term investments | | | 254,927 | | | | 187,408 | |
Accounts receivable, net | | | 69,500 | | | | 83,319 | | | | 183,815 | | | | 189,280 | |
Prepaid expenses and other current assets | | | 18,002 | | | | 11,548 | | | | 35,407 | | | | 24,418 | |
Total current assets | | | 763,611 | | | | 684,987 | | | | 267,895 | | | | 264,566 | |
Digital assets | | | | 3,626,476 | | | | 1,840,028 | |
Property and equipment, net | | | 53,359 | | | | 57,436 | | | | 28,941 | | | | 32,311 | |
Capitalized software development costs, net | | | 2,499 | | | | 8,497 | |
Right-of-use assets | | | | 57,343 | | | | 61,299 | |
Deposits and other assets | | | 2,868 | | | | 5,695 | | | | 24,300 | | | | 23,916 | |
Deferred tax assets, net | | | 13,391 | | | | 11,704 | | | | 757,573 | | | | 188,152 | |
Total assets | | $ | 835,728 | | | $ | 768,319 | | | $ | 4,762,528 | | | $ | 2,410,272 | |
Liabilities and Stockholders’ Equity | | | | | | | | |
Liabilities and Stockholders’ Equity (Deficit) | | | | | | |
Current liabilities: | | | | | | | | | | | | | |
Accounts payable and accrued expenses | | $ | 30,711 | | | $ | 36,628 | |
Accounts payable, accrued expenses, and operating lease liabilities | | | $ | 43,090 | | | $ | 42,976 | |
Accrued compensation and employee benefits | | | 41,498 | | | | 43,323 | | | | 50,045 | | | | 53,716 | |
Deferred revenue and advance payments, net | | | 112,649 | | | | 105,535 | |
Accrued interest | | | | 1,493 | | | | 2,829 | |
Current portion of long-term debt, net | | | | 483 | | | | 454 | |
Deferred revenue and advance payments | | | | 228,162 | | | | 217,428 | |
Total current liabilities | | | 184,858 | | | | 185,486 | | | | 323,273 | | | | 317,403 | |
Deferred revenue and advance payments, net | | | 10,181 | | | | 13,915 | |
Long-term debt, net | | | | 2,182,108 | | | | 2,378,560 | |
Deferred revenue and advance payments | | | | 8,524 | | | | 12,763 | |
Operating lease liabilities | | | | 61,086 | | | | 67,344 | |
Other long-term liabilities | | | 50,146 | | | | 16,447 | | | | 22,208 | | | | 17,124 | |
Deferred tax liabilities | | | 4 | | | | 294 | | | | 357 | | | | 198 | |
Total liabilities | | | 245,189 | | | | 216,142 | | | | 2,597,556 | | | | 2,793,392 | |
Commitments and Contingencies | | | | | | | | | | | | | |
Stockholders’ Equity | | | | | | | | |
Stockholders’ Equity (Deficit) | | | | | | |
Preferred stock undesignated, $0.001 par value; 5,000 shares authorized; no shares issued or outstanding | | | 0 | | | | 0 | | | | 0 | | | | 0 | |
Class A common stock, $0.001 par value; 330,000 shares authorized; 15,817 shares issued and 9,412 shares outstanding, and 15,805 shares issued and 9,400 shares outstanding, respectively | | | 16 | | | | 16 | |
Class B convertible common stock, $0.001 par value; 165,000 shares authorized; 2,035 shares issued and outstanding, and 2,035 shares issued and outstanding, respectively | | | 2 | | | | 2 | |
Class A common stock, $0.001 par value; 330,000 shares authorized; 23,588 shares issued and 14,904 shares outstanding, and 18,269 shares issued and 9,585 shares outstanding, respectively | | | | 24 | | | | 18 | |
Class B convertible common stock, $0.001 par value; 165,000 shares authorized; 1,964 shares issued and outstanding, and 1,964 shares issued and outstanding, respectively | | | | 2 | | | | 2 | |
Additional paid-in capital | | | 559,918 | | | | 543,974 | | | | 3,957,728 | | | | 1,841,120 | |
Treasury stock, at cost; 6,405 shares | | | (475,184 | ) | | | (475,184 | ) |
Treasury stock, at cost; 8,684 shares and 8,684 shares, respectively | | | | (782,104 | ) | | | (782,104 | ) |
Accumulated other comprehensive loss | | | (5,968 | ) | | | (10,743 | ) | | | (11,444 | ) | | | (13,801 | ) |
Retained earnings | | | 511,755 | | | | 494,112 | |
Total stockholders’ equity | | | 590,539 | | | | 552,177 | |
Total liabilities and stockholders’ equity | | $ | 835,728 | | | $ | 768,319 | |
Accumulated deficit | | | | (999,234 | ) | | | (1,428,355 | ) |
Total stockholders’ equity (deficit) | | | | 2,164,972 | | | | (383,120 | ) |
Total liabilities and stockholders’ equity (deficit) | | | $ | 4,762,528 | | | $ | 2,410,272 | |
The accompanying notes are an integral part of these Consolidated Financial Statements.
MICROSTRATEGY INCORPORATED
CONSOLIDATED STATEMENTS OF OPERATIONS
(in thousands, except per share data)
| | | Years Ended December 31, | | | Years Ended December 31, | |
| | 2017 | | | 2016 | | | 2015 | | | 2023 | | | 2022 | | | 2021 | |
Revenues: | | | | | | | | | | | | | | | | | | | |
Product licenses | | $ | 93,969 | | | $ | 113,503 | | | $ | 119,143 | | | $ | 75,351 | | | $ | 86,498 | | | $ | 101,804 | |
Subscription services | | | 32,368 | | | | 30,574 | | | | 27,839 | | | | 81,179 | | | | 60,746 | | | | 43,069 | |
Total product licenses and subscription services | | | 126,337 | | | | 144,077 | | | | 146,982 | | | | 156,530 | | | | 147,244 | | | | 144,873 | |
Product support | | | 289,174 | | | | 285,079 | | | | 281,740 | | | | 263,888 | | | | 266,521 | | | | 281,209 | |
Other services | | | 89,032 | | | | 83,005 | | | | 101,147 | | | | 75,843 | | | | 85,499 | | | | 84,680 | |
Total revenues | | | 504,543 | | | | 512,161 | | | | 529,869 | | | | 496,261 | | | | 499,264 | | | | 510,762 | |
Cost of revenues: | | | | | | | | | | | | | | | | | | | |
Product licenses | | | 7,176 | | | | 8,573 | | | | 8,118 | | | | 1,929 | | | | 1,672 | | | | 1,721 | |
Subscription services | | | 13,435 | | | | 12,765 | | | | 13,051 | | | | 31,776 | | | | 24,770 | | | | 16,901 | |
Total product licenses and subscription services | | | 20,611 | | | | 21,338 | | | | 21,169 | | | | 33,705 | | | | 26,442 | | | | 18,622 | |
Product support | | | 17,481 | | | | 15,001 | | | | 12,748 | | | | 22,434 | | | | 21,264 | | | | 19,254 | |
Other services | | | 58,557 | | | | 56,808 | | | | 67,191 | | | | 53,805 | | | | 55,283 | | | | 54,033 | |
Total cost of revenues | | | 96,649 | | | | 93,147 | | | | 101,108 | | | | 109,944 | | | | 102,989 | | | | 91,909 | |
Gross profit | | | 407,894 | | | | 419,014 | | | | 428,761 | | | | 386,317 | | | | 396,275 | | | | 418,853 | |
Operating expenses: | | | | | | | | | | | | | | | | | | | |
Sales and marketing | | | 174,612 | | | | 158,740 | | | | 148,522 | | | | 149,671 | | | | 146,882 | | | | 160,141 | |
Research and development | | | 78,766 | | | | 73,142 | | | | 65,206 | | | | 120,530 | | | | 127,428 | | | | 117,117 | |
General and administrative | | | 80,161 | | | | 79,462 | | | | 80,732 | | | | 115,312 | | | | 111,421 | | | | 95,501 | |
Restructuring costs | | | 0 | | | | 45 | | | | 279 | |
Digital asset impairment losses (gains on sale), net | | | | 115,851 | | | | 1,286,286 | | | | 830,621 | |
Total operating expenses | | | 333,539 | | | | 311,389 | | | | 294,739 | | | | 501,364 | | | | 1,672,017 | | | | 1,203,380 | |
Income from operations | | | 74,355 | | | | 107,625 | | | | 134,022 | |
Interest income, net | | | 5,205 | | | | 2,203 | | | | 284 | |
Loss from operations | | | | (115,047 | ) | | | (1,275,742 | ) | | | (784,527 | ) |
Interest expense, net | | | | (48,960 | ) | | | (53,136 | ) | | | (29,149 | ) |
Gain on debt extinguishment | | | | 44,686 | | | | 0 | | | | 0 | |
Other (expense) income, net | | | (6,953 | ) | | | 3,218 | | | | 3,558 | | | | (5,204 | ) | | | 6,413 | | | | 2,287 | |
Income before income taxes | | | 72,607 | | | | 113,046 | | | | 137,864 | |
Provision for income taxes | | | 54,964 | | | | 22,138 | | | | 31,933 | |
Net income | | | 17,643 | | | | 90,908 | | | | 105,931 | |
Basic earnings per share (1) | | $ | 1.54 | | | $ | 7.96 | | | $ | 9.33 | |
Weighted average shares outstanding used in computing basic earnings per share | | | 11,444 | | | | 11,425 | | | | 11,355 | |
Diluted earnings per share (1) | | $ | 1.53 | | | $ | 7.89 | | | $ | 9.18 | |
Weighted average shares outstanding used in computing diluted earnings per share | | | 11,547 | | | | 11,516 | | | | 11,539 | |
Loss before income taxes | | | | (124,525 | ) | | | (1,322,465 | ) | | | (811,389 | ) |
(Benefit from) provision for income taxes | | | | (553,646 | ) | | | 147,332 | | | | (275,909 | ) |
Net income (loss) | | | | 429,121 | | | | (1,469,797 | ) | | | (535,480 | ) |
Basic earnings (loss) per share (1) | | | $ | 31.39 | | | $ | (129.83 | ) | | $ | (53.44 | ) |
Weighted average shares outstanding used in computing basic earnings (loss) per share | | | | 13,671 | | | | 11,321 | | | | 10,020 | |
Diluted earnings (loss) per share (1) | | | $ | 26.42 | | | $ | (129.83 | ) | | $ | (53.44 | ) |
Weighted average shares outstanding used in computing diluted earnings (loss) per share | | | | 16,566 | | | | 11,321 | | | | 10,020 | |
(1)
| Basic and fully diluted earnings per share for class A and class B common stock are the same.
|
(1) Basic and fully diluted earnings (loss) per share for class A and class B common stock are the same.
The accompanying notes are an integral part of these Consolidated Financial Statements.
MICROSTRATEGY INCORPORATED
CONSOLIDATED STATEMENTS OF COMPREHENSIVE INCOME (LOSS)
(in thousands)
| | Years Ended December 31, | |
| | 2017 | | | 2016 | | | 2015 | |
Net income | | $ | 17,643 | | | $ | 90,908 | | | $ | 105,931 | |
Other comprehensive gain (loss), net of applicable taxes: | | | | | | | | | | | | |
Foreign currency translation adjustment | | | 4,805 | | | | (3,347 | ) | | | (3,018 | ) |
Less: reclassification adjustment for translation gain included in other income | | | 0 | | | | 0 | | | | 280 | |
Foreign currency translation adjustment, net | | | 4,805 | | | | (3,347 | ) | | | (2,738 | ) |
Unrealized (loss) gain on short-term investments | | | (30 | ) | | | 12 | | | | (27 | ) |
Total other comprehensive gain (loss) | | | 4,775 | | | | (3,335 | ) | | | (2,765 | ) |
Comprehensive income | | $ | 22,418 | | | $ | 87,573 | | | $ | 103,166 | |
| | | | | | | | | | | | |
| | Years Ended December 31, | |
| | 2023 | | | 2022 | | | 2021 | |
Net income (loss) | | $ | 429,121 | | | $ | (1,469,797 | ) | | $ | (535,480 | ) |
Other comprehensive income (loss), net of applicable taxes: | | | | | | | | | |
Foreign currency translation adjustment | | | 2,357 | | | | (6,258 | ) | | | (3,658 | ) |
Total other comprehensive income (loss) | | | 2,357 | | | | (6,258 | ) | | | (3,658 | ) |
Comprehensive income (loss) | | $ | 431,478 | | | $ | (1,476,055 | ) | | $ | (539,138 | ) |
The accompanying notes are an integral part of these Consolidated Financial Statements.
MICROSTRATEGY INCORPORATED
CONSOLIDATED STATEMENTS OF STOCKHOLDERS’ EQUITY (DEFICIT)
(in thousands)
| | | | | | | | | | | | | | Class B | | | | | | | | | | | | | | | Accumulated | | | | | |
| | | | | | Class A | | | Convertible | | | Additional | | | | | | | | | | | Other | | | | | |
| | | | | | Common Stock | | | Common Stock | | | Paid-in | | | Treasury Stock | | | Comprehensive | | | Retained | |
| | Total | | | Shares | | | Amount | | | Shares | | | Amount | | | Capital | | | Shares | | | Amount | | | Income (Loss) | | | Earnings | |
Balance at January 1, 2015 | | $ | 324,471 | | | | 15,660 | | | $ | 16 | | | | 2,055 | | | $ | 2 | | | $ | 506,727 | | | | (6,405 | ) | | $ | (475,184 | ) | | $ | (4,363 | ) | | $ | 297,273 | |
Net income | | | 105,931 | | | | 0 | | | | 0 | | | | 0 | | | | 0 | | | | 0 | | | | 0 | | | | 0 | | | | 0 | | | | 105,931 | |
Other comprehensive loss | | | (2,765 | ) | | | 0 | | | | 0 | | | | 0 | | | | 0 | | | | 0 | | | | 0 | | | | 0 | | | | (2,765 | ) | | | 0 | |
Translation gain reclassified to other income | | | (280 | ) | | | 0 | | | | 0 | | | | 0 | | | | 0 | | | | 0 | | | | 0 | | | | 0 | | | | (280 | ) | | | 0 | |
Conversion of class B to class A common stock | | | 0 | | | | 20 | | | | 0 | | | | (20 | ) | | | 0 | | | | 0 | | | | 0 | | | | 0 | | | | 0 | | | | 0 | |
Issuance of class A common stock under stock option plans | | | 9,529 | | | | 91 | | | | 0 | | | | 0 | | | | 0 | | | | 9,529 | | | | 0 | | | | 0 | | | | 0 | | | | 0 | |
Tax effect of stock option exercises | | | 1,096 | | | | 0 | | | | 0 | | | | 0 | | | | 0 | | | | 1,096 | | | | 0 | | | | 0 | | | | 0 | | | | 0 | |
Share-based compensation expense | | | 17,299 | | | | 0 | | | | 0 | | | | 0 | | | | 0 | | | | 17,299 | | | | 0 | | | | 0 | | | | 0 | | | | 0 | |
Balance at December 31, 2015 | | $ | 455,281 | | | | 15,771 | | | $ | 16 | | | | 2,035 | | | $ | 2 | | | $ | 534,651 | | | | (6,405 | ) | | $ | (475,184 | ) | | $ | (7,408 | ) | | $ | 403,204 | |
Net income | | | 90,908 | | | | 0 | | | | 0 | | | | 0 | | | | 0 | | | | 0 | | | | 0 | | | | 0 | | | | 0 | | | | 90,908 | |
Other comprehensive loss | | | (3,335 | ) | | | 0 | | | | 0 | | | | 0 | | | | 0 | | | | 0 | | | | 0 | | | | 0 | | | | (3,335 | ) | | | 0 | |
Issuance of class A common stock under stock option plans | | | 1,663 | | | | 34 | | | | 0 | | | | 0 | | | | 0 | | | | 1,663 | | | | 0 | | | | 0 | | | | 0 | | | | 0 | |
Tax effect of stock option exercises | | | 1,244 | | | | 0 | | | | 0 | | | | 0 | | | | 0 | | | | 1,244 | | | | 0 | | | | 0 | | | | 0 | | | | 0 | |
Share-based compensation expense | | | 11,817 | | | | 0 | | | | 0 | | | | 0 | | | | 0 | | | | 11,817 | | | | 0 | | | | 0 | | | | 0 | | | | 0 | |
Payment of taxes relating to net exercise of employee stock options | | | (3,739 | ) | | | 0 | | | | 0 | | | | 0 | | | | 0 | | | | (3,739 | ) | | | 0 | | | | 0 | | | | 0 | | | | 0 | |
Write-off of deferred tax assets relating to vested employee stock options that are no longer exercisable | | | (1,662 | ) | | | 0 | | | | 0 | | | | 0 | | | | 0 | | | | (1,662 | ) | | | 0 | | | | 0 | | | | 0 | | | | 0 | |
Balance at December 31, 2016 | | $ | 552,177 | | | | 15,805 | | | $ | 16 | | | | 2,035 | | | $ | 2 | | | $ | 543,974 | | | | (6,405 | ) | | $ | (475,184 | ) | | $ | (10,743 | ) | | $ | 494,112 | |
Net income | | | 17,643 | | | | 0 | | | | 0 | | | | 0 | | | | 0 | | | | 0 | | | | 0 | | | | 0 | | | | 0 | | | | 17,643 | |
Other comprehensive gain | | | 4,775 | | | | 0 | | | | 0 | | | | 0 | | | | 0 | | | | 0 | | | | 0 | | | | 0 | | | | 4,775 | | | | 0 | |
Issuance of class A common stock under stock option plans | | | 1,677 | | | | 12 | | | | 0 | | | | 0 | | | | 0 | | | | 1,677 | | | | 0 | | | | 0 | | | | 0 | | | | 0 | |
Share-based compensation expense | | | 14,267 | | | | 0 | | | | 0 | | | | 0 | | | | 0 | | | | 14,267 | | | | 0 | | | | 0 | | | | 0 | | | | 0 | |
Balance at December 31, 2017 | | $ | 590,539 | | | | 15,817 | | | $ | 16 | | | | 2,035 | | | $ | 2 | | | $ | 559,918 | | | | (6,405 | ) | | $ | (475,184 | ) | | $ | (5,968 | ) | | $ | 511,755 | |
| | | | | | | | | | | | | | | | | | | | | | | | | | | | | | | | | | | | | | | | |
| | | | | | | | | | | Class B | | | | | | | | | | | | Accumulated | | | (Accumulated | |
| | | | | Class A | | | Convertible | | | Additional | | | | | | | | | Other | | | Deficit) | |
| | | | | Common Stock | | | Common Stock | | | Paid-in | | | Treasury Stock | | | Comprehensive | | | Retained | |
| | Total | | | Shares | | | Amount | | | Shares | | | Amount | | | Capital | | | Shares | | | Amount | | | Loss | | | Earnings | |
Balance at January 1, 2021 | | $ | 446,192 | | | | 16,307 | | | $ | 16 | | | | 1,964 | | | $ | 2 | | | $ | 655,241 | | | | (8,684 | ) | | $ | (782,104 | ) | | $ | (3,885 | ) | | $ | 576,922 | |
Net loss | | | (535,480 | ) | | | 0 | | | | 0 | | | | 0 | | | | 0 | | | | 0 | | | | 0 | | | | 0 | | | | 0 | | | | (535,480 | ) |
Other comprehensive loss | | | (3,658 | ) | | | 0 | | | | 0 | | | | 0 | | | | 0 | | | | 0 | | | | 0 | | | | 0 | | | | (3,658 | ) | | | 0 | |
Issuance of class A common stock upon exercise of stock options | | | 40,651 | | | | 269 | | | | 0 | | | | 0 | | | | 0 | | | | 40,651 | | | | 0 | | | | 0 | | | | 0 | | | | 0 | |
Issuance of class A common stock under employee stock purchase plan | | | 2,854 | | | | 5 | | | | 0 | | | | 0 | | | | 0 | | | | 2,854 | | | | 0 | | | | 0 | | | | 0 | | | | 0 | |
Issuance of class A common stock upon vesting of restricted stock units, net of withholding taxes | | | (4,754 | ) | | | 11 | | | | 0 | | | | 0 | | | | 0 | | | | (4,754 | ) | | | 0 | | | | 0 | | | | 0 | | | | 0 | |
Issuance of class A common stock under public offerings, net of issuance costs | | | 990,463 | | | | 1,414 | | | | 2 | | | | 0 | | | | 0 | | | | 990,461 | | | | 0 | | | | 0 | | | | 0 | | | | 0 | |
Share-based compensation expense | | | 42,690 | | | | 0 | | | | 0 | | | | 0 | | | | 0 | | | | 42,690 | | | | 0 | | | | 0 | | | | 0 | | | | 0 | |
Balance at December 31, 2021 | | $ | 978,958 | | | | 18,006 | | | $ | 18 | | | | 1,964 | | | $ | 2 | | | $ | 1,727,143 | | | | (8,684 | ) | | $ | (782,104 | ) | | $ | (7,543 | ) | | $ | 41,442 | |
Net loss | | | (1,469,797 | ) | | | 0 | | | | 0 | | | | 0 | | | | 0 | | | | 0 | | | | 0 | | | | 0 | | | | 0 | | | | (1,469,797 | ) |
Other comprehensive loss | | | (6,258 | ) | | | 0 | | | | 0 | | | | 0 | | | | 0 | | | | 0 | | | | 0 | | | | 0 | | | | (6,258 | ) | | | 0 | |
Issuance of class A common stock upon exercise of stock options | | | 1,393 | | | | 9 | | | | 0 | | | | 0 | | | | 0 | | | | 1,393 | | | | 0 | | | | 0 | | | | 0 | | | | 0 | |
Issuance of class A common stock under employee stock purchase plan | | | 4,473 | | | | 16 | | | | 0 | | | | 0 | | | | 0 | | | | 4,473 | | | | 0 | | | | 0 | | | | 0 | | | | 0 | |
Issuance of class A common stock upon vesting of restricted stock units, net of withholding taxes | | | (2,213 | ) | | | 19 | | | | 0 | | | | 0 | | | | 0 | | | | (2,213 | ) | | | 0 | | | | 0 | | | | 0 | | | | 0 | |
Issuance of class A common stock under public offerings, net of issuance costs | | | 46,219 | | | | 219 | | | | 0 | | | | 0 | | | | 0 | | | | 46,219 | | | | 0 | | | | 0 | | | | 0 | | | | 0 | |
Share-based compensation expense | | | 64,105 | | | | 0 | | | | 0 | | | | 0 | | | | 0 | | | | 64,105 | | | | 0 | | | | 0 | | | | 0 | | | | 0 | |
Balance at December 31, 2022 | | $ | (383,120 | ) | | | 18,269 | | | $ | 18 | | | | 1,964 | | | $ | 2 | | | $ | 1,841,120 | | | | (8,684 | ) | | $ | (782,104 | ) | | $ | (13,801 | ) | | $ | (1,428,355 | ) |
Net income | | | 429,121 | | | | 0 | | | | 0 | | | | 0 | | | | 0 | | | | 0 | | | | 0 | | | | 0 | | | | 0 | | | | 429,121 | |
Other comprehensive income | | | 2,357 | | | | 0 | | | | 0 | | | | 0 | | | | 0 | | | | 0 | | | | 0 | | | | 0 | | | | 2,357 | | | | 0 | |
Issuance of class A common stock upon exercise of stock options | | | 30,519 | | | | 175 | | | | 1 | | | | 0 | | | | 0 | | | | 30,518 | | | | 0 | | | | 0 | | | | 0 | | | | 0 | |
Issuance of class A common stock under employee stock purchase plan | | | 3,955 | | | | 20 | | | | 0 | | | | 0 | | | | 0 | | | | 3,955 | | | | 0 | | | | 0 | | | | 0 | | | | 0 | |
Issuance of class A common stock upon vesting of restricted stock units, net of withholding taxes | | | (4,344 | ) | | | 26 | | | | 0 | | | | 0 | | | | 0 | | | | (4,344 | ) | | | 0 | | | | 0 | | | | 0 | | | | 0 | |
Issuance of class A common stock under public offerings, net of issuance costs | | | 2,020,089 | | | | 5,098 | | | | 5 | | | | 0 | | | | 0 | | | | 2,020,084 | | | | 0 | | | | 0 | | | | 0 | | | | 0 | |
Share-based compensation expense | | | 66,395 | | | | 0 | | | | 0 | | | | 0 | | | | 0 | | | | 66,395 | | | | 0 | | | | 0 | | | | 0 | | | | 0 | |
Balance at December 31, 2023 | | $ | 2,164,972 | | | | 23,588 | | | $ | 24 | | | | 1,964 | | | $ | 2 | | | $ | 3,957,728 | | | | (8,684 | ) | | $ | (782,104 | ) | | $ | (11,444 | ) | | $ | (999,234 | ) |
The accompanying notes are an integral part of these Consolidated Financial Statements.
MICROSTRATEGY INCORPORATED
CONSOLIDATED STATEMENTS OF CASH FLOWS
(in thousands)
| | | Years Ended December 31, | | | Years Ended December 31, | |
| | 2017 | | | 2016 | | | 2015 | | | 2023 | | | 2022 | | | 2021 | |
Operating activities: | | | | | | | | | | | | | | | | | | | |
Net income | | $ | 17,643 | | | $ | 90,908 | | | $ | 105,931 | |
Adjustments to reconcile net income to net cash provided by operating activities: | | | | | | | | | | | | |
Net income (loss) | | | $ | 429,121 | | | $ | (1,469,797 | ) | | $ | (535,480 | ) |
Adjustments to reconcile net income (loss) to net cash provided by operating activities: | | | | | | | | |
Depreciation and amortization | | | 12,572 | | | | 17,195 | | | | 21,214 | | | | 14,527 | | | | 10,874 | | | | 11,358 | |
Bad debt expense | | | 2,269 | | | | 224 | | | | 884 | |
Unrealized net loss on foreign currency forward contracts | | | 0 | | | | 0 | | | | 1,641 | |
Non-cash restructuring costs and adjustments | | | 0 | | | | 0 | | | | (136 | ) |
Reduction in carrying amount of right-of-use assets | | | | 8,643 | | | | 8,072 | | | | 8,189 | |
Credit losses and sales allowances | | | | 1,387 | | | | 939 | | | | 1,509 | |
Deferred taxes | | | (2,011 | ) | | | (4,983 | ) | | | 9,666 | | | | (568,949 | ) | | | 131,493 | | | | (284,221 | ) |
Release of liabilities for unrecognized tax benefits | | | 0 | | | | (394 | ) | | | (899 | ) | | | (506 | ) | | | (360 | ) | | | (561 | ) |
Share-based compensation expense | | | 14,267 | | | | 11,817 | | | | 17,299 | | | | 69,571 | | | | 63,619 | | | | 44,126 | |
Excess tax benefits from share-based compensation arrangements | | | 0 | | | | (1,244 | ) | | | (1,096 | ) |
Reclassification of foreign currency translation adjustment from other comprehensive income | | | 0 | | | | 0 | | | | (280 | ) |
Digital asset impairment losses (gains on sale), net | | | | 115,851 | | | | 1,286,286 | | | | 830,621 | |
Amortization of issuance costs on long-term debt | | | | 8,808 | | | | 8,694 | | | | 7,201 | |
Gain on debt extinguishment | | | | (44,686 | ) | | | 0 | | | | 0 | |
Changes in operating assets and liabilities: | | | | | | | | | | | | | | | | | | | |
Accounts receivable | | | 15,348 | | | | (16,878 | ) | | | 5,003 | | | | 10,307 | | | | (5,292 | ) | | | 2,618 | |
Prepaid expenses and other current assets | | | (4,279 | ) | | | (880 | ) | | | 4,446 | | | | (11,358 | ) | | | (6,342 | ) | | | (25 | ) |
Deposits and other assets | | | 2,981 | | | | (4,059 | ) | | | 1,631 | | | | (632 | ) | | | (7,455 | ) | | | (1,713 | ) |
Accounts payable and accrued expenses | | | (9,093 | ) | | | 6,981 | | | | 1,904 | | | | (634 | ) | | | (3,521 | ) | | | 3,749 | |
Accrued compensation and employee benefits | | | (3,683 | ) | | | 3,787 | | | | (8,387 | ) | | | (12,000 | ) | | | (12,344 | ) | | | 2,374 | |
Accrued restructuring costs | | | 0 | | | | (58 | ) | | | (1,922 | ) |
Deferred revenue and advance payments, net | | | (1,609 | ) | | | 11,238 | | | | (4,176 | ) |
Accrued interest | | | | (1,336 | ) | | | 1,336 | | | | 1,222 | |
Deferred revenue and advance payments | | | | 2,362 | | | | 14,839 | | | | 14,710 | |
Operating lease liabilities | | | | (10,218 | ) | | | (9,634 | ) | | | (10,222 | ) |
Other long-term liabilities | | | 33,917 | | | | (3,065 | ) | | | (3,024 | ) | | | 2,454 | | | | (8,196 | ) | | | (1,622 | ) |
Net cash provided by operating activities | | | 78,322 | | | | 110,589 | | | | 149,699 | | | | 12,712 | | | | 3,211 | | | | 93,833 | |
Investing activities: | | | | | | | | | | | | | | | | | | | |
Proceeds from redemption of short-term investments | | | 390,720 | | | | 361,680 | | | | 479,200 | |
Purchases of digital assets | | | | (1,902,299 | ) | | | (287,921 | ) | | | (2,626,529 | ) |
Proceeds from sale of digital assets | | | | 0 | | | | 11,817 | | | | 0 | |
Purchases of property and equipment | | | (3,982 | ) | | | (2,337 | ) | | | (3,484 | ) | | | (2,938 | ) | | | (2,486 | ) | | | (2,706 | ) |
Purchases of short-term investments | | | (456,468 | ) | | | (354,999 | ) | | | (473,779 | ) |
Capitalized software development costs | | | 0 | | | | 0 | | | | (9,598 | ) |
Net cash (used in) provided by investing activities | | | (69,730 | ) | | | 4,344 | | | | (7,661 | ) |
Net cash used in investing activities | | | | (1,905,237 | ) | | | (278,590 | ) | | | (2,629,235 | ) |
Financing activities: | | | | | | | | | | | | | | | | | | | |
Proceeds from sale of class A common stock under exercise of employee stock options | | | 1,677 | | | | 1,663 | | | | 9,529 | |
Payment of taxes relating to net exercise of employee stock options | | | 0 | | | | (3,739 | ) | | | 0 | |
Excess tax benefits from share-based compensation arrangements | | | 0 | | | | 1,244 | | | | 1,096 | |
Payments on capital lease obligations and other financing arrangements | | | (21 | ) | | | (172 | ) | | | (1,447 | ) |
Net cash provided by (used in) financing activities | | | 1,656 | | | | (1,004 | ) | | | 9,178 | |
Proceeds from convertible senior notes | | | | 0 | | | | 0 | | | | 1,050,000 | |
Issuance costs paid for convertible senior notes | | | | 0 | | | | 0 | | | | (24,796 | ) |
Proceeds from senior secured notes | | | | 0 | | | | 0 | | | | 500,000 | |
Issuance costs paid for senior secured notes | | | | 0 | | | | 0 | | | | (12,792 | ) |
Proceeds from secured term loan, net of lender fees | | | | 0 | | | | 204,693 | | | | 0 | |
Issuance costs paid for secured term loan, excluding lender fees | | | | 0 | | | | (107 | ) | | | 0 | |
Repayments of secured term loan and third-party extinguishment costs | | | | (160,033 | ) | | | 0 | | | | 0 | |
Proceeds from other long-term secured debt | | | | 0 | | | | 11,100 | | | | 0 | |
Issuance costs paid for other long-term secured debt | | | | 0 | | | | (270 | ) | | | 0 | |
Repayments of other long-term secured debt | | | | (513 | ) | | | (246 | ) | | | 0 | |
Proceeds from sale of common stock under public offerings | | | | 2,029,214 | | | | 46,592 | | | | 1,000,000 | |
Issuance costs paid related to sale of common stock under public offerings | | | | (9,141 | ) | | | (358 | ) | | | (9,537 | ) |
Proceeds from exercise of stock options | | | | 30,518 | | | | 1,393 | | | | 40,651 | |
Proceeds from sales under employee stock purchase plan | | | | 3,955 | | | | 4,473 | | | | 2,854 | |
Payment of withholding tax on vesting of restricted stock units | | | | (4,114 | ) | | | (2,082 | ) | | | (4,695 | ) |
Net cash provided by financing activities | | | | 1,889,886 | | | | 265,188 | | | | 2,541,685 | |
Effect of foreign exchange rate changes on cash, cash equivalents, and restricted cash | | | 8,222 | | | | (4,176 | ) | | | (5,837 | ) | | | 444 | | | | (3,375 | ) | | | (2,608 | ) |
Net increase in cash, cash equivalents, and restricted cash | | | 18,470 | | | | 109,753 | | | | 145,379 | |
Net (decrease) increase in cash, cash equivalents, and restricted cash | | | | (2,195 | ) | | | (13,566 | ) | | | 3,675 | |
Cash, cash equivalents, and restricted cash, beginning of year | | | 402,712 | | | | 292,959 | | | | 147,580 | | | | 50,868 | | | | 64,434 | | | | 60,759 | |
Cash, cash equivalents, and restricted cash, end of year | | $ | 421,182 | | | $ | 402,712 | | | $ | 292,959 | | | $ | 48,673 | | | $ | 50,868 | | | $ | 64,434 | |
Supplemental disclosure of cash flow information: | | | | | | | | | | | | | | | | | | | |
Cash paid during the year for interest | | $ | 0 | | | $ | 2 | | | $ | 34 | | | $ | 41,229 | | | $ | 43,448 | | | $ | 20,416 | |
Cash paid during the year for income taxes, net of tax refunds | | $ | 29,279 | | | $ | 24,332 | | | $ | 13,346 | | | $ | 30,318 | | | $ | 21,973 | | | $ | 7,010 | |
Supplemental disclosure of noncash investing and financing activities: | | | | | | | | | | | | |
Assets acquired under capital lease obligations and other financing arrangements | | $ | 0 | | | $ | 0 | | | $ | 14 | |
The accompanying notes are an integral part of these Consolidated Financial Statements.
MICROSTRATEGY INCORPORATED
NOTES TO CONSOLIDATED FINANCIAL STATEMENTS
(1) Organization
MicroStrategy is a worldwide providercommitted to the continued development of the Bitcoin network through its activities in the financial markets, advocacy and technology innovation. The Company’s enterprise analytics software business, which it has operated for over 30 years, is its predominant operational focus. The Company uses the cash flows generated by its software business, as well as proceeds from equity and mobility software. The Company’s mission isdebt financings, to provide enterprise customers with world-class software and expert services so they can deploy unique intelligence applications.accumulate bitcoin, which serves as its primary treasury reserve asset.
(2) Summary of Significant Accounting Policies
(a) Basis of Presentation
The accompanying Consolidated Financial Statements include the accounts of the Company and its subsidiaries. All significant intercompany accounts and transactions have been eliminated in consolidation.
As discussed in Note 3, Recent Accounting Standards, to the Consolidated Financial Statements, the Company adopted ASU 2016-18 effective January 1, 2017 and has retroactively applied the required updates to its Consolidated Statements of Cash Flows for all periods presented. As a result of the adoption of ASU 2016-18, changes in restricted cash have been removed from investing activities in the Consolidated Statements of Cash Flows; instead, restricted cash has been included with total cash and cash equivalents when reconciling the beginning and end of period amounts.
(b) Use of Estimates
The preparation of the Consolidated Financial Statements, in conformity with accounting principles generally accepted in the United States of America,GAAP, requires management to make estimates and judgments that affect the amounts reported in the Consolidated Financial Statements and accompanying notes. On an on-going basis, the Company evaluates its estimates, including, but not limited to, those related to revenue recognition, allowance for doubtful accounts, investments, derivative financial instruments, software development costs, fixed assets, intangibledigital assets, variable compensation,leases, debt, share-based compensation, income taxes, including the carrying value of deferred tax assets, and litigation and contingencies, including liabilities that the Company deems not probable of assertion. The Company bases its estimates on historical experience and on various other assumptions that are believed to be reasonable under the circumstances, the results of which form the basis for making judgments about the carrying value of assets, liabilities, and equity that are not readily apparent from other sources. Actual results and outcomes could differ from these estimates and assumptions.
(c) Fair Value Measurements
The Company measures certain assets and liabilities at fair value on a recurring or nonrecurring basis. Fair value is defined as the price that is expected to be received to sell an asset or paid to transfer a liability in an orderly transaction between market participants at the measurement date. The Company uses a three-level hierarchy that prioritizes fair value measurements based on the types of inputs used for the various valuation techniques. The three levels of the fair value hierarchy are described below:
| |
Level 1: | Level 1:
| Quoted (unadjusted) prices in active markets that are accessible at the measurement date for identical, unrestricted assets or liabilities.
|
Level 2: | Level 2:
| Inputs other than quoted prices that are either directly or indirectly observable, such as quoted prices in active markets for similar assets or liabilities, quoted prices for identical or similar assets or liabilities in inactive markets, or other inputs that are observable or can be corroborated by observable market data for substantially the full term of the assets or liabilities.
|
Level 3: | Level 3:
| Inputs that are generally unobservable, supported by little or no market activity, and typically reflect management’s estimates of assumptions that market participants would use in pricing the asset or liability. |
80
MICROSTRATEGY INCORPORATED
NOTES TO CONSOLIDATED FINANCIAL STATEMENTS
The categorization of an asset or liability within the fair value hierarchy is based on the lowest level of input that is significant to the fair value measurement. The valuation techniques used by the Company when measuring fair value maximize the use of observable inputs and minimize the use of unobservable inputs.
The Company also estimates the fair value of cash and cash equivalents, restricted cash, accounts receivable, accounts payable and accrued expenses, and accrued compensation and employee benefits. The Company considers the carrying value of these instruments in the financial statementsConsolidated Financial Statements to approximate fair value due to their short maturities.
(d) Cash and Cash Equivalents and Restricted Cash
Cash equivalents may include bank demand deposits, money market instruments, certificates of deposit, U.S. Treasury securities, and equivalent funds. The Company generally considers all highly liquid investments with an original maturity of three months or less to be cash equivalents. Restricted cash consists of cash balances restricted in use by contractual obligations with third parties.
(e) Credit Losses on Accounts Receivable
(e) Short-term Investments
The Company periodically invests a portionmaintains an allowance for credit losses on its accounts receivable balances, which represents its best estimate of current expected credit losses over the contractual life of the accounts receivable. When evaluating the adequacy of its excess cash in short-term investment instruments. All highly liquid investments with stated maturity dates between three months and one year from the purchase date are classified as short-term investments. The Company determines the appropriate classification of its short-term investments at the time of purchase.
Substantially all of the Company’s short-term investments are in U.S. Treasury securities and certificates of deposit, andallowance for credit losses each reporting period, the Company hasanalyzes accounts receivable balances with similar risk characteristics on a collective basis, considering factors such as the abilityaging of receivable balances, payment terms, geographic location, historical loss experience, current information, and intent to hold these investments to maturity. Therefore, these short-term investments are classified and accounted for as held-to-maturity and are reported at amortized cost.future expectations. Each reporting period, the Company determinesreassesses whether a decline in fair value below the amortized cost for each individual security is other-than-temporaryany accounts receivable no longer share similar risk characteristics and if it wouldshould instead be required to sell the security before recovery of its amortized cost basis. Upon recognition of an other-than-temporary impairment, the previous amortized cost basis less the other-than-temporary impairment recognized in earnings becomes the new amortized cost basis of the investment.
(f) Derivative Financial Instruments
The Company is exposed to certain risks related to its ongoing business operations, including the effect of changes in foreign exchange rates on the Company’s monetary assets and liabilities denominated in foreign currency. The Company may use foreign currency forward contractsevaluated as part of its strategyanother pool or on an individual basis. Changes to manage these risks, but does not hold or issue derivativethe allowance for credit losses are adjusted through credit loss expense, which is presented within “General and administrative” operating expenses in the Consolidated Statements of Operations.
(f) Concentrations of Credit Risk
Financial instruments for trading purposes or speculation.that potentially subject the Company to concentrations of credit risk consist primarily of cash and cash equivalents, restricted cash, and accounts receivable. The Company executes these instrumentsplaces its cash equivalents with high credit-quality financial institutions and has established guidelines relative to credit ratings and maturities that hold an investment grade credit rating. These foreign currency forward contracts do not meetseek to maintain safety and liquidity.
The Company sells its offerings to various companies across several industries throughout the requirementsworld in the ordinary course of business. The Company routinely assesses the financial strength of its customers and maintains allowances for hedge accountinganticipated losses. As of December 31, 2023 and 2022, no individual customer accounted for 10% or more of net accounts receivable, and for the years ended December 31, 2023, 2022, and 2021, no individual customer accounted for 10% or more of revenue.
(g) Digital Assets
The Company accounts for its digital assets, which are comprised solely of bitcoin, as indefinite-lived intangible assets in accordance with Accounting Standards Codification (“ASC”) 350, Intangibles—Goodwill and Other. The Company has ownership of and control over its bitcoin and uses third-party custodial services at multiple locations that are geographically dispersed to store its bitcoin. The Company’s digital assets are initially recorded on the balance sheet as either an asset or liabilityat cost. Subsequently, they are measured at their fair value ascost, net of the reporting date. Changes inany impairment losses incurred since acquisition.
The Company determines the fair value of derivative instruments, as measured usingits bitcoin on a nonrecurring basis in accordance with ASC 820, Fair Value Measurement, based on quoted (unadjusted) prices on the three-level hierarchy described above,Coinbase exchange, the active exchange that the Company has determined is its principal market for bitcoin (Level 1 inputs). The Company performs an analysis each quarter to identify whether events or changes in circumstances, principally decreases in the quoted (unadjusted) prices on the active exchange, indicate that it is more likely than not that any of the assets are impaired. In determining if an impairment has occurred, the Company considers the lowest price of one bitcoin quoted on the active exchange at any time since acquiring the specific bitcoin held by the Company. If the carrying value of a bitcoin exceeds that lowest price, an impairment loss has occurred with respect to that bitcoin in the amount equal to the difference between its carrying value and such lowest price.
Impairment losses are recognized in “Other (expense) income,the period in which the impairment occurs and are reflected within “Digital asset impairment losses (gains on sale), net” in the Company’s Consolidated Statements of Operations. The impaired digital assets are written down to their fair value at the time of impairment and this new cost basis will not be adjusted upward for any subsequent increase in fair value. Gains (if any) are not recorded until realized upon sale, at which point they are presented net of any impairment losses in the Company’s Consolidated Statements of Operations. In determining the gain to be recognized upon sale, the Company calculates the difference between the sales price and carrying value of the specific bitcoins sold immediately prior to sale.
(g)See Note 4, Digital Assets, to the Consolidated Financial Statements for further information regarding the Company’s purchases and sales of digital assets.
(h) Property and Equipment
Property and equipment are stated at cost, net of accumulated depreciation. Depreciation is computed using the straight-line method over the estimated useful lives of the assets, as follows: three years for computer equipment and purchased software; five years for office equipment; 10 years for office equipmentfurniture; and automobiles; and ten19 years for office furniture and ownedthe Company’s corporate aircraft, which has an estimated salvage value of 70%21%. Leasehold improvements are amortized using the straight-line method over the estimated useful lives of the improvements or the term of the lease, whichever is shorter. The Company periodically evaluates the appropriateness of the estimated useful lives and salvage value of all property and equipment. Any change in the estimated useful life or salvage value is treated as a change in estimate and accounted for prospectively in the period of change.
81
MICROSTRATEGY INCORPORATED
NOTES TO CONSOLIDATED FINANCIAL STATEMENTS
Expenditures for maintenance and repairs are charged to expense as incurred, except for certain costs related to the aircraft. The costs of normal, recurring, or periodic repairs and maintenance activities related to the aircraft are expensed as incurred. The cost of planned major maintenance activities (“PMMA”) may be treated differently because those activities may involve the acquisition of additional aircraft components or the replacement of existing aircraft components. PMMA are performed periodically based on passage of time and the use of the aircraft. The classification of a maintenance activity as part of PMMA requires judgment and can affect the amount of expense recognized in any particular period. The cost of each PMMA is expected to be capitalized and amortized over the period until the next scheduled PMMA. There have been no PMMA to date.
When assets are retired or sold, the capitalized cost and related accumulated depreciation are removed from the property and equipment accounts and any resulting gain or loss is recognized in the results of operations.
Eligible internal-use software development costs are capitalized subsequent to the completion of the preliminary project stage. Such costs include external direct material and service costs, employee payroll, and payroll-related costs. After all substantial testing and deployment is completed and the software is ready for its intended use, capitalization ceases and internal-use software development costs are amortized using the straight-line method over the estimated useful life of the software, generally three years.years.
The Company reviews long-lived assets including intangible assets, for impairment annually or whenever events or changes in business circumstances indicate that the carrying value of the assets may not be fully recoverable or that the useful lives of these assets are no longer appropriate. Each impairment test is based on a comparison of the undiscounted cash flows to the recorded value of the asset. If an asset is impaired, the asset is written down by the amount by which the carrying value of the asset exceeds the related fair value of the asset.
(i) Leases
(h)A lease is a contract, or part of a contract, that conveys the right to both (i) obtain economic benefits from and (ii) direct the use of an identified asset for a period of time in exchange for consideration. The Company evaluates its contracts to determine if they contain a lease and classifies any lease components identified as an operating or finance lease. For each lease component, the Company recognizes a right-of-use (“ROU”) asset and a lease liability. ROU assets and lease liabilities are presented separately for operating and finance leases; however, the Company currently has no material finance leases. The Company’s operating leases are primarily related to office space in the United States and foreign locations.
In a contract that contains a lease, a component is an item or activity that transfers a good or service to the lessee. Such contracts may be comprised of lease components, non-lease components, and elements that are not components. Each lease component represents a lessee’s right to use an underlying asset in the contract if the lessee can benefit from the right of use of the asset either on its own or together with other readily available resources and if the right of use is neither highly dependent nor highly interrelated with other rights of use. Non-lease components include items such as common area maintenance and utilities provided by the lessor. The Company has elected the practical expedient to not separate lease components from non-lease components for office space, which is the Company’s only material underlying asset class. For each lease within this asset class, the non-lease components and related lease components are accounted for as a single lease component. Items or activities that do not transfer goods or services to the lessee, such as administrative tasks to set up the contract and reimbursement or payment of lessor costs, are not components of the contract and therefore no contract consideration is allocated to such items or activities.
Consideration in the contract is comprised of any fixed payments and variable payments that depend on an index or rate. Payments in the Company’s operating lease arrangements are typically comprised of base office rent and parking fees. Costs related to the Company’s non-lease components, as described above, are generally variable and do not depend on an index or rate and are therefore excluded from the contract consideration allocated to the lease components. The Company’s operating lease arrangements generally do not contain any payments related to items or activities that are not components.
Operating lease liabilities are initially and subsequently measured at the present value of unpaid lease payments, discounted at the discount rate of the lease. Operating lease ROU assets are initially measured as the sum of the initial lease liability, any initial direct costs incurred, and any prepaid lease payments, less any lease incentives received. The ROU asset is amortized over the term of the lease. The amortization of operating lease ROU assets is included in “Reduction in carrying amount of right-of-use assets” within the operating activities section of the Consolidated Statements of Cash Flows. A single lease expense is recorded within operating expenses in the Consolidated Statements of Operations on a straight-line basis over the lease term. Variable lease payments that are not included in the measurement of the lease liability are recognized in the period when the obligations for those payments are incurred. In the Company’s lease agreements, these variable payments typically include certain taxes, utilities, and maintenance costs, and other fees.
The Company uses its incremental borrowing rate as the discount rate for all of its leases, as the rate implicit in the lease is not readily determinable in any of its lease contracts. In order to estimate a collateralized borrowing rate curve, the Company first estimates a synthetic credit rating and then applies modeling methodologies to an unsecured borrowing rate curve. In determining the incremental borrowing rate of each lease, the Company uses a centralized treasury approach and considers the currency of the contract, the economic environment in which the lease exists, and the term of the lease.
The Company does not recognize lease liabilities or ROU assets for any short-term leases with a non-cancellable lease term of 12 months or less. Instead, the lease payments for these short-term leases are expensed on a straight-line basis over the lease term, and any variable payments are recognized in the period when the obligations for those payments are incurred. The Company believes that, using this methodology, the expense recorded reasonably reflects the Company’s short-term lease commitments.
(j) Software Development Costs
Software development costs are expensed as incurred until technological feasibility has been established, at which time such costs are capitalized until the product is available for general release to customers. Capitalized software development costs include direct labor costs and fringe benefit costs attributed to programmers, software engineers, and quality control and field certifiers working on products after they reach technological feasibility, but before they are generally available to customers for sale. Technological feasibility is considered to be achieved when a product design and working model of the software product have been completed. Capitalized software development costs are typically amortized over the estimated product life of three years, on a straight-line basis. The Company has significantly accelerated the pace of its software development efforts and increased the frequency of its software releases subsequent to the release of MicroStrategy 10, which has resulted in the Company’s software development costs in recent periods being expensed as incurred.
Capitalized software development costs, net of accumulated amortization, were $2.5 million and $8.5 million as of December 31, 2017 and 2016, respectively. Amortization expense related to software development costs was $6.0 million, $7.4 million, and $7.2 million for the years ended December 31, 2017, 2016, and 2015, respectively, and is included in cost of product licenses and subscription services revenues. The Company did notnot capitalize any software development costs during the years ended December 31, 20172023, 2022, and 2016, respectively. During2021. Due to the year ended December 31, 2015,pace of the Company capitalizedCompany’s software development efforts and frequency of its software releases, the Company’s software development costs are expensed as incurred within “Research and development” in the Consolidated Statements of $9.6 million. The Company analyzes the net realizable value of capitalized software development costs on at least an annual basis and has determined that there is no indication of impairment of the capitalized software development costs as forecasted future sales are adequate to support amortization costs.Operations.
(k) Loss Contingencies and Legal Costs
The Company accrues loss contingencies that are believed to be probable and can be reasonably estimated. As events evolve during the administration and litigation process and additional information becomes known, the Company reassesses its estimates related to loss contingencies. Legal costs are expensed in the period in which the costs are incurred.
82
MICROSTRATEGY INCORPORATED
NOTES TO CONSOLIDATED FINANCIAL STATEMENTS
(j)(l) Deferred Revenue and Advance Payments
Deferred revenue and advance payments related to product support, subscriptionare contract liabilities that represent amounts received or due from customers in advance of the Company transferring its software or services and other services result from payments received prior to the performancecustomer under an enforceable contract. Revenue is subsequently recognized in the period(s) in which control of the software or services for technical support, subscription, consulting, and education. Deferred revenue and advance payments relatedis transferred to product licenses result primarily from multiple-element arrangements that include future deliverables.the customer. Deferred revenue is comprised of deferred product licenses and subscription services, deferred product support, or other services revenue based on the objective fair valuetransaction price allocated to the specific performance obligation in the contract with the customer, and presented as either current or non-current in the Consolidated Balance Sheets, depending on whether the software or services are expected to be transferred to the customer within the next year.
(m) Debt Arrangements
As discussed in Note 8, Long-term Debt, to the Consolidated Financial Statements, the Company issued convertible senior notes in December 2020 and February 2021 and senior secured notes in June 2021, and entered into secured term loan agreements in March 2022 and June 2022. The embedded conversion features in each of the multiple elements ofconvertible notes are indexed to the arrangement, exceptCompany’s class A common stock and meet the criteria for software licenses for which the Companyclassification in stockholders’ equity, and therefore derivative accounting does not have an objective measure of fair value.apply. The Company offsetsrecords the aggregate principal amount of each of its accounts receivable and deferred revenue for any billed and unpaid items included in deferred revenue and advance payments.debt instruments as a liability on its Consolidated Balance Sheets, offset by the issuance costs associated with each instrument. The issuance costs are amortized to interest expense using the effective interest method over the expected term of each debt instrument.
(k)(n) Revenue Recognition
The Company recognizes revenue using a five-step model:
(i)Identifying the contract(s) with a customer,
(ii)Identifying the performance obligation(s),
(iii)Determining the transaction price,
(iv)Allocating the transaction price to the performance obligations in the contract, and
(v)Recognizing revenue when, or as, the Company satisfies a performance obligation.
The Company has elected to exclude taxes assessed by government authorities in determining the transaction price, and therefore revenue is recognized net of taxes collected from customers. The Company enters into non-cancellable nonrefundable orders with customers and does not have a history of granting returns or refunds and therefore does not have a reserve for future returns.
Performance Obligations and Timing of Revenue Recognition
The Company primarily sells goods and services that fall into the categories discussed below. Each category contains one or more performance obligations that are either (i) capable of being distinct (i.e., the customer can benefit from the good or service on its own or together with readily available resources, including those purchased separately from the Company) and distinct within the context of the contract (i.e., separately identifiable from other promises in the contract) or (ii) a series of distinct goods or services that are substantially the same and have the same pattern of transfer to the customer. Aside from the Company’s term and perpetual product licenses, which are delivered at a point in time, the majority of the Company’s services are delivered over time.
Product Licenses
The Company sells different types of business intelligence software, licensed on a term or perpetual basis and installed either on premises or on a public cloud that is procured and managed by the customer. Although product licenses are sold with product support, the software is fully functional at the outset of the arrangement and is considered a distinct performance obligation. Revenue from product license sales is recognized when control of the license is transferred to the customer, which is the later of delivery or commencement of the license term. The Company may also sell through resellers and OEMs who purchase the Company’s software for resale. In reseller arrangements, revenue is generally recognized when control of the license is transferred to the end user. In OEM arrangements, revenue is recognized when control of the license is transferred to the OEM.
Subscription Services
The Company also sells access to its software through MCE, a cloud subscription service, wherein customers access the software through a cloud environment that the Company manages on behalf of the customer. Control of the software itself does not transfer to the customer under this arrangement and is not considered a separate performance obligation. Cloud subscriptions are regularly sold on a standalone basis and include technical support, monitoring, backups, updates, and quarterly service reviews. Additionally, customers with existing on-premise software licenses may convert their installations to end users upon:
| 1)
| persuasive evidence of an arrangement, as provided by agreements, contracts, purchase orders, or other arrangements, generally executed by both parties;
|
| 2)
| existence of a fixed or determinable fee;
|
| 3)
| delivery of the software; and
|
| 4)
| determination that collection is reasonably assured.
|
WhenMCE, at which time the feeson-premise licenses are typically terminated and replaced by a new subscription to the MCE service. At conversion, an analysis is performed for each contract to determine whether any revenue adjustments are necessary given that the contract modifications revoke previously transferred rights to perpetual on-premise software. Such revenue adjustments were not material for the years ended December 31, 2023, 2022, and 2021. Revenue related to cloud subscriptions is recognized on a straight-line basis over the contract period, which is the period over which the customer has continuous access to the software.
Product Support
In all product license transactions, customers are required to purchase a standard product support package (either separately or as an included component of a term license transaction) that may subsequently be renewed at their option. Customers may also purchase a premium product support package for a fixed annual fee. All product support packages include both technical support and when-and-if-available software upgrades, and enhancements, technical support, consulting, and educationwhich are bundled with the license fee,treated as a single performance obligation as they are unbundled forconsidered a series of distinct services that are substantially the same and have the same duration and measure of progress. Revenue from product support is recognized on a straight-line basis over the contract period, which is the period over which the customer has continuous access to product support.
Consulting Services
The Company sells consulting services to help customers plan and execute deployment of the Company’s software. Customers are not required to use consulting services to fully benefit from the software. Consulting services are regularly sold on a standalone basis and either (i) prepaid upfront or (ii) sold on a time and materials basis. Consulting arrangements are each considered separate performance obligations because they do not integrate with each other or with other offerings to deliver a combined output to the customer, do not modify or customize (or are not modified or customized by) each other or other offerings, and do not affect the customer’s ability to use the other consulting services or the Company’s other offerings. Revenue under consulting arrangements is recognized over time as services are delivered. For time and materials-based consulting arrangements, the Company has elected the practical expedient of recognizing revenue recognition purposes, using vendor specific objective evidence (“VSOE”) of fairupon invoicing since the invoiced amount corresponds directly to the value of the elements.Company’s service to date.
Product supportEducation Services
The Company sells various education and training services to its customers. Education services are sold on a standalone basis under two different types of arrangements: (i) annual subscriptions to live and on-demand training courses and (ii) custom courses purchased on an hourly basis. Education arrangements are each considered separate performance obligations because they do not integrate with each other or post-contract support (“PCS”) revenue is derived from providing technical software supportwith other offerings to deliver a combined output to the customer, do not modify or customize (or are not modified or customized by) each other or other offerings, and software updates and upgradesdo not affect the customer’s ability to customers. PCS revenueuse the other education services or the Company’s other offerings. Revenue on annual subscriptions is recognized ratablyon a straight-line basis over the term of the contract which in most cases is one year. The Company’s VSOE for PCS, which includes updates, upgrades, and enhancements, is determined based on the optional stated renewal fee for PCS in the contract,period, which is the priceperiod over which the customer is requiredhas continuous access to pay when PCS is renewed. Additionally, the optional stated renewal fee used to establish VSOE for PCS in a software transaction must be above the Company’s minimum substantive VSOE rate for PCS. If a stated renewal rate is considered non-substantive, VSOE of PCS has not been established and the Company recognizes all revenue under the arrangement ratably over the PCS period. A minimum substantive VSOE rate is determined basedtraining courses. Revenue on an analysis of historical sales of PCS. For a renewal rate to be non-substantive, the Company believes it must be significantly lower than its minimum VSOE rate. The Company considers a 10% variance below its minimum VSOE rate to be significant. It is rare for the Company to have an arrangement that includes a renewal rate that is below the minimum VSOE rate.
Revenue from consulting, education, and subscription servicescustom courses is recognized on a time and materials basis as the services are performed. delivered.
See Note 16, Segment Information, to the Consolidated Financial Statements for information regarding total revenues by geographic region.
Estimates and Judgments
The Company’s VSOE for services other than PCS is determinedCompany makes estimates and judgments to allocate the transaction price based on an analysisobservable or estimated SSP. The Company also makes estimates and judgments with respect to capitalizing incremental costs to obtain a customer contract and determining the subsequent amortization period. These estimates and judgments are discussed further below.
Determining the Transaction Price
The transaction price includes both fixed and variable consideration. Variable consideration is included in the transaction price to the extent it is probable that a significant reversal will not occur. The amount of variable consideration excluded from the transaction price was not material for the years ended December 31, 2023, 2022, and 2021. The Company’s estimates of variable consideration are also subject to subsequent true-up adjustments and may result in changes to its historical sales of each element when sold separately from software.
For new offerings of services other than PCS or service offerings thattransaction prices. Such true-up adjustments have not had a sufficient historybeen and are not expected to be material. The Company has the following sources of sales activity,variable consideration:
(i)Performance penalties – Subscription services and product support arrangements generally contain performance response time guarantees. For subscription services arrangements, the Company initially establishes VSOEestimates variable consideration using a portfolio
approach because performance penalties are tied to standard up-time requirements. For product support arrangements, the Company estimates variable consideration on a contract basis because such arrangements are customer-specific. For both subscription services and product support arrangements, the Company uses an expected value approach to estimate variable consideration based on historical business practices and current and future performance expectations to determine the listlikelihood of incurring penalties.
(ii)Extended payment terms – The Company’s standard payment terms are generally within 180 days of invoicing. If extended payment terms are granted to customers, those terms generally do not exceed one year. For contracts with extended payment terms, the Company estimates variable consideration on a contract basis because such estimates are customer-specific and uses an expected value approach to analyze historical business experience on a customer-by-customer basis to determine the likelihood that extended payment terms lead to an implied price as determined by management withconcession.
(iii)Sales and usage-based royalties – Certain product license arrangements include sales or usage-based royalties, covering both product license and product support. In these arrangements, the
relevant authority. Each service offering hasCompany uses an expected value approach to estimate and recognize revenue for royalty sales each period, utilizing historical data on a
single list pricecontract-by-contract basis. True-up adjustments are recorded in
each country where sold.If VSOE exists for all undelivered elementssubsequent periods when royalty reporting is received from the OEMs and there is no such evidence of fair value established for delivered elements,during the arrangement fee is first allocatedyears ended December 31, 2023, 2022, and 2021 were not material.
The Company provides a standard software assurance warranty to the elements where evidence of fair value has been established and the residual amount is allocated to the delivered elements. If evidence of fair value for any undelivered element of an arrangementrepair, replace, or refund software that does not exist, all revenue fromperform in accordance with documentation. The standard software assurance warranty period is generally less than one year. Assurance warranty claims were not material for the arrangementyears ended December 31, 2023, 2022, and 2021.
The Company does not adjust the transaction price for significant financing components where the time period between cash payment and performance is deferred until such time that evidence of fair value exists for undelivered elementsone year or until all elements ofless. However, there are circumstances where the arrangement are delivered, subject to certain limited exceptions.
83
MICROSTRATEGY INCORPORATED
NOTES TO CONSOLIDATED FINANCIAL STATEMENTS
If an arrangement includes acceptance criteria, revenuetiming between cash payment and performance may exceed one year. These circumstances generally involve prepaid multi-year license, product support and subscription services arrangements where the customer determines when the service is not recognized untilutilized. In these circumstances, the Company can objectively demonstrate thathas determined no significant financing component exists because the customer controls when to utilize the service and because there are significant business purposes behind the timing difference between payment and performance (e.g., ensuring collectability in the case of subscription services).
Allocating the Transaction Price Based on Standalone Selling Prices (SSP)
The Company allocates the transaction price to each performance obligation in a contract based on its relative SSP. The SSP is the price, or estimated price, of the software or service can meet the acceptance criteria, or the acceptance period lapses, whichever occurs earlier. Ifwhen sold on a software license arrangement obligatesstandalone basis at contract inception. In circumstances where SSP is not directly observable, the Company to deliver specified future products or upgrades, revenue is recognized whenestimates SSP using the specified future product or upgradesfollowing methodologies:
(i)Product licenses – Product licenses are
delivered, or when the obligation to deliver specified future products expires, whichever occurs earlier. If a software license arrangement obligates the Company to deliver unspecified future products, then revenue is recognizednot sold on a
subscriptionstandalone basis
ratably overand pricing is highly variable. The Company establishes SSP of product licenses using a residual approach after first establishing the
termSSP of standard product support. Standard product support is sold on a standalone basis within a narrow range of the
contract.License revenue derived from sales to resellers or original equipment manufacturers (“OEMs”) who purchase the Company’s products for resale is recognized upon sufficient evidence that the products have been sold to the end user, provided all other revenue recognition criteria have been met. The Company’s standard softwarestated net license fee, and reseller agreements do not include any return rights other than the right to return non-conforming products for repair or replacement underbecause an economic relationship exists between product licenses and standard product warranties. During the last three fiscal years,support, the Company has not experienced anyconcluded that the residual method to estimate SSP of product returns relatedlicenses sold on both a perpetual and term basis is a fair allocation of the transaction price.
(ii)Subscription services – Given the highly variable selling price of subscription services, the Company establishes the SSP of its subscription services arrangements using a similar residual approach after first establishing the SSP of consulting and education services to
warranty claims.The Company generally offers either commercial discounts or referral fees to its channel partners, depending on the nature of services performed. Revenue recognized from transactions with channel partners involved in resale or distribution activities is recorded net of any commercial discounts provided to them. Referral fees paid to channel partners not involved in resale or distribution activities are expensed as cost of revenues and, during the last three fiscal years, were not significant.
The Company’s standard software license agreements do not include any price protection provisions. However, transactions under the General Services Administration Federal Supply Schedule contract must comply with the Price Reductions clause. In addition, certain government agencies have the right to cancel contracts for “convenience.” During the last three fiscal years, there were no material amounts refunded under the Price Reductions clause and there were no material contracts cancelled for convenience.
Amounts collected prior to satisfying the above revenue recognition criteriaextent they are included in net deferred revenue and advance payments in the accompanying Consolidated Balance Sheets.
Software revenue recognition requires judgment, including determinations about whether collectability is reasonably assured, the fee is fixed and determinable, a software arrangement includes multiple elements, and if so, whether VSOE exists for those elements. Judgment is also required to assess whether future releases of certain software represent new products or upgrades and enhancements to existing products.
The Company also generates subscription services revenues primarily from its cloud services offerings. Subscription services revenues include subscription fees from customers for access to the full breadth of MicroStrategy Analytics and MicroStrategy Mobile capabilities, database services, and data integration services. The Company’s standard arrangements with customers generally do not provide the customer with the right to take possession of the software supporting the cloud-based application service at any time. As such, these arrangements are considered service contracts and revenue is recognized ratably over the service period of the contract, following completion of the set-up service. Any related set-up service fees are recognized ratably over the longer of the contract period or the estimated average life of the customer relationship.
The Company’s subscription services are generally offered as standalone arrangements or as part of arrangements that include professional services. If deliverables in a multiple-element arrangement have standalone value upon delivery, the Company accounts for each such deliverable separately.arrangement. The Company has concluded that the residual method to estimate SSP of its subscription services is a fair allocation of the transaction price.
(iii)Standard product support – The Company establishes SSP of standard product support as a percentage of the stated net license fee, given such pricing is consistent with its normal pricing practices and its professional services each havethere exists sufficient history of customers renewing standard product support on a standalone value. Whenbasis at similar percentages. Semi-annually, the Company enters into multiple-element arrangements that include subscriptiontracks renewal rates negotiated when standard product support is initially sold with a perpetual license in order to determine the SSP of standard product support within each geographic region for the upcoming quarter. If the stated standard product support fee falls within the SSP range, the specific rate in the contract will be used to determine SSP. If the stated fee is above or below SSP, the highest or lowest end of the range, respectively, will generally be used to determine SSP of standard product support for perpetual licenses. For term licenses, the Company determines SSP of standard product support at the lower end of the SSP range used for perpetual licenses because the term licenses are time bound, resulting in a lower value placed on product support as compared to a perpetual license.
(iv)Premium product support, consulting services, and professionaleducation services –SSP of premium product support, consulting services, and education services is established by using a bell-shaped curve approach to define a narrow range within each geographic region in which the total arrangement consideration is allocated to eachservices are discounted off of the deliverables basedlist price on the relative selling price hierarchy. a standalone basis.
The Company determinesoften provides options to purchase future offerings at a discount. The Company analyzes the relative sellingoption price against the previously established SSP of the goods or services to determine if the options represent material rights that should be accounted for each deliverable using VSOE of selling price, if available,as separate performance obligations. In general, an option sold at or its best estimate of selling price (“BESP”), if VSOEabove SSP is not available.considered a material right because the customer could have received that right without entering into the contract. If a material right exists, revenue associated with the option is deferred and recognized when the future goods or services are transferred, or when the option expires. During the years ended December 31, 2023, 2022, and 2021, separate performance obligations arising from future purchase options have not been material.
(o) Incremental Costs to Obtain Customer Contracts
The Company capitalizes costs incurred to obtain a contract with a customer when they are deemed incremental to obtaining the contract and expected to be recoverable. Capitalizable costs are generally limited to sales incentives paid to the Company’s sales team. The Company capitalizes the amounts related to new product support, cloud subscription, and term license contracts. Costs capitalized are amortized over a period of time that is consistent with the pattern of transfer to the customer, which the Company has determined is generally three years and includes consideration for contract length, anticipated renewals, product life cycle, and customer behavior. The Company amortizes the cost over this period on a straight-line basis for product support and subscription service components, and at point(s) in time coinciding with delivery of the license component of term license contracts. The Company has determined that third-party evidenceelected the practical expedient to expense capitalizable costs as incurred where the amortization period would be one year or less, which includes those amounts earned on perpetual license, consulting, and education contracts, and renewals of selling price is not a practical alternative dueproduct support, cloud subscription, and term license contracts.
As of December 31, 2023 and 2022, capitalized costs to differences in its services offerings as compared toobtain customer contracts, net of accumulated amortization, were $15.7 million and $15.8 million, respectively, and are presented within “Deposits and other companies and the lack of availability of third-party pricing information. For professional services, the Company has established VSOE because a consistent number of standalone sales of this deliverable have been priced within a
84
MICROSTRATEGY INCORPORATED
NOTES TO CONSOLIDATED FINANCIAL STATEMENTS
reasonably narrow range. For subscription services, the Company has not established VSOE because, among other factors, the offering is relatively new and its pricing model continues to evolve. Accordingly, the Company uses BESP to determine the relative selling price of its subscription services.
The Company determines BESP by reviewing historical transactions and by considering the service’s pricing models and objectives that take into account factors such as gross margin, the size and volume of the transactions, perceived pricing sensitivity, and growth strategies. The determination of BESP is made through consultation with, and approval by, the Company’s management team, taking into consideration the go-to-market strategy. As the Company’s pricing and go-to-market strategies evolve, the Company may modify its pricing practicesassets” in the future, which could resultConsolidated Balance Sheets. During the years ended December 31, 2023, 2022, and 2021, amortization expenses related to these capitalized costs were $8.1 million, $4.5 million, and $2.7 million, respectively, and are reflected within “Sales and marketing” in changes to the determinationConsolidated Statements of VSOE and BESP.Operations.
Amounts, upon invoicing, are recorded in accounts receivable and either gross deferred revenue or revenue, depending on whether the applicable revenue recognition criteria have been met.
(l)(p) Advertising Costs
Advertising costs include production costs, which are expensed the first time the advertisement takes place, and media placement costs, which are expensed in the month the advertising appears. Total advertising costs were $5.7$0.1 million, $1.3$0.8 million, and $0.5$1.2 million for the years ended December 31, 2017, 2016,2023, 2022, and 2015,2021, respectively. As of December 31, 20172023 and 2016,2022, the Company had no prepaid advertising costs.
(m)(q) Share-based Compensation
The Company maintains itsthe 2013 Stock Incentive Plan (as amended, the “2013 Equity Plan”), and the 2023 Equity Incentive Plan (the “2023 Equity Plan,” and, together with the 2013 Equity Plan, the “Stock Incentive Plans”). As of May 2023, no new awards will be granted under whichthe 2013 Equity Plan, though awards previously granted under the 2013 Equity Plan remain outstanding in accordance with their terms. Under the Stock Incentive Plans, the Company’s employees, officers, directors, and other eligible participants may be (with respect to the 2023 Equity Plan) and have been (with respect to both the 2023 Equity Plan and the 2013 Equity Plan) awarded various types of share-based compensation, including options to purchase shares of the Company’s class A common stock. Thestock, restricted stock units, and other stock-based awards. Additionally, under the 2023 Equity Plan, awards may be and have been granted that are subject to the achievement of one or more performance measures established by the Company’s Board of Directors or a duly authorized committee thereof. During 2021, the Company recognizes share-based compensation expense associatedadopted and the Company’s stockholders approved the 2021 Employee Stock Purchase Plan (the “2021 ESPP”), under which eligible employees of the Company and certain of its subsidiaries may be provided with such stock optionopportunities to purchase shares of the Company’s class A common stock.
For options and other stock-based awards, on a straight-line basis over the award’s requisite service period (generally, the vesting period). The share-based compensation expense is based on the fair value of suchthe awards on the date of grant, as estimated using the Black-Scholes option pricingvaluation model. For restricted stock units, the share-based compensation expense is based on the fair value of the Company’s class A common stock on the date of grant. The fair value of liability-classified awards (e.g., the other stock-based awards and cash-settled restricted stock units) is remeasured at each reporting date. For performance stock units subject to a market condition, the Company uses a Monte Carlo simulation model to determine the grant date fair value. For the 2021 ESPP, the share-based compensation expense is based on the grant date fair value, which consists of the intrinsic value of any purchase discount and the fair value of the look-back provision using the Black-Scholes valuation model.
The Company recognizes share-based compensation expense for service-conditioned awards granted under the Stock Incentive Plans and the 2021 ESPP on a straight-line basis over the requisite service period (generally, the vesting period for service-conditioned awards under the Stock Incentive Plans and the offering period under the 2021 ESPP). The Company recognizes share-based compensation expense for market-conditioned performance stock units granted under the 2023 Equity Plan ratably over the performance period using an accelerated attribution cost recognition method. Share-based compensation expense is recorded in cost of revenues or operating expense line items in the Statement of Operations corresponding to the respective participant’s role or function.
See Note 11, Share-based Compensation, to the Consolidated Financial Statements for further information regarding the 2013 Equity Plan,Stock Incentive Plans, the 2021 ESPP, related share-based compensation expense, and assumptions used in the Black-Scholes option pricing model.determining fair value.
(n)(r) Income Taxes
The Company is subject to federal, state, and local income taxes in the United States and manya number of foreign countries. DeferredThe Company accounts for income taxes are provided basedunder the asset and liability method, which requires the recognition of deferred tax assets and deferred tax liabilities for the expected future tax consequences of events that have been included in the financial statements. Under this method, the Company determines deferred tax assets and deferred tax liabilities on the basis of differences between the financial statement and tax bases of assets and liabilities by using enacted tax laws and rates applicable toin effect for the periodsyear in which differences are expected to reverse. The effect of a change in the taxes become payable. tax rates on deferred tax assets and deferred tax liabilities is recognized in income in the period that includes the enactment date.
For uncertain income tax positions, the Company uses a more-likely-than-not recognition threshold based on the technical merits of the income tax position taken. Income tax positions that meet the more-likely-than-not recognition threshold are measured in order to determine the tax benefit recognized in the financial statements. The Company recognizes accrued interest related to unrecognized tax benefits as part of income tax expense. Penalties, if incurred, are recognized as a component of income tax expense.
The Company provides a valuation allowance to reduce deferred tax assets to their estimated realizable value, when appropriate.
(o)(s) Basic and Diluted Earnings (Loss) Per Share
Basic earnings (loss) per share is determined by dividing the net income (loss) attributable to common stockholders by the weighted average number of shares of common stock, including shares of class A common stock and participating securitiesclass B common stock, outstanding during the period. Participating securities are included in the basicDiluted earnings per share calculation when dilutive. Diluted earnings(loss) per share is determined by dividing the net income (loss) attributable to common stockholders by the weighted average number of shares of common sharesstock and potential shares of common sharesstock outstanding during the period. PotentialThe impact from potential shares of common shares are included instock on the diluted earnings per share calculation are included when dilutive. Potential shares of common sharesstock consisting of class A common stock issuable upon the exercise of outstanding employee stock options, the vesting of restricted stock units and warrantsperformance stock units considered probable of achievement, and in connection with the 2021 ESPP, are computed using the
85
MICROSTRATEGY INCORPORATED
NOTES TO CONSOLIDATED FINANCIAL STATEMENTS
treasury stock method. Potential common shares also consist of class A common stock issuable upon the conversion of preferred stock. Beginning January 1, 2017, excess tax benefitsthe Company’s convertible senior notes are no longer included incomputed using the calculation ofif-converted method. In computing diluted earnings per share, onthe Company first calculates the earnings per incremental share (“EPIS”) for each class of potential shares of common stock and ranks the classes from the most dilutive (i.e., lowest EPIS) to the least dilutive (i.e., highest EPIS). Basic earnings per share is then adjusted for the effect of each class of shares, in sequence and cumulatively, until a prospective basis. particular class no longer produces further dilution.
The Company has two classes of common stock: class A common stock and class B common stock. Holders of class A common stock generally have the same rights, including rights to dividends, as holders of class B common stock, except that holders of class A common stock have one vote per share while holders of class B common stock have ten votes per share. Each share of class B common stock is convertible at any time, at the option of the holder, into one share of class A common stock.stock. As such, basic and fully diluted earnings per share for class A common stock and for class B common stock are the same. The Company has never declared or paid any cash dividends on either class A or class B common stock. As of December 31, 20172023 and 2016,2022, there were no shares of preferred stock issued or outstanding.
(p)(t) Foreign Currency Translation
The functional currency of the Company’s international operations is generally the local currency. Accordingly, allsuch assets and liabilities of international subsidiaries are translated using exchange rates in effect at the end of the period, and revenue and expenses are translated using weighted average monthly exchange rates for the period.period in which the transactions occur. The related translation adjustments are reported in “Accumulated other comprehensive income (loss)”loss” in stockholders’ equity.equity (deficit). In general, upon complete or substantially complete liquidation of an investment in an international subsidiary, the amount of accumulated translation adjustments attributable to that subsidiary is reclassified from stockholders’ equity (deficit) to the statement of operations. Transaction gains and losses arising from transactions denominated in a currency other than the functional currency of the entity involved are included in the results of operations.
In 2015, as a result of the completion of the liquidation of one of the Company’s foreign subsidiaries, a $0.3 million foreign currency translation gain was reclassified from “Accumulated other comprehensive loss” in the accompanying Consolidated Balance Sheets to “Other (expense) income, net” in the accompanying Consolidated Statements of Operations. No reclassifications were recorded in 2017 or 2016. 84
As of December 31, 2017, 2016,2023, 2022, and 2015,2021, the cumulative foreign currency translation balances were $(6.0)$(11.4) million, $(10.8)$(13.8) million, and $(7.4)$(7.5) million, respectively. Since the Company intends to indefinitely reinvest its undistributed earnings of all of its subsidiaries, noNo taxes were recognized on the temporary differences resulting from foreign currency translation adjustments for the years ended December 31, 2017, 2016,2023, 2022, and 2015.2021.
Transaction gains and losses arising from transactions denominated in foreign currencies resulted in a net loss of $7.0$5.6 million in 20172023 and net gains of $3.0$6.2 million and $2.4$2.5 million in 20162022 and 2015,2021, respectively, and are included in “Other (expense) income, net” in the accompanying Consolidated Statements of Operations.
(q) Concentrations of Credit Risk
Financial instruments that potentially subject the Company to concentrations of credit risk consist primarily of cash and cash equivalents, restricted cash, short-term investments, foreign currency forward contracts, and accounts receivable. The Company places its cash equivalents and enters into foreign currency forward contracts with high credit-quality financial institutions and invests its excess cash primarily in short-term investments. The Company has established guidelines relative to credit ratings and maturities that seek to maintain safety and liquidity.
The Company sells products and services to various companies across several industries throughout the world in the ordinary course of business. The Company routinely assesses the financial strength of its customers and maintains allowances for anticipated losses. As of December 31, 2017 and 2016, no individual customer accounted for 10% or more of net accounts receivable, and for the years ended December 31, 2017, 2016, and 2015, no individual customer accounted for 10% or more of revenue.
86
MICROSTRATEGY INCORPORATED
NOTES TO CONSOLIDATED FINANCIAL STATEMENTS
(3) Recent Accounting Standards
Share-based compensation accountingCrypto Assets
In March 2016,December 2023, the Financial Accounting Standards Board (“FASB”) issued Accounting Standards Update No. 2016-09, Compensation – Stock Compensation (Topic 718)2023-08, Intangibles—Goodwill and Other—Crypto Assets (Subtopic 350-60): Improvements to Employee Share-Based Payment Accounting for and Disclosure of Crypto Assets (“ASU 2016-09”2023-08”),. ASU 2023-08 requires in-scope crypto assets (including the Company's bitcoin holdings) to simplify certain aspects of accounting for share-based payment transactions. Under ASU 2016-09, all excess tax benefits should be recognized as income tax expense or benefit in the income statement, regardless of whether the benefit reduces taxes payable in the current period. The excess tax benefits will be combined with other income tax cash flows within operating activities in the statement of cash flows. In addition, excess tax benefits or tax deficiencies will no longer be included in the calculation of assumed proceeds under the treasury stock method of computing diluted earnings per share. ASU 2016-09 also allows companies to make an accounting policy election to either estimate the number of awards expected to vest or to account for forfeitures as they occur, when accruing share-based compensation expense. Lastly, ASU 2016-09 permits employers to withhold up to the employee’s maximum statutory tax rate in applicable jurisdictions and still qualify for the exception to liability classification. Cash paid by an employer when directly withholding shares for tax-withholding purposes should be classified as a financing activity in the statement of cash flows. The Company adopted this guidance on January 1, 2017 and has:
| (i)
| recognized excess tax benefits as part of the “Provision for income taxes” line item in the Consolidated Statements of Operations, on a prospective basis.
|
| (ii)
| combined the impact of excess tax benefits with the “Deferred taxes” line item within operating activities in the Consolidated Statements of Cash Flows, on a prospective basis.
|
| (iii)
| excluded excess tax benefits or tax deficiencies in the calculation of the Company’s diluted earnings per share, on a prospective basis; and
|
| (iv)
| made an accounting policy election to account for forfeitures as they occur, on a modified retrospective basis, the impact of which is generally consistent with the Company’s previous method of estimating forfeitures.
|
No prior periods have been adjusted in connection with the Company’s adoption of ASU 2016-09. In addition, no cumulative-effect adjustments to retained earnings have been recorded as of January 1, 2017 because there were no unrecognized excess tax benefits or tax deficiencies outstanding and no expected forfeitures applied to the Company’s share-based compensation expense as of the end of the preceding year. The remaining amendments under ASU 2016-09 did not have a material impact on the Company’s consolidated financial position, results of operations, and cash flows.
Statement of cash flows
In November 2016, the FASB issued Accounting Standards Update No. 2016-18, Statement of Cash Flows (Topic 230): Restricted Cash (a consensus of the FASB Emerging Issues Task Force) (“ASU 2016-18”), to address the diversity in practice that currently exists regarding the classification and presentation of changes in restricted cash on the statement of cash flows. Under ASU 2016-18, entities will be required to include restricted cash and restricted cash equivalents with total cash and cash equivalents when reconciling the beginning and end of period amounts on the statement of cash flows. Entities will also be required to disclose information about the nature of their restricted cash and restricted cash equivalents. Additionally, if cash, cash equivalents, restricted cash and restricted cash equivalents are presented in more than one line itemmeasured at fair value in the statement of financial position, entities will be required to present a reconciliation, either onwith gains and losses from changes in the facefair value of such crypto assets recognized in net income each reporting period. ASU 2023-08 also requires certain interim and annual disclosures for crypto assets within the scope of the statement of cash flows or disclosed instandard. The standard is effective for the notes, of the totals in the statement of cash flows to the related line item captions in the statement of financial position. The Company adopted this guidance onfor interim and annual periods beginning January 1, 2017 and retrospectively applied the required updates to its Consolidated Statements of Cash Flows for all periods presented. The Company does not consider its restricted cash balances to be material for further disclosure or reconciliation. The adoption of this guidance did not impact the Company’s consolidated financial position, results of operations, or footnote disclosures.
87
MICROSTRATEGY INCORPORATED
NOTES TO CONSOLIDATED FINANCIAL STATEMENTS
Revenue from contracts2025, with customers
In May 2014, the FASB issued Accounting Standards Update No. 2014-09, Revenue from Contracts with Customers (Topic 606) (“ASU 2014-09”), which supersedes nearly all existing revenue recognition guidance. The standard’s core principle is that an entity should recognize revenue when it transfers promised goods or services to customers in an amount that reflects the consideration to which the entity expects to be entitled in exchange for those goods or services. The standard also requires disclosure of additional information to enable users of financial statements to understand the nature, amount, timing, and uncertainty of revenue and cash flows arising from contracts with customers.
The Company will adopt this guidance and its subsequent amendments effective as of January 1, 2018 and will adjust prior period consolidated financial statements to reflect full retrospective adoption, beginning with the Quarterly Report on Form 10-Q for the first quarter of 2018. The Company has substantially completed the implementation of key system changes and changes to internal controls over financial reporting to allow the Company to timely compile the information needed to account for transactions under this new guidance and to adjust its prior periods’ consolidated financial statements.
In adopting ASU 2014-09, the Company expects the following significant changes in accounting principles:
| (i)
| Timing of revenue recognition for term license sales. Under ASU 2014-09, the Company will recognize product license revenue from term licenses upon delivery of the software. Previously, this revenue was recognized over the term of the arrangement.
|
| (ii)
| Timing of revenue recognition for sales to channel partners. Under ASU 2014-09, the Company will recognize revenue from sales made to resellers and OEMs when control of the products transfers to the reseller or OEM, less adjustments for returns or price protection. Previously, this revenue was not recognized until the product was sold by the reseller or OEM to the end user.
|
| (iii)
| Allocating the transaction price to the performance obligations in the contract. Under ASU 2014-09, the Company will allocate the transaction price to the various performance obligations in the contract based on their relative standalone selling price (“SSP”). Except for SSP of product support, the Company’s methodologies for estimating SSP of its various performance obligations will be generally consistent with the Company’s previous methodologies used to establish VSOE of fair value on multiple element arrangements. The SSP of product support will result in a difference in the allocation of the transaction price between product support and product license performance obligations. The Company expects the impact from SSP-based allocations to be immaterial to the financial statements.
|
| (iv)
| Material rights. The Company’s contracts with customers may include options to acquire additional goods and services at a discount. Under ASU 2014-09, certain of these options may be considered material rights if sold below SSP and would be treated as separate performance obligations and included in the allocation of the transaction price. Previously, none of the Company’s options were considered material rights. The Company expects the impact from material rights to be immaterial to the financial statements.
|
| (v)
| Presentation of accounts receivable, contract assets, and contract liabilities (deferred revenue). Under ASU 2014-09, the Company’s rights to consideration are presented separately depending on whether those rights are conditional or unconditional. The Company will present its unconditional rights to consideration as “accounts receivable” in its Consolidated Balance Sheets. In contrast, separate “contract assets” will represent rights to consideration that are subject to a condition other than the passage of time, and will be comprised primarily of accrued sales- and usage-based royalty revenue. Previously, this revenue was not recognized until quarterly royalty reporting had been received from the OEM. Under ASU 2014-09, once quarterly royalty reporting has been received, the related contract assets will be transferred to accounts receivable. Current and non-current contract assets will be included under “Prepaid expenses and other current assets” and “Deposits and other assets,” respectively, on the Company’s Consolidated Balance Sheets. Further, contract assets will be netted against “contract liabilities” at the contract level. Contract liabilities will be presented as “deferred revenue” on the Company’s Consolidated Balance Sheets and will be comprised of consideration received, or accounts receivable recorded, prior to the transfer of goods or services to the customer. Under ASU 2014-09, the Company cannot net accounts receivable with deferred revenue and the
|
88
MICROSTRATEGY INCORPORATED
NOTES TO CONSOLIDATED FINANCIAL STATEMENTS
| | Company will no longer offset its accounts receivable and deferred revenue balances for unpaid items that are included in the deferred revenue balance. Previously, this offsetting of accounts receivable and deferred revenue balances for unpaid amounts was applied in the Company’s financial statements.
|
| (vi)
| Deferral of incremental direct costs to obtaining a contract with a customer. Under ASU 2014-09, the Company will capitalize certain variable compensation (i.e., sales commissions) payable to its sales force and subsequently amortize the capitalized costs over a period of time that is consistent with the transfer of the related good or service to the customer, which the Company has determined to be three years. Capitalized costs, net of accumulated amortization, will be included in “Deposits and other assets” on the Company’s Consolidated Balance Sheets. Previously, the Company elected to expense these incremental direct costs as incurred.
|
The Company currently estimates the adoption of ASU 2014-09 will increase its 2016 beginning retained earnings balance by approximately $13.0 million, offset by a $13.0 million decrease in gross deferred revenues, a $5.0 million decrease in deferred tax assets, net of deferred tax liabilities, a $4.0 million increase in other non-current assets, and a $1.0 million increase in other current assets. In addition, net accounts receivable and net deferred revenues as of December 31, 2017 and 2016 will each further increase by approximately $95.9 million and $101.5 million, respectively, due to the Company no longer offsetting these balances for unpaid amounts included in the gross deferred revenue balances. For the years ended December 31, 2017 and 2016, the Company estimates $2.5 million and $3.0 million, respectively, of previously expensed variable compensation will be capitalized and amortized over a three-year period. The Company estimates that product licenses revenues will decrease by approximately $0.5 million and increase by approximately $1.5 million for the years ended December 31, 2017 and 2016, respectively. The Company also estimates its provision for income taxes will decrease by approximately $1.5 million and increase by approximately $0.5 million for the years ended December 31, 2017 and 2016, respectively.
Intra-entity asset transfers
In October 2016, the FASB issued Accounting Standards Update No. 2016-16, Income Taxes (Topic 740): Intra-Entity Transfers of Assets Other Than Inventory (“ASU 2016-16”), to improve the accounting for income tax effects of intra-entity transfers of assets other than inventory. Under ASU 2016-16, the deferral of the income tax consequences of intra-entity transfers of assets other than inventory is eliminated. Entities will be required to recognize the income tax consequences of intra-entity transfers of assets other than inventory when the transfers occur. The standard requires a cumulative-effect adjustment directly to the opening balance of retained earnings as of the beginning of the annual reporting period in which the Company adopts the guidance. Prior periods will not be restated. Early adoption is permitted in any interim or annual period for which an entity's financial statements have not been issued as of adoption using a modified retrospective approach. the beginning of the annual reporting period.
The Company will adopt this guidance effective as of January 1, 2018. Theexpects the adoption of this guidance is not expected toASU 2023-08 will have a material impact on its consolidated balance sheets, statements of operations, statements of cash flows and disclosures. Although the Company will continue to initially record its bitcoin purchases at cost, upon adopting ASU 2023-08, any subsequent increases or decreases in fair value will be recognized as incurred in the Company's Consolidated Statements of Operations, and the fair value of the Company’s consolidated financial position, resultsbitcoin will be reflected within the Company's Consolidated Balance Sheets each reporting period-end. Upon adopting ASU 2023-08, the Company will no longer account for its bitcoin under a cost-less-impairment accounting model.
The Company is currently evaluating early adoption of operations, or cash flows.ASU 2023-08 and the potential implications of unrealized fair value gains and losses as they relate to the changing global tax landscape. If the Company were to adopt this guidance during 2024, it estimates that its 2024 beginning retained earnings balance would increase by approximately $3.1 billion.
Income Taxes
Lease accounting
In February 2016,December 2023, the FASB issued Accounting Standards Update No. 2016-02, Leases2023-09, Income Taxes (Topic 842)740): Improvements to Income Tax Disclosures (“ASU 2016-02”2023-09”), which. ASU 2023-09 requires lease assetsenhanced disclosures surrounding income taxes, particularly related to rate reconciliation and lease liabilitiesincome taxes paid information. In particular, on an annual basis, companies will be recognizedrequired to disclose specific categories in the rate reconciliation and provide additional information for all leases, in additionreconciling items that meet a quantitative threshold. Companies will also be required to the disclosure of key information to enable users of financial statements to assessdisclose, on an annual basis, the amount timing,of income taxes paid, disaggregated by federal, state, and uncertainty of cash flows arising from an entity’s leasing arrangements. ASU 2016-02 definesforeign taxes, and also disaggregated by individual jurisdictions above a lease as a contract, or part of a contract, that conveys both (i) the right to obtain economic benefits from and (ii) direct the use of an identified asset for a period of time in exchange for consideration. Under ASU 2016-02, leases are classified as either finance or operating leases. For finance leases, a lessee shall recognize in profit or loss the amortization of the lease asset and interest on the lease liability. For operating leases, a lessee shall recognize in profit or loss a single lease cost, calculated so that the remaining cost of the lease is allocated over the remaining lease term, generally on a straight-line basis. ASU 2016-02 requires the recognition and measurement of leases at the beginning of the earliest period presented using a modified retrospective approach andquantitative threshold. The standard is effective for interim andthe Company for annual periods beginning January 1, 2019.2025 on a prospective basis, with retrospective application permitted for all prior periods presented. Early adoption is permitted. The Company is currently evaluating the impact of this guidance on its consolidated financialdisclosures.
Segment Reporting
In November 2023, the FASB issued Accounting Standards Update No. 2023-07, Segment Reporting (Topic 280): Improvements to Reportable Segment Disclosures (“ASU 2023-07”). ASU 2023-07 requires enhanced disclosures surrounding reportable segments, particularly (i) significant segment expenses that are regularly provided to the chief operating decision maker ("CODM") and included in the reported measure(s) of a segment's profit and loss and (ii) other segment items that reconcile segment revenue and significant expenses to the reported measure(s) of a segment's profit and loss, both on an annual and interim basis. Companies are also required to provide all annual disclosures currently required under Topic 280 in interim periods, in addition to disclosing the title and position results of operations,the CODM and how the CODM uses the reported measure(s) of segment profit and loss in assessing segment performance and allocating resources. The standard is effective for the Company for annual periods beginning January 1, 2024 and for interim periods beginning January 1, 2025, with updates applied retrospectively. Early adoption is permitted. The Company is currently evaluating the impact of this guidance on its disclosures.
(4) Digital Assets
The following table summarizes the Company’s digital asset holdings (in thousands, except number of bitcoins), as of:
| | | | | | | | |
| | December 31, | |
| | 2023 | | | 2022 | |
Approximate number of bitcoins held | | | 189,150 | | | | 132,500 | |
Digital assets carrying value | | $ | 3,626,476 | | | $ | 1,840,028 | |
Cumulative digital asset impairment losses | | $ | 2,269,013 | | | $ | 2,153,162 | |
The carrying value on the Company’s Consolidated Balance Sheet at each period-end represents the lowest fair value (based on Level 1 inputs in the fair value hierarchy) of the bitcoins at any time since their acquisition. Therefore, these fair value measurements were made during the period from their acquisition through December 31, 2023 or 2022, respectively, and not as of December 31, 2023 or 2022, respectively.
The following table summarizes the Company’s digital asset purchases, digital asset sales, digital asset impairment losses, and gains on sale of digital assets (in thousands, except number of bitcoins) for the periods indicated:
| | | | | | | | | | | | |
| | Years Ended December 31, | |
| | 2023 | | | 2022 | | | 2021 | |
Approximate number of bitcoins purchased | | | 56,650 | | | | 8,813 | | | | 53,922 | |
Approximate number of bitcoins sold | | | 0 | | | | 704 | | | | 0 | |
Digital asset purchases | | $ | 1,902,299 | | | $ | 287,921 | | | $ | 2,626,529 | |
Digital asset sales | | $ | 0 | | | $ | 11,817 | | | $ | 0 | |
Digital asset impairment losses | | $ | 115,851 | | | $ | 1,287,213 | | | $ | 830,621 | |
Gains on sale of digital assets | | $ | 0 | | | $ | 927 | | | $ | 0 | |
From time to time, the Company may be extended short-term credits from its execution partners to purchase bitcoin in advance of using cash flows.
89
MICROSTRATEGY INCORPORATED
NOTES TO CONSOLIDATED FINANCIAL STATEMENTS
(4) Fair Value Measurements
funds in the Company’s trading account. The trade credits are due and payable in cash within days after they are extended. In 2023, certain of the assets, including bitcoin, of MacroStrategy LLC (“MacroStrategy”), a wholly-owned subsidiary of the Company, were subject to a first priority security interest and lien in order to secure the repayment of short-term trade credits taken in its name. While trade credits are outstanding, the Company may incur interest fees and be required to maintain minimum balances in its trading and collateral accounts with such execution partners. As of December 31, 20172023 and 2016, there were 2022, the Company had no financial assets outstanding trade credits payable.
As of December 31, 2023 and 2022, respectively, approximately 16,081 and 14,890 of the bitcoins held by the Company, which had carrying values of approximately $263.9 million and $230.2 million on the Company’s Consolidated Balance Sheets as of December 31, 2023 and 2022, respectively, served as part of the collateral for the Company’s 6.125% Senior Secured Notes due 2028 (the “2028 Secured Notes”), as further described in Note 8, Long-term Debt, to the Consolidated Financial Statements. As of December 31, 2022, approximately 34,619 of the bitcoins held by the Company, which had a carrying value of approximately $420.0 million on the Company’s Consolidated Balance Sheet as of December 31, 2022, served as part of the collateral for a $205.0 million term loan (the “2025 Secured Term Loan”) issued to MacroStrategy by Silvergate Bank (“Silvergate”). Upon the repayment of the 2025 Secured Term Loan during the first quarter of 2023, Silvergate released its security interest in the aforementioned bitcoin. Refer to Note 8, Long-term Debt, to the Consolidated Financial Statements for further details of the 2025 Secured Term Loan and its repayment.
(5) Contract Balances
The Company invoices its customers in accordance with billing schedules established in each contract. The Company’s rights to consideration from customers are presented separately in the Company’s Consolidated Balance Sheets depending on whether those rights are conditional or liabilities measured at fair value on a recurring basis.unconditional.
The Company presents unconditional rights to consideration from customers within “Accounts receivable, net” in its Consolidated Balance Sheets. All of the Company’s foreign currency forward contracts (designated as Level 2, non-hedging derivative instruments) were settled by December 31, 2015. Changes inare generally non-cancellable and/or non-refundable, and therefore an unconditional right generally exists when the fair value ofcustomer is billed or amounts are billable per the Company’s foreign currency forward contracts during the year ended December 31, 2015 resulted in a net gain of $0.5 million recorded to “Other income, net.” contract.
There were no transfers among the levels within the fair value hierarchy during the years ended December 31, 2017, 2016, and 2015. As of December 31, 2017 and 2016, the Company had no assets or liabilities that were required to be measured at fair value on a non-recurring basis.
(5) Short-term Investments
The Company periodically invests a portion of its excess cash in short-term investment instruments. Substantially all of the Company’s short-term investments are in U.S. Treasury securities and certificates of deposit, and the Company has the ability and intent to hold these investments to maturity. The stated maturity dates of these investments are between three months and one year from the purchase date. These held-to-maturity investments are recorded at amortized cost and included within “Short-term investments” on the accompanying Consolidated Balance Sheets. The fair value of held-to-maturity investments in U.S. Treasury securities and certificates of deposit is determined based on quoted market prices in active markets for identical securities (Level 1 inputs).
The amortized cost, carrying value, and fair value of held-to-maturity investments at December 31, 2017 were $254.9 million, $254.9 million, and $254.8 million, respectively. The amortized cost, carrying value, and fair value of held-to-maturity investments at December 31, 2016 were $187.3 million, $187.3 million, and $187.3 million, respectively. The gross unrecognized holding gains and losses were not material for 2017, 2016, and 2015. No other-than-temporary impairments related to these investments have been recognized as of December 31, 2017 and 2016. As of December 31, 2017 and 2016, the Company’s available-for-sale investments were not material.
(6) Accounts Receivable
Accounts receivable (in thousands) consisted of the following, as of:
| | December 31, | |
| | 2017 | | | 2016 | |
Billed and billable | | $ | 169,554 | | | $ | 188,038 | |
Less: unpaid deferred revenue | | | (95,864 | ) | | | (101,538 | ) |
Accounts receivable, gross | | | 73,690 | | | | 86,500 | |
Less: allowance for doubtful accounts | | | (4,190 | ) | | | (3,181 | ) |
Accounts receivable, net | | $ | 69,500 | | | $ | 83,319 | |
| | | | | | | | |
| | December 31, | |
| | 2023 | | | 2022 | |
Billed and billable | | $ | 186,884 | | | $ | 191,844 | |
Less: allowance for credit losses | | | (3,069 | ) | | | (2,564 | ) |
Accounts receivable, net | | $ | 183,815 | | | $ | 189,280 | |
The Company offsets itsChanges in the allowance for credit losses were not material for the year ended December 31, 2023.
Rights to consideration that are subject to a condition other than the passage of time are considered contract assets until they are expected to become unconditional and transfer to accounts receivable. Current contract assets included in “Prepaid expenses and other current assets” in the Consolidated Balance Sheets consisted of $1.2 million and $0.6 million, as of December 31, 2023 and 2022, respectively, related to accrued sales and usage-based royalty revenue and performance obligations or services being rendered in advance of future invoicing associated with multi-year contracts. In royalty-based arrangements, consideration is not billed or billable until the royalty reporting is received, generally in the subsequent quarter, at which time the contract asset transfers to accounts receivable and a true-up adjustment is recorded to revenue. These true-up adjustments are generally not material. Non-current contract assets included in “Deposits and other assets” in the Consolidated Balance Sheets consisted of $0.9 million and $0.7 million, as of December 31, 2023 and 2022, respectively, related to performance obligations or services being rendered in advance of future invoicing associated with multi-year contracts. During the years ended December 31, 2023, 2022, and 2021, there were no significant impairments to the Company’s contract assets, nor were there any significant changes in the timing of the Company’s contract assets being reclassified to accounts receivable.
Contract liabilities are amounts received or due from customers in advance of the Company transferring the software or services to the customer and presented as "Deferred revenue and advance payments" in the Consolidated Balance Sheets. In the case of multi-year service contract arrangements, the Company generally does not invoice more than one year in advance of services and does not record deferred revenue for anyamounts that have not been invoiced. Revenue is subsequently recognized in the period(s) in which control of the software or services is transferred to the customer.
The Company’s “Accounts receivable, net” and “Deferred revenue and advance payments” balances in the Consolidated Balance Sheets include unpaid items includedamounts related to contracts under which the Company has an enforceable right to invoice the customer for non-cancellable and/or non-refundable software and services. Changes in accounts receivable and changes in deferred revenue and advance payments.
The Company maintains an allowance for doubtful accounts which represents its best estimatepayments are presented net of probable losses inherentthese unpaid amounts in “Operating activities” in the accounts receivable balances. The Company evaluates specific accounts when it becomes aware that a customer may not be able to meet its financial obligations due to deteriorationConsolidated Statements of its liquidity or financial viability, credit ratings, or bankruptcy. In addition, the Company periodically adjusts this allowance based on its review and assessment of the aging of receivables.
90
MICROSTRATEGY INCORPORATED
NOTES TO CONSOLIDATED FINANCIAL STATEMENTS
(7) Property and Equipment
Property and equipment (in thousands) consisted of the following, as of:
Cash Flows.
| | December 31, | |
| | 2017 | | | 2016 | |
Transportation equipment | | $ | 48,645 | | | $ | 48,835 | |
Computer equipment and purchased software | | | 57,515 | | | | 60,692 | |
Furniture and equipment | | | 10,425 | | | | 10,871 | |
Leasehold improvements | | | 28,511 | | | | 27,737 | |
Internally developed software | | | 9,643 | | | | 9,655 | |
Property and equipment, gross | | | 154,739 | | | | 157,790 | |
Less: accumulated depreciation and amortization | | | (101,380 | ) | | | (100,354 | ) |
Property and equipment, net | | $ | 53,359 | | | $ | 57,436 | |
Included in transportation equipment is the Company’s owned corporate aircraft, including capitalizable costs related to the repairs to the aircraft, and aircraft-related equipment. As of December 31, 2017, the net asset value of the aircraft and aircraft-related equipment was $36.9 million, net of $11.7 million of accumulated depreciation. As of December 31, 2016, the net asset value of the aircraft and aircraft-related equipment was $38.4 million, net of $10.2 million of accumulated depreciation.
Included in computer equipment at December 31, 2017 and 2016 is $0.6 million and $2.2 million, respectively, acquired under capital lease arrangements. At December 31, 2017 and 2016, accumulated amortization relating to computer equipment under capital lease arrangements totaled $0.6 million and $2.2 million, respectively.
Depreciation and amortization expense related to property and equipment, including assets under capital leases, was $8.4 million, $10.6 million, and $14.0 million for the years ended December 31, 2017, 2016, and 2015, respectively.
(8) Deferred Revenue and Advance Payments
Deferred revenue and advance payments (in thousands) from customers consisted of the following, as of:
| | | | | | | | |
| | December 31, | |
| | 2023 | | | 2022 | |
Current: | | | | | | |
Deferred product licenses revenue | | $ | 3,579 | | | $ | 2,825 | |
Deferred subscription services revenue | | | 65,512 | | | | 51,861 | |
Deferred product support revenue | | | 152,012 | | | | 155,366 | |
Deferred other services revenue | | | 7,059 | | | | 7,376 | |
Total current deferred revenue and advance payments | | $ | 228,162 | | | $ | 217,428 | |
| | | | | | |
Non-current: | | | | | | |
Deferred product licenses revenue | | $ | 0 | | | $ | 2,742 | |
Deferred subscription services revenue | | | 3,097 | | | | 3,030 | |
Deferred product support revenue | | | 4,984 | | | | 6,387 | |
Deferred other services revenue | | | 443 | | | | 604 | |
Total non-current deferred revenue and advance payments | | $ | 8,524 | | | $ | 12,763 | |
During the years ended December 31, 2023, 2022, and 2021, the Company recognized revenues of $215.9 million, $203.1 million, and $188.7 million, respectively, from amounts included in the total deferred revenue and advance payments balances at the beginning of the respective year. For the years ended December 31, 2023, 2022, and 2021, there were no significant changes in the timing of revenue recognition on the Company’s deferred balances.
| | December 31, | |
| | 2017 | | | 2016 | |
Current: | | | | | | | | |
Deferred product licenses revenue | | $ | 11,113 | | | $ | 13,023 | |
Deferred subscription services revenue | | | 17,324 | | | | 18,303 | |
Deferred product support revenue | | | 168,043 | | | | 162,781 | |
Deferred other services revenue | | | 9,465 | | | | 10,015 | |
Gross current deferred revenue and advance payments | | | 205,945 | | | | 204,122 | |
Less: unpaid deferred revenue | | | (93,296 | ) | | | (98,587 | ) |
Net current deferred revenue and advance payments | | $ | 112,649 | | | $ | 105,535 | |
| | | | | | | | |
Non-current: | | | | | | | | |
Deferred product licenses revenue | | $ | 7,169 | | | $ | 9,118 | |
Deferred subscription services revenue | | | 126 | | | | 1,307 | |
Deferred product support revenue | | | 4,826 | | | | 5,751 | |
Deferred other services revenue | | | 628 | | | | 690 | |
Gross non-current deferred revenue and advance payments | | | 12,749 | | | | 16,866 | |
Less: unpaid deferred revenue | | | (2,568 | ) | | | (2,951 | ) |
Net non-current deferred revenue and advance payments | | $ | 10,181 | | | $ | 13,915 | |
87
91
MICROSTRATEGY INCORPORATED
NOTES TO CONSOLIDATED FINANCIAL STATEMENTS
The Company offsets itsCompany’s remaining performance obligation represents all future revenue under contract and includes deferred revenue and advance payments and billable non-cancelable amounts that will be invoiced and recognized as revenue in future periods. The remaining performance obligation excludes contracts that are billed in arrears, such as certain time and materials contracts. The portions of multi-year contracts that will be invoiced in the future are not presented on the balance sheet within accounts receivable and deferred revenuerevenues and are instead included in the following remaining performance obligation disclosure. As of December 31, 2023, the Company had an aggregate transaction price of $339.7 million allocated to the remaining performance obligation related to product support, subscription services, product licenses, and other services contracts. The Company expects to recognize $255.5 million within the next 12 months and the remainder thereafter.
(6) Property and Equipment
Property and equipment (in thousands) consisted of the following, as of:
| | | | | | | | |
| | December 31, | |
| | 2023 | | | 2022 | |
Corporate aircraft and related equipment | | $ | 48,645 | | | $ | 48,645 | |
Computer equipment and purchased software | | | 60,979 | | | | 60,375 | |
Furniture and equipment | | | 9,920 | | | | 9,936 | |
Leasehold improvements | | | 29,944 | | | | 28,755 | |
Internally developed software | | | 9,917 | | | | 9,917 | |
Property and equipment, gross | | | 159,405 | | | | 157,628 | |
Less: accumulated depreciation and amortization | | | (130,464 | ) | | | (125,317 | ) |
Property and equipment, net | | $ | 28,941 | | | $ | 32,311 | |
Depreciation and amortization expenses related to property and equipment were $6.4 million, $6.7 million, and $8.7 million for the years ended December 31, 2023, 2022, and 2021, respectively.
(7) Leases
The Company leases office space in the United States and foreign locations under operating lease agreements. Office space is the Company’s only material underlying asset class under operating lease agreements. The Company has no material finance leases.
Under the Company’s office space lease agreements, fixed payments and variable payments that depend on an index or rate are typically comprised of base rent and parking fees. Additionally, under these agreements the Company is generally responsible for certain variable payments that typically include certain taxes, utilities and maintenance costs, and other fees. These variable lease payments are generally based on the Company’s occupation or usage percentages and are subject to adjustments by the lessor.
The Company’s ROU asset and total lease liability balances were $57.3 million and $71.5 million, respectively, as of December 31, 2023, and $61.3 million and $77.4 million, respectively, as of December 31, 2022. The Company’s most significant lease is for its corporate headquarters in Northern Virginia. The ROU asset and total lease liability balances related to the Company’s corporate headquarters lease were $48.1 million and $61.7 million, respectively, as of December 31, 2023, and $52.5 million and $68.2 million, respectively, as of December 31, 2022. The lease agreement for the Company’s corporate headquarters location is set to expire in December 2030, with an option for the Company to extend the term for an additional five or 10 consecutive years. The Company is currently not reasonably certain it will exercise this renewal option and therefore has not included the renewal option in the lease term. Several of the Company’s remaining leases contain options for renewal or options to terminate all or a portion of the leased space. The Company continually assesses the likelihood of exercising these options and recognizes an option as part of its ROU assets and lease liabilities if and when it is reasonably certain that it will exercise the option.
The following table presents the Company’s total lease cost and other lease details for the periods indicated (in thousands, except years and discount rates):
| | | | | | | | | | | | |
| | Years Ended December 31, | |
| | 2023 | | | 2022 | | | 2021 | |
Lease cost: | | | | | | | | | |
Operating lease cost | | $ | 13,081 | | | $ | 13,008 | | | $ | 13,522 | |
Short-term lease cost | | | 579 | | | | 582 | | | | 558 | |
Variable lease cost | | | 783 | | | | 514 | | | | 1,224 | |
Total lease cost | | $ | 14,443 | | | $ | 14,104 | | | $ | 15,304 | |
Other information: | | | | | | | | | |
Cash paid for amounts included in the measurement of operating lease liabilities | | $ | 9,862 | | | $ | 14,224 | | | $ | 15,772 | |
ROU assets obtained in exchange for new operating lease liabilities | | $ | 6,183 | | | $ | 1,563 | | | $ | 2,420 | |
Weighted average remaining lease term in years – operating leases | | | 6.6 | | | | 7.5 | | | | 8.3 | |
Weighted average discount rate – operating leases | | | 6.0 | % | | | 6.1 | % | | | 6.1 | % |
The following table presents the maturities of the Company’s operating lease liabilities as of December 31, 2023 (in thousands):
| | | | |
For the year ended December 31, | | | |
2024 | | $ | 14,415 | |
2025 | | | 13,357 | |
2026 | | | 13,509 | |
2027 | | | 12,865 | |
2028 | | | 12,590 | |
Thereafter | | | 19,352 | |
Total lease payments | | | 86,088 | |
Less: imputed interest | | | (14,539 | ) |
Total | | $ | 71,549 | |
| | | |
Reported as: | | | |
Current operating lease liabilities | | $ | 10,463 | |
Non-current operating lease liabilities | | | 61,086 | |
Total | | $ | 71,549 | |
The net carrying value of the Company’s long-term debt (in thousands) consisted of the following as of:
| | | | | | | | |
| | December 31, | |
| | 2023 | | | 2022 | |
2025 Convertible Notes | | $ | 643,931 | | | $ | 640,888 | |
2027 Convertible Notes | | | 1,037,306 | | | | 1,033,277 | |
2028 Secured Notes | | | 491,193 | | | | 489,547 | |
2025 Secured Term Loan | | | 0 | | | | 204,688 | |
Other long-term secured debt | | | 9,678 | | | | 10,160 | |
Total | | $ | 2,182,108 | | | $ | 2,378,560 | |
Convertible Senior Notes
In December 2020, the Company issued $650.0 million aggregate principal amount of 0.750% Convertible Senior Notes due 2025 (the “2025 Convertible Notes”) in a private offering. The 2025 Convertible Notes are senior unsecured obligations of the Company and bear interest at a fixed rate of 0.750% per annum, payable semiannually in arrears on June 15 and December 15 of each year, beginning on June 15, 2021. Holders of the 2025 Convertible Notes may receive additional interest under specified circumstances as outlined in the indenture relating to the issuance of the 2025 Convertible Notes (the “2025 Convertible Notes Indenture”). The 2025 Convertible Notes will mature on December 15, 2025, unless earlier converted, redeemed or repurchased in accordance with their terms. The total net proceeds from the 2025 Convertible Notes offering, after deducting initial purchaser discounts and issuance costs, were approximately $634.7 million.
In February 2021, the Company issued $1.050 billion aggregate principal amount of 0% Convertible Senior Notes due 2027 (the “2027 Convertible Notes”) in a private offering. The 2027 Convertible Notes are senior unsecured obligations of the Company and do not bear regular interest. However, holders of the 2027 Convertible Notes may receive special interest under specified circumstances as outlined in the indenture relating to the issuance of the 2027 Convertible Notes (the “2027 Convertible Notes Indenture”). Any special interest is payable semiannually in arrears on February 15 and August 15 of each year, beginning on August 15, 2021. The 2027 Convertible Notes will mature on February 15, 2027, unless earlier converted, redeemed, or repurchased in accordance with their terms. The total net proceeds from the 2027 Convertible Notes offering, after deducting initial purchaser discounts and issuance costs, were approximately $1.026 billion.
The 2025 Convertible Notes and 2027 Convertible Notes (collectively, the “Convertible Notes”) are senior unsecured obligations and rank senior in right of payment to any of the Company’s indebtedness that is expressly subordinated in right of payment to the Convertible Notes; equal in right of payment to any of the Company’s unsecured indebtedness that is not so subordinated; effectively junior in right of payment to any of the Company’s secured indebtedness to the extent of the value of the assets securing such indebtedness; and structurally junior to all indebtedness and other liabilities (including trade payables) of the Company’s subsidiaries.
The Convertible Notes are convertible into shares of the Company’s class A common stock at initial conversion rates of 2.5126 shares and 0.6981 shares per $1,000 principal amount of Convertible Notes for the 2025 Convertible Notes and 2027 Convertible Notes, respectively (equivalent to an initial conversion price of approximately $397.99 per share and $1,432.46 per share of class A common stock for the 2025 Convertible Notes and 2027 Convertible Notes, respectively). The conversion rates are subject to customary anti-dilution adjustments. In addition, following certain events that may occur prior to the respective maturity dates or if the Company delivers a notice of redemption, the Company will increase the conversion rate for a holder who elects to convert its Convertible Notes in connection with such corporate event or notice of redemption, as the case may be, in certain circumstances as provided in the 2025 Convertible Notes Indenture and the 2027 Convertible Notes Indenture (collectively, the “Convertible Notes Indentures”), respectively. There have been no adjustments to the initial conversion rates for each of the Convertible Notes as of December 31, 2023. As of December 31, 2023, the maximum number of shares into which the Convertible Notes could be potentially converted if the conversion features are triggered are 1,633,190 and 733,005 shares for the 2025 Convertible Notes and 2027 Convertible Notes, respectively.
Prior to June 15, 2025 and August 15, 2026 for the 2025 Convertible Notes and 2027 Convertible Notes, respectively, the Convertible Notes are convertible only under the following circumstances: (1) during any calendar quarter commencing after the calendar quarter ending on March 31, 2021 and June 30, 2021 for the 2025 Convertible Notes and 2027 Convertible Notes, respectively (and only during such calendar quarter), if the last reported sale price of the Company’s class A common stock for at least 20 trading days (whether or not consecutive) during the period of 30 consecutive trading days ending on, and including, the last trading day of the immediately preceding calendar quarter is greater than or equal to 130% of the conversion price of the 2025 Convertible Notes or 2027 Convertible Notes, respectively, on each applicable trading day; (2) during the five business day period after any five consecutive trading day period (the “measurement period”) in which the “trading price” (as defined in the Convertible Notes Indentures) per $1,000 principal amount of the 2025 Convertible Notes or 2027 Convertible Notes, respectively, for each trading day of the measurement period was less than 98% of the product of the last reported sale price of the Company’s class A common stock and the applicable conversion rate on each such trading day; (3) if the Company calls any or all of the 2025 Convertible Notes or 2027 Convertible Notes, respectively, for redemption, at any time prior to the close of business on the second scheduled trading day immediately preceding the redemption date; and (4) upon occurrence of specified corporate events as described in the Convertible Notes Indentures.
On or after June 15, 2025 or August 15, 2026 for the 2025 Convertible Notes and 2027 Convertible Notes, respectively, until the close of business on the second scheduled trading day immediately preceding the maturity dates of the 2025 Convertible Notes or 2027 Convertible Notes, respectively, holders may convert the 2025 Convertible Notes or 2027 Convertible Notes, respectively, at any time. Upon conversion of the Convertible Notes, the Company will pay or deliver, as the case may be, cash, shares of the Company’s class A common stock, or a combination of cash and shares of class A common stock, at the Company’s election.
Prior to December 20, 2023 or February 20, 2024 for the 2025 Convertible Notes and 2027 Convertible Notes, respectively, the Company may not redeem the Convertible Notes. The Company may redeem for cash all or a portion of the 2025 Convertible Notes or 2027 Convertible Notes, at its option, on or after December 20, 2023 or February 20, 2024, respectively, if the last reported sale price of the Company’s class A common stock has been at least 130% of the conversion price of the 2025 Convertible Notes or 2027 Convertible Notes, respectively, then in effect for at least 20 trading days (whether or not consecutive), including the trading day immediately preceding the date on which the Company provides a notice of redemption, during any 30 consecutive trading day period ending on, and including, the trading day immediately preceding the date on which the Company provides notice of redemption. The redemption price will be equal to 100% of the principal amount of the Convertible Notes to be redeemed, plus accrued and unpaid interest to, but excluding, the redemption date. The Company has not redeemed any of the Convertible Notes as of December 31, 2023.
If the Company undergoes a “fundamental change,” as defined in the Convertible Notes Indentures, prior to maturity, subject to certain conditions, holders may require the Company to repurchase for cash all or any portion of their Convertible Notes at a fundamental change repurchase price equal to 100% of the principal amount of the Convertible Notes to be repurchased, plus any accrued and unpaid interest to, but excluding, the fundamental change repurchase date.
The Convertible Notes Indentures contain customary terms and covenants, including that upon certain events of default occurring and continuing, either the Trustee or the holders of at least 25% in principal amount of the outstanding 2025 Convertible Notes or 2027 Convertible Notes, respectively, may declare 100% of the principal of, and accrued and unpaid interest, if any, on, all the 2025 Convertible Notes or 2027 Convertible Notes, respectively, to be due and payable.
During the year ended December 31, 2023, the 2025 Convertible Notes were not convertible at any time. During the year ended December 31, 2022, the 2025 Convertible Notes were convertible at the option of the holders of the 2025 Convertible Notes during the first quarter of 2022 only. During the year ended December 31, 2021, the 2025 Convertible Notes were convertible at the option of the holders of the 2025 Convertible Notes during the second quarter and fourth quarter of 2021 only. During the years ended December 31, 2023, 2022, and 2021, the 2027 Convertible Notes were not convertible at any time. No conversions of the Convertible Notes occurred during the years ended December 31, 2023, 2022, and 2021. The Convertible Notes may be convertible in future periods if one or more of the conversion conditions is satisfied during future measurement periods. As of December 31, 2023, the last reported sale price of the Company’s class A common stock for at least 20 trading days during the 30 consecutive trading days ending on, and including, December 31, 2023 was greater than or equal to 130% of the conversion price of the 2025 Convertible Notes on each applicable trading day. Therefore, the 2025 Convertible Notes are convertible at the option of the holders of the 2025 Convertible Notes during the first quarter of 2024.
The Company incurred approximately $15.3 million and $24.2 million in customary offering expenses associated with the 2025 Convertible Notes and 2027 Convertible Notes, respectively (“issuance costs”). The Company accounts for these issuance costs as a reduction to the principal amount of the 2025 Convertible Notes and 2027 Convertible Notes, respectively, and amortizes the issuance costs to interest expense over the contractual term of the 2025 Convertible Notes and 2027 Convertible Notes, respectively, at an effective interest rate of 1.23% and 0.39%, respectively.
Although the Convertible Notes each contain embedded conversion features, the Company accounts for each of the Convertible Notes in its entirety as a liability because the conversion features are indexed to the Company’s class A common stock and meet the criteria for classification in stockholders’ equity and therefore do not qualify for separate derivative accounting. As of December 31, 2023 and 2022, the net carrying value of the Convertible Notes was classified as a long-term liability in the “Long-term debt, net” line item in the Company’s Consolidated Balance Sheets.
The following is a summary of the Company’s convertible debt instruments as of December 31, 2023 (in thousands):
| | | | | | | | | | | | | | | | | | |
| | December 31, 2023 |
| | Outstanding | | | Unamortized | | | Net Carrying | | | Fair Value |
| | Principal Amount | | | Issuance Costs | | | Value | | | Amount | | | Leveling |
2025 Convertible Notes | | $ | 650,000 | | | $ | (6,069 | ) | | $ | 643,931 | | | $ | 1,074,713 | | | Level 2 |
2027 Convertible Notes | | | 1,050,000 | | | | (12,694 | ) | | | 1,037,306 | | | | 913,808 | | | Level 2 |
Total | | $ | 1,700,000 | | | $ | (18,763 | ) | | $ | 1,681,237 | | | $ | 1,988,521 | | | |
The following is a summary of the Company’s convertible debt instruments as of December 31, 2022 (in thousands):
| | | | | | | | | | | | | | | | | | |
| | December 31, 2022 |
| | Outstanding | | | Unamortized | | | Net Carrying | | | Fair Value |
| | Principal Amount | | | Issuance Costs | | | Value | | | Amount | | | Leveling |
2025 Convertible Notes | | $ | 650,000 | | | $ | (9,112 | ) | | $ | 640,888 | | | $ | 364,000 | | | Level 2 |
2027 Convertible Notes | | | 1,050,000 | | | | (16,723 | ) | | | 1,033,277 | | | | 394,800 | | | Level 2 |
Total | | $ | 1,700,000 | | | $ | (25,835 | ) | | $ | 1,674,165 | | | $ | 758,800 | | | |
The fair value of the Convertible Notes is determined using observable market data other than quoted prices, specifically the last traded price at the end of the reporting period of identical instruments in the over-the-counter market (Level 2).
For the years ended December 31, 2023, 2022 and 2021, interest expense related to the Convertible Notes was as follows (in thousands):
| | | | | | | | | | | | | | | | | | | | | | | | | | | | | | | | | | | | |
| | Year Ended December 31, 2023 | | | Year Ended December 31, 2022 | | | Year Ended December 31, 2021 | |
| | Contractual | | | Amortization of | | | | | | Contractual | | | Amortization of | | | | | | Contractual | | | Amortization of | | | | |
| | Interest Expense | | | Issuance Costs | | | Total | | | Interest Expense | | | Issuance Costs | | | Total | | | Interest Expense | | | Issuance Costs | | | Total | |
2025 Convertible Notes | | $ | 4,875 | | | $ | 3,043 | | | $ | 7,918 | | | $ | 4,875 | | | $ | 3,006 | | | $ | 7,881 | | | $ | 4,875 | | | $ | 2,970 | | | $ | 7,845 | |
2027 Convertible Notes | | | 0 | | | | 4,029 | | | | 4,029 | | | | 0 | | | | 4,014 | | | | 4,014 | | | | 0 | | | | 3,433 | | | | 3,433 | |
Total | | $ | 4,875 | | | $ | 7,072 | | | $ | 11,947 | | | $ | 4,875 | | | $ | 7,020 | | | $ | 11,895 | | | $ | 4,875 | | | $ | 6,403 | | | $ | 11,278 | |
The Company paid $4.9 million, $4.9 million and $4.9 million, respectively, in interest related to the 2025 Convertible Notes during the years ended December 31, 2023, 2022, and 2021. The Company has not paid any additional interest or special interest related to the 2025 Convertible Notes or the 2027 Convertible Notes, respectively, to date.
Senior Secured Notes
On June 14, 2021, the Company issued $500.0 million aggregate principal amount of 2028 Secured Notes. The 2028 Secured Notes were sold under a purchase agreement, dated as of June 8, 2021, entered into by and among the Company, MicroStrategy Services Corporation, a wholly owned subsidiary of the Company (the “Guarantor”), and Jefferies LLC, for resale to qualified institutional buyers pursuant to Rule 144A under the Securities Act of 1933, as amended (the “Securities Act”), and to persons outside the United States pursuant to Regulation S under the Securities Act. The terms of the 2028 Secured Notes are governed by an indenture, dated as of June 14, 2021 (the “2028 Secured Notes Indenture”), among the Company, the Guarantor, and U.S. Bank National Association, as trustee and collateral agent.
The 2028 Secured Notes are unconditionally guaranteed, jointly and severally, on a senior secured basis by the Guarantor and certain subsidiaries of the Company (excluding MacroStrategy) that may be formed or acquired on or after June 14, 2021 (collectively, the “Subsidiary Guarantors”). The 2028 Secured Notes bear interest at a fixed rate of 6.125% per annum, payable semiannually in arrears on June 15 and December 15 of each year, beginning on December 15, 2021. The 2028 Secured Notes have a stated maturity date of June 15, 2028, unless earlier redeemed or repurchased in accordance with their terms and subject to a springing maturity date of September 15, 2025 or November 16, 2026 as discussed further below. The total net proceeds from the 2028 Secured Notes, after deducting initial purchaser discounts and issuance costs, were approximately $487.2 million.
The 2028 Secured Notes and the related guarantees are secured, on a senior secured basis with the Company’s existing and future senior indebtedness, by a security interest in substantially all of the Company’s and the Subsidiary Guarantors’ assets (the “Collateral”). The Collateral includes any bitcoins or other digital assets acquired by the Company or a Subsidiary Guarantor on or after June 14, 2021, but excludes bitcoins held by MacroStrategy and certain other excluded assets. As of December 31, 2023, approximately 16,081 of the bitcoins held by the Company serve as part of the Collateral. MacroStrategy is the Company’s subsidiary formed to hold bitcoins and digital assets that are not included in the Collateral, including bitcoins acquired before June 14, 2021, bitcoins that MacroStrategy acquired using the proceeds from the 2025 Secured Term Loan, and bitcoins purchased by MacroStrategy from contributions made to it by the Company with the proceeds from sales of the Company’s class A common stock, such as sales of the Company’s class A common stock pursuant to the equity offerings described in Note 13, At-the-Market Equity Offerings, to the Consolidated Financial Statements.
The 2028 Secured Notes and the related guarantees are the general senior secured obligations of the Company and the Subsidiary Guarantors and rank pari passu in right of payment with the Company’s and the Subsidiary Guarantors’ existing and future senior indebtedness, are senior in right of payment to all future subordinated indebtedness of the Company and the Subsidiary Guarantors, and are effectively senior to any existing and future unsecured indebtedness of the Company and the Subsidiary Guarantors (including the Convertible Notes) to the extent of the value of the Collateral (after giving effect to the sharing of such Collateral with holders of equal or prior ranking liens on the Collateral).
The 2028 Secured Notes and the guarantees are: (i) secured on a first priority basis by liens on the Collateral (subject to certain permitted liens and certain other exceptions, as provided in the 2028 Secured Notes Indenture) or to the extent there is outstanding ABL Indebtedness (as defined in the 2028 Secured Notes Indenture), secured on a first priority basis by the Notes Priority Collateral (as defined in the 2028 Secured Notes Indenture) and on a second priority basis by liens on the ABL Priority Collateral (as defined in the 2028 Secured Notes Indenture) (subject to certain permitted liens and certain other exceptions), (ii) effectively subordinated to any future ABL Indebtedness to the extent of the value of the ABL Priority Collateral securing such future ABL Indebtedness, (iii) effectively subordinated to any existing and future indebtedness of the Company or any Subsidiary Guarantor that is secured by liens on assets of the Company or any Subsidiary Guarantor that do not constitute a part of the Collateral, and (iv) structurally subordinated to any existing and future indebtedness and other liabilities of MacroStrategy and any other Company subsidiaries that are not Subsidiary Guarantors, other than intercompany indebtedness and liabilities owed to the Company or a Subsidiary Guarantor.
At any time and from time to time prior to June 15, 2024, the Company may redeem some or all of the 2028 Secured Notes at a redemption price equal to 100% of the principal amount of the 2028 Secured Notes being redeemed, plus accrued and unpaid interest, if any, to, but excluding, the redemption date, plus a “make-whole” premium as set forth in the 2028 Secured Notes Indenture. At any time and from time to time on or after June 15, 2024, the Company may redeem some or all of the 2028 Secured Notes at the redemption prices described in the 2028 Secured Notes Indenture, plus accrued and unpaid interest, if any, to, but excluding, the redemption date. At any time prior to June 15, 2024, but not more than once during each consecutive twelve-month period, the Company may redeem up to 10% of the aggregate principal amount of the 2028 Secured Notes at a redemption price equal to 103% of the principal amount of the 2028 Secured Notes being redeemed, plus accrued and unpaid interest, if any, to, but excluding, the redemption date. At any time prior to June 15, 2024, the Company may redeem, on one or more occasions, up to 40% of the aggregate principal amount of the 2028 Secured Notes with the proceeds of certain equity offerings, at a redemption price equal to 106.125% of the principal amount of the 2028 Secured Notes to be redeemed, plus accrued and unpaid interest, if any, to, but excluding, the redemption date. The Company has not redeemed any of the 2028 Secured Notes as of December 31, 2023.
If the Company experiences a Change of Control or Fundamental Change (each as defined in the 2028 Secured Notes Indenture), the Company may be required to offer to repurchase the 2028 Secured Notes at a purchase price equal to 101% of their principal amount plus accrued and unpaid interest, if any, to, but excluding, the repurchase date. In certain circumstances, the Company must use certain of the proceeds from a sale of assets to make an offer to repurchase 2028 Secured Notes at a purchase price equal to 100% of their principal amount, plus accrued and unpaid interest, if any, to, but excluding, the repurchase date.
The 2028 Secured Notes include a springing maturity feature that will cause the stated maturity date to spring ahead to: (1) September 15, 2025 (the “First Springing Maturity Date”), unless on the First Springing Maturity Date (i) the Company has Liquidity (as defined in the 2028 Secured Notes Indenture) in excess of 130% of the amount required to pay in full in cash the then outstanding aggregate principal amount of, and accrued interest on, the 2025 Convertible Notes or (ii) less than $100,000,000 of the aggregate principal amount of the 2025 Convertible Notes remains outstanding, (2) November 16, 2026 (the “Second Springing Maturity Date”), unless on the Second Springing Maturity Date (i) the Company has Liquidity in excess of 130% of the amount required to pay in full in cash the then outstanding aggregate principal amount of, and accrued interest on, the 2027 Convertible Notes or (ii) less than $100,000,000 of the aggregate principal amount of the 2027 Convertible Notes remains outstanding, or (3) the date (such date, an “FCCR Springing Maturity Date”) that is 91 days prior to the maturity date of any future convertible debt that we may issue that is then outstanding (the “FCCR Convertible Indebtedness”), unless on the FCCR Springing Maturity Date (i) the Company has Liquidity in excess of 130% of the amount required to pay in full in cash the then outstanding aggregate principal amount of and accrued interest on such FCCR Convertible Indebtedness or (ii) less than $100,000,000 of the aggregate principal amount of such FCCR Convertible Indebtedness remains outstanding. “Liquidity” is defined in the 2028 Secured Notes Indenture and includes the Digital Asset Market Value (as defined in the 2028 Secured Notes Indenture) of the bitcoin owned by the Company and its Restricted Subsidiaries (as defined in the 2028 Secured Notes Indenture) immediately prior to the issuance of the 2028 Secured Notes (which are referred to as “Existing Digital Assets”). As of December 31, 2023, for purposes of calculating Liquidity, the Company and its Restricted Subsidiaries owned approximately 92,079 Existing Digital Assets, all of which were unencumbered.
The 2028 Secured Notes Indenture contains certain covenants with which the Company must comply, including covenants with respect to limitations on (i) additional indebtedness, (ii) liens, (iii) certain payments and investments, (iv) the ability to merge or consolidate with another person, or sell or otherwise dispose of substantially all the Company’s assets, and (v) certain transactions with affiliates. The Company was in compliance with its debt covenants as of December 31, 2023.
The Company incurred approximately $12.8 million in customary offering expenses associated with the 2028 Secured Notes. The Company accounts for these issuance costs as a reduction to the principal amount of the 2028 Secured Notes and amortizes the issuance costs to interest expense over the contractual term of the 2028 Secured Notes at an effective interest rate of 6.58%. As of December 31, 2023 and 2022, the net carrying value of the 2028 Secured Notes was classified as a long-term liability in the “Long-term debt, net” line item in the Company’s Consolidated Balance Sheets.
The following is a summary of the 2028 Secured Notes as of December 31, 2023 (in thousands):
| | | | | | | | | | | | | | | | | | |
| | December 31, 2023 |
| | Outstanding | | | Unamortized | | | Net Carrying | | | Fair Value |
| | Principal Amount | | | Issuance Costs | | | Value | | | Amount | | | Leveling |
2028 Secured Notes | | $ | 500,000 | | | $ | (8,807 | ) | | $ | 491,193 | | | $ | 485,070 | | | Level 2 |
The following is a summary of the 2028 Secured Notes as of December 31, 2022 (in thousands):
| | | | | | | | | | | | | | | | | | |
| | December 31, 2022 |
| | Outstanding | | | Unamortized | | | Net Carrying | | | Fair Value |
| | Principal Amount | | | Issuance Costs | | | Value | | | Amount | | | Leveling |
2028 Secured Notes | | $ | 500,000 | | | $ | (10,453 | ) | | $ | 489,547 | | | $ | 369,800 | | | Level 2 |
The fair value of the 2028 Secured Notes is determined using observable market data other than quoted prices, specifically the last traded price at the end of the reporting period of identical instruments in the over-the-counter market (Level 2).
For the years ended December 31, 2023, 2022, and 2021, interest expense related to the 2028 Secured Notes was as follows (in thousands):
| | | | | | | | | | | | | | | | | | | | | | | | | | | | | | | | | | | | |
| | Year Ended December 31, 2023 | | | Year Ended December 31, 2022 | | | Year Ended December 31, 2021 | |
| | Contractual | | | Amortization of | | | | | | Contractual | | | Amortization of | | | | | | Contractual | | | Amortization of | | | | |
| | Interest Expense | | | Issuance Costs | | | Total | | | Interest Expense | | | Issuance Costs | | | Total | | | Interest Expense | | | Issuance Costs | | | Total | |
2028 Secured Notes | | $ | 30,625 | | | $ | 1,646 | | | $ | 32,271 | | | $ | 30,625 | | | $ | 1,541 | | | $ | 32,166 | | | $ | 16,674 | | | $ | 798 | | | $ | 17,472 | |
The Company paid $30.6 million, $30.6 million, and $15.4 million, respectively, in interest related to the 2028 Secured Notes during the years ended December 31, 2023, 2022, and 2021.
Secured Term Loan
On March 23, 2022, MacroStrategy, a wholly-owned subsidiary of the Company, entered into a Credit and Security Agreement (the “Credit and Security Agreement”) with Silvergate pursuant to which Silvergate issued the $205.0 million 2025 Secured Term Loan to MacroStrategy.
On March 24, 2023, MacroStrategy and Silvergate entered into a Prepayment, Waiver and Payoff to Credit and Security Agreement, pursuant to which MacroStrategy voluntarily prepaid Silvergate approximately $161.0 million (the “Payoff Amount”), in full repayment, satisfaction, and discharge of the 2025 Secured Term Loan and all other obligations under the Credit and Security Agreement. Upon Silvergate’s receipt of the Payoff Amount on March 24, 2023, the Credit and Security Agreement was terminated and Silvergate released its security interest in all of MacroStrategy’s assets collateralizing the 2025 Secured Term Loan, including the bitcoin that was serving as collateral.
The Payoff Amount consisted of a $159.9 million payment to repay the full $205.0 million outstanding principal amount of the 2025 Secured Term Loan as of March 24, 2023 and a $1.1 million payment for accrued unpaid interest on the 2025 Secured Term Loan as of March 24, 2023. The Company also incurred $0.1 million in third party fees in connection with the repayment of the 2025 Secured Term Loan. The net carrying value of the 2025 Secured Term Loan as of March 24, 2023, immediately prior to the loan’s repayment, was $204.7 million, which resulted in a $44.7 million gain on debt extinguishment recognized in the Company’s Consolidated Statement of Operations in the first quarter of 2023.
MacroStrategy previously maintained a $5.0 million cash reserve account (the “Reserve Account”) with Silvergate to serve as additional collateral for the 2025 Secured Term Loan. On March 24, 2023, the $5.0 million then held in the Reserve Account was applied against the Payoff Amount, reducing the amount of additional funds that were required to be paid by MacroStrategy to Silvergate in connection with the payoff of the 2025 Secured Term Loan. As of December 31, 2022, the Reserve Account was presented within “Restricted cash” in the Company’s Consolidated Balance Sheet and the Bitcoin Collateral Account was presented within “Digital assets” in the Company’s Consolidated Balance Sheet as further described in Note 4, Digital Assets, to the Consolidated Financial Statements.
Prior to the prepayment, the 2025 Secured Term Loan was a senior secured obligation of MacroStrategy that bore interest at a floating rate equal to the Secured Overnight Financing Rate 30 Day Average, as published by the Federal Reserve Bank of New York’s website, plus 3.70%, with a floor of 3.75%, with interest payable monthly in arrears beginning May 2022. The 2025 Secured Term Loan was scheduled to mature on March 23, 2025, unless earlier prepaid or repaid in accordance with the terms of the Credit and Security Agreement. The total net proceeds from the 2025 Secured Term Loan, after deducting lender fees and third-party costs, were approximately $204.6 million.
In accordance with the terms of the Credit and Security Agreement, the 2025 Secured Term Loan was initially collateralized at closing by bitcoin with a value of approximately $820.0 million placed in a collateral account (the “Bitcoin Collateral Account”) with a custodian mutually authorized by Silvergate and MacroStrategy. While the 2025 Secured Term Loan was outstanding, MacroStrategy was required to maintain a loan to collateral value ratio (“LTV Ratio”) of less than 50%. As a result, MacroStrategy was required to maintain more than $410.0 million of bitcoin in the Bitcoin Collateral Account, assuming the full $205.0 million of 2025 Secured Term Loan principal remained outstanding.
The Company incurred approximately $0.4 million in lender fees and third-party costs (“issuance costs”) associated with the 2025 Secured Term Loan. The Company accounted for these issuance costs as a reduction to the principal amount of the 2025 Secured Term Loan and amortized the issuance costs to interest expense over the contractual term of the 2025 Secured Term Loan at an effective interest rate of 3.87% until the 2025 Secured Term Loan's prepayment in March 2023. As of December 31, 2022, the net carrying value of the 2025 Secured Term Loan was classified as a long-term liability in the “Long-term debt, net” line item in the Company’s Consolidated Balance Sheet.
The following is a summary of the 2025 Secured Term Loan as of December 31, 2022 (in thousands):
| | | | | | | | | | | | | | | | | | |
| | December 31, 2022 |
| | Outstanding | | | Unamortized | | | Net Carrying | | | Fair Value |
| | Principal Amount | | | Issuance Costs | | | Value | | | Amount | | | Leveling |
2025 Secured Term Loan | | $ | 205,000 | | | $ | (312 | ) | | $ | 204,688 | | | $ | 205,000 | | | Level 3 |
The outstanding principal amount of the 2025 Secured Term Loan approximated its fair value as of December 31, 2022 as the 2025 Secured Term Loan bore interest at a floating rate and was over-collateralized (the Company was required to maintain an LTV ratio of less than 50%). Additionally, the Company had approximately 82,991 unencumbered bitcoins that were available to be pledged as additional collateral at December 31, 2022.
No interest expense related to the 2025 Secured Term Loan was recognized after the debt was repaid in full during the first quarter of 2023. For the years ended December 31, 2023 and 2022, interest expense related to the 2025 Secured Term Loan was as follows (in thousands):
| | | | | | | | | | | | | | | | | | | | | | | | |
| | Year Ended December 31, 2023 | | | Year Ended December 31, 2022 | |
| | Contractual | | | Amortization of | | | | | | Contractual | | | Amortization of | | | | |
| | Interest Expense | | | Issuance Costs | | | Total | | | Interest Expense | | | Issuance Costs | | | Total | |
2025 Secured Term Loan | | $ | 3,781 | | | $ | 31 | | | $ | 3,812 | | | $ | 9,006 | | | $ | 103 | | | $ | 9,109 | |
The Company paid a final $5.1 million in interest related to the 2025 Secured Term Loan during the first quarter of 2023, $1.1 million of which was included in the Payoff Amount. The Company paid $7.7 million in interest related to the 2025 Secured Term Loan during the year ended December 31, 2022.
Other long-term secured debt
In June 2022, the Company, through a wholly-owned subsidiary, entered into a secured term loan agreement in the amount of $11.1 million, bearing interest at an annual rate of 5.2%, and maturing in June 2027. The loan is secured by certain non-bitcoin assets of the Company that are not otherwise serving as collateral for any unpaid itemsof the Company’s other indebtedness. After monthly payments made under the terms of the agreement, the loan had a net carrying value of $10.2 million and $10.6 million as of December 31, 2023 and 2022, respectively, and an outstanding principal balance of $10.3 million and $10.9 million as of December 31, 2023 and 2022, respectively. As of December 31, 2023 and 2022, $0.5 million and $0.5 million of the respective net carrying values were short-term and presented in "Current portion of long-term debt, net" in the Consolidated Balance Sheets.
Maturities
The following table shows the maturities of the Company’s debt instruments as of December 31, 2023 (in thousands). The principal payments related to the 2028 Secured Notes are included in deferred revenue and advance payments.the table below based on the First Springing Maturity Date of September 15, 2025, as if the springing maturity feature discussed above were triggered. As of December 31, 2023, the Company expects to be able to satisfy the requirements in the 2028 Secured Notes Indenture to avoid triggering the springing maturity feature of the 2028 Secured Notes.
| | | | | | | | | | | | | | | | | | | | |
Payments due by period ended December 31, | | 2025 Convertible Notes | | | 2027 Convertible Notes | | | 2028 Secured Notes | | | Other long-term
secured debt | | | Total | |
2024 | | $ | 0 | | | $ | 0 | | | $ | 0 | | | $ | 539 | | | $ | 539 | |
2025 | | | 650,000 | | | | 0 | | | | 500,000 | | | | 570 | | | | 1,150,570 | |
2026 | | | 0 | | | | 0 | | | | 0 | | | | 600 | | | | 600 | |
2027 | | | 0 | | | | 1,050,000 | | | | 0 | | | | 8,633 | | | | 1,058,633 | |
2028 | | | 0 | | | | 0 | | | | 0 | | | | 0 | | | | 0 | |
Thereafter | | | 0 | | | | 0 | | | | 0 | | | | 0 | | | | 0 | |
Total | | $ | 650,000 | | | $ | 1,050,000 | | | $ | 500,000 | | | $ | 10,342 | | | $ | 2,210,342 | |
(9) Commitments and Contingencies
(a) Commitments
From time to time, the Company enters into certain types of contracts that require it to indemnify parties against third-party claims. These contracts primarily relate to agreements under which the Company assumes indemnity obligations for intellectual property infringement, as well as other obligations from time to time depending on arrangements negotiated with customers and other third parties. The conditions of these obligations vary. Thus, the overall maximum amount of the Company’s indemnification obligations cannot be reasonably estimated. Historically, the Company has not been obligated to make significant payments for these obligations and does not currently expect to incur any material obligations in the future. Accordingly, the Company has not recorded an indemnification liability on its balance sheetsConsolidated Balance Sheets as of December 31, 20172023 or December 31, 2016.2022.
The Company leases office space and computer and other equipment under operating lease agreements. Under the lease agreements, in addition to base rent, the Company is generally responsible for certain taxes, utilities and maintenance costs, and other fees. Several of these leases include options for renewal or purchase. The Company does not have any material capital leases. As of December 31, 2017, the Company leased approximately 214,000 square feet of office space at a location in Northern Virginia that began serving as its corporate headquarters in October 2010 and was to expire in December 2020. In January 2018, the Company amended the lease to extend the lease term through December 2030. See Note 17, Subsequent Events, to the Consolidated Financial Statements for further information.
At December 31, 2017 and 2016, deferred rent of $8.5 million and $12.3 million, respectively, was included in other long-term liabilities and $3.8 million and $3.5 million, respectively, was included in current accrued expenses.
As a result of the U.S. government enacted comprehensive tax legislation commonly referred to as the Tax Cuts and Jobs Act (the “Tax Act”), the Company estimated and recorded a one-time $40.3 million tax expense related to the mandatory deemed repatriation transition tax (“Transition Tax”) during the year ended December 31, 2017. See Note 10, Income Taxes, to the Consolidated Financial Statement for further information. At December 31, 2017, $36.8 million of the Transition Tax was included in “other long-term liabilities” and $3.5 million was netted against “prepaid expenses and other current assets” in the Company’s Consolidated Balance Sheets.
The following table shows future minimum rent payments under noncancellable operating leases andrelated to noncancelable purchase agreements with initial terms of greater than one year net of total future minimum rent payments to be received under noncancellable sublease agreements, and anticipated payments related to the one-time Transition Taxmandatory deemed repatriation transition tax resulting from the U.S. Tax Cuts and Jobs Act (“Transition Tax”) based on the expected due dates of the various installments as of December 31, 20172023 (in thousands):
| | | | | | | | |
| | Operating Leases | | | Transition Tax | |
Year | | Amount | | | Amount | |
2018 | | $ | 24,508 | | | $ | 3,450 | |
2019 | | | 20,059 | | | | 3,200 | |
2020 | | | 18,779 | | | | 3,200 | |
2021 | | | 2,610 | | | | 3,200 | |
2022 | | | 1,758 | | | | 3,200 | |
Thereafter | | | 4,276 | | | | 24,000 | |
| | $ | 71,990 | | | $ | 40,250 | |
| | | | | | | | |
Year | | Purchase
Obligations | | | Transition
Tax | |
2024 | | $ | 22,003 | | | $ | 7,379 | |
2025 | | | 31,633 | | | | 9,223 | |
2026 | | | 57,132 | | | | 0 | |
2027 | | | 25,000 | | | | 0 | |
2028 | | | 0 | | | | 0 | |
Thereafter | | | 0 | | | | 0 | |
| | $ | 135,768 | | | $ | 16,602 | |
(b) Contingencies
Brazil Matter
Following an internal review initiated in 2018, the Company believes that its Brazilian subsidiary failed or likely failed to comply with local procurement regulations in conducting business with certain Brazilian government entities.
On February 6, 2020, the Company learned that a Brazilian court authorized the Brazilian Federal Police to use certain investigative measures in its investigation into alleged corruption and procurement fraud involving certain government officials, pertaining to a particular transaction. The above table doestransaction at issue is part of the basis of the previously reported failure or likely failure of the Company’s Brazilian subsidiary to comply with local procurement regulations. The Company is not aware of any allegations that any former employee or the Company made any payments to Brazilian government officials. The Brazilian Federal Police expanded the investigation to include estimated payments relatedother possible cases of procurement fraud involving Brazilian government entities. Criminal penalties may be imposed against individuals; however, neither employees of the Company’s Brazilian subsidiary nor the subsidiary itself have been targets of the Federal Police investigation.
The Company has also learned that Brazil’s Federal Comptroller General filed an administrative action against the Company’s Brazilian subsidiary with respect to the renewalalleged procurement violations. These matters remain the subject of our corporate headquarters officeinvestigation by Brazilian authorities. The Company is taking measures to attempt to resolve these matters.
On January 18, 2023, Brazil’s General Superintendence of the Administrative Council for Economic Defense (“SG/CADE”) launched an administrative proceeding to investigate potentially anticompetitive conduct, naming various individuals and companies as defendants including the Company’s Brazilian subsidiary. The proceeding involves conduct relating to transactions with certain Brazilian public and private entities that is part of the basis of the foregoing failure or likely failure of the Brazilian subsidiary to comply with local procurement regulations. The proceeding was precipitated by the Company’s Brazilian subsidiary’s voluntary disclosure of information to SG/CADE that arose out of the internal review initiated in 2018, and the Company’s Brazilian subsidiary has secured a leniency agreement with SG/CADE. If at the end of the proceeding, CADE’s Tribunal confirms that the leniency agreement obligations have been fulfilled, the Company’s Brazilian subsidiary will receive full immunity from fines.
The Company believes that a loss is probable in connection with these Brazilian matters. The Company has estimated a minimum loss of $1.2 million in respect of these matters. Given the stage of these matters, as of December 31, 2023, the Company remains unable to reasonably estimate a range of loss beyond such minimum loss. The aggregate accrued amount for these matters is included as a component of “Accounts payable, accrued expenses, and operating lease liabilities” in January 2018. See Note 17, Subsequent Events, to the Consolidated Financial Statements for further information about our corporate headquarters office lease.
92
MICROSTRATEGY INCORPORATED
NOTES TO CONSOLIDATED FINANCIAL STATEMENTS
Total rental expenses under operating lease agreementsBalance Sheet as of December 31, 2023. No amounts were accrued as of December 31, 2022, as the minimum loss was not estimable at such date. The final outcome of these matters may result in a loss that is significantly greater than this accrued amount. Any loss associated with the final outcome of these matters may result in a material impact on the Company’s earnings and financial results for the years ended December 31, 2017, 2016, and 2015 were $19.8 million, $20.3 million, and $22.6 million, respectively.period in which any such additional
liability is accrued. However, the Company believes that any loss associated with the final outcome of these matters will not have a material effect on the Company’s financial position.
(b) ContingenciesDaedalus Matter
In December 2011, DataTern, Inc. (“DataTern”) filedAs previously reported, on November 4, 2020, a complaint for patent infringementwas filed against the Company in the United StatesU.S. District Court for the Eastern District of MassachusettsVirginia by a patent assertion entity called Daedalus Blue, LLC (“Daedalus”). In its complaint, Daedalus alleges that the Company has infringed U.S. Patent Nos. 8,341,172 (the “District Court”“’172 Patent”). and 9,032,076 (the “’076 Patent”) based on specific functionality in the MicroStrategy platform. The ’172 Patent relates to a method for providing aggregate data access in response to a query, whereas the ’076 Patent relates to a role-based access control system.
On January 5, 2024, Daedalus and the Company entered into a Memorandum of Understanding (“MOU”) pursuant to which the parties agreed to settle the matter. Under the MOU, the Company received a fully paid-up license to all patents owned by Daedalus as of January 5, 2024, including the ’172 Patent and the ’076 Patent. The court cancelled the trial scheduled to begin on January 8, 2024 and suspended all case deadlines. On January 29, 2024, the parties executed a formal settlement agreement memorializing the terms set forth in the MOU and agreed to file a stipulation of dismissal with the court by February 27, 2024.
False Claims Act Matter
On August 31, 2022, the District of Columbia (the “District”), through its Office of the Attorney General, filed a civil complaint in the Superior Court of the District of Columbia naming as defendants (i) Michael J. Saylor, the Chairman of the Company’s Board of Directors and the Company’s Executive Chairman, in his personal capacity, and (ii) the Company. The District sought, among other relief, monetary damages under the District’s False Claims Act for the alleged failure of Mr. Saylor to pay personal income taxes to the District over a number of years together with penalties, interest, and treble damages. The complaint alleged that the Company infringes U.S. Patent No. 6,101,502 (the “’502 Patent”), allegedly owned by DataTern, by making, selling, or offering for sale severalamount of the Company’s products and services, including MicroStrategy 9, MicroStrategy Intelligence Server, MicroStrategy Business Intelligence Platform, MicroStrategy Cloud Personal, and other MicroStrategy applications for creating or using data mining, dashboards, business analytics, data storage and warehousing, and web hosting support.personal income taxes purportedly involved was more than $25 million. The complaint accusedalso alleged in the sole claim against the Company of willful infringement and sought an unspecified amount of damages, an award of attorneys’ fees, and preliminary and permanent injunctive relief. In light of a judgment in a separate action involving DataTern in another jurisdiction, in February 2013, MicroStrategy and DataTern filed motions for summary judgment of non-infringement andthat it violated the District Court entered summary judgment against DataTern. In March 2013, DataTern filed a notice of appeal withDistrict’s False Claims Act by conspiring to assist Mr. Saylor’s alleged failure to pay personal income taxes. On October 26, 2022, the United States Court of Appeals for the Federal Circuit (the “Federal Circuit”). In December 2014, the Federal Circuit issued an opinion vacating the District Court’s summary judgment, stating that the claim construction on which the summary judgment was based was incorrect. In January 2015, the case was remanded to the District Court for further proceedings. A claim construction ruling was issued in February 2017. In August 2017, counsel for DataTernCompany filed a motion to withdraw fromdismiss the lawsuit.District’s complaint. On February 28, 2023, the court ruled on the motion to dismiss, dismissing the sole claim against the Company as well as a claim against Mr. Saylor alleging that Mr. Saylor violated the District’s False Claims Act. The District Court initially gave DataTern a deadline of September 18, 2017court did not dismiss claims against Mr. Saylor alleging that Mr. Saylor failed to find replacement counsel, which was later extended to October 20, 2017.pay personal income taxes, interest and penalties due. On October 20, 2017,April 13, 2023, the District, Court dismissed the case for failure to prosecute when DataTern failed to identify substitute counsel. The Company has received indemnification requests from certain ofthrough its channel partners and customers who were sued by DataTern in the District Court in lawsuits alleging infringementOffice of the ‘502 Patent. The proceedingsAttorney General, filed a motion to amend its complaint to attempt to restore claims under the False Claims Act against these channel partnersboth Mr. Saylor and customers were stayed pending the resolution of DataTern’s lawsuit against the Company. On October 30, 2017,May 10, 2023, the court granted the District’s motion to amend its complaint, reinstating the Company as a defendant in the case. The amended complaint alleges that the Company violated the District’s False Claims Act by making and using false records and statements in the form of false withholding filings with the District Court dismissedOffice of Tax and Revenue. The amended complaint also alleges that Mr. Saylor violated the District’s False Claims Act by making and using false records and statements and by causing the Company to make and use false records and statements. On June 7, 2023, Mr. Saylor and the Company filed a motion to dismiss the District’s amended complaint with prejudice these channel partnerprejudice. On July 5, 2023, the District filed an opposition to the motion to dismiss made by Mr. Saylor and customer proceedings. No estimated liability for these matters has been accruedthe Company. On July 19, 2023, Mr. Saylor and the Company filed a reply in support of their motion to dismiss. On July 31, 2023, the court denied Mr. Saylor’s and the Company’s motion to dismiss the amended complaint. On August 22, 2023, the Company and Mr. Saylor filed a motion asking the court to reconsider its July 31 decision or, in the accompanying Consolidated Financial Statements.alternative, to certify for interlocutory review two case-dispositive issues relating to the validity of tax-related amendments to the District’s False Claims Act and authority of the Office of the Attorney General to sue for allegedly unpaid taxes. On October 31, 2023, the court denied Mr. Saylor’s and the Company’s motion for reconsideration or, in the alternative, certification for interlocutory review. The final outcome of this matter is not presently determinable.
Various Legal Proceedings and Contingent Liabilities
The Company is also involved in various other legal proceedings arising in the normal course of business. Although the outcomes of these other legal proceedings are inherently difficult to predict, management does not expect the resolution of these other legal proceedings to have a material adverse effect on the Company’s financial position, results of operations, or cash flows.
The Company has contingent liabilities that, in management’s judgment, are not probable of assertion. If such unasserted contingent liabilities were to be asserted, or become probable of assertion, the Company may be required to record significant expenses and liabilities in the period in which these liabilities are asserted or become probable of assertion.
(10) Income Taxes
U.S. and international components of (loss) income before income taxes (in thousands) were comprised of the following for the periods indicated:
| | | | | | | | | | | | |
| | Years Ended December 31, | |
| | 2023 | | | 2022 | | | 2021 | |
U.S. | | $ | (157,810 | ) | | $ | (1,362,230 | ) | | $ | (854,610 | ) |
Foreign | | | 33,285 | | | | 39,765 | | | | 43,221 | |
Total | | $ | (124,525 | ) | | $ | (1,322,465 | ) | | $ | (811,389 | ) |
| | Years Ended December 31, | |
| | 2017 | | | 2016 | | | 2015 | |
U.S. | | $ | 19,166 | | | $ | 51,145 | | | $ | 68,555 | |
Foreign | | | 53,441 | | | | 61,901 | | | | 69,309 | |
Total | | $ | 72,607 | | | $ | 113,046 | | | $ | 137,864 | |
93
MICROSTRATEGY INCORPORATED
NOTES TO CONSOLIDATED FINANCIAL STATEMENTS
The (benefit from) provision for income taxes (in thousands) consisted of the following for the periods indicated:
| | | | | | | | | | | | |
| | Years Ended December 31, | |
| | 2023 | | | 2022 | | | 2021 | |
Current: | | | | | | | | | |
Federal | | $ | 2,774 | | | $ | 9,278 | | | $ | (4,622 | ) |
State | | | 3,376 | | | | 5,362 | | | | 2,184 | |
Foreign | | | 9,146 | | | | 8,139 | | | | 5,533 | |
| | $ | 15,296 | | | $ | 22,779 | | | $ | 3,095 | |
| | | | | | | | | |
Deferred: | | | | | | | | | |
Federal | | $ | (374,800 | ) | | $ | 89,581 | | | $ | (204,784 | ) |
State | | | (194,374 | ) | | | 34,521 | | | | (74,796 | ) |
Foreign | | | 232 | | | | 451 | | | | 576 | |
| | $ | (568,942 | ) | | $ | 124,553 | | | $ | (279,004 | ) |
Total (benefit) provision | | $ | (553,646 | ) | | $ | 147,332 | | | $ | (275,909 | ) |
| | Years Ended December 31, | |
| | 2017 | | | 2016 | | | 2015 | |
Current: | | | | | | | | | | | | |
Federal | | $ | 48,794 | | | $ | 18,453 | | | $ | 11,748 | |
State | | | 4,077 | | | | 3,681 | | | | 2,997 | |
Foreign | | | 4,074 | | | | 4,941 | | | | 7,565 | |
| | $ | 56,945 | | | $ | 27,075 | | | $ | 22,310 | |
| | | | | | | | | | | | |
Deferred: | | | | | | | | | | | | |
Federal | | $ | 88 | | | $ | (4,742 | ) | | $ | 9,215 | |
State | | | (1,342 | ) | | | (890 | ) | | | 693 | |
Foreign | | | (727 | ) | | | 695 | | | | (285 | ) |
| | $ | (1,981 | ) | | $ | (4,937 | ) | | $ | 9,623 | |
Total provision | | $ | 54,964 | | | $ | 22,138 | | | $ | 31,933 | |
98
The benefit from or provision for income taxes differs from the amount computed by applying the federal statutory income tax rate to the Company’s incomeloss before income taxes as follows for the periods indicated:
| | | | | | | | | | | | |
| | Years Ended December 31, | |
| | 2023 | | | 2022 | | | 2021 | |
Income tax expense at federal statutory rate | | | 21.0 | % | | | 21.0 | % | | | 21.0 | % |
State taxes, net of federal tax effect | | | 8.4 | % | | | 7.3 | % | | | 9.1 | % |
Other international components | | | (3.4 | )% | | | (0.1 | )% | | | 0.2 | % |
Change in valuation allowance | | | 409.5 | % | | | (38.6 | )% | | | 0.0 | % |
Non-deductible officers compensation | | | (5.5 | )% | | | (0.3 | )% | | | (1.0 | )% |
Research and development tax credit | | | 2.7 | % | | | 0.1 | % | | | 0.8 | % |
Share-based compensation | | | 3.4 | % | | | (0.1 | )% | | | 4.0 | % |
Rate changes, including states | | | 11.0 | % | | | (0.3 | )% | | | 0.0 | % |
Other permanent differences (1) | | | (2.5 | )% | | | (0.1 | )% | | | (0.1 | )% |
Effective income tax rate | | | 444.6 | % | | | -11.1 | % | | | 34.0 | % |
(1) Included in the “Other permanent differences” category in the table above are other permanent items, each below the threshold required for separate presentation in the table.
| | Years Ended December 31, | |
| | 2017 | | | 2016 | | | 2015 | |
Income tax expense at federal statutory rate | | | 35.0 | % | | | 35.0 | % | | | 35.0 | % |
State taxes, net of federal tax effect | | | 2.5 | % | | | 1.6 | % | | | 1.7 | % |
Foreign earnings taxed at different rates | | | (24.2 | )% | | | (15.5 | )% | | | (14.0 | )% |
Withholding tax | | | 1.9 | % | | | 1.4 | % | | | 1.1 | % |
Foreign tax credit | | | (1.1 | )% | | | (1.0 | )% | | | (0.3 | )% |
Other international components | | | 0.0 | % | | | (0.1 | )% | | | 0.8 | % |
Change in valuation allowance | | | 0.2 | % | | | (0.8 | )% | | | (0.1 | )% |
Deferred tax adjustments and rate changes | | | 5.2 | % | | | 0.1 | % | | | (0.1 | )% |
Deemed repatriation transition tax | | | 55.5 | % | | | 0.0 | % | | | 0.0 | % |
Subpart F income | | | 1.5 | % | | | 0.6 | % | | | 0.5 | % |
Research and development tax credit | | | (1.1 | )% | | | (0.8 | )% | | | (0.6 | )% |
Section 199 Deduction | | | (1.4 | )% | | | (1.8 | )% | | | (1.5 | )% |
Other permanent differences | | | 1.7 | % | | | 0.9 | % | | | 0.7 | % |
Total | | | 75.7 | % | | | 19.6 | % | | | 23.2 | % |
The Company’s U.S. and foreign effective tax rates for incomeloss before income taxes were as follows for the periods indicated:
| | | Years Ended December 31, | | | Years Ended December 31, | |
| | 2017 | | | 2016 | | | 2015 | | | 2023 | | | 2022 | | | 2021 | |
U.S. | | | 269.3 | % | | | 32.3 | % | | | 36.0 | % | | | 356.8 | % | | | (10.2 | )% | | | 33.0 | % |
Foreign | | | 6.3 | % | | | 9.1 | % | | | 10.5 | % | | | 28.2 | % | | | 21.6 | % | | | 14.1 | % |
Combined | | | 75.7 | % | | | 19.6 | % | | | 23.2 | % | | | 444.6 | % | | | (11.1 | )% | | | 34.0 | % |
The change in the Company’s effective tax rate in 2017,2023, as compared to the prior year,2022, was primarily due to an estimated one-time tax provision of $44.0 million as a result(i) the release of the Tax Act. Thisvaluation allowance during 2023 on the Company’s deferred tax provision is comprised of a $40.3 million Transition Tax and a $3.7 million chargeasset related to the re-measurementimpairment on its bitcoin holdings, attributable to the increase in the market value of netbitcoin as of December 31, 2023 compared to December 31, 2022, compared to (ii) the establishment of a valuation allowance during 2022 on the Company’s deferred tax assets arising from the new lower corporate tax rate effected by the Tax Act.
94
MICROSTRATEGY INCORPORATED
NOTES TO CONSOLIDATED FINANCIAL STATEMENTS
The Tax Act imposes a Transition Tax on previously untaxed accumulated and current earnings and profits (“E&P”) of certain foreign subsidiaries of the Company. To determine the amount of the Transition Tax, the Company must determine, among other things, the amount of post-1986 E&P of the relevant subsidiaries, as well as the amount of non-U.S. income taxes paid on such earnings. The Company made a reasonable estimate of the Transition Tax and recorded a provisional Transition Tax obligation of $40.3 million, of which $36.8 million is recorded in “other long-term liabilities” in the Company’s Consolidated Balance Sheets. However, the Company continues to gather additional information to compute more precisely the post-1986 E&P and related non-U.S. income taxes paid.
The Tax Act also reduced the U.S. corporate tax rate from 35% to 21%, effective January 1, 2018. Consequently, the Company has recorded a decrease related to its U.S. deferred tax assets and liabilities, with a corresponding net deferred income tax expense of $3.7 million for the year ended December 31, 2017 as a result of re-measuring net deferred tax assets at the new lower corporate tax rate of 21%.
Additionally, the Tax Act requires certain Global Intangible Low Taxed Income (“GILTI”) earned by controlled foreign corporations (“CFCs”) to be included in the gross income of the CFCs’ U.S. shareholder. GAAP allows the Company to either: (i) treat taxes due on future U.S. inclusions in taxable income related to GILTI as a current-period expense when incurred (the “period cost method”); or (ii) factor such amounts into its measurement of deferred taxes (the “deferred method”). The Company elected the period cost method. The GILTI tax rules will become effective for the 2018 tax year and therefore the Company has not made any adjustmentsasset related to the potential GILTI taximpairment on its bitcoin holdings, attributable to the decrease in its financial statements for the year endedmarket value of bitcoin as of December 31, 2017. The Company continues2022 compared to evaluate the impact of the new GILTI tax rules and the application of ASC 740 on its financial statements.
Except as discussed below, the Company intends to indefinitely reinvest its undistributed earnings of all of its foreign subsidiaries. However, under the Tax Act, those undistributed earnings (as computed for U.S. federal income tax purposes, and with due regard to the discussion below regarding Subpart F deemed dividends) are subject to the Transition Tax, which was recorded at a provisional amount of $40.3 million during the year ended December 31, 2017.2021.
In addition, U.S. federal tax laws require the Company to include in its U.S. taxable income certain investment income earned outside of the United States in excess of certain limits (“Subpart F deemed dividends”). Because Subpart F deemed dividends are already required to be recognized in the Company’s U.S. federal income tax return, the Company regularly repatriates Subpart F deemed dividends to the United States and no additional tax is incurred on the distribution. The Company repatriated Subpart F deemed dividends of $1.8 million and $1.9 million in 2017 and 2016, respectively, with no additional tax. The Company did not repatriate any Subpart F deemed dividends in 2015 because it did not report any Subpart F income on its 2014 U.S. tax return.
As of December 31, 20172023 and 2016,2022, the amount of cash and cash equivalents and short-term investments held by the Company’s U.S. entities was $293.8$10.5 million and $279.8$14.8 million, respectively, and by the Company’s non-U.S. entities was $381.4$36.3 million and $309.6$29.0 million, respectively. If the cash and cash equivalents and short-term investments held by the Company’s non-U.S. entities were to be actually repatriated toThe Company earns a significant amount of its revenues outside the United States, after taking into account the Transition Tax described above,States. The Company repatriated foreign earnings and profits of $20.3 million during 2023 and $44.7 million during 2022. As of December 31, 2023, the Company doeshas not expect such repatriationindefinitely reinvested any of its undistributed foreign earnings and has recorded a deferred tax liability of $2.9 million on undistributed foreign earnings related to generate any additionalforeign withholding tax and U.S. federal taxablestate income to the Company.taxes.
MICROSTRATEGY INCORPORATED
NOTES TO CONSOLIDATED FINANCIAL STATEMENTS
Deferred income taxes reflect the net tax effects of the temporary differences between the carrying amounts of assets and liabilities for financial reporting purposes and the amounts used for income tax purposes. Significant components of the Company’s deferred tax assets and liabilities (in thousands) were as follows for the periods indicated:
| | | December 31, | | | December 31, | |
| | 2017 | | | 2016 | | | 2023 | | | 2022 | |
Deferred tax assets, net: | | | | | | | | | | | | | | |
Net operating loss carryforwards | | $ | 761 | | | $ | 214 | | | $ | 727 | | | $ | 723 | |
Tax credits | | | 1,520 | | | | 1,372 | |
Intangible assets | | | 10 | | | | 11 | |
Deferred revenue adjustment | | | 3,351 | | | | 3,305 | |
Tax credit carryforwards | | | | 1,841 | | | | 1,677 | |
Intangible assets, including capitalized R&D | | | | 57,410 | | | | 41,082 | |
Deferred revenue | | | | 1,481 | | | | 24,747 | |
Accrued compensation | | | 2,863 | | | | 7,866 | | | | 5,882 | | | | 6,602 | |
Share-based compensation expense | | | 11,597 | | | | 11,440 | | | | 30,345 | | | | 23,305 | |
Deferred rent | | | 0 | | | | 1,281 | |
Digital asset impairment losses | | | | 652,280 | | | | 607,659 | |
Interest expense carryforward | | | | 11,627 | | | | 1,239 | |
Lease liability | | | | 18,197 | | | | 14,861 | |
Other | | | 2,457 | | | | 2,002 | | | | 4,699 | | | | 1,887 | |
Deferred tax assets before valuation allowance | | | 22,559 | | | | 27,491 | | | | 784,489 | | | | 723,782 | |
Valuation allowance | | | (1,015 | ) | | | (832 | ) | | | (1,427 | ) | | | (511,412 | ) |
Deferred tax assets, net of valuation allowance | | | 21,544 | | | | 26,659 | | | | 783,062 | | | | 212,370 | |
| | | | | | | | | | | | | | |
Deferred tax liabilities: | | | | | | | | | | | | | | |
Prepaid expenses and other | | | 684 | | | | 1,098 | | | | 3,681 | | | | 4,372 | |
Property and equipment | | | 6,778 | | | | 10,821 | | | | 1,062 | | | | 1,786 | |
Capitalized software development costs | | | 695 | | | | 3,330 | |
Deferred tax on undistributed foreign earnings | | | | 2,923 | | | | 2,231 | |
Right of use asset | | | | 18,180 | | | | 16,027 | |
Total deferred tax liabilities | | | 8,157 | | | | 15,249 | | | | 25,846 | | | | 24,416 | |
Total net deferred tax asset | | $ | 13,387 | | | $ | 11,410 | | | $ | 757,216 | | | $ | 187,954 | |
| | | | | | | | | | | | | | |
Reported as: | | | | | | | | | | | | | | |
Non-current deferred tax assets, net | | | 13,391 | | | | 11,704 | | | | 757,573 | | | | 188,152 | |
Non-current deferred tax liabilities | | | (4 | ) | | | (294 | ) | | | (357 | ) | | | (198 | ) |
Total net deferred tax asset | | $ | 13,387 | | | $ | 11,410 | | | $ | 757,216 | | | $ | 187,954 | |
The Company had no U.S. NOL carryforwards as of December 31, 2023 and 2022. The Company had $3.0 million and $3.3 million of foreign NOL carryforwards as of December 31, 2023 and 2022, respectively. As of December 31, 20172023, the Company also had gross state NOLs of $10.1 million of which $9.1 million will expire by 2042 and 2016,the remainder can be carried forward indefinitely.
The Company’s valuation allowance of $1.4 million at December 31, 2023 primarily related to the Company’s deferred tax assets related to foreign tax credits in certain jurisdictions that, in the Company’s present estimation, more likely than not will not be realized. The Company’s valuation allowance of $511.4 million at December 31, 2022 primarily related to the Company’s deferred tax asset related to the impairment on its bitcoin holdings, and was based on the market value of bitcoin at December 31, 2022.
Valuation allowances have been established where the Company has concluded that it is more likely than not that such deferred tax assets are not realizable. The Company’s ability to realize its net deferred tax assets of $757.6 million as of December 31, 2023 is primarily dependent upon generating sufficient taxable income of the proper character in future years. Management has concluded that there is sufficient positive evidence to support the expected realization of these deferred tax assets primarily due to the fact that the excess of the market value of the Company’s bitcoin over the cost basis of the Company’s bitcoin as of December 31, 2023 results in a significant built-in gain for tax purposes and is therefore a source of future taxable income that is expected to allow all of the U.S. net deferred tax assets to be realized. As part of the assessment of the amount of the valuation allowance, management has asserted that it has the ability and intent to execute tax planning strategies if necessary, including selling bitcoin with a built-in gain.
After consideration of all available evidence, the Company has concluded that, as of December 31, 2023, it is more likely than not that its deferred tax assets, with the exception of certain foreign tax credits for which a valuation allowance has been established, will be realized. If the market value of bitcoin declines in future periods, the Company would need to assess other sources of forecasted taxable income of proper character, which could result in additional valuation allowances being recorded.
As of December 31, 2023 and 2022, the Company had income taxes payablereceivable of $0.4$15.3 million and $10.5$2.5 million, respectively, recorded in “accounts payable“Prepaid expenses and accrued expenses”other current assets” in the Company’s Consolidated Balance Sheets.
As of December 31, 2017,2023, the Company had gross unrecognized income tax benefits of $4.0$8.3 million, including accrued interest, all of which was recorded in “Other long-term liabilities” in the Company’s Consolidated Balance Sheets. The change in unrecognized income tax benefits (in thousands) is presented in the table below:
below for the periods indicated:
Unrecognized tax benefits at January 1, 2017 | | $ | 3,121 | |
Increase related to positions taken in prior period | | | 771 | |
Increase related to positions taken in current period | | | 294 | |
Decrease related to expiration of statute of limitations | | | (741 | ) |
Unrecognized tax benefits at December 31, 2017 | | | 3,445 | |
Accrued interest | | | 569 | |
Unrecognized tax benefits recorded in other long-term liabilities at December 31, 2017 | | $ | 4,014 | |
| | | | | | | | | | | | |
| | 2023 | | | 2022 | | | 2021 | |
Unrecognized income tax benefits at beginning of year | | $ | 5,811 | | | $ | 5,960 | | | $ | 4,293 | |
Increase (decrease) related to positions taken in prior period | | | 1,458 | | | | (67 | ) | | | 1,082 | |
Increase related to positions taken in current period | | | 930 | | | | 318 | | | | 1,146 | |
Decrease related to settlement with tax authorities | | | 0 | | | | (40 | ) | | | 0 | |
Decrease related to expiration of statute of limitations | | | (301 | ) | | | (360 | ) | | | (561 | ) |
Unrecognized income tax benefits at end of year | | | 7,898 | | | | 5,811 | | | | 5,960 | |
Accrued interest | | | 352 | | | | 276 | | | | 272 | |
Gross unrecognized income tax benefits at end of year | | $ | 8,250 | | | $ | 6,087 | | | $ | 6,232 | |
If recognized, $3.5$8.0 million of the gross unrecognized income tax benefits as of December 31, 2023 would impact the Company’s effective tax rate. Over the next 12 months, the amount of the Company’s liability for unrecognized income tax benefits shown above is not expected to change by a material amount.materially. The Company recognizes estimated accrued interest related to unrecognized income tax benefits in the (benefit from) provision for income tax accounts.taxes. During the years ended December 31, 2017,
96
MICROSTRATEGY INCORPORATED
NOTES TO CONSOLIDATED FINANCIAL STATEMENTS
2016,2023, 2022, and 2015,2021, the Company released or recognized an immaterial amount of accrued interest. The amount of accumulated accrued interest related to the above unrecognized income tax benefits was approximately $0.6$0.4 million and $0.4$0.3 million as of December 31, 20172023 and 2016,2022, respectively.
The Company files tax returns in numerous foreign countries as well as the United States and its tax returns may be subject to audit by tax authorities in all countries in which it files. Each country has its own statute of limitations for making assessment of additional tax liabilities. In 2017, the Company settled the tax examination in Germany for tax years 2013, 2014, and 2015 without any material audit assessments. The Company’s U.S. tax returns for tax years from 20142019 and forward are subject to potential examination by the Internal Revenue Service.
However, due to the Company’s use of state NOL carryovers in the United States, state tax authorities may attempt to reduce or fully offset the amount of state NOL carryovers from tax years ended 2011 and forward that the Company used in later tax years. The Company’s major foreign tax jurisdictions and the tax years that remain subject to potential examination are GermanyItaly for tax years 2016 forward,2017 and forward; Poland and China for tax years 2013 forward,2019 and forward; and Spain, for tax years 2014 forward,Germany, and the United Kingdom for tax years 20162020 and forward. To date there have been no material audit assessments related to audits in the United States or any of the applicable foreign jurisdictions.
(11) Share-based Compensation
The Company had no U.S. net operating loss (“NOL”) carryforwardsStock Incentive Plans
On May 24, 2023, the Company’s stockholders approved the Company’s 2023 Equity Plan, which became effective as of December 31, 2017 and 2016. The Company had $2.5 million and $0.7 million of foreign NOL carryforwards as of December 31, 2017 and 2016, respectively.
The Company’s valuation allowances of $1.0 million and $0.8 million at December 31, 2017 and 2016, respectively, primarily relate to certain foreign tax credit carryforward tax assets. The Company assessed whether its valuation allowance analyses are affected by various aspects ofsuch date. No awards may be granted under the Tax Act (e.g., deemed repatriation of deferred foreign income, GILTI inclusions,2023 Equity Plan more than 10 years after the 2023 Equity Plan’s effective date. No new categories of foreign tax credits) and concluded that they were not significantly affected by the Tax Act.
In determiningawards will be granted under the Company’s provision for or benefit from income taxes, net deferred tax assets, liabilities, and valuation allowances, management is required to make judgments and estimates related to projections of domestic and foreign profitability, the timing and extent of the utilization of NOL carryforwards, applicable tax rates, transfer pricing methods, and prudent and feasible tax planning strategies. As a multinational company, the Company is required to calculate and provide for estimated income tax liabilities for each of the tax jurisdictions in which it operates. This process involves estimating current tax obligations and exposures in each jurisdiction, as well as making judgments regarding the future recoverability of deferred tax assets. Changes in the estimated level of annual pre-tax income, changes in tax laws, particularly changes related to the utilization of NOLs in various jurisdictions, and changes resulting from tax audits can all affect the overall effective income tax rate which, in turn, impacts the overall level of income tax expense or benefit and net income.
Judgments and estimates related to the Company’s projections and assumptions are inherently uncertain. Therefore, actual results could differ materially from projections. The timing and manner in which the Company will use research and development tax credit carryforward tax assets, alternative minimum tax credit carryforward tax assets, and foreign tax credit carryforward tax assets in any year, or in total, may be limited by provisions of the Internal Revenue Code regarding changes in the Company’s ownership. Currently, the Company expects to use the tax assets, subject to Internal Revenue Code limitations, within the carryforward periods. Valuation allowances have been established where the Company has concluded that it is more likely than not that such deferred tax assets are not realizable. If the Company is unable to sustain profitability in future periods, it may be required to increase the valuation allowance against the deferred tax assets, which could result in a charge that would materially adversely affect net income in the period in which the charge is incurred.
Section 382 of the Internal Revenue Code provides an annual limitation on the amount of federal NOLs and tax credits that may be used in the event of an ownership change. The limitation is based on, among other things, the value of the company as of the change date multiplied by a U.S. federal long-term tax exempt interest rate. The Company does not currently expect the limitations under the Section 382 ownership change rules to impact the Company’s ability to use its NOL carryforwards or tax credits that existed as of the date of the ownership change.
97
MICROSTRATEGY INCORPORATED
NOTES TO CONSOLIDATED FINANCIAL STATEMENTS
(11) Share-based Compensation
The 2013 Equity Plan, authorizesthough awards previously granted under the issuance of various types of share-based awards to2013 Equity Plan remain outstanding in accordance with their terms. Under the Stock Incentive Plans, the Company’s employees, officers, directors, and other eligible participants. Asparticipants may be (with respect to the 2023 Equity Plan) and have been (with respect to both the 2023 Equity Plan and the 2013 Equity Plan) awarded various types of December 31, 2017, the total number ofshare-based compensation, including options to purchase shares of the Company’s class A common stock, authorized for issuancerestricted stock units, and other stock-based awards. Additionally, under the 20132023 Equity Plan, was 1,700,000 shares.
During 2017, stock options to purchase an aggregate of 175,000 shares of class A common stock wereawards may be and have been granted to certain Company employees and directors pursuantthat are subject to the 2013 Equity Plan. Asachievement of December 31, 2017, there were options to purchase 991,633one or more performance measures established by the Company’s Board of Directors or a duly authorized committee thereof. Any shares of class A common stock outstanding under the 2013 Equity Plan. As of December 31, 2017, there were 485,000 remaining shares of class A common stock authorized for future issuance under the 2013 Equity Plan.
Shares issued under the 2013 Equity PlanStock Incentive Plans may consist in whole or in part of authorized but unissued shares or treasury shares. No awards may be issued more than ten years after
An aggregate of up to 1,932,703 shares of the Company’s class A common stock were initially authorized for issuance under the 2023 Equity Plan, comprised of (i) 200,000 shares of the Company’s class A common stock authorized under the 2023 Equity Plan and (ii) up to an aggregate of 1,732,703 shares of the Company’s class A common stock consisting of: (a) the shares of class A common stock reserved for issuance under the 2013 Equity Plan’s effective date. Stock optionsPlan that areremained available for grant as of May 23, 2023, and (b) shares of class A common stock subject to awards granted under the 2013 Equity Plan that were outstanding as of May 23, 2023 and which subsequently expire, terminate or are otherwise surrendered, cancelled or forfeited or repurchased by the Company at their original issuance price pursuant to a contractual repurchase right, including shares subject to awards granted under the 2013 Equity Plan that are delivered (either by actual delivery, attestation or net exercise) to the Company by a participant to (x) purchase shares upon the exercise of such award or (y) satisfy tax withholding obligations with respect to such awards, including shares retained from the award creating the tax obligation,
subject, in the case of incentive stock options, to any limitations under the Internal Revenue Code of 1986, as amended. As of December 31, 2023, there were 238,593 shares of class A common stock reserved and available for future issuance under the 2023 Equity Plan.
In determining related share-based compensation expense for any award under the Stock Incentive Plans, the Company has made an accounting policy election to account for forfeitures of awards as they occur and therefore share-based compensation expense presented below has not been adjusted for any estimated forfeitures.
Stock option awards
Stock options granted under the Stock Incentive Plans must have an exercise price equal to at least the fair market value of the Company’s class A common stock on the date of grant, become exercisable as established by the Board of Directors or the Compensation Committee, and expire no later than ten10 years following the date of grant. The Company recognizes share-based compensation expense associated with such stock option awards on a straight-line basis over the award’s requisite service period (generally, the vesting period). TheWith the exception of stock option awards to non-employee members of the Company’s Board of Directors under the 2023 Equity Plan, which vest in full after one year, the stock option awards granted to date vest in equal annual installments over an approximately four-year vesting period (unless accelerated uponin connection with a change in control event (as definedunder specified conditions as set forth in the stockapplicable option agreement for the applicable award) or otherwise in accordance with provisions of the 2013 Equity Plan or applicable option agreement)Stock Incentive Plans).
Share-based compensation expense related to stock option awards is based on the fair value of the stock option awards on the date of grant, as estimated using the Black-Scholes option pricingvaluation model. The Black-Scholes option pricingvaluation model requires the input of certain management assumptions, including the expected term, expected stock price volatility, risk-free interest rate, and expected dividend yield. The Company estimates the term over which option holders are expected to hold their stock options by using the simplified method for “plain-vanilla” stock option awards because the Company’s stock option exercise history does not provide a reasonable basis to compute the expected term for stock options granted under the 2013 Equity Plan. TheStock Incentive Plans. During 2021, 2022 and 2023, as a result of the significant increase in the Company’s stock price volatility, the Company reliesestablished estimates for the expected stock price volatility by calculating a blended rate from the historical stock price volatility of its class A common stock and the implied volatility of the Company’s traded financial instruments with similar terms to the respective award. For stock options granted prior to 2021, the Company relied exclusively on its historical stock price volatility using a simple average calculation method to estimate the expected stock price volatility over the expected term because the Company believesbelieved at the date of grant that future volatility iswas unlikely to differ from the past. In estimating the expected stock price volatility, the Company uses a simple average calculation method. The risk-free interest rate is based on U.S. Treasury securities with terms that approximate the expected term of the stock options. The expected dividend yield is based on the Company’s past cash dividend history and anticipated future cash dividend payments. The expected dividend yield is zero, as the Company has not previously declared cash dividends and does not currently intend to declare cash dividends in the foreseeable future. These assumptions are based on management’s best judgment, and changes to these assumptions could materially affect the fair value estimates and amount of share-based compensation expense recognized.
98
MICROSTRATEGY INCORPORATED
NOTES TO CONSOLIDATED FINANCIAL STATEMENTS
As of December 31, 2023, there were options to purchase 1,293,627 shares of class A common stock outstanding under the Stock Incentive Plans. The following table summarizes the Company’s stock option activity (in thousands, except per share data and years) for the periods indicated:
| | Stock Options Outstanding |
| | | | | | Weighted Average | | | Aggregate | | | Weighted Average | | Stock Options Outstanding | |
| | | | | | Exercise Price | | | Intrinsic | | | Remaining Contractual | | | | Weighted Average | | Aggregate | | Weighted Average | |
| | Shares | | | Per Share | | | Value | | | Term (Years) | | | | Exercise Price | | Intrinsic | | Remaining Contractual | |
Balance as of January 1, 2015 | | | 1,201 | | | $ | 111.77 | | | | | | | |
| | | Shares | | | Per Share | | | Value | | | Term (Years) | |
Balance as of January 1, 2021 | | | | 1,157 | | | $ | 139.48 | | | | | | | |
Granted | | | 380 | | | | 178.93 | | | | | | | | | | 305 | | | | 676.10 | | | | | | | |
Exercised | | | (91 | ) | | | 105.25 | | | $ | 6,367 | | | | | | (269 | ) | | | 151.19 | | | $ | 163,427 | | | | |
Forfeited/Expired | | | (167 | ) | | | 131.31 | | | | | | | | | | (26 | ) | | | 499.11 | | | | | | | |
Balance as of December 31, 2015 | | | 1,323 | | | | 129.04 | | | | | | | |
Balance as of December 31, 2021 | | | | 1,167 | | | | 268.74 | | | | | | |
Granted | | 45 | | | 189.62 | | | | | | | | | | 440 | | | | 346.15 | | | | | | | |
Exercised | | | (112 | ) | | 97.82 | | | $ | 8,102 | | | | | | (9 | ) | | | 137.51 | | | $ | 1,469 | | | | |
Forfeited/Expired | | | (370 | ) | | 110.28 | | | | | | | | | | (21 | ) | | | 498.69 | | | | | | | |
Balance as of December 31, 2016 | | | 886 | | | | 143.89 | | | | | | | |
Balance as of December 31, 2022 | | | | 1,577 | | | | 288.30 | | | | | | |
Granted | | 175 | | | | 169.04 | | | | | | | | | | 37 | | | | 290.11 | | | | | | |
Exercised | | | (12 | ) | | | 143.35 | | | $ | 541 | | | | | | (175 | ) | | | 173.83 | | | $ | 36,636 | | | | |
Forfeited/Expired | | | (57 | ) | | | 196.52 | | | | | | | | | | (145 | ) | | | 441.50 | | | | | | |
Balance as of December 31, 2017 | | | 992 | | | $ | 145.28 | | | | | | | |
Exercisable as of December 31, 2017 | | | 536 | | | $ | 135.48 | | | $ | 3,941 | | | 6.6 |
Expected to vest as of December 31, 2017 | | | 456 | | | $ | 156.79 | | | | 1,409 | | | 7.9 |
Balance as of December 31, 2023 | | | | 1,294 | | | $ | 286.78 | | | | | | |
Exercisable as of December 31, 2023 | | | | 859 | | | $ | 221.95 | | | $ | 357,749 | | | | 3.4 | |
Expected to vest as of December 31, 2023 | | | | 435 | | | $ | 414.59 | | | | 100,600 | | | | 8.0 | |
Total | | | 992 | | | $ | 145.28 | | | $ | 5,350 | | | 7.2 | | | 1,294 | | | $ | 286.78 | | | $ | 458,349 | | | | 5.0 | |
Stock options outstanding as of December 31, 20172023 are comprised of the following range of exercise prices per share (in thousands, except per share data and years):
| | Stock Options Outstanding at December 31, 2017 | |
| | | | | | Weighted Average | | | Weighted Average | |
| | | | | | Exercise Price | | | Remaining Contractual | |
Range of Exercise Prices per Share | | Shares | | | Per Share | | | Term (Years) | |
$117.85 - $120.00 | | | 25 | | | $ | 118.55 | | | | 6.3 | |
$120.01 - $150.00 | | | 570 | | | $ | 122.67 | | | | 6.7 | |
$150.01 - $180.00 | | | 202 | | | $ | 167.50 | | | | 7.2 | |
$180.01 - $201.25 | | | 195 | | | $ | 191.78 | | | | 8.7 | |
Total | | | 992 | | | $ | 145.28 | | | | 7.2 | |
| | | | | | | | | | | | |
| | Stock Options Outstanding at December 31, 2023 | |
| | | | | Weighted Average | | | Weighted Average | |
| | | | | Exercise Price | | | Remaining Contractual | |
Range of Exercise Prices per Share | | Shares | | | Per Share | | | Term (Years) | |
$121.43 - $200.00 | | | 727 | | | $ | 135.79 | | | | 2.7 | |
$200.01 - $300.00 | | | 111 | | | $ | 251.58 | | | | 8.9 | |
$300.01 - $400.00 | | | 3 | | | $ | 301.63 | | | | 9.4 | |
$400.01 - $500.00 | | | 247 | | | $ | 410.26 | | | | 8.1 | |
$600.01 - $691.23 | | | 206 | | | $ | 691.23 | | | | 7.1 | |
Total | | | 1,294 | | | $ | 286.78 | | | | 5.0 | |
An aggregate of 215,000, 222,500,260,625, 245,500, and 283,750200,625 stock options with an aggregate grant date fair value of $13.0$51.6 million, $13.7$35.8 million, and $14.2$11.0 million vested during the years ended December 31, 2017, 2016,2023, 2022, and 2015,2021, respectively. Beginning January 1, 2017, the Company made an accounting policy election to prospectively account for forfeitures as they occur. Therefore, share-based compensation expense has not been adjusted for any estimated forfeitures. Prior periods have not been restated.
The weighted average grant date fair value of stock option awards using the Black-Scholes option pricingvaluation model was $68.67, $75.54,$194.94, $201.64, and $73.86$372.05 for each share subject to a stock option granted during the years ended December 31, 2017, 2016,2023, 2022, and 2015,2021, respectively, based on the following assumptions:
| | | | | | |
| | Years Ended December 31, |
| | 2023 | | 2022 | | 2021 |
Expected term of options in years | | 5.5 - 6.3 | | 6.3 | | 6.3 |
Expected volatility | | 70.6% - 74.1% | | 58.4% - 75.5% | | 56.8% - 59.0% |
Risk-free interest rate | | 3.7% - 4.4% | | 1.9% - 3.9% | | 0.8% - 1.1% |
Expected dividend yield | | 0.0% | | 0.0% | | 0.0% |
| | Years Ended December 31, |
| | 2017 | | 2016 | | 2015 |
Expected term of options in years | | 6.3 | | 6.3 | | 6.3 |
Expected volatility | | 37.4% - 37.8% | | 38.5% | | 39.0% - 40.2% |
Risk-free interest rate | | 1.9% - 2.3% | | 1.4% - 1.6% | | 1.5% - 2.0% |
Expected dividend yield | | 0.0% | | 0.0% | | 0.0% |
99
MICROSTRATEGY INCORPORATED
NOTES TO CONSOLIDATED FINANCIAL STATEMENTS
The Company recognized approximately $14.3$44.8 million, $11.8$48.3 million, and $17.3$32.0 million in share-based compensation expense for the years ended December 31, 2017, 2016,2023, 2022, and 2015,2021, respectively, from stock options granted under the 2013 Equity Plan.Stock Incentive Plans. As of December 31, 2017,2023, there was approximately $19.8$70.8 million of total unrecognized share-based compensation expense related to unvested stock options. options, which the Company expects to recognize over a weighted average vesting period of approximately 2.0 years.
Share-settled restricted stock units
Share-settled restricted stock units granted under the Stock Incentive Plans entitle recipients to receive a number of shares of the Company’s class A common stock over a vesting period, as specified in the applicable restricted stock unit agreement. Although the Company may in its sole discretion elect to pay fully or partially in cash in lieu of settling solely in shares, it does not currently intend to do so.
Share-based compensation expense related to share-settled restricted stock units is based on the fair value of the Company’s class A common stock on the date of grant. The Company recognizes share-based compensation expense associated with such share-settled restricted stock unit awards on a straight-line basis over the award’s requisite service period (generally, the vesting period). With the exception of share-settled restricted stock unit awards to non-employee members of the Company’s Board of Directors, which vest in full after one year, the share-settled restricted stock unit awards granted to date vest in equal annual installments over a four-year period (unless accelerated in connection with a change in control event under specified conditions as set forth in the applicable restricted stock unit agreement or otherwise in accordance with provisions of the Stock Incentive Plan or applicable restricted stock unit agreement). Upon vesting of the share-settled restricted stock units, the Company covers the minimum tax withholding obligation in most jurisdictions by withholding shares with equivalent value based on the closing stock price on the vesting date. For these jurisdictions,
the Company then pays the withholding tax obligation to the appropriate taxing authorities which is reflected as a financing activity on the Consolidated Statements of Cash Flows.
As of December 31, 2017,2023, there were 185,153 share-settled restricted stock units outstanding under the Stock Incentive Plans. The following table summarizes the Company’s share-settled restricted stock unit activity (in thousands) for the periods indicated:
| | | | | | | | |
| | Share-Settled Restricted Stock Units Outstanding | |
| | | | | Aggregate | |
| | Units | | | Intrinsic Value | |
Balance as of January 1, 2021 | | | 74 | | | | |
Granted | | | 58 | | | | |
Vested | | | (17 | ) | | $ | 13,803 | |
Forfeited | | | (10 | ) | | | |
Balance as of December 31, 2021 | | | 105 | | | | |
Granted | | | 60 | | | | |
Vested | | | (28 | ) | | $ | 6,604 | |
Forfeited | | | (17 | ) | | | |
Balance as of December 31, 2022 | | | 120 | | | | |
Granted | | | 123 | | | | |
Vested | | | (37 | ) | | $ | 14,817 | |
Forfeited | | | (21 | ) | | | |
Balance as of December 31, 2023 | | | 185 | | | | |
Expected to vest as of December 31, 2023 | | | 185 | | | $ | 116,946 | |
During the year ended December 31, 2023, 36,502 share-settled restricted stock units having an aggregate grant date fair value of $13.5 million vested, and 10,440 shares were withheld to satisfy tax obligations, resulting in 26,062 issued shares. During the year ended December 31, 2022, 28,180 share-settled restricted stock units having an aggregate grant date fair value of $12.3 million vested, and 9,467 shares were withheld to satisfy tax obligations, resulting in 18,713 issued shares. During the year ended December 31, 2021, 17,004 share-settled restricted stock units having an aggregate grant date fair value of $3.3 million vested, and 5,857 shares were withheld to satisfy tax obligations, resulting in 11,147 issued shares. The weighted average grant date fair value of share-settled restricted stock units granted during the years ended December 31, 2023, 2022, and 2021 was $292.83, $246.17 and $736.46, respectively, based on the fair value of the Company’s class A common stock. The Company expected to recognize this remainingrecognized approximately $17.4 million, $13.4 million, and $8.0 million in share-based compensation expense for the years ended December 31, 2023, 2022, and 2021, respectively, from share-settled restricted stock units granted under the Stock Incentive Plans. As of December 31, 2023, there was approximately $49.4 million of total unrecognized share-based compensation expense related to unvested share-settled restricted stock units, which the Company expects to recognize over a weighted-averageweighted average vesting period of approximately 2.32.8 years.
Share-settled performance stock units
During the second quarter of 2023, the Company granted performance stock units under the 2023 Equity Plan. Performance stock units entitle recipients to receive a number of shares of the Company’s class A common stock at a specified date in the future based on achievement of one or more performance measures, as specified in the applicable performance stock unit agreement. Although the Company may in its sole discretion elect to pay fully or partially in cash in lieu of settling solely in shares, it does not currently intend to do so.
The vesting of each performance stock unit granted is subject to the Company’s achievement of a relative total shareholder return (“TSR”) performance goal over a three-year performance period with the number of performance stock units granted representing the number of performance stock units that would vest based on target performance. As more fully specified in the applicable grant agreements, the number of performance stock units that will vest will be based on the percentile ranking of the Company’s TSR over the three-year performance period as compared to the TSR of the members of the Nasdaq Composite Index over the same period (the “TSR Goal”), with the payout factor ranging from 0% to 200% of the number of performance stock units granted. The performance stock units, to the extent vested, will vest on the date the Compensation Committee of the Company’s Board of Directors certifies the level of achievement of the TSR Goal.
Vesting of the performance stock units is also generally subject to the provision of service through the vesting date of the award (unless accelerated in connection with a termination following a change in control event as set forth in the applicable performance stock unit agreement or otherwise in accordance with provisions of the 2023 Equity Plan or applicable performance stock unit agreement).
The TSR Goal is considered a “market condition” under ASC 718, Compensation—Stock Compensation. The Company uses a Monte Carlo simulation model to determine the grant date fair value of performance awards with a market condition. The Monte Carlo
simulation takes into consideration the assumptions noted below, in addition to the probability that the market condition will be achieved based on predicted stock price paths compared to peer companies in the Nasdaq Composite Index. The Company did not grant any performance awards prior to 2023. The weighted average grant date fair value of performance stock units using the Monte-Carlo simulation model was $486.18 for each performance stock unit granted during the year ended December 31, 2023 based on the following assumptions:
| | | | |
|
| Year ending December 31, |
|
|
| 2023 |
|
Expected term of awards in years |
|
| 3.0 |
|
Expected volatility |
|
| 95.6 | % |
Risk-free interest rate |
|
| 4.1 | % |
Expected dividend yield |
|
| 0.0 | % |
Since the Company accounts for forfeitures as they occur, as long as the performance stock unit recipient provides service to the Company during the requisite service period, share-based compensation expense associated with the grant date fair value of the performance stock units is recognized ratably over the performance period, regardless of the Company’s actual level of achievement against the TSR Goal.
As of December 31, 2023, there were 25,375 performance stock units outstanding under the 2023 Equity Plan. The following table summarizes the Company’s performance stock unit activity (in thousands) for the period indicated:
| | | | | | | | |
| | Share-Settled Performance Stock Units Outstanding | |
| | | | | Aggregate | |
| | Units | | | Intrinsic Value | |
Balance as of January 1, 2023 | | | 0 | | | | |
Granted | | | 27 | | | | |
Vested | | | 0 | | | $ | 0 | |
Forfeited | | | (2 | ) | | | |
Balance as of December 31, 2023 | | | 25 | | | | |
Expected to vest as of December 31, 2023 | | | 25 | | | $ | 32,055 | |
No performance stock units vested during the year ended December 31, 2023. For the year ended December 31, 2023, the Company recognized approximately $2.3 million in share-based compensation expense from performance stock units granted under the 2023 Equity Plan. As of December 31, 2023, there was approximately $10.0 million of total unrecognized share-based compensation expense related to unvested performance stock units, which the Company expects to recognize over a weighted average vesting period of approximately 2.5 years.
Other stock-based awards and cash-settled restricted stock units
During 2021, the Company granted 9,000 “other stock-based awards” under the 2013 Equity Plan. Other stock-based awards were not granted in 2023 or 2022. As of December 31, 2023, there were a total of 10,250 other stock-based awards outstanding under the 2013 Equity Plan. These other stock-based awards are similar to stock options, except these awards are settled in cash only and not in shares of the Company’s class A common stock.
During 2021, the Company granted 900 cash-settled restricted stock units under the 2013 Equity Plan. Cash-settled restricted stock units were not granted in 2023 or 2022. As of December 31, 2023, there were a total of 250 cash-settled restricted stock units outstanding under the 2013 Equity Plan. These cash-settled restricted stock units are similar to the Company’s share-settled restricted stock units, except they are settled in cash only and not in shares of the Company’s class A common stock.
Both the other stock-based awards and the cash-settled restricted stock units are classified as liabilities in the Company’s Consolidated Balance Sheets due to the required cash settlement feature and the fair value of the awards is remeasured each quarterly reporting period. The Company recognized approximately $3.2 million and $1.4 million, respectively, in share-based compensation expense from other stock-based awards and cash-settled restricted stock units for the years ended December 31, 2023 and 2021. During the year ended December 31, 2022, the Company recognized a reduction of approximately $0.5 million in share-based compensation expense from other stock-based awards and cash-settled restricted stock units. As of December 31, 2023, there was approximately $1.2 million of total unrecognized share-based compensation expense related to other stock-based awards and cash-settled restricted stock units, which the Company expects to recognize over a weighted average vesting period of approximately 1.1 years, subject to additional fair value adjustments through the earlier of settlement or expiration.
2021 ESPP
In 2021, the Company adopted, and the Company’s stockholders approved, the 2021 ESPP. The purpose of the 2021 ESPP is to provide eligible employees of the Company and certain of its subsidiaries with opportunities to purchase shares of the Company’s class A common stock, commencing at such time and on such dates as the Board of Directors of the Company shall determine. The first offering period under the 2021 ESPP commenced on February 16, 2021 and ended on August 15, 2021. After this first offering period, the Board of Directors of the Company determined to provide subsequent 6-month offering periods commencing on each March 1 and September 1 for the remaining term of the 2021 ESPP. An aggregate of 100,000 shares of the Company’s class A common stock has been authorized for issuance under the 2021 ESPP. During the years ended December 31, 20162023, 2022, and 2015,2021, 19,856 shares,15,925 shares, and 4,612 shares, respectively, of class A common stock were issued in connection with the Company was able to recognize and utilize tax deductions related to equity compensation in excess2021 ESPP. As of compensation recognizedDecember 31, 2023, 59,607 shares of the Company’s class A common stock remained available for financial reporting that was generatedissuance under the 2013 Equity Plan. Accordingly, additional paid-in capital increased2021 ESPP.
Unless otherwise determined by $1.2 millionthe Board of Directors, shares are purchased at a price equal to 85% of the lesser of the closing price of the Company’s class A common stock on the first or last business day of the offering period, respectively. Share-based compensation expense is based on the grant date fair value, which consists of the intrinsic value of the 15% discounted share purchase rights and $1.1 million duringthe fair value of the look-back provision using the Black-Scholes valuation model, recognized on a straight-line basis over the offering period. The grant date is the offering period commencement date.
During the years ended December 31, 20162023, 2022, and 2015, respectively. Beginning January 1, 2017, excess tax benefits are no longer recognized as additional paid-in capital; instead they are prospectively included within the provision for income taxes. Prior periods have not been restated.
During the year ended December 31, 2016,2021, the Company wrote off $1.7recognized approximately $1.9 million, of deferred tax assets related to certain vested stock options that were no longer exercisable. Accordingly, additional paid-in capital decreased by $1.7$2.4 million during the year ended December 31, 2016. No such adjustment was made during the years ended December 31, 2017 and 2015.
During the year ended December 31, 2016, the Company paid $3.7$2.6 million, to tax authoritiesrespectively, in share-based compensation expense related to the net exercise2021 ESPP. As of a stock option under the 2013 Equity Plan. This payment resulted in a $3.7 million reduction to additional paid-in capital during the year ended December 31, 2016. No net exercises2023, there was approximately $0.3 million of stock options were made duringtotal unrecognized share-based compensation expense related to the years ended December 31, 2017 and 2015.2021 ESPP, which the Company expects to recognize over a period of approximately 0.2 years.
Tax Benefits Related to Equity Plans
The following table summarizes the tax (benefit) expense related to the Company’s equity plans (in thousands) for the periods indicated:
| | | | | | | | | | | | |
| | Years Ended December 31, | |
| | 2023 | | | 2022 | | | 2021 | |
Tax (benefit) expense related to: | | | | | | | | | |
Share-based compensation expense | | $ | (12,874 | ) | | $ | (12,155 | ) | | $ | (8,260 | ) |
Exercises of stock options and vesting of share-settled restricted stock units | | | (3,367 | ) | | | 1,370 | | | | (37,664 | ) |
Total tax benefit related to the Company's equity plans | | $ | (16,241 | ) | | $ | (10,785 | ) | | $ | (45,924 | ) |
(12) Basic and Diluted Earnings (Loss) per Share
Potential shares of common stock are included in the diluted earnings per share calculation when dilutive. Potential shares of common stock, consisting of common stock issuable upon exercise of outstanding stock options, are calculated using the treasury stock method.
The following table sets forth the computation of basic and diluted earnings (loss) per share (in thousands, except per share data) for the periods indicated:
| | Years Ended December 31, | |
| | 2017 | | | 2016 | | | 2015 | |
Numerator: | | | | | | | | | | | | |
Net income | | $ | 17,643 | | | $ | 90,908 | | | $ | 105,931 | |
| | | | | | | | | | | | |
Denominator: | | | | | | | | | | | | |
Weighted average common shares of class A common stock | | | 9,409 | | | | 9,390 | | | | 9,320 | |
Weighted average common shares of class B common stock | | | 2,035 | | | | 2,035 | | | | 2,035 | |
Total weighted average common stock shares outstanding | | | 11,444 | | | | 11,425 | | | | 11,355 | |
Effect of dilutive securities: | | | | | | | | | | | | |
Employee stock options | | | 103 | | | | 91 | | | | 184 | |
Adjusted weighted average shares | | | 11,547 | | | | 11,516 | | | | 11,539 | |
| | | | | | | | | | | | |
Earnings per share: | | | | | | | | | | | | |
Basic earnings per share | | $ | 1.54 | | | $ | 7.96 | | | $ | 9.33 | |
Diluted earnings per share | | $ | 1.53 | | | $ | 7.89 | | | $ | 9.18 | |
| | | | | | | | | | | | |
| | Years Ended December 31, | |
| | 2023 | | | 2022 | | | 2021 | |
Numerator: | | | | | | | | | |
Net income (loss) - Basic | | $ | 429,121 | | | $ | (1,469,797 | ) | | $ | (535,480 | ) |
Effect of dilutive shares on net income (loss): | | | | | | | | | |
Interest expense on 2025 Convertible Notes, net of tax | | | 5,648 | | | | 0 | | | | 0 | |
Interest expense on 2027 Convertible Notes, net of tax | | | 2,874 | | | | 0 | | | | 0 | |
Net income (loss) - Diluted | | $ | 437,643 | | | $ | (1,469,797 | ) | | $ | (535,480 | ) |
| | | | | | | | | |
Denominator: | | | | | | | | | |
Weighted average common shares of class A common stock | | | 11,707 | | | | 9,357 | | | | 8,056 | |
Weighted average common shares of class B common stock | | | 1,964 | | | | 1,964 | | | | 1,964 | |
Total weighted average shares of common stock outstanding - Basic | | | 13,671 | | | | 11,321 | | | | 10,020 | |
| | | | | | | | | |
Effect of dilutive shares on weighted average common shares outstanding: | | | | | | | | | |
Stock options | | | 461 | | | | 0 | | | | 0 | |
Restricted stock units | | | 54 | | | | 0 | | | | 0 | |
Performance stock units | | | 13 | | | | 0 | | | | 0 | |
Employee stock purchase plan | | | 1 | | | | 0 | | | | 0 | |
2025 Convertible Notes | | | 1,633 | | | | 0 | | | | 0 | |
2027 Convertible Notes | | | 733 | | | | 0 | | | | 0 | |
Total weighted average shares of common stock outstanding - Diluted | | | 16,566 | | | | 11,321 | | | | 10,020 | |
| | | | | | | | | |
Earnings (loss) per share: | | | | | | | | | |
Basic earnings (loss) per share (1) | | $ | 31.39 | | | $ | (129.83 | ) | | $ | (53.44 | ) |
Diluted earnings (loss) per share (1) | | $ | 26.42 | | | $ | (129.83 | ) | | $ | (53.44 | ) |
For(1) Basic and fully diluted earnings (loss) per share for class A and class B common stock are the years ended December 31, 2017, 2016, and 2015, stock options issued under the 2013 Equity Plan to purchase asame.
The following weighted average of approximately 398,000, 391,000, and 262,000 shares of potential class A common stock
100
MICROSTRATEGY INCORPORATED
NOTES TO CONSOLIDATED FINANCIAL STATEMENTS
respectively, were excluded from the diluted earnings (loss) per share calculation because their impact would have been anti-dilutive.anti-dilutive (in thousands):
| | | | | | | | | | | | |
| | Years Ended December 31, | |
| | 2023 | | | 2022 | | | 2021 | |
Stock options | | | 590 | | | | 1,462 | | | | 1,233 | |
Restricted stock units | | | 30 | | | | 119 | | | | 95 | |
Performance stock units | | | 0 | | | | 0 | | | | 0 | |
Employee stock purchase plan | | | 5 | | | | 6 | | | | 2 | |
2025 Convertible Notes | | | 0 | | | | 1,633 | | | | 1,633 | |
2027 Convertible Notes | | | 0 | | | | 733 | | | | 635 | |
Total | | | 625 | | | | 3,953 | | | | 3,598 | |
(13) At-the-Market Equity Offerings
During 2023, 2022, and 2021, the Company entered into sales agreements with agents pursuant to which the Company could issue and sell shares of its class A common stock through at-the-market equity offering programs. Pursuant to these agreements, the Company agreed to pay the sales agents commissions for their services in acting as agents with respect to the sale of shares through the at-the-market equity offering programs and also agreed to provide the sales agents with reimbursement for certain incurred expenses and customary indemnification and contribution rights. The following table summarizes the terms and provisions of each sales agreement, and sales activity pursuant to each at-the-market equity offering program that was active during 2023, 2022, or 2021. The maximum aggregate offering price and net proceeds (less sales commissions and expenses) for each at-the-market equity offering program in the following table are reported in thousands.
| | | | | | | | | | | | | | | | | | | | |
| | November 2023 Sales Agreement | | | August 2023 Sales Agreement | | | May 2023 Sales Agreement | | | 2022 Sales Agreement | | | 2021 Sales Agreement | |
Agreement effective date | | November 30, 2023 | | | August 1, 2023 | | | May 1, 2023 | | | September 9, 2022 | | | June 14, 2021 | |
Sales agents | | Cowen and Company, LLC, Canaccord Genuity LLC, and BTIG, LLC ("November 2023 Sales Agents") | | | Cowen and Company, LLC, Canaccord Genuity LLC, and Berenberg Capital Markets LLC ("August 2023 Sales Agents") | | | Cowen and Company, LLC and Canaccord Genuity LLC ("May 2023 Sales Agents") | | | Cowen and Company, LLC and BTIG, LLC ("2022 Sales Agents") | | | Jefferies, LLC ("2021 Sales Agents") | |
Maximum aggregate offering price | | $ | 750,000 | | | $ | 750,000 | | | $ | 625,000 | | | $ | 500,000 | | | $ | 1,000,000 | |
Maximum commissions payable to sales agents on gross proceeds from the sale of shares | | | 2.0 | % | | | 2.0 | % | | | 2.0 | % | | | 2.0 | % | | | 2.0 | % |
Date terminated | | n/a | | | November 29, 2023 | | | August 1, 2023 | | | May 1, 2023 | | | December 28, 2021 | |
Shares sold under such sales agreement during the year ended: | | | | | | | | | | | | | | | |
December 31, 2023 | | | 1,076,915 | | | | 1,592,950 | | | | 1,079,170 | | | | 1,348,855 | | | n/a | |
December 31, 2022 | | n/a | | | n/a | | | n/a | | | | 218,575 | | | n/a | |
December 31, 2021 | | n/a | | | n/a | | | n/a | | | n/a | | | | 1,413,767 | |
Net proceeds received from shares sold under such sales agreement during the year ended: | | | | | | | | | | | | | | | |
December 31, 2023 | | $ | 609,873 | | | $ | 737,760 | | | $ | 333,494 | | | $ | 338,962 | | | n/a | |
December 31, 2022 | | n/a | | | n/a | | | n/a | | | $ | 46,219 | | | n/a | |
December 31, 2021 | | n/a | | | n/a | | | n/a | | | n/a | | | $ | 990,463 | |
As of December 31, 2023: | | | | | | | | | | | | | | | |
Cumulative shares sold under such sales agreement | | | 1,076,915 | | | | 1,592,950 | | | | 1,079,170 | | | | 1,567,430 | | | | 1,413,767 | |
Cumulative net proceeds received from shares sold under such sales agreement | | $ | 609,873 | | | $ | 737,760 | | | $ | 333,494 | | | $ | 385,181 | | | $ | 990,463 | |
Maximum aggregate offering price remaining under such sales agreement | | $ | 137,765 | | | n/a | | | n/a | | | n/a | | | n/a | |
The sales commissions and expenses related to each of the above at-the-market equity offering programs are considered direct and incremental costs and are charged against “Additional paid-in capital” on the Consolidated Balance Sheet in the period in which the corresponding shares are issued and sold.
(13)
The Board of Directors haspreviously authorized the Company’s repurchase of up to an aggregate of $800.0$800.0 million of its class A common stock from time to time on the open market through April 29, 2018 (the “20052023 under the Share Repurchase Program”), although the program may be suspended or discontinued by the Company at any time.Program. The timing and amount of any shares repurchased will be determined by the Company’s management based on its evaluation of market conditions and other factors. The 2005 Share Repurchase Program may be funded usingexpired by its own terms on April 29, 2023, and no shares of the Company’s working capital, as well as proceeds from any other funding arrangements thatclass A common stock remain available for repurchase under the Company may enter into inShare Repurchase Program. At the future. Astime of December 31, 2017,expiration, the Company had repurchased an aggregate of 3,826,9475,674,226 shares of its class A common stock at an average price per share of $90.23$104.13 and an aggregate cost of $345.3$590.9 million pursuant to the 2005 Share Repurchase Program. The average price per share and aggregate cost amounts disclosed above include broker commissions. During the years ended December 31, 2017, 2016,2023, 2022 and 2015,2021, the Company did notnot repurchase any shares of its class A common stock pursuant to the 2005 Share Repurchase Program.
(14)(15) Employee Benefit Plan
The Company sponsors a benefit plan to provide retirement benefits for its employees, known as the MicroStrategy 401(k) Savings Plan (the “Plan”“401(k) Plan”). Participants may make voluntary contributions to the 401(k) Plan of up to 50%75% (and prior to September 30, 2022, up to 50%) of their annual base pre-tax compensation, cash bonuses, and commissions not to exceed the federally determined maximum allowable contribution amounts. Participants may designate all or a portion of the 401(k) Plan elective deferral contributions as Roth elective deferral contributions instead of pre-tax elective deferral contributions. The 401(k) Plan permits for discretionary Company contributions.
The Company currently makes a matching contribution to each 401(k) Plan participant in the amount of 50%50% of the first 6%12% of a participant’s contributions, up to a maximum of $3,000$5,000 per year. A participant vestsFurther, all active participants become fully vested in the Company’s matching contributions in increments based on the participant’safter completing four years of employment, byvesting in 25% increments at the Company, becoming fully vested after completing six yearsend of employment. each year of employment with the Company.
The Company made contributions to the 401(k) Plan totaling $2.1$2.8 million, $1.9$3.1 million, and $1.6$2.9 million during the years ended December 31, 2017, 2016,2023, 2022, and 2015,2021, respectively.
(15)(16) Segment Information
The Company manages its business in one reportable operating segment. The Company’s one reportable operating segment is engaged in the design, development, marketing, and sales of its software platform through licensing arrangements and cloud-basedcloud subscriptions and related services. The following table presents total revenues, gross profit, and long-lived assets excluding long-term deferred tax assets, (in thousands) according to geographic region:region. Long-lived assets are comprised of right-of-use assets and property and equipment, net.
| Geographic regions: | | Domestic | | | EMEA | | | Other Regions | | | Consolidated | | | U.S. | | | EMEA | | | Other Regions | | | Consolidated | |
Year ended December 31, 2017 | | | | | | | | | | | | | | | | |
Year ended December 31, 2023 | | | | | | | | | | | | | |
Total revenues | | $ | 292,930 | | | $ | 154,567 | | | $ | 57,046 | | | $ | 504,543 | | | $ | 284,174 | | | $ | 155,914 | | | $ | 56,173 | | | $ | 496,261 | |
Gross profit | | $ | 233,945 | | | $ | 126,147 | | | $ | 47,802 | | | $ | 407,894 | | | $ | 222,952 | | | $ | 123,510 | | | $ | 39,855 | | | $ | 386,317 | |
Year ended December 31, 2016 | | | | | | | | | | | | | | | | |
Year ended December 31, 2022 | | | | | | | | | | | | | |
Total revenues | | $ | 310,972 | | | $ | 150,422 | | | $ | 50,767 | | | $ | 512,161 | | | $ | 294,697 | | | $ | 152,614 | | | $ | 51,953 | | | $ | 499,264 | |
Gross profit | | $ | 253,234 | | | $ | 122,865 | | | $ | 42,915 | | | $ | 419,014 | | | $ | 240,048 | | | $ | 120,162 | | | $ | 36,065 | | | $ | 396,275 | |
Year ended December 31, 2015 | | | | | | | | | | | | | | | | |
Year ended December 31, 2021 | | | | | | | | | | | | | |
Total revenues | | $ | 326,792 | | | $ | 153,658 | | | $ | 49,419 | | | $ | 529,869 | | | $ | 282,444 | | | $ | 171,140 | | | $ | 57,178 | | | $ | 510,762 | |
Gross profit | | $ | 265,438 | | | $ | 121,148 | | | $ | 42,175 | | | $ | 428,761 | | | $ | 236,646 | | | $ | 139,704 | | | $ | 42,503 | | | $ | 418,853 | |
As of December 31, 2017 | | | | | | | | | | | | | | | | |
As of December 31, 2023 | | | | | | | | | | | | | |
Long-lived assets | | $ | 53,102 | | | $ | 4,108 | | | $ | 1,516 | | | $ | 58,726 | | | $ | 75,004 | | | $ | 3,937 | | | $ | 7,343 | | | $ | 86,284 | |
As of December 31, 2016 | | | | | | | | | | | | | | | | |
As of December 31, 2022 | | | | | | | | | | | | | |
Long-lived assets | | $ | 67,031 | | | $ | 3,256 | | | $ | 1,341 | | | $ | 71,628 | | | $ | 83,279 | | | $ | 6,466 | | | $ | 3,865 | | | $ | 93,610 | |
The domestic region consists of the United States and Canada. The EMEA region includes operations in Europe, the Middle East, and Africa. The other regions include all other foreign countries, generally comprising Latin
101
MICROSTRATEGY INCORPORATED
NOTES TO CONSOLIDATED FINANCIAL STATEMENTS
America, and the Asia Pacific region.region, and Canada. For the years ended December 31, 2017, 2016,2023, 2022, and 2015, 2021, no individual foreign country accounted for 10% or more of total consolidated revenues.
For the years ended December 31, 2017, 2016,2023, 2022, and 2015, 2021, no individual customer accounted for 10% or more of total consolidated revenues.
As of December 31, 20172023 and 2016, 2022, no individual foreign country accounted for 10% or more of total consolidated assets.
(17) Related Party Transactions
(16) Selected Quarterly Financial Data (Unaudited)
The following tables contain unaudited StatementIn June 2021, Michael J. Saylor, the Company’s Chairman of Operations informationthe Board of Directors and Executive Chairman and, at that time, the Company’s Chief Executive Officer, entered into an indemnification agreement (the “Original Agreement”) with the Company for an initial term of 90 days and subject to successive 90-day term extensions at the election of the Company, all of such term extensions were exercised. Pursuant to the Original Agreement, Mr. Saylor provided during the term of the agreement, from his personal funds, indemnity coverage to the Company for the benefit of the directors and officers (“D&Os”) of the Company and its subsidiaries in the event such coverage was not indemnifiable by the Company, up to a total of $40 million. In return, the Company paid Mr. Saylor $388,945 for each quarter of 2017 and 2016. During the fourth quarter of 2017, the Company estimated and recorded a one-time tax provision of $44.0 million as a result of the Tax Act. This tax provision is comprised of a $40.3 million Transition Taxinitial and a $3.7 million charge related to the re-measurement of net deferred tax assets arising from the new lower corporate tax rate effected by the Tax Act. During the fourth quarter of 2016, the Company reversed the accrual for potential future payments in connection with the departure from the Company of two executives in connection with an executive management reorganization in January 2016, which resulted in a $3.4 million increase in net income. The operating results for any quarter are not necessarily indicative of results for any future period.successive 90-day terms.
| | Quarter Ended | | | | | |
| | March 31 | | | June 30 | | | September 30 | | | December 31 | | | Year | |
| | (in thousands, except per share data) | |
2017 | | | | | | | | | | | | | | | | | | | | |
Revenues | | $ | 120,576 | | | $ | 120,610 | | | $ | 125,212 | | | $ | 138,145 | | | $ | 504,543 | |
Gross profit | | $ | 97,444 | | | $ | 96,235 | | | $ | 100,823 | | | $ | 113,392 | | | $ | 407,894 | |
Net (loss) income | | $ | 14,867 | | | $ | 11,076 | | | $ | 17,924 | | | $ | (26,224 | ) | | $ | 17,643 | |
Earnings (loss) per share:(1) | | | | | | | | | | | | | | | | | | | | |
Basic | | $ | 1.30 | | | $ | 0.97 | | | $ | 1.57 | | | $ | (2.29 | ) | | $ | 1.54 | |
Diluted | | $ | 1.28 | | | $ | 0.96 | | | $ | 1.56 | | | $ | (2.29 | ) | | $ | 1.53 | |
| | Quarter Ended | | | | | |
| | March 31 | | | June 30 | | | September 30 | | | December 31 | | | Year | |
| | (in thousands, except per share data) | |
2016 | | | | | | | | | | | | | | | | | | | | |
Revenues | | $ | 119,015 | | | $ | 123,142 | | | $ | 129,896 | | | $ | 140,108 | | | $ | 512,161 | |
Gross profit | | $ | 96,192 | | | $ | 99,041 | | | $ | 106,961 | | | $ | 116,820 | | | $ | 419,014 | |
Net income | | $ | 14,272 | | | $ | 18,884 | | | $ | 26,628 | | | $ | 31,124 | | | $ | 90,908 | |
Earnings per share:(1) | | | | | | | | | | | | | | | | | | | | |
Basic | | $ | 1.25 | | | $ | 1.65 | | | $ | 2.33 | | | $ | 2.72 | | | $ | 7.96 | |
Diluted | | $ | 1.24 | | | $ | 1.64 | | | $ | 2.31 | | | $ | 2.69 | | | $ | 7.89 | |
(1)
| The sum of the basicOn June 12, 2022, Mr. Saylor and diluted (loss) earnings per share for the four quarters may differ from annual earnings per share as the weighted-average shares outstanding are computed independently for each of the quarters presented.
|
(17) Subsequent Events
In January 2018, the Company entered into a renewed indemnification agreement (the “Renewed Agreement”) for an initial term of 90 days, which became effective upon the expiration of the final 90-day extension of the Original Agreement. In return, the Company paid Mr. Saylor a one-time fee of $388,945 for the initial 90-day term (the “Renewal Payment”).
On June 24, 2022, the Company bound D&O liability insurance policies (the “Initial Commercial Policies”) with several third-party carriers for $30 million in coverage. Concurrently, Mr. Saylor and the Company also entered into (i) an indemnification agreement (the “Excess Agreement”) for Mr. Saylor to amend its corporate headquarters office lease. provide $10 million in excess indemnity coverage payable only after the exhaustion of the Initial Commercial Policies, and (ii) an indemnification agreement (the “2022 Tail Agreement”) for Mr. Saylor to provide $40 million in indemnity coverage for claims made at any time based on actions or omissions occurring prior to the inception date of the Initial Commercial Policies. The Company paid Mr. Saylor $600,000 for a one-year term under the Excess Agreement, and $150,000 for a 90-day term under the 2022 Tail Agreement. At the option of the Company, the Company was permitted to extend the term under the 2022 Tail Agreement for up to a total of twenty-three additional 90-day periods, for $150,000 per additional 90-day term. In connection with the execution of the Initial Commercial Policies and the release of his obligations under the Renewed Agreement, Mr. Saylor refunded the Company $337,086, which was the pro rata portion of the Renewal Payment attributable to the period from the date of the Initial Commercial Policies through the end of the original term of the Renewed Agreement.
On August 30, 2022, the Company bound additional D&O liability insurance policies (the “Excess Commercial Policies”) with third-party carriers for $10 million in excess coverage payable only after the exhaustion of the Initial Commercial Policies. Effective as of the same date, the Company and Mr. Saylor executed an amendment extends(the “Amendment”) to the existing lease expiration date from December 2020Excess Agreement to December 2030 and provides for certain tenant allowances and incentives. Before tenant allowances and incentives,limit Mr. Saylor’s obligation to provide indemnification under the Company’s annual base rent is expectedExcess Agreement to range from approximately $10.0 million to $13.0 millionclaims made during the twelve-year leaseterm of the Excess Agreement which arise from wrongful acts occurring upon or after the commencement of the Excess Agreement but prior to the effective date of the Amendment. In connection with the Amendment, Mr. Saylor refunded $489,863 to the Company, representing the pro rata portion of the $600,000 originally paid by the Company to Mr. Saylor under the Excess Agreement attributable to the period from the date of the Amendment through the end of the original term of the Excess Agreement. During the third and fourth quarters of 2022 and the first quarter of 2023, pursuant to the terms of the 2022 Tail Agreement, the Company elected to extend the term of the 2022 Tail Agreement for additional 90-day periods and paid Mr. Saylor $150,000 for each such extension.
On June 12, 2023, the Company bound new D&O liability insurance policies (the “2023 Commercial Policies”) with third-party carriers that provide coverage substantially equivalent to the aggregate coverage provided under the Initial Commercial Policies and the Excess Commercial Policies for a policy period running from June 12, 2023 through June 12, 2024 except that the 2023 Commercial Policies also provide coverage for claims made with respect to wrongful acts or omissions occurring prior to the binding of the Initial Commercial Policies subject to exclusions with respect to claims previously noticed to and accepted by an earlier D&O insurer, claims related to acts or omissions giving rise to such claims, and demands, investigations, suits or other proceedings entered against an insured prior to June 24, 2022, as well as future interrelated wrongful acts (collectively, the “Excluded Claims”).
On June 12, 2023, the Company entered into a new indemnification agreement with Mr. Saylor (the “2023 Tail Agreement”) pursuant to which Mr. Saylor agreed to provide coverage that is similar to the coverage provided under the 2022 Tail Agreement, but only to cover the Excluded Claims for an initial one-year term and for a payment of $157,000. The Company may elect, at its option, to extend the term under the 2023 Tail Agreement for up to a total of four additional one-year periods, for $157,000 per each additional one-year term.
Prior to entering into the Original Agreement, Renewed Agreement, Excess Agreement, 2022 Tail Agreement, and 2023 Tail Agreement with Mr. Saylor, the Company obtained and considered market quotes for D&O liability insurance policies. The Company determined that the policies considered at such times would have provided insufficient coverage and would have required substantial premiums to the extent coverage were available, and that obtaining indemnification coverage provided by Mr. Saylor was appropriate and in the best interests of the Company.
(18) Subsequent Events
Since December 31, 2023 through the date immediately preceding the filing of this Annual Report, the Company has purchased approximately 850 bitcoins for $37.2 million, or approximately $43,723 per bitcoin. All of these approximately 850 bitcoins serve as part of the collateral for the 2028 Secured Notes.
The Company has incurred at least $28.9 million in digital asset impairment losses during the first quarter of 2024 on bitcoin held as of December 31, 2023.
See Note 2(g), Summary of Significant Accounting Policies, and Note 4, Digital Assets, to the Consolidated Financial Statements, for further detail on accounting for digital assets.
INDEX TO EXHIBITS
| | |
Exhibit Number |
| Description |
|
|
|
3.1 |
| Second Restated Certificate of Incorporation of the registrant (incorporated herein by reference to Exhibit 3.1 to the registrant’s Quarterly Report on Form 10-Q for the fiscal quarter ended March 31, 2003 (File No. 000-24435)). |
|
|
|
3.2 |
| Amended and Restated By-Laws of the registrant (incorporated herein by reference to Exhibit 3.1 to the registrant’s Current Report on Form 8-K filed with the SEC on January 30, 2015 (File No. 000-24435)). |
|
|
|
4.1 |
| Form of Certificate of Class A Common Stock of the registrant (incorporated herein by reference to Exhibit 4.1 to the registrant’s Quarterly Report on Form 10-Q for the fiscal quarter ended June 30, 2003 (File No. 000-24435)). |
|
|
|
4.2 |
| Description of the registrant’s registered securities (incorporated herein by reference to Exhibit 4.2 to the registrant’s Annual Report on Form 10-K for the fiscal year ended December 31, 2019 (File No. 000-24435)). |
|
|
|
4.3 |
| Indenture, dated as of December 11, 2020, by and between the registrant and U.S. Bank National Association, as trustee (incorporated herein by reference to Exhibit 4.1 to the registrant’s Current Report on Form 8-K filed with the SEC on December 11, 2020 (File No. 000-24435)). |
|
|
|
10.1† 4.4
|
| Form of 0.750% Convertible Senior Note due 2025 (included within Exhibit 4.3 incorporated herein by reference to Exhibit 4.1 to the registrant’s Current Report on Form 8-K filed with the SEC on December 11, 2020 (File No. 000-24435)). |
|
|
|
4.5 |
| Indenture, dated as of February 19, 2021, by and between the registrant and U.S. Bank National Association, as trustee (incorporated herein by reference to Exhibit 4.1 to the registrant’s Current Report on Form 8-K filed with the SEC on February 19, 2021 (File No. 000-24435)). |
|
|
|
4.6 |
| Form of 0% Convertible Senior Note due 2027 (included within Exhibit 4.5 incorporated herein by reference to Exhibit 4.1 to the registrant’s Current Report on Form 8-K filed with the SEC on February 19, 2021 (File No. 000-24435)). |
|
|
|
4.7 |
| Indenture, dated as of June 14, 2021, by and among the registrant, as issuer, MicroStrategy Services Corporation, as a guarantor, and U.S. Bank National Association, as trustee and notes collateral agent (incorporated herein by reference to Exhibit 4.1 to the registrant’s Current Report on Form 8-K filed with the SEC on June 14, 2021 (File No. 000-24435)). |
|
|
|
4.8 |
| Form of 6.125% Senior Secured Note due 2028 (included within Exhibit 4.7 incorporated herein by reference to Exhibit 4.1 to the registrant’s Current Report on Form 8-K filed with the SEC on June 14, 2021 (File No. 000-24435)). |
|
|
|
10.1† |
| MicroStrategy Incorporated 2013 Stock Incentive Plan (incorporated herein by reference to Exhibit 10.1 to the registrant’s Current Report on Form 8-K filed with the SEC on September 9, 2013 (File No. 000-24435)). |
|
|
|
10.2† |
| Amendment No. 1 to the MicroStrategy Incorporated 2013 Stock Incentive Plan (incorporated herein by reference to Exhibit 10.1 to the registrant’s Current Report on Form 8-K filed with the SEC on April 28, 2014 (File No. 000-24435)). |
|
|
|
10.3† |
| Amendment No. 2 to the MicroStrategy Incorporated 2013 Stock Incentive Plan (incorporated herein by reference to Exhibit 99.3 to the registrant’s Registration Statement on Form S-8 filed with the SEC on July 25, 2014 (File No. 333-197645)). |
|
|
|
10.4† |
| Amendment No. 3 to the MicroStrategy Incorporated 2013 Stock Incentive Plan (incorporated herein by reference to Exhibit 10.1 to the registrant’s Current Report on Form 8-K filed with the SEC on October 26, 2015 (File No. 000-24435)). |
|
|
|
10.5† |
| Amendment No. 4 to the MicroStrategy Incorporated 2013 Stock Incentive Plan (incorporated herein by reference to Exhibit 10.4 to the registrant’s Quarterly Report on Form 10-Q for the fiscal quarter ended June 30, 2018 (File No. 000-24435)). |
|
|
|
10.6† |
| Amendment No. 5 to the MicroStrategy Incorporated 2013 Stock Incentive Plan (incorporated herein by reference to Appendix A to the registrant’s Definitive Proxy Statement on Schedule 14A filed with the SEC on April 15, 2021 (File No. 000-24435)). |
|
|
|
10.7† |
| 2013 Form of Nonstatutory Stock Option Agreement (incorporated(incorporated herein by reference to Exhibit 10.2 to the registrant’s Current Report on Form 8-K filed with the SEC on September 9, 2013 (File No. 000-24435)). |
|
|
|
10.6†10.8†
|
| 2016 Form of Nonstatutory Stock Option Agreement (incorporated herein by reference to Exhibit 10.1 to the registrant’s Quarterly Report on Form 10-Q for the fiscal quarter ended June 30, 2016 (File No. 000-24435)). |
|
|
|
10.7†10.9†
|
| SummaryForm of Perquisites and Associated Other Compensation Arrangements for Named Executive OfficersRestricted Stock Unit Agreement (incorporated herein by reference to Exhibit 10.610.9 to the registrant’s Annual Report on Form 10-K for the fiscal year ended December 31, 20152021 (File No. 000-24435)).
|
| | |
|
|
|
10.10† |
| Form of International Restricted Stock Unit Agreement (incorporated herein by reference to Exhibit 10.1 to the registrant’s Quarterly Report on Form 10-Q for the fiscal quarter ended June 30, 2022 (File No. 000-24435)). |
|
|
|
10.8†10.11†
|
| SummaryForm of Director Fees and Perquisites and Associated Other Compensation ArrangementsUK Restricted Stock Unit Agreement (incorporated herein by reference to Exhibit 10.11 to the registrant’s Annual Report on Form 10-K for Non-Employee Directorsthe fiscal year ended December 31, 2021 (File No. 000-24435)).
|
|
|
|
10.12† |
| Form of Canada Restricted Stock Unit Agreement (incorporated herein by reference to Exhibit 10.12 to the registrant’s Annual Report on Form 10-K for the fiscal year ended December 31, 2021 (File No. 000-24435)). |
|
|
|
10.13† |
| Form of Argentina Restricted Stock Unit Agreement (incorporated herein by reference to Exhibit 10.2 to the registrant’s Quarterly Report on Form 10-Q for the fiscal quarter ended March 31, 2014June 30, 2022 (File No. 000-24435)). |
|
|
|
10.9†10.14†
|
| Form of China Restricted Stock Unit Agreement (incorporated herein by reference to Exhibit 10.3 to the registrant’s Quarterly Report on Form 10-Q for the fiscal quarter ended June 30, 2022 (File No. 000-24435)). |
|
|
|
10.15† |
| MicroStrategy Incorporated 2023 Equity Incentive Plan. |
|
|
|
10.16† |
| U.S. Form of Nonstatutory Stock Option Agreement (incorporated herein by reference to Exhibit 99.1 to the registrant’s Current Report on Form 8-K filed with the SEC on May 30, 2023 (File No. 000-24435)). |
|
|
|
10.17† |
| U.S. Form of RSU Agreement (incorporated herein by reference to Exhibit 99.2 to the registrant’s Current Report on Form 8-K filed with the SEC on May 30, 2023 (File No. 000-24435)). |
|
|
|
10.18† |
| UK Form of Nonstatutory Stock Option Agreement (incorporated herein by reference to Exhibit 10.4 to the registrant’s Quarterly Report on Form 10-Q for the fiscal quarter ended June 30, 2023 (File No. 000-24435)). |
|
|
|
10.19† |
| UK Form of RSU Agreement (incorporated herein by reference to Exhibit 10.5 to the registrant’s Quarterly Report on Form 10-Q for the fiscal quarter ended June 30, 2023 (File No. 000-24435)). |
|
|
|
10.20† |
| China Form of Nonstatutory Stock Option Agreement (incorporated herein by reference to Exhibit 10.6 to the registrant’s Quarterly Report on Form 10-Q for the fiscal quarter ended June 30, 2023 (File No. 000-24435)). |
|
|
|
10.21† |
| China Form of RSU Agreement (incorporated herein by reference to Exhibit 10.7 to the registrant’s Quarterly Report on Form 10-Q for the fiscal quarter ended June 30, 2023 (File No. 000-24435)). |
|
|
|
10.22† |
| Canada Form of RSU Agreement (incorporated herein by reference to Exhibit 10.8 to the registrant’s Quarterly Report on Form 10-Q for the fiscal quarter ended June 30, 2023 (File No. 000-24435)). |
|
|
|
10.23† |
| International Form of Nonstatutory Stock Option Agreement (incorporated herein by reference to Exhibit 10.9 to the registrant’s Quarterly Report on Form 10-Q for the fiscal quarter ended June 30, 2023 (File No. 000-24435)). |
|
|
|
10.24† |
| International Form of RSU Agreement. |
|
|
|
10.25† |
| UK Sub-Plan (incorporated herein by reference to Exhibit 10.11 to the registrant’s Quarterly Report on Form 10-Q for the fiscal quarter ended June 30, 2023 (File No. 000-24435)). |
|
|
|
10.26† |
| U.S. Form of Nonstatutory Stock Option Agreement (Non-Employee Director) (incorporated herein by reference to Exhibit 10.12 to the registrant’s Quarterly Report on Form 10-Q for the fiscal quarter ended June 30, 2023 (File No. 000-24435)). |
|
|
|
10.27† |
| U.S. Form of RSU Agreement (Non-Employee Director) (incorporated herein by reference to Exhibit 10.13 to the registrant’s Quarterly Report on Form 10-Q for the fiscal quarter ended June 30, 2023 (File No. 000-24435)). |
|
|
|
10.28† |
| U.S. Form of PSU Agreement (incorporated herein by reference to Exhibit 99.3 to the registrant’s Current Report on Form 8-K filed with the SEC on May 30, 2023 (File No. 000-24435)). |
|
|
|
10.29† |
| Summary of Perquisites and Associated Other Compensation Arrangements for Named Executive Officers. |
|
|
|
10.30† |
| Summary of Director Fees, Equity Grants, Perquisites, and Associated Other Compensation Arrangements for Non-Employee Directors. |
|
|
|
10.31† |
| Sublease Agreement, dated as of January 31, 2011, by and between the Company and Aeromar Management Company, LLC (incorporated herein by reference to Exhibit 10.14 to the registrant’s Annual Report on Form 10-K for the fiscal year ended December 31, 2010 (File No. 000-24435)). |
|
|
|
10.10†10.32†
|
| Material Terms for Payment of Certain Executive Incentive Compensation (incorporated herein by reference to Exhibit 10.2 to the registrant’s Quarterly Report on Form 10-Q for the fiscal quarter ended March 31, 2015 (File No. 000-24435)).
|
| | |
10.11†
| | Summary of Designated Company Vehicles Policy (incorporated herein by reference to Exhibit 10.1 to the registrant’s Quarterly Report on Form 10-Q for the fiscal quarter ended June 30, 2007 (File No. 000-24435)). |
|
|
|
| | |
10.12†10.33†
|
| Amended and Restated Performance Incentive Plan (incorporated herein by reference to Exhibit 99.1 to the registrant’s Current Report on Form 8-K filed with the SEC on December 28, 2012 (File No. 000-24435)). |
|
|
|
10.13†10.34†
|
| Summary of Salary and Annual Cash Bonus Targetand Salary Determinations for Phong Q. Le and Timothy E. LangCertain Executive Officers (incorporated herein by reference to Item 9B to the registrant’s CurrentAnnual Report on Form 8-K filed with10-K for the SEC on March 24, 2017fiscal year ended December 31, 2022 (File No. 000-24435)). |
|
|
|
10.14†10.35†
|
| Summary of2023 Sales Executive Variable Compensation for David J. RennysonPlan, by and W. Ming Shao (incorporatedbetween the registrant and Kevin L. Adkisson (incorporated herein by reference to Exhibit 10.1 to the registrant’s Quarterly Report on Form 10-Q for the fiscal quarter ended March 31, 2023 (File No. 000-24435)).
|
|
|
|
10.36† |
| Summary of Certain Provisions of CFO Offer Letter (incorporated herein by reference to Exhibit 10.2 to the registrant’s Quarterly Report on Form 10-Q for the fiscal quarter ended March 31, 2023 (File No. 000-24435)). |
|
|
|
10.37† |
| Agreement, dated as of March 30, 2023, by and between the registrant and Timothy E. Lang (incorporated herein by reference to Exhibit 10.3 to the registrant’s Quarterly Report on Form 10-Q for the fiscal quarter ended March 31, 20172023 (File No. 000-24435)). |
|
|
|
10.15†10.38†
|
| 2017 Senior Executive Vice President, Worldwide Sales Compensation Plan (incorporatedAgreement dated July 12, 2023 between the Company and Kevin Adkisson (incorporated herein by reference to Exhibit 10.410.16 to the registrant’s Quarterly Report on Form 10-Q for the fiscal quarter ended March 31, 2017June 30, 2023 (File No. 000-24435)).
|
|
|
|
10.16†10.39†
|
| Summary of 2017 Cash Bonus Determinations for Executive Officers (incorporatedMicroStrategy Incorporated 2021 Employee Stock Purchase Plan (incorporated herein by reference to Item 5.02Exhibit 99.1 to the registrant’s Registration Statement on Form S-8 filed with the SEC on February 1, 2021 (File No. 333-252608)).
|
|
|
|
|
|
|
10.40†* |
| Indemnification Agreement, effective as of June 12, 2023, by and between the registrant and Michael J. Saylor (incorporated herein by reference to Exhibit 10.1 to the registrant’s Quarterly Report on Form 10-Q for the fiscal quarter ended June 30, 2023 (File No. 000-24435)). |
|
|
|
10.41 |
| Sales Agreement, dated as of November 30, 2023, by and among MicroStrategy, Cowen and Company, LLC, Canaccord Genuity LLC and BTIG, LLC (incorporated herein by reference to Exhibit 1.1 to the registrant’s Current Report on Form 8-K filed with the SEC on January 25, 2018November 30, 2023 (File No. 000-24435)). |
|
|
|
10.17†21.1
|
| SummarySubsidiaries of Compensation for Stephen H. Holdridge.the registrant.
|
|
|
|
21.123.1
|
| SubsidiariesConsent of the registrant.KPMG LLP.
|
|
|
|
23.131.1
|
| Consent of KPMG LLP.
|
| | |
31.1
| | Certification pursuant to Rule 13a-14(a) or Rule 15d-14(a) of the Chairman of the Board of Directors, President & ChiefPrincipal Executive Officer. |
|
|
|
31.2 |
| Certification pursuant to Rule 13a-14(a) or Rule 15d-14(a) of the Senior Executive Vice President & ChiefPrincipal Financial Officer. |
|
|
|
32.1 |
| Certification pursuant to 18 U.S.C. Section 1350, as adopted pursuant to Section 906 of the Sarbanes-Oxley Act of 2002. |
|
|
|
101.INS97.1
|
| XBRL Instance Document.Dodd-Frank Compensation Recovery Policy.
|
|
|
|
101.SCH101.INS
|
| Inline XBRL Instance Document. The instance document does not appear in the Interactive Data File because its XBRL tags are embedded within the Inline XBRL document. |
|
|
|
101.SCH |
| Inline XBRL Taxonomy Extension Schema.Schema with Embedded Linkbases Document. |
|
|
|
101.CAL104
|
| Cover Page Interactive Data File (formatted as inline XBRL Taxonomy Extension Calculation Linkbase. |
| | |
101.DEF
| | XBRL Taxonomy Extension Definition Linkbase.
|
| | |
101.LAB
| | XBRL Taxonomy Extension Label Linkbase.
|
| | |
101.PRE
| | XBRL Taxonomy Extension Presentation Linkbase.with applicable taxonomy extension information contained in Exhibits 101).
|
†Management contracts and compensatory plans or arrangements.
* Portions of this exhibit have been omitted pursuant to Item 601(b)(10)(iv) of Regulation S-K.
SIGNATURESSIGNATURES
Pursuant to the requirements of Section 13 or 15(d) of the Securities Exchange Act of 1934, as amended, the registrant has duly caused this report to be signed on its behalf by the undersigned, thereunto duly authorized.
| | | |
| MicroStrategy Incorporated |
| (Registrant) |
|
|
|
| By: | /s/ Michael J. SaylorPhong Le |
|
| Name: | Michael J. SaylorPhong Le
|
|
| Title: | Chairman of the Board of Directors,
|
| | | President & Chief Executive Officer |
|
|
|
|
| Date: February 7, 201815, 2024 |
Pursuant to the requirements of the Securities Exchange Act of 1934, as amended, this report has been signed below by the following persons on behalf of the registrant and in the capacities and on the dates indicated.
| | | | |
Name |
| Position |
| Date |
|
|
|
|
|
/s/ Michael J. SaylorPhong Le Phong Le |
| Chairman of the Board of Directors, President & Chief Executive Officer and Director (Principal Executive Officer)
|
| February 7, 201815, 2024 |
Michael J. Saylor
|
|
|
|
|
/s/ Andrew Kang Andrew Kang |
| | | |
/s/ Phong Le
Phong Le
| | Senior Executive Vice President & Chief Financial Officer (Principal Financial and Accounting Officer)
|
| February 7, 201815, 2024
|
/s/ Jeanine Montgomery Jeanine Montgomery |
| Senior Vice President & Chief Accounting Officer (Principal Accounting Officer) |
| February 15, 2024 |
/s/ Robert H. Epstein
|
| Director
|
| February 7, 2018
|
Robert H. Epstein/s/ Michael J. Saylor
|
| Chairman of the Board of Directors & Executive Chairman |
| February 15, 2024 |
Michael J. Saylor |
|
|
|
|
|
|
|
|
|
/s/ Stephen X. Graham |
| Director |
| February 7, 201815, 2024 |
Stephen X. Graham |
|
|
|
|
|
|
|
|
|
/s/ Jarrod M. Patten |
| Director |
| February 7, 201815, 2024 |
Jarrod M. Patten |
|
|
|
|
|
|
|
|
|
/s/ Leslie Rechan |
| Director |
| February 15, 2024 |
Leslie Rechan |
|
|
|
|
|
|
|
|
|
/s/ Carl J. Rickertsen |
| Director |
| February 7, 201815, 2024 |
Carl J. Rickertsen |
|
|
|
|
SCHEDULE II
VALUATION AND QUALIFYING ACCOUNTS
For the years ended December 31, 2017, 2016,2023, 2022, and 20152021
(in thousands)
| | | | | | | | | | | | | | | | |
| | Balance at the | | | | | | | | | Balance at | |
| | beginning of | | | | | | | | | the end of | |
| | the period | | | Additions (1) | | | Deductions | | | the period | |
Allowance for credit losses: | | | | | | | | | | | | |
December 31, 2023 | | $ | 2,564 | | | | 797 | | | | (292 | ) | | $ | 3,069 | |
December 31, 2022 | | $ | 2,775 | | | | 383 | | | | (594 | ) | | $ | 2,564 | |
December 31, 2021 | | $ | 2,760 | | | | 669 | | | | (654 | ) | | $ | 2,775 | |
Deferred tax valuation allowance: | | | | | | | | | | | | |
December 31, 2023 | | $ | 511,412 | | | | 193 | | | | (510,178 | ) | | $ | 1,427 | |
December 31, 2022 | | $ | 999 | | | | 510,488 | | | | (75 | ) | | $ | 511,412 | |
December 31, 2021 | | $ | 1,259 | | | | 0 | | | | (260 | ) | | $ | 999 | |
| | Balance at the | | | | | | | | | | | Balance at | |
| | beginning of | | | | | | | | | | | the end of | |
| | the period | | | Additions (1) | | | Deductions | | | the period | |
Allowance for doubtful accounts: | | | | | | | | | | | | | | | | |
December 31, 2017 | | $ | 3,181 | | | | 2,269 | | | | (1,260 | ) | | $ | 4,190 | |
December 31, 2016 | | $ | 3,825 | | | | 224 | | | | (868 | ) | | $ | 3,181 | |
December 31, 2015 | | $ | 4,412 | | | | 884 | | | | (1,471 | ) | | $ | 3,825 | |
Deferred tax valuation allowance: | | | | | | | | | | | | | | | | |
December 31, 2017 | | $ | 832 | | | | 183 | | | | 0 | | | $ | 1,015 | |
December 31, 2016 | | $ | 1,984 | | | | 20 | | | | (1,172 | ) | | $ | 832 | |
December 31, 2015 | | $ | 2,311 | | | | 75 | | | | (402 | ) | | $ | 1,984 | |
Reductions in/charges to revenues and expenses.
(1)
116 | Reductions in/charges to revenues and expenses.
|
106