

UNITED STATES
SECURITIES AND EXCHANGE COMMISSION
Washington, D.C. 20549
FORM 10-K
☒ | ANNUAL REPORT PURSUANT TO SECTION 13 OR 15(d) OF THE SECURITIES EXCHANGE ACT OF 1934 |
for the fiscal year ended December 31, 20172023
or
☐ | TRANSITION REPORT PURSUANT TO SECTION 13 OR 15(d) OF THE SECURITIES EXCHANGE ACT OF 1934 |
Commission file number 000-3683
TRUSTMARK CORPORATIONCORPORATION
(Exact name of Registrant as specified in its charter)
| 64-0471500 | |
(State or other jurisdiction of incorporation or organization) | (IRS Employer Identification Number) | |
248 East Capitol Street, Jackson, Mississippi | 39201 | |
(Address of principal executive offices) | (Zip Code) | |
Registrant’s telephone number, including area code: |
| (601) 208-5111 |
Securities registered pursuant to Section 12(b) of the Act: | ||
Common Stock, no par value |
| Nasdaq Global Select Market |
(Title of Class) | (Trading Symbol) | (Name of Exchange on Which Registered) |
Indicate by check mark if the registrant is a well-known seasoned issuer, as defined in Rule 405 of the Securities Act. Yes☑ No ☐
Indicate by check mark if the registrant is not required to file reports pursuant to Section 13 or Section 15(d) of the Act. Yes ☐No☑
Indicate by check mark whether the registrant (1) has filed all reports required to be filed by Section 13 or 15(d) of the Securities Exchange Act of 1934 during the preceding 12 months (or for such shorter period that the registrant was required to file such reports), and (2) has been subject to such filing requirements for the past 90 days. Yes☑ No ☐
Indicate by check mark whether the registrant has submitted electronically and posted on its corporate Web site, if any, every Interactive Data File required to be submitted and posted pursuant to Rule 405 of Regulation S-T (§232.405 of this chapter) during the preceding 12 months (or for such shorter period that the registrant was required to submit and post such files). Yes☑ No ☐
Indicate by check mark if disclosure of delinquent filers pursuant to Item 405 of Regulation S-K is not contained herein, and will not be contained, to the best of registrant’s knowledge, in definitive proxy or information statements incorporated by reference in Part III of this Form 10-K or any amendment to this Form 10-K. ☐
Indicate by check mark whether the registrant is a large accelerated filer, an accelerated filer, a non-accelerated filer, or a smaller reporting company, or an emerging growth company. See definition of “large accelerated filer,” “accelerated filer,” and “smaller reporting company,” and “emerging growth company” in Rule 12b-2 of the Exchange Act. (Check one):
Large accelerated filer | ☑ | Accelerated filer | ☐ | |
Non-accelerated filer | ☐ | Smaller reporting company | ☐ | |
|
|
|
| ☐ |
If an emerging growth company, indicate by check mark if the registrant has elected not to use the extended transition period for complying with any new or revised financial accounting standards provided pursuant to Section 13(a) of the Exchange Act. ☐
Indicate by check mark whether the registrant has filed a report on and attestation to its management’s assessment of the effectiveness of its internal control over financial reporting under Section 404(b) of the Sarbanes-Oxley Act (15 U.S.C. 7262(b)) by the registered public accounting firm that prepared or issued its audit report. ☐
If securities are registered pursuant to Section 12(b) of the Act, indicate by check mark whether the financial statements of the registrant included in the filing reflect the correction of an error to previously issued financial statements. ☐
Indicate by check mark whether any of those error corrections are restatements that required a recovery analysis of incentive-based compensation received by any of the registrant’s executive officers during the relevant recovery period pursuant to §240.10D-1(b). ☐
Indicate by check mark whether the registrant is a shell company (as defined in Rule 12b-2 of the Act.) Yes ☐ No ☑
Based on the closing sales price at June 30, 2017,2023, the last business day of the registrant’s most recently completed second fiscal quarter, the aggregate market value of the shares of common stock held by nonaffiliates of the registrant was approximately $1.306 billion.$698.8 million.
As of January 31, 2018,2024, there were issued and outstanding 67,818,09361,084,299 shares of the registrant’s Common Stock.
DOCUMENTS INCORPORATED BY REFERENCE
Portions of the Proxy Statement for Trustmark’s 20182024 Annual Meeting of Shareholders to be held April 24, 201823, 2024 are incorporated by reference into Part III of the Form 10-K report.
ANNUAL REPORT ON FORM 10-K
TABLE OF CONTENTS
PAGE | ||
Item 1. | 3 | |
Item 1A. |
| |
Item 1B. |
| |
Item |
| |
Item |
| |
Item | 29 | |
Item 4. |
| |
Item 5. |
| |
Item 6. |
| |
Item 7. | Management’s Discussion and Analysis of Financial Condition and Results of Operations | 33 |
Item 7A. |
| |
Item 8. |
| |
Item 9. | Changes in and Disagreements with Accountants on Accounting and Financial Disclosure |
|
Item 9A. |
| |
Item 9B. |
| |
Item 9C. | Disclosure Regarding Foreign Jurisdictions that Prevent Inspections | 144 |
Item 10. | Directors, Executive Officers of the Registrant and Corporate Governance |
|
Item 11. |
| |
Item 12. | Security Ownership of Certain Beneficial Owners and Management and Related Stockholder Matters |
|
Item 13. | Certain Relationships and Related Transactions, and Director Independence |
|
Item 14. |
| |
Item 15. |
| |
Item 16. |
| |
| ||
2
2
Certain statements contained in this Annual Report on Form 10-K constitute forward-looking statements within the meaning of the Private Securities Litigation Reform Act of 1995. You can identify forward-looking statements by words such as “may,” “hope,” “will,” “should,” “expect,” “plan,” “anticipate,” “intend,” “believe,” “estimate,” “predict,” “project,” “potential,” “seek,” “continue,” “could,” “would,” “future” or the negative of those terms or other words of similar meaning. You should read statements that contain these words carefully because they discuss our future expectations or state other “forward-looking” information. These forward-looking statements include, but are not limited to, statements relating to anticipated future operating and financial performance measures, including net interest margin, credit quality, business initiatives, growth opportunities and growth rates, among other things, and encompass any estimate, prediction, expectation, projection, opinion, anticipation, outlook or statement of belief included therein as well as the management assumptions underlying these forward-looking statements. You should be aware that the occurrence of the events described under the caption Item 1A. Risk Factors in this report could have an adverse effect on our business, results of operations and financial condition. Should one or more of these risks materialize, or should any such underlying assumptions prove to be significantly different, actual results may vary significantly from those anticipated, estimated, projected or expected.
Risks that could cause actual results to differ materially from current expectations of Management include, but are not limited to, changes in the level of nonperforming assets and charge-offs, an increase in unemployment levels and slowdowns in economic growth, actions by the Board of Governors of the Federal Reserve System (FRB) that impact the level of market interest rates, local, state and national economic and market conditions, including potential market impacts of efforts by the Federal Reserve Board to reduce the size of its balance sheet and conditions in the housing and real estate markets in the regions in which Trustmark operates and the extent and duration of the current volatility in the credit and financial markets, as well aslevels of and volatility in crude oil prices, changes in our ability to measure the fair value of assets in our portfolio, material changes in the level and/or volatility of market interest rates, the impacts related to or resulting from bank failures and other economic and industry volatility, including potential increased regulatory requirements and costs and potential impacts to macroeconomic conditions, the performance and demand for the products and services we offer, including the level and timing of withdrawals from our deposit accounts, the costs and effects of litigation and of unexpected or adverse outcomes in such litigation, our ability to attract noninterest-bearing deposits and other low-cost funds, competition in loan and deposit pricing, as well as the entry of new competitors into our markets through de novo expansion and acquisitions, economic conditions, including the potential impact of issues related to the European financial system and monetary and other governmental actions designed to address the level and volatility of interest rates and the volatility ofcredit, securities, currency and otherand/or commodity markets, the enactment of legislation and changes in existing regulations or enforcement practices or the adoption of new regulations, changes in accounting standards and practices, including changes in the interpretation of existing standards, that affect our consolidated financial statements, changes in consumer spending, borrowings and savings habits, technological changes, changes in the financial performance or condition of our borrowers, changes in our ability to control expenses, changes in our compensation and benefit plans, greater than expected costs or difficulties related to the integration of acquisitions or new products and lines of business, cyber-attacks and other breaches which could affect our information system security, natural disasters, environmental disasters, pandemics or other health crises, acts of war or terrorism, and other risks described in our filings with the Securities and Exchange Commission.Commission (SEC).
Although we believe that the expectations reflected in such forward-looking statements are reasonable, we can give no assurance that such expectations will prove to be correct. Except as required by law, we undertake no obligation to update or revise any of this information, whether as the result of new information, future events or developments or otherwise.
ITEM 1. BUSINESS
The Corporation
Description of Business
Trustmark Corporation (Trustmark), a Mississippi business corporation incorporated in 1968, is a bank holding company headquartered in Jackson, Mississippi. Trustmark’s principal subsidiary is Trustmark National Bank (TNB), initially chartered by the State of Mississippi in 1889. At December 31, 2017,2023, TNB had total assets of $13.796$18.720 billion, which represented approximately 99.98%99.99% of the consolidated assets of Trustmark.
Through TNB and its subsidiaries, Trustmark operates as a financial services organization providing banking and other financial solutions through 198 offices and 2,8932,757 full-time equivalent associates (measured at December 31, 2017)2023) located in the states of Alabama (includes the Georgia Loan Production Office (LPO), which are collectively referred to herein as Trustmark's Alabama market region), Florida (primarily in the northwest or “Panhandle” region of that state, which is referred to herein as Trustmark’s Florida market), Mississippi, Tennessee (in the Memphis and the Northern Mississippi regions, which are collectively referred to herein as Trustmark’s
3
Tennessee market), and Texas (primarily in Houston, which is referred to herein as Trustmark’s Texas market). The principal products produced and services rendered by TNB and Trustmark’s other subsidiaries are as follows:
3
Commercial Banking – TNB provides a full range of commercial banking services to corporations and other business customers. Loans are provided for a variety of general corporate purposes, including financing for commercial and industrial projects, income producing commercial real estate, owner-occupied real estate and construction and land development. TNB also provides deposit services, including checking, savings and money market accounts and certificates of deposit as well as treasury management services.
Consumer Banking – TNB provides banking services to consumers, including checking, savings, and money market accounts as well as certificates of deposit and individual retirement accounts. In addition, TNB provides consumer customers with installment and real estate loans and lines of credit.
Mortgage Banking – TNB provides mortgage banking services, including construction financing, production of conventional and government insured mortgages, secondary marketing and mortgage servicing.
Insurance – TNB provides a competitive array of insurance solutions for business and individual risk management needs. Business insurance offerings include services and specialized products for medical professionals, construction, manufacturing, hospitality, real estate and group life and health plans. Individual customers are also provided life and health insurance, and personal line policies. TNB provides these services through Fisher Brown Bottrell Insurance, Inc. (FBBI), a Mississippi corporation and a wholly-owned subsidiary of TNB, which is based in Jackson, Mississippi.
Wealth Management and Trust Services – TNB offers specialized services and expertise in the areas of wealth management, trust, investment and custodial services for corporate and individual customers. These services include the administration of personal trusts and estates as well as the management of investment accounts for individuals, employee benefit plans and charitable foundations. TNB also provides corporate trust and institutional custody, securities brokerage, financial and estate planning and retirement plan services. TNB’s wealth management division is also assisted by Trustmark Investment Advisors, Inc. (TIA), a Securities and Exchange Commission (SEC)-registered investment adviser and a wholly-owned subsidiary of TNB. TIA provides customized investment management services to TNB’s Wealth Management Division, which in turns relies upon that advice to provide investment management services to TNB’s wealth management customers.
New Market Tax Credits (NMTC) – TNB provides an intermediary vehicle for the provision of loans or investments in Low-Income Communities (LICs) through its subsidiary Southern Community Capital, LLC (SCC). SCC is a Mississippi single member limited liability company, a certified Community Development Entity (CDE) and a wholly-owned subsidiary of TNB. The primary mission of SCC is to provide investment capital for LICs, as defined by Section 45D of the Internal Revenue Code, or for Low-Income Persons (LIPs). As a certified CDE, SCC is able to apply to the Community Development Financial Institutions Fund (CDFI Fund) to receive NMTC allocations to offer investors in exchange for equity investments in qualified projects.
Capital Trust
Trustmark Preferred Capital Trust I (the Trust) is a Delaware trust affiliate and a wholly-owned subsidiary of Trustmark formed in 2006 to facilitate a private placement of $60.0 million in trust preferred securities. As defined in applicable accounting standards, the Trust is considered a variable interest entity for which Trustmark is not the primary beneficiary. Accordingly, the accounts of the Trust are not included in Trustmark’s consolidated financial statements.
Strategy
Trustmark seeks to be a premier diversified financial services company in its markets, providing a broad range of banking, wealth management and insurance solutions to its customers. Trustmark’s products and services are designed to strengthen and expand customer relationships and enhance the organization’s competitive advantages in its markets as well as to provide cross-selling opportunities that will enable Trustmark to continue to diversify its revenue and earnings streams.
4
The following table sets forth summary data regarding Trustmark’s securities, loans, assets, deposits, equity and revenue over the past fivethree years ($ in thousands):
December 31, |
| 2017 |
|
| 2016 |
|
| 2015 |
|
| 2014 |
|
| 2013 |
|
| 2023 |
|
| 2022 |
|
| 2021 |
| ||||||||
Securities |
| $ | 3,295,121 |
|
| $ | 3,515,325 |
|
| $ | 3,533,240 |
|
| $ | 3,545,252 |
|
| $ | 3,362,882 |
|
| $ | 3,189,157 |
|
| $ | 3,518,596 |
|
| $ | 3,581,414 |
|
Total securities growth (decline) |
| $ | (220,204 | ) |
| $ | (17,915 | ) |
| $ | (12,012 | ) |
| $ | 182,370 |
|
| $ | 662,949 |
|
| $ | (329,439 | ) |
| $ | (62,818 | ) |
| $ | 1,051,527 |
|
Total securities growth (decline) |
|
| -6.26 | % |
|
| -0.51 | % |
|
| -0.34 | % |
|
| 5.42 | % |
|
| 24.55 | % |
|
| -9.4 | % |
|
| -1.8 | % |
|
| 41.6 | % |
|
|
|
|
|
|
|
|
|
|
|
|
|
|
|
|
|
|
|
|
|
|
|
|
|
|
|
|
|
| |||
Loans * |
| $ | 8,831,484 |
|
| $ | 8,123,460 |
|
| $ | 7,481,796 |
|
| $ | 6,998,878 |
|
| $ | 6,603,087 |
| ||||||||||||
Loans held for investment (LHFI) |
| $ | 12,950,524 |
|
| $ | 12,204,039 |
|
| $ | 10,247,829 |
| ||||||||||||||||||||
Total loans growth (decline) |
| $ | 708,024 |
|
| $ | 641,664 |
|
| $ | 482,918 |
|
| $ | 395,791 |
|
| $ | 876,769 |
|
| $ | 746,485 |
|
| $ | 1,956,210 |
|
| $ | 423,305 |
|
Total loans growth (decline) |
|
| 8.72 | % |
|
| 8.58 | % |
|
| 6.90 | % |
|
| 5.99 | % |
|
| 15.31 | % |
|
| 6.1 | % |
|
| 19.1 | % |
|
| 4.3 | % |
|
|
|
|
|
|
|
|
|
|
|
|
|
|
|
|
|
|
|
|
|
|
|
|
|
|
|
|
|
| |||
Assets |
| $ | 13,797,953 |
|
| $ | 13,352,333 |
|
| $ | 12,678,896 |
|
| $ | 12,250,633 |
|
| $ | 11,790,383 |
|
| $ | 18,722,189 |
|
| $ | 18,015,478 |
|
| $ | 17,595,636 |
|
Total assets growth (decline) |
| $ | 445,620 |
|
| $ | 673,437 |
|
| $ | 428,263 |
|
| $ | 460,250 |
|
| $ | 1,961,716 |
|
| $ | 706,711 |
|
| $ | 419,842 |
|
| $ | 1,043,796 |
|
Total assets growth (decline) |
|
| 3.34 | % |
|
| 5.31 | % |
|
| 3.50 | % |
|
| 3.90 | % |
|
| 19.96 | % |
|
| 3.9 | % |
|
| 2.4 | % |
|
| 6.3 | % |
|
|
|
|
|
|
|
|
|
|
|
|
|
|
|
|
|
|
|
|
|
|
|
|
|
|
|
|
|
| |||
Deposits |
| $ | 10,577,512 |
|
| $ | 10,056,012 |
|
| $ | 9,588,230 |
|
| $ | 9,698,358 |
|
| $ | 9,859,902 |
|
| $ | 15,569,763 |
|
| $ | 14,437,648 |
|
| $ | 15,087,160 |
|
Total deposits growth (decline) |
| $ | 521,500 |
|
| $ | 467,782 |
|
| $ | (110,128 | ) |
| $ | (161,544 | ) |
| $ | 1,963,385 |
|
| $ | 1,132,115 |
|
| $ | (649,512 | ) |
| $ | 1,038,396 |
|
Total deposits growth (decline) |
|
| 5.19 | % |
|
| 4.88 | % |
|
| -1.14 | % |
|
| -1.64 | % |
|
| 24.86 | % |
|
| 7.8 | % |
|
| -4.3 | % |
|
| 7.4 | % |
|
|
|
|
|
|
|
|
|
|
|
|
|
|
|
|
|
|
|
|
|
|
|
|
|
|
|
|
|
| |||
Equity |
| $ | 1,571,701 |
|
| $ | 1,520,208 |
|
| $ | 1,473,057 |
|
| $ | 1,419,940 |
|
| $ | 1,354,953 |
|
| $ | 1,661,847 |
|
| $ | 1,492,268 |
|
| $ | 1,741,311 |
|
Total equity growth (decline) |
| $ | 51,493 |
|
| $ | 47,151 |
|
| $ | 53,117 |
|
| $ | 64,987 |
|
| $ | 67,584 |
|
| $ | 169,579 |
|
| $ | (249,043 | ) |
| $ | 194 |
|
Total equity growth (decline) |
|
| 3.39 | % |
|
| 3.20 | % |
|
| 3.74 | % |
|
| 4.80 | % |
|
| 5.25 | % |
|
| 11.4 | % |
|
| -14.3 | % |
|
| — |
|
|
|
|
|
|
|
|
|
|
|
|
|
|
|
|
|
|
|
|
|
|
|
|
|
|
|
|
|
|
| |||
Years Ended December 31, |
|
|
|
|
|
|
|
|
|
|
|
|
|
|
|
|
|
|
|
|
|
|
|
|
|
|
|
|
| |||
Revenue ** |
| $ | 592,213 |
|
| $ | 561,476 |
|
| $ | 564,914 |
|
| $ | 578,478 |
|
| $ | 562,346 |
| ||||||||||||
Revenue * |
| $ | 759,836 |
|
| $ | 699,852 |
|
| $ | 640,261 |
| ||||||||||||||||||||
Total revenue growth (decline) |
| $ | 30,737 |
|
| $ | (3,438 | ) |
| $ | (13,564 | ) |
| $ | 16,132 |
|
| $ | 46,167 |
|
| $ | 59,984 |
|
| $ | 59,591 |
|
| $ | (60,869 | ) |
Total revenue growth (decline) |
|
| 5.47 | % |
|
| -0.61 | % |
|
| -2.34 | % |
|
| 2.87 | % |
|
| 8.94 | % |
|
| 8.6 | % |
|
| 9.3 | % |
|
| -8.7 | % |
* Consistent with Trustmark’s audited financial statements, revenue is defined as net interest income plus noninterest income.
|
|
|
|
For additional information regarding the general development of Trustmark’s business, see Part II. Item 6. – Selected Financial Data and Item 7. – Management’s Discussion and Analysis of Financial Condition and Results of Operations of this report.
Geographic Information
The following table shows Trustmark’s percentage of loans, deposits and revenue for each of the geographic regions in which it operates as of and for the year ended December 31, 2017 ($ in thousands):
|
| Loans (1) |
|
| Deposits |
|
| Revenue (2) |
| |||||||||||||||
|
| Amount |
|
| % |
|
| Amount |
|
| % |
|
| Amount |
|
| % |
| ||||||
Alabama |
| $ | 1,537,692 |
|
|
| 17.4 | % |
| $ | 1,607,510 |
|
|
| 15.2 | % |
| $ | 79,736 |
|
|
| 13.5 | % |
Florida |
|
| 397,762 |
|
|
| 4.5 | % |
|
| 669,995 |
|
|
| 6.3 | % |
|
| 39,387 |
|
|
| 6.6 | % |
Mississippi |
|
| 4,749,860 |
|
|
| 53.8 | % |
|
| 6,349,275 |
|
|
| 60.0 | % |
|
| 379,367 |
|
|
| 64.1 | % |
Tennessee |
|
| 740,753 |
|
|
| 8.4 | % |
|
| 1,480,854 |
|
|
| 14.0 | % |
|
| 46,686 |
|
|
| 7.9 | % |
Texas |
|
| 1,405,417 |
|
|
| 15.9 | % |
|
| 469,878 |
|
|
| 4.5 | % |
|
| 47,037 |
|
|
| 7.9 | % |
Total |
| $ | 8,831,484 |
|
|
| 100.0 | % |
| $ | 10,577,512 |
|
|
| 100.0 | % |
| $ | 592,213 |
|
|
| 100.0 | % |
|
|
|
|
5
For the year ended December 31, 2017, Trustmark operated through three operating segments: General Banking Division, Insurance Division and Wealth Management Division. The table below presents a summary of segment financial data for each segment for the last three years ($ in thousands):
|
| Years Ended December 31, |
| |||||||||
|
| 2017 |
|
| 2016 |
|
| 2015 |
| |||
General Banking |
|
|
|
|
|
|
|
|
|
|
|
|
Net interest income |
| $ | 406,406 |
|
| $ | 386,596 |
|
| $ | 391,092 |
|
Provision for loan losses, net |
|
| 7,699 |
|
|
| 14,714 |
|
|
| 11,800 |
|
Noninterest income |
|
| 116,180 |
|
|
| 107,059 |
|
|
| 105,477 |
|
Net income |
|
| 97,706 |
|
|
| 99,083 |
|
|
| 106,738 |
|
Total assets |
|
| 13,724,193 |
|
|
| 13,278,668 |
|
|
| 12,604,112 |
|
|
|
|
|
|
|
|
|
|
|
|
|
|
Wealth Management |
|
|
|
|
|
|
|
|
|
|
|
|
Net interest income |
| $ | 910 |
|
| $ | 726 |
|
| $ | 337 |
|
Noninterest income |
|
| 30,285 |
|
|
| 30,117 |
|
|
| 31,245 |
|
Net income |
|
| 2,244 |
|
|
| 4,124 |
|
|
| 3,850 |
|
Total assets |
|
| 5,592 |
|
|
| 7,501 |
|
|
| 7,471 |
|
|
|
|
|
|
|
|
|
|
|
|
|
|
Insurance |
|
|
|
|
|
|
|
|
|
|
|
|
Net interest income |
| $ | 234 |
|
| $ | 211 |
|
| $ | 336 |
|
Noninterest income |
|
| 38,198 |
|
|
| 36,767 |
|
|
| 36,427 |
|
Net income |
|
| 5,680 |
|
|
| 5,204 |
|
|
| 5,450 |
|
Total assets |
|
| 68,168 |
|
|
| 66,164 |
|
|
| 67,313 |
|
For more information on Trustmark’s operating segments, please see the section captioned “Results of Segment Operations” in Part II. Item 7. - Management’s Discussion and Analysis of Financial Condition and Results of Operations and Note 20 - Segment Information included in Part II. Item 8. - Financial Statements and Supplementary Data of this report.
Overview of Lending Business
Trustmark categorizes loans on its balance sheet into threetwo categories. These categories are described in more detail in Note 1 – Significant Accounting Policies included in Part II. Item 8. - Financial Statements and Supplementary Data of this report.
Loans Held for Investment (LHFI) – Loans originally underwritten by Trustmark that do not constitute loans held for sale or acquired loans.
Loans Held for Sale (LHFS) – Mortgage loans purchased from wholesale customers or originated in Trustmark’s General Banking Division,Segment, other than mortgage loans that are retained in the LHFI portfolio based on banking relationships or certain investment strategies.
Acquired Loans – Loans acquired by Trustmark, either pursuant to the acquisition of another bank or pursuant to an acquisition of some or all of another bank’s loan portfolio as well as loans acquired by Trustmark in a Federal Deposit Insurance Corporation (FDIC)-assisted transaction and that are covered under a loss-share agreement with the FDIC.
The following discussion briefly summarizes Trustmark’s lending business by focusing on LHFI and LHFS and includes a discussion of the risks inherent in these loans, Trustmark’s underwriting policies for its loans and the characteristics of the real estate loan component of these loans. Acquired loans and covered loans are excluded from this summary, as Trustmark did not underwrite those loans at inception. Discussion of Trustmark’s acquired loans, including covered loans, is contained elsewhere in this report.
As a general matter, extending credit to businesses and consumers exposes Trustmark to credit risk, which is the risk that the principal balance and any related interest may not be collected according to the original terms due to the inability or unwillingness of the borrower to repay the loan. Trustmark mitigates credit risk through a set of internal controls, which includes adherence to conservative lending practices and underwriting guidelines, collateral monitoring, and oversight of its borrower’s financial performance and collateral. The risks inherent in specific subsets of lending are discussed below.
LHFI Secured by Construction, Land Development, and Other Land – Construction and land development loans include loans for both commercial and residential properties to builders/developers, other commercial borrowers and to consumers. This category also includes loans secured by vacant land, except land known to be used or usable for agricultural purposes, such as crop and livestock production. Repayment is normally derived from the sale of the underlying property or from permanent financing, which refinances Trustmark’s
5
initial loan. Trustmark’s
6
engagement in this type of lending is generally extended to those builders and developers exhibiting the highest credit quality with significant equity invested in the project and is primarily restricted to projects within itsTrustmark’s geographic markets. The underwriting process for these loans includes analysis of the financial position and strength of both the borrower and guarantor, experience with similar projects in the past, market demand and prospects for successful completion of the proposed project within the established budget and schedule, values of underlying collateral and availability of permanent financing. Risk within this portfolio is mitigated through adherence to policies and lending limits, periodic target credit reviews of the different segments of this portfolio, inspection of projects throughout the life of the loan and routine monitoring of financial information and collateral values as they are updated.
Inherent in real estate construction lending is the risk that the full value of the collateral does not exist at the time the loan is granted. Construction lending also inherently includes the risk associated with a borrower’s ability to successfully complete a proposed project on time and within budget. Further, adverse changes in the market occurring between the start of construction and completion of the projects can result in slower sales or rental rates and lower sales prices than originally anticipated which could impact the underlying real estate collateral values and timely and full repayment of these loans. Rising interest rates can adversely affect the cost of construction and the financial viability of real estate projects. Higher interest rates may also result in higher capitalization rates, thereby reducing a property’s value. As a result of this risk profile, LHFI secured by construction, land development and other land are considered to be higher risks than other real estate loans.
LHFI and LHFS Secured by Residential Properties – Residential real estate loans consist of first and junior liens on residential properties that are extended in the geographic markets in which Trustmark operates as well as mortgage products, originated and purchased, that are underwritten to secondary market standards. Credit underwriting standards include evaluation of the borrower’s credit history and repayment capacity, including verification of income and valuation of collateral. Portfolio performance is continuously evaluated through updated credit bureau scores and monitoring of repayment performance.
Credit performance of consumer residential real estate loans is highly dependent on housing values and household income which, in turn are highly dependent on national, regional and local economic factors. Rising interest rates, rising unemployment rates and other adverse changes in these economies may have a negative effect on the ability of Trustmark’s borrowers to repay these loans and negatively affect value of the underlying residential real estate collateral.
LHFI Secured by Nonfarm, Nonresidential Properties (NFNR LHFI) – Trustmark provides financing for both owner-occupied commercial real estate as well as income-producing commercial real estate. Trustmark seeks to maintain a balance of owner-occupied and income-producing real estate loans that moderates its risk to the specific risks of each type of loan. Commercial real estate term loans are typically collateralized by liens on real property. Both types of commercial real estate loans are underwritten to lending policies that include maximum loan-to-value ratios, minimum equity requirements, acceptable amortization periods and minimum debt service coverage requirements, based on property type. Income-producing commercial real estate loans also generally require substantial equity and are subject to exposure limits for a single project. All exceptions to established guidelines are subject to stringent internal review and require specific approval. As with commercial loans, the borrower’s financial strength and capacity to repay their obligations remain the primary focus of underwriting. Financial strength is evaluated based upon analytical tools that consider historical and projected cash flows and performance in addition to analysis of the proposed project for income-producing properties. Additional support offered by guarantors is also considered.
Risk for owner-occupied commercial real estate is driven by the creditworthiness of the underlying borrowers, particularly cash flow from the borrowers’ business operations as well as the risk of a shortfall in collateral. Credit performance of loans secured by commercial income-producing real estate can be negatively affected by national, regional and local economic conditions, which may result in deteriorating tenant credit profiles, tenant losses, reduced rental/lease rates and higher than anticipated vacancy rates, all contributing to declines in value or liquidity of the underlying real estate collateral. Other factors, such as increasing interest rates, may result in higher capitalization rates, thereby reducing a property’s value.
Commercial and Industrial LHFI – Commercial loans (other than commercial loans related to real estate assets, which are summarized above) are made to many types of businesses for various purposes, such as short-term working capital loans that are usually secured by accounts receivable and inventory, equipment and fixed asset purchases that are secured by those assets and term financing for those within Trustmark’s geographic markets. Trustmark’s credit underwriting process for commercial loans includes analysis of historical and projected cash flows and performance, evaluation of financial strength of both borrowers and guarantors as reflected in current and detailed financial information and evaluation of underlying collateral to support the credit. Credit risk within the commercial loan portfolio is managed through adherence to specific commercial lending policies and internally established lending authorities, diversification within the portfolio and monitoring of the portfolio on a continuing basis.
Credit risk in commercial and industrial loans can arise due to fluctuations in borrowers’ financial condition, deterioration in collateral values and changes in market conditions. The credit risk inherent in these loans depends on, to a significant degree, the general economic
6
conditions of these areas. Further, credit risk can increase if Trustmark’s loans are concentrated to borrowers engaged in the
7
same or similar activities, or to groups of borrowers who may be uniquely or disproportionately affected by market or economic conditions.
Consumer LHFI – Consumer credit includes loans to individuals for household and personal items, automobile purchases, unsecured loans, personal lines of credit and credit cards. All consumer loans are subject to a standardized underwriting process through Trustmark’s consumer loan center, which uses a custom credit scoring model with emphasis placed upon the borrower’s credit evaluation and historical performance, income evaluation and valuation of collateral (where applicable). Updated credit bureau scores are obtained on all existing consumer loans/lines on a periodic basis in order to monitor portfolio credit quality changes and mitigate risk.
Similar to residential real estate loan portfolios, an inherent risk factor in consumer loans is that they are dependent on national, regional and local economic factors that affect employment in the markets where these loans are originated. Generally, consumer loan portfolios consist of a large number of relatively small-balance loans, some of which are originated as unsecured credit (credit cards and some personal lines of credit), and as such, do not have collateral as a secondary source of repayment. Consumer loans generally pose heightened risks of collectability and loss when compared to other loan types.
Other LHFI – Other loans primarily consist of loans to non-depository financial institutions, such as mortgage companies, finance companies and other financial intermediaries, loans to state and political subdivisions, and loans to non-profit and charitable organizations. These loans are underwritten based on the specific nature or purpose of the loan and underlying collateral with special consideration given to the specific source of repayment for the loan.
Similar to commercial and industrial loans, inherent risk in other loans can arise due to fluctuations in borrowers’ financial condition, deterioration in collateral values and changes in market and economic conditions. Loans to state and political subdivisions have the added inherent risk of being somewhat dependent on the ability and capacity of those entities to generate tax and other revenue to repay the loans. Loans to non-profit and charitable organizations are dependent on those organizations’ ability to generate revenue through their fundraising efforts and other forms of financial support, which can be susceptible to economic downturns.
Recent Economic and Industry Developments
The economy continued to show moderate signs of improvement in 2017;Economic activity improved slightly during 2023; however, economic concerns remain as a result of the cumulative weight of volatility in crude oil prices and uncertain growth prospects in Russia and other emerging markets, combined with uncertainty regarding the potential economic impact of further tightening ofgeopolitical developments, such as the monetary policy byconflicts in Ukraine and the Board of Governors of the Federal Reserve System (FRB),Middle East, inflation, the consequences of bank failures in the decisionfirst half of 2023 and other economic and industry volatility, the 2024 political cycle in the United Kingdom to exit the European Union,States, supply chain issues, higher energy prices and the potential impact on the economy of the current presidential administration’s policies.broader price pressures. Doubts surrounding the near-term direction of global markets and the potential impact of these trends on the United States economy are expected to persist for the near term. While Trustmark’sTrustmark's customer base is wholly domestic, international economic conditions affect domestic economic conditions, and thus may have an impact upon Trustmark’sTrustmark's financial condition or results of operations.
Market interest rates began to rise during 2022 after an extended period at historical lows. Starting in March 2022, the FRB began raising the target federal funds rate for the first time in three years and continued with multiple increases throughout 2022 and 2023, up to a range of 5.25% to 5.50% as of December 2023. In addition, the FRB increased the interest that it pays on reserves multiple times during 2022 and 2023 from 0.10% to 5.40% as of December 2023. As interest rates have increased, so have competitive pressures on the deposit cost of funds. This has been exacerbated by bank failures and the resulting heightened competition for deposits, which has also affected the interest that Trustmark pays on deposits. It is not possible to predict the pace and magnitude of changes in interest rates, or the impact rate changes will have on Trustmark's results of operations.
In the January 20182024 “Summary of Commentary on Current Economic Conditions by Federal Reserve Districts,District,” the twelve Federal Reserve Districts’ reports suggested nationalthat economic activity continued to expand at a modest to moderate pace during the reporting period.period (covering the period from November 18, 2023 through January 8, 2024) was mixed across Districts, with three Districts reporting modest increases in overall activity, eight Districts reporting little or no change and one District reporting a moderate decline. Reports by the twelve Federal Reserve Districts noted modest growththe following during the reporting period:
7
Reports by the near term. The Federal Reserve’s Sixth District, Atlanta (which includes Trustmark’s Alabama, Florida and Mississippi market regions), reported that economic activity expanded at a modest pace with optimistic outlooks for steady growth in the near-term, labor markets remained tight and wage growth was stable, holiday retail sales exceeded expectations and increased demand in commercial construction. The Federal Reserve’s Sixth District also reported that residential real estate activity increased modestly and commercial real estate demand continued to improve, but cautioned that the rate of improvement varied by metropolitan area, submarket, and property type. The Federal Reserve’s Sixth District noted increased business activity in manufacturing and that credit remained readily available for qualified borrowers. The Federal Reserve’s Eighth District, St. Louis (which includes Trustmark’s Tennessee market region), and Eleventh District, Dallas (which includes Trustmark’s Texas market region), noted similar findings for the reporting period as those discussed above. The Federal Reserve’s Sixth District also noted lending increased during the reporting period, especially for multifamily and home equity loans; however, consumer lending contracted overall, alongside a rise in delinquencies in credit cards, auto loans and unsecured personal loans. The Federal Reserve's Sixth District reported that economic conditions improved at a modest pace, labor markets remained tight with moderate growthdemand and large time deposit balances continued to increase as financial institutions paid higher interest rates on deposits; however, these higher funding costs have led to earnings concerns resulting in wages, improvements in consumer spending, modest improvements in residential real estate conditions, slight improvements in commercial constructionsome banks restructuring securities portfolios and continued growth in the banking sectors.reinvesting proceeds into higher-yielding securities to protect margins. The Federal Reserve’s Eighth District also reported that loan growth which had slowed gradually sinceat a modest pace during the start of 2017, levelled off at year-endreporting period, but banking conditions and noted that lending activity improved moderately with positive loan growth across all categories other than open-ended home equity loans.remained healthy. The Federal Reserve’s EleventhEighth District Dallas (which includes Trustmark’s Texas market region),also noted that commercial and industrial loan growth decreased slightly despite an increase in overall loan volume, demand for loans continues to be lower than the prior year and an ongoing modest decline in real estate loan growth. The Federal Reserve’s Eighth District also reported economic activity expanded at a robust pace at year-end and acceleratedthat total deposit growth acrossincreased modestly although faster than the manufacturing, retail, nonfinancial services and energy sectors.national rate. The Federal Reserve’s Eleventh District also reported increasedloan volumes stabilized during the reporting period and the pace of credit tightening decelerated, loan demand forcontinued to decline, though at a slower pace, loan nonperformance continued to rise, still largely driven by consumer loans, and loan pricing and a tightening in credit standards and terms and
8
noted that overall loan volumes increasedcontinued to increase but at a faster pace.slower rate. The Federal Reserve’s Eleventh District also noted that home sales were returningbankers reported increased core deposit volumes and although banking outlooks remain pessimistic and future business activity and loan demand are expected to a normal pace after Hurricane Harvey. decline, the rate of decline is anticipated to be milder than prior expectations.
The Federal Reserve’s Eleventh District also reported drilling activity increased, well completions continued to grow, demand for oil field services remained steady and outlooks for 2018 improved.
During June 2017, the FRB increased the target range for the federal funds rate for the third consecutive quarter. In December 2017, the FRB further increased rates and commenced reducing the size of its balance sheet. In December 2017, the FRB predicted an additional threerising interest rate hikesenvironment during 2022 and 2023, the resulting industry-wide reduction in 2018. It is not possible to predict the impact, if any, on market interest ratesfair value of efforts by the FRB to reduce the size of its balance sheet. The extended period of low interest rates continues to place pressure on net interest margins for Trustmark (as well as its competitors); however, interest rates have increased during 2017securities portfolios and the FRB has indicatedbank runs that it intendsled to continuethe failures of some financial institutions in March 2023, among other events, have resulted in a current state of volatility and uncertainty with respect to raise rates in 2018. Any increases in interest rates will place competitive pressures on the health of the United States banking system. There is heightened awareness around liquidity, uninsured deposits, deposit cost of funds. It is not possible to predict the pacecomposition, unrecognized investment losses and magnitude of rising interest rates, or the impact rising rates will have on Trustmark’s results of operations.capital.
For additional discussion of the impact of the current economic environment on the financial condition and results of operations of Trustmark and its subsidiaries, see Part II. Item 7. – Management’s Discussion and Analysis of Financial Condition and Results of Operations of this report.
Competition
There is significant competition within the banking and financial services industry in the markets in which Trustmark operates. Changes in regulation, technology and product delivery systems have resulted in an increasingly competitive environment. Trustmark expects to continue to face increasing competition from online and traditional financial institutions seeking to attract customers by providing access to similar services and products.
Trustmark and its subsidiaries compete with national and state charteredstate-chartered banking institutions of comparable or larger size and resources and with smaller community banking organizations. Trustmark has numerous local, regional and national nonbank competitors, including savings and loan associations, credit unions, mortgage companies, insurance companies, finance companies, financial service operations of major retailers, investment brokerage and financial advisory firms and mutual fund companies. Because nonbank financial institutions are not subject to the same regulatory restrictions as banks and bank holding companies, they can often operate with greater flexibility and lower cost structures. Currently, Trustmark does not face meaningful competition from international banks in its markets, although that could change in the future.
At June 30, 2017,2023, Trustmark’s deposit market share ranked within the top three positions in 58%56.0% of the 55 counties served and within the top five positions in 73%69.0% of the counties served. The following table below presents FDICFederal Deposit Insurance Corporation (FDIC) deposit data regarding TNB’s deposit market share by state as of June 30, 2017.2023. The FDIC deposit market share data presented below does not align with Trustmark’s reported geographic market regions, which in some instances cross state lines, and Trustmark’s
8
geographic coverage within certain states presented below is not statewide (see the sectionssection captioned “Description of Business” and “Geographic Information” above).
State | DepositMarket Share | |||
Alabama |
| 1.80 | % | |
Florida |
| 0.17 | % | |
Mississippi |
| 12.87 | % | |
Tennessee |
| 0.33 | % | |
Texas |
| 0.04 | % | |
Services provided by the Wealth Management DivisionSegment face competition from many national, regional and local financial institutions. Companies that offer broad services similar to those provided by Trustmark, such as other banks, trust companies and full servicefull-service brokerage firms, as well as companies that specialize in particular services offered by Trustmark, such as investment advisors and mutual fund providers, all compete with Trustmark’s Wealth Management Division.Segment.
Trustmark’s insurance subsidiary faces competition from local, regional and national insurance companies, independent insurance agencies as well as from other financial institutions offering insurance products.
Trustmark’s ability to compete effectively is a result of providing customers with desired products and services in a convenient and cost effectivecost-effective manner. Customers for commercial, consumer and mortgage banking as well as wealth management and insurance services are influenced by convenience, quality of service, personal contacts, availability of products and services and competitive pricing. Trustmark continually reviews its products, locations, alternative delivery channels, and pricing strategies to maintain and enhance its competitive position. While Trustmark’s position varies by market, Management believes it can compete effectively as a result of the quality of Trustmark’s products and services, local market knowledge and awareness of customer needs.
9
The following discussion sets forth material elements of the regulatory framework applicable to bank holding companies and their subsidiaries and provides specific information relevant to Trustmark. The discussion is a summary of detailed statutes, regulations and policies. The descriptions are not intended to be complete summaries of the statutes, regulations and policies referenced therein. Such statutes, regulations and policies are continually under the review of the United States Congress and state legislatures as well as federal and state regulatory agencies. A change in statutes, regulations or policies could have a material impact on the business of Trustmark and its subsidiaries.
Regulation of Trustmark
Trustmark is a registered bank holding company under the Bank Holding Company Act of 1956 (BHC Act). Trustmark and its nonbank subsidiaries are therefore subject to the supervision, examination, enforcement and reporting requirements of the BHC Act, the Federal Deposit Insurance Act (FDI Act), the regulations of the FRB and certain of the requirements imposed by the Dodd-Frank Wall Street Reform and Consumer Protection Act (Dodd-Frank Act), as amended by the Economic Growth, Regulatory Relief and Consumer Protection Act (EGRRCPA).
Federal Oversight Over Mergers and Acquisitions, Investments and Branching
The BHC Act requires every bank holding company to obtain the prior approval of the FRB before: (i) it may acquire direct or indirect ownership or control of any voting shares of any bank if, after such acquisition, the bank holding company will directly or indirectly own or control 5.0% or more of the voting shares of the bank; (ii) it or any of its subsidiaries, other than a bank, may acquire all or substantially all of the assets of any bank; or (iii) it may merge or consolidate with any other bank holding company. The BHC Act further provides thatrequires the FRB may not approve any such transaction that would result in a monopoly or would be in furtherance of any combination or conspiracy to monopolize or attempt to monopolizeconsider the business of banking in any sectioncompetitive impact of the United States, or the effect of which may be substantially to lessen competition or to tend to create a monopoly in any section of the country, or that in any other manner would be in restraint of trade, unless the anticompetitive effects of the proposed transaction, are clearly outweighed by the public interest in meeting the convenience and needs of the community to be served. The FRB is also required to consider the financial and managerial resources and future prospects of the bank holding companies and banks concerned and the convenience and needs of the community to be served.served, including the applicant’s record of performance under the Community Reinvestment Act (CRA). The FRB is also required to take into account in evaluating such a transaction the effectiveness of the parties in combattingcombating money laundering activities. Consideration of financial resources generally focuses on capital adequacy, and consideration of convenience and needs issues includes the parties’ performance under the Community Reinvestment Act of 1977 (CRA). Provisions of the FDI Act known as the Bank Merger Act impose similar approval standards for an insured depository institution to merge with another insured depository institution.
The BHC Act, as amended by the interstate banking provisions of the Riegle-Neal Interstate Banking and Branching Efficiency Act of 1994 (Riegle-Neal Act), permits a bank holding company, such as Trustmark, to acquire a bank located in any other state, regardless of state law to the contrary, subject to certain deposit-percentage, aging requirements, and other restrictions, if the company is
9
well-capitalized. The Riegle-Neal Act also generally permits national and state-chartered banks to branch interstate through acquisitions of banks in other states, if the resulting institution would be well-capitalized and well-managed.
In addition, the Office of the Comptroller of the Currency (OCC) has the authority to approve applications by national banks to establish de novo branches, including, under the Riegle-Neal Act, in states other than the bank’s home state if the law of the state in which the branch is located, or is to be located, would permit establishment of the branch if the bank were a state bank chartered by such state.
The BHC Act also generally requires FRB approval for a bank holding company’s acquisition of a company that is not an insured depository institution. Bank holding companies generally may engage, directly or indirectly, only in banking and such other activities as are determined by the FRB to be closely related to banking. The FRB must generally consider whether performance of the activity byAdditionally, a bank holding company can reasonably be expected to produce benefits to the public, such as greater convenience, increased competition, or gains in efficiency, that outweigh possible adverse effects, such as undue concentration of resources, decreased or unfair competition, conflicts of interest, or unsound banking practices. The FRB has express statutory authority to also consider the “risk to the stability of the United States banking or financial system” when reviewing the acquisition of such a company by a bank holding company.
The BHC Act, as amended by the interstate banking provisions of the Riegle-Neal Interstate Banking and Branching Efficiency Act of 1994 (Riegle-Neal Act), permits Trustmark to acquire a bank located in any other state, regardless of state law to the contrary, subject to certain deposit-percentage, aging requirements, and other restrictions. The Riegle-Neal Act also generally permits national and state-chartered banks to branch interstate through acquisitions of banks in other states. Bank holding companies must be well-capitalized and well-managed to obtain federal bank regulatory approval of an interstate acquisition without regard to state law prohibiting the transaction.
Under provisionsprovision of the BHC Act referred toknown as the “VolckerVolcker Rule” limitations are placed places limits on the ability of insured depository institutions, insured depository institution holding companiesTrustmark and their affiliates (“Banking Entities”)TNB to acquire or retain ownership interests in, or act as sponsor to, certain investment funds, including hedge funds and private equity funds. The Volcker Rule also places restrictions onfunds, or to engage in proprietary trading by(i.e., engaging as principal in any purchase or sale of one or more financial instruments for a Banking Entity.trading account).
The Office of the Comptroller of the Currency (OCC) has the authority to approve applications by national banks to establish de novo branches, including, under the Riegle-Neal Act, in states other than the bank’s home state if the law of the State in which the branch is located, or is to be located, would permit establishment of the branch if the bank were a State bank chartered by such State.
10
Certain acquisitions of Trustmark’s voting stock may be subject to regulatory approval or notice under federal law. Investors are responsible for ensuring that they do not, directly or indirectly, acquire shares of Trustmark’s stock in excess of the amount that can be acquired without regulatory approval underUnder the Change in Bank Control Act and the BHC Act, which prohibit anya person or company from acquiringthat directly or indirectly acquires control of Trustmark without, in most cases,a bank holding company or bank must obtain the prior writtennon-objection or approval of the FRB.institution’s appropriate federal banking agency in advance of the acquisition. For a publicly-traded bank holding company such as Trustmark, control for purposes of the Change in Bank Control Act is presumed to exist if the acquirer will have 10% or more of any class of the company’s voting securities.
Source of Strength
Under the FDI Act, Trustmark is expected to act as a source of financial and managerial strength to TNB. Under this policy, a bank holding company is expected to commit resources to support its bank subsidiary, including at times when the holding company may not be inclined or in a financial position to provide it.
Capital Adequacy
Bank holding companies and banks are subject to various regulatory capital requirements administered by state and federal bank regulatory agencies. Capital adequacy regulations and, additionally for banks, prompt corrective action regulations involve quantitative measures of assets, liabilities, and certain off-balance sheet items calculated under regulatory accounting practices. Capital amounts and classifications are also subject to qualitative judgments by regulators about components, risk weighting and other factors. United States capital regulations were substantially revised in 2013 as a result of changes in the Dodd-Frank Act and the Basel Committee on Banking Supervision’s December 2010 final capital framework, referred to as “Basel III.” The FRB and the OCC, the primary regulators of Trustmark and TNB, respectively, have established substantially similar minimum risk-based capital ratio and leverage ratio requirements.requirements for bank holding companies and banks.
Under capital requirements applicable to Trustmark and TNB, as of January 1, 2015, Trustmark and TNB are required to meet a common equity Tier 1 capital to risk-weighted assets ratio of at least 7.0% (a minimum of 4.5% plus a capital conservation buffer of 2.5%, which will be fully phased in by January 1, 2019)), a Tier 1 capital to risk-weighted assets ratio of at least 8.5% (a minimum of 6.0% plus a phased-in capital conservation buffer of 2.5%), a total capital to risk-weighted assets ratio of at least 10.5% (a minimum of 8%8.0% plus a phased-in capital conservation buffer of 2.5%), and a leverage ratio of Tier 1 capital to total consolidated assets of at least 4.0%. In addition, for an insured depository institution to be “well-capitalized” under the banking agencies’ prompt corrective action framework, it must have a common equity Tier 1 capital ratio of 6.5%, Tier 1 capital ratio of 8.0%, a total capital ratio of 10.0%, and a leverage ratio of 5.0%, and must not be subject to any written agreement, order or capital directive, or prompt corrective action directive issued by its primary federal regulator to meet and maintain a specific capital level for any capital measure.
For purposes of calculating the denominator of the risk-based capital ratios, a banking institution’s assets and some of its specified off-balance sheet commitments and obligations are assigned to various risk categories. For purposes of calculating the numerator of the capital ratios, capital, at both the holding company and bank level, is classified in one of three tiers depending on the “quality” and loss-absorbing features of the capital instrument. Common equity Tier 1 capital is predominantly comprised of common stock instruments (including related surplus) and retained earnings, net of treasury stock, and after making necessary capital deductions and adjustments. Tier 1 capital is comprised of common equity Tier 1 capital and additional Tier 1 capital, which includes non-cumulative perpetual preferred stock and similar instruments meeting specified eligibility criteria (including related surplus) and “TARP” preferred stock and other instruments issued under the Emergency Economic Stabilization Act of 2008.. Newly issued trust preferred securities and cumulative perpetual preferred stock may not be included in Tier 1 capital. However, smallerSmaller depository institution holding companies (those with assets of less than $15 billion as of year-end 2009)2009, including Trustmark) and most mutual holding companies are generally allowed to continue to count as Tier 1 capital most outstanding trust preferred securities and other non-qualifying securities that were issued prior to May 19, 2010 (up to a limit of 25% of Tier 1 capital, excluding non-qualifying capital instruments) rather than phasing such securities out of regulatory capital. However, a smaller depository institution holding company that has $15 billion or more in assets following an acquisition of another depository institution holding company generally is no longer allowed to count outstanding non-qualifying capital instruments toward its Tier 1 capital. Trustmark currently has outstanding trust preferred securities that isare permitted to continue to count as Tier 1 capital up to the regulatory limit. Total capital is comprised of Tier 1 capital and Tier 2 capital, which includes certain subordinated debt with a minimum original maturity of five years (including related surplus) and a limited amount of allowance for loan losses. Newly issued trust preferred securities and cumulative perpetual preferred stock generally
10
may be included in Tier 2 capital, provided they do not include features that are disallowed by the capital rules, such as the acceleration of principal other than in the event of a bankruptcy, insolvency, or receivership of the issuer.
Failure to meet minimum capital requirements could subject a bank to a variety of enforcement remedies. The FDI Act identifies fiveremedies, including issuance of a capital categories for insured depository institutions: well-capitalized, adequately capitalized, undercapitalized, significantly undercapitalizeddirective, the termination of deposit insurance by the FDIC and critically undercapitalized. An insured depository institution is subject to differential regulation corresponding to the capital category within which the institution falls. The FDI Act requires banking regulators to take prompt corrective action whenever financial institutions do not meet minimum capital requirements. Failure to meet the capital guidelines could also subject an insured depository institution to capital raising requirements. In addition, an insured depository institution is generally prohibited from making capital distributions, including paying dividends, or paying management fees to a holding company, if the institution would thereafter be undercapitalized. In addition, the FDI Act requires the various regulatory agencies to prescribe certain noncapital
11
standards for safety and soundness relating generally to operations and management, asset quality and executive compensation, and permits regulatory action against an insured depository institution that does not meet such standards.
other restrictions on its business. An institution’s failure to exceed the capital conservation buffer with common equity Tier 1 capital would result in limitations on an institution’s ability to make capital distributions and discretionary bonus payments. The
In addition, the FDI Act’s “prompt corrective action” framework identifies five capital conservation buffercategories for insured depository institutions: well-capitalized, adequately capitalized, undercapitalized, significantly undercapitalized and critically undercapitalized. For an insured depository institution to be “well-capitalized,” it must have a common equity Tier 1 capital ratio of at least 6.5%, a Tier 1 capital ratio of at least 8.0%, a total capital ratio of at least 10.0% and a leverage ratio of at least 5.0%, and must not be subject to any written agreement, order or capital directive or prompt corrective action directive issued by its primary federal regulator to meet and maintain a specific capital level for any capital measure. An insured depository institution is being phased in until January 1, 2019.subject to differential regulation corresponding to the capital category within which the institution falls. For example, an insured depository institution is generally prohibited from making capital distributions, including paying dividends, or paying management fees to a holding company, if the institution would thereafter be undercapitalized.
At December 31, 2017,2023, Trustmark exceeded its minimum capital requirements with common equity Tier 1 capital, Tier 1 capital and total capital equal to 11.77%10.04%, 12.33%10.44% and 13.10%12.29% of its total risk-weighted assets, respectively. At December 31, 2017,2023, TNB also exceeded these requirements with common equity Tier 1 capital, Tier 1 capital and total capital equal to 12.16%10.58%, 12.16%10.58% and 12.93%11.61% of its total risk-weighted assets, respectively. At December 31, 2017,2023, the leverage ratios for Trustmark and TNB were 9.67%8.62% and 9.54%8.75%, respectively. As ofAt December 31, 2017, the most recent notification from the OCC categorized2023, TNB aswas well-capitalized based on the ratios and guidelines described above.
Stress Testing
Bank holding companiesIn December 2018, the federal banking agencies issued a final rule that allows institutions to elect to phase in the regulatory capital effects of the Current Expected Credit Losses (CECL) accounting standard over three years. In addition, as a result of the Coronavirus Aid, Relief, and national banksEconomic Security Act (the CARES Act) enacted on March 27, 2020 in response to the COVID-19 pandemic, the federal bank regulatory agencies issued rules that allow banking organizations that implemented CECL in 2020 to elect to mitigate the effects of the CECL accounting standard on their regulatory capital for two years. This two-year delay is in addition to the three-year transition period that the agencies had already made available. Trustmark elected to defer the regulatory capital effects of CECL in accordance with average total consolidated assets between $10 billion and $50 billion must conduct annual company-run stress tests using data asthese rules, which largely delayed the effects of the adoption of CECL on its regulatory capital through December 31, of each year under one baseline and at least two stress scenarios as provided by the FRB and the OCC, respectively. Stress test results must be provided to the FRB and OCC by July2021. The effects are being phased-in over a three-year period from January 1, 2022 through December 31, of the following year. Trustmark has been subject to annual company-run stress test requirements since September 2014.2024.
Trustmark anticipates that capital ratios, as reflected in the stress test calculations under the required stress test scenarios, will be an important factor considered by the agencies in evaluating the capital adequacy of Trustmark and TNB and whether proposed payments of dividends or stock repurchases are consistent with prudential expectations.
Payment of Dividends and Stock Repurchases
Trustmark is limited in its ability to pay dividends or repurchase its stock by the FRB, including if doing so would be an unsafe or unsound banking practice. Where a bank holding company intends to declare or pay a dividend that could raise safety and soundness concerns, it generally will be required to inform and consult withIn addition, the FRB in advance. It ishas adopted the policy of the FRB that a bank holding company should generally pay cash dividends on common stock only outto the extent that the company’s net income for the past year is sufficient to cover the cash dividends, and that the company’s rate of earnings, and only if prospective earningsearning retention is consistent with the company’s capital needs, asset quality and overall current and prospective financial condition.
According to guidance from the FRB, a bank holding company’s dividend policies will be assessed against, among other things, its ability to achieve applicable capital ratio requirements. If In addition, a bank holding company does not achieve applicable capital ratio requirements, it may not be able to pay dividends. Although Trustmark currently meets applicable capital ratio requirements, inclusive of the phased-in capital conservation buffer, Trustmark cannot be sure that it will continue to meet those requirements or that even if it does, it will be able to pay dividends.
Trustmark also is required to obtainconsult with or notify the approvalFRB prior to purchasing or redeeming its outstanding equity securities in certain circumstances, including if the gross consideration for the purchase or redemption, when aggregated with the net consideration paid by the company for all such purchases or redemptions during the preceding twelve months, is equal to 10% or more of the FRB in advance of redeeming or repurchasing its stock. In evaluating the appropriateness of a proposed redemption or repurchase of stock, the FRB will consider, among other things, the potential loss that acompany’s consolidated net worth. A bank holding company may sufferthat is well-capitalized, well-managed and not the subject of any unresolved supervisory issues is exempt from the prospective need to increase reserves and write down assets as a result of continued asset deterioration, and its ability to raise additional common equity and other capital to replace the stock that will be redeemed or repurchased. The FRB also will consider the potential negative effects on the bank holding company’s capital structure of replacing common stock with any lower-tier form of regulatory capital issued.this notice requirement.
Anti-Money Laundering (AML) Initiatives and Sanctions Compliance
Trustmark and TNB are subject to extensive laws and regulations aimed at combattingcombating money laundering and terrorist financing. Thefinancing, including the USA Patriot Act of 2001 (USA Patriot Act) substantially broadenedand the scope of United States anti-money laundering laws and regulations by imposing significant compliance and due diligence obligations, creating new crimes and penalties and expanding the extra-territorial jurisdiction of the United States. United States Department of the Treasury regulationsBank Secrecy Act. Regulations implementing the USA Patriot Actthese statutes impose obligations on financial institutions to maintain appropriate policies, procedures and controls to detect, prevent and report money laundering and terrorist financing and to verify the identity of their customers and of beneficial owners of their legal entity customers. Failure of a financial institution to maintain and implement adequate programs to combat money laundering and terrorist financing, or to comply with all of the relevant laws or regulations, could have serious legal and financial consequences for the institution. The federal Financial Crimes Enforcement Network of the Department of the Treasury, in addition to federal bank regulatory agencies, is authorized to impose significant civil money penalties for violations of these requirements, and has recently engaged in coordinated enforcement efforts with state and federal banking regulators, the U.S. Department of Justice, the Consumer Financial Protection Bureau (CFPB), the Drug Enforcement Administration and the Internal Revenue Service. Violations of AML requirements can also lead to criminal penalties. In addition, the federal banking agencies are required to consider the effectiveness of a financial institution’s AML activities when reviewing proposed bank mergers and bank holding company acquisitions.
The U.S. Department of the Treasury’s Office of Foreign Assets Control (OFAC) is responsible for helping to insureensure that U.S. entities do not engage in transactions with certain prohibited parties, as defined by various Executive Orders and Acts of Congress. OFAC publishesadministers and enforces economic and trade sanctions programs, including publishing lists of persons, organizations, and countries suspected of aiding, harboring or engaging in terrorist acts, known as Specially
12
Designated Nationals and Blocked Persons. OFAC administers and enforces applicable economic and trade sanctions programs. These sanctions are usually targeted against foreign countries, terrorists, international narcotics traffickers and those believed to be involved in the proliferation of weapons of mass destruction. These regulations generally require either the blocking of accounts or other property of specified entities or individuals, but they may also require the rejection of certain transactions involving specified entities or individuals. Trustmark maintains policies, procedures and other internal controls designed to comply with these sanctions programs.
Other Federal Regulation of Trustmark
In addition to being regulated as a bank holding company, Trustmark is subject to regulation by the State of Mississippi under its general business corporation laws. Trustmark is also subject to the disclosure and other regulatory requirements of the Securities Act of 1933 and the Securities Exchange Act of 1934, as administered by the SEC.
Regulation of TNB
TNB is a national bank and, as such, is subject to extensive regulation by the OCC and, to a lesser extent, by the FDIC. In addition, as a large provider of consumer financial services, TNB is subject to regulation, supervision, enforcement and examination by the Consumer Financial Protection Bureau (CFPB).CFPB. Almost every area of the operations and financial condition of TNB is subject to extensive regulation and supervision and to various requirements and restrictions under federal and state law including loans, reserves, investments, issuance of securities, establishment of branches, capital adequacy, liquidity, earnings, dividends, management practices and the provision of services. TNB is subject to supervision, examination, enforcement and reporting requirements under the National Bank Act, the Federal Reserve Act, the FDI Act, regulations of the OCC and certain of the requirements imposed by the Dodd-Frank Act. Trustmark and TNB are also subject to a wide range of consumer protection laws and regulations.
Restrictions on Lending, Insider Transactions and Affiliate Transactions
National banks are limited in the amounts they may lend to one borrower and the amount they may lend to insiders. These single counterparty and insider lending limits extend to loans, derivative transactions, repurchase agreements, reverse repurchase agreements and securities lending or borrowing transactions. In addition, the FDI Act imposes restrictions on insured depository institutions’ purchases of assets from insiders.
Under section 22 of the Federal Reserve Act, as implemented by the FRB’s Regulation O, restrictions also apply to extensions of credit by a bank to its executive officers, directors, principal shareholders and their related interests, and to similar individuals at the holding company or affiliates. In general, such extensions of credit (i) may not exceed certain dollar limitations, (ii) must be made on substantially the same terms, including interest rates and collateral, as those prevailing at the time for comparable transactions with third parties and (iii) must not involve more than the normal risk of repayment or present other unfavorable features.
Sections 23A and 23B of the Federal Reserve Act establish parameters for an insured bank to conduct “covered transactions” with its affiliates, generally (i) limiting the extent to which the bank or its subsidiaries may engage in “covered transactions” with any one affiliate to an amount equal to 10 percent10% of the bank’s capital stock and surplus, and limiting the aggregate of all such transactions with all affiliates to an amount equal to 20 percent20% of the bank’s capital stock and surplus, and (ii) requiring that all such transactions be on terms substantially the same, or at least as favorable, to the bank or subsidiary as those that would be provided to a non-affiliate. In addition, an insured bank’s loans to affiliates must be fully collateralized. The term “covered transaction” includes the making of loans to the affiliate, purchase of assets from the affiliate, issuance of a guarantee on behalf of the affiliate and several other types of transactions.
Payment of Dividends
The principal source of Trustmark’s cash revenue is dividends from TNB. There are various legal and regulatory provisions that limit the amount of dividends TNB can pay to Trustmark without regulatory approval. Under the National Bank Act, approval of the OCC is required if the total of all dividends declared in any calendar year exceeds the total of TNB’s net income for that year combined with its retained net income from the preceding two years. Also, under the National Bank Act, TNB may not pay any dividends in excess of undivided profits (retained earnings). In addition, subsidiary banks
Community Reinvestment Act
The Community Reinvestment Act (CRA) requires an insured depository institution’s appropriate federal banking regulator to evaluate the institution's record of meeting the credit needs of its entire community, including low- and moderate-income neighborhoods, and to
12
consider this record in its evaluation of certain applications to banking regulators, such as an application for approval of a merger or the establishment of a branch.
As of its last examination from the OCC, TNB received a CRA rating of “Needs to Improve.” The evaluation covered activities in the period from January 1, 2019 through December 31, 2021. TNB received performance ratings of “High Satisfactory” on each of the three individual components of the CRA examination. The TNB’s final overall rating, however, was downgraded from “Satisfactory” to “Needs to Improve” as a result of alleged discriminatory credit practices in the Memphis Metropolitan Statistical Area between 2014 and 2018. As previously disclosed on October 22, 2021, TNB entered into a consent order with the OCC and a separate consent order jointly with the U.S. Department of Justice and the CFPB, to resolve allegations that TNB previously violated the FHA, the Equal Credit Opportunity Act and the Consumer Financial Protection Act within the Memphis Metropolitan Statistical Area. The OCC Performance Evaluation states that “Following the findings, the bank holding companyundertook significant corrective actions to address the impact of these practices and ensure that the conduct does not recur.”
A “Needs to Improve” rating adversely affects TNB’s ability to obtain regulatory approvals to engage in certain expansionary activities, including certain mergers and acquisitions and the establishment of bank branches. These limitations will remain in place until TNB receives a CRA rating of at least “Satisfactory” following a subsequent CRA examination. The precise timing of the completion of that examination and any results therefrom will not be known until later.
On October 24, 2023, the federal banking agencies released a final rule significantly revising the framework that the agencies use to evaluate banks’ records of meeting the credit needs of their entire communities under the CRA. Under the revised framework, banks with assets of at least $2 billion, including TNB, are considered large banks and, accordingly, will have their retail lending, retail services and products, community development financing and community development services subject to certain restrictions imposed byperiodic evaluation under complex, multi-part standards. Large banks will be subject to enhanced data collection and reporting requirements, with additional data collection and reporting requirements applying to banks, such as TNB, with assets greater than $10 billion. Depending on a large bank’s geographic concentrations of lending, the Federal Reserve Act on extensionsevaluation of retail lending may include assessment areas in which the bank extends loans but does not operate any deposit-taking facilities, in addition to assessment areas in which the bank has deposit-taking facilities. The rule becomes effective April 1, 2024. Compliance with most provisions of the final rule will be required beginning January 1, 2026, and compliance with the remaining provisions will be required beginning January 1, 2027. Trustmark is evaluating the impact of the final rule.
Consumer Protection Laws
TNB is subject to a number of federal and state laws designed to protect customers and promote lending to various sectors of the economy and population. These consumer protection laws apply to a broad range of TNB’s activities and to various aspects of its business, and include laws relating to interest rates, fair lending, disclosures of credit terms and estimated transaction costs to consumer borrowers, debt collection practices, the bank holding company or anyuse of its subsidiaries. Further, subsidiary banksand the provision of a bank holding company are prohibited from engaging in certain tie-in arrangements in connection with any extensioninformation to consumer reporting agencies and the prohibition of credit, lease or sale of property or furnishing of any services to the bank holding company. Moreover, an institution’s failure to exceed the capital conservation buffer set forth in the capital rules with common equity Tier 1 capital would result in limitations on an institution’s ability to make capital distributions and discretionary bonus payments.
CFPB
The Dodd-Frank Act established the CFPB within the Federal Reserve System as an independent bureau with responsibility for consumer financial protection. The CFPB is responsible for issuing rules, orders and guidance implementing federal consumer financial laws. The CFPB has primary enforcement authority over “very large” insured depository institutions or insured credit unions and their affiliates. An insured depository institution is deemed “very large” if it reports assets of more than $10 billion in its quarterly Call Report for four consecutive quarters. The CFPB has near exclusive supervision authority, including examination authority, over
13
these “very large” institutions and their affiliates to assess compliance with federal consumer financial laws, to obtain information about the institutions’ activities and compliance systems and procedures, and to detect and assess risks to consumers and markets. The CFPB has broad authority to prevent “unfair,unfair, deceptive or abusive acts or practices” and ensure consistent enforcement of laws so that all consumers have access to markets for consumer financial products and services that are fair, transparent and competitive. The CFPB has rulemaking and interpretive authority underpractices in connection with the Dodd-Frank Act and other federal consumer financial services laws, as well as broad supervisory, examination and enforcement authority over large providersoffer, sale or provision of consumer financial products and services, such as TNB. TNB’s total assets exceeded $10 billion at December 31, 2017 and 2016, and therefore, TNB is subject to CFPB supervision.
In October 2017, the CFPB issued a final rule generally requiring lenders that make certain covered short-term loans, longer-term balloon-payment loans, or longer-term loans with certain costs and features, to reasonably determine that a borrower of a covered loan has the ability to repay such a loan, make certain disclosures to the borrower before attempting to withdraw payment from the borrower’s account, forego from making three consecutive attempts to withdraw payments and report covered loans to registered information systems. Most of the requirements of the final rule will take effect in the third quarter of 2019. Based on TNB’s current credit portfolio, any covered loans made by TNB are considered exempt “accommodation loans” under the CFPB’s final rule, and accordingly, Trustmark does not expect that the final rule will have a material impact on its operations.
Other Federal and State Laws
Banking organizations are subject to numerous laws and regulations intended to protect consumers in addition to those discussed above.services. These laws include among others:the Equal Credit Opportunity Act, the Fair Credit Reporting Act, the Truth in Lending Act, (TILA); Truth in Savings Act; Electronic Funds Transfer Act (EFTA); Expedited Funds Availability Act; Equal Credit Opportunity Act; Fair and Accurate Credit Transactions Act; Fair Housing Act; Fair Credit Reporting Act; Fair Debt Collection Act; Gramm-Leach-Bliley Act;the Home Mortgage Disclosure Act; Right to Financial Privacy Act;Act, the Real Estate Settlement Procedures Act;Act, the Fair Debt Collection Practices Act and their state law counterparts. At the federal level, most consumer financial protection laws regarding unfairare administered by the CFPB, which supervises TNB. The CFPB also has authority to issue regulations and deceptive actshas proposed several rules that would restrict various fees that financial institutions can charge consumers, including credit card late fees, overdraft fees and practices;certain insufficient funds (NSF) fees.
Violations of applicable consumer protection laws can result in significant potential liability, including actual damages, restitution and usury laws.injunctive relief, from litigation brought by customers, state attorneys general and other plaintiffs, as well as enforcement actions by banking regulators and reputational harm.
Many states and local jurisdictions have consumer protection laws analogous, and in addition to, those listed above. While TNB’s activities are governed primarily by federal law, the Dodd-Frank Act potentially narrowed National Bank Act preemption of state consumer financial laws, thereby making TNB and other national banks potentially subject to increased state regulation. The Dodd-Frank Act also codified the Supreme Court’s decision in Cuomo v. Clearing House Association. As a result, State Attorneys General may enforce in a court action “an applicable law” against federally-chartered depository institutions like TNB. In addition, under the Dodd-Frank Act, State Attorneys Generalstate attorneys general are authorized to bring civil actions against federally-chartered institutions, like TNB, to enforce regulations prescribed by the CFPB or to secure other remedies.
Finally, the Dodd-Frank Act potentially expanded state regulation over banks by eliminating National Bank Act preemption for national bank operating subsidiaries, including operating subsidiaries of TNB.
Mortgage Regulation13
The Dodd-Frank Act imposed new standards for mortgage loan originations on lenders. The statute amended TILA to restrict the payment of fees to real-estate mortgage originators. Furthermore, the statute amended TILA to impose minimum underwriting standards on real-estate mortgage creditors (including nonbanks as well as bank creditors) and verifications to check borrowers’ income and their ability to repay.
Financial Privacy Laws and Cybersecurity
The Gramm-Leach-Bliley Financial Services Modernization Act of 1999 (GLB Act) imposed requirements related to the privacy of customer financial information. In accordance with the GLB Act, federal bank regulators adopted rules that limit the ability of banks and other financial institutions to disclose nonpublic information about consumers to nonaffiliated third parties. The GLB Act also requires disclosure of privacy policies to consumers and, in some circumstances, allows consumers to prevent disclosure of certain personal information to a nonaffiliated third party. The privacy provisions of the GLB Act affect how consumer information is transmitted through diversified financial companies and conveyed to outside vendors. Trustmark recognizes the need to comply with legal and regulatory requirements that affect its customers’ privacy.
In addition, the federal banking agencies pay close attention to the cybersecurity practices of banks, and the agencies include review of an institution’s information technology and its ability to thwart cyberattacks in their examinations. An institution’s failure to have adequate cybersecurity safeguards in place can result in supervisory criticism, monetary penalties and/or reputational harm. Additionally, banking organizations are required to notify their primary federal regulator of significant computer security incidents within 36 hours of determining that such an incident has occurred.
Debit Interchange Regulation
The FRB has issued rules under the EFTA,Electronic Fund Transfer Act (EFTA), as amended by the Dodd-Frank Act, to limit interchange fees that an issuer with $10.0 billion or more in assets, such as TNB, may receive or charge for an electronic debit card transaction. Under the FRB’s rules, the maximum permissible interchange fee that an issuer may receive for an electronic debit transaction is the sum of 21 cents per transaction and five basis points multiplied by the value of the transaction. In addition, the FRB’s rules allow for an upward adjustment of no more than one cent to an issuer’s debit card interchange fee if the issuer develops and implements policies and procedures reasonably designed to achieve the fraud-prevention standards set out in the rule.
14
IssuersIn October 2023, the FRB proposed changes to its EFTA rules that together with their affiliates, have assetswould decrease the maximum interchange fees that an issuer may receive for an electronic debit transaction to the sum of less than $10.0 billion14.4 cents and four basis points multiplied by the value of the transaction and increase the fraud prevention adjustment to 1.3 cents. Trustmark is evaluating the impact of this proposal.
The FRB also has established rules governing routing and exclusivity that require debt card issuers to offer two unaffiliated networks for routing transactions on the annual measurement date (December 31) are exempt from theeach debit card interchange fee standards. At the December 31, 2013 annual measurement date, Trustmark had assets greater than $10.0 billion; and, therefore, was required to comply with the debit card interchange fee standards by July 1, 2014.or prepaid product.
FDIC Deposit Insurance Assessments
The deposits of TNB are insured by the Deposit Insurance Fund (DIF), as administered by the FDIC, and, accordingly, are subject to deposit insurance assessments to maintain the DIF at minimum levels required by statute. The Dodd-Frank Act increased the minimum reserve ratio requirement for the DIF to 1.35 percent of total estimated insured deposits or the comparable percentage of the deposit assessment base.
The FDIC uses a risk basedrisk-based assessment system that imposes insurance premiums as determined by multiplying an insured bank’s assessment base by its assessment rate. The Dodd-Frank Act revised theA bank’s deposit insurance assessment base to beis generally equal to athe bank’s total assets minus the sum of (1) its average tangible equity during the assessment period, and (2) any additional amount the FDIC determines is warranted for custodial and banker’s banks.period.
The FDIC determines a bank’s assessment rate within a range of base assessment rates using a risk scorecard that takes into account the bank’s financial ratios and supervisory rating (the CAMELS composite rating), among other factors. The CAMELS rating system is a supervisory rating system developed to classify a bank’s overall condition by taking into account capital adequacy, assets, management capability, earnings, liquidity and sensitivity to market and interest rate risk.
Under a rule adopted by The methodology that the FDIC in 2011,uses to calculate assessment amounts is also based on the range of base assessment rates for all banks is to decrease in phases as the DIF’sFDIC’s designated reserve ratio, grows to 1.15 percent, 2.00 percent and 2.50 percent. Thewhich is currently 2.0%. Since the outbreak of the COVID-19 pandemic, the amount of total estimated insured deposits has grown rapidly while the funds in the DIF have grown at a normal rate, causing the DIF reserve ratio reached 1.17 percent asto fall below the statutory minimum of 1.35%. The FDIC adopted a restoration plan in September 2020, which it amended in June 2022, to restore the DIF reserve ratio to at least 1.35% by September 30, 2016. In March 2016, the Board of Directors of2028. On October 18, 2022, the FDIC approvedadopted a final rule to increase initial base deposit insurance assessment rates for insured depository institutions by 2 basis points, which began with the first quarterly assessment period of 2023. The increased assessment rate schedules will remain in effect unless and until the DIF reserve ratio meets or exceeds 2.00%. As a result of this rule, the FDIC insurance costs of insured depository institutions, including TNB, have generally increased. TNB incurred an additional $2.6 million of FDIC assessment expense during 2023 as a result of this rule.
On November 16, 2023, the FDIC adopted a final rule implementing a special assessment to recover the loss to the FDIC’s DIF incurred in the receiverships of Silicon Valley Bank and Signature Bank. Under the final rule, the FDIC will collect special assessments at a quarterly rate of 3.36 basis points, or approximately 13.4 basis points annually, over eight quarterly assessment periods beginning with the first quarterly assessment period of 2024. The assessment base for the special assessment is equal to an insured depository
14
institution's estimated uninsured deposits, reported as of December 31, 2022, adjusted to exclude the first $5 billion in estimated uninsured deposits. The FDIC retained the ability to cease collection early, extend the special assessment collection period one or more quarters beyond the initial eight-quarter collection period to collect the difference between estimated or actual losses and the amounts collected, or impose a surchargefinal shortfall special assessment on a one-time basis after the receiverships for Silicon Valley Bank and Signature Bank terminate. The special assessment is not expected to be material to Trustmark's financial condition or results of 4.5 cents per $100operations.
The FDIC may terminate the deposit insurance of any insured depository institution, including the assessment base,TNB, if the FDIC determines after making certain adjustments, on banks with $10.0 billion or more in assets, through the quartera hearing that the DIF’s reserve ratio reachesinstitution has engaged or is engaging in unsafe or unsound banking practices, is in an unsafe or unsound condition to continue operations or has violated any applicable law, regulation, order or any condition imposed by an agreement with the statutorily required minimum levelFDIC. The FDIC also may suspend deposit insurance temporarily during the hearing process for the permanent termination of 1.35 percent, whichinsurance if the FDIC expects will occur after approximately two years of payments of these surcharges. The surcharges became effective and began on July 1, 2016. Following the effectiveness of the decrease in base assessment rates and surcharges on July 1, 2016, the total base assessment rate for an institution with $10.0 billion or more in assets ranges from a minimum of 1.5 basis points to a maximum of 40.0 basis points, plus applicable surcharges, but this range is subject to change as the DIF’s reserve ratio continues to grow.has no tangible capital.
TNB’s FDIC assessment expenses declined during 2017 as the lower regular assessment rates and the allowable adjustments more than offset the surcharge of 4.5 cents per $100 of assessment base. In 2017,2023, TNB’s expenses related to deposit insurance premiums totaled $10.4$13.5 million.
TNB also paid approximately $660 thousand in Financing Corporation (FICO) assessments related to outstanding FICO bonds for which the FDIC serves as collection agent. The bonds issued by FICO are due to mature from 2018 through 2019. For the quarter ended December 31, 2017, the FICO assessment rate was equal to 0.46 basis points.
The Dodd-Frank Act permanently increased the deposit insurance level to $250 thousand per depositor for each insured depository institution.
TNB Subsidiaries
TNB’s nonbanking subsidiaries are subject to a variety of state and federal laws and regulations. TIA, a registered investment adviser, is subject to regulation by the SEC under the Investment Advisers Act of 1940 and by the State of Mississippi. FBBI is subject to the insurance laws and regulations of the states in which its divisions areit is active. SCC is subject to the supervision and regulation of the CDFI Fund and the State of Mississippi.
During April 2016, the Department of Labor (DOL) issued a final rule related to fiduciary standards that apply to the provision of advice to clients with respect to the investing of certain of their retirement accounts. The final rule expands the definition of a fiduciary under the Employee Retirement Income Security Act of 1974, as amended. Those who provide investment advice to plans, plan sponsors, fiduciaries, plan participants, beneficiaries and IRAs and IRA owners generally must either avoid payments that create conflicts of interest or satisfy an exemption from these requirements issued by the DOL. Under exemptions adopted with the rule, financial institutions will generally be obligated to acknowledge their status and the status of their individual advisers as “fiduciaries.” Among other obligations, firms and advisers will be required to make prudent investment recommendations that are in their clients’ best interests and charge only reasonable compensation. Additionally, the rule requires certain disclosures to be made to the client, and ongoing compliance must be monitored and documented. On June 9, 2017, following a 60-day extension of the final rule’s applicability date, certain provisions of the final rule became applicable, including provisions that apply to Trustmark. The remaining provisions of the final rule are scheduled to be phased in by July 1, 2019. It is not clear if that applicability date will be further
15
delayed, and it is also possible that the Securities and Exchange Commission or another governmental entity could impose separate regulations regarding the provision of investment advice with respect to retirement accounts. Management does not expect the final DOL rule to have a significant impact on the results of operations or financial condition of Trustmark or TNB.
The GLB Act authorizes national banks to own or control a “financial subsidiary” that engages in activities that are not permissible for national banks to engage in directly. The GLB Act contains a number of provisions dealing with insurance activities by bank subsidiaries. Generally, the GLB Act affirms the role of the states in regulating insurance activities, including the insurance activities of financial subsidiaries of banks, but the GLB Act also preempts certain state laws. As a result of the GLB Act, TNB elected for predecessor subsidiaries that now constitute FBBI to become financial subsidiaries. This enables FBBI to engage in insurance agency activities at any location.
Available Information
Trustmark’s internet address is www.trustmark.com. Information contained on this website is not a part of this report. Trustmark makes available through this address, free of charge, its Annual Report on Form 10-K, Quarterly Reports on Form 10-Q, Current Reports on Form 8-K and amendments to those reports filed or furnished pursuant to Section 13(a) or 15(d) of the Exchange Act as soon as reasonably practicable after such material is electronically filed, or furnished to, the SEC.
Employees
At December 31, 2017,2023, Trustmark employed 2,8932,757 full-time equivalent associates, none of which are represented by a collective bargaining agreement. Trustmark believes its employee relations to be satisfactory.
Information about Executive Officers of Trustmark
As of the Registrant
Thefiling date, the executive officers of Trustmark (the Registrant) and its primary bank subsidiary, TNB, including their ages, positions and principal occupations for the last five years are as follows:
Gerard R. Host, 6369
Trustmark Corporation
Chairman since May 2022
Executive Chairman from January 2021 to April 2022
Chairman from April 2020 to December 2020
President and Chief Executive Officer from January 2011 to December 2020
Trustmark National Bank
Chairman since May 2022
Executive Chairman from January 2021 to April 2022
Chairman from April 2020 to December 2020
Chief Executive Officer from January 2011 to December 2020
President from January 2011 to December 2019
15
Duane A. Dewey, 65
Trustmark Corporation
President and Chief Executive Officer since January 20112021
Trustmark National Bank
President and Chief Executive Officer since January 20112021
Louis E. Greer, 63President since January 2020
Chief Operating Officer from January 2019 to December 2020
George T. Chambers, Jr., 64
Trustmark Corporation
Treasurer and Principal FinancialAccounting Officer since January 2007March 2021
Trustmark National Bank
Executive Vice President and Chief FinancialAccounting Officer since February 2007March 2021
Granville Tate, Jr., 61
Trustmark Corporation
Secretary since December 2015
Trustmark National Bank
ExecutiveSenior Vice President Secretary, General Counsel and Chief Risk Officer since June 2016Controller from March 2009 to February 2021
Executive Vice President, Secretary and General Counsel from December 2015 to June 2016
Brunini, Grantham, Grower & Hewes, PLLC
Partner from January 2010 to December 2015
Board of Directors from January 2010 to November 2015
Chairman of the Board of Directors from January 2010 to May 2015
Monica A. Day, 5763
Trustmark National Bank
President – Institutional Banking since April 2019
Executive Vice President and Real Estate Banking Manager sincefrom May 2017 to April 2019
Senior Vice President and Corporate Commercial Real Estate Manager from October 2008 to May 2017
Duane A. Dewey, 59
Trustmark National Bank
President – Corporate Banking since September 2011
16
Trustmark National Bank
Chief Credit and Operations Officer since June 2021
Chief Credit Officer from March 2010 to May 2021
Executive Vice President since March 2010
Thomas C. Owens, 59
Trustmark Corporation
Treasurer and Chief CreditPrincipal Financial Officer since March 20102021
Donald Glynn Ingram, 66
Trustmark National Bank
Chief Financial Officer since March 2021
Bank Treasurer from September 2013 to February 2021
Executive Vice President and Chief Information Officer since September 20082013
James M. Outlaw, Jr., 65
Trustmark National Bank
Executive Vice President and Chief Administrative Officer since August 2014
President and Chief Operating Officer – Texas from August 2006 to August 2014
Thomas C. Owens, 53
Trustmark National Bank
Executive Vice President and Bank Treasurer since September 2013
Webster Financial Corporation – Waterbury, Connecticut
Assistant Treasurer – Asset Liability Management from 2008 to September 2013
W. Arthur Stevens, 5359
Trustmark National Bank
President – Retail Banking since September 2011
Breck W. Tyler, 59Maria Luisa "Ria" Sugay, 42
Trustmark National Bank
President – Mortgage ServicesBank Treasurer since March 20122021
C. Scott Woods, 61Bank Co-Treasurer from July 2020 to February 2021
Executive Vice President since July 2020
USAA
Director, Asset Liability Management from June 2016 to June 2020
Granville Tate, Jr., 67
Trustmark Corporation
Secretary since December 2015
Trustmark National Bank
President – Insurance and Wealth ManagementChief Administrative Officer since November 2017January 2021
President – Insurance ServicesChief Risk Officer from March 2012June 2016 to November 20172021
General Counsel from December 2015 to November 2021
Executive Vice President and Secretary since December 2015
ITEM 1A. RISK FACTORS
Trustmark and its subsidiaries could be adversely impacted by various risks and uncertainties, which are difficult to predict. As a financial institution, Trustmark has significant exposure to market risks, including interest rate risk, liquidity risk and credit risk. This
16
section includes a description of the risks, uncertainties and assumptions identified by Management that could, individually or in combination, materially affect Trustmark’s financial condition and results of operations, as well as the value of Trustmark’s financial instruments in general, and Trustmark common stock, in particular. Additional risks and uncertainties that Management currently deems immaterial or is unaware of may also impair Trustmark’s financial condition and results of operations. This report is qualified in its entirety by the risk factors that are identified below.
Risks Related to Trustmark’s Business
Interest Rate Risks
Trustmark’s largest source of revenue (net interest income) is subject to interest rate risk.
Trustmark’s profitability depends to a large extent on net interest income, which is the difference between income on interest-earning assets, such as loans and investment securities, and expense on interest-bearing liabilities, such as deposits and borrowings. Trustmark is exposed to interest rate risk in its core banking activities of lending and deposit taking, since assets and liabilities reprice at different times and by different amounts as interest rates change. Trustmark is unable to predict changes in market interest rates, which are affected by many factors beyond Trustmark’s control, including inflation, recession, unemployment, money supply, domestic and international events and changes in the United States and other financial markets. During June 2017,Market interest rates began to rise during 2022 after an extended period at historical lows. Starting in March 2022, the FRB increasedbegan raising the target range for the federal funds rate for the third consecutive quarter.first time in three years and continued with multiple increases throughout 2022 and 2023, up to a range of 5.25% to 5.50% as of December 2023. In December 2017,addition, the FRB further increased the interest that it pays on reserves multiple times during 2022 and 2023 from 0.10% to 5.40% as of December 2023. As interest rates have increased, so have competitive pressures on the deposit cost of funds. This has been exacerbated by the bank failures in the first half of 2023 and commenced reducing the size of its balance sheet. In December 2017,resulting heightened competition for deposits, which has also affected the FRB also predicted an additional three interest rate hikes in 2018.that Trustmark pays on deposits. It is not possible to predict the impact, if any, on marketpace and magnitude of changes in interest rates, or the impact rate changes will have on Trustmark's results of efforts by the FRB to reduce the size of its balance sheet.operations.
Financial simulation models are the primary tools used by Trustmark to measure interest rate exposure. Using a wide range of scenarios, Management is provided with extensive information on the potential impact to net interest income caused by changes in interest rates. Models are structured to simulate cash flows and accrual characteristics of Trustmark’s balance sheet. Assumptions are made about the direction and volatility of interest rates, the slope of the yield curve and the changing composition of Trustmark’s balance sheet, resulting from both strategic plans and customer behavior. In addition, the model incorporates Management’s assumptions and expectations regarding such factors as loan and deposit growth, pricing, prepayment speeds and spreads between
17
interest rates. Trustmark’s simulation model using static balances at December 31, 2017,2023, estimated that in the event of a hypothetical 200 basis point increase in interest rates, net interest income may decrease 2.1%increase 0.5%, while a hypothetical 100 basis point increase in interest rates, may decreaseincrease net interest income 1.0%0.3%. In the event of a hypothetical 100 basis point decrease in interest rates using static balances at December 31, 2017,2023, it is estimated net interest income may decrease by 4.2%0.4%, while a hypothetical 200 basis point decrease in interest rates, may decrease net interest income 1.0%.
Net interest income is Trustmark’s largest revenue source, and it is important to discuss how Trustmark'sTrustmark’s interest rate risk may be influenced by the various factors shown below:
In general, for a given change in interest rates, the amount of the change in value (positive or negative) is larger for assets and liabilities with longer remaining maturities. The shape of the yield curve may affect new loan yields, funding costs and investment income differently.
The remaining maturity of various assets or liabilities may shorten or lengthen as payment behavior changes in response to changes in interest rates. For example, if interest rates decline sharply, fixed-rate loans may pre-pay, or pay down, faster than anticipated, thus reducing future cash flows and interest income. Conversely, if interest rates increase, depositors may cash in their certificates of deposit prior to term (notwithstanding any applicable early withdrawal penalties) or otherwise reduce their deposits to pursue higher yielding investment alternatives. Repricing frequencies and maturity profiles for assets and liabilities may occur at different times. For example, in a falling rate environment, if assets reprice faster than liabilities, there will be an initial decline in earnings. Moreover, if assets and liabilities reprice at the same time, they may not be by the same increment. For instance, if the federal funds rate increased 50 basis points, rates on demand deposits may rise by 10 basis points, whereas rates on prime-based loans will instantly rise 50 basis points.
Financial instruments do not respond in a parallel fashion to rising or falling interest rates. This causes asymmetry in the magnitude of changes in net interest income, net economic value and investment income resulting from the hypothetical increases and decreases in interest rates. Therefore, Management monitors interest rate risk and adjusts Trustmark’s investment, funding and hedging strategies to mitigate adverse effects of interest rate shifts on Trustmark’s balance sheet.
17
Trustmark utilizes derivative contracts to hedge the mortgage servicing rights (MSR) in order to offset changes in fair value resulting from changes in interest rate environments. In spite of Trustmark’s due diligence in regard to these hedging strategies, significant risks are involved that, if realized, may prove such strategies to be ineffective, which could adversely affect Trustmark’s financial condition or results of operations. Risks associated with these strategies include the risk that counterparties in any such derivative and other hedging transactions may not perform; the risk that these hedging strategies rely on Management’s assumptions and projections regarding these assets and general market factors, including prepayment risk, basis risk, market volatility and changes in the shape of the yield curve, and that these assumptions and projections may prove to be incorrect; the risk that these hedging strategies do not adequately mitigate the impact of changes in interest rates, prepayment speeds or other forecasted inputs to the hedging model; and the risk that the models used to forecast the effectiveness of hedging instruments may project expectations that differ from actual results. In addition, increased regulation of the derivative markets may increase the cost to Trustmark to implement and maintain an effective hedging strategy.
Trustmark closely monitors the sensitivity of net interest income and investment income to changes in interest rates and attempts to limit the variability of net interest income as interest rates change. Trustmark makes use of both on- and off-balance sheet financial instruments to mitigate exposure to interest rate risk.
Trustmark may be adversely affected by the transition from the London Interbank Offered Rate (LIBOR) as a reference rate.
In 2017, the United Kingdom’s Financial Conduct Authority (FCA), which regulates LIBOR, announced that after the end of 2021 it would no longer compel banks to submit the rates required to calculate LIBOR. On March 5, 2021, the FCA confirmed that the publication of most LIBOR term rates would end on June 30, 2023 (excluding one-week U.S. LIBOR and two-month U.S. LIBOR, the publication of which ended on December 31, 2021). The Alternative Reference Rates Committee (ARRC), a committee of U.S. financial market participants, identified the Secured Overnight Financing Rate (SOFR) as the reference rate that represents best practice as the alternative to LIBOR for use in derivatives and other financial contracts that are currently indexed to USD-LIBOR. However, there are conceptual and technical differences between LIBOR and SOFR. The federal banking agencies encouraged banking organizations to cease entering into new contracts that use US$ LIBOR as a reference rate by no later than December 31, 2021, and to ensure existing contracts have robust fallback language that includes a clearly defined alternative reference rate.
On December 16, 2022, the FRB adopted a final rule that implemented the Adjustable Interest Rate (LIBOR) Act by identifying benchmark rates based on SOFR that will replace LIBOR in certain financial contracts after June 30, 2023. Following the LIBOR cessation date of June 30, 2023, the nationwide process for replacing LIBOR in financial contracts that mature thereafter and that do not provide for an effective means to replace LIBOR upon its cessation took effect pursuant to the Adjustable Interest Rate (LIBOR) Act. For contracts in which a party has the discretion to identify a replacement rate, the Adjustable Interest Rate (LIBOR) Act also provides a safe harbor to parties if they choose the SOFR-based benchmark replacement rate to be identified by the FRB. Trustmark transitioned to SOFR for new variable rate loans, derivative contracts, borrowings and other financial instruments as of January 1, 2022.
Trustmark had a significant number of loans, derivative contracts, borrowings and other financial instruments with attributes that were either directly or indirectly dependent on LIBOR. As of December 31, 2023, all of Trustmark’s LIBOR exposure was remediated or in the process of being remediated. The transition from LIBOR has resulted in and could continue to result in added costs and employee efforts and could present additional risk. Since alternative reference rates are calculated differently than LIBOR, payments under contracts referencing new alternative reference rates will differ from those referencing LIBOR. Trustmark cannot predict what the ultimate impact of the transition from LIBOR will be; however, Trustmark has implemented various measures to manage the transition and mitigate risks.
Credit and Lending Risks
Trustmark is subject to lending risk, which could impact the adequacy of the allowance for credit losses and results of operations.
There are inherent risks associated with Trustmark’s lending activities. If trends in the housing and real estate markets were to revert to or decline below recession levels, Trustmark may experience higher than normal delinquencies and credit losses. Moreover, if the United States economy returns to a recessionary state, Management expects that it could severely affect economic conditions in Trustmark’s market areas and that Trustmark could experience significantly higher delinquencies and credit losses. In addition, bank regulatory agencies periodically review Trustmark’s allowance for credit losses and may require an increase in the provision for credit losses or the recognition of further charge-offs, based on judgments different from those of Management. As a result, Trustmark may elect, or be required, to make further increases in its provision for credit losses in the future, particularly if economic conditions deteriorate.
Additionally, Trustmark may rely on information furnished by or on behalf of customers and counterparties in deciding whether to extend credit or enter into other transactions. This information could include financial statements, credit reports, business plans, and
18
other information. Trustmark may also rely on representations of those customers, counterparties or other third parties, such as independent auditors, as to the accuracy and completeness of that information. Reliance on inaccurate or misleading financial statements, credit reports or other information could have a material adverse impact on Trustmark’s business, financial condition and results of operations.
Trustmark is subject to environmental liability risk associated with lending activities.
A significant portion of Trustmark’s loan portfolio is secured by real property. During the ordinary course of business, Trustmark forecloses on and takes title to properties securing certain loans. In doing so, there is a risk that hazardous or toxic substances could be found on these properties. If hazardous or toxic substances are found, Trustmark may be liable for remediation costs, as well as for personal injury and property damage, civil fines and criminal penalties regardless of when the hazardous conditions or toxic substances first affected any particular property. Environmental laws may require Trustmark to incur substantial expenses and may materially reduce the affected property’s value or limit Trustmark’s ability to use or ability to sell the affected property or to repay the indebtedness secured by the property. In addition, future laws or more stringent interpretations or enforcement policies with respect to existing laws may increase Trustmark’s exposure to environmental liability. Environmental reviews of nonresidential real estate before initiating foreclosure actions may not be sufficient to detect all potential environmental hazards. The remediation costs and any other financial liabilities associated with an environmental hazard could have a material adverse effect on Trustmark’s business, financial condition and results of operations.
Declines in asset values may result in credit losses and adversely affect the value of Trustmark’s investments.
Trustmark maintains an investment portfolio that includes, among other asset classes, obligations of states and municipalities, agency debt securities and agency mortgage-related securities. The market value of investments in Trustmark’s investment portfolio may be affected by factors other than interest rates or the underlying performance of the issuer of the securities, such as ratings downgrades, adverse changes in the business climate and a lack of pricing information or liquidity in the secondary market for certain investment securities. In addition, government involvement or intervention in the financial markets or the lack thereof or market perceptions regarding the existence or absence of such activities could affect the market and the market prices for these securities.
On a quarterly basis, Trustmark evaluates investments and other assets for expected credit losses. At December 31, 2023, gross unrealized losses on securities for which an allowance for credit losses has not been recorded totaled $196.1 million. Trustmark may be required to record credit loss expense if these investments suffer a decline in value that is the result of a credit loss. If Trustmark determines that a credit loss exists, the credit portion of the allowance would be measured using a discounted cash flow (DCF) analysis using the effective interest rate as of the security’s purchase date. The amount of credit loss Trustmark may record is limited to the amount by which the amortized cost exceeds the fair value, which could have a material adverse effect on results of operations in the period in which a credit loss, if any, occurs.
Liquidity Risk
Trustmark is subject to liquidity risk, which could disrupt its ability to meet its financial obligations.
Liquidity refers to Trustmark’s ability to ensure that sufficient cash flow and liquid assets are available to satisfy current and future financial obligations, including demand for loans and deposit withdrawals, funding operating costs and other corporate purposes. Liquidity risk arises whenever the maturities of financial instruments included in assets and liabilities differ or when assets cannot be liquidated at fair market value as needed. Trustmark obtains funding through deposits and various short-term and long-term wholesale borrowings, including federal funds purchased and securities sold under repurchase agreements, the Federal Reserve Discount Window (Discount Window) and Federal Home Loan Bank (FHLB) advances. Any significant restriction or disruption of Trustmark’s ability to obtain funding from these or other sources could have a negative effect on Trustmark’s ability to satisfy its current and future financial obligations, which could materially affect Trustmark’s financial condition or results of operations.
In addition to the risk that one or more of the funding sources may become constrained due to market conditions unrelated to Trustmark, there is the risk that Trustmark’s credit profile may decline such that one or more of these funding sources becomes partially or wholly unavailable to Trustmark.
Trustmark attempts to quantify such credit event risk by modeling bank specific and systemic scenarios that estimate the liquidity impact. Trustmark estimates such impact by attempting to measure the effect on available unsecured lines of credit, available capacity from secured borrowing sources and securitizable assets. To mitigate such risk, Trustmark maintains available lines of credit with the Federal Reserve Bank of Atlanta and the FHLB of Dallas that are secured by loans and investment securities. Management continuously monitors Trustmark’s liquidity position for compliance with internal policies.
19
External and Market-Related Risks
Trustmark’s business may be adversely affected by conditions in the financial markets and economic conditions in general.
The economy continued to show moderate signs of improvement in 2017;Economic activity improved slightly during 2023; however, economic concerns remain as a result of the cumulative weight of volatility in crude oil prices and uncertain growth prospects in Russia and other emerging markets, combined with uncertainty regarding the potential economic impact of further tightening ofgeopolitical developments, such as the monetary policy byconflicts in Ukraine and the FRB,Middle East, inflation, the consequences of bank failures and other economic and industry volatility, the decision of2024 political cycle in the United Kingdom to exit the European Union,States, supply chain issues, higher energy prices and the potential impact on the economy of the current presidential administration’s policies.broader price pressures. Doubts surrounding the near-term direction of global markets, and the potential impact of these trends on the United States economy, are expected to persist for the near term. While Trustmark’s customer base is wholly domestic, international economic conditions affect domestic conditions, and thus may have an impact upon Trustmark’s financial condition or results of operations. While domestic demand for loans has improved, particularly for commercial loans, further meaningful gains will depend on sustained economic growth. Strategic risk, including threats to business models from rising rates and modest economic growth, remains high. Management’s ability to plan, prioritize and allocate resources in this new environment will be critical to Trustmark’s ability to sustain earnings that will attract capital. Because of the complexities presented by current economic conditions, Management will continue to be challenged in identifying alternative sources of revenue, prudently diversifying assets, liabilities and revenue and effectively managing the costs of compliance.
18
During June 2017, the FRB increased the target range for the federal funds rate for the third consecutive quarter. In December 2017, the FRB further increased rates and commenced reducing the size of its balance sheet. In December 2017, the FRB predicted an additional three interest rate hikes in 2018. It is not possible to predict the impact, if any, on marketMarket interest rates of efforts by the FRBbegan to reduce the size of its balance sheet. Therise during 2022 after an extended period of low interest rates continuesat historical lows and continued to place pressure on net interest margins for Trustmark (as well as its competitors); however,rise in 2023. As interest rates have increased, during 2017 and the FRB has indicated that it intends to continue to raise rates in 2018. Any increases in interest rates will placeso have competitive pressures on the deposit cost of funds. This has been exacerbated by bank failures and the resulting heightened competition for deposits, which has also affected the interest that Trustmark pays on deposits. It is not possible to predict the pace and magnitude of risingchanges to interest rates, or the impact rising ratesrate changes will have on Trustmark’s results of operations.
Despite recent optimism resulting from stabilization in the housing sector, improvement of unemployment data and credit quality improvement, Trustmark does not assume that current uncertain conditions in the economy will improve significantly in the near future. A further weakened economy could affect Trustmark in a variety of substantial and unpredictable ways. In particular, Trustmark may face the following risks in connection with these events:
Market developments and the resulting economic pressure on consumers may affect consumer confidence levels and may cause increases in delinquencies and default rates, which, among other effects, could further affect Trustmark’s charge-offs and provision for loancredit losses.
Loan performance could experience a significantly extended deterioration or loan default levels could accelerate, foreclosure activity could significantly increase, or Trustmark’s assets (including loans and investment securities) could materially decline in value, any one of which, or any combination of more than one of which, could have a material adverse effect on Trustmark’s financial condition or results of operations.
Management’s ability to measure the fair value of Trustmark’s assets could be adversely affected by market disruptions that could make valuation of assets more difficult and subjective. If Management determines that a significant portion of its assets have values that are significantly below their recorded carrying value, Trustmark could recognize a material charge to earnings in the quarter during which such determination was made, Trustmark’s capital ratios would be adversely affected by any such charge, and a rating agency might downgrade Trustmark’s credit rating or put Trustmark on credit watch.
The price per barrelrising interest rate environment during 2022 and 2023, the resulting industry-wide reduction in the fair value of crude oil remained volatile during 2017. As of December 31, 2017, energy-related LHFI represented approximately 2.6% of Trustmark’s total LHFI portfolio,securities portfolios and consisted principally of loans within the oilfield services and midstream segments. Additionally, as of December 31, 2017, approximately 9.7% of Trustmark’s energy-related LHFI, or 0.3% of Trustmark’s total LHFI portfolio, were classified as nonperforming or nonaccrual. Trustmark has no loan exposure where the source of repayment, or the underlying security of such exposure, is tiedbank runs that led to the realizationfailures of value from energy reserves. Nonetheless, if oil prices remain atsome financial institutions in March 2023, among other events, have resulted in a current levels or below for an extended periodstate of time, Trustmark could experience weakening or increasedvolatility and uncertainty with respect to the health of the United States banking system. There is heightened awareness around liquidity, uninsured deposits, deposit composition, unrecognized investment losses within its energy-related LHFI portfolio.
and capital. It is difficult to predict the extent to which these challenging economic conditions will persist or whether recent progress in the economic recovery will instead shift to the potential for further decline. If the economy does weaken in the future, it is uncertain how Trustmark’s business would be affected and whether Trustmark would be able to successfully to mitigate any such effects on its business. Accordingly, these factors in the United States (and, indirectly, global) economy could have a material adverse effect on Trustmark’s financial condition and results of operations.
Trustmark is subject to lending risk,operates in a highly competitive financial services industry.
Trustmark faces substantial competition in all areas of its operations from a variety of different competitors, many of which could impact the adequacy of the allowance for loan losses and results of operations.
There are inherent risks associated with Trustmark’s lending activities. While the housing and real estate markets have shown continued improvement, they remain at depressed levels in certain regions. If trends in the housing and real estate markets were to revert or further decline below recession levels, Trustmark may experience higher than normal delinquencies and credit losses. Moreover, if the United States economy returns to a recessionary state, Management expects that it could severely affect economic conditions in Trustmark’s market areas and that Trustmark could experience significantly higher delinquencies and credit losses. In addition, bank regulatory agencies periodically review Trustmark’s allowance for loan losseslarger and may require an increasehave greater financial resources. Such competitors primarily include banks, as well as community banks operating nationwide and regionally within the various markets in which Trustmark operates. Trustmark also faces competition from many other types of financial institutions, including savings and loans, credit unions, finance companies, brokerage firms, insurance companies, factoring companies and other financial intermediaries. Additionally, fintech developments, such as blockchain and other distributed ledger technologies, have the provision for loan losses orpotential to disrupt the recognition of further charge-offs, based on judgments different from those of Management. Asfinancial industry and change the way banks do business. The financial services industry could become even more competitive as a result Trustmarkof legislative, regulatory and technological changes and continued consolidation.
20
Some of Trustmark’s competitors have fewer regulatory constraints and may elect, orhave lower cost structures. Additionally, due to their size, many of Trustmark’s larger competitors may be requiredable to to make further increases in its provisionachieve economies of scale and, as a result, may offer a broader range of products and services as well as better pricing for loan losses in the future, particularly if economic conditions deteriorate.those products and services than Trustmark.
Additionally, Trustmark may rely on information furnished by or on behalf of customers and counterparties in deciding whether to extend credit or enter into other transactions. This information could include financial statements, credit reports, business plans, and other information. Trustmark may also rely on representations of those customers, counterparties, or other third parties, such as independent auditors, as to the accuracy and completeness of that information. Reliance on inaccurate or misleading financial
19
statements, credit reports, or other information could have a material adverse impact on Trustmark’s business, financial condition, and results of operations.
Trustmark is subject to liquidity risk, which could disrupt its ability to meet its financial obligations.
Liquidity refers to Trustmark’s ability to ensure that sufficient cash flow and liquid assets are available to satisfy current and future financial obligations, including demand for loans and deposit withdrawals, funding operating costs and other corporate purposes. Liquidity risk arises whenevercompete successfully depends on a number of factors, including: the maturities of financial instruments included in assets and liabilities differ or when assets cannot be liquidated at fair market value as needed. Trustmark obtains funding through deposits and various short-term and long-term wholesale borrowings, including federal funds purchased and securities sold under agreements to repurchase, the Federal Reserve Discount Window (Discount Window) and Federal Home Loan Bank (FHLB) advances. Any significant restriction or disruption of Trustmark’s ability to obtain funding from these or other sources could have a negative effectdevelop, maintain and build upon long-term customer relationships based on Trustmark’stop quality service, high ethical standards and safe, sound assets; the ability to satisfycontinue to expand Trustmark’s market position through organic growth and acquisitions; the scope, relevance and pricing of products and services offered to meet customer needs and demands; the rate at which Trustmark introduces new products and services relative to its currentcompetitors; and future financial obligations,industry and general economic trends. Failure to perform in any of these areas could significantly weaken Trustmark’s competitive position, which could materiallyadversely affect Trustmark’s financial condition or results of operations.
In addition to the risk thatThe soundness of other financial institutions could adversely affect Trustmark.
Financial services institutions are interrelated as a result of trading, clearing, counterparty or other relationships. As a result, defaults by, or questions or rumors about, one or more financial services institutions or the financial services industry in general, could lead to market-wide liquidity problems, which could, in turn, lead to defaults or losses by Trustmark and by other institutions. Trustmark has exposure to many different industries and counterparties, and routinely executes transactions with counterparties in the financial services industry, including commercial banks, brokers and dealers, investment banks, mutual funds, and other institutional clients. Many of these transactions expose Trustmark to credit risk in the event of default of its counterparty or client. In addition, Trustmark’s credit risk may be exacerbated when the collateral it holds cannot be realized upon or is liquidated at prices not sufficient to recover the full amount of the funding sources may become constrained duecredit or derivative exposure owed to market conditions unrelatedTrustmark. Losses related to Trustmark, there is the risk thatthese credit risks could materially and adversely affect Trustmark’s credit profile may decline such that one or moreresults of these funding sources becomes partially or wholly unavailable to Trustmark.operations.
Trustmark attempts to quantify such credit event risk by modeling bank specificCompliance and systemic scenarios that estimate the liquidity impact. Trustmark estimates such impact by attempting to measure the effect on available unsecured lines of credit, available capacity from secured borrowing sources and securitizable assets. To mitigate such risk, Trustmark maintains available lines of credit with the Federal Reserve Bank of Atlanta and the FHLB of Dallas that are secured by loans and investment securities. Management continuously monitors Trustmark’s liquidity position for compliance with internal policies.Regulatory Risks
Trustmark is subject to extensive government regulation and supervision and possible enforcement and other legal actions.
Trustmark, primarily through TNB and certain nonbank subsidiaries, is subject to extensive federal and state regulation and supervision, which vests a significant amount of discretion in the various regulatory authorities. Banking regulations are primarily intended to protect depositors’ funds, federal deposit insurance funds and the banking system as a whole, not security holders. These regulations and supervisory guidance affect Trustmark’s lending practices, capital structure, investment practices, dividend policy and growth, among other things. Congress and federal regulatory agencies continually review banking laws, regulations and policies for possible changes. Changes to statutes, regulations or regulatory policies or supervisory guidance, including changes in interpretation or implementation or statutes, regulations, policies and supervisory guidance, could affect Trustmark in substantial and unpredictable ways. Such changes could subject Trustmark to additional costs, limit the types of financial services and products Trustmark may offer and/or increase the ability of nonbanks to offer competing financial services and products, among other things. Failure to comply with laws, regulations, policies or supervisory guidance could result in enforcement and other legal actions by Federal or state authorities, including criminal and civil penalties, the loss of FDIC insurance, the revocation of a banking charter, civil money penalties, other sanctions by regulatory agencies and/or reputational damage. In this regard, government authorities, including bank regulatory agencies, continue to pursue enforcement agendas with respect to compliance and other legal matters involving financial activities, which heightens the risks associated with actual and perceived compliance failures. Any of the foregoing could have a material adverse effect on Trustmark’s financial condition or results of operations.
Trustmark is subject to numerous laws designed to protect consumers, including fair lending laws, and failure to comply with these laws could lead to a wide variety of sanctions.
The Equal Credit Opportunity Act, the Fair Housing Act and other fair lending laws and regulations impose nondiscriminatory lending requirements on financial institutions. The Department of Justice and other federal agencies are responsible for enforcing these laws and regulations. A successful regulatory challenge to an institution’s performance under fair lending laws and regulations could result in a wide variety of direct or indirect negative consequences, including damages and civil money penalties, injunctive relief, restrictions on mergers and acquisitions activity, restrictions on geographic expansion and restrictions on entering new business lines. Private parties may also have the ability to challenge an institution’s performance under fair lending laws in private class action litigation. Such actions could have a material adverse effect on Trustmark’s business, financial condition or results of operations. In 2021, TNB settled a fair lending enforcement action with the Department of Justice, the OCC and the CFPB and incurred a one-time settlement expense of $5.0 million and made other commitments to enhance credit opportunities to residents of majority-Black and Hispanic neighborhoods in the Memphis metropolitan statistical area. Trustmark and TNB could be subject to other enforcement actions in the future.
In addition, financial institutions face scrutiny on actions and policies that are deemed to adversely impact consumers under the Dodd-Frank Act’s prohibition against unfair, deceptive or abusive acts and practices and Section 5 of the Federal Trade Commission Act’s
21
prohibition against unfair or deceptive acts and practices. Bank regulators and the CFPB are responsible for enforcing these prohibitions against banking organizations. These prohibitions have been applied to prohibit perceived customer abuse in connection with a range of products, services, and practices, including account openings and fees charged where inadequate or no services are rendered for which charges were imposed, as well as other instances where consumers may have been misled through bank disclosures. In addition, the enforcement priorities of the agencies enforcing consumer protection laws have evolved over time and may continue to do so.
TNB's CRA rating of "Needs to Improve" could make it more difficult for Trustmark’s business to grow.
The performance of a bank under the CRA in meeting the credit needs of its community is a factor that must be taken into consideration when the federal banking agencies evaluate applications related to mergers and acquisitions, as well as branch opening and relocations. As of its last examination, TNB received a CRA rating of “Needs to Improve,” which is downgraded from its prior rating of “Satisfactory.” The rating of “Needs to Improve” adversely affects TNB’s ability to obtain regulatory approvals to engage in certain expansionary activities, including certain mergers and acquisitions and the establishment of bank branches. These limitations will remain in place until TNB receives a CRA rating of at least “Satisfactory” following a subsequent CRA examination. The precise timing of the completion of that examination and any results therefrom will not be known until later, and it is possible that TNB’s current CRA rating would not improve in the next examination.
Trustmark is subject to stringent capital requirements.
On September 12, 2010,Under the Groupregulatory capital rules of Governorsthe FRB, OCC, and HeadsFDIC that implement a set of Supervision, the oversight body ofcapital requirements issued by the Basel Committee on Banking Supervision announced agreement on the calibration and phase-in arrangements for a strengthened set of capital requirements, known as Basel III. The FRB, OCC,III, Trustmark and FDIC issued final rules establishing regulatoryTNB are required to maintain a common equity Tier 1 capital requirements consistent with Basel IIIto risk-weighted assets ratio of at least 7.0% (a minimum of 4.5% plus a capital conservation buffer of 2.5%), a Tier 1 capital to risk-weighted assets ratio of at least 8.5% (a minimum of 6.0% plus a capital conservation buffer of 2.5%), a total capital to risk-weighted assets ratio of at least 10.5% (a minimum of 8.0% plus a capital conservation buffer of 2.5%) and implementinga leverage ratio of Tier 1 capital to total consolidated assets of at least 4.0%. In addition, for TNB to be “well-capitalized” under the capital requirements in the Dodd-Frank Act in July 2013. These capital rules require, among other things,banking agencies’ prompt corrective action framework, it must have a minimum common equity Tier 1 capital ratio of 4.5%at least 6.5%, net of regulatory deductions, and establish a capital conservation buffer of an additional 2.5% of common equity to risk-weighted assets above the regulatory minimum capital requirement, effectively establishing a minimum common equity Tier 1 ratio of 7%. In addition, the capital rules increased the minimum Tier 1 capital requirement from 4%ratio of at least 8.0%, a total capital ratio of at least 10.0% and a leverage ratio of at least 5.0%, and must not be subject to 6% of risk-weighted assets. Theany written agreement, order or capital rules also specify thatdirective, or prompt corrective action directive issued by its primary federal regulator to meet and maintain a banking organization with aspecific capital conservation buffer that does not exceed 2.5% shall face limitations onlevel for any capital distributions and bonus payments to executives.measure.
The capital rules also include stringent criteria for capital instruments to qualify as Tier 1 or Tier 2 capital. For instance, the rules effectively disallow newly-issuednewly issued trust preferred securities to be a component of a holding company’s Tier 1 capital. Trustmark will continue to count $60.0 million in outstanding trust preferred securities issued by the Trust as Tier 1 capital up to the regulatory limit, as permitted by a grandfather provision in the capital rules.rules, but this grandfather provision may cease to apply if Trustmark consummates an acquisition of a depository institution holding company and the resulting organization has $15 billion of more in total assets.
20
Financial Accounting Standards Board (FASB) Accounting Standard Codification (ASC) Topic 326, “Financial Instruments-Credit Losses: Measurement of Credit Losses on Financial Instruments,” requires Trustmark to recognize all expected credit losses over the life of a loan based on historical experience, current conditions and TNB were requiredreasonable and supportable forecasts. FASB ASC Topic 326 generally is expected to comply withresult in earlier recognition of credit losses, which would increase reserves and decrease capital. Additionally, the revisedallowance for credit losses model could be materially impacted by changes in current and forecasted macroeconomic conditions. It is not possible to predict the timing or magnitude of changes in macroeconomic conditions or the impact such changes could have on Trustmark’s allowance for credit losses; however, material changes in the allowance for credit losses could have a material impact on Trustmark’s reserves and capital.
The regulatory capital rules beginning January 1, 2015. Certain of the requirements of the revised capital rules, such as the capital conservation buffer, will be phased in until January 1, 2019. Once the revised capital requirements are fully phased in, Trustmark and TNB will be requiredapplicable to hold a greater amount of capital and a greater amount of common equity than they were previously required to hold. Management does not expect the capital rules to have a significant impact on Trustmark or TNB.
Unfavorable results from ongoing stress test analyses conducted on Trustmark and TNB may adversely affect Trustmark’s abilitycontinue to approve, declare and pay dividendsevolve as a result of new requirements established by the Basel Committee on Banking Supervision or legislative, regulatory or accounting changes in the United States. Management cannot predict the effect that any changes to shareholders or compete for new business opportunities.
The FRB and OCC requirecurrent capital requirements would have on Trustmark and TNBTNB.
Trustmark’s use of third-party service providers and Trustmark’s other ongoing third-party business relationships are subject to perform periodic stress testsincreasing regulatory requirements and analysisattention.
Trustmark regularly uses third-party service providers and subcontractors as part of its business. Trustmark also has substantial ongoing business relationships with partners and other third-parties and relies on certain third-parties to evaluate their abilityprovide products and services necessary to absorb losses in various economicmaintain day-to-day operations. These types of third-party relationships are subject to increasingly demanding regulatory requirements and financial scenarios. This stress test analysis uses three economic and financial scenarios generatedattention by regulators, including the FRB, OCC, CFPB and OCC, including baseline, adverse and severely adverse scenarios.FDIC. Under regulatory guidance, Trustmark and TNB areis required to makeapply stringent due diligence, conduct ongoing monitoring and maintain effective control over third-party service providers and subcontractors and other ongoing third-party business relationships. These regulatory expectations may change, and potentially become more rigorous in certain assumptionsways, due to an interagency effort to replace existing guidance on the risk management of third-party
22
relationships with new guidance. Trustmark expects that the regulators will hold Trustmark responsible for deficiencies in modeling futureits oversight and control of its third-party relationships and in the performance and must support these assumptions through statistical analysis and observed market behavior where applicable. Results of the stress testsparties with which Trustmark has these relationships. Trustmark maintains a system of policies and analysisprocedures designed to ensure adequate due diligence is performed byand to monitor vendor risks. While Trustmark believes these policies and TNB mustprocedures effectively mitigate risk, if the regulators conclude that Trustmark has not exercised adequate oversight and control over third-party service providers and subcontractors or other ongoing third-party business relationships or that such third-parties have not performed appropriately, Trustmark could be submittedsubject to the FRB and the OCC annually to be used in the regulators’ analysis.
The outcome of the FRB’s analysis of Trustmark’s projected performance (including capital, earnings and balance sheet changes) could hinder Trustmark’s ability to pay cash dividends to shareholders at levels consistent with prior practice,enforcement actions, including civil monetary penalties or at all. The results of the stress tests could also impact decision making regarding future acquisitions by Trustmarkother administrative or judicial penalties or fines as well as Trustmark’s ability to effectively competerequirements for new business opportunities.customer remediation.
Additionally, the FRB and OCC may require Trustmark and TNB to raise additional capital or take other actions, or may impose restrictions on its business, based on the results of the stress tests, including requiring revisions or changes to capital plans. Trustmark and TNB may not be able to raise additional capital if required to do so, or may not be able to do so on favorable terms. Any such capital raises, if required, may also be dilutive to existing shareholders.Operational Risks
There may be risks resulting from the extensive use of models in Trustmark’s business.
Trustmark relies on statistical and quantitative models to measure risks and to estimate certain financial values. Models may be used in such processes as determining the pricing of various products, assessing potential acquisition opportunities, developing presentations made to market analysts and others, creating loans and extending credit, measuring interest rate and other market risks, predicting losses, assessing capital adequacy, conducting capital stress testing, calculating regulatory capital levels and estimating the fair value of financial instruments and balance sheet items. These models reflect assumptions that may not be accurate, particularly in times of market stress or other unforeseen circumstances. Even if these assumptions are adequate, the models may prove to be inadequate or inaccurate because of other flaws in their design or their implementation. If models for determining interest rate risk and asset-liability management are inadequate, Trustmark may incur increased or unexpected losses upon changes in market interest rates or other market measures. If models for determining probable loanexpected credit losses are inadequate, the allowance for loancredit losses may not be sufficient to support future charge-offs. If models to measure the fair value of financial instruments are inadequate, the fair value of such financial instruments may fluctuate unexpectedly or may not accurately reflect what Trustmark could realize upon sale or settlement of such financial instruments. Any such failure in the analytical or forecasting models could have a material adverse effect on Trustmark’s financial condition or results of operations.
Also, information Trustmark provides to its regulators based on poorly designed or implemented models could be inaccurate or misleading. Certain decisions that the regulators make, including those related to capital distributions and dividends to Trustmark’s shareholders, could be adversely affected due to the regulator’s perception that the quality of Trustmark’s models used to generate the relevant information is insufficient.
Trustmark could be required to write down goodwill and other intangible assets.
WhenIf Trustmark consummates an acquisition, a portion of the purchase price iswould generally be allocated to goodwill and other identifiable intangible assets. The amount of the purchase price that is allocated to goodwill and other intangible assets is determined by the excess of the purchase price over the net identifiable assets acquired. At December 31, 2017,2023, goodwill and other identifiable intangible assets were $396.0$387.2 million. Under current accounting standards, if Trustmark determines goodwill or intangible assets are impaired, Trustmark would be required to write down the carrying value of these assets. Trustmark’s annual goodwill impairment evaluation performed during the fourth quarter of 20172023 indicated no impairment of goodwill for any reporting segment. Management cannot provide assurance, however, that Trustmark will not be required to take an impairment charge in the future. Any impairment charge would have an adverse effect on Trustmark’s shareholders’ equity and financial condition and could cause a decline in Trustmark’s stock price.
21
Trustmark holds a significant amount of other real estate and may acquire and hold significant additional amounts, which could lead to increased operating expenses and vulnerability to additional declines in real property values.
As business necessitates, Trustmark forecloses on and takes title to real estate serving as collateral for loans. At December 31, 2017,2023, Trustmark held $43.2$6.9 million of other real estate, compared to $62.1 million at December 31, 2016.estate. The amount of other real estate held by Trustmark may increase in the future as a result of, among other things, business combinations, increased uncertainties in the housing market or increased levels of credit stress in residential real estate loan portfolios. Increased other real estate balances could lead to greater expenses as Trustmark incurs costs to manage, maintain and dispose of real properties as well as to remediate any environmental cleanup costs incurred in connection with any contamination discovered on real property on which Trustmark has foreclosed and to which Trustmark has taken title. As a result, Trustmark’s earnings could be negatively affected by various expenses associated with other real estate owned, including personnel costs, insurance and taxes, completion and repair costs, valuation adjustments and other expenses associated with real property ownership, as well as by the funding costs associated with other real estate assets. The expenses associated with holding a significant amount of other real estate could have a material adverse effect on Trustmark’s financial condition or results of operations.
Declines in asset values may result in impairment charges and adversely affect the value of Trustmark’s investments.23
Trustmark maintains an investment portfolio that includes, among other asset classes, obligations of states and municipalities, agency debt securities and agency mortgage-related securities. The market value of investments in Trustmark’s investment portfolio may be affected by factors other than interest rates or the underlying performance of the issuer of the securities, such as ratings downgrades, adverse changes in the business climate and a lack of pricing information or liquidity in the secondary market for certain investment securities. In addition, government involvement or intervention in the financial markets or the lack thereof or market perceptions regarding the existence or absence of such activities could affect the market and the market prices for these securities.
On a quarterly basis, Trustmark evaluates investments and other assets for impairment indicators. As of December 31, 2017, gross unrealized losses on temporarily impaired securities totaled $42.1 million. Trustmark may be required to record impairment charges if these investments suffer a decline in value that is other-than-temporary. If it is determined that a significant impairment has occurred, Trustmark would be required to charge against earnings the credit-related portion of the other-than-temporary impairment, which could have a material adverse effect on results of operations in the period in which a write-off, if any, occurs.
If Trustmark is required to repurchase a significant number of mortgage loans that it had previously sold, such repurchases could negatively affect earnings.
One of Trustmark’s primary business operations is mortgage banking under which residential mortgage loans are sold in the secondary market under agreements that contain representations and warranties related to, among other things, the origination and characteristics of the mortgage loans. Trustmark may be required to either repurchase the outstanding principal balance of a loan or make the purchaser whole for the anticipated economic benefits of a loan if it is determined that the loan sold was in violation of representations or warranties made by Trustmark at the time of the sale, herein referred to as mortgage loan servicing putback expenses. Such representations and warranties typically include those made regarding loans that had missing or insufficient file documentation, loans that do not meet investor guidelines, loans in which the appraisal does not support the value and/or loans obtained through fraud by the borrowers or other third parties. Generally, putback requests may be made until the loan is paid in full. However, mortgage loans delivered to the Federal National Mortgage Association (FNMA) and the Federal Home Loan Mortgage Corporation (FHLMC) on or after January 1, 2013 are subject to the Lending and Selling Representations and Warranties Framework, updated in May 2014, which provides certain instances in whichthat FNMA and FHLMC will not exercise their remedies, including a putback request, for breaches of certain selling representations and warranties if the mortgage loans satisfy certain criteria, such as payment history andor quality control review.
Trustmark operatesChanges in a highly competitive financial services industry.
Trustmark faces substantial competitionretail distribution strategies and consumer behavior may adversely impact Trustmark’s investments in all areas of its operations from a variety of different competitors, many of which are largerpremises, equipment, technology and other assets and may have greater financial resources. Such competitors primarily include nationallead to increased expenditures to change its retail distribution channel.
Trustmark has significant investments in bank premises and regional banks,equipment for its branch network. Advances in technology such as ecommerce, telephone, internet and mobile banking, and in-branch self-service technologies including interactive teller machines (ITMs) and other equipment, as well as community banks withinan increasing customer preference for these other methods of accessing Trustmark’s products and services, could decrease the various markets in whichvalue of its branch network, technology, or other retail distribution physical assets and may cause Trustmark operates. At this time, major international banks do not materially compete directly with to change its retail distribution strategy, close and/or sell certain branches or parcels of land held for development and restructure or reduce its remaining branches and work force. These actions could lead to losses on these assets or could adversely impact the carrying value of any long-lived assets and may lead to increased expenditures to renovate, reconfigure or close a number of Trustmark’s remaining branches or to otherwise reform its retail distribution channel.
Trustmark may experience disruptions of its operating systems or breaches in its markets, although they may do so ininformation system security.
Trustmark is dependent upon communications and information systems to conduct business as such systems are used to manage virtually all aspects of Trustmark’s business. Trustmark’s operations rely on the future. Trustmark also faces competition from many other typessecure processing, storage and transmission of financial institutions, including savings and loans, credit unions, finance companies, brokerage firms, insurance companies, factoring companiesconfidential and other financial intermediaries. Additionally, fintech developments, suchinformation within its computer systems and networks. Any failure, interruption or breach in security of these systems could result in significant disruption to Trustmark's operations. Trustmark has taken protective measures, which are continuously monitored and modified as blockchainwarranted; however, Trustmark’s computer systems, software and other distributed ledger technologies, have the potentialnetworks may fail to disrupt the financial industry and change the way banks do business. The financial services industry couldoperate properly or become even more competitivedisabled or damaged as a result of legislative, regulatory and technological changes and continued consolidation.
22
Some of Trustmark’s competitors have fewer regulatory constraints and may have lower cost structures. Additionally, due to their size, many of Trustmark’s larger competitors may be able to achieve economies of scale and, as a result, may offer a broader range of products and services as well as better pricing for those products and services than Trustmark.
Trustmark’s ability to compete successfully depends on a number of factors, including:including events that are wholly or partially beyond Trustmark’s control. There could be sudden increases in customer transaction volume; electrical, telecommunications or other major physical infrastructure outages; natural disasters; and events arising from local or larger scale political or social matters, including terrorist acts.
Further, Trustmark’s operational and security systems and infrastructure may be vulnerable to breaches and cybersecurity-related incidents including, but not limited to, attempts to access information, including customer and company information, malicious code, computer viruses and denial of service attacks that could result in unauthorized access, theft, misuse, loss, release or destruction of data (including confidential customer information), account takeovers, unavailability of service or other events. These types of threats may derive from human error, fraud or malice on the ability to develop, maintain and build upon long-term customer relationships based on top quality service, high ethical standards and safe, sound assets; the ability to continue to expand Trustmark’s market position through organic growth and acquisitions; the scope, relevance and pricingpart of products and services offered to meet customer needs and demands; the rate at which Trustmark introduces new products and services relative to its competitors; and industry and general economic trends. Failure to perform in anyexternal or internal parties, or may result from accidental technological failure. If one or more of these areasevents were to occur, Trustmark’s or its customers’ confidential and other information would be jeopardized, or such an event could significantly weakencause interruptions or malfunctions in Trustmark’s competitive position,or its customers’ or counterparties’ operations. Any failures related to upgrades and maintenance of Trustmark's technology and information systems could further increase its information and system security risk. Trustmark's increased use of cloud and other technologies, such as remote work technologies, also increases its risk of being subject to a cyber-attack. The risk of a security breach or disruption, particularly through cyber-attack or cyber intrusion, has increased as the number, intensity and sophistication of attempted attacks and intrusions from around the world have increased. Trustmark may be required to expend significant additional resources to modify its protective measures or to investigate and remediate vulnerabilities or other exposures in its computer systems and networks, and Trustmark may be subject to litigation and financial losses that are either not insured against or not fully covered through any insurance maintained by Trustmark. Any such losses, which may be difficult to detect, could adversely affect Trustmark’s financial condition or results of operations. In addition, the occurrence of such a loss could expose Trustmark to reputational risk, the loss of customer business and additional regulatory scrutiny.
Security breaches in Trustmark’s internet and mobile banking activities (myTrustmark®) could further expose Trustmark to possible liability and reputational risk. Any compromise in security could deter customers from using Trustmark’s internet and mobile banking services that involve the transmission of confidential information. Trustmark relies on standard internet security systems to provide the
24
security and authentication necessary to effect secure transmission of data. However, these precautions may not protect Trustmark’s systems from compromise or breaches of security, which could result in significant legal liability and significant damage to Trustmark’s reputation and business.
Trustmark relies upon certain third-party vendors to provide products and services necessary to maintain day-to-day operations. Accordingly, Trustmark’s operations are exposed to the risk that these vendors might not perform in accordance with applicable contractual arrangements or service level agreements or that the security of the third-party vendors’ computer systems, software and networks may be vulnerable to compromises that could impact information system security. Trustmark maintains a system of policies and procedures designed to monitor vendor risks. While Trustmark believes these policies and procedures effectively mitigate risk, the failure of an external vendor to perform in accordance with applicable contractual arrangements or service level agreements or any compromise in the security of an external vendor’s information systems could be disruptive to Trustmark’s operations, which could have a material adverse effect on its financial condition or results of operations.
As of the date of this Annual Report on Form 10-K, Trustmark has seen no material adverse impact on its business or operations from cyber-attacks or events. Trustmark's customers, employees and third parties that it does business with have been, and will continue to be, targeted by parties using fraudulent e-mails and other communications in attempts to misappropriate passwords, bank account information or other personal information or to introduce viruses or other malware programs to its information systems, the information systems of its merchants or third-party service providers and/or its customers' personal devices, which are beyond Trustmark's security control systems. Though Trustmark endeavors to mitigate these threats through product improvements, use of encryption and authentication technology and customer and employee education, such cyber-attacks against Trustmark, its merchants, third-party service providers and customers remain a serious issue and have been successful in the past.
Although Trustmark makes significant efforts to maintain the security and integrity of its information systems and has implemented various measures to manage the risks of a security breach or disruption, there can be no assurance that its security efforts and measures will be effective or that attempted security breaches or disruptions would not be successful or damaging. Even well protected information, networks, systems and facilities remain potentially vulnerable to attempted security breaches or disruptions because the techniques used in such attempts are constantly evolving and generally are not recognized until launched against a target, and in some cases are designed not to be detected and, in fact, may not be detected. Accordingly, Trustmark may be unable to anticipate these techniques or to implement adequate security barriers or other preventative measures, and thus it is virtually impossible for Trustmark to entirely mitigate this risk. Furthermore, in the event of a cyber-attack, Trustmark may be delayed in identifying or responding to the attack, which could increase the negative impact of the cyber-attack on its business, financial condition and results of operations. A security breach or other significant disruption of Trustmark's information systems or those related to its customers, merchants or third-party vendors, including as a result of cyber-attacks, could (i) disrupt the proper functioning of its networks and systems and therefore its operations and/or those of its customers; (ii) result in the unauthorized access to, and destruction, loss, theft, misappropriation or release of confidential, sensitive or otherwise valuable information of Trustmark or its customers; (iii) result in a violation of applicable privacy, data breach and other laws, subjecting Trustmark to additional regulatory scrutiny and exposing it to civil litigation, enforcement actions, governmental fines and possible financial liability; (iv) require significant management attention and resources to remedy the damages that result; or (v) harm Trustmark's reputation or cause a decrease in the number of customers that choose to do business with Trustmark. The occurrence of any of the foregoing could have a material adverse effect on Trustmark's business, financial condition and results of operations.
Trustmark must utilize new technologies to deliver its products and services, which could require significant resources and expose Trustmark to additional risks, including cyber-security risks.
In order to deliver new products and services and to improve the productivity of existing products and services, the banking industry relies on rapidly evolving technologies. Trustmark continues to invest in technology to facilitate the ability of its customers to engage in financial transactions, and otherwise enhance the customer experience with respect to its products and services. Trustmark’s ability to effectively utilize new technologies to address customer needs and create operating efficiencies could materially affect future prospects. Management cannot provide any assurances that Trustmark will be successful in utilizing such new technologies. Incorporation of new products and services, such as internet and mobile banking services, may require significant resources and expose Trustmark to additional risks, including cyber-security risks.
Trustmark’s controls and procedures may fail or be circumvented.
Trustmark’s internal controls, disclosure controls and procedures, and corporate governance policies and procedures are based in part on assumptions, and can provide only reasonable, not absolute, assurances that the objectives of the system are met. Any failure or circumvention of Trustmark’s controls and procedures or failure to comply with regulations related to controls and procedures could have a material adverse effect on Trustmark’s business, financial condition and results of operations.
25
Trustmark may be subject to increased claims and litigation, which could result in legal liability and reputational damage.
Trustmark has been named from time to time as a defendant in litigation relating to its businesses and activities. Litigation may include claims for substantial compensatory or punitive damages or claims for indeterminate amounts of damages.
In recent years, a number of judicial decisions have upheld the right of borrowers to sue lending institutions on the basis of various evolving legal theories, collectively termed “lender liability.” Generally, lender liability is founded on the premise that a lender has either violated a duty, whether implied or contractual, of good faith and fair dealing owed to the borrower or has assumed a degree of control over the borrower resulting in the creation of a fiduciary duty owed to the borrower or its other creditors or shareholders.
Substantial legal liability against Trustmark, including its subsidiaries, could materially adversely affect Trustmark’s business, financial condition or results of operations, or cause significant harm to its reputation. TNB recently agreed to settlements relating to litigation involving the Stanford Financial Group and Adams/Madison Timber. For additional information regarding these settlements, see the section captioned “Legal Proceedings” in Note 16 - Commitments and Contingencies included in Part II. Item 8. - Financial Statements and Supplementary Data of this report.
Damage to Trustmark’s reputation could have a significant negative impact on Trustmark’s business.
Trustmark’s ability to attract and retain customers, clients, investors, and highly-skilled management and employees is affected by its reputation. Significant harm to Trustmark’s reputation can also arise from other sources, including employee misconduct, actual or perceived unethical or illegal behavior, litigation or regulatory outcomes, failing to deliver minimum or required standards of service and quality, compliance failures, disclosure of confidential information, significant or numerous failures, interruptions or breaches of its information systems and the activities of its clients, customers and counterparties, including vendors. Actions by the financial services industry generally or by certain members or individuals in the industry may have a significant adverse effect on Trustmark’s reputation. Trustmark could also suffer significant reputational harm if it fails to properly identify and manage potential conflicts of interest. Management of potential conflicts of interests has become increasingly complex as Trustmark expands its business activities through more numerous transactions, obligations and interests with and among its clients. The actual or perceived failure to adequately address conflicts of interest could affect the willingness of clients to deal with Trustmark, which could adversely affect Trustmark’s businesses.
Risk Related to Acquisition Activity
Potential acquisitions by Trustmark may disrupt Trustmark’s business and dilute shareholder value.
Trustmark seekscontinuously monitors the market for merger or acquisition partners that are culturallyopportunities and, depending upon business and other considerations, may elect to pursue one or more such opportunities in the future. Any such merger or acquisition candidate would need to have a similar andculture to Trustmark, have experienced management and possess either significant market presence or have potential for improved profitability through financial management, economies of scale or expanded services, and Trustmark will likely continue to seek to acquire such businesses in the future.services. Acquiring other banks, businesses, or branches involves various risks commonly associated with acquisitions, including: potential exposure to unknown or contingent liabilities of the target company, exposure to potential asset quality issues of the target company, difficulty and expense of integrating the operations and personnel of the target company, potential disruption to Trustmark’s business, potential diversion of Trustmark’s Management’s time and attention, the possible loss of key employees and customers of the target company, difficulty in estimating the value of the target company and potential changes in banking or tax laws or regulations that may affect the target company. Acquisitions may involve the payment of a premium over book and market values, and, therefore, some dilution of Trustmark’s tangible book value and net income per share of common stock may occur in connection with any future transaction. Furthermore, failure to realize the expected revenue projections, cost savings, increases in geographic or product presence, and/or other projected benefits from an acquisition could have a material adverse effect on Trustmark’s financial condition or results of operations.
In addition, the acquisition of an insured depository institution that subsequently fails could significantly adversely affect an affiliated insured depository institution. Under cross-guarantee provisions of the FDI Act, the FDIC may recoup losses to the DIF by assessing a claim against insured depository institutions under common control for losses caused by the failure of an affiliated insured depository institution.General Risk Factors
The soundness of other financial institutions could adversely affect Trustmark.
Financial services institutions are interrelated as a result of trading, clearing, counterparty or other relationships. As a result, defaults by, or questions or rumors about, one or more financial services institutions or the financial services industry in general, could lead to market-wide liquidity problems, which could, in turn, lead to defaults or losses by Trustmark and by other institutions. Trustmark has exposure to many different industries and counterparties, and routinely executes transactions with counterparties in the financial services industry, including commercial banks, brokers and dealers, investment banks, mutual funds, and other institutional clients. Many of these transactions expose Trustmark to credit risk in the event of default of its counterparty or client. In addition, Trustmark’s credit risk may be exacerbated when the collateral it holds cannot be realized upon or is liquidated at prices not sufficient to recover the full amount of the credit or derivative exposure owed to Trustmark. Losses related to these credit risks could materially and adversely affect Trustmark’s results of operations.
Trustmark may experience disruptions of its operating systems or breaches in its information system security.
Trustmark is dependent upon communications and information systems to conduct business as such systems are used to manage virtually all aspects of Trustmark’s business. Trustmark’s operations rely on the secure processing, storage and transmission of confidential and other information within its computer systems and networks. Trustmark has taken protective measures, which are continuously monitored and modified as warranted; however, Trustmark’s computer systems, software and networks may fail to operate properly or become disabled or damaged as a result of a number of factors, including events that are wholly or partially beyond Trustmark’s control. There could be sudden increases in customer transaction volume; electrical, telecommunications or other major physical infrastructure outages; natural disasters; and events arising from local or larger scale political or social matters, including terrorist acts. Further, Trustmark’s operational and security systems and infrastructure may be vulnerable to breaches, unauthorized access, misuse, computer viruses or other malicious codes and cyber-attacks that could affect their information system security. If one or more of these events were to occur, Trustmark’s or its customers’ confidential and other information would be jeopardized, or such an event could cause interruptions or malfunctions in Trustmark’s or its customers’ or counterparties’ operations. Trustmark may be required to expend significant additional resources to modify its protective measures or to investigate and remediate vulnerabilities or other exposures in its computer systems and networks, and Trustmark may be subject to litigation and financial losses that are either not insured against or not fully covered through any insurance maintained by Trustmark. Any such losses, which
23
may be difficult to detect, could adversely affect Trustmark’s financial condition or results of operations. In addition, the occurrence of such a loss could expose Trustmark to reputational risk, the loss of customer business and additional regulatory scrutiny.
Security breaches in Trustmark’s internet and mobile banking activities (myTrustmarkSM) could further expose Trustmark to possible liability and reputational risk. Any compromise in security could deter customers from using Trustmark’s internet and mobile banking services that involve the transmission of confidential information. Trustmark relies on standard internet security systems to provide the security and authentication necessary to effect secure transmission of data. However, these precautions may not protect Trustmark’s systems from compromise or breaches of security, which could result in significant legal liability and significant damage to Trustmark’s reputation and business.
Trustmark relies upon certain third-party vendors to provide products and services necessary to maintain day-to-day operations. Accordingly, Trustmark’s operations are exposed to the risk that these vendors might not perform in accordance with applicable contractual arrangements or service level agreements or that the security of the third-party vendors’ computer systems, software and networks may be vulnerable to compromises that could impact information system security. Trustmark maintains a system of policies and procedures designed to monitor vendor risks. While Trustmark believes these policies and procedures effectively mitigate risk, the failure of an external vendor to perform in accordance with applicable contractual arrangements or service level agreements or any compromise in the security of an external vendor’s information systems could be disruptive to Trustmark’s operations, which could have a material adverse effect on its financial condition or results of operations.
Trustmark must utilize new technologies to deliver its products and services, which could require significant resources and expose Trustmark to additional risks, including cyber-security risks.
In order to deliver new products and services and to improve the productivity of existing products and services, the banking industry relies on rapidly evolving technologies. Trustmark’s ability to effectively utilize new technologies to address customer needs and create operating efficiencies could materially affect future prospects. Management cannot provide any assurances that Trustmark will be successful in utilizing such new technologies. Incorporation of new products and services, such as internet and mobile banking services, may require significant resources and expose Trustmark to additional risks, including cyber-security risks.
Trustmark’s use of third-party service providers and Trustmark’s other ongoing third-party business relationships are subject to increasing regulatory requirements and attention.
Trustmark regularly uses third-party service providers and subcontractors as part of its business. Trustmark also has substantial ongoing business relationships with partners and other third-parties, and relies on certain third-parties to provide products and services necessary to maintain day-to-day operations. These types of third-party relationships are subject to increasingly demanding regulatory requirements and attention by regulators, including the FRB, OCC, CFPB and FDIC. Under regulatory guidance, Trustmark is required to apply stringent due diligence, conduct ongoing monitoring and maintain effective control over third-party service providers and subcontractors and other ongoing third-party business relationships. Trustmark expects that the regulators will hold Trustmark responsible for deficiencies in its oversight and control of its third-party relationships and in the performance of the parties with which Trustmark has these relationships. Trustmark maintains a system of policies and procedures designed to ensure adequate due diligence is performed and to monitor vendor risks. While Trustmark believes these policies and procedures effectively mitigate risk, if the regulators conclude that Trustmark has not exercised adequate oversight and control over third-party service providers and subcontractors or other ongoing third-party business relationships or that such third-parties have not performed appropriately, Trustmark could be subject to enforcement actions, including civil monetary penalties or other administrative or judicial penalties or fines as well as requirements for customer remediation.
Trustmark’s controls and procedures may fail or be circumvented.
Trustmark’s internal controls, disclosure controls and procedures, and corporate governance policies and procedures are based in part on assumptions, and can provide only reasonable, not absolute, assurances that the objectives of the system are met. Any failure or circumvention of Trustmark’s controls and procedures or failure to comply with regulations related to controls and procedures could have a material adverse effect on Trustmark’s business, financial condition and results of operations.
24
The stock price of financial institutions, like Trustmark, can be volatile.
The volatility in the stock prices of companies in the financial services industry, such as Trustmark, may make it more difficult for shareholders to resell Trustmark common stock at attractive prices in a timely manner. Trustmark’s stock price can fluctuate significantly in response to a variety of factors, including factors affecting the financial industry as a whole.whole, such as the bank failures in March 2023. The factors affecting financial stocks generally and Trustmark’s stock price in particular include:
actual or anticipated variations in earnings;
changes in analysts’ recommendations or projections;
operating and stock performance of other companies deemed to be peers;
26
significant acquisitions or business combinations involving Trustmark or its competitors;
provisions in Trustmark’s by-laws and articles of incorporation that may discourage takeover attempts, which may make Trustmark less attractive to a potential purchaser;
changes in government regulation;
failure to integrate acquisitions or realize anticipated benefits from acquisitions; and
volatility affecting the financial markets in general.
General market fluctuations, the potential for breakdowns on electronic trading or other platforms for executing securities transactions, industry factors and general economic and political conditions could also cause Trustmark’s stock price to decrease regardless of operating results.
Changes in accounting standards may affect how Trustmark reports its financial condition and results of operations.
Trustmark’s accounting policies and methods are fundamental to how Trustmark records and reports its financial condition and results of operations. From time to time, the Financial Accounting Standards Board (FASB)FASB changes the financial accounting and reporting standards that govern the preparation of Trustmark’s financial statements. The most recent economic recession resulted in increased scrutiny of accounting standards by regulators and legislators, particularly as they relate to fair value accounting principles. In addition, ongoing efforts to achieve convergence between U.S. generally accepted accounting principles (GAAP) and International Financial Reporting Standards may result in changes to GAAP. Any such changes can be difficult to predict and can materially affect how Trustmark records and reports its financial condition or results of operations. For example, in June 2016, the FASB issued Accounting Standards Update (ASU) 2016-13, “Financial Instruments-Credit Losses (Topic 326): Measurement of Credit Losses on Financial Instruments,” which replaces the current incurred loss impairment methodology with a methodology that reflects all current expected credit losses (CECL) and requires consideration of a broader range of reasonable and supportable information to determine credit loss estimates. Trustmark intends to adopt ASU 2016-13 during the first quarter of 2020, and adoption of this ASU could materially affect its allowance for loan losses methodology, financial condition, capital levels and results of operations, including expenses Trustmark may incur in implementing this ASU. For additional details regarding recently adopted and pending accounting pronouncements, see Note 1 – Significant Accounting Policies included in Part II. Item 8. - Financial Statements and Supplementary Data of this report.
Trustmark may not be able to attract or retain key employees.
Trustmark’s success depends substantially on its ability to attract and retain skilled, experienced personnel. Competition for qualified candidates in the activities and markets that Trustmark serves is intense. While Trustmark invests significantly in the training and developmentsdevelopment of its employees, it is possible that Trustmark may not be able to retain key employees. If Trustmark were unable to retain its most qualified employees, its performance and competitive positioning could be materially adversely affected.
Natural disasters, such as hurricanes, could have a significant negative impact on Trustmark’s business.
Many of Trustmark’s loans are secured by property or are made to businesses in or near the Gulf Coast regions of Alabama, Florida, Mississippi and Texas, which are often in the path of seasonal hurricanes. Natural disasters, such as hurricanes, could have a significant negative impact on the stability of Trustmark’s deposit base, the ability of borrowers to repay outstanding loans and the value of collateral securing loans, and could cause Trustmark to incur material additional expenses. Although Management has established disaster recovery policies and procedures, the occurrence of a natural disaster, especially if any applicable insurance coverage is not adequate to enable Trustmark’s borrowers to recover from the effects of the event, could have a material adverse effect on Trustmark’s financial condition or results of operations.
25
Trustmark may be subject to increased claimsExpectations around Environmental, Social and litigation, whichGovernance (ESG) practices as well as climate change and related legislative and regulatory initiatives could result in legal liability and reputational damage.
Trustmark has been named from time to time as a defendant in litigation relating to its businesses and activities. Litigation may include claims for substantial compensatory or punitive damages or claims for indeterminate amounts of damages.
In recent years, a number of judicial decisions have upheld the right of borrowers to sue lending institutions on the basis of various evolving legal theories, collectively termed “lender liability.” Generally, lender liability is founded on the premise that a lender has either violated a duty, whether implied or contractual, of good faith and fair dealing owed to the borrower or has assumed a degree of control over the borrower resulting in the creation of a fiduciary duty owed to the borrower or its other creditors or shareholders.
Substantial legal liability against Trustmark, including its subsidiaries, could materially adversely affect Trustmark’s business financial condition orand results of operations, or cause significant harmincluding indirectly through impact to our reputation.its customers.
DamageCompanies are facing increased scrutiny from customers, regulators and other stakeholders with respect to their ESG practices and disclosures. Institutional investors, and investor advocacy groups, in particular, are increasingly focused on these matters and expectations in many of these areas can vary widely. In addition, increased ESG related compliance costs could result in increases to Trustmark’s reputationoverall operational costs. Failure to adapt to or comply with regulatory requirements or investor or stakeholder expectations and standards, and fluctuations in these standards, could have a significant negativenegatively impact on Trustmark’s business.
Trustmark’sreputation, ability to attractdo business with certain partners and retain customers, clients, investors,its stock price. New government regulations could also result in new or more stringent forms of ESG oversight and highly-skilled managementexpanding mandatory and employees is affected by its reputation. Public perceptionvoluntary reporting, diligence and disclosure.
In addition to regulatory and investor expectations on environmental matters in general, the current and anticipated effects of climate change are creating an increasing level of concern for the state of the financial services industry declinedglobal environment. As a result, political and social attention to the issue of climate change has increased. In recent years, governments across the world have entered into international agreements to attempt to reduce global temperatures, in part by limiting greenhouse gas emissions. The United States Congress, state legislatures and
27
federal and state regulatory agencies have continued to propose and advance numerous legislative and regulatory initiatives seeking to mitigate the effects of climate change. These agreements and measures may result in the imposition of taxes and fees, the required purchase of emission credits and the implementation of significant operational changes, each of which may require businesses to expend significant capital and incur compliance, operating, maintenance and remediation costs. Consumers and businesses also may change their behavior on their own as a result of the economic downturnthese concerns.
It is not possible to predict how climate change may impact Trustmark’s financial condition and related government response.operations; however, Trustmark faces increased public and regulatory scrutiny resulting from the financial crisis and economic downturn. Significant harm to Trustmark’s reputation can also arise from other sources, including employee misconduct, actual or perceived unethical behavior, litigation or regulatory outcomes, failing to deliver minimum or required standards of service and quality, compliance failures, disclosure of confidential information, significant or numerous failures, interruptions or breaches ofoperates in areas where its information systemsbusiness and the activities of its clients, customers and counterparties, including vendors. Actionscould be impacted by the financial services industry generallyeffects of climate change. The effects of climate change may include increased frequency or by certain membersseverity of weather-related events, such as severe storms, hurricanes, flooding and droughts and rising sea levels. These effects can disrupt business operations, damage property, devalue assets and change customer and business preferences, which may adversely affect borrowers, increase credit risk and reduce demand for Trustmark’s products and services. Trustmark and its customers will need to respond to new laws and regulations as well as consumer and business preferences resulting from climate change concerns. Trustmark and its customers may face cost increases, asset value reductions, operating process changes and the like. The impact to Trustmark’s customers will likely vary depending on their specific attributes, including reliance on or individualsrole in carbon intensive activities. In addition, Trustmark could face reductions in creditworthiness on the part of some customers or in the industryvalue of assets securing loans. Trustmark’s efforts to take these risks into account may not be effective in protecting it from the negative impact of new laws and regulations or changes in consumer or business behavior and could have a significantmaterial adverse effect on Trustmark’s reputation. financial condition and results of operations.
ITEM 1B. UNRESOLVED STAFF COMMENTS
None
ITEM 1C. CYBERSECURITY
Trustmark couldrecognizes the critical importance of identifying, assessing and managing material risks from cybersecurity threats. Trustmark is committed to implementing and maintaining a comprehensive information security program to manage such risks and safeguard its systems and data.
Trustmark’s Board of Directors has ultimate oversight of cybersecurity-related risks and it is assisted in this role by the Enterprise Risk Committee and the Audit Committee. Processes for identifying, assessing and managing cybersecurity-related risks are integrated into Trustmark’s overall enterprise risk management process, which is overseen by the Enterprise Risk Committee. The Enterprise Risk Committee is responsible for monitoring risks that are being taken by Trustmark, understanding the enterprise-wide effect of those risks and reporting such risks to the Board. In fulfilling this role, the Enterprise Risk Committee has primary oversight responsibility over management’s efforts to manage and mitigate cybersecurity-related risk and reviews and approves Trustmark’s cybersecurity strategy for protecting Trustmark’s information assets and technology platforms. The Audit Committee oversees Trustmark’s Internal Audit Department, which conducts reviews and assessments related to information security. Management provides periodic reports to the Enterprise Risk Committee and the Audit Committee, both of which provide reports of their meetings to the full Board. These reports to the Board and its Committees address the threat environment, vulnerability assessments, specific cyber incidents and management’s efforts to monitor, detect and prevent cyber threats.
Trustmark’s information security program is primarily administered at the management level by the Information Security Department, which is led by Trustmark’s Chief Information Security Officer (CISO), and is supported by the Information Technology Department, which is led by Trustmark’s Chief Information Officer (CIO). The CISO reports to the CIO, who in turn reports to Trustmark’s Chief Credit and Operations Officer. Trustmark’s Information Security Department is responsible for day-to-day management of Trustmark’s information security program, including data loss prevention, access control, threat monitoring, incident response and employee education and training. The Information Security Department also suffer significant reputational harm if it failsmaintains policies related to properly identifycybersecurity and manage potential conflictsdata security that provide the required governance for the information security program. Additionally, Trustmark’s Information Technology Department maintains policies that govern technical aspects of interest.Trustmark’s information security program. Each policy is reviewed and approved by the Enterprise Risk Committee at least every three years and is mapped to applicable regulatory guidance. The Cybersecurity Operations team within the Information Technology Department maintains and runs Trustmark’s security operations center and is responsible for cybersecurity event management and maintaining security tooling. Trustmark also maintains an Information Security / Cybersecurity Management Committee, which is comprised of potential conflictsrepresentatives from the Information Security, Information Technology, Enterprise Risk, Corporate Security, Internal Audit and Legal departments and members of interestsexecutive management. This committee meets quarterly to discuss and review Trustmark’s information security program and receives qualitative and quantitative update reports from the Information Security Department, Internal Audit Department and Information Technology Department.
Trustmark engages third party assessors, consultants and auditors in connection with its information security program, including to conduct external penetration testing, independent audits and risk assessments. Trustmark also utilizes third party service providers in
28
the ordinary course of business. The Information Security Department performs information security assessments for third party service providers that store or process Trustmark confidential data. These information security assessments include a review of any systems and organization control reports, proof of the vendor’s independent testing of their data protection controls, as well as a review of any exceptions noted and assessment of management responses, results of vulnerability and penetration testing, incident response processes and third party data protection controls (which can include, but is not limited to: access reviews and controls, backups, monitoring, encryption standards and disaster recovery). The review of these areas is taken into account in order to provide an overall information security conclusion and risk rating for the vendor.
As a regulated financial institution, Trustmark is also subject to financial privacy laws and its cybersecurity practices are subject to oversight by the federal banking agencies. For additional information, see “Supervision and Regulation – Financial Privacy Laws and Cybersecurity” included in Part I. Item 1 – Business of this report.
Although Trustmark has become increasingly complexnot, as Trustmark expandsof the date of this Annual Report on Form 10-K, experienced a cybersecurity threat or incident that materially affected its business activities through more numerous transactions, obligationsstrategy, results of operations or financial condition, there can be no guarantee that Trustmark will not experience such an incident in the future. For additional information regarding the risk Trustmark faces from cybersecurity threats, please see the risk factors titled “Trustmark may experience disruptions of its operating systems or breaches in its information system security” and interests with“Trustmark must utilize new technologies to deliver its products and among its clients. The actual or perceived failure to adequately address conflicts of interest could affect the willingness of clients to deal with Trustmark,services, which could adversely affect Trustmark’s businesses.require significant resources and expose Trustmark to additional risks, including cyber-security risks” included in Part I. Item 1A. – Risk Factors of this report.
NoneITEM 2. PROPERTIES
Trustmark’s principal offices are housed in its complexmain office building located in downtown Jackson, Mississippi and owned by TNB. Approximately 235,000 square feet, or 89%, of the available space in theTrustmark’s main office building is primarily allocated tofor bank use with the remainder occupied ora small portion available for occupancy by tenants on a lease basis. As ofbasis, although such incidental leasing activity is not material to Trustmark’s operations. At December 31, 2017,2023, Trustmark, through TNB, also operated 178163 full-service branches, 207 limited-service branches and an ATMautomated teller machine (ATM) network, which included 180131 ATMs and 128 ITMs at on-premise locations, 66 ATMs located at off-premise sitesits branches and three interactive teller machines (ITMs) located at off-premise sites.other locations. In addition, Trustmark’s Mortgage Banking Group utilized six off-siteTrustmark operated 13 offices in various locations the Wealth Management Division utilized one off-site locationproviding mortgage banking, wealth management and the Insurance Division utilized five off-site locations.insurance services. Trustmark leases 9032 of its 279branch and other office locations with the remainder being owned. Trustmark believes its properties are suitable and adequate to operate its financial services business.
Trustmark’s wholly-owned subsidiary, TNB, has been named as a defendant in three lawsuits related to the collapse of the Stanford Financial Group. The first is a purported class action complaint that was filed on August 23, 2009 in the District Court of Harris County, Texas, by Peggy Roif Rotstain, Guthrie Abbott, Catherine Burnell, Steven Queyrouze, Jaime Alexis Arroyo Bornstein and Juan C. Olano (collectively, Class Plaintiffs), on behalf of themselves and all others similarly situated, naming TNB and four other financial institutions unaffiliated with Trustmark as defendants. The complaint seeks to recover (i) alleged fraudulent transfers from each of the defendants in the amount of fees and other monies received by each defendant from entities controlled by R. Allen Stanford (collectively, the Stanford Financial Group) and (ii) damages allegedly attributable to alleged conspiracies by one or more of the defendants with the Stanford Financial Group to commit fraud and/or aid and abet fraud on the asserted grounds that defendants knew or should have known the Stanford Financial Group was conducting an illegal and fraudulent scheme. Plaintiffs have demanded a jury trial. Plaintiffs did not quantify damages.
In November 2009, the lawsuit was removed to federal court by certain defendants and then transferred by the United States Panel on Multidistrict Litigation to federal court in the Northern District of Texas (Dallas) where multiple Stanford related matters are being consolidated for pre-trial proceedings. In May 2010, all defendants (including TNB) filed motions to dismiss the lawsuit. In AugustITEM 3. LEGAL PROCEEDINGS
26
2010, the court authorized and approved the formation of an Official Stanford Investors Committee (OSIC) to represent the interests of Stanford investors and, under certain circumstances, to file legal actions for the benefit of Stanford investors. In December 2011, the OSIC filed a motion to interveneInformation required in this action. In September 2012,section is set forth under the district court referred the case to a magistrate judge for hearingheading “Legal Proceedings” of Note 16 – Commitments and determinationContingencies in Part II. Item 8. – Financial Statements and Supplementary Data of certain pretrial issues. In December 2012, the court granted the OSIC’s motion to intervene, and the OSIC filed an Intervenor Complaint against one of the other defendant financial institutions. In February 2013, the OSIC filed a second Intervenor Complaint that asserts claims against TNB and the remaining defendant financial institutions. The OSIC seeks to recover: (i) alleged fraudulent transfers in the amount of the fees each of the defendants allegedly received from Stanford Financial Group, the profits each of the defendants allegedly made from Stanford Financial Group deposits, and other monies each of the defendants allegedly received from Stanford Financial Group; (ii) damages attributable to alleged conspiracies by each of the defendants with the Stanford Financial Group to commit fraud and/or aid and abet fraud and conversion on the asserted grounds that the defendants knew or should have known the Stanford Financial Group was conducting an illegal and fraudulent scheme; and (iii) punitive damages. The OSIC did not quantify damages. this report.
In July 2013, all defendants (including TNB) filed motions to dismiss the OSIC’s claims. In March 2015, the court entered an order authorizing the parties to conduct discovery regarding class certification, staying all other discovery and setting a deadline for the parties to complete briefing on class certification issues. In April 2015, the court granted in part and denied in part the defendants’ motions to dismiss the Class Plaintiffs’ claims and the OSIC’s claims. The court dismissed all of the Class Plaintiffs’ fraudulent transfer claims and dismissed certain of the OSIC’s claims. The court denied the motions by TNB and the other financial institution defendants to dismiss the OSIC’s constructive fraudulent transfer claims.
On June 23, 2015, the court allowed the Class Plaintiffs to file a Second Amended Class Action Complaint (SAC), which asserted new claims against TNB and certain of the other defendants for (i) aiding, abetting and participating in a fraudulent scheme, (ii) aiding, abetting and participating in violations of the Texas Securities Act, (iii) aiding, abetting and participating in breaches of fiduciary duty, (iv) aiding, abetting and participating in conversion and (v) conspiracy. On July 14, 2015, the defendants (including TNB) filed motions to dismiss the SAC and to reconsider the court’s prior denial to dismiss the OSIC’s constructive fraudulent transfer claims against TNB and the other financial institutions that are defendants in the action. On July 27, 2016, the court denied the motion by TNB and the other financial institution defendants to dismiss the SAC and also denied the motion by TNB and the other financial institution defendants to reconsider the court’s prior denial to dismiss the OSIC’s constructive fraudulent transfer claims. On August 24, 2016, TNB filed its answer to the SAC. On October 20, 2017, the OSIC filed a motion seeking an order lifting the discovery stay and establishing a trial schedule. On November 7, 2017, the court denied the OSIC’s motion seeking class certification and designation of class representatives and counsel, finding that common issues of fact did not predominate. The court granted the OSIC’s motion to lift the discovery stay that it had previously ordered.
The second Stanford-related lawsuit was filed on December 14, 2009 in the District Court of Ascension Parish, Louisiana, individually by Harold Jackson, Paul Blaine, Carolyn Bass Smith, Christine Nichols, and Ronald and Ramona Hebert naming TNB (misnamed as Trust National Bank) and other individuals and entities not affiliated with Trustmark as defendants. The complaint seeks to recover the money lost by these individual plaintiffs as a result of the collapse of the Stanford Financial Group (in addition to other damages) under various theories and causes of action, including negligence, breach of contract, breach of fiduciary duty, negligent misrepresentation, detrimental reliance, conspiracy, and violation of Louisiana’s uniform fiduciary, securities, and racketeering laws. The complaint does not quantify the amount of money the plaintiffs seek to recover. In January 2010, the lawsuit was removed to federal court by certain defendants and then transferred by the United States Panel on Multidistrict Litigation to federal court in the Northern District of Texas (Dallas) where multiple Stanford related matters are being consolidated for pre-trial proceedings. On March 29, 2010, the court stayed the case. TNB filed a motion to lift the stay, which was denied on February 28, 2012. In September 2012, the district court referred the case to a magistrate judge for hearing and determination of certain pretrial issues.
On April 11, 2016, Trustmark learned that a third Stanford-related lawsuit had been filed on that date in the Superior Court of Justice in Ontario, Canada, by The Toronto-Dominion Bank (TD Bank), naming TNB and three other financial institutions not affiliated with Trustmark as defendants. The complaint seeks a declaration specifying the degree to which each of TNB and the other defendants are liable in respect of any loss and damage for which TD Bank is found to be liable in a litigation commenced against TD Bank brought by the Joint Liquidators of Stanford International Bank Limited in the Superior Court of Justice, Commercial List in Ontario, Canada (the Joint Liquidators’ Action), as well as contribution and indemnity in respect of any judgment, interest and costs TD Bank is ordered to pay in the Joint Liquidators’ Action. To date, TNB has not been served in connection with this action.
TNB’s relationship with the Stanford Financial Group began as a result of Trustmark’s acquisition of a Houston-based bank in August 2006, and consisted of correspondent banking and other traditional banking services in the ordinary course of business. All Stanford-related lawsuits are in pre-trial stages.
27
Trustmark and its subsidiaries are also parties to other lawsuits and other claims that arise in the ordinary course of business. Some of the lawsuits assert claims related to the lending, collection, servicing, investment, trust and other business activities, and some of the lawsuits allege substantial claims for damages.
All pending legal proceedings described above are being vigorously contested. In accordance FASB Accounting Standards Codification (ASC) TopicASC Subtopic 450-20, “Loss Contingencies,” Trustmark will establish an accrued liability for litigation matters when those matters present loss contingencies that are both probable and reasonably estimable. As a result of the entry into the Stanford Settlement relating to the litigation involving the Stanford Financial Group, Trustmark recognized a $100.0 million litigation settlement expense included in noninterest expense during 2022, plus an additional $750 thousand in related legal fees. As a result of the entry into the Adams/Madison Timber Settlement relating to the litigation involving Adams/Madison Timber, Trustmark recognized a $6.5 million litigation settlement expense included in noninterest expense during 2023. At the present time, ManagementTrustmark believes, based on its evaluation and the advice of legal counsel, and Management’s evaluation, that a loss in any suchcurrently pending legal proceeding is not probable and reasonably estimable. All matters will continue to be monitored for further developments that would make such loss contingency both probable and reasonably estimable. In view of the inherent difficulty of predicting the outcome of legal proceedings, Trustmark cannot predict the eventual outcomes of the currently pending matters or the timing of their ultimate resolution. Management currently believes, however, based upon the advice of legal counsel and Management’s evaluation and after taking into account its current insurance coverage, that the legal proceedings currently pending should not have a material adverse effect on Trustmark’s consolidated financial condition.
ITEM 4. MINE SAFETY DISCLOSURES
Not applicable.
|
|
ITEM 5. MARKET FOR THE REGISTRANT’S COMMON EQUITY, RELATED STOCKHOLDER MATTERS AND ISSUER PURCHASES OF EQUITY SECURITIES
Common Stock Prices and Dividends
Trustmark’s common stock is listed on the NASDAQNasdaq Stock Market and is traded under the symbol TRMK. The table below represents, for each quarter“TRMK.”
29
Trustmark paid quarterly cash dividends to shareholders of 2017 and 2016, the high and low intra-day sales price$0.23 per share, or $0.92 per share annually, in 2023. As a component of Trustmark’sreturn to common stock and theshareholders, Trustmark intends to pay cash dividends when corporate financial performance and capital strength allow it to do so. All dividend payments must be approved and declared per common share.by the Board of Directors of Trustmark and are required to be in compliance with all applicable laws and regulations.
|
| 2017 |
|
| 2016 |
| ||||||||||
Sales Price Per Share |
| High |
|
| Low |
|
| High |
|
| Low |
| ||||
First quarter |
| $ | 36.58 |
|
| $ | 30.03 |
|
| $ | 23.64 |
|
| $ | 19.75 |
|
Second quarter |
|
| 34.15 |
|
|
| 29.99 |
|
|
| 25.29 |
|
|
| 21.93 |
|
Third quarter |
|
| 33.42 |
|
|
| 28.16 |
|
|
| 28.70 |
|
|
| 23.67 |
|
Fourth quarter |
|
| 35.09 |
|
|
| 31.24 |
|
|
| 36.79 |
|
|
| 26.81 |
|
Dividends Per Share |
|
|
|
|
| 2017 |
|
| 2016 |
| ||
First quarter |
|
|
|
|
| $ | 0.23 |
|
| $ | 0.23 |
|
Second quarter |
|
|
|
|
|
| 0.23 |
|
|
| 0.23 |
|
Third quarter |
|
|
|
|
|
| 0.23 |
|
|
| 0.23 |
|
Fourth quarter |
|
|
|
|
|
| 0.23 |
|
|
| 0.23 |
|
Total |
|
|
|
|
| $ | 0.92 |
|
| $ | 0.92 |
|
At January 31, 2018,2024, there were approximately 3,7002,936 registered shareholders of record and approximately 38,00015,952 beneficial account holders of shares in nominee name of Trustmark’s common stock. Other information required by this item can be found in Note 17 - Shareholders’ Equity included in Part II. Item 8. - Financial Statements and Supplementary Data of this report.
Stock Repurchase Program
On March 11, 2016,January 28, 2020, the Board of Directors of Trustmark authorized a stock repurchase program, effective April 1, 2020, under which $100.0 million of Trustmark’s outstanding common stock maycould be acquired through March 31, 2019. The shares may be purchased from time to time at prevailing market prices, through open market or privately negotiated transactions, depending on market conditions. Trustmark repurchased none of its common stock during the year ended December 31, 2017.2021. Under this authority, Trustmark repurchased approximately 341.9 million shares of its outstanding common stock valued at $61.8 million during 2021.
On December 7, 2021, the Board of Directors of Trustmark authorized a stock repurchase program, effective January 1, 2022, under which $100.0 million of Trustmark’s outstanding common stock could be acquired through December 31, 2022. Under this authority, Trustmark repurchased approximately 789 thousand shares of its common stock valuedvalue at approximately $750 thousand$24.6 million during 2022.
On December 6, 2022, the year endedBoard of Directors of Trustmark authorized a stock repurchase program, effective January 1, 2023, under which $50.0 million of Trustmark's outstanding common stock could be acquired through December 31, 2016.2023. No shares were repurchased under this authority.
28On December 5, 2023, the Board of Directors of Trustmark authorized a new stock repurchase program, effective January 1, 2024, under which $50.0 million of Trustmark's outstanding common stock may be acquired through December 31, 2024. The repurchase program, which is subject to market conditions and management discretion, will be implemented through open market repurchases or privately negotiated transactions. No shares have been repurchased under this authority.
30
Performance Graph
The following graph compares Trustmark’s annual percentage change in cumulative total return on common shares over the past five years with the cumulative total return of companies comprising the NASDAQNasdaq market value index and the Morningstar BanksS&P 500 – Regional – USBanks index. The Morningstar BanksS&P 500 – Regional – USBanks index is an industry index published by MorningstarS&P Dow Jones Indices, a division of S&P Global, and consistsis comprised of 1,000 large, regional, diverse financial institutions serving the corporate, government and consumer needs of retail banking, investment banking, trust management, credit cards and mortgage bankingstock in the United States.S&P Total Market Index that are classified in the Global Industry Classification Standard regional banks sub-industry. This presentation assumes that $100 was invested in shares of the relevant issuers on December 31, 2012,2018, and that dividends received were immediately invested in additional shares. The graph plots the value of the initial $100 investment at one-year intervals for the fiscal years shown.
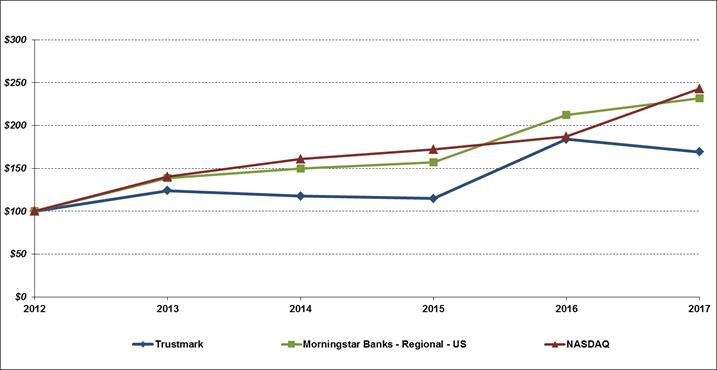

Company |
| 2018 |
|
| 2019 |
|
| 2020 |
|
| 2021 |
|
| 2022 |
|
| 2023 |
| ||||||
Trustmark |
| $ | 100.00 |
|
| $ | 124.73 |
|
| $ | 102.39 |
|
| $ | 125.30 |
|
| $ | 138.67 |
|
| $ | 115.09 |
|
NASDAQ Composite-Total Return |
|
| 100.00 |
|
|
| 136.69 |
|
|
| 198.10 |
|
|
| 242.03 |
|
|
| 163.28 |
|
|
| 236.17 |
|
S&P 500 - Regional Banks |
|
| 100.00 |
|
|
| 135.42 |
|
|
| 129.28 |
|
|
| 181.68 |
|
|
| 135.32 |
|
|
| 106.07 |
|
Prepared by Zacks Investment Research, Inc. Used with permission. All rights reserved. Copyright 1980-2024.
Index Data: Copyright NASDAQ OMX, Inc. Used with permission. All rights reserved.
Index Data: Copyright Standard and Poor’s, Inc. Used with permission. All rights reserved.
Company | 2012 |
| 2013 |
| 2014 |
| 2015 |
| 2016 |
| 2017 |
| ||||||
Trustmark |
| 100.00 |
|
| 123.88 |
|
| 117.73 |
|
| 114.87 |
|
| 183.94 |
|
| 169.18 |
|
Morningstar Banks - Regional - US |
| 100.00 |
|
| 138.74 |
|
| 149.60 |
|
| 156.82 |
|
| 212.44 |
|
| 231.79 |
|
NASDAQ |
| 100.00 |
|
| 140.12 |
|
| 160.78 |
|
| 171.97 |
|
| 187.22 |
|
| 242.71 |
|
31
ITEM 6. SELECTED FINANCIAL DATA
29
The following unaudited consolidated financial data is derived from Trustmark’s audited financial statements as of and for the fivethree years ended December 31, 20172023 ($ in thousands, except per share data). The data should be read in conjunction with Part II. Item 7. - Management’s Discussion and Analysis of Financial Condition and Results of Operations and Item 8. – Financial Statements and Supplementary Data.
Years Ended December 31, |
| 2023 |
|
| 2022 |
|
| 2021 |
| |||
Consolidated Statements of Income |
|
|
|
|
|
|
|
|
| |||
Total interest income |
| $ | 878,832 |
|
| $ | 541,833 |
|
| $ | 442,511 |
|
Total interest expense |
|
| 325,954 |
|
|
| 47,125 |
|
|
| 24,160 |
|
Net interest income |
|
| 552,878 |
|
|
| 494,708 |
|
|
| 418,351 |
|
Provision for credit losses (PCL), LHFI |
|
| 27,362 |
|
|
| 21,677 |
|
|
| (21,499 | ) |
PCL, off-balance sheet credit exposures |
|
| (2,781 | ) |
|
| 1,215 |
|
|
| (2,949 | ) |
Noninterest income |
|
| 206,958 |
|
|
| 205,144 |
|
|
| 221,910 |
|
Noninterest expense |
|
| 537,919 |
|
|
| 603,213 |
|
|
| 489,296 |
|
Income before income taxes |
|
| 197,336 |
|
|
| 73,747 |
|
|
| 175,413 |
|
Income taxes |
|
| 31,847 |
|
|
| 1,860 |
|
|
| 28,048 |
|
Net Income |
| $ | 165,489 |
|
| $ | 71,887 |
|
| $ | 147,365 |
|
|
|
|
|
|
|
|
|
|
| |||
Total Revenue (1) |
| $ | 759,836 |
|
| $ | 699,852 |
|
| $ | 640,261 |
|
|
|
|
|
|
|
|
|
|
| |||
Per Share Data |
|
|
|
|
|
|
|
|
| |||
Basic earnings per share |
| $ | 2.71 |
|
| $ | 1.17 |
|
| $ | 2.35 |
|
Diluted earnings per share |
|
| 2.70 |
|
|
| 1.17 |
|
|
| 2.34 |
|
Cash dividends per share |
|
| 0.92 |
|
|
| 0.92 |
|
|
| 0.92 |
|
|
|
|
|
|
|
|
|
|
| |||
Performance Ratios |
|
|
|
|
|
|
|
|
| |||
Return on average equity |
|
| 10.54 | % |
|
| 4.48 | % |
|
| 8.32 | % |
Return on average tangible equity |
|
| 14.04 | % |
|
| 6.00 | % |
|
| 10.81 | % |
Return on average assets |
|
| 0.89 | % |
|
| 0.41 | % |
|
| 0.86 | % |
Average equity / average assets |
|
| 8.41 | % |
|
| 9.18 | % |
|
| 10.38 | % |
Net interest margin (fully taxable equivalent) |
|
| 3.32 | % |
|
| 3.17 | % |
|
| 2.76 | % |
Dividend payout ratio |
|
| 33.95 | % |
|
| 78.63 | % |
|
| 39.15 | % |
|
|
|
|
|
|
|
|
|
| |||
Credit Quality Ratios (2) |
|
|
|
|
|
|
|
|
| |||
Net charge-offs (recoveries)/average loans |
|
| 0.06 | % |
|
| 0.01 | % |
|
| -0.04 | % |
PCL, LHFI / average loans |
|
| 0.21 | % |
|
| 0.19 | % |
|
| -0.21 | % |
Nonaccrual LHFI / (LHFI + LHFS) |
|
| 0.76 | % |
|
| 0.53 | % |
|
| 0.60 | % |
Nonperforming assets / (LHFI + LHFS) |
|
| 0.81 | % |
|
| 0.55 | % |
|
| 0.64 | % |
Allowance for credit losses (ACL), LHFI / LHFI |
|
| 1.08 | % |
|
| 0.99 | % |
|
| 0.97 | % |
Years Ended December 31, |
| 2017 |
|
| 2016 |
|
| 2015 |
|
| 2014 |
|
| 2013 |
| |||||
Consolidated Statements of Income |
|
|
|
|
|
|
|
|
|
|
|
|
|
|
|
|
|
|
|
|
Total interest income |
| $ | 449,795 |
|
| $ | 412,080 |
|
| $ | 412,225 |
|
| $ | 426,882 |
|
| $ | 414,346 |
|
Total interest expense |
|
| 42,245 |
|
|
| 24,547 |
|
|
| 20,460 |
|
|
| 21,546 |
|
|
| 25,859 |
|
Net interest income |
|
| 407,550 |
|
|
| 387,533 |
|
|
| 391,765 |
|
|
| 405,336 |
|
|
| 388,487 |
|
Provision for loan losses, LHFI |
|
| 15,094 |
|
|
| 10,957 |
|
|
| 8,375 |
|
|
| 1,211 |
|
|
| (13,421 | ) |
Provision for loan losses, acquired loans |
|
| (7,395 | ) |
|
| 3,757 |
|
|
| 3,425 |
|
|
| 6,171 |
|
|
| 6,039 |
|
Noninterest income |
|
| 184,663 |
|
|
| 173,943 |
|
|
| 173,149 |
|
|
| 173,142 |
|
|
| 173,859 |
|
Noninterest expense |
|
| 430,169 |
|
|
| 407,298 |
|
|
| 401,662 |
|
|
| 409,005 |
|
|
| 415,731 |
|
Income before income taxes |
|
| 154,345 |
|
|
| 139,464 |
|
|
| 151,452 |
|
|
| 162,091 |
|
|
| 153,997 |
|
Income taxes |
|
| 48,715 |
|
|
| 31,053 |
|
|
| 35,414 |
|
|
| 38,529 |
|
|
| 36,937 |
|
Net Income |
| $ | 105,630 |
|
| $ | 108,411 |
|
| $ | 116,038 |
|
| $ | 123,562 |
|
| $ | 117,060 |
|
|
|
|
|
|
|
|
|
|
|
|
|
|
|
|
|
|
|
|
|
|
Revenue (1) |
|
|
|
|
|
|
|
|
|
|
|
|
|
|
|
|
|
|
|
|
Total revenue |
| $ | 592,213 |
|
| $ | 561,476 |
|
| $ | 564,914 |
|
| $ | 578,478 |
|
| $ | 562,346 |
|
|
|
|
|
|
|
|
|
|
|
|
|
|
|
|
|
|
|
|
|
|
Per Share Data |
|
|
|
|
|
|
|
|
|
|
|
|
|
|
|
|
|
|
|
|
Basic earnings per share |
| $ | 1.56 |
|
| $ | 1.60 |
|
| $ | 1.72 |
|
| $ | 1.83 |
|
| $ | 1.75 |
|
Diluted earnings per share |
|
| 1.56 |
|
|
| 1.60 |
|
|
| 1.71 |
|
|
| 1.83 |
|
|
| 1.75 |
|
Cash dividends per share |
|
| 0.92 |
|
|
| 0.92 |
|
|
| 0.92 |
|
|
| 0.92 |
|
|
| 0.92 |
|
|
|
|
|
|
|
|
|
|
|
|
|
|
|
|
|
|
|
|
|
|
Performance Ratios |
|
|
|
|
|
|
|
|
|
|
|
|
|
|
|
|
|
|
|
|
Return on average equity |
|
| 6.77 | % |
|
| 7.14 | % |
|
| 7.94 | % |
|
| 8.83 | % |
|
| 8.75 | % |
Return on average tangible equity |
|
| 9.39 | % |
|
| 9.99 | % |
|
| 11.36 | % |
|
| 12.97 | % |
|
| 13.09 | % |
Return on average assets |
|
| 0.77 | % |
|
| 0.84 | % |
|
| 0.95 | % |
|
| 1.03 | % |
|
| 1.02 | % |
Average equity/average assets |
|
| 11.38 | % |
|
| 11.73 | % |
|
| 11.90 | % |
|
| 11.63 | % |
|
| 11.60 | % |
Net interest margin (fully taxable equivalent) |
|
| 3.48 | % |
|
| 3.53 | % |
|
| 3.78 | % |
|
| 4.03 | % |
|
| 4.01 | % |
Dividend payout ratio |
|
| 58.97 | % |
|
| 57.50 | % |
|
| 53.49 | % |
|
| 50.27 | % |
|
| 52.57 | % |
|
|
|
|
|
|
|
|
|
|
|
|
|
|
|
|
|
|
|
|
|
Credit Quality Ratios (2) |
|
|
|
|
|
|
|
|
|
|
|
|
|
|
|
|
|
|
|
|
Net charge-offs (recoveries)/average loans |
|
| 0.11 | % |
|
| 0.10 | % |
|
| 0.15 | % |
|
| -0.03 | % |
|
| -0.02 | % |
Provision for loan losses/average loans |
|
| 0.18 | % |
|
| 0.14 | % |
|
| 0.12 | % |
|
| 0.02 | % |
|
| -0.23 | % |
Nonperforming loans/total loans (incl LHFS*) |
|
| 0.77 | % |
|
| 0.61 | % |
|
| 0.76 | % |
|
| 1.21 | % |
|
| 1.10 | % |
Nonperforming assets/total loans (incl LHFS*) plus ORE** |
|
| 1.26 | % |
|
| 1.38 | % |
|
| 1.81 | % |
|
| 2.57 | % |
|
| 2.84 | % |
Allowance for loan losses/total loans (excl LHFS*) |
|
| 0.90 | % |
|
| 0.91 | % |
|
| 0.95 | % |
|
| 1.08 | % |
|
| 1.15 | % |
32
December 31, |
| 2023 |
|
| 2022 |
|
| 2021 |
| |||
Consolidated Balance Sheets |
|
|
|
|
|
|
|
|
| |||
Total assets |
| $ | 18,722,189 |
|
| $ | 18,015,478 |
|
| $ | 17,595,636 |
|
Securities |
|
| 3,189,157 |
|
|
| 3,518,596 |
|
|
| 3,581,414 |
|
Total loans (incl. PPP, LHFS and LHFI) |
|
| 13,135,336 |
|
|
| 12,339,265 |
|
|
| 10,556,871 |
|
Deposits |
|
| 15,569,763 |
|
|
| 14,437,648 |
|
|
| 15,087,160 |
|
Total shareholders' equity |
|
| 1,661,847 |
|
|
| 1,492,268 |
|
|
| 1,741,311 |
|
|
|
|
|
|
|
|
|
|
| |||
Stock Performance |
|
|
|
|
|
|
|
|
| |||
Market value - close |
| $ | 27.88 |
|
| $ | 34.91 |
|
| $ | 32.46 |
|
Book value |
|
| 27.21 |
|
|
| 24.47 |
|
|
| 28.25 |
|
Tangible book value |
|
| 20.87 |
|
|
| 18.11 |
|
|
| 21.93 |
|
|
|
|
|
|
|
|
|
|
| |||
Capital Ratios |
|
|
|
|
|
|
|
|
| |||
Total equity / total assets |
|
| 8.88 | % |
|
| 8.28 | % |
|
| 9.90 | % |
Tangible equity / tangible assets |
|
| 6.95 | % |
|
| 6.27 | % |
|
| 7.86 | % |
Tangible equity / risk-weighted assets |
|
| 8.41 | % |
|
| 7.61 | % |
|
| 10.71 | % |
Tier 1 leverage ratio (1) |
|
| 8.62 | % |
|
| 8.47 | % |
|
| 8.73 | % |
Common equity tier 1 risk-based capital ratio (1) |
|
| 10.04 | % |
|
| 9.74 | % |
|
| 11.29 | % |
Tier 1 risk-based capital ratio (1) |
|
| 10.44 | % |
|
| 10.15 | % |
|
| 11.77 | % |
Total risk-based capital ratio (1) |
|
| 12.29 | % |
|
| 11.91 | % |
|
| 13.55 | % |
30
| 2017 |
|
| 2016 |
|
| 2015 |
|
| 2014 |
|
| 2013 |
| ||||||
Consolidated Balance Sheets |
|
|
|
|
|
|
|
|
|
|
|
|
|
|
|
|
|
|
|
|
Total assets |
| $ | 13,797,953 |
|
| $ | 13,352,333 |
|
| $ | 12,678,896 |
|
| $ | 12,250,633 |
|
| $ | 11,790,383 |
|
Securities |
|
| 3,295,121 |
|
|
| 3,515,325 |
|
|
| 3,533,240 |
|
|
| 3,545,252 |
|
|
| 3,362,882 |
|
Total loans (incl LHFS* and acquired loans) |
|
| 9,011,996 |
|
|
| 8,299,387 |
|
|
| 7,641,985 |
|
|
| 7,131,074 |
|
|
| 6,752,256 |
|
Deposits |
|
| 10,577,512 |
|
|
| 10,056,012 |
|
|
| 9,588,230 |
|
|
| 9,698,358 |
|
|
| 9,859,902 |
|
Total shareholders' equity |
|
| 1,571,701 |
|
|
| 1,520,208 |
|
|
| 1,473,057 |
|
|
| 1,419,940 |
|
|
| 1,354,953 |
|
|
|
|
|
|
|
|
|
|
|
|
|
|
|
|
|
|
|
|
|
|
Stock Performance |
|
|
|
|
|
|
|
|
|
|
|
|
|
|
|
|
|
|
|
|
Market value - close |
| $ | 31.86 |
|
| $ | 35.65 |
|
| $ | 23.04 |
|
| $ | 24.54 |
|
| $ | 26.84 |
|
Book value |
|
| 23.20 |
|
|
| 22.48 |
|
|
| 21.80 |
|
|
| 21.04 |
|
|
| 20.11 |
|
Tangible book value |
|
| 17.35 |
|
|
| 16.76 |
|
|
| 15.98 |
|
|
| 15.13 |
|
|
| 13.95 |
|
|
|
|
|
|
|
|
|
|
|
|
|
|
|
|
|
|
|
|
|
|
Capital Ratios |
|
|
|
|
|
|
|
|
|
|
|
|
|
|
|
|
|
|
|
|
Total equity/total assets |
|
| 11.39 | % |
|
| 11.39 | % |
|
| 11.62 | % |
|
| 11.59 | % |
|
| 11.49 | % |
Tangible equity/tangible assets |
|
| 8.77 | % |
|
| 8.74 | % |
|
| 8.79 | % |
|
| 8.62 | % |
|
| 8.26 | % |
Tangible equity/risk-weighted assets |
|
| 11.13 | % |
|
| 11.39 | % |
|
| 11.68 | % |
|
| 12.17 | % |
|
| 11.88 | % |
Tier 1 leverage ratio |
|
| 9.67 | % |
|
| 9.90 | % |
|
| 10.03 | % |
|
| 9.63 | % |
|
| 9.06 | % |
Tier 1 common risk-based capital ratio - BASEL I |
|
| — |
|
|
| — |
|
|
| — |
|
|
| 12.75 | % |
|
| 12.21 | % |
Common equity tier 1 risk-based capital ratio - BASEL III |
|
| 11.77 | % |
|
| 12.16 | % |
|
| 12.57 | % |
|
| — |
|
|
| — |
|
Tier 1 risk-based capital ratio |
|
| 12.33 | % |
|
| 12.76 | % |
|
| 13.21 | % |
|
| 13.47 | % |
| �� | 12.97 | % |
Total risk-based capital ratio |
|
| 13.10 | % |
|
| 13.59 | % |
|
| 14.07 | % |
|
| 14.56 | % |
|
| 14.18 | % |
|
|
|
|
|
|
|
|
The following unaudited tables represent Trustmark’s summary of quarterly operations for the years ended December 31, 2017 and 2016 ($ in thousands, except per share data):ITEM 7. MANAGEMENT’S DISCUSSION AND ANALYSIS OF FINANCIAL CONDITION AND RESULTS OF OPERATIONS
2017 |
| 1Q |
|
| 2Q |
|
| 3Q |
|
| 4Q |
| ||||
Interest income |
| $ | 104,906 |
|
| $ | 111,776 |
|
| $ | 116,114 |
|
| $ | 116,999 |
|
Interest expense |
|
| 7,316 |
|
|
| 9,772 |
|
|
| 12,202 |
|
|
| 12,955 |
|
Net interest income |
|
| 97,590 |
|
|
| 102,004 |
|
|
| 103,912 |
|
|
| 104,044 |
|
Provision for loan losses, LHFI |
|
| 2,762 |
|
|
| 2,921 |
|
|
| 3,672 |
|
|
| 5,739 |
|
Provision for loan losses, acquired loans |
|
| (1,605 | ) |
|
| (2,564 | ) |
|
| (1,653 | ) |
|
| (1,573 | ) |
Noninterest income |
|
| 46,033 |
|
|
| 50,190 |
|
|
| 44,480 |
|
|
| 43,960 |
|
Noninterest expense |
|
| 102,057 |
|
|
| 122,075 |
|
|
| 103,086 |
|
|
| 102,951 |
|
Income before income taxes |
|
| 40,409 |
|
|
| 29,762 |
|
|
| 43,287 |
|
|
| 40,887 |
|
Income taxes |
|
| 9,161 |
|
|
| 5,727 |
|
|
| 8,708 |
|
|
| 25,119 |
|
Net income |
| $ | 31,248 |
|
| $ | 24,035 |
|
| $ | 34,579 |
|
| $ | 15,768 |
|
Earnings per share |
|
|
|
|
|
|
|
|
|
|
|
|
|
|
|
|
Basic |
| $ | 0.46 |
|
| $ | 0.35 |
|
| $ | 0.51 |
|
| $ | 0.23 |
|
Diluted |
|
| 0.46 |
|
|
| 0.35 |
|
|
| 0.51 |
|
|
| 0.23 |
|
31
| 1Q |
|
| 2Q |
|
| 3Q |
|
| 4Q |
| |||||
Interest income |
| $ | 100,598 |
|
| $ | 102,331 |
|
| $ | 103,786 |
|
| $ | 105,365 |
|
Interest expense |
|
| 5,858 |
|
|
| 5,954 |
|
|
| 6,222 |
|
|
| 6,513 |
|
Net interest income |
|
| 94,740 |
|
|
| 96,377 |
|
|
| 97,564 |
|
|
| 98,852 |
|
Provision for loan losses, LHFI |
|
| 2,243 |
|
|
| 2,596 |
|
|
| 4,284 |
|
|
| 1,834 |
|
Provision for loan losses, acquired loans |
|
| 1,309 |
|
|
| 607 |
|
|
| 691 |
|
|
| 1,150 |
|
Noninterest income |
|
| 43,276 |
|
|
| 44,227 |
|
|
| 44,716 |
|
|
| 41,724 |
|
Noninterest expense |
|
| 98,944 |
|
|
| 110,179 |
|
|
| 97,908 |
|
|
| 100,267 |
|
Income before income taxes |
|
| 35,520 |
|
|
| 27,222 |
|
|
| 39,397 |
|
|
| 37,325 |
|
Income taxes |
|
| 8,517 |
|
|
| 5,719 |
|
|
| 8,415 |
|
|
| 8,402 |
|
Net income |
| $ | 27,003 |
|
| $ | 21,503 |
|
| $ | 30,982 |
|
| $ | 28,923 |
|
Earnings per share |
|
|
|
|
|
|
|
|
|
|
|
|
|
|
|
|
Basic |
| $ | 0.40 |
|
| $ | 0.32 |
|
| $ | 0.46 |
|
| $ | 0.43 |
|
Diluted |
|
| 0.40 |
|
|
| 0.32 |
|
|
| 0.46 |
|
|
| 0.43 |
|
32
The following provides a narrative discussion and analysis of Trustmark’s financial condition and results of operations. This discussion should be read in conjunction with the consolidated financial statements and the supplemental financial data included in Part II. Item 8. – Financial Statements and Supplementary Data of this report.
Executive Overview
Trustmark continued to achieve solid Discussion and analysis of Trustmark’s financial condition and results with total revenue of $148.0 million and $592.2 millionoperations for the three monthsyears ended December 31, 2022 and 2021 are included in the respective sections within Part II. Item 7 – Management’s Discussion and Analysis of Financial Condition and Results of Operations of Trustmark’s Annual Report filed on Form 10-K for the year ended December 31, 2017, respectively. 2022.
Executive Overview
Trustmark continuedhas been committed to maintainmeeting the banking and expand customer relationships asfinancial needs of its customers and communities for over 130 years and remains focused on providing support, advice and solutions to its customers' unique needs. Trustmark produced strong financial results during 2023, despite the challenging financial services environment and increasingly competitive deposit costs, reflected by significant growth across all five market regions in the LHFI portfolio, which increased $718.8of $746.5 million, or 9.2%6.1%, during year ended December 31, 2017. During the first quarterand deposits of 2017, Trustmark reclassified $36.7 million$1.132 billion, or 7.8%, an increase in net interest income of acquired loans not accounted for under FASB ASC Topic 310-30, “Loans and Debt Securities Acquired with Deteriorated Credit Quality” to LHFI due to the discount on these loans being fully amortized. Excluding the reclassified acquired loans, LHFI increased $682.0$58.2 million, or 8.7%11.8%, during 2017. Credit quality remained strong and continued to be an important contributor to Trustmark’s financial success. Trustmark is committed to investments to support profitable revenue growth as well as reengineering and efficiency opportunities to enhance shareholder value.solid credit quality. Trustmark’s capital position remained solid, reflecting the consistent profitability of its diversified financial services businesses. Trustmark’s
On October 9, 2023, Trustmark entered into a settlement agreement that resolved all current and potential future claims relating to litigation involving Adams/Madison Timber. As a result, Trustmark recognized $6.5 million of litigation settlement expense which was included in noninterest expense for the third quarter of 2023.
Trustmark is committed to managing the franchise for the long term, supporting investments to promote profitable revenue growth, realigning delivery channels to support changing customer preferences as well as reengineering and efficiency opportunities to enhance long-term shareholder value. The Board of Directors of Trustmark declared a quarterly cash dividend of $0.23 per share. The dividend is payable March 15, 2018,2024, to shareholders of record on March 1, 2018.2024.
During August 2017, the Texas Gulf Coast region was severely impacted by Hurricane Harvey. None of Trustmark’s banking facilities in its Texas market region sustained damage, and all were able to reopen as soon as practical following the storm. In the aftermath of Hurricane Harvey, Trustmark initiated a process to assess the storm’s impact on its customers. Trustmark identified all loans where the collateral, project or mailing addresses were located within Federal Emergency Management Association (FEMA) designated disaster zip codes and proactively surveyed these customers to determine the extent of any damages. Potential loss exposure was calculated based upon customer responses as to the extent of damage suffered and applicable insurance coverage. As a result, Trustmark increased its allowance for loan losses for LHFI during the third quarter of 2017 by $1.1 million due to the potential loss exposure caused by Hurricane Harvey.
On April 7, 2017, Trustmark completed its previously announced merger with RB Bancorporation (Reliance). Reliance was the holding company for Reliance Bank, which had seven offices serving the Huntsville, Alabama metropolitan service area in northern Alabama. Reliance Bank was merged into TNB simultaneously with the merger of Trustmark and Reliance. Under the terms of the merger agreement dated November 14, 2016, Trustmark paid $22.00 in cash for each share of Reliance common stock outstanding, which represented payment to Reliance common shareholders of approximately $23.7 million. In addition, Trustmark paid off Reliance preferred stock of $1.1 million bringing the total consideration paid to $24.8 million. The operations of Reliance are included in Trustmark’s operating results from April 7, 2017 and did not have a material impact on Trustmark’s results of operations. During the second quarter of 2017, Trustmark included non-routine merger transaction expenses in other expense totaling $3.2 million.
As previously reported, on July 26, 2016, the Board of Directors of Trustmark authorized the termination of the Trustmark Capital Accumulation Plan (the Plan), a noncontributory tax-qualified defined benefit pension plan, effective as of December 31, 2016. The final distributions were made from current plan assets and a one-time pension settlement expense of $17.6 million was recognized when paid by Trustmark during the second quarter of 2017.
Financial Highlights
Trustmark reported net income of $15.8$36.1 million, or basic and diluted earnings per share (EPS) of $0.23, in$0.59, for the fourth quarter of 2017,2023, compared to $28.9a net loss of $34.1 million, or basic and diluted EPS of $0.43,-$0.56, in the fourth quarter of 2016. The decrease in net income when the fourth quarter of 2017 is compared to the same time period in 2016 was principally due to an one-time charge to income taxes resulting from the re-measurement of Trustmark’s net deferred tax assets due to the enactment of the Tax Cuts and Jobs Act of 2017 (Tax Reform Act) and the elimination of a deferred tax valuation allowance related to a prior merger, which collectively reduced net income by $17.0 million, or $0.25 per diluted share. Excluding these non-routine transactions, net income for the fourth quarter of 2017 totaled $32.7 million, or diluted EPS of $0.48. The increase in net income, excluding the non-routine transactions, when the fourth quarter of 2017 is compared to the same time period in 2016 was principally due to an increase in total revenue (primarily due to increases in interest and fees on LHFS and LHFI, mortgage banking, net and other income, net principally as a result of proceeds received related to bank-owned life insurance) partially offset by an increase in noninterest expense. These factors are discussed in greater detail below.2022. Trustmark’s reported performance during the quarter ended December 31, 2017,2023, produced a return on average tangible equity of 5.60%11.92%, a return on average assets of 0.45%0.77%, an average equity to average assets ratio of 11.40%8.51% and a dividend payout ratio of 100.00%38.98%, compared to a return on
33
average tangible equity of 10.41%-12.14%, a return on average assets of 0.87%-0.76%, an average
33
equity to average assets ratio of 11.63%8.41% and a dividend payout ratio of 53.49%-41.07% during the quarter ended December 31, 2016. For a reconciliation between the reported2022.
The increase in net income andwhen the fourth quarter of 2023 is compared to the fourth quarter of 2022 was principally due to the litigation settlement expense recorded during the fourth quarter of 2022 related to the Stanford Financial Group litigation. Excluding the litigation settlement expense, net income adjusted for significant non-routine transactions as well as select financial ratios, please seedecreased $5.4 million, or 13.0%, when the section captioned “Significant Non-routine Transactions.”
fourth quarter of 2023 is compared to the fourth quarter of 2022, principally due to a decrease in revenue and an increase in noninterest expense, excluding the litigation settlement expense, partially offset by a decrease in the PCL on off-balance sheet credit exposures. Revenue, which is defined as net interest income plus noninterest income, totaled $148.0$186.5 million for the quarter ended December 31, 20172023 compared to $140.6$191.8 million for the quarter ended December 31, 2016, an increase2022, a decrease of $7.4$5.2 million, or 5.3%2.7%. The increasedecrease in total revenue for the fourth quarter of 2017 was2023 compared to the same time period in 2022, resulted from a decrease in net interest income, principally the result ofdue to increases in interest on deposits and other interest expense largely offset by increases in interest and fees on LHFS and LHFI mortgage banking, net and other interest income, net, partially offset by an increase in total interest expense.
Interest and fees on LHFS and LHFI increased $14.0 million, or 18.2%, when the fourth quarter of 2017 is compared to the same time period in 2016, primarilynoninterest income, principally due to an increaseincreases in the LHFI portfoliomortgage banking, net and higherinsurance commissions.
Net interest rates. LHFI totaled $8.570 billion at December 31, 2017, an increase of $718.8 million, or 9.2%, when compared to December 31, 2016, as a result of net growth across all of Trustmark’s market regions and all categories in its LHFI portfolio. Mortgage banking, netincome for the fourth quarter of 2017 increased $856 thousand,2023 totaled $136.7 million, a decrease of $9.8 million, or 15.8%6.7%, when compared to the fourth quarter of 2022. Interest income totaled $232.9 million for the fourth quarter of 2023, an increase of $56.4 million, or 31.9%, when compared to the same time period in 2016,2022, principally due to a decreaseincreases in interest and fees on LHFS and LHFI primarily due to loan growth and rising interest rates and other interest income primarily due to an increase in the net negative mortgage valuation adjustment, partially offsetrate paid by a decline in gainthe Federal Reserve Bank of Atlanta (FRBA) on sales of loans, net. Other income, netreserves. Interest expense totaled $96.1 million for the three months ended December 31, 2017fourth quarter of 2023, an increase of $66.2 million when compared to the same time period in 2022. The increase in interest expense when the fourth quarter of 2023 is compared to the same time period in 2022 was principally due to an increase in interest on deposits primarily due to rising interest rates, increased $589 thousand,competition for deposits and higher average balances, and an increase in other interest expense primarily due to the increase in the rate paid on short-term FHLB advances.
Noninterest income for the fourth quarter of 2023 totaled $49.8 million, an increase of $4.6 million, or 28.2%10.3%, when compared to the fourth quarter of 2022, principally due to increases in mortgage banking, net and insurance commissions. Mortgage banking, net totaled $5.5 million for the fourth quarter of 2023, an increase of $2.1 million, or 61.9%, when compared to the same time period in 2016 primarily2022, principally due to non-taxable proceedsa decline in the net negative hedge ineffectiveness and an increase in the gain on sales of $1.7loans, net. Insurance commissions totaled $13.2 million related to bank-owned life insurance received during the fourth quarter of 2017. Interest expense for the fourth quarter of 2017 increased $6.42023, an increase of $1.2 million, or 98.9%9.8%, when compared to the same time period in 20162022, principally due to rising interest ratesan increase in general, which result in increases in interest on deposits and other interest expense. Interestcommission income.
Noninterest expense on deposits for the three months ended December 31, 2017 increased $3.9fourth quarter of 2023 totaled $136.4 million, a decrease of $94.8 million, or 41.0%, when compared to the same time period in 2016,fourth quarter of 2022, principally due to rising interest rates in general, accompaniedthe litigation settlement expense recorded during the fourth quarter of 2022 related to the Stanford Financial Group litigation partially offset by increases in average balances of all categories of interest-bearing accounts. Other interestsalaries and employee benefits and other expense. Excluding the litigation settlement expense, noninterest expense increased $1.9$6.0 million, or 71.1%4.6%, when the fourth quarter of 20172023 is compared to the same time period in 2016, principally due to increases in rates in general and average balances of short-term FHLB advances partially offset by the decline in interest expense on the subordinated notes.
Trustmark’s provision for loan losses, LHFI for the three months ended December 31, 2017 totaled $5.7 million, an increase of $3.9 million when compared to a provision for loan losses, LHFI of $1.8 million for the three months ended December 31, 2016. The increase in the provision for loan losses, LHFI for the fourth quarter of 2017 when compared to the same time period in 2016 was primarily due to an increase in the amount of provision required for existing2022. Salaries and newly impaired LHFI, primarily in the Texas and Mississippi market regions, and an increase in the amount of provision related to quantitative reserve factors. Please see the section captioned “Provision for Loan Losses, LHFI,” for additional information regarding the provision for loan losses, LHFI. The provision for loan losses, acquired loans for the three months ended December 31, 2017employee benefits totaled a negative $1.6 million, a decrease of $2.7 million when compared to the same time period in 2016 principally due to changes in expectations based on the periodic re-estimations performed during the respective periods and a decline in acquired loan balances. Please see the section captioned “Provision for Loan Losses, Acquired Loans,” for additional information regarding the provision for loan losses, acquired loans. In total, the provision for loan losses, net was $4.2$78.0 million for the fourth quarter of 2017,2023, an increase of $1.2$4.5 million, or 39.6%6.2%, when compared to the same time period in 2016.2022, principally due to increases in salaries expense, primarily due to general merit increases, and accrued management performance incentives, partially offset by a decrease in commission expense due to the decline in mortgage originations. Other expense totaled $16.6 million for the fourth quarter of 2023, an increase of $1.5 million, or 10.0%, when compared to the same time period in 2022, principally due to an increase in FDIC assessment expense.
Trustmark’s PCL, LHFI for the three months ended December 31, 2023 totaled $7.6 million compared to $6.9 million for the three months ended December 31, 2022, an increase of $683 thousand, or 9.9%. The PCL, LHFI for the fourth quarter of 2023 primarily reflected an increase in required reserves as a result of net adjustments to the qualitative reserve factors, loan growth and changes in the macroeconomic forecasts, partially offset by a decline in specific reserves for individually analyzed LHFI. The PCL, off-balance sheet credit exposures totaled a negative $888 thousand for the three months ended December 31, 2023 compared to $5.2 million for the three months ended December 31, 2022, a decrease of $6.1 million. The PCL, off-balance sheet credit exposures for the fourth quarter of 2023 primarily reflected declines in required reserves as a result of a decline in unfunded commitments. Please see the section captioned “Provision for Credit Losses,” for additional information regarding the PCL on LHFI and off-balance sheet credit exposures.
For the year ended December 31, 2017,2023, Trustmark reported net income of $105.6$165.5 million, or basic and diluted EPS of $1.56,$2.71 and $2.70, respectively, compared to $108.4$71.9 million, or basic and diluted EPS of $1.60,$1.17, for the year ended December 31, 20162022 and $116.0$147.4 million, or basic and diluted EPS of $1.72$2.35 and $1.71,$2.34, respectively, for the year ended December 31, 2015. The decrease in net income when 2017 is2021. Trustmark’s reported performance for the year ended December 31, 2023, produced a return on average tangible equity of 14.04%, a return on average assets of 0.89% and a dividend payout ratio of 33.95%, compared to 2016a return on average tangible equity of 6.00%, a return on average assets of 0.41% and a dividend payout ratio of 78.63% for the year ended December 31, 2022 and a return on average tangible equity of 10.81%, a return on average assets of 0.86% and a dividend payout ratio of 39.15% for the year ended December 31, 2021. Trustmark’s average equity to average assets ratio was primarily due8.41%, 9.18% and 10.38% for the years ended December 31, 2023, 2022 and 2021, respectively.
34
Revenue totaled $759.8 million for the year ended December 31, 2023, compared to increases in income taxes$699.9 million and noninterest expense (principally due to non-routine transaction expenses)$640.3 million for the years ended December 31, 2022 and 2021, respectively, an increase of $60.0 million, or 8.6%, which was partially offset by anand $59.6 million, or 9.3%, respectively. The increase in total revenue (primarilyfor 2023 compared to 2022 was principally due an increase in net interest income, principally due to increases in interest and fees on LHFS and LHFI and other interest income net principally as a result of proceeds received related to life insurance) and the declinelargely offset by an increase in the provision for loan losses, acquired loans. These factors are discussed in greater detail below. During the fourth quarter of 2017, Trustmark incurred non-routinetotal interest expense.
Net interest income tax expenses of $17.0 million related to the re-measurement of Trustmark’s net deferred tax assets due to the enactment of the Tax Reform Act and the elimination of a deferred tax valuation allowance related to a prior merger. During the second quarter of 2017, Trustmark received $4.9 million in non-routine, nontaxable proceeds related to life insurance acquired in a previous acquisition. Additionally, Trustmark incurred non-routine transaction expenses of $17.6 million related to the termination of the defined benefit pension plan and $3.2 million related to the completion of the Reliance merger during the second quarter of 2017. Excluding these non-routine transactions, net income for 2017 totaled $130.6 million, or diluted EPS of $1.92. Trustmark’s reported performance for the year ended December 31, 2017, produced a return on average tangible equity2023 totaled $552.9 million, an increase of 9.39%$58.2 million, or 11.8%, a return on average assets of 0.77% and a dividend payout ratio of 58.97%,when compared to a return on average tangible equity of 9.99%, a return on average assets of 0.84% and a dividend payout ratio of 57.50% for the year ended December 31, 2016 and a return on average tangible equity of 11.36%, a return on average assets of 0.95% and a dividend payout ratio of 53.49% for the year ended December 31, 2015. Trustmark’s average equity to average assets ratio was 11.38%, 11.73% and 11.90% for the years ended December 31, 2017, 2016 and 2015, respectively. For a reconciliation between the reported net2022. Interest income and the net income adjusted for significant non-routine transactions as well as select financial ratios, please see the section captioned “Significant Non-routine Transactions.”
34
Revenue totaled $592.2$878.8 million for the year ended December 31, 2017,2023, an increase of $337.0 million, or 62.2%, when compared to $561.5 million and $564.9 million for the yearsyear ended December 31, 2016 and 2015, respectively. The increase in total revenue for 2017 compared2022, principally due to 2016 was principally the result of increases in interest and fees on LHFS and LHFI, primarily due to loan growth and rising interest rates, and other interest income, net partially offset byprimarily due to an increase in total interest expense.
the rate paid by the FRBA on reserves. Interest and fees on LHFS and LHFIexpense totaled $326.0 million for 2017 increased $45.0 million, or 15.0%, compared to 2016, primarily due to the year-over-yearyear ended December 31, 2023, an increase in the LHFI portfolio. Other income, net for 2017 increased $8.3of $278.8 million, when compared to 2016 primarilythe year ended December 31, 2022. The increase in interest expense when 2023 is compared to 2022 was due to non-taxable proceeds of $4.4 million related to bank-owned life insurance received during 2017 and the $4.9 millionan increase in non-routine, non-taxable proceeds related to life insurance acquired in a previous acquisition received during the second quarter of 2017. Interest expense for 2017 increased $17.7 million, or 72.1%, when compared to 2016interest on deposits primarily due to rising interest rates, increased competition for deposits and higher average balances, an increase in general. Interestother interest expense on deposits for 2017 increased $10.0 million, or 78.2%, when compared to 2016, principallyprimarily due to rising ratesthe increase in general, accompanied by increasesthe amount of short-term FHLB advances held throughout 2023 as well as an increase in average balances of all categories of interest-bearing deposits. Interestthe rate paid for short-term FHLB advances and an increase in interest on federal funds purchased and securities sold under repurchase agreements increased $2.4primarily due to increases to the target rate for federal funds purchased by the FRB.
Noninterest income for 2023 totaled $207.0 million, an increase of $1.8 million, or 0.9%, when 2017 is compared to 20162022, principally due to increases in insurance commissions, other income, net and service charges on deposit accounts, partially offset by declines in bank card and other fees and mortgage banking, net. Insurance commissions totaled $57.6 million for 2023, an increase of $3.8 million, or 7.2%, when compared to 2022, principally due to increases in commercial property and casualty commissions and other commission income. Other income, net totaled $11.2 million for 2023, an increase of $1.3 million, or 13.7%, when compared to 2022, principally due to an increase in cash management service charges partially offset by an increase in the target rangeamortization of tax credit partnerships and a decrease in other miscellaneous income. Service charges on deposit accounts totaled $43.4 million for 2023, an increase of $1.3 million, or 3.0%, when compared to 2022, principally due to an increase in service charges on personal interest checking accounts partially offset by a decline in NSF and overdraft charges on consumer deposit accounts. Bank card and other fees totaled $33.4 million for 2023, a decline of $2.7 million, or 7.4%, when compared to 2022, principally due to declines in customer derivatives revenue and miscellaneous other bank fees. Mortgage banking, net totaled $26.2 million for 2023, a decrease of $2.1 million, or 7.4%, when compared to 2022, principally due to a decline in the federal funds rategain on sales of loans, net and an increase in the net negative hedge ineffectiveness, partially offset by a decline in the run-off of the MSR.
Noninterest expense totaled $537.9 million for 2023, a decrease of $65.3 million, or 10.8%, when compared to 2022, principally due to the $100.8 million litigation settlement expense recorded during the fourth quarter of 2022, partially offset by the FRB. Other interest$6.5 million of litigation settlement expense recorded during the third quarter of 2023 as well as increases in salaries and employee benefits, other expense, services and fees and equipment expense. Excluding the litigation settlement expenses, noninterest expense increased $5.3$29.0 million, or 52.5%5.8%, when 2023 is compared to 2022. Salaries and employee benefits totaled $304.7 million for the year ended December 31, 2017 is2023, an increase of $17.2 million, or 6.0%, when compared to the year ended December 31, 2016,2022, principally due to increases in ratessalaries expense, primarily due to general merit increases, accrued management performance incentives and commission expense due to improvements in general, accompanied by increases in average balances of short-term FHLB advancesinsurance production, partially offset by a decline in commission expense due to the decline in interestmortgage originations. Other expense on the subordinated notes.
Trustmark’s provisiontotaled $61.7 million for loan losses, LHFI, for 2017 totaled $15.1 million,2023, an increase of $4.1$5.8 million, or 37.8%10.4%, when compared to a provision for loan losses, LHFI of $11.0 million for 2016. The increase2022, principally due to increases in the provision for loan losses, LHFI for 2017 when compared to 2016 wasFDIC assessment expense, primarily due to an increase in the amountassessment rate, partially offset by a decline in loan expense. Services and fees totaled $109.5 million for 2023, an increase of provision required$4.0 million, or 3.8%, when compared to 2022, principally due to increases in data processing charges related to existingsoftware and newly impairedbusiness process outsourcing fees, partially offset by a decrease in other services and fees. Equipment expense totaled $26.1 million for 2023, an increase of $1.7 million, or 6.9%, when compared to 2022, principally due to increases in data processing equipment expenses, depreciation on furniture and equipment and personal property taxes.
Trustmark’s PCL, LHFI for 2023 totaled $27.4 million compared to $21.7 million for 2022, an increase of $5.7 million, or 26.2%. The PCL, LHFI for 2023 primarily reflected an increase in required reserves as a result of loan growth, net changes in the qualitative reserve factors, changes in the macroeconomic forecasts and extended maturities on the $1.1secured by 1-4 family residential properties portfolio resulting from lower prepayment speeds, partially offset by a decline in specific reserves for individually analyzed LHFI. The PCL, off-balance sheet credit exposures totaled a negative $2.8 million for 2023 compared to $1.2 million for 2022, a decrease of additional$4.0 million. The release in PCL on off-balance sheet credit exposures for 2023 primarily reflected a decrease in required reserves due to a decline in unfunded commitments partially offset by an increase in required reserves as a result of changes in the potential loss exposure caused by Hurricane Harvey.total reserve rate. Please see the section captioned “Provision for Loan Losses, LHFI,”Credit Losses” for additional information regarding the provision for loan losses, LHFI. The provision for loan losses, acquired loans for 2017 totaled a negative $7.4 million, a decrease of $11.2 million when compared to 2016 principally due to changes in expectations basedPCL on the periodic re-estimations performed during the respective periodsLHFI and a decline in acquired loan balances. Please see the section captioned “Provision for Loan Losses, Acquired Loans,” for additional information regarding the provision for loan losses, acquired loans. In total, the provision for loan losses, net was $7.7 million for 2017, a decrease of $7.0 million, or 47.7%, when compared to 2016. off-balance sheet credit exposures.
At December 31, 2017,2023, nonperforming assets excluding acquired loans, totaled $110.8$106.9 million, a decreasean increase of $482 thousand,$38.9 million, or 0.4%57.3%, compared to December 31, 20162022 principally due to a decline in other real estate, which was largely offset by an increase in nonaccrual LHFI. Total nonaccrual LHFI were $67.6$100.0 million at December 31, 2017, representing2023, an increase of $18.3$34.0 million, or 37.3%51.6%, relative to December 31, 2016 principally due to2022, primarily as a result of three large substandardcommercial credits movingplaced on nonaccrual as well as an increase in mortgage nonaccruals that were partially offset by other commercial credits that were foreclosed, charged off,
35
returned to nonaccrual status during 2017.accrual or paid off. The percentage of total loans excluding acquired loans,(LHFS and LHFI) that are 30 days or more past due and nonaccrual LHFI increased in 20172023 to 1.53%1.69% compared to 1.33% in 2016 and 1.44% in 2015. Other real estate declined $18.8 million, or 30.3%, during 2017 primarily due to properties sold in all five market of Trustmark’s market regions as well as write-downs of properties in Trustmark’s Mississippi, Florida and Alabama market regions partially offset by properties foreclosed in all five market regions.2022.
LHFI totaled $8.570$12.951 billion at December 31, 2017,2023, an increase of $718.8$746.5 million, or 9.2%6.1%, compared to December 31, 2016. During the first quarter of 2017, Trustmark reclassified $36.7 million of acquired loans not accounted for under FASB ASC Topic 310-30 to LHFI due to the discount on these loans being fully amortized. Excluding the reclassified acquired loans, LHFI increased $682.0 million, or 8.7%, during 2017.2022. The increase in LHFI excluding the reclassified acquired loans, during 2017 represented2023 was primarily due to net growth across all five of Trustmark’s market regionsin LHFI secured by real estate, commercial and all loan categories.industrial LHFI and other commercial LHFI and leases partially offset by a decline in state and other political subdivision LHFI. For additional information regarding changes in LHFI and comparative balances by loan category, see the section captioned “LHFI.”
Both classified and criticized LHFI balances remain at low levels and continue to reflect strong credit quality. As of December 31, 2017, classified LHFI balances decreased $13.9 million, or 6.2%, while criticized LHFI balances decreased $602 thousand, or 0.2%, when compared to balances at December 31, 2016. All of the credits have been appropriately reserved.
Management has continued its practice of maintaining excess funding capacity to provide Trustmark with adequate liquidity for its ongoing operations. In this regard, Trustmark benefits from its strong deposit base, its highly liquid investment portfolio and its access to funding from a variety of external funding sources such as upstream federal funds lines, FHLB advances and on a limited basis, brokered deposits. See the section captioned “Capital Resources and Liquidity” for further discussion of the components of Trustmark’s excess funding capacity.
Total deposits were $10.578$15.570 billion at December 31, 2017,2023, an increase of $521.5 million,$1.132 billion, or 5.2%7.8%, compared to December 31, 2016,2022. During 2023, noninterest-bearing deposits decreased $896.2 million, or 21.9%, as a result of declines in all categories of noninterest-bearing deposits reflecting customers' desire for higher-yielding deposit accounts. Interest-bearing deposits increased $2.028 billion, or 19.6%, during 2023, primarily due to growth in interest-bearing deposits. During 2017, noninterest-bearingcertificates of deposits increased $4.8(CDs), which was principally attributable to deposit campaigns offered during 2023 and the addition of $578.8 million or 0.2%, primarily due to growthof brokered CDs, business and consumer money market deposit accounts (MMDA) and business interest checking accounts, partially offset by declines in consumer and public demand deposit accounts, which were largely offset by a decline in commercial demand deposit accounts, while interest-bearing deposits increased $516.7 million, or 7.3%, primarily due to growth in all categories of interest-bearing demand deposit accounts with the exception of public interest checking accounts and money market accounts, reflecting the Reliance mergerconsumer savings accounts.
Federal funds purchased and increases in interest rates. At December 31, 2017, the balance of deposits for branches associated with the
35
Reliance merger was $163.6 million. Excluding these Reliance deposits, total depositsrepurchase agreements totaled $405.7 million at December 31, 2017 increased $357.92023 compared to $449.3 million at December 31, 2022, a decrease of $43.6 million, or 3.6%.
9.7%, principally due to a decrease in customer sweep transactions. Trustmark uses short-term borrowingshad $370.0 million of upstream federal funds purchased at December 31, 2023, compared to fund growth of earning assets in excess of deposits growth. Short-term$383.0 million at December 31, 2022. Other borrowings totaled $1.441$483.2 million at December 31, 2023, a decrease of $567.7 million, or 54.0%, when compared with $1.051 billion at December 31, 2017, an increase of $131.3 million, or 10.0%, when compared to December 31, 2016 as a result of the increase in earning assets,2022, principally LHFI, out-pacing the growth in deposits. The increase in short-term borrowings was primarily due to an increasea decline in the outstanding balance of short-term FHLB advances as Trustmark continues to utilize this funding source to fund the difference between loan and deposit growth. Short-term FHLB advances increased $200.0 million during 2017 as a result of a $450.0 million increase in outstanding short-term advances withobtained from the FHLB of Dallas as well as the $250.0 million long-term FHLB advance with the FHLB of Dallas which was reclassified to short-term in May 2017 partially offset by the $500.0 million advance with the FHLB of Dallas that matured in December 2017.Dallas.
Critical Accounting Policies and Accounting Estimates
Trustmark’s consolidated financial statements are prepared in accordance with GAAP and follow general practices within the financial services industry. Application of these accounting principles requires Management to make estimates, assumptions and judgments that affect the amounts reported in the consolidated financial statements and accompanying notes. These estimates, assumptions and judgments are based on historical experience, current information availableand other factors deemed relevant as of the date of the consolidated financial statements; accordingly, as this information changes, actual financial results could differ from those estimates.
Certain policies inherently have a greater reliance on the use of estimates, assumptions and judgments and, as such, have a greater possibility of producing results that could be materially different than originally reported. TheseAn accounting estimate is considered critical if the accounting policiesestimate requires Management to make assumptions about matters with a significant level of uncertainty and if the accounting estimate, or changes to the accounting estimate that are described below.reasonably likely to occur from period to period, have had or are reasonable likely to have a material impact to the consolidated financial statements.
For additional information regarding the accounting policies discussed below, please see Note 1 – Significant Accounting Policies set forth in Part II. Item 8. – Financial Statements and Supplementary Data of this report.
Allowance for LoanCredit Losses LHFI(ACL)
LHFI
The allowance for loan losses,ACL, LHFI is established through provisions for estimated loan losses charged againsta valuation account, calculated in accordance with FASB ASC Topic 326, that is deducted from the loans’ amortized cost basis to present the net income.amount expected to be collected on the loans. The allowance reflectsACL, LHFI represents Management’s best estimate of the probable loancurrent expected credit losses related to specifically identifiedon Trustmark’s existing LHFI as well as probable incurred loan losses in the remaining loan portfolio and requires considerable judgment. The allowance is based upon Management’s current judgments about the credit quality of the loan portfolio, including allconsidering available information, from internal and external sources, relevant to assessing exposure to credit loss over the contractual term of the instrument. The ACL, LHFI is adjusted through the PCL, LHFI and reduced by the charge off of loan amounts, net of recoveries.
The credit loss estimation process involves procedures to appropriately consider the unique characteristics of Trustmark’s LHFI portfolio segments. These segments are further disaggregated into loan classes, the level at which credit risk is estimated. When computing allowance levels, credit loss assumptions are estimated using a model that categorizes loan pools based on loss history, delinquency status and other credit trends and risk characteristics, including current conditions and reasonable and supportable forecasts about the future. Evaluations of the portfolio and individual credits are inherently subjective, as they require estimates, assumptions and judgments
36
as to the facts and circumstances of particular situations. Determining the appropriateness of the ACL, LHFI is complex and requires judgment by Management about the effect of matters that are inherently uncertain. While Management utilizes its best judgment and information available, the ultimate adequacy of Trustmark’s ACL, LHFI is dependent upon a variety of factors that impact loan collectibility. Accordingly,beyond its controls, including the allowance is based upon both past eventsperformance of the portfolios, the economy, changes in interest rates and current economic conditions.
Athe view of regulatory authorities toward classification of assets. In future periods, evaluations of the overall LHFI portfolio, in light of the factors and forecasts then prevailing, may result in significant shift in one or more factors includedchanges in the allowanceACL and PCL for loan loss methodology could result in a material change to Trustmark’s allowance for loan losses, LHFI. For example, if there were changes in one or more of the estimates, assumptions or judgments used as they relate to a portfolio of commercial LHFI, Trustmark could find that it needs to increase the level of future provisions for possible loan losses with respect to that portfolio. Additionally, credit deterioration of specific borrowers due to changes in these factors could cause the internally assigned risk rating to shift to a more severe category. As a result, Trustmark could find that it needs to increase the level of future provisions for possible loan losses with respect to these LHFI. Given the nature of many of these estimates,the factors, forecasts and assumptions and judgments,in the ACL methodology for LHFI, it is not possible to provide meaningful estimates of the impact of any such potential shifts.change.
For a complete description of Trustmark’s allowanceACL methodology for loan loss methodology,the LHFI portfolio, please see Note 54 – LHFI and Allowance for LoanCredit Losses, LHFI included in Part II. Item 8. – Financial Statements and Supplementary Data of this report.
Acquired LoansOff-Balance Sheet Credit Exposures
Acquired loansTrustmark maintains a separate ACL on off-balance sheet credit exposures, including unfunded loan commitments and letters of credit, which are recorded at their estimated fair value as of the acquisition date.not unconditionally cancellable. The fair value of acquired loansACL on off-balance sheet credit exposures is determined using a discounted cash flow model based on assumptions regarding the amount and timing of principal and interest payments, estimated prepayments, estimated default rates, estimated loss severityliability account calculated in the event of defaults, and current market rates. Estimated credit losses are included in the determination of fair value; therefore, an allowance for loan losses is not recorded on the acquisition date.
For acquired impaired loans, Trustmark (i) calculates the contractual amount and timing of undiscounted principal and interest payments (the undiscounted contractual cash flows) and (ii) estimates the amount and timing of undiscounted expected principal and interest payments (the undiscounted expected cash flows). Underaccordance with FASB ASC Topic 310-30326 and presented in the difference betweenaccompanying consolidated balance sheets. Adjustments to the undiscountedACL on off-balance sheet credit exposures are recorded to PCL, off-balance sheet credit exposures.
Expected credit losses for off-balance sheet credit exposures are estimated by calculating a commitment usage factor over the contractual cash flowsperiod for exposures that are not unconditionally cancellable by Trustmark. Trustmark calculates a loan pool level unfunded amount for the period. In addition to the unfunded balances, Trustmark uses a funding rate for loan pools that are considered open-ended. In order to mitigate volatility and incorporate historical experience in the undiscountedfunding rate, Trustmark uses a twelve-quarter moving average. For the closed-ended loan pools, Trustmark takes a conservative approach and uses a 100% funding rate. The expected cash flowsfunding rate is applied to each pool’s unfunded commitment balances to ensure that reserves will be applied to each pool based upon balances expected to be funded based upon historical levels. In addition to the nonaccretable difference. The nonaccretable difference represents an estimatefunding rate being applied to the unfunded commitment balance, a reserve rate is applied that is loan pool specific and is applied to the unfunded amount to ensure loss factors, both quantitative and qualitative, are being considered on the unfunded portion of the loss exposure of principal and interest relatedloan pool, consistent with the methodology applied to the acquired impairedfunded loan portfolio,pools.
Evaluations of the unfunded commitments are inherently subjective, as they require estimates, assumptions and such amountjudgments as to the facts and circumstances of particular situations. Determining the appropriateness of the ACL on off-balance sheet credit exposures is
36
subject to change over time based complex and requires judgment by Management about the effect of matters that are inherently uncertain. While Management utilizes its best judgment and information available, the ultimate adequacy of Trustmark’s ACL on off-balance sheet credit exposures is dependent upon a variety of factors beyond its control, including the performance of such loans. The excessthe portfolios, the economy, changes in interest rates and the view of undiscounted expected cash flows at acquisition over the initial fair valueregulatory authorities toward classification of acquired impaired loans is referred to as the “accretable yield” and is recorded as interest income over the estimated lifeassets. In future periods, evaluations of off-balance sheet credit exposures, in light of the loans usingfactors and forecasts then prevailing, may result in significant changes in the effective yield method ifACL and PCL on off-balance sheet credit exposures. Given the timing and amountnature of many of the future cash flowsfactors, forecasts and assumptions in the ACL methodology for off-balance sheet credit exposures, it is reasonably estimable. Under the effective yield method, the accretable yield is recorded as an accretion of interest income over the lifenot possible to provide meaningful estimates of the loan.impact of any such potential change.
As required by FASB ASC Topic 310-30, Trustmark periodically re-estimatesFor a complete description of Trustmark’s ACL methodology for off-balance sheet credit exposures, please see the expected cash flows to be collected over the lifesection captioned “Lending Related” in Note 16 – Commitments and Contingencies included in Part II. Item 8. – Financial Statements and Supplementary Data of the acquired impaired loans. If, based on current information and events, it is probable that Trustmark will be unable to collect all cash flows expected at acquisition plus additional cash flows expected to be collected arising from changes in estimate after acquisition, the acquired loans are considered impaired. The decrease in the expected cash flows reduces the carrying value of the acquired impaired loans as well as the accretable yield and results in a charge-off through the allowance for loan losses, acquired loans or the establishment of an allowance for loan losses, acquired loans with a charge to income through the provision for loan losses, acquired loans. If, based on current information and events, it is probable that there is a significant increase in the cash flows previously expected to be collected or if actual cash flows are significantly greater than cash flows previously expected, Trustmark will reduce any remaining allowance for loan losses, acquired loans established on the acquired impaired loans for the increase in the present value of cash flows expected to be collected. The increase in the expected cash flows for the acquired impaired loans over those originally estimated at acquisition increases the carrying value of the acquired impaired loans as well as the accretable yield.this report.
Mortgage Servicing Rights (MSR)
Trustmark recognizes as assets the rights to service mortgage loans based on the estimated fair value of the MSR when loans are sold and the associated servicing rights are retained. Trustmark has elected to account for the MSR at fair value.
The fair value of the MSR is determined using a valuation model administered by a third party that calculates the present value of estimated future net servicing income. The model incorporates assumptions that market participants use in estimating future net servicing income, including estimates of prepayment speeds, discount rate, default rates, cost to service (including delinquency and foreclosure costs), escrow account earnings and contractual servicing fee income and other ancillary income such as late fees.costs. Management reviews all significant assumptions at least quarterly. Mortgage loan prepayment speeds, a key assumption in the model, is the annual rate at which borrowers are forecasted to repay their mortgage loan principal. The discount rate used to determine the present value of estimated future net servicing income, another key assumption in the model, is an estimate of the required rate of return investors in the market would require for an asset with similar risk. Both assumptions can, and generally will, change as market conditions and interest rates change.
By way of example, an increase in either the prepayment speed or discount rate assumption willmay result in a decrease in the fair value of the MSR, while a decrease in either assumption willmay result in an increase in the fair value of the MSR. In recent years, there have been significant market-driven fluctuations in loan prepayment speeds and discount rates. These fluctuations can be rapid and may continue
37
to be significant. Therefore, estimating prepayment speedspeeds and/or discount rates within ranges that market participants would use in determining the fair value of the MSR requires significant management judgment.
At December 31, 2017,2023, the MSR fair value was approximately $84.3$131.9 million. The impact on the MSR fair value of either a 10% adverse change in prepayment speeds or a 100 basis point increase in discount rates at December 31, 2017,2023, would be a decline in fair value of approximately $3.1 million.$4.8 million and $5.4 million, respectively. Changes of equal magnitude in the opposite direction would produce similar increases in fair value in the respective amounts.
Goodwill See the section captioned “MSR” in Note 6 – Mortgage Banking included in Part II. Item 8. – Financial Statements and Identifiable Intangible Assets
Trustmark records all assets and liabilities acquired in purchase acquisitions, including goodwill and other intangible assets, at fair value as required by FASB ASC Topic 805. The carrying amountSupplementary Data of goodwill at December 31, 2017 totaled $334.6 millionthis report for the General Banking Division and $45.0 million for the Insurance Division, a consolidated total of $379.6 million. Trustmark’s goodwill is not amortized but is subject to annual tests for impairment or more often if events or circumstances indicate it may be impaired. Trustmark’s identifiable intangible assets, which totaled $16.4 million at December 31, 2017, are amortized over their estimated useful lives and are subject to impairment tests if events or circumstances indicate a possible inability to realize the carrying amount.
The initial recording and subsequent impairment testing of goodwill requires subjective judgments concerning estimates of the fair value of the acquired assets. The goodwill impairment test is performed in two phases. The first step compares the fair value of the reporting unit with its carrying amount, including goodwill. If the fair value of the reporting unit exceeds its carrying amount, goodwill of the reporting unit is considered not impaired; however, if the carrying amount of the reporting unit exceeds its fair value, an additional procedure must be performed. That additional procedure, or a second step, comparesinformation regarding the implied fair value of the reporting unit’s goodwill with the carrying amount of that goodwill. An impairment loss would be recorded to the extent that the carrying amount of goodwill exceeds its implied fair value. Trustmark performed an annual impairment test of goodwill for reporting units contained in both the General Banking and Insurance Divisions as of October 1, 2017, 2016, and 2015, respectively, which
37
indicated that no impairment charge was required. The impairment test for the General Banking Division utilized valuations based on comparable deal values for financial institutions while the test for the Insurance Division utilizes varying valuation scenarios for the multiple of earnings before interest, income taxes, depreciation and amortization method based on recent acquisition activity. Based on this analysis, Trustmark concluded that the fair value of the reporting units exceeded the carrying value for both the General Banking Division and the Insurance Division; therefore, no impairment charge was required. Significant changes in future profitability and value of our reporting units could affect Trustmark’s impairment evaluation.
The carrying amount of Trustmark’s identifiable intangible assets subject to amortization is not recoverable if it exceeds the sum of the undiscounted cash flows expected to result from the use and eventual disposition. That assessment shall be based on the carrying amount of the intangible assets subject to amortization at the date it is tested for recoverability. Intangible assets subject to amortization shall be tested for recoverability whenever events or changes in circumstances indicate that its carrying amount may not be recoverable.
Fair value may be determined using market prices, comparison to similar assets, market multiples and other determinants. Factors that may significantly affect the estimates include, among others, competitive forces, customer behavior and attrition, changes in revenue growth trends and specific industry or market sector conditions. Other key judgments in accounting for intangibles include determining the useful life of the particular asset and classifying assets as either goodwill (which does not require amortization) or identifiable intangible assets (which does require amortization).
Other Real Estate
Other real estate includes assets that have been acquired in satisfaction of debt through foreclosure and is carried at the lower of cost or estimated fair value less the estimated cost of disposition. Fair value is based on independent appraisals and other relevant factors. Valuation adjustments required at foreclosure are charged to the allowance for loan losses. Other real estate is revalued on an annual basis or more often if market conditions necessitate. An other real estate specific reserve may be recorded through other real estate expense for declines in fair value subsequent to foreclosure based on recent appraisals or changes in market conditions. Subsequent to foreclosure, losses on the periodic revaluation of the property are charged against a reserve specific to other real estate or to noninterest expense in other real estate expense if a reserve does not exist. Significant judgments and complex estimates are required in estimating the fair value of other real estate, and the period of time within which such estimates can be considered current is significantly shortened during periods of market volatility. As a result, the net proceeds realized from sales transactions could differ significantly from appraisals, comparable sales, and other estimates used to determine the fair value of other real estate.
Defined Benefit Plans
Trustmark’s plan assets, projected benefit liabilities and cost are determined utilizing actuarially-determined present value calculations. The valuation of the projected benefit obligation and net periodic benefit cost for the Trustmark Corporation Pension Plan for certain Employees of Acquired Financial Institutions (the Continuing Plan) and Trustmark’s nonqualified supplemental retirement plans requires Management to make estimates regarding the amount and timing of expected cash outflows. Several variables affect these calculations, including (i) size and characteristics of the participant population, (ii) discount rate, (iii) expected long-term rate of return on plan assets and (iv) recognition of actual returns on plan assets. Below is a brief description of the variables that introduce material uncertainty into Management’s estimates and the effect they have on estimated benefit cost.
Population and Characteristics of Participants. Benefit cost is directly related to the number of participants covered by the plan and characteristics such as salary, age, years of service and benefit terms. At December 31, 2017, the census for Trustmark’s plans totaled 124 participants.
Discount Rate. The discount rate utilized in determining the present value of the future benefit obligation was 3.32% at December 31, 2017 (as compared to 3.71% at December 31, 2016). The discount rate for the plans is determined by matching the expected cash flows of the plans to a yield curve based on long term, high quality fixed income debt instruments available as of the measurement date (December 31, 2017). The discount rate is reset annually on the measurement date to reflect current economic conditions. If Trustmark assumes a 1.00% increase or decrease in the discount rate for Trustmark’s plans and kept all other assumptions constant, the benefit cost associated with Trustmark’s plans would decrease or increase by approximately $281 thousand and $314 thousand, respectively.
38
|
Other Actuarial Assumptions. To estimate the projected benefit obligation, actuarial assumptions are required to be made by Management, including mortality rate, retirement rate, disability rate and the rate of compensation increases.
Contingent LiabilitiesMSR.
Trustmark estimates contingent liabilities based on Management’s evaluation of the probability of outcomes and their ability to estimate the range of exposure. As stated in FASB ASC Topic 450, “Contingencies,” a liability is contingent if the amount is not presently known but may become known in the future as a result of the occurrence of some uncertain future event. Accounting standards require that a liability be recorded if Management determines that it is probable that a loss has occurred, and the loss can be reasonably estimated. It is implicit in this standard that it must be probable that the loss will be confirmed by some future event. As part of the estimation process, Management is required to make assumptions about matters that are, by their nature, highly uncertain. The assessment of contingent liabilities, including legal contingencies and income tax liabilities, involves the use of critical estimates, assumptions and judgments. Management’s estimates are based on their belief that future events will validate the current assumptions regarding the ultimate outcome of these exposures. However, there can be no assurance that future events, such as court decisions or Internal Revenue Service (IRS) positions, will not differ from Management’s assessments. Whenever practicable, Management consults with outside experts (attorneys, consultants, claims administrators, etc.) to assist with the gathering and evaluation of information related to contingent liabilities.
Recent Legislative and Regulatory Developments
For information regarding legislation and regulation applicable to Trustmark, see the section captioned “Supervision and Regulation” included in Part I. Item 1. – Business of this report.
Non-GAAP Financial Measures
In addition to capital ratios defined by GAAP and banking regulators, Trustmark utilizes various tangible common equity measures when evaluating capital utilization and adequacy. Tangible common equity, as defined by Trustmark, represents common equity less goodwill and identifiable intangible assets. Trustmark’s Common Equity Tier 1 capital includes common stock, capital surplus and retained earnings, and is reduced by goodwill and other intangible assets, net of associated net deferred tax liabilities as well as disallowed deferred tax assets and threshold deductions as applicable.
Trustmark believes these measures are important because they reflect the level of capital available to withstand unexpected market conditions. Additionally, presentation of these measures allows readers to compare certain aspects of Trustmark’s capitalization to other organizations. These ratios differ from capital measures defined by banking regulators principally in that the numerator excludes shareholders’ equity associated with preferred securities, the nature and extent of which varies across organizations. In Management’s experience, many stock analysts use tangible common equity measures in conjunction with more traditional bank capital ratios to compare capital adequacy of banking organizations with significant amounts of goodwill or other intangible assets, typically stemming from the use of the purchase accounting method in accounting for mergers and acquisitions.
These calculations are intended to complement the capital ratios defined by GAAP and banking regulators. Because GAAP does not include these capital ratio measures, Trustmark believes there are no comparable GAAP financial measures to these tangible common equity ratios. Despite the importance of these measures to Trustmark, there are no standardized definitions for them and, as a result, Trustmark’s calculations may not be comparable with other organizations. Also, there may be limits in the usefulness of these measures to investors. As a result, Trustmark encourages readers to consider its audited consolidated financial statements and the notes related thereto in their entirety and not to rely on any single financial measure.
3938
The following table reconciles Trustmark’s calculation of these measures to amounts reported under GAAP for the periods presented ($ in thousands, except per share data):
|
|
| Years Ended December 31, |
| |||||||||
TANGIBLE EQUITY |
|
| 2023 |
|
| 2022 |
|
| 2021 |
| |||
AVERAGE BALANCES |
|
|
|
|
|
|
|
|
|
| |||
Total shareholders' equity |
|
| $ | 1,570,098 |
|
| $ | 1,604,854 |
|
| $ | 1,770,151 |
|
Less: Goodwill |
|
|
| (384,237 | ) |
|
| (384,237 | ) |
|
| (384,463 | ) |
Identifiable intangible assets |
|
|
| (3,259 | ) |
|
| (4,312 | ) |
|
| (6,205 | ) |
Total average tangible equity |
|
| $ | 1,182,602 |
|
| $ | 1,216,305 |
|
| $ | 1,379,483 |
|
PERIOD END BALANCES |
|
|
|
|
|
|
|
|
|
| |||
Total shareholders' equity |
|
| $ | 1,661,847 |
|
| $ | 1,492,268 |
|
| $ | 1,741,311 |
|
Less: Goodwill |
|
|
| (384,237 | ) |
|
| (384,237 | ) |
|
| (384,237 | ) |
Identifiable intangible assets |
|
|
| (2,965 | ) |
|
| (3,640 | ) |
|
| (5,074 | ) |
Total tangible equity | (a) |
| $ | 1,274,645 |
|
| $ | 1,104,391 |
|
| $ | 1,352,000 |
|
|
|
|
|
|
|
|
|
|
|
| |||
TANGIBLE ASSETS |
|
|
|
|
|
|
|
|
|
| |||
Total assets |
|
| $ | 18,722,189 |
|
| $ | 18,015,478 |
|
| $ | 17,595,636 |
|
Less: Goodwill |
|
|
| (384,237 | ) |
|
| (384,237 | ) |
|
| (384,237 | ) |
Identifiable intangible assets |
|
|
| (2,965 | ) |
|
| (3,640 | ) |
|
| (5,074 | ) |
Total tangible assets | (b) |
| $ | 18,334,987 |
|
| $ | 17,627,601 |
|
| $ | 17,206,325 |
|
Risk-weighted assets | (c) |
| $ | 15,153,263 |
|
| $ | 14,521,078 |
|
| $ | 12,623,630 |
|
|
|
|
|
|
|
|
|
|
|
| |||
NET INCOME ADJUSTED FOR INTANGIBLE AMORTIZATION |
|
|
|
|
|
|
|
|
|
| |||
Net income |
|
| $ | 165,489 |
|
| $ | 71,887 |
|
| $ | 147,365 |
|
Plus: Intangible amortization net of tax |
|
|
| 505 |
|
|
| 1,076 |
|
|
| 1,738 |
|
Net income adjusted for intangible amortization |
|
| $ | 165,994 |
|
| $ | 72,963 |
|
| $ | 149,103 |
|
Period end common shares outstanding | (d) |
|
| 61,071,173 |
|
|
| 60,977,686 |
|
|
| 61,648,679 |
|
|
|
|
|
|
|
|
|
|
|
| |||
TANGIBLE EQUITY MEASUREMENTS |
|
|
|
|
|
|
|
|
|
| |||
Return on average tangible equity (1) |
|
|
| 14.04 | % |
|
| 6.00 | % |
|
| 10.81 | % |
Tangible equity/tangible assets | (a)/(b) |
|
| 6.95 | % |
|
| 6.27 | % |
|
| 7.86 | % |
Tangible equity/risk-weighted assets | (a)/(c) |
|
| 8.41 | % |
|
| 7.61 | % |
|
| 10.71 | % |
Tangible book value | (a)/(d)*1,000 |
| $ | 20.87 |
|
| $ | 18.11 |
|
| $ | 21.93 |
|
|
|
|
|
|
|
|
|
|
|
| |||
COMMON EQUITY TIER 1 CAPITAL (CET1) - BASEL III |
|
|
|
|
|
|
|
|
|
| |||
Total shareholders' equity |
|
| $ | 1,661,847 |
|
| $ | 1,492,268 |
|
| $ | 1,741,311 |
|
CECL transition adjustment (2) |
|
|
| 13,000 |
|
|
| 19,500 |
|
|
| 26,000 |
|
AOCI-related adjustments |
|
|
| 219,723 |
|
|
| 275,403 |
|
|
| 32,560 |
|
CET1 adjustments and deductions: |
|
|
|
|
|
|
|
|
|
| |||
Goodwill net of associated deferred tax liabilities (DTLs) |
|
|
| (370,212 | ) |
|
| (370,241 | ) |
|
| (370,252 | ) |
Other adjustments and deductions for CET1 (3) |
|
|
| (2,693 | ) |
|
| (3,258 | ) |
|
| (4,392 | ) |
CET1 capital | (e) |
|
| 1,521,665 |
|
|
| 1,413,672 |
|
|
| 1,425,227 |
|
Additional tier 1 capital instruments plus related surplus |
|
|
| 60,000 |
|
|
| 60,000 |
|
|
| 60,000 |
|
Tier 1 capital |
|
| $ | 1,581,665 |
|
| $ | 1,473,672 |
|
| $ | 1,485,227 |
|
Common equity tier 1 risk-based capital ratio | (e)/(c) |
|
| 10.04 | % |
|
| 9.74 | % |
|
| 11.29 | % |
|
|
| Years Ended December 31, |
| |||||||||
TANGIBLE EQUITY |
|
| 2017 |
|
| 2016 |
|
| 2015 |
| |||
AVERAGE BALANCES |
|
|
|
|
|
|
|
|
|
|
|
|
|
Total shareholders' equity |
|
| $ | 1,560,884 |
|
| $ | 1,517,955 |
|
| $ | 1,460,650 |
|
Less: Goodwill |
|
|
| (375,947 | ) |
|
| (366,156 | ) |
|
| (365,613 | ) |
Identifiable intangible assets |
|
|
| (18,885 | ) |
|
| (24,132 | ) |
|
| (30,686 | ) |
Total average tangible equity |
|
| $ | 1,166,052 |
|
| $ | 1,127,667 |
|
| $ | 1,064,351 |
|
PERIOD END BALANCES |
|
|
|
|
|
|
|
|
|
|
|
|
|
Total shareholders' equity |
|
| $ | 1,571,701 |
|
| $ | 1,520,208 |
|
| $ | 1,473,057 |
|
Less: Goodwill |
|
|
| (379,627 | ) |
|
| (366,156 | ) |
|
| (366,156 | ) |
Identifiable intangible assets |
|
|
| (16,360 | ) |
|
| (20,680 | ) |
|
| (27,546 | ) |
Total tangible equity | (a) |
| $ | 1,175,714 |
|
| $ | 1,133,372 |
|
| $ | 1,079,355 |
|
|
|
|
|
|
|
|
|
|
|
|
|
|
|
TANGIBLE ASSETS |
|
|
|
|
|
|
|
|
|
|
|
|
|
Total assets |
|
| $ | 13,797,953 |
|
| $ | 13,352,333 |
|
| $ | 12,678,896 |
|
Less: Goodwill |
|
|
| (379,627 | ) |
|
| (366,156 | ) |
|
| (366,156 | ) |
Identifiable intangible assets |
|
|
| (16,360 | ) |
|
| (20,680 | ) |
|
| (27,546 | ) |
Total tangible assets | (b) |
| $ | 13,401,966 |
|
| $ | 12,965,497 |
|
| $ | 12,285,194 |
|
Risk-weighted assets | (c) |
| $ | 10,566,818 |
|
| $ | 9,952,123 |
|
| $ | 9,242,902 |
|
|
|
|
|
|
|
|
|
|
|
|
|
|
|
NET INCOME ADJUSTED FOR INTANGIBLE AMORTIZATION |
|
|
|
|
|
|
|
|
|
|
|
|
|
Net income |
|
| $ | 105,630 |
|
| $ | 108,411 |
|
| $ | 116,038 |
|
Plus: Intangible amortization net of tax |
|
|
| 3,810 |
|
|
| 4,240 |
|
|
| 4,829 |
|
Net income adjusted for intangible amortization |
|
| $ | 109,440 |
|
| $ | 112,651 |
|
| $ | 120,867 |
|
Period end common shares outstanding | (d) |
|
| 67,746,094 |
|
|
| 67,628,618 |
|
|
| 67,559,128 |
|
TANGIBLE EQUITY MEASUREMENTS |
|
|
|
|
|
|
|
|
|
|
|
|
|
Return on average tangible equity (1) |
|
|
| 9.39 | % |
|
| 9.99 | % |
|
| 11.36 | % |
Tangible equity/tangible assets | (a)/(b) |
|
| 8.77 | % |
|
| 8.74 | % |
|
| 8.79 | % |
Tangible equity/risk-weighted assets | (a)/(c) |
|
| 11.13 | % |
|
| 11.39 | % |
|
| 11.68 | % |
Tangible book value | (a)/(d)*1,000 |
| $ | 17.35 |
|
| $ | 16.76 |
|
| $ | 15.98 |
|
COMMON EQUITY TIER 1 CAPITAL (CET1) - BASEL III |
|
|
|
|
|
|
|
|
|
|
|
|
|
Total shareholders' equity |
|
| $ | 1,571,701 |
|
| $ | 1,520,208 |
|
| $ | 1,473,057 |
|
AOCI-related adjustments |
|
|
| 48,248 |
|
|
| 45,798 |
|
|
| 45,394 |
|
CET1 adjustments and deductions: |
|
|
|
|
|
|
|
|
|
|
|
|
|
Goodwill net of associated deferred tax liabilities (DTLs) |
|
|
| (366,461 | ) |
|
| (347,442 | ) |
|
| (348,873 | ) |
Other adjustments and deductions for CET1 (2) |
|
|
| (10,248 | ) |
|
| (8,637 | ) |
|
| (7,980 | ) |
CET1 capital | (e) |
|
| 1,243,240 |
|
|
| 1,209,927 |
|
|
| 1,161,598 |
|
Additional tier 1 capital instruments plus related surplus |
|
|
| 60,000 |
|
|
| 60,000 |
|
|
| 60,000 |
|
Less: Additional tier 1 capital deductions |
|
|
| (2 | ) |
|
| (267 | ) |
|
| (1,063 | ) |
Additional tier 1 capital |
|
|
| 59,998 |
|
|
| 59,733 |
|
|
| 58,937 |
|
Tier 1 capital |
|
| $ | 1,303,238 |
|
| $ | 1,269,660 |
|
| $ | 1,220,535 |
|
Common equity tier 1 risk-based capital ratio | (e)/(c) |
|
| 11.77 | % |
|
| 12.16 | % |
|
| 12.57 | % |
|
|
|
|
Significant Non-routine Transactions
Trustmark discloses certain non-GAAP financial measures, including net income adjusted for significant non-routine transactions, because Management uses these measures for business planning purposes, including to manage Trustmark’s business against internal projected results of operations and to measure Trustmark’s performance. Trustmark views net income adjusted for significant non-routine transactions as a measure of its core operating business, which excludes the impact of the items detailed below, as these items are generally not operational in nature. This non-GAAP measure also provides another basis for comparing period-to-period results as presented in the accompanying selected financial data table and the audited consolidated financial statements by excluding potential differences caused by non-operational and unusual or non-recurring items. Readers are cautioned that these adjustments are not permitted under GAAP. Trustmark encourages readers to consider its audited consolidated financial statements and the notes related thereto, included in Part II. Item 8. – Financial Statements and Supplementary Data of this report, in their entirety, and not to rely on any single financial measure.
4039
The following table presents adjustments to net income and select financial ratios as reported in accordance with GAAP resulting from significant non-routine items occurring during the periods presented ($ in thousands, except per share data):
|
| Years Ended December 31, |
| |||||||||||||||||||||
|
| 2017 |
|
| 2016 |
|
| 2015 |
| |||||||||||||||
|
| Amount |
|
| Diluted EPS |
|
| Amount |
|
| Diluted EPS |
|
| Amount |
|
| Diluted EPS |
| ||||||
Net Income (GAAP) |
| $ | 105,630 |
|
| $ | 1.556 |
|
| $ | 108,411 |
|
| $ | 1.599 |
|
| $ | 116,038 |
|
| $ | 1.714 |
|
|
|
|
|
|
|
|
|
|
|
|
|
|
|
|
|
|
|
|
|
|
|
|
|
|
Significant non-routine transactions: |
|
|
|
|
|
|
|
|
|
|
|
|
|
|
|
|
|
|
|
|
|
|
|
|
Re-measurement of net deferred taxes |
|
| 25,619 |
|
|
| 0.377 |
|
|
| — |
|
|
| — |
|
|
| — |
|
|
| — |
|
Elimination of deferred tax valuation allowance |
|
| (8,650 | ) |
|
| (0.127 | ) |
|
| — |
|
|
| — |
|
|
| — |
|
|
| — |
|
Defined benefit plan termination, net of tax |
|
| 10,895 |
|
|
| 0.160 |
|
|
| — |
|
|
| — |
|
|
| — |
|
|
| — |
|
Reliance merger transaction expenses, net of tax |
|
| 1,999 |
|
|
| 0.029 |
|
|
| — |
|
|
| — |
|
|
| — |
|
|
| — |
|
Non-taxable gain on acquired life insurance proceeds |
|
| (4,894 | ) |
|
| (0.072 | ) |
|
| — |
|
|
| — |
|
|
| — |
|
|
| — |
|
Early retirement program expense, net of tax |
|
| — |
|
|
| — |
|
|
| 6,049 |
|
|
| 0.089 |
|
|
| — |
|
|
| — |
|
Pension expense due to de-risking strategy in Plan assets portfolio, net of tax |
|
| — |
|
|
| — |
|
|
| 820 |
|
|
| 0.012 |
|
|
| — |
|
|
| — |
|
Net Income adjusted for significant non-routine transactions (Non-GAAP) |
| $ | 130,599 |
|
| $ | 1.923 |
|
| $ | 115,280 |
|
| $ | 1.700 |
|
| $ | 116,038 |
|
| $ | 1.714 |
|
|
|
|
|
|
|
|
|
|
|
|
|
|
|
|
|
|
|
|
|
|
|
|
|
|
|
| Reported (GAAP) |
|
| Adjusted (Non-GAAP) |
|
| Reported (GAAP) |
|
| Adjusted (Non-GAAP) |
|
| Reported (GAAP) |
|
| Adjusted (Non-GAAP) |
| ||||||
Return on average equity |
|
| 6.77 | % |
|
| 8.37 | % |
|
| 7.14 | % |
|
| 7.59 | % |
|
| 7.94 | % |
| n/a |
| |
Return on average tangible equity |
|
| 9.39 | % |
|
| 11.53 | % |
|
| 9.99 | % |
|
| 10.60 | % |
|
| 11.36 | % |
| n/a |
| |
Return on average assets |
|
| 0.77 | % |
|
| 0.95 | % |
|
| 0.84 | % |
|
| 0.89 | % |
|
| 0.95 | % |
| n/a |
| |
|
| Years Ended December 31, |
| |||||||||||||||||||||
|
| 2023 |
|
| 2022 |
|
| 2021 |
| |||||||||||||||
|
| Amount |
|
| Diluted EPS |
|
| Amount |
|
| Diluted EPS |
|
| Amount |
|
| Diluted EPS |
| ||||||
Net income (GAAP) |
| $ | 165,489 |
|
| $ | 2.70 |
|
| $ | 71,887 |
|
| $ | 1.17 |
|
| $ | 147,365 |
|
| $ | 2.34 |
|
|
|
|
|
|
|
|
|
|
|
|
|
|
|
|
|
|
|
| ||||||
Significant non-routine transactions (net of taxes): |
|
|
|
|
|
|
|
|
|
|
|
|
|
|
|
|
|
| ||||||
Reduction in force expense |
|
| 1,055 |
|
|
| 0.02 |
|
|
| — |
|
|
| — |
|
|
| — |
|
|
| — |
|
Litigation settlement expense |
|
| 4,875 |
|
|
| 0.08 |
|
|
| 75,563 |
|
|
| 1.23 |
|
|
| — |
|
|
| — |
|
Voluntary early retirement program |
|
| — |
|
|
| — |
|
|
| — |
|
|
| — |
|
|
| 4,275 |
|
|
| 0.07 |
|
Regulatory settlement charge |
|
| — |
|
|
| — |
|
|
| — |
|
|
| — |
|
|
| 5,000 |
|
|
| 0.08 |
|
Net Income adjusted for significant |
| $ | 171,419 |
|
| $ | 2.80 |
|
| $ | 147,450 |
|
| $ | 2.40 |
|
| $ | 156,640 |
|
| $ | 2.49 |
|
|
|
|
|
|
|
|
|
|
|
|
|
|
|
|
|
|
|
| ||||||
|
| Reported |
|
| Adjusted |
|
| Reported |
|
| Adjusted |
|
| Reported |
|
| Adjusted |
| ||||||
Return on average equity |
|
| 10.54 | % |
|
| 10.90 | % |
|
| 4.48 | % |
|
| 9.13 | % |
|
| 8.32 | % |
|
| 8.83 | % |
Return on average tangible equity |
|
| 14.04 | % |
|
| 14.51 | % |
|
| 6.00 | % |
|
| 12.12 | % |
|
| 10.81 | % |
|
| 11.45 | % |
Return on average assets |
|
| 0.89 | % |
|
| 0.92 | % |
|
| 0.41 | % |
|
| 0.84 | % |
|
| 0.86 | % |
|
| 0.92 | % |
Re-measurement of Net Deferred TaxesReduction in Force Expense
During the fourth quarter 2023, Trustmark incurred reduction in force expenses of 2017,$1.4 million related to various restructuring initiatives.
Litigation Settlement Expense
On October 9, 2023, Trustmark re-measured its net deferred tax assets subsequententered into a settlement agreement that resolved all current and potential future claims relating to litigation involving Adams/Madison Timber. Information regarding this settlement and related litigation is set forth under the enactmentheading “Legal Proceedings” of the Tax Reform Act which resultedNote 16 – Commitments and Contingencies in the reductionPart II. Item 8. – Financial Statements and Supplementary Data of the corporate federal income tax rate. In accordance with FASB ASC Topic 740, “Income Taxes,” Trustmark recorded a one-time increase in deferred income tax expense of $25.6 million for the year ended December 31, 2017.
Elimination of Deferred Tax Valuation Allowance
During 2013, a deferred tax valuation allowance was created asthis report. As a result of Trustmark’s merger with BancTrust Financial Group, Inc. (BancTrust) and was established to reduce deferred tax assetsthis settlement, Trustmark recognized a one-time charge of $6.5 million of litigation settlement expense during the third quarter of 2023.
On January 13, 2023, TNB entered into a settlement agreement relating to the amount that was more likely than not to be realizedlitigation involving the Stanford Financial Group. Information regarding this settlement and related litigation is set forth under the heading “Legal Proceedings” of Note 16 – Commitments and Contingencies in future years.Part II. Item 8. – Financial Statements and Supplementary Data of this report. As a result of this settlement, Trustmark has continually evaluated this allowance since inception and, based on the weightrecognized a one-time charge of the available evidence, has determined that the deferred tax assets will not be subject to the limitations$100.0 million of Internal Revenue Code, Section 382 on the deductibilitylitigation settlement expense as well as an additional $750 thousand of built-in losses in future years. Duringlegal fees during the fourth quarter of 2017, Trustmark eliminated the valuation allowance and recorded a one-time decrease in deferred income tax expense of $8.7 million.2022.
Defined Benefit Pension Plan Termination Expense
As previously reported, on July 26, 2016, the Board of Directors of Trustmark authorized the termination of the Plan, a noncontributory tax-qualified defined benefit pension plan, effective as of December 31, 2016. The final distributions were made from current plan assets and a one-time pension settlement expense of $17.6 million, before taxes, which is included in noninterest expense for the year ended December 31, 2017.
Reliance Merger Transaction Expenses
On April 7, 2017, Trustmark completed its previously announced merger with Reliance. The operations of Reliance are included in Trustmark’s operating results from April 7, 2017 and did not have a material impact on Trustmark’s results of operations. During the second quarter of 2017, Trustmark included non-routine merger transaction expenses in other expense totaling $3.2 million, before tax.
41
Non-taxable Gain on Acquired Life Insurance Proceeds
During the second quarter of 2017, Trustmark received non-routine, non-taxable proceeds related to life insurance acquired in a previous acquisition. Included in other income, net for the year ended December 31, 2017 were non-routine, non-taxable proceeds of $4.9 million.
Voluntary Early Retirement Program Expense
During the second quarter of 2016,2021, Trustmark completed a voluntary early retirement program (ERP) as a proactive measure to manage noninterest expense. Included in noninterest expense for the year ended December 31, 2016 wereand incurred one-time charges of $5.7 million ($5.6 million of non-routine expenses related to the ERP totaling $9.8 million, before taxes, ($9.6 million included in salaries and employee benefits expense and $213$89 thousand included inof non-routine other miscellaneous expense).
Pension Expense Due to De-risking Strategy in Plan Assets Portfolio
On July 26, 2016, the Board of Directors of Trustmark authorized the termination of the Plan effective December 31, 2016. As a result of Trustmark’s de-risking investment strategy for the Plan as of June 30, 2016, the expected rate of return on plan assets during the second half of 2016 decreased from 6.0% to 2.5%, which resulted in increased periodic benefit costs for the Plan. Included in salaries and employee benefits expense for the year ended December 31, 2016, were non-routine pension expenses related to this program.
Regulatory Settlement Charge
During 2021, Trustmark finalized a settlement with regulatory authorities to resolve fair lending allegations in the de-risking investment strategy forMemphis metropolitan statistical area (MSA). Trustmark incurred a one-time settlement expense of $5.0 million and made other commitments to enhance credit opportunities to residents in majority-Black and Hispanic neighborhoods in the plan assets totaling $1.3 million, before tax.Memphis MSA.
Results of Operations
Net Interest Income
Net interest income is the principal component of Trustmark’s income stream and represents the difference, or spread, between interest and fee income generated from earning assets and the interest expense paid on deposits and borrowed funds. Fluctuations in interest
40
rates, as well as volume and mix changes in earning assets and interest-bearing liabilities, can materially impact net interest income. The net interest margin is computed by dividing fully taxable equivalent (FTE) net interest income by average interest-earning assets and measures how effectively Trustmark utilizes its interest-earning assets in relationship to the interest cost of funding them. The accompanying Yield/Rate Analysis Table shows the average balances for all assets and liabilities of Trustmark and the interest income or expense associated with earning assets and interest-bearing liabilities. The yields and rates have been computed based upon interest income and expense adjusted to a FTE basis using a 35.0%the federal marginalstatutory corporate tax rate in effect for alleach of the periods shown. Loans on nonaccrual have been included in the average loan balances, and interest collected prior to these loans having been placed on nonaccrual has been included in interest income. Loan fees included in interest associated with the average loanLHFS and LHFI balances are immaterial.
Net interest income-FTE for 2017the year ended December 31, 2023 increased $21.5$59.3 million, or 5.3%11.7%, when compared with 2016.the year ended December 31, 2022. The increase in net interest margin decreased 5 basis points to 3.48% for 2017income-FTE when 2023 is compared to 2016. The decrease in the net interest margin2022 was primarily the result ofprincipally due to increases in the cost of interest-bearing liabilities in conjunction with rising rates in general,interest and fees on LHFS and LHFI-FTE and other interest income, partially offset by an increase in the yield on LHFS and LHFI.total interest expense. The net interest marginmargin-FTE for 2023 increased 15 basis points to 3.32% when compared to 2022. The net interest margin-FTE excluding acquiredPPP loans and the balance held at the FRBA, which equals the reported net interest income-FTE excluding interest and fees on acquiredPPP loans and interest on the FRBA balance, as a percentage of average earning assets excluding average acquiredPPP loans and the average FRBA balance, was 3.25% for 2017 was 3.36%,2023, a decrease of 15 basis pointpoints when compared to 2016,3.30% for 2022. The decrease in the net interest margin-FTE excluding PPP loans and the balance held at the FRBA for 2023 was principally due to higher costs of interest-bearing liabilities, partially offset by increases in the factors discussed above.yields on the LHFS and LHFI and securities portfolios reflecting the higher interest rate environment.
At both December 31, 2023 and 2022, Trustmark had no PPP loans outstanding.
The average FRBA balance, included in other earning assets, for 2023 totaled $617.6 million, a decrease of $229.3 million, or 27.1%, when compared to 2022. Interest earned on the FRBA balance increased $25.0 million when 2023 is compared to 2022. The yield on the FRBA balance was 5.17% and 0.82% for 2023 and 2022, respectively, an increase of 435 basis points reflecting the FRBA's increase in the interest rate that it pays on reserves during 2023.
Average interest-earning assets for 20172023 were $12.274$17.082 billion compared to $11.485$16.014 billion for 20162022, an increase of $789.1 million,$1.068 billion, or 6.9%6.7%. The growthincrease in average earning assets during 20172023 was primarily due to an increase in average loans (LHFS and LHFI) of $820.5 million,$1.565 billion, or 10.8%13.9%, which was partially offset by a decreasedecreases in average acquired loanssecurities of $46.8$302.5 million, or 14.1%7.9%, and average other earning assets of $179.2 million, or 19.8%. The increase in average loans (LHFS and LHFI) was primarily attributable to the $718.8 million, or 9.2%,an increase in the average balance of the LHFI portfolio of $1.596 billion, or 14.5%, partially offset by a decrease in the average balance of the LHFS portfolio of $30.8 million, or 15.9%, when balances at December 31, 20172023 are compared to balances at December 31, 2016. This increase represented net growth across all of Trustmark’s market regions2022. See the sections captioned "LHFS" and all categories"LHFI" for additional information regarding changes in itsthe LHFS and LHFI portfolio.portfolios. The declinedecrease in average acquired loans during 2017 was primarily attributable to anticipated pay-offs of acquired loans, principally related to the BancTrust merger, as well as the reclassification of $36.7 million of acquired loans not accounted for under FASB ASC Topic 310-30 to LHFI due to the discount on these loans being fully amortized, partially offset by the loans acquired in the Reliance merger.
During 2017, interest and fees on LHFS and LHFI-FTE increased $46.8 million, or 14.8%,securities when compared to 2016, due to growth in LHFI, while the yield on loans (LHFS and LHFI) increased 15 basis points to 4.31% as a result of increases in interest rates. During 2017, interest and fees on acquired loans decreased $5.7 million, or 18.8%, compared to 2016, due to declines in recoveries on settlement of debt and accretion income, primarily related to loans acquired in the BancTrust merger, as acquired loans continue to pay-down as anticipated, partially offset by interest and fees on loans acquired in the Reliance merger. As a result, the yield on acquired loans decreased 50 basis points to 8.59% when 20172023 is compared to 2016. During 2017, interest on securities decreased $2.5 million, or 3.0%, and the yield on securities declined 8 basis points to 2.31%, compared to 2016, principally due to calls, maturities
42
and pay-downs of the underlying loans of higher yielding securities being replaced with lower yielding securities as well as a decline in the yield maintenance payments on prepaid mortgage-backed securities. As a result of these factors, interest income-FTE increased $39.2 million, or 9.1%, when 2017 is compared to 2016, while the yield on total earning assets increased 8 basis points to 3.83%.
Average interest-bearing liabilities for 2017 totaled $8.963 billion compared to $8.281 billion for 2016, an increase of $682.1 million, or 8.2%. The increase in average interest-bearing liabilities2022 was principally due to increases in average short-term borrowings and interest-bearing deposits, partially offset by a decline in average long-term FHLB advances. Average short-term borrowings for 2017 increased $768.3 million when compared to 2016, principally due to the increased balance in outstanding short-term FHLB advances with the FHLB of Dallas. Average interest-bearing deposits for 2017 increased $481.3 million, or 7.2%, when compared to 2016 principally due to growth in all categories of interest-bearing deposits as well as the deposits acquired in the Reliance merger. Average long-term FHLB advances decreased $536.7 million, or 84.6%, during 2017, primarily due to the $500.0 million long-term FHLB advance obtained from the FHLB of Dallas that was reclassified to short-term during December 2016 and the $250.0 million long-term FHLB advance obtained from the FHLB of Dallas during May 2016 that was reclassified to short-term in May 2017.
Total interest expense for 2017 increased $17.7 million, or 72.1%, when compared with 2016, principally due to rising interest rates in general. Interest expense on deposits for 2017 increased $10.0 million, or 78.2%, when compared to 2016, principally due to rising rates in general, accompanied by increases in average balances of all categories of interest-bearing deposits. The rate on interest-bearing deposits increased 13 basis points to 0.32% for 2017 compared to 0.19% for 2016. Interest on federal funds purchased and securities sold under repurchase agreements increased $2.4 million while the rate increased 46 basis points to 0.81% when 2017 is compared to 2016 principally due to increases in the target range for the federal funds rate by the FRB. Other interest expense increased $5.3 million, or 52.5%, while the rate on other borrowings increased 27 basis points to 1.18% when the year ended December 31, 2017 is compared to the year ended December 31, 2016, principally due to increases in rates in general, accompanied by increases in average balances of short-term FHLB advances partially offset by the decline in interest expense on the subordinated notes which matured in December 2016. As a result of these factors, the overall rate on interest-bearing liabilities increased 17 basis points to 0.47% when 2017 is compared with 2016.
Net interest income-FTE for 2016 decreased $2.3 million, or 0.6%, when compared with 2015. The net interest margin decreased 25 basis points to 3.53% for 2016 when compared to 2015. The decrease in the net interest margin reflected the prolonged low interest rate environment in the United States, and was primarily the result of decreases in the yield on acquired loans principally due to declines in accretion income and recoveries on settlement of debt related to acquired loans, downward repricing of LHFI in response to increased competitive pricing pressures and decreases in the yield on taxable securities. The net interest margin excluding acquired loans, which equals the reported net interest income-FTE excluding interest and fees on acquired loans, as a percentage of average earning assets excluding average acquired loans, for 2016 was 3.37%, a decrease of 9 basis points when compared to 2015, due to similar factors as discussed above.
Average interest-earning assets for 2016 were $11.485 billion compared to $10.791 billion for 2015 an increase of $693.4 million, or 6.4%. The growth in average earning assets during 2016 was primarily due to an increase in average loans (LHFS and LHFI) of $846.3 million, or 12.5%, partially offset by a decrease in average acquired loans of $130.9 million, or 28.3% and a decline in average total securities of $38.7 million, or 1.1%. The increase in average loans (LHFS and LHFI) was primarily attributable to the $759.8 million, or 10.7%, increase in the LHFI portfolio when balances at December 31, 2016 are compared to balances at December 31, 2015. This increase represented net growth across all of Trustmark’s market regions and all categories in its LHFI portfolio, with the exception of other loans. The decline in average acquired loans during 2016 was primarily attributable to anticipated pay-offs of acquired loans, principally related to the BancTrust merger. The decline in average total securities during 2016 was primarily attributable to calls, maturities and pay-downs of the loans underlying these securities.
During 2016, interest and fees on LHFS and LHFI-FTE increased $27.5 million, or 9.5%, when compared to 2015, due to growth in LHFI, while the yield on loans (LHFS and LHFI) fell 12 basis points to 4.16% as a result of downward repricing of LHFI due to the current interest rate environment and related competitive pressures. During 2016, interest and fees on acquired loans decreased $21.0 million, or 41.1%, compared to 2015, due to declines in accretion income and recoveries on settlement of debt as acquired loans continue to pay-down as anticipated. As a result, the yield on acquired loans decreased to 9.09% compared to 11.06% during 2015. During 2016, interest on securities-taxable decreased $3.1 million, or 3.9%, and the yield on taxable securities declined 8 basis points to 2.31%, compared to 2015, principally due to calls, maturities and pay-downs of the underlying loans of higher yielding securities being replaced with lower yielding securities reflecting the current interest rate environment as well as a declinegovernment-sponsored enterprise (GSE) guaranteed securities. The decrease in the yield maintenance payments on prepaid mortgage-backed securities. As a result of these factors, interest income-FTE increased $1.8 million, or 0.4%,average other earning assets when 20162023 is compared to 2015. The impact2022 was primarily due to a decrease in reserves held at the FRBA.
Interest income-FTE totaled $892.3 million for 2023, an increase of these changes is also illustrated by the decline in$338.1 million, or 61.0%, while the yield on total earning assets which fell from 3.97% for 2015increased 176 basis points to 3.75% for 2016,5.22% when compared to 2022. The increase in interest income-FTE in 2023 primarily reflects increases in interest and fees on LHFS and LHFI-FTE and other interest income. During 2023, interest and fees on LHFS and LHFI-FTE increased $303.5 million, or 62.5%, when compared to 2022, while the yield on loans (LHFS and LHFI) increased to 6.16% compared to 4.32% as a decreaseresult of 22 basis points.the increase in the average balance of the LHFI portfolio as well as higher interest rates. During 2023, other interest income increased $29.1 million when compared to 2022, while the yield on other earning assets increased to 5.10% compared to 0.89%, principally due to the FRBA's increase in the interest rate paid on reserves during 2023. See the discussion above regarding changes in interest income and yields on balances held at the FRBA.
Average interest-bearing liabilities for 20162023 totaled $8.281$12.983 billion compared to $7.890$10.987 billion for 2015,2022, an increase of $391.0 million,$1.996 billion, or 5.0%18.2%. The increase in average interest-bearing liabilities was attributable to an increaseprimarily the result of increases in average long-term FHLB advancesinterest-bearing deposits, average other borrowings and average federal funds purchased and securities sold under repurchase agreements. Average interest-bearing deposits for 2023 increased $1.083 billion, or 10.5%, when compared to 2022, reflecting growth in average time deposits and average interest-bearing demand deposits partially offset by declines in allaverage savings deposits. Average other categories of average interest-bearing liabilities. Average long-termborrowings for 2023 increased $785.6 million when compared to 2022, principally due to the increase in short-term FHLB advances outstanding during the year. Average federal funds purchased and securities sold under repurchase agreements increased $127.6 million, or 45.0%, when 2023 is compared to 2022, principally due to an increase in upstream federal funds purchased during the year.
43
$620.8Interest expense for 2023 totaled $326.0 million, during 2016,an increase of $278.8 million when compared with 2022, while the rate on total interest-bearing liabilities increased to 2.51% compared to 0.43%. The increase in total interest expense for 2023 reflected increases in interest on deposits, interest on federal funds purchased and securities sold under repurchase agreements and other interest expense. Interest on
41
deposits increased $216.9 million, while the rate on interest-bearing deposits increased to 2.16% compared to 0.28% when 2023 is compared to 2022, primarily due to increases in interest on all categories of interest checking accounts, CDs and MMDAs, reflecting rising interest rates and higher average balances. Other interest expense increased $47.7 million, while the $500.0 million long-term FHLB advance obtained from the FHLB of Dallas during December 2015 and the $250.0 million long-term FHLB advance obtained from the FHLB of Dallas during May 2016. Average interest-bearing deposits for 2016 decreased $174.5 million, or 2.5%rate on other borrowings increased to 5.09% compared to 3.11%, when 2023 is compared to 2015,2022, principally due to declines in average time deposits, reflecting Trustmark’s continued efforts to reduce high-cost deposit balances and customers continued movement away from longer-term commitments as a result of the low interest rate environment. Average short-term borrowings decreased $45.1 million, or 10.9%, when 2016 is compared to 2015, which was primarily attributable to a decreasean increase in the amount of short-term FHLB advances obtained from the FHLB of Dallas during 2016 partially offset by the $500.0 million FHLB advance withyear as well as the FHLB of Dallas that was reclassified from long-term to short-term during December 2016.
Total interest expense during 2016 increased $4.1 million, or 20.0%, when compared with 2015, principally due to the increase in other interest expense. Other interest expense increased $3.0 million, or 42.8%, when 2016 is compared to 2015, primarily due to increases in interest expense on long-term FHLB advances and short-term borrowings. Interest expense on long-term FHLB advances increased $2.1 million during 2016, while the rate on long-term FHLB advances decreased 3 basis points to 0.33%, compared to 2015, reflecting the increase in the outstanding long-term FHLB advances with the FHLB of Dallas. Interest expense on short-term borrowings increased $836 thousand, or 29.2%, during 2016 primarily due to a $1.1 million increase in interest expensepaid on short-term FHLB advances, while the rate for short-term borrowings increased 31 basis points to 1.00%.advances. Interest expense on federal funds purchased and securities sold under reverse repurchase agreements increased $916 thousand when 2016 is compared to 2015,$14.3 million, while the rate on federal funds purchased and securities sold under reverse repurchase agreements increased 19 basis points to 0.35%. The increase in the rate on federal funds purchased and securities sold under reverse repurchase agreements during 2016 was4.97% compared to 2.16%, when 2023 is compared to 2022, principally due to the FRB’s increase in rates by the FRB. As a result of these factors,target range for the overall yield on interest-bearing liabilities increased 4 basis points to 0.30% when 2016 is compared with 2015.federal funds rate as well as an increase in upstream federal funds purchased during the year.
44
The following table provides the tax equivalent basis yield or rate for each component of the tax equivalent net interest margin for the periods presented ($ in thousands):
|
| Years Ended December 31, |
| |||||||||||||||||||||||||||||||||
|
| 2023 |
|
| 2022 |
|
| 2021 |
| |||||||||||||||||||||||||||
|
| Average |
|
|
|
| Yield/ |
|
| Average |
|
|
|
| Yield/ |
|
| Average |
|
|
|
| Yield/ |
| ||||||||||||
|
| Balance |
| Interest |
|
| Rate |
|
| Balance |
| Interest |
|
| Rate |
|
| Balance |
| Interest |
|
| Rate |
| ||||||||||||
Assets |
|
|
|
|
|
|
|
|
|
|
|
|
|
|
|
|
|
|
|
|
|
|
|
|
|
|
| |||||||||
Interest-earning assets: |
|
|
|
|
|
|
|
|
|
|
|
|
|
|
|
|
|
|
|
|
|
|
|
|
|
|
| |||||||||
Federal funds sold and securities |
| $ | 1,492 |
|
| $ | 80 |
|
|
| 5.36 | % |
| $ | 1,753 |
|
| $ | 74 |
|
|
| 4.22 | % |
| $ | 79 |
|
| $ | — |
|
|
| — |
|
Securities available for sale: |
|
|
|
|
|
|
|
|
|
|
|
|
|
|
|
|
|
|
|
|
|
|
|
| ||||||||||||
Taxable |
|
| 2,090,201 |
|
|
| 35,359 |
|
|
| 1.69 | % |
|
| 2,932,054 |
|
|
| 38,799 |
|
|
| 1.32 | % |
|
| 2,573,533 |
|
|
| 30,453 |
|
|
| 1.18 | % |
Nontaxable |
|
| 4,657 |
|
|
| 182 |
|
|
| 3.91 | % |
|
| 4,997 |
|
|
| 195 |
|
|
| 3.90 | % |
|
| 5,166 |
|
|
| 199 |
|
|
| 3.85 | % |
Securities held to maturity: |
|
|
|
|
|
|
|
|
|
|
|
|
|
|
|
|
|
|
|
|
|
|
|
| ||||||||||||
Taxable |
|
| 1,454,450 |
|
|
| 30,741 |
|
|
| 2.11 | % |
|
| 911,010 |
|
|
| 20,918 |
|
|
| 2.30 | % |
|
| 423,763 |
|
|
| 8,245 |
|
|
| 1.95 | % |
Nontaxable |
|
| 1,854 |
|
|
| 81 |
|
|
| 4.37 | % |
|
| 5,623 |
|
|
| 227 |
|
|
| 4.04 | % |
|
| 12,765 |
|
|
| 495 |
|
|
| 3.88 | % |
PPP loans |
|
| — |
|
|
| — |
|
|
| — |
|
|
| 14,868 |
|
|
| 639 |
|
|
| 4.30 | % |
|
| 350,668 |
|
|
| 36,726 |
|
|
| 10.47 | % |
Loans (LHFS and LHFI) |
|
| 12,801,531 |
|
|
| 788,719 |
|
|
| 6.16 | % |
|
| 11,236,388 |
|
|
| 485,246 |
|
|
| 4.32 | % |
|
| 10,377,941 |
|
|
| 375,330 |
|
|
| 3.62 | % |
Other earning assets |
|
| 728,181 |
|
|
| 37,135 |
|
|
| 5.10 | % |
|
| 907,414 |
|
|
| 8,080 |
|
|
| 0.89 | % |
|
| 1,825,134 |
|
|
| 2,767 |
|
|
| 0.15 | % |
Total interest-earning assets |
|
| 17,082,366 |
|
|
| 892,297 |
|
|
| 5.22 | % |
|
| 16,014,107 |
|
|
| 554,178 |
|
|
| 3.46 | % |
|
| 15,569,049 |
|
|
| 454,215 |
|
|
| 2.92 | % |
Other assets |
|
| 1,718,058 |
|
|
|
|
|
|
|
|
| 1,567,921 |
|
|
|
|
|
|
|
|
| 1,599,114 |
|
|
|
|
|
|
| ||||||
Allowance for credit losses |
|
| (125,942 | ) |
|
|
|
|
|
|
|
| (104,138 | ) |
|
|
|
|
|
|
|
| (110,170 | ) |
|
|
|
|
|
| ||||||
Total Assets |
| $ | 18,674,482 |
|
|
|
|
|
|
|
| $ | 17,477,890 |
|
|
|
|
|
|
|
| $ | 17,057,993 |
|
|
|
|
|
|
| ||||||
|
|
|
|
|
|
|
|
|
|
|
|
|
|
|
|
|
|
|
|
|
|
|
|
|
|
|
| |||||||||
Liabilities and Shareholders' Equity |
|
|
|
|
|
|
|
|
|
|
|
|
|
|
|
|
|
|
|
|
|
|
|
|
|
|
| |||||||||
Interest-bearing liabilities: |
|
|
|
|
|
|
|
|
|
|
|
|
|
|
|
|
|
|
|
|
|
|
|
|
|
|
| |||||||||
Interest-bearing demand deposits |
| $ | 4,871,977 |
|
|
| 121,138 |
|
|
| 2.49 | % |
| $ | 4,585,955 |
|
|
| 16,409 |
|
|
| 0.36 | % |
| $ | 4,096,746 |
|
|
| 4,906 |
|
|
| 0.12 | % |
Savings deposits |
|
| 3,838,791 |
|
|
| 28,605 |
|
|
| 0.75 | % |
|
| 4,579,742 |
|
|
| 9,654 |
|
|
| 0.21 | % |
|
| 4,622,167 |
|
|
| 7,912 |
|
|
| 0.17 | % |
Time deposits |
|
| 2,691,682 |
|
|
| 96,208 |
|
|
| 3.57 | % |
|
| 1,153,983 |
|
|
| 3,006 |
|
|
| 0.26 | % |
|
| 1,287,663 |
|
|
| 4,127 |
|
|
| 0.32 | % |
Federal funds purchased and |
|
| 410,945 |
|
|
| 20,419 |
|
|
| 4.97 | % |
|
| 283,328 |
|
|
| 6,127 |
|
|
| 2.16 | % |
|
| 172,782 |
|
|
| 232 |
|
|
| 0.13 | % |
Other borrowings |
|
| 984,315 |
|
|
| 50,441 |
|
|
| 5.12 | % |
|
| 198,672 |
|
|
| 4,963 |
|
|
| 2.50 | % |
|
| 125,554 |
|
|
| 1,037 |
|
|
| 0.83 | % |
Subordinated notes |
|
| 123,364 |
|
|
| 4,751 |
|
|
| 3.85 | % |
|
| 123,144 |
|
|
| 4,751 |
|
|
| 3.86 | % |
|
| 122,933 |
|
|
| 4,752 |
|
|
| 3.87 | % |
Junior subordinated debt securities |
|
| 61,856 |
|
|
| 4,392 |
|
|
| 7.10 | % |
|
| 61,856 |
|
|
| 2,215 |
|
|
| 3.58 | % |
|
| 61,856 |
|
|
| 1,194 |
|
|
| 1.93 | % |
Total interest-bearing liabilities |
|
| 12,982,930 |
|
|
| 325,954 |
|
|
| 2.51 | % |
|
| 10,986,680 |
|
|
| 47,125 |
|
|
| 0.43 | % |
|
| 10,489,701 |
|
|
| 24,160 |
|
|
| 0.23 | % |
Noninterest-bearing demand deposits |
|
| 3,532,134 |
|
|
|
|
|
|
|
|
| 4,452,046 |
|
|
|
|
|
|
|
|
| 4,531,642 |
|
|
|
|
|
|
| ||||||
Other liabilities |
|
| 589,320 |
|
|
|
|
|
|
|
|
| 434,310 |
|
|
|
|
|
|
|
|
| 266,499 |
|
|
|
|
|
|
| ||||||
Shareholders' equity |
|
| 1,570,098 |
|
|
|
|
|
|
|
|
| 1,604,854 |
|
|
|
|
|
|
|
|
| 1,770,151 |
|
|
|
|
|
|
| ||||||
Total Liabilities and |
| $ | 18,674,482 |
|
|
|
|
|
|
|
| $ | 17,477,890 |
|
|
|
|
|
|
|
| $ | 17,057,993 |
|
|
|
|
|
|
| ||||||
|
|
|
|
|
|
|
|
|
|
|
|
|
|
|
|
|
|
|
|
|
|
|
|
|
|
|
| |||||||||
Net Interest Margin |
|
|
|
|
| 566,343 |
|
|
| 3.32 | % |
|
|
|
|
| 507,053 |
|
|
| 3.17 | % |
|
|
|
|
| 430,055 |
|
|
| 2.76 | % | |||
|
|
|
|
|
|
|
|
|
|
|
|
|
|
|
|
|
|
|
|
|
|
|
|
|
|
|
| |||||||||
Less tax equivalent adjustments: |
|
|
|
|
|
|
|
|
|
|
|
|
|
|
|
|
|
|
|
|
|
|
|
|
|
|
| |||||||||
Investments |
|
|
|
|
| 55 |
|
|
|
|
|
|
|
|
| 89 |
|
|
|
|
|
|
|
|
| 146 |
|
|
|
| ||||||
Loans |
|
|
|
|
| 13,410 |
|
|
|
|
|
|
|
|
| 12,256 |
|
|
|
|
|
|
|
|
| 11,558 |
|
|
|
| ||||||
Net Interest Margin per |
|
|
|
| $ | 552,878 |
|
|
|
|
|
|
|
| $ | 494,708 |
|
|
|
|
|
|
|
| $ | 418,351 |
|
|
|
| ||||||
|
| Years Ended December 31, |
| |||||||||||||||||||||||||||||||||
|
| 2017 |
|
| 2016 |
|
| 2015 |
| |||||||||||||||||||||||||||
|
| Average |
|
|
|
|
|
| Yield/ |
|
| Average |
|
|
|
|
|
| Yield/ |
|
| Average |
|
|
|
|
|
| Yield/ |
| ||||||
|
| Balance |
|
| Interest |
|
| Rate |
|
| Balance |
|
| Interest |
|
| Rate |
|
| Balance |
|
| Interest |
|
| Rate |
| |||||||||
Assets |
|
|
|
|
|
|
|
|
|
|
|
|
|
|
|
|
|
|
|
|
|
|
|
|
|
|
|
|
|
|
|
|
|
|
|
|
Interest-earning assets: |
|
|
|
|
|
|
|
|
|
|
|
|
|
|
|
|
|
|
|
|
|
|
|
|
|
|
|
|
|
|
|
|
|
|
|
|
Federal funds sold and securities purchased under reverse repurchase agreements |
| $ | 2,229 |
|
| $ | 33 |
|
|
| 1.48 | % |
| $ | 1,105 |
|
| $ | 14 |
|
|
| 1.27 | % |
| $ | 835 |
|
| $ | 8 |
|
|
| 0.96 | % |
Securities available for sale: |
|
|
|
|
|
|
|
|
|
|
|
|
|
|
|
|
|
|
|
|
|
|
|
|
|
|
|
|
|
|
|
|
|
|
|
|
Taxable |
|
| 2,296,070 |
|
|
| 52,806 |
|
|
| 2.30 | % |
|
| 2,236,663 |
|
|
| 53,005 |
|
|
| 2.37 | % |
|
| 2,231,507 |
|
|
| 55,621 |
|
|
| 2.49 | % |
Nontaxable |
|
| 73,373 |
|
|
| 3,042 |
|
|
| 4.15 | % |
|
| 97,942 |
|
|
| 3,982 |
|
|
| 4.07 | % |
|
| 118,579 |
|
|
| 4,763 |
|
|
| 4.02 | % |
Securities held to maturity: |
|
|
|
|
|
|
|
|
|
|
|
|
|
|
|
|
|
|
|
|
|
|
|
|
|
|
|
|
|
|
|
|
|
|
|
|
Taxable |
|
| 1,091,108 |
|
|
| 23,386 |
|
|
| 2.14 | % |
|
| 1,120,267 |
|
|
| 24,609 |
|
|
| 2.20 | % |
|
| 1,140,182 |
|
|
| 25,109 |
|
|
| 2.20 | % |
Nontaxable |
|
| 32,874 |
|
|
| 1,575 |
|
|
| 4.79 | % |
|
| 34,616 |
|
|
| 1,672 |
|
|
| 4.83 | % |
|
| 37,883 |
|
|
| 1,888 |
|
|
| 4.98 | % |
Loans (LHFS and LHFI) |
|
| 8,412,673 |
|
|
| 362,795 |
|
|
| 4.31 | % |
|
| 7,592,223 |
|
|
| 316,007 |
|
|
| 4.16 | % |
|
| 6,745,970 |
|
|
| 288,538 |
|
|
| 4.28 | % |
Acquired loans |
|
| 284,898 |
|
|
| 24,478 |
|
|
| 8.59 | % |
|
| 331,736 |
|
|
| 30,144 |
|
|
| 9.09 | % |
|
| 462,602 |
|
|
| 51,152 |
|
|
| 11.06 | % |
Other earning assets |
|
| 80,468 |
|
|
| 1,466 |
|
|
| 1.82 | % |
|
| 70,029 |
|
|
| 988 |
|
|
| 1.41 | % |
|
| 53,613 |
|
|
| 1,579 |
|
|
| 2.95 | % |
Total interest-earning assets |
|
| 12,273,693 |
|
|
| 469,581 |
|
|
| 3.83 | % |
|
| 11,484,581 |
|
|
| 430,421 |
|
|
| 3.75 | % |
|
| 10,791,171 |
|
|
| 428,658 |
|
|
| 3.97 | % |
Cash and due from banks |
|
| 311,642 |
|
|
|
|
|
|
|
|
|
|
| 291,868 |
|
|
|
|
|
|
|
|
|
|
| 275,246 |
|
|
|
|
|
|
|
|
|
Other assets |
|
| 1,215,019 |
|
|
|
|
|
|
|
|
|
|
| 1,243,985 |
|
|
|
|
|
|
|
|
|
|
| 1,286,139 |
|
|
|
|
|
|
|
|
|
Allowance for loan losses |
|
| (84,708 | ) |
|
|
|
|
|
|
|
|
|
| (82,414 | ) |
|
|
|
|
|
|
|
|
|
| (82,361 | ) |
|
|
|
|
|
|
|
|
Total Assets |
| $ | 13,715,646 |
|
|
|
|
|
|
|
|
|
| $ | 12,938,020 |
|
|
|
|
|
|
|
|
|
| $ | 12,270,195 |
|
|
|
|
|
|
|
|
|
|
|
|
|
|
|
|
|
|
|
|
|
|
|
|
|
|
|
|
|
|
|
|
|
|
|
|
|
|
|
|
|
|
|
|
|
|
Liabilities and Shareholders' Equity |
|
|
|
|
|
|
|
|
|
|
|
|
|
|
|
|
|
|
|
|
|
|
|
|
|
|
|
|
|
|
|
|
|
|
|
|
Interest-bearing liabilities: |
|
|
|
|
|
|
|
|
|
|
|
|
|
|
|
|
|
|
|
|
|
|
|
|
|
|
|
|
|
|
|
|
|
|
|
|
Interest-bearing demand deposits |
| $ | 2,114,475 |
|
|
| 6,820 |
|
|
| 0.32 | % |
| $ | 1,866,225 |
|
|
| 3,297 |
|
|
| 0.18 | % |
| $ | 1,901,478 |
|
|
| 3,235 |
|
|
| 0.17 | % |
Savings deposits |
|
| 3,308,027 |
|
|
| 6,047 |
|
|
| 0.18 | % |
|
| 3,140,060 |
|
|
| 2,657 |
|
|
| 0.08 | % |
|
| 3,124,393 |
|
|
| 2,547 |
|
|
| 0.08 | % |
Time deposits |
|
| 1,730,569 |
|
|
| 9,850 |
|
|
| 0.57 | % |
|
| 1,665,516 |
|
|
| 6,794 |
|
|
| 0.41 | % |
|
| 1,820,437 |
|
|
| 6,816 |
|
|
| 0.37 | % |
Federal funds purchased and securities sold under repurchase agreements |
|
| 512,085 |
|
|
| 4,152 |
|
|
| 0.81 | % |
|
| 495,197 |
|
|
| 1,717 |
|
|
| 0.35 | % |
|
| 503,077 |
|
|
| 801 |
|
|
| 0.16 | % |
Short-term borrowings |
|
| 1,138,353 |
|
|
| 12,981 |
|
|
| 1.14 | % |
|
| 370,008 |
|
|
| 3,695 |
|
|
| 1.00 | % |
|
| 415,081 |
|
|
| 2,859 |
|
|
| 0.69 | % |
Long-term FHLB advances |
|
| 97,561 |
|
|
| 566 |
|
|
| 0.58 | % |
|
| 634,300 |
|
|
| 2,104 |
|
|
| 0.33 | % |
|
| 13,533 |
|
|
| 49 |
|
|
| 0.36 | % |
Subordinated notes |
|
| — |
|
|
| — |
|
|
| — |
|
|
| 47,662 |
|
|
| 2,775 |
|
|
| 5.82 | % |
|
| 49,951 |
|
|
| 2,895 |
|
|
| 5.80 | % |
Junior subordinated debt securities |
|
| 61,856 |
|
|
| 1,829 |
|
|
| 2.96 | % |
|
| 61,856 |
|
|
| 1,508 |
|
|
| 2.44 | % |
|
| 61,856 |
|
|
| 1,258 |
|
|
| 2.03 | % |
Total interest-bearing liabilities |
|
| 8,962,926 |
|
|
| 42,245 |
|
|
| 0.47 | % |
|
| 8,280,824 |
|
|
| 24,547 |
|
|
| 0.30 | % |
|
| 7,889,806 |
|
|
| 20,460 |
|
|
| 0.26 | % |
Noninterest-bearing demand deposits |
|
| 3,028,982 |
|
|
|
|
|
|
|
|
|
|
| 2,996,886 |
|
|
|
|
|
|
|
|
|
|
| 2,781,682 |
|
|
|
|
|
|
|
|
|
Other liabilities |
|
| 162,854 |
|
|
|
|
|
|
|
|
|
|
| 142,355 |
|
|
|
|
|
|
|
|
|
|
| 138,057 |
|
|
|
|
|
|
|
|
|
Shareholders' equity |
|
| 1,560,884 |
|
|
|
|
|
|
|
|
|
|
| 1,517,955 |
|
|
|
|
|
|
|
|
|
|
| 1,460,650 |
|
|
|
|
|
|
|
|
|
Total Liabilities and Shareholders' Equity |
| $ | 13,715,646 |
|
|
|
|
|
|
|
|
|
| $ | 12,938,020 |
|
|
|
|
|
|
|
|
|
| $ | 12,270,195 |
|
|
|
|
|
|
|
|
|
|
|
|
|
|
|
|
|
|
|
|
|
|
|
|
|
|
|
|
|
|
|
|
|
|
|
|
|
|
|
|
|
|
|
|
|
|
Net Interest Margin |
|
|
|
|
|
| 427,336 |
|
|
| 3.48 | % |
|
|
|
|
|
| 405,874 |
|
|
| 3.53 | % |
|
|
|
|
|
| 408,198 |
|
|
| 3.78 | % |
|
|
|
|
|
|
|
|
|
|
|
|
|
|
|
|
|
|
|
|
|
|
|
|
|
|
|
|
|
|
|
|
|
|
|
|
|
Less tax equivalent adjustments: |
|
|
|
|
|
|
|
|
|
|
|
|
|
|
|
|
|
|
|
|
|
|
|
|
|
|
|
|
|
|
|
|
|
|
|
|
Investments |
|
|
|
|
|
| 1,616 |
|
|
|
|
|
|
|
|
|
|
| 1,979 |
|
|
|
|
|
|
|
|
|
|
| 2,328 |
|
|
|
|
|
Loans |
|
|
|
|
|
| 18,170 |
|
|
|
|
|
|
|
|
|
|
| 16,362 |
|
|
|
|
|
|
|
|
|
|
| 14,105 |
|
|
|
|
|
Net Interest Margin per Income Statements |
|
|
|
|
| $ | 407,550 |
|
|
|
|
|
|
|
|
|
| $ | 387,533 |
|
|
|
|
|
|
|
|
|
| $ | 391,765 |
|
|
|
|
|
42
45
The table below shows the change from year to year for each component of the tax equivalent net interest margin in the amount generated by volume changes and the amount generated by changes in the yield or rate (tax equivalent basis) for the periods presented ($ in thousands):
|
| 2017 Compared to 2016 |
|
| 2016 Compared to 2015 |
|
| 2023 Compared to 2022 |
| 2022 Compared to 2021 |
| |||||||||||||||||||||||||||||||||||||
|
| Increase (Decrease) Due To: |
|
| Increase (Decrease) Due To: |
|
| Increase (Decrease) Due To: |
|
| Increase (Decrease) Due To: |
| ||||||||||||||||||||||||||||||||||||
|
|
|
|
|
| Yield/ |
|
|
|
|
|
|
|
|
|
| Yield/ |
|
|
|
|
|
|
|
| Yield/ |
|
|
|
|
| Yield/ |
|
|
| |||||||||||||
|
| Volume |
|
| Rate |
|
| Net |
|
| Volume |
|
| Rate |
|
| Net |
|
| Volume |
|
| Rate |
|
| Net |
|
| Volume |
|
| Rate |
|
| Net |
| ||||||||||||
Interest earned on: |
|
|
|
|
|
|
|
|
|
|
|
|
|
|
|
|
|
|
|
|
|
|
|
|
|
|
|
|
|
|
|
|
|
|
|
|
| |||||||||||
Federal funds sold and securities purchased under reverse repurchase agreements |
| $ | 17 |
|
| $ | 2 |
|
| $ | 19 |
|
| $ | 3 |
|
| $ | 3 |
|
| $ | 6 |
|
| $ | (12 | ) |
| $ | 18 |
|
| $ | 6 |
|
| $ | — |
|
| $ | 74 |
|
| $ | 74 |
|
Securities available for sale: |
|
|
|
|
|
|
|
|
|
|
|
|
|
|
|
|
|
|
|
|
|
|
|
|
|
|
|
|
|
|
|
|
|
|
|
|
| |||||||||||
Taxable |
|
| 1,389 |
|
|
| (1,588 | ) |
|
| (199 | ) |
|
| 125 |
|
|
| (2,741 | ) |
|
| (2,616 | ) |
|
| (12,720 | ) |
|
| 9,280 |
|
|
| (3,440 | ) |
|
| 4,508 |
|
|
| 3,838 |
|
|
| 8,346 |
|
Nontaxable |
|
| (1,017 | ) |
|
| 77 |
|
|
| (940 | ) |
|
| (839 | ) |
|
| 58 |
|
|
| (781 | ) |
|
| (13 | ) |
|
| — |
|
|
| (13 | ) |
|
| (7 | ) |
|
| 3 |
|
|
| (4 | ) |
Securities held to maturity: |
|
|
|
|
|
|
|
|
|
|
|
|
|
|
|
|
|
|
|
|
|
|
|
|
|
|
|
|
|
|
|
|
|
|
|
|
| |||||||||||
Taxable |
|
| (597 | ) |
|
| (626 | ) |
|
| (1,223 | ) |
|
| (500 | ) |
|
| — |
|
|
| (500 | ) |
|
| 11,669 |
|
|
| (1,846 | ) |
|
| 9,823 |
|
|
| 10,962 |
|
|
| 1,711 |
|
|
| 12,673 |
|
Nontaxable |
|
| (83 | ) |
|
| (14 | ) |
|
| (97 | ) |
|
| (160 | ) |
|
| (56 | ) |
|
| (216 | ) |
|
| (164 | ) |
|
| 18 |
|
|
| (146 | ) |
|
| (287 | ) |
|
| 19 |
|
|
| (268 | ) |
PPP loans |
|
| (319 | ) |
|
| (320 | ) |
|
| (639 | ) |
|
| (22,339 | ) |
|
| (13,748 | ) |
|
| (36,087 | ) | ||||||||||||||||||||||||
Loans, net of unearned income (LHFS and LHFI) |
|
| 35,083 |
|
|
| 11,705 |
|
|
| 46,788 |
|
|
| 35,684 |
|
|
| (8,215 | ) |
|
| 27,469 |
|
|
| 74,788 |
|
|
| 228,685 |
|
|
| 303,473 |
|
|
| 32,932 |
|
|
| 76,984 |
|
|
| 109,916 |
|
Acquired loans |
|
| (4,077 | ) |
|
| (1,589 | ) |
|
| (5,666 | ) |
|
| (12,891 | ) |
|
| (8,117 | ) |
|
| (21,008 | ) | ||||||||||||||||||||||||
Other earning assets |
|
| 162 |
|
|
| 316 |
|
|
| 478 |
|
|
| 392 |
|
|
| (983 | ) |
|
| (591 | ) |
|
| (1,898 | ) |
|
| 30,953 |
|
|
| 29,055 |
|
|
| (2,008 | ) |
|
| 7,321 |
|
|
| 5,313 |
|
Total interest-earning assets |
|
| 30,877 |
|
|
| 8,283 |
|
|
| 39,160 |
|
|
| 21,814 |
|
|
| (20,051 | ) |
|
| 1,763 |
|
|
| 71,331 |
|
|
| 266,788 |
|
|
| 338,119 |
|
|
| 23,761 |
|
|
| 76,202 |
|
|
| 99,963 |
|
|
|
|
|
|
|
|
|
|
|
|
|
|
|
|
|
|
|
|
|
|
|
|
|
|
|
|
|
|
|
|
|
|
|
|
|
|
| |||||||||||
Interest paid on: |
|
|
|
|
|
|
|
|
|
|
|
|
|
|
|
|
|
|
|
|
|
|
|
|
|
|
|
|
|
|
|
|
|
|
|
|
| |||||||||||
Interest-bearing demand deposits |
|
| 515 |
|
|
| 3,008 |
|
|
| 3,523 |
|
|
| (76 | ) |
|
| 138 |
|
|
| 62 |
|
|
| 1,093 |
|
|
| 103,636 |
|
|
| 104,729 |
|
|
| 648 |
|
|
| 10,855 |
|
|
| 11,503 |
|
Savings deposits |
|
| 139 |
|
|
| 3,251 |
|
|
| 3,390 |
|
|
| 110 |
|
|
| — |
|
|
| 110 |
|
|
| (1,806 | ) |
|
| 20,757 |
|
|
| 18,951 |
|
|
| (73 | ) |
|
| 1,815 |
|
|
| 1,742 |
|
Time deposits |
|
| 278 |
|
|
| 2,778 |
|
|
| 3,056 |
|
|
| (651 | ) |
|
| 629 |
|
|
| (22 | ) |
|
| 8,831 |
|
|
| 84,371 |
|
|
| 93,202 |
|
|
| (399 | ) |
|
| (722 | ) |
|
| (1,121 | ) |
Federal funds purchased and securities sold under repurchase agreements |
|
| 61 |
|
|
| 2,374 |
|
|
| 2,435 |
|
|
| (13 | ) |
|
| 929 |
|
|
| 916 |
|
|
| 3,676 |
|
|
| 10,616 |
|
|
| 14,292 |
|
|
| 233 |
|
|
| 5,662 |
|
|
| 5,895 |
|
Short-term borrowings |
|
| 8,699 |
|
|
| 587 |
|
|
| 9,286 |
|
|
| (338 | ) |
|
| 1,174 |
|
|
| 836 |
| ||||||||||||||||||||||||
Long-term FHLB advances |
|
| (1,538 | ) |
|
| — |
|
|
| (1,538 | ) |
|
| 2,055 |
|
|
| — |
|
|
| 2,055 |
| ||||||||||||||||||||||||
Other borrowings |
|
| 35,951 |
|
|
| 9,527 |
|
|
| 45,478 |
|
|
| 881 |
|
|
| 3,045 |
|
|
| 3,926 |
| ||||||||||||||||||||||||
Subordinated notes |
|
| (1,388 | ) |
|
| (1,387 | ) |
|
| (2,775 | ) |
|
| (130 | ) |
|
| 10 |
|
|
| (120 | ) |
|
| 10 |
|
|
| (10 | ) |
|
| — |
|
|
| 9 |
|
|
| (10 | ) |
|
| (1 | ) |
Junior subordinated debt securities |
|
| — |
|
|
| 321 |
|
|
| 321 |
|
|
| — |
|
|
| 250 |
|
|
| 250 |
|
|
| — |
|
|
| 2,177 |
|
|
| 2,177 |
|
|
| — |
|
|
| 1,021 |
|
|
| 1,021 |
|
Total interest-bearing liabilities |
|
| 6,766 |
|
|
| 10,932 |
|
|
| 17,698 |
|
|
| 957 |
|
|
| 3,130 |
|
|
| 4,087 |
|
|
| 47,755 |
|
|
| 231,074 |
|
|
| 278,829 |
|
|
| 1,299 |
|
|
| 21,666 |
|
|
| 22,965 |
|
Change in net interest income on a tax equivalent basis |
| $ | 24,111 |
|
| $ | (2,649 | ) |
| $ | 21,462 |
|
| $ | 20,857 |
|
| $ | (23,181 | ) |
| $ | (2,324 | ) |
| $ | 23,576 |
|
| $ | 35,714 |
|
| $ | 59,290 |
|
| $ | 22,462 |
|
| $ | 54,536 |
|
| $ | 76,998 |
|
The change in interest due to both volume and yield or rate has been allocated to change due to volume and change due to yield or rate in proportion to the absolute value of the change in each. Tax-exempt income has been adjusted to a tax equivalent basis using athe federal statutory corporate tax rate of 35.0%in effect for each of the three years presented. The balances of nonaccrual loans and the related income recognized have been included for purposes of these computations.
Provision for LoanCredit Losses LHFI
The provision for loan losses,PCL, LHFI is determined by Management as the amount necessary to adjustmaintain the allowance for loan losses,ACL, LHFI to a level, which, in Management’s best estimate, is necessary to absorb probable losses within the existing loan portfolio. The provision for loan losses, LHFI reflects loan quality trends, including the levels of and trends related to nonaccrual LHFI, past due LHFI, potential problem LHFI, criticized LHFI, net charge-offs or recoveries and growth in the LHFI portfolio among other factors. Accordingly,at the amount of expected credit losses inherent within the provision reflectsLHFI portfolio. The amount of PCL and the necessary increases or decreasesrelated ACL for LHFI are based on Trustmark’s ACL methodology. The PCL, LHFI totaled $27.4 million for 2023, compared to a PCL, LHFI of $21.7 million for 2022 and a negative PCL, LHFI of $21.5 million for 2021. The PCL, LHFI for 2023 primarily reflected an increase in the allowance for loan losses, LHFI related to adjustments for specific loans or loan poolsrequired reserves as a result of loan growth, net changes in the portfolioqualitative reserve factors, changes in the macroeconomic forecasts and evaluation of current impairment analyses, actions taken with respect to risk ratingsextended maturities on loans and other adjustmentsthe secured by 1-4 family residential properties portfolio resulting from lower prepayment speeds, partially offset by a decline in specific reserves for individually analyzed LHFI.
FASB ASC Topic 326 requires Trustmark to estimate expected credit losses for off-balance sheet credit exposures which are not unconditionally cancellable by Trustmark. Trustmark maintains a separate ACL on off-balance sheet credit exposures, including unfunded commitments and letters of credit. Adjustments to the ACL on off-balance sheet credit exposures are recorded to the PCL, off-balance sheet credit exposures. The PCL, off-balance sheet credit exposures totaled a negative $2.8 million for 2023 compared to $1.2 million for 2022, and a negative $2.9 million for 2021. The release in PCL on off-balance sheet credit exposures for 2023 primarily reflected a decrease in required reserves due to a decline in unfunded commitments partially offset by an increase in required reserves as a result of changes in qualitative factors. The provision for loan losses, LHFI totaled $15.1 million for 2017, $11.0 million for 2016 and $8.4 million for 2015. the total reserve rate.
See the section captioned “Allowance for Loan Losses, LHFI”Credit Losses” for information regarding Trustmark’s ACL methodology as well as further analysis of the provision for loan losses, LHFI.
Provision for Loan Losses, Acquired Loans
The provision for loan losses, acquired loans is recognized subsequent to acquisition to the extent it is probable that Trustmark will be unable to collect all cash flows expected at acquisition plus additional cash flows expected to be collected arising from changes in estimates after acquisition, considering both the timing and amount of those expected cash flows. Provisions may be required when actual losses of unpaid principal incurred exceed previous loss expectations to date, or future cash flows previously expected to be collectible are no longer probable of collection. The provision for loan losses, acquired loans is reflected as a valuation allowance
46
netted against the carrying value of the acquired loans. The decrease in the provision for loan losses, acquired loans when 2017 is compared to 2016 was principally due to changes in expectations based on the periodic re-estimations performed during the respective periods and a decline in acquired loan balances. The increase in the provision for loan losses, acquired loans when 2016 is compared to 2015 was principally due to changes in expectations based on the periodic re-estimations performed during the year, primarily related to loans acquired from BancTrust.
The following table presents the provision for loan losses, acquired loans, by acquisition for the periods presented ($ in thousands):
PCL.
|
| Years Ended December 31, |
| |||||||||
|
| 2017 |
|
| 2016 |
|
| 2015 |
| |||
BancTrust |
| $ | (6,089 | ) |
| $ | 4,143 |
|
| $ | 3,899 |
|
Bay Bank |
|
| (1,323 | ) |
|
| (50 | ) |
|
| (24 | ) |
Heritage |
|
| (122 | ) |
|
| (336 | ) |
|
| (450 | ) |
Reliance |
|
| 139 |
|
|
| — |
|
|
| — |
|
Total provision for loan losses, acquired loans |
| $ | (7,395 | ) |
| $ | 3,757 |
|
| $ | 3,425 |
|
43
Noninterest Income
Noninterest income represented 31.2%27.2%, 31.0%29.3% and 30.7%34.7% of total revenue, before securities gains (losses), net in 2017, 20162023, 2022 and 2015,2021, respectively. The following table provides the comparative components of noninterest income for the periods presented ($ in thousands):
|
| Years Ended December 31, |
| |||||||||||||||||||||
|
| 2017 |
|
| 2016 |
|
| 2015 |
| |||||||||||||||
|
| Amount |
|
| % Change |
|
| Amount |
|
| % Change |
|
| Amount |
|
| % Change |
| ||||||
Service charges on deposit accounts |
| $ | 44,003 |
|
|
| -2.8 | % |
| $ | 45,253 |
|
|
| -4.5 | % |
| $ | 47,366 |
|
|
| -2.7 | % |
Bank card and other fees |
|
| 28,286 |
|
|
| 1.4 | % |
|
| 27,906 |
|
|
| -1.4 | % |
|
| 28,298 |
|
|
| -14.2 | % |
Mortgage banking, net |
|
| 29,902 |
|
|
| 6.0 | % |
|
| 28,212 |
|
|
| -6.5 | % |
|
| 30,176 |
|
|
| 21.8 | % |
Insurance commissions |
|
| 38,168 |
|
|
| 3.8 | % |
|
| 36,764 |
|
|
| 0.9 | % |
|
| 36,424 |
|
|
| 8.8 | % |
Wealth management |
|
| 30,340 |
|
|
| -0.5 | % |
|
| 30,492 |
|
|
| -2.8 | % |
|
| 31,369 |
|
|
| -3.0 | % |
Other, net |
|
| 13,949 |
|
| n/m |
|
|
| 5,626 |
|
| n/m |
|
|
| (484 | ) |
| n/m |
| |||
Total Noninterest Income before securities gains (losses), net |
|
| 184,648 |
|
|
| 6.0 | % |
|
| 174,253 |
|
|
| 0.6 | % |
|
| 173,149 |
|
|
| 0.2 | % |
Securities gains (losses), net |
|
| 15 |
|
| n/m |
|
|
| (310 | ) |
| n/m |
|
|
| — |
|
| n/m |
| |||
Total Noninterest Income |
| $ | 184,663 |
|
|
| 6.2 | % |
| $ | 173,943 |
|
|
| 0.5 | % |
| $ | 173,149 |
|
|
| — |
|
|
| Years Ended December 31, |
| |||||||||||||||||||||
|
| 2023 |
|
| 2022 |
|
| 2021 |
| |||||||||||||||
|
| Amount |
|
| % Change |
|
| Amount |
|
| % Change |
|
| Amount |
|
| % Change |
| ||||||
Service charges on deposit accounts |
| $ | 43,416 |
|
|
| 3.0 | % |
| $ | 42,157 |
|
|
| 26.8 | % |
| $ | 33,246 |
|
|
| 3.0 | % |
Bank card and other fees |
|
| 33,439 |
|
|
| -7.4 | % |
|
| 36,105 |
|
|
| 4.2 | % |
|
| 34,662 |
|
|
| 11.7 | % |
Mortgage banking, net |
|
| 26,216 |
|
|
| -7.4 | % |
|
| 28,306 |
|
|
| -55.6 | % |
|
| 63,750 |
|
|
| -49.3 | % |
Insurance commissions |
|
| 57,569 |
|
|
| 7.2 | % |
|
| 53,721 |
|
|
| 10.7 | % |
|
| 48,511 |
|
|
| 7.4 | % |
Wealth management |
|
| 35,092 |
|
|
| 0.2 | % |
|
| 35,013 |
|
|
| -0.5 | % |
|
| 35,190 |
|
|
| 11.3 | % |
Other, net |
|
| 11,187 |
|
|
| 13.7 | % |
|
| 9,842 |
|
|
| 50.2 | % |
|
| 6,551 |
|
|
| -24.3 | % |
Total noninterest income before securities |
|
| 206,919 |
|
|
| 0.9 | % |
|
| 205,144 |
|
|
| -7.6 | % |
|
| 221,910 |
|
|
| -19.2 | % |
Securities gains (losses), net |
|
| 39 |
|
| n/m |
|
|
| — |
|
|
| — |
|
|
| — |
|
|
| — |
| |
Total noninterest income |
| $ | 206,958 |
|
|
| 0.9 | % |
| $ | 205,144 |
|
|
| -7.6 | % |
| $ | 221,910 |
|
|
| -19.2 | % |
n/m - percentage changes greater than +/- 100% are not considered meaningful
Changes in various components of noninterest income for the year ended December 31, 2023 are discussed in further detail below. For analysis of Trustmark’s insurance commissions and wealth management income, please see the section captioned “Results of Segment Operations.”
Service Charges on Deposit Accounts
The declineincrease in service charges on deposit accounts when 20172023 is compared to 20162022 was principally due to decline in service charges of $734 thousand, or 4.8%, primarily related to commercial and consumer demand deposit accounts and a decline in non-sufficient fund (NSF) and overdraft fees of $516 thousand, or 1.7%, primarily related to commercial demand deposit accounts and consumer interest checking accounts.
The declinean increase in service charges on depositpersonal interest checking accounts when 2016 is compared to 2015 was principally due topartially offset by a $1.5 million, or 4.6%, decreasedecline in NSF and overdraft charges on consumer deposit accountsaccounts.
Bank Card and a $436 thousand, or 4.7%,Other Fees
The decrease in service charges on consumer deposit accounts. The declinebank card and other fees when 2023 is compared to 2022 was principally due to declines in NSFcustomer derivatives revenue and overdraft charges on deposit accounts during 2016 was primarily the result of balances in consumer deposit accounts increasing 3.5% during 2016 providing more available funds to complete banking transactions.miscellaneous other bank fees.
47
The following table illustrates the components of mortgage banking, net included in noninterest income for the periods presented ($ in thousands):
|
| Years Ended December 31, |
|
| Years Ended December 31, |
| ||||||||||||||||||||||||||||||||||||||||||
|
| 2017 |
|
| 2016 |
|
| 2015 |
|
| 2023 |
|
| 2022 |
|
| 2021 |
| ||||||||||||||||||||||||||||||
|
| Amount |
|
| % Change |
|
| Amount |
|
| % Change |
|
| Amount |
|
| % Change |
|
| Amount |
|
| % Change |
|
| Amount |
|
| % Change |
|
| Amount |
|
| % Change |
| ||||||||||||
Mortgage servicing income, net |
| $ | 21,663 |
|
|
| 4.5 | % |
| $ | 20,724 |
|
|
| 5.6 | % |
| $ | 19,625 |
|
|
| 5.4 | % |
| $ | 27,196 |
|
|
| 3.4 | % |
| $ | 26,291 |
|
|
| 3.2 | % |
| $ | 25,476 |
|
|
| 7.6 | % |
Change in fair value-MSR from runoff |
|
| (10,780 | ) |
|
| 6.7 | % |
|
| (10,106 | ) |
|
| 6.1 | % |
|
| (9,527 | ) |
|
| 11.2 | % |
|
| (10,030 | ) |
|
| -28.5 | % |
|
| (14,034 | ) |
|
| -30.4 | % |
|
| (20,160 | ) |
|
| 21.5 | % |
Gain on sales of loans, net |
|
| 18,934 |
|
|
| -7.8 | % |
|
| 20,535 |
|
|
| 14.3 | % |
|
| 17,965 |
|
|
| 66.8 | % |
|
| 15,345 |
|
|
| -24.0 | % |
|
| 20,178 |
|
|
| -64.0 | % |
|
| 55,976 |
|
|
| -49.5 | % |
Other, net |
|
| (169 | ) |
| n/m |
|
|
| (84 | ) |
| n/m |
|
|
| 233 |
|
|
| -74.2 | % | ||||||||||||||||||||||||||
Mortgage banking income before hedge ineffectiveness |
|
| 29,648 |
|
|
| -4.6 | % |
|
| 31,069 |
|
|
| 9.8 | % |
|
| 28,296 |
|
|
| 30.2 | % | ||||||||||||||||||||||||
Mortgage banking income before net hedge |
|
| 32,511 |
|
|
| 0.2 | % |
|
| 32,435 |
|
|
| -47.1 | % |
|
| 61,292 |
|
|
| -48.1 | % | ||||||||||||||||||||||||
Change in fair value-MSR from market changes |
|
| (1,050 | ) |
| n/m |
|
|
| (406 | ) |
| n/m |
|
|
| 1,577 |
|
| n/m |
|
|
| (1,489 | ) |
| n/m |
|
|
| 38,181 |
|
| n/m |
|
|
| 13,258 |
|
| n/m |
| ||||||
Change in fair value of derivatives |
|
| 1,304 |
|
| n/m |
|
|
| (2,451 | ) |
| n/m |
|
|
| 303 |
|
|
| -97.0 | % |
|
| (4,806 | ) |
|
| -88.6 | % |
|
| (42,310 | ) |
| n/m |
|
|
| (10,800 | ) |
| n/m |
| ||||
Net hedge ineffectiveness |
|
| 254 |
|
| n/m |
|
|
| (2,857 | ) |
| n/m |
|
|
| 1,880 |
|
|
| -38.4 | % |
|
| (6,295 | ) |
|
| 52.5 | % |
|
| (4,129 | ) |
| n/m |
|
|
| 2,458 |
|
|
| -68.6 | % | |||
Mortgage banking, net |
| $ | 29,902 |
|
|
| 6.0 | % |
| $ | 28,212 |
|
|
| -6.5 | % |
| $ | 30,176 |
|
|
| 21.8 | % |
| $ | 26,216 |
|
|
| -7.4 | % |
| $ | 28,306 |
|
|
| -55.6 | % |
| $ | 63,750 |
|
|
| -49.3 | % |
n/m - percentage changes greater than +/- 100% are not considered meaningful
The increase in mortgage banking, net for 2017 when compared to 2016 was principally due to a net positive hedge ineffectiveness for 2017 compared to a net negative hedge ineffectiveness for 2016 and an increase in mortgage servicing income, net, partially offset by a decline in gains on sales of loans, net. The decrease in mortgage banking, net for 2016 when 2023 is compared to 20152022 was principally due to a net negative hedge ineffectiveness for 2016 compared to a net positive hedge ineffectiveness for 2015, partially offset by increasesdecline in the gain on sales of loans, net and mortgage servicing income, net.an increase in the net negative hedge ineffectiveness, partially offset by a decline in the run-off of the MSR. Mortgage loan production decreased $250.8totaled $1.454 billion for 2023, a decrease of $670.7 million, or 15.6%31.6%, during 2017when compared to total $1.355 billion, reflecting the current rising interest rate environment.2022. Mortgage loan production increased $124.2totaled $2.125 billion for 2022, a decrease of $678.1 million, or 8.4%24.2%, during 2016when compared to total $1.606 billion, which continued to reflect increased mortgage lending activity due to low mortgage rates.2021. Loans serviced for others totaled $6.624$8.477 billion at December 31, 2017,2023, compared with $6.371$8.116 billion at December 31, 2016,2022, and $5.971$7.953 billion at December 31, 2015.2021.
44
Representing a significant component of mortgage banking income is gain on sales of loans, net. The decrease in the gain on sales of loans, net when 20172023 is compared to 2016 resulted2022 was primarily from a declinethe result of decreases in the volume of loans sold as well as lower profit margins in secondary marketing activities partially offset by higher profit margins from secondary marketing activities. Thean increase in the gain on sales of loans, net when 2016 is compared to 2015 resulted from both higher profit margins from secondary marketing activities as well as higher volumes of loans sold.mortgage valuation adjustment. Loan sales decreased $205.4$107.0 million, or 14.8%8.6%, during 20172023 to total $1.179$1.136 billion compared to an increasea decrease of $138.0 million,$1.043 billion, or 11.1%45.6%, during 20162022 to total $1.384$1.243 billion. The decrease in loan sales during 20172023 and 2022 was principally due to thea decline in mortgage lending activity due to increasingas result of rising interest rates. The increase in loans sales during 2016 was due to increased mortgage lending activity and Trustmark’s decision during 2015 to sell the vast majority of these lower-rate, longer-term home mortgages in the secondary market, rather than replacing the run-off in its single-family loan portfolio.
Other Income, Net
The following table illustrates the components of other income, net included in noninterest income for the periods presented ($ in thousands):
|
| Years Ended December 31, |
|
| Years Ended December 31, |
| ||||||||||||||||||||||||||||||||||||||||||
|
| 2017 |
|
| 2016 |
|
| 2015 |
|
| 2023 |
|
| 2022 |
|
| 2021 |
| ||||||||||||||||||||||||||||||
|
| Amount |
|
| % Change |
|
| Amount |
|
| % Change |
|
| Amount |
|
| % Change |
|
| Amount |
|
| % Change |
|
| Amount |
|
| % Change |
|
| Amount |
|
| % Change |
| ||||||||||||
Partnership amortization for tax credit purposes |
| $ | (9,560 | ) |
|
| -3.6 | % |
| $ | (9,916 | ) |
|
| -1.3 | % |
| $ | (10,050 | ) |
|
| -15.0 | % |
| $ | (7,988 | ) |
|
| 28.6 | % |
| $ | (6,211 | ) |
|
| -22.5 | % |
| $ | (8,011 | ) |
|
| 40.5 | % |
Increase in life insurance cash surrender value |
|
| 7,125 |
|
|
| 3.4 | % |
|
| 6,891 |
|
|
| 2.8 | % |
|
| 6,702 |
|
|
| -8.7 | % |
|
| 7,018 |
|
|
| 5.2 | % |
|
| 6,673 |
|
|
| 0.6 | % |
|
| 6,630 |
|
|
| -3.6 | % |
Other miscellaneous income |
|
| 16,384 |
|
|
| 89.4 | % |
|
| 8,651 |
|
| n/m |
|
|
| 2,864 |
|
|
| -43.8 | % |
|
| 12,157 |
|
|
| 29.6 | % |
|
| 9,380 |
|
|
| 18.3 | % |
|
| 7,932 |
|
|
| 6.1 | % | |
Total other, net |
| $ | 13,949 |
|
| n/m |
|
| $ | 5,626 |
|
| n/m |
|
| $ | (484 | ) |
| n/m |
|
| $ | 11,187 |
|
|
| 13.7 | % |
| $ | 9,842 |
|
|
| 50.2 | % |
| $ | 6,551 |
|
|
| -24.3 | % | |||
n/m - percentage changes greater than +/- 100% are not considered meaningful
The increase in other income, net when 20172023 is compared to 20162022 was primarily due to an increase in other miscellaneous income partially offset by an increase in the amortization of tax credit partnerships as a result of $4.4 million of non-taxable bank-owned life insurance proceeds and the $4.9 million of non-routine, non-taxable proceeds related to life insurance acquired as part of a previous acquisition received during 2017. Excluding the non-taxable life insurance proceeds, other miscellaneous income for 2017 decreased $734 thousand, or 23.0%, when compared to 2016.investment in new tax credit partnerships. The increase in other income, net when 2016 is compared to 2015, was primarily due to a decrease in the net reduction of the FDIC indemnification asset related to the acquired covered loans and covered other real estate, a net gain on the sale of premises and equipment as a result of the
48
sale of a former bank branch during 2016 compared to a net loss on the sale of premises and equipment recorded during 2015 on the sale of a former bank branch acquired in the BancTrust merger and an increase in other miscellaneous income relatedwhen 2023 is compared with 2022 was principally due to various vendor contract bonusesincreases in cash management service charges partially offset by declines in gains on the sales of premises and settlements, an one-time arrangement feeequipment and merchant service fees received during 2016.gain on non-qualified benefit plans.
Noninterest Expense
The following table illustrates the comparative components of noninterest expense for the periods presented ($ in thousands):
|
| Years Ended December 31, |
| |||||||||||||||||||||
|
| 2017 |
|
| 2016 |
|
| 2015 |
| |||||||||||||||
|
| Amount |
|
| % Change |
|
| Amount |
|
| % Change |
|
| Amount |
|
| % Change |
| ||||||
Salaries and employee benefits |
| $ | 234,987 |
|
|
| -1.9 | % |
| $ | 239,637 |
|
|
| 4.1 | % |
| $ | 230,198 |
|
|
| 1.5 | % |
Defined benefit plan termination |
|
| 17,644 |
|
| n/m |
|
|
| — |
|
|
| — |
|
|
| — |
|
|
| — |
| |
Services and fees |
|
| 60,893 |
|
|
| 3.7 | % |
|
| 58,695 |
|
|
| 2.0 | % |
|
| 57,534 |
|
|
| 1.7 | % |
Net occupancy-premises |
|
| 25,767 |
|
|
| 3.1 | % |
|
| 24,982 |
|
|
| -1.3 | % |
|
| 25,318 |
|
|
| -4.3 | % |
Equipment expense |
|
| 24,453 |
|
|
| 0.9 | % |
|
| 24,225 |
|
|
| 1.5 | % |
|
| 23,859 |
|
|
| — |
|
Other real estate expense: |
|
|
|
|
|
|
|
|
|
|
|
|
|
|
|
|
|
|
|
|
|
|
|
|
Write-downs |
|
| 3,296 |
|
|
| -26.1 | % |
|
| 4,463 |
|
|
| 7.0 | % |
|
| 4,171 |
|
|
| -50.7 | % |
Net (gain)/loss on sale |
|
| (2,091 | ) |
|
| -70.3 | % |
|
| (7,030 | ) |
|
| 74.0 | % |
|
| (4,040 | ) |
|
| 8.6 | % |
Carrying costs |
|
| 2,467 |
|
|
| -21.8 | % |
|
| 3,153 |
|
|
| -33.9 | % |
|
| 4,772 |
|
|
| -27.5 | % |
Total other real estate expense |
|
| 3,672 |
|
| n/m |
|
|
| 586 |
|
|
| -88.0 | % |
|
| 4,903 |
|
|
| -56.7 | % | |
FDIC assessment expense |
|
| 11,010 |
|
|
| -2.1 | % |
|
| 11,243 |
|
|
| 4.8 | % |
|
| 10,728 |
|
|
| 5.2 | % |
Other expense |
|
| 51,743 |
|
|
| 8.0 | % |
|
| 47,930 |
|
|
| -2.4 | % |
|
| 49,122 |
|
|
| -8.8 | % |
Total noninterest expense |
| $ | 430,169 |
|
|
| 5.6 | % |
| $ | 407,298 |
|
|
| 1.4 | % |
| $ | 401,662 |
|
|
| -1.8 | % |
|
| Years Ended December 31, |
| |||||||||||||||||||||
|
| 2023 |
|
| 2022 |
|
| 2021 |
| |||||||||||||||
|
| Amount |
|
| % Change |
|
| Amount |
|
| % Change |
|
| Amount |
|
| % Change |
| ||||||
Salaries and employee benefits |
| $ | 304,665 |
|
|
| 6.0 | % |
| $ | 287,440 |
|
|
| 1.2 | % |
| $ | 284,158 |
|
|
| 4.4 | % |
Services and fees (2) |
|
| 109,478 |
|
|
| 3.8 | % |
|
| 105,469 |
|
|
| 14.3 | % |
|
| 92,282 |
|
|
| 10.1 | % |
Net occupancy-premises |
|
| 29,482 |
|
|
| 0.7 | % |
|
| 29,264 |
|
|
| 8.2 | % |
|
| 27,043 |
|
|
| 2.1 | % |
Equipment expense |
|
| 26,142 |
|
|
| 6.9 | % |
|
| 24,448 |
|
|
| 0.5 | % |
|
| 24,337 |
|
|
| 4.6 | % |
Litigation settlement expense |
|
| 6,500 |
|
|
| -93.5 | % |
|
| 100,750 |
|
| n/m |
|
|
| — |
|
|
| — |
| |
Other expense (1)(2) |
|
| 61,652 |
|
|
| 10.4 | % |
|
| 55,842 |
|
|
| -9.2 | % |
|
| 61,476 |
|
|
| 1.7 | % |
Total noninterest expense |
| $ | 537,919 |
|
|
| -10.8 | % |
| $ | 603,213 |
|
|
| 23.3 | % |
| $ | 489,296 |
|
|
| 4.9 | % |
n/m - percentage changes greater than +/- 100% are not considered meaningful
Changes in the various componentcomponents of noninterest expense for the year ended December 31, 2023 are discussed in further detail below. Management considers disciplined expense management a key area of focus in the support of improving shareholder value.
Salaries and Employee Benefits
During the second quarter of 2016, Trustmark completed a voluntary ERP as a proactive measure to manage noninterest expense. As a result of the ERP, 188 of the eligible associates retired from Trustmark by June 30, 2016. The ERP resulted in non-routine expenses totaling $9.8 million ($9.6 million included in salaries and employee benefits expense and $213 thousand included in other expense) during 2016. As a result of the ERP, Trustmark realized cost savings in salaries and employee benefits expense of $4.4 million during 2016.
As previously announced, on July 26, 2016, the Board of Directors of Trustmark authorized the termination of the Plan, a noncontributory tax-qualified defined benefit pension plan, effective December 31, 2016. As a result of Trustmark’s de-risking investment strategy for the Plan as of June 30, 2016, the expected rate of return on plan assets during the second half of 2016 decreased from 6.0% to 2.5%, which resulted in increased periodic benefit costs for the Plan. Included in salaries and employee benefits expense for the year ended December 31, 2016, were non-routine pension expenses related to the de-risking investment strategy for the plan assets totaling $1.3 million.
The decrease in salaries and employee benefits, the largest component of noninterest expense, when 2017 is compared to 2016 was primarily due to the non-routine transaction expenses recorded in 2016. Excluding the non-routine transactions, salaries and employee benefits increased $6.3 million, or 2.7%, when 2017 is compared to 2016 primarily due to increase in salaries and incentive compensation as a result of general merit increase and the addition of the employees from Reliance. The increase in salaries and employee benefits the largest category of noninterest expense when 20162023 is compared to 2015,2022 was principally due to increases in salaries expense, primarily due to non-routine transaction expenses relatedgeneral merit increases, accrued management performance incentives and commission expense due to the ERP and Plan termination and higher commissions expense as a result of improvements in mortgage loaninsurance production, partially offset by cost savings realized relateda decline in commission expense due to the ERP.decline in mortgage originations.
Services and Fees
The increase in services and fees expense when 20172023 is compared to 20162022 was primarily toprincipally due to increases in data processing expensescharges related to software and business process outsourcing fees, partially offset by declinesa decrease in other outside services and fees.
45
Equipment Expense
The increase in services and feesequipment expense when 20162023 is compared to 2015,2022 was primarily toprincipally due to increases in data processing equipment expenses, related to software, other outside servicesdepreciation on furniture and feesequipment and advertising, partially offset by declines in legal and communications expenses.personal property taxes.
49
The increase in other real estate expense for 2017 compared to 2016 was principally due to a decline in the net gain on sales of other real estate partially offset by a decline in write-downs on other real estate. The decrease in other real estate expense for 2016 compared to 2015 was principally due to an increase in the net gain on sales of other real estate and a decrease in other real estate carrying costs. The net gain on sale of other real estate for 2017 totaled $2.1 million, compared to a net gain on the sale of other real estate of $7.0 million for 2016 and $4.0 million for 2015. For additional analysis of other real estate and foreclosure expenses, please see the section captioned “Nonperforming Assets, Excluding Acquired Loans and Covered Other Real Estate.”
Other Expense
The following table illustrates the comparative components of other noninterest expense for the periods presented ($ in thousands):
|
| Years Ended December 31, |
| |||||||||||||||||||||
|
| 2023 |
|
| 2022 |
|
| 2021 |
| |||||||||||||||
|
| Amount |
|
| % Change |
|
| Amount |
|
| % Change |
|
| Amount |
|
| % Change |
| ||||||
Loan expense (2) |
| $ | 11,114 |
|
|
| -9.3 | % |
| $ | 12,249 |
|
|
| -0.6 | % |
| $ | 12,329 |
|
|
| -18.8 | % |
Amortization of intangibles |
|
| 675 |
|
|
| -52.9 | % |
|
| 1,434 |
|
|
| -38.1 | % |
|
| 2,316 |
|
|
| -24.1 | % |
FDIC assessment expense |
|
| 13,529 |
|
|
| 83.2 | % |
|
| 7,385 |
|
|
| 33.9 | % |
|
| 5,515 |
|
|
| -9.4 | % |
Regulatory settlement charge |
|
| — |
|
|
| — |
|
|
| — |
|
|
| -100.0 | % |
|
| 5,000 |
|
| n/m |
| |
Other real estate expense, net (1) |
|
| 119 |
|
|
| -89.9 | % |
|
| 1,173 |
|
|
| -66.8 | % |
|
| 3,528 |
|
|
| 80.4 | % |
Other miscellaneous expense |
|
| 36,215 |
|
|
| 7.8 | % |
|
| 33,601 |
|
|
| 2.5 | % |
|
| 32,788 |
|
|
| -4.1 | % |
Total other expense |
| $ | 61,652 |
|
|
| 10.4 | % |
| $ | 55,842 |
|
|
| -9.2 | % |
| $ | 61,476 |
|
|
| 1.7 | % |
n/m - percentage changes greater than +/- 100% are not considered meaningful
|
| Years Ended December 31, |
| |||||||||||||||||||||
|
| 2017 |
|
| 2016 |
|
| 2015 |
| |||||||||||||||
|
| Amount |
|
| % Change |
|
| Amount |
|
| % Change |
|
| Amount |
|
| % Change |
| ||||||
Loan expense |
| $ | 10,908 |
|
|
| -10.8 | % |
| $ | 12,226 |
|
|
| -4.7 | % |
| $ | 12,835 |
|
|
| -0.9 | % |
Amortization of intangibles |
|
| 6,169 |
|
|
| -10.2 | % |
|
| 6,866 |
|
|
| -12.2 | % |
|
| 7,819 |
|
|
| -10.7 | % |
Other miscellaneous expense |
|
| 34,666 |
|
|
| 20.2 | % |
|
| 28,838 |
|
|
| 1.3 | % |
|
| 28,468 |
|
|
| -11.5 | % |
Total other expense |
| $ | 51,743 |
|
|
| 8.0 | % |
| $ | 47,930 |
|
|
| -2.4 | % |
| $ | 49,122 |
|
|
| -8.8 | % |
The increasedincrease in other expense for 2017 when 2023 is compared to 20162022 was principally due to non-routine transaction expenses related to the Reliance merger completed on April 7, 2017 as well as increasesan increase in various other miscellaneous expenses. Excluding these non-routine transaction expenses, otherFDIC assessment expense, for 2017 increased $788 thousand, or 1.7%, compared to 2016.
The decline in other expense when 2016 is compared to 2015 was primarily due to decreasesan increase in franchise taxes, the amortization of the non-taxable core deposit intangible asset and loan expenses,assessment rate, partially offset by increasesa decline in customer related fraud lossesloan expense.
For additional analysis of other real estate and a property valuation adjustment recorded during 2016 related to properties transferred to assets held for sale. During 2016, Trustmark continued its measured approach toforeclosure expenses, please see the optimization of its retail delivery channels by consolidated nine branch offices across the Alabama, Florida and Mississippi market regions, and reallocated a portion of those resources into a new banking center in Tuscaloosa, Alabama, and a new loan production office in Pensacola, Florida. Seven of the closed branches as well as two pieces of property previously purchased in anticipation of a future branch were transferred to assets held for sale during 2016 at the lower of the current book value or the fair value less costs to sell. A property valuation adjustment of $750 thousand was recorded as a result of transferring these properties to assets held for sale.section captioned “Nonperforming Assets.”
Results of Segment Operations
Trustmark’s operations are managed along three operating segments: General Banking, Division, Wealth Management Division and Insurance Division.Insurance. A description of each segment and the methodologies used to measure financial performance and financial information by reportable segment are included in Note 20 – Segment Information located in Part II. Item 8. – Financial Statements and Supplementary Data of this report.
The following table provides the net income by reportable segment for the periods presented ($ in thousands):
|
| Years Ended December 31, |
| |||||||||
|
| 2017 |
|
| 2016 |
|
| 2015 |
| |||
General Banking |
| $ | 97,706 |
|
| $ | 99,083 |
|
| $ | 106,738 |
|
Wealth Management |
|
| 2,244 |
|
|
| 4,124 |
|
|
| 3,850 |
|
Insurance |
|
| 5,680 |
|
|
| 5,204 |
|
|
| 5,450 |
|
Consolidated Net Income |
| $ | 105,630 |
|
| $ | 108,411 |
|
| $ | 116,038 |
|
|
| Years Ended December 31, |
| |||||||||
|
| 2023 |
|
| 2022 |
|
| 2021 |
| |||
General banking |
| $ | 145,204 |
|
| $ | 55,121 |
|
| $ | 131,247 |
|
Wealth management |
|
| 7,958 |
|
|
| 5,671 |
|
|
| 6,650 |
|
Insurance |
|
| 12,327 |
|
|
| 11,095 |
|
|
| 9,468 |
|
Consolidated net income |
| $ | 165,489 |
|
| $ | 71,887 |
|
| $ | 147,365 |
|
General Banking
Net interest income for the General Banking DivisionSegment for 20172023 increased $19.8$57.6 million, or 5.1%11.8%, when compared with 2016. The increase in net interest income was2022, principally due to an increaseincreases in interest and fees on LHFS and LHFI, which were partially offset by declines inother interest and fees on acquired loansincome and interest on securities, andpartially offset by an increase in total interest expense. Net interest income for the General Banking DivisionSegment for 2016 decreased $4.52022 increased $76.2 million, or 1.1%18.4%, when compared with 2015. The decrease in net interest income was2021, principally due to declines in interest and fees on acquired loans and interest on taxable securities and an increase in other interest expense, which were partially offset by an increaseincreases in interest and fees on LHFS and LHFI.LHFI and interest on securities, partially offset by a decline in interest and fees on PPP loans and an increase in total interest expense. The provisionPCL (LHFI and off-balance sheet credit exposures) for loan losses, net during 2017the General Banking Segment for 2023 totaled $7.7$26.7 million compared with $14.7to a PCL of $22.9 million during 20162022 and $11.8a negative PCL of $24.4 million during 2015.2021. For more information on these net interest income items, please see the sections captioned “Financial Highlights” and “Results of Operations.”
5046
Noninterest income for the General Banking Division increased $9.1Segment decreased $2.9 million, or 8.5%2.5%, during 20172023 compared to an increasea decrease of $1.6$21.5 million, or 1.5%15.6%, during 2016. During 2017, Trustmark received $4.9 million2022. The decrease in non-taxable proceeds related to life insurance acquired in a previous acquisition and $4.4 million of non-taxable proceeds related to bank-owned life insurance. Excluding these non-taxable proceeds, noninterest income for the General Banking DivisionSegment during 2023 was relatively unchanged when 2017 is comparedprimarily due to 2016.the decreases in bank card and other fees and mortgage banking, net, partially offset by increases in service charges on deposit accounts and other income, net. The decrease in noninterest income for the General Banking Segment during 2022 was primarily due to the decrease in mortgage banking, net, partially offset by increases in service charges on deposit accounts and other income, net. Noninterest income for the General Banking DivisionSegment represented 22.2%17.2% of total revenue for 2017, 21.7%2023, 19.2% for 20162022 and 21.2%25.0% for 2015.2021. Noninterest income for the General Banking DivisionSegment includes service charges on deposit accounts; wealth management; bank card and other fees; mortgage banking, net; other income, net and securities gains (losses), net. For more information on these noninterest income items, please see the analysis included in the section captioned “Noninterest Income.”
Noninterest expense for the General Banking Division increased $18.7Segment decreased $67.9 million, or 5.3%12.8%, during 20172023 compared to an increase of $6.3$109.8 million, or 1.8%26.1%, during 2016.2022. The decrease in noninterest expense for the General Banking Segment for 2023 was principally due to decreases in litigation settlement expense, outside services and fees and loan expenses, partially offset by increases in salaries and employee benefits, data processing expenses related to software and FDIC assessment expense. During 2023, Trustmark recognized litigation settlement expense of $6.5 million as a result of the settlement relating to the litigation involving the Adams/Madison timber compared to litigation settlement expense of $100.0 million and legal fees of $750 thousand recognized in 2022 as a result of the settlement relating to the litigation involving the Stanford Financial Group. The increase in noninterest expense for 2017 was principally due to non-routine transaction expenses related to the termination of the defined benefit pension plan and the Reliance merger. The increase in noninterest expenseGeneral Banking Segment for 20162022 was principally due to increases in litigation settlement expense, services and fees, net occupancy-premises and salaries and employee benefits, expense, primarily as a result of non-routine expenses related to the ERP, increased commission expense due to improved mortgage loan production and non-routine pension expense resulting from the de-risking strategy for plan assets in anticipation of the termination of the Plan, and services and fees, partially offset by declines in other real estate expense and other expense.non-routine transaction expenses incurred during 2021. For more information on these noninterest expense items, please see the analysis included in the section captioned “Noninterest Expense.”
Wealth Management
During 2017,2023, net income for the Wealth Management Division decreased $1.9Segment increased $2.3 million, or 45.6%40.3%, compared to a decrease of $979 thousand, or 14.7%, during 2022. The increase in net income for the Wealth Management Segment during 2023 was principally due to an increase of $274 thousand, or 7.1%,in the negative PCL. The decrease in net income for the Wealth Management Segment during 2016. 2022 was principally due to an increase in noninterest expense.
Net interest income for the Wealth Management Division, which primarily consists of interest income earned on deposit accounts held by the Wealth Management Division,Segment increased $184$558 thousand, or 25.3%10.5%, during 20172023 compared to an increase of $389$160 thousand, or 3.1%, during 2022. The increase in net interest income for the Wealth Management Segment during 2023 and 2022 was principally due to an increase in interest and fees on loans partially offset by an increase in interest on deposits generated by the Private Banking Group. The PCL for the Wealth Management Segment for 2023 totaled a negative $2.1 million compared to a negative PCL of $21 thousand during 2016. 2022 and a negative PCL of $9 thousand during 2021.
Noninterest income for the Wealth Management Segment, which includes income related to investment management, trust and brokerage services, increased $168decreased $136 thousand, or 0.6%0.4%, during 2017,2023, principally due to declines in income from brokerage services and other miscellaneous income partially offset by increases in income from trust management and annuity services and indirect income allocated to the Wealth Management Segment. Noninterest income for the Wealth Management Segment decreased $348 thousand, or 1.0%, during 2022, principally due to declines in income from brokerage services and trust management services, partially offset by an increase in income from annuity services. Noninterest expense decreased $534 thousand, or 1.6%, during 2023 compared to a decreasean increase of $1.1$1.2 million, or 3.6%, during 2016.2022. The slight increasedecrease in noninterest incomeexpense for the Wealth Management Division during 2017Segment for 2023 was primarily attributableprincipally due to a decrease in data processing charges related to software, partially offset by an increase in commissions generated by the brokerage services unit, which was largely offset by declines in trust management fees as well as a decline in annuity income generated by the brokerage services unit. The decrease in noninterest income for the Wealth Management Division during 2016 was primarily attributable to declines in commissions and annuity income generated by the brokerage services unit and trust fees related to retirement planning and personal estate services, partially offset by growth in trust asset management fee income from mutual funds and custody services. Noninterest expense increased $3.4 million, or 14.1%, during 2017 compared to a decrease of $1.2 million, or 4.7%, during 2016.business process outsourcing expenses. The increase in noninterest expense for the Wealth Management Division during 2017Segment for 2022 was principally due to increasesan increase in outside services and fees, other miscellaneous expenses and allocated general overhead expense. The decrease in noninterest expense for the Wealth Management Division during 2016 was principally due to decreases in salariessalary and employee benefits,benefit expense, primarily due to lowerincreases in commissions expense and salary expenseannual performance incentives, and data processing charges related to software, partially offset by an increasea decline in trust incentives expense, and data processing charges.other miscellaneous expenses.
At December 31, 20172023 and 2016,2022, Trustmark held assets under management and administration of $10.640$8.250 billion and $10.255$16.913 billion and brokerage assets of $1.780$2.592 billion and $1.643$2.327 billion, respectively.
Insurance
Net income for the Insurance DivisionSegment during 20172023 increased $476 thousand,$1.2 million, or 9.1%11.1%, compared to a decreasean increase of $246 thousand,$1.6 million, or 4.5%17.2%, during 2016.2022. Noninterest income for the Insurance Division,Segment, which predominately consists of insurance commissions, increased $1.4$4.8 million, or 3.9%8.9%, during 2017,2023, compared to an increase of $340 thousand,$5.1 million, or 0.9%10.5%, during 2016.2022. The increase in noninterest income for the Insurance DivisionSegment during 20172023 was primarilyprincipally due to new business volumeincreases in commercial property and casualty commissions, other commission income and other miscellaneous income. The increase in noninterest income for the Insurance Segment during 2022 was principally due to increases in property and casualty coverage as well as increases incommissions, other commission income. The slight increase in insurance commissions during 2016 was primarily due to new business commission volume primarily inincome and group health coverage and an increase in contingent commissions from insurance companies, which was mostly offset by declines in business commission volume in property and casualty coverage and policy fees and other income. General business activity in Trustmark’s geographic markets continues to improve marginally, resulting in increases in the demand for coverage on inventories, property, equipment, general liability and workers’ compensation.commissions.
47
Noninterest expense for the Insurance DivisionSegment increased $809 thousand,$3.1 million, or 2.8%8.1%, during 20172023 and $532 thousand,$2.9 million, or 1.9%8.1%, during 2016.2022. The increase in noninterest expense for the Insurance Division during 2017Segment for 2023 was primarilyprincipally due to higher salaries and commissions expense resulting from modest general merit increases and improved performance as well as an increasehigher commission expense due to improvements in travel and entertainment expenses.business volumes. The slight increase in noninterest expense for the Insurance Division during 2016Segment for 2022 was principally due to higher salaries expense resulting from modest general merit increases and higher commission expense due to improvements in salariesbusiness volumes, partially offset by a decrease in outside services and insurance expenses.fees.
During 2017, business conditions improved slightly in the markets served by FBBI. Trustmark performed an annual impairment test of the book value of goodwill held in the Insurance DivisionSegment as of October 1, 2017, 2016,2023, 2022, and 2015.2021. Based on this analysis,
51
Trustmark concluded that no impairment charge was required. A renewedAn extended period of falling prices and suppressed demand for the products of the Insurance Division maySegment could result in impairment of goodwill in the future. FBBI’s ability to maintain the current income trend is dependent on the success of the subsidiary’s continued initiatives to attract new business through cross referrals between practice units and bank relationships and seeking new business in other markets.
Income Taxes
For the year ended December 31, 2017,2023, Trustmark’s combined effective tax rate was 31.6%16.1% compared to 22.3%2.5% in 20162022 and 23.4%16.0% in 2015. During2021. The decline in the fourth quarter of 2017, Trustmark incurred non-routine income tax expenses of $17.0 million related to the re-measurement of Trustmark’s net deferred tax assets due to the enactment of the Tax Reform Act and the elimination of a deferred tax valuation allowance related to a prior merger. Excluding the effect of these non-routine income tax expenses, Trustmark’s combined effective tax rate for 20172022 was 20.6%.principally due to the net loss recorded for 2022 as a result of the $100.8 million of litigation settlement expense. Trustmark’s effective tax rate continues to be less than the statutory rate primarily due to various tax-exempt income items and its utilization of income tax credit programs. Trustmark invests in partnerships that provide income tax credits on a Federal and/or State basis (i.e.i.e., NMTC,new market tax credits, low income housing tax credits andor historical tax credits). The income tax credits related to these partnerships are utilized as specifically allowed by income tax law and are recorded as a reduction in income tax expense. The Tax Reform Act did not impact the availability or accounting for these income tax credits in general; however, as a result of the lower combined effective tax rate, Trustmark is limited in its ability to invest in any new tax credits. Trustmark estimates its combined effective tax rate will decrease to approximately 12.0% to 14.0% beginning in 2018, primarily as a result of the Tax Reform Act.
Financial Condition
Earning assets serve as the primary revenue streams for Trustmark and are comprised of securities, loans, federal funds sold, securities purchased under reverse repurchase agreements and other earning assets. Average earning assets totaled $12.274$17.082 billion, or 89.5%91.5% of total average assets, at December 31, 2017,2023, compared with $11.485$16.014 billion, or 88.8%91.6% of total average assets, at December 31, 2016,2022, an increase of $789.1 million,$1.068 billion, or 6.9%6.7%.
Securities
The securities portfolio is utilized by Management to manage interest rate risk, generate interest income, provide liquidity and use as collateral for public and wholesale funding. Risk and return can be adjusted by altering duration, composition and/or balance of the portfolio. The weighted-average life of the portfolio decreased to 3.8 years at December 31, 2017, compared to 4.12023 and 2022 was 4.5 and 4.9 years, at December 31, 2016.respectively.
When compared with December 31, 2016,2022, total investment securities decreased by $220.2$329.4 million, or 6.3%9.4%, during 2017.2023. This decrease resulted primarily from calls, maturities and pay-downs of the underlying loans of GSE guaranteed securities partially offset by purchasesan increase in the fair market value of GSE securities.securities available for sale. Trustmark sold $27.7$4.8 million of available for sale securities during 2017, which generated2023, generating a net gain of $15$39 thousand, compared to $25.0 million ofno securities sold during 2016, which generated a net loss of $310 thousand.2022.
During 2013,2022, Trustmark reclassified approximately $1.099 billion$766.0 million of securities available for sale asto securities held to maturity to mitigate the potential adverse impact of a rising interest rate environment on the fair value of the available for sale securities and the related impact on tangible common equity. The securities were transferred at fair value, which became the cost basis for the securities held to maturity. At the date of transfer,these transfers, the net unrealized holding loss on the available for sale securities totaled approximately $46.6$91.9 million ($28.868.9 million net of tax). The resulting net unrealized holding loss islosses are being amortized over the remaining life of the securities as a yield adjustment in a manner consistent with the amortization or accretion of the original purchase premium or discount on the associated security. There were no gains or losses recognized as a result of the transfer.
At December 31, 2017,2023, the net unamortized, unrealized loss on theall transferred securities included in accumulated other comprehensive loss (AOCL)income (loss) (AOCI) in the accompanying consolidated balance sheets totaled $19.5$57.6 million ($12.0 million net of tax) compared to $24.2$69.2 million ($14.9 million net of tax) at December 31, 2016.2022.
Available for sale securities are carried at their estimated fair value with unrealized gains or losses recognized, net of taxes, in AOCL,AOCI, a separate component of shareholders’ equity. At December 31, 2017,2023, available for sale securities totaled $2.239$1.763 billion, which represented 67.9%55.3% of the securities portfolio, compared to $2.357$2.024 billion, or 67.0%57.5%, at December 31, 2016.2022. At December 31, 2017,2023, unrealized losses, net on available for sale securities totaled $23.5$196.1 million compared to unrealized losses, net of $9.5$246.6 million at December 31, 2016.2022. At December 31, 2017,2023, available for sale securities consisted of obligations of states and political subdivisions,U.S. Treasury securities, GSE guaranteed mortgage-related securities and direct obligations of government agencies and GSEs.
48
Held to maturity securities are carried at amortized cost and represent those securities that Trustmark both intends and has the ability to hold to maturity. At December 31, 2017,2023, held to maturity securities totaled $1.056$1.426 billion and represented 32.1%44.7% of the total securities portfolio, compared with $1.159$1.495 billion, or 33.0%42.5%, at December 31, 2016.2022.
52
The table below indicates the amortized cost of securities available for sale and held to maturity by type at December 31, 2017, 2016 and 2015 ($ in thousands):
|
| December 31, |
| |||||||||
|
| 2017 |
|
| 2016 |
|
| 2015 |
| |||
Securities available for sale |
|
|
|
|
|
|
|
|
|
|
|
|
U.S. Government agency obligations |
|
|
|
|
|
|
|
|
|
|
|
|
Issued by U.S. Government agencies |
| $ | 45,508 |
|
| $ | 56,272 |
|
| $ | 68,314 |
|
Issued by U.S. Government sponsored agencies |
|
| 255 |
|
|
| 257 |
|
|
| 258 |
|
Obligations of states and political subdivisions |
|
| 78,433 |
|
|
| 113,541 |
|
|
| 134,719 |
|
Mortgage-backed securities |
|
|
|
|
|
|
|
|
|
|
|
|
Residential mortgage pass-through securities |
|
|
|
|
|
|
|
|
|
|
|
|
Guaranteed by GNMA |
|
| 66,634 |
|
|
| 43,222 |
|
|
| 25,602 |
|
Issued by FNMA and FHLMC |
|
| 824,872 |
|
|
| 638,809 |
|
|
| 222,899 |
|
Other residential mortgage-backed securities |
|
|
|
|
|
|
|
|
|
|
|
|
Issued or guaranteed by FNMA, FHLMC or GNMA |
|
| 1,028,176 |
|
|
| 1,271,198 |
|
|
| 1,584,338 |
|
Commercial mortgage-backed securities |
|
|
|
|
|
|
|
|
|
|
|
|
Issued or guaranteed by FNMA, FHLMC or GNMA |
|
| 218,252 |
|
|
| 242,869 |
|
|
| 278,429 |
|
Asset-backed securities and structured financial products |
|
| — |
|
|
| — |
|
|
| 25,003 |
|
Total securities available for sale |
| $ | 2,262,130 |
|
| $ | 2,366,168 |
|
| $ | 2,339,562 |
|
|
|
|
|
|
|
|
|
|
|
|
|
|
Securities held to maturity |
|
|
|
|
|
|
|
|
|
|
|
|
U.S. Government agency obligations |
|
|
|
|
|
|
|
|
|
|
|
|
Issued by U.S. Government sponsored agencies |
| $ | 3,692 |
|
| $ | 3,647 |
|
| $ | 101,782 |
|
Obligations of states and political subdivisions |
|
| 46,039 |
|
|
| 46,303 |
|
|
| 55,892 |
|
Mortgage-backed securities |
|
|
|
|
|
|
|
|
|
|
|
|
Residential mortgage pass-through securities |
|
|
|
|
|
|
|
|
|
|
|
|
Guaranteed by GNMA |
|
| 13,539 |
|
|
| 15,478 |
|
|
| 17,363 |
|
Issued by FNMA and FHLMC |
|
| 133,975 |
|
|
| 81,299 |
|
|
| 10,368 |
|
Other residential mortgage-backed securities |
|
|
|
|
|
|
|
|
|
|
|
|
Issued or guaranteed by FNMA, FHLMC or GNMA |
|
| 678,926 |
|
|
| 803,474 |
|
|
| 820,012 |
|
Commercial mortgage-backed securities |
|
|
|
|
|
|
|
|
|
|
|
|
Issued or guaranteed by FNMA, FHLMC or GNMA |
|
| 180,315 |
|
|
| 208,442 |
|
|
| 182,401 |
|
Total securities held to maturity |
| $ | 1,056,486 |
|
| $ | 1,158,643 |
|
| $ | 1,187,818 |
|
53
The following table details the weighted-average yield for each range of maturities of securities available for sale and held to maturity using the amortized cost at December 31, 2017, and the weighted-average yield for each range of maturities2023 (tax equivalent basis) ($ in thousands):
|
| Maturing |
| |||||||||||||||||||||||||||||||||
|
| Within One Year |
|
| Yield |
|
| After One, But Within Five Years |
|
| Yield |
|
| After Five, But Within Ten Years |
|
| Yield |
|
| After Ten Years |
|
| Yield |
|
| Total |
| |||||||||
Securities available for sale |
|
|
|
|
|
|
|
|
|
|
|
|
|
|
|
|
|
|
|
|
|
|
|
|
|
|
|
|
|
|
|
|
|
|
|
|
U.S. Government agency obligations |
|
|
|
|
|
|
|
|
|
|
|
|
|
|
|
|
|
|
|
|
|
|
|
|
|
|
|
|
|
|
|
|
|
|
|
|
Issued by U.S. Government agencies |
| $ | — |
|
|
| — |
|
| $ | 10,060 |
|
|
| 3.62 | % |
| $ | 3,866 |
|
|
| 2.93 | % |
| $ | 31,582 |
|
|
| 2.95 | % |
| $ | 45,508 |
|
Issued by U.S. Government sponsored agencies |
|
| — |
|
|
| — |
|
|
| 255 |
|
|
| 3.85 | % |
|
| — |
|
|
| — |
|
|
| — |
|
|
| — |
|
|
| 255 |
|
Obligations of states and political subdivisions |
|
| 31,376 |
|
|
| 3.78 | % |
|
| 47,057 |
|
|
| 4.17 | % |
|
| — |
|
|
| — |
|
|
| — |
|
|
| — |
|
|
| 78,433 |
|
Mortgage-backed securities |
|
|
|
|
|
|
|
|
|
|
|
|
|
|
|
|
|
|
|
|
|
|
|
|
|
|
|
|
|
|
|
|
|
|
|
|
Residential mortgage pass-through securities |
|
|
|
|
|
|
|
|
|
|
|
|
|
|
|
|
|
|
|
|
|
|
|
|
|
|
|
|
|
|
|
|
|
|
|
|
Guaranteed by GNMA |
|
| — |
|
|
| — |
|
|
| 163 |
|
|
| 3.66 | % |
|
| 7,846 |
|
|
| 2.07 | % |
|
| 58,625 |
|
|
| 2.73 | % |
|
| 66,634 |
|
Issued by FNMA and FHLMC |
|
| — |
|
|
| — |
|
|
| 15 |
|
|
| 2.01 | % |
|
| 187,964 |
|
|
| 2.22 | % |
|
| 636,893 |
|
|
| 2.05 | % |
|
| 824,872 |
|
Other residential mortgage-backed securities |
|
|
|
|
|
|
|
|
|
|
|
|
|
|
|
|
|
|
|
|
|
|
|
|
|
|
|
|
|
|
|
|
|
|
|
|
Issued or guaranteed by FNMA, FHLMC, or GNMA |
|
| — |
|
|
| — |
|
|
| 5,441 |
|
|
| 2.01 | % |
|
| 41,308 |
|
|
| 2.51 | % |
|
| 981,427 |
|
|
| 2.39 | % |
|
| 1,028,176 |
|
Commercial mortgage-backed securities |
|
|
|
|
|
|
|
|
|
|
|
|
|
|
|
|
|
|
|
|
|
|
|
|
|
|
|
|
|
|
|
|
|
|
|
|
Issued or guaranteed by FNMA, FHLMC, or GNMA |
|
| 15,273 |
|
|
| 3.74 | % |
|
| 148,795 |
|
|
| 2.38 | % |
|
| 45,555 |
|
|
| 2.43 | % |
|
| 8,629 |
|
|
| 2.71 | % |
|
| 218,252 |
|
Total securities available for sale |
| $ | 46,649 |
|
|
| 3.77 | % |
| $ | 211,786 |
|
|
| 2.83 | % |
| $ | 286,539 |
|
|
| 2.30 | % |
| $ | 1,717,156 |
|
|
| 2.29 | % |
| $ | 2,262,130 |
|
|
|
|
|
|
|
|
|
|
|
|
|
|
|
|
|
|
|
|
|
|
|
|
|
|
|
|
|
|
|
|
|
|
|
|
|
|
Securities held to maturity |
|
|
|
|
|
|
|
|
|
|
|
|
|
|
|
|
|
|
|
|
|
|
|
|
|
|
|
|
|
|
|
|
|
|
|
|
U.S. Government agency obligations |
|
|
|
|
|
|
|
|
|
|
|
|
|
|
|
|
|
|
|
|
|
|
|
|
|
|
|
|
|
|
|
|
|
|
|
|
Issued by U.S. Government sponsored agencies |
| $ | — |
|
|
| — |
|
| $ | — |
|
|
| — |
|
| $ | 3,692 |
|
|
| 2.53 | % |
| $ | — |
|
|
| — |
|
| $ | 3,692 |
|
Obligations of states and political subdivisions |
|
| 155 |
|
|
| 8.04 | % |
|
| 40,594 |
|
|
| 5.21 | % |
|
| 5,290 |
|
|
| 5.19 | % |
|
| — |
|
|
| — |
|
|
| 46,039 |
|
Mortgage-backed securities |
|
|
|
|
|
|
|
|
|
|
|
|
|
|
|
|
|
|
|
|
|
|
|
|
|
|
|
|
|
|
|
|
|
|
|
|
Residential mortgage pass-through securities |
|
|
|
|
|
|
|
|
|
|
|
|
|
|
|
|
|
|
|
|
|
|
|
|
|
|
|
|
|
|
|
|
|
|
|
|
Guaranteed by GNMA |
|
| — |
|
|
| — |
|
|
| — |
|
|
| — |
|
|
| — |
|
|
| — |
|
|
| 13,539 |
|
|
| 3.03 | % |
|
| 13,539 |
|
Issued by FNMA and FHLMC |
|
| — |
|
|
| — |
|
|
| — |
|
|
| — |
|
|
| — |
|
|
| — |
|
|
| 133,975 |
|
|
| 2.32 | % |
|
| 133,975 |
|
Other residential mortgage-backed securities |
|
|
|
|
|
|
|
|
|
|
|
|
|
|
|
|
|
|
|
|
|
|
|
|
|
|
|
|
|
|
|
|
|
|
|
|
Issued or guaranteed by FNMA, FHLMC, or GNMA |
|
| — |
|
|
| — |
|
|
| — |
|
|
| — |
|
|
| — |
|
|
| — |
|
|
| 678,926 |
|
|
| 1.98 | % |
|
| 678,926 |
|
Commercial mortgage-backed securities |
|
|
|
|
|
|
|
|
|
|
|
|
|
|
|
|
|
|
|
|
|
|
|
|
|
|
|
|
|
|
|
|
|
|
|
|
Issued or guaranteed by FNMA, FHLMC, or GNMA |
|
| 6,216 |
|
|
| 2.42 | % |
|
| 94,824 |
|
|
| 2.15 | % |
|
| 48,251 |
|
|
| 2.36 | % |
|
| 31,024 |
|
|
| 2.40 | % |
|
| 180,315 |
|
Total securities held to maturity |
| $ | 6,371 |
|
|
| 2.56 | % |
| $ | 135,418 |
|
|
| 3.07 | % |
| $ | 57,233 |
|
|
| 2.63 | % |
| $ | 857,464 |
|
|
| 2.07 | % |
| $ | 1,056,486 |
|
|
| Maturing |
| |||||||||||||||||
|
| Within |
|
| After One, |
|
| After Five, |
|
| After |
|
| Total |
| |||||
Securities Available for Sale |
|
|
|
|
|
|
|
|
|
|
|
|
|
|
| |||||
U.S. Treasury securities |
|
| 1.08 | % |
|
| 1.18 | % |
|
| — |
|
|
| — |
|
|
| 1.17 | % |
U.S. Government agency obligations |
|
| 8.58 | % |
|
| 7.00 | % |
|
| 2.27 | % |
|
| 7.22 | % |
|
| 5.34 | % |
Mortgage-backed securities |
|
|
|
|
|
|
|
|
|
|
|
|
|
|
| |||||
Residential mortgage pass-through securities |
|
|
|
|
|
|
|
|
|
|
|
|
|
|
| |||||
Guaranteed by GNMA |
|
| 0.93 | % |
|
| 1.65 | % |
|
| 3.75 | % |
|
| 2.51 | % |
|
| 2.51 | % |
Issued by FNMA and FHLMC |
|
| 2.83 | % |
|
| 2.04 | % |
|
| 1.95 | % |
|
| 1.44 | % |
|
| 1.49 | % |
Other residential mortgage-backed securities |
|
|
|
|
|
|
|
|
|
|
|
|
|
|
| |||||
Issued or guaranteed by FNMA, FHLMC, or GNMA |
|
| — |
|
|
| 2.37 | % |
|
| 2.40 | % |
|
| 2.13 | % |
|
| 2.26 | % |
Commercial mortgage-backed securities |
|
|
|
|
|
|
|
|
|
|
|
|
|
|
| |||||
Issued or guaranteed by FNMA, FHLMC, or GNMA |
|
| 4.88 | % |
|
| 3.41 | % |
|
| 5.63 | % |
|
| 3.57 | % |
|
| 5.56 | % |
Total securities available for sale |
|
| 1.10 | % |
|
| 1.35 | % |
|
| 3.93 | % |
|
| 1.50 | % |
|
| 1.69 | % |
|
|
|
|
|
|
|
|
|
|
|
|
|
|
|
| |||||
Securities Held to Maturity |
|
|
|
|
|
|
|
|
|
|
|
|
|
|
| |||||
U.S. Treasury securities |
|
| — |
|
|
| 1.04 | % |
|
| — |
|
|
| — |
|
|
| 1.04 | % |
Obligations of states and political subdivisions |
|
| 5.17 | % |
|
| — |
|
|
| — |
|
|
| — |
|
|
| 5.17 | % |
Mortgage-backed securities |
|
|
|
|
|
|
|
|
|
|
|
|
|
|
| |||||
Residential mortgage pass-through securities |
|
|
|
|
|
|
|
|
|
|
|
|
|
|
| |||||
Guaranteed by GNMA |
|
| — |
|
|
| — |
|
|
| — |
|
|
| 4.49 | % |
|
| 4.49 | % |
Issued by FNMA and FHLMC |
|
| — |
|
|
| 1.91 | % |
|
| 1.90 | % |
|
| 1.68 | % |
|
| 1.68 | % |
Other residential mortgage-backed securities |
|
|
|
|
|
|
|
|
|
|
|
|
|
|
| |||||
Issued or guaranteed by FNMA, FHLMC, or GNMA |
|
| — |
|
|
| — |
|
|
| 1.95 | % |
|
| 1.95 | % |
|
| 1.95 | % |
Commercial mortgage-backed securities |
|
|
|
|
|
|
|
|
|
|
|
|
|
|
| |||||
Issued or guaranteed by FNMA, FHLMC, or GNMA |
|
| — |
|
|
| 2.53 | % |
|
| 2.09 | % |
|
| 2.96 | % |
|
| 2.32 | % |
Total securities held to maturity |
|
| 5.17 | % |
|
| 2.41 | % |
|
| 2.06 | % |
|
| 1.81 | % |
|
| 2.07 | % |
Mortgage-backed securities and collateralized mortgage obligations are included in maturity categories based on their stated maturity date. Expected maturities may differ from contractual maturities because issuers may have the right to call or prepay obligations.
Management continues to focus on asset quality as one of the strategic goals of the securities portfolio, which is evidenced by the investment of approximately 96%99.99% of the portfolio in GSE-backed obligations and other Aaa-rated securities as determined by Moody’s Investors Services (Moody’s). None of the securities owned by Trustmark are collateralized by assets which are considered sub-prime. Furthermore, outside of stock ownership in the FHLB of Dallas, FHLB of Atlanta and Federal Reserve Bank of Atlanta,FRBA, Trustmark does not hold any other equity investment in a GSE.
54
As ofAt December 31, 2017,2023, Trustmark did not hold securities of any one issuer with a carrying value exceeding ten percent of total shareholders’ equity, other than certain GSEs which are exempt from inclusion. Management continues to closely monitor the credit quality as well as the ratings of the debt and mortgage-backed securities issued by the GSEs and held in Trustmark’s securities portfolio.
49
The following table presents Trustmark’s securities portfolio by amortized cost and estimated fair value and by credit rating, as determined by Moody’s, at December 31, 20172023 ($ in thousands):
|
| December 31, 2023 |
| |||||||||||||
|
| Amortized Cost |
|
| Estimated Fair Value |
| ||||||||||
|
| Amount |
|
| % |
|
| Amount |
|
| % |
| ||||
Securities Available for Sale |
|
|
|
|
|
|
|
|
|
|
|
| ||||
Aaa |
| $ | 1,959,007 |
|
|
| 100.0 | % |
| $ | 1,762,878 |
|
|
| 100.0 | % |
Total securities available for sale |
| $ | 1,959,007 |
|
|
| 100.0 | % |
| $ | 1,762,878 |
|
|
| 100.0 | % |
|
|
|
|
|
|
|
|
|
|
|
|
| ||||
Securities Held to Maturity |
|
|
|
|
|
|
|
|
|
|
|
| ||||
Aaa |
| $ | 1,425,939 |
|
|
| 100.0 | % |
| $ | 1,355,164 |
|
|
| 100.0 | % |
Not Rated (1) |
|
| 340 |
|
|
| — |
|
|
| 340 |
|
|
| — |
|
Total securities held to maturity |
| $ | 1,426,279 |
|
|
| 100.0 | % |
| $ | 1,355,504 |
|
|
| 100.0 | % |
|
| Amortized Cost |
|
| Estimated Fair Value |
| ||||||||||
|
| Amount |
|
| % |
|
| Amount |
|
| % |
| ||||
Securities Available for Sale |
|
|
|
|
|
|
|
|
|
|
|
|
|
|
|
|
Aaa |
| $ | 2,183,697 |
|
|
| 96.5 | % |
| $ | 2,159,407 |
|
|
| 96.5 | % |
Aa1 to Aa3 |
|
| 55,456 |
|
|
| 2.5 | % |
|
| 56,072 |
|
|
| 2.5 | % |
Baa1 to Baa3 |
|
| 213 |
|
|
| — |
|
|
| 208 |
|
|
| — |
|
Not Rated (1) |
|
| 22,764 |
|
|
| 1.0 | % |
|
| 22,948 |
|
|
| 1.0 | % |
Total securities available for sale |
| $ | 2,262,130 |
|
|
| 100.0 | % |
| $ | 2,238,635 |
|
|
| 100.0 | % |
|
|
|
|
|
|
|
|
|
|
|
|
|
|
|
|
|
Securities Held to Maturity |
|
|
|
|
|
|
|
|
|
|
|
|
|
|
|
|
Aaa |
| $ | 1,010,446 |
|
|
| 95.6 | % |
| $ | 999,223 |
|
|
| 95.5 | % |
Aa1 to Aa3 |
|
| 33,504 |
|
|
| 3.2 | % |
|
| 34,319 |
|
|
| 3.3 | % |
Baa1 to Baa3 |
|
| 410 |
|
|
| — |
|
|
| 416 |
|
|
| — |
|
Not Rated (1) |
|
| 12,126 |
|
|
| 1.2 | % |
|
| 12,289 |
|
|
| 1.2 | % |
Total securities held to maturity |
| $ | 1,056,486 |
|
|
| 100.0 | % |
| $ | 1,046,247 |
|
|
| 100.0 | % |
|
|
The table above presenting the credit rating of Trustmark’s securities is formatted to show the securities according to the credit rating category, and not by category of the underlying security. At December 31, 2017,2023, approximately 96.5%100.0% of the available for sale securities, measured at the estimated fair value, and 95.6% ofthe held to maturity securities, measured at amortized cost, were rated Aaa.
LHFS
At December 31, 2017,2023, LHFS totaled $180.5$184.8 million, consisting of $132.3$106.0 million of residential real estate mortgage loans in the process of being sold to third parties and $48.2$78.8 million of Government National Mortgage Association (GNMA) optional repurchase loans. At December 31, 2016,2022, LHFS totaled $175.9$135.2 million, consisting of $132.0$64.4 million of residential real estate mortgage loans in the process of being sold to third parties and $43.9$70.8 million of GNMA optional repurchase loans. Please refer to the nonperforming assets table that follows for information on GNMA loans eligible for repurchase which are past due 90 days or more.
Trustmark did not exercise its buy-back option on any delinquent loans serviced for GNMA during 20172023 or 2016.2022.
For additional information regarding the GNMA optional repurchase loans, please see the section captioned “Past Due LHFS” included in Note 54 – LHFI and Allowance for LoanCredit Losses, LHFI of Part II. Item 8. – Financial Statements and Supplementary Data of this report.
55
The table below provides the carrying value of the LHFI portfolio by loan typeclass for each year of the five-year periodyears ended20172023 and 2022 ($ in thousands):
|
| December 31, |
|
| December 31, |
| ||||||||||||||||||||||||||||||||||||||||||||||||||
|
| 2017 |
|
| 2016 |
|
| 2015 |
|
| 2014 |
|
| 2013 |
|
| 2023 |
|
| 2022 |
| |||||||||||||||||||||||||||||||||||
|
| Amount |
|
| % |
|
| Amount |
|
| % |
|
| Amount |
|
| % |
|
| Amount |
|
| % |
|
| Amount |
|
| % |
|
| Amount |
|
| % |
|
| Amount |
|
| % |
| ||||||||||||||
Loans secured by real estate: |
|
|
|
|
|
|
|
|
|
|
|
|
|
|
|
|
|
|
|
|
|
|
|
|
|
|
|
|
|
|
|
|
|
|
|
|
|
|
|
|
|
|
|
|
|
|
|
|
| |||||||
Construction, land development and other land |
| $ | 987,624 |
|
|
| 11.5 | % |
| $ | 831,437 |
|
|
| 10.6 | % |
| $ | 824,723 |
|
|
| 11.6 | % |
| $ | 619,877 |
|
|
| 9.6 | % |
| $ | 596,889 |
|
|
| 10.3 | % |
| $ | 642,886 |
|
|
| 5.0 | % |
| $ | 690,616 |
|
|
| 5.7 | % |
Secured by 1-4 family residential properties |
|
| 1,675,311 |
|
|
| 19.6 | % |
|
| 1,660,043 |
|
|
| 21.1 | % |
|
| 1,649,501 |
|
|
| 23.3 | % |
|
| 1,634,397 |
|
|
| 25.4 | % |
|
| 1,485,564 |
|
|
| 25.6 | % | ||||||||||||||||
Other secured by 1-4 family residential properties |
|
| 622,397 |
|
|
| 4.8 | % |
|
| 590,790 |
|
|
| 4.8 | % | ||||||||||||||||||||||||||||||||||||||||
Secured by nonfarm, nonresidential properties |
|
| 2,193,823 |
|
|
| 25.6 | % |
|
| 2,034,176 |
|
|
| 25.9 | % |
|
| 1,736,476 |
|
|
| 24.5 | % |
|
| 1,553,193 |
|
|
| 24.1 | % |
|
| 1,415,139 |
|
|
| 24.4 | % |
|
| 3,489,434 |
|
|
| 26.9 | % |
|
| 3,278,830 |
|
|
| 26.9 | % |
Other real estate secured |
|
| 517,956 |
|
|
| 6.1 | % |
|
| 318,148 |
|
|
| 4.0 | % |
|
| 211,228 |
|
|
| 3.0 | % |
|
| 253,787 |
|
|
| 3.9 | % |
|
| 189,362 |
|
|
| 3.3 | % |
|
| 1,312,551 |
|
|
| 10.1 | % |
|
| 742,538 |
|
|
| 6.1 | % |
Other loans secured by real estate: |
|
|
|
|
|
|
|
|
|
|
|
| ||||||||||||||||||||||||||||||||||||||||||||
Other construction |
|
| 867,793 |
|
|
| 6.7 | % |
|
| 1,028,926 |
|
|
| 8.4 | % | ||||||||||||||||||||||||||||||||||||||||
Secured by 1-4 family residential properties |
|
| 2,282,318 |
|
|
| 17.6 | % |
|
| 2,185,057 |
|
|
| 17.9 | % | ||||||||||||||||||||||||||||||||||||||||
Commercial and industrial loans |
|
| 1,570,345 |
|
|
| 18.3 | % |
|
| 1,528,434 |
|
|
| 19.5 | % |
|
| 1,343,211 |
|
|
| 18.9 | % |
|
| 1,270,350 |
|
|
| 19.7 | % |
|
| 1,157,614 |
|
|
| 20.0 | % |
|
| 1,922,910 |
|
|
| 14.9 | % |
|
| 1,821,259 |
|
|
| 14.9 | % |
Consumer loans |
|
| 171,918 |
|
|
| 2.0 | % |
|
| 170,562 |
|
|
| 2.2 | % |
|
| 169,135 |
|
|
| 2.4 | % |
|
| 167,964 |
|
|
| 2.6 | % |
|
| 165,308 |
|
|
| 2.8 | % |
|
| 165,734 |
|
|
| 1.3 | % |
|
| 170,230 |
|
|
| 1.4 | % |
State and other political subdivision loans |
|
| 952,483 |
|
|
| 11.1 | % |
|
| 917,515 |
|
|
| 11.7 | % |
|
| 734,615 |
|
|
| 10.4 | % |
|
| 602,727 |
|
|
| 9.3 | % |
|
| 499,963 |
|
|
| 8.6 | % |
|
| 1,088,466 |
|
|
| 8.4 | % |
|
| 1,223,863 |
|
|
| 10.0 | % |
Other loans |
|
| 500,507 |
|
|
| 5.8 | % |
|
| 390,898 |
|
|
| 5.0 | % |
|
| 422,496 |
|
|
| 5.9 | % |
|
| 347,174 |
|
|
| 5.4 | % |
|
| 289,042 |
|
|
| 5.0 | % | ||||||||||||||||
Other commercial loans and leases |
|
| 556,035 |
|
|
| 4.3 | % |
|
| 471,930 |
|
|
| 3.9 | % | ||||||||||||||||||||||||||||||||||||||||
LHFI |
| $ | 8,569,967 |
|
|
| 100.0 | % |
| $ | 7,851,213 |
|
|
| 100.0 | % |
| $ | 7,091,385 |
|
|
| 100.0 | % |
| $ | 6,449,469 |
|
|
| 100.0 | % |
| $ | 5,798,881 |
|
|
| 100.0 | % |
| $ | 12,950,524 |
|
|
| 100.0 | % |
| $ | 12,204,039 |
|
|
| 100.0 | % |
LHFI at December 31, 2023 increased $718.8$746.5 million, or 9.2%6.1%, compared to December 31, 2016. During the first quarter of 2017, Trustmark reclassified $36.72022. The increase in LHFI during 2023 was primarily due to net growth in LHFI secured by real estate, commercial and industrial LHFI and other commercial LHFI and leases partially offset by a decline in state and other political subdivision LHFI.
50
LHFI secured by real estate (loans secured by real estate and other loans secured by real estate) increased $700.6 million, of acquiredor 8.2%, during 2023, principally due to net growth in Trustmark's Alabama, Mississippi and Texas market regions. LHFI secured by other real estate increased $570.0 million, or 76.8%, during 2023, primarily due to other construction loans not accounted for under FASB ASC Topic 310-30that moved to LHFI secured by multi-family residential properties in the Alabama, Texas and Mississippi market regions, partially offset by pay-offs of LHFI secured by multi-family residential properties. Excluding other construction loan reclassifications, LHFI secured by other real estate declined by $160.8 million, or 21.7%. LHFI secured by nonfarm, nonresidential properties (NFNR LHFI) increased $210.6 million, or 6.4%, during 2023, principally due to movement from the discount on theseother construction loans being fully amortized.category. Excluding other construction loan reclassifications, the reclassified acquired loans,NFNR LHFI increased $682.0portfolio decreased $286.0 million, or 8.7%, during 2017. The increase2023 primarily due to declines in LHFI, excludingnonowner-occupied loans in the reclassified acquiredMississippi, Alabama, Florida and Tennessee market regions as well as declines in owner-occupied loans in the Texas and Alabama market regions, which were partially offset by growth in owner-occupied loans in the Mississippi market region and nonowner-occupied loans in the Texas market region. Other construction loans decreased $161.1 million, or 15.7%, during 2017 represented net growth2023 primarily due to other construction loans moved to other loan categories upon the completion of the related construction project partially offset by new construction loans across all five of Trustmark’s market regionsregions. During 2023, $1.227 billion loans were moved from other construction to other loan categories, including $730.8 million to multi-family residential loans, $419.1 million to nonowner-occupied loans and $77.5 million to owner-occupied loans. Excluding all reclassifications between loan categories, other construction loans categories. The discussion below excludes the reclassified acquired loans.
During 2017, LHFI secured by real estate increased $513.8 million, or 10.6%, as$1.060 billion during 2023, reflecting growth in the Alabama, Texas, Mississippi and Florida market regions was partially offsetregions. LHFI secured by declines1-4 family residential properties increased $97.3 million, or 4.5%, during 2023, primarily in the TennesseeMississippi market region. Trustmark's LHFI secured by 1-4 family residential properties are primarily included in the Mississippi market region because these loans are centrally analyzed and approved as part of the mortgage line of business which is located in Jackson, Mississippi. LHFI secured by construction, land development and other land increased $155.7decreased $47.7 million, or 18.7%6.9%, during 2017,2023 principally due to new loan growthdeclines in the other1-4 family construction category, partially offsetloans in Trustmark's Alabama, Florida, Tennessee and Mississippi market regions. LHFI secured by other construction loans that were moved to the appropriate permanent categories upon completion1-4 family residential properties, which primarily consists of the related construction project. During 2017, $523.6revolving home equity lines of credit, increased $31.6 million, in other construction loans were moved to the appropriate permanent categories upon completion, including $299.2 million in multi-family residential, $184.2 million in non-owner occupied and $40.7 million in owner occupied. Excluding all reclassifications between loan categories,or 5.4%, during 2023 reflecting growth in other construction loans across all five market regions totaled $690.0 million for 2017.regions.
Commercial and industrial LHFI secured by nonfarm, nonresidential properties (NFNR LHFI) increased $155.7$101.7 million, or 7.7%5.6%, during 2017, principally due to other construction loans that moved to permanent financing. Excluding other construction loan reclassifications, the NFNR LHFI portfolio declined $69.3 million, or 3.4%, during 2017. The decrease in the NFNR LHFI portfolio, excluding the other construction reclassifications, was2023, primarily attributable to declines in non-owner occupied loans in Trustmark’s Mississippi, Texas and Tennessee market regions as well as declines in owner occupied loans in the Mississippi and Florida market regions, partially offset by growth in non-owner occupied loans in the Florida and Alabama market regions and owner occupied loans in the Alabama, Tennessee and Texas market regions. Other real estate secured LHFI increased $198.2 million, or 62.3%, during 2017, primarily due to multi-family residential loans in Trustmark’s Texas, Mississippi, Alabama and Tennessee market regions that were moved from other construction loans to permanent financing. Excluding the other construction loan reclassifications, other real estate secured LHFI decreased $101.1 million, or 31.8%, during 2017.
The commercial and industrial loan portfolio increased $26.4 million, or 1.7%, during 2017, due to growth in Trustmark’s Alabama market region, principally due to the growth in equipment finance (EF) loans, partially offset by a decline in the Tennessee market region. Other commercial LHFI and leases increased $84.1 million, or 17.8%, during 2023, principally due to an increase in the Alabama Tennessee, Florida and Mississippi market regions,region, primarily due to growth in EF leases, partially offset by declines in the TexasMississippi and Tennessee market region. Trustmark’s exposure toregions. During 2023, Trustmark introduced the energy sector is primarilyEF lending line of business through its Georgia LPO providing commercial customers with loans and leases for equipment and machinery. At December 31, 2023, EF loans totaled $130.5 million and were included in the commercial and industrial LHFI loan portfolio in Trustmark’s Mississippi and TexasTrustmark's Alabama market regions.region. At December 31, 20172023, EF leases, which include sales-type and 2016, energy-related LHFI had outstanding balances of approximately $226.5direct financing leases, totaled $137.7 million and $271.5 million, respectively, which represented approximately 2.6%were included in the other commercial LHFI and leases portfolio in Trustmark's Alabama market region. For additional information regarding the EF leases, please see the sections captioned “Lessor Arrangements” included in Note 1 - Significant Accounting Policies and Note 9 – Leases of Trustmark’s total LHFI portfolio at December 31, 2017 compared to approximately 3.5%Part II. Item 8. – Financial Statements and Supplementary Data of the total LHFI portfolio at December 31, 2016. Trustmark has no loan exposure where the source of repayment, or the underlying security of such exposure, is tied to the realization of value from energy reserves. Should oil prices remain at current levels or below for a prolonged period of time, there is potential for downgrades to occur. Management will continue to monitor this exposure. report.
State and other political subdivision LHFI increased $35.0decreased $135.4 million, or 3.8%11.1%, during 2017 principally due to growth in the Mississippi and Alabama2023 reflecting declines across all five market regions, partially offset by declines in the Texas, Tennessee and Florida market regions. The other loan portfolio, which includes lending to nonprofits, financial intermediaries and real estate investment trusts, increased $105.6 million, or 27.0%, during 2017, which represented growth in all of Trustmark’s market regions with the exception of the Florida market region.
56
The following table provides information regarding Trustmark’s home equity loans and home equity lines of credit which are included in the LHFI secured by 1-4 family residential properties as ofat December 31, 20172023 and 20162022 ($ in thousands):
|
| December 31, |
|
| December 31, |
| ||||||||||
|
| 2017 |
|
| 2016 |
|
| 2023 |
|
| 2022 |
| ||||
Home equity loans |
| $ | 47,032 |
|
| $ | 54,687 |
|
| $ | 58,176 |
|
| $ | 45,532 |
|
Home equity lines of credit |
|
| 407,627 |
|
|
| 390,629 |
|
|
| 430,933 |
|
|
| 412,013 |
|
Percentage of loans and lines for which Trustmark holds first lien |
|
| 60.7 | % |
|
| 59.7 | % |
|
| 47.8 | % |
|
| 51.7 | % |
Percentage of loans and lines for which Trustmark does not hold first lien |
|
| 39.3 | % |
|
| 40.3 | % |
|
| 52.2 | % |
|
| 48.3 | % |
Due to the increased risk associated with second liens, loan terms and underwriting guidelines differ from those used for products secured by first liens. Loan amounts and loan-to-value ratios are limited and are lower for second liens than first liens. Also, interest rates and maximum amortization periods are adjusted accordingly. In addition, regardless of lien position, the passing credit score for approval of all home equity lines of credit is higher than that of term loans. The allowance for loan losses,ACL on LHFI is also reflective of the increased risk related to second liens through application of a greater loss factor to this portion of the portfolio.
In the following tables, LHFI reported by region (along with related nonperforming assets and net charge-offs) are associated with location of origination except for loans secured by 1-4 family residential properties (representing traditional mortgages) and credit cards. These loans are included in the Mississippi market region because they are centrally analyzed and approved as part of a specific line of business located at Trustmark’s headquarters in Jackson, Mississippi.
5751
The following table presents the LHFI composition by region at December 31, 20172023 and reflects a diversified mix of loans by region ($ in thousands):
|
| December 31, 2023 |
| |||||||||||||||||||||
LHFI Composition by Region |
| Total |
|
| Alabama |
|
| Florida |
|
| Mississippi |
|
| Tennessee |
|
| Texas |
| ||||||
Loans secured by real estate: |
|
|
|
|
|
|
|
|
|
|
|
|
|
|
|
|
|
| ||||||
Construction, land development and other land |
| $ | 642,886 |
|
| $ | 286,345 |
|
| $ | 35,567 |
|
| $ | 185,817 |
|
| $ | 37,194 |
|
| $ | 97,963 |
|
Other secured by 1-4 family residential |
|
| 622,397 |
|
|
| 151,446 |
|
|
| 54,998 |
|
|
| 304,167 |
|
|
| 79,875 |
|
|
| 31,911 |
|
Secured by nonfarm, nonresidential properties |
|
| 3,489,434 |
|
|
| 960,656 |
|
|
| 233,908 |
|
|
| 1,431,968 |
|
|
| 153,226 |
|
|
| 709,676 |
|
Other real estate secured |
|
| 1,312,551 |
|
|
| 583,165 |
|
|
| 1,761 |
|
|
| 396,715 |
|
|
| 7,587 |
|
|
| 323,323 |
|
Other loans secured by real estate: |
|
|
|
|
|
|
|
|
|
|
|
|
|
|
|
|
|
| ||||||
Other construction |
|
| 867,793 |
|
|
| 402,093 |
|
|
| 2,059 |
|
|
| 249,589 |
|
|
| — |
|
|
| 214,052 |
|
Secured by 1-4 family residential properties |
|
| 2,282,318 |
|
|
| — |
|
|
| — |
|
|
| 2,278,162 |
|
|
| 4,156 |
|
|
| — |
|
Commercial and industrial loans |
|
| 1,922,910 |
|
|
| 658,573 |
|
|
| 25,406 |
|
|
| 780,949 |
|
|
| 217,729 |
|
|
| 240,253 |
|
Consumer loans |
|
| 165,734 |
|
|
| 22,752 |
|
|
| 7,491 |
|
|
| 105,502 |
|
|
| 20,306 |
|
|
| 9,683 |
|
State and other political subdivision loans |
|
| 1,088,466 |
|
|
| 71,882 |
|
|
| 52,759 |
|
|
| 813,291 |
|
|
| 25,999 |
|
|
| 124,535 |
|
Other commercial loans and leases |
|
| 556,035 |
|
|
| 209,731 |
|
|
| 8,494 |
|
|
| 219,470 |
|
|
| 46,646 |
|
|
| 71,694 |
|
LHFI |
| $ | 12,950,524 |
|
| $ | 3,346,643 |
|
| $ | 422,443 |
|
| $ | 6,765,630 |
|
| $ | 592,718 |
|
| $ | 1,823,090 |
|
|
|
|
|
|
|
|
|
|
|
|
|
|
|
|
|
|
|
| ||||||
Construction, Land Development and Other Land Loans by Region |
| |||||||||||||||||||||||
Lots |
| $ | 71,875 |
|
| $ | 30,186 |
|
| $ | 8,353 |
|
| $ | 17,257 |
|
| $ | 4,714 |
|
| $ | 11,365 |
|
Development |
|
| 146,655 |
|
|
| 74,015 |
|
|
| 1,262 |
|
|
| 36,690 |
|
|
| 12,649 |
|
|
| 22,039 |
|
Unimproved land |
|
| 101,941 |
|
|
| 17,432 |
|
|
| 12,853 |
|
|
| 36,573 |
|
|
| 8,094 |
|
|
| 26,989 |
|
1-4 family construction |
|
| 322,415 |
|
|
| 164,712 |
|
|
| 13,099 |
|
|
| 95,297 |
|
|
| 11,737 |
|
|
| 37,570 |
|
Construction, land development and |
| $ | 642,886 |
|
| $ | 286,345 |
|
| $ | 35,567 |
|
| $ | 185,817 |
|
| $ | 37,194 |
|
| $ | 97,963 |
|
|
|
|
|
|
|
|
|
|
|
|
|
|
|
|
|
|
|
| ||||||
Loans Secured by Nonfarm, Nonresidential (NFNR) Properties by Region |
| |||||||||||||||||||||||
Nonowner-occupied: |
|
|
|
|
|
|
|
|
|
|
|
|
|
|
|
|
|
| ||||||
Retail |
| $ | 346,844 |
|
| $ | 128,743 |
|
| $ | 25,732 |
|
| $ | 91,057 |
|
| $ | 17,721 |
|
| $ | 83,591 |
|
Office |
|
| 286,511 |
|
|
| 104,114 |
|
|
| 19,857 |
|
|
| 94,294 |
|
|
| 1,649 |
|
|
| 66,597 |
|
Hotel/motel |
|
| 270,740 |
|
|
| 144,403 |
|
|
| 47,111 |
|
|
| 53,227 |
|
|
| 25,999 |
|
|
| — |
|
Mini-storage |
|
| 157,938 |
|
|
| 32,452 |
|
|
| 1,917 |
|
|
| 103,500 |
|
|
| 756 |
|
|
| 19,313 |
|
Industrial |
|
| 382,737 |
|
|
| 57,386 |
|
|
| 19,762 |
|
|
| 123,306 |
|
|
| 9,730 |
|
|
| 172,553 |
|
Health care |
|
| 97,783 |
|
|
| 69,352 |
|
|
| 688 |
|
|
| 25,021 |
|
|
| 333 |
|
|
| 2,389 |
|
Convenience stores |
|
| 26,254 |
|
|
| 3,315 |
|
|
| 425 |
|
|
| 13,777 |
|
|
| 249 |
|
|
| 8,488 |
|
Nursing homes/senior living |
|
| 508,665 |
|
|
| 229,352 |
|
|
| — |
|
|
| 160,359 |
|
|
| 4,901 |
|
|
| 114,053 |
|
Other |
|
| 110,828 |
|
|
| 31,370 |
|
|
| 9,232 |
|
|
| 52,521 |
|
|
| 8,321 |
|
|
| 9,384 |
|
Total nonowner-occupied loans |
|
| 2,188,300 |
|
|
| 800,487 |
|
|
| 124,724 |
|
|
| 717,062 |
|
|
| 69,659 |
|
|
| 476,368 |
|
|
|
|
|
|
|
|
|
|
|
|
|
|
|
|
|
|
|
| ||||||
Owner-occupied: |
|
|
|
|
|
|
|
|
|
|
|
|
|
|
|
|
|
| ||||||
Office |
|
| 152,053 |
|
|
| 44,028 |
|
|
| 38,401 |
|
|
| 39,790 |
|
|
| 11,459 |
|
|
| 18,375 |
|
Churches |
|
| 62,217 |
|
|
| 17,098 |
|
|
| 4,178 |
|
|
| 34,899 |
|
|
| 3,541 |
|
|
| 2,501 |
|
Industrial warehouses |
|
| 159,227 |
|
|
| 11,619 |
|
|
| 4,618 |
|
|
| 40,837 |
|
|
| 16,330 |
|
|
| 85,823 |
|
Health care |
|
| 125,304 |
|
|
| 11,031 |
|
|
| 6,274 |
|
|
| 87,507 |
|
|
| 2,269 |
|
|
| 18,223 |
|
Convenience stores |
|
| 142,537 |
|
|
| 12,593 |
|
|
| 29,299 |
|
|
| 65,031 |
|
|
| 14 |
|
|
| 35,600 |
|
Retail |
|
| 89,174 |
|
|
| 9,606 |
|
|
| 15,644 |
|
|
| 37,340 |
|
|
| 17,694 |
|
|
| 8,890 |
|
Restaurants |
|
| 48,172 |
|
|
| 4,010 |
|
|
| 3,503 |
|
|
| 22,316 |
|
|
| 15,095 |
|
|
| 3,248 |
|
Auto dealerships |
|
| 43,556 |
|
|
| 5,533 |
|
|
| 201 |
|
|
| 21,383 |
|
|
| 16,439 |
|
|
| — |
|
Nursing homes/senior living |
|
| 345,108 |
|
|
| 31,644 |
|
|
| — |
|
|
| 287,264 |
|
|
| — |
|
|
| 26,200 |
|
Other |
|
| 133,786 |
|
|
| 13,007 |
|
|
| 7,066 |
|
|
| 78,539 |
|
|
| 726 |
|
|
| 34,448 |
|
Total owner-occupied loans |
|
| 1,301,134 |
|
|
| 160,169 |
|
|
| 109,184 |
|
|
| 714,906 |
|
|
| 83,567 |
|
|
| 233,308 |
|
Loans secured by NFNR properties |
| $ | 3,489,434 |
|
| $ | 960,656 |
|
| $ | 233,908 |
|
| $ | 1,431,968 |
|
| $ | 153,226 |
|
| $ | 709,676 |
|
|
| December 31, 2017 |
| |||||||||||||||||||||
|
| Total |
|
| Alabama |
|
| Florida |
|
| Mississippi |
|
| Tennessee |
|
| Texas |
| ||||||
LHFI Composition by Region |
|
|
|
|
|
|
|
|
|
|
|
|
|
|
|
|
|
|
|
|
|
|
|
|
Loans secured by real estate: |
|
|
|
|
|
|
|
|
|
|
|
|
|
|
|
|
|
|
|
|
|
|
|
|
Construction, land development and other land |
| $ | 987,624 |
|
| $ | 373,107 |
|
| $ | 47,592 |
|
| $ | 274,415 |
|
| $ | 21,741 |
|
| $ | 270,769 |
|
Secured by 1-4 family residential properties |
|
| 1,675,311 |
|
|
| 105,281 |
|
|
| 47,500 |
|
|
| 1,411,503 |
|
|
| 93,625 |
|
|
| 17,402 |
|
Secured by nonfarm, nonresidential properties |
|
| 2,193,823 |
|
|
| 368,337 |
|
|
| 213,404 |
|
|
| 947,708 |
|
|
| 151,526 |
|
|
| 512,848 |
|
Other real estate secured |
|
| 517,956 |
|
|
| 84,973 |
|
|
| 2,801 |
|
|
| 231,750 |
|
|
| 46,414 |
|
|
| 152,018 |
|
Commercial and industrial loans |
|
| 1,570,345 |
|
|
| 206,677 |
|
|
| 20,897 |
|
|
| 800,297 |
|
|
| 331,536 |
|
|
| 210,938 |
|
Consumer loans |
|
| 171,918 |
|
|
| 22,274 |
|
|
| 4,231 |
|
|
| 125,980 |
|
|
| 17,229 |
|
|
| 2,204 |
|
State and other political subdivision loans |
|
| 952,483 |
|
|
| 83,300 |
|
|
| 28,185 |
|
|
| 626,119 |
|
|
| 28,410 |
|
|
| 186,469 |
|
Other loans |
|
| 500,507 |
|
|
| 55,740 |
|
|
| 17,431 |
|
|
| 324,295 |
|
|
| 50,272 |
|
|
| 52,769 |
|
LHFI |
| $ | 8,569,967 |
|
| $ | 1,299,689 |
|
| $ | 382,041 |
|
| $ | 4,742,067 |
|
| $ | 740,753 |
|
| $ | 1,405,417 |
|
|
|
|
|
|
|
|
|
|
|
|
|
|
|
|
|
|
|
|
|
|
|
|
|
|
Construction, Land Development and Other Land Loans by Region |
| |||||||||||||||||||||||
Lots |
| $ | 57,616 |
|
| $ | 13,100 |
|
| $ | 14,795 |
|
| $ | 23,193 |
|
| $ | 2,249 |
|
| $ | 4,279 |
|
Development |
|
| 47,050 |
|
|
| 5,382 |
|
|
| 4,711 |
|
|
| 21,484 |
|
|
| 255 |
|
|
| 15,218 |
|
Unimproved land |
|
| 95,856 |
|
|
| 12,336 |
|
|
| 14,682 |
|
|
| 35,395 |
|
|
| 14,860 |
|
|
| 18,583 |
|
1-4 family construction |
|
| 188,561 |
|
|
| 61,709 |
|
|
| 10,352 |
|
|
| 80,511 |
|
|
| 2,406 |
|
|
| 33,583 |
|
Other construction |
|
| 598,541 |
|
|
| 280,580 |
|
|
| 3,052 |
|
|
| 113,832 |
|
|
| 1,971 |
|
|
| 199,106 |
|
Construction, land development and other land loans |
| $ | 987,624 |
|
| $ | 373,107 |
|
| $ | 47,592 |
|
| $ | 274,415 |
|
| $ | 21,741 |
|
| $ | 270,769 |
|
|
|
|
|
|
|
|
|
|
|
|
|
|
|
|
|
|
|
|
|
|
|
|
|
|
Loans Secured by Nonfarm, Nonresidential Properties by Region |
| |||||||||||||||||||||||
Non-owner occupied: |
|
|
|
|
|
|
|
|
|
|
|
|
|
|
|
|
|
|
|
|
|
|
|
|
Retail |
| $ | 308,452 |
|
| $ | 89,530 |
|
| $ | 44,797 |
|
| $ | 101,584 |
|
| $ | 16,900 |
|
| $ | 55,641 |
|
Office |
|
| 213,049 |
|
|
| 36,678 |
|
|
| 20,741 |
|
|
| 72,605 |
|
|
| 5,909 |
|
|
| 77,116 |
|
Nursing homes/senior living |
|
| 191,845 |
|
|
| 18,507 |
|
|
| — |
|
|
| 166,932 |
|
|
| 6,406 |
|
|
| — |
|
Hotel/motel |
|
| 263,768 |
|
|
| 54,658 |
|
|
| 60,968 |
|
|
| 58,575 |
|
|
| 35,014 |
|
|
| 54,553 |
|
Mini-storage |
|
| 126,117 |
|
|
| 14,539 |
|
|
| 6,403 |
|
|
| 43,632 |
|
|
| 560 |
|
|
| 60,983 |
|
Industrial |
|
| 93,481 |
|
|
| 11,467 |
|
|
| 9,613 |
|
|
| 19,903 |
|
|
| 4,553 |
|
|
| 47,945 |
|
Health care |
|
| 32,442 |
|
|
| 11,303 |
|
|
| 782 |
|
|
| 19,138 |
|
|
| — |
|
|
| 1,219 |
|
Convenience stores |
|
| 25,101 |
|
|
| 1,353 |
|
|
| — |
|
|
| 13,207 |
|
|
| 865 |
|
|
| 9,676 |
|
Other |
|
| 87,729 |
|
|
| 10,773 |
|
|
| 14,823 |
|
|
| 14,772 |
|
|
| 7,750 |
|
|
| 39,611 |
|
Total non-owner occupied loans |
|
| 1,341,984 |
|
|
| 248,808 |
|
|
| 158,127 |
|
|
| 510,348 |
|
|
| 77,957 |
|
|
| 346,744 |
|
|
|
|
|
|
|
|
|
|
|
|
|
|
|
|
|
|
|
|
|
|
|
|
|
|
Owner-occupied: |
|
|
|
|
|
|
|
|
|
|
|
|
|
|
|
|
|
|
|
|
|
|
|
|
Office |
|
| 145,072 |
|
|
| 24,329 |
|
|
| 19,805 |
|
|
| 74,663 |
|
|
| 6,136 |
|
|
| 20,139 |
|
Churches |
|
| 92,059 |
|
|
| 17,082 |
|
|
| 658 |
|
|
| 46,753 |
|
|
| 19,883 |
|
|
| 7,683 |
|
Industrial warehouses |
|
| 138,536 |
|
|
| 8,932 |
|
|
| 3,557 |
|
|
| 56,904 |
|
|
| 13,785 |
|
|
| 55,358 |
|
Health care |
|
| 113,702 |
|
|
| 23,372 |
|
|
| 4,019 |
|
|
| 67,488 |
|
|
| 4,373 |
|
|
| 14,450 |
|
Convenience stores |
|
| 104,740 |
|
|
| 10,200 |
|
|
| 12,623 |
|
|
| 54,222 |
|
|
| 1,298 |
|
|
| 26,397 |
|
Retail |
|
| 43,132 |
|
|
| 5,877 |
|
|
| 6,756 |
|
|
| 22,040 |
|
|
| 1,830 |
|
|
| 6,629 |
|
Restaurants |
|
| 33,908 |
|
|
| 2,848 |
|
|
| 702 |
|
|
| 26,484 |
|
|
| 1,922 |
|
|
| 1,952 |
|
Auto dealerships |
|
| 31,486 |
|
|
| 8,949 |
|
|
| 34 |
|
|
| 12,828 |
|
|
| 9,675 |
|
|
| — |
|
Other |
|
| 149,204 |
|
|
| 17,940 |
|
|
| 7,123 |
|
|
| 75,978 |
|
|
| 14,667 |
|
|
| 33,496 |
|
Total owner-occupied loans |
|
| 851,839 |
|
|
| 119,529 |
|
|
| 55,277 |
|
|
| 437,360 |
|
|
| 73,569 |
|
|
| 166,104 |
|
Loans secured by nonfarm, nonresidential properties |
| $ | 2,193,823 |
|
| $ | 368,337 |
|
| $ | 213,404 |
|
| $ | 947,708 |
|
| $ | 151,526 |
|
| $ | 512,848 |
|
52
Due to the short-term nature of most commercial real estate lendingTrustmark’s variable rate LHFI are based primarily on various prime and the practice of annual renewal of commercial lines of credit, approximately one-third of Trustmark’s portfolio matures in less than one year. Such a short-term maturity profile is not unusual for a
58
commercial bank and provides Trustmark the opportunity to obtain updated financial information from its borrowers and to actively monitor its borrowers’ creditworthiness. This maturity profile is well matched with many of Trustmark’s sources of funding, which are also short-term in nature.
SOFR interest rate bases. The following table provides information regarding Trustmark’s LHFI maturities by loan typeclass and interest rate terms at December 31, 20172023 ($ in thousands):
|
| Maturing |
| |||||||||||||||||
|
|
|
|
| One Year |
|
| Five Years |
|
|
|
|
|
|
| |||||
|
| Within |
|
| Through |
|
| Through |
|
| After |
|
|
|
| |||||
|
| One Year |
|
| Five |
|
| Fifteen |
|
| Fifteen |
|
|
|
| |||||
|
| or Less |
|
| Years |
|
| Years |
|
| Years |
|
| Total |
| |||||
Loans secured by real estate: |
|
|
|
|
|
|
|
|
|
|
|
|
|
|
| |||||
Construction, land development and other land |
| $ | 412,967 |
|
| $ | 192,672 |
|
| $ | 19,576 |
|
| $ | 17,671 |
|
| $ | 642,886 |
|
Other secured by 1-4 family residential properties |
|
| 56,969 |
|
|
| 238,281 |
|
|
| 310,411 |
|
|
| 16,736 |
|
|
| 622,397 |
|
Secured by nonfarm, nonresidential properties |
|
| 754,572 |
|
|
| 2,134,093 |
|
|
| 589,766 |
|
|
| 11,003 |
|
|
| 3,489,434 |
|
Other real estate secured |
|
| 467,767 |
|
|
| 783,585 |
|
|
| 61,183 |
|
|
| 16 |
|
|
| 1,312,551 |
|
Other loans secured by real estate: |
|
|
|
|
|
|
|
|
|
|
|
|
|
|
| |||||
Other construction |
|
| 85,609 |
|
|
| 756,987 |
|
|
| 25,197 |
|
|
| — |
|
|
| 867,793 |
|
Secured by 1-4 family residential properties |
|
| 32,907 |
|
|
| 173,694 |
|
|
| 1,042,746 |
|
|
| 1,032,971 |
|
|
| 2,282,318 |
|
Commercial and industrial loans |
|
| 394,100 |
|
|
| 1,407,426 |
|
|
| 121,384 |
|
|
| — |
|
|
| 1,922,910 |
|
Consumer loans |
|
| 47,201 |
|
|
| 112,881 |
|
|
| 5,652 |
|
|
| — |
|
|
| 165,734 |
|
State and other political subdivision loans |
|
| 166,048 |
|
|
| 481,354 |
|
|
| 395,030 |
|
|
| 46,034 |
|
|
| 1,088,466 |
|
Other commercial loans and leases |
|
| 82,096 |
|
|
| 353,230 |
|
|
| 120,298 |
|
|
| 411 |
|
|
| 556,035 |
|
LHFI |
| $ | 2,500,236 |
|
| $ | 6,634,203 |
|
| $ | 2,691,243 |
|
| $ | 1,124,842 |
|
| $ | 12,950,524 |
|
|
|
|
|
|
|
|
|
|
|
|
|
|
|
|
| |||||
Loans with Fixed Interest Rates |
|
|
|
|
|
|
|
|
|
|
|
|
|
|
| |||||
Loans secured by real estate: |
|
|
|
|
|
|
|
|
|
|
|
|
|
|
| |||||
Construction, land development and other land |
| $ | 66,290 |
|
| $ | 55,541 |
|
| $ | 18,641 |
|
| $ | 17,671 |
|
| $ | 158,143 |
|
Other secured by 1-4 family residential properties |
|
| 27,414 |
|
|
| 112,902 |
|
|
| 39,957 |
|
|
| 392 |
|
|
| 180,665 |
|
Secured by nonfarm, nonresidential properties |
|
| 331,490 |
|
|
| 988,144 |
|
|
| 167,304 |
|
|
| 317 |
|
|
| 1,487,255 |
|
Other real estate secured |
|
| 46,600 |
|
|
| 90,350 |
|
|
| 10,145 |
|
|
| 16 |
|
|
| 147,111 |
|
Other loans secured by real estate: |
|
|
|
|
|
|
|
|
|
|
|
|
|
|
| |||||
Other construction |
|
| 5,530 |
|
|
| 3,509 |
|
|
| 1,201 |
|
|
| — |
|
|
| 10,240 |
|
Secured by 1-4 family residential properties |
|
| 1,944 |
|
|
| 38,959 |
|
|
| 306,835 |
|
|
| 1,026,761 |
|
|
| 1,374,499 |
|
Commercial and industrial loans |
|
| 89,144 |
|
|
| 568,126 |
|
|
| 99,542 |
|
|
| — |
|
|
| 756,812 |
|
Consumer loans |
|
| 28,349 |
|
|
| 103,423 |
|
|
| 5,652 |
|
|
| — |
|
|
| 137,424 |
|
State and other political subdivision loans |
|
| 164,702 |
|
|
| 454,756 |
|
|
| 376,780 |
|
|
| 25,854 |
|
|
| 1,022,092 |
|
Other commercial loans and leases |
|
| 21,019 |
|
|
| 159,494 |
|
|
| 119,506 |
|
|
| 75 |
|
|
| 300,094 |
|
LHFI |
| $ | 782,482 |
|
| $ | 2,575,204 |
|
| $ | 1,145,563 |
|
| $ | 1,071,086 |
|
| $ | 5,574,335 |
|
|
|
|
|
|
|
|
|
|
|
|
|
|
|
|
| |||||
Loans with Variable Interest Rates |
|
|
|
|
|
|
|
|
|
|
|
|
|
|
| |||||
Loans secured by real estate: |
|
|
|
|
|
|
|
|
|
|
|
|
|
|
| |||||
Construction, land development and other land |
| $ | 346,677 |
|
| $ | 137,131 |
|
| $ | 935 |
|
| $ | — |
|
| $ | 484,743 |
|
Other secured by 1-4 family residential properties |
|
| 29,555 |
|
|
| 125,379 |
|
|
| 270,454 |
|
|
| 16,344 |
|
|
| 441,732 |
|
Secured by nonfarm, nonresidential properties |
|
| 423,082 |
|
|
| 1,145,949 |
|
|
| 422,462 |
|
|
| 10,686 |
|
|
| 2,002,179 |
|
Other real estate secured |
|
| 421,167 |
|
|
| 693,235 |
|
|
| 51,038 |
|
|
| — |
|
|
| 1,165,440 |
|
Other loans secured by real estate: |
|
|
|
|
|
|
|
|
|
|
|
|
|
|
| |||||
Other construction |
|
| 80,079 |
|
|
| 753,478 |
|
|
| 23,996 |
|
|
| — |
|
|
| 857,553 |
|
Secured by 1-4 family residential properties |
|
| 30,963 |
|
|
| 134,735 |
|
|
| 735,911 |
|
|
| 6,210 |
|
|
| 907,819 |
|
Commercial and industrial loans |
|
| 304,956 |
|
|
| 839,300 |
|
|
| 21,842 |
|
|
| — |
|
|
| 1,166,098 |
|
Consumer loans |
|
| 18,852 |
|
|
| 9,458 |
|
|
| — |
|
|
| — |
|
|
| 28,310 |
|
State and other political subdivision loans |
|
| 1,346 |
|
|
| 26,598 |
|
|
| 18,250 |
|
|
| 20,180 |
|
|
| 66,374 |
|
Other commercial loans and leases |
|
| 61,077 |
|
|
| 193,736 |
|
|
| 792 |
|
|
| 336 |
|
|
| 255,941 |
|
LHFI |
| $ | 1,717,754 |
|
| $ | 4,058,999 |
|
| $ | 1,545,680 |
|
| $ | 53,756 |
|
| $ | 7,376,189 |
|
|
| Maturing |
| |||||||||||||
|
|
|
|
|
| One Year |
|
|
|
|
|
|
|
|
| |
|
| Within |
|
| Through |
|
| After |
|
|
|
|
| |||
|
| One Year |
|
| Five |
|
| Five |
|
|
|
|
| |||
|
| or Less |
|
| Years |
|
| Years |
|
| Total |
| ||||
Loans secured by real estate: |
|
|
|
|
|
|
|
|
|
|
|
|
|
|
|
|
Construction, land development and other land |
| $ | 606,224 |
|
| $ | 327,854 |
|
| $ | 53,546 |
|
| $ | 987,624 |
|
Secured by 1-4 family residential properties |
|
| 536,948 |
|
|
| 203,319 |
|
|
| 935,044 |
|
|
| 1,675,311 |
|
Other real estate secured |
|
| 1,025,695 |
|
|
| 1,354,432 |
|
|
| 331,652 |
|
|
| 2,711,779 |
|
Commercial and industrial loans |
|
| 778,892 |
|
|
| 656,533 |
|
|
| 134,920 |
|
|
| 1,570,345 |
|
Consumer loans |
|
| 46,237 |
|
|
| 118,227 |
|
|
| 7,454 |
|
|
| 171,918 |
|
Other loans |
|
| 357,823 |
|
|
| 426,567 |
|
|
| 668,600 |
|
|
| 1,452,990 |
|
LHFI |
| $ | 3,351,819 |
|
| $ | 3,086,932 |
|
| $ | 2,131,216 |
|
| $ | 8,569,967 |
|
53
Allowance for Credit Losses
LHFI
Trustmark’s ACL methodology for LHFI is based upon guidance within FASB ASC Subtopic 326-20, “Financial Instruments – Credit Losses – Measured at Amortized Cost,” as well as regulatory guidance from its primary regulator. The following table provides information regardingACL is a valuation account that is deducted from the loans’ amortized cost basis to present the net amount expected to be collected on the loans. Credit quality within the LHFI portfolio is continuously monitored by Management and is reflected within the ACL for loans. The ACL is an estimate of expected losses inherent within Trustmark’s existing LHFI portfolio. The ACL on LHFI is adjusted through the PCL, LHFI and reduced by the charge off of loan amounts, net of recoveries.
The loan loss estimation process involves procedures to appropriately consider the unique characteristics of Trustmark’s LHFI maturitiesportfolio segments. These segments are further disaggregated into loan classes, the level at which credit risk is estimated. When computing allowance levels, credit loss assumptions are estimated using a model that categorizes loan pools based on loss history, delinquency status and other credit trends and risk characteristics, including current conditions and reasonable and supportable forecasts about the future. Evaluations of the portfolio and individual credits are inherently subjective, as they require estimates, assumptions and judgments as to the facts and circumstances of particular situations.
The econometric models currently in production reflect segment or pool level sensitivities of probability of default (PD) to changes in macroeconomic variables. By measuring the relationship between defaults and changes in the economy, the quantitative reserve incorporates reasonable and supportable forecasts of future conditions that will affect the value of its assets, as required by interest rate sensitivity at December 31, 2017 ($FASB ASC Topic 326. Under stable forecasts, these linear regressions will reasonably predict a pool’s PD. However, due to the COVID-19 pandemic, the macroeconomic variables used for reasonable and supportable forecasting changed rapidly. At the current levels, it is not clear that the models currently in thousands):
|
| Maturing |
| |||||||||||||
|
|
|
|
|
| One Year |
|
|
|
|
|
|
|
|
| |
|
| Within |
|
| Through |
|
| After |
|
|
|
|
| |||
|
| One Year |
|
| Five |
|
| Five |
|
|
|
|
| |||
|
| or Less |
|
| Years |
|
| Years |
|
| Total |
| ||||
Loan Type |
|
|
|
|
|
|
|
|
|
|
|
|
|
|
|
|
Predetermined interest rates |
| $ | 1,048,420 |
|
| $ | 2,180,435 |
|
| $ | 1,972,736 |
|
| $ | 5,201,591 |
|
Floating interest rates: |
|
|
|
|
|
|
|
|
|
|
|
|
|
|
|
|
Loans which are at contractual floor |
|
| 53,695 |
|
|
| 13,584 |
|
|
| 1,805 |
|
|
| 69,084 |
|
Loans which are free to float |
|
| 2,249,704 |
|
|
| 892,913 |
|
|
| 156,675 |
|
|
| 3,299,292 |
|
Total floating interest rates |
|
| 2,303,399 |
|
|
| 906,497 |
|
|
| 158,480 |
|
|
| 3,368,376 |
|
LHFI |
| $ | 3,351,819 |
|
| $ | 3,086,932 |
|
| $ | 2,131,216 |
|
| $ | 8,569,967 |
|
production will produce reasonably representative results since the models were originally estimated using data beginning in 2004 through 2019. During this period, a traditional, albeit severe, economic recession occurred. Thus, econometric models are sensitive to similar future levels of PD.
Trustmark’s variable rate LHFIIn order to prevent the econometric models from extrapolating beyond reasonable boundaries of their input variables, Trustmark chose to establish an upper and lower limit process when applying the periodic forecasts. In this way, Management will not rely upon unobserved and untested relationships in the setting of the quantitative reserve. This approach applies to all input variables, including: Southern Unemployment, National Unemployment, National Gross Domestic Product (GDP), Southern GDP, Southern Vacancy Rate and the Prime Rate. The upper and lower limits are based primarily on various primethe distribution of the macroeconomic variable by selecting extreme percentiles at the upper and LIBORlower limits of the distribution, the 1st and 99th percentiles, respectively. These upper and lower limits are then used to calculate the PD for the forecast time period in which the forecasted values are outside of the upper and lower limit range. Due to multiple periods having a PD or loss given default (LGD) at or near zero as a result of the improving macroeconomic forecasts, Management implemented PD and LGD floors to account for the risk associated with each portfolio. The PD and LGD floors are based on Trustmark's historical loss experience and applied at a portfolio level.
The external factors qualitative factor is Management’s best judgment on the loan or pool level impact of all factors that affect the portfolio that are not accounted for using any other part of the ACL methodology (i.e., natural disasters, changes in legislation, impacts due to technology and pandemics). Trustmark's External Factor – Pandemic ensures reserve adequacy for collectively evaluated loans most likely to be impacted by the unique economic and behavioral conditions created by the COVID-19 pandemic. Additional qualitative reserves are derived based on two principles. The first is the disconnect of economic factors to Trustmark’s modeled PD (derived from the econometric models underpinning the quantitative pooled reserves). During the pandemic, extraordinary measures by the federal government were made available to consumers and businesses, including COVID-19 loan payment concessions, direct transfer payments to households, tax deferrals and reduced interest rate bases. The following tables provide information regardingrates, among others. These government interventions may have extended the interest rate termslag between economic conditions and default, relative to what was captured in the model development data. Because Trustmark’s econometric PD models rely on the observed relationship from the economic downturn from 2007 to 2009 in both timing and severity, Management does not expect the models to reflect these current conditions. For example, while the models would predict contemporaneous unemployment peaks and loan defaults, this may not occur when borrowers can request payment deferrals. Thus, for the affected population, economic conditions are not fully considered as a part of Trustmark’s LHFIquantitative reserve. The second principle is the change in risk that is identified by rating changes. As a part of Trustmark’s credit review process, loans in the affected population have been given more frequent screening to ensure accurate ratings are maintained through this dynamic period. Trustmark’s quantitative reserve does not directly address changes in ratings; thus, a migration qualitative factor was designed to work in concert with the quantitative reserve.
As discussed above, the disconnect of economic factors means that changes in rating caused by deteriorating and weak economic conditions as a result of the pandemic are not being captured in the quantitative reserve. During 2020, due to unforeseen pandemic conditions that varied from Management’s expectations, additional reserves were further dimensioned in order to appropriately reflect the risk within the portfolio related to the COVID-19 pandemic. In an effort to ensure the External Factor – Pandemic qualitative factor
54
is reasonable and supportable, historical Trustmark loss data was leveraged to construct a framework that is quantitative in nature. To dimension the additional reserve, Management uses the sensitivity of the quantitative commercial loan reserve to changes in macroeconomic conditions to apply to loans rated acceptable or better (risk rates 1-4). In addition, to account for the known changes in risk, a weighted average of the commercial loan portfolio loss rate, derived from the performance trends qualitative factor, is used to dimension additional reserves for downgraded credits. Loans rated acceptable with risk (risk rate 5) or watch (risk rate 6) received the additional reserves based on the average of the macroeconomic conditions and weighted average of the commercial loan portfolio loss rate while the loans rated special mention (risk rate 7) and substandard (risk rate 8) received additional reserves based on the weighted-average described above. During 2022, Management noted that all pass rate loans (risk rate 5 and 6) related to the External Factor - Pandemic qualitative factor either did not experience significant stress related to the pandemic or have since recovered and does not expect future stresses attributed to the pandemic that may affect these loans. As a result, Management decided to accelerate the release of the additional pandemic reserves on all pass rate loans as a result of pandemic conditions resolving. During the fourth quarter of 2023, Management decided to resolve the External Factor-Pandemic qualitative factor as a result of the remaining loan balances that were identified as COVID affected loans were immaterial from both a reserve and balance perspective. The remaining loans were incorporated back into the performance qualitative factor as a result of this resolution. Further, due to this resolution there is no longer any active External Factor as of December 31, 20172023.
During the first quarter of 2022, in order to account for the potential uncertainty related to higher prices and 2016 ($low economic growth, Trustmark chose to enact a portion of the qualitative framework, External Factor - Stagflation. Management calculated the reserve using a third-party stagflation forecast and compared it to the third-party baseline forecast used in thousands): the quantitative modeling. The weighted differential was added as qualitative reserves to account for potential uncertainty. During the fourth quarter of 2022, Management determined that the likelihood of a stagflation scenario had sufficiently diminished. Management identified that the potential had already been reduced and effectively captured within a nominally more negative baseline economic forecast. As a result, Management elected to resolve the External Factor - Stagflation and fully release the reserves.
|
| December 31, 2017 |
| |||||||||
|
| Fixed |
|
| Variable |
|
| Total |
| |||
Loans secured by real estate: |
|
|
|
|
|
|
|
|
|
|
|
|
Construction, land development and other land |
| $ | 253,744 |
|
| $ | 733,880 |
|
| $ | 987,624 |
|
Secured by 1- 4 family residential properties |
|
| 1,632,853 |
|
|
| 42,458 |
|
|
| 1,675,311 |
|
Secured by nonfarm, nonresidential properties |
|
| 1,385,217 |
|
|
| 808,606 |
|
|
| 2,193,823 |
|
Other real estate secured |
|
| 153,851 |
|
|
| 364,105 |
|
|
| 517,956 |
|
Commercial and industrial loans |
|
| 522,613 |
|
|
| 1,047,732 |
|
|
| 1,570,345 |
|
Consumer loans |
|
| 151,685 |
|
|
| 20,233 |
|
|
| 171,918 |
|
State and other political subdivision loans |
|
| 863,262 |
|
|
| 89,221 |
|
|
| 952,483 |
|
Other loans |
|
| 238,315 |
|
|
| 262,192 |
|
|
| 500,507 |
|
LHFI |
| $ | 5,201,540 |
|
| $ | 3,368,427 |
|
| $ | 8,569,967 |
|
59
| December 31, 2016 |
| ||||||||||
|
| Fixed |
|
| Variable |
|
| Total |
| |||
Loans secured by real estate: |
|
|
|
|
|
|
|
|
|
|
|
|
Construction, land development and other land |
| $ | 210,862 |
|
| $ | 620,575 |
|
| $ | 831,437 |
|
Secured by 1- 4 family residential properties |
|
| 1,616,289 |
|
|
| 43,754 |
|
|
| 1,660,043 |
|
Secured by nonfarm, nonresidential properties |
|
| 1,131,720 |
|
|
| 902,456 |
|
|
| 2,034,176 |
|
Other real estate secured |
|
| 167,250 |
|
|
| 150,898 |
|
|
| 318,148 |
|
Commercial and industrial loans |
|
| 518,125 |
|
|
| 1,010,309 |
|
|
| 1,528,434 |
|
Consumer loans |
|
| 150,304 |
|
|
| 20,258 |
|
|
| 170,562 |
|
State and other political subdivision loans |
|
| 827,969 |
|
|
| 89,546 |
|
|
| 917,515 |
|
Other loans |
|
| 191,358 |
|
|
| 199,540 |
|
|
| 390,898 |
|
LHFI |
| $ | 4,813,877 |
|
| $ | 3,037,336 |
|
| $ | 7,851,213 |
|
During 2022, Management elected to activate the nature and volume of the portfolio qualitative factor as a result of a sub-pool of the secured by 1-4 family residential properties growing to a significant size along with the underlying nature being different as well. The nature and volume of the portfolio qualitative factor utilizes a WARM methodology that uses industry data for the assumptions to support the qualitative adjustment. The industry data is used to compile a PD based on credit score ranges along with using the industry data to compile an LGD. The sub-pool of credits is then aggregated into the appropriate credit score bands in which a weighted average loss rate is calculated based on the PD and LGD for each credit score range. This weighted average loss rate is then applied to the expected balance for the sub-segment of credits. This total is then used as the qualitative reserve adjustment.
Allowance for Loan Losses, LHFI
Trustmark’s allowance for loan loss methodologyTrustmark's current quantitative methodologies do not completely incorporate changes in credit quality. As a result, Trustmark utilizes the performance trends factor. This factor is based on guidance providedmigration analyses, that allocates additional ACL to non-pass/delinquent loans within each pool. In this way, Management believes the ACL will directly reflect changes in SEC Staff Accounting Bulletin (SAB) No. 102, “Selected Loan Loss Allowance Methodology and Documentation Issues,” as well as other regulatory guidance. Trustmark’s allowance has been developed using different factors to estimate losses based upon specific evaluation of identified individual LHFI considered impaired, estimated identified losses on various pools of LHFI and/or groups of risk, rated LHFI with common risk characteristics and other external and internal factors of estimated probable losses based on other factsthe performance of the loans with a pool, whether declining or improving.
The performance trends qualitative factor is estimated by properly segmenting loan pools into risk levels by risk rating for commercial credits and circumstances. Thedelinquency status for consumer credits. A migration analysis is then performed quarterly using a third-party software and the results for each risk level of Trustmark’s allowance reflects Management’s continuing evaluation of specific credit risks, loan loss experience, currentare compiled to calculate the historical PD average for each loan portfolio growth, present economic, politicalbased on risk levels. This average historical PD rate is updated annually. For the mortgage portfolio, Trustmark uses an internal report to incorporate a roll rate method for the calculation of the PD rate. In addition, to the PD rate for each portfolio, Management incorporates the quantitative rate and regulatory conditionsthe k value derived from the Frye-Jacobs method to calculate a loss estimate that includes both PD and unidentified losses inherentLGD. The quantitative rate is used to eliminate any additional reserve that the quantitative reserve already includes. Finally, the loss estimate rate is then applied to the total balances for each risk level for each portfolio to calculate a qualitative reserve
Determining the appropriateness of the allowance is complex and requires judgment by Management about the effect of matters that are inherently uncertain. In future periods, evaluations of the overall LHFI portfolio, in light of the factors and forecasts then prevailing, may result in significant changes in the current loan portfolio. allowance and credit loss expense.
For a complete description of Trustmark’s allowance for loan lossACL methodology and the quantitative and qualitative factors included in the valuation allowance,calculation, please see Note 54 – LHFI and Allowance for LoanCredit Losses, LHFI included in Part II. Item 8. – Financial Statements and Supplementary Data of this report.
60At December 31, 2023, the ACL, LHFI was $139.4 million, an increase of $19.2 million, or 15.9%, when compared with December 31, 2022. The increase in the ACL, LHFI during 2023 was principally due to loan growth, net changes in the qualitative reserve factors, changes in the macroeconomic forecasts and extended maturities on the secured by 1-4 family residential properties portfolio resulting from lower prepayment speeds, partially offset by a decline in specific reserves for individually analyzed LHFI. Allocation of Trustmark’s ACL, LHFI represented 0.85% of commercial LHFI and 1.81% of consumer and home mortgage LHFI, resulting in an
55
ACL to total LHFI of 1.08% at December 31, 2023. This compares with an ACL to total LHFI of 0.99% at December 31, 2022, which was allocated to commercial LHFI at 0.85% and to consumer and home mortgage LHFI at 1.41%.
The table below illustrates the changes in Trustmark’s allowance for loan losses,ACL on LHFI as well as Trustmark’s loan loss experience for the periods presented ($ in thousands):
|
| Years Ended December 31, |
| |||||||||||||||||
|
| 2017 |
|
| 2016 |
|
| 2015 |
|
| 2014 |
|
| 2013 |
| |||||
Balance at beginning of period |
| $ | 71,265 |
|
| $ | 67,619 |
|
| $ | 69,616 |
|
| $ | 66,448 |
|
| $ | 78,738 |
|
LHFI charged off: |
|
|
|
|
|
|
|
|
|
|
|
|
|
|
|
|
|
|
|
|
Construction, land development and other land loans |
|
| (79 | ) |
|
| (311 | ) |
|
| (2,435 | ) |
|
| (1,100 | ) |
|
| (1,441 | ) |
Loans secured by 1-4 family residential properties |
|
| (950 | ) |
|
| (1,319 | ) |
|
| (2,473 | ) |
|
| (2,505 | ) |
|
| (1,298 | ) |
Loans secured by nonfarm, nonresidential properties |
|
| (4,231 | ) |
|
| (3,067 | ) |
|
| (1,439 | ) |
|
| (390 | ) |
|
| (1,002 | ) |
Other loans secured by real estate |
|
| (5 | ) |
|
| (27 | ) |
|
| (24 | ) |
|
| (277 | ) |
|
| (910 | ) |
Commercial and industrial loans |
|
| (8,286 | ) |
|
| (6,602 | ) |
|
| (8,081 | ) |
|
| (2,092 | ) |
|
| (1,371 | ) |
Consumer loans |
|
| (2,546 | ) |
|
| (1,864 | ) |
|
| (2,171 | ) |
|
| (1,965 | ) |
|
| (2,425 | ) |
State and other political subdivision loans |
|
| — |
|
|
| — |
|
|
| — |
|
|
| — |
|
|
| — |
|
Other loans |
|
| (5,050 | ) |
|
| (5,740 | ) |
|
| (5,846 | ) |
|
| (4,897 | ) |
|
| (5,031 | ) |
Total charge-offs |
|
| (21,147 | ) |
|
| (18,930 | ) |
|
| (22,469 | ) |
|
| (13,226 | ) |
|
| (13,478 | ) |
Recoveries on LHFI previously charged off: |
|
|
|
|
|
|
|
|
|
|
|
|
|
|
|
|
|
|
|
|
Construction, land development and other land loans |
|
| 1,428 |
|
|
| 1,380 |
|
|
| 1,773 |
|
|
| 3,608 |
|
|
| 3,077 |
|
Loans secured by 1-4 family residential properties |
|
| 1,833 |
|
|
| 1,122 |
|
|
| 920 |
|
|
| 922 |
|
|
| 427 |
|
Loans secured by nonfarm, nonresidential properties |
|
| 396 |
|
|
| 976 |
|
|
| 605 |
|
|
| 944 |
|
|
| 225 |
|
Other loans secured by real estate |
|
| 69 |
|
|
| 7 |
|
|
| 136 |
|
|
| — |
|
|
| 229 |
|
Commercial and industrial loans |
|
| 2,578 |
|
|
| 732 |
|
|
| 1,761 |
|
|
| 2,657 |
|
|
| 2,298 |
|
Consumer loans |
|
| 1,938 |
|
|
| 4,007 |
|
|
| 3,289 |
|
|
| 3,883 |
|
|
| 4,798 |
|
State and other political subdivision loans |
|
| — |
|
|
| — |
|
|
| — |
|
|
| — |
|
|
| — |
|
Other loans |
|
| 3,279 |
|
|
| 3,395 |
|
|
| 3,613 |
|
|
| 3,169 |
|
|
| 3,555 |
|
Total recoveries |
|
| 11,521 |
|
|
| 11,619 |
|
|
| 12,097 |
|
|
| 15,183 |
|
|
| 14,609 |
|
Net (charge-offs) recoveries |
|
| (9,626 | ) |
|
| (7,311 | ) |
|
| (10,372 | ) |
|
| 1,957 |
|
|
| 1,131 |
|
Provision for loan losses, LHFI |
|
| 15,094 |
|
|
| 10,957 |
|
|
| 8,375 |
|
|
| 1,211 |
|
|
| (13,421 | ) |
Balance at end of period |
| $ | 76,733 |
|
| $ | 71,265 |
|
| $ | 67,619 |
|
| $ | 69,616 |
|
| $ | 66,448 |
|
|
|
|
|
|
|
|
|
|
|
|
|
|
|
|
|
|
|
|
|
|
Percentage of net charge-offs (recoveries) during period to average loans (LHFS and LHFI) outstanding during the period |
|
| 0.11 | % |
|
| 0.10 | % |
|
| 0.15 | % |
|
| -0.03 | % |
|
| -0.02 | % |
|
| Years Ended December 31, |
| |||||||||
|
| 2023 |
|
| 2022 |
|
| 2021 |
| |||
Balance at beginning of period |
| $ | 120,214 |
|
| $ | 99,457 |
|
| $ | 117,306 |
|
LHFI charged off |
|
| (17,515 | ) |
|
| (11,332 | ) |
|
| (10,275 | ) |
Recoveries |
|
| 9,306 |
|
|
| 10,412 |
|
|
| 13,925 |
|
Net (charge-offs) recoveries |
|
| (8,209 | ) |
|
| (920 | ) |
|
| 3,650 |
|
PCL, LHFI |
|
| 27,362 |
|
|
| 21,677 |
|
|
| (21,499 | ) |
Balance at end of period |
| $ | 139,367 |
|
| $ | 120,214 |
|
| $ | 99,457 |
|
At December 31, 2017, the allowanceCharge-offs exceeded recoveries for loan losses, LHFI, was $76.7 million, an increase2023 resulting in net charge-offs of $5.5$8.2 million, or 7.7%0.06% of average loans (LHFS and LHFI), when compared with December 31, 2016.to net charge-offs of $920 thousand, or 0.01% of average loans (LHFS and LHFI), in 2022, and net recoveries of $3.7 million, or -0.04% of average loans (LHFS and LHFI), in 2021. The increase in the allowance for loan lossnet charge-offs during 20172023 was principally due to an increaseincreases in quantitative reserves for commercial LHFIcharge-offs in Trustmark’sthe Texas, Mississippi and TexasAlabama market regions as well as qualitative reservesdeclines in recoveries in the Alabama, Mississippi and Florida market region,regions, partially offset by a declinean increase in recoveries in the required specific reserve for impaired LHFI in the MississippiTennessee market region. Total allowance coverage of nonperforming LHFI, excluding specifically reviewed impaired LHFI, increased to 320.84% at December 31, 2017, compared to 267.40% at December 31, 2016 due to a $7.2 million, or 10.5%, increase in the allowance for loan losses, LHFI excluding the specific reserves for impaired LHFI and a $2.0 million, or 7.9%, decrease in nonperforming LHFI excluding the specifically reviewed impaired LHFI during 2017. Allocation of Trustmark’s $76.7 million allowance for loan losses, LHFI, represented 0.95% of commercial LHFI and 0.68% of consumer and home mortgage LHFI, resulting in an allowance to total LHFI of 0.90% as of December 31, 2017. This compares with an allowance to total LHFI of 0.91% at December 31, 2016, which was allocated to commercial LHFI at 0.97% and to consumer and mortgage LHFI at 0.68%.
The following tables present changes intable presents the allowance for loan losses, LHFInet (charge-offs) recoveries by geographic market region for the periods presented ($ in thousands):
|
| Years Ended December 31, |
| |||||||||
|
| 2023 |
|
| 2022 |
|
| 2021 |
| |||
Alabama |
| $ | (873 | ) |
| $ | 2,019 |
|
| $ | 1,299 |
|
Florida |
|
| 130 |
|
|
| 652 |
|
|
| 521 |
|
Mississippi |
|
| (5,347 | ) |
|
| (2,713 | ) |
|
| (111 | ) |
Tennessee |
|
| 1,644 |
|
|
| (790 | ) |
|
| 940 |
|
Texas |
|
| (3,763 | ) |
|
| (88 | ) |
|
| 1,001 |
|
Total net (charge-offs) recoveries |
| $ | (8,209 | ) |
| $ | (920 | ) |
| $ | 3,650 |
|
|
| Year Ended December 31, 2017 |
| |||||||||||||||||||||
|
| Total |
|
| Alabama |
|
| Florida |
|
| Mississippi |
|
| Tennessee |
|
| Texas |
| ||||||
Balance at beginning of period |
| $ | 71,265 |
|
| $ | 7,188 |
|
| $ | 2,900 |
|
| $ | 43,010 |
|
| $ | 5,801 |
|
| $ | 12,366 |
|
LHFI charged-off |
|
| (21,147 | ) |
|
| (986 | ) |
|
| (339 | ) |
|
| (13,910 | ) |
|
| (1,157 | ) |
|
| (4,755 | ) |
Recoveries |
|
| 11,521 |
|
|
| 439 |
|
|
| 3,209 |
|
|
| 6,555 |
|
|
| 764 |
|
|
| 554 |
|
Net (charge-offs) recoveries |
|
| (9,626 | ) |
|
| (547 | ) |
|
| 2,870 |
|
|
| (7,355 | ) |
|
| (393 | ) |
|
| (4,201 | ) |
Provision for loan losses, LHFI |
|
| 15,094 |
|
|
| 3,832 |
|
|
| (2,951 | ) |
|
| 8,733 |
|
|
| 19 |
|
|
| 5,461 |
|
Balance at end of period |
| $ | 76,733 |
|
| $ | 10,473 |
|
| $ | 2,819 |
|
| $ | 44,388 |
|
| $ | 5,427 |
|
| $ | 13,626 |
|
56
|
| Year Ended December 31, 2016 |
| |||||||||||||||||||||
|
| Total |
|
| Alabama |
|
| Florida |
|
| Mississippi |
|
| Tennessee |
|
| Texas |
| ||||||
Balance at beginning of period |
| $ | 67,619 |
|
| $ | 5,469 |
|
| $ | 2,766 |
|
| $ | 43,183 |
|
| $ | 5,230 |
|
| $ | 10,971 |
|
LHFI charged-off |
|
| (18,930 | ) |
|
| (1,238 | ) |
|
| (658 | ) |
|
| (10,228 | ) |
|
| (1,274 | ) |
|
| (5,532 | ) |
Recoveries |
|
| 11,619 |
|
|
| 333 |
|
|
| 2,598 |
|
|
| 6,464 |
|
|
| 948 |
|
|
| 1,276 |
|
Net (charge-offs) recoveries |
|
| (7,311 | ) |
|
| (905 | ) |
|
| 1,940 |
|
|
| (3,764 | ) |
|
| (326 | ) |
|
| (4,256 | ) |
Provision for loan losses, LHFI |
|
| 10,957 |
|
|
| 2,624 |
|
|
| (1,806 | ) |
|
| 3,591 |
|
|
| 897 |
|
|
| 5,651 |
|
Balance at end of period |
| $ | 71,265 |
|
| $ | 7,188 |
|
| $ | 2,900 |
|
| $ | 43,010 |
|
| $ | 5,801 |
|
| $ | 12,366 |
|
|
| Year Ended December 31, 2015 |
| |||||||||||||||||||||
|
| Total |
|
| Alabama |
|
| Florida |
|
| Mississippi |
|
| Tennessee |
|
| Texas |
| ||||||
Balance at beginning of period |
| $ | 69,616 |
|
| $ | 3,647 |
|
| $ | 3,920 |
|
| $ | 47,290 |
|
| $ | 5,674 |
|
| $ | 9,085 |
|
LHFI charged-off |
|
| (22,469 | ) |
|
| (1,294 | ) |
|
| (1,924 | ) |
|
| (15,848 | ) |
|
| (1,630 | ) |
|
| (1,773 | ) |
Recoveries |
|
| 12,097 |
|
|
| 349 |
|
|
| 2,892 |
|
|
| 6,361 |
|
|
| 1,105 |
|
|
| 1,390 |
|
Net (charge-offs) recoveries |
|
| (10,372 | ) |
|
| (945 | ) |
|
| 968 |
|
|
| (9,487 | ) |
|
| (525 | ) |
|
| (383 | ) |
Provision for loan losses, LHFI |
|
| 8,375 |
|
|
| 2,767 |
|
|
| (2,122 | ) |
|
| 5,380 |
|
|
| 81 |
|
|
| 2,269 |
|
Balance at end of period |
| $ | 67,619 |
|
| $ | 5,469 |
|
| $ | 2,766 |
|
| $ | 43,183 |
|
| $ | 5,230 |
|
| $ | 10,971 |
|
Charge-offs exceeded recoveriesThe following table presents selected credit ratios for 2017 resultingthe periods presented ($ in a net charge-off of $9.6 million, or 0.11%thousands):
|
| Years Ended December 31, |
| |||||||||
|
| 2023 |
|
| 2022 |
|
| 2021 |
| |||
ACL, LHFI to Total LHFI |
|
| 1.08 | % |
|
| 0.99 | % |
|
| 0.97 | % |
ACL, LHFI |
| $ | 139,367 |
|
| $ | 120,214 |
|
| $ | 99,457 |
|
LHFI |
|
| 12,950,524 |
|
|
| 12,204,039 |
|
|
| 10,247,829 |
|
|
|
|
|
|
|
|
|
|
| |||
Nonaccrual LHFI to Total LHFI |
|
| 0.77 | % |
|
| 0.53 | % |
|
| 0.61 | % |
Nonaccrual LHFI |
| $ | 100,008 |
|
| $ | 65,972 |
|
| $ | 62,698 |
|
LHFI |
|
| 12,950,524 |
|
|
| 12,204,039 |
|
|
| 10,247,829 |
|
|
|
|
|
|
|
|
|
|
| |||
ACL, LHFI to Nonaccrual LHFI |
|
| 139.36 | % |
|
| 182.22 | % |
|
| 158.63 | % |
ACL, LHFI |
| $ | 139,367 |
|
| $ | 120,214 |
|
| $ | 99,457 |
|
Nonaccrual LHFI |
|
| 100,008 |
|
|
| 65,972 |
|
|
| 62,698 |
|
|
|
|
|
|
|
|
|
|
| |||
Net (Charge-offs) Recoveries to Average LHFI |
|
|
|
|
|
|
|
|
| |||
Construction, land development and other land loans |
|
| -0.02 | % |
|
| 0.16 | % |
|
| 0.28 | % |
Net (charge-offs) recoveries |
| $ | (100 | ) |
| $ | 1,054 |
|
| $ | 1,525 |
|
Average LHFI |
|
| 652,922 |
|
|
| 655,680 |
|
|
| 551,266 |
|
Other loans secured by 1-4 family residential properties |
|
| 0.02 | % |
|
| 0.07 | % |
|
| 0.08 | % |
Net (charge-offs) recoveries |
| $ | 119 |
|
| $ | 372 |
|
| $ | 396 |
|
Average LHFI |
|
| 599,723 |
|
|
| 541,383 |
|
|
| 505,063 |
|
Loans secured by nonfarm, nonresidential properties |
|
| 0.06 | % |
|
| 0.05 | % |
|
| 0.04 | % |
Net (charge-offs) recoveries |
| $ | 2,050 |
|
| $ | 1,418 |
|
| $ | 1,076 |
|
Average LHFI |
|
| 3,455,308 |
|
|
| 3,094,532 |
|
|
| 2,846,103 |
|
Other loans secured by real estate |
|
| — |
|
|
| -0.02 | % |
|
| — |
|
Net (charge-offs) recoveries |
| $ | 28 |
|
| $ | (117 | ) |
| $ | 20 |
|
Average LHFI |
|
| 1,079,402 |
|
|
| 636,658 |
|
|
| 971,881 |
|
Other construction loans |
|
| -0.35 | % |
|
| 0.01 | % |
|
| 0.01 | % |
Net (charge-offs) recoveries |
| $ | (3,380 | ) |
| $ | 69 |
|
| $ | 47 |
|
Average LHFI |
|
| 976,849 |
|
|
| 831,435 |
|
|
| 757,716 |
|
Loans secured by 1-4 family residential properties |
|
| -0.06 | % |
|
| — |
|
|
| — |
|
Net (charge-offs) recoveries |
| $ | (1,419 | ) |
| $ | 13 |
|
| $ | (49 | ) |
Average LHFI |
|
| 2,250,931 |
|
|
| 1,881,006 |
|
|
| 1,328,220 |
|
Commercial and industrial loans |
|
| -0.06 | % |
|
| 0.02 | % |
|
| 0.03 | % |
Net (charge-offs) recoveries |
| $ | (1,095 | ) |
| $ | 284 |
|
| $ | 336 |
|
Average LHFI |
|
| 1,867,199 |
|
|
| 1,603,499 |
|
|
| 1,331,537 |
|
Consumer loans |
|
| -2.48 | % |
|
| -0.35 | % |
|
| 0.02 | % |
Net (charge-offs) recoveries |
| $ | (4,098 | ) |
| $ | (562 | ) |
| $ | 25 |
|
Average LHFI |
|
| 165,241 |
|
|
| 161,145 |
|
|
| 156,826 |
|
State and other political subdivision loans |
|
| — |
|
|
| — |
|
|
| — |
|
Net (charge-offs) recoveries |
| $ | — |
|
| $ | — |
|
| $ | — |
|
Average LHFI |
|
| 1,104,444 |
|
|
| 1,159,939 |
|
|
| 1,098,190 |
|
Other commercial loans and leases |
|
| -0.06 | % |
|
| -0.72 | % |
|
| 0.06 | % |
Net (charge-offs) recoveries |
| $ | (314 | ) |
| $ | (3,451 | ) |
| $ | 274 |
|
Average LHFI |
|
| 486,518 |
|
|
| 477,296 |
|
|
| 474,291 |
|
Total LHFI |
|
| -0.06 | % |
|
| -0.01 | % |
|
| 0.04 | % |
Net (charge-offs) recoveries |
| $ | (8,209 | ) |
| $ | (920 | ) |
| $ | 3,650 |
|
Average LHFI |
|
| 12,638,537 |
|
|
| 11,042,573 |
|
|
| 10,021,093 |
|
The PCL, LHFI for 2023 totaled 0.21% of average loans (LHFS and LHFI), compared to a net charge-off of $7.3 million, or 0.10% of average loans (LHFS and LHFI), in 2016, and a net charge-off of $10.4 million, or 0.15% of average loans (LHFS and LHFI), in 2015. The increase in net charge-offs during 2017 was principally due to an increase in charge-offs in the Mississippi market region primarily due to two large substandard credits that were charged-off during 2017. The decrease in total net charge-offs during 2016 was principally due to declines in charge-offs in the Mississippi, Florida, Tennessee and Alabama market regions partially offset by an increase in charge-offs in the Texas market region, primarily due to three large substandard credits that were charged off during 2016.
The provision for loan losses, LHFI represents the change in the estimated loan losses determined utilizing Trustmark’s allowance for loan loss methodology net of charge-offs and recoveries of LHFI charged against net income. The provision for loan losses, LHFI, for 2017 totaled 0.18% of average loans (LHFS and LHFI), compared to 0.14%0.19% of average loans (LHFS and LHFI) in 20162022 and 0.12%-0.21% of average loans (LHFS and LHFI) in 2015.2021. The increase in the provision for loan losses,PCL, LHFI for 2017 when compared to 2016 was2023 primarily due toreflected an increase in the amountrequired reserves as a result of provision required related to existing and newly impaired LHFI, and the $1.1 million of additional reserves due to the potential loss exposure caused by Hurricane Harvey. The increaseloan growth, net changes in the provision for loan losses, LHFI when 2016 is compared to 2015 primarily reflects the increasequalitative reserve factors, changes in the amount of required reserves for LHFI,macroeconomic forecasts and extended maturities on the secured by 1-4 family residential properties portfolio resulting from lower prepayment speeds, partially offset by a decline in specific reserves for individually analyzed LHFI.
57
Off-Balance Sheet Credit Exposures
Trustmark maintains a separate ACL on off-balance sheet credit exposures, including unfunded loan commitments and letters of credit, which is included on the accompanying consolidated balance sheets. Expected credit losses for off-balance sheet credit exposures are estimated by calculating a commitment usage factor over the contractual period for exposures that are not unconditionally cancellable by Trustmark. Trustmark calculates a loan pool level unfunded amount for the period. Trustmark calculates an expected funding rate each period which is applied to each pool’s unfunded commitment balances to ensure that reserves will be applied to each pool based upon balances expected to be funded based upon historical levels. Additionally, a reserve rate is applied to the unfunded commitment balance, which incorporates both quantitative and qualitative aspects of the current period’s expected credit loss rate. The reserve rate is loan pool specific and is applied to the unfunded amount to ensure loss factors, both quantitative and qualitative, are being considered on the unfunded portion of the loan pool, consistent with the methodology applied to the funded loan pools. See the section captioned “Lending Related” in Note 16 – Commitments and Contingencies included in Part II. Item 8. – Financial Statements and Supplementary Data of this report for complete description of Trustmark’s ACL methodology on off-balance sheet credit exposures.
Adjustments to the ACL on off-balance sheet credit exposures are recorded to PCL, off-balance sheet credit exposures. At December 31, 2023, the ACL on off-balance sheet credit exposures totaled $34.1 million compared to $36.8 million at December 31, 2022, a decrease of $2.8 million, or 7.5%. The PCL, off-balance sheet credit exposures totaled a negative $2.8 million for 2023, compared to a PCL, off-balance sheet credit exposures totaled $1.2 million for 2022 and a negative PCL, off-balance sheet credit exposures of $2.9 million for 2021. The release in PCL, off-balance sheet credit exposures for 2023 primarily reflected a decrease in net charge-offs and the additional provision expense recorded during 2015required reserves due to a decline in unfunded commitments partially offset by an increase in required reserves as a result of revisions tochanges in the allowance for loan loss methodology.total reserve rate.
During 2015, Trustmark made revisions to bothNonperforming Assets
The table below provides the quantitative and qualitative portionscomponents of the allowancenonperforming assets by geographic market region at December 31, 2023 and 2022 ($ in thousands):
|
| December 31, |
| |||||
|
| 2023 |
|
| 2022 |
| ||
Nonaccrual LHFI |
|
|
|
|
|
| ||
Alabama |
| $ | 23,271 |
|
| $ | 12,300 |
|
Florida |
|
| 170 |
|
|
| 227 |
|
Mississippi |
|
| 54,615 |
|
|
| 24,683 |
|
Tennessee |
|
| 1,802 |
|
|
| 5,566 |
|
Texas |
|
| 20,150 |
|
|
| 23,196 |
|
Total nonaccrual LHFI |
|
| 100,008 |
|
|
| 65,972 |
|
Other real estate |
|
|
|
|
|
| ||
Alabama |
|
| 1,397 |
|
|
| 194 |
|
Mississippi |
|
| 1,242 |
|
|
| 1,769 |
|
Tennessee |
|
| — |
|
|
| 23 |
|
Texas |
|
| 4,228 |
|
|
| — |
|
Total other real estate |
|
| 6,867 |
|
|
| 1,986 |
|
Total nonperforming assets |
| $ | 106,875 |
|
| $ | 67,958 |
|
|
|
|
|
|
|
| ||
Nonperforming assets/total loans (LHFS and LHFI) |
|
| 0.81 | % |
|
| 0.55 | % |
|
|
|
|
|
|
| ||
Loans Past Due 90 Days or More |
|
|
|
|
|
| ||
LHFI |
| $ | 5,790 |
|
| $ | 3,929 |
|
LHFS - Guaranteed GNMA services loans (1) |
| $ | 51,243 |
|
| $ | 49,320 |
|
For additional information regarding the Trustmark’s serviced GNMA loans eligible for loan loss methodology for commercial and consumer LHFI. In total, these revisions resulted in an additional provision expense of $9.5 million during 2015. For a complete description of the revisions made to Trustmark’s allowance for loan loss methodology during 2015,repurchase, please see the section captioned “Loans Held for Sale (LHFS)” included in Note 51 – Significant Accounting Policies of Part II. Item 8. – Financial Statements and Supplementary Data of this report.
58
Nonaccrual LHFI
At December 31, 2023, nonaccrual LHFI totaled $100.0 million, or 0.76% of total LHFS and LHFI, reflecting an increase of $34.0 million, or 51.6%, relative to December 31, 2022. The increase in nonaccrual LHFI was primarily as a result of three large commercial credits placed on nonaccrual as well as an increase in mortgage nonaccruals that were partially offset by other commercial credits that were foreclosed, charged off, returned to accrual or paid off.
For additional information regarding nonaccrual LHFI, see the section captioned “Nonaccrual and Past Due LHFI” in Note 4 – LHFI and Allowance for LoanCredit Losses, LHFI included in Part II. Item 8. – Financial Statements and Supplementary Data of this report.
62
Nonperforming Assets, Excluding Acquired Loans and Covered Other Real Estate
The table below provides the components of the nonperforming assets, excluding acquired loans and covered other real estate, by geographic market region for each year in the five-year period ended December 31, 2017 ($ in thousands):
|
| December 31, |
| |||||||||||||||||
|
| 2017 |
|
| 2016 |
|
| 2015 |
|
| 2014 |
|
| 2013 |
| |||||
Nonaccrual LHFI |
|
|
|
|
|
|
|
|
|
|
|
|
|
|
|
|
|
|
|
|
Alabama |
| $ | 3,083 |
|
| $ | 665 |
|
| $ | 1,776 |
|
| $ | 852 |
|
| $ | 14 |
|
Florida |
|
| 3,034 |
|
|
| 3,644 |
|
|
| 5,180 |
|
|
| 11,091 |
|
|
| 12,278 |
|
Mississippi |
|
| 49,129 |
|
|
| 37,771 |
|
|
| 40,754 |
|
|
| 57,129 |
|
|
| 42,307 |
|
Tennessee |
|
| 4,436 |
|
|
| 6,213 |
|
|
| 5,106 |
|
|
| 5,819 |
|
|
| 4,390 |
|
Texas |
|
| 7,893 |
|
|
| 941 |
|
|
| 2,496 |
|
|
| 4,452 |
|
|
| 6,249 |
|
Total nonaccrual LHFI |
|
| 67,575 |
|
|
| 49,234 |
|
|
| 55,312 |
|
|
| 79,343 |
|
|
| 65,238 |
|
Other real estate |
|
|
|
|
|
|
|
|
|
|
|
|
|
|
|
|
|
|
|
|
Alabama |
|
| 11,714 |
|
|
| 15,989 |
|
|
| 21,578 |
|
|
| 21,196 |
|
|
| 25,912 |
|
Florida |
|
| 13,937 |
|
|
| 22,582 |
|
|
| 29,579 |
|
|
| 35,324 |
|
|
| 34,480 |
|
Mississippi |
|
| 14,260 |
|
|
| 15,646 |
|
|
| 14,312 |
|
|
| 17,397 |
|
|
| 22,766 |
|
Tennessee |
|
| 2,535 |
|
|
| 6,183 |
|
|
| 9,974 |
|
|
| 10,292 |
|
|
| 12,892 |
|
Texas |
|
| 782 |
|
|
| 1,651 |
|
|
| 1,734 |
|
|
| 8,300 |
|
|
| 10,489 |
|
Total other real estate, excluding covered other real estate |
|
| 43,228 |
|
|
| 62,051 |
|
|
| 77,177 |
|
|
| 92,509 |
|
|
| 106,539 |
|
Total nonperforming assets |
| $ | 110,803 |
|
| $ | 111,285 |
|
| $ | 132,489 |
|
| $ | 171,852 |
|
| $ | 171,777 |
|
|
|
|
|
|
|
|
|
|
|
|
|
|
|
|
|
|
|
|
|
|
Nonperforming assets/total loans (LHFS and LHFI) and ORE |
|
| 1.26 | % |
|
| 1.38 | % |
|
| 1.81 | % |
|
| 2.57 | % |
|
| 2.84 | % |
|
|
|
|
|
|
|
|
|
|
|
|
|
|
|
|
|
|
|
|
|
Loans Past Due 90 days or more |
|
|
|
|
|
|
|
|
|
|
|
|
|
|
|
|
|
|
|
|
LHFI |
| $ | 2,171 |
|
| $ | 1,832 |
|
| $ | 2,300 |
|
| $ | 2,764 |
|
| $ | 3,298 |
|
LHFS - Guaranteed GNMA services loans (1) |
| $ | 35,544 |
|
| $ | 28,345 |
|
| $ | 21,812 |
|
| $ | 25,943 |
|
| $ | 21,540 |
|
|
|
See the previous discussion of LHFS for more information on Trustmark’s serviced GNMA loans eligible for repurchase and the impact of Trustmark’s repurchases of delinquent mortgage loans under the GNMA optional repurchase program.
Nonaccrual LHFI
At December 31, 2017, nonaccrual LHFI totaled $67.6 million, or 0.77% of total LHFS and LHFI, reflecting an increase of $18.3 million, or 0.23% of total LHFS and LHFI, relative to December 31, 2016. The increase in nonaccrual LHFI was principally due to three large substandard credits moving to nonaccrual status during 2017. As of December 31, 2017, nonaccrual energy-related LHFI totaled $22.0 million and represented 9.7% of Trustmark’s total energy-related portfolio, compared to $11.4 million, or 4.2% of Trustmark’s total energy-related portfolio at December 31, 2016. For additional information regarding nonaccrual LHFI, see the section captioned “Nonaccrual LHFI” in Note 5 – LHFI and Allowance for Loan Losses, LHFI included in Part II. Item 8. – Financial Statements and Supplementary Data of this report.
63
The following table illustrates nonaccrual LHFI by loan type for each year in the five-year period ended December 31, 2017 ($ in thousands):
|
| December 31, |
| |||||||||||||||||
|
| 2017 |
|
| 2016 |
|
| 2015 |
|
| 2014 |
|
| 2013 |
| |||||
Loans secured by real estate: |
|
|
|
|
|
|
|
|
|
|
|
|
|
|
|
|
|
|
|
|
Construction, land development and other land |
| $ | 2,105 |
|
| $ | 3,323 |
|
| $ | 6,123 |
|
| $ | 13,867 |
|
| $ | 13,327 |
|
Secured by 1-4 family residential properties |
|
| 19,022 |
|
|
| 20,329 |
|
|
| 23,079 |
|
|
| 25,621 |
|
|
| 21,603 |
|
Secured by nonfarm, nonresidential properties |
|
| 12,608 |
|
|
| 8,482 |
|
|
| 17,800 |
|
|
| 25,717 |
|
|
| 21,809 |
|
Other real estate secured |
|
| 212 |
|
|
| 402 |
|
|
| 145 |
|
|
| 1,318 |
|
|
| 1,327 |
|
Commercial and industrial loans |
|
| 33,338 |
|
|
| 15,824 |
|
|
| 7,622 |
|
|
| 12,104 |
|
|
| 6,286 |
|
Consumer loans |
|
| 135 |
|
|
| 300 |
|
|
| 31 |
|
|
| 88 |
|
|
| 151 |
|
State and other political subdivision loans |
|
| — |
|
|
| — |
|
|
| — |
|
|
| — |
|
|
| — |
|
Other loans |
|
| 155 |
|
|
| 574 |
|
|
| 512 |
|
|
| 628 |
|
|
| 735 |
|
Total nonaccrual LHFI |
| $ | 67,575 |
|
| $ | 49,234 |
|
| $ | 55,312 |
|
| $ | 79,343 |
|
| $ | 65,238 |
|
Other Real Estate, Excluding Covered Other Real Estate
Other real estate, excluding covered other real estate at December 31, 2017 decreased $18.82023 increased $4.9 million or 30.3%, when compared with December 31, 2016. The decrease in other real estate, excluding covered other real estate, during 2017 was primarily2022, principally due to properties soldforeclosed in all five market of Trustmark’s market regions as well as write-downs of properties in Trustmark’sthe Texas, Mississippi Florida and Alabama market regions partially offset by properties foreclosedsold in all fiveTrustmark’s Mississippi market regions.region.
On July 1, 2016, $388 thousand of covered other real estate was transferred to other real estate, excluding covered other real estate, as a result of the expiration of a loss-share agreement with the FDIC on June 30, 2016. At December 31, 2017 and 2016, Trustmark had no covered other real estate. The remaining loss-share agreement with the FDIC, which covers loans secured by 1-4 family residential properties, will expire in 2021. Should a loan covered by the remaining loss-share agreement be foreclosed, the related property would be classified as covered other real estate.
The following tables illustrate changes in other real estate, excluding covered other real estate by geographic market region for the periods presented ($ in thousands):
|
| Year Ended December 31, 2017 |
| |||||||||||||||||||||
|
| Total |
|
| Alabama |
|
| Florida |
|
| Mississippi |
|
| Tennessee |
|
| Texas |
| ||||||
Balance at beginning of period |
| $ | 62,051 |
|
| $ | 15,989 |
|
| $ | 22,582 |
|
| $ | 15,646 |
|
| $ | 6,183 |
|
| $ | 1,651 |
|
Additions |
|
| 9,235 |
|
|
| 1,226 |
|
|
| 504 |
|
|
| 5,970 |
|
|
| 753 |
|
|
| 782 |
|
Disposals |
|
| (24,762 | ) |
|
| (4,562 | ) |
|
| (7,993 | ) |
|
| (6,183 | ) |
|
| (4,373 | ) |
|
| (1,651 | ) |
Write-downs |
|
| (3,296 | ) |
|
| (939 | ) |
|
| (1,156 | ) |
|
| (1,173 | ) |
|
| (28 | ) |
|
| — |
|
Balance at end of period |
| $ | 43,228 |
|
| $ | 11,714 |
|
| $ | 13,937 |
|
| $ | 14,260 |
|
| $ | 2,535 |
|
| $ | 782 |
|
|
| Year Ended December 31, 2016 |
| |||||||||||||||||||||
|
| Total |
|
| Alabama |
|
| Florida |
|
| Mississippi |
|
| Tennessee |
|
| Texas |
| ||||||
Balance at beginning of period |
| $ | 77,177 |
|
| $ | 21,578 |
|
| $ | 29,579 |
|
| $ | 14,312 |
|
| $ | 9,974 |
|
| $ | 1,734 |
|
Additions |
|
| 24,348 |
|
|
| 2,363 |
|
|
| 10,523 |
|
|
| 9,514 |
|
|
| 1,849 |
|
|
| 99 |
|
Disposals |
|
| (35,075 | ) |
|
| (6,934 | ) |
|
| (16,815 | ) |
|
| (6,841 | ) |
|
| (4,303 | ) |
|
| (182 | ) |
Write-downs |
|
| (4,399 | ) |
|
| (1,018 | ) |
|
| (705 | ) |
|
| (1,339 | ) |
|
| (1,337 | ) |
|
| — |
|
Balance at end of period |
| $ | 62,051 |
|
| $ | 15,989 |
|
| $ | 22,582 |
|
| $ | 15,646 |
|
| $ | 6,183 |
|
| $ | 1,651 |
|
|
| Year Ended December 31, 2015 |
| |||||||||||||||||||||
|
| Total |
|
| Alabama |
|
| Florida |
|
| Mississippi |
|
| Tennessee |
|
| Texas |
| ||||||
Balance at beginning of period |
| $ | 92,509 |
|
| $ | 21,196 |
|
| $ | 35,324 |
|
| $ | 17,397 |
|
| $ | 10,292 |
|
| $ | 8,300 |
|
Additions |
|
| 33,396 |
|
|
| 8,791 |
|
|
| 8,330 |
|
|
| 6,004 |
|
|
| 1,374 |
|
|
| 8,897 |
|
Disposals |
|
| (45,826 | ) |
|
| (8,506 | ) |
|
| (12,689 | ) |
|
| (7,504 | ) |
|
| (1,701 | ) |
|
| (15,426 | ) |
Write-downs |
|
| (2,902 | ) |
|
| (745 | ) |
|
| (1,386 | ) |
|
| (743 | ) |
|
| 9 |
|
|
| (37 | ) |
Adjustments |
|
| — |
|
|
| 842 |
|
|
| — |
|
|
| (842 | ) |
|
| — |
|
|
| — |
|
Balance at end of period |
| $ | 77,177 |
|
| $ | 21,578 |
|
| $ | 29,579 |
|
| $ | 14,312 |
|
| $ | 9,974 |
|
| $ | 1,734 |
|
|
| Year Ended December 31, 2023 |
| |||||||||||||||||
|
| Total |
|
| Alabama |
|
| Mississippi |
|
| Tennessee |
|
| Texas |
| |||||
Balance at beginning of period |
| $ | 1,986 |
|
| $ | 194 |
|
| $ | 1,769 |
|
| $ | 23 |
|
| $ | — |
|
Additions |
|
| 7,237 |
|
|
| 1,073 |
|
|
| 1,706 |
|
|
| 230 |
|
|
| 4,228 |
|
Disposals |
|
| (2,555 | ) |
|
| (194 | ) |
|
| (2,108 | ) |
|
| (253 | ) |
|
| — |
|
Net (write-downs) recoveries |
|
| 199 |
|
|
| 324 |
|
|
| (125 | ) |
|
| — |
|
|
| — |
|
Balance at end of period |
| $ | 6,867 |
|
| $ | 1,397 |
|
| $ | 1,242 |
|
| $ | — |
|
| $ | 4,228 |
|
|
| Year Ended December 31, 2022 |
| |||||||||||||||||
|
| Total |
|
| Alabama |
|
| Mississippi |
|
| Tennessee |
|
| Texas |
| |||||
Balance at beginning of period |
| $ | 4,557 |
|
| $ | — |
|
| $ | 4,557 |
|
| $ | — |
|
| $ | — |
|
Additions |
|
| 1,533 |
|
|
| 151 |
|
|
| 1,359 |
|
|
| 23 |
|
|
| — |
|
Disposals |
|
| (4,142 | ) |
|
| (48 | ) |
|
| (4,094 | ) |
|
| — |
|
|
| — |
|
Net (write-downs) recoveries |
|
| 38 |
|
|
| 91 |
|
|
| (53 | ) |
|
| — |
|
|
| — |
|
Balance at end of period |
| $ | 1,986 |
|
| $ | 194 |
|
| $ | 1,769 |
|
| $ | 23 |
|
| $ | — |
|
|
| Year Ended December 31, 2021 |
| |||||||||||||||||
|
| Total |
|
| Alabama |
|
| Mississippi |
|
| Tennessee |
|
| Texas |
| |||||
Balance at beginning of period |
| $ | 11,651 |
|
| $ | 3,271 |
|
| $ | 8,330 |
|
| $ | 50 |
|
| $ | — |
|
Additions |
|
| 770 |
|
|
| — |
|
|
| 717 |
|
|
| 53 |
|
|
| — |
|
Disposals |
|
| (6,932 | ) |
|
| (3,063 | ) |
|
| (3,741 | ) |
|
| (128 | ) |
|
| — |
|
Net (write-downs) recoveries |
|
| (932 | ) |
|
| (208 | ) |
|
| (749 | ) |
|
| 25 |
|
|
| — |
|
Balance at end of period |
| $ | 4,557 |
|
| $ | — |
|
| $ | 4,557 |
|
| $ | — |
|
| $ | — |
|
Net recoveries of other real estate excluding covered other real estate, decreased $1.1 millionincreased $161 thousand during 2017,2023 compared to an increase of $1.5 million during 2016 and a decrease of $4.8 million during 2015. The decrease in write-downs on other real estate, excluding covered other real estate, during 2017 was principally due to declines in other real estate write-downs in the Alabama and Tennessee
64
market regions partially offset by an increase innet write-downs of other real estate of $970 thousand during 2022. The increase in net recoveries of other real estate during 2023 compared to 2022 was primarily due to a decline in write-downs on foreclosed properties in the Mississippi market region as well as an increase in recoveries at foreclosure for properties in the Alabama market region, partially offset by reserves released during 2022 as a result of properties sold in the Mississippi and FloridaAlabama market regions. The increase in write-downs on other real estate, excluding covered other real estate, during 2016 was primarily due to $2.2 million of reserves for other real estate write-downs used or released during 2015 in the Alabama, Tennessee and Mississippi market regions.
The following table illustrates other real estate excluding covered other real estate, by type of property for each year in the five-year period endedat December 31, 20172023 and 2022 ($ in thousands):
|
| December 31, |
| |||||
|
| 2023 |
|
| 2022 |
| ||
1-4 family residential properties |
| $ | 1,977 |
|
| $ | 1,128 |
|
Nonfarm, nonresidential properties |
|
| 4,835 |
|
|
| 561 |
|
Other real estate properties |
|
| 55 |
|
|
| 297 |
|
Total other real estate |
| $ | 6,867 |
|
| $ | 1,986 |
|
|
| December 31, |
| |||||||||||||||||
|
| 2017 |
|
| 2016 |
|
| 2015 |
|
| 2014 |
|
| 2013 |
| |||||
Construction, land development and other land properties |
| $ | 27,491 |
|
| $ | 36,871 |
|
| $ | 47,550 |
|
| $ | 61,015 |
|
| $ | 65,273 |
|
1-4 family residential properties |
|
| 5,081 |
|
|
| 7,926 |
|
|
| 10,732 |
|
|
| 10,150 |
|
|
| 14,696 |
|
Nonfarm, nonresidential properties |
|
| 10,468 |
|
|
| 16,817 |
|
|
| 16,717 |
|
|
| 19,696 |
|
|
| 26,433 |
|
Other real estate properties |
|
| 188 |
|
|
| 437 |
|
|
| 2,178 |
|
|
| 1,648 |
|
|
| 137 |
|
Total other real estate, excluding covered other real estate |
| $ | 43,228 |
|
| $ | 62,051 |
|
| $ | 77,177 |
|
| $ | 92,509 |
|
| $ | 106,539 |
|
59
Deposits
For additional information regarding other real estate, including covered other real estate, see Note 10 – Other Real Estate included in Part II. Item 8. – Financial Statements and Supplementary Data of this report.
Acquired Loans
During the first quarter of 2017, Trustmark modified the presentation of the acquired loans disclosures to eliminate the segmentation of acquired noncovered loans and acquired covered loans due to the significantly reduced size of the acquired covered loan portfolio. Trustmark’s loss share agreement with the FDIC covering the acquired covered loans other than loans secured by 1-4 family residential properties expired on June 30, 2016. Trustmark’s loss share agreement with the FDIC covering the acquired covered loans secured by 1-4 family residential properties will expire in 2021. Effective July 1, 2016, all acquired covered loans excluding the acquired covered loans secured by 1-4 family residential properties were reclassified to acquired noncovered loans. The revised presentation reflects total acquired loan information in the accompanying consolidated balance sheets and tables below. All prior period information has been reclassified to conform to the current period presentation.
The table below provides the carrying value of the acquired loan portfolio by loan type for each year of the five-year period ended December 31, 2017 ($ in thousands):
|
| December 31, |
| |||||||||||||||||
|
| 2017 |
|
| 2016 |
|
| 2015 |
|
| 2014 |
|
| 2013 |
| |||||
Loans secured by real estate: |
|
|
|
|
|
|
|
|
|
|
|
|
|
|
|
|
|
|
|
|
Construction, land development and other land |
| $ | 23,586 |
|
| $ | 20,850 |
|
| $ | 42,644 |
|
| $ | 59,506 |
|
| $ | 101,291 |
|
Secured by 1-4 family residential properties |
|
| 61,751 |
|
|
| 69,540 |
|
|
| 97,008 |
|
|
| 130,100 |
|
|
| 174,330 |
|
Secured by nonfarm, nonresidential properties |
|
| 114,694 |
|
|
| 103,820 |
|
|
| 140,264 |
|
|
| 209,995 |
|
|
| 298,081 |
|
Other real estate secured |
|
| 16,746 |
|
|
| 19,010 |
|
|
| 25,146 |
|
|
| 28,909 |
|
|
| 36,592 |
|
Commercial and industrial loans |
|
| 31,506 |
|
|
| 36,896 |
|
|
| 55,699 |
|
|
| 88,533 |
|
|
| 149,889 |
|
Consumer loans |
|
| 2,600 |
|
|
| 3,365 |
|
|
| 5,641 |
|
|
| 9,772 |
|
|
| 18,547 |
|
Other loans |
|
| 10,634 |
|
|
| 18,766 |
|
|
| 24,009 |
|
|
| 22,594 |
|
|
| 25,476 |
|
Acquired loans |
|
| 261,517 |
|
|
| 272,247 |
|
|
| 390,411 |
|
|
| 549,409 |
|
|
| 804,206 |
|
Less allowance for loan losses, acquired loans |
|
| 4,079 |
|
|
| 11,397 |
|
|
| 11,992 |
|
|
| 12,059 |
|
|
| 9,636 |
|
Net acquired loans |
| $ | 257,438 |
|
| $ | 260,850 |
|
| $ | 378,419 |
|
| $ | 537,350 |
|
| $ | 794,570 |
|
During 2017, acquired loans declined $10.7 million, or 3.9%, compared to balances at December 31, 2016. During the first quarter of 2017, Trustmark reclassified $36.7 million of acquired loans not accounted for under FASB ASC Topic 310-30 to LHFI due to the discount on these loans being fully amortized. Additionally, acquired loans as of December 31, 2017 included $86.2 million of loans acquired in the Reliance merger completed on April 7, 2017. Excluding the reclassified acquired loans and the loans acquired in the Reliance merger, acquired loans decreased $60.2 million, or 22.1%, during 2017, primarily due to pay-downs and pay-offs of these acquired loans. Based on the most recent re-estimation of expected cash flows, Trustmark anticipates that acquired loan balances, excluding any settlement of debt, will decline approximately $15.0 million to $25.0 million during the first quarter of 2018. Trustmark also expects the yield on the acquired loans, excluding any recoveries, to be approximately 6.0% to 7.0% for the first quarter of 2018. As the balances in the acquired loan portfolio continue to run-off, Trustmark expects that the income benefit provided by this portfolio will also decline.
Loans acquired in the Reliance merger were evaluated using a fair value process to determine the degree of credit deterioration since origination and the collectibility of contractually required payments. Approximately $7.9 million of the loans acquired in the Reliance
65
merger exhibited evidence of significant credit deterioration since origination and for which it was probable at acquisition that Trustmark would not be able to collect all contractually required payments. These loans are accounted for as acquired impaired loans under FASB ASC Topic 310-30.
For additional information regarding acquired loans, including changes in the net carrying value, see Note 6 – Acquired Loans included in Part II. Item 8. – Financial Statements and Supplementary Data of this report.
Deposits
Trustmark’s deposits are its primary source of funding and consist primarily of core deposits from the communities Trustmark serves. Deposits include interest-bearing and noninterest-bearing demand accounts, savings, money market,MMDA, certificates of deposit and individual retirement accounts. Total deposits were $10.578$15.570 billion at December 31, 20172023 compared to $10.056$14.438 billion at December 31, 2016,2022, an increase of $521.5$1.132 billion, or 7.8%, primarily reflecting an increase in interest-bearing deposits partially offset by a decrease in noninterest-bearing deposit accounts. During 2023, noninterest-bearing deposits decreased $896.2 million, or 5.2%21.9%, as a result of declines in all categories of noninterest-bearing deposits reflecting customers' desire for higher-yielding deposit accounts. Interest-bearing deposits increased $2.028 billion, or 19.6%, during 2023, primarily due to growth in interest-bearing deposits. During 2017, noninterest-bearing deposits increased $4.8CDs, which was principally attributable to deposit campaigns offered during 2023 and the addition of $578.8 million or 0.2%, primarily due to growth in publicof brokered CDs, business and consumer demand depositMMDA and business interest checking accounts, while interest-bearing deposits increased $516.7 million, or 7.3%, primarily due to growthpartially offset by declines in all categories of interest-bearing deposits with the exception ofconsumer and public interest checking accounts and money market accounts, reflecting the increase in interest rates in general and the Reliance merger. consumer savings accounts.
At December 31, 2017, the balance2023, Trustmark's total uninsured deposits were $5.601 billion, or 36.0% of total deposits, for branches associated with the Reliance merger was $163.6 million. Excluding these Reliance deposits,compared to $5.831 billion, or 40.4% of total deposits, at December 31, 2017 increased $357.9 million, or 3.6%.2022.
Short-term BorrowingsThe maturities of time deposits that exceed the FDIC insurance limit of $250 thousand at December 31, 2023 are as follows ($ in thousands):
Three months or less |
| $ | 355,175 |
|
Over three months through six months |
|
| 286,191 |
|
Over six months through twelve months |
|
| 153,104 |
|
Over twelve months |
|
| 27,961 |
|
Total time deposits in excess of FDIC insurance limit |
| $ | 822,431 |
|
Borrowings
Trustmark uses short-term borrowings, such as federal funds purchased, securities sold under repurchase agreements and short-term FHLB advances, to fund growth of earning assets in excess of deposit growth. Short-term borrowings consist primarilySee the section captioned “Liquidity” for further discussion of federal funds purchased, securities sold under repurchase agreements, short-term FHLB advances and GNMA optional repurchase loans. Short-term borrowings totaled $1.441 billion at December 31, 2017, an increasethe components of $131.3 million, or 10.0%, when compared with $1.310 billion at December 31, 2016, primarily due to an increase in the outstanding balance of short-term FHLB advances as Trustmark continues to utilize thisTrustmark’s excess funding source to fund the difference between loan and deposit growth. Short-term FHLB advances increased $200.0 million during 2017 as a result of a $450.0 million increase in outstanding short-term advances with the FHLB of Dallas as well as the $250.0 million long-term FHLB advance with the FHLB of Dallas which was reclassified to short-term in May 2017 partially offset by the $500.0 million advance with the FHLB of Dallas that matured in December 2017. capacity.
Federal funds purchased and securities sold under repurchase agreements totaled $469.8$405.7 million at December 31, 20172023 compared to $539.8$449.3 million at December 31, 2016,2022, a decrease of $70.0$43.6 million, or 13.0%9.7%. Of these amounts $139.8At December 31, 2023 and 2022, $35.7 million and $140.5$66.3 million, respectively, represented customer related transactions, such as commercial sweep repurchase balances. Excluding customer related transactions,Trustmark had $370.0 million of upstream federal funds purchased totaled $330.0at December 31, 2023, compared to $383.0 million at December 31, 2017, a decrease of $69.4 million when compared with $399.42022.
Other borrowings totaled $483.2 million at December 31, 2016.
The table below presents information concerning qualifying components of Trustmark’s short-term borrowings for each of the last three years ($ in thousands):
|
| 2017 |
|
| 2016 |
|
| 2015 |
| |||
Federal funds purchased and securities sold under repurchase agreements: |
|
|
|
|
|
|
|
|
|
|
|
|
Amount outstanding at end of period |
| $ | 469,827 |
|
| $ | 539,817 |
|
| $ | 441,042 |
|
Weighted average interest rate at end of period |
|
| 1.06 | % |
|
| 0.52 | % |
|
| 0.25 | % |
Maximum amount outstanding at any month end during each period |
| $ | 620,698 |
|
| $ | 606,336 |
|
| $ | 673,360 |
|
Average amount outstanding during each period |
|
| 512,085 |
|
|
| 495,197 |
|
|
| 503,077 |
|
Weighted average interest rate during each period |
|
| 0.81 | % |
|
| 0.35 | % |
|
| 0.16 | % |
|
|
|
|
|
|
|
|
|
|
|
|
|
Short-term borrowings: |
|
|
|
|
|
|
|
|
|
|
|
|
Amount outstanding at end of period |
| $ | 971,049 |
|
| $ | 769,778 |
|
| $ | 412,617 |
|
Weighted average interest rate at end of period |
|
| 1.35 | % |
|
| 0.72 | % |
|
| 0.58 | % |
Maximum amount outstanding at any month end during each period |
| $ | 1,423,787 |
|
| $ | 769,778 |
|
| $ | 858,827 |
|
Average amount outstanding during each period |
|
| 1,138,353 |
|
|
| 370,008 |
|
|
| 415,081 |
|
Weighted average interest rate during each period |
|
| 1.14 | % |
|
| 1.00 | % |
|
| 0.69 | % |
Long-term FHLB Advances
Long-term FHLB advances totaled $946 thousand at December 31, 2017,2023, a decrease of $250.1$567.7 million, or 99.6%54.0%, when compared with $251.0 million$1.051 billion at December 31, 2016. During May of 2016, Trustmark2022, principally due to a decline in outstanding short-term FHLB advances obtained a $250.0 million variable rate long-term FHLB advance with a two-year maturity from the FHLB of Dallas. As noted above, during May 2017, the $250.0 million long-term FHLB
66
advance was reclassified from long-term to short-term. Trustmark chose to utilize FHLB advances with the FHLB of Dallas as a funding source for loan growth due to the advantageous rates available in comparison to other sources of funding. For additional information regarding Trustmark’s long-term FHLB advances, please see the section captioned “Liquidity.”
Benefit Plans
Defined Benefit Plans
As disclosed in Note 14 – Defined Benefit and Other Postretirement Benefits included in Part II. Item 8. – Financial Statements and Supplementary Data of this report, Trustmark maintainedmaintains a noncontributory tax-qualified defined benefit pension plan titled the Trustmark Corporation Pension Plan in which substantially all associates who began employment priorfor Certain Employees of Acquired Financial Institutions (the Continuing Plan) to 2007 participated. The Plan provided for retirement benefits based on the length of credited service and final average compensation, as defined in the Plan, which vested upon three years of service. Benefit accruals under the Plan were frozen in 2009, with the exception of benefit accruals for certain associates of acquired financial institutions covered through plans that were subsequently merged into the Plan. As previously reported, on July 26, 2016, the Board of Directors of Trustmark authorized the termination of the Plan, effective as of December 31, 2016.
During the second quarter of 2017, Trustmark fully funded the Plan on a termination basis by contributing additional assets in the amount of $17.6 million in accordance with the IRS and Pension Benefit Guaranty Corporation requirements. Participants in the plan elected to receive either a lump sum cash payment or annuity payments under a group annuity contract purchased from an insurance carrier. Final distributions were made to participants from plan assets and a one-time pension settlement expense was recognized totaling $17.6 million. After the distribution of plan assets during the second quarter of 2017, Trustmark estimates that the annual pension expense will be reduced by $3.0 million to $4.0 million.
Other than the associates covered through these acquired plans that were merged into the Plan, associates have not earned additional benefits, except for interest as required by law, since the Plan was frozen. Current and former associates who participated in the Plan retained their right to receive benefits that accrued before the Plan was frozen.
To satisfy commitments made by Trustmark to associates covered through plans obtained in acquisitions and subsequently merged into the Plan (collectively, the “Continuing Associates”), on July 26, 2016, the Board of Directors of Trustmark also approved the spin-off of the portion of the Plan associated with the accrued benefits of the Continuing Associates into a new plan, the Continuing Plan, effective as of December 30, 2016, immediately prior to the termination of the Plan. acquisitions.
At December 31, 2017,2023, the fair value of the Continuing Plan’s assets totaled $4.6$2.4 million and was exceeded by the projected benefit obligation of $10.1$5.9 million by $5.5$3.5 million. Net periodic benefit cost equaled $20.5$262 thousand in 2023, compared to $410 thousand in 2022 and $1.1 million in 2017, compared with $7.5 million in 2016 and $4.9 million in 2015. The increase in the net periodic benefit cost during 2017 was principally due to the $17.6 million one-time pension settlement expense as a result of the termination of the Plan. Excluding this one-time pension settlement expense, net periodic benefit cost during 2017 totaled $2.8 million.2021.
The fair value of plan assets is determined utilizing current market quotes, while the benefit obligation and periodic benefit costs are determined utilizing actuarial methodology with certain weighted-average assumptions. For 2017, 20162023, 2022 and 2015,2021, the process used to select the discount rate assumption under FASB ASC Topic 715,"Compensation-Retirement Benefits," takes into account the benefit cash flow and the segmented yields on high-quality corporate bonds that would be available to provide for the payment of the benefit cash flow. Assumptions, which have been chosen to represent the estimate of a particular event as required by GAAP, have been reviewed and approved by Management based on recommendations from its actuaries. For additional information regarding the assumptions used by Management, please refer to the section captioned “Critical Accounting Policies – Defined Benefit Plans.”
60
The range of potential contributions to the Continuing Plan is determined annually by the Continuing Plan’s actuary in accordance with applicable IRS rules and regulations. Trustmark’s policy is to fund amounts that are sufficient to satisfy the annual minimum funding requirements and do not exceed the maximum that is deductible for federal income tax purposes. The actual amount of the contribution is determined annually based on the Continuing Plan’s funded status and return on plan assets as of the measurement date, which is December 31. For the plan year ending December 31, 2017,2023, Trustmark’s minimum required contribution to the Continuing Plan was $113 thousand. During 2017,$154 thousand; however, Trustmark contributed $200$609 thousand, to$455 thousand in excess of the Continuing Plan for the plan year ended December 31 2017.minimum required. For the plan year ending December 31, 2018,2024, Trustmark’s minimum required contribution to the Continuing Plan is expected to be $175$128 thousand; however, Management and the Board of Directors of Trustmark will monitor the Continuing Plan throughout 20182024 to determine any additional funding requirements by the plan’s measurement date.
For the plan year ending December 31, 2016, Trustmark’s minimum required contribution to the Plan was zero. Since the Plan has terminated, there were no additional contributions required other than amounts necessary to facilitate the Plan termination.
67
As disclosed in Note 14 – Defined Benefit and Other Postretirement Benefits included in Part II. Item 8. – Financial Statements and Supplementary Data of this report, Trustmark maintains a nonqualified supplemental retirement plan covering key executive officers and senior officers as well as directors who have elected to defer fees. The plan provides for retirement and/or death benefits based on a participant’s covered salary or deferred fees. Although plan benefits may be paid from Trustmark’s general assets, Trustmark has purchased life insurance contracts on the participants covered under the plan, which may be used to fund future benefit payments under the plan. The annual measurement date for the plan is December 31. As a result of mergers prior to 2014, Trustmark became the administrator of small nonqualified supplemental retirement plans, for which the plan benefits were frozen prior to the merger date.dates.
At December 31, 2017,2023, the accrued benefit obligation for the supplemental retirement plans equaled $57.9$41.6 million, while the net periodic benefit cost equaled $3.4$2.5 million in 2017, $3.62023, $2.4 million in 20162022 and $3.8$2.5 million in 2015.2021. The net periodic benefit cost and projected benefit obligation are determined using actuarial assumptions as of the plans’ measurement date, which is December 31.date. The process used to select the discount rate assumption under FASB ASC Topic 715 takes into account the benefit cash flow and the segmented yields on high-quality corporate bonds that would be available to provide for the payment of the benefit cash flow. At December 31, 2017,2023, unrecognized actuarial losses and unrecognized prior service costs continue to be amortized over future service periods.
Legal Environment
Information required in this section is set forth under the heading “Legal Proceedings” of Note 16 – Commitments and Contingencies in Part II. Item 8. – Financial Statements and Supplementary Data of this report.
Off-Balance Sheet Arrangements
Information required in this section is set forth under the heading “Lending Related” of Note 16 – Commitments and Contingencies in Part II. Item 8. – Financial Statements and Supplementary Data of this report.
Contractual Obligations
Trustmark is obligated to make payments under specific long-term and certain other binding contractual arrangements. The following table provides a schedule of the amount of the payments due under those obligations as of December 31, 2017 ($ in thousands):
|
| Less than |
|
| One to Three |
|
| Three to Five |
|
| After |
|
|
|
|
| ||||
|
| One Year |
|
| Years |
|
| Years |
|
| Five Years |
|
| Total |
| |||||
Time deposits |
| $ | 1,356,448 |
|
| $ | 342,734 |
|
| $ | 57,160 |
|
| $ | 2,099 |
|
| $ | 1,758,441 |
|
Securities sold under repurchase agreements |
|
| 118,694 |
|
|
| — |
|
|
| — |
|
|
| — |
|
|
| 118,694 |
|
FHLB advances |
|
| 900,013 |
|
|
| — |
|
|
| 774 |
|
|
| 171 |
|
|
| 900,958 |
|
Junior subordinated debt securities |
|
| — |
|
|
| — |
|
|
| — |
|
|
| 61,856 |
|
|
| 61,856 |
|
Operating lease obligations |
|
| 12,031 |
|
|
| 17,078 |
|
|
| 10,236 |
|
|
| 28,518 |
|
|
| 67,863 |
|
Total |
| $ | 2,387,186 |
|
| $ | 359,812 |
|
| $ | 68,170 |
|
| $ | 92,644 |
|
| $ | 2,907,812 |
|
Capital Resources and Liquidity
At December 31, 2017,2023, Trustmark’s total shareholders’ equity was $1.572$1.662 billion, an increase of $51.5$169.6 million, or 3.4%11.4%, when compared to December 31, 2016. During 2017,2022. The increase in shareholders’ equity increasedduring 2023 was primarily as a result of net income of $105.6$165.5 million as well as an increase in the fair market value of available for sale securities, net of tax, of $38.1 million and a decrease in the unrealized net change in pension and other postretirement benefit plans of $11.5 million,holding losses on securities transferred from available for sale to held to maturity, net of tax, of $11.7 million, partially offset by common stock dividends of $62.8$56.7 million. Trustmark utilizes a capital model in order to provide Management with a monthly tool for analyzing changes in its strategic capital ratios. This allows Management to hold sufficient capital to provide for growth opportunities and protect the balance sheet against sudden adverse market conditions, while maintaining an attractive return on equity to shareholders.
Regulatory Capital
Trustmark and TNB are subject to minimum risk-based capital and leverage capital requirements, as described in the section captioned “Capital Adequacy” included in Part I. Item 1. – Business of this report, which are administered by the federal bank regulatory agencies. These capital requirements, as defined by federal regulations, involve quantitative and qualitative measures of assets, liabilities and certain off-balance sheet instruments. Trustmark’s and TNB’s minimum risk-based capital requirements include the phased ina capital conservation buffer of 1.250% and 0.625% at December 31, 2017 and 2016, respectively. AOCL2.5%. AOCI is not included in computing regulatory capital. Trustmark has elected the five-year phase-in transition period (through December 31, 2024) related to adopting FASB ASU 2016-13 for regulatory capital purposes. Failure to meet minimum capital requirements can result in certain mandatory and possibly additional discretionary actions by regulators that, if undertaken, could have a direct material effect on the financial statements of Trustmark and
68
TNB and limit Trustmark’s and TNB’s ability to pay dividends. As ofAt December 31, 2017,2023, Trustmark and TNB exceeded all applicable minimum capital standards. In addition, Trustmark and TNB met
61
applicable regulatory guidelines to be considered well-capitalized at December 31, 2017.2023. To be categorized in this manner, Trustmark and TNB maintained minimum common equity Tier 1 risk-based capital, Tier 1 risk-based capital, total risk-based capital and Tier 1 leverage ratios, and were not subject to any written agreement, order or capital directive, or prompt corrective action directive issued by their primary federal regulators to meet and maintain a specific capital level for any capital measures. There are no significant conditions or events that have occurred since December 31, 2017,2023, which Management believes have affected Trustmark’s or TNB’s present classification.
In 2020, Trustmark enhanced its capital structure with the issuance of $125.0 million of subordinated notes. At December 31, 2023 and 2022,the carrying amount of the subordinated notes was $123.5 million and $123.3 million, respectively. The subordinated notes mature December 1, 2030 and are redeemable at Trustmark’s option under certain circumstances. For regulatory capital purposes, the subordinated notes qualified as Tier 2 capital for Trustmark at December 31, 2023 and 2022. Trustmark may utilize the full carrying value of the subordinated notes as Tier 2 capital until December 1, 2025 (five years prior to maturity). Beginning December 1, 2025, the subordinated notes will phase out of Tier 2 capital 20.0% each year until maturity.
In 2006, Trustmark enhanced its capital structure with the issuance of trust preferred securities. For regulatory capital purposes, the trust preferred securities qualified as Tier 1 capital at December 31, 20172023 and 2016.2022. Trustmark intends to continue to utilize $60.0 million in trust preferred securities issued by the Trust as Tier 1 capital up to the regulatory limit, as permitted by the grandfather provision in the Dodd-Frank Act and the Basel III Final Rule.
Refer to the section captioned “Regulatory Capital” included in Note 17 – Shareholders’ Equity in Part II. Item 8. – Financial Statements and Supplementary Data of this report for an illustration of Trustmark’s and TNB’s actual regulatory capital amounts and ratios under regulatory capital standards in effect at December 31, 20172023 and 2016.2022.
Dividends on Common Stock
Dividends per common share for each of the years ended December 31, 2017, 20162023, 2022 and 20152021 were $0.92. Trustmark’s dividend payout ratio for 2017, 20162023, 2022 and 20152021 was 58.97%33.95%, 57.50%78.63%, and 53.49%39.15%, respectively. The increase in the dividend payout ratio for 2022 was principally due to the $100.8 million of litigation settlement expense recorded during the fourth quarter of 2022. Since Trustmark is a holding company and does not conduct operations, its primary source of liquidity are dividends paid from TNB and borrowings from outside sources. Approval by TNB’s regulators is required if the total of all dividends declared in any calendar year exceeds the total of its net income for that year combined with its retained net income of the preceding two years. In 2024, TNB will have available in 2018 approximately $87.0$95.1 million plus its net income for that year to pay as dividends to Trustmark. The actual amount of any dividends declared in 20182024 by Trustmark will be determined by Trustmark’s Board of Directors. Trustmark’s Board of Directors declared a quarterly cash dividend of $0.23 per share payable of March 15, 2024, to shareholders of record on March 1, 2024.
LiquidityStock Repurchase Plan
From time to time, Trustmark’s Board of Directors has authorized stock repurchase plans. In general, stock repurchase plans allow Trustmark to proactively manage its capital position and return excess capital to shareholders. Shares purchased also provide Trustmark with shares of common stock necessary to satisfy obligations related to stock compensation awards. Under the stock repurchase plan effective April 1, 2020 through December 31, 2021, Trustmark repurchased approximately 1.9 million shares of its common stock valued at $61.8 million. Under the stock repurchase plan effective January 1, 2022 through December 31, 2022, Trustmark repurchased approximately 789 thousand shares of its common stock valued at $24.6 million. Under the stock repurchase plan effective January 1, 2023 through December 31, 2023, Trustmark did not repurchase any of its outstanding common stock. On December 5, 2023, the Board of Directors of Trustmark authorized a new stock repurchase program, effective January 1, 2024, under which $50.0 million of Trustmark’s outstanding common stock may be acquired through December 31, 2024. The repurchase program, which is subject to market conditions and management discretion, will be implemented through open market repurchases or privately negotiated transactions. No shares have been repurchased under this stock repurchase program.
Liquidity
Liquidity is the ability to ensure that sufficient cash flow and liquid assets are available to satisfy current and future financial obligations, including demand for loans and deposit withdrawals, funding operating costs and other corporate purposes. Consistent cash flows from operations and adequate capital provide internally generated liquidity. Furthermore, Management maintains funding capacity from a variety of external sources to meet daily funding needs, such as those required to meet deposit withdrawals, loan disbursements and security settlements. Liquidity strategy also includes the use of wholesale funding sources to provide for the seasonal fluctuations of deposit and loan demand and the cyclical fluctuations of the economy that impact the availability of funds. Management keeps excess funding capacity available to meet potential demands associated with adverse circumstances.
62
The asset side of the balance sheet provides liquidity primarily through maturities and cash flows from loans and securities as well as the ability to pledge or sell certain loans and securities while thesecurities. The liability portion of the balance sheet provides liquidity primarily through noninterest and interest-bearing deposits. Trustmark utilizes federal funds purchased, FHLB advances, securities sold under repurchase agreements, as well as the Discount Window and on a limited basis as discussed below, brokered deposits to provide additional liquidity. Access to these additional sources represents Trustmark’s incremental borrowing capacity.
Trustmark’s liquidity position is continuously monitored and adjustments are made to manage the balance as deemed appropriate. Liquidity risk management is an important element to Trustmark’s asset/liability management process. Trustmark regularly models liquidity stress scenarios to assess potential liquidity outflows or funding problems resulting from economic disruptions or other significant occurrences as deemed appropriate by Management. These scenarios are incorporated into Trustmark’s contingency funding plan, which provides the basis for the identification of its liquidity needs.
Deposit accounts represent Trustmark’s largest funding source. Average deposits totaled to $10.182$14.935 billion for 20172023 and represented approximately 74.2%80.0% of average liabilities and shareholders’ equity, compared to average deposits of $9.669$14.772 billion, which represented 74.7%84.5% of average liabilities and shareholders’ equity for 2016.2022.
Trustmark had $712.0 million held in an interest-bearing account at the FRBA at December 31, 2023, compared to $434.0 million at December 31, 2022. The increase in Trustmark's balance held at the FRBA was principally due to cash balance management at year-end.
Trustmark utilizes a limited amount of brokered deposits to supplement other wholesale funding sources. At December 31, 2017,2023, brokered sweep Money Market Deposit Account (MMDA)MMDA deposits totaled $38.6$10.6 million compared to $34.2$15.1 million at December 31, 2016.2022. In addition, Trustmark had $578.8 million of brokered CDs at December 31, 2023 compared to none at December 31, 2022. The increase in brokered CDs during 2023 was primarily due to leveraging comparatively attractive brokered CD pricing as a component of funding loan growth.
At December 31, 2017,2023, Trustmark had $330.0$370.0 million inof upstream federal funds purchased compared to $399.4$383.0 million of upstream federal funds purchased at December 31, 2016.2022. Trustmark maintains adequate federal funds lines to provide sufficient short-term liquidity.
Trustmark maintains a relationship with the FHLB of Dallas, which provided $900.0$400.0 million of outstanding short-term advances and no outstanding long-term advances at December 31, 20172023, compared to $700.0$975.0 million of outstanding short-term and no long-term FHLB advances and $250.0 million of outstanding long-term advances at December 31, 2016. The2022. Trustmark had no letters of credit outstanding short-termwith the FHLB advancesof Dallas at December 31, 2017 included the $250.0 million FHLB advance that was reclassified from long-term to short-term during May 2017.2023, and 2022. Under the existing borrowing agreement, Trustmark had sufficient qualifying collateral to increase FHLB advances with the FHLB of Dallas by $1.771$4.003 billion at December 31, 2017. 2023.
69
In addition, at December 31, 2017,2023, Trustmark had $958no short-term and $58 thousand in long-term FHLB advances outstanding with the FHLB of Atlanta, which were acquired in the BancTrust merger, compared to $1.1 millionno short-term and $78 thousand in long-term FHLB advances outstanding at December 31, 2016.2022. Trustmark has non-member status and thus no additional borrowing capacity with the FHLB of Atlanta.
Additionally, Trustmark has the ability to leverage its unencumbered investment securities as collateral. At December 31, 2017,2023, Trustmark had approximately $1.299 billion$842.0 million available in unencumbered Treasury and agency securities compared to $1.373 billion$797.0 million at December 31, 2016. The decrease was primarily due to Management’s decision to suspend reinvestment of security cash flows during the fourth quarter of 2017.2022.
Another borrowing source is the Discount Window. At December 31, 2017,2023, Trustmark had approximately $1.042$1.374 billion available in collateral capacity at the Discount Window primarily from pledges of commercial and industrial LHFI, compared with $998.1 million$1.345 billion at December 31, 2016. This increase was2022.
Additionally, on March 15, 2020, in response to the COVID-19 pandemic, the FRB reduced reserve requirements for insured depository institutions to zero percent, which increased TNB’s available liquidity.
On March 12, 2023, the U.S. Treasury Department, the FRB and the FDIC jointly announced the establishment of the Bank Term Funding Program (BTFP), in response to recent liquidity concerns within the banking industry in part due to recent deposit runs that resulted in a few large bank failures. The BTFP was designed to provide available additional funding to eligible depository institutions to help assure that banks have the increaseability to meet the needs of all their depositors. Under the program, eligible depository institutions can obtain loans of up to one year in length by pledging U.S. Treasuries, agency debt and mortgage-backed securities and other qualifying assets (valued at par) as collateral. The BTFP is intended to eliminate the commercialneed for depository institutions to quickly sell their securities when they are experiencing stress on their liquidity. As of December 31, 2023, Trustmark had not accessed the BTFP.
63
During 2020, Trustmark issued $125.0 million aggregate principal amount of its 3.625% fixed-to-floating rate subordinated notes. The subordinated notes. At December 31, 2023 and industrial LHFI portfolio during 2017.2022,the carrying amount of the subordinated notes was $123.5 million and $123.3 million, respectively. The subordinated notes mature December 1, 2030 and are redeemable at Trustmark’s option under certain circumstances. The subordinated notes are unsecured obligations and are subordinated in right of payment to all of Trustmark’s existing and future senior indebtedness, whether secured or unsecured. The subordinated notes are obligations of Trustmark only and are not obligations of, and are not guaranteed by, any of its subsidiaries, including TNB.
During 2006, Trustmark completed a private placement of $60.0 million of trust preferred securities through a newly formed Delaware trust affiliate, the Trust. The trust preferred securities mature September 30, 2036 and are redeemable at Trustmark’s option. The proceeds from the sale of the trust preferred securities were used by the Trust to purchase $61.9 million in aggregate principal amount of Trustmark’s junior subordinated debentures.
The Board of Directors of Trustmark currently has the authority to issue up to 20.0 million preferred shares with no par value. The ability to issue preferred shares in the future will provide Trustmark with additional financial and management flexibility for general corporate and acquisition purposes. At December 31, 2017,2023, Trustmark had no shares of preferred stock issued and outstanding.
Liquidity position and strategy are reviewed regularly by Management and continuously adjusted in relationship to Trustmark’s overall strategy. Management believes that Trustmark has sufficient liquidity and capital resources to meet presently known cash flow requirements arising from ongoing business transactions. As of December 31, 2023, Management is not aware of any events that are reasonably likely to have a material adverse effect on our liquidity, capital resources or operations. In addition, Management is not aware of any regulatory recommendations regarding liquidity that would have a material adverse effect on Trustmark.
In the ordinary course of business, Trustmark has entered into contractual obligations and has made other commitments to make future payments. Please refer to the accompanying notes to the consolidated financial statements included in Part II. Item 8. – Financial Statements and Supplementary Data of this report for the expected timing of such payments as of December 31, 2023. These include payments related to (i) short-term and long-term borrowings (Note 11 – Borrowings), (ii) operating and finance leases (Note 9 – Leases), (iii) time deposits with stated maturity dates (Note 10 – Deposits) and (iv) commitments to extend credit and standby letters of credit (Note 16 – Commitments and Contingencies).
Asset/Liability Management
Overview
Market risk reflects the potential risk of loss arising from adverse changes in interest rates and market prices. Trustmark has risk management policies to monitor and limit exposure to market risk. Trustmark’s primary market risk is interest rate risk created by core banking activities. Interest rate risk is the potential variability of the income generated by Trustmark’s financial products or services, which results from changes in various market interest rates. Market rate changes may take the form of absolute shifts, variances in the relationships between different rates and changes in the shape or slope of the interest rate term structure.
Following the LIBOR cessation date of June 30, 2023, the nationwide process for replacing LIBOR in financial contracts that mature thereafter and that do not provide for an effective means to replace LIBOR upon its cessation took effect pursuant to the Adjustable Interest Rate (LIBOR) Act. For contracts in which a party has the discretion to identify a replacement rate, the Adjustable Interest Rate (LIBOR) Act also provides a safe harbor to parties if they choose the SOFR-based benchmark replacement rate to be identified by the FRB. Trustmark had a significant number of loans, derivative contracts, borrowings and other financial instruments with attributes that were either directly or indirectly dependent on LIBOR. As December 31, 2023, all of Trustmark’s LIBOR exposure was remediated or in the process of being remediated. The transition from LIBOR could create costs and additional risk. Trustmark cannot predict what the ultimate impact of the transition from LIBOR will be; however, Trustmark has implemented various measures to manage the transition and mitigate risks. For additional information regarding the transition from LIBOR and Trustmark’s management of this transition, please see the respective risk factor included in Part I. Item 1A. – Risk Factors of this report.
Management continually develops and applies cost-effective strategies to manage these risks. Management’s Asset/Liability Committee sets the day-to-day operating guidelines, approves strategies affecting net interest income and coordinates activities within policy limits established by the Board of Directors of Trustmark. A key objective of the asset/liability management program is to quantify, monitor and manage interest rate risk and to assist Management in maintaining stability in the net interest margin under varying interest rate environments.
Derivatives
Trustmark uses financial derivatives for management of interest rate risk. Management’s Asset/Liability Committee, in its oversight role for the management of interest rate risk, approves the use of derivatives in balance sheet hedging strategies. The most common
64
derivatives employed by Trustmark are interest rate lock commitments, forward contracts (both futures contracts and options on futures contracts), interest rate swaps, interest rate caps and interest rate floors. As a general matter, the values of these instruments are designed to be inversely related to the values of the assets that they hedge (i.e., if the value of the hedged asset falls, the value of the related hedge rises). In addition, Trustmark has entered into derivatives contracts as counterparty to one or more customers in connection with loans extended to those customers. These transactions are designed to hedge interest rate, currency or other exposures of the customers and are not entered into by Trustmark for speculative purposes. Increased federal regulation of the derivatives markets may increase the cost to Trustmark to administer derivatives programs.
On April 4, 2013,Derivatives Designated as Hedging Instruments
During 2022, Trustmark entered into a forward interest rate swap contract on junior subordinated debentures with a total notional amount of $60.0 million. The interest rate swap contract was designated as a derivative instrument ininitiated a cash flow hedging program. Trustmark's objectives in initiating this hedging program were to add stability to interest income and to manage its exposure to interest rate movements. Interest rate swaps designated as cash flow hedges involve the receipt of fixed-rate amounts from a counterparty in exchange for Trustmark making variable-rate payments over the life of the agreements without exchange of the underlying notional amount. Interest rate floor spreads designated as cash flow hedges involve the receipt of variable-rate amounts if interest rates fall below the purchased floor strike rate on the contract and payments of variable-rate amounts if interest rates fall below the sold floor strike rate on the contract. Trustmark uses such derivatives to hedge under FASB ASC Topic 815,the variable cash flows associated with existing and anticipated variable-rate loan assets. At December 31, 2023, the objectiveaggregate notional value of protectingTrustmark's interest rate swaps and floor spreads designated as cash flow hedges totaled $1.125 billion compared to $825.0 million at December 31, 2022.
Trustmark records any gains or losses on these cash flow hedges in AOCI. Gains and losses on derivatives representing hedge components excluded from the quarterlyassessment of effectiveness are recognized over the life of the hedge on a systematic and rational basis, as documented at hedge inception in accordance with Trustmark’s accounting policy election. The earnings recognition of excluded components totaled $57 thousand of amortization expense for the year ended December 31, 2023, and is included in interest and fees on LHFS and LHFI. As interest payments are received on Trustmark’s $60.0 million of junior subordinated debentures issued to the Trust throughout the five-year period beginning December 31, 2014Trustmark's variable-rate assets, amounts reported in AOCI are reclassified into interest and ending December 31, 2019 from the risk of variability of those payments resulting from changesfees on LHFS and LHFI in the three-month LIBOR interest rate. Under the swap, which became
70
effective on December 31, 2014, Trustmark pays a fixed interest rate of 1.66% and receives a variable interest rate based on three-month LIBOR on a total notional amount of $60.0 million, with quarterly net settlements.
No ineffectiveness related to the interest rate swap designated as a cash flow hedge was recognized in theaccompanying consolidated statements of income during the same period. For the years ended December 31, 2017, 20162023 and 2015. The accumulated2022, Trustmark reclassified a loss, net after-tax gain related to the effective cash flow hedge included in AOCL totaled $278of tax, of $12.3 million and $345 thousand, at December 31, 2017 compared to a net after-tax loss of $18 thousand at December 31, 2016. Amounts reported in AOCL related to this derivative are reclassified to otherrespectively, into interest expense as interest payments are madeand fees on Trustmark’s variable rate junior subordinated debentures.LHFS and LHFI. During the next twelve months, Trustmark estimates that $125 thousand$13.2 million will be reclassified as an increasea reduction to interest and fees on LHFS and LHFI. This amount could differ due to changes in interest rates, hedge de-designations or the addition of other interest expense.hedges.
Derivatives Not Designated as Hedging Instruments
As part of Trustmark’s risk management strategy in the mortgage banking business, various derivative instruments such as interest rate lock commitments and forward sales contracts are utilized. Rate lock commitments are residential mortgage loan commitments with customers, which guarantee a specified interest rate for a specified period of time. Trustmark’s obligations under forward contracts consist of commitments to deliver mortgage loans, originated and/or purchased, in the secondary market at a future date. The gross notional amount of Trustmark’s off-balance sheet obligations under these derivative instruments totaled $265.0$171.4 million at December 31, 2017,2023, with a positivenegative valuation adjustment of $663$150 thousand, compared to $292.9$165.4 million, with a positive valuation adjustment of $3.8 million$325 thousand at December 31, 2016.2022.
Trustmark utilizes a portfolio of exchange-traded derivative instruments, such as Treasury note futures contracts and option contracts, to achieve a fair value return that economically hedges changes in the fair value of the MSR attributable to interest rates. These transactions are considered freestanding derivatives that do not otherwise qualify for hedge accounting under GAAP. The total notional amount of these derivative instruments were $349.0was $285.0 million at December 31, 20172023 compared to $262.0$277.0 million at December 31, 2016.2022. These exchange-traded derivative instruments are accounted for at fair value with changes in the fair value recorded inas noninterest income in mortgage banking, net and are offset by the changes in the fair value of the MSR. The MSR fair value represents the present value of future cash flows, which among other things includes decay and the effect of changes in interest rates. Ineffectiveness of hedging the MSR fair value is measured by comparing the change in value of hedge instruments to the change in the fair value of the MSR asset attributable to changes in interest rates and other market driven changes in valuation inputs and assumptions. The impact of this strategy resulted in a net positivenegative ineffectiveness of $254 thousand$6.3 million for the year ended December 31, 2017,2023, compared to a net negative ineffectiveness of $2.9$4.1 million for the year ended December 31, 20162022 and a net positive ineffectiveness of $1.9$2.5 million for the year ended December 31, 2015, respectively. The net positive ineffectiveness was primarily due to the mortgage spread widening during 2017 compared to 2016. The net negative ineffectiveness was primarily due to the tightening in the mortgage spread during 2016 compared to 2015. 2021.
Trustmark offers certain interest rate derivatives products directly to qualified commercial lending clients seeking to manage their interest rate risk under loans they have entered into with TNB. Trustmark economically hedges interest rate swap transactions executed with commercial lending clients by entering into offsetting interest rate swap transactions with institutional derivatives market participants. Derivatives transactions executed as part of this program are not designated as qualifying hedging relationships under GAAP and are, therefore, carried on Trustmark’s financial statements at fair value with the change in fair value recorded as noninterest
65
income in bank card and other fees. Because these derivatives have mirror-image contractual terms, in addition to collateral provisions which mitigate the impact of non-performance risk, the changes in fair value are expected to substantially offset. The Chicago Mercantile Exchange rules legally characterize variation margin collateral payments made or received for centrally cleared interest rate swaps as settlements rather than collateral. As ofa result, centrally cleared interest rate swaps included in other assets and other liabilities are presented on a net basis in the accompanying consolidated balance sheets. At December 31, 2017,2023, Trustmark had interest rate swaps with an aggregate notional amount of $351.9 million$1.500 billion related to this program, compared to $340.2 million as of$1.391 billion at December 31, 2016.2022.
Credit-Risk-Related Contingent Features
Trustmark has agreements with its financial institution counterparties that contain provisions where if Trustmark defaults on any of its indebtedness, including default where repayment of the indebtedness has not been accelerated by the lender, then Trustmark could also be deemed to be in default on its derivatives obligations.
As ofAt December 31, 2017 and 2016,2023, the termination value of interest rate swaps in a liability position, which includes accrued interest but excludes any adjustment for nonperformance risk, related to these agreements was $80 thousand and $1.2$1.4 million respectively. As ofcompared to none at December 31, 2017,2022. At December 31, 2023 and 2022, Trustmark had posted collateral of $100$2.0 million and $740 thousand, respectively, against its obligations because of negotiated thresholds and minimum transfer amounts under these agreements. If Trustmark had breached any of these triggering provisions at December 31, 2017,2023, it could have been required to settle its obligations under the agreements at the termination value (which is expected to approximate fair market value).
Credit risk participation agreements arise when Trustmark contracts with other financial institutions, as a guarantor or beneficiary, to share credit risk associated with certain interest rate swaps. These agreements provide for reimbursement of losses resulting from a third partythird-party default on the underlying swap. At December 31, 2017 and 2016,2023, Trustmark had entered into twosix risk participation agreements as a beneficiary with and aggregate notional amount of $40.1 million compared to five risk participation agreements as a beneficiary with an aggregate notional amount of $13.7$50.2 million and $14.2 million, respectively. As ofat December 31, 2017,2022. At December 31, 2023, Trustmark had entered into sixthirty-five risk participation agreements as a guarantor with an aggregate notional amount of $37.1$304.7 million,
71
compared to fivetwenty-nine risk participation agreements as a guarantor with an aggregate notional amount of $28.0$235.8 million at December 31, 2016.2022. The aggregate fair values of these risk participation agreements were immaterial at December 31, 20172023 and 2016.2022.
Trustmark’s participation in the derivatives markets is subject to increased federal regulation of these markets. Trustmark believes that it may continue to use financial derivatives to manage interest rate risk and also to offer derivatives products to certain qualified commercial lending clients in compliance with the Volcker Rule. However, the increased federal regulation of the derivatives markets has increased the cost to Trustmark of administering its derivatives programs. Some of these costs (particularly compliance costs related to the Volcker Rule and other federal regulations) are expected to recur in the future.
ITEM 7A. QUANTITATIVE AND QUALITATIVE DISCLOSURES ABOUT MARKET RISK
Market/Interest Rate Risk Management
The primary purpose in managing interest rate risk is to invest capital effectively and preserve the value created by the core banking business. This is accomplished through the development and implementation of lending, funding, pricing and hedging strategies designed to maximize net interest income performance under varying interest rate environments subject to specific liquidity and interest rate risk guidelines.
Financial simulation models are the primary tools used by Management’s Asset/Liability Committee to measure interest rate exposure. The significant increase in short-term market interest rates and the overall interest rate environment is likely to affect the balance sheet composition and rates. The simulation incorporates assumptions regarding the effects of such changes based on a combination of historical analysis and expected behavior. Using a wide range of scenarios, Management is provided with extensive information on the potential impact on net interest income caused by changes in interest rates. Models are structured to simulate cash flows and accrual characteristics of Trustmark’s balance sheet. Assumptions are made about the direction and volatility of interest rates, the slope of the yield curve and the changing composition of Trustmark’s balance sheet, resulting from both strategic plans and customer behavior. In addition, the model incorporates Management’s assumptions and expectations regarding such factors as loan and deposit growth, pricing, prepayment speeds and spreads between interest rates.
Based on the results of the simulation models using static balances, the table below summarizes the effect various one-year interest rate shift scenarios would have on net interest income compared to a base case, flat scenario at December 31, 20172023 and 2016. At2022. Given the
66
substantial increase in market rates, the down 200 basis points scenario has been added to the table below for the year ended December 31, 2017 and 2016, the impact of a 200 basis point drop scenario was not calculated due to the low interest rate environment.2023.
|
| Estimated % Change |
|
| Estimated % Change |
| ||||||||||
|
| in Net Interest Income |
|
| in Net Interest Income |
| ||||||||||
Change in Interest Rates |
| 2017 |
|
| 2016 |
|
| 2023 |
|
| 2022 |
| ||||
+200 basis points |
|
| -2.1 | % |
|
| -0.1 | % |
|
| 0.5 | % |
|
| 3.3 | % |
+100 basis points |
|
| -1.0 | % |
|
| 0.0 | % |
|
| 0.3 | % |
|
| 1.7 | % |
-100 basis points |
|
| -4.2 | % |
|
| -6.3 | % |
|
| -0.4 | % |
|
| -1.8 | % |
-200 basis points |
|
| -1.0 | % |
|
| — |
| ||||||||
As shown in the table above, the interest rate shocks for 2017 illustrate little change in net interest income in rising rate scenarios while displaying modest exposure to a falling rate environment. The exposure to falling rates is primarily due to a downward repricing of various earning assets with minimal contribution from liabilities given the already low cost of deposits in the base scenario. Management cannot provide any assurance about the actual effect of changes in interest rates on net interest income. The estimates provided do not include the effects of possible strategic changes in the balances of various assets and liabilities throughout 20182024 or additional actions Trustmark could undertake in response to changes in interest rates. Management will continue to prudently manage the balance sheet in an effort to control interest rate risk and maintain profitability over the long term.
Another component of interest rate risk management is measuring the economic value-at-risk for a given change in market interest rates. The economic value-at-risk may indicate risks associated with longer-term balance sheet items that may not affect net interest income at risk over shorter time periods. Trustmark uses computer-modeling techniques to determine the present value of all asset and liability cash flows (both on- and off-balance sheet), adjusted for prepayment expectations, using a market discount rate. The economic value of equity (EVE), also known as net portfolio value, is defined as the difference between the present value of asset cash flows and the present value of liability cash flows. The resulting change in EVE in different market rate environments, from the base case scenario, is the amount of EVE at risk from those rate environments.
The following table summarizes the effect that various interest rate shifts would have on net portfolio value at December 31, 20172023 and 2016. At December 31, 2017 and 2016, the impact of a 200 basis point drop scenario was not calculated due to the historically low interest rate environment.2022.
|
| Estimated % Change |
|
| Estimated % Change |
| ||||||||||
|
| in Net Portfolio Value |
|
| in Net Portfolio Value |
| ||||||||||
Change in Interest Rates |
| 2017 |
|
| 2016 |
|
| 2023 |
|
| 2022 |
| ||||
+200 basis points |
|
| 3.3 | % |
|
| 7.0 | % |
|
| -2.3 | % |
|
| -1.6 | % |
+100 basis points |
|
| 2.2 | % |
|
| 4.0 | % |
|
| -0.9 | % |
|
| -0.6 | % |
-100 basis points |
|
| -10.0 | % |
|
| -11.3 | % | ||||||||
Trustmark determines the fair value of the MSR using a valuation model administered by a third party that calculates the present value of estimated future net servicing income. The model incorporates assumptions that market participants use in estimating future net servicing income, including estimates of prepayment speeds, discount rate, default rates, cost to service (including delinquency and foreclosure costs), escrow account earnings, contractual servicing fee income and other ancillary income such as late fees. Management reviews all significant assumptions quarterly. Mortgage loan prepayment speeds, a key assumption in the model, is the annual rate at which borrowers are forecasted to repay their mortgage loan principal. The discount rate used to determine the present value of estimated future net servicing income, another key assumption in the model, is an estimate of the required rate of return investors in the market would require for an asset with similar risk. Both assumptions can, and generally will, change as market conditions and interest rates change.
By way of example, an increase in either the prepayment speed or discount rate assumption will result in a decrease in the fair value of the MSR, while a decrease in either assumption will result in an increase in the fair value of the MSR. In recent years, there have been significant market-driven fluctuations in loan prepayment speeds and discount rates. These fluctuations can be rapid and may continue to be significant. Therefore, estimating prepayment speed and/or discount rates within ranges that market participants would use in determining the fair value of the MSR requires significant management judgment.
At December 31, 2017,2023, the MSR fair value was approximately $84.3$131.9 million, compared to $80.2$129.7 million at December 31, 2016.2022. The impact on the MSR fair value of both a 10% adverse change in prepayment speeds or a 100 basis100-basis point increase in discount rates at December 31, 2017,2023 would be a decline in fair value of approximately $3.1$4.8 million and $5.4 million, respectively, compared to a decline in fair value of approximately $2.5$4.5 million and $2.9$5.4 million, respectively, at December 31, 2016.2022. Changes of equal magnitude in the opposite direction would produce similar increases in fair value in the respective amounts.
67
ITEM 8. FINANCIAL STATEMENTS AND SUPPLEMENTARY DATA
73
Report of Independent Registered Public Accounting Firm
Shareholders and the Board of Directors of Trustmark Corporation
Jackson, Mississippi
Opinions on the Financial Statements and Internal Control over Financial Reporting
We have audited the accompanying consolidated balance sheets of Trustmark Corporation and subsidiaries (the “Corporation”"Company") as of December 31, 20172023 and 2016, and2022, the related consolidated statements of income, comprehensive income, changes in shareholders’ equity, and cash flows for each of the years in the two-yearthree-year period ended December 31, 2017,2023, and the related notes (collectively referred to as the “financial statements”"financial statements"). We also have audited the Corporation’sCompany’s internal control over financial reporting as of December 31, 2017,2023, based on criteria established in Internal Control—Control – Integrated Framework: (2013) issued by the Committee of Sponsoring Organizations of the Treadway Commission (COSO).
In our opinion, the financial statements referred to above present fairly, in all material respects, the financial position of the CorporationCompany as of December 31, 20172023 and 2016,2022, and the results of itstheir operations and itstheir cash flows for each of the years in the two-yearthree-year period ended December 31, 20172023 in conformity with accounting principles generally accepted in the United States of America. Also in our opinion, the CorporationCompany maintained, in all material respects, effective internal control over financial reporting as of December 31, 2017,2023, based on criteria established in Internal Control—Control – Integrated Framework: (2013) issued by the COSO.
Basis for Opinions
The Corporation’sCompany’s management is responsible for these financial statements, for maintaining effective internal control over financial reporting, and for its assessment of the effectiveness of internal control over financial reporting, included in the accompanying Management Report on Internal Control over Financial Reporting. Our responsibility is to express an opinion on the Corporation’sCompany’s financial statements and an opinion on the Corporation’sCompany’s internal control over financial reporting based on our audits. We are a public accounting firm registered with the Public Company Accounting Oversight Board (United States) (“PCAOB”("PCAOB") and are required to be independent with respect to the CorporationCompany in accordance with the U.S. federal securities laws and the applicable rules and regulations of the Securities and Exchange Commission and the PCAOB.
We conducted our audits in accordance with the standards of the PCAOB. Those standards require that we plan and perform the audits to obtain reasonable assurance about whether the financial statements are free of material misstatement, whether due to error or fraud, and whether effective internal control over financial reporting was maintained in all material respects.
Our audits of the financial statements included performing procedures to assess the risks of material misstatement of the financial statements, whether due to error or fraud, and performing procedures that respond to those risks. Such procedures included examining, on a test basis, evidence regarding the amounts and disclosures in the financial statements. Our audits also included evaluating the accounting principles used and significant estimates made by management, as well as evaluating the overall presentation of the financial statement.statements. Our audit of internal control over financial reporting included obtaining an understanding of internal control over financial reporting, assessing the risk that a material weakness exists, and testing and evaluating the design and operating effectiveness of internal control based on the assessed risk. Our audits also included performing such other procedures as we considered necessary in the circumstances. We believe that our audits provide a reasonable basis for our opinions.
Definition and Limitations of Internal Control Over Financial Reporting
A company’s internal control over financial reporting is a process designed to provide reasonable assurance regarding the reliability of financial reporting and the preparation of financial statements for external purposes in accordance with generally accepted accounting principles. A company’s internal control over financial reporting includes those policies and procedures that (1) pertain to the maintenance of records that, in reasonable detail, accurately and fairly reflect the transactions and dispositions of the assets of the company; (2) provide reasonable assurance that transactions are recorded as necessary to permit preparation of financial statements in accordance with generally accepted accounting principles, and that receipts and expenditures of the company are being made only in accordance with authorizations of management and directors of the company; and (3) provide reasonable assurance regarding prevention or timely detection of unauthorized acquisition, use, or disposition of the company’s assets that could have a material effect on the financial statements.
74
Because of its inherent limitations, internal control over financial reporting may not prevent or detect misstatements. Also, projections of any evaluation of effectiveness to future periods are subject to the risk that controls may become inadequate because of changes in conditions, or that the degree of compliance with the policies or procedures may deteriorate.
68
Critical Audit Matter
The critical audit matter communicated below is a matter arising from the current period audit of the financial statements that was communicated or required to be communicated to the audit committee and that: (1) relates to accounts or disclosures that are material to the financial statements and (2) involved our especially challenging, subjective, or complex judgments. The communication of the critical audit matter does not alter in any way our opinion on the financial statements, taken as a whole, and we are not, by communicating the critical audit matter below, providing a separate opinion on the critical audit matter or on the accounts or disclosures to which it relates.
Allowance for Credit Losses, LHFI Reasonable and Supportable Forecasts
As described in Note 1 - Significant Accounting Policies and Note 4 – Loans Held For Investment and Allowance for Credit Losses, LHFI to the consolidated financial statements, the Company uses a third-party software application to calculate the quantitative portion of the allowance for credit losses, which employs a discounted cash flow (DCF) or weighted average remaining maturity (WARM) method by loan pool. A reasonable and supportable forecast is developed through a Loss Driver Analysis (LDA) by loan class. The LDA uses charge off data from Trustmark National Bank’s Federal Financial Institutions Examination Council (FFIEC) reports to construct a periodic default rate (PDR). The PDR is decomposed into a probability of default (PD). Regressions are run using the data for various macroeconomic variables in order to determine which correlate to the Company’s losses. These variables are then incorporated into the application to calculate a quarterly PD using a third-party baseline forecast. Loss given default (LGD) is derived from a method that traces the relationship between LGD and PD over a period of time and projects LGD based on the PD forecast. This model approach is applicable to all pools within the construction, land development and other land, other secured by 1-4 family residential properties, secured by nonfarm, nonresidential properties and other real estate secured loan classes, as well as all other consumer and other loans pools. For commercial and industrial loan pools, the Company uses its own PD and LGD data. The Company utilizes a third-party bond default study to derive the PD and LGD for the obligations of state and political subdivisions pool.
The Company determined that reasonable and supportable forecasts could be made for a twelve-month period for all of its loan pools in which models were developed through the LDA. To the extent the lives of the loans in the LHFI portfolio extend beyond this forecast period, Trustmark uses a reversion period of four quarters and reverts to the historical mean on a straight-line basis over the remaining life of the loans.
Estimating reasonable and supportable forecasts requires significant judgment and could have a material effect on the Company’s financial statements. Management leverages economic projections from an independent third party for its forecasts over the forecast period. We identified auditing the reasonableness of forecasts, including the LDA, as a critical audit matter as it involves especially subjective auditor judgment and increased audit effort, including the involvement of specialists.
The primary audit procedures we performed to address this critical audit matter included the following:
Tested the effectiveness of controls over the LDA and reasonable and supportable forecast including:
Performed substantive testing over the LDA and reasonable and supportable forecast including:
/s/ Crowe Horwath LLP
We have served as the Corporation’sCompany’s auditor since 2015, which is the year the engagement letter was signed for the audit of the 2016 financial statements.
Atlanta, GeorgiaFort Lauderdale, Florida
February 20, 201815, 2024
75
Report of Independent Registered Public Accounting Firm
The Board of Directors and Shareholders
Trustmark Corporation:
We have audited the accompanying consolidated statements of income, comprehensive income, changes in shareholders’ equity, and cash flows of Trustmark Corporation and subsidiaries (the Corporation) for the year ended December 31, 2015. These consolidated financial statements are the responsibility of the Corporation’s management. Our responsibility is to express an opinion on these consolidated financial statements based on our audit.
We conducted our audit in accordance with the standards of the Public Company Accounting Oversight Board (United States). Those standards require that we plan and perform the audit to obtain reasonable assurance about whether the financial statements are free of material misstatement. An audit includes examining, on a test basis, evidence supporting the amounts and disclosures in the financial statements. An audit also includes assessing the accounting principles used and significant estimates made by management, as well as evaluating the overall financial statement presentation. We believe that our audit provides a reasonable basis for our opinion.
In our opinion, the consolidated financial statements referred to above present fairly, in all material respects, the results of operations and the cash flows of Trustmark Corporation and subsidiaries for the year ended December 31, 2015, in conformity with U.S. generally accepted accounting principles.
/s/ KPMG LLP
Jackson, Mississippi
February 23, 2016
76
Trustmark Corporation and Subsidiaries
Consolidated Balance Sheets
($ in thousands except share data)thousands)
|
| December 31, |
|
| December 31, |
| ||||||||||
|
| 2017 |
|
| 2016 |
|
| 2023 |
|
| 2022 |
| ||||
Assets |
|
|
|
|
|
|
|
|
|
|
|
|
| |||
Cash and due from banks (noninterest-bearing) |
| $ | 335,768 |
|
| $ | 327,706 |
| ||||||||
Cash and due from banks |
| $ | 975,543 |
|
| $ | 734,787 |
| ||||||||
Federal funds sold and securities purchased under reverse repurchase agreements |
|
| 615 |
|
|
| 500 |
|
|
| — |
|
|
| 4,000 |
|
Securities available for sale (at fair value) |
|
| 2,238,635 |
|
|
| 2,356,682 |
| ||||||||
Securities held to maturity (fair value: $1,046,247-2017; $1,157,046-2016) |
|
| 1,056,486 |
|
|
| 1,158,643 |
| ||||||||
Securities available for sale, at fair value (amortized cost: $1,959,007-2023; |
|
| 1,762,878 |
|
|
| 2,024,082 |
| ||||||||
Securities held to maturity, net of ACL of $0 |
|
| 1,426,279 |
|
|
| 1,494,514 |
| ||||||||
Loans held for sale (LHFS) |
|
| 180,512 |
|
|
| 175,927 |
|
|
| 184,812 |
|
|
| 135,226 |
|
Loans held for investment (LHFI) |
|
| 8,569,967 |
|
|
| 7,851,213 |
|
|
| 12,950,524 |
|
|
| 12,204,039 |
|
Less allowance for loan losses, LHFI |
|
| 76,733 |
|
|
| 71,265 |
| ||||||||
Less ACL, LHFI |
|
| 139,367 |
|
|
| 120,214 |
| ||||||||
Net LHFI |
|
| 8,493,234 |
|
|
| 7,779,948 |
|
|
| 12,811,157 |
|
|
| 12,083,825 |
|
Acquired loans |
|
| 261,517 |
|
|
| 272,247 |
| ||||||||
Less allowance for loan losses, acquired loans |
|
| 4,079 |
|
|
| 11,397 |
| ||||||||
Net acquired loans |
|
| 257,438 |
|
|
| 260,850 |
| ||||||||
Net LHFI and acquired loans |
|
| 8,750,672 |
|
|
| 8,040,798 |
| ||||||||
Premises and equipment, net |
|
| 179,339 |
|
|
| 184,987 |
|
|
| 232,537 |
|
|
| 212,365 |
|
Mortgage servicing rights |
|
| 84,269 |
|
|
| 80,239 |
| ||||||||
Mortgage servicing rights (MSR) |
|
| 131,870 |
|
|
| 129,677 |
| ||||||||
Goodwill |
|
| 379,627 |
|
|
| 366,156 |
|
|
| 384,237 |
|
|
| 384,237 |
|
Identifiable intangible assets, net |
|
| 16,360 |
|
|
| 20,680 |
|
|
| 2,965 |
|
|
| 3,640 |
|
Other real estate |
|
| 43,228 |
|
|
| 62,051 |
| ||||||||
Other real estate, net |
|
| 6,867 |
|
|
| 1,986 |
| ||||||||
Operating lease right-of-use assets |
|
| 38,142 |
|
|
| 36,301 |
| ||||||||
Other assets |
|
| 532,442 |
|
|
| 577,964 |
|
|
| 764,902 |
|
|
| 770,838 |
|
Total Assets |
| $ | 13,797,953 |
|
| $ | 13,352,333 |
|
| $ | 18,722,189 |
|
| $ | 18,015,478 |
|
|
|
|
|
|
|
|
|
|
|
|
|
|
| |||
Liabilities |
|
|
|
|
|
|
|
|
|
|
|
|
| |||
Deposits: |
|
|
|
|
|
|
|
|
|
|
|
|
| |||
Noninterest-bearing |
| $ | 2,978,074 |
|
| $ | 2,973,238 |
|
| $ | 3,197,620 |
|
| $ | 4,093,771 |
|
Interest-bearing |
|
| 7,599,438 |
|
|
| 7,082,774 |
|
|
| 12,372,143 |
|
|
| 10,343,877 |
|
Total deposits |
|
| 10,577,512 |
|
|
| 10,056,012 |
|
|
| 15,569,763 |
|
|
| 14,437,648 |
|
Federal funds purchased and securities sold under repurchase agreements |
|
| 469,827 |
|
|
| 539,817 |
|
|
| 405,745 |
|
|
| 449,331 |
|
Short-term borrowings |
|
| 971,049 |
|
|
| 769,778 |
| ||||||||
Long-term Federal Home Loan Bank (FHLB) advances |
|
| 946 |
|
|
| 251,049 |
| ||||||||
Other borrowings |
|
| 483,230 |
|
|
| 1,050,938 |
| ||||||||
Subordinated notes |
|
| 123,482 |
|
|
| 123,262 |
| ||||||||
Junior subordinated debt securities |
|
| 61,856 |
|
|
| 61,856 |
|
|
| 61,856 |
|
|
| 61,856 |
|
ACL on off-balance sheet credit exposures |
|
| 34,057 |
|
|
| 36,838 |
| ||||||||
Operating lease liabilities |
|
| 41,584 |
|
|
| 38,932 |
| ||||||||
Other liabilities |
|
| 145,062 |
|
|
| 153,613 |
|
|
| 340,625 |
|
|
| 324,405 |
|
Total Liabilities |
|
| 12,226,252 |
|
|
| 11,832,125 |
|
|
| 17,060,342 |
|
|
| 16,523,210 |
|
|
|
|
|
|
|
|
|
|
|
|
|
|
| |||
Shareholders' Equity |
|
|
|
|
|
|
|
|
|
|
|
|
| |||
Common stock, no par value: |
|
|
|
|
|
|
|
|
|
|
|
|
| |||
Authorized: 250,000,000 shares |
|
|
|
|
|
|
|
|
|
|
|
|
| |||
Issued and outstanding: 67,746,094 shares - 2017; 67,628,618 shares - 2016 |
|
| 14,115 |
|
|
| 14,091 |
| ||||||||
Issued and outstanding: 61,071,173 shares - 2023; 60,977,686 shares - 2022 |
|
| 12,725 |
|
|
| 12,705 |
| ||||||||
Capital surplus |
|
| 369,124 |
|
|
| 366,563 |
|
|
| 159,688 |
|
|
| 154,645 |
|
Retained earnings |
|
| 1,228,187 |
|
|
| 1,185,352 |
|
|
| 1,709,157 |
|
|
| 1,600,321 |
|
Accumulated other comprehensive loss, net of tax |
|
| (39,725 | ) |
|
| (45,798 | ) | ||||||||
Accumulated other comprehensive income (loss), net of tax |
|
| (219,723 | ) |
|
| (275,403 | ) | ||||||||
Total Shareholders' Equity |
|
| 1,571,701 |
|
|
| 1,520,208 |
|
|
| 1,661,847 |
|
|
| 1,492,268 |
|
Total Liabilities and Shareholders' Equity |
| $ | 13,797,953 |
|
| $ | 13,352,333 |
|
| $ | 18,722,189 |
|
| $ | 18,015,478 |
|
See notes to consolidated financial statements.
70
77
Trustmark Corporation and Subsidiaries
Consolidated Statements of Income
($ in thousands, except per share data)
|
| Years Ended December 31, |
| |||||||||
|
| 2023 |
|
| 2022 |
|
| 2021 |
| |||
Interest Income |
|
|
|
|
|
|
|
|
| |||
Interest and fees on LHFS & LHFI |
| $ | 775,309 |
|
| $ | 472,990 |
|
| $ | 363,772 |
|
Interest and fees on PPP loans |
|
| — |
|
|
| 639 |
|
|
| 36,726 |
|
Interest on securities: |
|
|
|
|
|
|
|
|
| |||
Taxable |
|
| 66,100 |
|
|
| 59,717 |
|
|
| 38,698 |
|
Tax exempt |
|
| 208 |
|
|
| 333 |
|
|
| 548 |
|
Interest on federal funds sold and securities purchased under |
|
| 80 |
|
|
| 74 |
|
|
| — |
|
Other interest income |
|
| 37,135 |
|
|
| 8,080 |
|
|
| 2,767 |
|
Total Interest Income |
|
| 878,832 |
|
|
| 541,833 |
|
|
| 442,511 |
|
Interest Expense |
|
|
|
|
|
|
|
|
| |||
Interest on deposits |
|
| 245,951 |
|
|
| 29,069 |
|
|
| 16,945 |
|
Interest on federal funds purchased and securities sold under |
|
| 20,419 |
|
|
| 6,127 |
|
|
| 232 |
|
Other interest expense |
|
| 59,584 |
|
|
| 11,929 |
|
|
| 6,983 |
|
Total Interest Expense |
|
| 325,954 |
|
|
| 47,125 |
|
|
| 24,160 |
|
Net Interest Income |
|
| 552,878 |
|
|
| 494,708 |
|
|
| 418,351 |
|
Provision for credit losses (PCL), LHFI |
|
| 27,362 |
|
|
| 21,677 |
|
|
| (21,499 | ) |
PCL, off-balance sheet credit exposures |
|
| (2,781 | ) |
|
| 1,215 |
|
|
| (2,949 | ) |
Net Interest Income After PCL |
|
| 528,297 |
|
|
| 471,816 |
|
|
| 442,799 |
|
Noninterest Income |
|
|
|
|
|
|
|
|
| |||
Service charges on deposit accounts |
|
| 43,416 |
|
|
| 42,157 |
|
|
| 33,246 |
|
Bank card and other fees |
|
| 33,439 |
|
|
| 36,105 |
|
|
| 34,662 |
|
Mortgage banking, net |
|
| 26,216 |
|
|
| 28,306 |
|
|
| 63,750 |
|
Insurance commissions |
|
| 57,569 |
|
|
| 53,721 |
|
|
| 48,511 |
|
Wealth management |
|
| 35,092 |
|
|
| 35,013 |
|
|
| 35,190 |
|
Other, net |
|
| 11,187 |
|
|
| 9,842 |
|
|
| 6,551 |
|
Securities gains (losses), net |
|
| 39 |
|
|
| — |
|
|
| — |
|
Total Noninterest Income |
|
| 206,958 |
|
|
| 205,144 |
|
|
| 221,910 |
|
Noninterest Expense |
|
|
|
|
|
|
|
|
| |||
Salaries and employee benefits |
|
| 304,665 |
|
|
| 287,440 |
|
|
| 284,158 |
|
Services and fees (2) |
|
| 109,478 |
|
|
| 105,469 |
|
|
| 92,282 |
|
Net occupancy - premises |
|
| 29,482 |
|
|
| 29,264 |
|
|
| 27,043 |
|
Equipment expense |
|
| 26,142 |
|
|
| 24,448 |
|
|
| 24,337 |
|
Litigation settlement expense |
|
| 6,500 |
|
|
| 100,750 |
|
|
| — |
|
Other expense (1)(2) |
|
| 61,652 |
|
|
| 55,842 |
|
|
| 61,476 |
|
Total Noninterest Expense |
|
| 537,919 |
|
|
| 603,213 |
|
|
| 489,296 |
|
Income Before Income Taxes |
|
| 197,336 |
|
|
| 73,747 |
|
|
| 175,413 |
|
Income taxes |
|
| 31,847 |
|
|
| 1,860 |
|
|
| 28,048 |
|
Net Income |
| $ | 165,489 |
|
| $ | 71,887 |
|
| $ | 147,365 |
|
|
|
|
|
|
|
|
|
|
| |||
Earnings Per Share |
|
|
|
|
|
|
|
|
| |||
Basic |
| $ | 2.71 |
|
| $ | 1.17 |
|
| $ | 2.35 |
|
Diluted |
| $ | 2.70 |
|
| $ | 1.17 |
|
| $ | 2.34 |
|
|
| Years Ended December 31, |
| |||||||||
|
| 2017 |
|
| 2016 |
|
| 2015 |
| |||
Interest Income |
|
|
|
|
|
|
|
|
|
|
|
|
Interest and fees on LHFS & LHFI |
| $ | 344,625 |
|
| $ | 299,645 |
|
| $ | 274,433 |
|
Interest and fees on acquired loans |
|
| 24,478 |
|
|
| 30,144 |
|
|
| 51,152 |
|
Interest on securities: |
|
|
|
|
|
|
|
|
|
|
|
|
Taxable |
|
| 76,192 |
|
|
| 77,614 |
|
|
| 80,730 |
|
Tax exempt |
|
| 3,001 |
|
|
| 3,675 |
|
|
| 4,323 |
|
Interest on federal funds sold and securities purchased under reverse repurchase agreements |
|
| 33 |
|
|
| 14 |
|
|
| 8 |
|
Other interest income |
|
| 1,466 |
|
|
| 988 |
|
|
| 1,579 |
|
Total Interest Income |
|
| 449,795 |
|
|
| 412,080 |
|
|
| 412,225 |
|
Interest Expense |
|
|
|
|
|
|
|
|
|
|
|
|
Interest on deposits |
|
| 22,717 |
|
|
| 12,748 |
|
|
| 12,598 |
|
Interest on federal funds purchased and securities sold under repurchase agreements |
|
| 4,152 |
|
|
| 1,717 |
|
|
| 801 |
|
Other interest expense |
|
| 15,376 |
|
|
| 10,082 |
|
|
| 7,061 |
|
Total Interest Expense |
|
| 42,245 |
|
|
| 24,547 |
|
|
| 20,460 |
|
Net Interest Income |
|
| 407,550 |
|
|
| 387,533 |
|
|
| 391,765 |
|
Provision for loan losses, LHFI |
|
| 15,094 |
|
|
| 10,957 |
|
|
| 8,375 |
|
Provision for loan losses, acquired loans |
|
| (7,395 | ) |
|
| 3,757 |
|
|
| 3,425 |
|
Net Interest Income After Provision for Loan Losses |
|
| 399,851 |
|
|
| 372,819 |
|
|
| 379,965 |
|
Noninterest Income |
|
|
|
|
|
|
|
|
|
|
|
|
Service charges on deposit accounts |
|
| 44,003 |
|
|
| 45,253 |
|
|
| 47,366 |
|
Bank card and other fees |
|
| 28,286 |
|
|
| 27,906 |
|
|
| 28,298 |
|
Mortgage banking, net |
|
| 29,902 |
|
|
| 28,212 |
|
|
| 30,176 |
|
Insurance commissions |
|
| 38,168 |
|
|
| 36,764 |
|
|
| 36,424 |
|
Wealth management |
|
| 30,340 |
|
|
| 30,492 |
|
|
| 31,369 |
|
Other, net |
|
| 13,949 |
|
|
| 5,626 |
|
|
| (484 | ) |
Securities gains (losses), net |
|
| 15 |
|
|
| (310 | ) |
|
| — |
|
Total Noninterest Income |
|
| 184,663 |
|
|
| 173,943 |
|
|
| 173,149 |
|
Noninterest Expense |
|
|
|
|
|
|
|
|
|
|
|
|
Salaries and employee benefits |
|
| 234,987 |
|
|
| 239,637 |
|
|
| 230,198 |
|
Defined benefit plan termination |
|
| 17,644 |
|
|
| — |
|
|
| — |
|
Services and fees |
|
| 60,893 |
|
|
| 58,695 |
|
|
| 57,534 |
|
Net occupancy - premises |
|
| 25,767 |
|
|
| 24,982 |
|
|
| 25,318 |
|
Equipment expense |
|
| 24,453 |
|
|
| 24,225 |
|
|
| 23,859 |
|
Other real estate expense |
|
| 3,672 |
|
|
| 586 |
|
|
| 4,903 |
|
FDIC assessment expense |
|
| 11,010 |
|
|
| 11,243 |
|
|
| 10,728 |
|
Other expense |
|
| 51,743 |
|
|
| 47,930 |
|
|
| 49,122 |
|
Total Noninterest Expense |
|
| 430,169 |
|
|
| 407,298 |
|
|
| 401,662 |
|
Income Before Income Taxes |
|
| 154,345 |
|
|
| 139,464 |
|
|
| 151,452 |
|
Income taxes |
|
| 48,715 |
|
|
| 31,053 |
|
|
| 35,414 |
|
Net Income |
| $ | 105,630 |
|
| $ | 108,411 |
|
| $ | 116,038 |
|
|
|
|
|
|
|
|
|
|
|
|
|
|
Earnings Per Share |
|
|
|
|
|
|
|
|
|
|
|
|
Basic |
| $ | 1.56 |
|
| $ | 1.60 |
|
| $ | 1.72 |
|
Diluted |
| $ | 1.56 |
|
| $ | 1.60 |
|
| $ | 1.71 |
|
See notes to consolidated financial statements.
71
78
Trustmark Corporation and Subsidiaries
Consolidated Statements of Comprehensive Income
($ in thousands)
|
| Years Ended December 31, |
|
| Years Ended December 31, |
| ||||||||||||||||||
|
| 2017 |
|
| 2016 |
|
| 2015 |
|
| 2023 |
|
| 2022 |
|
| 2021 |
| ||||||
Net income per consolidated statements of income |
| $ | 105,630 |
|
| $ | 108,411 |
|
| $ | 116,038 |
|
| $ | 165,489 |
|
| $ | 71,887 |
|
| $ | 147,365 |
|
Other comprehensive income (loss), net of tax: |
|
|
|
|
|
|
|
|
|
|
|
|
|
|
|
|
|
|
|
|
| |||
Net unrealized gains (losses) on available for sale securities and transferred securities: |
|
|
|
|
|
|
|
|
|
|
|
|
|
|
|
|
|
|
|
|
| |||
Net unrealized holding gains (losses) arising during the period |
|
| (8,641 | ) |
|
| (9,667 | ) |
|
| (10,309 | ) |
|
| 38,133 |
|
|
| (172,143 | ) |
|
| (37,090 | ) |
Less: adjustment for net (gains) losses realized in net income |
|
| (9 | ) |
|
| 191 |
|
|
| — |
| ||||||||||||
Reclassification adjustment for net (gains) losses realized in |
|
| (29 | ) |
|
| — |
|
|
| — |
| ||||||||||||
Change in net unrealized holding loss on securities transferred to held to maturity |
|
| 2,915 |
|
|
| 6,070 |
|
|
| 3,918 |
|
|
| 11,668 |
|
|
| (64,525 | ) |
|
| 1,985 |
|
Pension and other postretirement benefit plans: |
|
|
|
|
|
|
|
|
|
|
|
|
|
|
|
|
|
|
|
|
| |||
Change in the actuarial loss of pension and other postretirement |
|
| (518 | ) |
|
| 8,094 |
|
|
| 2,134 |
| ||||||||||||
Reclassification adjustments for changes realized in net income: |
|
|
|
|
|
|
|
|
| |||||||||||||||
Net change in prior service costs |
|
| 154 |
|
|
| 154 |
|
|
| 154 |
|
|
| 83 |
|
|
| 83 |
|
|
| 84 |
|
Recognized net loss due to lump sum settlements |
|
| — |
|
|
| 2,412 |
|
|
| 1,371 |
|
|
| 19 |
|
|
| — |
|
|
| 137 |
|
Change in net actuarial loss |
|
| 451 |
|
|
| 294 |
|
|
| 2,252 |
|
|
| 133 |
|
|
| 817 |
|
|
| 1,241 |
|
Recognized net loss due to defined benefit plan termination |
|
| 10,907 |
|
|
| — |
|
|
| — |
| ||||||||||||
Derivatives: |
|
|
|
|
|
|
|
|
|
|
|
|
|
|
|
|
|
|
| |||||
Change in the accumulated gain (loss) on effective cash flow hedge derivatives |
|
| 122 |
|
|
| (228 | ) |
|
| (812 | ) |
|
| (6,098 | ) |
|
| (15,514 | ) |
|
| — |
|
Less: adjustment for loss realized in net income |
|
| 174 |
|
|
| 370 |
|
|
| 516 |
| ||||||||||||
Reclassification adjustment for (gain) loss realized in net income |
|
| 12,289 |
|
|
| 345 |
|
|
| — |
| ||||||||||||
Other comprehensive income (loss), net of tax |
|
| 6,073 |
|
|
| (404 | ) |
|
| (2,910 | ) |
|
| 55,680 |
|
|
| (242,843 | ) |
|
| (31,509 | ) |
Comprehensive income |
| $ | 111,703 |
|
| $ | 108,007 |
|
| $ | 113,128 |
| ||||||||||||
Comprehensive income (loss) |
| $ | 221,169 |
|
| $ | (170,956 | ) |
| $ | 115,856 |
| ||||||||||||
See notes to consolidated financial statements.
72
79
Trustmark Corporation and Subsidiaries
Consolidated Statements of Changes in Shareholders' Equity
($ in thousands, except per share data)
|
|
|
|
|
|
|
|
|
|
|
|
|
|
|
|
|
| Accumulated |
|
|
|
|
| |
|
|
|
|
|
|
|
|
|
|
|
|
|
|
|
|
|
| Other |
|
|
|
|
| |
|
| Common Stock |
|
|
|
|
|
|
|
|
|
| Comprehensive |
|
|
|
|
| ||||||
|
| Shares |
|
|
|
|
|
| Capital |
|
| Retained |
|
| Income |
|
|
|
|
| ||||
|
| Outstanding |
|
| Amount |
|
| Surplus |
|
| Earnings |
|
| (Loss) |
|
| Total |
| ||||||
Balance, January 1, 2015 |
|
| 67,481,992 |
|
| $ | 14,060 |
|
| $ | 356,244 |
|
| $ | 1,092,120 |
|
| $ | (42,484 | ) |
| $ | 1,419,940 |
|
Net income per consolidated statements of income |
|
| — |
|
|
| — |
|
|
| — |
|
|
| 116,038 |
|
|
| — |
|
|
| 116,038 |
|
Other comprehensive income (loss), net of tax |
|
| — |
|
|
| — |
|
|
| — |
|
|
| — |
|
|
| (2,910 | ) |
|
| (2,910 | ) |
Cash dividends paid on common stock ($0.92 per share) |
|
| — |
|
|
| — |
|
|
| — |
|
|
| (62,605 | ) |
|
| — |
|
|
| (62,605 | ) |
Common stock issued, long-term incentive plan |
|
| 77,136 |
|
|
| 16 |
|
|
| 1,555 |
|
|
| (2,645 | ) |
|
| — |
|
|
| (1,074 | ) |
Compensation expense, long-term incentive plan |
|
| — |
|
|
| — |
|
|
| 3,668 |
|
|
| — |
|
|
| — |
|
|
| 3,668 |
|
Balance, December 31, 2015 |
|
| 67,559,128 |
|
|
| 14,076 |
|
|
| 361,467 |
|
|
| 1,142,908 |
|
|
| (45,394 | ) |
|
| 1,473,057 |
|
Net income per consolidated statements of income |
|
| — |
|
|
| — |
|
|
| — |
|
|
| 108,411 |
|
|
| — |
|
|
| 108,411 |
|
Other comprehensive income (loss), net of tax |
|
| — |
|
|
| — |
|
|
| — |
|
|
| — |
|
|
| (404 | ) |
|
| (404 | ) |
Cash dividends paid on common stock ($0.92 per share) |
|
| — |
|
|
| — |
|
|
| — |
|
|
| (62,666 | ) |
|
| — |
|
|
| (62,666 | ) |
Common stock issued, long-term incentive plan |
|
| 103,112 |
|
|
| 22 |
|
|
| 2,155 |
|
|
| (3,301 | ) |
|
| — |
|
|
| (1,124 | ) |
Repurchase and retirement of common stock |
|
| (33,622 | ) |
|
| (7 | ) |
|
| (743 | ) |
|
| - |
|
|
| — |
|
|
| (750 | ) |
Compensation expense, long-term incentive plan |
|
| — |
|
|
| — |
|
|
| 3,684 |
|
|
| — |
|
|
| — |
|
|
| 3,684 |
|
Balance, December 31, 2016 |
|
| 67,628,618 |
|
|
| 14,091 |
|
|
| 366,563 |
|
|
| 1,185,352 |
|
|
| (45,798 | ) |
|
| 1,520,208 |
|
Net income per consolidated statements of income |
|
| — |
|
|
| — |
|
|
| — |
|
|
| 105,630 |
|
|
| — |
|
|
| 105,630 |
|
Other comprehensive income (loss), net of tax |
|
| — |
|
|
| — |
|
|
| — |
|
|
| — |
|
|
| 6,073 |
|
|
| 6,073 |
|
Cash dividends paid on common stock ($0.92 per share) |
|
| — |
|
|
| — |
|
|
| — |
|
|
| (62,795 | ) |
|
| — |
|
|
| (62,795 | ) |
Common stock issued, long-term incentive plan |
|
| 117,476 |
|
|
| 24 |
|
|
| (1,748 | ) |
|
| — |
|
|
| — |
|
|
| (1,724 | ) |
Compensation expense, long-term incentive plan |
|
| — |
|
|
| — |
|
|
| 4,309 |
|
|
| — |
|
|
| — |
|
|
| 4,309 |
|
Balance, December 31, 2017 |
|
| 67,746,094 |
|
| $ | 14,115 |
|
| $ | 369,124 |
|
| $ | 1,228,187 |
|
| $ | (39,725 | ) |
| $ | 1,571,701 |
|
|
|
|
|
|
|
|
|
|
|
|
|
|
| Accumulated |
|
|
|
| ||||||
|
|
|
|
|
|
|
|
|
|
|
|
|
| Other |
|
|
|
| ||||||
|
| Common Stock |
|
|
|
|
|
|
|
| Comprehensive |
|
|
|
| |||||||||
|
| Shares |
|
|
|
|
| Capital |
|
| Retained |
|
| Income |
|
|
|
| ||||||
|
| Outstanding |
|
| Amount |
|
| Surplus |
|
| Earnings |
|
| (Loss) |
|
| Total |
| ||||||
Balance, January 1, 2021 |
|
| 63,424,526 |
|
| $ | 13,215 |
|
| $ | 233,120 |
|
| $ | 1,495,833 |
|
| $ | (1,051 | ) |
| $ | 1,741,117 |
|
Net income per consolidated statements of |
|
| — |
|
|
| — |
|
|
| — |
|
|
| 147,365 |
|
|
| — |
|
|
| 147,365 |
|
Other comprehensive income (loss), net of |
|
| — |
|
|
| — |
|
|
| — |
|
|
| — |
|
|
| (31,509 | ) |
|
| (31,509 | ) |
Cash dividends paid on common stock |
|
| — |
|
|
| — |
|
|
| — |
|
|
| (58,085 | ) |
|
| — |
|
|
| (58,085 | ) |
Shares withheld to pay taxes, long-term |
|
| 133,907 |
|
|
| 28 |
|
|
| (1,407 | ) |
|
| — |
|
|
| — |
|
|
| (1,379 | ) |
Repurchase and retirement of common |
|
| (1,909,754 | ) |
|
| (398 | ) |
|
| (61,401 | ) |
|
| — |
|
|
| — |
|
|
| (61,799 | ) |
Compensation expense, long-term |
|
| — |
|
|
| — |
|
|
| 5,601 |
|
|
| — |
|
|
| — |
|
|
| 5,601 |
|
Balance, December 31, 2021 |
|
| 61,648,679 |
|
|
| 12,845 |
|
|
| 175,913 |
|
|
| 1,585,113 |
|
|
| (32,560 | ) |
|
| 1,741,311 |
|
Net income per consolidated statements of |
|
| — |
|
|
| — |
|
|
| — |
|
|
| 71,887 |
|
|
| — |
|
|
| 71,887 |
|
Other comprehensive income (loss), net of |
|
| — |
|
|
| — |
|
|
| — |
|
|
| — |
|
|
| (242,843 | ) |
|
| (242,843 | ) |
Cash dividends paid on common stock |
|
| — |
|
|
| — |
|
|
| — |
|
|
| (56,679 | ) |
|
| — |
|
|
| (56,679 | ) |
Shares withheld to pay taxes, long-term |
|
| 118,398 |
|
|
| 24 |
|
|
| (1,711 | ) |
|
| — |
|
|
| — |
|
|
| (1,687 | ) |
Repurchase and retirement of common |
|
| (789,391 | ) |
|
| (164 | ) |
|
| (24,440 | ) |
|
| — |
|
|
| — |
|
|
| (24,604 | ) |
Compensation expense, long-term |
|
| — |
|
|
| — |
|
|
| 4,883 |
|
|
| — |
|
|
| — |
|
|
| 4,883 |
|
Balance, December 31, 2022 |
|
| 60,977,686 |
|
|
| 12,705 |
|
|
| 154,645 |
|
|
| 1,600,321 |
|
|
| (275,403 | ) |
|
| 1,492,268 |
|
Net income per consolidated statements of |
|
| — |
|
|
| — |
|
|
| — |
|
|
| 165,489 |
|
|
| — |
|
|
| 165,489 |
|
Other comprehensive income (loss), net of |
|
| — |
|
|
| — |
|
|
| — |
|
|
| — |
|
|
| 55,680 |
|
|
| 55,680 |
|
Cash dividends paid on common stock |
|
| — |
|
|
| — |
|
|
| — |
|
|
| (56,653 | ) |
|
| — |
|
|
| (56,653 | ) |
Shares withheld to pay taxes, long-term |
|
| 93,487 |
|
|
| 20 |
|
|
| (1,112 | ) |
|
| — |
|
|
| — |
|
|
| (1,092 | ) |
Compensation expense, long-term |
|
| — |
|
|
| — |
|
|
| 6,155 |
|
|
| — |
|
|
| — |
|
|
| 6,155 |
|
Balance, December 31, 2023 |
|
| 61,071,173 |
|
| $ | 12,725 |
|
| $ | 159,688 |
|
| $ | 1,709,157 |
|
| $ | (219,723 | ) |
| $ | 1,661,847 |
|
See notes to consolidated financial statements.
73
80
Trustmark Corporation and Subsidiaries
Consolidated Statements of Cash Flows
($ in thousands)
|
| Years Ended December 31, |
|
| Years Ended December 31, |
| ||||||||||||||||||
|
| 2017 |
|
| 2016 |
|
| 2015 |
|
| 2023 |
|
| 2022 |
|
| 2021 |
| ||||||
Operating Activities |
|
|
|
|
|
|
|
|
|
|
|
|
|
|
|
|
|
|
| |||||
Net income per consolidated statements of income |
| $ | 105,630 |
|
| $ | 108,411 |
|
| $ | 116,038 |
|
| $ | 165,489 |
|
| $ | 71,887 |
|
| $ | 147,365 |
|
Adjustments to reconcile net income to net cash provided by operating activities: |
|
|
|
|
|
|
|
|
|
|
|
|
|
|
|
|
|
|
|
|
| |||
Provision for loan losses, net |
|
| 7,699 |
|
|
| 14,714 |
|
|
| 11,800 |
| ||||||||||||
PCL |
|
| 24,581 |
|
|
| 22,892 |
|
|
| (24,448 | ) | ||||||||||||
Depreciation and amortization |
|
| 38,471 |
|
|
| 36,613 |
|
|
| 37,056 |
|
|
| 35,756 |
|
|
| 39,882 |
|
|
| 45,813 |
|
Net amortization of securities |
|
| 10,964 |
|
|
| 9,664 |
|
|
| 7,793 |
|
|
| 6,140 |
|
|
| 11,206 |
|
|
| 20,310 |
|
Securities (gains) losses, net |
|
| (15 | ) |
|
| 310 |
|
|
| — |
|
|
| (39 | ) |
|
| — |
|
|
| — |
|
Gains on sales of loans, net |
|
| (18,933 | ) |
|
| (20,531 | ) |
|
| (17,953 | ) |
|
| (13,599 | ) |
|
| (24,914 | ) |
|
| (70,954 | ) |
Compensation expense, long-term incentive plan |
|
| 6,155 |
|
|
| 4,883 |
|
|
| 5,601 |
| ||||||||||||
Deferred income tax provision |
|
| 26,068 |
|
|
| 18,000 |
|
|
| 14,800 |
|
|
| (4,800 | ) |
|
| (16,800 | ) |
|
| 20,115 |
|
Proceeds from sales of loans held for sale |
|
| 1,197,821 |
|
|
| 1,404,852 |
|
|
| 1,264,303 |
| ||||||||||||
Purchases and originations of loans held for sale |
|
| (1,179,187 | ) |
|
| (1,392,155 | ) |
|
| (1,279,321 | ) | ||||||||||||
Originations of mortgage servicing rights |
|
| (15,860 | ) |
|
| (16,745 | ) |
|
| (17,598 | ) | ||||||||||||
Proceeds from sales of LHFS |
|
| 1,149,609 |
|
|
| 1,267,967 |
|
|
| 2,357,108 |
| ||||||||||||
Purchases and originations of LHFS |
|
| (1,177,563 | ) |
|
| (1,116,232 | ) |
|
| (2,171,605 | ) | ||||||||||||
Originations of MSR |
|
| (13,712 | ) |
|
| (17,843 | ) |
|
| (28,125 | ) | ||||||||||||
Earnings on bank-owned life insurance |
|
| (5,025 | ) |
|
| (4,883 | ) |
|
| (4,824 | ) |
|
| (5,244 | ) |
|
| (4,875 | ) |
|
| (4,853 | ) |
Net change in other assets |
|
| 23,451 |
|
|
| (20,129 | ) |
|
| 28,794 |
|
|
| (11,454 | ) |
|
| (51,921 | ) |
|
| 42,400 |
|
Net change in other liabilities |
|
| 9,093 |
|
|
| 7,284 |
|
|
| 6,608 |
|
|
| 34,376 |
|
|
| 167,743 |
|
|
| 19,645 |
|
Other operating activities, net |
|
| 6,430 |
|
|
| 2,932 |
|
|
| 5,043 |
|
|
| 1,192 |
|
|
| (57,359 | ) |
|
| (9,601 | ) |
Net cash provided by operating activities |
|
| 206,607 |
|
|
| 148,337 |
|
|
| 172,539 |
| ||||||||||||
Net cash from operating activities |
|
| 196,887 |
|
|
| 296,516 |
|
|
| 348,771 |
| ||||||||||||
|
|
|
|
|
|
|
|
|
|
|
|
|
|
|
|
|
|
|
|
|
| |||
Investing Activities |
|
|
|
|
|
|
|
|
|
|
|
|
|
|
|
|
|
|
|
|
| |||
Proceeds from maturities, prepayments and calls of securities held to maturity |
|
| 174,976 |
|
|
| 277,373 |
|
|
| 126,546 |
|
|
| 103,051 |
|
|
| 136,135 |
|
|
| 197,091 |
|
Proceeds from maturities, prepayments and calls of securities available for sale |
|
| 467,194 |
|
|
| 486,915 |
|
|
| 479,927 |
|
|
| 301,344 |
|
|
| 435,386 |
|
|
| 835,200 |
|
Proceeds from sales of securities available for sale |
|
| 27,682 |
|
|
| 24,693 |
|
|
| — |
|
|
| 4,796 |
|
|
| — |
|
|
| — |
|
Purchases of securities held to maturity |
|
| (69,989 | ) |
|
| (239,446 | ) |
|
| (107,679 | ) |
|
| (19,491 | ) |
|
| (604,938 | ) |
|
| — |
|
Purchases of securities available for sale |
|
| (346,159 | ) |
|
| (547,112 | ) |
|
| (504,920 | ) |
|
| — |
|
|
| (230,527 | ) |
|
| (2,150,935 | ) |
Net proceeds from bank-owned life insurance |
|
| 3,623 |
|
|
| 2,585 |
|
|
| 648 |
|
|
| (46 | ) |
|
| 288 |
|
|
| 1,772 |
|
Net change in federal funds sold and securities purchased under reverse repurchase agreements |
|
| 6,785 |
|
|
| (250 | ) |
|
| 1,635 |
|
|
| 4,000 |
|
|
| (4,000 | ) |
|
| 50 |
|
Net change in member bank stock |
|
| 4,474 |
|
|
| (8,386 | ) |
|
| (18,480 | ) |
|
| 17,830 |
|
|
| (39,329 | ) |
|
| (1,220 | ) |
Net change in loans |
|
| (608,886 | ) |
|
| (677,296 | ) |
|
| (528,050 | ) | ||||||||||||
Net change in LHFI and PPP loans |
|
| (761,931 | ) |
|
| (1,925,327 | ) |
|
| (197,800 | ) | ||||||||||||
Proceeds from sales of PPP loans |
|
| — |
|
|
| — |
|
|
| 353,287 |
| ||||||||||||
Purchases of premises and equipment |
|
| (13,219 | ) |
|
| (10,208 | ) |
|
| (12,757 | ) |
|
| (40,082 | ) |
|
| (26,624 | ) |
|
| (27,360 | ) |
Proceeds from sales of premises and equipment |
|
| 8,377 |
|
|
| 6,799 |
|
|
| 3,061 |
|
|
| 1,863 |
|
|
| 5,107 |
|
|
| 961 |
|
Proceeds from sales of other real estate |
|
| 26,849 |
|
|
| 42,809 |
|
|
| 48,898 |
|
|
| 2,410 |
|
|
| 3,136 |
|
|
| 5,064 |
|
Purchases of software |
|
| (5,498 | ) |
|
| (8,024 | ) |
|
| (8,741 | ) |
|
| (8,575 | ) |
|
| (7,388 | ) |
|
| (3,836 | ) |
Investments in tax credit and other partnerships |
|
| (5,296 | ) |
|
| (116 | ) |
|
| (4,578 | ) |
|
| (16,343 | ) |
|
| (22,321 | ) |
|
| (17,288 | ) |
Purchase of insurance book of business |
|
| — |
|
|
| — |
|
|
| (2,787 | ) | ||||||||||||
Net cash used in business acquisition |
|
| (19,775 | ) |
|
| — |
|
|
| — |
| ||||||||||||
Net cash used in investing activities |
|
| (348,862 | ) |
|
| (649,664 | ) |
|
| (527,277 | ) | ||||||||||||
Net cash from investing activities |
|
| (411,174 | ) |
|
| (2,280,402 | ) |
|
| (1,005,014 | ) | ||||||||||||
|
|
|
|
|
|
|
|
|
|
|
|
|
|
|
|
|
|
|
|
|
| |||
Financing Activities |
|
|
|
|
|
|
|
|
|
|
|
|
|
|
|
|
|
|
|
|
| |||
Net change in deposits |
|
| 355,342 |
|
|
| 467,782 |
|
|
| (110,128 | ) |
|
| 1,132,115 |
|
|
| (649,512 | ) |
|
| 1,038,396 |
|
Net change in federal funds purchased and securities sold under repurchase agreements |
|
| (69,990 | ) |
|
| 98,775 |
|
|
| (2,501 | ) |
|
| (43,586 | ) |
|
| 210,754 |
|
|
| 74,058 |
|
Net change in short-term borrowings |
|
| (67,451 | ) |
|
| (150,748 | ) |
|
| (7,293 | ) | ||||||||||||
Payments on long-term FHLB advances |
|
| (65 | ) |
|
| (94 | ) |
|
| (94 | ) | ||||||||||||
Proceeds from long-term FHLB advances |
|
| — |
|
|
| 250,000 |
|
|
| 500,000 |
| ||||||||||||
Redemption of junior subordinated debt securities |
|
| (3,000 | ) |
|
| — |
|
|
| — |
| ||||||||||||
Payment of subordinated debt |
|
| — |
|
|
| (50,000 | ) |
|
| — |
| ||||||||||||
Net change in other borrowings |
|
| (575,020 | ) |
|
| 974,981 |
|
|
| (19,189 | ) | ||||||||||||
Payments under finance lease obligations |
|
| (721 | ) |
|
| (1,409 | ) |
|
| (1,434 | ) | ||||||||||||
Common stock dividends |
|
| (62,795 | ) |
|
| (62,666 | ) |
|
| (62,605 | ) |
|
| (56,653 | ) |
|
| (56,679 | ) |
|
| (58,085 | ) |
Repurchase and retirement of common stock |
|
| — |
|
|
| (750 | ) |
|
| — |
|
|
| — |
|
|
| (24,604 | ) |
|
| (61,799 | ) |
Shares withheld to pay taxes, long-term incentive plan |
|
| (1,724 | ) |
|
| (1,017 | ) |
|
| (863 | ) |
|
| (1,092 | ) |
|
| (1,687 | ) |
|
| (1,379 | ) |
Net cash provided by financing activities |
|
| 150,317 |
|
|
| 551,282 |
|
|
| 316,516 |
| ||||||||||||
Net cash from financing activities |
|
| 455,043 |
|
|
| 451,844 |
|
|
| 970,568 |
| ||||||||||||
|
|
|
|
|
|
|
|
|
|
|
|
|
|
|
|
|
|
|
|
|
| |||
Net change in cash and cash equivalents |
|
| 8,062 |
|
|
| 49,955 |
|
|
| (38,222 | ) |
|
| 240,756 |
|
|
| (1,532,042 | ) |
|
| 314,325 |
|
Cash and cash equivalents at beginning of year |
|
| 327,706 |
|
|
| 277,751 |
|
|
| 315,973 |
|
|
| 734,787 |
|
|
| 2,266,829 |
|
|
| 1,952,504 |
|
Cash and cash equivalents at end of year |
| $ | 335,768 |
|
| $ | 327,706 |
|
| $ | 277,751 |
|
| $ | 975,543 |
|
| $ | 734,787 |
|
| $ | 2,266,829 |
|
See notes to consolidated financial statements.
74
Note 1 – Significant Accounting Policies
Business
Business
Trustmark Corporation (Trustmark) is a bank holding company headquartered in Jackson, Mississippi. Through its subsidiaries, Trustmark operates as a financial services organization providing banking and financial solutions to corporate institutions and individual customers through 198 offices in Alabama (includes the Georgia Loan Production Office), Florida, Mississippi, Tennessee and Texas.
Basis of Financial Statement Presentation
The consolidated financial statements include the accounts of Trustmark and all other entities in which Trustmark has a controlling financial interest. All significant intercompany accounts and transactions have been eliminated in consolidation. Certain reclassifications have been made to prior period amounts to conform to the current period presentation.
The consolidated financial statements have been prepared in conformity with U.S. generally accepted accounting principles (GAAP). The preparation of financial statements in conformity with these accounting principles requires Management to make estimates and assumptions that affect the reported amounts of assets and liabilities at the date of the financial statements and income and expense during the reporting periods and the related disclosures. Although Management’s estimates contemplate current conditions and how they are expected to change in the future, it is reasonably possible that in 20182024 actual conditions could vary from those anticipated, which could affect Trustmark’s financial condition and results of operations. Actual results could differ from those estimates.
Securities
Securities
Securities are classified as either held to maturity or available for sale. Securities are classified as held to maturity and carried at amortized cost when Management has the positive intent and the ability to hold them until maturity. Securities to be held for indefinite periods of time are classified as available for sale and carried at fair value, with the unrealized holding gains and losses reported as a component of other comprehensive income (loss), net of tax. Securities available for sale are used as part of Trustmark’s interest rate risk management strategy and may be sold in response to changes in interest rates, changes in prepayment rates and other factors. Management determines the appropriate classification of securities at the time of purchase.
The amortized cost of debt securities classified as securities held to maturity or securities available for sale is adjusted for amortization of premiums and accretion of discounts to maturity of the security using the interest method. Such amortization or accretion is included in interest on securities. Realized gains and losses are determined using the specific identification method and are included in noninterest income as securities gains (losses), net.
Securities transferred from the available for sale category to the held to maturity category are recorded at fair value at the date of transfer. Unrealized holding gains or losses associated with the transfer of securities from available for sale to held to maturity are included in the balance of accumulated other comprehensive income (loss), net of tax, in the consolidated balance sheets. These unrealized holding gains or losses are amortized over the remaining life of the security as a yield adjustment in a manner consistent with the amortization or accretion of the original purchase premium or discount on the associated security.
Trustmark reviewsAllowance for Credit Losses (ACL)
Financial Accounting Standards Board (FASB) Accounting Standard Codification (ASC) Topic 326 requires a current expected credit losses methodology for estimating allowances for credit losses and applies to all financial instruments carried at amortized cost, including securities for impairment quarterly. Declines in the fair value of held to maturity, and makes targeted improvements to the accounting for credit losses on securities available for sale.
Under FASB ASC Topic 326, the ACL is an estimate measured using relevant information about past events, including historical credit loss experience on financial assets with similar risk characteristics, current conditions, and reasonable and supportable forecasts that affect the collectability of the remaining cash flows over the contractual term of the financial assets.
Trustmark adopted a zero-credit loss assumption for certain classes of securities. This zero-credit loss assumption applies to debt issuances of the U.S. Treasury and agencies and instrumentalities of the United States government. The reasons behind the adoption of the zero-credit loss assumption were as follows:
75
Trustmark continuously monitors any changes in economic conditions, credit downgrades, changes to explicit or implicit guarantees granted to certain debt issuers, and any other relevant information that would indicate potential credit deterioration and prompt Trustmark to reconsider its zero-credit loss assumption.
Securities Available for Sale
FASB ASC Subtopic 326-30, “Financial Instruments-Credit Losses-Available-for-Sale Debt Securities,” replaced the concept of other-than-temporarily impaired with the ACL. Unlike securities held to maturity, securities available for sale are evaluated on an individual level and pooling of securities below their cost thatis not allowed.
Quarterly, Trustmark evaluates if any security has a fair value less than its amortized cost. Once these securities are deemedidentified, in order to be other than temporary are reflecteddetermine whether a decline in earnings as realized losses to the extent the impairment is related tofair value resulted from a credit losses. The amount of the impairment related toloss or other factors, is recognizedTrustmark performs further analysis as a component of other comprehensive income (loss), net of tax. In estimating other-than-temporary impairment losses, Management considers, among other things, the length of time andoutlined below:
The DCF analysis utilizes contractual maturities, as well as third-party credit ratings and abilitycumulative default rates published annually by Moody’s Investor Service (Moody’s).
Accrued interest receivable is excluded from the estimate of credit losses for securities available for sale and reported in other assets on the consolidated balance sheets.
Securities Held to holdMaturity
FASB ASC Subtopic 326-20, “Financial Instruments-Credit Losses-Measured at Amortized Cost,” requires institutions to measure expected credit losses on financial assets carried at amortized cost on a collective or pool basis when similar risks exist. Trustmark uses several levels of segmentation to measure expected credit losses for its held to maturity securities:
As discussed above, Trustmark has determined that for certain classes of securities it would be appropriate to assume the securityexpected credit loss to be zero, which include debt issuances of the U.S. Treasury and agencies and instrumentalities of the United States government. This assumption is reviewed and attested to quarterly. Trustmark uses an internally built model to verify the accuracy of third-party provided calculations.
Accrued interest receivable is excluded from the estimate of credit losses for securities held to maturity and included in other assets on the consolidated balance sheets.
Trustmark monitors the credit quality of securities held to maturity on a period of time sufficient to allow for any anticipated recovery in fair value.monthly basis through credit ratings.
76
Loans Held for Sale (LHFS)
Primarily, allTrustmark's LHFS portfolio consists of mortgage loans purchased from wholesale customers or originated in Trustmark’s General Banking Division are considered to be held for sale. In certain circumstances, Trustmark will retain a mortgage loan in its portfolio based on banking relationships or certain investment strategies.Segment. Trustmark has elected to account for its LHFS under the fair value option permitted by Financial Accounting Standards Board (FASB) Accounting Standards Codification (ASC)FASB ASC Topic 825, “Financial Instruments,” with interest income on the LHFS reported in interest and fees on LHFS and LHFI. Trustmark reports unrealized gains and losses resulting from changes in the fair value of the LHFS accounted for under the fair value option as noninterest income in mortgage banking, net. LHFS are actively managed and monitored and certain market risks of the loans may be mitigated through the use of derivatives. These derivative instruments are carried at fair value with changes in the fair value reported as noninterest income in mortgage banking, net. Changes in the fair value of the LHFS are largely offset by changes in the fair value of the derivative instruments. Election of the fair value option allows Trustmark to reduce the accounting volatility that would otherwise result from the asymmetry
82
created by accounting for its LHFS at the lower of cost or fair value and the derivative instruments at fair value. Realized gains and losses upon ultimate sale of the loans are reported as noninterest income in mortgage banking, net.
Government National Mortgage Association (GNMA) optional repurchase programs allow financial institutions to buy back individual delinquent mortgage loans that meet certain criteria from the securitized loan pool for which the institution provides servicing. At the servicer’s option and without GNMA’s prior authorization, the servicer may repurchase such a delinquent loan for an amount equal to 100 percent of the remaining principal balance of the loan. Under FASB ASC Topic 860, “Transfers and Servicing,” this buy-back option is considered a conditional option until the delinquency criteria are met, at which time the option becomes unconditional. When Trustmark is deemed to have regained effective control over these loans under the unconditional buy-back option, the loans can no longer be reported as sold and must be brought back onto the balance sheet as LHFS, regardless of whether Trustmark intends to exercise the buy-back option. These loans are reported as LHFS with the offsetting liability being reported as short-term borrowings. The fair value option election does not apply to the GNMA optional repurchase loans which do not meet the requirements under FASB ASC Topic 825 to be accounted for under the fair value option.
Trustmark defers the upfront loan fees and costs related to the LHFS. In general, the LHFS are only retained on Trustmark’s balance sheet for 30 to 45 days before they are pooled and sold in the secondary market. The difference between deferring these loan fees and costs until the loans are sold and recognizing them in earnings as incurred as required by FASB ASC TopicSubtopic 825-10 is considered immaterial. Deferred loan fees and costs are reflected in the basis of the LHFS and, as such, impact the resulting gain or loss when the loans are sold.
Loans Held for Investment (LHFI)
LHFI are statedloans that management has the intent and ability to hold for the foreseeable future or until maturity or pay-off and are reported at amortized cost net of the ACL. Amortized cost is the amount of unpaid principal, adjusted for the net amount of direct costs and nonrefundable loan fees associated with lending. The net amount of nonrefundable loan origination fees and direct costs associated with the lending process, including commitment fees, is deferred and accreted to interest income over the lives of the loans using a method that approximates the interest method. Interest on LHFI is accrued and recorded as interest income based on the outstanding principal balance.
Past due LHFI are loans contractually past due 30 days or more as to principal or interest payments. A LHFI is classified as nonaccrual, and the accrual of interest on such loan is discontinued, when the contractual payment of principal or interest becomes 90 days past due on commercial credits and 120 days past due on non-business purpose credits. In addition, a credit may be placed on nonaccrual at any other time Management has serious doubts about further collectibilitycollectability of principal or interest according to the contractual terms, even though the loan is currently performing. A LHFI may remain in accrual status if it is in the process of collection and well secured.well-secured. When a LHFI is placed in nonaccrual status, interest accrued but not received is reversed against interest income. Interest payments received on nonaccrual LHFI are applied against principal under the cost-recovery method, until qualifying for return to accrual status. Under the cost-recovery method, interest income is not recognized until the principal balance is reduced to zero. LHFI are restored to accrual status when the ultimate collectability of the total contractual principal and interest is no longer in doubt and the obligation ishas either been brought current or has performed in accordance with the contractual terms for a reasonable period of timetime.
Purchased Credit Deteriorated (PCD) Loans
Purchased loans which have experienced more than insignificant credit deterioration since origination are considered PCD loans. An initial ACL for PCD loans is determined at acquisition using the same ACL methodology as the LHFI. The initial ACL determined on a collective basis is allocated to individual loans. PCD loans are reported at the amortized cost, which equals the loan purchased price plus the initial ACL. The difference between the amortized cost basis of the PCD loan and the ultimate collectibility of the total contractual principal and interest is no longer in doubt.
A LHFI is considered impaired when, based on current information and events, it is probable that Trustmark will be unable to collect the scheduled payments of principal or interest when due according to the contractual termspar value of the loan agreement.is the noncredit premium or discount, which is amortized into interest income over the life of the loan. Subsequent changes to the ACL are recorded through the PCL, LHFI.
77
Upon adoption of FASB ASC Topic 326, Trustmark considers all nonaccrual LHFIelected to maintain pools of loans that were previously accounted for under FASB ASC Subtopic 310-30, “Receivables-Loans and LHFI classifiedDebt Securities Acquired with Deteriorated Credit Quality,” and will continue to account for these pools as a troubled debt restructuring (TDR)unit of account. Loans are only removed from the existing loan pools if they are written off, paid off or sold. Upon adoption of FASB ASC Topic 326, the ACL was determined for each pool and added to the pool’s carrying value to establish a new amortized cost basis. The difference between the unpaid principal balance of the pool and the new amortized cost basis is the noncredit premium or discount which will be impaired loans. All commercial nonaccrual relationshipsamortized into interest income over the remaining life of $500 thousand or more and all LHFI classified as TDRsthe pool. Changes to the ACL after adoption of FASB ASC Topic 326 are individually reviewedrecorded through the PCL, LHFI.
ACL
LHFI
Trustmark’s ACL methodology for impairment (individually evaluated impaired LHFI). If a LHFI is deemed impaired, a specific valuation allowance is allocated, if necessary, so that the loan is reported net, at the present value of estimated future cash flows using the loan’s existing rate or at the fair value of collateral if repayment is expected solely from the collateral. Commercial nonaccrual relationships under $500 thousand are not individually evaluated for impairment due to the insignificant number and dollar amount of these types of loans. Nonaccrual LHFI includes both individually evaluated impaired LHFIbased upon guidance within FASB ASC Subtopic 326-20 as well as smaller balance homogeneous loansapplicable regulatory guidance. The ACL on LHFI is a valuation account that are collectively evaluated for impairment. Consistent with the policy for nonaccrual LHFI, interest payments on impaired LHFI are applied to principal. Impaired LHFI, or portions thereof, are charged off when deemed uncollectible.
Troubled Debt Restructuring
A TDR occurs when a borrower is experiencing financial difficulties, and for related economic or legal reasons, a concession is granted to the borrower that Trustmark would not otherwise consider. Whatever the form of concession that might be granted by Trustmark, Management’s objective is to enhance collectibility by obtaining more cash or other valuededucted from the borrower or by increasingloans’ amortized cost basis to present the probability of receipt by granting the concession than by not granting it. Other concessions may arise from court proceedings or maynet amount expected to be imposed by law. In addition, TDRs also include those credits that are extended or renewed to a borrower who is not able to obtain funds from sources other than Trustmark at a market interest rate for new debt with similar risk.
83
A formal TDR may include, but is not necessarily limited to, one or a combination of the following situations:
Trustmark accepts a third-party receivable or other asset(s) of the borrower, in lieu of the receivable from the borrower.
Trustmark accepts an equity interest in the borrower in lieu of the receivable.
Trustmark accepts modification of the terms of the debt including but not limited to:
|
|
|
|
|
|
|
|
Troubled debt restructurings are addressed in Trustmark’s loan policy, and in accordance with that policy, any modifications or concessions that may result in a TDR are subject to a special approval process which allows for control, identification, and monitoring of these arrangements. Prior to granting a concession, a revised borrowing arrangement is proposed which is structured so as to improve collectability of the loan in accordance with a reasonable repayment schedule with any loss promptly identified. It is supported by a thorough evaluation of the borrower’s financial condition and prospects for repayment under those revised terms. Other TDRs arising from renewals or extensions of existing debt are routinely identified through the processes utilized in the Problem Loan Committees and in the Credit Quality Review Committee. TDRs are subsequently reported to the Director Credit Policy Committee on a quarterly basis and are disclosed in Trustmark’s consolidated financial statements in accordance with GAAP and regulatory reporting guidance.
All loans whose terms have been modified in a troubled debt restructuring are evaluated for impairment under FASB ASC Topic 310, “Receivables.” Accordingly, Trustmark measures any losscollected on the restructuring in accordance with that guidance. A TDR in which Trustmark receives physical possession of the borrower’s assets, regardless of whether formal foreclosure or repossession proceedings take place, is accounted for in accordance with FASB ASC Subtopic 310-40, “Troubled Debt Restructurings by Creditors.” Thus, the loan is treated as if assets have been received in satisfaction of the loan and reported as a foreclosed asset.
A TDR may be returned to accrual status if Trustmark is reasonably assured of repayment of principal and interest under the modified terms and the borrower has demonstrated sustained performance under those terms for a period of at least six months. Otherwise, the restructured loan must remain on nonaccrual.
Allowance for Loan Losses, LHFI
The allowance for loan losses, LHFI is established through provisions for estimated loan losses charged against net income. The allowance account is maintained at a level which is believed to be adequate by Management based on estimated probable lossesloans. Credit quality within the LHFI portfolio is continuously monitored by Management and is reflected within the ACL on LHFI. The ACL on LHFI is an estimate of expected losses inherent within Trustmark’s existing LHFI portfolio. The ACL on LHFI is adjusted through the PCL, LHFI and reduced by the charge off of loan amounts, net of recoveries.
The loan loss estimation process involves procedures to appropriately consider the unique characteristics of Trustmark’s LHFI portfolio segments. These segments are further disaggregated into loan classes, the level at which credit risk is estimated. When computing allowance levels, credit loss assumptions are estimated using a model that categorizes loan pools based on loss history, delinquency status and other credit trends and risk characteristics, including current conditions and reasonable and supportable forecasts about the future. Evaluations of the portfolio and individual credits are inherently subjective, as they require estimates, assumptions and judgments as to the facts and circumstances of particular situations. SomeDetermining the appropriateness of the allowance is complex and requires judgment by Management about the effect of matters that are inherently uncertain. In future periods, evaluations of the overall LHFI portfolio, in light of the factors considered, such as amounts and timing of future cash flows expected to be received,forecasts then prevailing, may be susceptible toresult in significant change.changes in the allowance and credit loss expense.
Trustmark’s allowance methodology is basedTrustmark estimates the ACL on guidance provided in Securities and Exchange Commission (SEC) Staff Accounting Bulletin (SAB) No. 102, “Selected Loan Loss Allowance Methodology and Documentation Issues,” as well as other regulatory guidance. The allowance for loan losses, LHFI consists of three components: (i) a historical valuation allowance determined in accordance with FASB ASC Topic 450, “Contingencies,” based on historical loan loss experience for LHFI with similar characteristics and trends, (ii) a specific valuation allowance determined in accordance with FASB ASC Topic 310 based on probable losses on specific LHFI and (iii) a qualitative risk valuation allowance determined in accordance with FASB ASC Topic 450 based on general economic conditions and other specificusing relevant available information, from internal and external qualitative risk factors. Eachsources, relating to past events, current conditions and reasonable and supportable forecasts. Trustmark uses a third-party software application to calculate the quantitative portion of these components calls for estimates,the ACL on LHFI using a methodology and assumptions and judgments as described below.
Historical Valuation Allowance
The historical valuation allowance is derived by application of a historical net loss percentage to the outstanding balances of LHFI contained in designated pools and risk rating categories. Pools are established by grouping credits that display similar characteristics and trends such as commercial LHFI for working capital purposes and non-working capital purposes, commercial purpose LHFI secured by real estate (which are further segregated into 1-4 family construction, non 1-4 family construction, land, lots and development, owner-occupied and non-owner occupied categories), other commercial loans, 1-4 family LHFI, 1-4 family LHFI
84
secured by junior liens and other consumer LHFI. Within these pools, LHFI are further segregated based on Trustmark’s internal credit risk rating process that evaluates, among other things: the obligor’s ability and willingness to pay, the value of underlying collateral, the ability of guarantors to meet their payment obligations, management experience and effectiveness, and the economic environment and industry in which the borrower operates. The historical net loss percentages, calculated on a quarterly basis, are proportionally distributedspecific to each risk rate within loan groups based upon degree of risk. Using third-party default data, which is updated annually to incorporate the most recent year’s information, average cumulative issuer-weighted global default rates by alphanumeric rating are aggregated by Trustmark’s commercial loan risk rates. Management uses the long-term default rates to measure the relative risk across the risk rates while the 12-quarter quantitative loss rate sets the absolute level of allowance for loan loss reserve. Further, given the volatility in the default data, the longer look-back period provides for a more stable allowance for loan loss estimate which better reflects the incremental risk across the risk rates.
pool. The historical net loss percentages are calculated using a 12 quarter look-back period, which is the period that best reflects losses inherent in the current loan portfolio. The look-back period sufficiently captures the volatility in net charge-off rates from quarter to quarter and affects the qualitative adjustments that are required to capture the differences in conditions between the current period and those that were prevailing during the look-back period.
The loss emergence period (LEP) refers to the period of time between the events that trigger a loss and charge-off of that loss. Losses are usually not immediately known and determining the loss event can be difficult. It takes time for the borrower and extent of loss to be identified and determined. Management may not be aware that the loss event has occurred until the borrower exhibits the inability to pay or other evidence of credit deterioration. The LEP is evaluated annually to incorporate the most recent year’s data and adjusted as necessary.
Loans-Specific Valuation Allowance
Once a LHFI is classified, it is subject to periodic review to determine whether or not the loan is impaired. If determined to be impaired, the loan is evaluated using oneportion of the valuation criteria contained in FASB ASC Topic 310 (i.e., individually or collectively evaluated), and a specific valuation allowance is allocated, if necessary, so that the loan is reported at the net realizable value.
Qualitative Risk Valuation Allowance
The qualitative risk valuation allowance is based on general economic conditions and other internal and external factors affecting Trustmark as a whole as well as specific LHFI. Factors considered include the following within Trustmark’s five key market regions: the experience, ability,following: lending policies and effectivenessprocedures, economic conditions and concentrations of Trustmark’s lending managementcredit, nature and staff; adherence to Trustmark’s loans policies, procedures and internal controls; the volume of exceptions relatingthe portfolio, performance trends, and external factors. The quantitative and qualitative portions of the allowance are added together to collateral, underwritingdetermine the total ACL on LHFI, which reflects Management’s expectations of future conditions based on reasonable and financial documentation;supportable forecasts.
The methodology for estimating the amount of expected credit concentrations; recent performance trends; regional economic trends;losses reported in the impactACL on LHFI has two basic components: a collective, or pooled, component for estimated expected credit losses for pools of recent acquisitions;loans that share similar risk characteristics, and an asset-specific component involving individual loans that do not share risk characteristics with other loans and the impactmeasurement of significant natural disasters. These factorsexpected credit losses for such individual loans. In estimating the ACL for the collective component, loans are evaluatedsegregated into loan pools based on loan product types and similar risk characteristics.
Trustmark determined that reasonable and supportable forecasts could be made for a twelve-month period for all of its loan pools. To the extent the lives of the loans in the LHFI portfolio extend beyond this forecast period, Trustmark uses a reversion period of four quarters and reverts to the historical mean on a quarterlystraight-line basis withover the results representing Trustmark’s qualitative risk profile in the current period which is used to establish an appropriate allowance. The qualitative portionremaining life of the commercialloans.
The ACL for individual loans that do not share risk characteristics with other loans is measured as the difference between the discounted value of expected future cash flows, based on the effective interest rate at origination, and consumer LHFI allowance for loan loss methodology also incorporates the use of maximum observed gross historical losses observed through the last economic cycle as a way to calculate a maximum qualitative reserve limit. The maximum observed gross historical losses as a percentageamortized cost basis of the loan, balances results in a maximum observed gross historical loss rate. Onceor the quantitative componentnet realizable value. The ACL is the difference between the loan’s net realizable value and its amortized cost basis (net of previous charge-offs and deferred loan fees and costs), except for collateral-dependent loans. A loan is collateral dependent when the borrower is experiencing financial difficulty and repayment of the allowance for loan loss methodology is calculated,expected to be provided substantially through the quantitative reserve percentage is deducted from the maximum observed gross historical loss rate to determine the maximum possible qualitative reserve limit. Management uses its qualitative factor evaluation process in conjunction with this maximum to determine the appropriate estimatesale of the qualitative considerations not capturedcollateral. The expected credit loss for collateral-dependent loans is measured as the difference between the amortized cost basis of the loan and the fair value of the collateral, adjusted for the estimated cost to sell. Fair value estimates for collateral-dependent loans are derived from appraised values based on the current market value or the ‘as is’ value of the collateral, normally from recently received and reviewed appraisals. Current appraisals are ordered on an annual basis based on the inspection date or more often if market conditions necessitate. Appraisals are obtained from state-certified appraisers and are based on certain assumptions, which may include construction or development status and the highest and best use of the property. These appraisals are reviewed by Trustmark’s historicalAppraisal Review Department to ensure they are acceptable, and values are adjusted down for costs associated with asset disposal. If the calculated expected credit loss rates.is determined to be permanent or not recoverable, the amount of the expected credit loss is charged off.
Other factors78
Accrued interest receivable is not included in the qualitative risk valuation allowance include consideration of: commercial loan facility risk that embodiesamortized cost basis of Trustmark’s LHFI and, therefore, excluded from the nature, frequency and durationestimate of credit losses for LHFI.
LHFI are charged off against the repayment structure as it pertainsACL on LHFI, with any subsequent recoveries credited back to the actual sourceACL on LHFI account. Recoveries may not exceed the aggregate of amounts previously charged off. Trustmark’s Loan Policy Manual dictates the guidelines to be followed in determining when a loan repayment, commercial nonaccrual relationships under $500 thousand which are below the threshold to perform a specific impairment analysis, and independent consumer credit bureau scores that are monitored to identify shifts in risk that are represented in the retail portfolio. These factors are also evaluated on a quarterly basis with the exception of the commercial nonaccrual relationships under $500 thousand which are evaluated monthly.
is charged off. Commercial purpose LHFI are charged off when a determination is made that the loan is uncollectible and continuance as a bankable asset is not warranted. Consumer LHFI secured by 1-4 family residential real estate are generally charged off or written down to the fair value of the collateral less cost to sell at no later than 180 days of delinquency. Non-real estate consumer purpose LHFI, including both secured and unsecured loans, are generally charged off by 120 days of delinquency. Consumer revolving lines of credit and credit card debt are generally charged off on or prior to 180 days of delinquency. LHFI are charged off against the allowance for loan losses, LHFI, with any subsequent recoveries credited back to the allowance account.
85
Acquired LoansACL on Off-Balance Sheet Credit Exposures
Acquired loans are accounted for under the acquisition method of accounting. The acquired loans are recorded at their estimated fair value at the time of acquisition. The fair value of acquired loans is determined using a discounted cash flow model based on assumptions regarding the amount and timing of principal and interest payments, estimated prepayments, estimated default rates, estimated loss severity in the event of defaults and current market rates. Estimated credit losses are included in the determination of fair value; therefore, an allowance for loan losses is not recorded on the acquisition date.
Trustmark accounts for acquired impaired loans under FASB ASC Topic 310-30, “Loans and Debt Securities Acquired with Deteriorated Credit Quality.” An acquired loan is considered impaired when there is evidence of credit deterioration since origination and it is probable at the date of acquisition that Trustmark would be unable to collect all contractually required payments. Acquired loans accounted for under FASB ASC Topic 310-30 are referred to as “acquired impaired loans.” Revolving credit agreements, such as home equity lines, and commercial leases are excluded from acquired impaired loan accounting requirements.
For acquired impaired loans, Trustmark (i) calculates the contractual amount and timing of undiscounted principal and interest payments (the “undiscounted contractual cash flows”) and (ii) estimates the amount and timing of undiscounted expected principal and interest payments (the “undiscounted expected cash flows”). Under FASB ASC Topic 310-30,Subtopic 326-20, Trustmark is required to estimate expected credit losses for off-balance sheet credit exposures which are not unconditionally cancellable. Trustmark maintains a separate ACL on off-balance sheet credit exposures, including unfunded loan commitments and letters of credit.
Expected credit losses for off-balance sheet credit exposures are estimated by calculating a commitment usage factor over the difference betweencontractual period for exposures that are not unconditionally cancellable by Trustmark. Trustmark calculates a loan pool level unfunded amount for the undiscounted contractual cash flowsperiod. Trustmark views the loan pools as either closed-ended or open-ended. Closed-ended loan pools are those that typically fund up to 100% such as other construction and nonowner-occupied. Open-ended loan pools are those that behave similar to a revolver such as the undiscounted expected cash flows iscommercial and industrial and home equity line of credit loan pools. In addition to the nonaccretable difference. The nonaccretable difference represents an estimateunfunded balances, Trustmark uses a funding rate for loan pools that are considered open-ended. Trustmark calculates the funding rate of the loss exposure of principalopen-ended loan pools each period. In order to mitigate volatility and interest relatedincorporate historical experience in the funding rate, Trustmark uses a twelve-quarter moving average. For the closed-ended loan pools, Trustmark takes a conservative approach and uses a 100% funding rate. The expected funding rate is applied to each pool’s unfunded commitment balances to ensure that reserves will be applied to each pool based on balances expected to be funded based upon historical levels. In addition to the acquired impairedfunding rate being applied to the unfunded commitment balance, a reserve rate is applied that incorporates both quantitative and qualitative aspects of the current period’s expected credit loss rate. The reserve rate is loan portfolio,pool specific and suchis applied to the unfunded amount is subject to change over time basedensure loss factors, both quantitative and qualitative, are being considered on the performance of such loans. The excess of undiscounted expected cash flows at acquisition over the initial fair value of acquired impaired loans is referred to as the “accretable yield” and is recorded as interest income over the estimated life of the loans using the effective yield method if the timing and amount of the future cash flows is reasonably estimable. Under the effective yield method, the accretable yield is recorded as an accretion of interest income over the life of the loan.
Trustmark aggregates certain acquired impaired loans into pools of loans with common credit risk characteristics such as loan type and risk rating. To establish accounting pools of acquired impaired loans, loans are first categorized by similar purpose, collateral and geographic region. Within each category, the acquired impaired loans are further segmented by ranges of risk determinants observed at the time of acquisition. For commercial loans, the primary risk determinant is the risk rating as assigned by Trustmark. For consumer loans, the risk determinants include delinquency, delinquency history and FICO scores. Statistical comparison of the pools reflect that each pool is comprised of acquired impaired loans generally of similar characteristics, including loan type, loan risk and weighted average life. Each pool is then reviewed for similarity of the pool constituents, including standard deviation of purchase price, weighted average life and concentration of the largest loans. Loan pools are initially booked at the aggregate fair valueunfunded portion of the loan pool, constituents, basedconsistent with the methodology applied to the funded loan pools. Adjustments to the ACL on off-balance sheet credit exposures are recorded to the present value of Trustmark's expected cash flows fromPCL, off-balance sheet credit exposures.
No credit loss estimate is reported for off-balance sheet credit exposures that are unconditionally cancellable by Trustmark or for undrawn amounts under such arrangements that may be drawn prior to the acquired impaired loans. An acquired impaired loan is removed from a pool of loans only if the loan is sold, foreclosed, payment is received in full satisfactioncancellation of the loan or the loan is fully charged off. The acquired impaired loan is removed from the pool at the carrying value. When an individual acquired impaired loan is removed from a pool of loans, the difference between its relative carrying amount and the cash, collateral (measured at fair value) or other assets received will be recognized as a gain or loss immediately in interest income on acquired loans and would not affect the effective yield used to recognize the accretable yield on the remaining pool. Certain acquired impaired loans are not pooled and are accounted for individually. Such acquired impaired loans are withheld from pools due to the inherent uncertainty of the timing and amount of their cash flows or because they are not a suitable similar constituent to the established pools.arrangement.
As required by FASB ASC Topic 310-30, Trustmark periodically re-estimates the expected cash flows to be collected over the life of the acquired impaired loans. If, based on current information and events, it is probable that Trustmark will be unable to collect all cash flows expected at acquisition plus additional cash flows expected to be collected arising from changes in estimate after acquisition, the acquired loans are considered impaired. The decrease in the expected cash flows reduces the carrying value of the acquired impaired loans as well as the accretable yield and results in a charge-off through the allowance for loan losses, acquired loans or the establishment of an allowance for loan losses, acquired loans with a charge to income through the provision for loan losses, acquired loans. If, based on current information and events, it is probable that there is a significant increase in the cash flows previously expected to be collected or if actual cash flows are significantly greater than cash flows previously expected, Trustmark will reduce any remaining allowance for loan losses, acquired loans established on the acquired impaired loans for the increase in the present value of cash flows expected to be collected. The increase in the expected cash flows for the acquired impaired loans over those originally estimated at acquisition increases the carrying value of the acquired impaired loans as well as the accretable yield. The increase in the accretable yield is recognized as interest income prospectively over the remaining life of the acquired impaired loans. The carrying value of acquired impaired loans is reduced by payments received, both principal and interest, and increased by the portion of the accretable yield recognized as interest income.
Under FASB ASC Topic 310-30, acquired impaired loans are generally considered accruing and performing loans as the loans accrete interest income over the estimated life of the loan when expected cash flows are reasonably estimable. Accordingly, acquired impaired loans that are contractually past due are still considered to be accruing and performing loans as long as the estimated cash
86
flows are received as expected. If the timing and amount of cash flows is not reasonably estimable, the loans may be classified as nonaccrual loans and interest income may be recognized on a cash basis or as a reduction of the principal amount outstanding.
Premises and Equipment, Net
Premises and equipment are statedreported at cost, less accumulated depreciation and amortization. Depreciation is charged to expense over the estimated useful lives of the assets, which are up to thirty-nine years for buildings and three to ten years for furniture and equipment. Leasehold improvements are amortized over the terms of the respective leases or the estimated useful lives of the improvements, whichever is shorter. In cases where Trustmark has the right to renew the lease for additional periods, the lease term for the purpose of calculating amortization of the capitalized cost of the leasehold improvements is extended when Trustmark is “reasonably assured” that it will renew the lease. Depreciation and amortization expenses are computed using the straight-line method. Trustmark continually evaluates whether events and circumstances have occurred that indicate that such long-lived assets have become impaired. Measurement of any impairment of such long-lived assets is based on the fair values of those assets.
Branch closures and purchased land held for future branch expansion for more than five years are evaluated to determine if the related land, buildings and building improvements should be transferred to assets held for sale in accordance with FASB ASC Topic 360, “Property, Plant and Equipment.” The property is transferred to assets held for sale at the lower of its carrying value or fair value less cost to sell. An impairment loss is recorded at the time of transfer if the carrying value of the assets exceeds the fair value. Impairment losses are recorded as non-interestnoninterest expense in other expense.
Mortgage Servicing Rights (MSR)
Trustmark recognizes as assets the rights to service mortgage loans based on the estimated fair value of the MSR when loans are sold and the associated servicing rights are retained. Trustmark has elected to account for the MSR at fair value.
The fair value of the MSR is determined using discounted cash flow techniques benchmarked against third-party valuations.a valuation model administered by a third party that calculates the present value of estimated future net servicing income. Estimates of fair value involve several assumptions, including the key valuation assumptions
79
about market expectations of future prepayment rates, interest rates and discount rates which are provided by a third-party firm. Prepayment rates are projected using an industry standard prepayment model. The model considers other key factors, such as a wide range of standard industry assumptions tied to specific portfolio characteristics such as remittance cycles, escrow payment requirements, geographic factors, foreclosure loss exposure, VA no-bid exposure, delinquency rates and cost of servicing, including base cost and cost to service delinquent mortgages. Prevailing market conditions at the time of analysis are factored into the accumulation of assumptions and determination of servicing value.
Trustmark economically hedges changes in the fair value of the MSR attributable to interest rates. See Note 1 – Significant Accounting Policies,the section titled “Derivative Financial Instruments – Derivatives notNot Designated as Hedging Instruments” of this note for information regarding these derivative instruments.
Trustmark receives annual servicing fee income for loans serviced, which is recorded as noninterest income in mortgage banking, net. The fees are based on a contractual percentage of the outstanding principal or a fixed amount per loan and are recorded as income when earned. Late fees and ancillary fees related to loan servicing are not considered material.
Goodwill and Identifiable Intangible Assets
Trustmark accounts for goodwill and other intangible assets in accordance with FASB ASC Topic 350, “Intangibles – Goodwill and Other.” Goodwill, which represents the excess of cost over the fair value of the net assets of an acquired business, is not amortized but tested for impairment on an annual basis, which is October 1 for Trustmark, or more often if events or circumstances indicate that there may be impairment.
Identifiable intangible assets are acquired assets that lack physical substance but can be distinguished from goodwill because of contractual or legal rights or because the assets are capable of being sold or exchanged either on their own or in combination with a related contract, asset or liability. Trustmark’s identifiable intangible assets primarily relate to core deposits, insurance customer relationships and borrower relationships. These intangibles, which have definite useful lives, are amortized on an accelerated basis over their estimated useful lives. In addition, these intangibles are evaluated for impairment whenever events and changes in circumstances indicate that the carrying amount should be reevaluated. Trustmark also purchased banking charters in order to facilitate its entry into the states of Florida and Texas. These identifiable intangible assets are being amortized on a straight-line method over 20 years.
87
Other real estate includes assets that have been acquired in satisfaction of debt through foreclosure and is carriedrecorded at the lowerfair value less cost to sell (estimated fair value) at the time of cost or estimated fair value.foreclosure. Fair value is based on independent appraisals and other relevant factors. Valuation adjustments requiredWhen foreclosed real estate is received in full satisfaction of a loan, the amount, if any, by which the recorded amount of the loan exceeds the estimated fair value of the property is a loss charged against the ACL at foreclosure are chargedthe time of foreclosure. If the recorded amount of the loan is less than the estimated fair value of the property, a credit is recorded to write-downs of other real estate at the allowance for loan losses. time of foreclosure.
Other real estate is revalued on an annual basis or more often if market conditions necessitate. An other real estate specific reserve may be recorded through other real estate expense for declines in fair value subsequent to foreclosure based on recent appraisals or changes in market conditions. Subsequent to foreclosure, losses on the periodic revaluation of the property are charged against an existing other real estate specific reserve or as noninterest expense in other real estate expense if a reserve does not exist. Costs of operating and maintaining the properties as well as gains or losses on their disposition are also included in other real estate expense as incurred. Improvements made to properties are capitalized if the expenditures are expected to be recovered upon the sale of the properties.
Leases
Lessor Arrangements
Trustmark leases certain types of machinery and equipment to its commercial customers through sales-type and direct financing leases as part of its equipment financing portfolio. Sales-type and direct financing leases are similar to other forms of installment lending in that lessors generally do not retain benefits and risks incidental to ownership of the property subject to the leases. Such arrangements are essentially financing transactions that permit lessees to acquire and use property. Trustmark does not have any significant operating leases in which it is the lessor.
As lessor, the sum of all minimum lease payments over the lease term and the estimated residual value, less unearned interest income, is recorded as the net investment in the lease on the commencement date and is included in LHFI on the consolidated balance sheets. Interest income is accrued as earned over the term of the lease based on the net investment in the leases and is recognized in
80
interest and fees on LHFS and LHFI on the consolidated statements of income. Certain fees or costs associated with lease originations are deferred and accreted or amortized to interest income over the life of the lease using the effective interest method.
Trustmark’s portfolio of sales-type and direct financing leases generally have remaining lease terms of three to ten years, some of which include renewal options and/or options for the lessee to purchase the leased property near or at the end of the lease term at either the residual value or a specified price. Trustmark expects to sell or release the equipment at the end of the lease term. Due to the structure of these leases, there is no selling profit or loss on these transactions.
Lessee Arrangements
Trustmark has certain contracts that it has identified as leases according to FASB ASC Topic 842, "Leases". Trustmark classifies these leases as either operating or finance leases and recognizes a right-of-use asset and a lease liability at the lease commencement date. The lease liability represents the present value of the lease payments that remain unpaid as of the commencement date and the right-of-use asset is the initial lease liability recognized for the lease plus any lease payments made to the lessor at or before the commencement date as well as any initial direct costs less any lease incentives received. Trustmark accounts for the lease and nonlease components separately as such amounts are readily determinable.
Trustmark’s finance leases consist of building and equipment leases. Trustmark recognizes interest expense based on the discount rate of the lease as interest expense in other interest expense and recognizes depreciation expense on a straight-line basis over the lease term as noninterest expense in net occupancy – premises for building leases and in equipment expense for equipment leases. Trustmark amortizes the right-of-use asset over the life of the lease term on a straight-line basis. Trustmark’s lease liabilities are measured as the present value of the remaining lease payments throughout the lease term. Trustmark records its finance lease right-of-use assets in premises and equipment, net and its finance lease liabilities in other borrowings.
Trustmark’s operating leases primarily consist of building and land leases. Trustmark recognizes lease rent expense on a straight-line basis over the term of the lease contract and records it as noninterest expense in net occupancy – premises for building and land leases and in equipment expense for equipment leases. Trustmark’s amortization of the right-of-use asset is the difference between the straight-line lease expense and the interest expense recognized on the lease liability during the period. Trustmark’s lease liabilities are measured as the present value of the remaining lease payments throughout the lease term.
Trustmark’s leases typically have one or more renewal options included in the lease contract. Due to the nature of Trustmark’s leases, for leases with renewal options available, Trustmark considers the first renewal option as reasonably certain to renew and is therefore included in the measurement of the right-of-use assets and lease liabilities.
In order to calculate its right-of-use assets and lease liabilities, FASB ASC Topic 842 requires Trustmark to use the rate of interest implicit in the lease when readily determinable. If the rate implicit in the lease is not readily determinable, Trustmark is required to use its incremental borrowing rate, which is the rate of interest Trustmark would have to pay to borrow on a collateralized basis over a similar term in a similar economic environment. Trustmark was able to determine the implicit interest rate for its equipment leases and used that rate as its discount rate. Since the implicit interest rate for most of its building and land leases were not readily determinable, Trustmark used its incremental borrowing rate.
Trustmark made an accounting policy election to not recognize short-term leases (12 months or less) on the balance sheet. Trustmark’s short-term leases primarily include automated teller machines. For short-term leases, Trustmark recognizes lease expense on a straight-line basis over the lease term.
Federal Home Loan Bank (FHLB) and Federal Reserve Bank of Atlanta Stock
Securities with limited marketability, such as stockTrustmark accounts for its investments in theFHLB and Federal Reserve Bank of Atlanta stock in accordance with FASB ASC Subtopic 942-325, “Financial Services-Depository and theLending-Investments-Other.” FHLB and Federal Reserve Bank stock are equity securities that do not have a readily determinable fair value because its ownership is restricted and it lacks a market. FHLB and Federal Reserve Bank stock are carried at cost.cost and evaluated for impairment. Trustmark’s investment in member bank stock is included in other assets in the accompanying consolidated balance sheets because these equity securities do not have a readily determinable fair value, which places them outside the scope of FASB ASC Topic 320, “Investments – Debt and Equity Securities.”sheets. At December 31, 20172023 and 2016,2022, Trustmark’s investment in member bank stock totaled $67.7$54.4 million and $71.0$72.2 million, respectively. The carrying value of Trustmark’s member bank stock gave rise to no other-than-temporary impairment for the years ended December 31, 2017, 20162023, 2022 and 2015.2021.
Revenue from Contracts with Customers
Insurance CommissionsTrustmark accounts for revenue from contracts with customers in accordance with FASB ASC Topic 606, “Revenue from Contracts with Customers,” which provides that revenue be recognized in a manner that depicts the transfer of goods or services to a customer in
81
an amount that reflects the consideration Trustmark expects to be entitled to in exchange for those goods or services. Revenue from contracts with customers is recognized either over time in a manner that depicts Trustmark’s performance, or at a point in time when control of the goods or services are transferred to the customer. Trustmark’s noninterest income, excluding all of mortgage banking, net and securities gains (losses), net and portions of bank card and other fees and other income, are considered within the scope of FASB ASC Topic 606. Gains or losses on the sale of other real estate, which are included in Trustmark’s noninterest expense as other real estate expense, are also within the scope of FASB ASC Topic 606.
CommissionGeneral Banking Segment
Service Charges on Deposit Accounts
In general, deposit accounts represent contracts with customers with no fixed duration and can be terminated or modified by either party at any time without compensation to the other party. According to FASB ASC Topic 606, a contract that can be terminated by either party without compensation does not exist for periods beyond the then-current period. Therefore, deposit contracts are considered to renew day-to-day if not minute-to-minute.
Deposit contracts have a single continuous or stand-ready service obligation whereby Trustmark makes customer funds available for use by the customer as and when the customer chooses as well as other services such as statement rendering and online banking. The specific services provided vary based on the type of deposit account. These services are not individually distinct, but are distinct as a group, and therefore, constitute a single performance obligation which is satisfied over time and qualifies as a series of distinct service periods.
Trustmark receives a fixed service charge amount as consideration monthly for services rendered. The service charge amount varies based on the type of deposit account. Some of the service charge revenue is subject to refund provisions, which is variable consideration under the guidelines of FASB ASC Topic 606. Trustmark has elected the ‘as-invoiced’ practical expedient permitted under FASB ASC Topic 606 for recognition of service charge revenue. Therefore, revenue is recognized as ofat the effective date oftime and in the insurance policy or the dateamount the customer is billed, whichevercharged. The service charge revenue is later.presented net of refunded amounts on Trustmark’s consolidated statements of income.
Services related to non-sufficient funds, overdrafts, excess account activity, stop payments, dormant accounts, etc. are considered optional purchases for a deposit contract because there is no performance obligation for Trustmark also receives contingent commissions from insurance companies as additional incentive for achieving specified premium volume goals and/until the service is requested by the customer or the loss experienceoccurrence of a triggering event. Fees for these services are fixed amounts and are charged to the customer when the service is performed. Revenue is recognized at the time the customer is charged.
Bank Card and Other Fees
Revenue from contracts with customers in bank card and other fees includes income related to interchange fees and various other contracts which primarily consists of contracts with a single performance obligation that is satisfied at a point in time. Trustmark receives a fixed consideration amount once the performance obligation is completed for these contracts. Trustmark reports revenue from these contracts net of amounts refunded or due to a third party.
As both a debit and credit card issuer, Trustmark receives an interchange fee for every card transaction completed by its customers with a merchant. Trustmark receives two types of interchange fees: point-of-sale transactions in which the customer must enter the PIN associated with the card to complete the transaction (a debit card transaction), and signature transactions in which the signature of the insurance placedcustomer is required to complete the transaction (a credit card transaction).
Trustmark, as the card issuing or settlement bank, has a contract (implied based on customary business practices) with the payment network in which Trustmark has a single continuous service obligation to make funds available for settlement of the card transaction. Trustmark’s service obligation is satisfied over time and qualifies as a series of distinct service periods. Trustmark receives interchange fees as consideration for services rendered in the amount established by the respective payment network. The interchange fees are established by the payment network based on the type of transaction and is posted on their website. Trustmark receives and records interchange fee revenue from the payment networks daily net of all fees and amounts due to the payment network.
Other Income
Revenue from contracts with customers in other income includes income related to cash management services and other contracts with a single performance obligation that is satisfied at a point in time. Trustmark receives a fixed consideration amount once the performance obligation is completed for these contracts. Trustmark reports revenue from these contracts net of amounts refunded or due to a third party.
82
Trustmark provides cash management services through the delivery of various products and services offered to its business and municipal customers including various departments of state, city and local governments, universities and other non-profit entities. Similar to the deposit account contracts, the cash management contracts primarily represent contracts with customers with no fixed duration and can be terminated or modified by either party at any time without compensation to the other party. Therefore, cash management contracts are generally considered to renew day-to-day if not minute-to-minute.
Cash management contracts have a single continuous or stand-ready service obligation whereby Trustmark makes a specific service or group of services available for use by the customer as and when the customer chooses. The specific services provided vary based on the type of account or product. These services are not individually distinct, but are distinct as a group, and therefore, constitute a single performance obligation which is satisfied over time and qualifies as a series of distinct service periods.
Trustmark receives a set service charge or maintenance fee amount as consideration monthly for services rendered. However, some of the fees are based on the number of transactions that occur (i.e., flat fee for a set number of transactions per month then an additional charge for each transaction after that) or the average daily account balance maintained by the customer during the month and a small amount of the cash management fee revenue is subject to refund provisions. These fees represent variable consideration under the guidelines of FASB ASC Topic 606. Trustmark has elected the ‘as-invoiced’ practical expedient permitted under FASB ASC Topic 606 for recognition of cash management fee revenue. The cash management revenue is presented net of any refunded amounts on Trustmark’s consolidated statements of income.
Trustmark’s merchant services provider contracts directly with Trustmark business customers and provides Trustmark’s merchant customers card processing equipment and transaction processing services. Trustmark’s contract with the merchant services provider has a single-continuous service obligation to provide customer referrals for potential new accounts which is satisfied over time and qualifies as a series of distinct service periods. Trustmark receives a flat fee for each new account established and a percentage of the residual income related to transactions processed for Trustmark’s merchant customers each month as provided in the contract. Under the guidelines of FASB ASC Topic 606, the fee received for each new account and the profit sharing represent variable consideration. Revenue from merchant card services contracts is recognized monthly using a time-elapsed measure of progress. Trustmark has elected the ‘as-invoiced’ practical expedient permitted under FASB ASC Topic 606 for recognition of the merchant card services revenue.
Other Real Estate
Trustmark records a gain or loss from the sale of other real estate when control of the property transfers to the buyer. Trustmark records the gain or loss from the sale of other real estate in noninterest expense as other expense. Other real estate sales for the year ended December 31, 2023 resulted in a net loss of $145 thousand compared to a net loss of $1.0 million for the year ended December 31, 2022 and a net loss of $1.9 million for the year ended December 31, 2021.
In general, purchases of Trustmark’s other real estate property are not financed by Trustmark. Contingent commissionsFinancing the purchase of other real estate is evaluated based upon the same lending policies and procedures as all other types of loans. Under FASB ASC Subtopic 610-20, “Other Income – Gains and Losses from insurance companiesthe Derecognition of Nonfinancial Assets,” when Trustmark finances the sale of its other real estate to a buyer, Trustmark is required to assess whether the buyer is committed to perform their obligations under the contract and whether collectability of the transaction price is probable. Once these two criteria are recognized throughoutmet, Trustmark derecognizes the calendar year using reasonable estimates that are continuously reviewedother real estate asset and revisedrecords a gain or loss on the sale once control of the property is transferred to reflect current experience. Trustmark maintains reserves for commission adjustments and doubtful accounts receivable which were not considered significant at December 31, 2017 or 2016.the buyer.
Wealth Management Segment
Trust Management
There are five categories of revenue included in trust management: personal trust and investments, retirement plan services, institutional custody, corporate trust and other. Each of these categories includes multiple types of contracts, service obligations and fee income. However, the majority of these contracts include a single service obligation that is satisfied over time, the customer is charged in arrears for services rendered and revenue is recognized when payment is received. In general, the time period between when the service obligation is completed and when payment from the customer is received is less than 30 days. Revenue from trust management contracts is primarily related to monthly service periods and based on the prior month-end’s market value. Some trust management revenue is mandated by a court order, while other revenue consists of flat fees. Trust management revenue based on an account’s market value represents variable consideration under the guidelines of FASB ASC Topic 606. Trustmark has elected the ‘as-invoiced’ practical expedient allowed under FASB ASC Topic 606 to account for the trust management revenue.
Assets under administration held by Trustmark in a fiduciary or agency capacity for customers are not included in Trustmark’s consolidated balance sheets.
83
Investment Services
Investment services includes both brokerage and annuity income. Trustmark has a contract with a third-party investment services company which contains a single continuous service obligation, to provide broker-dealer and advisory services to customers on behalf of the third-party, which is satisfied over time and qualifies as a series of distinct service periods. Trustmark serves as the agent between the third-party investment services company, the principle, and the customer. In accordance with the contract, Trustmark receives a monthly payment from the investment services company for commissions and advisory fees (asset management fees) earned on transactions completed in the prior month net of all charges and trustfees due to the investment services company. Trustmark recognizes revenue from the investment services company, net of the revenue sharing expense due to the investment services company, when the payments are received. Commissions vary from month-to-month based on the specific products and transactions completed. The advisory fees vary based on the average daily balance of the managed assets for the period. The commissions and advisory fees represent variable consideration under FASB ASC Topic 606. Trustmark has elected the ‘as-invoiced’ practical expedient allowed under FASB ASC Topic 606 to recognize revenue from the investment services company.
Insurance Segment
Fisher Brown Bottrell Insurance, Inc. (FBBI), a wholly-owned subsidiary of Trustmark National Bank (TNB), operates as an insurance broker representing the policyholder and has no allegiance with any one insurance provider. FBBI serves as the agent between the insurance provider (either insurance carrier or broker), the principal, and the policy holder, the customer. FBBI has four general categories of insurance contracts: commercial, commercial installments, personal and employee benefits. FBBI’s insurance contracts contain a single performance obligation, policy placement, which is satisfied at a point in time. FBBI’s performance obligation is satisfied as of the policy effective date.
In addition to policy placement, FBBI provides various other periodic services to the policyholders for which no additional fee income is recordedcharged. These additional services are not considered material to the overall contract. Trustmark has elected the immaterial promises practical expedient allowed under FASB ASC Topic 606, which allows Trustmark to not assess whether promised services are performance obligations if the promised services are immaterial in the context of the contract. Therefore, the immaterial additional services offered to policyholders are not considered a performance obligation and no amount of the contract transaction price is allocated to these services.
In general, the transaction price for the insurance contracts is an established commission amount agreed upon by FBBI and the insurance provider. The commission amount varies based on the insurance provider and the type of policy. There are a cash basis,small number of insurance contracts which FBBI does not receive a commission but charges a fee directly to the policyholder.
Most of the commissions from insurance contracts are subject to clawback provisions which require FBBI to refund a prorated amount of the commissions received as a result of policy cancellations or lapses. Commissions subject to clawback provisions are considered variable consideration under FASB ASC Topic 606. Trustmark believes the expected value method of estimating the commissions subject to clawback provisions would best predict the amount of commissions FBBI will be entitled to because of the regularitylarge number of insurance contracts with similar characteristics and the number of possible outcomes. FBBI calculates a separate weighted-average percentage (returned commissions percentage) based on actual cancellations over the previous three years for commercial lines, bonds, and personal lines. FBBI applies the respective returned commissions percentage to the commission revenue earned related to insurance contracts within these three lines each month to calculate the estimated returned commissions amount, which represents the variable consideration subject to variable constraint. Revenue from insurance contracts is reported net of the billing cycles, approximatesvariable consideration subject to variable constraint. FBBI performs an analysis of the returned commissions reserve quarterly and adjusts the reserve balance based on all available information including actual cancellations and the remaining term of the contract. The returned commission percentage is updated annually.
Insurance Producers at FBBI earn commission as compensation for each policy they are responsible for placing. FBBI utilizes a ‘pay when paid’ system. Under the ‘pay when paid’ system, Producers receive the commissions for which they are entitled at the end of the month following the month in which FBBI receives payment from the insurance provider or customer. Under FASB ASC Subtopic 340-40, “Other Assets and Deferred Costs: Contracts with Customers,” the commission paid to the Producers is an incremental cost of obtaining a contract, which should be capitalized and amortized in a manner consistent with the pattern of transfer of the service related to the contract acquisition asset. Insurance contracts have a term of one year or less; therefore, Trustmark has elected the cost of obtaining a contract practical expedient allowed under FASB ASC Subtopic 340-40, which allows FBBI to recognize the incremental costs of obtaining a contract as an expense when incurred if the amortization period of the contract asset that FBBI otherwise would have recognized is one year or less. Commission expense is recorded as noninterest expense in salaries and employee benefits when paid to the Producers.
84
Commercial Insurance
Revenue from FBBI’s commercial insurance contracts (both agency billed and direct billed) consists of a set commission amount, which is subject to clawback provisions. Revenue from commercial installment insurance contracts consists of a set commission amount, which is not subject to clawback provisions. An estimated commission amount is entered in the agency management system when a commercial insurance contract is placed. FBBI records a top line receivable based on the estimated commission amount entered in the system each month, along with a corresponding amount recognized as revenue, and then adjusts the estimated receivable when the commissions are received from the insurance provider or customer.
Personal Insurance
Revenue from FBBI’s personal insurance contracts consists of a set commission amount, which is subject to clawback provisions, and is recognized when payment is received (generally 30-60 days after the policy effective date). Personal insurance contracts have a term of one year; therefore, recognizing the revenue from these contracts when payment is received is not materially different than recognizing the revenue at the policy effective date for any given period.
Employee Benefits Insurance
Revenue from FBBI’s employee benefits insurance contracts consists of a variable commission amount, which is not subject to clawback provisions, and is recognized when payment is received, typically on a monthly basis. Employee benefits insurance contracts have a set commission rate, but can vary from period to period based on changes in the number of employees covered by the policy (i.e., new hires and terminations). FBBI generally receives twelve monthly commission payments for these contracts with the initial payment being received approximately 60-90 days after the policy effective date. Under the guidelines of FASB ASC Topic 606, commissions from employee benefits insurance contracts represent fixed consideration because at contract inception (policy effective date) there is a set commission rate times a known number of covered employees. Changes in the number of covered employees are not known, nor can they be predicted, at contract inception. An increase or decrease in the number of covered employees after the policy effective date is considered a contract modification resulting from a change in scope and transaction price under FASB ASC Topic 606. This modification is treated as part of the existing contract because it does not add a distinct service. Employee benefits insurance contracts have a term of one year; therefore, recognizing the revenue from these contracts when payment is received is not materially different than recognizing the revenue at the policy effective date or the contract modification date for any given period.
Contingency Commission Insurance
In addition to the insurance contracts discussed above, FBBI has contracts with various insurance providers for which it receives contingency income based on volume of business and claims experience. FBBI is the principal and the insurance provider is the customer for these contingency commission insurance contracts. The contingency commission contracts have a single continuous or stand-ready service obligation whereby FBBI places policies with policyholders when acceptable to the insurance provider, which is satisfied over time. The contract term for these contingency commission contracts is one year. Revenue is recognized from the contingency commission contracts monthly using a time-elapsed measure of progress. FBBI accrues throughout the current year the amount of contingency commission income it expects to receive in the following year adjusted for a degree of uncertainty. FBBI updates a detail by insurance provider with the contingency commission income received, which is then compared to the total amount that was expected to be received. If actual receipts are higher or lower than the amount accrued in the prior year, the monthly accrual for the current year is adjusted accordingly.
Under the guidelines of FASB ASC Topic 606, revenue from contingency commission insurance contracts represents variable consideration and should be estimated using one of the two allowable methods subject to the variable consideration constraint. FBBI believes the most likely amount method in accordance with industry practice.to be the most appropriate method for estimating the variable consideration as there are only a few possible outcomes for each contract.
Derivative Financial Instruments
Trustmark maintains an overall interest rate risk management strategy that incorporates the use of derivative instruments to minimize significant unplanned fluctuations in earnings and cash flows caused by interest rate volatility. Trustmark’s interest rate risk management strategy involves modifying the repricing characteristics of certain assets and liabilities so that changes in interest rates do not adversely affect the net interest margin and cash flows. Under the guidelines of FASB ASC Topic 815, “Derivatives and Hedging,” all derivative instruments are required to be recognized as either assets or liabilities and carried at fair value on the balance sheet. The fair value of derivative positions outstanding is included in other assets and/or other liabilities in the accompanying consolidated balance sheets and in the net change in these financial statement line items in the accompanying consolidated statements of cash flows as well as included in noninterest income in the accompanying consolidated statements of income and other comprehensive income (loss), net
85
of tax in the accompanying consolidated statements of comprehensive income. Trustmark’s interest rate swap derivative instruments are subject to master netting agreements, and therefore, eligible for offsetting in the consolidated balance sheets. Trustmark has elected to not offset any derivative instruments in its consolidated balance sheets.
Derivatives Designated as Hedging Instruments
Trustmark has entered into a forward interest rate swap contract on its junior subordinated debentures,FASB ASC Topic 815, Derivatives and Hedging (ASC 815), provides the disclosure requirements for derivatives and hedging activities with the objectiveintent to provide users of protectingfinancial statements with an enhanced understanding of: (a) how and why an entity uses derivative instruments, (b) how the quarterly interest payments fromentity accounts for derivative instruments and related hedged items, and (c) how derivative instruments and related hedged items affect an entity’s financial position, financial performance, and cash flows. Further, qualitative disclosures are required that explain the riskobjectives and strategies for using derivatives, as well as quantitative disclosures about the fair value of variabilityand gains and losses on derivative instruments, and disclosures about credit-risk-related contingent features in derivative instruments.
Derivatives designated and qualifying as a hedge of those payments resulting fromthe exposure to changes in the three-month LIBORfair value of an asset, liability, or firm commitment attributable to a particular risk, such as interest rate risk, are considered fair value hedges. Derivatives designated and qualifying as a hedge of the exposure to variability in expected future cash flows, or other types of forecasted transactions, are considered cash flow hedges. Hedge accounting generally provides for the five-year period beginning December 31, 2014 and ending December 31, 2019. This derivativematching of the timing of gain or loss recognition on the hedging instrument is designated aswith the recognition of the changes in the fair value of the hedged asset or liability that are attributable to the hedged risk in a fair value hedge or the earnings effect of the hedged forecasted transactions in a cash flow hedge.
When entering into a hedge under FASB ASC Topic 815. Any accumulated net after-tax gainstransaction, Trustmark formally documents the relationship between the hedging instrument and the hedged item, as well as the risk management objective and strategy for undertaking the hedge transaction, which includes designating the derivative instrument as a fair value or losses related to effective cash flow hedge to a specific asset or liability on the balance sheet or to specific forecasted transactions and the risk being hedged, along with a formal assessment at the inception of the hedge as to the effectiveness of the derivative instrument in offsetting changes in fair values or cash flows of the hedged item. Trustmark continues to assess hedge effectiveness on an ongoing basis using either a qualitative or a quantitative assessment (regression analysis).
As required by ASC 815, Trustmark records all derivatives on the balance sheet at fair value. The accounting for changes in the fair value of derivatives depends on the intended use of the derivative, whether Trustmark has elected to designate a derivative in a hedging relationship and apply hedge accounting and whether the hedging relationship has satisfied the criteria necessary to apply hedge accounting. For cash flow hedges, changes in the fair value of the derivative instrument are includedrecorded in accumulated other comprehensive income (loss), and subsequently reclassified to net of tax. Any ineffective portion of the interest rate swap is reclassified from accumulated other comprehensive income (loss), net of tax to noninterest expense in the consolidated statementssame period that the hedged transaction impacts net income. Upon discontinuation of incomehedge accounting for the relevant periods. Amounts reportedcash flow hedges, any amounts in accumulated other comprehensive income (loss), net of tax related
88
to this derivativethat relationship affects earnings at the same time and in the same manner in which the hedged transaction affects earnings. If it becomes probable that the forecasted transaction will not occur, any related amounts in accumulated other comprehensive income (loss) are reclassified to other interest expense as interest payments are made on Trustmark’s variable rate junior subordinated debentures.earnings immediately.
Derivatives notNot Designated as Hedging Instruments
As part of Trustmark’s risk management strategy in the mortgage banking area, derivative instruments such as forward sales contracts are utilized. Trustmark’s obligations under forward contracts consist of commitments to deliver mortgage loans, originated and/or purchased, in the secondary market at a future date. Changes in the fair value of these derivative instruments are recorded as noninterest income in mortgage banking, net and are offset by changes in the fair value of LHFS. See Note 1 – Significant Accounting Policies, “Loans Held for Sale (LHFS)” for information regarding the fair value option election.
Trustmark also utilizes derivative instruments such as interest rate lock commitments in its mortgage banking area. Rate lock commitments are residential mortgage loan commitments with customers, which guarantee a specified interest rate for a specified time period. Changes in the fair value of these derivative instruments are recorded as noninterest income in mortgage banking, net and are offset by the changes in the fair value of forward sales contracts.
Trustmark utilizes a portfolio of exchange-traded derivative instruments, such as Treasury note futures contracts and option contracts, to achieve a fair value return that economically hedges changes in the fair value of the MSR attributable to interest rates. These transactions are considered freestanding derivatives that do not otherwise qualify for hedge accounting. These exchange-traded derivative instruments are accounted for at fair value with changes in the fair value recorded as noninterest income in mortgage banking, net and are offset by changes in the fair value of the MSR. The MSR fair value represents the present value of future cash flows, which among other things includes decay and the effect of changes in interest rates. Ineffectiveness of hedging the MSR fair value is measured by comparing the change in the fair value of the hedge instruments to the change in the fair value of the MSR asset attributable to changes in interest rates and other market driven changes in valuation inputs and assumptions.
86
Trustmark offers certain derivatives products directly to qualified commercial lending clients seeking to manage their interest rate risk. Trustmark economically hedges interest rate swap transactions executed with commercial lending clients by entering into offsetting interest rate swap transactions with institutional derivatives market participants. Derivative transactions executed as part of this program are not designated as qualifying hedging relationships and are, therefore, carried at fair value with the change in fair value recorded as noninterest income in bank card and other fees. Because these derivatives have mirror-image contractual terms, in addition to collateral provisions which mitigate the impact of non-performance risk, the changes in fair value are expected to substantially offset. The offsetting interest rate swap transactions are either cleared through the Chicago Mercantile Exchange for clearable transactions or booked directly with institutional derivatives market participants for non-clearable transactions. The Chicago Mercantile Exchange rules legally characterize variation margin collateral payments made or received for centrally cleared interest rate swaps as settlements rather than collateral. As a result, centrally cleared interest rate swaps included in other assets and other liabilities are presented on a net basis in the accompanying consolidated balance sheets.
Income Taxes
Trustmark accounts for uncertain tax positions in accordance with FASB ASC Topic 740, “Income Taxes,” which clarifies the accounting and disclosure for uncertainty in tax positions. Under the guidance of FASB ASC Topic 740, Trustmark accounts for deferred income taxes using the liability method. Deferred tax assets and liabilities are based on temporary differences between the financial statement carrying amounts and the tax basis of Trustmark’s assets and liabilities. Deferred tax assets and liabilities are measured using the enacted tax rates expected to apply to taxable income in the years in which those temporary differences are expected to be realized or settled and are presented net in the accompanying consolidated balance sheets in other assets.
Stock-Based Compensation
Trustmark accounts for the stock and incentive compensation under the provisions of FASB ASC Topic 718, “Compensation – Stock Compensation.” Under this accounting guidance, fair value is established as the measurement objective in accounting for stock awards and requires the application of a fair value based measurement method in accounting for compensation cost, which is recognized over the requisite service period. Trustmark has elected to account for forfeitures of stock awards as they occur.
89
For purposes of reporting cash flows, cash and cash equivalents include cash on hand and amounts due from banks. The following table reflects specific transaction amounts for the periods presented ($ in thousands):
|
| Years Ended December 31, |
| |||||||||
| 2023 |
|
| 2022 |
|
| 2021 |
| ||||
Income taxes paid |
| $ | 38,803 |
|
| $ | 2,701 |
|
| $ | 15,259 |
|
Interest paid on deposits and borrowings |
|
| 306,568 |
|
|
| 45,275 |
|
|
| 24,429 |
|
Noncash transfers from loans to other real estate |
|
| 7,237 |
|
|
| 1,533 |
|
|
| 770 |
|
Securities transferred from available for sale to held to maturity |
|
| — |
|
|
| 674,092 |
|
|
| — |
|
Investment in tax credit partnership not funded |
|
| 3,202 |
|
|
| 18,891 |
|
|
| 10,647 |
|
Finance right-of-use assets resulting from lease liabilities |
|
| — |
|
|
| — |
|
|
| 92 |
|
Operating right-of-use assets resulting from lease liabilities |
|
| 7,303 |
|
|
| 6,912 |
|
|
| 9,666 |
|
|
| Years Ended December 31, |
| |||||||||
|
| 2017 |
|
| 2016 |
|
| 2015 |
| |||
Income taxes paid |
| $ | 7,371 |
|
| $ | 24,836 |
|
| $ | 16,321 |
|
Interest expense paid on deposits and borrowings |
|
| 41,472 |
|
|
| 24,312 |
|
|
| 20,733 |
|
Noncash transfers from loans to other real estate (1) |
|
| 8,760 |
|
|
| 23,965 |
|
|
| 32,782 |
|
Transfer of long-term FHLB advances to short-term |
|
| 250,038 |
|
|
| 500,009 |
|
|
| — |
|
Assets acquired in business combination |
|
| 196,265 |
|
|
| — |
|
|
| — |
|
Liabilities assumed in business combination |
|
| 184,949 |
|
|
| — |
|
|
| — |
|
|
|
Per Share Data
Trustmark accounts for per share data in accordance with FASB ASC Topic 260, “Earnings Per Share,” which provides that unvested share-based payment awards that contain non-forfeitable rights to dividends or dividend equivalents (whether paid or unpaid) are participating securities and shall be included in the computation of earnings per share (EPS) pursuant to the two-class method. Trustmark has determined that its outstanding unvested stock awards and deferred stock units are not participating securities. Based on this determination, no change has been made to Trustmark’s current computation for basic and diluted EPS.
Basic EPS is computed by dividing net income by the weighted-average shares of common stock outstanding. Diluted EPS is computed by dividing net income by the weighted-average shares of common stock outstanding, adjusted for the effect of potentially dilutive stock awards outstanding during the period.
87
The following table reflects weighted-average shares used to calculate basic and diluted EPS for the periods presented (in thousands):
|
| Years Ended December 31, |
| |||||||||
|
| 2023 |
|
| 2022 |
|
| 2021 |
| |||
Basic shares |
|
| 61,054 |
|
|
| 61,242 |
|
|
| 62,788 |
|
Dilutive shares |
|
| 177 |
|
|
| 190 |
|
|
| 185 |
|
Diluted shares |
|
| 61,231 |
|
|
| 61,432 |
|
|
| 62,973 |
|
|
| Years Ended December 31, |
| |||||||||
|
| 2017 |
|
| 2016 |
|
| 2015 |
| |||
Basic shares |
|
| 67,727 |
|
|
| 67,620 |
|
|
| 67,550 |
|
Dilutive shares |
|
| 160 |
|
|
| 164 |
|
|
| 142 |
|
Diluted shares |
|
| 67,887 |
|
|
| 67,784 |
|
|
| 67,692 |
|
Weighted-average antidilutive stock awards were excluded in determining diluted EPS. The following table reflects weighted-average antidilutive stock awards for the periods presented (in thousands):
|
| Years Ended December 31, |
| |||||||||
|
| 2023 |
|
| 2022 |
|
| 2021 |
| |||
Weighted-average antidilutive stock awards |
|
| 23 |
|
|
| — |
|
|
| 1 |
|
|
| Years Ended December 31, |
| |||||||||
|
| 2017 |
|
| 2016 |
|
| 2015 |
| |||
Weighted-average antidilutive stock awards |
|
| 74 |
|
|
| 2 |
|
|
| 1 |
|
Fair Value Measurements
FASB ASC Topic 820, “Fair Value Measurements and Disclosures,” defines fair value, establishes a framework for measuring fair value in generally accepted accounting principles, and requires certain disclosures about fair value measurements. The fair value of an asset or liability is the price that would be received to sell that asset or paid to transfer that liability in an orderly transaction occurring in the principal market (or most advantageous market in the absence of a principal market) for such asset or liability. Depending on the nature of the asset or liability, Trustmark uses various valuation techniques and assumptions when estimating fair value. Inputs to valuation techniques include the assumptions that market participants would use in pricing an asset or liability. FASB ASC Topic 820 establishes a fair value hierarchy for valuation inputs that gives the highest priority to quoted prices in active markets for identical assets or liabilities and the lowest priority to unobservable inputs. The fair value hierarchy is as follows:
Level 1 Inputs – Valuation is based upon quoted prices (unadjusted) in active markets for identical assets or liabilities that Trustmark has the ability to access at the measurement date.
Level 2 Inputs – Valuation is based upon quoted prices in active markets for similar assets or liabilities, quoted prices for identical or similar assets or liabilities in markets that are not active, inputs other than quoted prices that are observable for the asset or liability such as interest rates, yield curves, volatilities and default rates and inputs that are derived principally from or corroborated by observable market data.
90
Level 3 Inputs – Unobservable inputs reflecting the reporting entity’s own determination about the assumptions that market participants would use in pricing the asset or liability based on the best information available.
In instances where the determination of the fair value measurement is based on inputs from different levels of the fair value hierarchy, the level in the fair value hierarchy within which the fair value measurement in its entirety is classified is based on the lowest level input that is significant to the fair value measurement in its entirety. Trustmark’s assessment of the significance of a particular input to the fair value measurement in its entirety requires judgment and considers factors specific to the asset or liability. Transfers between levels of the fair value hierarchy are recognized on the actual date of the event or circumstances that caused the transfer.
Accounting Policies Recently Adopted
Except for the changes detailed below, Trustmark has consistently applied its accounting policies to all periods presented in the accompanying consolidated financial statements.
ASU 2022-02, “Financial Instruments-Credit Losses (Topic 326): Trouble Debt Restructurings and Pending Accounting Pronouncements
ASU 2018-02, “Income Statement-Reporting Comprehensive Income (Topic 220): Reclassification of Certain Tax Effects from Accumulated Other Comprehensive Income.Vintage Disclosures.” Issued in February 2018,March 2022, ASU 2018-022022-02 seeks to help entities reclassifyimprove the decision usefulness of information provided to investors concerning certain stranded income tax effects in accumulated other comprehensive income resulting fromloan refinancings, restructurings and write-offs. In regard to troubled debt restructurings (TDRs) by creditors, investors and preparers observed that the Tax Cuts and Jobs Act of 2017 (Tax Reform Act), enacted on December 22, 2017. ASU 2018-02 was issued in response to concerns regarding current guidance in GAAP that requires deferred tax liabilities and assets to be adjusted for the effectadditional designation of a change in tax laws or rates with the effect included in income from continuing operations in the reporting period that includes the enactment date, even in situations in whichloan modification as a TDR and the related income tax effects of items in accumulated other comprehensive income were originally recognized in other comprehensive income, rather than net income,accounting are unnecessarily complex and as a result the stranded tax effects would not reflect the appropriate tax rate.no longer provide decision-useful information. The amendments of ASU 2018-02 allow2022-02 eliminate the accounting guidance for TDRs by creditors in FASB ASC Subtopic 310-40, “Receivables-Troubled Debt Restructurings by Creditors,” as it is no longer meaningful due to the implementation of FASB ASC Topic 326, which requires an entity to makeconsider lifetime expected credit losses on loans when establishing an allowance for credit losses. Therefore, most losses that would have been realized for a reclassification from accumulated other comprehensive incomeTDR under FASB ASC Subtopic 310-40 are now captured by the accounting required under FASB ASC Topic 326. The amendments of ASU 2022-02 also enhanced disclosure requirements for certain loan refinancings and restructurings by creditors when a borrower is experiencing financial difficulty. Stakeholders also noted inconsistency in the requirement for a public business entity (PBE) to retained earningsdisclose gross write-offs and gross recoveries by class of financing receivable and major security type in certain vintage disclosures. Financial statement users expressed that, in addition to the existing vintage disclosures in FASB ASC Topic 326, information about gross write-offs by year of origination
88
would be helpful in understanding credit quality changes in an entity’s loan portfolio and underwriting performance. For PBEs, the amendments of ASU 2022-02 require that an entity disclose current period gross write-offs by year of origination for financing receivables and net investments in leases within the stranded tax effects, which isscope of FASB ASC Subtopic 326-20, “Financial Instruments-Credit Losses-Measured at Amortized Cost.” For write-offs associated with origination dates that are more than five annual periods before the difference betweenreporting period, an entity may present aggregate amounts in the historical corporate income tax ratecurrent period for financing receivables and net investment in leases. The amendments of 35.0% and the newly enacted corporate income tax rate of 21.0%. ASU 2018-02 is2022-02 were effective for fiscal years and interim periods within those fiscal years beginning after December 31, 2018; however, public business15, 2022 for entities are allowed to early adoptthat have already adopted the amendments of ASU 2018-02 in any interim period for which2016-13, such as Trustmark. Trustmark adopted the financial statements have not yet been issued.amendments of ASU 2022-02 effective January 1, 2023. The amendments of ASU 2018-022022-02 include only changes to certain financial statement disclosures; and, therefore, adoption of ASU 2022-02 did not have a material impact on Trustmark’s consolidated financial statements or results of operations. The enhanced disclosures required by ASU 2022-02 are presented in Note 4 - LHFI and ACL, LHFI of this report.
ASU 2023-07, “Segment Reporting (Topic 280): Improvements to Reportable Segment Disclosures.” Issued in November 2023, ASU 2023-07 is intended to improve disclosures about a public entity’s reportable segments and address requests from investors and other allocators of capital for additional, more detailed information about a reportable segment’s expenses. The amendments of ASU 2023-07 require a public entity to disclose, on an annual and interim basis, significant segment expenses that are regularly provided to the chief operating decision maker (CODM) and included within each reported measure of segment profit or loss, and an amount for other segment items by reportable segment and a description of its composition. The other segment items category is the difference between segment revenue less the significant expenses disclosed and each reported measure of segment profit or loss. ASU 2023-07 also requires a public entity to provide all annual disclosures about a reportable segment’s profit or loss and assets currently required under FASB ASC Topic 280 in interim periods. The amendments of ASU 2023-07 clarify that if the CODM uses more than one measure of a segment's profit or loss in assessing segment performance and deciding how to allocate resources, a public entity may be applied eitherreport one or more of those additional measures of segment profit. However, at the beginningleast one of the period (annualreported segment profit or interim) of adoption or retrospectivelyloss measures (or the single reported measure if only one is disclosed) should be the measure that is most consistent with the measurement principles used in measuring the corresponding amounts in the public entity's consolidated financial statements. ASU 2023-07 requires a public entity to eachdisclose the title and position of the period(s)CODM, together with an explanation of how the CODM uses the reported measure(s) of segment profit or loss in whichassessing segment performance and deciding how to allocate resources. In addition, ASU 2023-07 requires that a public entity with a single reportable segment provide all the effect of the change in the U.S. federal corporate tax rate in the Tax Reform Act is recognized. As a result of the re-measurement of Trustmark’s deferred tax assets following the enactment of the Tax Reform Act, accumulated other comprehensive loss included $8.5 million of stranded tax effects at December 31, 2017. Trustmark intends to early adopt the amendments of 2018-02 during the first quarter of 2018 and plans to make an election to reclassify the stranded tax effects from accumulated other comprehensive loss to retaining earnings at the beginning of the period of adoption. The reclassification of the stranded tax effects will result in an increase in accumulated other comprehensive loss and a corresponding increase in retained earnings. Disclosuresdisclosures required by the amendments of ASU 2018-022023-07 and all existing segment disclosures in FASB ASC Topic 280. The amendments of ASU 2023-07 are effective for fiscal years beginning after December 15, 2023, and for interim periods within fiscal years beginning after December 15, 2024, with early adoption permitted. The amendments in ASU 2023-07 should be applied retrospectively to all periods presented on the financial statements. Upon implementation, the segment expense categories and amounts disclosed in the prior periods should be based on the significant segment expense categories identified and disclosed in the period of adoption. Trustmark has adopted the amendments of ASU 2023-07 related to annual disclosure requirements effective January 1, 2024, and will be presentedpresent any newly required annual disclosures in its Annual Report of Form 10-K for the year ending December 31, 2024. Trustmark intends to adopt the amendments of ASU 2023-07 related to interim disclosure requirements effective January 1, 2025, and will present any newly required interim disclosures beginning with its Quarterly Report on Form 10-Q for the period ending March 31, 2018.2025. Adoption of ASU 2018-022023-07 is not expected to have a material impact onto Trustmark’s consolidated financial statements.statements or results of operations.
Pending Accounting Pronouncements
ASU 2017-12, “Derivatives and Hedging2023-09, “Income Taxes (Topic 815)740): Targeted Improvements to Accounting for Hedging Activities.Income Tax Disclosures.” Issued in August 2017,December 2023, ASU 2017-12 aims2023-09 is intended to improve the disclosures for income taxes to address requests from investors, lenders, creditors and other allocators of capital (collectively, "investors") that use the financial reportingstatements to make capital allocation decisions. During the FASB's 2021 agenda consultation process and other stakeholder outreach, investors highlighted that the current system of hedging relationshipsincome tax disclosures does not provide enough information to better portrayunderstand the economic resultstax provision for an entity that operates in multiple jurisdictions. Investors currently rely on the rate reconciliation table and other disclosures, including total income taxes paid in the statement of an entity’s risk management activities in its financial statements.cash flows, to evaluate income tax risks and opportunities. The amendments in ASU 2017-12 aim to better align an entity’s risk management activities2023-09 will require consistent categories and financial reporting for hedging relationships by expanding and refining hedge accounting for both non-financial and financial risk components and aligning the recognition and presentationgreater disaggregation of the effects of the hedging instrument and the hedged iteminformation in the financial statements. The amendments in ASU 2017-12 (i) permit hedge accounting for risk components in hedging relationships involving nonfinancial risk and interest rate risk; (ii) change the guidance for designating fair value hedgesreconciliation disclosure as well as disclosure of interest rate risk and for measuring the change in fair value of the hedged item in fair value hedges of interest rate risk; (iii) continue to allow an entity to exclude option premiums and forward points from the assessment of hedge effectiveness; and (iv) permit an entity to exclude the portion of the change in fair value of a currency swap that is attributable to a cross-country basis spread from the assessment of hedge effectiveness.income taxes paid disaggregated by jurisdiction. The amendments of ASU 2017-12 also include targeted improvements intended to simplify the application of hedge accounting. The amendments of ASU 2017-122023-09 are effective for fiscal years, and interimannual periods within those years, beginning after December 15, 2018. All transition requirements2024, and elections must be applied to all hedging relationships existing at the date of adoption.early adoption is permitted for annual financial statements that have not yet been issued or made available for issuance. Trustmark plansintends to adopt the amendments of ASU 2017-12 during the first quarter of 2019 using2023-09 effective January 1, 2025, and will include the required modified retrospective transition method.disclosures in its Annual Report on Form 10-K for the year ending December 31, 2025. Trustmark will recognize the cumulative effect of the change, if any, in the beginning balance of each affected component of equity as of January 1, 2019. Management is currently assessing allevaluating the potential impacts of the amendments inchanges to disclosures required by ASU 2017-12 on Trustmark’s consolidated financial statements;2023-09; however, the adoption of ASU 2017-122023-09 is not expected to have a material impact on Trustmark’s consolidated financial statements.
ASU 2017-09, “Compensation-Stock Compensation (Topic 718): Scope of Modification Accounting.” ASU 2017-09 seeks to provide clarity, reduce diversity in practice, and reduce cost and complexity when applying the guidance in Topic 718, Compensation-Stock Compensation, regarding a change to the terms or conditions of a share-based payment award. In fact, ASU 2017-09 provides guidance concerning which changes to the terms or conditions of a share-based payment award require an entity to apply modification accounting in Topic 718. Specifically, an entity is to account for the effects of a modification, unless all of the following are satisfied: (1) the fair value (or calculated value or intrinsic value, if such an alternative measurement method is used) of the modified award is the same as the fair value (or calculated value or intrinsic value, if such an alternative measurement method is used) of the original
91
award immediately before the original award is modified; (2) the vesting conditions of the modified award are the same as the vesting conditions of the original award immediately before the original award is modified; and (3) the classification of the modified award as an equity instrument or as a liability instrument is the same as the classification of the original award immediately before the original award is modified. Note that the current disclosure requirements in Topic 718 apply regardless of whether an entity is required to apply modification accounting under the amendments in this ASU. The amendments of ASU 2017-09 became effective for Trustmark on January 1, 2018 and had no impact on Trustmark’s consolidated financial statements. However, should Trustmark modify the terms or conditions of any share-based payment award in the future, this modification would be evaluated and disclosed as appropriate based on the amendments of ASU 2017-09.
ASU 2017-08, “Receivables-Nonrefundable Fees and Other Costs (Subtopic 310-20): Premium Amortization on Purchased Callable Debt Securities.” Issued in March 2017, ASU 2017-08 amends the amortization period for certain purchased callable debt securities held at a premium. In particular, the amendments in ASU 2017-08 require the premium to be amortized to the earliest call date. The amendments do not, however, require an accounting change for securities held at a discount; instead, the discount continues to be amortized to maturity. Notably, the amendments in this ASU more closely align the amortization period of premiums and discounts to expectations incorporated in market pricing on the underlying securities. Securities within the scope of ASU 2017-08 are purchased debt securities that have explicit, noncontingent call features that are callable at fixed prices and on preset dates. The amendments of ASU 2017-08 become effective for fiscal years, and for interim periods within those fiscal years, beginning after December 15, 2018. Trustmark plans to adopt these amendments during the first quarter of 2019. As of December 31, 2017, Trustmark’s total unamortized premium for purchased debt securities within the scope of ASU 2017-08 was immaterial. Management will continue to evaluate the impact this ASU will have on Trustmark’s consolidated financial statements through its effective date; however, the adoption of ASU 2017-08 is not expected to have a material impact on Trustmark’s consolidated financial statements.
ASU 2017-07, “Compensation-Retirement Benefits (Topic 715)-Improving the Presentation of Net Periodic Pension Cost and Net Periodic Postretirement Benefit Cost.” Issued in March 2017, ASU 2017-07 is designed to improve guidance related to the presentation of defined benefit costs in the income statement. In particular, ASU No. 2017-07 requires that an employer report the service cost component in the same line item(s) as other compensation costs arising from services rendered by the pertinent employees during the period. The other components of net benefit cost are required to be presented in the income statement separately from the service cost component and outside a subtotal of income from operations, if one is presented. If a separate line item or items are used to present the other components of net benefit cost, then that line item or items must be appropriately described. However, if a separate line item or items are not used, then the line item(s) used in the income statement to present the other components of net benefit cost must be disclosed. Additionally, ASU 2017-07 allows only the service cost component to be eligible for capitalization, when applicable. The amendments of ASU 2017-07 must be applied retrospectively for the presentation of the service cost component and the other components of net periodic benefit cost in the income statement and prospectively, on or after the adoption date, for capitalization of the service cost component in assets. Management has evaluated the amendments of this ASU and determined that the amendments of ASU 2017-07 would require a reclassification of the net periodic benefit cost, with the exception of the service cost component, from salaries and employee benefits to other expense on the consolidated statements of income for each period presented, which is not considered material to Trustmark’s consolidated financial statements. Trustmark adopted the amendments of ASU 2017-07 effective January 1, 2018. Trustmark has elected the available practical expedient which allows Trustmark to use the amounts disclosed in its pension and other postretirement benefits footnote for the prior comparative periods for applying the retrospective presentation requirements This change in presentation will be presented beginning with the Quarterly Report on Form 10-Q for the period ending March 31, 2018.
ASU 2017-04, “Intangibles-Goodwill and Other (Topic 350): Simplifying the Test for Goodwill Impairment.” Issued in January 2017, ASU 2017-04 simplifies the manner in which an entity is required to test goodwill for impairment by eliminating Step 2 from the goodwill impairment test. Step 2 measures a goodwill impairment loss by comparing the implied fair value of a reporting unit's goodwill with the carrying amount of that goodwill. In computing the implied fair value of goodwill under Step 2, an entity, prior to the amendments in ASU 2017-04, had to perform procedures to determine the fair value at the impairment testing date of its assets and liabilities, including unrecognized assets and liabilities, in accordance with the procedure that would be required in determining the fair value of assets acquired and liabilities assumed in a business combination. However, under the amendments in ASU 2017-04, an entity should (1) perform its annual or interim goodwill impairment test by comparing the fair value of a reporting unit with its carrying amount, and (2) recognize an impairment charge for the amount by which the carrying amount exceeds the reporting unit's fair value, with the understanding that the loss recognized should not exceed the total amount of goodwill allocated to that reporting unit. Additionally, ASU 2017-04 removes the requirements for any reporting unit with a zero or negative carrying amount to perform a qualitative assessment and, if it fails such qualitative test, to perform Step 2 of the goodwill impairment test. ASU 2017-04 is effective prospectively for annual, or any interim, goodwill impairment tests in fiscal years beginning after December 15, 2019. Based on Trustmark’s annual goodwill impairment test performed as of October 1, 2017, the fair value of its reporting units exceeded the carrying value and, therefore, the related goodwill was not impaired. Management will continue to evaluate the impact this ASU will have on Trustmark’s consolidated financial statements through its effective date; however, the adoption of ASU 2017-04 is not expected to have a material impact on Trustmark’s consolidated financial statements.
92
ASU 2017-01, “Business Combinations (Topic 805) - Clarifying the Definition of a Business.” Issued in January 2017, ASU 2017-01 clarifies the definition of a business with the objective of adding guidance to assist entities with evaluating whether transactions should be accounted for as acquisitions (or disposals) of assets or businesses, which determines whether goodwill should be recorded or not. The amendments in ASU No. 2017-01 provide a screen to determine when a set of assets and activities (collectively, a “set”) is not a business. The screen requires that when substantially all of the fair value of the gross assets acquired (or disposed of) is concentrated in a single identifiable asset or a group of similar identifiable assets, the set is not a business. This screen reduces the number of transactions that need to be further evaluated. If, however, the screen is not met, then the amendments in ASU 2017-01 require that to be considered a business, a set must include, at a minimum, an input and a substantive process that together significantly contribute to the ability to create output and remove the evaluation of whether a market participant could replace missing elements. The revised definition will result in more transactions being recorded as asset acquisitions or dispositions as opposed to business acquisitions or dispositions. The amendments of ASU 2017-01 must be applied prospectively to transactions occurring on or after the adoption date. The amendments of ASU 2017-01 became effective for Trustmark on January 1, 2018 and did not have any impact to Trustmark’s consolidated financial statements; however, any future business combinations will be evaluated and disclosed as appropriate based on the amendments of ASU 2017-01.
ASU 2016-15, “Statement of Cash Flows (Topic 230): Classification of Certain Cash Receipts and Cash Payments.” Issued in August 2016, ASU 2016-15 provides guidance to reduce the diversity in practice of how certain cash receipts and cash payments are presented and classified in the statement of cash flows. The amendments of ASU 2016-15 provide guidance on eight specific cash flow: (i) debt prepayment or debt extinguishment costs; (ii) settlement of zero-coupon bonds; (iii) contingent consideration payments made after a business combination; (iv) proceeds from the settlement of insurance claims; (v) proceeds from the settlement of corporate-owned life insurance policies, including bank-owned life insurance policies; (vi) distributions received from equity method investees; (vii) beneficial interests in securitization transactions and (viii) separately identifiable cash flows and application of the predominance principle. Trustmark adopted the amendments of ASU 2016-15 effective January 1, 2018, and adoption of this ASU did not have any impact to Trustmark’s existing presentation of the applicable cash receipts and cash payments on its consolidated statements of cash flows.
ASU 2016-13, “Financial Instruments-Credit Losses (Topic 326): Measurement of Credit Losses on Financial Instruments.” Issued in June 2016, ASU 2016-13 will add FASB ASC Topic 326, “Financial Instruments-Credit Losses” and finalizes amendments to FASB ASC Subtopic 825-15, “Financial Instruments-Credit Losses.” The amendments of ASU 2016-13 are intended to provide financial statement users with more decision-useful information related to expected credit losses on financial instruments and other commitments to extend credit by replacing the current incurred loss impairment methodology with a methodology that reflects expected credit losses and requires consideration of a broader range of reasonable and supportable information to determine credit loss estimates. The amendments of ASU 2016-13 eliminate the probable initial recognition threshold and, in turn, reflect an entity’s current estimate of all expected credit losses. ASU 2016-13 does not specify the method for measuring expected credit losses, and an entity is allowed to apply methods that reasonably reflect its expectations of the credit loss estimate. Additionally, the amendments of ASU 2016-13 require that credit losses on available for sale debt securities be presented as an allowance rather than as a write-down. The amendments of ASU 2016-13 are effective for interim and annual periods beginning after December 15, 2019. Earlier application is permitted for interim and annual periods beginning after December 15, 2018. Trustmark has established a Current Expected Credit Loss (CECL) Steering Committee and a CECL Working Group which include the appropriate members of Management to evaluate the impact this ASU will have on Trustmark’s financial position, results of operations and financial statement disclosures and determine the most appropriate method of implementing the amendments in this ASU as well as any resources needed to implement the amendments. Trustmark selected a third-party vendor to provide an automated allowance for loan loss software as well as advisory services in developing a new allowance for loan loss methodology that would be compliant with amendments of ASU 2016-13, and is working with the approved third-party vendor to develop the CECL model and evaluate the impact to Trustmark. Trustmark intends to adopt the amendments of ASU 2016-13 during the first quarter of 2020. Management will continue to evaluate the impact this ASU will have on Trustmark’s consolidated financial statements through its effective date.operations.
ASU 2016-09, “Compensation-Stock Compensation (Topic 718): Improvements to Employee Share-Based Payment Accounting.” Issued in March 2016, ASU 2016-09 seeks to reduce complexity in accounting standards by simplifying several aspects of the accounting for share-based payment transactions. The amendments of ASU 2016-09 include: (i) requiring all excess tax benefits and tax deficiencies to be recognized as income tax expense or benefit in the income statement; (ii) requiring excess tax benefits to be classified along with other income tax cash flows as an operating activity on the statement of cash flow; (iii) allowing an entity to make an entity-wide accounting policy election to either estimate the number of awards that expect to vest or account for forfeitures when they occur; (iv) change the threshold to qualify for equity classification to permit withholding up to the maximum statutory tax rates in the applicable jurisdictions; and (v) requiring that cash paid by an employer when directly withholding shares for tax-withholding purposes to be classified as a financing activity on the statement of cash flows. The amendments of ASU 2016-09 became effective for Trustmark on January 1, 2017. Trustmark elected to present changes to the consolidated statements of cash flows on a retrospective basis, which resulted in $107 thousand and $211 thousand of excess tax expense from stock-based compensation arrangements being reclassified from financing activities to other operating activities, net and $1.0 million and $863 thousand of withholding taxes paid for shares directly withheld being reclassified from other operating activities, net to financing activities for the
93
years ended December 31, 2016 and 2015, respectively. Adoption of ASU 2016-09 did not materially affect Trustmark’s consolidated financial statements. Trustmark has made an entity-wide accounting policy election to account for forfeitures of stock awards as they occur. Changes as required by the amendments of ASU 2016-09 are presented in the accompanying consolidated statements of cash flows.
ASU 2016-02, “Leases (Topic 842).” Issued in February 2016, ASU 2016-02 was issued by the FASB to increase transparency and comparability among organizations by recognizing lease assets and lease liabilities on the balance sheet and by disclosing key information about leasing arrangements. ASU 2016-02 will, among other things, require lessees to recognize a lease liability, which is a lessee’s obligation to make lease payments arising from a lease, measured on a discounted basis; and a right-of-use asset, which is an asset that represents the lessee’s right to use, or control the use of, a specified asset for the lease term. ASU 2016-02 does not significantly change lease accounting requirements applicable to lessors; however, the ASU contains some targeted improvements that are intended to align, where necessary, lessor accounting with the lessee accounting model and with the updated revenue recognition guidance issued in 2014. The amendments of ASU 2016-02 are effective for interim and annual periods beginning after December 15, 2018. Trustmark plans to adopt the amendments of ASU 2016-02 beginning in the first quarter of 2019. At adoption, Trustmark will recognize a lease asset and a corresponding lease liability on its consolidated balance sheet for its total lease obligation measured on a discounted basis. As of December 31, 2017, all leases in which Trustmark was the lessee were classified as operating leases and the total outstanding lease obligation was $67.9 million, or 0.5% of total assets. Management is currently evaluating these lease obligations as potential lease assets and liabilities as defined by ASU 2016-02. Trustmark does not anticipant any material impact to its consolidated statements of income as a result of the adoption of this ASU. Trustmark has an immaterial amount of leases in which it is the lessor. Based on Management’s evaluation to date, Trustmark does not expect the amendments of ASU 2016-02 to have any material impact to these leases or the related income. Management will continue to evaluate the impact this ASU will have on Trustmark’s consolidated financial statements; however, the adoption of ASU 2016-02 is not expected to have a material impact on Trustmark’s consolidated financial statements.
ASU 2016-01, “Financial Instruments-Overall (Subtopic 825-10): Recognition and Measurement of Financial Assets and Financial Liabilities (An Amendment of the FASB Accounting Standards Codification).” Issued in January 2016, ASU 2016-01 is intended to enhance the reporting model for financial instruments to provide users of financial statements with improved decision-making information. The amendments of ASU 2016-01 include: (i) requiring equity investments, except those accounted for under the equity method of accounting or those that result in the consolidation of an investee, to be measured at fair value with changes in fair value recognized in net income; (ii) requiring a qualitative assessment to identify impairment of equity investments without readily determinable fair values; (iii) eliminating the requirement to disclose the method and significant assumptions used to estimate the fair value for financial instruments measured at amortized cost on the balance sheet; (iv) requiring the use of the exit price notion when measuring the fair value of financial instruments for disclosure purposes; (v) requiring an entity that has elected the fair value option to measure the fair value of a liability to present separately in other comprehensive income the portion of the change in the fair value resulting from a change in the instrument-specific credit risk; (vi) requiring separate presentation of financial assets and financial liabilities by measurement category and form of financial asset on the balance sheet or the accompanying notes to the financial statements and (vii) clarifying that an entity should evaluate the need for a valuation allowance on a deferred tax asset related to available for sale securities in combination with the entity’s other deferred tax assets. The amendments of ASU 2016-01 became effective for Trustmark on January 1, 2018. Trustmark’s investments in member bank stock, which are equity securities that do not have readily determinable fair values, are not within the scope of ASU 2016-01. See Note 1 – Significant Accounting Policies, “Federal Home Loan Bank (FHLB) and Federal Reserve Bank of Atlanta Stock” for information regarding Trustmark’s investment in member bank stock. The amendments of ASU 2016-01, specifically amendments (iii) and (iv) described above, will require changes to Trustmark’s fair value related disclosures. Trustmark has selected a third-party vendor to measure the fair value of the LHFI portfolio using the exit price notion as required by amendment (iv) above. The adoption of ASU 2016-01 did not have a material impact on Trustmark’s consolidated financial statements. Changes to Trustmark’s fair value related disclosures will be presented beginning with the Quarterly Report on Form 10-Q as of March 31, 2018.
ASU 2014-09, “Revenue from Contracts with Customers (Topic 606).” Issued in May 2014, ASU 2014-09 will add FASB ASC Topic 606, “Revenue from Contracts with Customers,” and will supersede revenue recognition requirements in FASB ASC Topic 605, “Revenue Recognition,” as well as certain cost guidance in FASB ASC Topic 605-35, “Revenue Recognition – Construction-Type and Production-Type Contracts.” ASU 2014-09 provides a framework for revenue recognition that replaces the existing industry and transaction specific requirements under the existing standards. ASU 2014-09 requires an entity to apply a five-step model to determine when to recognize revenue and at what amount. The model specifies that revenue should be recognized when (or as) an entity transfers control of goods or services to a customer at the amount in which the entity expects to be entitled. Depending on whether certain criteria are met, revenue should be recognized either over time, in a manner that depicts the entity’s performance, or at a point in time, when control of the goods or services are transferred to the customer. ASU 2014-09 provides that an entity should apply the following steps: (1) identify the contract(s) with a customer; (2) identify the performance obligations in the contract; (3) determine the transaction price; (4) allocate the transaction price to the performance obligations in the contract; and (5) recognize revenue when, or as, the entity satisfies a performance obligation. In addition, the existing requirements for the recognition of a gain or loss on the transfer of non-financial assets that are not in a contract with a customer are amended to be consistent with the guidance
94
on recognition and measurement in ASU 2014-09. The amendments of ASU 2014-09 may be applied either retrospectively to each prior reporting period presented or retrospectively with the cumulative effect of initially applying ASU 2014-09 recognized at the date of initial application. If the transition method of application is elected, the entity should also provide the additional disclosures in reporting periods that include the date of initial application of (1) the amount by which each financial statement line item is affected in the current reporting period, as compared to the guidance that was in effect before the change, and (2) an explanation of the reasons for significant changes. The amendments of ASU 2014-09 and all subsequently issued ASUs, which provided additional guidance and clarifications to various aspects of FASB ASC Topic 606, became effective for Trustmark on January 1, 2018. Trustmark elected to adopt these amendments using the modified retrospective method of application for only those contracts not completed as of the date of adoption. Trustmark’s contracts with customers are primarily for a term of one year or less and substantially all of Trustmark’s contracts were completed as of January 1, 2018. Management has determined that approximately 23% of the revenues earned by Trustmark are within the scope of ASU 2014-09, and, for most of the revenue streams within the scope of ASU 2014-09, the amendments do not change the timing or amount of revenue recognized. The adoption of ASU 2014-09 did not have a material impact on Trustmark’s consolidated financial statements. No cumulative adjustment was recorded as a result of the adoption of ASU 2014-09. Disclosures required by the amendments of ASU 2014-09 will be presented beginning with the Quarterly Report on Form 10-Q for the period ending March 31, 2018.
Note 2 – Business Combinations
On April 7, 2017, Trustmark completed its merger with RB Bancorporation (Reliance), the holding company for Reliance Bank, which had seven offices serving the Huntsville, Alabama metropolitan service area (MSA). Reliance Bank was merged into Trustmark National Bank simultaneously with the merger of Trustmark and Reliance. Under the terms of the Merger Agreement dated November 14, 2016, Trustmark paid $22.00 in cash for each share of Reliance common stock outstanding, which represented payment to Reliance common shareholders of approximately $23.7 million. In addition, Trustmark paid off Reliance Preferred Stock of $1.1 million bringing the total consideration paid to $24.8 million.
The merger with Reliance was consistent with Trustmark’s strategic plan to selectively expand the Trustmark franchise and enhance the Trustmark franchise in north Alabama.
This merger was accounted for in accordance with FASB ASC Topic 805, “Business Combinations.” Accordingly, the assets and liabilities, both tangible and intangible, were recorded at their estimated fair values as of the merger date. The fair values of the assets acquired and liabilities assumed are subject to adjustment if additional information relative to the closing date fair values becomes available through the measurement period, which is not to exceed one year from the merger date of April 7, 2017.
The statement of assets purchased and liabilities assumed in the Reliance merger is presented below at their estimated fair values as of the merger date of April 7, 2017 ($ in thousands):
Assets: |
|
|
|
|
Cash and due from banks |
| $ | 5,013 |
|
Federal funds sold and securities purchased under reverse repurchase agreements |
|
| 6,900 |
|
Securities |
|
| 54,843 |
|
Acquired loans |
|
| 117,447 |
|
Premises and equipment, net |
|
| 3,700 |
|
Identifiable intangible assets |
|
| 1,850 |
|
Other real estate |
|
| 475 |
|
Other assets |
|
| 6,037 |
|
Total Assets |
|
| 196,265 |
|
|
|
|
|
|
Liabilities: |
|
|
|
|
Deposits |
|
| 166,158 |
|
Other borrowings |
|
| 17,469 |
|
Other liabilities |
|
| 1,322 |
|
Total Liabilities |
|
| 184,949 |
|
|
|
|
|
|
Net identified assets acquired at fair value |
|
| 11,316 |
|
Goodwill |
|
| 13,471 |
|
Total consideration paid |
| $ | 24,787 |
|
95
The excess of the consideration paid over the estimated fair value of the net assets acquired was $13.5 million, which was recorded as goodwill under FASB ASC Topic 805. The identifiable intangible assets acquired represent the core deposit intangible at fair value at the merger date. The core deposit intangible is being amortized on an accelerated basis over the estimated useful life, currently expected to be approximately ten years.
Loans acquired from Reliance were evaluated under a fair value process. Loans with evidence of deterioration in credit quality and for which it was probable at acquisition that Trustmark would not be able to collect all contractually required payments are referred to as acquired impaired loans and accounted for in accordance with FASB ASC Topic 310-30. See Note 6 – Acquired Loans for additional information on acquired loans.
The operations of Reliance are included in Trustmark’s operating results from April 7, 2017 and did not have a material impact on Trustmark’s results of operations. During the second quarter of 2017, Trustmark included merger transaction expenses in other noninterest expense totaling $3.2 million (change in control expense of $1.3 million; professional fees, contract termination and other expenses of $1.9 million).
Fair Value of Acquired Financial Instruments
For financial instruments measured at fair value, Trustmark utilized Level 2 inputs to determine the fair value of securities available for sale (included in securities above), time deposits (included in deposits above) and FHLB advances (included in other borrowings above). Level 3 inputs were used to determine the fair value of acquired loans, identifiable intangible assets and other real estate. The methodology and significant assumptions used in estimating the fair values of these financial assets and liabilities are as follows:
Securities Available for Sale
Estimated fair values for securities available for sale are based on quoted market prices where available. If quoted market prices are not available, estimated fair values are based on quoted market prices of comparable instruments.
Acquired Loans
Fair value of acquired loans is determined using a discounted cash flow model based on assumptions regarding the amount and timing of principal and interest payments, estimated prepayments, estimated default rates, estimated loss severity in the event of default and current market rates.
Identifiable Intangible Assets
The fair value assigned to the identifiable intangible assets, in this case the core deposit intangible, represents the future economic benefits of the potential cost savings from acquiring core deposits in the merger compared to the cost of obtaining alternative funding from market sources.
Other Real Estate
Other real estate was initially recorded at its estimated fair value on the merger date based on independent appraisals less estimated selling costs.
Time Deposits
Time deposits were valued by projecting expected cash flows into the future based on each account’s contracted rate and then determining the present value of those expected cash flows using current rates for deposits with similar maturities.
FHLB Advances
FHLB advances were valued by projecting expected cash flows into the future based on each advance’s contracted rate and then determining the present value of those expected cash flows using current rates for advances with similar maturities.
Please refer to Note 18 – Fair Value for more information on Trustmark’s classification of financial instruments based on valuation inputs within the fair value hierarchy.
96
Note 3 – Cash and Due from Banks
Trustmark is no longer required to maintain average reserve balances with the Federal Reserve Bank of Atlanta based on a percentage of deposits. The average amounts of those reservesEffective March 26, 2020, the Federal Reserve reduced reserve requirement ratios to zero percent, eliminating the reserve
89
requirements for all depository institutions, in order to provide liquidity in the years ended December 31, 2017banking system to support lending to households and 2016 were $100.8 million and $94.7 million, respectively.businesses due to the COVID-19 pandemic.
Note 43 – Securities Available for Sale and Held to Maturity
The following tables are a summary of the amortized cost and estimated fair value of securities available for sale and held to maturity at December 31, 20172023 and 20162022 ($ in thousands):
|
| Securities Available for Sale |
|
| Securities Held to Maturity |
| ||||||||||||||||||||||||||||||||||||||||||||||||||||||||||
|
|
|
|
|
| Gross |
|
| Gross |
|
| Estimated |
|
|
|
|
|
| Gross |
|
| Gross |
|
| Estimated |
|
| Securities Available for Sale |
|
| Securities Held to Maturity |
| ||||||||||||||||||||||||||||||||
|
| Amortized |
|
| Unrealized |
|
| Unrealized |
|
| Fair |
|
| Amortized |
|
| Unrealized |
|
| Unrealized |
|
| Fair |
|
|
|
| Gross |
| Gross |
| Estimated |
|
|
|
| Gross |
| Gross |
| Estimated |
| ||||||||||||||||||||||
December 31, 2017 |
| Cost |
|
| Gains |
|
| Losses |
|
| Value |
|
| Cost |
|
| Gains |
|
| Losses |
|
| Value |
| ||||||||||||||||||||||||||||||||||||||||
|
| Amortized |
| Unrealized |
| Unrealized |
| Fair |
|
| Amortized |
| Unrealized |
| Unrealized |
| Fair |
| ||||||||||||||||||||||||||||||||||||||||||||||
December 31, 2023 |
| Cost |
|
| Gains |
|
| Losses |
|
| Value |
|
| Cost |
|
| Gains |
|
| Losses |
|
| Value |
| ||||||||||||||||||||||||||||||||||||||||
U.S. Treasury securities |
| $ | 396,179 |
|
| $ | — |
|
| $ | (23,811 | ) |
| $ | 372,368 |
|
| $ | 29,068 |
|
| $ | — |
|
| $ | (26 | ) |
| $ | 29,042 |
| ||||||||||||||||||||||||||||||||
U.S. Government agency obligations |
|
|
|
|
|
|
|
|
|
|
|
|
|
|
|
|
|
|
|
|
|
|
|
|
|
|
|
|
|
|
|
|
|
| 6,207 |
|
|
| 1 |
|
|
| (416 | ) |
|
| 5,792 |
|
|
| — |
|
|
| — |
|
|
| — |
|
|
| — |
|
Issued by U.S. Government agencies |
| $ | 45,508 |
|
| $ | 310 |
|
| $ | (800 | ) |
| $ | 45,018 |
|
| $ | — |
|
| $ | — |
|
| $ | — |
|
| $ | — |
| ||||||||||||||||||||||||||||||||
Issued by U.S. Government sponsored agencies |
|
| 255 |
|
|
| 12 |
|
|
| — |
|
|
| 267 |
|
|
| 3,692 |
|
|
| 182 |
|
|
| — |
|
|
| 3,874 |
| ||||||||||||||||||||||||||||||||
Obligations of states and political subdivisions |
|
| 78,433 |
|
|
| 850 |
|
|
| (54 | ) |
|
| 79,229 |
|
|
| 46,039 |
|
|
| 1,044 |
|
|
| (59 | ) |
|
| 47,024 |
|
|
| — |
|
|
| — |
|
|
| — |
|
|
| — |
|
|
| 340 |
|
|
| — |
|
|
| — |
|
|
| 340 |
|
Mortgage-backed securities |
|
|
|
|
|
|
|
|
|
|
|
|
|
|
|
|
|
|
|
|
|
|
|
|
|
|
|
|
|
|
|
|
|
|
|
|
|
|
|
|
|
|
|
|
|
|
|
|
|
|
| |||||||||||||
Residential mortgage pass-through securities |
|
|
|
|
|
|
|
|
|
|
|
|
|
|
|
|
|
|
|
|
|
|
|
|
|
|
|
|
|
|
|
|
|
|
|
|
|
|
|
|
|
|
|
|
| |||||||||||||||||||
Guaranteed by GNMA |
|
| 66,634 |
|
|
| 215 |
|
|
| (1,103 | ) |
|
| 65,746 |
|
|
| 13,539 |
|
|
| 207 |
|
|
| (73 | ) |
|
| 13,673 |
|
|
| 25,744 |
|
|
| 4 |
|
|
| (2,613 | ) |
|
| 23,135 |
|
|
| 13,005 |
|
|
| — |
|
|
| (497 | ) |
|
| 12,508 |
|
Issued by FNMA and FHLMC |
|
| 824,872 |
|
|
| 827 |
|
|
| (11,249 | ) |
|
| 814,450 |
|
|
| 133,975 |
|
|
| 210 |
|
|
| (1,559 | ) |
|
| 132,626 |
|
|
| 1,338,256 |
|
|
| 32 |
|
|
| (161,490 | ) |
|
| 1,176,798 |
|
|
| 469,593 |
|
|
| — |
|
|
| (18,205 | ) |
|
| 451,388 |
|
Other residential mortgage-backed securities |
|
|
|
|
|
|
|
|
|
|
|
|
|
|
|
|
|
|
|
|
|
|
|
|
|
|
|
|
|
|
|
|
|
|
|
|
|
|
|
|
|
|
|
|
|
|
|
|
|
|
| |||||||||||||
Issued or guaranteed by FNMA, FHLMC or GNMA |
|
| 1,028,176 |
|
|
| 1,808 |
|
|
| (13,194 | ) |
|
| 1,016,790 |
|
|
| 678,926 |
|
|
| 1,209 |
|
|
| (11,065 | ) |
|
| 669,070 |
|
|
| 92,076 |
|
|
| — |
|
|
| (6,002 | ) |
|
| 86,074 |
|
|
| 154,466 |
|
|
| — |
|
|
| (10,113 | ) |
|
| 144,353 |
|
Commercial mortgage-backed securities |
|
|
|
|
|
|
|
|
|
|
|
|
|
|
|
|
|
|
|
|
|
|
|
|
|
|
|
|
|
|
|
|
|
|
|
|
|
|
|
|
|
|
|
|
|
|
|
|
| |||||||||||||||
Issued or guaranteed by FNMA, FHLMC or GNMA |
|
| 218,252 |
|
|
| 426 |
|
|
| (1,543 | ) |
|
| 217,135 |
|
|
| 180,315 |
|
|
| 1,102 |
|
|
| (1,437 | ) |
|
| 179,980 |
|
|
| 100,545 |
|
|
| — |
|
|
| (1,834 | ) |
|
| 98,711 |
|
|
| 759,807 |
|
|
| 51 |
|
|
| (41,985 | ) |
|
| 717,873 |
|
Total |
| $ | 2,262,130 |
|
| $ | 4,448 |
|
| $ | (27,943 | ) |
| $ | 2,238,635 |
|
| $ | 1,056,486 |
|
| $ | 3,954 |
|
| $ | (14,193 | ) |
| $ | 1,046,247 |
|
| $ | 1,959,007 |
|
| $ | 37 |
|
| $ | (196,166 | ) |
| $ | 1,762,878 |
|
| $ | 1,426,279 |
|
| $ | 51 |
|
| $ | (70,826 | ) |
| $ | 1,355,504 |
|
|
|
|
|
|
|
|
|
|
|
|
|
|
|
|
|
|
|
|
|
|
|
|
|
|
|
|
|
|
|
|
|
|
|
|
|
|
|
|
|
|
|
|
|
|
|
|
|
|
| |||||||||||||||
December 31, 2016 |
|
|
|
|
|
|
|
|
|
|
|
|
|
|
|
|
|
|
|
|
|
|
|
|
|
|
|
|
|
|
|
| ||||||||||||||||||||||||||||||||
December 31, 2022 |
|
|
|
|
|
|
|
|
|
|
|
|
|
|
|
|
| |||||||||||||||||||||||||||||||||||||||||||||||
U.S. Treasury securities |
| $ | 425,719 |
|
| $ | 308 |
|
| $ | (34,514 | ) |
| $ | 391,513 |
|
| $ | 28,295 |
|
| $ | — |
|
| $ | (115 | ) |
| $ | 28,180 |
| ||||||||||||||||||||||||||||||||
U.S. Government agency obligations |
|
|
|
|
|
|
|
|
|
|
|
|
|
|
|
|
|
|
|
|
|
|
|
|
|
|
|
|
|
|
|
|
|
| 8,297 |
|
|
| — |
|
|
| (531 | ) |
|
| 7,766 |
|
|
| — |
|
|
| — |
|
|
| — |
|
|
| — |
|
Issued by U.S. Government agencies |
| $ | 56,272 |
|
| $ | 416 |
|
| $ | (925 | ) |
| $ | 55,763 |
|
| $ | — |
|
| $ | — |
|
| $ | — |
|
| $ | — |
| ||||||||||||||||||||||||||||||||
Issued by U.S. Government sponsored agencies |
|
| 257 |
|
|
| 19 |
|
|
| — |
|
|
| 276 |
|
|
| 3,647 |
|
|
| 355 |
|
|
| — |
|
|
| 4,002 |
| ||||||||||||||||||||||||||||||||
Obligations of states and political subdivisions |
|
| 113,541 |
|
|
| 1,945 |
|
|
| (113 | ) |
|
| 115,373 |
|
|
| 46,303 |
|
|
| 1,476 |
|
|
| (27 | ) |
|
| 47,752 |
|
|
| 4,820 |
|
|
| 53 |
|
|
| (11 | ) |
|
| 4,862 |
|
|
| 4,510 |
|
|
| 3 |
|
|
| (3 | ) |
|
| 4,510 |
|
Mortgage-backed securities |
|
|
|
|
|
|
|
|
|
|
|
|
|
|
|
|
|
|
|
|
|
|
|
|
|
|
|
|
|
|
|
|
|
|
|
|
|
|
|
|
|
|
|
|
|
|
|
|
|
|
| |||||||||||||
Residential mortgage pass-through securities |
|
|
|
|
|
|
|
|
|
|
|
|
|
|
|
|
|
|
|
|
|
|
|
|
|
|
|
|
|
|
|
|
|
|
|
|
|
|
|
|
|
|
|
|
| |||||||||||||||||||
Guaranteed by GNMA |
|
| 43,222 |
|
|
| 340 |
|
|
| (776 | ) |
|
| 42,786 |
|
|
| 15,478 |
|
|
| 280 |
|
|
| (52 | ) |
|
| 15,706 |
|
|
| 30,534 |
|
|
| 7 |
|
|
| (3,444 | ) |
|
| 27,097 |
|
|
| 4,442 |
|
|
| — |
|
|
| (395 | ) |
|
| 4,047 |
|
Issued by FNMA and FHLMC |
|
| 638,809 |
|
|
| 1,773 |
|
|
| (9,498 | ) |
|
| 631,084 |
|
|
| 81,299 |
|
|
| 223 |
|
|
| (1,084 | ) |
|
| 80,438 |
|
|
| 1,541,570 |
|
|
| 12 |
|
|
| (196,119 | ) |
|
| 1,345,463 |
|
|
| 509,311 |
|
|
| — |
|
|
| (19,586 | ) |
|
| 489,725 |
|
Other residential mortgage-backed securities |
|
|
|
|
|
|
|
|
|
|
|
|
|
|
|
|
|
|
|
|
|
|
|
|
|
|
|
|
|
|
|
|
|
|
|
|
|
|
|
|
|
|
|
|
|
|
|
|
|
|
| |||||||||||||
Issued or guaranteed by FNMA, FHLMC or GNMA |
|
| 1,271,198 |
|
|
| 5,865 |
|
|
| (9,112 | ) |
|
| 1,267,951 |
|
|
| 803,474 |
|
|
| 3,208 |
|
|
| (6,519 | ) |
|
| 800,163 |
|
|
| 123,755 |
|
|
| — |
|
|
| (8,615 | ) |
|
| 115,140 |
|
|
| 188,201 |
|
|
| — |
|
|
| (13,826 | ) |
|
| 174,375 |
|
Commercial mortgage-backed securities |
|
|
|
|
|
|
|
|
|
|
|
|
|
|
|
|
|
|
|
|
|
|
|
|
|
|
|
|
|
|
|
|
|
|
|
|
|
|
|
|
|
|
|
|
|
|
|
|
| |||||||||||||||
Issued or guaranteed by FNMA, FHLMC or GNMA |
|
| 242,869 |
|
|
| 1,766 |
|
|
| (1,186 | ) |
|
| 243,449 |
|
|
| 208,442 |
|
|
| 1,758 |
|
|
| (1,215 | ) |
|
| 208,985 |
|
|
| 136,014 |
|
|
| — |
|
|
| (3,773 | ) |
|
| 132,241 |
|
|
| 759,755 |
|
|
| 34 |
|
|
| (54,037 | ) |
|
| 705,752 |
|
Total |
| $ | 2,366,168 |
|
| $ | 12,124 |
|
| $ | (21,610 | ) |
| $ | 2,356,682 |
|
| $ | 1,158,643 |
|
| $ | 7,300 |
|
| $ | (8,897 | ) |
| $ | 1,157,046 |
|
| $ | 2,270,709 |
|
| $ | 380 |
|
| $ | (247,007 | ) |
| $ | 2,024,082 |
|
| $ | 1,494,514 |
|
| $ | 37 |
|
| $ | (87,962 | ) |
| $ | 1,406,589 |
|
97
During 2013,2022, Trustmark reclassified approximately $1.099 billiona total of $766.0 million of securities available for sale to securities held to maturity. On the date of these transfers, the net unrealized holding loss on the available for sale securities totaled approximately $91.9 million ($68.9 million, net of tax).
The securities were transferred at fair value, which became the cost basis for the securities held to maturity. At the date of transfer, the net unrealized holding loss on the available for sale securities totaled approximately $46.6 million ($28.8 million, net of tax). The net unrealized holding loss iswill be amortized over the remaining life of the securities as a yield adjustment in a manner consistent with the amortization or accretion of the original purchase premium or discount on the associated security. There were no gains or losses recognized as a result of the transfer.these transfers. At December 31, 2017,2023, the net unamortized, unrealized loss on the transferred securities included in accumulated other comprehensive lossincome (loss) in the accompanying balance sheet totaled $57.6 million compared to approximately $19.5$69.2 million ($12.0at December 31, 2022.
ACL on Securities
Securities Available for Sale
Quarterly, Trustmark evaluates if any security has a fair value less than its amortized cost. Once these securities are identified, in order to determine whether a decline in fair value resulted from a credit loss or other factors, Trustmark performs further analysis. If Trustmark determines that a credit loss exists, the credit portion of the allowance is measured using a DCF analysis using the effective interest rate as of the security’s purchase date. The amount of credit loss Trustmark records will be limited to the amount by which the amortized
90
cost exceeds the fair value. The DCF analysis utilizes contractual maturities, as well as third-party credit ratings and cumulative default rates published annually by Moody’s.
At both December 31, 2023 and 2022, the results of the loss analysis performed did not identify any securities that warranted DCF analysis and no credit loss was recognized on any of the securities available for sale.
Accrued interest receivable is excluded from the estimate of credit losses for securities available for sale. At December 31, 2023 and 2022, accrued interest receivable totaled $3.7 million netand $4.0 million, respectively, for securities available for sale and was reported in other assets on the accompanying consolidated balance sheet.
Securities Held to Maturity
At December 31, 2023 and 2022, the potential credit loss exposure for Trustmark’s securities held to maturity was $340 thousand and $4.5 million, respectively, and consisted of tax).municipal securities. After applying appropriate probability of default and loss given default assumptions, the total amount of current expected credit losses was deemed immaterial. Therefore, no reserve was recorded at December 31, 2023 and 2022.
Temporarily Impaired SecuritiesAccrued interest receivable is excluded from the estimate of credit losses for securities held to maturity. At December 31, 2023 and 2022, accrued interest receivable totaled $2.6 million and $2.7 million for securities held to maturity and was reported in other assets on the accompanying consolidated balance sheet.
At both December 31, 2023 and 2022, Trustmark had no securities held to maturity that were past due 30 days or more as to principal or interest payments. Trustmark had no securities held to maturity classified as nonaccrual at December 31, 2023 and 2022.
Trustmark monitors the credit quality of securities held to maturity on a monthly basis through credit ratings. The following table presents the amortized cost of Trustmark’s securities held to maturity by credit rating, as determined by Moody’s, at December 31, 2023 and 2022 ($ in thousands):
|
| December 31, 2023 |
|
| December 31, 2022 |
| ||
Aaa |
| $ | 1,425,939 |
|
| $ | 1,490,004 |
|
Aa1 to Aa3 |
|
| — |
|
|
| 3,001 |
|
Not Rated (1) |
|
| 340 |
|
|
| 1,509 |
|
Total |
| $ | 1,426,279 |
|
| $ | 1,494,514 |
|
91
The table below includes securities with gross unrealized losses for which an ACL has not been recorded and segregated by length of impairment at December 31, 20172023 and 20162022 ($ in thousands):
|
| Less than 12 Months |
|
| 12 Months or More |
|
| Total |
| |||||||||||||||
|
|
|
|
|
| Gross |
|
|
|
|
|
| Gross |
|
|
|
|
|
| Gross |
| |||
|
| Estimated |
|
| Unrealized |
|
| Estimated |
|
| Unrealized |
|
| Estimated |
|
| Unrealized |
| ||||||
December 31, 2017 |
| Fair Value |
|
| Losses |
|
| Fair Value |
|
| Losses |
|
| Fair Value |
|
| Losses |
| ||||||
U.S. Government agency obligations |
|
|
|
|
|
|
|
|
|
|
|
|
|
|
|
|
|
|
|
|
|
|
|
|
Issued by U.S. Government agencies |
| $ | 5,214 |
|
| $ | (113 | ) |
| $ | 29,432 |
|
| $ | (687 | ) |
| $ | 34,646 |
|
| $ | (800 | ) |
Obligations of states and political subdivisions |
|
| 19,345 |
|
|
| (80 | ) |
|
| 3,874 |
|
|
| (33 | ) |
|
| 23,219 |
|
|
| (113 | ) |
Mortgage-backed securities |
|
|
|
|
|
|
|
|
|
|
|
|
|
|
|
|
|
|
|
|
|
|
|
|
Residential mortgage pass-through securities |
|
|
|
|
|
|
|
|
|
|
|
|
|
|
|
|
|
|
|
|
|
|
|
|
Guaranteed by GNMA |
|
| 37,304 |
|
|
| (351 | ) |
|
| 29,446 |
|
|
| (825 | ) |
|
| 66,750 |
|
|
| (1,176 | ) |
Issued by FNMA and FHLMC |
|
| 506,410 |
|
|
| (4,219 | ) |
|
| 369,060 |
|
|
| (8,589 | ) |
|
| 875,470 |
|
|
| (12,808 | ) |
Other residential mortgage-backed securities |
|
|
|
|
|
|
|
|
|
|
|
|
|
|
|
|
|
|
|
|
|
|
|
|
Issued or guaranteed by FNMA, FHLMC or GNMA |
|
| 755,013 |
|
|
| (7,668 | ) |
|
| 534,955 |
|
|
| (16,591 | ) |
|
| 1,289,968 |
|
|
| (24,259 | ) |
Commercial mortgage-backed securities |
|
|
|
|
|
|
|
|
|
|
|
|
|
|
|
|
|
|
|
|
|
|
|
|
Issued or guaranteed by FNMA, FHLMC or GNMA |
|
| 230,898 |
|
|
| (1,719 | ) |
|
| 55,288 |
|
|
| (1,261 | ) |
|
| 286,186 |
|
|
| (2,980 | ) |
Total |
| $ | 1,554,184 |
|
| $ | (14,150 | ) |
| $ | 1,022,055 |
|
| $ | (27,986 | ) |
| $ | 2,576,239 |
|
| $ | (42,136 | ) |
|
|
|
|
|
|
|
|
|
|
|
|
|
|
|
|
|
|
|
|
|
|
|
|
|
December 31, 2016 |
|
|
|
|
|
|
|
|
|
|
|
|
|
|
|
|
|
|
|
|
|
|
|
|
U.S. Government agency obligations |
|
|
|
|
|
|
|
|
|
|
|
|
|
|
|
|
|
|
|
|
|
|
|
|
Issued by U.S. Government agencies |
| $ | 9,420 |
|
| $ | (142 | ) |
| $ | 33,248 |
|
| $ | (783 | ) |
| $ | 42,668 |
|
| $ | (925 | ) |
Obligations of states and political subdivisions |
|
| 20,539 |
|
|
| (135 | ) |
|
| 654 |
|
|
| (5 | ) |
|
| 21,193 |
|
|
| (140 | ) |
Mortgage-backed securities |
|
|
|
|
|
|
|
|
|
|
|
|
|
|
|
|
|
|
|
|
|
|
|
|
Residential mortgage pass-through securities |
|
|
|
|
|
|
|
|
|
|
|
|
|
|
|
|
|
|
|
|
|
|
|
|
Guaranteed by GNMA |
|
| 43,615 |
|
|
| (822 | ) |
|
| 222 |
|
|
| (6 | ) |
|
| 43,837 |
|
|
| (828 | ) |
Issued by FNMA and FHLMC |
|
| 588,352 |
|
|
| (10,582 | ) |
|
| — |
|
|
| — |
|
|
| 588,352 |
|
|
| (10,582 | ) |
Other residential mortgage-backed securities |
|
|
|
|
|
|
|
|
|
|
|
|
|
|
|
|
|
|
|
|
|
|
|
|
Issued or guaranteed by FNMA, FHLMC or GNMA |
|
| 1,127,501 |
|
|
| (12,722 | ) |
|
| 76,196 |
|
|
| (2,909 | ) |
|
| 1,203,697 |
|
|
| (15,631 | ) |
Commercial mortgage-backed securities |
|
|
|
|
|
|
|
|
|
|
|
|
|
|
|
|
|
|
|
|
|
|
|
|
Issued or guaranteed by FNMA, FHLMC or GNMA |
|
| 244,050 |
|
|
| (2,311 | ) |
|
| 4,655 |
|
|
| (90 | ) |
|
| 248,705 |
|
|
| (2,401 | ) |
Total |
| $ | 2,033,477 |
|
| $ | (26,714 | ) |
| $ | 114,975 |
|
| $ | (3,793 | ) |
| $ | 2,148,452 |
|
| $ | (30,507 | ) |
|
| Less than 12 Months |
|
| 12 Months or More |
|
| Total |
| |||||||||||||||
|
|
|
|
| Gross |
|
|
|
|
| Gross |
|
|
|
|
| Gross |
| ||||||
|
| Estimated |
|
| Unrealized |
|
| Estimated |
|
| Unrealized |
|
| Estimated |
|
| Unrealized |
| ||||||
December 31, 2023 |
| Fair Value |
|
| Losses |
|
| Fair Value |
|
| Losses |
|
| Fair Value |
|
| Losses |
| ||||||
U.S. Treasury securities |
| $ | 29,042 |
|
| $ | (26 | ) |
| $ | 372,368 |
|
| $ | (23,811 | ) |
| $ | 401,410 |
|
| $ | (23,837 | ) |
U.S. Government agency obligations |
|
| — |
|
|
| — |
|
|
| 5,791 |
|
|
| (416 | ) |
|
| 5,791 |
|
|
| (416 | ) |
Mortgage-backed securities |
|
|
|
|
|
|
|
|
|
|
|
|
|
|
|
|
|
| ||||||
Residential mortgage pass-through |
|
|
|
|
|
|
|
|
|
|
|
|
|
|
|
|
|
| ||||||
Guaranteed by GNMA |
|
| 9,381 |
|
|
| (172 | ) |
|
| 25,967 |
|
|
| (2,938 | ) |
|
| 35,348 |
|
|
| (3,110 | ) |
Issued by FNMA and FHLMC |
|
| 309,466 |
|
|
| (3,274 | ) |
|
| 1,311,865 |
|
|
| (176,421 | ) |
|
| 1,621,331 |
|
|
| (179,695 | ) |
Other residential mortgage-backed |
|
|
|
|
|
|
|
|
|
|
|
|
|
|
|
|
|
| ||||||
Issued or guaranteed by FNMA, |
|
| — |
|
|
| — |
|
|
| 230,368 |
|
|
| (16,115 | ) |
|
| 230,368 |
|
|
| (16,115 | ) |
Commercial mortgage-backed |
|
|
|
|
|
|
|
|
|
|
|
|
|
|
|
|
|
| ||||||
Issued or guaranteed by FNMA, |
|
| 1,656 |
|
|
| (13 | ) |
|
| 812,520 |
|
|
| (43,806 | ) |
|
| 814,176 |
|
|
| (43,819 | ) |
Total |
| $ | 349,545 |
|
| $ | (3,485 | ) |
| $ | 2,758,879 |
|
| $ | (263,507 | ) |
| $ | 3,108,424 |
|
| $ | (266,992 | ) |
|
|
|
|
|
|
|
|
|
|
|
|
|
|
|
|
|
|
| ||||||
December 31, 2022 |
|
|
|
|
|
|
|
|
|
|
|
|
|
|
|
|
|
| ||||||
U.S. Treasury securities |
| $ | 161,298 |
|
| $ | (5,655 | ) |
| $ | 258,087 |
|
| $ | (28,974 | ) |
| $ | 419,385 |
|
| $ | (34,629 | ) |
U.S. Government agency obligations |
|
| 1,828 |
|
|
| (184 | ) |
|
| 5,938 |
|
|
| (347 | ) |
|
| 7,766 |
|
|
| (531 | ) |
Obligations of states and political |
|
| 1,017 |
|
|
| (11 | ) |
|
| 3,664 |
|
|
| (3 | ) |
|
| 4,681 |
|
|
| (14 | ) |
Mortgage-backed securities |
|
|
|
|
|
|
|
|
|
|
|
|
|
|
|
|
|
| ||||||
Residential mortgage pass-through |
|
|
|
|
|
|
|
|
|
|
|
|
|
|
|
|
|
| ||||||
Guaranteed by GNMA |
|
| 27,223 |
|
|
| (3,270 | ) |
|
| 3,577 |
|
|
| (569 | ) |
|
| 30,800 |
|
|
| (3,839 | ) |
Issued by FNMA and FHLMC |
|
| 770,865 |
|
|
| (41,807 | ) |
|
| 1,062,041 |
|
|
| (173,898 | ) |
|
| 1,832,906 |
|
|
| (215,705 | ) |
Other residential mortgage-backed |
|
|
|
|
|
|
|
|
|
|
|
|
|
|
|
|
|
| ||||||
Issued or guaranteed by FNMA, |
|
| 281,964 |
|
|
| (21,452 | ) |
|
| 7,235 |
|
|
| (989 | ) |
|
| 289,199 |
|
|
| (22,441 | ) |
Commercial mortgage-backed |
|
|
|
|
|
|
|
|
|
|
|
|
|
|
|
|
|
| ||||||
Issued or guaranteed by FNMA, |
|
| 833,970 |
|
|
| (57,742 | ) |
|
| 1,644 |
|
|
| (68 | ) |
|
| 835,614 |
|
|
| (57,810 | ) |
Total |
| $ | 2,078,165 |
|
| $ | (130,121 | ) |
| $ | 1,342,186 |
|
| $ | (204,848 | ) |
| $ | 3,420,351 |
|
| $ | (334,969 | ) |
The unrealized losses shown above are due to increases in market rates over the yields available at the time of purchase of the underlying securities and not credit quality. Because Trustmark does not intend to sell these securities and it is more likely than not
98
that Trustmark will not be required to sell the investments before recovery of their amortized cost bases, which may be maturity, Trustmark does not consider these investments to be other-than-temporarily impaired at December 31, 2017. There were no other-than-temporary impairments formaturity.
Securities Gains and Losses
Realized gains and losses are determined using the specific identification method and are included in noninterest income as securities gains (losses), net. For the years ended December 31, 2017, 20162023, 2022 and 2015.
Security Gains and Losses
For the periods presented,2021, gross realized gains andor losses as a result of calls and dispositions of securities, as well as any associated proceeds, were as follows ($ in thousands):
|
| Years Ended December 31, |
| |||||||||
Available for Sale |
| 2017 |
|
| 2016 |
|
| 2015 |
| |||
Proceeds from calls and sales of securities |
| $ | 27,682 |
|
| $ | 24,693 |
|
| $ | — |
|
Gross realized gains |
|
| 16 |
|
|
| 32 |
|
|
| — |
|
Gross realized losses |
|
| (1 | ) |
|
| (342 | ) |
|
| — |
|
|
| Years Ended December 31, |
| |||||||||
Available for Sale |
| 2023 |
|
| 2022 |
|
| 2021 |
| |||
Proceeds from calls and sales of securities |
| $ | 4,796 |
|
| $ | — |
|
| $ | — |
|
Gross realized gains |
|
| 47 |
|
|
| — |
|
|
| — |
|
Gross realized losses |
|
| (8 | ) |
|
| — |
|
|
| — |
|
92
Securities Pledged
Securities with a carrying value of $1.834$2.321 billion and $1.999$2.693 billion at December 31, 20172023 and 2016,2022, respectively, were pledged to collateralize public deposits and securities sold under repurchase agreements and for other purposes as permitted by law. At both December 31, 20172023 and 2016,2022, none of these securities were pledged under the Federal Reserve Discount Window program to provide additional contingency funding capacity.
Contractual Maturities
The amortized cost and estimated fair value of securities available for sale and held to maturity at December 31, 2017,2023, by contractual maturity, are shown below ($ in thousands). Expected maturities may differ from contractual maturities because borrowers may have the right to call or prepay obligations with or without call or prepayment penalties.
|
| Securities |
|
| Securities |
| ||||||||||
|
| Available for Sale |
|
| Held to Maturity |
| ||||||||||
|
| Amortized |
|
| Estimated |
|
| Amortized |
|
| Estimated |
| ||||
|
| Cost |
|
| Fair Value |
|
| Cost |
|
| Fair Value |
| ||||
Due in one year or less |
| $ | 65,199 |
|
| $ | 63,501 |
|
| $ | 340 |
|
| $ | 340 |
|
Due after one year through five years |
|
| 331,225 |
|
|
| 309,108 |
|
|
| 29,068 |
|
|
| 29,042 |
|
Due after five years through ten years |
|
| 2,356 |
|
|
| 2,151 |
|
|
| — |
|
|
| — |
|
Due after ten years |
|
| 3,606 |
|
|
| 3,400 |
|
|
| — |
|
|
| — |
|
|
|
| 402,386 |
|
|
| 378,160 |
|
|
| 29,408 |
|
|
| 29,382 |
|
Mortgage-backed securities |
|
| 1,556,621 |
|
|
| 1,384,718 |
|
|
| 1,396,871 |
|
|
| 1,326,122 |
|
Total |
| $ | 1,959,007 |
|
| $ | 1,762,878 |
|
| $ | 1,426,279 |
|
| $ | 1,355,504 |
|
|
| Securities |
|
| Securities |
| ||||||||||
|
| Available for Sale |
|
| Held to Maturity |
| ||||||||||
|
| Amortized |
|
| Estimated |
|
| Amortized |
|
| Estimated |
| ||||
|
| Cost |
|
| Fair Value |
|
| Cost |
|
| Fair Value |
| ||||
Due in one year or less |
| $ | 31,376 |
|
| $ | 31,525 |
|
| $ | 155 |
|
| $ | 155 |
|
Due after one year through five years |
|
| 57,372 |
|
|
| 58,343 |
|
|
| 40,594 |
|
|
| 41,450 |
|
Due after five years through ten years |
|
| 3,866 |
|
|
| 3,845 |
|
|
| 8,982 |
|
|
| 9,293 |
|
Due after ten years |
|
| 31,582 |
|
|
| 30,801 |
|
|
| — |
|
|
| — |
|
|
|
| 124,196 |
|
|
| 124,514 |
|
|
| 49,731 |
|
|
| 50,898 |
|
Mortgage-backed securities |
|
| 2,137,934 |
|
|
| 2,114,121 |
|
|
| 1,006,755 |
|
|
| 995,349 |
|
Total |
| $ | 2,262,130 |
|
| $ | 2,238,635 |
|
| $ | 1,056,486 |
|
| $ | 1,046,247 |
|
Note 54 – LHFI and Allowance for Loan Losses,ACL, LHFI
At December 31, 20172023 and 2016,2022, LHFI consisted of the following ($ in thousands):
|
| December 31, |
| |||||
|
| 2017 |
|
| 2016 |
| ||
Loans secured by real estate: |
|
|
|
|
|
|
|
|
Construction, land development and other land |
| $ | 987,624 |
|
| $ | 831,437 |
|
Secured by 1-4 family residential properties |
|
| 1,675,311 |
|
|
| 1,660,043 |
|
Secured by nonfarm, nonresidential properties |
|
| 2,193,823 |
|
|
| 2,034,176 |
|
Other real estate secured |
|
| 517,956 |
|
|
| 318,148 |
|
Commercial and industrial loans |
|
| 1,570,345 |
|
|
| 1,528,434 |
|
Consumer loans |
|
| 171,918 |
|
|
| 170,562 |
|
State and other political subdivision loans |
|
| 952,483 |
|
|
| 917,515 |
|
Other loans |
|
| 500,507 |
|
|
| 390,898 |
|
LHFI (1) |
|
| 8,569,967 |
|
|
| 7,851,213 |
|
Less allowance for loan losses, LHFI |
|
| 76,733 |
|
|
| 71,265 |
|
Net LHFI |
| $ | 8,493,234 |
|
| $ | 7,779,948 |
|
|
|
|
| December 31, |
| |||||
|
| 2023 |
|
| 2022 |
| ||
Loans secured by real estate: |
|
|
|
|
|
| ||
Construction, land development and other land |
| $ | 642,886 |
|
| $ | 690,616 |
|
Other secured by 1-4 family residential properties |
|
| 622,397 |
|
|
| 590,790 |
|
Secured by nonfarm, nonresidential properties |
|
| 3,489,434 |
|
|
| 3,278,830 |
|
Other real estate secured |
|
| 1,312,551 |
|
|
| 742,538 |
|
Other loans secured by real estate: |
|
|
|
|
|
| ||
Other construction |
|
| 867,793 |
|
|
| 1,028,926 |
|
Secured by 1-4 family residential properties |
|
| 2,282,318 |
|
|
| 2,185,057 |
|
Commercial and industrial loans |
|
| 1,922,910 |
|
|
| 1,821,259 |
|
Consumer loans |
|
| 165,734 |
|
|
| 170,230 |
|
State and other political subdivision loans |
|
| 1,088,466 |
|
|
| 1,223,863 |
|
Other commercial loans and leases |
|
| 556,035 |
|
|
| 471,930 |
|
LHFI |
|
| 12,950,524 |
|
|
| 12,204,039 |
|
Less ACL |
|
| 139,367 |
|
|
| 120,214 |
|
Net LHFI |
| $ | 12,811,157 |
|
| $ | 12,083,825 |
|
99Accrued interest receivable is not included in the amortized cost basis of Trustmark’s LHFI. At December 31, 2023 and 2022, accrued interest receivable for LHFI totaled $71.0 million and $50.7 million, respectively, with no related ACL and was reported in other assets on the accompanying consolidated balance sheet.
Trustmark does not have any loan concentrations other than those reflected in the preceding table, which exceed 10% of total LHFI. At December 31, 2017,2023, Trustmark’s geographic loan distribution was concentrated primarily in its five key market regions: Alabama, Florida, Mississippi, Tennessee and Texas. Accordingly, the ultimate collectability of a substantial portion of these loans is susceptible to changes in market conditions in these areas.
93
Related Party Loans
At December 31, 20172023 and 2016,2022, loans to certain executive officers and directors, including their immediate families and companies in which they are principal owners, totaled $59.9$41.1 million and $47.1$47.0 million, respectively. During 2017, $418.52023, $287.4 million of new loan advances were made, while repayments were $405.8$293.2 million. In addition,There were no increases in loans due to changes in executive officers and directors totaled $12 thousand.directors.
Nonaccrual and Past Due LHFI
At December 31, 2017 and 2016, the carrying amounts of nonaccrual LHFI were $67.6 million and $49.2 million, respectively. Included in these amounts were $23.2 million and $14.4 million, respectively, of nonaccrual LHFI classified as TDRs. No material interest income was recognized in the income statement on nonaccrual LHFI for each of the years in the three-year period ended December 31, 2017.2023.
The following table detailstables provide the amortized cost basis of loans on nonaccrual LHFI by loan typestatus and loans past due 90 days or more still accruing interest at December 31, 20172023 and 20162022 ($ in thousands):
|
| December 31, 2023 |
| |||||||||
|
| Nonaccrual With No ACL |
|
| Total Nonaccrual |
|
| Loans Past Due 90 Days or More Still Accruing |
| |||
Loans secured by real estate: |
|
|
|
|
|
|
|
|
| |||
Construction, land development and other land |
| $ | 2,020 |
|
| $ | 2,642 |
|
| $ | — |
|
Other secured by 1-4 family residential properties |
|
| 946 |
|
|
| 6,518 |
|
|
| 1,238 |
|
Secured by nonfarm, nonresidential properties |
|
| 20,812 |
|
|
| 23,061 |
|
|
| 54 |
|
Other real estate secured |
|
| — |
|
|
| 158 |
|
|
| 106 |
|
Other loans secured by real estate: |
|
|
|
|
|
|
|
|
| |||
Other construction |
|
| — |
|
|
| 62 |
|
|
| — |
|
Secured by 1-4 family residential properties |
|
| 3,235 |
|
|
| 43,815 |
|
|
| 3,740 |
|
Commercial and industrial loans |
|
| 79 |
|
|
| 22,303 |
|
|
| 24 |
|
Consumer loans |
|
| — |
|
|
| 243 |
|
|
| 628 |
|
Other commercial loans and leases |
|
| — |
|
|
| 1,206 |
|
|
| — |
|
Total |
| $ | 27,092 |
|
| $ | 100,008 |
|
| $ | 5,790 |
|
|
| December 31, 2022 |
| |||||||||
|
| Nonaccrual With No ACL |
|
| Total Nonaccrual |
|
| Loans Past Due 90 Days or More Still Accruing |
| |||
Loans secured by real estate: |
|
|
|
|
|
|
|
|
| |||
Construction, land development and other land |
| $ | 137 |
|
| $ | 1,902 |
|
| $ | — |
|
Other secured by 1-4 family residential properties |
|
| 482 |
|
|
| 3,957 |
|
|
| 534 |
|
Secured by nonfarm, nonresidential properties |
|
| 4,841 |
|
|
| 6,957 |
|
|
| — |
|
Other real estate secured |
|
| — |
|
|
| 231 |
|
|
| — |
|
Other loans secured by real estate: |
|
|
|
|
|
|
|
|
| |||
Other construction |
|
| — |
|
|
| 7,620 |
|
|
| — |
|
Secured by 1-4 family residential properties |
|
| 1,193 |
|
|
| 19,775 |
|
|
| 3,118 |
|
Commercial and industrial loans |
|
| 14,441 |
|
|
| 25,102 |
|
|
| — |
|
Consumer loans |
|
| — |
|
|
| 181 |
|
|
| 277 |
|
Other commercial loans |
|
| — |
|
|
| 247 |
|
|
| — |
|
Total |
| $ | 21,094 |
|
| $ | 65,972 |
|
| $ | 3,929 |
|
|
| December 31, |
| |||||
|
| 2017 |
|
| 2016 |
| ||
Loans secured by real estate: |
|
|
|
|
|
|
|
|
Construction, land development and other land |
| $ | 2,105 |
|
| $ | 3,323 |
|
Secured by 1-4 family residential properties |
|
| 19,022 |
|
|
| 20,329 |
|
Secured by nonfarm, nonresidential properties |
|
| 12,608 |
|
|
| 8,482 |
|
Other real estate secured |
|
| 212 |
|
|
| 402 |
|
Commercial and industrial loans |
|
| 33,338 |
|
|
| 15,824 |
|
Consumer loans |
|
| 135 |
|
|
| 300 |
|
State and other political subdivision loans |
|
| — |
|
|
| — |
|
Other loans |
|
| 155 |
|
|
| 574 |
|
Total nonaccrual LHFI |
| $ | 67,575 |
|
| $ | 49,234 |
|
94
The following tables provide an aging analysis of the amortized cost basis of past due andLHFI (including nonaccrual LHFI by loan typeloans) at December 31, 20172023 and 20162022 ($ in thousands):
|
| December 31, 2017 |
| |||||||||||||||||||||||||
|
| Past Due |
|
|
|
|
|
|
|
|
|
|
|
|
| |||||||||||||
|
|
|
|
|
|
|
|
|
| 90 Days |
|
|
|
|
|
|
|
|
|
| Current |
|
|
|
|
| ||
|
| 30-59 Days |
|
| 60-89 Days |
|
| or More (1) |
|
| Total |
|
| Nonaccrual |
|
| Loans |
|
| Total LHFI |
| |||||||
Loans secured by real estate: |
|
|
|
|
|
|
|
|
|
|
|
|
|
|
|
|
|
|
|
|
|
|
|
|
|
|
|
|
Construction, land development and other land |
| $ | 391 |
|
| $ | 1 |
|
| $ | — |
|
| $ | 392 |
|
| $ | 2,105 |
|
| $ | 985,127 |
|
| $ | 987,624 |
|
Secured by 1-4 family residential properties |
|
| 6,412 |
|
|
| 2,084 |
|
|
| 1,917 |
|
|
| 10,413 |
|
|
| 19,022 |
|
|
| 1,645,876 |
|
|
| 1,675,311 |
|
Secured by nonfarm, nonresidential properties |
|
| 2,319 |
|
|
| 256 |
|
|
| — |
|
|
| 2,575 |
|
|
| 12,608 |
|
|
| 2,178,640 |
|
|
| 2,193,823 |
|
Other real estate secured |
|
| — |
|
|
| — |
|
|
| — |
|
|
| — |
|
|
| 212 |
|
|
| 517,744 |
|
|
| 517,956 |
|
Commercial and industrial loans |
|
| 759 |
|
|
| 1,233 |
|
|
| 12 |
|
|
| 2,004 |
|
|
| 33,338 |
|
|
| 1,535,003 |
|
|
| 1,570,345 |
|
Consumer loans |
|
| 2,141 |
|
|
| 255 |
|
|
| 242 |
|
|
| 2,638 |
|
|
| 135 |
|
|
| 169,145 |
|
|
| 171,918 |
|
State and other political subdivision loans |
|
| 350 |
|
|
| 39 |
|
|
| — |
|
|
| 389 |
|
|
| — |
|
|
| 952,094 |
|
|
| 952,483 |
|
Other loans |
|
| 18 |
|
|
| 4 |
|
|
| — |
|
|
| 22 |
|
|
| 155 |
|
|
| 500,330 |
|
|
| 500,507 |
|
Total |
| $ | 12,390 |
|
| $ | 3,872 |
|
| $ | 2,171 |
|
| $ | 18,433 |
|
| $ | 67,575 |
|
| $ | 8,483,959 |
|
| $ | 8,569,967 |
|
Modified LHFI |
| ||||||||||||||||||||||||||||||||||||||||||||||||||||||||||||||||||||||||||||||||||||||||||||||||||||||||||||||||||||||||||||||||||||||||||||||||||||||||||||||||||||||||||||||||||||||||||||||||||||||||||||||||||||||||||||||||||||||||||||||||||||||||||||||||||||||||||||||||||||||||||||||||||||||||||||||||||||||||||||||||||||||||||||||||||||||||||||||||||||||||||||||||||||||||||||||||||||||||||||||||||||||||||||||||||||||||||||||||||||||||||||||||||||||||||||||||||||||||||||||||||||||||||||||||||||||||||||||||||||||||||||||||||||||||||||||||||||||||||||||||||||||||||||||||||||||||||||||||||||||||||||||||||||||||||||||||||||||||||||||||||||||||||||||||||||||||||||||||||||||||||||||||||||||||||||||||||||||||||||||||||||||||||||||||||||||||||||||||||||||||||||||||||||||||||||||||||||||||||||||||||||||||||||||||||||||||||||||||||||||||||||||||||||||||||||||||||||||||||||||||||||||||||||||||||||
100
| December 31, 2016 |
| ||||||||||||||||||||||||||
|
| Past Due |
|
|
|
|
|
|
|
|
|
|
|
|
| |||||||||||||
|
|
|
|
|
|
|
|
|
| 90 Days |
|
|
|
|
|
|
|
|
|
| Current |
|
|
|
|
| ||
|
| 30-59 Days |
|
| 60-89 Days |
|
| or More (1) |
|
| Total |
|
| Nonaccrual |
|
| Loans |
|
| Total LHFI |
| |||||||
Loans secured by real estate: |
|
|
|
|
|
|
|
|
|
|
|
|
|
|
|
|
|
|
|
|
|
|
|
|
|
|
|
|
Construction, land development and other land |
| $ | 248 |
|
| $ | 37 |
|
| $ | 54 |
|
| $ | 339 |
|
| $ | 3,323 |
|
| $ | 827,775 |
|
| $ | 831,437 |
|
Secured by 1-4 family residential properties |
|
| 5,308 |
|
|
| 2,434 |
|
|
| 1,436 |
|
|
| 9,178 |
|
|
| 20,329 |
|
|
| 1,630,536 |
|
|
| 1,660,043 |
|
Secured by nonfarm, nonresidential properties |
|
| 606 |
|
|
| 100 |
|
|
| — |
|
|
| 706 |
|
|
| 8,482 |
|
|
| 2,024,988 |
|
|
| 2,034,176 |
|
Other real estate secured |
|
| 179 |
|
|
| — |
|
|
| — |
|
|
| 179 |
|
|
| 402 |
|
|
| 317,567 |
|
|
| 318,148 |
|
Commercial and industrial loans |
|
| 571 |
|
|
| 213 |
|
|
| — |
|
|
| 784 |
|
|
| 15,824 |
|
|
| 1,511,826 |
|
|
| 1,528,434 |
|
Consumer loans |
|
| 1,561 |
|
|
| 330 |
|
|
| 341 |
|
|
| 2,232 |
|
|
| 300 |
|
|
| 168,030 |
|
|
| 170,562 |
|
State and other political subdivision loans |
|
| 1,035 |
|
|
| — |
|
|
| — |
|
|
| 1,035 |
|
|
| — |
|
|
| 916,480 |
|
|
| 917,515 |
|
Other loans |
|
| 178 |
|
|
| 53 |
|
|
| — |
|
|
| 231 |
|
|
| 574 |
|
|
| 390,093 |
|
|
| 390,898 |
|
Total |
| $ | 9,686 |
|
| $ | 3,167 |
|
| $ | 1,831 |
|
| $ | 14,684 |
|
| $ | 49,234 |
|
| $ | 7,787,295 |
|
| $ | 7,851,213 |
|
|
|
Impaired LHFI
As of January 1, 2017,Occasionally, Trustmark modified its presentation of individually evaluated impaired LHFI in the accompanying notes to the consolidatedmodifies loans for borrowers experiencing financial statements to include all commercial nonaccrual relationships of $500 thousand or more, which are specifically reviewed for impairment and deemed impaired, and all LHFI classified as TDRs in accordance with FASB ASC Topic 310-10-50-20. Previously, Trustmark presented all nonaccrual LHFI and LHFI classified as TDRs as impaired loans. Nonaccrual LHFI includes both individually evaluated impaired LHFI as well as smaller balance homogeneous loans that are collectively evaluated for impairment. As a result of this change in presentation, these smaller balance homogenous nonaccrual LHFI are included within the LHFI collectively evaluated for impairment category. All prior period information has been reclassified to conform to the current period presentation.
Trustmark’s individually evaluated impaired LHFI are primarily collateral dependent loans. Fair value estimates for collateral dependent loans are derived from appraised values based on the current market value or as is value of the collateral, normally from recently received and reviewed appraisals. Current appraisals are ordered on an annual basis based on the inspection date or more often if market conditions necessitate. Appraisals are obtained from state-certified appraisers and are based on certain assumptions, which may include construction or development status and the highest and best use of the property. These appraisals are revieweddifficulties by Trustmark’s Appraisal Review Department to ensure they are acceptable, and values are adjusted down for costs associated with asset disposal. Once this estimated net realizable value has been determined, the value used in the impairment assessment is updated. At the time a LHFI that has been individually evaluated for impairment is deemed to be impaired, the full difference between book value and the most likely estimate of the collateral’s net realizable value is charged off. As subsequent events dictate and estimated net realizable values decline, required reserves may be established or further adjustments recorded.
No material interest income was recognized in the accompanying consolidated statements of income on impaired LHFI for each of the years in the three-year period ended December 31, 2017.
101
At December 31, 2017 and 2016, the carrying amount of LHFI individually evaluated for impairment consisted of the following ($ in thousands):
|
| December 31, 2017 |
| |||||||||||||||||||||
|
| LHFI |
|
|
|
|
|
|
|
|
| |||||||||||||
|
| Unpaid |
|
| With No Related |
|
| With an |
|
| Total |
|
|
|
|
|
| Average |
| |||||
|
| Principal |
|
| Allowance |
|
| Allowance |
|
| Carrying |
|
| Related |
|
| Recorded |
| ||||||
|
| Balance |
|
| Recorded |
|
| Recorded |
|
| Amount |
|
| Allowance |
|
| Investment |
| ||||||
Loans secured by real estate: |
|
|
|
|
|
|
|
|
|
|
|
|
|
|
|
|
|
|
|
|
|
|
|
|
Construction, land development and other land |
| $ | 1,704 |
|
| $ | 1,206 |
|
| $ | 199 |
|
| $ | 1,405 |
|
| $ | 75 |
|
| $ | 1,923 |
|
Secured by 1-4 family residential properties |
|
| 6,031 |
|
|
| 160 |
|
|
| 4,576 |
|
|
| 4,736 |
|
|
| 1,331 |
|
|
| 4,693 |
|
Secured by nonfarm, nonresidential properties |
|
| 15,205 | �� |
|
| 10,027 |
|
|
| 396 |
|
|
| 10,423 |
|
|
| 165 |
|
|
| 8,321 |
|
Other real estate secured |
|
| — |
|
|
| — |
|
|
| — |
|
|
| — |
|
|
| — |
|
|
| — |
|
Commercial and industrial loans |
|
| 36,874 |
|
|
| 31,281 |
|
|
| 518 |
|
|
| 31,799 |
|
|
| 131 |
|
|
| 22,734 |
|
Consumer loans |
|
| 17 |
|
|
| — |
|
|
| 17 |
|
|
| 17 |
|
|
| — |
|
|
| 9 |
|
State and other political subdivision loans |
|
| — |
|
|
| — |
|
|
| — |
|
|
| — |
|
|
| — |
|
|
| — |
|
Other loans |
|
| 556 |
|
|
| — |
|
|
| 556 |
|
|
| 556 |
|
|
| 41 |
|
|
| 325 |
|
Total |
| $ | 60,387 |
|
| $ | 42,674 |
|
| $ | 6,262 |
|
| $ | 48,936 |
|
| $ | 1,743 |
|
| $ | 38,005 |
|
|
| December 31, 2016 |
| |||||||||||||||||||||
|
| LHFI |
|
|
|
|
|
|
|
|
| |||||||||||||
|
| Unpaid |
|
| With No Related |
|
| With an |
|
| Total |
|
|
|
|
|
| Average |
| |||||
|
| Principal |
|
| Allowance |
|
| Allowance |
|
| Carrying |
|
| Related |
|
| Recorded |
| ||||||
|
| Balance |
|
| Recorded |
|
| Recorded |
|
| Amount |
|
| Allowance |
|
| Investment |
| ||||||
Loans secured by real estate: |
|
|
|
|
|
|
|
|
|
|
|
|
|
|
|
|
|
|
|
|
|
|
|
|
Construction, land development and other land |
| $ | 5,691 |
|
| $ | 2,213 |
|
| $ | 228 |
|
| $ | 2,441 |
|
| $ | 103 |
|
| $ | 2,943 |
|
Secured by 1-4 family residential properties |
|
| 6,134 |
|
|
| 221 |
|
|
| 4,428 |
|
|
| 4,649 |
|
|
| 960 |
|
|
| 4,639 |
|
Secured by nonfarm, nonresidential properties |
|
| 8,562 |
|
|
| 5,784 |
|
|
| 435 |
|
|
| 6,219 |
|
|
| 221 |
|
|
| 6,703 |
|
Other real estate secured |
|
| — |
|
|
| — |
|
|
| — |
|
|
| — |
|
|
| — |
|
|
| 500 |
|
Commercial and industrial loans |
|
| 14,593 |
|
|
| 11,222 |
|
|
| 2,447 |
|
|
| 13,669 |
|
|
| 1,976 |
|
|
| 14,258 |
|
Consumer loans |
|
| 2 |
|
|
| — |
|
|
| 2 |
|
|
| 2 |
|
|
| — |
|
|
| 2 |
|
State and other political subdivision loans |
|
| — |
|
|
| — |
|
|
| — |
|
|
| — |
|
|
| — |
|
|
| — |
|
Other loans |
|
| 95 |
|
|
| — |
|
|
| 95 |
|
|
| 95 |
|
|
| — |
|
|
| 95 |
|
Total |
| $ | 35,077 |
|
| $ | 19,440 |
|
| $ | 7,635 |
|
| $ | 27,075 |
|
| $ | 3,260 |
|
| $ | 29,140 |
|
Troubled Debt Restructurings
At December 31, 2017, 2016 and 2015, LHFI classified as TDRs totaled $23.9 million, $14.5 million and $9.7 million, respectively, and were primarily comprised of credits withproviding payment concessions, interest-only payments for an extended period of time, which totaled $20.5 million, $9.8 millionmaturity extensions or interest rate reductions. Other concessions may arise from court proceedings or may be imposed by law. In some cases, Trustmark provides multiple types of concessions on one loan.
The following tables present the amortized cost of LHFI at the end of each of the periods presented of loans modified to borrowers experiencing financial difficulty disaggregated by class of loan and $5.9 million, respectively.type of modification ($ in thousands). The remaining TDRspercentage of the amortized cost basis of LHFI that were modified to borrowers in financial distress as compared to the amortized cost basis of each class of LHFI is also presented below:
|
| Year Ended December 31, 2023 |
| |||||||||||||
|
| Payment Concessions |
|
| Term Extensions |
|
| Total |
|
| % of Total Class of Loan |
| ||||
Loans secured by real estate: |
|
|
|
|
|
|
|
|
|
|
|
| ||||
Other secured by 1-4 family residential properties |
| $ | — |
|
| $ | 805 |
|
| $ | 805 |
|
|
| 0.13 | % |
Secured by nonfarm, nonresidential properties |
|
| — |
|
|
| 359 |
|
|
| 359 |
|
|
| 0.01 | % |
Other loans secured by real estate: |
|
|
|
|
|
|
|
|
|
|
|
| ||||
Secured by 1-4 family residential properties |
|
| — |
|
|
| 1,148 |
|
|
| 1,148 |
|
|
| 0.05 | % |
Commercial and industrial loans |
|
| 242 |
|
|
| — |
|
|
| 242 |
|
|
| 0.01 | % |
Consumer loans |
|
| — |
|
|
| 36 |
|
|
| 36 |
|
|
| 0.02 | % |
Other commercial loans and leases |
|
| 116 |
|
|
| 31 |
|
|
| 147 |
|
|
| 0.03 | % |
Total |
| $ | 358 |
|
| $ | 2,379 |
|
| $ | 2,737 |
|
|
| 0.02 | % |
95
The following table details the financial effect of the loan modifications presented above to borrowers experiencing financial difficulty for the periods presented:
Year Ended December 31, 2023 | ||||
Financial Effect | ||||
Payment Concessions | Term Extensions | |||
Loans secured by real estate: | ||||
Other secured by 1-4 family residential properties | Modifed lines of credit to amortize over 12 month and 24 month terms | |||
Secured by nonfarm, nonresidential properties | One loan renewed and extended maturity by six months | |||
Other loans secured by real estate: | ||||
Secured by 1-4 family residential properties | Extended amortization with term adjusted by weighted-average 3.4 years | |||
Commercial and industrial loans | Six month payment deferrals | |||
Consumer loans | Bankruptcies extended amortization with term adjusted by weighted average 1.3 years reducing borrower payment | |||
Other commercial loans and leases | Six month payment deferrals | One loan renewed and extended maturity by seven months | ||
Trustmark had no unused commitments on modified loans to borrowers experiencing financial difficulty at December 31, 2017, 2016 and 2015 resulted from real estate loans discharged through Chapter 7 bankruptcy that were not reaffirmed or from payment or maturity extensions.2023.
For TDRs, Trustmark had a related loan loss allowance of $458 thousand at December 31, 2017, $2.2 million at December 31, 2016 and $1.8 million at December 31, 2015. LHFI classified as TDRs are charged down toDuring the most likely fair value estimate less an estimated cost to sell for collateral dependent loans, which would approximate net realizable value. Specific charge-offs related to TDRs totaled $127 thousand, $1.0 million and $806 thousand for the yearsyear ended December 31, 2017, 2016 and 2015, respectively.
At December 31, 2017 and 2016,2023, Trustmark held $366had payment concession balances of $116 thousand and $269 thousand, respectively, of foreclosed residential real estate as a result of foreclosure or in substance repossession of consumer mortgageat default for LHFI classified as TDRs. There were no consumer mortgage LHFI classified as TDRs in the process of formal foreclosure proceedings at December 31, 2017 compared to $101 thousand at December 31, 2016.
102
The following tables illustrate the impact of modifications classified as TDRs as well as those TDRsother commercial loans and leases portfolio that had a payment default and were modified within the last 12twelve months for which there was a paymentprior to that default during the period for the periods presented ($ in thousands):to borrowers experiencing financial difficulty.
|
| Year Ended December 31, 2017 |
| |||||||||
Modifications Classified as TDRs |
| Number of Contracts |
|
| Pre-Modification Outstanding Recorded Investment |
|
| Post-Modification Outstanding Recorded Investment |
| |||
Loans secured by real estate: |
|
|
|
|
|
|
|
|
|
|
|
|
Construction, land development and other land |
|
| 1 |
|
| $ | 341 |
|
| $ | 325 |
|
Secured by 1-4 family residential properties |
|
| 22 |
|
|
| 1,478 |
|
|
| 1,487 |
|
Secured by nonfarm, nonresidential properties |
|
| 1 |
|
|
| 426 |
|
|
| 426 |
|
Commercial and industrial loans |
|
| 8 |
|
|
| 12,836 |
|
|
| 12,836 |
|
Other loans |
|
| 1 |
|
|
| 556 |
|
|
| 556 |
|
Total |
|
| 33 |
|
| $ | 15,637 |
|
| $ | 15,630 |
|
|
| Year Ended December 31, 2016 |
| |||||||||
Modifications Classified as TDRs |
| Number of Contracts |
|
| Pre-Modification Outstanding Recorded Investment |
|
| Post-Modification Outstanding Recorded Investment |
| |||
Loans secured by real estate: |
|
|
|
|
|
|
|
|
|
|
|
|
Construction, land development and other land |
|
| 1 |
|
| $ | 14 |
|
| $ | 14 |
|
Secured by 1-4 family residential properties |
|
| 18 |
|
|
| 1,386 |
|
|
| 1,391 |
|
Secured by nonfarm, nonresidential properties |
|
| 2 |
|
|
| 717 |
|
|
| 717 |
|
Commercial and industrial loans |
|
| 5 |
|
|
| 10,043 |
|
|
| 9,982 |
|
Consumer loans |
|
| 1 |
|
|
| 2 |
|
|
| 2 |
|
Total |
|
| 27 |
|
| $ | 12,162 |
|
| $ | 12,106 |
|
|
| Year Ended December 31, 2015 |
| |||||||||
Modifications Classified as TDRs |
| Number of Contracts |
|
| Pre-Modification Outstanding Recorded Investment |
|
| Post-Modification Outstanding Recorded Investment |
| |||
Loans secured by real estate: |
|
|
|
|
|
|
|
|
|
|
|
|
Secured by 1-4 family residential properties |
|
| 13 |
|
| $ | 688 |
|
| $ | 688 |
|
Secured by nonfarm, nonresidential properties |
|
| 5 |
|
|
| 3,613 |
|
|
| 3,613 |
|
Total |
|
| 18 |
|
| $ | 4,301 |
|
| $ | 4,301 |
|
|
| Years Ended December 31, |
| |||||||||||||||||||||
|
| 2017 |
|
| 2016 |
|
| 2015 |
| |||||||||||||||
TDRs that Subsequently Defaulted |
| Number of Contracts |
|
| Recorded Investment |
|
| Number of Contracts |
|
| Recorded Investment |
|
| Number of Contracts |
|
| Recorded Investment |
| ||||||
Loans secured by 1-4 family residential properties |
|
| 4 |
|
| $ | 78 |
|
|
| 1 |
|
| $ | — |
|
|
| 5 |
|
| $ | 260 |
|
Commercial and industrial loans |
|
| 3 |
|
|
| 9,526 |
|
|
| 2 |
|
|
| 2,154 |
|
|
| — |
|
|
| — |
|
Total |
|
| 7 |
|
| $ | 9,604 |
|
|
| 3 |
|
| $ | 2,154 |
|
|
| 5 |
|
| $ | 260 |
|
Trustmark’s TDRs have resulted primarily from allowing the borrower to pay interest-only for an extended period of time rather than from forgiveness. Accordingly, as shown above, these TDRs have a similar recorded investment for both the pre-modification and post-modification disclosure. Trustmark has utilized loans 90 days or more past due to define payment default in determining TDRsmodified loans that have subsequently defaulted. If Trustmark determines that a modified loan (or a portion of a loan) has subsequently been deemed uncollectible, the loan (or a portion of the loan) is charged off against the ACL, LHFI.
103
Trustmark closely monitors the performance of loans that are modified to borrowers experiencing financial difficulty to understand the effectiveness of its modification efforts. The following tables detailprovide details of the performance of such LHFI classified as TDRsthat have been modified during the periods presented ($ in thousands):
|
| Year Ended December 31, 2023 |
| |||||||||||||||||||||
|
| Past Due |
|
|
|
|
|
|
| |||||||||||||||
|
|
|
|
|
|
|
| 90 Days |
|
| Total |
|
| Current |
|
|
|
| ||||||
|
| 30-59 Days |
|
| 60-89 Days |
|
| or More |
|
| Past Due |
|
| Loans |
|
| Total |
| ||||||
Loans secured by real estate: |
|
|
|
|
|
|
|
|
|
|
|
|
|
|
|
|
|
| ||||||
Other secured by 1-4 family residential properties |
| $ | 290 |
|
| $ | 17 |
|
| $ | — |
|
| $ | 307 |
|
| $ | 498 |
|
| $ | 805 |
|
Secured by nonfarm, nonresidential properties |
|
| — |
|
|
| — |
|
|
| — |
|
|
| — |
|
|
| 359 |
|
|
| 359 |
|
Other loans secured by real estate: |
|
|
|
|
|
|
|
|
|
|
|
|
|
|
|
|
|
| ||||||
Secured by 1-4 family residential properties |
|
| 64 |
|
|
| — |
|
|
| — |
|
|
| 64 |
|
|
| 1,084 |
|
|
| 1,148 |
|
Commercial and industrial loans |
|
| — |
|
|
| — |
|
|
| — |
|
|
| — |
|
|
| 242 |
|
|
| 242 |
|
Consumer loans |
|
| 17 |
|
|
| — |
|
|
| — |
|
|
| 17 |
|
|
| 19 |
|
|
| 36 |
|
Other commercial loans and leases |
|
| — |
|
|
| — |
|
|
| — |
|
|
| — |
|
|
| 147 |
|
|
| 147 |
|
Total |
| $ | 371 |
|
| $ | 17 |
|
| $ | — |
|
| $ | 388 |
|
| $ | 2,349 |
|
| $ | 2,737 |
|
96
Collateral-Dependent Loans
The following tables present the amortized cost basis of collateral-dependent loans by loanclass of loans and collateral type at December 31, 2017, 20162023 and 20152022 ($ in thousands):
|
| December 31, 2023 |
| |||||||||||||
|
| Real Estate |
|
| Vehicles |
|
| Miscellaneous |
|
| Total |
| ||||
Loans secured by real estate: |
|
|
|
|
|
|
|
|
|
|
|
| ||||
Construction, land development and |
| $ | 2,020 |
|
| $ | — |
|
| $ | — |
|
| $ | 2,020 |
|
Other secured by 1-4 family |
|
| 946 |
|
|
| — |
|
|
| — |
|
|
| 946 |
|
Secured by nonfarm, nonresidential |
|
| 20,812 |
|
|
| — |
|
|
| — |
|
|
| 20,812 |
|
Other loans secured by real estate: |
|
|
|
|
|
|
|
|
|
|
|
| ||||
Secured by 1-4 family residential |
|
| 3,235 |
|
|
| — |
|
|
| — |
|
|
| 3,235 |
|
Commercial and industrial loans |
|
| 38 |
|
|
| 41 |
|
|
| 21,023 |
|
|
| 21,102 |
|
Other commercial loans and leases |
|
| — |
|
|
| — |
|
|
| 967 |
|
|
| 967 |
|
Total |
| $ | 27,051 |
|
| $ | 41 |
|
| $ | 21,990 |
|
| $ | 49,082 |
|
|
| December 31, 2022 |
| |||||||||||||||||
|
| Real Estate |
|
| Inventory and Receivables |
|
| Vehicles |
|
| Miscellaneous |
|
| Total |
| |||||
Loans secured by real estate: |
|
|
|
|
|
|
|
|
|
|
|
|
|
|
| |||||
Construction, land development and |
| $ | 1,558 |
|
| $ | — |
|
| $ | — |
|
| $ | — |
|
| $ | 1,558 |
|
Other secured by 1-4 family |
|
| 482 |
|
|
| — |
|
|
| — |
|
|
| — |
|
|
| 482 |
|
Secured by nonfarm, nonresidential |
|
| 4,841 |
|
|
| — |
|
|
| — |
|
|
| — |
|
|
| 4,841 |
|
Other loans secured by real estate: |
|
|
|
|
|
|
|
|
|
|
|
|
|
|
| |||||
Other construction |
|
| 7,620 |
|
|
| — |
|
|
| — |
|
|
| — |
|
|
| 7,620 |
|
Secured by 1-4 family residential |
|
| 1,193 |
|
|
| — |
|
|
| — |
|
|
| — |
|
|
| 1,193 |
|
Commercial and industrial loans |
|
| 40 |
|
|
| 233 |
|
|
| 395 |
|
|
| 23,926 |
|
|
| 24,594 |
|
Total |
| $ | 15,734 |
|
| $ | 233 |
|
| $ | 395 |
|
| $ | 23,926 |
|
| $ | 40,288 |
|
A loan is collateral dependent when the borrower is experiencing financial difficulty and repayment of the loan is expected to be provided substantially through the sale of the collateral. The following provides a qualitative description by class of loan of the collateral that secures Trustmark’s collateral-dependent LHFI:
|
| December 31, 2017 |
| |||||||||
|
| Accruing |
|
| Nonaccrual |
|
| Total |
| |||
Loans secured by real estate: |
|
|
|
|
|
|
|
|
|
|
|
|
Construction, land development and other land |
| $ | — |
|
| $ | 199 |
|
| $ | 199 |
|
Secured by 1-4 family residential properties |
|
| 51 |
|
|
| 3,140 |
|
|
| 3,191 |
|
Secured by nonfarm, nonresidential properties |
|
| — |
|
|
| 421 |
|
|
| 421 |
|
Commercial and industrial loans |
|
| 53 |
|
|
| 19,434 |
|
|
| 19,487 |
|
Consumer loans |
|
| — |
|
|
| 17 |
|
|
| 17 |
|
Other loans |
|
| 556 |
|
|
| — |
|
|
| 556 |
|
Total TDRs |
| $ | 660 |
|
| $ | 23,211 |
|
| $ | 23,871 |
|
97
|
| December 31, 2016 |
| |||||||||
|
| Accruing |
|
| Nonaccrual |
|
| Total |
| |||
Loans secured by real estate: |
|
|
|
|
|
|
|
|
|
|
|
|
Construction, land development and other land |
| $ | — |
|
| $ | 405 |
|
| $ | 405 |
|
Secured by 1-4 family residential properties |
|
| — |
|
|
| 2,873 |
|
|
| 2,873 |
|
Secured by nonfarm, nonresidential properties |
|
| — |
|
|
| 881 |
|
|
| 881 |
|
Commercial and industrial loans |
|
| 53 |
|
|
| 10,266 |
|
|
| 10,319 |
|
Consumer loans |
|
| — |
|
|
| 2 |
|
|
| 2 |
|
Total TDRs |
| $ | 53 |
|
| $ | 14,427 |
|
| $ | 14,480 |
|
|
| December 31, 2015 |
| |||||||||
|
| Accruing |
|
| Nonaccrual |
|
| Total |
| |||
Loans secured by real estate: |
|
|
|
|
|
|
|
|
|
|
|
|
Construction, land development and other land |
| $ | — |
|
| $ | 869 |
|
| $ | 869 |
|
Secured by 1-4 family residential properties |
|
| 1,426 |
|
|
| 2,424 |
|
|
| 3,850 |
|
Secured by nonfarm, nonresidential properties |
|
| 809 |
|
|
| 3,662 |
|
|
| 4,471 |
|
Commercial and industrial loans |
|
| — |
|
|
| 463 |
|
|
| 463 |
|
Total TDRs |
| $ | 2,235 |
|
| $ | 7,418 |
|
| $ | 9,653 |
|
Credit Quality Indicators
Trustmark’s loan portfolio credit quality indicators focus on six key quality ratios that are compared against bank tolerances. The loan indicators are total classified outstanding, total criticized outstanding, nonperforming loans, nonperforming assets, delinquencies and net loan losses. Due to the homogenous nature of consumer loans, Trustmark does not assign a formal internal risk rating to each credit and therefore the criticized and classified measures are primarily composed of commercial loans.
In addition to monitoring portfolio credit quality indicators, Trustmark also measures how effectively the lending process is being managed and risks are being identified. As part of an ongoing monitoring process, Trustmark grades the commercial portfolio segment as it relates to credit file completion and financial statement exceptions, underwriting, collateral documentation and compliance with law as shown below:
Credit File Completeness and Financial Statement Exceptions – evaluates the quality and condition of credit files in terms of content and completeness and focuses on efforts to obtain and document sufficient information to determine the quality and status of credits. Also included is an evaluation of the systems/procedures used to insureensure compliance with policy.
Underwriting – evaluates whether credits are adequately analyzed, appropriately structured and properly approved within loan policy requirements. A properly approved credit is approved by adequate authority in a timely manner with all conditions of approval fulfilled. Total policy exceptions measure the level of underwriting and other policy exceptions within a loan portfolio.
Collateral Documentation – focuses on the adequacy of documentation to perfect Trustmark’s collateral position and substantiate collateral value. Collateral exceptions measure the level of documentation exceptions within a loan portfolio.portfolio segment. Collateral exceptions occur when certain collateral documentation is either not present or not current.
Compliance with Law – focuses on underwriting, documentation, approval and reporting in compliance with banking laws and regulations. Primary emphasis is directed to the Financial Institutions Reform, Recovery and Enforcement Act of 1989 (FIRREA), Regulation O requirements and regulations governing appraisals.
104
Trustmark has established a loan grading system that consists of ten individual credit risk grades (risk ratings) that encompass a range from loans where the expectation of loss is negligible to loans where loss has been established. The model is based on the risk of default for an individual credit and establishes certain criteria to delineate the level of risk across the ten unique credit risk grades. Credit risk grade definitions are as follows:
Risk Rate (RR) 1 through RR 6 – Grades one through six represent groups of loans that are not subject to criticism as defined in regulatory guidance. Loans in these groups exhibit characteristics that represent low to moderate risk measured by using a variety of credit risk criteria such as cash flow coverage, debt service coverage, balance sheet leverage, liquidity, management experience, industry position, prevailing economic conditions, support from secondary sources of repayment and other credit factors that may be relevant to a specific loan. In general, these loans are supported by properly margined collateral and guarantees of principal parties.
Other Assets Especially Mentioned (Special Mention) - (RR 7) – a loan that has a potential weakness that if not corrected will lead to a more severe rating. This rating is for credits that are currently protected but potentially weak because of an adverse feature or condition that if not corrected will lead to a further downgrade.
Substandard (RR 8) – a loan that has at least one identified weakness that is well defined. This rating is for credits where the primary sources of repayment are not viable at the time of evaluation or where either the capital or collateral is not adequate to support the loan and the secondary means of repayment do not provide a sufficient level of support to offset the identified weakness. Loss potential exists in the aggregate amount of substandard loans but does not necessarily exist in individual loans.
Doubtful (RR 9) – a loan with an identified weakness that does not have a valid secondary source of repayment. Generally, these credits have an impaired primary source of repayment and secondary sources are not sufficient to prevent a loss in the credit. The exact amount of the loss has not been determined at this time.
Loss (RR 10) – a loan or a portion of a loan that is deemed to be uncollectible.
By definition, credit risk grades special mention (RR 7), substandard (RR 8), doubtful (RR 9) and loss (RR 10) are criticized loans while substandard (RR 8), doubtful (RR 9) and loss (RR 10) are classified loans. These definitions are standardized by all bank regulatory agencies and are generally equally applied toby each individual lending institution. The remaining credit risk grades are considered pass credits and are solely defined by Trustmark.
Each commercial loan is assigned a credit risk grade that is an indication for the likelihood of default and is not a direct indication of loss at default. The loss at default aspect of the subject risk ratings is neither uniform across the nine primary commercial loan groups or constant between the geographic areas. To account for the variance in the loss at default aspects of the risk rating system, the loss expectations for each risk rating are integrated into the allowance for loan loss methodology where the calculated loss at default is allotted for each individual risk rating with respect to the individual loan group and unique geographic area. The loss at default aspect of the reserve methodology is calculated each quarter as a component of the overall reserve factor for each risk grade by loan group and geographic area.98
To enhance this process, relationshipsTrustmark has determined that certain loans will be individually assessed, and a formal analysis will be performed and based upon the analysis the loan will be written down to net realizable value. Trustmark will individually assess and remove loans from the pool in the following circumstances:
The distributionpool based on the results of the lossesassessment.
The expected loss distribution is spread across the various risk ratings by the perceived level of risk for loss. The nine grade scale described above ranges from a negligible risk of loss to an identified loss across its breadth. The loss distribution factors are graduated through the scale on a basis proportional to the degree of risk that appears manifest in each individual rating and assumes that migration through the loan grading system will occur.
Each loan officer assesses the appropriateness of the internal risk rating assigned to their credits on an ongoing basis. Trustmark’s Asset Review area conducts independent credit quality reviews of the majority of Trustmark’s commercial loan portfolio both on the underlying credit quality of each individual loan portfolioclass as well as the adherence to Trustmark’s loan policy and the loan administration process. In general, Asset Review conducts reviews of each lending area within a six to eighteen month window depending on the overall credit quality results of the individual area.
105
In addition to the ongoing internal risk rate monitoring described above, Trustmark’s Credit Quality Review Committee meets monthly and performs a review of all loans of $100 thousand or more that are either delinquent thirty30 days or more or on nonaccrual. This review includes recommendations regarding risk ratings, accrual status, charge-offs and appropriate servicing officer as well as evaluation of problem credits for determination of TDRs.modified status. Quarterly, the Credit Quality Review Committee reviews and modifies continuous action plans for all credits risk rated seven or worse for relationships of $100 thousand or more.
In addition, a semi-annual reviewperiodic reviews of significant development, commercial construction, multi-family and non-owner occupiednonowner-occupied projects isare performed. This review assessesThese reviews assess each particular project with respect to location, project valuations, progress of completion, leasing status, current financial information, rents, operating expenses, cash flow, adherence to budget and projections and other information as applicable. Summary results are reviewed by Senior and Regional Credit Officers in addition to the Chief Credit Officer with a determination made as to the appropriateness of existing risk ratings and accrual status.
Consumer Credits
Consumer LHFI that do not meet a minimum custom credit score are reviewed quarterly by Management. The Retail Credit Review Committee, reviewsManagement Credit Policy Committee and the Enterprise Risk Committee review the volume and percentage of approvals that did not meetconsumer loan delinquencies and losses to monitor the minimum passing custom score by region, individual location, and officer to ensure that Trustmark continues to originateoverall quality loans.of the consumer portfolio.
Trustmark monitors the levels and severity of past due consumer LHFI on a daily basis through its collection activities. A detailed assessment of consumer LHFI delinquencies is performed monthly at both a product and market level by delivery channel, which incorporates the perceived level of risk at time of underwriting.level.
99
The tables below present LHFIthe amortized cost basis of loans by loan type and credit quality indicator and class of loans based on analyses performed at December 31, 20172023 and 20162022 ($ in thousands):
|
| Term Loans by Origination Year |
|
|
|
|
|
|
| |||||||||||||||||||||||
|
| 2023 |
|
| 2022 |
|
| 2021 |
|
| 2020 |
|
| 2019 |
|
| Prior |
|
| Revolving Loans |
|
| Total |
| ||||||||
As of December 31, 2023 |
| Commercial LHFI |
| |||||||||||||||||||||||||||||
Loans secured by real estate: |
|
|
|
|
|
|
|
|
|
|
|
|
|
|
|
|
|
|
|
|
|
|
|
| ||||||||
Construction, land development |
|
|
|
|
|
|
|
|
|
|
|
|
|
|
|
|
|
|
|
|
|
|
|
| ||||||||
Pass - RR 1 through RR 6 |
| $ | 359,813 |
|
| $ | 98,742 |
|
| $ | 35,095 |
|
| $ | 10,591 |
|
| $ | 2,036 |
|
| $ | 1,961 |
|
| $ | 52,351 |
|
| $ | 560,589 |
|
Special Mention - RR 7 |
|
| — |
|
|
| — |
|
|
| 360 |
|
|
| — |
|
|
| — |
|
|
| — |
|
|
| — |
|
|
| 360 |
|
Substandard - RR 8 |
|
| 606 |
|
|
| 336 |
|
|
| 1,512 |
|
|
| 19 |
|
|
| — |
|
|
| 21 |
|
|
| — |
|
|
| 2,494 |
|
Doubtful - RR 9 |
|
| — |
|
|
| — |
|
|
| — |
|
|
| — |
|
|
| — |
|
|
| 24 |
|
|
| — |
|
|
| 24 |
|
Total |
|
| 360,419 |
|
|
| 99,078 |
|
|
| 36,967 |
|
|
| 10,610 |
|
|
| 2,036 |
|
|
| 2,006 |
|
|
| 52,351 |
|
|
| 563,467 |
|
Current period gross |
|
| — |
|
|
| (4 | ) |
|
| (10 | ) |
|
| — |
|
|
| (228 | ) |
|
| — |
|
|
| — |
|
|
| (242 | ) |
|
|
|
|
|
|
|
|
|
|
|
|
|
|
|
|
|
|
|
|
|
|
|
|
| ||||||||
Other secured by 1-4 family residential |
|
|
|
|
|
|
|
|
|
|
|
|
|
|
|
|
|
|
|
|
|
|
|
| ||||||||
Pass - RR 1 through RR 6 |
| $ | 33,072 |
|
| $ | 30,760 |
|
| $ | 29,159 |
|
| $ | 14,309 |
|
| $ | 8,084 |
|
| $ | 2,822 |
|
| $ | 10,077 |
|
| $ | 128,283 |
|
Special Mention - RR 7 |
|
| — |
|
|
| 82 |
|
|
| 48 |
|
|
| 10 |
|
|
| — |
|
|
| — |
|
|
| — |
|
|
| 140 |
|
Substandard - RR 8 |
|
| 220 |
|
|
| 625 |
|
|
| 157 |
|
|
| 22 |
|
|
| 80 |
|
|
| 306 |
|
|
| 98 |
|
|
| 1,508 |
|
Doubtful - RR 9 |
|
| — |
|
|
| — |
|
|
| — |
|
|
| — |
|
|
| — |
|
|
| — |
|
|
| — |
|
|
| — |
|
Total |
|
| 33,292 |
|
|
| 31,467 |
|
|
| 29,364 |
|
|
| 14,341 |
|
|
| 8,164 |
|
|
| 3,128 |
|
|
| 10,175 |
|
|
| 129,931 |
|
Current period gross |
|
| — |
|
|
| — |
|
|
| (24 | ) |
|
| — |
|
|
| — |
|
|
| (6 | ) |
|
| — |
|
|
| (30 | ) |
|
|
|
|
|
|
|
|
|
|
|
|
|
|
|
|
|
|
|
|
|
|
|
|
| ||||||||
Secured by nonfarm, nonresidential |
|
|
|
|
|
|
|
|
|
|
|
|
|
|
|
|
|
|
|
|
|
|
|
| ||||||||
Pass - RR 1 through RR 6 |
| $ | 501,327 |
|
| $ | 919,519 |
|
| $ | 526,412 |
|
| $ | 596,240 |
|
| $ | 323,687 |
|
| $ | 369,250 |
|
| $ | 129,142 |
|
| $ | 3,365,577 |
|
Special Mention - RR 7 |
|
| 4,271 |
|
|
| 14,930 |
|
|
| — |
|
|
| 138 |
|
|
| 23,966 |
|
|
| — |
|
|
| — |
|
|
| 43,305 |
|
Substandard - RR 8 |
|
| 6,332 |
|
|
| 1,964 |
|
|
| 47,491 |
|
|
| 10,809 |
|
|
| 8,614 |
|
|
| 5,200 |
|
|
| 48 |
|
|
| 80,458 |
|
Doubtful - RR 9 |
|
| 21 |
|
|
| — |
|
|
| — |
|
|
| — |
|
|
| 53 |
|
|
| 13 |
|
|
| — |
|
|
| 87 |
|
Total |
|
| 511,951 |
|
|
| 936,413 |
|
|
| 573,903 |
|
|
| 607,187 |
|
|
| 356,320 |
|
|
| 374,463 |
|
|
| 129,190 |
|
|
| 3,489,427 |
|
Current period gross |
|
| — |
|
|
| (39 | ) |
|
| (82 | ) |
|
| — |
|
|
| (19 | ) |
|
| (138 | ) |
|
| — |
|
|
| (278 | ) |
|
|
|
|
|
|
|
|
|
|
|
|
|
|
|
|
|
|
|
|
|
|
|
|
| ||||||||
Other real estate secured: |
|
|
|
|
|
|
|
|
|
|
|
|
|
|
|
|
|
|
|
|
|
|
|
| ||||||||
Pass - RR 1 through RR 6 |
| $ | 194,141 |
|
| $ | 447,200 |
|
| $ | 332,818 |
|
| $ | 209,757 |
|
| $ | 56,024 |
|
| $ | 11,080 |
|
| $ | 8,880 |
|
| $ | 1,259,900 |
|
Special Mention - RR 7 |
|
| 126 |
|
|
| 2,076 |
|
|
| — |
|
|
| — |
|
|
| 35,881 |
|
|
| — |
|
|
| — |
|
|
| 38,083 |
|
Substandard - RR 8 |
|
| — |
|
|
| 14,064 |
|
|
| — |
|
|
| 290 |
|
|
| — |
|
|
| 39 |
|
|
| — |
|
|
| 14,393 |
|
Doubtful - RR 9 |
|
| 42 |
|
|
| — |
|
|
| — |
|
|
| — |
|
|
| — |
|
|
| — |
|
|
| — |
|
|
| 42 |
|
Total |
|
| 194,309 |
|
|
| 463,340 |
|
|
| 332,818 |
|
|
| 210,047 |
|
|
| 91,905 |
|
|
| 11,119 |
|
|
| 8,880 |
|
|
| 1,312,418 |
|
Current period gross |
|
| — |
|
|
| — |
|
|
| — |
|
|
| — |
|
|
| — |
|
|
| — |
|
|
| — |
|
|
| — |
|
|
| December 31, 2017 |
| |||||||||||||||||
|
| Commercial LHFI |
| |||||||||||||||||
|
| Pass - |
|
| Special Mention - |
|
| Substandard - |
|
| Doubtful - |
|
|
|
|
| ||||
|
| Categories 1-6 |
|
| Category 7 |
|
| Category 8 |
|
| Category 9 |
|
| Subtotal |
| |||||
Loans secured by real estate: |
|
|
|
|
|
|
|
|
|
|
|
|
|
|
|
|
|
|
|
|
Construction, land development and other land |
| $ | 922,563 |
|
| $ | 316 |
|
| $ | 3,780 |
|
| $ | 222 |
|
| $ | 926,881 |
|
Secured by 1-4 family residential properties |
|
| 127,405 |
|
|
| 134 |
|
|
| 4,948 |
|
|
| 76 |
|
|
| 132,563 |
|
Secured by nonfarm, nonresidential properties |
|
| 2,135,749 |
|
|
| 6,684 |
|
|
| 50,785 |
|
|
| 527 |
|
|
| 2,193,745 |
|
Other real estate secured |
|
| 517,036 |
|
|
| — |
|
|
| 517 |
|
|
| — |
|
|
| 517,553 |
|
Commercial and industrial loans |
|
| 1,437,590 |
|
|
| 28,780 |
|
|
| 103,089 |
|
|
| 886 |
|
|
| 1,570,345 |
|
Consumer loans |
|
| — |
|
|
| — |
|
|
| — |
|
|
| — |
|
|
| — |
|
State and other political subdivision loans |
|
| 936,420 |
|
|
| 5,850 |
|
|
| 10,213 |
|
|
| — |
|
|
| 952,483 |
|
Other loans |
|
| 478,083 |
|
|
| — |
|
|
| 16,390 |
|
|
| 108 |
|
|
| 494,581 |
|
Total |
| $ | 6,554,846 |
|
| $ | 41,764 |
|
| $ | 189,722 |
|
| $ | 1,819 |
|
| $ | 6,788,151 |
|
100
|
| Term Loans by Origination Year |
|
|
|
|
|
|
| |||||||||||||||||||||||
|
| 2023 |
|
| 2022 |
|
| 2021 |
|
| 2020 |
|
| 2019 |
|
| Prior |
|
| Revolving Loans |
|
| Total |
| ||||||||
As of December 31, 2023 |
| Commercial LHFI |
| |||||||||||||||||||||||||||||
Other loans secured by real estate: |
|
|
|
|
|
|
|
|
|
|
|
|
|
|
|
|
|
|
|
|
|
|
|
| ||||||||
Other construction |
|
|
|
|
|
|
|
|
|
|
|
|
|
|
|
|
|
|
|
|
|
|
|
| ||||||||
Pass - RR 1 through RR 6 |
| $ | 179,676 |
|
| $ | 518,062 |
|
| $ | 149,883 |
|
| $ | 14,062 |
|
| $ | — |
|
| $ | 6 |
|
| $ | 6,042 |
|
| $ | 867,731 |
|
Special Mention - RR 7 |
|
| — |
|
|
| — |
|
|
| — |
|
|
| — |
|
|
| — |
|
|
| — |
|
|
| — |
|
|
| — |
|
Substandard - RR 8 |
|
| 62 |
|
|
| — |
|
|
| — |
|
|
| — |
|
|
| — |
|
|
| — |
|
|
| — |
|
|
| 62 |
|
Doubtful - RR 9 |
|
| — |
|
|
| — |
|
|
| — |
|
|
| — |
|
|
| — |
|
|
| — |
|
|
| — |
|
|
| — |
|
Total |
|
| 179,738 |
|
|
| 518,062 |
|
|
| 149,883 |
|
|
| 14,062 |
|
|
| — |
|
|
| 6 |
|
|
| 6,042 |
|
|
| 867,793 |
|
Current period gross |
|
| (61 | ) |
|
| — |
|
|
| (3,392 | ) |
|
| — |
|
|
| — |
|
|
| — |
|
|
| — |
|
|
| (3,453 | ) |
|
|
|
|
|
|
|
|
|
|
|
|
|
|
|
|
|
|
|
|
|
|
|
|
| ||||||||
Commercial and industrial loans: |
|
|
|
|
|
|
|
|
|
|
|
|
|
|
|
|
|
|
|
|
|
|
|
| ||||||||
Pass - RR 1 through RR 6 |
| $ | 497,730 |
|
| $ | 474,737 |
|
| $ | 158,659 |
|
| $ | 80,646 |
|
| $ | 31,876 |
|
| $ | 44,972 |
|
| $ | 537,527 |
|
| $ | 1,826,147 |
|
Special Mention - RR 7 |
|
| 12,570 |
|
|
| 10,141 |
|
|
| 3,149 |
|
|
| 1,381 |
|
|
| 110 |
|
|
| — |
|
|
| 126 |
|
|
| 27,477 |
|
Substandard - RR 8 |
|
| 4,797 |
|
|
| 16,872 |
|
|
| 13,909 |
|
|
| 11,958 |
|
|
| 40 |
|
|
| 80 |
|
|
| 21,528 |
|
|
| 69,184 |
|
Doubtful - RR 9 |
|
| 6 |
|
|
| 58 |
|
|
| 1 |
|
|
| — |
|
|
| — |
|
|
| 25 |
|
|
| 12 |
|
|
| 102 |
|
Total |
|
| 515,103 |
|
|
| 501,808 |
|
|
| 175,718 |
|
|
| 93,985 |
|
|
| 32,026 |
|
|
| 45,077 |
|
|
| 559,193 |
|
|
| 1,922,910 |
|
Current period gross |
|
| (42 | ) |
|
| (1,071 | ) |
|
| (700 | ) |
|
| (138 | ) |
|
| (95 | ) |
|
| (108 | ) |
|
| (7 | ) |
|
| (2,161 | ) |
|
|
|
|
|
|
|
|
|
|
|
|
|
|
|
|
|
|
|
|
|
|
|
|
| ||||||||
State and other political subdivision loans: |
|
|
|
|
|
|
|
|
|
|
|
|
|
|
|
|
|
|
|
|
|
|
|
| ||||||||
Pass - RR 1 through RR 6 |
| $ | 152,157 |
|
| $ | 247,034 |
|
| $ | 174,812 |
|
| $ | 99,786 |
|
| $ | 32,118 |
|
| $ | 377,225 |
|
| $ | 5,334 |
|
| $ | 1,088,466 |
|
Special Mention - RR 7 |
|
| — |
|
|
| — |
|
|
| — |
|
|
| — |
|
|
| — |
|
|
| — |
|
|
| — |
|
|
| — |
|
Substandard - RR 8 |
|
| — |
|
|
| — |
|
|
| — |
|
|
| — |
|
|
| — |
|
|
| — |
|
|
| — |
|
|
| — |
|
Doubtful - RR 9 |
|
| — |
|
|
| — |
|
|
| — |
|
|
| — |
|
|
| — |
|
|
| — |
|
|
| — |
|
|
| — |
|
Total |
|
| 152,157 |
|
|
| 247,034 |
|
|
| 174,812 |
|
|
| 99,786 |
|
|
| 32,118 |
|
|
| 377,225 |
|
|
| 5,334 |
|
|
| 1,088,466 |
|
Current period gross |
|
| — |
|
|
| — |
|
|
| — |
|
|
| — |
|
|
| — |
|
|
| — |
|
|
| — |
|
|
| — |
|
|
|
|
|
|
|
|
|
|
|
|
|
|
|
|
|
|
|
|
|
|
|
|
|
| ||||||||
Other commercial loans and leases: |
|
|
|
|
|
|
|
|
|
|
|
|
|
|
|
|
|
|
|
|
|
|
|
| ||||||||
Pass - RR 1 through RR 6 |
| $ | 211,402 |
|
| $ | 48,947 |
|
| $ | 30,071 |
|
| $ | 21,377 |
|
| $ | 32,837 |
|
| $ | 8,468 |
|
| $ | 201,339 |
|
| $ | 554,441 |
|
Special Mention - RR 7 |
|
| — |
|
|
| — |
|
|
| — |
|
|
| 208 |
|
|
| — |
|
|
| — |
|
|
| 20 |
|
|
| 228 |
|
Substandard - RR 8 |
|
| 106 |
|
|
| 211 |
|
|
| 42 |
|
|
| — |
|
|
| — |
|
|
| — |
|
|
| 987 |
|
|
| 1,346 |
|
Doubtful - RR 9 |
|
| — |
|
|
| — |
|
|
| — |
|
|
| — |
|
|
| — |
|
|
| 20 |
|
|
| — |
|
|
| 20 |
|
Total |
|
| 211,508 |
|
|
| 49,158 |
|
|
| 30,113 |
|
|
| 21,585 |
|
|
| 32,837 |
|
|
| 8,488 |
|
|
| 202,346 |
|
|
| 556,035 |
|
Current period gross |
|
| (40 | ) |
|
| (248 | ) |
|
| — |
|
|
| (26 | ) |
|
| — |
|
|
| — |
|
|
| — |
|
|
| (314 | ) |
|
|
|
|
|
|
|
|
|
|
|
|
|
|
|
|
|
|
|
|
|
|
|
|
| ||||||||
Total commercial LHFI |
| $ | 2,158,477 |
|
| $ | 2,846,360 |
|
| $ | 1,503,578 |
|
| $ | 1,071,603 |
|
| $ | 555,406 |
|
| $ | 821,512 |
|
| $ | 973,511 |
|
| $ | 9,930,447 |
|
Total commercial LHFI |
| $ | (143 | ) |
| $ | (1,362 | ) |
| $ | (4,208 | ) |
| $ | (164 | ) |
| $ | (342 | ) |
| $ | (252 | ) |
| $ | (7 | ) |
| $ | (6,478 | ) |
|
| Consumer LHFI |
|
|
|
|
| |||||||||||||||||
|
|
|
|
|
| Past Due |
|
| Past Due |
|
|
|
|
|
|
|
|
|
|
|
|
| ||
|
| Current |
|
| 30-89 Days |
|
| 90 Days or More |
|
| Nonaccrual |
|
| Subtotal |
|
| Total LHFI |
| ||||||
Loans secured by real estate: |
|
|
|
|
|
|
|
|
|
|
|
|
|
|
|
|
|
|
|
|
|
|
|
|
Construction, land development and other land |
| $ | 60,240 |
|
| $ | 342 |
|
| $ | — |
|
| $ | 161 |
|
| $ | 60,743 |
|
| $ | 987,624 |
|
Secured by 1-4 family residential properties |
|
| 1,516,691 |
|
|
| 7,874 |
|
|
| 1,809 |
|
|
| 16,374 |
|
|
| 1,542,748 |
|
|
| 1,675,311 |
|
Secured by nonfarm, nonresidential properties |
|
| 78 |
|
|
| — |
|
|
| — |
|
|
| — |
|
|
| 78 |
|
|
| 2,193,823 |
|
Other real estate secured |
|
| 403 |
|
|
| — |
|
|
| — |
|
|
| — |
|
|
| 403 |
|
|
| 517,956 |
|
Commercial and industrial loans |
|
| — |
|
|
| — |
|
|
| — |
|
|
| — |
|
|
| — |
|
|
| 1,570,345 |
|
Consumer loans |
|
| 169,146 |
|
|
| 2,396 |
|
|
| 242 |
|
|
| 134 |
|
|
| 171,918 |
|
|
| 171,918 |
|
State and other political subdivision loans |
|
| — |
|
|
| — |
|
|
| — |
|
|
| — |
|
|
| — |
|
|
| 952,483 |
|
Other loans |
|
| 5,926 |
|
|
| — |
|
|
| — |
|
|
| — |
|
|
| 5,926 |
|
|
| 500,507 |
|
Total |
| $ | 1,752,484 |
|
| $ | 10,612 |
|
| $ | 2,051 |
|
| $ | 16,669 |
|
| $ | 1,781,816 |
|
| $ | 8,569,967 |
|
101
|
| Term Loans by Origination Year |
|
|
|
|
|
|
| |||||||||||||||||||||||
|
| 2023 |
|
| 2022 |
|
| 2021 |
|
| 2020 |
|
| 2019 |
|
| Prior |
|
| Revolving Loans |
|
| Total |
| ||||||||
As of December 31, 2023 |
| Consumer LHFI |
| |||||||||||||||||||||||||||||
Loans secured by real estate: |
|
|
|
|
|
|
|
|
|
|
|
|
|
|
|
|
|
|
|
|
|
|
|
| ||||||||
Construction, land development and |
|
|
|
|
|
|
|
|
|
|
|
|
|
|
|
|
|
|
|
|
|
|
|
| ||||||||
Current |
| $ | 44,912 |
|
| $ | 23,110 |
|
| $ | 5,973 |
|
| $ | 1,203 |
|
| $ | 1,082 |
|
| $ | 1,864 |
|
| $ | 653 |
|
| $ | 78,797 |
|
Past due 30-89 days |
|
| — |
|
|
| 250 |
|
|
| — |
|
|
| — |
|
|
| 30 |
|
|
| 191 |
|
|
| — |
|
|
| 471 |
|
Past due 90 days or more |
|
| — |
|
|
| — |
|
|
| — |
|
|
| — |
|
|
| — |
|
|
| — |
|
|
| — |
|
|
| — |
|
Nonaccrual |
|
| — |
|
|
| — |
|
|
| 148 |
|
|
| — |
|
|
| — |
|
|
| 3 |
|
|
| — |
|
|
| 151 |
|
Total |
|
| 44,912 |
|
|
| 23,360 |
|
|
| 6,121 |
|
|
| 1,203 |
|
|
| 1,112 |
|
|
| 2,058 |
|
|
| 653 |
|
|
| 79,419 |
|
Current period gross |
|
| — |
|
|
| — |
|
|
| — |
|
|
| — |
|
|
| — |
|
|
| — |
|
|
| — |
|
|
| — |
|
|
|
|
|
|
|
|
|
|
|
|
|
|
|
|
|
|
|
|
|
|
|
|
|
| ||||||||
Other secured by 1-4 family residential |
|
|
|
|
|
|
|
|
|
|
|
|
|
|
|
|
|
|
|
|
|
|
|
| ||||||||
Current |
| $ | 29,636 |
|
| $ | 11,366 |
|
| $ | 5,733 |
|
| $ | 4,471 |
|
| $ | 4,313 |
|
| $ | 7,674 |
|
| $ | 417,383 |
|
| $ | 480,576 |
|
Past due 30-89 days |
|
| 225 |
|
|
| 68 |
|
|
| 74 |
|
|
| 4 |
|
|
| 51 |
|
|
| 220 |
|
|
| 4,292 |
|
|
| 4,934 |
|
Past due 90 days or more |
|
| — |
|
|
| 264 |
|
|
| — |
|
|
| — |
|
|
| — |
|
|
| 41 |
|
|
| 934 |
|
|
| 1,239 |
|
Nonaccrual |
|
| 8 |
|
|
| 76 |
|
|
| 48 |
|
|
| 8 |
|
|
| — |
|
|
| 616 |
|
|
| 4,961 |
|
|
| 5,717 |
|
Total |
|
| 29,869 |
|
|
| 11,774 |
|
|
| 5,855 |
|
|
| 4,483 |
|
|
| 4,364 |
|
|
| 8,551 |
|
|
| 427,570 |
|
|
| 492,466 |
|
Current period gross |
|
| — |
|
|
| (100 | ) |
|
| (9 | ) |
|
| (2 | ) |
|
| (10 | ) |
|
| (22 | ) |
|
| (147 | ) |
|
| (290 | ) |
|
|
|
|
|
|
|
|
|
|
|
|
|
|
|
|
|
|
|
|
|
|
|
|
| ||||||||
Secured by nonfarm, nonresidential |
|
|
|
|
|
|
|
|
|
|
|
|
|
|
|
|
|
|
|
|
|
|
|
| ||||||||
Current |
| $ | — |
|
| $ | — |
|
| $ | 7 |
|
| $ | — |
|
| $ | — |
|
| $ | — |
|
| $ | — |
|
| $ | 7 |
|
Past due 30-89 days |
|
| — |
|
|
| — |
|
|
| — |
|
|
| — |
|
|
| — |
|
|
| — |
|
|
| — |
|
|
| — |
|
Past due 90 days or more |
|
| — |
|
|
| — |
|
|
| — |
|
|
| — |
|
|
| — |
|
|
| — |
|
|
| — |
|
|
| — |
|
Nonaccrual |
|
| — |
|
|
| — |
|
|
| — |
|
|
| — |
|
|
| — |
|
|
| — |
|
|
| — |
|
|
| — |
|
Total |
|
| — |
|
|
| — |
|
|
| 7 |
|
|
| — |
|
|
| — |
|
|
| — |
|
|
| — |
|
|
| 7 |
|
Current period gross |
|
| — |
|
|
| — |
|
|
| — |
|
|
| — |
|
|
| — |
|
|
| — |
|
|
| — |
|
|
| — |
|
|
|
|
|
|
|
|
|
|
|
|
|
|
|
|
|
|
|
|
|
|
|
|
|
| ||||||||
Other real estate secured: |
|
|
|
|
|
|
|
|
|
|
|
|
|
|
|
|
|
|
|
|
|
|
|
| ||||||||
Current |
| $ | — |
|
| $ | — |
|
| $ | — |
|
| $ | 78 |
|
| $ | — |
|
| $ | 55 |
|
| $ | — |
|
| $ | 133 |
|
Past due 30-89 days |
|
| — |
|
|
| — |
|
|
| — |
|
|
| — |
|
|
| — |
|
|
| — |
|
|
| — |
|
|
| — |
|
Past due 90 days or more |
|
| — |
|
|
| — |
|
|
| — |
|
|
| — |
|
|
| — |
|
|
| — |
|
|
| — |
|
|
| — |
|
Nonaccrual |
|
| — |
|
|
| — |
|
|
| — |
|
|
| — |
|
|
| — |
|
|
| — |
|
|
| — |
|
|
| — |
|
Total |
|
| — |
|
|
| — |
|
|
| — |
|
|
| 78 |
|
|
| — |
|
|
| 55 |
|
|
| — |
|
|
| 133 |
|
Current period gross |
|
| — |
|
|
| — |
|
|
| — |
|
|
| — |
|
|
| — |
|
|
| — |
|
|
| — |
|
|
| — |
|
102
|
| Term Loans by Origination Year |
|
|
|
|
|
|
| |||||||||||||||||||||||
|
| 2023 |
|
| 2022 |
|
| 2021 |
|
| 2020 |
|
| 2019 |
|
| Prior |
|
| Revolving Loans |
|
| Total |
| ||||||||
As of December 31, 2023 |
| Consumer LHFI |
| |||||||||||||||||||||||||||||
Other loans secured by real estate: |
|
|
|
|
|
|
|
|
|
|
|
|
|
|
|
|
|
|
|
|
|
|
|
| ||||||||
Secured by 1-4 family residential properties |
|
|
|
|
|
|
|
|
|
|
|
|
|
|
|
|
|
|
|
|
|
|
|
| ||||||||
Current |
| $ | 258,800 |
|
| $ | 878,893 |
|
| $ | 516,324 |
|
| $ | 180,272 |
|
| $ | 98,552 |
|
| $ | 277,664 |
|
| $ | — |
|
| $ | 2,210,505 |
|
Past due 30-89 days |
|
| 3,370 |
|
|
| 11,293 |
|
|
| 5,513 |
|
|
| 2,121 |
|
|
| 298 |
|
|
| 1,664 |
|
|
| — |
|
|
| 24,259 |
|
Past due 90 days or more |
|
| 376 |
|
|
| 1,219 |
|
|
| 1,208 |
|
|
| 682 |
|
|
| — |
|
|
| 255 |
|
|
| — |
|
|
| 3,740 |
|
Nonaccrual |
|
| 678 |
|
|
| 15,586 |
|
|
| 11,452 |
|
|
| 4,884 |
|
|
| 1,848 |
|
|
| 9,366 |
|
|
| — |
|
|
| 43,814 |
|
Total |
|
| 263,224 |
|
|
| 906,991 |
|
|
| 534,497 |
|
|
| 187,959 |
|
|
| 100,698 |
|
|
| 288,949 |
|
|
| — |
|
|
| 2,282,318 |
|
Current period gross |
|
| (64 | ) |
|
| (930 | ) |
|
| (217 | ) |
|
| (104 | ) |
|
| — |
|
|
| (142 | ) |
|
| — |
|
|
| (1,457 | ) |
|
|
|
|
|
|
|
|
|
|
|
|
|
|
|
|
|
|
|
|
|
|
|
|
| ||||||||
Consumer loans: |
|
|
|
|
|
|
|
|
|
|
|
|
|
|
|
|
|
|
|
|
|
|
|
| ||||||||
Current |
| $ | 59,496 |
|
| $ | 32,767 |
|
| $ | 10,698 |
|
| $ | 2,604 |
|
| $ | 917 |
|
| $ | 294 |
|
| $ | 55,321 |
|
| $ | 162,097 |
|
Past due 30-89 days |
|
| 1,274 |
|
|
| 475 |
|
|
| 134 |
|
|
| 34 |
|
|
| 5 |
|
|
| 5 |
|
|
| 839 |
|
|
| 2,766 |
|
Past due 90 days or more |
|
| 64 |
|
|
| 44 |
|
|
| 3 |
|
|
| 1 |
|
|
| — |
|
|
| — |
|
|
| 516 |
|
|
| 628 |
|
Nonaccrual |
|
| 44 |
|
|
| 65 |
|
|
| 84 |
|
|
| 26 |
|
|
| — |
|
|
| — |
|
|
| 24 |
|
|
| 243 |
|
Total |
|
| 60,878 |
|
|
| 33,351 |
|
|
| 10,919 |
|
|
| 2,665 |
|
|
| 922 |
|
|
| 299 |
|
|
| 56,700 |
|
|
| 165,734 |
|
Current period gross |
|
| (6,138 | ) |
|
| (559 | ) |
|
| (167 | ) |
|
| (43 | ) |
|
| (1 | ) |
|
| (1 | ) |
|
| (2,381 | ) |
|
| (9,290 | ) |
|
|
|
|
|
|
|
|
|
|
|
|
|
|
|
|
|
|
|
|
|
|
|
|
| ||||||||
Total consumer LHFI |
| $ | 398,883 |
|
| $ | 975,476 |
|
| $ | 557,399 |
|
| $ | 196,388 |
|
| $ | 107,096 |
|
| $ | 299,912 |
|
| $ | 484,923 |
|
| $ | 3,020,077 |
|
Total consumer LHFI |
| $ | (6,202 | ) |
| $ | (1,589 | ) |
| $ | (393 | ) |
| $ | (149 | ) |
| $ | (11 | ) |
| $ | (165 | ) |
| $ | (2,528 | ) |
| $ | (11,037 | ) |
|
|
|
|
|
|
|
|
|
|
|
|
|
|
|
|
|
|
|
|
|
|
|
|
| ||||||||
Total LHFI |
| $ | 2,557,360 |
|
| $ | 3,821,836 |
|
| $ | 2,060,977 |
|
| $ | 1,267,991 |
|
| $ | 662,502 |
|
| $ | 1,121,424 |
|
| $ | 1,458,434 |
|
| $ | 12,950,524 |
|
Total current period |
| $ | (6,345 | ) |
| $ | (2,951 | ) |
| $ | (4,601 | ) |
| $ | (313 | ) |
| $ | (353 | ) |
| $ | (417 | ) |
| $ | (2,535 | ) |
| $ | (17,515 | ) |
|
| Term Loans by Origination Year |
|
|
|
|
|
|
| |||||||||||||||||||||||
|
| 2022 |
|
| 2021 |
|
| 2020 |
|
| 2019 |
|
| 2018 |
|
| Prior |
|
| Revolving Loans |
|
| Total |
| ||||||||
As of December 31, 2022 |
| Commercial LHFI |
| |||||||||||||||||||||||||||||
Loans secured by real estate: |
|
|
|
|
|
|
|
|
|
|
|
|
|
|
|
|
|
|
|
|
|
|
|
| ||||||||
Construction, land development |
|
|
|
|
|
|
|
|
|
|
|
|
|
|
|
|
|
|
|
|
|
|
|
| ||||||||
Pass - RR 1 through RR 6 |
| $ | 363,824 |
|
| $ | 119,727 |
|
| $ | 29,632 |
|
| $ | 3,405 |
|
| $ | 1,016 |
|
| $ | 2,364 |
|
| $ | 64,953 |
|
| $ | 584,921 |
|
Special Mention - RR 7 |
|
| — |
|
|
| — |
|
|
| — |
|
|
| — |
|
|
| — |
|
|
| — |
|
|
| — |
|
|
| — |
|
Substandard - RR 8 |
|
| 146 |
|
|
| 199 |
|
|
| — |
|
|
| 1,415 |
|
|
| — |
|
|
| — |
|
|
| 44 |
|
|
| 1,804 |
|
Doubtful - RR 9 |
|
| — |
|
|
| — |
|
|
| — |
|
|
| — |
|
|
| — |
|
|
| 42 |
|
|
| — |
|
|
| 42 |
|
Total |
|
| 363,970 |
|
|
| 119,926 |
|
|
| 29,632 |
|
|
| 4,820 |
|
|
| 1,016 |
|
|
| 2,406 |
|
|
| 64,997 |
|
|
| 586,767 |
|
|
|
|
|
|
|
|
|
|
|
|
|
|
|
|
|
|
|
|
|
|
|
|
|
| ||||||||
Other secured by 1-4 family residential |
|
|
|
|
|
|
|
|
|
|
|
|
|
|
|
|
|
|
|
|
|
|
|
| ||||||||
Pass - RR 1 through RR 6 |
| $ | 41,996 |
|
| $ | 33,346 |
|
| $ | 17,215 |
|
| $ | 9,341 |
|
| $ | 6,798 |
|
| $ | 2,870 |
|
| $ | 12,209 |
|
| $ | 123,775 |
|
Special Mention - RR 7 |
|
| 29 |
|
|
| 64 |
|
|
| 17 |
|
|
| — |
|
|
| — |
|
|
| — |
|
|
| — |
|
|
| 110 |
|
Substandard - RR 8 |
|
| 686 |
|
|
| 31 |
|
|
| 75 |
|
|
| 88 |
|
|
| 220 |
|
|
| 285 |
|
|
| — |
|
|
| 1,385 |
|
Doubtful - RR 9 |
|
| 15 |
|
|
| — |
|
|
| — |
|
|
| — |
|
|
| — |
|
|
| — |
|
|
| — |
|
|
| 15 |
|
Total |
|
| 42,726 |
|
|
| 33,441 |
|
|
| 17,307 |
|
|
| 9,429 |
|
|
| 7,018 |
|
|
| 3,155 |
|
|
| 12,209 |
|
|
| 125,285 |
|
|
|
|
|
|
|
|
|
|
|
|
|
|
|
|
|
|
|
|
|
|
|
|
|
| ||||||||
Secured by nonfarm, nonresidential |
|
|
|
|
|
|
|
|
|
|
|
|
|
|
|
|
|
|
|
|
|
|
|
| ||||||||
Pass - RR 1 through RR 6 |
| $ | 889,556 |
|
| $ | 657,242 |
|
| $ | 603,515 |
|
| $ | 457,163 |
|
| $ | 205,425 |
|
| $ | 281,828 |
|
| $ | 130,052 |
|
| $ | 3,224,781 |
|
Special Mention - RR 7 |
|
| 10,284 |
|
|
| — |
|
|
| — |
|
|
| 271 |
|
|
| — |
|
|
| — |
|
|
| — |
|
|
| 10,555 |
|
Substandard - RR 8 |
|
| 12,034 |
|
|
| 1,066 |
|
|
| 9,457 |
|
|
| 905 |
|
|
| 706 |
|
|
| 18,488 |
|
|
| 693 |
|
|
| 43,349 |
|
Doubtful - RR 9 |
|
| 34 |
|
|
| — |
|
|
| — |
|
|
| 77 |
|
|
| — |
|
|
| 18 |
|
|
| — |
|
|
| 129 |
|
Total |
|
| 911,908 |
|
|
| 658,308 |
|
|
| 612,972 |
|
|
| 458,416 |
|
|
| 206,131 |
|
|
| 300,334 |
|
|
| 130,745 |
|
|
| 3,278,814 |
|
|
|
|
|
|
|
|
|
|
|
|
|
|
|
|
|
|
|
|
|
|
|
|
|
| ||||||||
Other real estate secured: |
|
|
|
|
|
|
|
|
|
|
|
|
|
|
|
|
|
|
|
|
|
|
|
| ||||||||
Pass - RR 1 through RR 6 |
| $ | 293,051 |
|
| $ | 156,386 |
|
| $ | 143,114 |
|
| $ | 107,827 |
|
| $ | 11,297 |
|
| $ | 17,626 |
|
| $ | 12,516 |
|
| $ | 741,817 |
|
Special Mention - RR 7 |
|
| — |
|
|
| — |
|
|
| — |
|
|
| — |
|
|
| — |
|
|
| — |
|
|
| — |
|
|
| — |
|
Substandard - RR 8 |
|
| 30 |
|
|
| — |
|
|
| 309 |
|
|
| — |
|
|
| 5 |
|
|
| 68 |
|
|
| 126 |
|
|
| 538 |
|
Doubtful - RR 9 |
|
| — |
|
|
| — |
|
|
| — |
|
|
| — |
|
|
| — |
|
|
| — |
|
|
| — |
|
|
| — |
|
Total |
|
| 293,081 |
|
|
| 156,386 |
|
|
| 143,423 |
|
|
| 107,827 |
|
|
| 11,302 |
|
|
| 17,694 |
|
|
| 12,642 |
|
|
| 742,355 |
|
103
|
| Term Loans by Origination Year |
|
|
|
|
|
|
| |||||||||||||||||||||||
|
| 2022 |
|
| 2021 |
|
| 2020 |
|
| 2019 |
|
| 2018 |
|
| Prior |
|
| Revolving Loans |
|
| Total |
| ||||||||
As of December 31, 2022 |
| Commercial LHFI |
| |||||||||||||||||||||||||||||
Other loans secured by real estate: |
|
|
|
|
|
|
|
|
|
|
|
|
|
|
|
|
|
|
|
|
|
|
|
| ||||||||
Other construction |
|
|
|
|
|
|
|
|
|
|
|
|
|
|
|
|
|
|
|
|
|
|
|
| ||||||||
Pass - RR 1 through RR 6 |
| $ | 372,981 |
|
| $ | 306,904 |
|
| $ | 340,388 |
|
| $ | 833 |
|
| $ | — |
|
| $ | — |
|
| $ | 200 |
|
| $ | 1,021,306 |
|
Special Mention - RR 7 |
|
| — |
|
|
| — |
|
|
| — |
|
|
| — |
|
|
| — |
|
|
| — |
|
|
| — |
|
|
| — |
|
Substandard - RR 8 |
|
| — |
|
|
| 7,620 |
|
|
| — |
|
|
| — |
|
|
| — |
|
|
| — |
|
|
| — |
|
|
| 7,620 |
|
Doubtful - RR 9 |
|
| — |
|
|
| — |
|
|
| — |
|
|
| — |
|
|
| — |
|
|
| — |
|
|
| — |
|
|
| — |
|
Total |
|
| 372,981 |
|
|
| 314,524 |
|
|
| 340,388 |
|
|
| 833 |
|
|
| — |
|
|
| — |
|
|
| 200 |
|
|
| 1,028,926 |
|
|
|
|
|
|
|
|
|
|
|
|
|
|
|
|
|
|
|
|
|
|
|
|
|
| ||||||||
Commercial and industrial loans: |
|
|
|
|
|
|
|
|
|
|
|
|
|
|
|
|
|
|
|
|
|
|
|
| ||||||||
Pass - RR 1 through RR 6 |
| $ | 673,848 |
|
| $ | 261,962 |
|
| $ | 120,123 |
|
| $ | 44,994 |
|
| $ | 14,265 |
|
| $ | 69,078 |
|
| $ | 577,749 |
|
| $ | 1,762,019 |
|
Special Mention - RR 7 |
|
| — |
|
|
| — |
|
|
| 12,421 |
|
|
| — |
|
|
| — |
|
|
| — |
|
|
| 6,454 |
|
|
| 18,875 |
|
Substandard - RR 8 |
|
| 6,973 |
|
|
| 9,845 |
|
|
| 2,170 |
|
|
| 312 |
|
|
| 74 |
|
|
| — |
|
|
| 20,625 |
|
|
| 39,999 |
|
Doubtful - RR 9 |
|
| 240 |
|
|
| 53 |
|
|
| 10 |
|
|
| 4 |
|
|
| 35 |
|
|
| — |
|
|
| 24 |
|
|
| 366 |
|
Total |
|
| 681,061 |
|
|
| 271,860 |
|
|
| 134,724 |
|
|
| 45,310 |
|
|
| 14,374 |
|
|
| 69,078 |
|
|
| 604,852 |
|
|
| 1,821,259 |
|
|
|
|
|
|
|
|
|
|
|
|
|
|
|
|
|
|
|
|
|
|
|
|
|
| ||||||||
State and other political subdivision loans: |
|
|
|
|
|
|
|
|
|
|
|
|
|
|
|
|
|
|
|
|
|
|
|
| ||||||||
Pass - RR 1 through RR 6 |
| $ | 393,345 |
|
| $ | 223,302 |
|
| $ | 123,350 |
|
| $ | 39,031 |
|
| $ | 18,876 |
|
| $ | 421,588 |
|
| $ | 1,671 |
|
| $ | 1,221,163 |
|
Special Mention - RR 7 |
|
| — |
|
|
| — |
|
|
| — |
|
|
| — |
|
|
| — |
|
|
| 2,700 |
|
|
| — |
|
|
| 2,700 |
|
Substandard - RR 8 |
|
| — |
|
|
| — |
|
|
| — |
|
|
| — |
|
|
| — |
|
|
| — |
|
|
| — |
|
|
| — |
|
Doubtful - RR 9 |
|
| — |
|
|
| — |
|
|
| — |
|
|
| — |
|
|
| — |
|
|
| — |
|
|
| — |
|
|
| — |
|
Total |
|
| 393,345 |
|
|
| 223,302 |
|
|
| 123,350 |
|
|
| 39,031 |
|
|
| 18,876 |
|
|
| 424,288 |
|
|
| 1,671 |
|
|
| 1,223,863 |
|
|
|
|
|
|
|
|
|
|
|
|
|
|
|
|
|
|
|
|
|
|
|
|
|
| ||||||||
Other commercial loans: |
|
|
|
|
|
|
|
|
|
|
|
|
|
|
|
|
|
|
|
|
|
|
|
| ||||||||
Pass - RR 1 through RR 6 |
| $ | 88,763 |
|
| $ | 40,006 |
|
| $ | 28,239 |
|
| $ | 37,607 |
|
| $ | 6,424 |
|
| $ | 10,829 |
|
| $ | 244,882 |
|
| $ | 456,750 |
|
Special Mention - RR 7 |
|
| 879 |
|
|
| — |
|
|
| — |
|
|
| — |
|
|
| — |
|
|
| — |
|
|
| — |
|
|
| 879 |
|
Substandard - RR 8 |
|
| 3,728 |
|
|
| 98 |
|
|
| — |
|
|
| — |
|
|
| 16 |
|
|
| 1,134 |
|
|
| 9,301 |
|
|
| 14,277 |
|
Doubtful - RR 9 |
|
| 24 |
|
|
| — |
|
|
| — |
|
|
| — |
|
|
| — |
|
|
| — |
|
|
| — |
|
|
| 24 |
|
Total |
|
| 93,394 |
|
|
| 40,104 |
|
|
| 28,239 |
|
|
| 37,607 |
|
|
| 6,440 |
|
|
| 11,963 |
|
|
| 254,183 |
|
|
| 471,930 |
|
|
|
|
|
|
|
|
|
|
|
|
|
|
|
|
|
|
|
|
|
|
|
|
|
| ||||||||
Total commercial LHFI |
| $ | 3,152,466 |
|
| $ | 1,817,851 |
|
| $ | 1,430,035 |
|
| $ | 703,273 |
|
| $ | 265,157 |
|
| $ | 828,918 |
|
| $ | 1,081,499 |
|
| $ | 9,279,199 |
|
104
|
| Term Loans by Origination Year |
|
|
|
|
|
|
| |||||||||||||||||||||||
|
| 2022 |
|
| 2021 |
|
| 2020 |
|
| 2019 |
|
| 2018 |
|
| Prior |
|
| Revolving Loans |
|
| Total |
| ||||||||
As of December 31, 2022 |
| Consumer LHFI |
| |||||||||||||||||||||||||||||
Loans secured by real estate: |
|
|
|
|
|
|
|
|
|
|
|
|
|
|
|
|
|
|
|
|
|
|
|
| ||||||||
Construction, land development and |
|
|
|
|
|
|
|
|
|
|
|
|
|
|
|
|
|
|
|
|
|
|
|
| ||||||||
Current |
| $ | 62,049 |
|
| $ | 32,867 |
|
| $ | 3,304 |
|
| $ | 1,759 |
|
| $ | 1,679 |
|
| $ | 1,915 |
|
| $ | — |
|
| $ | 103,573 |
|
Past due 30-89 days |
|
| — |
|
|
| 150 |
|
|
| — |
|
|
| 36 |
|
|
| 15 |
|
|
| 9 |
|
|
| — |
|
|
| 210 |
|
Past due 90 days or more |
|
| — |
|
|
| — |
|
|
| — |
|
|
| — |
|
|
| — |
|
|
| — |
|
|
| — |
|
|
| — |
|
Nonaccrual |
|
| — |
|
|
| 58 |
|
|
| — |
|
|
| — |
|
|
| — |
|
|
| 8 |
|
|
| — |
|
|
| 66 |
|
Total |
|
| 62,049 |
|
|
| 33,075 |
|
|
| 3,304 |
|
|
| 1,795 |
|
|
| 1,694 |
|
|
| 1,932 |
|
|
| — |
|
|
| 103,849 |
|
|
|
|
|
|
|
|
|
|
|
|
|
|
|
|
|
|
|
|
|
|
|
|
|
| ||||||||
Other secured by 1-4 family residential |
|
|
|
|
|
|
|
|
|
|
|
|
|
|
|
|
|
|
|
|
|
|
|
| ||||||||
Current |
| $ | 25,402 |
|
| $ | 7,983 |
|
| $ | 5,389 |
|
| $ | 4,894 |
|
| $ | 3,701 |
|
| $ | 7,252 |
|
| $ | 403,123 |
|
| $ | 457,744 |
|
Past due 30-89 days |
|
| 19 |
|
|
| 35 |
|
|
| 15 |
|
|
| 134 |
|
|
| 5 |
|
|
| 286 |
|
|
| 3,197 |
|
|
| 3,691 |
|
Past due 90 days or more |
|
| — |
|
|
| — |
|
|
| — |
|
|
| 1 |
|
|
| — |
|
|
| — |
|
|
| 452 |
|
|
| 453 |
|
Nonaccrual |
|
| 88 |
|
|
| 24 |
|
|
| 4 |
|
|
| 20 |
|
|
| 7 |
|
|
| 454 |
|
|
| 3,020 |
|
|
| 3,617 |
|
Total |
|
| 25,509 |
|
|
| 8,042 |
|
|
| 5,408 |
|
|
| 5,049 |
|
|
| 3,713 |
|
|
| 7,992 |
|
|
| 409,792 |
|
|
| 465,505 |
|
|
|
|
|
|
|
|
|
|
|
|
|
|
|
|
|
|
|
|
|
|
|
|
|
| ||||||||
Secured by nonfarm, nonresidential |
|
|
|
|
|
|
|
|
|
|
|
|
|
|
|
|
|
|
|
|
|
|
|
| ||||||||
Current |
| $ | — |
|
| $ | 16 |
|
| $ | — |
|
| $ | — |
|
| $ | — |
|
| $ | — |
|
| $ | — |
|
| $ | 16 |
|
Past due 30-89 days |
|
| — |
|
|
| — |
|
|
| — |
|
|
| — |
|
|
| — |
|
|
| — |
|
|
| — |
|
|
| — |
|
Past due 90 days or more |
|
| — |
|
|
| — |
|
|
| — |
|
|
| — |
|
|
| — |
|
|
| — |
|
|
| — |
|
|
| — |
|
Nonaccrual |
|
| — |
|
|
| — |
|
|
| — |
|
|
| — |
|
|
| — |
|
|
| — |
|
|
| — |
|
|
| — |
|
Total |
|
| — |
|
|
| 16 |
|
|
| — |
|
|
| — |
|
|
| — |
|
|
| — |
|
|
| — |
|
|
| 16 |
|
|
|
|
|
|
|
|
|
|
|
|
|
|
|
|
|
|
|
|
|
|
|
|
|
| ||||||||
Other real estate secured: |
|
|
|
|
|
|
|
|
|
|
|
|
|
|
|
|
|
|
|
|
|
|
|
| ||||||||
Current |
| $ | — |
|
| $ | — |
|
| $ | 89 |
|
| $ | — |
|
| $ | 5 |
|
| $ | 89 |
|
| $ | — |
|
| $ | 183 |
|
Past due 30-89 days |
|
| — |
|
|
| — |
|
|
| — |
|
|
| — |
|
|
| — |
|
|
| — |
|
|
| — |
|
|
| — |
|
Past due 90 days or more |
|
| — |
|
|
| — |
|
|
| — |
|
|
| — |
|
|
| — |
|
|
| — |
|
|
| — |
|
|
| — |
|
Nonaccrual |
|
| — |
|
|
| — |
|
|
| — |
|
|
| — |
|
|
| — |
|
|
| — |
|
|
| — |
|
|
| — |
|
Total |
|
| — |
|
|
| — |
|
|
| 89 |
|
|
| — |
|
|
| 5 |
|
|
| 89 |
|
|
| — |
|
|
| 183 |
|
|
| Term Loans by Origination Year |
|
|
|
|
|
|
| |||||||||||||||||||||||
|
| 2022 |
|
| 2021 |
|
| 2020 |
|
| 2019 |
|
| 2018 |
|
| Prior |
|
| Revolving Loans |
|
| Total |
| ||||||||
As of December 31, 2022 |
| Consumer LHFI |
| |||||||||||||||||||||||||||||
Other loans secured by real estate: |
|
|
|
|
|
|
|
|
|
|
|
|
|
|
|
|
|
|
|
|
|
|
|
| ||||||||
Secured by 1-4 family residential properties |
|
|
|
|
|
|
|
|
|
|
|
|
|
|
|
|
|
|
|
|
|
|
|
| ||||||||
Current |
| $ | 939,511 |
|
| $ | 559,804 |
|
| $ | 198,769 |
|
| $ | 109,466 |
|
| $ | 80,249 |
|
| $ | 262,196 |
|
| $ | — |
|
| $ | 2,149,995 |
|
Past due 30-89 days |
|
| 3,967 |
|
|
| 3,752 |
|
|
| 2,119 |
|
|
| 425 |
|
|
| — |
|
|
| 1,906 |
|
|
| — |
|
|
| 12,169 |
|
Past due 90 days or more |
|
| 835 |
|
|
| 777 |
|
|
| 272 |
|
|
| — |
|
|
| 134 |
|
|
| 1,100 |
|
|
| — |
|
|
| 3,118 |
|
Nonaccrual |
|
| 2,363 |
|
|
| 4,180 |
|
|
| 3,275 |
|
|
| 1,896 |
|
|
| 2,028 |
|
|
| 6,033 |
|
|
| — |
|
|
| 19,775 |
|
Total |
|
| 946,676 |
|
|
| 568,513 |
|
|
| 204,435 |
|
|
| 111,787 |
|
|
| 82,411 |
|
|
| 271,235 |
|
|
| — |
|
|
| 2,185,057 |
|
|
|
|
|
|
|
|
|
|
|
|
|
|
|
|
|
|
|
|
|
|
|
|
|
| ||||||||
Consumer loans: |
|
|
|
|
|
|
|
|
|
|
|
|
|
|
|
|
|
|
|
|
|
|
|
| ||||||||
Current |
| $ | 70,858 |
|
| $ | 25,771 |
|
| $ | 9,514 |
|
| $ | 2,509 |
|
| $ | 1,513 |
|
| $ | 295 |
|
| $ | 56,508 |
|
| $ | 166,968 |
|
Past due 30-89 days |
|
| 1,431 |
|
|
| 238 |
|
|
| 159 |
|
|
| 8 |
|
|
| 23 |
|
|
| 10 |
|
|
| 946 |
|
|
| 2,815 |
|
Past due 90 days or more |
|
| 28 |
|
|
| 12 |
|
|
| 7 |
|
|
| 1 |
|
|
| 2 |
|
|
| — |
|
|
| 216 |
|
|
| 266 |
|
Nonaccrual |
|
| 79 |
|
|
| 41 |
|
|
| 19 |
|
|
| 17 |
|
|
| 4 |
|
|
| — |
|
|
| 21 |
|
|
| 181 |
|
Total |
|
| 72,396 |
|
|
| 26,062 |
|
|
| 9,699 |
|
|
| 2,535 |
|
|
| 1,542 |
|
|
| 305 |
|
|
| 57,691 |
|
|
| 170,230 |
|
|
|
|
|
|
|
|
|
|
|
|
|
|
|
|
|
|
|
|
|
|
|
|
|
| ||||||||
Total consumer LHFI |
| $ | 1,106,630 |
|
| $ | 635,708 |
|
| $ | 222,935 |
|
| $ | 121,166 |
|
| $ | 89,365 |
|
| $ | 281,553 |
|
| $ | 467,483 |
|
| $ | 2,924,840 |
|
|
|
|
|
|
|
|
|
|
|
|
|
|
|
|
|
|
|
|
|
|
|
|
|
| ||||||||
Total LHFI |
| $ | 4,259,096 |
|
| $ | 2,453,559 |
|
| $ | 1,652,970 |
|
| $ | 824,439 |
|
| $ | 354,522 |
|
| $ | 1,110,471 |
|
| $ | 1,548,982 |
|
| $ | 12,204,039 |
|
106
| December 31, 2016 |
| ||||||||||||||||||
|
| Commercial LHFI |
| |||||||||||||||||
|
| Pass - |
|
| Special Mention - |
|
| Substandard - |
|
| Doubtful - |
|
|
|
|
| ||||
|
| Categories 1-6 |
|
| Category 7 |
|
| Category 8 |
|
| Category 9 |
|
| Subtotal |
| |||||
Loans secured by real estate: |
|
|
|
|
|
|
|
|
|
|
|
|
|
|
|
|
|
|
|
|
Construction, land development and other land |
| $ | 752,318 |
|
| $ | 9,567 |
|
| $ | 8,086 |
|
| $ | 465 |
|
| $ | 770,436 |
|
Secured by 1-4 family residential properties |
|
| 124,615 |
|
|
| 170 |
|
|
| 6,162 |
|
|
| 129 |
|
|
| 131,076 |
|
Secured by nonfarm, nonresidential properties |
|
| 1,989,554 |
|
|
| 4,394 |
|
|
| 38,913 |
|
|
| 584 |
|
|
| 2,033,445 |
|
Other real estate secured |
|
| 315,829 |
|
|
| 762 |
|
|
| 890 |
|
|
| — |
|
|
| 317,481 |
|
Commercial and industrial loans |
|
| 1,386,155 |
|
|
| 7,095 |
|
|
| 134,199 |
|
|
| 985 |
|
|
| 1,528,434 |
|
Consumer loans |
|
| — |
|
|
| — |
|
|
| — |
|
|
| — |
|
|
| — |
|
State and other political subdivision loans |
|
| 899,935 |
|
|
| 6,450 |
|
|
| 11,130 |
|
|
| — |
|
|
| 917,515 |
|
Other loans |
|
| 382,890 |
|
|
| — |
|
|
| 2,685 |
|
|
| 350 |
|
|
| 385,925 |
|
Total |
| $ | 5,851,296 |
|
| $ | 28,438 |
|
| $ | 202,065 |
|
| $ | 2,513 |
|
| $ | 6,084,312 |
|
|
| Consumer LHFI |
|
|
|
|
| |||||||||||||||||
|
|
|
|
|
| Past Due |
|
| Past Due |
|
|
|
|
|
|
|
|
|
|
|
|
| ||
|
| Current |
|
| 30-89 Days |
|
| 90 Days or More |
|
| Nonaccrual |
|
| Subtotal |
|
| Total LHFI |
| ||||||
Loans secured by real estate: |
|
|
|
|
|
|
|
|
|
|
|
|
|
|
|
|
|
|
|
|
|
|
|
|
Construction, land development and other land |
| $ | 60,701 |
|
| $ | 188 |
|
| $ | 54 |
|
| $ | 58 |
|
| $ | 61,001 |
|
| $ | 831,437 |
|
Secured by 1-4 family residential properties |
|
| 1,503,096 |
|
|
| 7,377 |
|
|
| 1,436 |
|
|
| 17,058 |
|
|
| 1,528,967 |
|
|
| 1,660,043 |
|
Secured by nonfarm, nonresidential properties |
|
| 731 |
|
|
| — |
|
|
| — |
|
|
| — |
|
|
| 731 |
|
|
| 2,034,176 |
|
Other real estate secured |
|
| 667 |
|
|
| — |
|
|
| — |
|
|
| — |
|
|
| 667 |
|
|
| 318,148 |
|
Commercial and industrial loans |
|
| — |
|
|
| — |
|
|
| — |
|
|
| — |
|
|
| — |
|
|
| 1,528,434 |
|
Consumer loans |
|
| 168,031 |
|
|
| 1,891 |
|
|
| 341 |
|
|
| 299 |
|
|
| 170,562 |
|
|
| 170,562 |
|
State and other political subdivision loans |
|
| — |
|
|
| — |
|
|
| — |
|
|
| — |
|
|
| — |
|
|
| 917,515 |
|
Other loans |
|
| 4,940 |
|
|
| 33 |
|
|
| — |
|
|
| — |
|
|
| 4,973 |
|
|
| 390,898 |
|
Total |
| $ | 1,738,166 |
|
| $ | 9,489 |
|
| $ | 1,831 |
|
| $ | 17,415 |
|
| $ | 1,766,901 |
|
| $ | 7,851,213 |
|
Past Due LHFS
LHFS past due 90 days or more totaled $35.5$51.2 million and $28.3$49.3 million at December 31, 20172023 and 2016,2022, respectively.
Trustmark did not exercise its buy-back option on any delinquent loans serviced for GNMA during 20172023 or 2016.2022.
105
ACL, LHFI
Allowance for Loan Losses, LHFI
Trustmark’s allowance for loan lossACL methodology for commercial LHFI is based upon guidance within FASB ASC Subtopic 326-20 as well as applicable regulatory guidanceguidance. The ACL is a valuation account that is deducted from its primary regulatorthe loans’ amortized cost basis to present the net amount expected to be collected on the loans. Credit quality within the LHFI portfolio is continuously monitored by Management and GAAP. is reflected within the ACL for LHFI. The ACL is an estimate of expected losses inherent within Trustmark’s existing LHFI portfolio. The ACL for LHFI is adjusted through the PCL, LHFI and reduced by the charge off of loan amounts, net of recoveries.
The methodology segregatesfor estimating the amount of expected credit losses reported in the ACL has two basic components: a collective, or pooled, component for estimated expected credit losses for pools of loans that share similar risk characteristics, and an asset-specific component involving individual loans that do not share risk characteristics with other loans and the measurement of expected credit losses for such individual loans. In estimating the ACL for the collective component, loans are segregated into loan pools based on loan product types and similar risk characteristics.
The loans secured by real estate and other loans secured by real estate portfolio segments include loans for both commercial purpose and residential properties. The underwriting process for these loans includes analysis of the financial position and strength of both the borrower and guarantor, experience with similar projects in the past, market demand and prospects for successful completion of the proposed project within the established budget and schedule, values of underlying collateral, availability of permanent financing, maximum loan-to-value ratios, minimum equity requirements, acceptable amortization periods and minimum debt service coverage requirements, based on property type. The borrower’s financial strength and capacity to repay their obligations remain the primary focus of underwriting. Financial strength is evaluated based upon analytical tools that consider historical and projected cash flows and performance in addition to analysis of the proposed project for income-producing properties. Additional support offered by guarantors is also considered. Ultimate repayment of these loans is sensitive to interest rate changes, general economic conditions, liquidity and availability of long-term financing.
The commercial constructionand industrial LHFI portfolios into nine separate loanportfolio segment includes loans within Trustmark’s geographic markets made to many types (or pools) which have similar characteristicsof businesses for various purposes, such as repayment, collateralshort-term working capital loans that are usually secured by accounts receivable and risk profiles. The nine basic loan poolsinventory and term financing for equipment and fixed asset purchases that are further segregated intosecured by those assets. Trustmark’s five key market regions, Alabama, Florida, Mississippi, Tennessee and Texas, to take into consideration the uniqueness of each market. A 10-point risk rating system is utilized for each separate loan pool to apply a reserve factor consisting of quantitative and qualitative components to determine the needed allowance by each loan type. As a result, there are 450 risk rate factorscredit underwriting process for commercial loan types. and industrial loans includes analysis of historical and projected cash flows and performance, evaluation of financial strength of both borrowers and guarantors as reflected in current and detailed financial information and evaluation of underlying collateral to support the credit.
The nine separate poolsconsumer LHFI portfolio segment is comprised of loans that are shown below:
Commercial Purpose LHFI
Real Estate – Owner-Occupied
Real Estate – Non-Owner Occupied
Working Capital
Non-Working Capital
Land
Lots and Development
Political Subdivisions
107
1 to 4 Family
Non-1 to 4 Family
The quantitative factorscentrally underwritten based on the borrower's credit bureau score as well as an evaluation of the allowance methodology reflectborrower’s repayment capacity, credit, and collateral. Property appraisals are obtained to assist in evaluating collateral. Loan-to-value and debt-to-income ratios, loan amount, and lien position are also considered in assessing whether to originate a twelve-quarter rolling average of net charge-offs by loan type within each key market region. This allows for a greater sensitivityloan. These borrowers are particularly susceptible to currentdownturns in economic trends such as economic changes,conditions that negatively affect housing prices and demand and levels of unemployment.
The state and other political subdivision LHFI and the other commercial LHFI portfolio segments primarily consist of loans to non-depository financial institutions, such as well as currentmortgage companies, finance companies and other financial intermediaries, loans to state and political subdivisions, and loans to non-profit and charitable organizations. These loans are underwritten based on the specific nature or purpose of the loan and underlying collateral with special consideration given to the specific source of repayment for the loan.
106
The following table provides a description of each of Trustmark’s portfolio segments, loan classes, loan pools and the ACL methodology and loss profiles and createsdrivers:
Portfolio Segment | Loan Class | Loan Pool | Methodology | Loss Drivers | ||||
Loans secured by real estate | Construction, land | 1-4 family residential | DCF | Prime Rate, National GDP | ||||
Lots and development | DCF | Prime Rate, Southern Unemployment | ||||||
Unimproved land | DCF | Prime Rate, Southern Unemployment | ||||||
All other consumer | DCF | Southern Unemployment | ||||||
Other secured by 1-4 | Consumer 1-4 family - 1st liens | DCF | Prime Rate, Southern Unemployment | |||||
All other consumer | DCF | Southern Unemployment | ||||||
Nonresidential owner-occupied | DCF | Southern Unemployment, National GDP | ||||||
Secured by nonfarm, | Nonowner-occupied - | DCF | Southern Vacancy Rate, Southern Unemployment | |||||
Nonowner-occupied - office | DCF | Southern Vacancy Rate, Southern Unemployment | ||||||
Nonowner-occupied- Retail | DCF | Southern Vacancy Rate, Southern Unemployment | ||||||
Nonowner-occupied - senior | DCF | Southern Vacancy Rate, Southern Unemployment | ||||||
Nonowner-occupied - | DCF | Southern Vacancy Rate, Southern Unemployment | ||||||
Nonresidential owner-occupied | DCF | Southern Unemployment, National GDP | ||||||
Other real estate secured | Nonresidential nonowner | DCF | Southern Vacancy Rate, Southern Unemployment | |||||
Nonresidential owner-occupied | DCF | Southern Unemployment, National GDP | ||||||
Nonowner-occupied - | DCF | Southern Vacancy Rate, Southern Unemployment | ||||||
Other loans secured by | Other construction | Other construction | DCF | Prime Rate, National Unemployment | ||||
Secured by 1-4 family | Trustmark mortgage | WARM | Southern Unemployment | |||||
Commercial and | Commercial and | Commercial and industrial - | DCF | Trustmark historical data | ||||
Commercial and industrial - | DCF | Trustmark historical data | ||||||
Equipment finance loans | WARM | Southern Unemployment, Southern GDP | ||||||
Credit cards | WARM | Trustmark call report data | ||||||
Consumer loans | Consumer loans | Credit cards | WARM | Trustmark call report data | ||||
Overdrafts | Loss Rate | Trustmark historical data | ||||||
All other consumer | DCF | Southern Unemployment | ||||||
State and other political | State and other political | Obligations of state and | DCF | Moody's Bond Default Study | ||||
Other commercial loans and leases | Other commercial loans and leases | Other loans | DCF | Prime Rate, Southern Unemployment | ||||
Commercial and industrial - | DCF | Trustmark historical data | ||||||
Commercial and industrial - | DCF | Trustmark historical data | ||||||
Equipment finance leases | WARM | Southern Unemployment, Southern GDP |
In general, Trustmark utilizes a more accurate depiction of historical losses.
During 2015, the LEP, a component ofDCF method to estimate the quantitative portion of the allowanceACL for loan pools. The DCF model consists of two key components, a loss driver analysis (LDA) and a cash flow analysis. For loan pools utilizing the DCF methodology, multiple assumptions are in place, depending on the loan pool. A reasonable and supportable forecast is utilized for each loan pool by developing a LDA for each loan class. The LDA uses charge off data from Federal Financial Institutions Examination Council (FFIEC) reports to construct a periodic default rate (PDR). The PDR is decomposed into a PD. Regressions are run using the data for various
107
macroeconomic variables in order to determine which ones correlate to Trustmark’s losses. These variables are then incorporated into the application to calculate a quarterly PD using a third-party baseline forecast. In addition to the PD, a LGD is derived using a method referred to as Frye Jacobs. The Frye Jacobs method is a mathematical formula that traces the relationship between LGD and PD over time and projects the LGD based on the levels of PD forecasts. This model approach is applicable to all pools within the construction, land development and other land, other secured by 1-4 family residential properties, secured by nonfarm, nonresidential properties and other real estate secured loan classes as well as consumer loans and other commercial LHFI, was revisedloans.
During the first quarter of 2022, Management elected to reflectincorporate a 1.5 year period rather than a one year period. An additional provision of approximately $2.3 million was recorded in 2015 as resultmethodology change related to the other construction pool. Components of this revisionchange include management utilizing an alternative LDA to support the PD and LGD assumptions necessary to apply a DCF methodology to the quantitative portion of the allowanceother construction pool. Fundamentally, this approach utilizes publicly reported default balances and leverages a generalized linear model (GLM) framework to estimate PD. Taken together, these differences allow for loan loss methodology for commercial LHFI. The LEP refersresults to be scaled to be specific and directly applicable to the period of time between the events that trigger a loss and a charge-off of that loss. Losses are usually not immediately known, and determining the loss event can be challenging. It takes time for the borrower and extent of lossother construction segment. LGD is assumed to be identifieda through-the-cycle constant based on the actual performance of Trustmark’s other construction segment. These assumptions are then input into the DCF model and determined. Trustmark may not be aware that the loss trigger has occurred until the borrower exhibits the inability to pay or other evidence of credit deterioration. Trustmark estimates the loss event to have occurred within a nine month period prior to the event of default. The charge-off of the loss occurs within a ten month period after the event of default, resulting in a 1.5 year LEP.
During 2015, Trustmark also revised the quantitative portion of the allowance for loan loss methodology for commercial LHFI to incorporate third-party default data. The default data is used in conjunction with each market/prepayment data to calculate the cash flows at the individual loan level. Previously, the other construction pool used the weighted average remaining maturity (WARM) method. Management believes this change is commensurate with the level of risk in the pool.
For the commercial loan pool’s loss rateand industrial loans related pools, Trustmark uses its own PD and LGD data, instead of the macroeconomic variables and the commercialFrye Jacobs method described above, to calculate the PD and LGD as there were no defensible macroeconomic variables that correlated to Trustmark’s losses. Trustmark utilizes a third-party Bond Default Study to derive the PD and LGD for the obligations of state and political subdivisions pool. Due to the lack of losses within this pool, no defensible macroeconomic factors were identified to correlate.
The PD and LGD measures are used in conjunction with prepayment data as inputs into the DCF model to calculate the cash flows at the individual loan LEP in calculatinglevel. Contractual cash flows based on loan terms are adjusted for PD, LGD and prepayments to derive loss cash flows. These loss cash flows are discounted by the loan’s coupon rate to arrive at the discounted cash flow based quantitative loss. The prepayment studies are updated quarterly by a total quantitative loss factorthird-party for each risk rating within each marketapplicable pool.
An alternate method of estimating the ACL is used for certain loan pools due to specific characteristics of these loans. For the non-DCF pools, specifically, those using the WARM method, the remaining life is incorporated into the ACL quantitative calculation.
Trustmark determined that reasonable and pool.supportable forecasts could be made for a twelve-month period for all of its loan pools. To the extent the lives of the loans in the LHFI portfolio extend beyond this forecast period, Trustmark uses a reversion period of four quarters and reverts to the historical mean on a straight-line basis over the remaining life of the loans. The econometric models currently in production reflect segment or pool level sensitivities of PD to changes in macroeconomic variables. By measuring the relationship between defaults and changes in the economy, the quantitative reservesreserve incorporates reasonable and supportable forecasts of future conditions that will affect the value of its assets, as required by FASB ASC Topic 326. Under stable forecasts, these linear regressions will reasonably predict a pool’s PD. However, due to the COVID-19 pandemic, the macroeconomic variables used for reasonable and supportable forecasting changed rapidly. At the macroeconomic levels experienced during the COVID-19 pandemic, it is not clear that the models currently in production will produce reasonably representative results since the models were originally estimated using data beginning in 2004 through 2019. During this period, a traditional, albeit severe, economic recession occurred. Thus, econometric models are sensitive to similar future levels of PD.
In order to prevent the econometric models from extrapolating beyond reasonable boundaries of their input variables, Trustmark chose to establish an upper and lower limit process when applying the periodic forecasts. In this way, Management will not rely upon unobserved and untested relationships in the setting of the quantitative reserve. This approach applies to all input variables, including: Southern Unemployment, National Unemployment, National Gross Domestic Product (GDP), Southern GDP, Southern Vacancy Rate and the Prime Rate. The upper and lower limits are based on the distribution of the macroeconomic variable by selecting extreme percentiles at the upper and lower limits of the distribution, the 1st and 99th percentiles, respectively. These upper and lower limits are then used to calculate the PD for the forecast time period in which the forecasted values are outside of the upper and lower limit range. Due to multiple periods having a PD or LGD at or near zero as a result of the improving macroeconomic forecasts, Management implemented PD and LGD floors to account for the risk associated with each portfolio. The PD and LGD floors are based on Trustmark’s historical loss experience and applied at a portfolio level.
Qualitative factors used in the ACL methodology include the following:
108
While all these factors are incorporated into the overall methodology, only three are currently considered active at December 31, 2023: (i) economic conditions and concentrations of credit, (ii) nature and volume of the portfolio and (iii) performance trends.
Two of Trustmark’s largest loan classes are the loans secured by nonfarm, nonresidential properties and the loans secured by other real estate. Trustmark elected to create a qualitative factor specifically for these loan classes which addresses changes in the economic conditions of metropolitan areas and applies additional pool level reserves. This qualitative factor is based on third-party market data and forecast trends and is updated quarterly as information is available, by market and by loan pool.
Trustmark's current quantitative methodologies do not completely incorporate changes in credit quality. As a result Trustmark utilizes the performance trends factor. This factor is based on migration analyses, that allocates additional ACL to non-pass/delinquent loans within each pool. In this way, Management believes the ACL will directly reflect changes in risk, based on the performance of the loans within a pool, whether declining or improving.
The performance trends qualitative factor is estimated by properly segmenting loan pools into risk levels by risk rating for commercial credits and delinquency status for consumer credits. A migration analysis is then performed quarterly using a third-party software and the results for each risk level is compiled to calculate the historical PD average for each loan portfolio based on risk levels. This average historical PD rate is updated annually. For the mortgage portfolio, Trustmark uses an internal report to incorporate a roll rate method for the calculation of the PD rate. In addition, to the PD rate for each portfolio, Management incorporates the quantitative rate and the k value derived from the Frye-Jacobs method to calculate a loss estimate that includes both PD and LGD. The quantitative rate is used to eliminate any additional reserve that the quantitative reserve already includes. Finally, the loss estimate rate is then applied to the total quantitativebalances for each risk level for each portfolio to calculate a qualitative reserve.
During the second quarter of 2022, Management elected to activate the nature and volume of the portfolio qualitative factor as a result of a sub-pool of the secured by 1-4 family residential properties growing to a significant size along with the underlying nature being different as well. The nature and volume of the portfolio qualitative factor utilizes a WARM methodology that uses industry data for the assumptions to support the qualitative adjustment. The industry data is used to compile a PD based on credit score ranges along with using the industry data to compile an LGD. The sub-pool of credits are then aggregated into the appropriate credit score bands in which a weighted average loss rate is calculated based on the PD and LGD for each credit score range. This weighted average loss rate is then applied to the expected balance for the sub-segment of credits. This total is then used as the qualitative reserve adjustment.
The external factors qualitative factor multipliedis Management’s best judgment on the loan or pool level impact of all factors that affect the portfolio that are not accounted for using any other part of the ACL methodology (e.g., natural disasters, changes in legislation, impacts due to technology and pandemics). Trustmark's External Factor – Pandemic ensures reserve adequacy for collectively evaluated loans most likely to be impacted by the outstandingunique economic and behavioral conditions created by the COVID-19 pandemic. Additional qualitative reserves are derived based on two principles. The first is the disconnect of economic factors to Trustmark’s modeled PD (derived from the econometric models underpinning the quantitative pooled reserves). During the pandemic, extraordinary measures by the federal government were made available to consumers and businesses, including COVID-19 loan payment concessions, direct transfer payments to households, tax deferrals, and reduced interest rates, among others. These government interventions may have extended the lag between economic conditions and default, relative to what was captured in the model development data. Because Trustmark’s econometric PD models rely on the observed relationship from the economic downturn from 2007 to 2009 in both timing and severity, Management does not expect the models to reflect these current conditions. For example, while the models would predict contemporaneous unemployment peaks and loan defaults, this may not occur when borrowers can request payment deferrals. Thus, for the affected population, economic conditions are not fully considered as a part of Trustmark’s quantitative reserve. The second principle is the change in risk that is identified by rating changes. As a part of Trustmark’s credit review process, loans in the affected population have been given more frequent screening to ensure accurate ratings are maintained through this dynamic period. Trustmark’s quantitative reserve does not directly address changes in ratings, thus a migration qualitative factor was designed to work in concert with the quantitative reserve.
As discussed above, the disconnect of economic factors means that changes in rating caused by deteriorating and weak economic conditions as a result of the pandemic were not being captured in the quantitative reserve. During 2020, due to unforeseen pandemic conditions that varied from Management’s expectations, additional reserves were further dimensioned in order to appropriately reflect the risk within the portfolio related to the COVID-19 pandemic. In an effort to ensure the External Factor-Pandemic qualitative factor is reasonable and supportable, historical Trustmark loss data was leveraged to construct a framework that is quantitative in nature. To dimension the additional reserve, Management uses the sensitivity of the quantitative commercial loan reserve to changes in
109
macroeconomic conditions to apply to loans rated acceptable or better (RR 1-4). In addition, to account for the known changes in risk, a weighted average of the commercial loan portfolio loss rate, derived from the performance trends qualitative factor, is used to dimension additional reserves for downgraded credits. Loans rated acceptable with risk (RR 5) or watch (RR 6) received the additional reserves based on the average of the macroeconomic conditions and weighted-average of the commercial loan portfolio loss rate while the loans rated special mention and substandard received additional reserves based on the weighted-average described above. During the fourth quarter of 2022, Management noted that all pass rated loans (RR 5 & RR 6) related to the External Factor-Pandemic qualitative factor either did not experience significant stress related to the pandemic or have since recovered and does not expect future stresses attributed to the pandemic that may affect these loans. As a result, Management decided to accelerate the release of the additional pandemic reserves on all pass rated loans. During the fourth quarter of 2023, Management decided to resolve the External Factor-Pandemic qualitative factor as a result of the remaining loan balances within each loan groupthat were identified as COVID affected loans were immaterial from both a reserve and risk rate. An additional provision of approximately $1.3 million was recorded in 2015balance perspective. The remaining loans were incorporated back into the performance qualitative factor as a result of this revisionresolution. Further, due to this resolution there is no longer any active External Factor as of December 31, 2023.
During the quantitativefirst quarter of 2022, in order to account for the potential uncertainty related to higher prices and low economic growth, Trustmark chose to enact a portion of the allowance for loan loss methodology for commercial LHFI.
Qualitative factorsqualitative framework, External Factor - Stagflation. Management calculated the reserve using a third-party stagflation forecast and compared it to the third-party baseline forecast used in the allowance methodology includequantitative modeling. The weighted differential is added as qualitative reserves to account for potential uncertainty. During the following:
National and regional economic trends and conditions
Impactfourth quarter of recent performance trends
Experience, ability and effectiveness of management
Adherence to Trustmark’s loan policies, procedures and internal controls
Collateral, financial and underwriting exception trends
Credit concentrations
Loan facility risk
Acquisitions
Catastrophe
Each qualitative factor is converted to a scale ranging from 0 (No risk) to 100 (High Risk), other than the last two factors, which are applied on a dollar-for-dollar basis to ensure2022, Management determined that the combinationlikelihood of such factors is proportional. The resulting ratings froma stagflation scenario had sufficiently diminished. Management identified that the individual factors are weightedpotential had already been reduced and summed to establish the weighted-average qualitative factoreffectively captured within each key market region.
During 2015, Trustmark eliminated caps and floors from the criticized risk grades in the qualitative portion and adjusted the Florida market region’s distribution factors in the qualitative and quantitative portions of the allowance for loan loss methodology for commercial LHFI. The caps and floors for criticized risk ratings were eliminated in order to allow the risk associated with those credits to be reflected without constraint of pre-existing limits (caps or floors) on the risk ratings. When the current allowance for loan loss methodology was originally established, the vast majority of the reserve for the Florida market region’s assets was covered by the quantitative features of the allowance for loan loss methodology due to the amount of gross charge-offs at that time and captured the vast majority of the embedded risk in the portfolio. The distribution for the Florida market region was adjusted to be the same as Trustmark’s other key market regions since the credit metrics in the Florida market region nowa nominally more closely resemble Trustmark as a whole. The elimination of the caps and floors for criticized risk ratings in the qualitative portion of the allowance for loan loss methodology for commercial LHFI resulted in a provision recapture of $1.8 million in 2015. The change in the Florida market region distribution resulted in an additional provision expense of $2.1 million related to the qualitative portion and an additional provision expense of $785 thousand related to the quantitative portion of the allowance for loan loss methodology for commercial LHFI in 2015. Combined, these revisions to the allowance for loan loss methodology for commercial LHFI resulted in an additional provision of approximately $1.1 million recorded during 2015.
108
In addition, Trustmark revised the qualitative portion of the commercial LHFI allowance for loan loss methodology to incorporate the use of maximum observed gross historical losses as a way to calculate a maximum qualitative reserve limit. The maximum observed gross historical losses for each market were observed for a three-year period reflecting the lastnegative baseline economic downturn (i.e., 2008-2010). The aggregate of these losses as a percentage of the three-year average commercial LHFI balance results in an entity wide maximum observed gross historical loss rate for commercial LHFI. Once the quantitative component of the allowance for loan loss methodology is calculated, the quantitative reserve percentage is deducted from the maximum observed gross historical loss rate, resulting in the maximum possible qualitative reserve limit. The overall Qualitative Risk Factor (QRF) percentage is calculated by weighting each market’s QRF and applied as a percentage to the maximum qualitative reserve limit. The result is the amount of qualitative adjustment to be distributed to each market. The distribution of qualitative reserves incorporates the nine separate commercial loan groups that are ranked in ascending order of risk by their respective weighted-average risk rates. The distribution of the qualitative adjustment among the risk rates was derived by an analysis that determines the probability of future credit deterioration. An additional provision of approximately $4.4 million was recorded in 2015 asforecast. As a result, of these revisions.
During 2015, Trustmark also revisedManagement elected to resolve the qualitative portion ofExternal Factor - Stagflation and fully release the allowance for loan loss methodology for commercial LHFI regarding the loan facility risk component. Loan facility risk embodies the nature, frequency and duration of the repayment structure as it pertains to the actual source of loan repayment. The underlying loan structure and nature of the credit either is risk neutral for traditional structures or adds risk to the credit for any variance that represents additional credit risk from the traditional structures. If the facility structure adds additional credit risk, qualitative reserves are added to individual loans based on their respective commercial loan pools. Factors considered in assigning facility risk include whether the principal is amortizing or not amortizing, revolving or not revolving, the payment frequency and the duration of the payment structure. In order to estimate the facility reserve for amortizing and interest only structures, loan level detail is used to estimate the incremental payment amount at risk, which is then assigned a reserve factor based upon probability of default, loss given default and the degree of deviation from the traditional structures. A provision recapture of approximately $2.1 million was recorded in 2015 as a result of this revision to the qualitative portion of the allowance for loan loss methodology for commercial LHFI.
Trustmark made no revisions to the allowance for loan loss methodology for commercial LHFI during 2017 or 2016.
The allowance for loan loss methodology segregates the consumer LHFI portfolio into homogeneous pools of loans that contain similar structure, repayment, collateral and risk profiles. These homogeneous pools of loans are shown below:.
Residential Mortgage
Direct Consumer
Junior Lien on 1-4 Family Residential Properties
Credit Cards
Overdrafts
The historical loss experience for these pools is determined by calculating a 12-quarter rolling average of net charge-offs, which is applied to each pool to establish the quantitative aspect of the methodology. Where, in Management’s estimation, the calculated loss experience does not fully cover the anticipated loss for a pool, an estimate is also applied to each pool to establish the qualitative aspect of the methodology, which represents the perceived risks across the loan portfolio at the current point in time. This qualitative methodology utilizes five separate factors made up of unique components that when weighted and combined produce an estimated level of reserve for each of the loan pools. The five qualitative factors include the following:
Economic indicators
Performance trends
Management experience
Credit concentrations
Loan policy exceptions
The risk measure for each factor is converted to a scale ranging from 0 (No risk) to 100 (High Risk) to ensure that the combination of such factors is proportional. The determination of the risk measurement for each qualitative factor is done for all markets combined. The resulting estimated reserve factor is then applied to each pool.
During 2015, Trustmark revised the qualitative portion of the allowance for loan loss methodology for consumer LHFI by recalibrating the loss expectation component to be more representative of current conditions as well as recalculating the expected loss potential component, which reflects the consumer 12-quarter rolling average of net charge-offs, for each of the respective consumer
109
loan groups. An additional provision of $2.2 million was recorded in 2015 as a result of these revisions to the qualitative portion of the allowance for loan loss methodology for consumer LHFI.
In addition, Trustmark revised the quantitative portion of the allowance for loan loss methodology for the consumer mortgage portfolio. When the current allowance for loan loss methodology was originally established, the Florida market mortgages and non-Florida mortgages were treated separately due to the vast difference in loss experience. Since the credit metrics in the Florida market region now more closely resemble Trustmark as a whole, the quantitative portion of the loan loss methodology was revised to no longer segregate the mortgage portfolio into Florida and non-Florida portions. A provision recapture of approximately $455 thousand was recorded in 2015 as a result of this revision to the quantitative portion of the allowance for loan loss methodology for consumer LHFI.
During 2015, Trustmark also revised the qualitative portion of the consumer LHFI allowance for loan loss methodology to incorporate the use of maximum observed gross historical losses as a way to calculate a maximum qualitative reserve limit. The maximum observed gross historical losses for each consumer loan portfolio were observed for a three-year period reflecting the last economic downturn (i.e., 2008-2010). The aggregate of these losses as a percentage of the respective pool’s loan balance results in a maximum observed gross historical loss rate. Once the quantitative component of the allowance for loan loss methodology is calculated, the quantitative reserve is deducted from the maximum observed gross historical loss rate, resulting in the maximum possible qualitative reserve limit. The QRF percentage is calculated and applied as a percentage to the maximum qualitative reserve limit. The result is the amount of qualitative adjustment to be distributed to each consumer loan pool, with the exception of overdrafts due to their specific nature. An additional provision of approximately $750 thousand was recorded in 2015 as a result of this revision to the qualitative portion of the allowance for loan loss methodology for consumer LHFI.
Trustmark made no revisions to the allowance for loan loss methodology for consumer LHFI during 2017 or 2016.
The resulting ratings from the individual factors are weighted and summed to establish the weighted-average qualitative factor of a specific loan portfolio. This weighted-average qualitative factor is then applied over the five loan pools.
Trustmark’s loan policy dictates the guidelines to be followed in determining when a loan is charged off. Commercial purpose loans are charged off when a determination is made that the loan is uncollectible and continuance as a bankable asset is not warranted or an impairment evaluation indicates that a value adjustment is necessary. Consumer loans secured by 1-4 family residential real estate are generally charged off or written down when the credit becomes severely delinquent and the balance exceeds the fair value of the property less costs to sell. Non-real estate consumer purpose loans, both secured and unsecured, are generally charged off in full during the month in which the loan becomes 120 days past due. Credit card loans are generally charged off in full when the loan becomes 180 days past due.
The following tables detaildisaggregate the balance inACL, LHFI and the allowance for loan losses, LHFI allocated to each loan type segmentedamortized cost basis of the loans by the impairment evaluationmeasurement methodology used at December 31, 20172023 and 20162022 ($ in thousands):
|
| December 31, 2023 |
| |||||||||||||||||||||
|
| ACL |
|
| LHFI |
| ||||||||||||||||||
|
| Individually Evaluated for Credit Loss |
|
| Collectively Evaluated for Credit Loss |
|
| Total ACL |
|
| Individually Evaluated for Credit Loss |
|
| Collectively Evaluated for Credit Loss |
|
| Total LHFI |
| ||||||
Loans secured by real estate: |
|
|
|
|
|
|
|
|
|
|
|
|
|
|
|
|
|
| ||||||
Construction, land development and other land |
| $ | — |
|
| $ | 17,192 |
|
| $ | 17,192 |
|
| $ | 2,020 |
|
|
| 640,866 |
|
| $ | 642,886 |
|
Other secured by 1-4 family residential properties |
|
| — |
|
|
| 12,942 |
|
|
| 12,942 |
|
|
| 946 |
|
|
| 621,451 |
|
|
| 622,397 |
|
Secured by nonfarm, nonresidential properties |
|
| — |
|
|
| 24,043 |
|
|
| 24,043 |
|
|
| 20,812 |
|
|
| 3,468,622 |
|
|
| 3,489,434 |
|
Other real estate secured |
|
| — |
|
|
| 4,488 |
|
|
| 4,488 |
|
|
| — |
|
|
| 1,312,551 |
|
|
| 1,312,551 |
|
Other loans secured by real estate: |
|
|
|
|
|
|
|
|
|
|
|
|
|
|
|
|
|
| ||||||
Other construction |
|
| — |
|
|
| 5,758 |
|
|
| 5,758 |
|
|
| — |
|
|
| 867,793 |
|
|
| 867,793 |
|
Secured by 1-4 family residential properties |
|
| — |
|
|
| 34,794 |
|
|
| 34,794 |
|
|
| 3,235 |
|
|
| 2,279,083 |
|
|
| 2,282,318 |
|
Commercial and industrial loans |
|
| 11,436 |
|
|
| 15,202 |
|
|
| 26,638 |
|
|
| 21,102 |
|
|
| 1,901,808 |
|
|
| 1,922,910 |
|
Consumer loans |
|
| — |
|
|
| 5,794 |
|
|
| 5,794 |
|
|
| — |
|
|
| 165,734 |
|
|
| 165,734 |
|
State and other political subdivision loans |
|
| — |
|
|
| 646 |
|
|
| 646 |
|
|
| — |
|
|
| 1,088,466 |
|
|
| 1,088,466 |
|
Other commercial loans and leases |
|
| 967 |
|
|
| 6,105 |
|
|
| 7,072 |
|
|
| 967 |
|
|
| 555,068 |
|
|
| 556,035 |
|
Total |
| $ | 12,403 |
|
| $ | 126,964 |
|
| $ | 139,367 |
|
| $ | 49,082 |
|
| $ | 12,901,442 |
|
| $ | 12,950,524 |
|
|
| December 31, 2022 |
| |||||||||||||||||||||
|
| ACL |
|
| LHFI |
| ||||||||||||||||||
|
| Individually Evaluated |
|
| Collectively Evaluated for Credit Loss |
|
| Total |
|
| Individually Evaluated for Credit Loss |
|
| Collectively Evaluated for Credit Loss |
|
| Total |
| ||||||
Loans secured by real estate: |
|
|
|
|
|
|
|
|
|
|
|
|
|
|
|
|
|
| ||||||
Construction, land development and other land |
| $ | 121 |
|
| $ | 12,707 |
|
| $ | 12,828 |
|
| $ | 1,558 |
|
| $ | 689,058 |
|
| $ | 690,616 |
|
Other secured by 1-4 family residential properties |
|
| — |
|
|
| 12,374 |
|
|
| 12,374 |
|
|
| 482 |
|
|
| 590,308 |
|
|
| 590,790 |
|
Secured by nonfarm, nonresidential properties |
|
| — |
|
|
| 19,488 |
|
|
| 19,488 |
|
|
| 4,841 |
|
|
| 3,273,989 |
|
|
| 3,278,830 |
|
Other real estate secured |
|
| — |
|
|
| 4,743 |
|
|
| 4,743 |
|
|
| — |
|
|
| 742,538 |
|
|
| 742,538 |
|
Other loans secured by real estate: |
|
|
|
|
|
|
|
|
|
|
|
|
|
|
|
|
|
| ||||||
Other construction |
|
| 7,620 |
|
|
| 7,512 |
|
|
| 15,132 |
|
|
| 7,620 |
|
|
| 1,021,306 |
|
|
| 1,028,926 |
|
Secured by 1-4 family residential properties |
|
| — |
|
|
| 21,185 |
|
|
| 21,185 |
|
|
| 1,193 |
|
|
| 2,183,864 |
|
|
| 2,185,057 |
|
Commercial and industrial loans |
|
| 9,946 |
|
|
| 13,194 |
|
|
| 23,140 |
|
|
| 24,594 |
|
|
| 1,796,665 |
|
|
| 1,821,259 |
|
Consumer loans |
|
| — |
|
|
| 5,792 |
|
|
| 5,792 |
|
|
| — |
|
|
| 170,230 |
|
|
| 170,230 |
|
State and other political subdivision loans |
|
| — |
|
|
| 885 |
|
|
| 885 |
|
|
| — |
|
|
| 1,223,863 |
|
|
| 1,223,863 |
|
Other commercial loans |
|
| — |
|
|
| 4,647 |
|
|
| 4,647 |
|
|
| — |
|
|
| 471,930 |
|
|
| 471,930 |
|
Total |
| $ | 17,687 |
|
| $ | 102,527 |
|
| $ | 120,214 |
|
| $ | 40,288 |
|
| $ | 12,163,751 |
|
| $ | 12,204,039 |
|
|
| December 31, 2017 |
| |||||||||
|
| Individually |
|
| Collectively |
|
| Total |
| |||
Loans secured by real estate: |
|
|
|
|
|
|
|
|
|
|
|
|
Construction, land development and other land |
| $ | 75 |
|
| $ | 7,790 |
|
| $ | 7,865 |
|
Secured by 1-4 family residential properties |
|
| 1,331 |
|
|
| 9,543 |
|
|
| 10,874 |
|
Secured by nonfarm, nonresidential properties |
|
| 165 |
|
|
| 23,263 |
|
|
| 23,428 |
|
Other real estate secured |
|
| — |
|
|
| 2,790 |
|
|
| 2,790 |
|
Commercial and industrial loans |
|
| 131 |
|
|
| 22,720 |
|
|
| 22,851 |
|
Consumer loans |
|
| — |
|
|
| 3,470 |
|
|
| 3,470 |
|
State and other political subdivision loans |
|
| — |
|
|
| 789 |
|
|
| 789 |
|
Other loans |
|
| 41 |
|
|
| 4,625 |
|
|
| 4,666 |
|
Total allowance for loan losses, LHFI |
| $ | 1,743 |
|
| $ | 74,990 |
|
| $ | 76,733 |
|
110
110
| December 31, 2016 |
| ||||||||||
|
| Individually |
|
| Collectively |
|
| Total |
| |||
Loans secured by real estate: |
|
|
|
|
|
|
|
|
|
|
|
|
Construction, land development and other land |
| $ | 103 |
|
| $ | 8,982 |
|
| $ | 9,085 |
|
Secured by 1-4 family residential properties |
|
| 960 |
|
|
| 9,387 |
|
|
| 10,347 |
|
Secured by nonfarm, nonresidential properties |
|
| 221 |
|
|
| 20,746 |
|
|
| 20,967 |
|
Other real estate secured |
|
| — |
|
|
| 2,263 |
|
|
| 2,263 |
|
Commercial and industrial loans |
|
| 1,976 |
|
|
| 20,035 |
|
|
| 22,011 |
|
Consumer loans |
|
| — |
|
|
| 3,241 |
|
|
| 3,241 |
|
State and other political subdivision loans |
|
| — |
|
|
| 859 |
|
|
| 859 |
|
Other loans |
|
| — |
|
|
| 2,492 |
|
|
| 2,492 |
|
Total allowance for loan losses, LHFI |
| $ | 3,260 |
|
| $ | 68,005 |
|
| $ | 71,265 |
|
The following tables detail LHFI by loan type related to each balance in the allowance for loan losses, LHFI segregated by the impairment evaluation methodology used at December 31, 2017 and 2016 ($ in thousands):
|
| December 31, 2017 |
| |||||||||
|
| LHFI Evaluated for Impairment |
| |||||||||
|
| Individually |
|
| Collectively |
|
| Total |
| |||
Loans secured by real estate: |
|
|
|
|
|
|
|
|
|
|
|
|
Construction, land development and other land |
| $ | 1,405 |
|
| $ | 986,219 |
|
| $ | 987,624 |
|
Secured by 1-4 family residential properties |
|
| 4,736 |
|
|
| 1,670,575 |
|
|
| 1,675,311 |
|
Secured by nonfarm, nonresidential properties |
|
| 10,423 |
|
|
| 2,183,400 |
|
|
| 2,193,823 |
|
Other real estate secured |
|
| — |
|
|
| 517,956 |
|
|
| 517,956 |
|
Commercial and industrial loans |
|
| 31,799 |
|
|
| 1,538,546 |
|
|
| 1,570,345 |
|
Consumer loans |
|
| 17 |
|
|
| 171,901 |
|
|
| 171,918 |
|
State and other political subdivision loans |
|
| — |
|
|
| 952,483 |
|
|
| 952,483 |
|
Other loans |
|
| 556 |
|
|
| 499,951 |
|
|
| 500,507 |
|
Total |
| $ | 48,936 |
|
| $ | 8,521,031 |
|
| $ | 8,569,967 |
|
|
| December 31, 2016 |
| |||||||||
|
| LHFI Evaluated for Impairment |
| |||||||||
|
| Individually |
|
| Collectively |
|
| Total |
| |||
Loans secured by real estate: |
|
|
|
|
|
|
|
|
|
|
|
|
Construction, land development and other land |
| $ | 2,441 |
|
| $ | 828,996 |
|
| $ | 831,437 |
|
Secured by 1-4 family residential properties |
|
| 4,649 |
|
|
| 1,655,394 |
|
|
| 1,660,043 |
|
Secured by nonfarm, nonresidential properties |
|
| 6,219 |
|
|
| 2,027,957 |
|
|
| 2,034,176 |
|
Other real estate secured |
|
| — |
|
|
| 318,148 |
|
|
| 318,148 |
|
Commercial and industrial loans |
|
| 13,669 |
|
|
| 1,514,765 |
|
|
| 1,528,434 |
|
Consumer loans |
|
| 2 |
|
|
| 170,560 |
|
|
| 170,562 |
|
State and other political subdivision loans |
|
| — |
|
|
| 917,515 |
|
|
| 917,515 |
|
Other loans |
|
| 95 |
|
|
| 390,803 |
|
|
| 390,898 |
|
Total |
| $ | 27,075 |
|
| $ | 7,824,138 |
|
| $ | 7,851,213 |
|
Changes in the allowance for loan losses,ACL, LHFI were as follows for the periods presented ($ in thousands):
|
| Years Ended December 31, |
|
| Years Ended December 31, |
| ||||||||||||||||||
|
| 2017 |
|
| 2016 |
|
| 2015 |
|
| 2023 |
|
| 2022 |
|
| 2021 |
| ||||||
Balance at beginning of period |
| $ | 71,265 |
|
| $ | 67,619 |
|
| $ | 69,616 |
|
| $ | 120,214 |
|
| $ | 99,457 |
|
| $ | 117,306 |
|
Loans charged-off |
|
| (21,147 | ) |
|
| (18,930 | ) |
|
| (22,469 | ) |
|
| (17,515 | ) |
|
| (11,332 | ) |
|
| (10,275 | ) |
Recoveries |
|
| 11,521 |
|
|
| 11,619 |
|
|
| 12,097 |
|
|
| 9,306 |
|
|
| 10,412 |
|
|
| 13,925 |
|
Net (charge-offs) recoveries |
|
| (9,626 | ) |
|
| (7,311 | ) |
|
| (10,372 | ) |
|
| (8,209 | ) |
|
| (920 | ) |
|
| 3,650 |
|
Provision for loan losses, LHFI |
|
| 15,094 |
|
|
| 10,957 |
|
|
| 8,375 |
| ||||||||||||
PCL, LHFI |
|
| 27,362 |
|
|
| 21,677 |
|
|
| (21,499 | ) | ||||||||||||
Balance at end of period |
| $ | 76,733 |
|
| $ | 71,265 |
|
| $ | 67,619 |
|
| $ | 139,367 |
|
| $ | 120,214 |
|
| $ | 99,457 |
|
111
The following tables detail changes in the allowance for loan losses,ACL, LHFI by loan typeclass for the years ended December 31, 20172023 and 2016, respectively2022 ($ in thousands):
|
| 2017 |
| |||||||||||||||||
|
| Balance |
|
|
|
|
|
|
|
|
|
| Provision for |
|
| Balance |
| |||
|
| January 1, |
|
| Charge-offs |
|
| Recoveries |
|
| Loan Losses |
|
| December 31, |
| |||||
Loans secured by real estate: |
|
|
|
|
|
|
|
|
|
|
|
|
|
|
|
|
|
|
|
|
Construction, land development and other land |
| $ | 9,085 |
|
| $ | (79 | ) |
| $ | 1,428 |
|
| $ | (2,569 | ) |
| $ | 7,865 |
|
Secured by 1-4 family residential properties |
|
| 10,347 |
|
|
| (950 | ) |
|
| 1,833 |
|
|
| (356 | ) |
|
| 10,874 |
|
Secured by nonfarm, nonresidential properties |
|
| 20,967 |
|
|
| (4,231 | ) |
|
| 396 |
|
|
| 6,296 |
|
|
| 23,428 |
|
Other real estate secured |
|
| 2,263 |
|
|
| (5 | ) |
|
| 69 |
|
|
| 463 |
|
|
| 2,790 |
|
Commercial and industrial loans |
|
| 22,011 |
|
|
| (8,286 | ) |
|
| 2,578 |
|
|
| 6,548 |
|
|
| 22,851 |
|
Consumer loans |
|
| 3,241 |
|
|
| (2,546 | ) |
|
| 1,938 |
|
|
| 837 |
|
|
| 3,470 |
|
State and other political subdivision loans |
|
| 859 |
|
|
| — |
|
|
| — |
|
|
| (70 | ) |
|
| 789 |
|
Other loans |
|
| 2,492 |
|
|
| (5,050 | ) |
|
| 3,279 |
|
|
| 3,945 |
|
|
| 4,666 |
|
Total allowance for loan losses, LHFI |
| $ | 71,265 |
|
| $ | (21,147 | ) |
| $ | 11,521 |
|
| $ | 15,094 |
|
| $ | 76,733 |
|
|
| 2016 |
| |||||||||||||||||
|
| Balance |
|
|
|
|
|
|
|
|
|
| Provision for |
|
| Balance |
| |||
|
| January 1, |
|
| Charge-offs |
|
| Recoveries |
|
| Loan Losses |
|
| December 31, |
| |||||
Loans secured by real estate: |
|
|
|
|
|
|
|
|
|
|
|
|
|
|
|
|
|
|
|
|
Construction, land development and other land |
| $ | 11,587 |
|
| $ | (311 | ) |
| $ | 1,380 |
|
| $ | (3,571 | ) |
| $ | 9,085 |
|
Secured by 1-4 family residential properties |
|
| 10,678 |
|
|
| (1,319 | ) |
|
| 1,122 |
|
|
| (134 | ) |
|
| 10,347 |
|
Secured by nonfarm, nonresidential properties |
|
| 21,563 |
|
|
| (3,067 | ) |
|
| 976 |
|
|
| 1,495 |
|
|
| 20,967 |
|
Other real estate secured |
|
| 2,467 |
|
|
| (27 | ) |
|
| 7 |
|
|
| (184 | ) |
|
| 2,263 |
|
Commercial and industrial loans |
|
| 15,815 |
|
|
| (6,602 | ) |
|
| 732 |
|
|
| 12,066 |
|
|
| 22,011 |
|
Consumer loans |
|
| 2,879 |
|
|
| (1,864 | ) |
|
| 4,007 |
|
|
| (1,781 | ) |
|
| 3,241 |
|
State and other political subdivision loans |
|
| 809 |
|
|
| — |
|
|
| — |
|
|
| 50 |
|
|
| 859 |
|
Other loans |
|
| 1,821 |
|
|
| (5,740 | ) |
|
| 3,395 |
|
|
| 3,016 |
|
|
| 2,492 |
|
Total allowance for loan losses, LHFI |
| $ | 67,619 |
|
| $ | (18,930 | ) |
| $ | 11,619 |
|
| $ | 10,957 |
|
| $ | 71,265 |
|
|
| 2023 |
| |||||||||||||||||
|
| Balance |
|
|
|
|
|
|
|
|
|
|
| Balance |
| |||||
|
| January 1, |
|
| Charge-offs |
|
| Recoveries |
|
| PCL |
|
| December 31, |
| |||||
Loans secured by real estate: |
|
|
|
|
|
|
|
|
|
|
|
|
|
|
| |||||
Construction, land development and other land |
| $ | 12,828 |
|
| $ | (242 | ) |
| $ | 142 |
|
| $ | 4,464 |
|
| $ | 17,192 |
|
Other secured by 1-4 family residential properties |
|
| 12,374 |
|
|
| (320 | ) |
|
| 439 |
|
|
| 449 |
|
|
| 12,942 |
|
Secured by nonfarm, nonresidential properties |
|
| 19,488 |
|
|
| (278 | ) |
|
| 2,328 |
|
|
| 2,505 |
|
|
| 24,043 |
|
Other real estate secured |
|
| 4,743 |
|
|
| — |
|
|
| 28 |
|
|
| (283 | ) |
|
| 4,488 |
|
Other loans secured by real estate: |
|
|
|
|
|
|
|
|
|
|
|
|
|
|
| |||||
Other construction |
|
| 15,132 |
|
|
| (3,453 | ) |
|
| 73 |
|
|
| (5,994 | ) |
|
| 5,758 |
|
Secured by 1-4 family residential properties |
|
| 21,185 |
|
|
| (1,457 | ) |
|
| 38 |
|
|
| 15,028 |
|
|
| 34,794 |
|
Commercial and industrial loans |
|
| 23,140 |
|
|
| (2,161 | ) |
|
| 1,066 |
|
|
| 4,593 |
|
|
| 26,638 |
|
Consumer loans |
|
| 5,792 |
|
|
| (9,290 | ) |
|
| 5,192 |
|
|
| 4,100 |
|
|
| 5,794 |
|
State and other political subdivision loans |
|
| 885 |
|
|
| — |
|
|
| — |
|
|
| (239 | ) |
|
| 646 |
|
Other commercial loans and leases |
|
| 4,647 |
|
|
| (314 | ) |
|
| — |
|
|
| 2,739 |
|
|
| 7,072 |
|
Total |
| $ | 120,214 |
|
| $ | (17,515 | ) |
| $ | 9,306 |
|
| $ | 27,362 |
|
| $ | 139,367 |
|
Note 6 – Acquired Loans
DuringThe PCL, LHFI for the first quarter of 2017, Trustmark modifiedyear ended December 31, 2023 was primarily attributable to loan growth, extended maturities on the presentation of the acquired loans disclosures to eliminate the segmentation of acquired noncovered loans and acquired covered loans due to the significantly reduced size of the acquired covered loan portfolio. Trustmark’s loss share agreement with the FDIC covering the acquired covered loans other than loans secured by 1-4 family residential properties expiredresulting from lower prepayment speeds, changes in the macroeconomic forecast and net adjustments to the qualitative factors.
The negative PCL, LHFI for the other construction portfolio for the year ended December 31, 2023 was primarily due to the transfer of a fully-reserved nonaccrual loan to other real estate, net.
|
| 2022 |
| |||||||||||||||||
|
|
|
|
|
|
|
|
|
|
|
|
|
|
|
| |||||
|
| Balance |
|
| Charge-offs |
|
| Recoveries |
|
| PCL |
|
| Balance |
| |||||
Loans secured by real estate: |
|
|
|
|
|
|
|
|
|
|
|
|
|
|
| |||||
Construction, land development and other land |
| $ | 6,079 |
|
| $ | (226 | ) |
| $ | 1,280 |
|
| $ | 5,695 |
|
| $ | 12,828 |
|
Other secured by 1-4 family residential properties |
|
| 10,310 |
|
|
| (225 | ) |
|
| 597 |
|
|
| 1,692 |
|
|
| 12,374 |
|
Secured by nonfarm, nonresidential properties |
|
| 37,912 |
|
|
| (306 | ) |
|
| 1,724 |
|
|
| (19,842 | ) |
|
| 19,488 |
|
Other real estate secured |
|
| 4,713 |
|
|
| (131 | ) |
|
| 14 |
|
|
| 147 |
|
|
| 4,743 |
|
Other loans secured by real estate: |
|
|
|
|
|
|
|
|
|
|
|
|
|
|
| |||||
Other construction |
|
| 5,968 |
|
|
| (153 | ) |
|
| 222 |
|
|
| 9,095 |
|
|
| 15,132 |
|
Secured by 1-4 family residential properties |
|
| 2,706 |
|
|
| (154 | ) |
|
| 167 |
|
|
| 18,466 |
|
|
| 21,185 |
|
Commercial and industrial loans |
|
| 18,939 |
|
|
| (671 | ) |
|
| 955 |
|
|
| 3,917 |
|
|
| 23,140 |
|
Consumer loans |
|
| 4,774 |
|
|
| (2,125 | ) |
|
| 1,563 |
|
|
| 1,580 |
|
|
| 5,792 |
|
State and other political subdivision loans |
|
| 2,708 |
|
|
| — |
|
|
| — |
|
|
| (1,823 | ) |
|
| 885 |
|
Other commercial loans |
|
| 5,348 |
|
|
| (7,341 | ) |
|
| 3,890 |
|
|
| 2,750 |
|
|
| 4,647 |
|
Total |
| $ | 99,457 |
|
| $ | (11,332 | ) |
| $ | 10,412 |
|
| $ | 21,677 |
|
| $ | 120,214 |
|
The increases in the PCL, LHFI for the year ended December 31, 2022 were primarily due to loan growth, the weakening of the macroeconomic forecast and the nature and volume of the portfolio.
The decrease in the PCL, LHFI for the secured by nonfarm, nonresidential properties portfolio for the year ended December 31, 2022 was primarily due to adjustments to the External Factor - Pandemic qualitative factor. The decrease in the PCL, LHFI for the state and
111
other political subdivision loans portfolio was due to the release of specific reserves on June 30, 2016. Trustmark’s loss share agreementindividually analyzed credits coupled with the FDIC covering the acquired covered loans secured by 1-4 family residential properties will expire in 2021. Effective July 1, 2016, all acquired covered loans excluding the acquired covered loans secured by 1-4 family residential properties were reclassified to acquired noncovered loans. The revised presentation reflects total acquired loan information in the accompanying consolidated balance sheets and tables below. All prior period information has been reclassified to conformadjustments to the current period presentation.
Loans acquired in the Reliance merger completed on April 7, 2017 were evaluated using a fair value process to determine the degree of credit deterioration since originationExternal Factor - Pandemic qualitative factor and the collectibility of contractually required payments. Approximately $7.9 million of the loans acquired in the Reliance merger exhibited evidence of significant credit deterioration since originationroutine modeling assumption updates.
Note 5 – Premises and for which it was probable at acquisition that Trustmark would not be able to collect all contractually required payments. These loans are accounted for as acquired impaired loans under FASB ASC Topic 310-30.Equipment, Net
112
At December 31, 20172023 and 2016, acquired loans2022, premises and equipment, net consisted of the following ($ in thousands):
|
| December 31, |
| |||||
|
| 2017 |
|
| 2016 |
| ||
Loans secured by real estate: |
|
|
|
|
|
|
|
|
Construction, land development and other land |
| $ | 23,586 |
|
| $ | 20,850 |
|
Secured by 1-4 family residential properties |
|
| 61,751 |
|
|
| 69,540 |
|
Secured by nonfarm, nonresidential properties |
|
| 114,694 |
|
|
| 103,820 |
|
Other real estate secured |
|
| 16,746 |
|
|
| 19,010 |
|
Commercial and industrial loans |
|
| 31,506 |
|
|
| 36,896 |
|
Consumer loans |
|
| 2,600 |
|
|
| 3,365 |
|
Other loans |
|
| 10,634 |
|
|
| 18,766 |
|
Acquired loans |
|
| 261,517 |
|
|
| 272,247 |
|
Less allowance for loan losses, acquired loans |
|
| 4,079 |
|
|
| 11,397 |
|
Net acquired loans |
| $ | 257,438 |
|
| $ | 260,850 |
|
|
| December 31, |
| |||||
|
| 2023 |
|
| 2022 |
| ||
Land |
| $ | 56,747 |
|
| $ | 54,300 |
|
Buildings and leasehold improvements |
|
| 247,173 |
|
|
| 237,215 |
|
Furniture and equipment |
|
| 212,625 |
|
|
| 198,698 |
|
Total cost of premises and equipment |
|
| 516,545 |
|
|
| 490,213 |
|
Less accumulated depreciation and amortization |
|
| 288,956 |
|
|
| 282,385 |
|
Premises and equipment, net |
|
| 227,589 |
|
|
| 207,828 |
|
Finance lease right-of-use assets |
|
| 3,751 |
|
|
| 4,537 |
|
Assets held for sale |
|
| 1,197 |
|
|
| — |
|
Total premises and equipment, net |
| $ | 232,537 |
|
| $ | 212,365 |
|
The following table presents changesThere were three properties included in the net carrying value of the acquired loansassets held for the periods presented ($ in thousands):
|
| Acquired |
|
| Acquired |
| ||
|
| Impaired |
|
| Not ASC 310-30 (1) |
| ||
Carrying value, net at January 1, 2016 |
| $ | 310,762 |
|
| $ | 67,657 |
|
Accretion to interest income |
|
| 18,405 |
|
|
| 40 |
|
Payments received, net |
|
| (111,522 | ) |
|
| (24,953 | ) |
Other (2) |
|
| (134 | ) |
|
| — |
|
Change in allowance for loan losses, acquired loans |
|
| 596 |
|
|
| (1 | ) |
Carrying value, net at December 31, 2016 |
|
| 218,107 |
|
|
| 42,743 |
|
Transfers (3) |
|
| — |
|
|
| (36,719 | ) |
Additions (4) |
|
| 7,899 |
|
|
| 109,548 |
|
Accretion to interest income |
|
| 14,924 |
|
|
| 1,578 |
|
Payments received, net |
|
| (68,317 | ) |
|
| (39,208 | ) |
Other (2) |
|
| (361 | ) |
|
| (74 | ) |
Change in allowance for loan losses, acquired loans |
|
| 7,318 |
|
|
| — |
|
Carrying value, net at December 31, 2017 |
| $ | 179,570 |
|
| $ | 77,868 |
|
|
|
|
|
|
|
|
|
Under FASB ASC Topic 310-30, the accretable yield is the excess of expected cash flows at acquisition over the initial fair value of acquired impaired loans and is recorded as interest income over the estimated life of the loans using the effective yield method if the timing and amount of the future cash flows is reasonably estimable. The following table presents changes in the accretable yield for the periods presented ($ in thousands):
|
| Years Ended December 31, |
| |||||||||
|
| 2017 |
|
| 2016 |
|
| 2015 |
| |||
Accretable yield at beginning of period |
| $ | (38,918 | ) |
| $ | (52,672 | ) |
| $ | (77,149 | ) |
Additions due to acquisition (1) |
|
| (784 | ) |
|
| — |
|
|
| — |
|
Accretion to interest income |
|
| 14,924 |
|
|
| 18,405 |
|
|
| 30,501 |
|
Disposals |
|
| 2,868 |
|
|
| 6,488 |
|
|
| 10,013 |
|
Reclassification from nonaccretable difference (2) |
|
| (9,516 | ) |
|
| (11,139 | ) |
|
| (16,037 | ) |
Accretable yield at end of period |
| $ | (31,426 | ) |
| $ | (38,918 | ) |
| $ | (52,672 | ) |
|
|
|
|
113
The following tables present the components of the allowance for loan losses on acquired impaired loans for the periods presented ($ in thousands):
|
| Years Ended December 31, |
| |||||||||
|
| 2017 |
|
| 2016 |
|
| 2015 |
| |||
Balance at beginning of period |
| $ | 11,397 |
|
| $ | 11,992 |
|
| $ | 12,059 |
|
Provision for loan losses, acquired loans |
|
| (7,395 | ) |
|
| 3,757 |
|
|
| 3,425 |
|
Loans charged-off |
|
| — |
|
|
| (6,616 | ) |
|
| (7,200 | ) |
Recoveries |
|
| 77 |
|
|
| 2,264 |
|
|
| 3,708 |
|
Net (charge-offs) recoveries |
|
| 77 |
|
|
| (4,352 | ) |
|
| (3,492 | ) |
Balance at end of period |
| $ | 4,079 |
|
| $ | 11,397 |
|
| $ | 11,992 |
|
As discussed in Note 5 - LHFI and Allowance for Loan Losses, LHFI, Trustmark has established a loan grading system that consists of ten individual credit risk grades (risk ratings) that encompass a range from loans where the expectation of loss is negligible to loans where loss has been established. The model is based on the risk of default for an individual credit and establishes certain criteria to segregate the level of risk across the ten unique risk ratings. These credit quality measures are unique to commercial loans. Credit quality for consumer loans is based on individual credit scores, aging status of the loan and payment activity.
The tables below present the acquired loans by loan type and credit quality indicatorsale at December 31, 2017 and 2016 ($ in thousands):
|
| December 31, 2017 |
| |||||||||||||||||||
|
|
|
| Commercial Loans |
| |||||||||||||||||
|
|
|
| Pass - |
|
| Special Mention - |
|
| Substandard - |
|
| Doubtful - |
|
|
|
|
| ||||
|
|
|
| Categories 1-6 |
|
| Category 7 |
|
| Category 8 |
|
| Category 9 |
|
| Subtotal |
| |||||
Loans secured by real estate: |
|
|
|
|
|
|
|
|
|
|
|
|
|
|
|
|
|
|
|
|
|
|
Construction, land development and other land |
|
|
| $ | 17,150 |
|
| $ | 234 |
|
| $ | 4,690 |
|
| $ | 264 |
|
| $ | 22,338 |
|
Secured by 1-4 family residential properties |
|
|
|
| 14,021 |
|
|
| 298 |
|
|
| 3,029 |
|
|
| — |
|
|
| 17,348 |
|
Secured by nonfarm, nonresidential properties |
|
|
|
| 95,147 |
|
|
| 1,400 |
|
|
| 17,583 |
|
|
| 530 |
|
|
| 114,660 |
|
Other real estate secured |
|
|
|
| 12,730 |
|
|
| 102 |
|
|
| 3,031 |
|
|
| 477 |
|
|
| 16,340 |
|
Commercial and industrial loans |
|
|
|
| 22,157 |
|
|
| 15 |
|
|
| 7,585 |
|
|
| 1,749 |
|
|
| 31,506 |
|
Consumer loans |
|
|
|
| — |
|
|
| — |
|
|
| — |
|
|
| — |
|
|
| — |
|
Other loans |
|
|
|
| 5,874 |
|
|
| 18 |
|
|
| 4,742 |
|
|
| — |
|
|
| 10,634 |
|
Total acquired loans |
|
|
| $ | 167,079 |
|
| $ | 2,067 |
|
| $ | 40,660 |
|
| $ | 3,020 |
|
| $ | 212,826 |
|
|
| Consumer Loans |
|
|
|
|
| |||||||||||||||||
|
|
|
|
|
| Past Due |
|
| Past Due |
|
|
|
|
|
|
|
|
|
| Total |
| |||
|
| Current |
|
| 30-89 Days |
|
| 90 Days or More |
|
| Nonaccrual (1) |
|
| Subtotal |
|
| Acquired Loans |
| ||||||
Loans secured by real estate: |
|
|
|
|
|
|
|
|
|
|
|
|
|
|
|
|
|
|
|
|
|
|
|
|
Construction, land development and other land |
| $ | 1,188 |
|
| $ | 46 |
|
| $ | 14 |
|
| $ | — |
|
| $ | 1,248 |
|
| $ | 23,586 |
|
Secured by 1-4 family residential properties |
|
| 42,008 |
|
|
| 1,687 |
|
|
| 584 |
|
|
| 124 |
|
|
| 44,403 |
|
|
| 61,751 |
|
Secured by nonfarm, nonresidential properties |
|
| 34 |
|
|
| — |
|
|
| — |
|
|
| — |
|
|
| 34 |
|
|
| 114,694 |
|
Other real estate secured |
|
| 406 |
|
|
| — |
|
|
| — |
|
|
| — |
|
|
| 406 |
|
|
| 16,746 |
|
Commercial and industrial loans |
|
| — |
|
|
| — |
|
|
| — |
|
|
| — |
|
|
| — |
|
|
| 31,506 |
|
Consumer loans |
|
| 2,428 |
|
|
| 172 |
|
|
| — |
|
|
| — |
|
|
| 2,600 |
|
|
| 2,600 |
|
Other loans |
|
| — |
|
|
| — |
|
|
| — |
|
|
| — |
|
|
| — |
|
|
| 10,634 |
|
Total acquired loans |
| $ | 46,064 |
|
| $ | 1,905 |
|
| $ | 598 |
|
| $ | 124 |
|
| $ | 48,691 |
|
| $ | 261,517 |
|
|
|
114
| December 31, 2016 |
| ||||||||||||||||||||
|
|
|
| Commercial Loans |
| |||||||||||||||||
|
|
|
| Pass - |
|
| Special Mention - |
|
| Substandard - |
|
| Doubtful - |
|
|
|
|
| ||||
|
|
|
| Categories 1-6 |
|
| Category 7 |
|
| Category 8 |
|
| Category 9 |
|
| Subtotal |
| |||||
Loans secured by real estate: |
|
|
|
|
|
|
|
|
|
|
|
|
|
|
|
|
|
|
|
|
|
|
Construction, land development and other land |
|
|
| $ | 12,148 |
|
| $ | 99 |
|
| $ | 6,469 |
|
| $ | 322 |
|
| $ | 19,038 |
|
Secured by 1-4 family residential properties |
|
|
|
| 14,552 |
|
|
| 61 |
|
|
| 4,066 |
|
|
| 69 |
|
|
| 18,748 |
|
Secured by nonfarm, nonresidential properties |
|
|
|
| 83,271 |
|
|
| 435 |
|
|
| 19,553 |
|
|
| 511 |
|
|
| 103,770 |
|
Other real estate secured |
|
|
|
| 15,344 |
|
|
| — |
|
|
| 2,673 |
|
|
| 565 |
|
|
| 18,582 |
|
Commercial and industrial loans |
|
|
|
| 22,024 |
|
|
| 18 |
|
|
| 13,494 |
|
|
| 1,354 |
|
|
| 36,890 |
|
Consumer loans |
|
|
|
| — |
|
|
| — |
|
|
| — |
|
|
| — |
|
|
| — |
|
Other loans |
|
|
|
| 12,954 |
|
|
| — |
|
|
| 5,649 |
|
|
| 161 |
|
|
| 18,764 |
|
Total acquired loans |
|
|
| $ | 160,293 |
|
| $ | 613 |
|
| $ | 51,904 |
|
| $ | 2,982 |
|
| $ | 215,792 |
|
|
| Consumer Loans |
|
|
|
|
| |||||||||||||||||
|
|
|
|
|
| Past Due |
|
| Past Due |
|
|
|
|
|
|
|
|
|
| Total |
| |||
|
| Current |
|
| 30-89 Days |
|
| 90 Days or More |
|
| Nonaccrual (1) |
|
| Subtotal |
|
| Acquired Loans |
| ||||||
Loans secured by real estate: |
|
|
|
|
|
|
|
|
|
|
|
|
|
|
|
|
|
|
|
|
|
|
|
|
Construction, land development and other land |
| $ | 1,801 |
|
| $ | — |
|
| $ | 11 |
|
| $ | — |
|
| $ | 1,812 |
|
| $ | 20,850 |
|
Secured by 1-4 family residential properties |
|
| 48,695 |
|
|
| 1,364 |
|
|
| 709 |
|
|
| 24 |
|
|
| 50,792 |
|
|
| 69,540 |
|
Secured by nonfarm, nonresidential properties |
|
| 50 |
|
|
| — |
|
|
| — |
|
|
| — |
|
|
| 50 |
|
|
| 103,820 |
|
Other real estate secured |
|
| 428 |
|
|
| — |
|
|
| — |
|
|
| — |
|
|
| 428 |
|
|
| 19,010 |
|
Commercial and industrial loans |
|
| 6 |
|
|
| — |
|
|
| — |
|
|
| — |
|
|
| 6 |
|
|
| 36,896 |
|
Consumer loans |
|
| 3,250 |
|
|
| 51 |
|
|
| 64 |
|
|
| — |
|
|
| 3,365 |
|
|
| 3,365 |
|
Other loans |
|
| 2 |
|
|
| — |
|
|
| — |
|
|
| — |
|
|
| 2 |
|
|
| 18,766 |
|
Total acquired loans |
| $ | 54,232 |
|
| $ | 1,415 |
|
| $ | 784 |
|
| $ | 24 |
|
| $ | 56,455 |
|
| $ | 272,247 |
|
|
|
At December 31, 2017 and 2016, there were no acquired impaired loans accounted for under FASB ASC Topic 310-30 classified as nonaccrual loans. At December 31, 2017, approximately $304 thousand of acquired loans not accounted for under FASB ASC Topic 310-30 were classified as nonaccrual loans,2023 compared to approximately $631 thousand of acquired loansno properties at December 31, 2016.
The following tables provide an aging analysis of contractually past due and nonaccrual acquired loans by loan type at December 31, 2017 and 2016 ($ in thousands):
|
| December 31, 2017 |
| |||||||||||||||||||||||||
|
| Past Due |
|
|
|
|
|
|
|
|
|
|
|
|
| |||||||||||||
|
|
|
|
|
|
|
|
|
|
|
|
|
|
|
|
|
|
|
|
|
|
|
|
|
|
|
|
|
|
| 30-59 Days |
|
| 60-89 Days |
|
| 90 Days or More (1) |
|
| Total |
|
| Nonaccrual (2) |
|
| Current Loans |
|
| Total Acquired Loans |
| |||||||
Loans secured by real estate: |
|
|
|
|
|
|
|
|
|
|
|
|
|
|
|
|
|
|
|
|
|
|
|
|
|
|
|
|
Construction, land development and other land |
| $ | 34 |
|
| $ | 90 |
|
| $ | 861 |
|
| $ | 985 |
|
| $ | — |
|
| $ | 22,601 |
|
| $ | 23,586 |
|
Secured by 1-4 family residential properties |
|
| 1,691 |
|
|
| 614 |
|
|
| 654 |
|
|
| 2,959 |
|
|
| 302 |
|
|
| 58,490 |
|
|
| 61,751 |
|
Secured by nonfarm, nonresidential properties |
|
| 467 |
|
|
| 73 |
|
|
| 898 |
|
|
| 1,438 |
|
|
| — |
|
|
| 113,256 |
|
|
| 114,694 |
|
Other real estate secured |
|
| 132 |
|
|
| — |
|
|
| — |
|
|
| 132 |
|
|
| — |
|
|
| 16,614 |
|
|
| 16,746 |
|
Commercial and industrial loans |
|
| — |
|
|
| — |
|
|
| — |
|
|
| — |
|
|
| 2 |
|
|
| 31,504 |
|
|
| 31,506 |
|
Consumer loans |
|
| 16 |
|
|
| 156 |
|
|
| — |
|
|
| 172 |
|
|
| — |
|
|
| 2,428 |
|
|
| 2,600 |
|
Other loans |
|
| — |
|
|
| — |
|
|
| 21 |
|
|
| 21 |
|
|
| — |
|
|
| 10,613 |
|
|
| 10,634 |
|
Total acquired loans |
| $ | 2,340 |
|
| $ | 933 |
|
| $ | 2,434 |
|
| $ | 5,707 |
|
| $ | 304 |
|
| $ | 255,506 |
|
| $ | 261,517 |
|
|
|
|
|
115
| December 31, 2016 |
| ||||||||||||||||||||||||||
|
| Past Due |
|
|
|
|
|
|
|
|
|
|
|
|
| |||||||||||||
|
|
|
|
|
|
|
|
|
|
|
|
|
|
|
|
|
|
|
|
|
|
|
|
|
|
|
|
|
|
| 30-59 Days |
|
| 60-89 Days |
|
| 90 Days or More (1) |
|
| Total |
|
| Nonaccrual (2) |
|
| Current Loans |
|
| Total Acquired Loans |
| |||||||
Loans secured by real estate: |
|
|
|
|
|
|
|
|
|
|
|
|
|
|
|
|
|
|
|
|
|
|
|
|
|
|
|
|
Construction, land development and other land |
| $ | 321 |
|
| $ | 100 |
|
| $ | 821 |
|
| $ | 1,242 |
|
| $ | — |
|
| $ | 19,608 |
|
| $ | 20,850 |
|
Secured by 1-4 family residential properties |
|
| 1,495 |
|
|
| 412 |
|
|
| 1,057 |
|
|
| 2,964 |
|
|
| 41 |
|
|
| 66,535 |
|
|
| 69,540 |
|
Secured by nonfarm, nonresidential properties |
|
| 1,658 |
|
|
| 38 |
|
|
| 343 |
|
|
| 2,039 |
|
|
| 328 |
|
|
| 101,453 |
|
|
| 103,820 |
|
Other real estate secured |
|
| 769 |
|
|
| — |
|
|
| 1,445 |
|
|
| 2,214 |
|
|
| — |
|
|
| 16,796 |
|
|
| 19,010 |
|
Commercial and industrial loans |
|
| 60 |
|
|
| 39 |
|
|
| — |
|
|
| 99 |
|
|
| 262 |
|
|
| 36,535 |
|
|
| 36,896 |
|
Consumer loans |
|
| 51 |
|
|
| — |
|
|
| 64 |
|
|
| 115 |
|
|
| — |
|
|
| 3,250 |
|
|
| 3,365 |
|
Other loans |
|
| — |
|
|
| — |
|
|
| — |
|
|
| — |
|
|
| — |
|
|
| 18,766 |
|
|
| 18,766 |
|
Total acquired loans |
| $ | 4,354 |
|
| $ | 589 |
|
| $ | 3,730 |
|
| $ | 8,673 |
|
| $ | 631 |
|
| $ | 262,943 |
|
| $ | 272,247 |
|
|
|
|
|
Note 7 – Premises and Equipment, Net
At December 31, 2017 and 2016, premises and equipment consisted of the following ($ in thousands):
|
| December 31, |
| |||||
|
| 2017 |
|
| 2016 |
| ||
Land |
| $ | 52,335 |
|
| $ | 51,097 |
|
Buildings and leasehold improvements |
|
| 197,372 |
|
|
| 195,296 |
|
Furniture and equipment |
|
| 166,071 |
|
|
| 172,170 |
|
Total cost of premises and equipment |
|
| 415,778 |
|
|
| 418,563 |
|
Less accumulated depreciation and amortization |
|
| 237,425 |
|
|
| 239,319 |
|
Premises and equipment, net |
|
| 178,353 |
|
|
| 179,244 |
|
Assets held for sale |
|
| 986 |
|
|
| 5,743 |
|
Total premises and equipment, net |
| $ | 179,339 |
|
| $ | 184,987 |
|
Assets held for sale consisted of three closed branches at December 31, 2017 compared to five closed branches and two parcels of land previously purchased for expansion at December 31, 2016.2022. These properties were transferred from landpremises and premisesequipment, net to assets held for sale due to Trustmark’s intent to sell thesethe properties over the nextsubsequent twelve months as a result of its strategic branch initiatives. As a result, propertyProperty valuation adjustments of $338 thousand and $750$470 thousand were recognized and included in other expense for 20172023 compared to $400 thousand for 2022 and 2016, respectively, with no property valuation adjustments recognized in 2015.$140 thousand for 2021.
Depreciation and amortization of premises and equipment totaled $14.3$17.4 million in 2017, $13.22023, $16.2 million in 20162022 and $14.0$15.6 million in 2015.2021.
Note 86 – Mortgage Banking
Mortgage Servicing RightsMSR
The activity in the MSR is detailed in the table below for the periods presented ($ in thousands):
|
| Years Ended December 31, |
|
| Years Ended December 31, |
| ||||||||||
|
| 2017 |
|
| 2016 |
|
| 2023 |
|
| 2022 |
| ||||
Balance at beginning of period |
| $ | 80,239 |
|
| $ | 74,007 |
|
| $ | 129,677 |
|
| $ | 87,687 |
|
Origination of servicing assets |
|
| 15,860 |
|
|
| 16,745 |
|
|
| 13,712 |
|
|
| 17,843 |
|
Change in fair value: |
|
|
|
|
|
|
|
|
|
|
|
|
| |||
Due to market changes |
|
| (1,050 | ) |
|
| (407 | ) |
|
| (1,489 | ) |
|
| 38,181 |
|
Due to runoff |
|
| (10,780 | ) |
|
| (10,106 | ) |
|
| (10,030 | ) |
|
| (14,034 | ) |
Balance at end of period |
| $ | 84,269 |
|
| $ | 80,239 |
|
| $ | 131,870 |
|
| $ | 129,677 |
|
In the determination of
Trustmark determines the fair value of the MSR atusing a valuation model administered by a third party that calculates the datepresent value of securitization, certain key economic assumptions are made. For instance,estimated future net servicing income. Trustmark considers the conditional prepayment rate (CPR), which is an estimated loan prepayment rate that uses historical prepayment rates for previous loans similar to the loans being evaluated, the float rate, which is the interest rate earned on escrow balances, and the discount rate as some of the primary assumptions used in determining the fair value of the MSR. An increase in either the CPR or discount rate assumption will result in a decrease in the fair value of the MSR, while a decrease in either assumption will result in an increase in the fair value of the MSR. An increase in the float rate will result in an increase in the fair value of the MSR, while a decrease in the float rate will result in a decrease in the fair value of the MSR. At December 31, 2017,2023, the fair value of the MSR included an assumed average prepayment speed of 9.149 CPR and an average discount rate of 10.28%10.07% compared to an assumed average prepayment speed of 7.948 CPR and an average discount rate of 10.32%10.08% at December 31, 2016. In recent years, there have been significant market-driven fluctuations in loan prepayment speeds and discount rates. These fluctuations can be rapid and may continue to be significant. Therefore, estimating prepayment speed and/or discount rates within ranges that market participants would use in determining the fair value of the MSR requires significant management judgment.2022.
Mortgage Loans Sold/Serviced
During 2017, 20162023, 2022 and 2015,2021, Trustmark sold $1.179$1.136 billion, $1.384$1.243 billion and $1.246$2.286 billion, respectively, of residential mortgage loans. Pretax gainsGain on these sales of loans, net totaled $18.9$15.3 million in 2017, $20.52023, $20.2 million in 20162022 and $18.0$56.0 million in 2015.2021. Trustmark receives annual servicing fee income approximating 0.33%0.32% of the outstanding balance of the underlying loans, which totaled $21.4$26.9 million in 2017, $20.42023, $26.0 million in 20162022 and $19.3$25.1 million in 2015.2021. The pretax gains on the sale of residential mortgage loans and the annual servicing fee
112
are both recorded to noninterest income in mortgage banking, net in the accompanying consolidated statements of income. The investors and the securitization trusts have no recourse to the assets of Trustmark for failure of debtors to pay when due.
The table below details the mortgage loans sold and serviced for others at December 31, 20172023 and 20162022 ($ in thousands):
|
| December 31, |
|
| December 31, |
| ||||||||||
|
| 2017 |
|
| 2016 |
|
| 2023 |
|
| 2022 |
| ||||
Federal National Mortgage Association |
| $ | 4,128,614 |
|
| $ | 3,992,349 |
|
| $ | 4,826,028 |
|
| $ | 4,684,815 |
|
Government National Mortgage Association |
|
| 2,421,456 |
|
|
| 2,291,398 |
|
|
| 3,510,983 |
|
|
| 3,350,222 |
|
Federal Home Loan Mortgage Corporation |
|
| 47,071 |
|
|
| 55,006 |
|
|
| 112,352 |
|
|
| 52,023 |
|
Other |
|
| 26,864 |
|
|
| 32,589 |
|
|
| 28,012 |
|
|
| 28,764 |
|
Total mortgage loans sold and serviced for others |
| $ | 6,624,005 |
|
| $ | 6,371,342 |
|
| $ | 8,477,375 |
|
| $ | 8,115,824 |
|
Trustmark is subject to losses in its loan servicing portfolio due to loan foreclosures. Trustmark has obligations to either repurchase the outstanding principal balance of a loan or make the purchaser whole for the economic benefits of a loan if it is determined that the loan sold was in violation of representations or warranties made by Trustmark at the time of the sale, herein referred to as mortgage loan servicing putback expenses. Such representations and warranties typically include those made regarding loans that had missing or insufficient file documentation, loans that do not meet investor guidelines, loans in which the appraisal does not support the value and/or loans obtained through fraud by the borrowers or other third parties. Generally, putback requests may be made until the loan is paid in full. However, mortgage loans delivered to Federal National Mortgage Association (FNMA) and Federal Home Loan Mortgage Corporation (FHLMC) on or after January 1, 2013 are subject to the Lending and Selling Representations and Warranties Framework, updated in May 2014, which provides certain instances in whichthat FNMA and FHLMC will not exercise their remedies, including a putback request, for breaches of certain selling representations and warranties, such as payment history andor quality control review.
When a putback request is received, Trustmark evaluates the request and takes appropriate actions based on the nature of the request. Trustmark is required by FNMA and FHLMC to provide a response to putback requests within 60 days of the date of receipt. Currently, putback requests primarily relate to 2009 through 2013 vintage mortgage loans. The total mortgage loan servicing putback expenses were included in other expense.
Changes in the At both December 31, 2023 and 2022, Trustmark had a reserve for mortgage loan servicing putback expense for mortgage loans were as follows for the periods presented ($ in thousands):expenses of $500 thousand.
|
| Years Ended December 31, |
| |||||||||
|
| 2017 |
|
| 2016 |
|
| 2015 |
| |||
Balance at beginning of period |
| $ | 1,130 |
|
| $ | 1,685 |
|
| $ | 1,170 |
|
Provision for putback expenses |
|
| (836 | ) |
|
| 420 |
|
|
| 315 |
|
Other (1) |
|
| 706 |
|
|
| (975 | ) |
|
| 200 |
|
Balance at end of period |
| $ | 1,000 |
|
| $ | 1,130 |
|
| $ | 1,685 |
|
|
|
117
There is inherent uncertainty in reasonably estimating the requirement for reserves against potential future mortgage loan servicing putback expenses. Future putback expenses are dependent on many subjective factors, including the review procedures of the purchasers and the potential refinance activity on loans sold with servicing released and the subsequent consequences under the representations and warranties. Trustmark believes that it has appropriately reserved for potential mortgage loan servicing putback requests.
Note 97 – Goodwill and Identifiable Intangible Assets
Goodwill
The table below illustrates goodwill by segment for the years ended December 31, 20172023 and 20162022 ($ in thousands):
|
| General |
|
|
|
|
|
|
|
|
| |
|
| Banking |
|
| Insurance |
|
| Total |
| |||
Balance as of January 1, 2016 |
| $ | 321,132 |
|
| $ | 45,024 |
|
| $ | 366,156 |
|
Adjustment during 2016 |
|
| — |
|
|
| — |
|
|
| — |
|
Balance as of December 31, 2016 |
|
| 321,132 |
|
|
| 45,024 |
|
|
| 366,156 |
|
Goodwill from Reliance merger during 2017 |
|
| 13,471 |
|
|
| — |
|
|
| 13,471 |
|
Balance as of December 31, 2017 |
| $ | 334,603 |
|
| $ | 45,024 |
|
| $ | 379,627 |
|
|
| General |
|
|
|
|
|
|
| |||
|
| Banking |
|
| Insurance |
|
| Total |
| |||
Balance as of January 1, 2022 |
| $ | 334,603 |
|
| $ | 49,634 |
|
| $ | 384,237 |
|
Adjustment during 2022 |
|
| — |
|
|
| — |
|
|
| — |
|
Balance as of December 31, 2022 |
|
| 334,603 |
|
|
| 49,634 |
|
|
| 384,237 |
|
Adjustment during 2023 |
|
| — |
|
|
| — |
|
|
| — |
|
Balance as of December 31, 2023 |
| $ | 334,603 |
|
| $ | 49,634 |
|
| $ | 384,237 |
|
Trustmark’s General Banking DivisionSegment delivers a full range of banking services to consumer, corporate, small and middle-market businesses through its extensive branch network. During 2017, Trustmark recorded $13.5 million as goodwill from its merger with Reliance.
The Insurance DivisionSegment includes TNB’s wholly-owned retail insurance subsidiary that offers a diverse mix of insurance products and services. Trustmark performed goodwill impairment tests for the General Banking and Insurance DivisionsSegments during 2017, 20162023, 2022 and 2015.2021. Based on these tests, Trustmark concluded that the fair value of both the General Banking and Insurance Divisions substantiallySegments exceeded the book value and no impairment charge was required.
113
Identifiable Intangible Assets
At December 31, 20172023 and 2016,2022, identifiable intangible assets consisted of the following ($ in thousands):
|
| December 31, 2017 |
|
| December 31, 2016 |
|
| December 31, 2023 |
|
| December 31, 2022 |
| ||||||||||||||||||||||||||||||||||||
|
| Gross Carrying |
|
| Accumulated |
|
| Net Carrying |
|
| Gross Carrying |
|
| Accumulated |
|
| Net Carrying |
|
| Gross Carrying |
| Accumulated |
| Net Carrying |
| Gross Carrying |
| Accumulated |
| Net Carrying |
| |||||||||||||||||
|
| Amount |
|
| Amortization |
|
| Amount |
|
| Amount |
|
| Amortization |
|
| Amount |
|
| Amount |
|
| Amortization |
|
| Amount |
|
| Amount |
|
| Amortization |
|
| Amount |
| ||||||||||||
Core deposit intangibles |
| $ | 87,674 |
|
| $ | 73,494 |
|
| $ | 14,180 |
|
| $ | 85,824 |
|
| $ | 67,843 |
|
| $ | 17,981 |
|
| $ | 87,674 |
|
| $ | 87,439 |
|
| $ | 235 |
|
| $ | 87,674 |
|
| $ | 87,199 |
|
| $ | 475 |
|
Insurance intangibles |
|
| 13,824 |
|
|
| 12,026 |
|
|
| 1,798 |
|
|
| 13,824 |
|
|
| 11,615 |
|
|
| 2,209 |
|
|
| 17,272 |
|
|
| 14,542 |
|
|
| 2,730 |
|
|
| 17,272 |
|
|
| 14,157 |
|
|
| 3,115 |
|
Banking charters |
|
| 1,325 |
|
|
| 943 |
|
|
| 382 |
|
|
| 1,325 |
|
|
| 877 |
|
|
| 448 |
|
|
| 1,325 |
|
|
| 1,325 |
|
|
| — |
|
|
| 1,325 |
|
|
| 1,275 |
|
|
| 50 |
|
Borrower relationship intangible |
|
| 690 |
|
|
| 690 |
|
|
| — |
|
|
| 690 |
|
|
| 648 |
|
|
| 42 |
| ||||||||||||||||||||||||
Total |
| $ | 103,513 |
|
| $ | 87,153 |
|
| $ | 16,360 |
|
| $ | 101,663 |
|
| $ | 80,983 |
|
| $ | 20,680 |
|
| $ | 106,271 |
|
| $ | 103,306 |
|
| $ | 2,965 |
|
| $ | 106,271 |
|
| $ | 102,631 |
|
| $ | 3,640 |
|
Trustmark recorded $6.2 million$675 thousand of amortization of identifiable intangible assets in 2017, $6.92023, $1.4 million in 20162022 and $7.8$2.3 million in 2015.2021. Trustmark estimates that amortization expense for identifiable intangible assets will be $5.2 million$469 thousand in 2018, $4.0 million2024, $403 thousand in 2019, $2.7 million2025, $341 thousand in 2020, $1.9 million2026, $283 thousand in 20212027 and $1.1 million$250 thousand in 2022.2028. Trustmark continually evaluates whether events and circumstances have occurred that indicate that identifiable intangible assets have become impaired. Measurement of any impairment of such identifiable intangible assets is based on the fair values of those assets. There were no impairment losses on identifiable intangible assets recorded during 2017, 20162023, 2022 or 2015.2021.
118
The following table illustrates the carrying amounts and remaining weighted-average amortization periods of identifiable intangible assets as ofat December 31, 20172023 ($ in thousands):
|
|
|
|
| Remaining |
| ||
|
|
|
|
| Weighted- |
| ||
|
|
|
|
| Average |
| ||
|
| Net Carrying |
|
| Amortization |
| ||
|
| Amount |
|
| Period in Years |
| ||
Core deposit intangibles |
| $ | 235 |
|
|
| 3.2 |
|
Insurance intangibles |
|
| 2,730 |
|
|
| 14.9 |
|
Total |
| $ | 2,965 |
|
|
| 13.9 |
|
|
|
|
|
|
| Remaining |
| |
|
|
|
|
|
| Weighted- |
| |
|
|
|
|
|
| Average |
| |
|
| Net Carrying |
|
| Amortization |
| ||
|
| Amount |
|
| Period in Years |
| ||
Core deposit intangibles |
| $ | 14,180 |
|
|
| 5.2 |
|
Insurance intangibles |
|
| 1,798 |
|
|
| 15.3 |
|
Banking charters |
|
| 382 |
|
|
| 5.7 |
|
Total |
| $ | 16,360 |
|
|
| 6.3 |
|
Note 108 – Other Real Estate
At December 31, 2017,2023, Trustmark’s geographic other real estate distribution was primarily concentrated primarily in its five keyAlabama, Mississippi and Texas market regions: Alabama, Florida, Mississippi, Tennessee and Texas.regions. The ultimate recovery of a substantial portion of the carrying amount of other real estate is susceptible to changes in market conditions in these areas.this area.
For the periods presented, changes and gains (losses), net on other real estate were as follows ($ in thousands):
|
| Years Ended December 31, |
| |||||||||
|
| 2023 |
|
| 2022 |
|
| 2021 |
| |||
Balance at beginning of period |
| $ | 1,986 |
|
| $ | 4,557 |
|
| $ | 11,651 |
|
Additions |
|
| 7,237 |
|
|
| 1,533 |
|
|
| 770 |
|
Disposals |
|
| (2,555 | ) |
|
| (4,142 | ) |
|
| (6,932 | ) |
(Write-downs) recoveries |
|
| 199 |
|
|
| 38 |
|
|
| (932 | ) |
Balance at end of period |
| $ | 6,867 |
|
| $ | 1,986 |
|
| $ | 4,557 |
|
|
|
|
|
|
|
|
|
|
| |||
Gains (losses), net on the sale of other real estate |
| $ | (145 | ) |
| $ | (1,006 | ) |
| $ | (1,869 | ) |
|
| Years Ended December 31, |
| |||||||||
|
| 2017 |
|
| 2016 (1) |
|
| 2015 (1) |
| |||
Balance at beginning of period |
| $ | 62,051 |
|
| $ | 78,828 |
|
| $ | 98,569 |
|
Additions (2) |
|
| 9,235 |
|
|
| 24,525 |
|
|
| 32,782 |
|
Disposals |
|
| (24,762 | ) |
|
| (36,801 | ) |
|
| (48,352 | ) |
Write-downs |
|
| (3,296 | ) |
|
| (4,501 | ) |
|
| (4,171 | ) |
Balance at end of period |
| $ | 43,228 |
|
| $ | 62,051 |
|
| $ | 78,828 |
|
|
|
|
|
|
|
|
|
|
|
|
|
|
Gain, net on the sale of other real estate included in other real estate expense |
| $ | 2,087 |
|
| $ | 7,031 |
|
| $ | 4,041 |
|
|
|
|
|
At December 31, 20172023 and 2016,2022, other real estate by type of property consisted of the following ($ in thousands):
|
| December 31, |
| |||||
|
| 2023 |
|
| 2022 |
| ||
1-4 family residential properties |
| $ | 1,977 |
|
| $ | 1,128 |
|
Nonfarm, nonresidential properties |
|
| 4,835 |
|
|
| 561 |
|
Other real estate properties |
|
| 55 |
|
|
| 297 |
|
Total other real estate |
| $ | 6,867 |
|
| $ | 1,986 |
|
|
| December 31, |
| |||||
|
| 2017 |
|
| 2016 |
| ||
Construction, land development and other land properties |
| $ | 27,491 |
|
| $ | 36,871 |
|
1-4 family residential properties |
|
| 5,081 |
|
|
| 7,926 |
|
Nonfarm, nonresidential properties |
|
| 10,468 |
|
|
| 16,817 |
|
Other real estate properties |
|
| 188 |
|
|
| 437 |
|
Total other real estate |
| $ | 43,228 |
|
| $ | 62,051 |
|
114
At December 31, 20172023 and 2016,2022, other real estate by geographic location consisted of the following ($ in thousands):
|
| December 31, |
| |||||
|
| 2023 |
|
| 2022 |
| ||
Alabama |
| $ | 1,397 |
|
| $ | 194 |
|
Mississippi (1) |
|
| 1,242 |
|
|
| 1,769 |
|
Tennessee (2) |
|
| — |
|
|
| 23 |
|
Texas |
|
| 4,228 |
|
|
| — |
|
Total other real estate |
| $ | 6,867 |
|
| $ | 1,986 |
|
|
| December 31, |
| |||||
|
| 2017 |
|
| 2016 |
| ||
Alabama |
| $ | 11,714 |
|
| $ | 15,989 |
|
Florida |
|
| 13,937 |
|
|
| 22,582 |
|
Mississippi (1) |
|
| 14,260 |
|
|
| 15,646 |
|
Tennessee (2) |
|
| 2,535 |
|
|
| 6,183 |
|
Texas |
|
| 782 |
|
|
| 1,651 |
|
Total other real estate |
| $ | 43,228 |
|
| $ | 62,051 |
|
|
|
|
|
Note 11 – Deposits
At December 31, 20172023 and 2016,2022, the balance of other real estate included $2.0 million and $1.1 million, respectively, of foreclosed residential real estate properties recorded as a result of obtaining physical possession of theproperty. At December 31, 2023 and 2022, the recorded investment of consumer mortgage loans secured by residential real estate properties for which formal foreclosure proceedings are in process was $6.4 million and $2.9 million, respectively.
Note 9 – Leases
Lessor Arrangements
Trustmark leases certain types of machinery and equipment to its customers through sales-type and direct financing leases as part of its equipment financing portfolio. These leases generally have remaining lease terms of three to ten years, some of which include renewal options and/or options for the lessee to purchase the leased property near or at the end of the lease term. Trustmark recognized interest income from its sales-type and direct financing leases of $3.2 million for the year ended December 31, 2023. Trustmark does not have any significant operating leases in which it is the lessor.
The table below summarizes the components of Trustmark's net investment in its sales-type and direct financing leases at December 31, 2023 ($ in thousands):
|
| December 31, 2023 |
| |
Leases receivable |
| $ | 161,319 |
|
Unearned income |
|
| (29,011 | ) |
Initial direct costs |
|
| 1,326 |
|
Unguaranteed lease residual |
|
| 4,101 |
|
Total net investment |
| $ | 137,735 |
|
The table below details the minimum future lease payments for Trustmark's leases receivable at December 31, 2023 ($ in thousands):
|
| December 31, 2023 |
| |
2024 |
| $ | 24,647 |
|
2025 |
|
| 25,617 |
|
2026 |
|
| 24,176 |
|
2027 |
|
| 36,295 |
|
2028 |
|
| 21,141 |
|
Thereafter |
|
| 29,443 |
|
Total leases receivable |
| $ | 161,319 |
|
115
Lessee Arrangements
The table below details the components of net lease cost for the periods presented ($ in thousands):
|
| Years Ended December 31, |
| |||||||||
|
| 2023 |
|
| 2022 |
|
| 2021 |
| |||
Finance leases |
|
|
|
|
|
|
|
|
| |||
Amortization of right-of-use assets |
| $ | 786 |
|
| $ | 1,479 |
|
| $ | 1,546 |
|
Interest on lease liabilities |
|
| 163 |
|
|
| 188 |
|
|
| 219 |
|
Operating lease cost |
|
| 5,311 |
|
|
| 5,172 |
|
|
| 5,275 |
|
Short-term lease cost |
|
| 277 |
|
|
| 389 |
|
|
| 463 |
|
Variable lease cost |
|
| 906 |
|
|
| 1,150 |
|
|
| 1,234 |
|
Sublease income |
|
| (12 | ) |
|
| (168 | ) |
|
| (350 | ) |
Net lease cost |
| $ | 7,431 |
|
| $ | 8,210 |
|
| $ | 8,387 |
|
The table below details the cash payments included in the measurement of lease liabilities during the periods presented ($ in thousands):
|
| Years Ended December 31, |
| |||||||||
|
| 2023 |
|
| 2022 |
|
| 2021 |
| |||
Finance leases |
|
|
|
|
|
|
|
|
| |||
Operating cash flows included in operating activities |
| $ | 163 |
|
| $ | 188 |
|
| $ | 219 |
|
Financing cash flows included in payments under finance lease |
|
| 721 |
|
|
| 1,409 |
|
|
| 1,434 |
|
Operating leases |
|
|
|
|
|
|
|
|
| |||
Operating cash flows (fixed payments) included in other operating |
|
| 4,188 |
|
|
| 4,829 |
|
|
| 4,781 |
|
Operating cash flows (liability reduction) included in other operating |
|
| 3,643 |
|
|
| 4,009 |
|
|
| 3,948 |
|
The table below details balance sheet information, as well as weighted-average lease terms and discount rates, related to leases at December 31, 2023 and 2022 ($ in thousands):
|
| December 31, |
| |||||
|
| 2023 |
|
| 2022 |
| ||
Finance lease right-of-use assets, net of accumulated depreciation |
| $ | 3,751 |
|
| $ | 4,537 |
|
Finance lease liabilities |
|
| 4,334 |
|
|
| 5,055 |
|
Operating lease right-of-use assets |
|
| 38,142 |
|
|
| 36,301 |
|
Operating lease liabilities |
|
| 41,584 |
|
|
| 38,932 |
|
|
|
|
|
|
|
| ||
Weighted-average lease term |
|
|
|
|
|
| ||
Finance leases |
| 8.34 years |
|
| 8.72 years |
| ||
Operating leases |
| 10.13 years |
|
| 9.64 years |
| ||
|
|
|
|
|
|
| ||
Weighted-average discount rate |
|
|
|
|
|
| ||
Finance leases |
|
| 3.61 | % |
|
| 3.49 | % |
Operating leases |
|
| 3.64 | % |
|
| 3.22 | % |
At December 31, 2023, future minimum rental commitments under finance and operating leases were as follows ($ in thousands):
|
| Finance Leases |
|
| Operating Leases |
| ||
2024 |
| $ | 573 |
|
| $ | 5,051 |
|
2025 |
|
| 584 |
|
|
| 5,119 |
|
2026 |
|
| 589 |
|
|
| 4,967 |
|
2027 |
|
| 594 |
|
|
| 5,020 |
|
2028 |
|
| 599 |
|
|
| 4,860 |
|
Thereafter |
|
| 2,086 |
|
|
| 25,452 |
|
Total minimum lease payments |
|
| 5,025 |
|
|
| 50,469 |
|
Less imputed interest |
|
| (691 | ) |
|
| (8,885 | ) |
Lease liabilities |
| $ | 4,334 |
|
| $ | 41,584 |
|
116
Note 10 – Deposits
At December 31, 2023 and 2022, deposits consisted of the following ($ in thousands):
|
| December 31, |
| |||||
|
| 2023 |
|
| 2022 |
| ||
Noninterest-bearing demand |
| $ | 3,197,620 |
|
| $ | 4,093,771 |
|
Interest-bearing demand |
|
| 4,947,626 |
|
|
| 4,773,219 |
|
Savings |
|
| 4,047,853 |
|
|
| 4,282,435 |
|
Time |
|
| 3,376,664 |
|
|
| 1,288,223 |
|
Total |
| $ | 15,569,763 |
|
| $ | 14,437,648 |
|
|
| December 31, |
| |||||
|
| 2017 |
|
| 2016 |
| ||
Noninterest-bearing demand |
| $ | 2,978,074 |
|
| $ | 2,973,238 |
|
Interest-bearing demand |
|
| 2,432,814 |
|
|
| 1,875,312 |
|
Savings |
|
| 3,408,183 |
|
|
| 3,586,369 |
|
Time |
|
| 1,758,441 |
|
|
| 1,621,093 |
|
Total |
| $ | 10,577,512 |
|
| $ | 10,056,012 |
|
Interest expense on deposits by type consisted of the following for the periods presented ($ in thousands):
|
| Years Ended December 31, |
|
| Years Ended December 31, |
| ||||||||||||||||||
|
| 2017 |
|
| 2016 |
|
| 2015 |
|
| 2023 |
|
| 2022 |
|
| 2021 |
| ||||||
Interest-bearing demand |
| $ | 6,820 |
|
| $ | 3,297 |
|
| $ | 3,235 |
|
| $ | 121,138 |
|
| $ | 16,409 |
|
| $ | 4,906 |
|
Savings |
|
| 6,047 |
|
|
| 2,657 |
|
|
| 2,547 |
|
|
| 28,605 |
|
|
| 9,654 |
|
|
| 7,912 |
|
Time |
|
| 9,850 |
|
|
| 6,794 |
|
|
| 6,816 |
|
|
| 96,208 |
|
|
| 3,006 |
|
|
| 4,127 |
|
Total |
| $ | 22,717 |
|
| $ | 12,748 |
|
| $ | 12,598 |
|
| $ | 245,951 |
|
| $ | 29,069 |
|
| $ | 16,945 |
|
Time deposits that exceed the FDIC insurance limit of $250 thousand totaled $342.3$822.4 million and $229.9$247.2 million at December 31, 20172023 and 2016,2022, respectively. The maturities of time deposits of $100 thousand or more at December 31, 2017 and 2016 are as follows ($ in thousands):
|
| December 31, |
| |||||
|
| 2017 |
|
| 2016 |
| ||
3 months or less |
| $ | 203,679 |
|
| $ | 150,991 |
|
Over 3 months through 6 months |
|
| 183,679 |
|
|
| 147,089 |
|
Over 6 months through 12 months |
|
| 276,944 |
|
|
| 204,944 |
|
Over 12 months |
|
| 179,237 |
|
|
| 179,469 |
|
Total |
| $ | 843,539 |
|
| $ | 682,493 |
|
The maturities of interest-bearing deposits at December 31, 2017,2023, are as follows ($ in thousands):
2024 |
| $ | 3,199,607 |
|
2025 |
|
| 142,607 |
|
2026 |
|
| 19,632 |
|
2027 |
|
| 7,433 |
|
2028 |
|
| 5,503 |
|
Thereafter |
|
| 1,882 |
|
Total time deposits |
|
| 3,376,664 |
|
Interest-bearing deposits with no stated maturity |
|
| 8,995,479 |
|
Total interest-bearing deposits |
| $ | 12,372,143 |
|
2018 |
| $ | 1,356,448 |
|
2019 |
|
| 268,989 |
|
2020 |
|
| 73,745 |
|
2021 |
|
| 23,191 |
|
2022 and thereafter |
|
| 36,068 |
|
Total time deposits |
|
| 1,758,441 |
|
Interest-bearing deposits with no stated maturity |
|
| 5,840,997 |
|
Total interest-bearing deposits |
| $ | 7,599,438 |
|
Note 1211 - Borrowings
Securities Sold Under Repurchase Agreements
Trustmark utilizes securities sold under repurchase agreements as a source of borrowing in connection with overnight repurchase agreements offered to commercial deposit customers by using its unencumbered investment securities as collateral. Trustmark accounts for its securities sold under repurchase agreements as secured borrowings in accordance with FASB ASC TopicSubtopic 860-30, “Transfers and Servicing – Secured Borrowing and Collateral.” Securities sold under repurchase agreements are stated at the amount of cash received in connection with the transaction. Trustmark monitors collateral levels on a continual basis and may be required to provide additional collateral based on the fair value of the underlying securities. Securities sold under repurchase agreements are secured by securities with a carrying amount of $200.9$61.6 million and $284.4$102.4 million at December 31, 20172023 and 2016,2022, respectively. As
120
ofAt both December 31, 2017,2023 and 2022, all repurchase agreements were short-term and consisted primarily of sweep repurchase arrangements, under which excess deposits are “swept” into overnight repurchase agreements with Trustmark.
117
The following table presents the securities sold under repurchase agreements by collateral pledged at December 31, 20172023 and 20162022 ($ in thousands):
|
| December 31, |
| |||||
|
| 2023 |
|
| 2022 |
| ||
Mortgage-backed securities |
|
|
|
|
|
| ||
Residential mortgage pass-through securities |
|
|
|
| ||||
Issued by FNMA and FHLMC |
| $ | 28,600 |
|
| $ | 41,732 |
|
Other residential mortgage-backed securities |
|
|
|
|
|
| ||
Issued or guaranteed by FNMA, FHLMC or GNMA |
|
| 526 |
|
|
| 1,111 |
|
Commercial mortgage-backed securities |
|
|
|
|
|
| ||
Issued or guaranteed by FNMA, FHLMC or GNMA |
|
| — |
|
|
| 21,277 |
|
Total securities sold under repurchase agreements |
| $ | 29,126 |
|
| $ | 64,120 |
|
Other Borrowings
|
| December 31, |
| |||||
|
| 2017 |
|
| 2016 |
| ||
Mortgage-backed securities |
|
|
|
|
|
|
|
|
Other residential mortgage-backed securities |
|
|
|
|
|
|
|
|
Issued or guaranteed by FNMA, FHLMC or GNMA |
| $ | 68,246 |
|
| $ | 75,795 |
|
Commercial mortgage-backed securities |
|
|
|
|
|
|
|
|
Issued or guaranteed by FNMA, FHLMC or GNMA |
|
| 50,448 |
|
|
| 51,212 |
|
Total securities sold under repurchase agreements |
| $ | 118,694 |
|
| $ | 127,007 |
|
Short-Term Borrowings
At December 31, 20172023 and 2016, short-term2022, other borrowings consisted of the following ($ in thousands):
|
| December 31, |
| |||||
|
| 2017 |
|
| 2016 |
| ||
FHLB advances |
| $ | 900,013 |
|
| $ | 700,008 |
|
Serviced GNMA loans eligible for repurchase |
|
| 48,211 |
|
|
| 43,925 |
|
Other |
|
| 22,825 |
|
|
| 25,845 |
|
Total short-term borrowings |
| $ | 971,049 |
|
| $ | 769,778 |
|
|
| December 31, |
| |||||
|
| 2023 |
|
| 2022 |
| ||
FHLB advances |
| $ | 400,058 |
|
| $ | 975,078 |
|
Serviced GNMA loans eligible for repurchase |
|
| 78,838 |
|
|
| 70,805 |
|
Finance lease liabilities |
|
| 4,334 |
|
|
| 5,055 |
|
Total other borrowings |
| $ | 483,230 |
|
| $ | 1,050,938 |
|
FHLB Advances
At December 31, 2017, Trustmark had four outstanding short-term FHLB advances totaling $900.0 million with the FHLB of Dallas. Two of these outstanding advances with the FHLB of Dallas had fixed interest rates 1.44% and 1.48% and balances of $250.0 million and $150.0 million, respectively. At December 31, 2017, these two fixed rate advances had a weighted-average remaining maturity of 58 days with a weighted-average cost of 1.45% during 2017. At December 31, 2017, Trustmark had two outstanding short-term FHLB advances with a balance of $250.0 million each with the FHLB of Dallas that reprice on a monthly basis and are set to mature on May 25, 2018 and October 19, 2018. These advances have a weighted-average remaining maturity of 219 days and had a weighted-average cost of 1.20% during 2017. Trustmark had three outstanding short-term FHLB advances totaling $700.0 million with the FHLB of Dallas at December 31, 2016. Two of these outstanding advances with the FHLB of Dallas had fixed interest rates of 0.55% and 0.80% and balances of $100.0 million each. At December 31, 2016, these two fixed rate advances had a weighted-average remaining maturity of seven days with a weighted-average cost of 0.68% during 2016. At December 31, 2016, Trustmark had one outstanding short-term FHLB advance with a balance of $500.0 million with the FHLB of Dallas that repriced on a monthly basis and matured on December 20, 2017.
At December 31, 2017 and 2016, Trustmark had $1.771 billion and $1.511 billion, respectively, available in additional short and long-term borrowing capacity from the FHLB of Dallas.
At both December 31, 20172023 and 2016, Trustmark had one outstanding short-term FHLB advance with the FHLB of Atlanta, which was assumed through the BancTrust merger. The short-term FHLB advance outstanding at December 31, 2017 had a balance of $13 thousand with a fixed interest rate of 6.12% and a remaining maturity of 72 days. The short-term FHLB advance outstanding at December 31, 2016 had a balance of $8 thousand with a fixed interest rate of 6.50% and a remaining maturity of 310 days. Trustmark has a non-member status and no additional borrowing capacity with the FHLB of Atlanta.
Interest expense on short-term FHLB advances totaled $11.4 million in 2017, $1.8 million in 2016 and $727 thousand in 2015.
Long-Term FHLB Advances
At December 31, 2017,2022, Trustmark had no outstanding long-termshort-term FHLB advances with the FHLB of Dallas. Atlanta.
At both December 31, 2016,2023 and 2022, Trustmark had one outstanding long-term FHLB advance with the FHLB of DallasAtlanta totaling $250.0 million. The long-term FHLB$58 thousand and $78 thousand, respectively. This advance outstanding at December 31, 2016 repriced onwas assumed through the BancTrust merger and had a monthly basis and is set to mature on May 25, 2018.fixed interest rate of 0.08%. At December 31, 2016,2023 and 2022, this advance had a remaining maturity of 1.42.71 years and had an average cost of 0.24% during 2016.
At December 31, 2017, Trustmark had two outstanding long-term FHLB advances totaling $946 thousand with the FHLB of Atlanta, compared to three outstanding long-term FHLB advances totaling $1.0 million with the FHLB of Atlanta at December 31, 2016. All of these advances were assumed through the BancTrust merger. The advances outstanding had fixed interest rates of 0.08% and 0.75% with outstanding balances of $171 thousand to $775 thousand at December 31, 2017. At December 31, 2017, these advances
121
had a weighted-average remaining maturity of 4.443.71 years, with a weighted-average cost of 0.63% during 2017. At December 31, 2016, the three outstanding long-term FHLB advances with the FHLB of Atlanta had interest rates ranging from 0.08% to 6.12% with outstanding balances ranging from $38 thousand to $800 thousand. At December 31, 2016, the outstanding long-term advances had a weighted-average remaining maturity of 5.32 years with a weighted-average cost of 0.82% during 2016.respectively. There was no fair market value adjustment associated with the BancTrust merger included in the long-term FHLB advances at December 31, 2017, compared to a fair mark value adjustment of $1 thousand at December 31, 2016.2023 and 2022. Trustmark’s long-term FHLB advances are collateralized by securities held in safekeeping with the FHLB of Atlanta.
At December 31, 2023, Trustmark had five outstanding short-term FHLB advances totaling $400.0 million and no long-term FHLB advances with the FHLB of Dallas, compared to four outstanding short-term FHLB advances totaling $975.0 million and no long-term FHLB advances with the FHLB of Dallas at December 31, 2022. The outstanding short-term advances with the FHLB of Dallas had fixed rates ranging from 5.38% and 5.61% with balances ranging from $50.0 million to $125.0 million. The outstanding short-term FHLB advances had a weighted-average remaining maturity of 9 days with a weighted-average cost of 5.54% at December 31, 2023, compared to a weighted-average remaining maturity of 10 days with a weighted-average cost of 4.58% at December 31, 2022.
Trustmark incurred $566$49.9 million of interest expense on short-term FHLB advances in 2023, compared to $4.8 million of interest expense in 2022 and $2 thousand of interest expense in 2021. Trustmark incurred no interest expense on long-term FHLB advances in 2017, compared2023, 2022 and 2021.
At December 31, 2023 and 2022, Trustmark had $4.003 billion and $3.034 billion, respectively, available in additional borrowing capacity from the FHLB of Dallas.
Subordinated Notes
During 2020, Trustmark agreed to $2.1issue and sell $125.0 million aggregate principal amount of its 3.625% Fixed-to-Floating Rate Subordinated Notes (the Notes) due December 1, 2030. The Notes were sold at an underwriting discount of 1.2%, resulting in net proceeds to Trustmark of $123.5 million before deducting offering expenses. At December 31, 2023 and 2022, the carrying amount of the Notes was $123.5 million and $123.3 million, respectively. The Notes are unsecured obligations and are subordinated in right of payment to all of Trustmark’s existing and future senior indebtedness, whether secured or unsecured. The Notes are obligations of Trustmark only and are not obligations of, and are not guaranteed by, any of its subsidiaries, including TNB. From the date of issuance until November 30, 2025, the Notes bear interest expenseat a fixed rate of 3.625% per year, payable semi-annually in 2016arrears on June 1 and $49 thousandDecember 1 of each year. Beginning December 1, 2025, the Notes will bear interest expenseat a floating rate per year equal to the Benchmark
118
rate, which is the Three-Month Term Secured Overnight Financing Rate (SOFR), plus 338.7 basis points, payable quarterly in 2015.arrears on March 1, June 1, September 1 and December 1 of each year. The Notes qualify as Tier 2 capital for Trustmark. The Notes may be redeemed at Trustmark’s option under certain circumstances. Trustmark intends to use the net proceeds for general corporate purposes.
Junior Subordinated Debt Securities
On August 18, 2006, Trustmark completed a private placement of $60.0 million of trust preferred securities through a newly formed Delaware trust affiliate, Trustmark Preferred Capital Trust I (the Trust). The trust preferred securities mature September 30, 2036, are redeemable at Trustmark’s option and bear interest at a variable rate per annum equal to the three-month LIBORChicago Mercantile Exchange, Inc. (CME) SOFR plus a spread adjustment of 0.26% and a margin of 1.72%. Under applicable regulatory guidelines, these trust preferred securities qualify as Tier 1 capital. The proceeds from the sale of the trust preferred securities were used by the Trust to purchase $61.9 million in aggregate principal amount of Trustmark’s junior subordinated debentures.
The debentures were issued pursuant to a Junior Subordinated Indenture, dated August 18, 2006, between Trustmark, as issuer, and Wilmington Trust Company, National Association, as trustee. Like the trust preferred securities, the debentures bear interest at a variable rate per annum equal to the three-month LIBORCME SOFR plus a spread adjustment of 0.26% and a margin of 1.72% and mature on September 30, 2036.2036. The debentures may be redeemed at Trustmark’s option at any time. The interest payments by Trustmark will be used to pay the quarterly distributions payable by the Trust to the holder of the trust preferred securities. However, so long as no event of default has occurred under the debentures, Trustmark may defer interest payments on the debentures (in which case the Trust will also defer distributions otherwise due on the trust preferred securities) for up to 20 consecutive quarters.
The debentures are subordinated to the prior payment of any other indebtedness of Trustmark that, by its terms, is not similarly subordinated. The trust preferred securities are recorded as a long-term liability on Trustmark’s balance sheet; however, for regulatory purposes the trust preferred securities are treated as Tier 1 capital under the rules of the FRB,Federal Reserve Board (FRB), Trustmark’s primary federal regulatory agency.
Trustmark also entered into a Guarantee Agreement, dated August 18, 2006, pursuant to which it has agreed to guarantee the payment by the Trust of distributions on the trust preferred securities and the payment of principal of the trust preferred securities when due, either at maturity or on redemption, but only if and to the extent that the Trust fails to pay distributions on or principal of the trust preferred securities after having received interest payments or principal payments on the junior subordinated debentures from Trustmark for the purpose of paying those distributions or the principal amount of the trust preferred securities.
As defined in applicable accounting standards, the Trust, a wholly-owned subsidiary of Trustmark, is considered a variable interest entity for which Trustmark is not the primary beneficiary. Accordingly, the accounts of the Trust are not included in Trustmark’s consolidated financial statements.
At both December 31, 20172023 and 2016,2022, assets for the Trust totaled $61.9 million, resulting from the investment in junior subordinated debentures issued by Trustmark. Liabilities and shareholder’sshareholders’ equity for the Trust also totaled $61.9 million at both December 31, 20172023 and 2016,2022, resulting from the issuance of trust preferred securities in the amount of $60.0 million as well as $1.9 million in common securities issued to Trustmark. During 2017,2023, net income for the Trust equaled $55$132 thousand resulting from interest income from the junior subordinated debt securities issued by Trustmark to the Trust, compared with net income of $45$66 thousand during 20162022 and $38$36 thousand during 2015.2021. Dividends issued to Trustmark by the Trust during 20172023 totaled $55$132 thousand, compared to $45$66 thousand during 20162022 and $38$36 thousand during 2015.2021.
119
Note 12 – Revenue from Contracts with Customers
The following table presents noninterest income disaggregated by reportable operating segment and revenue stream for the periods presented ($ in thousands):
|
| Year Ended December 31, 2023 |
|
| Year Ended December 31, 2022 |
|
| Year Ended December 31, 2021 |
| |||||||||||||||||||||||||||
|
| Topic 606 |
|
| Not Topic |
|
| Total |
|
| Topic 606 |
|
| Not Topic |
|
| Total |
|
| Topic 606 |
|
| Not Topic |
|
| Total |
| |||||||||
General Banking |
|
|
|
|
|
|
|
|
|
|
|
|
|
|
|
|
|
|
|
|
|
|
|
|
|
|
| |||||||||
Service charges on |
| $ | 43,329 |
|
| $ | — |
|
| $ | 43,329 |
|
| $ | 42,073 |
|
| $ | — |
|
| $ | 42,073 |
|
| $ | 33,169 |
|
| $ | — |
|
| $ | 33,169 |
|
Bank card and other fees |
|
| 30,387 |
|
|
| 2,995 |
|
|
| 33,382 |
|
|
| 31,474 |
|
|
| 4,584 |
|
|
| 36,058 |
|
|
| 30,897 |
|
|
| 3,727 |
|
|
| 34,624 |
|
Mortgage banking, net |
|
| — |
|
|
| 26,216 |
|
|
| 26,216 |
|
|
| — |
|
|
| 28,306 |
|
|
| 28,306 |
|
|
| — |
|
|
| 63,750 |
|
|
| 63,750 |
|
Wealth management |
|
| 838 |
|
|
| — |
|
|
| 838 |
|
|
| 639 |
|
|
| — |
|
|
| 639 |
|
|
| 48 |
|
|
| — |
|
|
| 48 |
|
Other, net |
|
| 11,769 |
|
|
| (2,076 | ) |
|
| 9,693 |
|
|
| 8,469 |
|
|
| 805 |
|
|
| 9,274 |
|
|
| 6,621 |
|
|
| (338 | ) |
|
| 6,283 |
|
Security gains (losses), |
|
| — |
|
|
| 39 |
|
|
| 39 |
|
|
| — |
|
|
| — |
|
|
| — |
|
|
| — |
|
|
| — |
|
|
| — |
|
Total noninterest |
| $ | 86,323 |
|
| $ | 27,174 |
|
| $ | 113,497 |
|
| $ | 82,655 |
|
| $ | 33,695 |
|
| $ | 116,350 |
|
| $ | 70,735 |
|
| $ | 67,139 |
|
| $ | 137,874 |
|
|
|
|
|
|
|
|
|
|
|
|
|
|
|
|
|
|
|
|
|
|
|
|
|
|
|
|
| |||||||||
Wealth Management |
|
|
|
|
|
|
|
|
|
|
|
|
|
|
|
|
|
|
|
|
|
|
|
|
|
|
| |||||||||
Service charges on |
| $ | 87 |
|
| $ | — |
|
| $ | 87 |
|
| $ | 84 |
|
| $ | — |
|
| $ | 84 |
|
| $ | 77 |
|
| $ | — |
|
| $ | 77 |
|
Bank card and other fees |
|
| 57 |
|
|
| — |
|
|
| 57 |
|
|
| 47 |
|
|
| — |
|
|
| 47 |
|
|
| 38 |
|
|
| — |
|
|
| 38 |
|
Wealth management |
|
| 34,254 |
|
|
| — |
|
|
| 34,254 |
|
|
| 34,374 |
|
|
| — |
|
|
| 34,374 |
|
|
| 35,142 |
|
|
| — |
|
|
| 35,142 |
|
Other, net |
|
| 162 |
|
|
| 376 |
|
|
| 538 |
|
|
| 528 |
|
|
| 39 |
|
|
| 567 |
|
|
| 130 |
|
|
| 33 |
|
|
| 163 |
|
Total noninterest |
| $ | 34,560 |
|
| $ | 376 |
|
| $ | 34,936 |
|
| $ | 35,033 |
|
| $ | 39 |
|
| $ | 35,072 |
|
| $ | 35,387 |
|
| $ | 33 |
|
| $ | 35,420 |
|
|
|
|
|
|
|
|
|
|
|
|
|
|
|
|
|
|
|
|
|
|
|
|
|
|
|
|
| |||||||||
Insurance Segment |
|
|
|
|
|
|
|
|
|
|
|
|
|
|
|
|
|
|
|
|
|
|
|
|
|
|
| |||||||||
Insurance commissions |
| $ | 57,569 |
|
| $ | — |
|
| $ | 57,569 |
|
| $ | 53,721 |
|
| $ | — |
|
| $ | 53,721 |
|
| $ | 48,511 |
|
| $ | — |
|
| $ | 48,511 |
|
Other, net |
|
| 956 |
|
|
| — |
|
|
| 956 |
|
|
| 1 |
|
|
| — |
|
|
| 1 |
|
|
| 105 |
|
|
| — |
|
|
| 105 |
|
Total noninterest |
| $ | 58,525 |
|
| $ | — |
|
| $ | 58,525 |
|
| $ | 53,722 |
|
| $ | — |
|
| $ | 53,722 |
|
| $ | 48,616 |
|
| $ | — |
|
| $ | 48,616 |
|
|
|
|
|
|
|
|
|
|
|
|
|
|
|
|
|
|
|
|
|
|
|
|
|
|
|
|
| |||||||||
Consolidated |
|
|
|
|
|
|
|
|
|
|
|
|
|
|
|
|
|
|
|
|
|
|
|
|
|
|
| |||||||||
Service charges on |
| $ | 43,416 |
|
| $ | — |
|
| $ | 43,416 |
|
| $ | 42,157 |
|
| $ | — |
|
| $ | 42,157 |
|
| $ | 33,246 |
|
| $ | — |
|
| $ | 33,246 |
|
Bank card and other fees |
|
| 30,444 |
|
|
| 2,995 |
|
|
| 33,439 |
|
|
| 31,521 |
|
|
| 4,584 |
|
|
| 36,105 |
|
|
| 30,935 |
|
|
| 3,727 |
|
|
| 34,662 |
|
Mortgage banking, net |
|
| — |
|
|
| 26,216 |
|
|
| 26,216 |
|
|
| — |
|
|
| 28,306 |
|
|
| 28,306 |
|
|
| — |
|
|
| 63,750 |
|
|
| 63,750 |
|
Insurance commissions |
|
| 57,569 |
|
|
| — |
|
|
| 57,569 |
|
|
| 53,721 |
|
|
| — |
|
|
| 53,721 |
|
|
| 48,511 |
|
|
| — |
|
|
| 48,511 |
|
Wealth management |
|
| 35,092 |
|
|
| — |
|
|
| 35,092 |
|
|
| 35,013 |
|
|
| — |
|
|
| 35,013 |
|
|
| 35,190 |
|
|
| — |
|
|
| 35,190 |
|
Other, net |
|
| 12,887 |
|
|
| (1,700 | ) |
|
| 11,187 |
|
|
| 8,998 |
|
|
| 844 |
|
|
| 9,842 |
|
|
| 6,856 |
|
|
| (305 | ) |
|
| 6,551 |
|
Security gains (losses), |
|
| — |
|
|
| 39 |
|
|
| 39 |
|
|
| — |
|
|
| — |
|
|
| — |
|
|
| — |
|
|
| — |
|
|
| — |
|
Total noninterest |
| $ | 179,408 |
|
| $ | 27,550 |
|
| $ | 206,958 |
|
| $ | 171,410 |
|
| $ | 33,734 |
|
| $ | 205,144 |
|
| $ | 154,738 |
|
| $ | 67,172 |
|
| $ | 221,910 |
|
120
122
The income tax provision included in the consolidated statements of income was as follows for the periods presented ($ in thousands):
|
| Years Ended December 31, |
| |||||||||
|
| 2023 |
|
| 2022 |
|
| 2021 |
| |||
Current |
|
|
|
|
|
|
|
|
| |||
Federal |
| $ | 29,450 |
|
| $ | 15,377 |
|
| $ | 5,815 |
|
State |
|
| 7,197 |
|
|
| 3,283 |
|
|
| 2,118 |
|
Deferred |
|
|
|
|
|
|
|
|
| |||
Federal |
|
| (3,840 | ) |
|
| (13,440 | ) |
|
| 16,092 |
|
State |
|
| (960 | ) |
|
| (3,360 | ) |
|
| 4,023 |
|
Income tax provision |
| $ | 31,847 |
|
| $ | 1,860 |
|
| $ | 28,048 |
|
|
| Years Ended December 31, |
| |||||||||
Current |
| 2017 |
|
| 2016 |
|
| 2015 |
| |||
Federal |
| $ | 16,959 |
|
| $ | 10,355 |
|
| $ | 18,448 |
|
State |
|
| 5,687 |
|
|
| 2,698 |
|
|
| 2,166 |
|
Deferred |
|
|
|
|
|
|
|
|
|
|
|
|
Federal |
|
| 7,280 |
|
|
| 15,647 |
|
|
| 12,865 |
|
State |
|
| 1,820 |
|
|
| 2,353 |
|
|
| 1,935 |
|
Income tax provision excluding deferred tax asset |
|
|
|
|
|
|
|
|
|
|
|
|
revaluation and reversal of valuation allowance |
|
| 31,746 |
|
|
| 31,053 |
|
|
| 35,414 |
|
|
|
|
|
|
|
|
|
|
|
|
|
|
Deferred tax expense (benefit) - re-measurement of deferred tax assets |
|
| 25,619 |
|
|
| — |
|
|
| — |
|
Deferred tax expense (benefit) - reversal of valuation allowance |
|
| (8,650 | ) |
|
| — |
|
|
| — |
|
Income tax provision |
| $ | 48,715 |
|
| $ | 31,053 |
|
| $ | 35,414 |
|
Trustmark maintained a valuation allowance for deferred tax assets of $8.7 million at December 31, 2016 that was related to unrealized built-in losses from a prior acquisition. Trustmark has determined that based on the weight of the available evidence that it is more likely than not that all deferred tax assets will be realized as of December 31, 2017. Therefore, the valuation allowance was reversed as of December 31, 2017, resulting in a decrease of $8.7 million to income tax expense for the year.
The re-measurement of the deferred tax assets and liabilities during 2017 resulted from the enactment of the Tax Reform Act, which was signed into law on December 22, 2017. Under the Tax Reform Act, corporate statutory income tax rates were reduced from 35.0% to 21.0% effective January 1, 2018. Trustmark re-measured its deferred tax assets and liabilities to reflect the future realization of these assets and liabilities at the lower tax rate. This re-measurement resulted in an increase to tax expense and a decrease to the net deferred tax asset of $25.6 million for the year ended December 31, 2017.
For the periods presented, the income tax provision differs from the amount computed by applying the statutory federal income tax rate of 35.0%in effect for each respective period to income before income taxes as a result of the following ($ in thousands):
|
| Years Ended December 31, |
| |||||||||
|
| 2023 |
|
| 2022 |
|
| 2021 |
| |||
Income tax computed at statutory tax rate |
| $ | 41,441 |
|
| $ | 15,487 |
|
| $ | 36,837 |
|
Tax exempt interest |
|
| (5,521 | ) |
|
| (4,419 | ) |
|
| (3,935 | ) |
Nondeductible interest expense |
|
| 2,104 |
|
|
| 271 |
|
|
| 106 |
|
State income taxes, net |
|
| 5,686 |
|
|
| 2,596 |
|
|
| 1,673 |
|
Income tax credits, net |
|
| (11,904 | ) |
|
| (10,071 | ) |
|
| (10,479 | ) |
Death benefit gains |
|
| (80 | ) |
|
| (287 | ) |
|
| (175 | ) |
Other |
|
| 121 |
|
|
| (1,717 | ) |
|
| 4,021 |
|
Income tax provision |
| $ | 31,847 |
|
| $ | 1,860 |
|
| $ | 28,048 |
|
|
| Years Ended December 31, |
| |||||||||
|
| 2017 |
|
| 2016 |
|
| 2015 |
| |||
Income tax computed at statutory tax rate |
| $ | 54,021 |
|
| $ | 48,812 |
|
| $ | 53,008 |
|
Tax exempt interest |
|
| (7,611 | ) |
|
| (6,780 | ) |
|
| (5,908 | ) |
Nondeductible interest expense |
|
| 407 |
|
|
| 201 |
|
|
| 119 |
|
State income taxes, net |
|
| 3,697 |
|
|
| 1,754 |
|
|
| 1,408 |
|
Income tax credits, net |
|
| (15,793 | ) |
|
| (16,183 | ) |
|
| (15,283 | ) |
Death benefit gains |
|
| (3,268 | ) |
|
| — |
|
|
| — |
|
Reversal of valuation allowance |
|
| (8,650 | ) |
|
| — |
|
|
| — |
|
Re-measurement of deferred tax assets |
|
| 25,619 |
|
|
| — |
|
|
| — |
|
Other |
|
| 293 |
|
|
| 3,249 |
|
|
| 2,070 |
|
Income tax provision |
| $ | 48,715 |
|
| $ | 31,053 |
|
| $ | 35,414 |
|
123
Temporary differences between the financial statement carrying amounts and the tax basis of assets and liabilities gave rise to the following net deferred tax assets at December 31, 20172023 and 2016,2022, which are included in other assets on the accompanying consolidated balance sheets ($ in thousands):
|
| December 31, |
| |||||
|
| 2023 |
|
| 2022 |
| ||
Deferred tax assets: |
|
|
|
|
|
| ||
Litigation losses |
| $ | 26,647 |
|
| $ | 25,187 |
|
Other real estate |
|
| 1,743 |
|
|
| 70 |
|
Accumulated credit losses |
|
| 43,473 |
|
|
| 39,370 |
|
Deferred compensation |
|
| 17,893 |
|
|
| 17,695 |
|
Finance and operating lease liabilities |
|
| 11,426 |
|
|
| 10,997 |
|
Realized built-in losses |
|
| 8,429 |
|
|
| 9,180 |
|
Securities |
|
| 68,223 |
|
|
| 84,813 |
|
Pension and other postretirement benefit plans |
|
| 2,025 |
|
|
| 1,931 |
|
Interest on nonaccrual loans |
|
| 1,218 |
|
|
| 1,159 |
|
LHFS |
|
| 777 |
|
|
| 205 |
|
Stock-based compensation |
|
| 3,196 |
|
|
| 2,647 |
|
Derivatives |
|
| 2,993 |
|
|
| 5,056 |
|
Other |
|
| 10,543 |
|
|
| 10,038 |
|
Gross deferred tax asset |
|
| 198,586 |
|
|
| 208,348 |
|
|
|
|
|
|
|
| ||
Deferred tax liabilities: |
|
|
|
|
|
| ||
Goodwill and other identifiable intangibles |
|
| 14,297 |
|
|
| 14,378 |
|
Premises and equipment |
|
| 17,382 |
|
|
| 15,978 |
|
Finance and operating lease right-of-use assets |
|
| 10,420 |
|
|
| 10,209 |
|
MSR |
|
| 26,271 |
|
|
| 24,452 |
|
Securities |
|
| 3,181 |
|
|
| 2,069 |
|
Other |
|
| 2,264 |
|
|
| 2,876 |
|
Gross deferred tax liability |
|
| 73,815 |
|
|
| 69,962 |
|
Net deferred tax asset |
| $ | 124,771 |
|
| $ | 138,386 |
|
|
| December 31, |
| |||||
|
| 2017 |
|
| 2016 |
| ||
Deferred tax assets: |
|
|
|
|
|
|
|
|
Loan purchase accounting |
| $ | 3,638 |
|
| $ | 9,341 |
|
Other real estate |
|
| 13,403 |
|
|
| 25,750 |
|
Allowance for loan losses |
|
| 20,203 |
|
|
| 31,618 |
|
Deferred compensation |
|
| 15,184 |
|
|
| 21,893 |
|
Realized built-in losses |
|
| 12,932 |
|
|
| 18,699 |
|
Securities |
|
| 4,869 |
|
|
| 9,256 |
|
Pension and other postretirement benefit plans |
|
| 5,453 |
|
|
| 15,545 |
|
Interest on nonaccrual loans |
|
| 774 |
|
|
| 2,093 |
|
Unrealized losses on securities available for sale |
|
| 5,874 |
|
|
| 3,629 |
|
Stock-based compensation |
|
| 2,067 |
|
|
| 3,031 |
|
Federal carryovers |
|
| 4,569 |
|
|
| — |
|
Other |
|
| 8,964 |
|
|
| 13,731 |
|
Gross deferred tax asset |
|
| 97,930 |
|
|
| 154,586 |
|
Valuation allowance |
|
| — |
|
|
| (8,650 | ) |
Deferred tax asset net of valuation allowance |
|
| 97,930 |
|
|
| 145,936 |
|
|
|
|
|
|
|
|
|
|
Deferred tax liabilities: |
|
|
|
|
|
|
|
|
Goodwill and other identifiable intangibles |
|
| 16,729 |
|
|
| 25,666 |
|
Premises and equipment |
|
| 11,877 |
|
|
| 19,391 |
|
Mortgage servicing rights |
|
| 9,964 |
|
|
| 12,159 |
|
Securities |
|
| 1,345 |
|
|
| 1,697 |
|
Leases |
|
| — |
|
|
| 60 |
|
Other |
|
| 5,040 |
|
|
| 6,891 |
|
Gross deferred tax liability |
|
| 44,955 |
|
|
| 65,864 |
|
Net deferred tax asset |
| $ | 52,975 |
|
| $ | 80,072 |
|
121
Trustmark has completed its accounting for the effects of the Tax Reform Act on its deferred tax assets and liabilities. In the course of normal operations, Trustmark is required to make reasonable estimates for certain tax items which could not be fully determined at year-end, but will be finalized when its tax return is filed in October 2018. However, Trustmark does not believe that any adjustments resulting from the finalization of the tax return will have a material impact on its financial statements.
The following table provides a summary of the changes during the 2017 calendar yearyears presented in the amount of unrecognized tax benefits that are included in other liabilities in the consolidated balance sheet ($ in thousands):
Balance at January 1, 2017 |
| $ | 1,734 |
|
Increases due to tax positions taken during the current year |
|
| 303 |
|
Decreases due to tax positions taken during a prior year |
|
| (853 | ) |
Decreases due to the lapse of applicable statute of limitations during the current year |
|
| (79 | ) |
Decreases due to settlements with taxing authorities during the current year |
|
| — |
|
Balance at December 31, 2017 |
| $ | 1,105 |
|
|
|
|
|
|
Accrued interest, net of federal benefit, at December 31, 2017 |
| $ | 217 |
|
|
|
|
|
|
Unrecognized tax benefits that would impact the effective tax rate, if recognized, at December 31, 2017 |
| $ | 883 |
|
|
| December 31, |
| |||||||||
|
| 2023 |
|
| 2022 |
|
| 2021 |
| |||
Balance at beginning of period |
| $ | 2,316 |
|
| $ | 2,129 |
|
| $ | 1,781 |
|
Change due to tax positions taken during the current year |
|
| 1,333 |
|
|
| 653 |
|
|
| 412 |
|
Change due to tax positions taken during a prior year |
|
| (426 | ) |
|
| (266 | ) |
|
| 107 |
|
Change due to the lapse of applicable statute of limitations during the |
|
| (359 | ) |
|
| (200 | ) |
|
| (171 | ) |
Balance at end of period |
| $ | 2,864 |
|
| $ | 2,316 |
|
| $ | 2,129 |
|
|
|
|
|
|
|
|
|
|
| |||
Accrued interest, net of federal benefit |
| $ | 470 |
|
| $ | 489 |
|
| $ | 419 |
|
|
|
|
|
|
|
|
|
|
| |||
Unrecognized tax benefits that would impact the effective |
| $ | 2,518 |
|
| $ | 1,948 |
|
| $ | 1,766 |
|
Interest and penalties related to unrecognized tax benefits, if any, are recorded in income tax expense. With limited exception, Trustmark is no longer subject to U.S. federal, state and local audits by tax authorities for 20112017 and earlier tax years. Trustmark does not anticipate a significant change to the total amount of unrecognized tax benefits within the next twelve months.
124
Note 14 – Defined Benefit and Other Postretirement Benefits
Qualified Pension PlansPlan
Trustmark Capital Accumulation Plan
Trustmark maintainedmaintains a noncontributory tax-qualified defined benefit pension plan titled the Trustmark Capital Accumulation Plan (the “Plan”) in which substantially all associates who began employment prior to 2007 participated. The Plan provided for retirement benefits based on the length of credited service and final average compensation, as defined in the Plan, which vested upon three years of service. Benefit accruals under the Plan were frozen in 2009, with the exception of benefit accruals for certain employees of acquired financial institutions covered through plans that were subsequently merged into the Plan. Other than certain employees of acquired financial institutions, associates have not earned additional benefits, except for interest as required by law, since the Plan was frozen. Current and former associates who participated in the Plan retained their right to receive benefits that accrued before the Plan was frozen. As previously reported, on July 26, 2016 the Board of Directors of Trustmark authorized the termination of the Plan, effective as of December 31, 2016. As a result of the termination of the Plan, each participant became fully vested in their accrued benefits under the Plan.
During the second quarter of 2017, Trustmark fully funded the Plan on a termination basis by contributing additional assets in the amount of $17.6 million in accordance with Internal Revenue Service (IRS) and Pension Benefit Guaranty Corporation requirements. Participants in the Plan elected to receive either a lump sum cash payment or annuity payments under a group annuity contract purchased from an insurance carrier. Final distributions were made to participants from plan assets and a one-time pension settlement expense was recognized totaling $17.6 million.
Trustmark Corporation Pension Plan for Certain Employees of Acquired Financial Institutions
To satisfy commitments made by Trustmark to associates covered through plans obtained in acquisitions and subsequently merged into the Plan (collectively, the “Continuing Associates”), on July 26, 2016, the Board of Directors of Trustmark also approved the spin-off of the portion of the Plan associated with the accrued benefits of the Continuing Associates into a new plan titled the Trustmark Corporation Pension Plan for Certain Employees of Acquired Financial Institutions (the “Continuing Plan”), effective as of December 30, 2016, immediately priorContinuing Plan) to the termination of the Plan.satisfy commitments made by Trustmark to associates covered through plans obtained in acquisitions.
122
The following tables present information regarding the benefit obligation, plan assets, funded status, amounts recognized in accumulated other comprehensive loss, net periodic benefit cost and other statistical disclosures for Trustmark’s tax-qualified defined benefit pension plans (thethe Continuing Plan and the Plan) for the periods presented ($ in thousands):
|
| December 31, |
|
| December 31, |
| ||||||||||
|
| 2017 |
|
| 2016 |
|
| 2023 |
|
| 2022 |
| ||||
Change in benefit obligation: |
|
|
|
|
|
|
|
|
|
|
|
|
| |||
Benefit obligation, beginning of year |
| $ | 75,900 |
|
| $ | 91,403 |
|
| $ | 6,907 |
|
| $ | 8,647 |
|
Service cost |
|
| 253 |
|
|
| 428 |
|
|
| 52 |
|
|
| 115 |
|
Interest cost |
|
| 1,461 |
|
|
| 3,355 |
|
|
| 292 |
|
|
| 192 |
|
Actuarial loss (gain) |
|
| 391 |
|
|
| (893 | ) | ||||||||
Benefits paid for the Plan |
|
| (68,583 | ) |
|
| (18,393 | ) | ||||||||
Settlement loss |
|
| 680 |
|
|
| — |
| ||||||||
Actuarial (gain) loss |
|
| 164 |
|
|
| (1,882 | ) | ||||||||
Benefits paid |
|
| (1,492 | ) |
|
| (165 | ) | ||||||||
Benefit obligation, end of year |
| $ | 10,102 |
|
| $ | 75,900 |
|
| $ | 5,923 |
|
| $ | 6,907 |
|
|
|
|
|
|
|
|
|
|
|
|
|
|
|
| ||
Change in plan assets: |
|
|
|
|
|
|
|
|
|
|
|
|
|
| ||
Fair value of plan assets, beginning of year |
| $ | 54,734 |
|
| $ | 74,137 |
|
| $ | 2,907 |
|
| $ | 2,900 |
|
Actual return on plan assets |
|
| 481 |
|
|
| (1,079 | ) |
|
| 237 |
|
|
| (285 | ) |
Employer contributions |
|
| 17,964 |
|
|
| 69 |
|
|
| 751 |
|
|
| 457 |
|
Benefit payments for the Plan |
|
| (68,583 | ) |
|
| (18,393 | ) | ||||||||
Benefit payments |
|
| (1,492 | ) |
|
| (165 | ) | ||||||||
Fair value of plan assets, end of year |
| $ | 4,596 |
|
| $ | 54,734 |
|
| $ | 2,403 |
|
| $ | 2,907 |
|
|
|
|
|
|
|
|
|
|
|
|
|
|
|
| ||
Funded status at end of year - net liability |
| $ | (5,506 | ) |
| $ | (21,166 | ) |
| $ | (3,520 | ) |
| $ | (4,000 | ) |
|
|
|
|
|
|
|
|
|
|
|
|
|
|
| ||
Amounts recognized in accumulated other comprehensive loss: |
|
|
|
|
|
|
|
|
|
|
|
|
|
| ||
Net loss - amount recognized |
| $ | 3,187 |
|
| $ | 21,355 |
| ||||||||
Net (gain) loss - amount recognized |
| $ | (262 | ) |
| $ | (271 | ) | ||||||||
|
|
|
|
|
| |||||||||||
Actuarial (gain) loss included in benefit obligation: |
|
|
|
|
| |||||||||||
Change in discount rate |
| $ | 124 |
|
| $ | (2,174 | ) | ||||||||
Change in mortality table |
|
| (38 | ) |
|
| — |
| ||||||||
Other |
|
| 78 |
|
|
| 292 |
| ||||||||
Actuarial (gain) loss |
| $ | 164 |
|
| $ | (1,882 | ) | ||||||||
|
| Years Ended December 31, |
| |||||||||
|
| 2023 |
|
| 2022 |
|
| 2021 |
| |||
Net periodic benefit cost: |
|
|
|
|
|
|
|
|
| |||
Service cost |
| $ | 52 |
|
| $ | 115 |
|
| $ | 252 |
|
Interest cost |
|
| 292 |
|
|
| 192 |
|
|
| 173 |
|
Expected return on plan assets |
|
| (107 | ) |
|
| (121 | ) |
|
| (130 | ) |
Recognized net loss due to lump sum settlements |
|
| 25 |
|
|
| — |
|
|
| 183 |
|
Recognized net actuarial loss |
|
| — |
|
|
| 224 |
|
|
| 594 |
|
Net periodic benefit cost |
| $ | 262 |
|
| $ | 410 |
|
| $ | 1,072 |
|
|
|
|
|
|
|
|
|
|
| |||
Other changes in plan assets and benefit obligation recognized in other |
|
|
|
|
|
|
|
|
| |||
Net loss - Total recognized in other comprehensive income (loss) |
| $ | 9 |
|
| $ | (1,699 | ) |
| $ | (1,136 | ) |
Total recognized in net periodic benefit cost and other comprehensive |
| $ | 271 |
|
| $ | (1,289 | ) |
| $ | (64 | ) |
|
|
|
|
|
|
|
|
|
| |||
Weighted-average assumptions as of end of year: |
|
|
|
|
|
|
|
|
| |||
Discount rate for benefit obligation |
|
| 4.67 | % |
|
| 4.88 | % |
|
| 2.41 | % |
Discount rate for net periodic benefit cost |
|
| 4.88 | % |
|
| 2.41 | % |
|
| 1.95 | % |
Expected long-term return on plan assets |
|
| 5.00 | % |
|
| 5.00 | % |
|
| 5.00 | % |
125
123
| Years Ended December 31, |
| ||||||||||
|
| 2017 |
|
| 2016 |
|
| 2015 |
| |||
Net periodic benefit cost: |
|
|
|
|
|
|
|
|
|
|
|
|
Service cost |
| $ | 253 |
|
| $ | 428 |
|
| $ | 513 |
|
Interest cost |
|
| 1,461 |
|
|
| 3,355 |
|
|
| 3,461 |
|
Expected return on plan assets |
|
| (317 | ) |
|
| (2,897 | ) |
|
| (5,187 | ) |
Recognized net loss due to defined benefit plan termination |
|
| 17,662 |
|
|
| — |
|
|
| — |
|
Recognized net loss due to lump sum settlements |
|
| — |
|
|
| 3,906 |
|
|
| 2,221 |
|
Recognized net actuarial loss |
|
| 1,414 |
|
|
| 2,749 |
|
|
| 3,878 |
|
Net periodic benefit cost |
| $ | 20,473 |
|
| $ | 7,541 |
|
| $ | 4,886 |
|
|
|
|
|
|
|
|
|
|
|
|
|
|
Other changes in plan assets and benefit obligation recognized in other comprehensive income (loss), before taxes: |
|
|
|
|
|
|
|
|
|
|
|
|
Net loss - Total recognized in other comprehensive income (loss) |
| $ | (18,168 | ) |
| $ | (3,572 | ) |
| $ | (3,173 | ) |
Total recognized in net periodic benefit cost and other comprehensive income (loss) |
| $ | 2,305 |
|
| $ | 3,969 |
|
| $ | 1,713 |
|
|
|
|
|
|
|
|
|
|
|
|
|
|
Weighted-average assumptions as of end of year: |
|
|
|
|
|
|
|
|
|
|
|
|
Discount rate for benefit obligation |
|
| 3.32 | % |
|
| 3.71 | % |
|
| 3.86 | % |
Discount rate for net periodic benefit cost |
|
| 3.71 | % |
|
| 3.86 | % |
|
| 3.57 | % |
Expected long-term return on plan assets |
|
| 5.00 | % |
|
| 4.25 | % |
|
| 7.00 | % |
Plan Assets
The weighted-average asset allocations by asset category are presented below for the Continuing Plan at December 31, 20172023 and 2016, and for the Plan at December 31, 2016. No assets remained in the Plan at December 31, 2017. 2022.
|
| December 31, |
|
| December 31, |
| ||||||||||
|
| 2017 |
|
| 2016 |
|
| 2023 |
|
| 2022 |
| ||||
Money market fund |
|
| 6.0 | % |
|
| 13.0 | % |
|
| 27.0 | % |
|
| 7.0 | % |
U.S. Treasuries |
|
| — |
|
|
| 87.0 | % | ||||||||
Exchange traded funds: |
|
|
|
|
|
|
|
|
|
|
|
|
|
| ||
Equity securities |
|
| 48.0 | % |
|
| — |
|
|
| 36.0 | % |
|
| 47.0 | % |
Fixed income |
|
| 32.0 | % |
|
| — |
|
|
| 28.0 | % |
|
| 39.0 | % |
International |
|
| 14.0 | % |
|
| — |
|
|
| 9.0 | % |
|
| 7.0 | % |
Total |
|
| 100.0 | % |
|
| 100.0 | % |
|
| 100.0 | % |
|
| 100.0 | % |
The strategic objective of the investments of the assets in the Continuing Plan aims to provide long-term capital growth with moderate income. The allocation is managed on a total return basis with the average participant age in mind. It is constructed with an intermediate investment time frame with a moderate to high risk tolerance or a long-term investment time frame with a low to moderate risk tolerance. The plan allocation is typically balanced between equity and fixed income. The equity exposure has the potential to earn a return greater than inflation while the fixed income exposure may reduce the risk and volatility of the portfolio to which the equity allocation contributes.
The strategic objective of the investments of the assets in the Plan was changed significantly after the decision to terminate the Plan. The Plan was no longer managed on a total return basis. The Plan was managed with as little market value fluctuation as possible. Given the known fixed actuarial discount rate used until termination to match liabilities, the asset allocation of the Plan was changed to reflect a very conservative posture. Money market and individual U.S. Treasury securities were used solely to maintain a stable market value and achieve a small level of interest income. The Treasury securities matured at or before the projected distribution date. Similarly, a money market allocation was maintained for liquidity purposes due to monthly reoccurring distributions and lump sum distributions until final termination.
Fair Value Measurements
At this time, Trustmark presents no fair values that are derived through internal modeling. Should positions requiring fair valuation arise that are not relevant to existing methodologies, Trustmark will make every reasonable effort to obtain market participant assumptions, or independent evaluation.
126
The following table setstables set forth by level, within the fair value hierarchy, the Continuing Plan’s assets measured at fair value at December 31, 20172023 and 2016 and the Plan’s assets at December 31, 20162022 ($ in thousands):
|
| December 31, 2023 |
| |||||||||||||
|
| Total |
|
| Level 1 |
|
| Level 2 |
|
| Level 3 |
| ||||
Money market fund |
| $ | 643 |
|
| $ | 643 |
|
| $ | — |
|
| $ | — |
|
Exchange traded funds: |
|
|
|
|
|
|
|
|
|
|
|
| ||||
Equity securities |
|
| 861 |
|
|
| 861 |
|
|
| — |
|
|
| — |
|
Fixed income |
|
| 690 |
|
|
| 690 |
|
|
| — |
|
|
| — |
|
International |
|
| 209 |
|
|
| 209 |
|
|
| — |
|
|
| — |
|
Total assets at fair value |
| $ | 2,403 |
|
| $ | 2,403 |
|
| $ | — |
|
| $ | — |
|
|
| December 31, 2022 |
| |||||||||||||
|
| Total |
|
| Level 1 |
|
| Level 2 |
|
| Level 3 |
| ||||
Money market fund |
| $ | 203 |
|
| $ | 203 |
|
| $ | — |
|
| $ | — |
|
Exchange traded funds: |
|
|
|
|
|
|
|
|
|
|
|
| ||||
Equity securities |
|
| 1,379 |
|
|
| 1,379 |
|
|
| — |
|
|
| — |
|
Fixed income |
|
| 1,135 |
|
|
| 1,135 |
|
|
| — |
|
|
| — |
|
International |
|
| 190 |
|
|
| 190 |
|
|
| — |
|
|
| — |
|
Total assets at fair value |
| $ | 2,907 |
|
| $ | 2,907 |
|
| $ | — |
|
| $ | — |
|
|
| December 31, 2017 |
| |||||||||||||
|
| Total |
|
| Level 1 |
|
| Level 2 |
|
| Level 3 |
| ||||
Money market fund |
| $ | 269 |
|
| $ | 269 |
|
| $ | — |
|
| $ | — |
|
Exchange traded funds: |
|
|
|
|
|
|
|
|
|
|
|
|
|
|
|
|
Equity securities |
|
| 2,199 |
|
|
| 2,199 |
|
|
| — |
|
|
| — |
|
Fixed income |
|
| 1,462 |
|
|
| 1,462 |
|
|
| — |
|
|
| — |
|
International |
|
| 666 |
|
|
| 666 |
|
|
| — |
|
|
| — |
|
Total assets at fair value |
| $ | 4,596 |
|
| $ | 4,596 |
|
| $ | — |
|
| $ | — |
|
|
| December 31, 2016 |
| |||||||||||||
|
| Total |
|
| Level 1 |
|
| Level 2 |
|
| Level 3 |
| ||||
Money market fund |
| $ | 6,859 |
|
| $ | 6,859 |
|
| $ | — |
|
| $ | — |
|
U.S. Treasuries |
|
| 47,875 |
|
|
| 47,875 |
|
|
| — |
|
|
| — |
|
Total assets at fair value |
| $ | 54,734 |
|
| $ | 54,734 |
|
| $ | — |
|
| $ | — |
|
There have been no changes in the methodologies used in estimating the fair value of plan assets at December 31, 2017.2023. The money market fund approximates fair value due to its immediate maturity.
The preceding methods described may produce a fair value calculation that may not be indicative of net realizable value or reflective of future fair values. Furthermore, although Trustmark believes their valuation methods are appropriate and consistent with other market participants, the use of different methodologies or assumptions to determine the fair value of certain financial instruments could result in a different fair value measurement at the reporting date.
Contributions
The range of potential contributions to the Continuing Plan is determined annually by the Continuing Plan’s actuary in accordance with applicable IRS rules and regulations. Trustmark’s policy is to fund amounts that are sufficient to satisfy the annual minimum funding requirements and do not exceed the maximum that is deductible for federal income tax purposes. The actual amount of the contribution is determined annually based on the Continuing Plan’s funded status and return on plan assets as of the measurement date, which is
124
December 31. For the plan year ending December 31, 2017,2023, Trustmark’s minimum required contribution to the Continuing Plan was $113 thousand. During 2017,$154 thousand and Trustmark contributed $200 thousand to the Continuing Plan for the plan year ending December 31, 2017.$609 thousand. For the plan year ending December 31, 2018,2024, Trustmark’s minimum required contribution to the Continuing Plan is expected to be $175 thousand; however,$128 thousand. Management and the Board of Directors of Trustmark will monitor the Continuing Plan throughout 20182024 to determine any additional funding requirements by the plan’s measurement date.
For the plan year ending December 31, 2016, Trustmark’s minimum required contribution to the Plan was zero. Since the Plan was terminated, there were no additional contributions required other than amounts necessary to facilitate the Plan termination.
Estimated Future Benefit Payments and Other Disclosures
The following table presents the expected benefit payments, which reflect expected future service, for the Continuing Plan ($ in thousands):
Year |
| Amount |
| |
2018 |
| $ | 196 |
|
2019 |
|
| 282 |
|
2020 |
|
| 333 |
|
2021 |
|
| 394 |
|
2022 |
|
| 453 |
|
2023 - 2027 |
|
| 2,961 |
|
Year |
| Amount |
| |
2024 |
| $ | 1,312 |
|
2025 |
|
| 682 |
|
2026 |
|
| 701 |
|
2027 |
|
| 724 |
|
2028 |
|
| 428 |
|
2029 - 2033 |
|
| 1,396 |
|
Amounts in accumulated other comprehensiveNo net gain or loss is expected to be recognized as components of net periodic benefit cost during 2018 include a net loss of $571 thousand.2024 in accumulated other comprehensive income (loss).
127
Trustmark maintains a nonqualified supplemental retirement plan covering key executive officers and senior officers as well as directors who have elected to defer fees. The plan provides for retirement and/or death benefits based on a participant’s covered salary or deferred fees. Although plan benefits may be paid from Trustmark’s general assets, Trustmark has purchased life insurance contracts on the participants covered under the plan, which may be used to fund future benefit payments under the plan. The annual measurement date for the plan is December 31. As a result of mergers prior to 2014, Trustmark became the administrator of small nonqualified supplemental retirement plans, for which the plan benefits were frozen prior to the merger date.
125
The following tables present information regarding the benefit obligation, plan assets, funded status, amounts recognized in accumulated other comprehensive loss, net periodic benefit cost and other statistical disclosures for Trustmark’s nonqualified supplemental retirement plans for the periods presented ($ in thousands):
|
| December 31, |
|
| December 31, |
| ||||||||||
|
| 2017 |
|
| 2016 |
|
| 2023 |
|
| 2022 |
| ||||
Change in benefit obligation: |
|
|
|
|
|
|
|
|
|
|
|
|
| |||
Benefit obligation, beginning of year |
| $ | 58,495 |
|
| $ | 57,766 |
|
| $ | 43,201 |
|
| $ | 55,035 |
|
Service cost |
|
| 141 |
|
|
| 295 |
|
|
| 69 |
|
|
| 71 |
|
Interest cost |
|
| 2,103 |
|
|
| 2,223 |
|
|
| 2,013 |
|
|
| 1,278 |
|
Actuarial loss |
|
| 642 |
|
|
| 1,537 |
| ||||||||
Actuarial (gain) loss |
|
| 763 |
|
|
| (9,195 | ) | ||||||||
Benefits paid |
|
| (3,451 | ) |
|
| (3,326 | ) |
|
| (4,427 | ) |
|
| (3,988 | ) |
Benefit obligation, end of year |
| $ | 57,930 |
|
| $ | 58,495 |
|
| $ | 41,619 |
|
| $ | 43,201 |
|
Change in plan assets: |
|
|
|
|
|
|
|
|
|
|
|
|
|
| ||
Fair value of plan assets, beginning of year |
| $ | — |
|
| $ | — |
|
| $ | — |
|
| $ | — |
|
Employer contributions |
|
| 3,451 |
|
|
| 3,326 |
|
|
| 4,427 |
|
|
| 3,988 |
|
Benefit payments |
|
| (3,451 | ) |
|
| (3,326 | ) |
|
| (4,427 | ) |
|
| (3,988 | ) |
Fair value of plan assets, end of year |
| $ | — |
|
| $ | — |
|
| $ | — |
|
| $ | — |
|
|
|
|
|
|
|
|
|
|
|
|
|
|
|
| ||
Funded status at end of year - net liability |
| $ | (57,930 | ) |
| $ | (58,495 | ) |
| $ | (41,619 | ) |
| $ | (43,201 | ) |
|
|
|
|
|
|
|
|
|
|
|
|
|
|
| ||
Amounts recognized in accumulated other comprehensive loss: |
|
|
|
|
|
|
|
|
|
|
|
|
|
| ||
Net loss |
| $ | 17,514 |
|
| $ | 17,739 |
|
| $ | 8,235 |
|
| $ | 7,756 |
|
Prior service cost |
|
| 1,109 |
|
|
| 1,359 |
|
|
| 126 |
|
|
| 237 |
|
Amounts recognized |
| $ | 18,623 |
|
| $ | 19,098 |
|
| $ | 8,361 |
|
| $ | 7,993 |
|
|
|
|
|
|
| |||||||||||
Actuarial (gain) loss included in benefit obligation: |
|
|
|
|
| |||||||||||
Change in discount rate |
| $ | 649 |
|
| $ | (9,803 | ) | ||||||||
Change in mortality table |
|
| (308 | ) |
|
| — |
| ||||||||
Other |
|
| 422 |
|
|
| 608 |
| ||||||||
Actuarial (gain) loss |
| $ | 763 |
|
| $ | (9,195 | ) | ||||||||
|
| Years Ended December 31, |
|
| Years Ended December 31, |
| ||||||||||||||||||
|
| 2017 |
|
| 2016 |
|
| 2015 |
|
| 2023 |
|
| 2022 |
|
| 2021 |
| ||||||
Net periodic benefit cost: |
|
|
|
|
|
|
|
|
|
|
|
|
|
|
|
|
|
|
|
|
| |||
Service cost |
| $ | 141 |
|
| $ | 295 |
|
| $ | 431 |
|
| $ | 69 |
|
| $ | 71 |
|
| $ | 75 |
|
Interest cost |
|
| 2,103 |
|
|
| 2,223 |
|
|
| 2,082 |
|
|
| 2,013 |
|
|
| 1,278 |
|
|
| 1,125 |
|
Amortization of prior service cost |
|
| 250 |
|
|
| 250 |
|
|
| 250 |
|
|
| 111 |
|
|
| 111 |
|
|
| 111 |
|
Recognized net actuarial loss |
|
| 866 |
|
|
| 864 |
|
|
| 992 |
|
|
| 284 |
|
|
| 986 |
|
|
| 1,192 |
|
Net periodic benefit cost |
| $ | 3,360 |
|
| $ | 3,632 |
|
| $ | 3,755 |
|
| $ | 2,477 |
|
| $ | 2,446 |
|
| $ | 2,503 |
|
|
|
|
|
|
|
|
|
|
|
|
|
|
|
|
|
|
|
|
|
|
| |||
Other changes in plan assets and benefit obligation recognized in other comprehensive income (loss), before taxes: |
|
|
|
|
|
|
|
|
|
|
|
|
|
|
|
|
|
|
|
|
| |||
Net (gain) loss |
| $ | (224 | ) |
| $ | (810 | ) |
| $ | (2,694 | ) |
| $ | 479 |
|
| $ | (10,181 | ) |
| $ | (3,549 | ) |
Amortization of prior service cost |
|
| (250 | ) |
|
| (250 | ) |
|
| (250 | ) |
|
| (111 | ) |
|
| (111 | ) |
|
| (111 | ) |
Total recognized in other comprehensive income (loss) |
| $ | (474 | ) |
| $ | (1,060 | ) |
| $ | (2,944 | ) |
| $ | 368 |
|
| $ | (10,292 | ) |
| $ | (3,660 | ) |
Total recognized in net periodic benefit cost and other comprehensive income (loss) |
| $ | 2,886 |
|
| $ | 2,572 |
|
| $ | 811 |
|
| $ | 2,845 |
|
| $ | (7,846 | ) |
| $ | (1,157 | ) |
|
|
|
|
|
|
|
|
|
|
|
|
|
|
|
|
|
|
|
|
|
| |||
Weighted-average assumptions as of end of year: |
|
|
|
|
|
|
|
|
|
|
|
|
|
|
|
|
|
|
|
|
| |||
Discount rate for benefit obligation |
|
| 3.32 | % |
|
| 3.71 | % |
|
| 3.86 | % |
|
| 4.67 | % |
|
| 4.88 | % |
|
| 2.41 | % |
Discount rate for net periodic benefit cost |
|
| 3.71 | % |
|
| 3.86 | % |
|
| 3.57 | % |
|
| 4.88 | % |
|
| 2.41 | % |
|
| 1.95 | % |
128126
Estimated Supplemental Retirement Plan Payments and Other Disclosures
The following table presents the expected benefits payments for Trustmark’s supplemental retirement plans ($ in thousands):
Year |
| Amount |
| |
2018 |
| $ | 3,475 |
|
2019 |
|
| 3,591 |
|
2020 |
|
| 4,047 |
|
2021 |
|
| 4,105 |
|
2022 |
|
| 4,262 |
|
2023 - 2027 |
|
| 19,230 |
|
Year |
| Amount |
| |
2024 |
| $ | 3,997 |
|
2025 |
|
| 3,871 |
|
2026 |
|
| 3,825 |
|
2027 |
|
| 3,641 |
|
2028 |
|
| 3,520 |
|
2029 - 2033 |
|
| 16,051 |
|
Amounts in accumulated other comprehensive lossincome (loss) expected to be recognized as components of net periodic benefit cost during 20182024 include a loss of $884$346 thousand and prior service cost of $250$111 thousand.
Other Benefit Plans
Defined Contribution Plan
Trustmark provides associates with a self-directed 401(k) retirement plan that allows associates to contribute a percentage of base pay,eligible compensation, within limits provided by the Internal Revenue Code and accompanying regulations, into the plan. Trustmark matches 100% of associate contributions to the plan based on the amount of each participant’s contributions up to a maximum of 6% of eligible compensation, subject to the IRS maximum eligible compensation. Associates are automatically enrolled in the plan at 3% of eligible compensation unless they opt out within 60 days of employment. Associates may become eligible to make elective deferral contributions the first of the month following 30 daysone month of employment. Eligible associates must complete one year of service in orderthat elect to participate vest immediately in Trustmark’s matching contributions. Trustmark’s contributions to this plan were $7.5$10.8 million in 2017, $7.22023, $10.2 million in 20162022 and $7.0$9.9 million in 2015.2021.
Note 15 – Stock and Incentive Compensation Plans
Trustmark has granted restricted stock and incentive compensation awardsunits subject to the provisions of the Stock and Incentive Compensation Plan (the Stock Plan). Current outstanding and future grants of restricted stock and incentive compensation awardsunits are subject to the provisions of the Stock Plan, which is designed to provide flexibility to Trustmark regarding its ability to motivate, attract and retain the services of key associates and directors. The Stock Plan also allows Trustmark to grant nonqualified stock options, incentive stock options, stock appreciation rights, restricted stock, restricted stock units and performance units to key associates and directors. At December 31, 2017,2023, the maximum number of shares of Trustmark’s common stock available for issuance under the Stock Plan was 1,110,739777,264 shares.
Restricted Stock Grants
Performance AwardsUnits
Trustmark’s performance awardsunits vest over three years and are granted to Trustmark’s executive and senior management teams. Performance awardsunits granted vest based on performance goals of return on average tangible equity and total shareholder return compared to a defined peer group.return. Performance awardsunits are valued utilizing a Monte Carlo simulation model to estimate fair value of the awards at the grant date. The Monte Carlo simulation is performed by an independent valuation consultant and requires the use of subjective modeling assumptions. These awardsunits are recognized using the straight-line method over the requisite service period. These awardsunits provide for achievement sharesunits if performance measures exceed 100%. The restricted sharestock agreement provides for these units provide for dividend privileges, but no voting rights and dividend privileges.rights.
The following table summarizes Trustmark’s performance awardunit activity for the periods presented:
|
| Years Ended December 31, |
| |||||||||||||||||||||
|
| 2023 |
|
| 2022 |
|
| 2021 |
| |||||||||||||||
|
|
|
|
| Weighted- |
|
|
|
|
| Weighted- |
|
|
|
|
| Weighted- |
| ||||||
|
|
|
|
| Average |
|
|
|
|
| Average |
|
|
|
|
| Average |
| ||||||
|
|
|
|
| Grant-Date |
|
|
|
|
| Grant-Date |
|
|
|
|
| Grant-Date |
| ||||||
|
| Shares |
|
| Fair Value |
|
| Shares |
|
| Fair Value |
|
| Shares |
|
| Fair Value |
| ||||||
Nonvested shares, beginning of year |
|
| 148,416 |
|
| $ | 31.63 |
|
|
| 140,821 |
|
| $ | 31.80 |
|
|
| 145,042 |
|
| $ | 32.43 |
|
Granted |
|
| 70,666 |
|
|
| 29.78 |
|
|
| 60,773 |
|
|
| 32.64 |
|
|
| 53,273 |
|
|
| 30.02 |
|
Released from restriction |
|
| (39,943 | ) |
|
| 31.98 |
|
|
| (19,723 | ) |
|
| 33.40 |
|
|
| (44,536 | ) |
|
| 31.88 |
|
Forfeited |
|
| (4,925 | ) |
|
| 31.41 |
|
|
| (33,455 | ) |
|
| 33.11 |
|
|
| (12,958 | ) |
|
| 31.28 |
|
Nonvested shares, end of year |
|
| 174,214 |
|
| $ | 30.81 |
|
|
| 148,416 |
|
| $ | 31.63 |
|
|
| 140,821 |
|
| $ | 31.80 |
|
|
| Years Ended December 31, |
| |||||||||||||||||||||
|
| 2017 |
|
| 2016 |
|
| 2015 |
| |||||||||||||||
|
|
|
|
|
| Weighted- |
|
|
|
|
|
| Weighted- |
|
|
|
|
|
| Weighted- |
| |||
|
|
|
|
|
| Average |
|
|
|
|
|
| Average |
|
|
|
|
|
| Average |
| |||
|
|
|
|
|
| Grant-Date |
|
|
|
|
|
| Grant-Date |
|
|
|
|
|
| Grant-Date |
| |||
|
| Shares |
|
| Fair Value |
|
| Shares |
|
| Fair Value |
|
| Shares |
|
| Fair Value |
| ||||||
Nonvested shares, beginning of year |
|
| 237,136 |
|
| $ | 26.27 |
|
|
| 212,309 |
|
| $ | 24.14 |
|
|
| 181,195 |
|
| $ | 24.98 |
|
Granted |
|
| 58,406 |
|
|
| 33.31 |
|
|
| 99,116 |
|
|
| 20.18 |
|
|
| 84,899 |
|
|
| 22.71 |
|
Released from restriction |
|
| (67,279 | ) |
|
| 34.78 |
|
|
| (40,888 | ) |
|
| 32.84 |
|
|
| (47,360 | ) |
|
| 24.97 |
|
Forfeited |
|
| (14,747 | ) |
|
| 28.42 |
|
|
| (33,401 | ) |
|
| 30.01 |
|
|
| (6,425 | ) |
|
| 24.97 |
|
Nonvested shares, end of year |
|
| 213,516 |
|
| $ | 25.37 |
|
|
| 237,136 |
|
| $ | 26.27 |
|
|
| 212,309 |
|
| $ | 24.14 |
|
127
129
Time-Vested AwardsTime-based Units
Trustmark’s time-vested awardstime-based units granted to Trustmark’s executive and senior management teams vest over three years and are. Trustmark’s time-based units granted to members of Trustmark’s Board of Directors as well as Trustmark’s executive and senior management teams. Time-vested awardsvest over one year. Time-based units are valued utilizing the fair value of Trustmark’s stock at the grant date. These awardsunits are recognized on the straight-line method over the requisite service period. The restricted stock agreement for these units provide for dividend privileges, but no voting rights.
The following table summarizes Trustmark’s time-vested awardtime-based unit activity for the periods presented:
|
| Years Ended December 31, |
| |||||||||||||||||||||
|
| 2023 |
|
| 2022 |
|
| 2021 |
| |||||||||||||||
|
|
|
|
| Weighted- |
|
|
|
|
| Weighted- |
|
|
|
|
| Weighted- |
| ||||||
|
|
|
|
| Average |
|
|
|
|
| Average |
|
|
|
|
| Average |
| ||||||
|
|
|
|
| Grant-Date |
|
|
|
|
| Grant-Date |
|
|
|
|
| Grant-Date |
| ||||||
|
| Shares |
|
| Fair Value |
|
| Shares |
|
| Fair Value |
|
| Shares |
|
| Fair Value |
| ||||||
Nonvested shares, beginning of year |
|
| 312,978 |
|
| $ | 30.99 |
|
|
| 337,466 |
|
| $ | 31.18 |
|
|
| 301,619 |
|
| $ | 32.24 |
|
Granted |
|
| 145,003 |
|
|
| 28.59 |
|
|
| 133,307 |
|
|
| 31.85 |
|
|
| 180,847 |
|
|
| 29.85 |
|
Released from restriction |
|
| (90,587 | ) |
|
| 30.90 |
|
|
| (148,905 | ) |
|
| 32.16 |
|
|
| (135,120 | ) |
|
| 31.77 |
|
Forfeited |
|
| (9,142 | ) |
|
| 30.72 |
|
|
| (8,890 | ) |
|
| 31.62 |
|
|
| (9,880 | ) |
|
| 31.19 |
|
Nonvested shares, end of year |
|
| 358,252 |
|
| $ | 30.04 |
|
|
| 312,978 |
|
| $ | 30.99 |
|
|
| 337,466 |
|
| $ | 31.18 |
|
|
| Years Ended December 31, |
| |||||||||||||||||||||
|
| 2017 |
|
| 2016 |
|
| 2015 |
| |||||||||||||||
|
|
|
|
|
| Weighted- |
|
|
|
|
|
| Weighted- |
|
|
|
|
|
| Weighted- |
| |||
|
|
|
|
|
| Average |
|
|
|
|
|
| Average |
|
|
|
|
|
| Average |
| |||
|
|
|
|
|
| Grant-Date |
|
|
|
|
|
| Grant-Date |
|
|
|
|
|
| Grant-Date |
| |||
|
| Shares |
|
| Fair Value |
|
| Shares |
|
| Fair Value |
|
| Shares |
|
| Fair Value |
| ||||||
Nonvested shares, beginning of year |
|
| 322,056 |
|
| $ | 22.65 |
|
|
| 306,657 |
|
| $ | 24.56 |
|
|
| 263,905 |
|
| $ | 24.66 |
|
Granted |
|
| 105,524 |
|
|
| 33.79 |
|
|
| 139,791 |
|
|
| 20.66 |
|
|
| 121,314 |
|
|
| 23.61 |
|
Released from restriction |
|
| (101,289 | ) |
|
| 25.35 |
|
|
| (108,241 | ) |
|
| 23.74 |
|
|
| (67,087 | ) |
|
| 24.31 |
|
Forfeited |
|
| (5,934 | ) |
|
| 26.52 |
|
|
| (16,151 | ) |
|
| 22.24 |
|
|
| (11,475 | ) |
|
| 24.22 |
|
Nonvested shares, end of year |
|
| 320,357 |
|
| $ | 25.40 |
|
|
| 322,056 |
|
| $ | 22.65 |
|
|
| 306,657 |
|
| $ | 24.56 |
|
The following table presents information regarding compensation expense for awardsunits under the Stock Plan for the periods presented ($ in thousands):
|
|
|
|
|
|
|
|
|
|
| At December 31, 2023 |
| ||||||||
|
| Recognized Compensation Expense |
|
| Unrecognized |
|
| Weighted Average |
| |||||||||||
|
| for Years Ended December 31, |
|
| Compensation |
|
| Life of Unrecognized |
| |||||||||||
|
| 2023 |
|
| 2022 |
|
| 2021 |
|
| Expense |
|
| Compensation Expense |
| |||||
Performance awards |
| $ | 1,772 |
|
| $ | 1,258 |
|
| $ | 828 |
|
| $ | 2,021 |
|
|
| 1.69 |
|
Time-based awards |
|
| 4,383 |
|
|
| 3,625 |
|
|
| 4,773 |
|
|
| 3,005 |
|
|
| 1.58 |
|
Total |
| $ | 6,155 |
|
| $ | 4,883 |
|
| $ | 5,601 |
|
| $ | 5,026 |
|
|
|
| |
|
|
|
|
|
|
|
|
|
|
|
|
|
|
|
|
|
| Weighted |
| |
|
|
|
|
|
|
|
|
|
|
|
|
|
|
|
|
|
| Average Life |
| |
|
| Recognized Compensation Expense |
|
| Unrecognized |
|
| of Unrecognized |
| |||||||||||
|
| for Years Ended December 31, |
|
| Compensation |
|
| Compensation |
| |||||||||||
|
| 2017 |
|
| 2016 |
|
| 2015 |
|
| Expense |
|
| Expense |
| |||||
Performance awards |
| $ | 1,387 |
|
| $ | 1,171 |
|
| $ | 1,201 |
|
| $ | 1,783 |
|
|
| 1.66 |
|
Time-vested awards |
|
| 2,922 |
|
|
| 2,513 |
|
|
| 2,467 |
|
|
| 3,058 |
|
|
| 1.80 |
|
Total |
| $ | 4,309 |
|
| $ | 3,684 |
|
| $ | 3,668 |
|
| $ | 4,841 |
|
|
|
|
|
Note 16 – Commitments and Contingencies
Lending Related
Trustmark makes commitments to extend credit and issues standby and commercial letters of credit (letters of credit) in the normal course of business in order to fulfill the financing needs of its customers. The carrying amount of commitments to extend credit and letters of credit approximates the fair value of such financial instruments.
Commitments to extend credit are agreements to lend money to customers pursuant to certain specified conditions. Commitments generally have fixed expiration dates or other termination clauses. Because many of these commitments are expected to expire without being fully drawn upon, the total commitment amounts do not necessarily represent future cash requirements. The exposure to credit loss in the event of nonperformance by the other party to the commitments to extend credit is represented by the contract amount of those instruments. Trustmark applies the same credit policies and standards as it does in the lending process when making these commitments. The collateral obtained is based upon the nature of the transaction and the assessed creditworthiness of the borrower. At December 31, 20172023 and 2016,2022, Trustmark had unused commitments to extend credit of $3.172$4.907 billion and $3.131$5.472 billion, respectively.
Letters of credit are conditional commitments issued by Trustmark to insure the performance of a customer to a third-party. A financial standby letter of credit irrevocably obligates Trustmark to pay a third-party beneficiary when a customer fails to repay an outstanding loan or debt instrument. A performance standby letter of credit irrevocably obligates Trustmark to pay a third-party beneficiary when a customer fails to perform some contractual, nonfinancial obligation. When issuing letters of credit, Trustmark uses the same policies regarding credit risk and collateral, which are followed in the lending process. At December 31, 20172023 and 2016,2022, Trustmark’s maximum exposure to credit loss in the event of nonperformance by the other party for letters of credit was $104.1$125.4 million and $111.3$144.1 million, respectively. These amounts consist primarily of commitments with maturities of less than three years, which have an immaterial carrying value. Trustmark holds collateral to support standby letters of credit when deemed necessary. As ofAt December 31, 20172023 and 2016,2022, the fair value of collateral held was $28.4$31.4 million and $32.7$15.4 million, respectively.
128
ACL on Off-Balance Sheet Credit Exposures
130
Trustmark currently has operating leasemaintains a separate ACL on off-balance sheet credit exposures, including unfunded loan commitments for banking premises and equipment,letters of credit, which expire from 2018 to 2038. It is expected that certain leases will be renewed, or equipment replaced, as leases expire. Rental expense totaled $9.3 millionincluded on the accompanying consolidated balance sheets.
Changes in 2017, $9.8 million in 2016 and $9.3 million in 2015.
At December 31, 2017, future minimum rental commitments under non-cancellable operating leases arethe ACL on off-balance sheet credit exposures were as follows for the periods presented ($ in thousands):
Year |
| Amount |
| |
2018 |
|
| 12,031 |
|
2019 |
|
| 10,436 |
|
2020 |
|
| 6,642 |
|
2021 |
|
| 5,197 |
|
2022 |
|
| 5,039 |
|
Thereafter |
|
| 28,518 |
|
Total |
| $ | 67,863 |
|
|
| Years Ended December 31, |
| |||||||||
|
| 2023 |
|
| 2022 |
|
| 2021 |
| |||
Balance at beginning of period |
| $ | 36,838 |
|
| $ | 35,623 |
|
| $ | 38,572 |
|
PCL, off-balance sheet credit exposures |
|
| (2,781 | ) |
|
| 1,215 |
|
|
| (2,949 | ) |
Balance at end of period |
| $ | 34,057 |
|
| $ | 36,838 |
|
| $ | 35,623 |
|
Legal Proceedings
Trustmark’s wholly-owned subsidiary, TNB, has been namedAdjustments to the ACL on off-balance sheet credit exposures are recorded to PCL, off-balance sheet credit exposures. The decrease in the ACL on off-balance sheet credit exposures for the year ended December 31, 2023 was primarily due to decreases in unfunded commitments for the construction, land development and other land portfolio and other construction loan portfolio. The increase in the ACL on off-balance sheet credit exposures for the year ended December 31, 2022 was primarily due to the overall increase in the total reserve rates applied to off-balance sheet credit exposures as a defendantresult of the weakening in three lawsuits relatedthe macroeconomic forecasts and an increase in unfunded balances.
Legal Proceedings
As previously announced, on December 31, 2022, Trustmark National Bank (TNB) agreed to the collapse ofa settlement in principle (the Stanford Settlement) relating to litigation involving the Stanford Financial Group. On January 13, 2023, TNB entered into a Settlement Agreement (the Stanford Settlement Agreement) reflecting the terms of the Stanford Settlement. The first is a purported class action complaint that was filedparties to the Stanford Settlement Agreement are, on August 23, 2009the one hand, (i) Ralph S. Janvey, solely in his capacity as the District Court of Harris County, Texas, by Peggy Roif Rotstain, Guthrie Abbott, Catherine Burnell, Steven Queyrouze, Jaime Alexis Arroyo Bornstein and Juan C. Olano (collectively, Class Plaintiffs), on behalf of themselves and all others similarly situated, naming TNB and four other financial institutions unaffiliated with Trustmark as defendants. The complaint seeks to recover (i) alleged fraudulent transfers fromcourt-appointed receiver (the Stanford Receiver) for the Stanford Receivership Estate; (ii) the Official Stanford Investors Committee; (iii) each of the defendantsplaintiffs in the amountRotstain and Smith Actions; and, on the other hand, (iv) TNB. Under the terms of fees and other monies received by each defendant from entities controlled by R. Allen Stanford (collectively, the Stanford Financial Group)Settlement Agreement, the parties agreed to settle and (ii) damages allegedly attributabledismiss the Rotstain Action, the Smith Action, and all current or future claims by plaintiffs in either such Action arising from or related to alleged conspiracies by one or moreStanford. In addition, the Stanford Settlement Agreement provided that the parties would request dismissal of the defendants withJackson Action pursuant to the terms of the bar orders described below. The Court’s approval of the Stanford Financial GroupSettlement Agreement, including the bar orders described below, has occurred and has been upheld on appeal, as described below. As a result, pursuant to commit fraud and/or aid and abet fraud on the asserted grounds that defendants knew or should have known the Stanford Financial Group was conducting an illegal and fraudulent scheme. Plaintiffs have demandedSettlement, TNB made a jury trial. Plaintiffs did not quantify damages. one-time cash payment of $100.0 million to the Stanford Receiver on February 2, 2024.
In November 2009,The Stanford Settlement Agreement included the lawsuit was removedparties’ agreement to federal court by certain defendants and then transferred by the United States Panel on Multidistrict Litigation to federal court inseek the Northern District of Texas (Dallas) where multiple Stanford related matters are being consolidated for pre-trial proceedings. In May 2010, all defendants (including TNB) filed motions to dismissDistrict Court’s entry of bar orders prohibiting any continued or future claims by the lawsuit. In August 2010,plaintiffs in the court authorized and approved the formation of an Official Stanford Investors Committee (OSIC) to represent the interests of Stanford investors and, under certain circumstances, to file legal actions for the benefit of Stanford investors. In December 2011, the OSIC filed a motion to intervene in this action. In September 2012, the district court referred the case to a magistrate judge for hearing and determination of certain pretrial issues. In December 2012, the court granted the OSIC’s motion to intervene, and the OSIC filed an Intervenor Complaint against one of theActions or by any other defendant financial institutions. In February 2013, the OSIC filed a second Intervenor Complaint that asserts claimsperson or entity against TNB and its related parties relating to Stanford, whether asserted to date or not. The bar orders prohibit all litigation relating to Stanford described herein, including not only the remaining defendant financial institutions. The OSIC seeks to recover: (i) alleged fraudulent transfersActions and any pending matters but also any actions that may be brought in the amountfuture. Final Court approval of the fees each of the defendants allegedly received from Stanford Financial Group, the profits each of the defendants allegedly made from Stanford Financial Group deposits, and other monies each of the defendants allegedly received from Stanford Financial Group; (ii) damages attributable to alleged conspiracies by each of the defendants with the Stanford Financial Group to commit fraud and/or aid and abet fraud and conversion on the asserted grounds that the defendants knew or should have known the Stanford Financial Groupthese bar orders was conducting an illegal and fraudulent scheme; and (iii) punitive damages. The OSIC did not quantify damages.
In July 2013, all defendants (including TNB) filed motions to dismiss the OSIC’s claims. In March 2015, the court entered an order authorizing the parties to conduct discovery regarding class certification, staying all other discovery and setting a deadline for the parties to complete briefing on class certification issues. In April 2015, the court granted in part and denied in part the defendants’ motions to dismiss the Class Plaintiffs’ claims and the OSIC’s claims. The court dismissed all of the Class Plaintiffs’ fraudulent transfer claims and dismissed certain of the OSIC’s claims. The court denied the motions by TNB and the other financial institution defendants to dismiss the OSIC’s constructive fraudulent transfer claims.
On June 23, 2015, the court allowed the Class Plaintiffs to file a Second Amended Class Action Complaint (SAC), which asserted new claims against TNB and certain of the other defendants for (i) aiding, abetting and participating in a fraudulent scheme, (ii) aiding, abetting and participating in violations of the Texas Securities Act, (iii) aiding, abetting and participating in breaches of fiduciary duty, (iv) aiding, abetting and participating in conversion and (v) conspiracy. On July 14, 2015, the defendants (including TNB) filed motions to dismiss the SAC and to reconsider the court’s prior denial to dismiss the OSIC’s constructive fraudulent transfer claims against TNB and the other financial institutions that are defendants in the action. On July 27, 2016, the court denied the motion by TNB and the other financial institution defendants to dismiss the SAC and also denied the motion by TNB and the other financial
131
institution defendants to reconsider the court’s prior denial to dismiss the OSIC’s constructive fraudulent transfer claims. On August 24, 2016, TNB filed its answer to the SAC. On October 20, 2017, the OSIC filed a motion seeking an order lifting the discovery stay and establishing a trial schedule. On November 7, 2017, the court denied the OSIC's motion seeking class certification and designation of class representatives and counsel, finding that common issues of fact did not predominate. The court granted the OSIC's motion to lift the discovery stay that it had previously ordered.
The second Stanford-related lawsuit was filed on December 14, 2009 in the District Court of Ascension Parish, Louisiana, individually by Harold Jackson, Paul Blaine, Carolyn Bass Smith, Christine Nichols, and Ronald and Ramona Hebert naming TNB (misnamed as Trust National Bank) and other individuals and entities not affiliated with Trustmark as defendants. The complaint seeks to recover the money lost by these individual plaintiffs as a result of the collapsecondition of the Stanford Financial Group (in additionSettlement.
The Stanford Settlement Agreement was also subject to other damages) under various theoriesnotice to Stanford’s investor claimants (which has been provided) and causes of action, including negligence, breach of contract, breach of fiduciary duty, negligent misrepresentation, detrimental reliance, conspiracy, and violation of Louisiana’s uniform fiduciary, securities, and racketeering laws. The complaint does not quantify the amount of money the plaintiffs seek to recover. In January 2010, the lawsuit was removed to federal court by certain defendants and then transferredfinal, non-appealable approval by the United States Panel on Multidistrict Litigation to federal court inU.S. District Court for the Northern District of Texas (Dallas) where multiple(which has occurred).
The Stanford related matters are being consolidated for pre-trial proceedings. On March 29, 2010, the court stayed the case.Settlement Agreement also provides that TNB filed a motion to lift the stay, which was denied on February 28, 2012. In September 2012, the district court referred the case to a magistrate judge for hearingdenies and determinationmakes no admission of certain pretrial issues.
On April 11, 2016, Trustmark learned that a third Stanford-related lawsuit had been filed on that date in the Superior Court of Justice in Ontario, Canada, by The Toronto-Dominion Bank (“TD Bank”), naming TNB and three other financial institutions not affiliated with Trustmark as defendants. The complaint seeks a declaration specifying the degree to which each of TNB and the other defendants are liable in respect of any loss and damage for which TD Bank is found to be liable in a litigation commenced against TD Bank brought by the Joint Liquidators of Stanford International Bank Limited in the Superior Court of Justice, Commercial List in Ontario, Canada (the “Joint Liquidators’ Action”), as well as contribution and indemnity in respect of any judgment, interest and costs TD Bank is ordered to pay in the Joint Liquidators’ Action. To date, TNB has not been servedliability or wrongdoing in connection with this action.
any Stanford matter. As has been the case throughout the pendency of the Actions, TNB expressly denies any liability or wrongdoing with respect to any matter alleged in regard to the multi-billion dollar Ponzi scheme operated by Stanford for almost 20 years. TNB’s relationship with the Stanford Financial Group began as a result of Trustmark’sTNB’s acquisition of a Houston-based bank in August 2006, and consisted of correspondent banking and other traditionalordinary banking services provided to business deposit customers.
The foregoing description of the terms of the Stanford Settlement Agreement does not purport to be complete and is qualified in its entirety by reference to the full text of the Stanford Settlement Agreement, a copy of which is filed as Exhibit 10.ai to the 2022 Annual Report and is incorporated herein by reference.
On January 20, 2023, the U.S. District Court for the Northern District of Texas entered an order preliminarily finding that the Stanford Settlement is fair, reasonable, and equitable; has no obvious deficiencies; and is the product of serious, informed, good faith, and arm’s-length negotiations. Following the provision of notice as required by the Stanford Settlement Agreement and by the Court’s preliminary order, the Court (Judge David C. Godbey, presiding) held a Final Approval Hearing on May 3, 2023, at which the Court approved the Stanford Settlement from the bench. On May 4, 2023, Judge Godbey signed the written orders confirming his oral ruling, including the bar order contemplated by the Stanford Settlement Agreement and the judgment and bar order with respect to the Jackson Action.
129
On May 10, 2023, Robert Allen Stanford, writing from prison, appealed the District Court’s approval of the Stanford Settlement to the Fifth Circuit Court of Appeals. On June 12, 2023, the Stanford Receiver moved to dismiss the appeal as frivolous. On July 25, 2023, a three-judge panel of the Fifth Circuit issued a per curiam order dismissing Stanford’s appeal as frivolous. In July and August 2023, Mr. Stanford filed, then subsequently withdrew, a motion seeking panel rehearing of the Fifth Circuit’s July 25, 2023, decision.
When Stanford’s deadline to appeal the Fifth Circuit’s ruling to the Supreme Court of the United States passed without his filing a petition for certiorari, the trial court’s ruling approving the Stanford Settlement and entering the bar orders became final and non-appealable, as defined in the ordinary courseStanford Settlement Agreement (the Stanford Settlement Effective Date). On November 14, the parties to the Rotstain and Smith Actions filed agreed dismissals of business. All Stanford-related lawsuitsthose cases, which were granted on November 27, 2023 (Smith Action) and December 18, 2023 (Rotstain Action). Those dismissals were final and non-appealable as of December 27, 2023 (Smith Action) and January 17, 2024 (Rotstain Action). Accordingly, pursuant to the Stanford Settlement Agreement, TNB made the settlement payment on February 2, 2024, concluding the Stanford Settlement.
TNB and Trustmark Corporation determined that it was in the best interest of TNB, Trustmark Corporation and the shareholders of Trustmark Corporation to enter into the Stanford Settlement and the Stanford Settlement Agreement to eliminate the risk, ongoing expense, uncertainty as to ultimate outcome, and imposition on management and the business of TNB of further litigation of the Actions and related Stanford claims.
As previously announced, on August 30, 2023, TNB agreed to a settlement in principle (the Adams/Madison Timber Settlement) relating to litigation and claims involving Arthur Lamar Adams and Madison Timber Properties, LLC (collectively, Adams/Madison Timber). On October 9, 2023, TNB entered into a Settlement Agreement (the Adams/Madison Timber Settlement Agreement) reflecting the terms of the Adams/Madison Timber Settlement. The parties to the Adams/Madison Timber Settlement are, on the one hand, Alysson Mills in pre-trial stages.her capacity as Court-appointed Receiver (the Adams/Madison Timber Receiver); and, on the other hand, TNB. Under the terms of the Adams/Madison Timber Settlement Agreement, the parties agreed to settle and dismiss the Adams/Madison Timber Action, and the Adams/Madison Timber Receiver agreed to fully release all claims against TNB and any of its employees, agents and representatives. The Adams/Madison Timber Settlement included the parties’ agreement to seek the Court’s entry of bar orders prohibiting any continued or future claims by anyone against TNB and its related parties relating to Adams/Madison Timber, whether asserted to date or not. Final Court approval of a bar order was a condition of the Adams/Madison Timber Settlement. On November 14, 2023, the Court entered a Partial Final Judgment and Final Bar Order approving the settlement. The bar order therefore is expected to prohibit all litigation relating to Adams/Madison Timber described herein.
The Adams/Madison Timber Settlement was subject to notice to Adams/Madison Timber investors, and final, non-appealable approval by the Court and entry of a judgment dismissing the Lawsuit against TNB. No investor or other interested parties appealed the bar order before the appeal deadline passed. Accordingly, TNB made the settlement payment to the Adams/Madison Timber Receiver on January 22, 2024, concluding the Adams/Madison Timber Settlement.
Trustmark and its subsidiaries are also parties to other lawsuits and other claims that arise in the ordinary course of business. Some of the lawsuits assert claims related to the lending, collection, servicing, investment, trust and other business activities, and some of the lawsuits allege substantial claims for damages.
All pending legal proceedings described above are being vigorously contested.contested, with the exception of the TD Bank Declaratory Action that, as noted above, TNB was not served in connection with. In accordance with FASB ASC TopicSubtopic 450-20, “Loss Contingencies,” TrustmarkTNB will establish an accrued liability for any litigation mattersmatter if and when those matters presentsuch matter presents loss contingencies that are both probable and reasonably estimable. As a result of the entry into the Stanford Settlement as described above, Trustmark Corporation recognized a $100.0 million litigation settlement expense included in noninterest expense related to the Stanford litigation during the fourth quarter of 2022, plus an additional $750 thousand in related legal fees. As a result of the entry into the Adams/Madison Timber Settlement as described above, Trustmark Corporation recognized a $6.5 million litigation settlement expense included in noninterest expense related to the Adams/Madison Timber litigation during the third quarter of 2023. Trustmark Corporation and TNB will remain substantially above levels considered to be well-capitalized under all relevant standards. At the present time, TrustmarkTNB believes, based on its evaluation and the advice of legal counsel, that a loss in any suchcurrently pending legal proceeding other than the settled Stanford and Adams/Madison Timber litigation is not probable and a reasonable estimate cannot reasonably be made.
Note 17 – Shareholders’ Equity
Regulatory Capital
Trustmark and TNB are subject to minimum risk-based capital and leverage capital requirements, as described in the section captioned “Capital Adequacy” included in Part I. Item 1. – Business of this report, which are administered by the federal bank regulatory agencies. These capital requirements, as defined by federal regulations, involve quantitative and qualitative measures of assets, liabilities and
130
certain off-balance sheet instruments. Trustmark’s and TNB’s minimum risk-based capital requirements include the phased ina capital conservation buffer of 1.250% at December 31, 2017 and 0.625% at December 31, 2016.2.5%. Accumulated other comprehensive loss,income (loss), net of tax, is not included in computing regulatory capital. Trustmark elected the five-year phase-in transition period (through December 31, 2024) related to adopting FASB ASU 2016-13 for regulatory capital purposes. Failure to meet minimum capital requirements can result in certain mandatory and possibly additional discretionary actions by regulators that, if undertaken, could have a direct material effect on the financial statements of Trustmark and TNB and limit Trustmark’s and TNB’s ability to pay dividends. As ofAt December 31, 2017,2023, Trustmark and TNB exceeded all applicable minimum capital standards. In addition, Trustmark and TNB met applicable regulatory guidelines to be considered well-capitalized at December 31, 2017.2023. To be categorized in this manner, Trustmark and TNB maintained minimum common equity Tier 1 risk-based capital, Tier 1 risk-based capital, total risk-based capital and Tier 1 leverage ratios as set forth in the accompanying table, and were not subject to any written agreement, order or capital directive, or prompt corrective action directive issued by their primary federal regulators to meet and maintain a specific capital level for any capital measures. There are no significant conditions or events that have occurred since December 31, 2017,2023, which Management believes have affected Trustmark’s or TNB’s present classification.
132
The regulatory capital ratios for December 31, 2017 contain a reclassification adjustment of $8.5 million from accumulated other comprehensive loss to retained earnings as allowed by regulatory agencies in an interagency statement released January 18, 2018 to address disproportionate tax effect in accumulated other comprehensive loss resulting from the recent enactment of the Tax Reform Act and the application of FASB ASC Topic 740.
The following table provides Trustmark’s and TNB’s actual regulatory capital amounts and ratios under regulatory capital standards in effect at December 31, 20172023 and 20162022 ($ in thousands):
|
| Actual |
|
|
|
|
|
|
| |||||||
|
| Regulatory Capital |
|
| Minimum |
|
| To Be Well |
| |||||||
|
| Amount |
|
| Ratio |
|
| Requirement |
|
| Capitalized |
| ||||
At December 31, 2023: |
|
|
|
|
|
|
|
|
|
|
|
| ||||
Common Equity Tier 1 Capital (to Risk Weighted Assets) |
|
|
|
|
|
|
|
|
|
|
|
| ||||
Trustmark Corporation |
| $ | 1,521,665 |
|
|
| 10.04 | % |
|
| 7.000 | % |
| n/a |
| |
Trustmark National Bank |
|
| 1,602,327 |
|
|
| 10.58 | % |
|
| 7.000 | % |
|
| 6.50 | % |
|
|
|
|
|
|
|
|
|
|
|
|
| ||||
Tier 1 Capital (to Risk Weighted Assets) |
|
|
|
|
|
|
|
|
|
|
|
| ||||
Trustmark Corporation |
| $ | 1,581,665 |
|
|
| 10.44 | % |
|
| 8.500 | % |
| n/a |
| |
Trustmark National Bank |
|
| 1,602,327 |
|
|
| 10.58 | % |
|
| 8.500 | % |
|
| 8.00 | % |
|
|
|
|
|
|
|
|
|
|
|
|
| ||||
Total Capital (to Risk Weighted Assets) |
|
|
|
|
|
|
|
|
|
|
|
| ||||
Trustmark Corporation |
| $ | 1,862,246 |
|
|
| 12.29 | % |
|
| 10.500 | % |
| n/a |
| |
Trustmark National Bank |
|
| 1,759,426 |
|
|
| 11.61 | % |
|
| 10.500 | % |
|
| 10.00 | % |
|
|
|
|
|
|
|
|
|
|
|
|
| ||||
Tier 1 Leverage (to Average Assets) |
|
|
|
|
|
|
|
|
|
|
|
| ||||
Trustmark Corporation |
| $ | 1,581,665 |
|
|
| 8.62 | % |
|
| 4.00 | % |
| n/a |
| |
Trustmark National Bank |
|
| 1,602,327 |
|
|
| 8.75 | % |
|
| 4.00 | % |
|
| 5.00 | % |
|
|
|
|
|
|
|
|
|
|
|
|
| ||||
At December 31, 2022: |
|
|
|
|
|
|
|
|
|
|
|
| ||||
Common Equity Tier 1 Capital (to Risk Weighted Assets) |
|
|
|
|
|
|
|
|
|
|
|
| ||||
Trustmark Corporation |
| $ | 1,413,672 |
|
|
| 9.74 | % |
|
| 7.000 | % |
| n/a |
| |
Trustmark National Bank |
|
| 1,501,889 |
|
|
| 10.34 | % |
|
| 7.000 | % |
|
| 6.50 | % |
|
|
|
|
|
|
|
|
|
|
|
|
| ||||
Tier 1 Capital (to Risk Weighted Assets) |
|
|
|
|
|
|
|
|
|
|
|
| ||||
Trustmark Corporation |
| $ | 1,473,672 |
|
|
| 10.15 | % |
|
| 8.500 | % |
| n/a |
| |
Trustmark National Bank |
|
| 1,501,889 |
|
|
| 10.34 | % |
|
| 8.500 | % |
|
| 8.00 | % |
|
|
|
|
|
|
|
|
|
|
|
|
| ||||
Total Capital (to Risk Weighted Assets) |
|
|
|
|
|
|
|
|
|
|
|
| ||||
Trustmark Corporation |
| $ | 1,729,499 |
|
|
| 11.91 | % |
|
| 10.500 | % |
| n/a |
| |
Trustmark National Bank |
|
| 1,634,454 |
|
|
| 11.26 | % |
|
| 10.500 | % |
|
| 10.00 | % |
|
|
|
|
|
|
|
|
|
|
|
|
| ||||
Tier 1 Leverage (to Average Assets) |
|
|
|
|
|
|
|
|
|
|
|
| ||||
Trustmark Corporation |
| $ | 1,473,672 |
|
|
| 8.47 | % |
|
| 4.00 | % |
| n/a |
| |
Trustmark National Bank |
|
| 1,501,889 |
|
|
| 8.65 | % |
|
| 4.00 | % |
|
| 5.00 | % |
|
| Actual |
|
|
|
|
|
|
|
|
| |||||
|
| Regulatory Capital |
|
| Minimum |
|
| To Be Well |
| |||||||
|
| Amount |
|
| Ratio |
|
| Requirement |
|
| Capitalized |
| ||||
At December 31, 2017: |
|
|
|
|
|
|
|
|
|
|
|
|
|
|
|
|
Common Equity Tier 1 Capital (to Risk Weighted Assets) |
|
|
|
|
|
|
|
|
|
|
|
|
|
|
|
|
Trustmark Corporation |
| $ | 1,243,240 |
|
|
| 11.77 | % |
|
| 5.750 | % |
| n/a |
| |
Trustmark National Bank |
|
| 1,284,575 |
|
|
| 12.16 | % |
|
| 5.750 | % |
|
| 6.50 | % |
|
|
|
|
|
|
|
|
|
|
|
|
|
|
|
|
|
Tier 1 Capital (to Risk Weighted Assets) |
|
|
|
|
|
|
|
|
|
|
|
|
|
|
|
|
Trustmark Corporation |
| $ | 1,303,238 |
|
|
| 12.33 | % |
|
| 7.250 | % |
| n/a |
| |
Trustmark National Bank |
|
| 1,284,575 |
|
|
| 12.16 | % |
|
| 7.250 | % |
|
| 8.00 | % |
|
|
|
|
|
|
|
|
|
|
|
|
|
|
|
|
|
Total Capital (to Risk Weighted Assets) |
|
|
|
|
|
|
|
|
|
|
|
|
|
|
|
|
Trustmark Corporation |
| $ | 1,384,050 |
|
|
| 13.10 | % |
|
| 9.250 | % |
| n/a |
| |
Trustmark National Bank |
|
| 1,365,387 |
|
|
| 12.93 | % |
|
| 9.250 | % |
|
| 10.00 | % |
|
|
|
|
|
|
|
|
|
|
|
|
|
|
|
|
|
Tier 1 Leverage (to Average Assets) |
|
|
|
|
|
|
|
|
|
|
|
|
|
|
|
|
Trustmark Corporation |
| $ | 1,303,238 |
|
|
| 9.67 | % |
|
| 4.00 | % |
| n/a |
| |
Trustmark National Bank |
|
| 1,284,575 |
|
|
| 9.54 | % |
|
| 4.00 | % |
|
| 5.00 | % |
|
|
|
|
|
|
|
|
|
|
|
|
|
|
|
|
|
At December 31, 2016: |
|
|
|
|
|
|
|
|
|
|
|
|
|
|
|
|
Common Equity Tier 1 Capital (to Risk Weighted Assets) |
|
|
|
|
|
|
|
|
|
|
|
|
|
|
|
|
Trustmark Corporation |
| $ | 1,209,927 |
|
|
| 12.16 | % |
|
| 5.125 | % |
| n/a |
| |
Trustmark National Bank |
|
| 1,251,329 |
|
|
| 12.58 | % |
|
| 5.125 | % |
|
| 6.50 | % |
|
|
|
|
|
|
|
|
|
|
|
|
|
|
|
|
|
Tier 1 Capital (to Risk Weighted Assets) |
|
|
|
|
|
|
|
|
|
|
|
|
|
|
|
|
Trustmark Corporation |
| $ | 1,269,660 |
|
|
| 12.76 | % |
|
| 6.625 | % |
| n/a |
| |
Trustmark National Bank |
|
| 1,251,329 |
|
|
| 12.58 | % |
|
| 6.625 | % |
|
| 8.00 | % |
|
|
|
|
|
|
|
|
|
|
|
|
|
|
|
|
|
Total Capital (to Risk Weighted Assets) |
|
|
|
|
|
|
|
|
|
|
|
|
|
|
|
|
Trustmark Corporation |
| $ | 1,352,322 |
|
|
| 13.59 | % |
|
| 8.625 | % |
| n/a |
| |
Trustmark National Bank |
|
| 1,333,991 |
|
|
| 13.41 | % |
|
| 8.625 | % |
|
| 10.00 | % |
|
|
|
|
|
|
|
|
|
|
|
|
|
|
|
|
|
Tier 1 Leverage (to Average Assets) |
|
|
|
|
|
|
|
|
|
|
|
|
|
|
|
|
Trustmark Corporation |
| $ | 1,269,660 |
|
|
| 9.90 | % |
|
| 4.00 | % |
| n/a |
| |
Trustmark National Bank |
|
| 1,251,329 |
|
|
| 9.77 | % |
|
| 4.00 | % |
|
| 5.00 | % |
131
133
Dividends paid by Trustmark are substantially funded from dividends received from TNB. Approval by TNB’s regulators is required if the total of all dividends declared in any calendar year exceeds the total of its net income for that year combined with its retained net income of the preceding two years.years. In 2024, TNB will have available in 2018 approximately $87.0$95.1 million plus its net income for that year to pay as dividends.
Stock Repurchase Program
On March 11, 2016,January 28, 2020, the Board of Directors of Trustmark authorized a stock repurchase program effective April 1, 2020 under which $100.0 million of Trustmark’s outstanding common stock maycould be acquired through MarchDecember 31, 2019. The2021. Under this authority, Trustmark repurchased approximately 1.9 million shares may be purchased from time to time at prevailing market prices, through open market or privately negotiated transactions, depending on market conditions. Trustmark did not repurchase any of its outstanding common stock valued at $61.8 million during the year ended December 31, 2017, compared to2021.
On December 7, 2021, Trustmark’s Board of Directors authorized a stock repurchase program effective January 1, 2022, under which $100.0 million of Trustmark’s outstanding shares could be acquired through December 31, 2022. Under this authority, Trustmark repurchased approximately 34789 thousand shares of its common stock valued at approximately $750 thousand repurchased$24.6 million during the yeartwelve months ended December 31, 2016.2022.
On December 6, 2022, Trustmark’s Board of Directors authorized a stock repurchase program effective January 1, 2023, under which $50.0 million of Trustmark’s outstanding shares could be acquired through December 31, 2023. No shares were repurchased under this stock repurchase program.
On December 5, 2023, Trustmark’s Board of Directors authorized a stock repurchase program effective January 1, 2024, under which $50.0 million of Trustmark’s outstanding shares may be acquired through December 31, 2024. The repurchase program, which is subject to market conditions and management discretion, will be implemented through open market repurchases or privately negotiated transactions. No shares have been repurchased under this stock repurchase program.
Other Comprehensive Income (Loss) and Accumulated Other Comprehensive LossIncome (Loss)
The following tables present the net change in the components of accumulated other comprehensive lossincome (loss) and the related tax effects allocated to each component for the years ended December 31, 2017, 20162023, 2022 and 20152021 ($ in thousands). Reclassification adjustments related to securities available for sale are included in securities gains (losses), net in the accompanying consolidated statements of income. The amortization of prior service cost, recognized net loss due to lump sum settlements and change in net actuarial loss and recognized net loss due to defined benefit plan termination for pension and other postretirement benefit plans are included in the computation of net periodic benefit cost (see Note 14 – Defined Benefit and Other Postretirement Benefits for additional details). Reclassification adjustments related to pension and other postretirement benefit plans are included in salaries and employee benefits defined benefit plan termination and other expense in the accompanying consolidated statements of income. Reclassification adjustments related to the cash flow hedge derivativederivatives are included in other interest expenseand fees on LHFS and LHFI in the accompanying consolidated statements of income.
132
|
| Before Tax |
|
| Tax (Expense) |
|
| Net of Tax |
| |||
|
| Amount |
|
| Benefit |
|
| Amount |
| |||
Year Ended December 31, 2017 |
|
|
|
|
|
|
|
|
|
|
|
|
Securities available for sale and transferred securities: |
|
|
|
|
|
|
|
|
|
|
|
|
Unrealized holding gains (losses) arising during the period |
| $ | (13,994 | ) |
| $ | 5,353 |
|
| $ | (8,641 | ) |
Reclassification adjustment for net (gains) losses realized in net income |
|
| (15 | ) |
|
| 6 |
|
|
| (9 | ) |
Change in net unrealized holding loss on securities transferred to held to maturity |
|
| 4,721 |
|
|
| (1,806 | ) |
|
| 2,915 |
|
Total securities available for sale and transferred securities |
|
| (9,288 | ) |
|
| 3,553 |
|
|
| (5,735 | ) |
Pension and other postretirement benefit plans: |
|
|
|
|
|
|
|
|
|
|
|
|
Net change in prior service costs |
|
| 250 |
|
|
| (96 | ) |
|
| 154 |
|
Change in net actuarial loss |
|
| 731 |
|
|
| (280 | ) |
|
| 451 |
|
Recognized net loss due to defined benefit plan termination |
|
| 17,662 |
|
|
| (6,755 | ) |
|
| 10,907 |
|
Total pension and other postretirement benefit plans |
|
| 18,643 |
|
|
| (7,131 | ) |
|
| 11,512 |
|
Cash flow hedge derivatives: |
|
|
|
|
|
|
|
|
|
|
|
|
Change in accumulated gain (loss) on effective cash flow hedge derivatives |
|
| 198 |
|
|
| (76 | ) |
|
| 122 |
|
Reclassification adjustment for loss realized in net income |
|
| 282 |
|
|
| (108 | ) |
|
| 174 |
|
Total cash flow hedge derivatives |
|
| 480 |
|
|
| (184 | ) |
|
| 296 |
|
Total other comprehensive income (loss) |
| $ | 9,835 |
|
| $ | (3,762 | ) |
| $ | 6,073 |
|
|
|
|
|
|
|
|
|
|
|
|
|
|
Year Ended December 31, 2016 |
|
|
|
|
|
|
|
|
|
|
|
|
Securities available for sale and transferred securities: |
|
|
|
|
|
|
|
|
|
|
|
|
Unrealized holding gains (losses) arising during the period |
| $ | (15,656 | ) |
| $ | 5,989 |
|
| $ | (9,667 | ) |
Reclassification adjustment for net (gains) losses realized in net income |
|
| 310 |
|
|
| (119 | ) |
|
| 191 |
|
Change in net unrealized holding loss on securities transferred to held to maturity |
|
| 9,830 |
|
|
| (3,760 | ) |
|
| 6,070 |
|
Total securities available for sale and transferred securities |
|
| (5,516 | ) |
|
| 2,110 |
|
|
| (3,406 | ) |
Pension and other postretirement benefit plans: |
|
|
|
|
|
|
|
|
|
|
|
|
Net change in prior service costs |
|
| 250 |
|
|
| (96 | ) |
|
| 154 |
|
Recognized net loss due to lump sum settlements |
|
| 3,906 |
|
|
| (1,494 | ) |
|
| 2,412 |
|
Change in net actuarial loss |
|
| 476 |
|
|
| (182 | ) |
|
| 294 |
|
Total pension and other postretirement benefit plans |
|
| 4,632 |
|
|
| (1,772 | ) |
|
| 2,860 |
|
Cash flow hedge derivatives: |
|
|
|
|
|
|
|
|
|
|
|
|
Change in accumulated gain (loss) on effective cash flow hedge derivatives |
|
| (369 | ) |
|
| 141 |
|
|
| (228 | ) |
Reclassification adjustment for loss realized in net income |
|
| 599 |
|
|
| (229 | ) |
|
| 370 |
|
Total cash flow hedge derivatives |
|
| 230 |
|
|
| (88 | ) |
|
| 142 |
|
Total other comprehensive income (loss) |
| $ | (654 | ) |
| $ | 250 |
|
| $ | (404 | ) |
|
|
|
|
|
|
|
|
|
|
|
|
|
Year Ended December 31, 2015 |
|
|
|
|
|
|
|
|
|
|
|
|
Securities available for sale and transferred securities: |
|
|
|
|
|
|
|
|
|
|
|
|
Unrealized holding gains (losses) arising during the period |
| $ | (16,695 | ) |
| $ | 6,386 |
|
| $ | (10,309 | ) |
Reclassification adjustment for net (gains) losses realized in net income |
|
| — |
|
|
| — |
|
|
| — |
|
Change in net unrealized holding loss on securities transferred to held to maturity |
|
| 6,345 |
|
|
| (2,427 | ) |
|
| 3,918 |
|
Total securities available for sale and transferred securities |
|
| (10,350 | ) |
|
| 3,959 |
|
|
| (6,391 | ) |
Pension and other postretirement benefit plans: |
|
|
|
|
|
|
|
|
|
|
|
|
Net change in prior service costs |
|
| 250 |
|
|
| (96 | ) |
|
| 154 |
|
Recognized net loss due to lump sum settlements |
|
| 2,221 |
|
|
| (850 | ) |
|
| 1,371 |
|
Change in net actuarial loss |
|
| 3,647 |
|
|
| (1,395 | ) |
|
| 2,252 |
|
Total pension and other postretirement benefit plans |
|
| 6,118 |
|
|
| (2,341 | ) |
|
| 3,777 |
|
Cash flow hedge derivatives: |
|
|
|
|
|
|
|
|
|
|
|
|
Change in accumulated gain (loss) on effective cash flow hedge derivatives |
|
| (1,315 | ) |
|
| 503 |
|
|
| (812 | ) |
Reclassification adjustment for loss realized in net income |
|
| 836 |
|
|
| (320 | ) |
|
| 516 |
|
Total cash flow hedge derivatives |
|
| (479 | ) |
|
| 183 |
|
|
| (296 | ) |
Total other comprehensive income (loss) |
| $ | (4,711 | ) |
| $ | 1,801 |
|
| $ | (2,910 | ) |
|
| Before Tax |
|
| Tax (Expense) |
|
| Net of Tax |
| |||
|
| Amount |
|
| Benefit |
|
| Amount |
| |||
Year Ended December 31, 2023 |
|
|
|
|
|
|
|
|
| |||
Securities available for sale and transferred securities: |
|
|
|
|
|
|
|
|
| |||
Net unrealized holding gains (losses) arising during the period |
| $ | 50,537 |
|
| $ | (12,404 | ) |
| $ | 38,133 |
|
Reclassification adjustment for net (gains) losses realized in net income |
|
| (39 | ) |
|
| 10 |
|
|
| (29 | ) |
Change in net unrealized holding loss on securities transferred to held to maturity |
|
| 15,557 |
|
|
| (3,889 | ) |
|
| 11,668 |
|
Total securities available for sale and transferred securities |
|
| 66,055 |
|
|
| (16,283 | ) |
|
| 49,772 |
|
Pension and other postretirement benefit plans: |
|
|
|
|
|
|
|
|
| |||
Change in the actuarial loss of pension and other postretirement |
|
| (691 | ) |
|
| 173 |
|
|
| (518 | ) |
Reclassification adjustments for changes realized in net income: |
|
|
|
|
|
|
|
|
| |||
Net change in prior service costs |
|
| 111 |
|
|
| (28 | ) |
|
| 83 |
|
Recognized net loss due to lump sum settlements |
|
| 25 |
|
|
| (6 | ) |
|
| 19 |
|
Change in net actuarial loss |
|
| 177 |
|
|
| (44 | ) |
|
| 133 |
|
Total pension and other postretirement benefit plans |
|
| (378 | ) |
|
| 95 |
|
|
| (283 | ) |
Cash flow hedge derivatives: |
|
|
|
|
|
|
|
|
| |||
Change in accumulated gain (loss) on effective cash flow hedge derivatives |
|
| (8,131 | ) |
|
| 2,033 |
|
|
| (6,098 | ) |
Reclassification adjustment for (gain) loss realized in net income |
|
| 16,385 |
|
|
| (4,096 | ) |
|
| 12,289 |
|
Total cash flow hedge derivatives |
|
| 8,254 |
|
|
| (2,063 | ) |
|
| 6,191 |
|
Total other comprehensive income (loss) |
| $ | 73,931 |
|
| $ | (18,251 | ) |
| $ | 55,680 |
|
|
|
|
|
|
|
|
|
|
| |||
Year Ended December 31, 2022 |
|
|
|
|
|
|
|
|
| |||
Securities available for sale and transferred securities: |
|
|
|
|
|
|
|
|
| |||
Net unrealized holding gains (losses) arising during the period |
| $ | (229,524 | ) |
| $ | 57,381 |
|
| $ | (172,143 | ) |
Change in net unrealized holding loss on securities transferred to held to maturity |
|
| (86,033 | ) |
|
| 21,508 |
|
|
| (64,525 | ) |
Total securities available for sale and transferred securities |
|
| (315,557 | ) |
|
| 78,889 |
|
|
| (236,668 | ) |
Pension and other postretirement benefit plans: |
|
|
|
|
|
|
|
|
| |||
Change in the actuarial loss of pension and other postretirement |
|
| 10,792 |
|
|
| (2,698 | ) |
|
| 8,094 |
|
Reclassification adjustments for changes realized in net income: |
|
|
|
|
|
|
|
|
| |||
Net change in prior service costs |
|
| 111 |
|
|
| (28 | ) |
|
| 83 |
|
Change in net actuarial loss |
|
| 1,089 |
|
|
| (272 | ) |
|
| 817 |
|
Total pension and other postretirement benefit plans |
|
| 11,992 |
|
|
| (2,998 | ) |
|
| 8,994 |
|
Cash flow hedge derivatives: |
|
|
|
|
|
|
|
|
| |||
Change in accumulated gain (loss) on effective cash flow hedge derivatives |
|
| (20,685 | ) |
|
| 5,171 |
|
|
| (15,514 | ) |
Reclassification adjustment for (gain) loss realized in net income |
|
| 460 |
|
|
| (115 | ) |
|
| 345 |
|
Total cash flow hedge derivatives |
|
| (20,225 | ) |
|
| 5,056 |
|
|
| (15,169 | ) |
Total other comprehensive income (loss) |
| $ | (323,790 | ) |
| $ | 80,947 |
|
| $ | (242,843 | ) |
|
|
|
|
|
|
|
|
|
| |||
Year Ended December 31, 2021 |
|
|
|
|
|
|
|
|
| |||
Securities available for sale and transferred securities: |
|
|
|
|
|
|
|
|
| |||
Net unrealized holding gains (losses) arising during the period |
| $ | (49,454 | ) |
| $ | 12,364 |
|
| $ | (37,090 | ) |
Change in net unrealized holding loss on securities transferred to held to maturity |
|
| 2,647 |
|
|
| (662 | ) |
|
| 1,985 |
|
Total securities available for sale and transferred securities |
|
| (46,807 | ) |
|
| 11,702 |
|
|
| (35,105 | ) |
Pension and other postretirement benefit plans: |
|
|
|
|
|
|
|
|
| |||
Change in the actuarial loss of pension and other postretirement |
|
| 2,845 |
|
|
| (711 | ) |
|
| 2,134 |
|
Reclassification adjustments for changes realized in net income: |
|
|
|
|
|
|
|
|
| |||
Net change in prior service costs |
|
| 111 |
|
|
| (27 | ) |
|
| 84 |
|
Recognized net loss due to lump sum settlements |
|
| 183 |
|
|
| (46 | ) |
|
| 137 |
|
Change in net actuarial loss |
|
| 1,655 |
|
|
| (414 | ) |
|
| 1,241 |
|
Total pension and other postretirement benefit plans |
|
| 4,794 |
|
|
| (1,198 | ) |
|
| 3,596 |
|
Total other comprehensive income (loss) |
| $ | (42,013 | ) |
| $ | 10,504 |
|
| $ | (31,509 | ) |
135
133
The following table presents the changes in the balances of each component of accumulated other comprehensive lossincome (loss) for the periods presented ($ in thousands). All amounts are presented net of tax.
|
| Securities |
|
| Defined |
|
| Cash Flow Hedge Derivative |
|
| Total |
| ||||
Balance, January 1, 2021 |
| $ | 17,331 |
|
| $ | (18,382 | ) |
| $ | — |
|
| $ | (1,051 | ) |
Other comprehensive income (loss) before |
|
| (35,105 | ) |
|
| 2,134 |
|
|
| — |
|
|
| (32,971 | ) |
Amounts reclassified from accumulated other |
|
| — |
|
|
| 1,462 |
|
|
| — |
|
|
| 1,462 |
|
Net other comprehensive income (loss) |
|
| (35,105 | ) |
|
| 3,596 |
|
|
| — |
|
|
| (31,509 | ) |
Balance, December 31, 2021 |
|
| (17,774 | ) |
|
| (14,786 | ) |
|
| — |
|
|
| (32,560 | ) |
Other comprehensive income (loss) before |
|
| (236,668 | ) |
|
| 8,094 |
|
|
| (15,514 | ) |
|
| (244,088 | ) |
Amounts reclassified from accumulated other |
|
| — |
|
|
| 900 |
|
|
| 345 |
|
|
| 1,245 |
|
Net other comprehensive income (loss) |
|
| (236,668 | ) |
|
| 8,994 |
|
|
| (15,169 | ) |
|
| (242,843 | ) |
Balance, December 31, 2022 |
|
| (254,442 | ) |
|
| (5,792 | ) |
|
| (15,169 | ) |
|
| (275,403 | ) |
Other comprehensive income (loss) before reclassification |
|
| 49,801 |
|
|
| (518 | ) |
|
| (6,098 | ) |
|
| 43,185 |
|
Amounts reclassified from accumulated other |
|
| (29 | ) |
|
| 235 |
|
|
| 12,289 |
|
|
| 12,495 |
|
Net other comprehensive income (loss) |
|
| 49,772 |
|
|
| (283 | ) |
|
| 6,191 |
|
|
| 55,680 |
|
Balance, December 31, 2023 |
| $ | (204,670 | ) |
| $ | (6,075 | ) |
| $ | (8,978 | ) |
| $ | (219,723 | ) |
|
| Securities Available for Sale and Transferred Securities |
|
| Defined Benefit Pension Items |
|
| Cash Flow Hedge Derivative |
|
| Total |
| ||||
Balance, January 1, 2015 |
| $ | (11,003 | ) |
| $ | (31,617 | ) |
| $ | 136 |
|
| $ | (42,484 | ) |
Other comprehensive income (loss) before reclassification |
|
| (6,391 | ) |
|
| 3,777 |
|
|
| (812 | ) |
|
| (3,426 | ) |
Amounts reclassified from accumulated other comprehensive loss |
|
| — |
|
|
| — |
|
|
| 516 |
|
|
| 516 |
|
Net other comprehensive income (loss) |
|
| (6,391 | ) |
|
| 3,777 |
|
|
| (296 | ) |
|
| (2,910 | ) |
Balance, December 31, 2015 |
|
| (17,394 | ) |
|
| (27,840 | ) |
|
| (160 | ) |
|
| (45,394 | ) |
Other comprehensive income (loss) before reclassification |
|
| (3,597 | ) |
|
| (148 | ) |
|
| (228 | ) |
|
| (3,973 | ) |
Amounts reclassified from accumulated other comprehensive loss |
|
| 191 |
|
|
| 3,008 |
|
|
| 370 |
|
|
| 3,569 |
|
Net other comprehensive income (loss) |
|
| (3,406 | ) |
|
| 2,860 |
|
|
| 142 |
|
|
| (404 | ) |
Balance, December 31, 2016 |
|
| (20,800 | ) |
|
| (24,980 | ) |
|
| (18 | ) |
|
| (45,798 | ) |
Other comprehensive income (loss) before reclassification |
|
| (5,726 | ) |
|
| (760 | ) |
|
| 122 |
|
|
| (6,364 | ) |
Amounts reclassified from accumulated other comprehensive loss |
|
| (9 | ) |
|
| 12,272 |
|
|
| 174 |
|
|
| 12,437 |
|
Net other comprehensive income (loss) |
|
| (5,735 | ) |
|
| 11,512 |
|
|
| 296 |
|
|
| 6,073 |
|
Balance, December 31, 2017 |
| $ | (26,535 | ) |
| $ | (13,468 | ) |
| $ | 278 |
|
| $ | (39,725 | ) |
Note 18 – Fair Value
Financial Instruments Measured at Fair Value
The methodologies Trustmark uses in determining the fair values are based primarily on the use of independent, market-based data to reflect a value that would be reasonably expected upon exchange of the position in an orderly transaction between market participants at the measurement date. The predominant portion of assets that are stated at fair value are of a nature that can be valued using prices or inputs that are readily observable through a variety of independent data providers. The providers selected by Trustmark for fair valuation data are widely recognized and accepted vendors whose evaluations support the pricing functions of financial institutions, investment and mutual funds, and portfolio managers. Trustmark has documented and evaluated the pricing methodologies used by the vendors and maintains internal processes that regularly test valuations for anomalies.
Trustmark utilizes an independent pricing service to advise it on the carrying value of the securities available for sale portfolio. As part of Trustmark’s procedures, the price provided from the service is evaluated for reasonableness given market changes. When a questionable price exists, Trustmark investigates further to determine if the price is valid. If needed, other market participants may be utilized to determine the correct fair value. Trustmark has also reviewed and confirmed its determinations in thorough discussions with the pricing source regarding their methods of price discovery.
Mortgage loan commitments are valued based on the securities prices of similar collateral, term, rate and delivery for which the loan is eligible to deliver in place of the particular security. Trustmark acquires a broad array of mortgage security prices that are supplied by a market data vendor, which in turn accumulates prices from a broad list of securities dealers. Prices are processed through a mortgage pipeline management system that accumulates and segregates all loan commitment and forward-sale transactions according to the similarity of various characteristics (maturity, term, rate, and collateral). Prices are matched to those positions that are deemed to be an eligible substitute or offset (i.e.(i.e., “deliverable”) for a corresponding security observed in the market place.marketplace.
Trustmark estimates fair value of the MSR through the use of prevailing market participant assumptions and market participant valuation processes. This valuation is periodically tested and validated against other third-party firm valuations.
Trustmark obtains the fair value of interest rate swaps from a third-party pricing service that uses an industry standard discounted cash flow methodology. In addition, credit valuation adjustments are incorporated in the fair values to account for potential nonperformance risk. In adjusting the fair value of its interest rate swap contracts for the effect of nonperformance risk, Trustmark has considered any applicable credit enhancements such as collateral postings, thresholds, mutual puts, and guarantees. In conjunction with the FASB’s
134
fair value measurement guidance, Trustmark made an accounting policy election to measure the credit risk of these derivative financial instruments, which are subject to master netting agreements, on a net basis by counterparty portfolio.
136
Trustmark has determined that the majority of the inputs used to value its interest rate swaps offered to qualified commercial borrowers fall within Level 2 of the fair value hierarchy, while the credit valuation adjustments associated with these derivatives utilize Level 3 inputs, such as estimates of current credit spreads. Trustmark has assessed the significance of the impact of the credit valuation adjustments on the overall valuation of its interest rate swaps and has determined that the credit valuation adjustment is not significant to the overall valuation of these derivatives. As a result, Trustmark classifies its interest rate swap valuations in Level 2 of the fair value hierarchy.
Trustmark also utilizes exchange-traded derivative instruments such as Treasury note futures contracts and option contracts to achieve a fair value return that offsets the changes in fair value of the MSR attributable to interest rates. Fair values of these derivative instruments are determined from quoted prices in active markets for identical assets therefore allowing them to be classified within Level 1 of the fair value hierarchy. In addition, Trustmark utilizes derivative instruments such as interest rate lock commitments in its mortgage banking area which lack observable inputs for valuation purposes resulting in their inclusion in Level 3 of the fair value hierarchy.
At this time, Trustmark presents no fair values that are derived through internal modeling. Should positions requiring fair valuation arise that are not relevant to existing methodologies, Trustmark will make every reasonable effort to obtain market participant assumptions, or independent evaluation.
Financial Assets and Liabilities
The following tables summarize financial assets and financial liabilities measured at fair value on a recurring basis as ofat December 31, 20172023 and 2016,2022, segregated by the level of valuation inputs within the fair value hierarchy utilized to measure fair value ($ in thousands). There were no transfers between fair value levels for the years ended December 31, 20172023 and 2016.2022.
|
| December 31, 2023 |
| |||||||||||||
|
| Total |
|
| Level 1 |
|
| Level 2 |
|
| Level 3 |
| ||||
U.S. Treasury securities |
| $ | 372,368 |
|
| $ | 372,368 |
|
| $ | — |
|
| $ | — |
|
U.S. Government agency obligations |
|
| 5,792 |
|
|
| — |
|
|
| 5,792 |
|
|
| — |
|
Obligations of states and political subdivisions |
|
| — |
|
|
| — |
|
|
| — |
|
|
| — |
|
Mortgage-backed securities |
|
| 1,384,718 |
|
|
| — |
|
|
| 1,384,718 |
|
|
| — |
|
Securities available for sale |
|
| 1,762,878 |
|
|
| 372,368 |
|
|
| 1,390,510 |
|
|
| — |
|
LHFS |
|
| 184,812 |
|
|
| — |
|
|
| 184,812 |
|
|
| — |
|
MSR |
|
| 131,870 |
|
|
| — |
|
|
| — |
|
|
| 131,870 |
|
Other assets - derivatives |
|
| 23,316 |
|
|
| 7,685 |
|
|
| 14,786 |
|
|
| 845 |
|
Other liabilities - derivatives |
|
| 35,600 |
|
|
| 21 |
|
|
| 35,579 |
|
|
| — |
|
|
| December 31, 2022 |
| |||||||||||||
|
| Total |
|
| Level 1 |
|
| Level 2 |
|
| Level 3 |
| ||||
U.S. Treasury securities |
| $ | 391,513 |
|
| $ | 391,513 |
|
| $ | — |
|
| $ | — |
|
U.S. Government agency obligations |
|
| 7,766 |
|
|
| — |
|
|
| 7,766 |
|
|
| — |
|
Obligations of states and political subdivisions |
|
| 4,862 |
|
|
| — |
|
|
| 4,862 |
|
|
| — |
|
Mortgage-backed securities |
|
| 1,619,941 |
|
|
| — |
|
|
| 1,619,941 |
|
|
| — |
|
Securities available for sale |
|
| 2,024,082 |
|
|
| 391,513 |
|
|
| 1,632,569 |
|
|
| — |
|
LHFS |
|
| 135,226 |
|
|
| — |
|
|
| 135,226 |
|
|
| — |
|
MSR |
|
| 129,677 |
|
|
| — |
|
|
| — |
|
|
| 129,677 |
|
Other assets - derivatives |
|
| 8,871 |
|
|
| 54 |
|
|
| 8,660 |
|
|
| 157 |
|
Other liabilities - derivatives |
|
| 45,379 |
|
|
| 474 |
|
|
| 44,905 |
|
|
| — |
|
|
| December 31, 2017 |
| |||||||||||||
|
| Total |
|
| Level 1 |
|
| Level 2 |
|
| Level 3 |
| ||||
U.S. Government agency obligations |
| $ | 45,285 |
|
| $ | — |
|
| $ | 45,285 |
|
| $ | — |
|
Obligations of states and political subdivisions |
|
| 79,229 |
|
|
| — |
|
|
| 79,229 |
|
|
| — |
|
Mortgage-backed securities |
|
| 2,114,121 |
|
|
| — |
|
|
| 2,114,121 |
|
|
| — |
|
Securities available for sale |
|
| 2,238,635 |
|
|
| — |
|
|
| 2,238,635 |
|
|
| — |
|
Loans held for sale |
|
| 180,512 |
|
|
| — |
|
|
| 180,512 |
|
|
| — |
|
Mortgage servicing rights |
|
| 84,269 |
|
|
| — |
|
|
| — |
|
|
| 84,269 |
|
Other assets - derivatives |
|
| 1,516 |
|
|
| (1,013 | ) |
|
| 1,629 |
|
|
| 900 |
|
Other liabilities - derivatives |
|
| 2,678 |
|
|
| 616 |
|
|
| 2,062 |
|
|
| — |
|
135
|
| December 31, 2016 |
| |||||||||||||
|
| Total |
|
| Level 1 |
|
| Level 2 |
|
| Level 3 |
| ||||
U.S. Government agency obligations |
| $ | 56,039 |
|
| $ | — |
|
| $ | 56,039 |
|
| $ | — |
|
Obligations of states and political subdivisions |
|
| 115,373 |
|
|
| — |
|
|
| 115,373 |
|
|
| — |
|
Mortgage-backed securities |
|
| 2,185,270 |
|
|
| — |
|
|
| 2,185,270 |
|
|
| — |
|
Securities available for sale |
|
| 2,356,682 |
|
|
| — |
|
|
| 2,356,682 |
|
|
| — |
|
Loans held for sale |
|
| 175,927 |
|
|
| — |
|
|
| 175,927 |
|
|
| — |
|
Mortgage servicing rights |
|
| 80,239 |
|
|
| — |
|
|
| — |
|
|
| 80,239 |
|
Other assets - derivatives |
|
| 2,518 |
|
|
| (524 | ) |
|
| 2,041 |
|
|
| 1,001 |
|
Other liabilities - derivatives |
|
| 412 |
|
|
| 1,174 |
|
|
| (762 | ) |
|
| — |
|
137
The changes in Level 3 assets measured at fair value on a recurring basis for the years ended December 31, 20172023 and 20162022 are summarized as follows ($ in thousands):
|
| MSR |
|
| Other Assets - |
| ||
Balance, January 1, 2023 |
| $ | 129,677 |
|
| $ | 157 |
|
Total net (loss) gain included in Mortgage banking, net (1) |
|
| (11,519 | ) |
|
| 2,470 |
|
Additions |
|
| 13,712 |
|
|
| — |
|
Sales |
|
| — |
|
|
| (1,782 | ) |
Balance, December 31, 2023 |
| $ | 131,870 |
|
| $ | 845 |
|
|
|
|
|
|
|
| ||
The amount of total gains (losses) for the period included in earnings that are |
| $ | (1,489 | ) |
| $ | 1,103 |
|
|
|
|
|
|
|
| ||
Balance, January 1, 2022 |
| $ | 87,687 |
|
| $ | 1,859 |
|
Total net (loss) gain included in Mortgage banking, net (1) |
|
| 24,147 |
|
|
| (131 | ) |
Additions |
|
| 17,843 |
|
|
| — |
|
Sales |
|
| — |
|
|
| (1,571 | ) |
Balance, December 31, 2022 |
| $ | 129,677 |
|
| $ | 157 |
|
|
|
|
|
|
|
| ||
The amount of total gains (losses) for the period included in earnings that are |
| $ | 38,181 |
|
| $ | (1,214 | ) |
|
| MSR |
|
| Other Assets - Derivatives |
| ||
Balance, January 1, 2017 |
| $ | 80,239 |
|
| $ | 1,001 |
|
Total net (loss) gain included in Mortgage banking, net (1) |
|
| (11,830 | ) |
|
| 4,165 |
|
Additions |
|
| 15,860 |
|
|
| — |
|
Sales |
|
| — |
|
|
| (4,266 | ) |
Balance, December 31, 2017 |
| $ | 84,269 |
|
| $ | 900 |
|
|
|
|
|
|
|
|
|
|
The amount of total gains (losses) for the period included in earnings that are attributable to the change in unrealized gains or losses still held at December 31, 2017 |
| $ | (1,050 | ) |
| $ | (1,569 | ) |
|
|
|
|
|
|
|
|
|
Balance, January 1, 2016 |
| $ | 74,007 |
|
| $ | 1,113 |
|
Total net (loss) gain included in Mortgage banking, net (1) |
|
| (10,513 | ) |
|
| 10,128 |
|
Additions |
|
| 16,745 |
|
|
| — |
|
Sales |
|
| — |
|
|
| (10,240 | ) |
Balance, December 31, 2016 |
| $ | 80,239 |
|
| $ | 1,001 |
|
|
|
|
|
|
|
|
|
|
The amount of total gains (losses) for the period included in earnings that are attributable to the change in unrealized gains or losses still held at December 31, 2016 |
| $ | (407 | ) |
| $ | 753 |
|
|
|
Trustmark may be required, from time to time, to measure certain assets at fair value on a nonrecurring basis in accordance with GAAP. Assets at December 31, 2017,2023, which have been measured at fair value on a nonrecurring basis, include impairedcollateral-dependent LHFI. Loans for which itA loan is probable Trustmark will be unable to collectcollateral dependent when the scheduled payments of principal or interest when due according to the contractual termsborrower is experiencing financial difficulty and repayment of the loan agreement are considered impaired. Specific allowances for impaired LHFI are based on comparisonsis expected to be provided substantially through the sale of the recorded carrying valuescollateral. The expected credit loss for collateral-dependent loans is measured as the difference between the amortized cost basis of the loans to the present value of the estimated cash flows of these loans at each loan’s original effective interest rate,loan and the fair value of the collateral, oradjusted for the observable market prices of the loans. Impaired LHFI are primarily collateral dependent loans and are assessed using a fair value approach.estimated cost to sell. Fair value estimates for collateral dependentcollateral-dependent loans are derived from appraised values based on the current market value or as-isas is value of the property being appraised,collateral, normally from recently received and reviewed appraisals. Current appraisals are ordered on an annual basis based on the inspection date or more often if market conditions necessitate. Appraisals are obtained from state-certified appraisers and are based on certain assumptions, which may include construction or development status and the highest and best use of the property. These appraisals are reviewed by Trustmark’s Appraisal Review Department to ensure they are acceptable. Appraisedacceptable, and values are adjusted down for costs associated with asset disposal. At December 31, 2017,2023, Trustmark had outstanding balances of $48.9$49.1 million with a related ACL of $12.4 million in impairedcollateral-dependent LHFI, that were individually evaluated for impairment and written down to fair value of the underlying collateral less cost to sell based on the fair value of the collateral or other unobservable input compared to $27.1outstanding balances of $40.3 million with a related ACL of $17.7 million in collateral-dependent LHFI at December 31, 2016. These individually evaluated impaired2022. The collateral-dependent LHFI are classified as Level 3 in the fair value hierarchy. Impaired LHFI are periodically reviewed and evaluated for additional impairment and adjusted accordingly based on the same factors identified above.
Nonfinancial Assets and Liabilities
Certain nonfinancial assets measured at fair value on a nonrecurring basis include foreclosed assets (upon initial recognition or subsequent impairment), nonfinancial assets and nonfinancial liabilities measured at fair value in the second step of a goodwill impairment test, and intangible assets and other nonfinancial long-lived assets measured at fair value for impairment assessment.
Other real estate includes assets that have been acquired in satisfaction of debt through foreclosure and is carriedrecorded at the lowerfair value less cost to sell (estimated fair value) at the time of cost or estimated fair value.foreclosure. Fair value is based on independent appraisals and other relevant factors. In the determination of fair value subsequent to foreclosure, Management also considers other factors or recent developments, such as changes in market conditions from the time of valuation and anticipated sales values considering plans for disposition, which could result in an adjustment to lower the collateral value estimates indicated in the appraisals. Periodic revaluations are classified as Level 3 in the fair value hierarchy since assumptions are used that may not be observable in the market.
138
Foreclosed assets of $26.6 million$898 thousand were re-measured during 20172023, requiring write-downs of $3.3 million$243 thousand to reach their current fair values compared to $32.2$3.0 million of foreclosed assets that were re-measured during 2016,2022, requiring write-downs of $4.4$1.0 million.
136
Fair Value of Financial Instruments
The carrying amounts and estimated fair values of financial instruments at December 31, 2017 and 2016 were as follows ($ in thousands):
|
| December 31, 2017 |
|
| December 31, 2016 |
| ||||||||||
|
| Carrying Value |
|
| Estimated Fair Value |
|
| Carrying Value |
|
| Estimated Fair Value |
| ||||
Financial Assets: |
|
|
|
|
|
|
|
|
|
|
|
|
|
|
|
|
Level 2 Inputs: |
|
|
|
|
|
|
|
|
|
|
|
|
|
|
|
|
Cash and short-term investments |
| $ | 336,383 |
|
| $ | 336,383 |
|
| $ | 328,206 |
|
| $ | 328,206 |
|
Securities held to maturity |
|
| 1,056,486 |
|
|
| 1,046,247 |
|
|
| 1,158,643 |
|
|
| 1,157,046 |
|
Level 3 Inputs: |
|
|
|
|
|
|
|
|
|
|
|
|
|
|
|
|
Net LHFI |
|
| 8,493,234 |
|
|
| 8,507,469 |
|
|
| 7,779,948 |
|
|
| 7,825,009 |
|
Net acquired loans |
|
| 257,438 |
|
|
| 257,438 |
|
|
| 260,850 |
|
|
| 260,850 |
|
|
|
|
|
|
|
|
|
|
|
|
|
|
|
|
|
|
Financial Liabilities: |
|
|
|
|
|
|
|
|
|
|
|
|
|
|
|
|
Level 2 Inputs: |
|
|
|
|
|
|
|
|
|
|
|
|
|
|
|
|
Deposits |
|
| 10,577,512 |
|
|
| 10,577,858 |
|
|
| 10,056,012 |
|
|
| 10,059,794 |
|
Short-term liabilities |
|
| 1,440,876 |
|
|
| 1,440,876 |
|
|
| 1,309,595 |
|
|
| 1,309,595 |
|
Long-term FHLB advances |
|
| 946 |
|
|
| 946 |
|
|
| 251,049 |
|
|
| 251,050 |
|
Junior subordinated debt securities |
|
| 61,856 |
|
|
| 45,773 |
|
|
| 61,856 |
|
|
| 41,057 |
|
FASB ASC Topic 825 requires disclosure of the fair value of financial assets and financial liabilities, including those financial assets and financial liabilities that are not measured and reported at fair value on a recurring basis or non-recurring basis.
The methodologycarrying amounts and significant assumptions used in estimating theestimated fair values presented above are as follows:
In cases where quoted market prices are not available, fair values are generally based on estimates using present value techniques. Trustmark’s premise in present value techniques is to represent the fair values on a basis of replacement value of the existing instrument given observed market rates on the measurement date. These techniques are significantly affected by the assumptions used, including the discount rate and estimates of future cash flows. In that regard, the derived fair value estimates for those assets or liabilities cannot be necessarily substantiated by comparison to independent markets and, in many cases, may not be realizable in immediate settlement of the instruments. The estimated fair value of financial instruments with immediate and shorter-term maturities (generally 90 days or less) is assumed to be the same as the recorded book value. All nonfinancial instruments, by definition, have been excluded from these disclosure requirements. Accordingly, the aggregate fair value amounts presented do not represent the underlying value of Trustmark.
Cash and Short-Term Investments
The carrying amounts for cash and due from banks and short-term investments (federal funds sold and securities purchased under reverse repurchase agreements) approximate fair values due to their immediate and shorter-term maturities.
Securities Held to Maturity
Estimated fair values for securities held to maturity are based on quoted market prices where available. If quoted market prices are not available, estimated fair values are based on quoted market prices of comparable instruments.
Net LHFI
The fair values of net LHFI are estimated for portfolios of loans with similar financial characteristics. For variable rate LHFI that reprice frequently with no significant change in credit risk, fair values are based on carrying values. The fair values of certain mortgage LHFI, such as 1-4 family residential properties, are based on quoted market prices of similar loans sold in conjunction with securitization transactions, adjusted for differences in loan characteristics. The fair values of other types of LHFI are estimated by discounting the future cash flows using the current rates at which similar loans would be made to borrowers with similar credit ratings and for the same remaining maturities. The processes for estimating the fair value of net LHFI described above do not represent an exit price under FASB ASC Topic 820 and such an exit price could potentially produce a different fair value estimate at December 31, 20172023 and 2016.2022 were as follows ($ in thousands):
139
|
| December 31, 2023 |
|
| December 31, 2022 |
| ||||||||||
|
| Carrying |
|
| Estimated |
|
| Carrying |
|
| Estimated |
| ||||
Financial Assets: |
|
|
|
|
|
|
|
|
|
|
|
| ||||
Level 2 Inputs: |
|
|
|
|
|
|
|
|
|
|
|
| ||||
Cash and short-term investments |
| $ | 975,543 |
|
| $ | 975,543 |
|
| $ | 738,787 |
|
| $ | 738,787 |
|
Securities held to maturity |
|
| 1,426,279 |
|
|
| 1,355,504 |
|
|
| 1,494,514 |
|
|
| 1,406,589 |
|
Level 3 Inputs: |
|
|
|
|
|
|
|
|
|
|
|
| ||||
Net LHFI |
|
| 12,811,157 |
|
|
| 12,762,505 |
|
|
| 12,083,825 |
|
|
| 11,850,318 |
|
|
|
|
|
|
|
|
|
|
|
|
|
| ||||
Financial Liabilities: |
|
|
|
|
|
|
|
|
|
|
|
| ||||
Level 2 Inputs: |
|
|
|
|
|
|
|
|
|
|
|
| ||||
Deposits |
|
| 15,569,763 |
|
|
| 15,553,417 |
|
|
| 14,437,648 |
|
|
| 14,404,661 |
|
Federal funds purchased and securities sold under |
|
| 405,745 |
|
|
| 405,745 |
|
|
| 449,331 |
|
|
| 449,331 |
|
Other borrowings |
|
| 483,230 |
|
|
| 483,226 |
|
|
| 1,050,938 |
|
|
| 1,050,932 |
|
Subordinated notes |
|
| 123,482 |
|
|
| 108,125 |
|
|
| 123,262 |
|
|
| 113,125 |
|
Junior subordinated debt securities |
|
| 61,856 |
|
|
| 46,856 |
|
|
| 61,856 |
|
|
| 46,392 |
|
The fair value of net acquired loans is based on estimates of future loan cash flows and appropriate discount rates, which incorporate Trustmark’s assumptions about market funding cost and liquidity premium. The estimates of future loan cash flows are determined using Trustmark’s assumptions concerning the amount and timing of principal and interest payments, prepayments and credit losses.
Deposits
The fair values of deposits with no stated maturity, such as noninterest-bearing demand deposits, NOW accounts, MMDA products and savings accounts are, by definition, equal to the amount payable on demand, which is the carrying value. Fair values for certificates of deposit are based on the discounted value of contractual cash flows. The discount rate is estimated using the rates currently offered for deposits with similar remaining maturities.
Short-Term Liabilities
The carrying amounts for federal funds purchased, securities sold under repurchase agreements and other borrowings, including short-term FHLB advances, approximate their fair values.
Long-Term FHLB Advances
FHLB advances were valued by projecting expected cash flows into the future based on each advance’s contracted rate and then determining the present value of those expected cash flows using current rates for advances with similar maturities.
Junior Subordinated Debt Securities
The fair value of the junior subordinated debt securities equals quoted market prices, if available. If a quoted market price is not available, the fair value is estimated using quoted market prices for similar junior subordinated debt securities.
Fair Value Option
Trustmark has elected to account for its LHFS under the fair value option, with interest income on these LHFS reported in interest and fees on LHFS and LHFI. The fair value of the LHFS is determined using quoted prices for a similar asset, adjusted for specific attributes of that loan. The LHFS are actively managed and monitored and certain market risks of the loans may be mitigated through the use of derivatives. These derivative instruments are carried at fair value with changes in fair value recorded as noninterest income in mortgage banking, net. The changes in the fair value of the LHFS are largely offset by changes in the fair value of the derivative instruments. For the yearsyear ended December 31, 2017, 2016 and 2015,2023, a net gain of $3.0$2.2 million a net loss of $2.5 million and a net loss of $857 thousand, respectively, was recorded as noninterest income in mortgage banking, net for changes in the fair value of the LHFS accounted for under the fair value option.option compared to net losses of $3.3 million and $10.3 million, respectively, for the years ended December 31, 2022 and 2021. Interest and fees on LHFS and LHFI for the yearsyear ended December 31, 2017, 2016 and 20152023 included $4.9$7.8 million $5.0 million and $4.7 million, respectively, of interest earned on the LHFS accounted for under the fair value option.option compared to $6.8 million and $7.0 million for the years ended December 31, 2022 and 2021, respectively. Election of the fair value option allows Trustmark to reduce the accounting volatility that would otherwise result from the asymmetry created by accounting for the financial instruments at the lower of cost or fair value and the derivatives at fair value. The fair value option election does not apply to the GNMA optional repurchase loans which do not meet the requirements under FASB ASC Topic 825 to be accounted for under the fair value option. GNMA optional repurchase loans totaled $48.2$78.8 million and $43.9$70.8 million at December 31, 20172023 and 2016,2022, respectively, and are included in LHFS on the accompanying consolidated balance sheets.
The following table provides information about the fair value and the contractual principal outstanding of the LHFS accounted for under the fair value option as ofat December 31, 20172023 and 20162022 ($ in thousands):
|
| December 31, |
| |||||
|
| 2023 |
|
| 2022 |
| ||
Fair value of LHFS |
| $ | 105,974 |
|
| $ | 64,421 |
|
LHFS contractual principal outstanding |
|
| 102,994 |
|
|
| 63,427 |
|
Fair value less unpaid principal |
| $ | 2,980 |
|
| $ | 994 |
|
|
| December 31, |
| |||||
|
| 2017 |
|
| 2016 |
| ||
Fair value of LHFS |
| $ | 132,300 |
|
| $ | 132,002 |
|
LHFS contractual principal outstanding |
|
| 129,347 |
|
|
| 132,047 |
|
Fair value less unpaid principal |
| $ | 2,953 |
|
| $ | (45 | ) |
Note 19 – Derivative Financial Instruments
Derivatives Designated as Hedging Instruments
On April 4, 2013,During the third quarter of 2022, Trustmark entered into a forward interest rate swap contract on junior subordinated debentures with a total notional amount of $60.0 million. The interest rate swap contract was designated as a derivative instrument ininitiated a cash flow hedging program. Trustmark's objectives in initiating this hedging program were to add stability to interest income and to manage its exposure to interest rate movements. Interest rate swaps designated as cash flow hedges involve the receipt of fixed-rate amounts from a counterparty in exchange for Trustmark making variable-rate
137
payments over the life of the agreements without exchange of the underlying notional amount. Interest rate floor spreads designated as cash flow hedges involve the receipt of variable-rate amounts if interest rates fall below the purchased floor strike rate on the contract and payments of variable-rate amounts if interest rates fall below the sold floor strike rate on the contract. Trustmark uses such derivatives to hedge under FASB
140
ASC Topic 815the variable cash flows associated with the objective of protecting the quarterly interest payments on Trustmark’s $60.0 million of junior subordinated debentures issued to Trustmark Preferred Capital Trust I throughout the five-year period beginningexisting and anticipated variable-rate loan assets. At December 31, 20142023, the aggregate notional value of Trustmark's interest rate swaps and endingfloor spreads designated as cash flow hedges totaled $1.125 billion compared to $825.0 million at December 31, 2019 from the risk of variability of those payments resulting from changes in the three-month LIBOR interest rate. Under the swap, which became effective2022.
Trustmark records any gains or losses on December 31, 2014, Trustmark will pay a fixed interest rate of 1.66% and receive a variable interest rate based on three-month LIBOR on a total notional amount of $60.0 million, with quarterly net settlements.
No ineffectiveness related to the interest rate swap designated as athese cash flow hedge was recognized in the consolidated statements of income for the years ended December 31, 2017, 2016 and 2015. The accumulated net after-tax gain related to the effective cash flow hedge includedhedges in accumulated other comprehensive lossincome (loss). Gains and losses on derivatives representing hedge components excluded from the assessment of effectiveness are recognized over the life of the hedge on a systematic and rational basis, as documented at hedge inception in accordance with Trustmark’s accounting policy election. The earnings recognition of excluded components totaled $278$57 thousand at December 31, 2017 compared to a net after-tax loss of $18 thousand at December 31, 2016. Amountsamortization expense for the year ended 2023 and is included in interest and fees on LHFS and LHFI. As interest payments are received on Trustmark's variable-rate assets, amounts reported in accumulated other comprehensive loss related to this derivativeincome (loss) are reclassified to otherinto interest expense as interest payments are madeand fees on Trustmark’s variable rate junior subordinated debentures.LHFS and LHFI in the accompanying consolidated statements of income during the same period. During the next twelve months, Trustmark estimates that $125 thousand$13.2 million will be reclassified as a decreasereduction to interest and fees on LHFS and LHFI. This amount could differ due to changes in interest rates, hedge de-designations or the addition of other interest expense.hedges.
Derivatives not Designated as Hedging Instruments
Trustmark utilizes a portfolio of exchange-traded derivative instruments, such as Treasury note futures contracts and option contracts, to achieve a fair value return that economically hedges changes in the fair value of the MSR attributable to interest rates. These transactions are considered freestanding derivatives that do not otherwise qualify for hedge accounting. The total notional amount of these derivative instruments was $349.0$285.0 million at December 31, 20172023 compared to $262.0$277.0 million at December 31, 2016.2022. Changes in the fair value of these exchange-traded derivative instruments are recorded as noninterest income in mortgage banking, net and are offset by changes in the fair value of the MSR. The impact of this strategy resulted in a net positivenegative ineffectiveness of $254 thousand for the year ended December 31, 2017, compared to$6.3 million and a net negative ineffectiveness of $2.9$4.1 million for the years ended December 31, 2023 and 2022, respectively, compared a net positive ineffectiveness of $2.5 million for the year ended December 31, 2016 and a net positive ineffectiveness of $1.9 million for the year ended December 31, 2015.2021.
As part of Trustmark’s risk management strategy in the mortgage banking area, derivative instruments such as forward sales contracts are utilized. Trustmark’s obligations under forward sales contracts consist of commitments to deliver mortgage loans, originated and/or purchased, in the secondary market at a future date. Changes in the fair value of these derivative instruments are recorded as noninterest income in mortgage banking, net and are offset by changes in the fair value of LHFS. Trustmark’s off-balance sheet obligations under these derivative instruments totaled $182.1$109.5 million at December 31, 2017,2023, with a negative valuation adjustment of $237$994 thousand, compared to $195.0$97.0 million at December 31, 2016,2022, with a positive valuation adjustment of $2.8 million.$168 thousand.
Trustmark also utilizes derivative instruments such as interest rate lock commitments in its mortgage banking area. Interest rate lock commitments are residential mortgage loan commitments with customers, which guarantee a specified interest rate for a specified time period. Changes in the fair value of these derivative instruments are recorded as noninterest income in mortgage banking, net and are offset by the changes in the fair value of forward sales contracts. Trustmark’s off-balance sheet obligations under these derivative instruments totaled $83.0$61.9 million at December 31, 2017,2023, with a positive valuation adjustment of $900$845 thousand, compared to $97.9$68.4 million at December 31, 2016,2022, with a positive valuation adjustment of $1.0 million.$157 thousand.
Trustmark offers certain derivatives products directly to qualified commercial lending clients seeking to manage their interest rate risk. Trustmark economically hedges interest rate swap transactions executed with commercial lending clients by entering into offsetting interest rate swap transactions with institutional derivatives market participants. Derivatives transactions executed as part of this program are not designated as qualifying hedging relationships and are, therefore, carried at fair value with the change in fair value recorded inas noninterest income in bank card and other fees. Because these derivatives have mirror-image contractual terms, in addition to collateral provisions which mitigate the impact of non-performance risk, the changes in fair value are expected to substantially offset. The offsetting interest rate swap transactions are either cleared through the Chicago Mercantile Exchange for clearable transactions or booked directly with institutional derivatives market participants for non-clearable transactions. The Chicago Mercantile Exchange rules legally characterize variation margin collateral payments made or received for centrally cleared interest rate swaps as settlements rather than collateral. As ofa result, centrally cleared interest rate swaps included in other assets and other liabilities are presented on a net basis in the accompanying consolidated balance sheets. At December 31, 2017,2023, Trustmark had interest rate swaps with an aggregate notional amount of $351.9 million$1.500 billion related to this program, compared to $340.2 million as of$1.391 billion at December 31, 2016.2022.
138
Credit-risk-related Contingent Features
Trustmark has agreements with its financial institution counterparties that contain provisions where if Trustmark defaults on any of its indebtedness, including default where repayment of the indebtedness has not been accelerated by the lender, then Trustmark could also be declared in default on its derivatives obligations.
As ofAt December 31, 2017 and 2016,2023, the termination value of interest rate swaps in a liability position, which includes accrued interest but excludes any adjustment for nonperformance risk, related to these agreements was $80 thousand and $1.2$1.4 million respectively. As ofcompared to none at December 31, 2017,2022. At December 31, 2023 and 2022, Trustmark had posted collateral of $100$2.0 million and $740 thousand, respectively, against its obligations because of negotiated thresholds and minimum transfer amounts under these agreements. If Trustmark had breached any of these triggering provisions at December 31, 2017,2023, it could have been required to settle its obligations under the agreements at the termination value.
141
Credit risk participation agreements arise when Trustmark contracts with other financial institutions, as a guarantor or beneficiary, to share credit risk associated with certain interest rate swaps. These agreements provide for reimbursement of losses resulting from a third partythird-party default on the underlying swap. At December 31, 2017 and 2016,2023, Trustmark had entered into twosix risk participation agreements as a beneficiary with an aggregate notional amount of $13.7 million and $14.2 million, respectively. At December 31, 2017, Trustmark had entered into six risk participation agreements as a guarantor with an aggregate notional amount of $37.1$40.1 million compared to five risk participation agreements as a guarantorbeneficiary with an aggregate notional amount of $28.0$50.2 million at December 31, 2016.2022. At December 31, 2023, Trustmark had entered into thirty-five risk participation agreements as a guarantor with aggregate notional amounts of $304.7 million compared to twenty-nine risk participation agreements as a guarantor with aggregate notional amounts of $235.8 million at December 31, 2022. The aggregate fair values of these risk participation agreements were immaterial at December 31, 20172023 and 2016.2022.
Tabular Disclosures
The following tables disclose the fair value of derivative instruments in Trustmark’s consolidated balance sheets as ofat December 31, 20172023 and 20162022 as well as the effect of these derivative instruments on Trustmark’s results of operations for the periods presented ($ in thousands):
|
| December 31, |
| |||||
|
| 2023 |
|
| 2022 |
| ||
Derivatives in hedging relationships |
|
|
|
|
|
| ||
Interest rate contracts: |
|
|
|
|
|
| ||
Interest rate swaps included in other assets (1) |
| $ | 1,182 |
|
| $ | — |
|
Interest rate floors included in other assets |
|
| 1,689 |
|
|
| — |
|
Interest rate swaps included in other liabilities (1) |
|
| 267 |
|
|
| 761 |
|
|
|
|
|
|
|
| ||
Derivatives not designated as hedging instruments |
|
|
|
|
|
| ||
Interest rate contracts: |
|
|
|
|
|
| ||
Exchange traded purchased options included in other assets |
| $ | 180 |
|
| $ | 38 |
|
OTC written options (rate locks) included in other assets |
|
| 845 |
|
|
| 157 |
|
Futures contracts included in other assets |
|
| 7,505 |
|
|
| 16 |
|
Interest rate swaps included in other assets (1) |
|
| 11,910 |
|
|
| 8,654 |
|
Credit risk participation agreements included in other assets |
|
| 5 |
|
|
| 6 |
|
Futures contracts included in other liabilities |
|
| — |
|
|
| 268 |
|
Forward contracts included in other liabilities |
|
| 994 |
|
|
| (168 | ) |
Exchange traded written options included in other liabilities |
|
| 21 |
|
|
| 206 |
|
Interest rate swaps included in other liabilities (1) |
|
| 34,255 |
|
|
| 44,304 |
|
Credit risk participation agreements included in other liabilities |
|
| 63 |
|
|
| 8 |
|
|
| December 31, |
| |||||
|
| 2017 |
|
| 2016 |
| ||
Derivatives in hedging relationships |
|
|
|
|
|
|
|
|
Interest rate contracts: |
|
|
|
|
|
|
|
|
Interest rate swaps included in other assets |
| $ | 451 |
|
| $ | (28 | ) |
|
|
|
|
|
|
|
|
|
Derivatives not designated as hedging instruments |
|
|
|
|
|
|
|
|
Interest rate contracts: |
|
|
|
|
|
|
|
|
Futures contracts included in other assets |
| $ | (1,088 | ) |
| $ | (626 | ) |
Exchange traded purchased options included in other assets |
|
| 75 |
|
|
| 102 |
|
OTC written options (rate locks) included in other assets |
|
| 900 |
|
|
| 1,001 |
|
Interest rate swaps included in other assets |
|
| 1,175 |
|
|
| 2,060 |
|
Credit risk participation agreements included in other assets |
|
| 3 |
|
|
| 9 |
|
Forward contracts included in other liabilities |
|
| 237 |
|
|
| (2,838 | ) |
Exchange traded written options included in other liabilities |
|
| 616 |
|
|
| 1,174 |
|
Interest rate swaps included in other liabilities |
|
| 1,819 |
|
|
| 2,065 |
|
Credit risk participation agreements included in other liabilities |
|
| 6 |
|
|
| 11 |
|
|
| Years Ended December 31, |
| |||||||||
|
| 2017 |
|
| 2016 |
|
| 2015 |
| |||
Derivatives in hedging relationships |
|
|
|
|
|
|
|
|
|
|
|
|
Amount of loss reclassified from accumulated other comprehensive loss and recognized in other interest expense |
| $ | (282 | ) |
| $ | (599 | ) |
| $ | (836 | ) |
|
|
|
|
|
|
|
|
|
|
|
|
|
Derivatives not designated as hedging instruments |
|
|
|
|
|
|
|
|
|
|
|
|
Amount of gain (loss) recognized in mortgage banking, net |
| $ | (1,873 | ) |
| $ | 13 |
|
| $ | 1,392 |
|
Amount of gain (loss) recognized in bank card and other fees |
|
| (31 | ) |
|
| 60 |
|
|
| (49 | ) |
139
|
| Years Ended December 31, |
| |||||||||
|
| 2023 |
|
| 2022 |
|
| 2021 |
| |||
Derivatives in hedging relationships |
|
|
|
|
|
|
|
|
| |||
Amount of gain (loss) reclassified from accumulated other |
| $ | (16,385 | ) |
| $ | (460 | ) |
| $ | — |
|
|
|
|
|
|
|
|
|
|
| |||
Derivatives not designated as hedging instruments |
|
|
|
|
|
|
|
|
| |||
Amount of gain (loss) recognized in mortgage banking, net |
| $ | (5,281 | ) |
| $ | (43,764 | ) |
| $ | (15,436 | ) |
Amount of gain (loss) recognized in bank card and other fees |
|
| 271 |
|
|
| 403 |
|
|
| 1,649 |
|
The following table discloses the amount included in other comprehensive income (loss), net of tax, for derivative instruments designated as cash flow hedges for the periods presented ($ in thousands):
|
| Years Ended December 31, |
| |||||||||
|
| 2023 |
|
| 2022 |
|
| 2021 |
| |||
Derivatives in cash flow hedging relationship |
|
|
|
|
|
|
|
|
| |||
Amount of gain (loss) recognized in other comprehensive |
| $ | (6,098 | ) |
| $ | (15,514 | ) |
| $ | — |
|
|
| Years Ended December 31, |
| |||||||||
|
| 2017 |
|
| 2016 |
|
| 2015 |
| |||
Derivatives in cash flow hedging relationship |
|
|
|
|
|
|
|
|
|
|
|
|
Amount of gain (loss) recognized in other comprehensive income (loss), net of tax |
| $ | 122 |
|
| $ | (228 | ) |
| $ | (812 | ) |
142
Information about financial instruments that are eligible for offset in the consolidated balance sheets as ofat December 31, 20172023 and 20162022 is presented in the following tables ($ in thousands):
Offsetting of Derivative Assets |
| |||||||||||||||||||||||
As of December 31, 2023 |
| |||||||||||||||||||||||
|
|
|
|
|
|
|
|
|
|
| Gross Amounts Not Offset in the |
|
|
|
| |||||||||
|
| Gross |
|
| Gross Amounts |
|
| Net Amounts of |
|
| Financial |
|
| Cash Collateral |
|
| Net Amount |
| ||||||
Derivatives |
| $ | 14,781 |
|
| $ | — |
|
| $ | 14,781 |
|
| $ | (4,339 | ) |
| $ | — |
|
| $ | 10,442 |
|
Offsetting of Derivative Liabilities |
| |||||||||||||||||||||||
As of December 31, 2023 |
| |||||||||||||||||||||||
|
|
|
|
|
|
|
|
|
|
| Gross Amounts Not Offset in the |
|
|
|
| |||||||||
|
| Gross |
|
| Gross Amounts |
|
| Net Amounts of |
|
| Financial |
|
| Cash Collateral |
|
| Net Amount |
| ||||||
Derivatives |
| $ | 34,522 |
|
| $ | — |
|
| $ | 34,522 |
|
| $ | (4,339 | ) |
| $ | (2,040 | ) |
| $ | 28,143 |
|
Offsetting of Derivative Assets |
| |||||||||||||||||||||||
As of December 31, 2022 |
| |||||||||||||||||||||||
|
|
|
|
|
|
|
|
|
|
| Gross Amounts Not Offset in the |
|
|
|
| |||||||||
|
| Gross |
|
| Gross Amounts |
|
| Net Amounts of |
|
| Financial |
|
| Cash Collateral |
|
| Net Amount |
| ||||||
Derivatives |
| $ | 9,415 |
|
| $ | — |
|
| $ | 9,415 |
|
| $ | — |
|
| $ | (2,230 | ) |
| $ | 7,185 |
|
Offsetting of Derivative Liabilities |
| |||||||||||||||||||||||
As of December 31, 2022 |
| |||||||||||||||||||||||
|
|
|
|
|
|
|
|
|
|
| Gross Amounts Not Offset in the |
|
|
|
| |||||||||
|
| Gross |
|
| Gross Amounts |
|
| Net Amounts of |
|
| Financial |
|
| Cash Collateral |
|
| Net Amount |
| ||||||
Derivatives |
| $ | 44,304 |
|
| $ | — |
|
| $ | 44,304 |
|
| $ | — |
|
| $ | (740 | ) |
| $ | 43,564 |
|
Offsetting of Derivative Assets |
| |||||||||||||||||||||||
As of December 31, 2017 |
| |||||||||||||||||||||||
|
|
|
|
|
|
|
|
|
|
|
|
|
| Gross Amounts Not Offset in the Statement of Financial Position |
|
|
|
|
| |||||
|
| Gross Amounts of Recognized Assets |
|
| Gross Amounts Offset in the Statement of Financial Position |
|
| Net Amounts of Assets presented in the Statement of Financial Position |
|
| Financial Instruments |
|
| Cash Collateral Received |
|
| Net Amount |
| ||||||
Derivatives |
| $ | 1,626 |
|
| $ | — |
|
| $ | 1,626 |
|
| $ | (311 | ) |
| $ | — |
|
| $ | 1,315 |
|
140
Offsetting of Derivative Liabilities |
| |||||||||||||||||||||||
As of December 31, 2017 |
| |||||||||||||||||||||||
|
|
|
|
|
|
|
|
|
|
|
|
|
| Gross Amounts Not Offset in the Statement of Financial Position |
|
|
|
|
| |||||
|
| Gross Amounts of Recognized Liabilities |
|
| Gross Amounts Offset in the Statement of Financial Position |
|
| Net Amounts of Liabilities presented in the Statement of Financial Position |
|
| Financial Instruments |
|
| Cash Collateral Posted |
|
| Net Amount |
| ||||||
Derivatives |
| $ | 1,819 |
|
| $ | — |
|
| $ | 1,819 |
|
| $ | (311 | ) |
| $ | (100 | ) |
| $ | 1,408 |
|
Offsetting of Derivative Assets |
| |||||||||||||||||||||||
As of December 31, 2016 |
| |||||||||||||||||||||||
|
|
|
|
|
|
|
|
|
|
|
|
|
| Gross Amounts Not Offset in the Statement of Financial Position |
|
|
|
|
| |||||
|
| Gross Amounts of Recognized Assets |
|
| Gross Amounts Offset in the Statement of Financial Position |
|
| Net Amounts of Assets presented in the Statement of Financial Position |
|
| Financial Instruments |
|
| Cash Collateral Received |
|
| Net Amount |
| ||||||
Derivatives |
| $ | 2,032 |
|
| $ | — |
|
| $ | 2,032 |
|
| $ | (499 | ) |
| $ | — |
|
| $ | 1,533 |
|
Offsetting of Derivative Liabilities |
| |||||||||||||||||||||||
As of December 31, 2016 |
| |||||||||||||||||||||||
|
|
|
|
|
|
|
|
|
|
|
|
|
| Gross Amounts Not Offset in the Statement of Financial Position |
|
|
|
|
| |||||
|
| Gross Amounts of Recognized Liabilities |
|
| Gross Amounts Offset in the Statement of Financial Position |
|
| Net Amounts of Liabilities presented in the Statement of Financial Position |
|
| Financial Instruments |
|
| Cash Collateral Posted |
|
| Net Amount |
| ||||||
Derivatives |
| $ | 2,065 |
|
| $ | — |
|
| $ | 2,065 |
|
| $ | (499 | ) |
| $ | (937 | ) |
| $ | 629 |
|
Note 20 – Segment Information
Trustmark’s management reporting structure includes three segments: General Banking, Wealth Management and Insurance. The General Banking DivisionSegment is responsible for all traditional banking products and services, including loans and deposits. The General Banking DivisionSegment also consists of internal operations such as Human Resources, Executive Administration, Treasury (Funds Management), Public Affairs and Corporate Finance. The Wealth Management DivisionSegment provides customized solutions for customers by integrating financial services with traditional banking products and services such as money management, full-service brokerage, financial planning, personal and institutional trust and retirement services. Through Fisher Brown Bottrell Insurance, Inc. (FBBI), a wholly owned subsidiary of TNB,FBBI, Trustmark’s Insurance DivisionSegment provides a full range of retail insurance products including commercial risk management products, bonding, group benefits and personal lines coverage.
The accounting policies of each reportable segment are the same as those of Trustmark except for its internal allocations. Noninterest expenses for back-office operations support are allocated to segments based on estimated uses of those services. Trustmark measures the net interest income of its business segments with a process that assigns cost of funds or earnings credit on a matched-term basis. This process, called “funds transfer pricing”, charges an appropriate cost of funds to assets held by a business unit, or credits the business unit for potential earnings for carrying liabilities. The net of these charges and credits flows through to the General Banking Division,Segment, which contains the management team responsible for determining TNB’s funding and interest rate risk strategies.
143141
The following table discloses financial information by reportable segment for the periods presented ($ in thousands):
|
| Years Ended December 31, |
| |||||||||
|
| 2023 |
|
| 2022 |
|
| 2021 |
| |||
General Banking |
|
|
|
|
|
|
|
|
| |||
Net interest income |
| $ | 547,010 |
|
| $ | 489,398 |
|
| $ | 413,201 |
|
PCL |
|
| 26,716 |
|
|
| 22,913 |
|
|
| (24,439 | ) |
Noninterest income |
|
| 113,497 |
|
|
| 116,350 |
|
|
| 137,874 |
|
Noninterest expense |
|
| 463,496 |
|
|
| 531,397 |
|
|
| 421,561 |
|
Income before income taxes |
|
| 170,295 |
|
|
| 51,438 |
|
|
| 153,953 |
|
Income taxes |
|
| 25,091 |
|
|
| (3,683 | ) |
|
| 22,706 |
|
General banking net income |
| $ | 145,204 |
|
| $ | 55,121 |
|
| $ | 131,247 |
|
|
|
|
|
|
|
|
|
|
| |||
Selected Financial Information |
|
|
|
|
|
|
|
|
| |||
Total assets |
| $ | 18,440,198 |
|
| $ | 17,710,673 |
|
| $ | 17,275,438 |
|
Depreciation and amortization |
| $ | 34,924 |
|
| $ | 38,909 |
|
| $ | 44,776 |
|
|
|
|
|
|
|
|
|
|
| |||
Wealth Management |
|
|
|
|
|
|
|
|
| |||
Net interest income |
| $ | 5,879 |
|
| $ | 5,321 |
|
| $ | 5,161 |
|
PCL |
|
| (2,135 | ) |
|
| (21 | ) |
|
| (9 | ) |
Noninterest income |
|
| 34,936 |
|
|
| 35,072 |
|
|
| 35,420 |
|
Noninterest expense |
|
| 32,339 |
|
|
| 32,873 |
|
|
| 31,721 |
|
Income before income taxes |
|
| 10,611 |
|
|
| 7,541 |
|
|
| 8,869 |
|
Income taxes |
|
| 2,653 |
|
|
| 1,870 |
|
|
| 2,219 |
|
Wealth Management net income |
| $ | 7,958 |
|
| $ | 5,671 |
|
| $ | 6,650 |
|
|
|
|
|
|
|
|
|
|
| |||
Selected Financial Information |
|
|
|
|
|
|
|
|
| |||
Total assets |
| $ | 185,342 |
|
| $ | 214,313 |
|
| $ | 232,997 |
|
Depreciation and amortization |
| $ | 261 |
|
| $ | 288 |
|
| $ | 269 |
|
|
|
|
|
|
|
|
|
|
| |||
Insurance |
|
|
|
|
|
|
|
|
| |||
Net interest income |
| $ | (11 | ) |
| $ | (11 | ) |
| $ | (11 | ) |
Noninterest income |
|
| 58,525 |
|
|
| 53,722 |
|
|
| 48,616 |
|
Noninterest expense |
|
| 42,084 |
|
|
| 38,943 |
|
|
| 36,014 |
|
Income before income taxes |
|
| 16,430 |
|
|
| 14,768 |
|
|
| 12,591 |
|
Income taxes |
|
| 4,103 |
|
|
| 3,673 |
|
|
| 3,123 |
|
Insurance net income |
| $ | 12,327 |
|
| $ | 11,095 |
|
| $ | 9,468 |
|
|
|
|
|
|
|
|
|
|
| |||
Selected Financial Information |
|
|
|
|
|
|
|
|
| |||
Total assets |
| $ | 96,649 |
|
| $ | 90,492 |
|
| $ | 87,201 |
|
Depreciation and amortization |
| $ | 571 |
|
| $ | 685 |
|
| $ | 768 |
|
|
|
|
|
|
|
|
|
|
| |||
Consolidated |
|
|
|
|
|
|
|
|
| |||
Net interest income |
| $ | 552,878 |
|
| $ | 494,708 |
|
| $ | 418,351 |
|
PCL |
|
| 24,581 |
|
|
| 22,892 |
|
|
| (24,448 | ) |
Noninterest income |
|
| 206,958 |
|
|
| 205,144 |
|
|
| 221,910 |
|
Noninterest expense |
|
| 537,919 |
|
|
| 603,213 |
|
|
| 489,296 |
|
Income before income taxes |
|
| 197,336 |
|
|
| 73,747 |
|
|
| 175,413 |
|
Income taxes |
|
| 31,847 |
|
|
| 1,860 |
|
|
| 28,048 |
|
Consolidated net income |
| $ | 165,489 |
|
| $ | 71,887 |
|
| $ | 147,365 |
|
|
|
|
|
|
|
|
|
|
| |||
Selected Financial Information |
|
|
|
|
|
|
|
|
| |||
Total assets |
| $ | 18,722,189 |
|
| $ | 18,015,478 |
|
| $ | 17,595,636 |
|
Depreciation and amortization |
| $ | 35,756 |
|
| $ | 39,882 |
|
| $ | 45,813 |
|
|
| Years Ended December 31, |
| |||||||||
|
| 2017 |
|
| 2016 |
|
| 2015 |
| |||
General Banking |
|
|
|
|
|
|
|
|
|
|
|
|
Net interest income |
| $ | 406,406 |
|
| $ | 386,596 |
|
| $ | 391,092 |
|
Provision for loan losses, net |
|
| 7,699 |
|
|
| 14,714 |
|
|
| 11,800 |
|
Noninterest income |
|
| 116,180 |
|
|
| 107,059 |
|
|
| 105,477 |
|
Noninterest expense |
|
| 373,221 |
|
|
| 354,555 |
|
|
| 348,270 |
|
Income before income taxes |
|
| 141,666 |
|
|
| 124,386 |
|
|
| 136,499 |
|
Income taxes |
|
| 43,960 |
|
|
| 25,303 |
|
|
| 29,761 |
|
General banking net income |
| $ | 97,706 |
|
| $ | 99,083 |
|
| $ | 106,738 |
|
|
|
|
|
|
|
|
|
|
|
|
|
|
Selected Financial Information |
|
|
|
|
|
|
|
|
|
|
|
|
Total assets |
| $ | 13,724,193 |
|
| $ | 13,278,668 |
|
| $ | 12,604,112 |
|
Depreciation and amortization |
| $ | 37,710 |
|
| $ | 35,692 |
|
| $ | 36,072 |
|
|
|
|
|
|
|
|
|
|
|
|
|
|
Wealth Management |
|
|
|
|
|
|
|
|
|
|
|
|
Net interest income |
| $ | 910 |
|
| $ | 726 |
|
| $ | 337 |
|
Noninterest income |
|
| 30,285 |
|
|
| 30,117 |
|
|
| 31,245 |
|
Noninterest expense |
|
| 27,561 |
|
|
| 24,165 |
|
|
| 25,346 |
|
Income before income taxes |
|
| 3,634 |
|
|
| 6,678 |
|
|
| 6,236 |
|
Income taxes |
|
| 1,390 |
|
|
| 2,554 |
|
|
| 2,386 |
|
Wealth Management net income |
| $ | 2,244 |
|
| $ | 4,124 |
|
| $ | 3,850 |
|
|
|
|
|
|
|
|
|
|
|
|
|
|
Selected Financial Information |
|
|
|
|
|
|
|
|
|
|
|
|
Total assets |
| $ | 5,592 |
|
| $ | 7,501 |
|
| $ | 7,471 |
|
Depreciation and amortization |
| $ | 131 |
|
| $ | 174 |
|
| $ | 183 |
|
|
|
|
|
|
|
|
|
|
|
|
|
|
Insurance |
|
|
|
|
|
|
|
|
|
|
|
|
Net interest income |
| $ | 234 |
|
| $ | 211 |
|
| $ | 336 |
|
Noninterest income |
|
| 38,198 |
|
|
| 36,767 |
|
|
| 36,427 |
|
Noninterest expense |
|
| 29,387 |
|
|
| 28,578 |
|
|
| 28,046 |
|
Income before income taxes |
|
| 9,045 |
|
|
| 8,400 |
|
|
| 8,717 |
|
Income taxes |
|
| 3,365 |
|
|
| 3,196 |
|
|
| 3,267 |
|
Insurance net income |
| $ | 5,680 |
|
| $ | 5,204 |
|
| $ | 5,450 |
|
|
|
|
|
|
|
|
|
|
|
|
|
|
Selected Financial Information |
|
|
|
|
|
|
|
|
|
|
|
|
Total assets |
| $ | 68,168 |
|
| $ | 66,164 |
|
| $ | 67,313 |
|
Depreciation and amortization |
| $ | 630 |
|
| $ | 747 |
|
| $ | 801 |
|
|
|
|
|
|
|
|
|
|
|
|
|
|
Consolidated |
|
|
|
|
|
|
|
|
|
|
|
|
Net interest income |
| $ | 407,550 |
|
| $ | 387,533 |
|
| $ | 391,765 |
|
Provision for loan losses, net |
|
| 7,699 |
|
|
| 14,714 |
|
|
| 11,800 |
|
Noninterest income |
|
| 184,663 |
|
|
| 173,943 |
|
|
| 173,149 |
|
Noninterest expense |
|
| 430,169 |
|
|
| 407,298 |
|
|
| 401,662 |
|
Income before income taxes |
|
| 154,345 |
|
|
| 139,464 |
|
|
| 151,452 |
|
Income taxes |
|
| 48,715 |
|
|
| 31,053 |
|
|
| 35,414 |
|
Consolidated net income |
| $ | 105,630 |
|
| $ | 108,411 |
|
| $ | 116,038 |
|
|
|
|
|
|
|
|
|
|
|
|
|
|
Selected Financial Information |
|
|
|
|
|
|
|
|
|
|
|
|
Total assets |
| $ | 13,797,953 |
|
| $ | 13,352,333 |
|
| $ | 12,678,896 |
|
Depreciation and amortization |
| $ | 38,471 |
|
| $ | 36,613 |
|
| $ | 37,056 |
|
142
144
Note 21 – Parent Company Only Financial Information
($ in thousands)
Condensed Balance Sheets |
| December 31, |
|
| December 31, |
| ||||||||||
|
| 2017 |
|
| 2016 |
|
| 2023 |
|
| 2022 |
| ||||
Assets: |
|
|
|
|
|
|
|
|
|
|
|
|
| |||
Investment in banks |
| $ | 1,617,238 |
|
| $ | 1,566,186 |
|
| $ | 1,770,392 |
|
| $ | 1,602,169 |
|
Other assets |
|
| 17,349 |
|
|
| 16,756 |
|
|
| 77,901 |
|
|
| 76,325 |
|
Total Assets |
| $ | 1,634,587 |
|
| $ | 1,582,942 |
|
| $ | 1,848,293 |
|
| $ | 1,678,494 |
|
|
|
|
|
|
|
|
|
|
|
|
|
|
|
| ||
Liabilities and Shareholders' Equity: |
|
|
|
|
|
|
|
|
|
|
|
|
|
| ||
Accrued expense |
| $ | 1,030 |
|
| $ | 878 |
|
| $ | 1,108 |
|
| $ | 1,108 |
|
Subordinated notes |
|
| 123,482 |
|
|
| 123,262 |
| ||||||||
Junior subordinated debt securities |
|
| 61,856 |
|
|
| 61,856 |
|
|
| 61,856 |
|
|
| 61,856 |
|
Shareholders' equity |
|
| 1,571,701 |
|
|
| 1,520,208 |
|
|
| 1,661,847 |
|
|
| 1,492,268 |
|
Total Liabilities and Shareholders' Equity |
| $ | 1,634,587 |
|
| $ | 1,582,942 |
|
| $ | 1,848,293 |
|
| $ | 1,678,494 |
|
Condensed Statements of Income |
| Years Ended December 31, |
| |||||||||
|
| 2023 |
|
| 2022 |
|
| 2021 |
| |||
Revenue: |
|
|
|
|
|
|
|
|
| |||
Dividends received from banks |
| $ | 67,189 |
|
| $ | 89,733 |
|
| $ | 45,284 |
|
Earnings of subsidiaries over distributions |
|
| 106,388 |
|
|
| (11,269 | ) |
|
| 108,141 |
|
Other income |
|
| 163 |
|
|
| 94 |
|
|
| 95 |
|
Total Revenue |
|
| 173,740 |
|
|
| 78,558 |
|
|
| 153,520 |
|
Expense: |
|
|
|
|
|
|
|
|
| |||
Other expense |
|
| 8,251 |
|
|
| 6,671 |
|
|
| 6,155 |
|
Total Expense |
|
| 8,251 |
|
|
| 6,671 |
|
|
| 6,155 |
|
Net Income |
| $ | 165,489 |
|
| $ | 71,887 |
|
| $ | 147,365 |
|
Condensed Statements of Cash Flows |
| Years Ended December 31, |
| |||||||||
|
| 2023 |
|
| 2022 |
|
| 2021 |
| |||
Operating Activities: |
|
|
|
|
|
|
|
|
| |||
Net income |
| $ | 165,489 |
|
| $ | 71,887 |
|
| $ | 147,365 |
|
Adjustments to reconcile net income to net cash provided |
|
|
|
|
|
|
|
|
| |||
Net change in investment in subsidiaries |
|
| (106,388 | ) |
|
| 11,269 |
|
|
| (108,141 | ) |
Other |
|
| (797 | ) |
|
| (1,550 | ) |
|
| (2,078 | ) |
Net cash from operating activities |
|
| 58,304 |
|
|
| 81,606 |
|
|
| 37,146 |
|
|
|
|
|
|
|
|
|
|
| |||
Financing Activities: |
|
|
|
|
|
|
|
|
| |||
Common stock dividends |
|
| (56,653 | ) |
|
| (56,679 | ) |
|
| (58,085 | ) |
Repurchase and retirement of common stock |
|
| — |
|
|
| (24,604 | ) |
|
| (61,799 | ) |
Net cash from financing activities |
|
| (56,653 | ) |
|
| (81,283 | ) |
|
| (119,884 | ) |
Net change in cash and cash equivalents |
|
| 1,651 |
|
|
| 323 |
|
|
| (82,738 | ) |
Cash and cash equivalents at beginning of year |
|
| 75,860 |
|
|
| 75,537 |
|
|
| 158,275 |
|
Cash and cash equivalents at end of year |
| $ | 77,511 |
|
| $ | 75,860 |
|
| $ | 75,537 |
|
Condensed Statements of Income |
| Years Ended December 31, |
| |||||||||
|
| 2017 |
|
| 2016 |
|
| 2015 |
| |||
Revenue: |
|
|
|
|
|
|
|
|
|
|
|
|
Dividends received from banks |
| $ | 65,663 |
|
| $ | 65,987 |
|
| $ | 64,752 |
|
Earnings of subsidiaries over distributions |
|
| 42,211 |
|
|
| 44,756 |
|
|
| 53,562 |
|
Other income |
|
| 71 |
|
|
| 60 |
|
|
| 55 |
|
Total Revenue |
|
| 107,945 |
|
|
| 110,803 |
|
|
| 118,369 |
|
Expense: |
|
|
|
|
|
|
|
|
|
|
|
|
Other expense |
|
| 2,315 |
|
|
| 2,392 |
|
|
| 2,331 |
|
Total Expense |
|
| 2,315 |
|
|
| 2,392 |
|
|
| 2,331 |
|
Net Income |
| $ | 105,630 |
|
| $ | 108,411 |
|
| $ | 116,038 |
|
Condensed Statements of Cash Flows |
| Years Ended December 31, |
| |||||||||
|
| 2017 |
|
| 2016 |
|
| 2015 |
| |||
Operating Activities: |
|
|
|
|
|
|
|
|
|
|
|
|
Net income |
| $ | 105,630 |
|
| $ | 108,411 |
|
| $ | 116,038 |
|
Adjustments to reconcile net income to net cash provided by operating activities: |
|
|
|
|
|
|
|
|
|
|
|
|
Net change in investment in subsidiaries |
|
| (42,211 | ) |
|
| (44,756 | ) |
|
| (53,562 | ) |
Other |
|
| (1,697 | ) |
|
| (739 | ) |
|
| (761 | ) |
Net cash provided by operating activities |
|
| 61,722 |
|
|
| 62,916 |
|
|
| 61,715 |
|
|
|
|
|
|
|
|
|
|
|
|
|
|
Investing Activities: |
|
|
|
|
|
|
|
|
|
|
|
|
Payment for investments in subsidiaries |
|
| (30,755 | ) |
|
| — |
|
|
| — |
|
Repayment for investments in subsidiaries |
|
| 32,000 |
|
|
| — |
|
|
| — |
|
Net cash provided by investing activities |
|
| 1,245 |
|
|
| — |
|
|
| — |
|
|
|
|
|
|
|
|
|
|
|
|
|
|
Financing Activities: |
|
|
|
|
|
|
|
|
|
|
|
|
Cash dividends paid on common stock |
|
| (62,795 | ) |
|
| (62,666 | ) |
|
| (62,605 | ) |
Other common stock transactions, net |
|
| — |
|
|
| (857 | ) |
|
| (211 | ) |
Net cash used in financing activities |
|
| (62,795 | ) |
|
| (63,523 | ) |
|
| (62,816 | ) |
Net change in cash and cash equivalents |
|
| 172 |
|
|
| (607 | ) |
|
| (1,101 | ) |
Cash and cash equivalents at beginning of year |
|
| 16,713 |
|
|
| 17,320 |
|
|
| 18,421 |
|
Cash and cash equivalents at end of year |
| $ | 16,885 |
|
| $ | 16,713 |
|
| $ | 17,320 |
|
Trustmark paid income taxes of approximately $38.8 million in 2023, $2.7 million in 2022 and $15.3 million in 2021. Trustmark (parent company only) paid income taxesinterest of approximately $7.4$4.5 million in 2017, $24.8 million in 2016 and $16.3 million in 2015. During 2017, interest paid was $283 thousand compared to $600 thousand of interest paid in 2016both 2023 and $837 thousand2022 and $4.6 million in 2021.
143
ITEM 9. CHANGES IN AND DISAGREEMENTS WITH ACCOUNTANTS ON ACCOUNTING AND FINANCIAL DISCLOSURE
There has been no change of interest paid during 2015.
145
On December 16, 2015,accountants within the Audit and Finance Committee of the Board of Directors of Trustmark completed a competitive processtwo-year period prior to review the appointment of Trustmark’s independent registered public accounting firm for the 2016 fiscal year. As a result of this process and following careful deliberation, on December 16, 2015, the Audit and Finance Committee notified KPMG LLP (“KPMG”) that it had determined to dismiss KPMG as Trustmark’s independent registered public accounting firm, effective as of the date of the filing of the Annual Report on Form 10-K for the fiscal year ending December 31, 2015. On December 21, 2015, based upon the recommendation of the Audit and Finance Committee, Trustmark retained Crowe Horwath LLP (“Crowe”) as Trustmark’s independent registered public accounting firm for the fiscal years ending December 31, 2017 and 2016.2023.
KPMG’s audit report on Trustmark’s consolidated financial statements for the fiscal year ended December 31, 2015 did not contain an adverse opinion or a disclaimer of opinion, or a qualification or modification as to uncertainty, audit scope or accounting principles. KPMG's audit report on the effectiveness of internal control over financial reporting as of December 31, 2015 did not contain an adverse opinion or disclaimer of opinion, or a qualification or modification as to uncertainty, audit scope or accounting principles. During Trustmark’s fiscal year ended December 31, 2015, (i) there were no disagreements with KPMG on any matter of accounting principles or practices, financial statement disclosure or auditing scope or procedure that, if not resolved to KPMG’s satisfaction, would have caused KPMG to make reference to the subject matter in connection with their report on Trustmark’s consolidated financial statements for such year; and (ii) there were no reportable events, within the meaning set forth in Item 304(a)(1)(v) of Regulation S-K.ITEM 9A. CONTROLS AND PROCEDURES
During Trustmark’s fiscal year ended December 31, 2015, neither Trustmark, nor any party on behalf of Trustmark, consulted with Crowe with respect to (i) the application of accounting principles to a specified transaction, either completed or proposed, or the type of the audit opinion that might be rendered on Trustmark’s consolidated financial statements, and no written report or oral advice was provided to Trustmark that Crowe concluded was an important factor considered by Trustmark in reaching a decision as to any accounting, auditing or financial reporting issue, or (ii) any matter that was subject to any disagreement, as defined in Item 304(a)(1)(iv) of Regulation S-K, or a reportable event within the meaning set forth in Item 304(a)(1)(v)of Regulation S-K.
Evaluation of Disclosure Controls and Procedures
As of the end of the period covered by this Annual Report on Form 10-K, an evaluation was carried out by Trustmark’s management, with the participation of its Chief Executive Officer and Treasurer and Principal Financial Officer (Principal Financial Officer), of the effectiveness of Trustmark’s disclosure controls and procedures (as defined in Rule 13a-15(e) under the Securities Exchange Act of 1934). Based upon that evaluation, the Chief Executive Officer and Principal Financial Officer concluded that the disclosure controls and procedures were effective as of the end of the period covered by this report. No changes were made to Trustmark’s internal control over financial reporting (as defined in Rule 13a-15(f) under the Securities Exchange Act of 1934) during the last fiscal quarter that materially affected, or are reasonably likely to materially affect, Trustmark’s internal control over financial reporting.
Management Report on Internal Control over Financial Reporting
The management of Trustmark is responsible for establishing and maintaining adequate internal control over financial reporting. Trustmark’s internal control over financial reporting was designed under the supervision of the Chief Executive Officer and Treasurer (Principal Financial Officer) to provide reasonable assurance regarding the reliability of financial reporting and the preparation of published financial statements in accordance with GAAP.
Management assessed the effectiveness of internal control over financial reporting as of December 31, 2017.2023. In making this assessment, it used the criteria set forth by the Committee of Sponsoring Organizations of the Treadway Commission (COSO) in Internal Control – Integrated Framework (2013). Based on our assessment, we believe that, as of December 31, 2017,2023, Trustmark’s internal control over financial reporting was effective based on those criteria.
The effectiveness of Trustmark’s internal control over financial reporting as of December 31, 20172023 was audited by Crowe Horwath LLP, Fort Lauderdale, Florida, (U.S. PCAOB Auditor Firm I.D.: 173), an independent registered public accounting firm, as stated in their report appearing in the section captioned “Report of Independent RegisterRegistered Public Accounting Form”Firm” included in Part II. Item 8. – Financial Statements and Supplementary Data of this report.
ITEM 9B. OTHER INFORMATION
None.
ITEM 9C. DISCLOSURE REGARDING FOREIGN JURISDICTIONS THAT PREVENT INSPECTIONS
Not applicable.
NonePART III
ITEM 10. DIRECTORS, EXECUTIVE OFFICERS AND CORPORATE GOVERNANCE
146
Certain information regarding executive officers is included under the section captioned “Executive“Information about Executive Officers of the Registrant”Trustmark” in Part I. Item 1. - Business, elsewhere in this Annual Report on Form 10-K. Other information required by this Item is incorporated herein by reference to Trustmark Corporation’s (Trustmark’s) Proxy Statement (Schedule 14A) for its 20182024 Annual Meeting of Shareholders to be filed with the SEC within 120 days of Trustmark’s fiscal year-end.
ITEM 11. EXECUTIVE COMPENSATION
The information required by this Item is incorporated herein by reference to Trustmark’s Proxy Statement (Schedule 14A) for its 20182024 Annual Meeting of Shareholders to be filed with the SEC within 120 days of Trustmark’s fiscal year-end.
|
|
Equity Compensation Plans
The table below contains summary information as of December 31, 2017 with respect to the Amended and Restated Stock and Incentive Compensation Plan, which is Trustmark’s only equity compensation plan under which shares of Trustmark common stock are authorized for issuance.ITEM 12. SECURITY OWNERSHIP OF CERTAIN BENEFICIAL OWNERS AND MANAGEMENT AND RELATED STOCKHOLDER MATTERS
|
| Number of securities to be issued upon exercise of outstanding options, warrants and rights (a) (1) |
|
| Weighted-average exercise price of outstanding options, warrants and rights (2) |
|
| Number of securities remaining available for future issuance under equity compensation plans (excluding securities reflected in column (a)) (3) |
| |||
Plan Category |
|
|
|
|
|
|
|
|
|
|
|
|
Equity compensation plans approved by security holders |
|
| 213,516 |
|
| $ | — |
|
|
| 1,110,739 |
|
Equity compensation plans not approved by security holders |
|
| — |
|
|
| — |
|
|
| — |
|
Total |
|
| 213,516 |
|
| $ | — |
|
|
| 1,110,739 |
|
|
|
|
|
|
|
All other information required by this Item is incorporated herein by reference to Trustmark’s Proxy Statement (Schedule 14A) for its 2018 Annual Meeting of Shareholders to be filed with the SEC within 120 days of Trustmark’s fiscal year-end.
The information required by this Item is incorporated herein by reference to Trustmark’s Proxy Statement (Schedule 14A) for its 20182024 Annual Meeting of Shareholders to be filed with the SEC within 120 days of Trustmark’s fiscal year-end.
The information required by this Item is incorporated herein by reference to Trustmark’s Proxy Statement (Schedule 14A) for its 20182024 Annual Meeting of Shareholders to be filed with the SEC within 120 days of Trustmark’s fiscal year-end.
147ITEM 14. PRINCIPAL ACCOUNTING FEES AND SERVICES
The information required by this Item is incorporated herein by reference to Trustmark’s Proxy Statement (Schedule 14A) for its 2024 Annual Meeting of Shareholders to be filed with the SEC within 120 days of Trustmark’s fiscal year-end.
PART IV
ITEM. 15. EXHIBITS, FINANCIAL STATEMENT SCHEDULES
A-1. Financial Statements
The reportsreport of Crowe Horwath LLP and KPMG LLP, independent registered public accounting firms,firm, and the following consolidated financial statements of Trustmark Corporation (Trustmark) and subsidiaries are included in the Registrant’s 20172023 Annual Report to Shareholderson Form 10-K and are incorporated into Part II. Item 8. – Financial Statements and Supplementary Data herein by reference:
Consolidated Balance Sheets as of December 31, 20172023 and 20162022
Consolidated Statements of Income for the Years Ended December 31, 2017, 20162023, 2022 and 20152021
Consolidated Statements of Comprehensive Income for the Years Ended December 31, 2017, 20162023, 2022 and 20152021
Consolidated Statements of Changes in Shareholders’ Equity for the Years Ended December 31, 2017, 20162023, 2022 and 20152021
Consolidated Statements of Cash Flows for the Years Ended December 31, 2017, 20162023, 2022 and 20152021
Notes to Consolidated Financial Statements (Notes 1 through 21)
A-2. Financial Statement Schedules
The schedules to the consolidated financial statements set forth by Article 9 of Regulation S-X are not required under the related instructions or are inapplicable and therefore have been omitted.
A-3. Exhibits
The exhibits to this Annual Report on Form 10-K listed below have been included only with the copy of this report filed with the Securities and Exchange Commission. Copies of individual exhibits will be furnished to shareholders upon written request to Trustmark and payment of a reasonable fee.
145
ITEM. 16. SUMMARY
None.
146
EXHIBIT INDEX
|
None.
148
| ||
2-b | ||
3-a | ||
3-b | ||
| ||
| ||
4-b | ||
4-c | ||
4-d | ||
10-a | ||
10-b | ||
10-c | ||
10-d | ||
10-e | ||
10-f | ||
10-g | ||
10-h | ||
10-i | ||
10-j | ||
149
147
10-l | ||
| ||
10-m | ||
10-n | ||
10-o | ||
10-p | ||
10-q | ||
10-r | ||
10-s | ||
10-t | ||
10-u | ||
10-v | ||
| ||
| ||
10-y | ||
10-z | ||
10-aa | ||
10-ab | ||
10-ac |
148
10-ad | ||
10-ae | ||
10-ag | ||
10-ah | ||
10-ai | ||
10-aj | ||
10-ak | Form of Compensation Clawback Policy, adopted on October 24, 2023 and revised on January 23, 2024.* | |
10-al | ||
10-am | ||
21 | ||
23 | ||
| ||
| ||
31-b | ||
32-a | ||
32-b | ||
101.INS | Inline XBRL Instance Document | |
101.SCH | Inline XBRL Taxonomy Extension Schema with Embedded Linkbases Document | |
| Cover Page Interactive Data File (embedded within the Inline XBRL | |
|
| |
|
| |
150
* - Denotes management contract.
All other exhibits are omitted, as they are inapplicable or not required by the related instructions.
149
SIGNATURES
151
Pursuant to the requirements of Section 13 or 15 (d) of the Securities Exchange Act of 1934, the Registrant has duly caused this report to be signed on its behalf by the undersigned, thereunto duly authorized.
TRUSTMARK CORPORATION
BY: | /s/ | |||||
| ||||||
President and Chief Executive Officer | ||||||
DATE: | February |
150
SIGNATURES
152
Pursuant to the requirements of the Securities Exchange Act of 1934, this report has been signed by the following persons on behalf of the Registrant and in the capacities and on the dates indicated:
DATE: | February | BY: | /s/ Adolphus B. Baker | |||
Adolphus B. Baker, Director | ||||||
DATE: | February | BY: | /s/ William A. Brown | |||
William A. Brown, Director | ||||||
DATE: | February | BY: | /s/ | |||
| ||||||
DATE: | February | BY: | /s/ George T. Chambers, Jr. | |||
George T. Chambers, Jr., Principal Accounting Officer | ||||||
DATE: | February 15, 2024 | BY: | /s/ Tracy T. Conerly | |||
Tracy T. Conerly, Director | ||||||
DATE: | February | BY: | /s/ | |||
and Director | ||||||
DATE: | February | BY: | /s/ | |||
| ||||||
| ||||||
DATE: | February 15, 2024 | BY: | ||||
|
|
| /s/ J. Clay Hays, Jr., M.D. | |||
J. Clay Hays, Jr., M.D., Director | ||||||
DATE: | February | BY: | /s/ Gerard R. Host | |||
Gerard R. Host, | ||||||
| ||||||
DATE: | February 15, 2024 | BY: | ||||
|
|
|
| |||
| ||||||
|
|
| /s/ Harris V. Morrissette | |||
Harris V. Morrissette, Director | ||||||
DATE: | February | BY: | /s/ Thomas C. Owens | |||
Thomas C. Owens, Treasurer and Principal Financial Officer | ||||||
DATE: | February 15, 2024 | BY: | /s/ Richard H. Puckett | |||
Richard H. Puckett, Director | ||||||
DATE: | February | BY: |
| |||
| ||||||
|
|
|
| |||
| ||||||
|
|
|
| |||
| ||||||
|
|
| /s/ William G. Yates III | |||
William G. Yates III, Director | ||||||
151
153