
UNITED STATES
SECURITIES AND EXCHANGE COMMISSION
Washington, D.C. 20549
FORM 10-K
☒ | ANNUAL REPORT PURSUANT TO SECTION 13 OR 15(d) OF THE SECURITIES EXCHANGE ACT OF 1934 |
For the Fiscal Year Ended DECEMBERDecember 31, 20172020
OR
☐ | TRANSITION REPORT PURSUANT TO SECTION 13 OR 15(d) OF THE SECURITIES EXCHANGE ACT OF 1934 |
For the transition period from to
Commission File Number: 1-12252 (Equity Residential)
Commission File Number: 0-24920 (ERP Operating Limited Partnership)
EQUITY RESIDENTIAL
ERP OPERATING LIMITED PARTNERSHIP
(Exact name of registrant as specified in its charter)
|
|
|
|
|
|
|
|
|
|
Securities registered pursuant to Section 12(b) of the Act:
|
|
|
|
|
|
Securities registered pursuant to Section 12(g) of the Act:
None (Equity Residential)
Units of Limited Partnership Interest (ERP Operating Limited Partnership)
(Title of each class)
Indicate by check mark if the registrant is a well-known seasoned issuer, as defined in Rule 405 of the Securities Act.
|
|
Indicate by check mark if the registrant is not required to file reports pursuant to Section 13 or Section 15(d) of the Act.
|
|
Indicate by check mark whether the registrant (1) has filed all reports required to be filed by Section 13 or 15(d) of the Securities Exchange Act of 1934 during the preceding 12 months (or for such shorter period that the registrant was required to file such reports), and (2) has been subject to such filing requirements for the past 90 days.
|
|
Indicate by check mark whether the registrant has submitted electronically and posted on its corporate Web site, if any, every Interactive Data File required to be submitted and posted pursuant to Rule 405 of Regulation S-T (§ 232.405 of this chapter) during the preceding 12 months (or for such shorter period that the registrant was required to submit and post such files).
|
|
Indicate by check mark if disclosure of delinquent filers pursuant to Item 405 of Regulation S-K (§ 229.405 of this chapter) is not contained herein, and will not be contained, to the best of registrant’s knowledge, in definitive proxy or information statements incorporated by reference in Part III of this Form 10-K or any amendment to this Form 10-K.
|
|
Indicate by check mark whether the registrant is a large accelerated filer, an accelerated filer, a non-accelerated filer, a smaller reporting company, or emerging growth company. See the definitions of “large accelerated filer,” “accelerated filer,” “smaller reporting company,” and “emerging growth company” in Rule 12b-2 of the Exchange Act.
| ||||||
|
|
|
| |||
|
|
|
| |||
|
| |||||
| ||||||
|
|
|
| |||
|
|
|
| |||
|
| |||||
If an emerging growth company, indicate by check mark if the registrant has elected not to use the extended transition period for complying with any new or revised financial accounting standards provided pursuant to Section 13(a) of the Exchange Act.
Equity Residential ☐ERP Operating Limited Partnership ☐
Indicate by check mark whether the registrant is a shell company (as defined in Rule 12b-2 of the Act).
|
|
The aggregate market value of Common Shares held by non-affiliates of the Registrant was approximately $23.8 billion based upon the closing price on June 30, 2017 of $65.83 using beneficial ownership of shares rules adopted pursuant to Section 13 of the Securities Exchange Act of 1934 to exclude voting shares owned by Trustees and Executive Officers, some of whom may not be held to be affiliates upon judicial determination.
The number of Common Shares of Beneficial Interest, $0.01 par value, outstanding on February 16, 2018 was 368,169,571.
DOCUMENTS INCORPORATED BY REFERENCE
Part III incorporates by reference certain information that will be contained in Equity Residential’s Proxy Statement relating to its 2018 Annual Meeting of Shareholders, which Equity Residential intends to file no later than 120 days after the end of its fiscal year ended December 31, 2017, and thus these items have been omitted in accordance with General Instruction G(3) to Form 10-K. Equity Residential is the general partner and 96.4% owner of ERP Operating Limited Partnership.
2
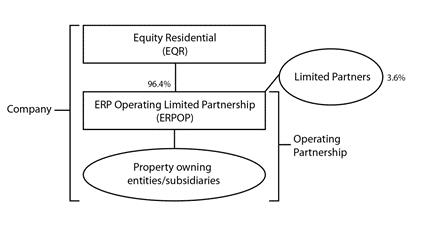
This report combines the annual reports on Form 10-K for the year ended December 31, 2017 of Equity Residential and ERP Operating Limited Partnership. Unless stated otherwise or the context otherwise requires, references to “EQR” mean Equity Residential, a Maryland real estate investment trust (“REIT”), and references to “ERPOP” mean ERP Operating Limited Partnership, an Illinois limited partnership. References to the “Company,” “we,” “us” or “our” mean collectively EQR, ERPOP and those entities/subsidiaries owned or controlled by EQR and/or ERPOP. References to the “Operating Partnership” mean collectively ERPOP and those entities/subsidiaries owned or controlled by ERPOP. The following chart illustrates the Company’s and the Operating Partnership’s corporate structure:
EQR is the general partner of, and as of December 31, 2017 owned an approximate 96.4% ownership interest in, ERPOP. The remaining 3.6% interest is owned by limited partners. As the sole general partner of ERPOP, EQR has exclusive control of ERPOP’s day-to-day management. Management operates the Company and the Operating Partnership as one business. The management of EQR consists of the same members as the management of ERPOP.
The Company is structured as an umbrella partnership REIT (“UPREIT”) and EQR contributes all net proceeds from its various equity offerings to ERPOP. In return for those contributions, EQR receives a number of OP Units (see definition below) in ERPOP equal to the number of Common Shares it has issued in the equity offering. The Company may acquire properties in transactions that include the issuance of OP Units as consideration for the acquired properties. Such transactions may, in certain circumstances, enable the sellers to defer in whole or in part, the recognition of taxable income or gain that might otherwise result from the sales. This is one of the reasons why the Company is structured in the manner shown above. Based on the terms of ERPOP’s partnership agreement, OP Units can be exchanged with Common Shares on a one-for-one basis because the Company maintains a one-for-one relationship between the OP Units of ERPOP issued to EQR and the outstanding Common Shares.
The Company believes that combining the reports on Form 10-K of EQR and ERPOP into this single report provides the following benefits:
enhances investors’ understanding of the Company and the Operating Partnership by enabling investors to view the business as a whole in the same manner as management views and operates the business;
eliminates duplicative disclosure and provides a more streamlined and readable presentation since a substantial portion of the disclosure applies to both the Company and the Operating Partnership; and
creates time and cost efficiencies through the preparation of one combined report instead of two separate reports.
3
The Company believes it is important to understand the few differences between EQR and ERPOP in the context of how EQR and ERPOP operate as a consolidated company. All of the Company’s property ownership, development and related business operations are conducted through the Operating Partnership and EQR has no material assets or liabilities other than its investment in ERPOP. EQR’s primary function is acting as the general partner of ERPOP. EQR also issues equity from time to time, the net proceeds of which it is obligated to contribute to ERPOP, and guarantees certain debt of ERPOP, as disclosed in this report. EQR does not have any indebtedness as all debt is incurred by the Operating Partnership. The Operating Partnership holds substantially all of the assets of the Company, including the Company’s ownership interests in its joint ventures. The Operating Partnership conducts the operations of the business and is structured as a partnership with no publicly traded equity. Except for the net proceeds from equity offerings by EQR, which are contributed to the capital of ERPOP in exchange for additional partnership interests in ERPOP (“OP Units”) (on a one-for-one Common Share per OP Unit basis) or additional preference units in ERPOP (on a one-for-one preferred share per preference unit basis), the Operating Partnership generates all remaining capital required by the Company’s business. These sources include the Operating Partnership’s working capital, net cash provided by operating activities, borrowings under its revolving credit facility and/or commercial paper program, the issuance of secured and unsecured debt and equity securities and proceeds received from disposition of certain properties and joint venture interests.
Shareholders’ equity, partners’ capital and noncontrolling interests are the main areas of difference between the consolidated financial statements of the Company and those of the Operating Partnership. The limited partners of the Operating Partnership are accounted for as partners’ capital in the Operating Partnership’s financial statements and as noncontrolling interests in the Company’s financial statements. The noncontrolling interests in the Operating Partnership’s financial statements include the interests of unaffiliated partners in various consolidated partnerships. The noncontrolling interests in the Company’s financial statements include the same noncontrolling interests at the Operating Partnership level and limited partner OP Unit holders of the Operating Partnership. The differences between shareholders’ equity and partners’ capital result from differences in the equity issued at the Company and Operating Partnership levels.
To help investors understand the differences between the Company and the Operating Partnership, this report provides separate consolidated financial statements for the Company and the Operating Partnership; a single set of consolidated notes to such financial statements that includes separate discussions of each entity’s debt, noncontrolling interests and shareholders’ equity or partners’ capital, as applicable; and a combined Management’s Discussion and Analysis of Financial Condition and Results of Operations section that includes discrete information related to each entity.
This report also includes separate Part II, Item 9A. Controls and Procedures sections and separate Exhibits 31 and 32 certifications for each of the Company and the Operating Partnership in order to establish that the requisite certifications have been made and that the Company and the Operating Partnership are compliant with Rule 13a-15 or Rule 15d-15 of the Securities Exchange Act of 1934 and 18 U.S.C. §1350.
In order to highlight the differences between the Company and the Operating Partnership, the separate sections in this report for the Company and the Operating Partnership specifically refer to the Company and the Operating Partnership. In the sections that combine disclosure of the Company and the Operating Partnership, this report refers to actions or holdings as being actions or holdings of the Company. Although the Operating Partnership is generally the entity that directly or indirectly enters into contracts and joint ventures and holds assets and debt, reference to the Company is appropriate because the Company is one business and the Company operates that business through the Operating Partnership.
As general partner with control of ERPOP, EQR consolidates ERPOP for financial reporting purposes, and EQR essentially has no assets or liabilities other than its investment in ERPOP. Therefore, the assets and liabilities of the Company and the Operating Partnership are the same on their respective financial statements. The separate discussions of the Company and the Operating Partnership in this report should be read in conjunction with each other to understand the results of the Company on a consolidated basis and how management operates the Company.
4
ERP OPERATING LIMITED PARTNERSHIP
(Exact name of registrant as specified in its charter)
Maryland (Equity Residential) | 13-3675988 (Equity Residential) |
Illinois (ERP Operating Limited Partnership) | 36-3894853 (ERP Operating Limited Partnership) |
(State or other jurisdiction of incorporation or organization) | (I.R.S. Employer Identification No.) |
Two North Riverside Plaza, Chicago, Illinois 60606 | (312) 474-1300 |
(Address of principal executive offices) (Zip Code) | (Registrant’s telephone number, including area code) |
Securities registered pursuant to Section 12(b) of the Act:
Title of each class | Trading Symbol(s) | Name of each exchange on which registered | ||
Common Shares of Beneficial Interest, | EQR | New York Stock Exchange | ||
7.57% Notes due August 15, 2026 | N/A | New York Stock Exchange |
Securities registered pursuant to Section 12(g) of the Act:
None (Equity Residential)
Units of Limited Partnership Interest (ERP Operating Limited Partnership)
(Title of each class)
Indicate by check mark if the registrant is a well-known seasoned issuer, as defined in Rule 405 of the Securities Act.
Equity Residential Yes ☒ No ☐ | ERP Operating Limited Partnership Yes ☒ No ☐ |
Indicate by check mark if the registrant is not required to file reports pursuant to Section 13 or Section 15(d) of the Act.
Equity Residential Yes ☐ No ☒ | ERP Operating Limited Partnership Yes ☐ No ☒ |
Indicate by check mark whether the registrant (1) has filed all reports required to be filed by Section 13 or 15(d) of the Securities Exchange Act of 1934 during the preceding 12 months (or for such shorter period that the registrant was required to file such reports), and (2) has been subject to such filing requirements for the past 90 days.
Equity Residential Yes ☒ No ☐ | ERP Operating Limited Partnership Yes ☒ No ☐ |
Indicate by check mark whether the registrant has submitted electronically every Interactive Data File required to be submitted pursuant to Rule 405 of Regulation S-T (§ 232.405 of this chapter) during the preceding 12 months (or for such shorter period that the registrant was required to submit such files).
Equity Residential Yes ☒ No ☐ | ERP Operating Limited Partnership Yes ☒ No ☐ |
Indicate by check mark whether the registrant is a large accelerated filer, an accelerated filer, a non-accelerated filer, a smaller reporting company, or an emerging growth company. See the definitions of “large accelerated filer,” “accelerated filer,” “smaller reporting company,” and “emerging growth company” in Rule 12b-2 of the Exchange Act.
Equity Residential: | ||||||
Large accelerated filer | ☒ | Accelerated filer | ☐ | |||
Non-accelerated filer | ☐ | Smaller reporting company | ☐ | |||
Emerging growth company | ☐ | |||||
ERP Operating Limited Partnership: | ||||||
Large accelerated filer | ☐ | Accelerated filer | ☐ | |||
Non-accelerated filer | ☒ | Smaller reporting company | ☐ | |||
Emerging growth company | ☐ | |||||
If an emerging growth company, indicate by check mark if the registrant has elected not to use the extended transition period for complying with any new or revised financial accounting standards provided pursuant to Section 13(a) of the Exchange Act.
Equity Residential | ☐ | ERP Operating Limited Partnership | ☐ |
Indicate by check mark whether the registrant has filed a report on and attestation to its management’s assessment of the effectiveness of its internal control over financial reporting under Section 404(b) of the Sarbanes-Oxley Act (15 U.S.C. 7262(b)) by the registered public accounting firm that prepared or issued its audit report.
Equity Residential | ☒ | ERP Operating Limited Partnership | ☒ |
Indicate by check mark whether the registrant is a shell company (as defined in Rule 12b-2 of the Act).
Equity Residential Yes ☐ No ☒ | ERP Operating Limited Partnership Yes ☐ No ☒ |
The aggregate market value of Common Shares held by non-affiliates of the Registrant was approximately $21.7 billion based upon the closing price on June 30, 2020 of $58.82 using beneficial ownership of shares rules adopted pursuant to Section 13 of the Securities Exchange Act of 1934 to exclude voting shares owned by Trustees and Executive Officers, some of whom may not be held to be affiliates upon judicial determination.
The number of Common Shares of Beneficial Interest, $0.01 par value, outstanding on February 12, 2021 was 372,663,215.
DOCUMENTS INCORPORATED BY REFERENCE
Part III incorporates by reference certain information that will be contained in Equity Residential’s Proxy Statement relating to its 2021 Annual Meeting of Shareholders, which Equity Residential intends to file no later than 120 days after the end of its fiscal year ended December 31, 2020, and thus these items have been omitted in accordance with General Instruction G(3) to Form 10-K. Equity Residential is the general partner and 96.4% owner of ERP Operating Limited Partnership.
2
EXPLANATORY NOTE
This report combines the annual reports on Form 10-K for the year ended December 31, 2020 of Equity Residential and ERP Operating Limited Partnership. Unless stated otherwise or the context otherwise requires, references to “EQR” mean Equity Residential, a Maryland real estate investment trust (“REIT”), and references to “ERPOP” mean ERP Operating Limited Partnership, an Illinois limited partnership. References to the “Company,” “we,” “us” or “our” mean collectively EQR, ERPOP and those entities/subsidiaries owned or controlled by EQR and/or ERPOP. References to the “Operating Partnership” mean collectively ERPOP and those entities/subsidiaries owned or controlled by ERPOP. The following chart illustrates the Company’s and the Operating Partnership’s corporate structure:
EQR is the general partner of, and as of December 31, 2020 owned an approximate 96.4% ownership interest in, ERPOP. The remaining 3.6% interest is owned by limited partners. As the sole general partner of ERPOP, EQR has exclusive control of ERPOP’s day-to-day management. Management operates the Company and the Operating Partnership as one business. The management of EQR consists of the same members as the management of ERPOP.
The Company is structured as an umbrella partnership REIT (“UPREIT”) and EQR contributes all net proceeds from its various equity offerings to ERPOP. In return for those contributions, EQR receives a number of OP Units (see definition below) in ERPOP equal to the number of Common Shares it has issued in the equity offering. The Company may acquire properties in transactions that include the issuance of OP Units as consideration for the acquired properties. Such transactions may, in certain circumstances, enable the sellers to defer in whole or in part, the recognition of taxable income or gain that might otherwise result from the sales. This is one of the reasons why the Company is structured in the manner shown above. Based on the terms of ERPOP’s partnership agreement, OP Units can be exchanged with Common Shares on a one-for-one basis because the Company maintains a one-for-one relationship between the OP Units of ERPOP issued to EQR and the outstanding Common Shares.
The Company believes that combining the reports on Form 10-K of EQR and ERPOP into this single report provides the following benefits:
• | enhances investors’ understanding of the Company and the Operating Partnership by enabling investors to view the business as a whole in the same manner as management views and operates the business; |
• | eliminates duplicative disclosure and provides a more streamlined and readable presentation since a substantial portion of the disclosure applies to both the Company and the Operating Partnership; and |
• | creates time and cost efficiencies through the preparation of one combined report instead of two separate reports. |
3
The Company believes it is important to understand the few differences between EQR and ERPOP in the context of how EQR and ERPOP operate as a consolidated company. All of the Company’s property ownership, development and related business operations are conducted through the Operating Partnership and EQR has no material assets or liabilities other than its investment in ERPOP. EQR’s primary function is acting as the general partner of ERPOP. EQR also issues equity from time to time, the net proceeds of which it is obligated to contribute to ERPOP. EQR does not have any indebtedness as all debt is incurred by the Operating Partnership. The Operating Partnership holds substantially all of the assets of the Company, including the Company’s ownership interests in its joint ventures. The Operating Partnership conducts the operations of the business and is structured as a partnership with no publicly traded equity. Except for the net proceeds from equity offerings by EQR (which are contributed to the capital of ERPOP in exchange for additional partnership interests in ERPOP (“OP Units”) (on a one-for-one Common Share per OP Unit basis) or additional preference units in ERPOP (on a one-for-one preferred share per preference unit basis)), the Operating Partnership generates all remaining capital required by the Company’s business. These sources include the Operating Partnership’s working capital, net cash provided by operating activities, borrowings under its revolving credit facility and/or commercial paper program, the issuance of secured and unsecured debt and partnership interests, and proceeds received from disposition of certain properties and joint venture interests.
Shareholders’ equity, partners’ capital and noncontrolling interests are the main areas of difference between the consolidated financial statements of the Company and those of the Operating Partnership. The limited partners of the Operating Partnership are accounted for as partners’ capital in the Operating Partnership’s financial statements and as noncontrolling interests in the Company’s financial statements. The noncontrolling interests in the Operating Partnership’s financial statements include the interests of unaffiliated partners in various consolidated partnerships. The noncontrolling interests in the Company’s financial statements include the same noncontrolling interests at the Operating Partnership level and limited partner OP Unit holders of the Operating Partnership. The differences between shareholders’ equity and partners’ capital result from differences in the equity issued at the Company and Operating Partnership levels.
To help investors understand the differences between the Company and the Operating Partnership, this report provides separate consolidated financial statements for the Company and the Operating Partnership; a single set of consolidated notes to such financial statements that includes separate discussions of each entity’s debt, noncontrolling interests and shareholders’ equity or partners’ capital, as applicable; and a combined Management’s Discussion and Analysis of Financial Condition and Results of Operations section that includes discrete information related to each entity.
This report also includes separate Part II, Item 9A, Controls and Procedures, sections and separate Exhibits 31 and 32 certifications for each of the Company and the Operating Partnership in order to establish that the requisite certifications have been made and that the Company and the Operating Partnership are compliant with Rule 13a-15 or Rule 15d-15 of the Securities Exchange Act of 1934, as amended (the “Exchange Act”), and 18 U.S.C. §1350.
In order to highlight the differences between the Company and the Operating Partnership, the separate sections in this report for the Company and the Operating Partnership specifically refer to the Company and the Operating Partnership. In the sections that combine disclosure of the Company and the Operating Partnership, this report refers to actions or holdings as being actions or holdings of the Company. Although the Operating Partnership is generally the entity that directly or indirectly enters into contracts and joint ventures and holds assets and debt, reference to the Company is appropriate because the Company is one business and the Company operates that business through the Operating Partnership.
As general partner with control of ERPOP, EQR consolidates ERPOP for financial reporting purposes, and EQR essentially has no assets or liabilities other than its investment in ERPOP. Therefore, the assets and liabilities of the Company and the Operating Partnership are the same on their respective financial statements. The separate discussions of the Company and the Operating Partnership in this report should be read in conjunction with each other to understand the results of the Company on a consolidated basis and how management operates the Company.
4
EQUITY RESIDENTIAL
ERP OPERATING LIMITED PARTNERSHIP
TABLE OF CONTENTS
|
|
|
| PAGE |
PART I. |
|
|
|
|
|
|
|
|
|
Item 1. |
|
| 6 | |
|
|
|
|
|
Item 1A. |
|
|
| |
|
|
|
|
|
Item 1B. |
|
|
| |
|
|
|
|
|
Item 2. |
|
|
| |
|
|
|
|
|
Item 3. |
|
|
| |
|
|
|
|
|
Item 4. |
|
|
| |
|
|
|
|
|
PART II. |
|
|
|
|
|
|
|
|
|
Item 5. |
|
|
| |
|
|
|
|
|
Item 6. |
|
|
| |
|
|
|
|
|
Item 7. |
| Management’s Discussion and Analysis of Financial Condition and Results of Operations |
|
|
|
|
|
|
|
Item 7A. |
|
|
| |
|
|
|
|
|
Item 8. |
|
|
| |
|
|
|
|
|
Item 9. |
| Changes in and Disagreements with Accountants on Accounting and Financial Disclosure |
|
|
|
|
|
|
|
Item 9A. |
|
|
| |
|
|
|
|
|
Item 9B. |
|
|
| |
|
|
|
|
|
PART III. |
|
|
|
|
|
|
|
|
|
Item 10. |
|
|
| |
|
|
|
|
|
Item 11. |
|
|
| |
|
|
|
|
|
Item 12. |
| Security Ownership of Certain Beneficial Owners and Management and Related Stockholder Matters |
|
|
|
|
|
|
|
Item 13. |
| Certain Relationships and Related Transactions, and Trustee Independence |
|
|
|
|
|
|
|
Item 14. |
|
|
| |
|
|
|
|
|
PART IV. |
|
|
|
|
|
|
|
|
|
Item 15. |
|
|
| |
|
|
|
|
|
Item 16. |
|
|
| |
| 49 | |||
|
|
|
|
|
EX-21 |
|
|
|
|
|
|
|
|
|
EX-23.1 |
|
|
|
|
|
|
|
|
|
EX-23.2 |
|
|
|
|
|
|
|
|
|
EX-31.1 |
|
|
|
|
|
|
|
|
|
EX-31.2 |
|
|
|
|
|
|
|
|
|
EX-31.3 |
|
|
|
|
|
|
|
|
|
EX 31.4 |
|
|
|
|
|
|
|
|
|
EX-32.1 |
|
|
|
|
|
|
|
|
|
EX-32.2 |
|
|
|
|
|
|
|
|
|
EX-32.3 |
|
|
|
|
|
|
|
|
|
EX-32.4 |
|
|
|
|
|
|
|
|
|
EX-101 INSTANCE DOCUMENT |
|
| ||
|
|
|
|
|
EX-101 SCHEMA DOCUMENT |
|
| ||
|
|
|
|
|
EX-101 CALCULATION LINKBASE DOCUMENT |
|
| ||
|
|
|
|
|
EX-101 LABELS LINKBASE DOCUMENT |
|
| ||
|
|
|
|
|
EX-101 PRESENTATION LINKBASE DOCUMENT |
|
| ||
|
|
|
|
|
EX-101 DEFINITION LINKBASE DOCUMENT |
|
| ||
5
General
Equity Residential (“EQR”), is committed to creating communities where people thrive. The Company, a member of the S&P 500, is focused on the acquisition, development and management of residential properties located in and around dynamic cities that attract high quality long-term renters. ERP Operating Limited Partnership (“ERPOP”) is focused on conducting the multifamily property business of EQR. EQR is a Maryland real estate investment trust (“REIT”) formed in March 1993 is an S&P 500 company focused on the acquisition, development and management of rental apartment properties in urban and high-density suburban coastal gateway markets. ERP Operating Limited Partnership (“ERPOP”),ERPOP is an Illinois limited partnership was formed in May 1993 to conduct the multifamily residential property business of Equity Residential. EQR has elected to be taxed as a REIT.1993. References to the “Company,” “we,” “us” or “our” mean collectively EQR, ERPOP and those entities/subsidiaries owned or controlled by EQR and/or ERPOP. References to the “Operating Partnership” mean collectively ERPOP and those entities/subsidiaries owned or controlled by ERPOP. Unless otherwise indicated, the notes to consolidated financial statements apply to both the Company and the Operating Partnership.
EQR is the general partner of, and as of December 31, 20172020 owned an approximate 96.4% ownership interest in, ERPOP. All of the Company’s property ownership, development and related business operations are conducted through the Operating Partnership and EQR has no material assets or liabilities other than its investment in ERPOP. EQR issues public equity from time to time, the net proceeds of which it is obligated to contribute to ERPOP, but does not have any indebtedness as all debt is incurred by the Operating Partnership. The Operating Partnership holds substantially all of the assets of the Company, including the Company’s ownership interests in its joint ventures. The Operating Partnership conducts the operations of the business and is structured as a partnership with no publicly traded equity.
The Company’s corporate headquarters is located in Chicago, Illinois and the Company also operates regional property management offices in each of its coastal gateway markets. As of December 31, 2017, the Company had approximately 2,700 employees who provided real estate operations, leasing, legal, financial, accounting, acquisition, disposition, development and other support functions.
Certain capitalized terms used herein are defined in the Notes to Consolidated Financial Statements. See also Note 17 in the Notes to Consolidated Financial Statements for additional discussion regarding the Company’s segment disclosures.
Available Information
You may access our Annual Report on Form 10-K, our Quarterly Reports on Form 10-Q, our Current Reports on Form 8-K, our proxy statements and any amendments to any of those reportsreports/statements we file with the SECSecurities and Exchange Commission (“SEC”) free of charge on our website, www.equityapartments.com. These reports are made available on our website as soon as reasonably practicable after we file them with the SEC. The information contained on our website, including any information referred to in this report as being available on our website, is not a part of or incorporated into this report.
Business Objectives and Operating and Investing Strategies
Overview
The Company invests inis one of the largest U.S. publicly-traded owners and operators of high-quality rental apartment communitiesproperties with a portfolio primarily located in strategically targeted markets with the goal of maximizing our risk adjusted total return (operating income plus capital appreciation) on invested capital.
We seek to maximize the incomeurban and capital appreciation of our properties by investingdense suburban communities in markets that are characterized by conditions favorable to multifamily property operations and appreciation. We are focused on the coastal gateway markets ofaround Boston, New York, Washington, D.C., Southern California (including Los Angeles, Orange County and San Diego), San Francisco, Seattle and Seattle. TheseDenver. Our markets continue to be the primary knowledge centers of the U.S. economy drawing the talented workers and employers that drive economic growth in the United States. Our properties are located in places that are attractive to knowledge workers whom we hope to convert into satisfied long-term residents.
We believe we have created a best-in-class operating platform to run our properties. Our employees are focused on delivering remarkable customer service to our residents so they will stay with us longer, be willing to pay higher rent for a great experience and will tell others about how much they love living in an Equity Residential property. We utilize technology and other innovative methods of engagement to foster relationships and community, improve the resident experience and operate our business more efficiently. Our disciplined balance sheet management enhances returns and value creation while maintaining flexibility to take advantage of future opportunities. We believe that our stakeholders value stability, liquidity, predictability and accountability and that is the mission to which we remain unwaveringly committed.
6
Equity Residential is committed to creating communities where people thrive. We carry this, our corporate purpose, through our relationships with our customers, our employees, our shareholders and the communities in which we operate. It drives our commitment to sustainability, diversity and inclusion, total well-being of our employees and being a responsible corporate citizen in the communities in which we operate, which is especially relevant when we face unprecedented challenges like the novel coronavirus (“COVID-19”) pandemic.
Despite the challenges we have faced with the COVID-19 pandemic, we believe that the long-term prospects for our business remain strong. Our well-located communities are in and around dynamic cities that we believe will continue to attract high quality long-term renters. When the pandemic subsides, we believe urban centers will re-energize and once again provide significant networking and other benefits for current and prospective residents who may have temporarily deferred, but not abandoned, their desire to live in vibrant major U.S. metropolitan areas.
Investment Strategy
The Company’s long-term strategy is to invest in apartment communities located in strategically targeted markets with the goal of maximizing our risk-adjusted total returns by balancing current cash flow generation with long-term capital appreciation. We seek to meet this goal by investing in markets that are characterized by conditions favorable to multifamily property operations over the long-term. We also consider governmental fiscal health, political/regulatory risk and resiliency of our targeted markets. The markets we focus on generally feature one or more of the following characteristics that allow us to increase rents:
High home ownership costs;
Strong economic growth leading to job growth and household formation, which in turn leads to high demand for our apartments;
Urban and high-density suburban locations with an attractive quality of life leading to high resident demand and retention;
Favorable demographics contributing to a larger pool of target residents with a high propensity or greater preference to rent apartments; and
6
drive performance:
| • | High single-family housing prices relative to rental housing costs leading to less competition from owned or rented single-family housing; |
• | Strong generators of economic growth often characterized as centers of the knowledge-based economy, leading to high wage job growth and household formation, which in turn leads to high demand for our apartments; |
• | Favorable demographics contributing to a larger pool of target residents with a high propensity or greater preference to rent apartments; |
• | Higher barriers to entry where, because of land scarcity or government regulation, it is typically more difficult or costly to build new apartment properties, creating limits on new |
• | Strong other demand drivers. |
We believe our strategy also capitalizes on the increasing preference of renters of all ages to live in the urban core of cities or dense suburban locations where we operate that typically are near to transportation (both public transit and convenient highway access), entertainment and cultural amenities. Millennials,Demand for rental housing is driven primarily by household formations from the approximately 78 million peopleMillennial segment and increasingly from the Generation Z segment of our population. Millennials, born between 1981 and 2000, total approximately 78 million people and are a prime apartment rental demographic.disproportionately renters. They also tend to remain renters longer due to societal trends favoring delays in marriage and having children. We believe we will continue to see demand from this group, as the largest sub-segment of this cohort is now turning 30 years old while the median age of our resident is 33 years old. After the Millennials comes Generation Z, which comprises the more than 70 million people born between 2001 and 2014. Reports also show a growing trend among aging Baby Boomers, a demographic of more than 76 million people born between 1946 and 1964, toward apartment rentals.
Overall, our high-quality resident tends to work in the highest earning sectors of the economy and is not rent burdened, creating the ability to raise rents more readily in good economic times and reducing risk during downturns. Many of these workers are employed in the fields of Science, Technology, Engineering and Mathematics, or STEM jobs. They have experienced significantly lower job loss during COVID-19. Once it subsides, we believe we are extremely well positioned to benefit for many years to come as a result of the significant impact the various generations discussed above will have on rental housing.
Over the last decade, the Company has done an extensive repositioning of its portfolio into urban and highly walkable, close-in suburban assets. While we continue to look for opportunities to expand our portfolio in these locations, it is our intention over time to further diversify our portfolio into select new markets that share the same characteristics as our current markets and to optimize the mix of our properties located in urban vs. dense suburban submarkets within our existing markets.
Operations and Innovation
We believe that both groups appreciate the locational values described above as well as the flexibility that rental apartments offer.
Our operating focus is on balancingattempt to balance occupancy and rental rates to maximize our revenue while exercising tight cost control to generate the highest possible return to our shareholders. Revenue is maximized by attracting qualified prospectsthrough our customized pricing system that uses market data on current and projected demand and availability to create both current and forward pricing daily for each apartment unit we manage. We believe our success prior to the pandemic in renewing our residents is due to our properties, cost-effectively convertingfocus on the resident experience. This focus has driven the strong occupancy and renewal rate growth that we have achieved over the last several years prior to the COVID-19 pandemic, which we would expect to return once the pandemic subsides.
7
Technology continues to drive innovation in the rental industry and to evolve at a rapid pace. We have been and continue to be a leader in deploying and investing in property technology to serve our customers better and operate more efficiently. Having been a first mover in such important areas as revenue management and online leasing, we are focused on technology that improves our operating margins and customer experience while also meeting the current needs of our customers, including addressing the challenges of the pandemic. We use a standardized purchasing system to control our operating expenses and a business intelligence platform that allows all our team members to quickly identify and address issues and opportunities. Our operations benefitted from having many of these prospects into new residentsinitiatives in place during the pandemic, allowing us to interact with our customers in a safe and keeping our residents satisfied so they will renew their leases upon expiration. responsible manner, including self-guided tours, automated responses to customer inquiries and enhanced service and maintenance management. While we believe areas such as “smart home” technology and others will provide the foundation for current and future improvements to how we do business, we will continue to consider the cost and longevity of technology capital investments versus the benefits.
Our Commitment to Environmental, Social and Governance (“ESG”)
At Equity Residential, we believe a focus on ESG is a key way to programmatically address stakeholder concerns as part of our corporate purpose. This needs to be a sustainable endeavor, in which we provide properties that it is our high-quality, well-located assets that bringwill stand the test of time and remain attractive to our customers to us, it isand the customer service and superior value provided by our on-site personnel that keeps them renting with us and recommending us to their friends.
We use technology to engage our customers incommunity without negatively impacting the way that they want to be engaged. Many of our residents utilize our web-based resident portal which allows them to sign and renew their leases, review their accounts and make payments, provide feedback and make service requests on-line.
Acquisitions and developments may be financed from various sources of capital, which may include retained cash flow, issuance of additional equity and debt, sales of properties and joint venture arrangements. In addition, the Company may acquire properties in transactions that include OP Units as consideration for the acquired properties. Such transactions may, in certain circumstances, enable the sellers to defer, in whole or in part, the recognition of taxable income or gain that might otherwise result from the sales.
As part of its strategy, the Company purchases completed and fully occupied apartment properties, partially completed or partially occupied properties and may acquire land parcels to hold and/or sell based on market opportunities as well as options to buy more land in the future. The Company may also seek to acquire properties by purchasing defaulted or distressed debt that encumbers desirable properties in the hope of obtaining title to property through foreclosure or deed-in-lieu of foreclosure proceedings.
Over the past several years, the Company has done an extensive repositioning of its portfolio into urban and highly walkable, close-in suburban assets. Since 2005, the Company has sold approximately 199,000 apartment units primarily located in the less dense portion of suburban markets for an aggregate sales price of approximately $23.8 billion, acquired nearly 70,000 apartment units primarily located in urban and high-density suburban markets for approximately $20.5 billion and began approximately $5.9 billion of development projects primarily located in urban and high-density suburban markets. We are currently seeking to acquire and develop assets in the following coastal gateway metropolitan areas: Boston, New York, Washington D.C., Southern California, San Francisco and Seattle.
We endeavor to provide a richly diverse work environment that employs the highest performers, cultivates the best ideas and creates the widest possible platform for success. We are committed to elevating and supporting the core values of diversity and inclusion, total well-being (which brings together physical, financial, career, social and community well-being into a cohesive whole), and environmental, social and governance ("ESG"), which includes sustainability and social responsibility, by actively engaging in these areas. Each member of the executive team maintains an annual goal related to these core values. Our goal is to create and sustain an inclusive environment where diversity will thrive, employees will want to work and residents will want to live. We are committed to providing our employees with encouragement, guidance, time and resources to learn and apply the skills required to succeed in their jobs. We provide many classroom and on-line training courses to assist our employees in interacting with prospects and residents as well as extensive training for our customer service specialists in maintaining our properties and improvements, equipment and appliances. We actively promote from within and many senior corporate and property leaders have risen from entry level or junior positions. We monitor our employees' engagement by surveying them annually and find most employees say they are proud to work at the Company, value one another as colleagues, believe in our mission and values and feel their skills meet their job requirements.
We have a commitment to sustainability and consider the environmental impacts of our business activities. Sustainability and social responsibility are key drivers of our focus on creating the best apartment communities for residents to live, work and play.environment. We have a dedicated in-house team that initiates and applies sustainable practices in all aspects of our business, including investment activities, development, property operations and property management activities. With its high density, multifamily
7
Multifamily housing is by its nature, an environmentally friendlyone of the most environmentally-friendly uses of real estate, as each property type. Our recent acquisitionprovides homes for hundreds of families in a denser shared environment. We consider building locations based on walkability, accessibility, neighborhoods and development activities have been primarily concentrated in pedestrian-friendly urbanparks. We also design our communities to support amenities such as fitness centers and close-in suburbanwe select locations near public transportation. Whenshops, healthy restaurants and health and wellness programs, enabling a low carbon footprint lifestyle for our residents to live, work and play.
Our sustainability goals help us focus efforts and drive outcomes to create a more sustainable future for all. We are especially focused on energy consumption, water consumption and greenhouse gas emissions. We invest in developing and renovating our properties, we strive to reducewith a focus on reducing waste, energy and water consumptionuse by investing in energy-saving technology, such as those for irrigation, lighting, HVAC and renewable energy, saving technology while positively impacting the experience of our residents and the value of our assets.
We continueare also intensely focused on the “Social” and “Governance” aspects of ESG. As detailed below, we have a commitment to implementour employees’ engagement, diversity and wellness that is the foundation of our corporate purpose. We also recognize that a combinationsuccessful company must incorporate the best corporate governance practices in order to better serve its stakeholders.
In 2018, the Company became the first multifamily REIT ever to issue a “green bond”. As a result, the net proceeds of irrigation, lighting, HVAC and renewable energy improvements at our properties that will reduce energy and water consumption. The Company was namedapproximately $396.7 million from the 2017 Global Residential Listed Sector Leader in ESG by GRESB, a globally recognized analysis of the ESG indicators of more than 800 real estate portfolios worldwide. The Company was also recently awarded the 2017 Residential Leader in the Light award for sustainability by the National Association of Real Estate Investment Trusts (“NAREIT”).offering were allocated to eligible green/sustainable certified projects. For additional information regarding our sustainabilityESG efforts, see our December 2017 CorporateNovember 2020 Environmental, Social Responsibility and SustainabilityGovernance Report at our website, www.equityapartments.com.www.equityapartments.com. This report, which includes Sustainability Accounting Standards Board disclosures and incorporates recommendations from the Task Force on Climate-related Financial Disclosures, was reviewed and approved by the Corporate Governance Committee of our Board of Trustees, which monitors the Company’s ongoing ESG efforts. For 2018, weWe continue to have an express company-wideenhance our ESG disclosure efforts, including auditing the results outlined in the above report. Furthermore, our annual proxy statements contain additional information on our corporate governance practices. Such annual proxy statements and the information contained therein are not part of or incorporated into this report.
Human Capital
At Equity Residential, our team of approximately 2,600 employees is the driving force behind our success. We believe that our richly diverse work environment captures top talent, cultivates the best ideas and creates the widest possible platform for this success in line with our corporate purpose of “Creating communities where people thrive.” Our core principles, affectionately named “Ten Ways to Be a Winner,” guide our behavior as individuals and collectively as a team, helping us in our goal regarding enhanced ESG efforts. Employees, including our executives, will have their performance against our various ESG goals evaluated asto deliver market-leading performance. As part of our annual performance review process.
Please referTen Ways to Item 7, Management’s DiscussionBe a Winner, we encourage our team members to raise questions, take educated risks, offer new ideas and Analysis of Financial Condition and Results of Operations, for the Company’s Results of Operations and Liquidity.
Starwood Transaction
The Company executed an agreement with controlled affiliates of Starwood Capital Group (“Starwood”) on October 23, 2015 to sell a portfolio of 72 operating properties consisting of 23,262 apartment units located in five markets across the United States for $5.365 billion (the “Starwood Transaction” or “Starwood Portfolio”). On January 26 and 27, 2016, the Company closed on the sale of the entire portfolio described above. The sale of the Starwood Portfolio, combined with the other 2016 dispositions, resulted in the Company’s exit from the South Florida, Denver and New England (excluding Boston) markets and substantially completed the Company’s portfolio transformation which started approximately ten years ago. These sales narrowed the Company’s focus, which is now entirely directed towards our coastal gateway markets.
The Company used the majority of the proceeds from the Starwood Transaction and other 2016 dispositions to pay two special dividends to its shareholders and holders of OP Units of $11.00 per share/unit in the aggregate, consisting of special dividends of $8.00 per share/unit (approximately $3.0 billion) on March 10, 2016 and $3.00 per share/unit (approximately $1.1 billion) on October 14, 2016. The Company used the majority of the remaining proceeds to reduce aggregate indebtedness in order tohelp us make the transaction leverage neutral. The Company retired approximately $2.0 billionright decisions. One way we live the “Ten Ways” is by enriching our culture through our core “Equity Values”—Diversity and Inclusion, Social Responsibility, Sustainability and Total Well-Being. We have assembled an employee-led Equity Values Council to lead our efforts on these values by acting as change agents to drive initiatives, create goals and awareness, and encourage colleagues to participate in securedcommunity service activities and unsecured debt, the majoritywellness initiatives. In addition, executive compensation is based, in part, on meeting important Equity Values goals, and our Board of which was scheduled to matureTrustees takes an active role in 2016overseeing our efforts in this regard.
8
Diversity and 2017, which improved the Company’s already strong credit metrics. Inclusion
• | Our commitment to diversity and inclusion starts at the top with a highly skilled and diverse Board of Trustees. |
• | We are committed to hiring a diverse workforce and also fostering a safe, inclusive and productive workplace for all employees. We believe providing a work environment based on respect, trust and collaboration creates an exceptional employee experience where employees can bring their whole selves to work and thrive in their careers. In recent years, we have created a Director of Diversity and Inclusion position to oversee this crucial work. |
• | To further prioritize the importance of our diversity and inclusion efforts, our executives’ annual compensation goals include an evaluation of objective metrics measuring our Company’s progress in this regard. |
• | We have the benefit of a diverse workforce, of which 60.0% currently identify as ethnically diverse. We also continue to focus on improving our female representation, which is now 37.0% of our workforce. |
• | Going forward, we plan to continue to strategically identify opportunities to increase the diversity of our talent pipeline at all levels, including by actively sourcing diverse candidates for mid-management and above positions. |
Pay Equity
• | In order to attract and retain the best employees, we are committed to providing a total compensation package which is market-based, performance driven, fair and internally equitable. |
• | Our goal is to be competitive both within the general employment market as well as with our competitors in the real estate industry, with our strongest performers being paid more. |
• | Base pay is reviewed annually, as is Equity Residential’s compensation framework, by partnering with managers to create and update job descriptions that reflect the duties, skills, experience and education required to perform the role, and then benchmarking our jobs against third-party compensation surveys to determine the market value of the job. |
• | During the year-end evaluation process, managers review and calibrate compensation for all employees on their team, in an effort to ensure equitableness around our pay practices and allow us to retain and reward our top talent. |
Employee Engagement
• | Employee engagement and experience are extremely important at Equity Residential. In 2020, we decided to collect employee engagement feedback through frequent pulse surveys (instead of an annual survey like we have historically done), allowing us to check in more often and respond more immediately on employee feedback gathered, especially in light of hardships experienced by many on a personal level as a result of the COVID-19 pandemic and social unrest. |
• | Senior leaders are assessed annually on their leadership results, which for 2020 was measured by the more frequent pulse survey scores, employee retention and diversity and inclusion efforts. |
• | The pulse survey ratings from employees in 2020 demonstrated a favorable attitude toward leadership and highlighted our leaders’ ability to effectively lead through adversity. Furthermore, the survey results reflected strong scores on our diversity and inclusion efforts. |
9
Training and Development
• | We believe a successful workplace is one where employees constantly learn and grow. Our internal Organization and Talent Development (“OTD”) team is interspersed throughout our markets and works regularly with employees to expand their knowledge and skills. OTD develops and delivers a wide range of training and development opportunities, from tactical to strategic, face-to-face to virtual, social learning to self-directed learning, and more. In 2020, each employee completed an average of 13 hours of dedicated learning at a Company expenditure of over $1,350 per employee. |
Health, Safety and Wellness
• | Equity Residential is committed to providing the tools and resources to help our employees achieve total well-being. Whether physical, financial, career, social or community well-being, Equity Residential offers benefits to help meet our employee needs. |
• | Physical - Equity Residential is focused on providing benefits that help our employees achieve balance and address good health proactively, with coverage for emergencies and ongoing needs that can arise as well. Long before healthcare reform, Equity Residential made a commitment to cover 100% of employee preventive care. This commitment—and our robust and highly popular Vitality Wellness Program—has made proactive personal healthcare more accessible and manageable for employees, while encouraging ongoing healthy behaviors and rewarding employees for taking a proactive approach to their health. |
• | Financial - These benefits and resources help our employees manage their money better today, while preparing for financial milestones and retirement in the future. Financial peace of mind is at the core of these offerings, whether it’s our generous 401(k) match, basic and supplemental insurance to ensure our loved ones and possessions are cared for, rent discounts at our properties or additional savings and investment options like our employee share purchase plan. |
• | Career - When employees move up in skill and experience, so does Equity Residential. We encourage our employees to “test their limits,” push the boundaries of their comfort zones and seek new challenges through several learning resources and courses, in addition to tuition reimbursement. We actively promote from within, and many senior corporate and property leaders have risen from entry level or junior positions. |
• | Social and Community - We offer a number of benefits that foster social and community well-being, including paid time off to volunteer in our communities. |
• | Throughout the COVID-19 pandemic, we have communicated regularly with employees and also released a comprehensive guide designed as a single place for employees to access information on critical benefits and resources. A key focus included mental well-being to help employees better cope with the challenges to our work routines, our home routines and how we interact with our family, friends and community. |
• | For nearly two years, we have partnered with Employees1st to provide financial relief via a crisis fund for employees struck by personal hardships or unforeseen disasters. The Company contributed additional funds to the Employees1st crisis fund to further support employees who experienced hardship as a result of the COVID-19 pandemic. We are proud that this program allows yet another avenue for us to tangibly demonstrate our One Team culture by ensuring that employees are safe and secure, especially during extreme or catastrophic circumstances. |
• | For further discussion, please refer to Item 7, Management’s Discussion and Analysis of Financial Condition and Results of Operations, for the Company’s responses related to health and safety issues during the COVID-19 pandemic. |
Competition
All of the Company’s properties are located in developed areas that includewith multiple housing choices, including other multifamily properties. The number of competitive housing choices or multifamily properties in a particular area could have a material effect on the Company’s ability to lease apartment units at its properties and on the rents charged. The Company may be competing with other entitieshousing providers that have greater resources than the Company and whose managers have more experience than the Company’s managers. In addition, other forms of rental properties and single familysingle-family housing provide housing alternatives to potential residents of multifamily properties. See Item 1A. 1A, Risk Factors,for additional information with respect to competition.
EnvironmentalRegulatory Considerations
See Item 1A. 1A, Risk Factors,for information concerning the potential effects of governmental regulations, including environmental regulations, on our operations.
10
Item 1A. Risk Factors
General
References to “EQR” mean Equity Residential, a Maryland real estate investment trust (“REIT”), and references to “ERPOP” mean ERP Operating Limited Partnership, an Illinois limited partnership. Unless otherwise indicated, when used in this section, the terms “Company,” “we,” “us” or “our” mean collectively EQR, ERPOP and those entities/subsidiaries owned or controlled by EQR and/or ERPOP and the term “Operating Partnership” means collectively ERPOP and those entities/subsidiaries owned or controlled by ERPOP. This Item 1A.1A includes forward-looking statements. You should refer to
8
our discussion of the qualifications and limitations on forward-looking statements included in Item 7, Management’s Discussion and Analysis of Financial Condition and Results of Operations.
The occurrence of the events discussed in the following risk factors could adversely affect, possibly in a material manner, our business, financial condition or results of operations, which could adversely affect the value of our common shares of beneficial interest or preferred shares of beneficial interest (which we refer to collectively as “Shares”), Preference Units, OP Units, restricted units and our public unsecured debt. In this section, we refer to the Shares, Preference Units, OP Units, restricted units and public unsecured debt together as our “securities” and the investors who own such securities as our “security holders”.holders.”
Risks Related to the COVID-19 Pandemic
The ongoing COVID-19 pandemic and measures intended to prevent its spread could have a material adverse effect on our business, results of operations, cash flows and financial condition.
In March 2020, the World Health Organization declared COVID-19 a pandemic. The outbreak has led governments and other authorities around the world, including federal, state and local authorities in the United States, to impose measures intended to control its spread, including restrictions on movement and business operations such as travel bans, border closings, business closures, quarantines, social distancing and shelter-in-place orders. The COVID-19 pandemic has also caused, and may likely continue to cause, severe economic, market and other disruptions worldwide. There can be no assurance that conditions will not continue to deteriorate as a result of the pandemic.
The impact of the COVID-19 pandemic and measures to prevent its spread could materially negatively impact our business, results of operations, financial condition and liquidity in a number of ways, including:
• | A decrease in our rental revenues or increase in related reserves and write-offs as a potential result of: |
• | The deterioration of global economic conditions as a result of the pandemic may ultimately decrease occupancy levels and pricing across our portfolio as residents reduce or defer their spending; |
• | Our residents’ and tenants’ ability to pay their rent on time or at all; |
• | Changes in the demand for multifamily properties within our markets; |
• | Our geographic concentrations, especially in our dense urban communitieswhich often makes social distancing more difficult, may experience longer periods of economic disruption due to delays in business re-openings and/or required re-closures, as a result of which we may be more susceptible to the impact of COVID-19; |
• | Changes in resident preferences, including changes due to increased employer flexibility to work from home, making current or prospective residents less likely to want to live in dense urban centers where we own many of our properties or to want to live in denser forms of multifamily housing like the high-rise or mid-rise housing the Company owns; |
• | The concessions made, and those that continue to be made, to residents’ rent obligations, which may not be on terms as favorable to us as those currently in place; |
• | The costs we may incur in protecting our investments and releasing our properties as a result of resident or tenant nonpayment, default or bankruptcy; |
• | The risk that local and national authorities may expand or extend certain measures imposing restrictions on our ability to enforce residents’ or tenants’ contractual rental obligations (such as eviction moratoriums or rental forgiveness) and limit our ability to raise rents or charge certain fees; |
• | The risk that local and national authorities may not pass, extendor may reduce government stimulus and relief programs which may be providing or would provide benefits to our residents (or employers of our residents) and tenants; |
• | Restrictions inhibiting our employees’ ability to meet with existing and potential residents has disrupted and could in the future further disrupt our ability to lease apartments which could adversely impact our rental rate and occupancy levels; and |
11
• | Non-residential operations in our apartment buildings are particularly vulnerable to the effects from the COVID-19 pandemic, which we expect may adversely impact their operations and, in turn, could result in an increase in tenant/garage operator defaults, rent deferrals/abatements and rent reductions. |
• | Our properties may also incur significant operating expenses related to shelter-in-place orders, quarantines and social distancing requirements, such as higher cleaning or other related costs; |
• | The risk that our access to capital at attractive terms may be diminished due to, among other factors: (i) potential disruptions in the long-term debt and commercial paper markets; (ii) the risk that a prolonged economic slowdown or recession could negatively impact our lending counterparties; and (iii) reductions in the Company’s credit ratings as a result of a protracted and more severe deterioration in our operations due to the pandemic; |
• | The risk of a prolonged outbreak and/or multiple waves of an outbreak of the pandemic: |
a) | could cause long-term damage to economic conditions, which in turn could cause material declines in the fair value of our assets, leading to asset impairment charges; and, |
b) | could cause an adverse impact on our future financial results, cash flows and financial condition and therefore our ability to pay dividends; |
• | A general decline in the real estate market or demand for real estate transactions could hinder our ability to acquire or dispose of properties, including through our joint ventures; |
• | The risk of delays in our development and renovation projects due to construction moratoriums, governmental movement restrictions, social distancing requirements, the closure of many permitting and inspection agencies and disruptions in the supply of construction materials or other products due to problems in the supply chain or otherwise; |
• | A possible further decline in the price of our common shares due to a prolonged economic recession or other impacts described herein; |
• | Increased risks of potential cyber attacks due to an increased reliance on remote working and other electronic interactions with our current and prospective residents; and |
• | Potential inability to maintain adequate staffing at our properties and corporate/regional offices due to shelter-in-place orders, an outbreak at one or more of our properties or corporate/regional offices and/or the continued duration or expansion of the pandemic. |
The extent of the COVID-19 pandemic’s effect on our operational and financial performance will depend on future developments including the duration, spread and securities valueintensity of the outbreak and the rollout and effectiveness of vaccines, all of which are uncertain and difficult to predict. To the extent the COVID-19 pandemic adversely affects our business, results of operations, cash flows and financial condition, it may also have the effect of heightening many of the other risks described below. Due to the speed with which the situation is continuing to develop, we are not able at this time to estimate the effect of these factors on our business, but the adverse impact on our business, results of operations, cash flows and financial condition could be material.
Risks Related to our Business Strategy
Investing in real estate is inherently subject to risks associated with thethat could negatively impact our business.
Investing in real estate industry.
General
Real estate investments areis subject to varying degrees and types of riskrisk. While we seek to mitigate these risks through various strategies, including geographic diversification, market research and proactive asset management, among other techniques, these risks cannot be eliminated. Factors that may impact cash flows and real estate values include, but are relatively illiquid. Numerous factors may adversely affect the economic performance and valuenot limited to:
• | Local economic conditions, particularly oversupply or reductions in demand; |
• | National, regional and local political climates, governmental fiscal health and governmental policies; |
• | The inability or unwillingness of residents to pay rent increases; |
• | Increases in our operating expenses; |
• | Cost and availability of labor and materials required to maintain our properties at acceptable standards; |
• | Availability of attractive financing opportunities; |
• | Changes in social preferences; and |
• | Additional risks that are discussed below. |
12
The geographic concentration of our properties and the ability to realize that value. These factors include changes in the global, national, regional and local political and economic climates, local conditions such as an oversupply of multifamily properties or a reduction in demand for our multifamily properties, the attractiveness of our properties to residents, competition from other multifamily properties and single family homes (both as rentals and owned housing) and changes in market rental rates. Our performance also depends on our ability to collect rent from residents and to pay for adequate maintenance, insurance and other operating costs, including real estate taxes, all of which could increase over time. Besides utilities, we are generally not able to pass through to our residents under existing leases any other operating expenses, including real estate taxes. These operating expenses could rise faster than our revenues causing our income to decline. In circumstances where we buy or sell properties, including large portfolios of properties, overhead (property management expense and general and administrative expense) may not increase/decrease proportionally with the associated changes in revenue. Costs of labor and materials required for maintenance, repair, capital expenditure or development may be more expensive than anticipated. Also, the expenses of owning and operating a property are not necessarily reduced when circumstances such as market factors and competition cause a reduction in income from the property.
We may be unable to renew leases or relet units as leases expire.
When our residents decide to leave our apartments, we may not be able to relet their apartment units. Even if the residents do renew or we can relet the apartment units, the terms of renewal or reletting may be less favorable than current lease terms. If we are unable to promptly renew the leases or relet the apartment units, or if the rental rates upon renewal or reletting are significantly lower than expected rates, then our results of operations and financial condition will be adversely affected. If residents do not experience increases in their income, we may be unable to increase rent and/or delinquencies may increase. Occupancy levels and market rents may be adversely affected by national and local political, economic and market conditions including, without limitation, new construction and excess inventory of multifamily and owned housing/condominiums, increasing portions of owned housing/condominium stock being converted to rental use, rental housing subsidized by the government, other government programs that favor single family rental housing or owner occupied housing over multifamily rental housing, governmental regulations, slow or negative employment growth and household formation, the availability of low-interest mortgages or the availability of mortgages requiring little or no down payment for single family home buyers, changes in social preferences and the potential for geopolitical instability, all of which are beyond our control. Finally, the federal government’s policies, many of which may encourage home ownership, can increase competition, possibly limit our ability to raise rents in our markets and lower the value of our properties. Consequently, our cash flow and ability to service debt and make distributions to security holders could be reduced.
The retail/commercial space (including parking garages) at our properties primarily serves as an additional amenity for our residents and neighbors. The long-term nature of our retail/commercial leases (generally five to ten years with market based renewal options) and the characteristics of many of our retail/commercial tenants (generally small, local businesses) may subject us to certain risks. We may not be able to lease new space for rents that are consistent with our projections or for market rates. Also, when leases for our existing retail/commercial space expire, the space may not be relet or the terms of reletting, including the cost of allowances and concessions to tenants, may be less favorable than the current lease terms. Our properties compete with other properties with retail/commercial space. The presence of competitive alternatives may affect our ability to lease space and the level of rents we can obtain. If our retail/commercial tenants experience financial distress or bankruptcy, they may fail to comply with their contractual obligations, seek concessions in order to continue operations or cease their operations which could adversely impact our results of operations and financial condition. The revenues from our retail/commercial space represent approximately 4.6% of our total rental income.
9
Changes in rent control or rent stabilization laws and regulations and eviction laws and regulations in our markets could have an adverse effect on our operations and property values.operations.
Various state and local governments have enacted and may continue to enact rent control or rent stabilization laws and regulations or take other actions which could limit our ability to raise rents or charge certain fees such as pet fees or application fees. We have seen a recent increase in governments considering or being urged by advocacy groups to consider rent control or rent stabilization laws and regulations. For example, California may have a ballot measure in November 2018 that would seek to repeal an existing state law that limits the ability of local governments to enact some forms of rent control. Depending on the extent and terms of future enactments of rent control or rent stabilization laws and regulations, as well as any lawsuits against the Company arising from such issues, such future enactments could have a significant adverse impact on our results of operations and the value of our properties.
State and local governments may also make changes to eviction and other tenants’ rights laws and regulations that could have an adverse impact on our operations and property values. Under current laws and regulations, eviction proceedings for delinquent residentsThe Company’s properties are already costly and time-consuming, especially in markets like New York where housing courts are backlogged. If we are restricted from releasing apartment units due to the inability to evict delinquent residents, our results of operations and property values may be adversely impacted.
We have increased our concentration of propertiesconcentrated in our primarily coastal gateway markets which could have an adverse effect on our operations if a particular market is adversely affected by economic or other conditions.and located in and around dynamic cities that we believe attract high quality long-term renters.
Over approximately the past ten years, the Company has exited its non-core markets as part of its strategy to reposition its portfolio, leaving the Company highly concentrated in its urban and high-density suburban coastal gateway markets. If any one or more of theseour markets (Boston, New York, Washington D.C., Southern California, San Francisco and Seattle) is adversely affectedunfavorably impacted by local or regionalspecific economic conditions, (such as business layoffs, industry slowdowns, changing demographics and other factors), local real estate conditions, (such as oversupplyincreases in social unrest, increases in real estate and other taxes, reduced quality of life, deterioration of local or reduced demand for multifamily properties)state government health, rent control or stabilization laws, localized environmental issues or naturalnatural/man-made disasters, the impact of such conditions may have an increased adversea more negative impact on our results of operations than if our portfolioproperties were more geographically diverse.
Within its primarily coastal markets, the Company is also concentrated in certain dense urban and suburban submarkets. To the extent that these markets or submarkets within these markets become less desirable to operate in, including changes in multifamily housing supply and demand, our results of operations could be more negatively impacted than if we were more diversified within our marketsor invested in a greater number of markets.
For example, the urban core submarkets of New York City, San Francisco, CA and Boston, MA, have been more adversely impacted by the COVID-19 pandemic in comparison to our other markets. Due to our concentrations in these submarkets, we have experienced larger decreases in rental income from elevated rent concessions and lower occupancy than we might have otherwise.
Failure to generate sufficient revenue could limit our ability to make financing payments or distributions to security holders.
A decrease in cash flows due to declines in rental revenue could negatively affect our ability to make financing payments and distributions to our security holders. Significant expenditures associated with each property, such as real estate taxes, insurance, utilities, maintenance costs and employee wages and benefits, may also negatively impact cash flows, and these expenditures may not decline as quickly or at the same rate as revenues when circumstances might cause a reduction of those revenues at our properties.
Competition in multifamily housing may negatively affect operations and demand for the Company’s properties or residents.
Our properties face competition for residents from other existing or new multifamily properties, condominiums, single family homes and other living arrangements, whether owned or rental, that may attract residents from our properties or prospective residents that would otherwise choose to live with us. As a result, we may not be able to renew existing resident leases or enter into new resident leases, or if we are able to renew or enter into new leases, they may be at rates or terms that are less favorable than our current rates or terms, resulting in a material impact on our results of operations.
Additionally, our properties face competition for residents as a result of technology innovation. Therefore, we may not be able to retain residents or attract new residents if we are unable to identify and cost effectively implement new, relevant technologies and to keep up with constantly changing resident demand for the latest innovations.
The short-term nature of apartment leases exposes us more quickly to the effects of declining market rents, potentially making our revenue more volatile.
Generally, our residential apartment leases are for twelve months or less. If the terms of the renewal or reletting are less favorable than current terms, then the Company’s results of operations and financial condition could be negatively affected. Given our generally shorter-term lease structure, our rental revenues are impacted by declines in market rents more quickly than if our leases were for longer terms.
Competition for acquisitions may prevent us from acquiring properties on favorable terms.
We may not be successful in pursuing acquisition and development opportunities. We expect that other real estate investors will compete with us for attractive investment opportunities or may also develop properties in markets where we focus our development and acquisition efforts. We may not be in a position or have the opportunity in the future to make suitable property acquisitions on favorable terms.
Operations from new acquisitions, development projects and renovations may fail to perform as expected.
We intend to actively acquire, develop and renovate multifamily operating properties as part of our business strategy. Newly acquired, developed or renovated properties may not perform as we expect. We may also overestimate the revenue (or underestimate the expenses) that a new or repositioned project may generate. The occupancy rates and rents at these properties may fail to meet the expectations underlying our investment. Development and renovations are subject to greater uncertainties and risks due to complexities and lead time in estimating costs. We may underestimate the costs necessary to operate an acquired property to the
13
standards established for its intended market position. We may also underestimate the costs to complete a development property or to complete a renovation.
Construction risks on our development projects could affect our profitability.
We intend to continue to develop multifamily properties as part of our business strategy. Development often includes long planning and entitlement timelines, subjecting the project to changes in market conditions. It can involve complex and costly activities, including significant environmental remediation or construction work in our markets. We may also experience an increase in costs due to general disruptions that affect the cost of labor and/or materials, such as trade disputes, tariffs, labor unrest and/or geopolitical conflicts. We may abandon opportunities that we have already begun to explore for a number of reasons, and as a result, we may fail to recover expenses or option payments already incurred in exploring those opportunities. We may also be unable to obtain, or experience delays in obtaining, necessary zoning, occupancy, or other required governmental or third-party permits and authorizations. These and other risks inherent in development projects could result in increased costs or the delay or abandonment of opportunities.
Because real estate investments are illiquid, we may not be able to sell properties when appropriate.
Real estate investments generally cannot be sold quickly. We may not be able to reconfigure our portfolio promptly in response to changing economic or other conditions. We may be unable to consummate such dispositions in a timely manner, on attractive terms, or at all. In some cases, we may also determine that we will not recover the carrying amount of the property upon disposition. This inability to reallocate our capital promptly could adverselynegatively affect our financial condition, andincluding our ability to make distributions to our security holders.
New acquisitions, development projects and/or renovationsThe Company’s real estate assets may failbe subject to perform as expectedimpairment charges.
A decline in the fair value of our assets may require us to recognize an impairment against our assets under accounting principles generally accepted in the United States (“GAAP”) if we were to determine that, with respect to any assets in unrealized loss positions, we do not have the ability and competitionintent to hold such assets for acquisitions may result in increased pricesa period of time sufficient to allow for properties thatrecovery of the depreciated cost of such assets. If such a determination were to be made, we would likerecognize unrealized losses through earnings and write-down the depreciated cost of such assets to acquire.
We intenda new cost basis, based on the fair value of such assets on the date they are considered to actively acquire, developbe impaired. Such impairment charges reflect non-cash losses at the time of recognition; subsequent disposition or sale of such assets could further affect our future losses or gains, as they are based on the difference between the sale price received and renovate multifamily properties for rental operations as market conditions dictate. We may also acquire multifamily properties thatadjusted amortized cost of such assets at the time of sale. If we are unoccupied or in the early stages of lease-up. We may be unablerequired to lease these apartment properties on schedule, resulting in decreases in expected rental revenues and/or lower yields due to lower occupancy and rental rates as well as higher than expected concessions or higher than expected operating expenses. We may not be able to achieve rents that are consistent with expectations for acquired, developed or renovated properties. We may underestimate the costs necessary to bring an acquired property up to standards established for its intended market position, to complete a development property or to complete a renovation. Additionally, we expect that other real estate investors with capital will compete with us for attractive investment opportunities or may also develop properties in markets where we focus our development and acquisition efforts. This competition (or lack thereof) may increase (or depress) prices for multifamily properties. We may not be in a position or have the opportunityrecognize material asset impairment charges in the future, to make suitable property acquisitions on favorable terms. We have acquired in the past and intend to continue to pursue the acquisition of properties, including large portfolios of properties, that could increase our size and result in alterations to our capital structure. The total number of apartment units under development, costs of development and estimated completion dates are subject to uncertainties arising from changing economic conditions (such as the cost of labor and construction materials), competition and local government regulation.
In connection with such government regulation, we may incur liability if our properties are not constructed and operated in compliance with the accessibility provisions of the Americans with Disabilities Act, the Fair Housing Act or other federal, state or local requirements. Noncompliance could result in fines, subject us to lawsuits and require us to remediate or repair the noncompliance.
10
Development and construction risks could affect our profitability.
We intend to continue to develop multifamily properties. These activities can include long planning and entitlement timelines and can involve complex and costly activities, including significant environmental remediation or construction work in high-density urban and close-in suburban areas. We may abandon opportunities (including land that we have optioned for purchase) that we have already begun to explore for a number of reasons, including changes in local market conditions or increases in construction or financing costs, and, as a result, we may fail to recover expenses or option payments already incurred in exploring those opportunities. The occupancy rates and rents at a property may fail to meet our original expectations for a number of reasons, including changes in market and economic conditions beyond our control and the development by competitors of competing properties. We may be unable to obtain, or experience delays in obtaining, necessary zoning, occupancy, or other required governmental or third party permits and authorizations, which could result in increased costs or the delay or abandonment of opportunities.
We own certain properties subject to ground leases that may limit our use of the properties, restrict our ability to finance, sell or otherwise transfer our interests in these properties and expose us to loss of the properties if such agreements are breached by us, terminated or lapse.
The Company owns the building and improvements and leases the land underlying the improvements under several long-term ground leases. These ground leases may impose limitations on our use of the properties, restrict our ability to finance, sell or otherwise transfer our interests in the properties or restrict the leasing of the properties. These restrictions may limit our ability to timely sell or exchange the properties, impair the properties’ value or negatively impact our ability to find suitable residents for the properties. In addition, we could lose our interests in the properties if the ground leases are breached by us, terminated or lapse. As we get closer to the lease termination dates, the values of the properties could decrease without an extension in place. Certain of these ground leases have payments subject to annual escalations and/or periodic fair market value adjustments whichcharges could adversely affect our financial condition orand results of operations.
Our investmentsWe are subject to risks involved in real estate activity through joint ventures could be adversely affected by our lack of sole decision-making authority regarding major decisions, our reliance on our joint venture partners’ financial condition, any disputes that may arise between us and our joint venture partners and our exposure to potential losses from the actions of our joint venture partners.ventures.
We currently, do and may continue to in the future, to develop and acquire properties in joint ventures with other persons or entities when we believe circumstances warrant the use of such structures. We have several jointentities. Joint ventures with other real estate investors. Joint venture investments involvecreate risks not present with respect to our wholly owned properties, including the following:
Our joint venture partners might experience financial distress, become bankrupt or fail to fund their share of required capital contributions, which may delay construction or development of a property or increase our financial commitment to the joint venture;
• | The possibility that our partners might refuse or be financially unable to make capital contributions when due and therefore we may be forced to make contributions to protect our investments; |
We may be responsible to our partners for indemnifiable losses;
• | We may be responsible to our partners for indemnifiable losses; |
Our joint venture partners may have business interests or goals with respect to a property that conflict with our business interests and goals, which could increase the likelihood of disputes regarding the ownership, management or disposition of the property;
• | Our partners might at any time have business or economic goals that are inconsistent with ours; and |
We may be unable to take actions that are opposed by our joint venture partners under arrangements that require us to share decision-making authority over major decisions affecting the ownership or operation of the joint venture and any property owned by the joint venture, such as the sale or financing of the property or the making of additional capital contributions for the benefit of the property;
Our joint venture partners may take actions that we oppose;
Our ability to sell or transfer our interest in a joint venture to a third party may be restricted without prior consent of our joint venture partners;
We may disagree with our joint venture partners about decisions affecting a property or the joint venture, which could result in litigation or arbitration that increases our expenses, distracts our officers and disrupts the day-to-day operations of the property, including by delaying important decisions until the dispute is resolved; and
We may suffer losses as a result of actions taken by our joint venture partners with respect to our joint venture investments.
• | Our partners may be in a position to take action or withhold consent contrary to our recommendations, instructions or requests. |
At times we have entered into agreements providing for joint and several liability with our partners. We also have in the past and could choose in the future to guarantee part of or all of certain joint venture debt. Frequently, weWe and our respective joint venture partners may
11
each have the right to trigger a buy-sell arrangement whichthat could cause us to sell our interest, or acquire our partners’partner's interest, at a time when we otherwise would notor price that is unfavorable to us. In some instances, joint venture partners may also have initiated such a transaction. Anycompeting interests or objectives that could create conflicts of these risksinterest similar to those noted above. These objectives may be contrary to our compliance with the REIT requirements, and our REIT status could materially and adversely affect our ability to generate and recognize attractive returns onbe jeopardized if any of our joint ventures do not operate in compliance with those requirements. To the extent our partners do not meet their obligations to us or our joint ventures, or they take actions inconsistent with the interests of the joint venture, investments, whichit could have a material adverse effect on our results of operations, financial condition and distributions to our shareholders.
Several of the assets we acquired in the Archstone transaction along with certain preferred interests acquired in joint ventures as part of the Archstone transaction, as well as certain other tax protected properties we have acquired over the years, are subject to tax protection agreements, which could limit our flexibility with respect to our ownership of such assets or cause us to incur material costs.
Several of the assets we acquired from Archstone Enterprise LP (“Archstone”) in February 2013 are subject to various agreements limiting the ability of the owner of the property to take actions that would trigger income tax liability for the contributing owner of the property, including a taxable disposition of the property. We assumed these obligations upon the completion of the Archstone transaction. In addition, we will also be required to maintain a certain amount of qualified nonrecourse financing on the tax protected properties during their respective restricted periods. Our obligations relating to these tax protected properties (as well as certain other tax protected properties we have acquired over the years) may affect the way in which we conduct our business, including whether, when and under what circumstances we sell properties or interests therein and the timing and nature of our financings and refinancing transactions. As a result, we may not be able to dispose of or refinance the tax protected properties when to do so may have otherwise been favorable to us and our shareholders, which could have a material adversenegative effect on our results of operations and financial condition.condition, including distributions to our security holders.
14
Corporate social responsibility, specifically related to ESG, may impose additional costs and expose us to new risks.
Sustainability, social and governance evaluations remain highly important to investors and other stakeholders. Certain preferred interests acquiredorganizations that provide corporate governance and other corporate risk advisory services to investors have developed scores and ratings to evaluate companies and investment funds based upon ESG metrics. Many investors focus on positive ESG-related business practices and scores when choosing to allocate their capital and may consider a company's score as a reputational or other factor in joint venturesmaking an investment decision. Investors' increased focus and activism related to ESG and similar matters may constrain our business operations or increase expenses. In addition, investors may decide to refrain from investing in us as parta result of their assessment of our approach to and consideration of ESG factors. We may face reputational damage in the Archstone transactionevent our corporate responsibility procedures or standards do not meet the standards set by various constituencies. Although we have complex tax requirementsgenerally scored highly in these metrics to date, there can be no assurance that if violated,we will continue to score highly in the future. In addition, the criteria by which companies are rated for ESG efforts may change, which could cause us to be requiredreceive lower scores than in previous years. A low ESG score could result in a negative perception of the Company, exclusion of our securities from consideration by certain investors who may elect to indemnifyinvest with our competition instead and/or cause investors to reallocate their capital away from the preferred shareholdersCompany, all of which could have an adverse impact on the price of our securities.
Risks Related to our Financing Strategy and Capital Structure
Disruptions in the financial markets could hinder our ability to obtain debt and equity financing and impact our acquisitions and dispositions.
Dislocations and disruptions in capital markets could result in increased costs or lack of availability of debt financing (including under our joint venture partnercommercial paper program) and equity financing. Such events may affect our ability to refinance existing debt, require us to utilize higher cost alternatives and/or impair our ability to adjust to changing economic and business conditions. Capital market disruptions could negatively impact our ability to make acquisitions or make it more difficult or not possible for certain tax protection costs.us to sell properties or may unfavorably affect the price we receive for properties that we do sell. Such disruptions could cause the price of our securities to decline.
Changes in market conditions and volatility of share prices could adversely affectdecrease the market price of our Common Shares.
The stock markets, including the New York Stock Exchange on which we list our Common Shares, have experienced significant price and volume fluctuations over time. As a result, the market price of our Common Shares could be similarly volatile, and investorsvolatile. Investors in our Common Shares consequently may experience a decrease in the value of their shares, including decreases unrelateddue to this volatility and not necessarily related to our operating performance or prospects. TheAdditionally, the market price of our Common Shares may decline or fluctuate significantly in response to many factors, including but not limited to the following:
General political, market and economic conditions;
Actual or anticipated variations in our guidance, quarterly operating results or dividends;
Changes in our net operating income (“NOI”), earnings, funds from operations (“FFO”) or Normalized FFO estimates;
Difficulties or inability to access capital or extend or refinance debt;
Large portfolio acquisitions or dispositions;
Decreasing (or uncertainty in) real estate valuations;
Rising crime rates in markets where our primarily urban and close-in suburban portfolio is concentrated;
A change in analyst and/or credit ratings;
Adverse market reaction to any additional debt we incur in the future;
Governmental regulatory action, including changes or proposed changes to rent control or rent stabilization laws and regulations and the mandates of Fannie Mae or Freddie Mac, and changes in tax laws;
The payment of any special dividends;
The issuance of additional Common Shares, or the perception that such issuances might occur, including under EQR’s At-The-Market (“ATM”) share offering program;
The resalesale of substantial amounts of our Common Shares, or the anticipation of the resalesale of such shares, by large holders of our securities; and
securities. The repurchaseissuance of additional Common Shares by the Company, or the perception that such repurchasesissuances might occur, throughcould also cause significant volatility and decreases in the Company’s share repurchase program, especially if those repurchasesvalue of our shares.
Our financial counterparties may not perform their obligations.
Although we have not experienced any material counterparty non-performance, disruptions in financial and credit markets or other events could impair the ability of our counterparties to perform under their contractual obligations to us. There are funded using additionalmultiple financial institutions that are individually committed to provide borrowings under our revolving credit facility. Should any of these institutions fail to perform their obligations when contractually required, our financial condition could be adversely affected.
Rising interest rates can increase costs.
The Company is exposed to market risk from financial instruments primarily from changes in market interest rates. Such risks derive from the refinancing of debt, as opposedexposure to interest rate fluctuations in floating rate debt and from derivative instruments utilized to swap fixed rate debt to floating rates or to hedge rates in anticipation of future debt issuances. Increases in interest rates would increase our interest expense and the costs of refinancing existing debt.
Insufficient cash flow could affect our ability to service existing debt and create refinancing risk.
We are subject to risks normally associated with debt financing, including the risk that our cash flow will be insufficient to meet required payments. We may not be able to refinance existing debt and if we can, the terms of such refinancing may be less favorable than the terms of existing indebtedness. Our inability to refinance, extend or repay debt with proceeds from operations.other capital market transactions would negatively impact our financial condition. If the debt is secured, the mortgage holder may also foreclose on the property.
1215
A significant downgrade in our credit ratings could adversely affect our performance.
A significant downgrade in our credit ratings, while not affecting our ability to draw proceeds under the Company’s revolving credit facility, would cause the corresponding borrowing costs to increase, impact our ability to borrow secured and unsecured debt, and potentially impair our ability to access the commercial paper market or otherwise limit our access to capital. In addition, a downgrade below investment grade would likely cause us to lose access to the commercial paper markets and would require us to post cash collateral and/or letters of credit in favor of some of our secured lenders to cover our self-insured property and liability insurance deductibles or to obtain lower deductible insurance compliant with the lenders’ requirements at the lower ratings level.
Financial covenants could limit operational flexibility and affect our overall financial position.
The terms of our credit agreements, including our revolving credit facility and the indentures under which a substantial portion of our unsecured debt was issued, require us to comply with a number of financial covenants. These covenants may limit our flexibility to run our business and breaches of these covenants could result in defaults under the instruments governing the applicable indebtedness and trigger a cross default of other debt.
Some of our properties are financed with tax-exempt bonds or otherwise contain restrictive covenants or deed restrictions, including affordability requirements, which limit income from certain properties. The Company monitors compliance with the restrictive covenants and deed restrictions that affect these properties. While we generally believe that the interest rate benefit from financing properties with tax-exempt bonds more than outweighs any loss of income due to restrictive covenants or deed restrictions, this may not always be the case. Some of these requirements are complex, and our failure to comply with them may subject us to material fines or liabilities.
We may change the dividend policy for our securities in the future.
The decision to declare and pay dividends on our securities, as well as the timing, amount and composition of any such future dividends, is at the discretion of the Board of Trustees and will depend on actual and projected financial conditions, the Company’s actual and projected liquidity and operating results, the Company’s projected cash needs for capital expenditures and other investment activities and such other factors as the Company’s Board of Trustees deems relevant. The Board of Trustees may modify our dividend policy from time to time and any change in our dividend policy could negatively impact the market price of our securities.
Issuances or sales of our Common Shares or Units may be dilutive.
TheAny potential additional issuance of Common Shares or sale of substantial amountsOP Units would reduce the percentage of our Common Shares and OP Units owned by investors. In most circumstances, shareholders and unitholders will not be entitled to vote on whether directly by us or in the secondary market, the perception that such issuances or sales of ournot we issue additional Common Shares could occur or Units. In addition, depending on the availability for future issuance or saleterms and pricing of additional offerings of our Common Shares or securities convertible into or exchangeable or exercisable forUnits along with the value of our properties, our shareholders and unitholders could experience dilution in both book value and fair value of their Common Shares could have a dilutive effect onor Units, as well as dilution in our actual and expected earnings per share, FFOfunds from operations (“FFO”) per share and Normalized FFO per share.
Regulatory and Tax Risks
The actual amountadoption of, dilution cannot be determined at this time and would be dependent upon numerous factors which are not currently known to us.
We may not have sufficient cash flows from operations after capital expenditures to cover our distributions and our dividend policy may lead to quicker dividend reductions.
We generally consider our cash flows provided by operating activities after capital expenditures to be adequate to meet operating requirements and payment of regular distributions to our security holders. However, whether due toor changes, in the dividend policyrent control or otherwise, there may be times when we experience shortfallsrent stabilization regulations and eviction regulations in our markets could have an adverse effect on our operations and property values.
A growing number of state and local governments have enacted and may continue to consider enacting and/or expanding rent control or rent stabilization regulations, which have limited and could continue to limit in broadening ways our ability to raise rents or charge certain fees, either of which could have a retroactive effect. We continue to see increases in governments considering or being urged by advocacy groups to consider rent forgiveness, rent control or rent stabilization regulations or expand coverage of distributions,existing regulations in our markets. These regulations may also make changes to and/or expand eviction and other tenants’ rights regulations that may limit our ability to enforce residents’ or tenants’ contractual rental obligations (such as eviction moratoriums), pursue collections or charge certain fees, which may cause uscould have an adverse impact on our operations and property values.
Compliance or failure to consider reducing our distributions and/or using the proceeds from property dispositions or additional financing transactions to make up the difference. Should these shortfalls occur for lengthy periods of time or be material in nature, our financial condition may be adversely affected and we may not be able to maintain our current distribution levels. See Item 7, Management’s Discussion and Analysis of Financial Condition and Results of Operations, for additional discussion regarding our dividend policy.
The value of investment securitiescomply with regulatory requirements could result in lossessubstantial costs.
Our properties are subject to various federal, state and local regulatory requirements, such as state and local fire and life safety requirements, building and zoning codes and federal, state and local accessibility requirements, including and in addition to those imposed by the Company.
From time to time,Americans with Disabilities Act and the Company holds investment securities and/or cash investments that have various levels of repayment and liquidity risk, including government obligations and bond funds, money market funds or bank deposits. On occasion we also may purchase securities of companies in our own industry as a means to invest funds. There may be times when we experience declines in the value of these investment securities, which mayFair Housing Act. Noncompliance could result in lossesfines, subject us to lawsuits and require us to remediate or repair the Companynoncompliance. Existing requirements could change and compliance with future requirements may require significant unanticipated expenditures that could adversely affect our financial condition or results of operations couldoperations.
16
Environmental problems are possible and can be adversely affected. Sometimescostly.
Federal, state and local laws and regulations relating to the cash we depositprotection of the environment may require current or previous owners or operators of real estate to investigate and clean up hazardous or toxic substances at such properties. The owner or operator may have to pay a bank substantially exceedsgovernmental entity or third parties for property damage and for investigation and clean-up costs incurred by such parties in connection with the FDIC insurance limitcontamination. These laws typically impose clean-up responsibility and liability without regard to whether the owner or we invest cash in money marketoperator knew of or similar type funds with investment management institutions thatcaused the presence of the contaminants. Even if more than one person may have been responsible for the contamination, each person covered by the environmental laws may be subjectheld responsible for all of the clean-up costs incurred. Third parties may also sue the owner or operator of a site for damages and costs resulting from environmental contamination emanating from that site. We cannot be assured that existing environmental assessments of our properties reveal all environmental liabilities, that any prior owner of any of our properties did not create a material environmental condition not known to nowus, or that a material environmental condition does not otherwise exist as to any of our properties.
Changes in U.S. accounting standards may materially and adversely affect the future, liquidity and/reporting of our operations.
The Company follows GAAP, which is established by the Financial Accounting Standards Board (“FASB”), an independent body whose standards are recognized by the Securities and Exchange Commission (“SEC”) as authoritative for publicly held companies. The FASB and the SEC create and interpret accounting standards and may issue new accounting pronouncements or withdrawal restrictions, resulting in risk tochange the Companyinterpretation and application of loss or lackthese standards that govern the preparation of immediate availabilityour financial statements. These changes could have a material impact on our reported consolidated results of funds if these banks or institutions fail to meet their obligations.operations and financial position.
Any weaknesses identified in our internal control over financial reporting could have an adverse effect onresult in a decrease of our share price.
Section 404 of the Sarbanes-Oxley Act of 2002 requires us to evaluate and report on our internal control over financial reporting. If we identify one or more material weaknesses in our internal control over financial reporting, we could lose investor confidence in the accuracy and completeness of our financial reports, which in turn could have a negative impact on our share price.
Our failure to qualify as a REIT would have serious adverse consequences to our security holders.
We plan to continue to meet the requirements for taxation as a REIT. Many of these requirements, for which there is limited judicial and administrative interpretation, however, are highly technical and complex. Therefore, we cannot guarantee that we have qualified or will qualify as a REIT in the future. The determination that we are a REIT requires an analysis of various factual matters that may not be totally within our control. To qualify as a REIT, our assets must be substantially comprised of real estate assets as defined in the Internal Revenue Code of 1986, as amended (the “Code”), and related guidance and our gross income must generally come from rental and other real estate or passive related sources that are itemized in the REIT tax laws. We are also required to distribute to security holders at least 90% of our REIT taxable income excluding net capital gains.
If we fail to qualify as a REIT, we would be subject to U.S. federal income tax at regular corporate rates (including, for years prior to 2018, any alternative minimum tax) and would have to pay significant income taxes unless the Internal Revenue Service (“IRS”) granted us relief under certain statutory provisions. In addition, we would remain disqualified from taxation as a REIT for four years following the year in which we failed to qualify as a REIT. We would therefore have less money available for investments or for distributions to security holders and would no longer be required to make distributions to security holders. This would likely have a significant negative impact on the value of our securities.
In addition, certain of our subsidiary entities have elected to be taxed as REITs. As such, each must separately satisfy all of the requirements to qualify for REIT status. If a subsidiary REIT did not satisfy such requirements, and certain relief provisions did not apply, it would be taxed as a regular corporation and its income would be subject to U.S. federal income taxation. Failure to comply with these complex REIT rules at the subsidiary REIT level can have a material and detrimental impact to EQR’s REIT status.
Gain on disposition of assets held for sale in the ordinary course of business is subject to 100% tax.
Any gain resulting from transfers of properties we hold as inventory or primarily for sale to customers in the ordinary course of business is treated as income from a prohibited transaction subject to a 100% penalty tax unless certain safe harbor exceptions set forth in the Code apply. We do not believe that our transfers or disposals of property are prohibited transactions. However, whether property is held for investment purposes is a question that depends on all the facts and circumstances surrounding the particular transaction. The IRS may contend that certain transfers or dispositions of properties by us or contributions of properties are prohibited transactions. While we believe the IRS would not prevail in any such dispute, if the IRS were to argue successfully that a transfer or disposition of property constituted a prohibited transaction, we would be required to pay a 100% penalty tax on any gain allocable to us from the prohibited transaction. In addition, income from a prohibited transaction might adversely affect our ability to satisfy the income tests for qualification as a REIT.
17
We may be subject to legislative or regulatory tax changes that could negatively impact our financial condition.
At any time, U.S. federal income tax laws governing REITs or impacting real estate or the administrative interpretations of those laws may be enacted or amended. We cannot predict if or when any new U.S. federal income tax law, regulation or administrative interpretation, or any amendment to any existing U.S. federal income tax law, IRS and U.S. Department of Treasury regulations or other administrative guidance, will be adopted or become effective and any such law, regulation or interpretation may take effect retroactively. The Company and our shareholders could be negatively impacted by any such change in, or any new, U.S. federal income tax law, regulations or administrative guidance.
Distribution requirements may limit our flexibility to manage our portfolio.
In order to maintain qualification as a REIT under the Code, a REIT must annually distribute to its shareholders at least 90% of its REIT taxable income, excluding the dividends paid deduction and net capital gains. To the extent the REIT does not distribute all its net capital gain, or distributes at least 90%, but less than 100% of its REIT taxable income, it will be required to pay regular U.S. federal income tax on the undistributed amount at corporate rates. In addition, we will be subject to a 4% nondeductible excise tax on amounts, if any, by which distributions we pay in any calendar year are less than the sum of 85% of our ordinary income, 95% of our net capital gains and 100% of our undistributed income from prior years. We may not have sufficient cash or other liquid assets to meet the 90% distribution requirement. We may be required from time to time, under certain circumstances, to accrue as income for tax purposes interest and rent earned but not yet received. We may incur a reduction in tax depreciation without a reduction in capital expenditures. Difficulties in meeting the 90% distribution requirement might arise due to competing demands for our funds or due to timing differences between tax reporting and cash distributions, because deductions may be disallowed, income may be reported before cash is received, expenses may have to be paid before a deduction is allowed or because the IRS may make a determination that adjusts reported income. In addition, gain from the sale of property may exceed the amount of cash received on a leverage-neutral basis. A substantial increase to our taxable income may reduce the flexibility of the Company to manage its portfolio through dispositions of properties other than through tax deferred transactions or cause the Company to borrow funds or liquidate investments on unfavorable terms in order to meet these distribution requirements. If we fail to satisfy the 90% distribution requirement and are unable to cure the deficiency, we would cease to be taxed as a REIT, resulting in substantial tax-related liabilities.
We have a share ownership limit for REIT tax purposes.
To remain qualified as a REIT for U.S. federal income tax purposes, not more than 50% in value of our outstanding Shares may be owned, directly or indirectly, by five or fewer individuals at any time during the last half of any year. To facilitate maintenance of our REIT qualification, our Declaration of Trust, subject to certain exceptions, prohibits ownership by any single shareholder of more than five percent of the lesser of the number or value of any outstanding class of common or preferred shares (the “Ownership Limit”). Absent an exemption or waiver granted by our Board of Trustees, securities acquired or held in violation of the Ownership Limit will be transferred to a trust for the exclusive benefit of a designated charitable beneficiary, and the security holder’s rights to distributions and to vote would terminate. A transfer of Shares may automatically be deemed void if it causes a person to violate the Ownership Limit. The Ownership Limit could delay or prevent a change in control and, therefore, could affect our security holders’ ability to realize a premium over the then-prevailing market price for their Shares. To reduce the ability of the Board to use the Ownership Limit as an anti-takeover device, the Company’s Ownership Limit requires, rather than permits, the Board to grant a waiver of the Ownership Limit if the individual seeking a waiver demonstrates that such ownership would not jeopardize the Company’s status as a REIT.
Tax elections regarding distributions may impact future liquidity of the Company or our shareholders.
Under certain circumstances we have made and/or may consider making in the future, a tax election to treat certain distributions to shareholders made after the close of a taxable year as having been distributed during such closed taxable year. This election, which is provided for in the Code, may allow us to avoid increasing our dividends or paying additional income taxes in the current year. However, this could result in a constraint on our ability to decrease our dividends in future years without creating risk of either violating the REIT distribution requirements or generating additional income tax liability. In addition, the Company may be required to pay interest to the IRS based on such a distribution.
In order to retain liquidity and continue to satisfy the REIT distribution requirements, the Company could issue shares rather than pay a dividend entirely in cash to shareholders. The IRS has published several rulings which have allowed REITs to offer shareholders the choice between shares or cash as a form of payment of a dividend (an “elective stock dividend”). However, REITs are generally required to structure the cash component to be no less than 20% of the total dividend paid. Therefore, it is possible that the total tax burden to shareholders resulting from an elective stock dividend may exceed the amount of cash received by the shareholder.
Inapplicability of Maryland law limiting certain changes in control.
Certain provisions of Maryland law applicable to REITs prohibit “business combinations” (including certain issuances of equity securities) with any person who beneficially owns ten percent or more of the voting power of outstanding securities, or with an affiliate who, at any time within the two-year period prior to the date in question, was the beneficial owner of ten percent or more of the voting power of the Company’s outstanding voting securities (an “Interested Shareholder”), or with an affiliate of an Interested
18
Shareholder. These prohibitions last for five years after the most recent date on which the Interested Shareholder became an Interested Shareholder. After the five-year period, a business combination with an Interested Shareholder must be approved by two super-majority shareholder votes unless, among other conditions, holders of common shares receive a minimum price for their shares and the consideration is received in cash or in the same form as previously paid by the Interested Shareholder for its common shares. As permitted by Maryland law, however, the Board of Trustees of the Company has opted out of these restrictions with respect to any business combination involving Sam Zell and certain of his affiliates and persons acting in concert with them. Consequently, the five-year prohibition and the super-majority vote requirements will not apply to a business combination involving us and/or any of them. Such business combinations may not be in the best interest of our security holders.
General Risk Factors
Risk of Pandemics or Other Health Crisis.
A pandemic, epidemic or other health crisis, similar to the recent outbreak of COVID-19, affecting areas where our properties, corporate/regional offices or major service providers are located could have an adverse effect on our share price.business, results of operations, cash flows and financial condition.
The occurrence of cyber incidents, or a deficiency in our cybersecurity, could negatively impact our business by causing a disruption to our operations, a compromise or corruption of our confidential information, and/or damage to our reputation and business relationships, all of which could negatively impact our financial results.
A cyber incident is an intentional attack or an unintentional event that can include gaining unauthorized access to systems to disrupt payment collections and operations, corrupt data or steal confidential information, including information regarding our residents, prospective residents, employees and employees’ dependents.
Despite system redundancy, the implementation of security measures, required employee awareness training and the existence of a disaster recovery plan for our internal information technology systems, our systems and systems maintained by third partythird-party vendors with which we do business are vulnerable to damage from any number of sources. We face risks associated with security breaches, whether through cyber attacks or cyber intrusions over the Internet, malware, computer viruses, attachments to emails, phishing attempts, ransomware or other scams, persons inside our organization or persons/vendors with access to our systems and other significant disruptions of our information technology networks and related systems.systems, including property infrastructure. Our information technology networks and related systems are essential to the operation of our business and our ability to perform day-to-day operations. Even the most well-protected information, networks, systems and facilities remain potentially vulnerable because the techniques used in such attempted security breaches evolve and generally are not recognized until launched against a target, and in some cases are designed not to be detected and, in fact, may not be detected. Accordingly, we may be unable to anticipate these techniques or to implement adequate security barriers or other preventative measures, and thus it is impossible for us to entirely mitigate this risk.
We collect and hold personally identifiable information of our residents and prospective residents in connection with our leasing activities, and we collect and hold personally identifiable information of our employees and their dependents. In
13
addition, we engage third partythird-party service providers that may have access to such personally identifiable information in connection with providing necessary information technology, and security and other business services to us. The systems of our third-party service providers may contain defects in design or other problems that could unexpectedly compromise personally identifiable information. Although we make efforts to maintain the security and integrity of these types ofour information technology networks and related systemsthose of our third-party providers and we have implemented various measures to manage the risk of a security breach or disruption, there can be no assurance that our security efforts and measures will be effective or that attempted security breaches or disruptions would not be successful or damaging.
We address potential breaches or disclosure of this confidential personally identifiable information by implementing a variety of security measures intended to protect the confidentiality and security of this information including (among others): (a) engaging reputable, recognized firms to help us design and maintain our information technology and data security systems; (b) conducting periodic testing and verification of information and data security systems, including performing ethical hacks of our systems to discover where any vulnerabilities may exist; and (c) providing periodic employee awareness training around phishing and other scams, malware and other cyber risks. WeThe Company also maintainhas a cyber riskliability insurance policy to provide some coverage for certain risks arising out of data and network breaches (see further discussion on cyber riskand data privacy regulations which provides a policy aggregate limit and a per occurrence deductible. Cyber liability insurance below).generally covers, among other things, costs associated with the wrongful release, through inadvertent breach or network attack, of personally identifiable information. However, there can be no assurance that these measures will prevent a cyber incident or that our cyber riskliability insurance coverage will be sufficient in the event of a cyber incident.
A breach or significant and extended disruption in the function of our systems, including our primary website, could damage our reputation and cause us to lose residents and revenues, result in a violation of applicable privacy and other laws, generate third party third-party
19
claims, result in the unintended and/or unauthorized public disclosure or the misappropriation of proprietary, personally identifiable and confidential information and require us to incur significant expenses to address and remediate or otherwise resolve these kinds of issues. We may not be able to recover these expenses in whole or in any part from our service providers, our insurers or any other responsible parties. As a result, there can be no assurance that our financial results would not be negatively impacted.
We are also subject to laws, rules, and regulations in the United States, such as the California Consumer Privacy Act (“CCPA”), relating to the collection, use, and security of resident, customer, employee and other data. Evolving compliance and operational requirements under the CCPA and the privacy laws of other jurisdictions in which we operate may impose significant costs that are likely to increase over time. Our failure to comply with laws, rules, and regulations related to privacy and data protection could harm our business or reputation or subject us to fines and penalties.
The Audit Committee is primarily responsible for oversight of the risk management process related to cybersecurity and typically meets no less often than annually with Company information technology personnel to discuss recent trends in cyber risks and the Company’s strategy to defend its business systems and information against cyber attacks as well as the Company’s efforts to comply with data privacy laws such as the CCPA.
Our business and operations rely on specialized information technology systems, the failure of or inadequacy of which could impact our business.
Our ability to identify, implement and maintain appropriate information technology systems differentiates and creates competitive advantages for us in the operations of our business. These systems often are developed and hosted by third party vendors whom we rely upon for ongoing maintenance, upgrades and enhancements. While we maintain a rigorous process around selecting appropriate information technology systems and partnering with vendors, our failure to adequately do so could negatively impact our operations and competitive position.
We depend on our key personnel.
We depend on the efforts of our trustees and executive officers. If one or more of them resign or otherwise cease to be employed by us, our business and results of operations and financial condition could be adversely impacted.affected.
Litigation risk could affect our business.
We may become involved in legal proceedings, includingclaims, actions, inquiries and investigations in the ordinary course of business. These legal proceedings may include, but are not limited to, proceedings related to consumer, shareholder, securities, employment, environmental, development, condominium conversion, tort, eviction and commercial legal issues (any of which could resultissues. Litigation can be lengthy and expensive, and it can divert management's attention and resources. Results cannot be predicted with certainty, and an unfavorable outcome in a class action lawsuit) that, if decided adversely to or settled by us,litigation could result in liability material to our financial condition or results of operations.
Environmental problems are possible and can be costly.
Federal, state and local laws and regulations relating to the protection of the environment may require a current or previous owner or operator of real estate to investigate and clean up hazardous or toxic substances or petroleum product releases at such property. The owner or operator may have to pay a governmental entity or third parties for property damage and for investigation and clean-up costs incurred by such parties in connection with the contamination. These laws typically impose clean-up responsibility and liability without regard to whether the owner or operator knew of or caused the presence of the contaminants. Even if more than one person may have been responsible for the contamination, each person covered by the environmental laws may be held responsible for all of the clean-up costs incurred. In addition, third parties may sue the owner or operator of a site for damages and costs resulting from environmental contamination emanating from that site.
Substantially all of our properties have been the subject of environmental assessments completed by qualified independent environmental consulting companies. While these environmental assessments have not revealed, nor are we aware of, any environmental liability that our management believes would have a material adverse effect on our business, results of operations, financial condition or liquidity, there can be no assurance that we will not incur such liabilities in the future.
We are aware that some of our properties have lead paint and have implemented an operations and maintenance program at each of those properties. While we do not currently anticipate that we will incur any material liabilities as a result of the presence of lead paint at our properties, there can be no assurance that we will not incur such liabilities in the future.
There have been a number of lawsuits against owners and managers of multifamily properties alleging personal injury and property damage caused by the presence of mold in residential real estate. While we have adopted programs designed to minimize the existence of mold in any of our properties as well as guidelines for promptly addressing and resolving reports of mold to minimize any impact mold might have on our residents or the property, should mold become an issue in the future, our financial condition or results of operations may be adversely affected.
14
We cannot be assured that existing environmental assessments of our properties reveal all environmental liabilities, that any prior owner of any of our properties did not create a material environmental condition not known to us, or that a material environmental condition does not otherwise exist as to any of our properties.
Insurance policies can be costly and may not cover all losses, which may adversely affect our financial condition or results of operations.
As of December 31, 2017, theThe Company’s property, general liability and workers compensation insurance policies provide for acoverage with substantial per occurrence deductible of $250,000. Earthquake losses are subject todeductibles and/or self-insured retentions. These self-insurance retentions can be a 2% deductible in the state of Washington and a 5% deductible in California, applied to the values of the buildings involved in the loss. The Company also typically self-insures a substantialmaterial portion of the first $50 million of a property lossinsurance losses in excess of thesethe base deductibles. Should a claim exceed these amounts, it would be 100% covered by insurance. Furthermore,While the Company has previously purchased additionalincremental insurance coverage in the event that the Company suffersof multiple non-catastrophic occurrences with losses from $25 million to $50 million within the same policy year. The Company’s general liability and worker’s compensation policies at December 31, 2017 provide for a $2.0 million and $1.0 million per occurrence deductible, respectively. These higheryear, these substantial deductible and self-insured retention amounts do expose the Company to greater potential for uninsured losses. The Company also has become more susceptible to large losses as it has transformed its portfolio, becoming more concentrated in fewer, more valuable assets over a smaller geographical footprint. Furthermore, the potential impact of climate change, increased severe weatherand this additional multiple occurrences coverage may not be available at all or earthquakes could cause a significant increase in insurance premiums and deductibles, or a decreaseon commercially reasonable terms in the availabilityfuture. We believe the policy specifications and insured limits of coverage, eitherthese policies are adequate and appropriate; however, there are certain types of which could expose the Company to even greater uninsuredextraordinary losses which may not be adequately covered under our insurance program. As a result, our financial results could be adversely affectaffected and may vary significantly from period to period.
The Company relies on third-party insurance providers for its property, general liability, workers compensation and other insurance, and should any of them experience liquidity issues or other financial distress, it could negatively impact their ability to pay claims under the Company’s policies.
Earthquake risk: Our policies insuring against earthquake losses have substantial deductibles which are applied to the values of the buildings involved in the loss. With the geographic concentration of our properties, a single earthquake affecting a market may have a significant negative effect on our financial condition orand results of operations.We cannot assure that an earthquake would not cause damage or losses greater than insured levels. In the event of a loss in excess of insured limits, we could lose our capital invested in the affected property or market, as well as anticipated future revenue.
20
Terrorism risk: The Company also has $750.0 million in terrorism insurance coverage with a $100,000 deductible. This coveragewhich excludes losses from nuclear, biological and chemical attacks. In the event of a terrorist attack impacting one or more of our properties, we could lose the revenues from the property, our capital investment in the property and possibly face liability claims from residents or others suffering injuries or losses.
As of December 31, 2017, the Company’s cyber liability insurance policy provides for a $5.0 million policy aggregate limit and a per occurrence deductible of $250,000. Cyber liability insurance generally covers costs associated with the wrongful release, through inadvertent breach or network attack, of personally identifiable information such as social security or credit card numbers. This cyber policy would cover the cost of victim notification, credit monitoring and other crisis response expenses.
The Company relies on third party insurance providers for its property, general liability and worker’s compensation insurance. While there has yet to be any non-performance by these major insurance providers, should any of them experience liquidity issues or other financial distress, it could negatively impact the Company. In addition, the Company annually assesses its insurance needs based on the cost of coverage and other factors. We may choose to self insure a greater portion of this risk in the future or may choose to have higher deductibles or lesser policy terms.
Damage from catastrophicCatastrophic weather and other natural events and climate change could result in losses to the Company.
Certain of ourdisaster risk: Our properties aremay be located in areas that maycould experience catastrophic weather and other natural eventsdisasters from time to time, including fires,wildfires, snow or ice storms, windstorms or hurricanes, earthquakes, flooding or other severe weather.disasters. These adversesevere weather and natural eventsdisasters could cause substantial damages or losses to our properties which may not be covered or could exceed our insurance coverage. In the event of a loss in excess of insured limits, we could lose our capital invested in the affected property, as well as anticipated future revenue from that property. WeExposure to this risk could also continue to be obligated to repay any mortgage indebtednessresult in a decrease in demand for properties located in these areas or other obligations related to the property. Any such loss could materially and adversely affect our business and our financial condition and results of operations.affected by these conditions.
Climate change risk: To the extent that significant changes in the climate occur in areas where our properties are located, we may experience extremesevere weather, and changes in precipitation and temperature, all of which may result in physical damage to or a decrease inthe demand for properties located in these areas or affected by these conditions. Should the impact of climate change be material in nature, includingsignificant property damage or destruction of our properties could result. In addition, climate change could cause a significant increase in insurance premiums and deductibles or occur for lengthy periodsa decrease in the availability of time, ourcoverage, either of which could expose the Company to even greater uninsured losses. Our financial condition or results of operations may be adversely affected.
In addition, changes in federal, state and statelocal legislation and regulation based on concerns about climate change could result in increased capital expenditures to improve the energy efficiency ofon our existing properties and could also require us to spend more on our new development properties without a corresponding increase in revenue.
15
The inability of Lehman to fulfill its indemnification obligations to us under the purchase agreement for the Archstone transaction could increase our liabilities and adversely affect our results of operations and financial condition.
In addition to certain indemnification obligations of each party to the purchase agreement for the Archstone transaction relating to breaches of fundamental representations and warranties and breaches of covenants and certain other specified matters, we negotiated as a term in the purchase agreement that Lehman Brothers Holdings Inc. (“Lehman”) retain responsibility for and indemnify us against damages resulting from certain third-party claims or other liabilities. These third-party claims and other liabilities include, without limitation, costs associated with various litigation matters. Lehman filed for bankruptcy protection under Chapter 11 of the Bankruptcy Code in September 2008 and is currently in the process of post-petition liquidation. If Lehman completes its liquidation prior to the termination of their indemnity obligations to us under the purchase agreement, or otherwise distributes substantially all of its assets to its creditors prior to such time, Lehman may not be able to satisfy its obligations with respect to claims and retained liabilities covered by the purchase agreement. The failure of Lehman to satisfy such obligations could have a material adverse effect on our results of operations and financial condition because claimants may successfully assert that we are liable for those claims and/or retained liabilities. In addition, certain obligations of Lehman to indemnify us terminated upon expiration of the applicable indemnification period (generally no more than four years following the closing or February 27, 2017). The assertion of third-party claims after the expiration of the applicable indemnification period, or the failure of Lehman to satisfy its indemnification obligations, could have a material adverse effect on our results of operations and financial condition.
Non-performance by our operating counterparties could adversely affect our performance.
We have relationships with and, from time to time, we execute transactions with or receive services from many counterparties. As a result, defaults by counterparties could result in services not being provided, or volatility in the financial markets could affect counterparties’ ability to complete transactions with us as intended, both of which could result in disruptions to our operations that may adversely affect our business and results of operations.
Debt financing and preferred shares/preference units could adversely affect our performance.
General
Please refer to Item 7, Management’s Discussion and Analysis of Financial Condition and Results of Operations, for the Company’s debt summaries as of December 31, 2017.
In addition to debt, we have a liquidation value of $37.3 million of outstanding preferred shares of beneficial interest/preference units with a dividend preference of 8.29% per annum as of December 31, 2017. Our use of debt and preferred equity financing creates certain risks, including the following:
Disruptions in the financial markets could adversely affect our ability to obtain debt financing and impact our acquisitions and dispositions.
Dislocations and liquidity disruptions in capital and credit markets could impact liquidity in the debt markets, resulting in financing terms that are less attractive to us and/or the unavailability of certain types of debt financing. Should the capital and credit markets experience volatility and the availability of funds again become limited, or be available only on unattractive terms, we will incur increased costs associated with issuing debt instruments. In addition, it is possible that our ability to access the capital and credit markets may be limited or precluded by these or other factors at a time when we would like, or need, to do so, which would adversely impact our ability to refinance maturing debt and/or react to changing economic and business conditions. Uncertainty in the credit markets could negatively impact our ability to make acquisitions and make it more difficult or not possible for us to sell properties or may adversely affect the price we receive for properties that we do sell, as prospective buyers may experience increased costs of debt financing or difficulties in obtaining debt financing. Potential continued disruptions in the financial markets could also have other unknown adverse effects on us or the economy generally and may cause the price of our securities to fluctuate significantly and/or to decline.
Potential reforms to Fannie Mae and Freddie Mac could adversely affect our performance.
Through their lender originator networks, Fannie Mae and Freddie Mac (the “Government Sponsored Enterprises” or “GSEs”) are significant lenders and enhancers of tax-exempt bonds both to the Company and to buyers of the Company’s properties. The GSEs have a mandate to support multifamily housing through their financing activities. Any changes to their mandates, reductions in their size or the scale of their activities or loss of key personnel could have an impact on the Company and may, among other things, lead to lower values for our assets and higher interest rates on our secured borrowings. Disruptions in the floating rate tax-exempt bond market (where interest rates reset weekly) and in the credit market’s perception of the GSEs, which guarantee and provide liquidity for many of these bonds, have been experienced in the past and may be experienced in the future and could result in an increase in interest rates on our tax-exempt debt obligations. These bonds could
16
also be put to our consolidated subsidiaries if the GSEs fail to satisfy their guaranty obligations. While this obligation is in almost all cases non-recourse to us, this could cause the Company to have to repay these obligations on short notice or risk foreclosure actions on the collateralized assets.
Non-performance by our financial counterparties could adversely affect our performance.
Although we have not experienced any material counterparty non-performance, disruptions in financial and credit markets could, among other things, impede the ability of our counterparties to perform on their contractual obligations. There are multiple financial institutions that are individually committed to lend us varying amounts as part of our revolving credit facility. Should any of these institutions fail to fund their committed amounts when contractually required, our financial condition could be adversely affected. Should several of these institutions fail to fund, we could experience significant financial distress.
A significant downgrade in our credit ratings could adversely affect our performance.
A significant downgrade in our credit ratings, while not affecting our ability to draw proceeds under the revolving credit facility, would cause our borrowing costs to increase under the revolving credit facility, impact our ability to borrow secured and unsecured debt, impair our ability to access the commercial paper market or otherwise limit our access to capital. In addition, a downgrade below investment grade would require us to post cash collateral and/or letters of credit in favor of some of our secured lenders to cover our self-insured property and liability insurance deductibles or to obtain lower deductible insurance compliant with the lenders’ requirements at the lower ratings level.
Scheduled debt payments could adversely affect our financial condition.
In the future, our cash flow could be insufficient to meet required payments of principal and interest or to pay distributions on our securities at expected levels.
We may not be able to refinance existing debt, including joint venture indebtedness (which in virtually all cases requires substantial principal payments at maturity) and, if we can, the terms of such refinancing might not be as favorable as the terms of existing indebtedness. If principal payments due at maturity cannot be refinanced, extended or paid with proceeds of other capital transactions, such as new equity capital, our operating cash flow will not be sufficient in all years to repay all maturing debt. As a result, certain of our other debt may cross default, we may be forced to postpone capital expenditures necessary for the maintenance of our properties, we may have to dispose of one or more properties on terms that would otherwise be unacceptable to us or we may be forced to allow the mortgage holder to foreclose on a property. Foreclosure on mortgaged properties or an inability to refinance existing indebtedness would likely have a negative impact on our financial condition and results of operations.
Please refer to Item 7, Management’s Discussion and Analysis of Financial Condition and Results of Operations, for the Company’s debt maturity schedule as of December 31, 2017.
Financial covenants could adversely affect the Company’s financial condition.
The mortgages on our properties may contain customary negative covenants that, among other things, limit our ability, without the prior consent of the lender, to further mortgage the property and to reduce or change insurance coverage. In addition, our revolving credit facility contains certain restrictions, requirements and other limitations on our ability to incur debt. The indentures under which a substantial portion of our unsecured debt was issued also contain certain financial and operating covenants including, among other things, maintenance of certain financial ratios, as well as limitations on our ability to incur secured and unsecured debt (including acquisition financing), and to sell all or substantially all of our assets. Our revolving credit facility and indentures are cross-defaulted and also contain cross default provisions with other material debt. While the Company believes it was in compliance with its unsecured public debt covenants for both the years ended December 31, 2017 and 2016, should it fall out of compliance, it would likely have a negative impact on our financial condition and results of operations.
Some of the properties were financed with tax-exempt bonds or otherwise contain certain restrictive covenants or deed restrictions, including affordability requirements. The Company, and from time to time its consultants, monitor compliance with the restrictive covenants and deed restrictions that affect these properties. If these compliance requirements restrict our ability to increase our rental rates to low or moderate-income residents, or eligible/qualified residents, then our income from these properties may be limited. While we generally believe that the interest rate benefit attendant to properties with tax-exempt bonds more than outweighs any loss of income due to restrictive covenants or deed restrictions, this may not always be the case. Some of these requirements are complex and our failure to comply with them may subject us to material fines or liabilities.
17
Our degree of leverage could limit our ability to obtain additional financing.
Our degree of leverage could have important consequences to security holders. For example, the degree of leverage could affect our ability to obtain additional financing in the future for working capital, capital expenditures, acquisitions, development or other general corporate purposes, making us more vulnerable to a downturn in business or the economy in general. Our consolidated debt-to-total market capitalization ratio was 26.9% as of December 31, 2017. In addition, our most restrictive unsecured public debt covenants are as follows:
|
| December 31, 2017 |
|
| December 31, 2016 |
| ||
Total Debt to Adjusted Total Assets (not to exceed 60%) |
|
| 34.6 | % |
|
| 35.4 | % |
Secured Debt to Adjusted Total Assets (not to exceed 40%) |
|
| 14.0 | % |
|
| 16.2 | % |
Consolidated Income Available for Debt Service to |
|
|
|
|
|
|
|
|
Maximum Annual Service Charges (must be at least 1.5 to 1) |
|
| 4.17 |
|
|
| 3.73 |
|
Total Unsecured Assets to Unsecured Debt (must be at least 150%) |
|
| 381.0 | % |
|
| 390.8 | % |
Rising interest rates could adversely affect our operations and cash flows.
The Company’s exposure to market risk for changes in interest rates primarily relates to the refinancing of its long-term debt and floating interest rate instruments that include its unsecured revolving credit facility, commercial paper program, floating rate tax-exempt debt and fair value hedges that convert fixed rate debt to floating rate debt. These exposures to interest rates are primarily driven by changes in long-term U.S. Treasury rates for refinancing activity, changes in short-term London interbank offered rate (“LIBOR”) borrowing rates and the Securities Industry and Financial Markets Association (“SIFMA”) index for floating rate debt and changes in commercial paper market conditions. Increases in interest rates would increase our interest expense under these debt instruments and would increase the costs of refinancing existing debt and of issuing new debt. Accordingly, higher interest rates could adversely affect our operations and cash flows and our ability to service our debt and make distributions to security holders.
Derivatives and hedging activity could adversely affect cash flow.
In the normal course of business, we use derivatives to manage our exposure to interest rate volatility on debt instruments, including hedging for future debt issuances. At other times we may utilize derivatives to increase our exposure to floating interest rates. We may also use derivatives to manage commodity prices in the daily operations of our business. There can be no assurance that these hedging arrangements will have the desired beneficial impact. These arrangements, which can include a number of counterparties, may expose us to additional risks, including failure of any of our counterparties to perform under these contracts, and may involve extensive costs, such as transaction fees or breakage costs, if we terminate them. No strategy can completely insulate us from the risks associated with interest rate or commodity pricing fluctuations.
We depend on our key personnel.
We depend on the efforts of the Chairman of our Board of Trustees, Samuel Zell, and our executive officers, particularly David J. Neithercut, our President and Chief Executive Officer (“CEO”). If they resign or otherwise cease to be employed by us, our operations could be temporarily adversely affected. Mr. Zell has entered into retirement benefit and noncompetition agreements with the Company.
Shareholders’ ability to effect changes in control of the Company is limited.
Provisions of our declarationDeclaration of trustTrust and bylawsBylaws could inhibit changes in control.
Certain provisions of our Declaration of Trust and Bylaws may delay or prevent a change in control of the Company or other transactions that could provide the security holders with a premium over the then-prevailing market price of their securities or which might otherwise be in the best interest of our security holders. This includes the 5% Ownership Limit described below.above. While our existing preferred shares/preference units do not have all of these provisions, any future series of preferred shares/preference units may have certain voting provisions that could delay or prevent a change in control or other transactions that might otherwise be in the interest of our security holders. Our Bylaws require certain information to be provided by any security holder, or persons acting in concert with such security holder, who proposes business or a nominee at an annual meeting of shareholders, including disclosure of information related to hedging activities and investment strategies with respect to our securities. These requirements could delay or prevent a change in control or other transactions that might otherwise be in the interest of our security holders.
18
We have a share ownership limit for REIT tax purposes.
To remain qualified as a REIT for federal income tax purposes, not more than 50% in value of our outstanding Shares may be owned, directly or indirectly, by five or fewer individuals at any time during the last half of any year. To facilitate maintenance of our REIT qualification, our Declaration of Trust, subject to certain exceptions, prohibits ownership by any single shareholder of more than 5% of the lesser of the number or value of any outstanding class of common or preferred shares. We refer to this restriction as the “Ownership Limit.” Absent any exemption or waiver granted by our Board of Trustees, securities acquired or held in violation of the Ownership Limit will be transferred to a trust for the exclusive benefit of a designated charitable beneficiary, and the security holder’s rights to distributions and to vote would terminate. A transfer of Shares may be void if it causes a person to violate the Ownership Limit. The Ownership Limit could delay or prevent a change in control and, therefore, could adversely affect our security holders’ ability to realize a premium over the then-prevailing market price for their Shares. To reduce the ability of the Board to use the Ownership Limit as an anti-takeover device, the Company’s Ownership Limit requires, rather than permits, the Board to grant a waiver of the Ownership Limit if the individual seeking a waiver demonstrates that such ownership would not jeopardize the Company’s status as a REIT. We have issued several of these waivers in the past.
Our preferred shares may affect changes in control.
Our Declaration of Trust authorizes the Board of Trustees to issue up to 100 million preferred shares, and to establish the preferences and rights (including the right to vote and the right to convert into common shares) of any preferred shares issued. The Board of Trustees may use its powers to issue preferred shares and to set the terms of such securities to delay or prevent a change in control of the Company even if a change in control were in the interest of the security holders.
Inapplicability of Maryland law limiting certain changes in control.
Certain provisions of Maryland law applicable to real estate investment trusts prohibit “business combinations” (including certain issuances of equity securities) with any person who beneficially owns ten percent or more of the voting power of outstanding securities, or with an affiliate who, at any time within the two-year period prior to the date in question, was the beneficial owner of ten percent or more of the voting power of the Company’s outstanding voting securities (an “Interested Shareholder”), or with an affiliate of an Interested Shareholder. These prohibitions last for five years after the most recent date on which the Interested Shareholder became an Interested Shareholder. After the five-year period, a business combination with an Interested Shareholder must be approved by two super-majority shareholder votes unless, among other conditions, holders of common shares receive a minimum price for their shares and the consideration is received in cash or in the same form as previously paid by the Interested Shareholder for its common shares. As permitted by Maryland law, however, the Board of Trustees of the Company has opted out of these restrictions with respect to any business combination involving Mr. Zell and certain of his affiliates and persons acting in concert with them. Consequently, the five-year prohibition and the super-majority vote requirements will not apply to a business combination involving us and/or any of them. Such business combinations may not be in the best interest of our security holders.
Our status as a REIT is dependent on compliance with federal income tax requirements.
Our failure to qualify as a REIT would have serious adverse consequences to our security holders.
We believe that we have qualified for taxation as a REIT for federal income tax purposes since our taxable year ended December 31, 1992 based, in part, upon opinions of tax counsel received whenever we have issued equity securities or engaged in significant merger transactions. We plan to continue to meet the requirements for taxation as a REIT. Many of these requirements, however, are highly technical and complex. We cannot, therefore, guarantee that we have qualified or will qualify as a REIT in the future. The determination that we are a REIT requires an analysis of various factual matters that may not be totally within our control. For example, to qualify as a REIT, our gross income must generally come from rental and other real estate or passive related sources that are itemized in the REIT tax laws. We are also required to distribute to security holders at least 90% of our REIT taxable income excluding net capital gains. The fact that we hold our assets through the Operating Partnership further complicates the application of the REIT requirements. In addition, certain of our subsidiary entities have elected to be taxed as REITs. As such, each must separately satisfy all of the requirements to qualify for REIT status. Our failure to comply with the complex REIT rules at the subsidiary REIT level can materially and adversely impact EQR’s REIT status.
Even a technical or inadvertent mistake could jeopardize our REIT status; however, the REIT qualification rules permit REITs in certain circumstances to pay a monetary penalty for inadvertent mistakes rather than lose REIT status. There is also risk that Congress and the IRS might make changes to the tax laws and regulations, and the courts might issue new rulings that make it more difficult, or impossible, for us to remain qualified as a REIT. We do not believe, however, that any pending or proposed tax law changes would jeopardize our REIT status.
19
If we fail to qualify as a REIT, we would be subject to federal income tax at regular corporate rates. Also, unless the IRS granted us relief under certain statutory provisions, we would remain disqualified from taxation as a REIT for four years following the year in which we failed to qualify as a REIT. If we fail to qualify as a REIT, we would have to pay significant income taxes. We therefore would have less money available for investments or for distributions to security holders. This would likely have a significant adverse effect on the value of our securities. In addition, we would no longer be required to make any distributions to security holders. Even if we qualify as a REIT, we are and will continue to be subject to certain federal, state and local taxes on our income and property. In addition, various business activities which generate income that is not qualifying income for a REIT are conducted through taxable REIT subsidiaries and will be subject to federal and state income tax at regular corporate rates to the extent they generate taxable income.
The effect of the Tax Act is uncertain.
On December 22, 2017, the President signed into law H.R. 1, informally titled the Tax Cuts and Jobs Act (the “Tax Act”), with most provisions having an initial effective date of January 1, 2018. The Tax Act makes major changes to the Internal Revenue Code, as amended, including several provisions that may affect the taxation of REITs and their security holders. The Tax Act is not expected to have a material impact on our REIT or subsidiary entities, the size and character of our dividends, our ability to continue to qualify as a REIT or on our results of operations. In addition, the Tax Act is expected to have a favorable impact on the effective tax rate of our shareholders and our residents. However, the complete impact of the Tax Act is not yet fully known and there can be no assurances that it will have a neutral or favorable impact. Technical corrections or other amendments to the Tax Act or administrative guidance interpreting the Tax Act may be forthcoming at any time. Prospective and current shareholders should consult with their tax advisors with respect to the effect of the Tax Act and any other regulatory or administrative developments and proposals and their potential effect on your investment.
We could be disqualified as a REIT or have to pay taxes if our merger partners did not qualify as REITs.
If any of our prior merger partners had failed to qualify as a REIT throughout the duration of their existence, then they might have had undistributed “Subchapter C corporation earnings and profits” at the time of their merger with us. If that were the case and we did not distribute those earnings and profits prior to the end of the year in which the merger took place, we might not qualify as a REIT. We believe, based in part upon opinions of legal counsel received pursuant to the terms of our merger agreements as well as our own investigations, among other things, that each of our prior merger partners qualified as a REIT and that, in any event, none of them had any undistributed “Subchapter C corporation earnings and profits” at the time of their merger with us. If any of our prior merger partners failed to qualify as a REIT, an additional concern would be that they could have been required to recognize taxable gain at the time they merged with us. We would be liable for the tax on such gain. We also could have to pay corporate income tax on any gain existing at the time of the applicable merger on assets acquired in the merger if the assets are sold within ten years of the merger.
Compliance with REIT distribution requirements may affect our financial condition and our shareholders’ liquidity.
Distribution requirements may limit our flexibility to manage our portfolio.
We may be required from time to time, under certain circumstances, to accrue as income for tax purposes interest and rent earned but not yet received. We may incur a reduction in tax depreciation without a reduction in capital expenditures. Provisions of the Tax Act may require that we depreciate existing assets over a 30-year or potentially a 40-year useful life, which may substantially increase our taxable income. In addition, gain from the sale of property may exceed the amount of cash received on a leverage-neutral basis. A substantial increase to our taxable income may reduce the flexibility of the Company to manage its portfolio through dispositions of properties in non-1031 exchange transactions or cause the Company to borrow funds or liquidate investments on adverse terms in order to meet these distribution requirements.
Tax elections regarding distributions may impact future liquidity of the Company or our shareholders.
Under certain circumstances we have made and/or may consider making again in the future, a tax election to treat future distributions to shareholders as distributions in the current year. This election, which is provided for in the Internal Revenue Code, may allow us to avoid increasing our dividends or paying additional income taxes in the current year. However, this could result in a constraint on our ability to decrease our dividends in future years without creating risk of either violating the REIT distribution requirements or generating additional income tax liability.
The Internal Revenue Service has published several rulings that allow REITs to offer shareholders the choice of stock or cash with respect to the receipt of a dividend (an “elective stock dividend”). However, REITs are also permitted to limit the amount of cash paid to all shareholders to 20% of the total dividend paid. Therefore, it is possible that the total tax burden to shareholders resulting from an elective stock dividend may exceed the amount of cash received by the shareholder.
20
Federal Income Tax Considerations
General
The following discussion summarizes the federal income tax considerations material to a holder of common shares. It is not exhaustive of all possible tax considerations. For example, it does not give a detailed discussion of any state, local or foreign tax considerations. The following discussion also does not address all tax matters that may be relevant to prospective shareholders in light of their particular circumstances. Moreover, it does not address all tax matters that may be relevant to shareholders who are subject to special treatment under the tax laws, such as insurance companies, tax-exempt entities, financial institutions or broker-dealers, foreign corporations, persons who are not citizens or residents of the United States and persons who own shares through a partnership or other entity treated as a flow-through entity for federal income tax purposes.
The specific tax attributes of a particular shareholder could have a material impact on the tax considerations associated with the purchase, ownership and disposition of common shares. Therefore, it is essential that each prospective shareholder consult with his or her own tax advisors with regard to the application of the federal income tax laws to the shareholder’s personal tax situation, as well as any tax consequences arising under the laws of any state, local or foreign taxing jurisdiction.
The information in this section is based on the current Internal Revenue Code, current, temporary and proposed Treasury regulations, the legislative history of the Internal Revenue Code, current administrative interpretations and practices of the Internal Revenue Service, including its practices and policies as set forth in private letter rulings, which are not binding on the Internal Revenue Service, and existing court decisions. Future legislation, regulations, administrative interpretations and court decisions could change current law or adversely affect existing interpretations of current law. Any change could apply retroactively. Thus, it is possible that the Internal Revenue Service could challenge the statements in this discussion, which do not bind the Internal Revenue Service or the courts, and that a court could agree with the Internal Revenue Service.
Our taxation
We elected REIT status beginning with the year that ended December 31, 1992. In any year in which we qualify as a REIT, we generally will not be subject to federal income tax on the portion of our REIT taxable income or capital gain that we distribute to our shareholders. This treatment substantially eliminates the double taxation that applies to most corporations, which pay a tax on their income and then distribute dividends to shareholders who are in turn taxed on the amount they receive. We elected taxable REIT subsidiary status for certain of our corporate subsidiaries engaged in activities which cannot be performed directly by a REIT, such as condominium conversion and sale activities. As a result, we will be subject to federal income tax on the taxable income generated by these activities in our taxable REIT subsidiaries.
We will be subject to federal income tax at regular corporate rates upon our REIT taxable income or capital gains that we do not distribute to our shareholders. In addition, we will be subject to a 4% excise tax if we do not satisfy specific REIT distribution requirements. For tax years prior to January 1, 2018, we could also be subject to the “alternative minimum tax” on our items of tax preference; pursuant to the Tax Act, for tax years beginning January 1, 2018, the corporate alternative minimum tax has been permanently eliminated. In addition, any net income from “prohibited transactions” (i.e., dispositions of property, other than property held by a taxable REIT subsidiary, held primarily for sale to customers in the ordinary course of business) will be subject to a 100% tax. We could also be subject to a 100% penalty tax on certain payments received from or on certain expenses deducted by a taxable REIT subsidiary if any such transaction is not respected by the Internal Revenue Service. If we fail to satisfy the 75% gross income test or the 95% gross income test (described below) but have maintained our qualification as a REIT because we satisfied certain other requirements, we will still generally be subject to a 100% penalty tax on the taxable income attributable to the gross income that caused the income test failure. If we fail to satisfy any of the REIT asset tests (described below) by more than a de minimis amount, due to reasonable cause, and we nonetheless maintain our REIT qualification because of specified cure provisions, we will be required to pay a tax equal to the greater of $50,000 or the highest marginal corporate tax rate multiplied by the net income generated by the non-qualifying assets. If we fail to satisfy any provision of the Internal Revenue Code that would result in our failure to qualify as a REIT (other than a violation of the REIT gross income or asset tests described below) and the violation is due to reasonable cause, we may retain our REIT qualification but we will be required to pay a penalty of $50,000 for each such failure. Moreover, we may be subject to taxes in certain situations and on certain transactions that we do not presently contemplate.
We believe that we have qualified as a REIT for all of our taxable years beginning with 1992. We also believe that our current structure and method of operation is such that we will continue to qualify as a REIT. However, given the complexity of the REIT qualification requirements, we cannot provide any assurance that the actual results of our operations have satisfied or will satisfy the requirements under the Internal Revenue Code for a particular year.
21
If we fail to qualify for taxation as a REIT in any taxable year and the relief provisions described herein do not apply, we will be subject to tax on our taxable income at regular corporate rates. Also, for tax years prior to January 1, 2018, we may be subject to the corporate “alternative minimum tax.” As a result, our failure to qualify as a REIT would significantly reduce the cash we have available to distribute to our shareholders. Unless entitled to statutory relief, we would not be able to re-elect to be taxed as a REIT until our fifth taxable year after the year of disqualification. It is not possible to state whether we would be entitled to statutory relief.
Our qualification and taxation as a REIT depend on our ability to satisfy various requirements under the Internal Revenue Code. We are required to satisfy these requirements on a continuing basis through actual annual operating and other results. Accordingly, there can be no assurance that we will be able to continue to operate in a manner so as to remain qualified as a REIT.
Ownership of Taxable REIT Subsidiaries by Us. The Internal Revenue Code provides that REITs may own greater than ten percent of the voting power and value of the securities of a “taxable REIT subsidiary” or “TRS”, provided that the aggregate value of all of the TRS securities held by the REIT does not exceed 25% of the REIT’s total asset value (20% for taxable years beginning January 1, 2018). TRSs are corporations subject to tax as a regular “C” corporation that have elected, jointly with a REIT, to be a TRS. Generally, a taxable REIT subsidiary may own assets that cannot otherwise be owned by a REIT and can perform impermissible tenant services (discussed below), which would otherwise taint our rental income under the REIT income tests. However, the REIT will be obligated to pay a 100% penalty tax on some payments that we receive or on certain expenses deducted by our TRSs if the economic arrangements between us, our tenants and the TRS are not comparable to similar arrangements among unrelated parties. A TRS may also receive income from prohibited transactions without incurring the 100% federal income tax liability imposed on REITs. Income from prohibited transactions may include the purchase and sale of land, the purchase and sale of completed development properties and the sale of condominium units.
TRSs pay federal and state income tax at the full applicable corporate rates. The amount of taxes paid on impermissible tenant services income and the sale of real estate held primarily for sale to customers in the ordinary course of business may be material in amount. The TRSs will attempt to reduce, if possible, the amount of these taxes, but we cannot guarantee whether, or the extent to which, measures taken to reduce these taxes will be successful. To the extent that these companies are required to pay taxes, less cash may be available for distributions to shareholders.
Share Ownership Test and Organizational Requirement. In order to qualify as a REIT, our shares of beneficial interest must be held by a minimum of 100 persons for at least 335 days of a taxable year that is 12 months, or during a proportionate part of a taxable year of less than 12 months. Also, not more than 50% in value of our shares of beneficial interest may be owned directly or indirectly by applying certain constructive ownership rules, by five or fewer individuals during the last half of each taxable year. In addition, we must meet certain other organizational requirements, including, but not limited to, that (i) the beneficial ownership in us is evidenced by transferable shares and (ii) we are managed by one or more trustees. We believe that we have satisfied all of these tests and all other organizational requirements and that we will continue to do so in the future. In order to ensure compliance with the 100 person test and the 50% share ownership test discussed above, we have placed certain restrictions on the transfer of our shares that are intended to prevent further concentration of share ownership. However, such restrictions may not prevent us from failing these requirements, and thereby failing to qualify as a REIT.
Gross Income Tests. To qualify as a REIT, we must satisfy two gross income tests:
|
|
|
|
To qualify as rents from real property for the purpose of satisfying the gross income tests, rental payments must generally be received from unrelated persons and not be based on the net income of the resident. Also, the rent attributable to personal property must not exceed 15% of the total rent. We may generally provide services to residents without “tainting” our rental income only if such services are “usually or customarily rendered” in connection with the rental of real property and not otherwise considered “impermissible services”. If such services are impermissible, then we may generally provide them only if they are considered de minimis in amount, or are provided through an independent contractor from whom we derive no revenue and that meets other requirements, or through a taxable REIT subsidiary. We believe that services provided to residents by us either are usually or customarily rendered in connection with the rental of real property and not otherwise considered
22
impermissible, or, if considered impermissible services, will meet the de minimis test or will be provided by an independent contractor or taxable REIT subsidiary. However, we cannot provide any assurance that the Internal Revenue Service will agree with these positions.
If we fail to satisfy one or both of the gross income tests for any taxable year, we may nevertheless qualify as a REIT for the year if we are entitled to relief under certain provisions of the Internal Revenue Code. In this case, a penalty tax would still be applicable as discussed above. Generally, it is not possible to state whether in all circumstances we would be entitled to the benefit of these relief provisions and in the event these relief provisions do not apply, we will not qualify as a REIT.
Asset Tests. In general, on the last day of each quarter of our taxable year, we must satisfy five tests relating to the nature of our assets:
|
|
|
|
|
|
|
|
|
|
The 10% value test described in clause (3)(b) above does not apply to nonqualified publicly offered REIT debt instruments or to certain securities that fall within a safe harbor under the Code. Under the safe harbor, the following are not considered “securities” held by us for purposes of this 10% value test: (i) straight debt securities, (ii) any loan of an individual or an estate, (iii) certain rental agreements for the use of tangible property, (iv) any obligation to pay rents from real property, (v) any security issued by a state or any political subdivision thereof, foreign government or Puerto Rico only if the determination of any payment under such security is not based on the profits of another entity or payments on any obligation issued by such other entity, or (vi) any security issued by a REIT. The timing and payment of interest or principal on a security qualifying as straight debt may be subject to a contingency provided that (A) such contingency does not change the effective yield to maturity, not considering a de minimis change which does not exceed the greater of ¼ of 1% or 5% of the annual yield to maturity or we own $1,000,000 or less of the aggregate issue price or value of the particular issuer’s debt and not more than 12 months of unaccrued interest can be required to be prepaid or (B) the contingency is consistent with commercial practice and the contingency is effective upon a default or the exercise of a prepayment right by the issuer of the debt. If we hold indebtedness from any issuer, including a REIT, the indebtedness will be subject to, and may cause a violation of, the asset tests, unless it is a qualifying real estate asset or otherwise satisfies the above safe harbor. We currently own equity interests in certain entities that have elected to be taxed as REITs for federal income tax purposes and are not publicly traded. If any such entity were to fail to qualify as a REIT, we would not meet the 10% voting stock limitation and the 10% value limitation and we would, unless certain relief provisions applied, fail to qualify as a REIT. We believe that we and each of the REITs we own an interest in have and will comply with the foregoing asset tests for REIT qualification. However, we cannot provide any assurance that the Internal Revenue Service will agree with our determinations.
If we fail to satisfy the 5% or 10% asset tests described above after a 30-day cure period provided in the Internal Revenue Code, we will be deemed to have met such tests if the value of our non-qualifying assets is de minimis (i.e., does not exceed the lesser of 1% of the total value of our assets at the end of the applicable quarter or $10,000,000) and we dispose of the non-qualifying assets within six months after the last day of the quarter in which the failure to satisfy the asset tests is discovered. For violations due to reasonable cause and not willful neglect that are in excess of the de minimis exception described above, we may avoid disqualification as a REIT under any of the asset tests, after the 30-day cure period, by disposing of sufficient assets to meet the asset test within such six month period, paying a tax equal to the greater of $50,000 or the highest corporate tax rate multiplied by the net income generated by the non-qualifying assets and disclosing certain information to the Internal Revenue Service. If we cannot avail ourselves of these relief provisions, or if we fail to timely cure any noncompliance with the asset tests, we would cease to qualify as a REIT.
Annual Distribution Requirements. To qualify as a REIT, we are generally required to distribute dividends, other than capital gain dividends, to our shareholders each year in an amount at least equal to 90% of our REIT taxable income. These
23
distributions must be paid either in the taxable year to which they relate, or in the following taxable year if declared before we timely file our tax return for the prior year and if paid with or before the first regular dividend payment date after the declaration is made. We intend to make timely distributions sufficient to satisfy our annual distribution requirements. To the extent that we do not distribute all of our net capital gain or distribute at least 90%, but less than 100% of our REIT taxable income, as adjusted, we are subject to tax on these amounts at regular corporate rates. We will be subject to a 4% excise tax on the excess of the required distribution over the sum of amounts actually distributed and amounts retained for which federal income tax was paid, if we fail to distribute during each calendar year at least the sum of: (1) 85% of our REIT ordinary income for the year; (2) 95% of our REIT capital gain net income for the year; and (3) any undistributed taxable income from prior taxable years. A REIT may elect to retain rather than distribute all or a portion of its net capital gains and pay the tax on the gains. In that case, a REIT may elect to have its shareholders include their proportionate share of the undistributed net capital gains in income as long-term capital gains and receive a credit for their share of the tax paid by the REIT. For purposes of the 4% excise tax described above, any retained amounts would be treated as having been distributed.
Ownership of Partnership Interests By Us. As a result of our ownership of the Operating Partnership, we will be considered to own and derive our proportionate share of the assets and items of income of the Operating Partnership, respectively, for purposes of the REIT asset and income tests, including its share of assets and items of income of any subsidiaries that are partnerships or limited liability companies.
State and Local Taxes. We may be subject to state or local taxation in various jurisdictions, including those in which we transact business or reside. State and local tax treatment may not conform to the federal income tax treatment discussed above and any changes in the federal tax code may not be adopted by the states, potentially leading to material tax liabilities for the Company and its shareholders. In addition, state and local taxing jurisdictions may adopt new legislation or tax regimes which could significantly impact our tax liabilities or require the Company to withhold taxes from shareholders. Consequently, prospective shareholders should consult their own tax advisors regarding the effect of state and local tax laws on an investment in common shares.
Taxation of domestic shareholders subject to U.S. tax
General. If we qualify as a REIT, distributions made to our taxable domestic shareholders with respect to their common shares, other than capital gain distributions and distributions attributable to taxable REIT subsidiaries, will be treated as ordinary income to the extent that the distributions come out of earnings and profits. These distributions will not be eligible for the dividends received deduction for shareholders that are corporations nor will they constitute “qualified dividend income” under the Internal Revenue Code, meaning that such dividends will be taxed at marginal rates applicable to ordinary income rather than the special capital gain rates currently applicable to qualified dividend income distributed to shareholders who satisfy applicable holding period requirements. In determining whether distributions are out of earnings and profits, we will allocate our earnings and profits first to preferred shares and second to the common shares. The portion of ordinary dividends which represent ordinary dividends we receive from a TRS, will be designated as “qualified dividend income” to REIT shareholders. These qualified dividends are eligible for preferential tax rates if paid to our non-corporate shareholders.
To the extent we make distributions to our taxable domestic shareholders in excess of our earnings and profits, such distributions will be considered a return of capital. Such distributions will be treated as a tax-free distribution and will reduce the tax basis of a shareholder’s common shares by the amount of the distribution so treated. To the extent such distributions cumulatively exceed a taxable domestic shareholder’s tax basis, such distributions are taxable as gain from the sale of shares. Shareholders may not include in their individual income tax returns any of our net operating losses or capital losses.
Dividends declared by a REIT in October, November, or December with a record date in such month, are deemed to have been paid by the REIT and received by its shareholders on December 31 of that year, so long as the dividends are actually paid during January of the following year. However, this treatment only applies to the extent of the REIT’s earnings and profits existing on December 31. To the extent the shareholder distributions paid in January exceed available earnings and profits as of December 31, the excess will be treated as a distribution taxable to shareholders in the year paid. As such, for tax reporting purposes, January distributions paid to our shareholders may be split between two tax years.
A REIT may make an election under the Internal Revenue Code to treat certain dividends that are paid in a taxable year, as being made by the REIT in the previous taxable year. A shareholder is required to include the amount of the dividend in the taxable year that it is paid by the REIT.
Distributions made by us that we properly designate as capital gain dividends will be taxable to taxable domestic shareholders as gain from the sale or exchange of a capital asset held for more than one year. This treatment applies only to the extent that the designated distributions do not exceed our actual net capital gain for the taxable year or the amount of
24
distributions treated as dividends for the taxable year. It applies regardless of the period for which a domestic shareholder has held his or her common shares. Despite this general rule, corporate shareholders may be required to treat up to 20% of certain capital gain dividends as ordinary income.
Generally, our designated capital gain dividends will be broken out into net capital gains distributions (which are taxable to taxable domestic shareholders that are individuals, estates or trusts at a maximum rate of 20% for individual taxpayers in the highest tax bracket) and unrecaptured Section 1250 gain distributions (which are taxable to taxable domestic shareholders that are individuals, estates or trusts at a maximum rate of 25%).
Certain U.S. shareholders that are taxed as individuals, estates or trusts may also be required to pay an additional 3.8% tax on, among other things, dividends on and capital gains from the sale or other disposition of shares.
If, for any taxable year, we elect to designate as capital gain dividends any portion of the dividends paid or made available for the year to holders of all classes of shares of beneficial interest, then the portion of the capital gains dividends that will be allocable to the holders of common shares will be the total capital gain dividends multiplied by a fraction. The numerator of the fraction will be the total dividends paid or made available to the holders of the common shares for the year. The denominator of the fraction will be the total dividends paid or made available to holders of all classes of shares of beneficial interest.
We may elect to retain (rather than distribute as is generally required) net capital gain for a taxable year and pay the income tax on that gain. If we make this election, shareholders must include in income, as long-term capital gain, their proportionate share of the undistributed net capital gain. Shareholders will be treated as having paid their proportionate share of the tax paid by us on these gains. Accordingly, they will receive a tax credit or refund for the amount. Shareholders will increase the basis in their common shares by the difference between the amount of capital gain included in their income and the amount of the tax they are treated as having paid. Our earnings and profits will be adjusted appropriately.
In general, a shareholder will recognize gain or loss for federal income tax purposes on the sale or other disposition of common shares in an amount equal to the difference between:
|
|
|
|
The gain or loss will be capital gain or loss if the common shares were held as a capital asset. Generally, the capital gain or loss will be long-term capital gain or loss if the common shares were held for more than one year.
In general, a loss recognized by a shareholder upon the sale of common shares that were held for six months or less, determined after applying certain holding period rules, will be treated as long-term capital loss to the extent that the shareholder received distributions that were treated as long-term capital gains. For shareholders who are individuals, trusts and estates, the long-term capital loss will be apportioned among the applicable long-term capital gain rates to the extent that distributions received by the shareholder were previously so treated.
Taxation of domestic tax-exempt shareholders
Most tax-exempt organizations are not subject to federal income tax except to the extent of their unrelated business taxable income, which is often referred to as UBTI. Unless a tax-exempt shareholder holds its common shares as debt financed property or uses the common shares in an unrelated trade or business, distributions to the shareholder should not constitute UBTI. Similarly, if a tax-exempt shareholder sells common shares, the income from the sale should not constitute UBTI unless the shareholder held the shares as debt financed property or used the shares in a trade or business.
However, for tax-exempt shareholders that are social clubs, voluntary employee benefit associations, supplemental unemployment benefit trusts, and qualified group legal services plans, income from owning or selling common shares will constitute UBTI unless the organization is able to properly deduct amounts set aside or placed in reserve so as to offset the income generated by its investment in common shares. These shareholders should consult their own tax advisors concerning these set aside and reserve requirements which are set forth in the Internal Revenue Code. In addition, certain provisions of the Tax Act may impact a tax-exempt shareholder’s calculation of UBTI. These shareholders should consult their own tax advisors concerning the impact of the Tax Act and their federal income tax obligations.
25
In addition, certain pension trusts that own more than 10% of a “pension-held REIT” must report a portion of the distributions that they receive from the REIT as UBTI. We have not been and do not expect to be treated as a pension-held REIT for purposes of this rule.
Taxation of foreign shareholders
The following is a discussion of certain anticipated United States federal income tax consequences of the ownership and disposition of common shares applicable to a foreign shareholder. For purposes of this discussion, a “foreign shareholder” is any person other than:
|
|
|
|
|
|
Distributions by Us. Distributions by us to a foreign shareholder that are neither attributable to gain from sales or exchanges by us of United States real property interests nor designated by us as capital gains dividends will be treated as dividends of ordinary income to the extent that they are made out of our earnings and profits. These distributions ordinarily will be subject to withholding of United States federal income tax on a gross basis at a 30% rate, or a lower treaty rate, unless the dividends are treated as effectively connected with the conduct by the foreign shareholder of a United States trade or business. Please note that under certain treaties lower withholding rates generally applicable to dividends do not apply to dividends from REITs. Dividends that are effectively connected with a United States trade or business will be subject to tax on a net basis at graduated rates, and are generally not subject to withholding. Certification and disclosure requirements must be satisfied before a dividend is exempt from withholding under this exemption. A foreign shareholder that is a corporation also may be subject to an additional branch profits tax at a 30% rate or a lower treaty rate.
We expect to withhold United States income tax at the rate of 30% on any such distributions made to a foreign shareholder unless:
|
|
|
|
If such distribution is in excess of our current or accumulated earnings and profits, it will not be taxable to a foreign shareholder to the extent that the distribution does not exceed the adjusted basis of the shareholder’s common shares. Instead, the distribution will reduce the adjusted basis of the common shares. To the extent that the distribution exceeds the adjusted basis of the common shares, it will give rise to gain from the sale or exchange of the shareholder’s common shares. The tax treatment of this gain is described below.
We intend to withhold at a rate of 30%, or a lower applicable treaty rate, on the entire amount of any distribution not designated as a capital gain distribution. In such event, a foreign shareholder may seek a refund of the withheld amount from the IRS if it is subsequently determined that the distribution was, in fact, in excess of our earnings and profits, and the amount withheld exceeded the foreign shareholder’s United States tax liability with respect to the distribution.
Distributions to a foreign shareholder that we designate at the time of the distributions as capital gain dividends, other than those arising from the disposition of a United States real property interest, generally will not be subject to United States federal income taxation unless:
|
|
|
|
26
Under the Foreign Investment in Real Property Tax Act, which is known as FIRPTA, distributions to a foreign shareholder (other than certain qualified shareholders and qualified foreign pension funds discussed below) that are attributable to gain from sales or exchanges of United States real property interests will cause the foreign shareholder to be treated as recognizing the gain as income effectively connected with a United States trade or business. This rule applies whether or not a distribution is designated as a capital gain dividend. Accordingly, foreign shareholders generally would be taxed on these distributions at the same rates applicable to U.S. shareholders, subject to a special alternative minimum tax in the case of nonresident alien individuals. In addition, a foreign corporate shareholder might be subject to the branch profits tax discussed above, as well as U.S. federal income tax return filing requirements. We are required to withhold 21% of these distributions. The withheld amount can be credited against the foreign shareholder’s United States federal income tax liability.
Although the law is not entirely clear on the matter, it appears that amounts we designate as undistributed capital gains in respect of the common shares held by U.S. shareholders would be treated with respect to foreign shareholders in the same manner as actual distributions of capital gain dividends. Under that approach, foreign shareholders would be able to offset as a credit against their United States federal income tax liability their proportionate share of the tax paid by us on these undistributed capital gains. In addition, if timely requested, foreign shareholders might be able to receive from the IRS a refund to the extent their proportionate share of the tax paid by us were to exceed their actual United States federal income tax liability.
Foreign Shareholders’ Sales of Common Shares. Gain recognized by a foreign shareholder upon the sale or exchange of common shares generally will not be subject to United States taxation unless the shares constitute a “United States real property interest” within the meaning of FIRPTA. The common shares will not constitute a United States real property interest so long as we are a domestically controlled REIT. A domestically controlled REIT is a REIT in which at all times during a specified testing period less than 50% in value of its stock is held directly or indirectly by foreign shareholders. We believe that we are a domestically controlled REIT. Therefore, we believe that the sale of common shares will not be subject to taxation under FIRPTA. However, because common shares and preferred shares are publicly traded, we cannot guarantee that we will continue to be a domestically controlled REIT. In any event, gain from the sale or exchange of common shares not otherwise subject to FIRPTA will be subject to U.S. tax, if either:
|
|
|
|
Even if we do not qualify as or cease to be a domestically controlled REIT, gain arising from the sale or exchange by a foreign shareholder of common shares still would not be subject to United States taxation under FIRPTA as a sale of a United States real property interest if:
|
|
|
|
If gain on the sale or exchange of common shares were subject to taxation under FIRPTA, the foreign shareholder would be subject to regular United States income tax with respect to the gain in the same manner as a taxable U.S. shareholder, subject to any applicable alternative minimum tax, a special alternative minimum tax in the case of nonresident alien individuals and the possible application of the branch profits tax in the case of foreign corporations. The purchaser of the common shares would be required to withhold and remit to the IRS 15% of the purchase price.
Exception to FIRPTA for Qualified Shareholders. For dispositions and distributions after December 18, 2015, stock of a REIT held (directly or through partnerships) by a “qualified shareholder” will not be treated as United States real property interest, and capital gain dividends from such a REIT will not be treated as gain from the sale of a United States real property interest. This exception does not apply to persons that hold an interest, taking into account applicable constructive ownership rules, more than 10% of the stock of the REIT (unless that interest is solely as a creditor (an “applicable investor”)). If the qualified shareholder has such an “applicable investor,” the portion of REIT stock indirectly owned through the qualified shareholder by the applicable investor will be treated as gains from the sale of United States real property interests. For these purposes, a “qualified shareholder” is a foreign person which is in a treaty jurisdiction and satisfies certain publicly traded requirements, is a “qualified collective investment vehicle” and maintains records on the identity of certain 5% owners. A
27
“qualified collective investment vehicle” is a foreign person that is eligible for a reduced withholding rate with respect to ordinary REIT dividends even if such person holds more than 10% of the REIT’s stock, a publicly traded partnership that is a withholding foreign partnership that would be a United States real property holding corporation if it were a United States corporation, or is designated as a qualified collective investment vehicle by the Secretary of the Treasury and is either fiscally transparent within the meaning of the Code or required to include dividends in its gross income but entitled to a deduction for distribution to its investors. Finally, capital gain dividends and nondividend redemption and liquidating distributions to a qualified shareholder that are not allocable to an applicable investor will be treated as ordinary dividends.
Exception to FIRPTA Withholding for Qualified Foreign Pension Funds. For distributions or disposition of REIT stock after December 18, 2015, “qualified foreign pension funds” and entities that are wholly owned by a qualified foreign pension fund are exempted from FIRPTA withholding. For these purposes, a “qualified foreign pension fund” is any trust, corporation, or other organization or arrangement if (i) it was created or organized under foreign law, (ii) it was established to provide retirement or pension benefits to participants or beneficiaries that are current or former employees (or persons designated by such employees) of one or more employers in consideration for services rendered, (iii) it does not have a single participant or beneficiary with a right to more than 5% of its assets or income, (iv) it is subject to government regulation and provides annual information reporting about its beneficiaries to the relevant tax authorities in the country in which it is established or operates, and (v) under the laws of the country in which it is established or operates, either contributions to such fund which would otherwise be subject to tax under such laws are deductible or excluded from the gross income of such fund or taxed at a reduced rate, or taxation of any investment income of such fund is deferred or such income is taxed at a reduced rate.
Information reporting requirement and backup withholding
We will report to our domestic shareholders and the Internal Revenue Service the amount of distributions paid during each calendar year and the amount of tax withheld, if any. Under certain circumstances, domestic shareholders may be subject to backup withholding. Backup withholding will apply only if such domestic shareholder fails to furnish certain information to us or the Internal Revenue Service. Backup withholding will not apply with respect to payments made to certain exempt recipients, such as corporations and tax-exempt organizations. Domestic shareholders should consult their own tax advisors regarding their qualification for exemption from backup withholding and the procedure for obtaining such an exemption. Backup withholding is not an additional tax. Rather, the amount of any backup withholding with respect to a payment to a domestic shareholder will be allowed as a credit against such person’s United States federal income tax liability and may entitle such person to a refund, provided that the required information is timely furnished to the Internal Revenue Service.
Withholding on foreign financial institutions and non-U.S. shareholders
The Foreign Account Tax Compliance Act (“FATCA”) imposes a U.S. withholding tax at a 30% rate on dividends and on proceeds from the sale of our shares paid beginning January 1, 2019 to “foreign financial institutions” (as defined under FATCA) and certain other foreign entities if certain due diligence and disclosure requirements related to U.S. accounts with, or ownership of, such entities are not satisfied or an exemption does not apply. If FATCA withholding is imposed, non-U.S. beneficial owners that are otherwise eligible for an exemption from, or a reduction of, U.S. withholding tax with respect to such distributions and sale proceeds would be required to seek a refund from the Internal Revenue Service to obtain the benefit of such exemption or reduction. Any payment made by us that is subject to withholding under FATCA or otherwise will be net of the amount required to be withheld.
Item 1B. Unresolved Staff Comments
None.
As of December 31, 2017,2020, the Company, directly or indirectly through investments in title holding entities, owned all or a portion of 305304 properties located in 109 states and the District of Columbia consisting of 78,61177,889 apartment units. See Item 1, Business, for additional information regarding the Company’s properties and the markets/metro areas upon which we are focused. The Company’s properties are summarized by building type in the following table:
Type |
| Properties |
|
| Apartment Units |
|
| Average Apartment Units |
|
| Properties |
|
| Apartment Units |
|
| Average Apartment Units |
| ||||||
Garden |
|
| 107 |
|
|
| 27,007 |
|
|
| 252 |
|
|
| 102 |
|
|
| 25,791 |
|
|
| 253 |
|
Mid/High-Rise |
|
| 198 |
|
|
| 51,604 |
|
|
| 261 |
|
|
| 202 |
|
|
| 52,098 |
|
|
| 258 |
|
|
|
| 305 |
|
|
| 78,611 |
|
|
| 258 |
|
|
| 304 |
|
|
| 77,889 |
|
|
| 256 |
|
28
The Company’s properties are summarized by ownership type in the following table:
|
| Properties |
|
| Apartment Units |
|
| Properties |
|
| Apartment Units |
| ||||
Wholly Owned Properties |
|
| 283 |
|
|
| 73,598 |
|
|
| 287 |
|
|
| 74,328 |
|
Master-Leased Properties – Consolidated |
|
| 3 |
|
|
| 853 |
| ||||||||
Master-Leased Property – Consolidated |
|
| 1 |
|
|
| 162 |
| ||||||||
Partially Owned Properties – Consolidated |
|
| 17 |
|
|
| 3,215 |
|
|
| 16 |
|
|
| 3,399 |
|
Partially Owned Properties – Unconsolidated |
|
| 2 |
|
|
| 945 |
| ||||||||
|
|
| 305 |
|
|
| 78,611 |
|
|
| 304 |
|
|
| 77,889 |
|
21
The following table sets forth certain information by market relating to the Company’s properties at December 31, 2017:2020:
Portfolio Summary | Portfolio Summary |
| Portfolio Summary |
| ||||||||||||||||||||||||||||
Markets/Metro Areas |
| Properties |
|
| Apartment Units |
|
| % of Stabilized NOI (A) |
|
| Average Rental Rate (B) |
|
| Properties |
|
| Apartment Units |
|
| % of Stabilized Budgeted NOI (1) |
|
| Average Rental Rate (2) |
| ||||||||
Los Angeles |
|
| 71 |
|
|
| 16,160 |
|
|
| 18.6 | % |
| $ | 2,454 |
|
|
| 72 |
|
|
| 16,603 |
|
|
| 21.5 | % |
| $ | 2,458 |
|
Orange County |
|
| 13 |
|
|
| 4,028 |
|
|
| 4.4 | % |
|
| 2,142 |
|
|
| 13 |
|
|
| 4,028 |
|
|
| 5.4 | % |
|
| 2,222 |
|
San Diego |
|
| 12 |
|
|
| 3,385 |
|
|
| 3.9 | % |
|
| 2,288 |
|
|
| 11 |
|
|
| 2,706 |
|
|
| 3.8 | % |
|
| 2,373 |
|
Subtotal – Southern California |
|
| 96 |
|
|
| 23,573 |
|
|
| 26.9 | % |
|
| 2,375 |
|
|
| 96 |
|
|
| 23,337 |
|
|
| 30.7 | % |
|
| 2,407 |
|
|
|
|
|
|
|
|
|
|
|
|
|
|
|
|
|
|
|
|
|
|
|
|
|
|
|
|
|
|
|
|
|
|
San Francisco |
|
| 54 |
|
|
| 12,961 |
|
|
| 19.5 | % |
|
| 3,089 |
|
|
| 48 |
|
|
| 12,707 |
|
|
| 18.3 | % |
|
| 3,053 |
|
Washington D.C. |
|
| 48 |
|
|
| 15,811 |
|
|
| 17.3 | % |
|
| 2,360 |
|
|
| 47 |
|
|
| 14,731 |
|
|
| 17.2 | % |
|
| 2,387 |
|
Seattle |
|
| 46 |
|
|
| 9,454 |
|
|
| 11.4 | % |
|
| 2,349 |
| ||||||||||||||||
New York |
|
| 39 |
|
|
| 10,462 |
|
|
| 16.5 | % |
|
| 3,758 |
|
|
| 37 |
|
|
| 9,606 |
|
|
| 11.3 | % |
|
| 3,617 |
|
Boston |
|
| 24 |
|
|
| 6,263 |
|
|
| 9.9 | % |
|
| 3,001 |
|
|
| 25 |
|
|
| 6,430 |
|
|
| 9.4 | % |
|
| 2,958 |
|
Seattle |
|
| 41 |
|
|
| 8,460 |
|
|
| 9.9 | % |
|
| 2,365 |
| ||||||||||||||||
Other Markets |
|
| 1 |
|
|
| 136 |
|
|
| — | % |
|
| 1,157 |
| ||||||||||||||||
Denver |
|
| 5 |
|
|
| 1,624 |
|
|
| 1.7 | % |
|
| 2,003 |
| ||||||||||||||||
Total |
|
| 303 |
|
|
| 77,666 |
|
|
| 100.0 | % |
|
| 2,729 |
|
|
| 304 |
|
|
| 77,889 |
|
|
| 100.0 | % |
| $ | 2,680 |
|
|
|
|
|
|
|
|
|
|
|
|
|
|
|
|
|
|
|
|
|
|
|
|
|
|
|
|
|
|
|
|
|
|
Unconsolidated Properties |
|
| 2 |
|
|
| 945 |
|
|
| — |
|
|
| — |
| ||||||||||||||||
|
|
|
|
|
|
|
|
|
|
|
|
|
|
|
|
| ||||||||||||||||
Grand Total |
|
| 305 |
|
|
| 78,611 |
|
|
| 100.0 | % |
| $ | 2,729 |
| ||||||||||||||||
Note: Projects under development are not included in the Portfolio Summary until construction has been completed.
| % of Stabilized Budgeted NOI - Represents original budgeted |
| Average Rental Rate - Total residential rental revenues reflected on a straight-line basis in accordance with GAAP divided by the weighted average occupied apartment units for the reporting period presented. |
As of December 31, 2017,2020, the Company’s same store occupancy was 95.9%94.4% and its total portfolio-wide occupancy, which includes completed development properties in various stages of lease-up, was 95.0%94.2%. Certain of the Company’s properties are encumbered by mortgages and additional detail can be found on Schedule III – Real Estate and Accumulated Depreciation. Resident leases are generally for twelve months in length and can require security deposits. The garden-style propertiesGarden-style are generally defined as properties with two and/or three story buildings while the mid-rise/high-rise are defined as properties with greater than three story buildings. These two property types typically provide residents with amenities, such as rooftop decks and swimming pools, fitness centers and community rooms. In addition, many of our urban properties have non-residential components, such as parking garagegarages and/or retail components.spaces.
2922
The consolidated properties currently in various stages of development and lease-up at December 31, 20172020, all of which are consolidated, are included in the following table:
Development and Lease-Up Projects as of December 31, 2017 | ||||||||||||||||||||||||||||||||||||||
(Amounts in thousands except for project and apartment unit amounts) | ||||||||||||||||||||||||||||||||||||||
Projects |
| Location |
| No. of Apartment Units |
|
| Total Budgeted Capital Cost (1) |
|
| Total Book Value to Date |
|
| Total Book Value Not Placed in Service |
|
| Total Debt |
|
| Percentage Completed |
|
| Percentage Leased |
|
| Percentage Occupied |
|
| Estimated Completion Date |
| Estimated Stabilization Date | ||||||||
Projects Under Development: |
|
|
|
|
|
|
|
|
|
|
|
|
|
|
|
|
|
|
|
|
|
|
|
|
|
|
|
|
|
|
|
|
|
|
|
|
|
|
855 Brannan |
| San Francisco, CA |
|
| 449 |
|
| $ | 304,035 |
|
| $ | 296,916 |
|
| $ | 90,676 |
|
| $ | — |
|
|
| 96 | % |
|
| 55 | % |
|
| 50 | % |
| Q1 2018 |
| Q1 2019 |
100 K Street |
| Washington D.C. |
|
| 222 |
|
|
| 88,023 |
|
|
| 45,603 |
|
|
| 45,603 |
|
|
| — |
|
|
| 33 | % |
|
| — |
|
|
| — |
|
| Q4 2018 |
| Q4 2019 |
1401 E. Madison |
| Seattle, WA |
|
| 137 |
|
|
| 62,352 |
|
|
| 18,334 |
|
|
| 18,334 |
|
|
| — |
|
|
| 3 | % |
|
| — |
|
|
| — |
|
| Q3 2019 |
| Q1 2020 |
249 Third Street |
| Cambridge, MA |
|
| 84 |
|
|
| 51,447 |
|
|
| 8,934 |
|
|
| 8,934 |
|
|
| — |
|
|
| 1 | % |
|
| — |
|
|
| — |
|
| Q4 2019 |
| Q2 2020 |
Projects Under Development |
|
|
|
| 892 |
|
|
| 505,857 |
|
|
| 369,787 |
|
|
| 163,547 |
|
|
| — |
|
|
|
|
|
|
|
|
|
|
|
|
|
|
|
|
|
Completed Not Stabilized (2): |
|
|
|
|
|
|
|
|
|
|
|
|
|
|
|
|
|
|
|
|
|
|
|
|
|
|
|
|
|
|
|
|
|
|
|
|
|
|
455 Eye Street |
| Washington D.C. |
|
| 174 |
|
|
| 73,157 |
|
|
| 72,972 |
|
|
| — |
|
|
| — |
|
|
|
|
|
|
| 96 | % |
|
| 91 | % |
| Completed |
| Q1 2018 |
Helios (formerly 2nd & Pine) |
| Seattle, WA |
|
| 398 |
|
|
| 227,287 |
|
|
| 220,101 |
|
|
| — |
|
|
| — |
|
|
|
|
|
|
| 54 | % |
|
| 48 | % |
| Completed |
| Q2 2019 |
Cascade |
| Seattle, WA |
|
| 477 |
|
|
| 176,378 |
|
|
| 169,597 |
|
|
| — |
|
|
| — |
|
|
|
|
|
|
| 50 | % |
|
| 47 | % |
| Completed |
| Q2 2019 |
Projects Completed Not Stabilized |
|
|
|
| 1,049 |
|
|
| 476,822 |
|
|
| 462,670 |
|
|
| — |
|
|
| — |
|
|
|
|
|
|
|
|
|
|
|
|
|
|
|
|
|
Completed and Stabilized During the Quarter: |
|
|
|
|
|
|
|
|
|
|
|
|
|
|
|
|
|
|
|
|
|
|
|
|
|
|
|
|
|
|
|
|
|
|
|
|
|
|
Altitude (formerly Village at Howard Hughes) |
| Los Angeles, CA |
|
| 545 |
|
|
| 192,331 |
|
|
| 191,747 |
|
|
| — |
|
|
| — |
|
|
|
|
|
|
| 96 | % |
|
| 95 | % |
| Completed |
| Stabilized |
The Alton (formerly Millikan) |
| Irvine, CA |
|
| 344 |
|
|
| 107,381 |
|
|
| 106,795 |
|
|
| — |
|
|
| — |
|
|
|
|
|
|
| 96 | % |
|
| 95 | % |
| Completed |
| Stabilized |
One Henry Adams |
| San Francisco, CA |
|
| 241 |
|
|
| 169,437 |
|
|
| 167,256 |
|
|
| — |
|
|
| — |
|
|
|
|
|
|
| 96 | % |
|
| 93 | % |
| Completed |
| Stabilized |
Projects Completed and Stabilized During the Quarter |
|
|
|
| 1,130 |
|
|
| 469,149 |
|
|
| 465,798 |
|
|
| — |
|
|
| — |
|
|
|
|
|
|
|
|
|
|
|
|
|
|
|
|
|
Total Development Projects |
|
|
|
| 3,071 |
|
| $ | 1,451,828 |
|
| $ | 1,298,255 |
|
| $ | 163,547 |
|
| $ | — |
|
|
|
|
|
|
|
|
|
|
|
|
|
|
|
|
|
Land Held for Development |
|
|
| N/A |
|
| N/A |
|
| $ | 98,963 |
|
| $ | 98,963 |
|
| $ | — |
|
|
|
|
|
|
|
|
|
|
|
|
|
|
|
|
| ||
Development and Lease-Up Projects as of December 31, 2020 |
| |||||||||||||||||||||||||||||||||||||||
(Amounts in thousands except for project and apartment unit amounts) |
| |||||||||||||||||||||||||||||||||||||||
|
|
|
|
|
|
|
| Total |
|
| Total |
|
| Total Book |
|
|
|
|
|
|
|
|
|
|
|
|
|
|
|
|
|
|
|
|
|
|
| |||
|
|
|
| No. of |
|
| Budgeted |
|
| Book |
|
| Value Not |
|
|
|
|
|
|
|
|
|
| Estimated/Actual |
|
|
|
|
|
|
|
| ||||||||
|
|
|
| Apartment |
|
| Capital |
|
| Value |
|
| Placed in |
|
| Total |
|
| Percentage |
|
| Initial |
| Completion |
| Stabilization |
| Percentage |
|
| Percentage |
| ||||||||
Projects |
| Location |
| Units |
|
| Cost (1) |
|
| to Date |
|
| Service |
|
| Debt |
|
| Completed |
|
| Occupancy |
| Date |
| Date |
| Leased |
|
| Occupied |
| ||||||||
Projects Under Development - Wholly Owned: |
|
|
|
|
|
|
|
|
|
|
|
|
|
|
|
|
|
|
|
|
|
|
|
|
|
|
|
|
|
|
|
|
|
|
|
|
|
|
|
|
Alcott Apartments (fka West End Tower) |
| Boston, MA |
|
| 470 |
|
| $ | 409,749 |
|
| $ | 267,783 |
|
| $ | 267,783 |
|
| $ | — |
|
|
| 67 | % |
| Q2 2021 |
| Q3 2021 |
| Q1 2023 |
|
| — |
|
|
| — |
|
The Edge (fka 4885 Edgemoor Lane) (2) |
| Bethesda, MD |
|
| 154 |
|
|
| 75,271 |
|
|
| 52,312 |
|
|
| 52,312 |
|
|
| — |
|
|
| 70 | % |
| Q3 2021 |
| Q3 2021 |
| Q3 2022 |
|
| — |
|
|
| — |
|
Projects Under Development Wholly Owned |
|
|
|
| 624 |
|
|
| 485,020 |
|
|
| 320,095 |
|
|
| 320,095 |
|
|
| — |
|
|
|
|
|
|
|
|
|
|
|
|
|
|
|
|
|
|
|
Projects Under Development - Partially Owned: |
|
|
|
|
|
|
|
|
|
|
|
|
|
|
|
|
|
|
|
|
|
|
|
|
|
|
|
|
|
|
|
|
|
|
|
|
|
|
|
|
Aero Apartments (3) |
| Alameda, CA |
|
| 200 |
|
|
| 117,794 |
|
|
| 91,039 |
|
|
| 91,039 |
|
|
| 31,494 |
|
|
| 78 | % |
| Q1 2021 |
| Q2 2021 |
| Q2 2022 |
|
| — |
|
|
| — |
|
Projects Under Development Partially Owned |
|
|
|
| 200 |
|
|
| 117,794 |
|
|
| 91,039 |
|
|
| 91,039 |
|
|
| 31,494 |
|
|
|
|
|
|
|
|
|
|
|
|
|
|
|
|
|
|
|
Total Projects Under Development |
|
|
|
| 824 |
|
| $ | 602,814 |
|
| $ | 411,134 |
|
| $ | 411,134 |
|
| $ | 31,494 |
|
|
|
|
|
|
|
|
|
|
|
|
|
|
|
|
|
|
|
Land Held for Development |
|
|
| N/A |
|
| N/A |
|
| $ | 86,170 |
|
| $ | 86,170 |
|
| $ | — |
|
|
|
|
|
|
|
|
|
|
|
|
|
|
|
|
|
|
| ||
Note: All development projects are wholly owned by the Company.
(1) | Total Budgeted Capital Cost |
(2) |
|
(3) | Aero Apartments – This development project is owned 90% by the Company and |
As of December 31, 2017,2020, the Company does not believe there is any litigation pending or threatened against it that, individually or in the aggregate, may reasonably be expected to have a material adverse effect on the Company.
Item 4. Mine Safety Disclosures
Not applicable.
3023
Item 5. Market for Registrant’s Common Equity, Related Stockholder Matters and Issuer Purchases of Equity Securities
Common Share Market PricesShare/Unit Information (Equity Residential and Dividends (Equity Residential)ERP Operating Limited Partnership)
The following table sets forth, for the years indicated, the high, low and closing sales prices for and the distributions declared on the Company’s Common Shares which trade on the New York Stock Exchange under the trading symbol EQR.
|
| Sales Price |
|
|
|
|
| |||||||||
|
| High |
|
| Low |
|
| Closing |
|
| Distributions |
| ||||
2017 |
|
|
|
|
|
|
|
|
|
|
|
|
|
|
|
|
Fourth Quarter Ended December 31, 2017 |
| $ | 70.46 |
|
| $ | 63.20 |
|
| $ | 63.77 |
|
| $ | 0.50375 |
|
Third Quarter Ended September 30, 2017 |
| $ | 68.77 |
|
| $ | 63.98 |
|
| $ | 65.93 |
|
| $ | 0.50375 |
|
Second Quarter Ended June 30, 2017 |
| $ | 68.83 |
|
| $ | 61.59 |
|
| $ | 65.83 |
|
| $ | 0.50375 |
|
First Quarter Ended March 31, 2017 |
| $ | 65.71 |
|
| $ | 59.49 |
|
| $ | 62.22 |
|
| $ | 0.50375 |
|
|
|
|
|
|
|
|
|
|
|
|
|
|
|
|
|
|
2016 |
|
|
|
|
|
|
|
|
|
|
|
|
|
|
|
|
Fourth Quarter Ended December 31, 2016 |
| $ | 65.14 |
|
| $ | 58.28 |
|
| $ | 64.36 |
|
| $ | 0.50375 |
|
Third Quarter Ended September 30, 2016 |
| $ | 71.53 |
|
| $ | 62.39 |
|
| $ | 64.33 |
|
| $ | 3.50375 |
|
Second Quarter Ended June 30, 2016 |
| $ | 75.49 |
|
| $ | 63.11 |
|
| $ | 68.88 |
|
| $ | 0.50375 |
|
First Quarter Ended March 31, 2016 |
| $ | 81.76 |
|
| $ | 66.62 |
|
| $ | 75.03 |
|
| $ | 8.50375 |
|
Note: In addition to the regular quarterly dividends in 2016, the Company paid special dividends of $8.00 per share/unit (approximately $3.0 billion) on March 10, 2016 and $3.00 per share/unit (approximately $1.1 billion) on October 14, 2016.
The number of record holders of Common Shares at February 16, 2018 was approximately 2,300. The number of outstanding Common Shares as of February 16, 2018 was 368,169,571.
Unit Dividends (ERP Operating Limited Partnership)
There is no established public market for the Operating Partnership’s Units (OP Units and restricted units).
The following table sets forth, for At February 12, 2021, the years indicated,number of record holders of Common Shares was approximately 1,950 and 372,663,215 Common Shares were outstanding. At February 12, 2021, the distributions declared on the Operating Partnership’s Units.
|
| Distributions |
| |||||
|
| 2017 |
|
| 2016 |
| ||
Fourth Quarter Ended December 31, |
| $ | 0.50375 |
|
| $ | 0.50375 |
|
Third Quarter Ended September 30, |
| $ | 0.50375 |
|
| $ | 3.50375 |
|
Second Quarter Ended June 30, |
| $ | 0.50375 |
|
| $ | 0.50375 |
|
First Quarter Ended March 31, |
| $ | 0.50375 |
|
| $ | 8.50375 |
|
Note: In addition to the regular quarterly dividends in 2016, the Company paid special dividends of $8.00 per share/unit (approximately $3.0 billion) on March 10, 2016 and $3.00 per share/unit (approximately $1.1 billion) on October 14, 2016.
The number of record holders of Units in the Operating Partnership at February 16, 2018 was approximately 500. The number of outstanding475 and 386,705,589 Units as of February 16, 2018 was 382,197,057.were outstanding.
Unregistered Common Shares Issued in the Quarter Ended December 31, 20172020 (Equity Residential)
During the quarter ended December 31, 2017,2020, EQR issued 41,54922,768 Common Shares in exchange for 41,54922,768 OP Units held by various limited partners of ERPOP. OP Units are generally exchangeable into Common Shares on a one-for-one basis or, at the option of ERPOP, the cash equivalent thereof, at any time one year after the date of issuance. These shares were either registered under the Securities Act of 1933, as amended (the “Securities Act”), or issued in reliance on an exemption from registration under Section 4(2)4(a)(2) of the Securities Act and the rules and regulations promulgated thereunder, as these were transactions by an issuer not involving a public offering. In light of the manner of the sale and information obtained by EQR from the limited partners in connection with these transactions, EQR believes it may rely on these exemptions.
31
Equity Compensation Plan Information
The following table provides information as of December 31, 20172020 with respect to the Company’s Common Shares that may be issued under its existing equity compensation plans.
Plan Category |
| Number of securities to be issued upon exercise of outstanding options, warrants and rights |
|
| Weighted average exercise price of outstanding options, warrants and rights |
| Number of securities remaining available for future issuance under equity compensation plans (excluding securities in column (a)) |
|
| Number of securities to be issued upon exercise of outstanding options, warrants and rights |
|
| Weighted-average exercise price of outstanding options, warrants and rights |
|
| Number of securities remaining available for future issuance under equity compensation plans (excluding securities in column (a)) |
| |||||
|
| (a) (1) |
|
| (b) (1) |
| (c) (2) |
|
| (a) (1) |
|
| (b) (1) |
|
| (c) (2) |
| |||||
Equity compensation plans approved by shareholders |
|
| 6,483,832 |
|
| $46.46 |
|
| 9,751,123 |
|
|
| 5,642,752 |
|
| $ | 56.91 |
|
|
| 13,136,526 |
|
Equity compensation plans not approved by shareholders |
| N/A |
|
| N/A |
| N/A |
|
| N/A |
|
| N/A |
|
| N/A |
| |||||
(1) | The amounts shown in columns (a) and (b) of the above table do not include |
(2) | Includes |
On June 27, 2019, the shareholders of EQR approved the Company's 2019 Plan and the Company has filed a Form S-8 registration statement to register 11,331,958 Common Shares under this plan. As of December 31, 2020, 10,512,390 shares were available for future issuance. In conjunction with the approval of the 2019 Plan, no further awards may be granted under the 2011 Plan. The 2019 Plan expires on June 27, 2029.
Any Common Shares issued pursuant to EQR’s incentive equity compensation and employee share purchase plans will result in ERPOP issuing OP Units to EQR on a one-for-one basis, with ERPOP receiving the net cash proceeds of such issuances.
Item 6. Selected Financial DataReserved
The following tables set forth selected financial and operating information on a historical basis for the Company and the Operating Partnership. The following information should be read in conjunction with all of the financial statements and notes thereto included elsewhere in this Form 10-K. The historical operating and balance sheet data have been derived from the historical financial statements of the Company and the Operating Partnership. Selected cash flow amounts have also been restated in accordance with the Company’s early adoption of the new statement of cash flows guidance effective October 1, 2017 (see Note 2 in the Notes to Consolidated Financial Statements for further discussion). Certain capitalized terms as used herein are defined in the Notes to Consolidated Financial Statements.
3224
��
CONSOLIDATED HISTORICAL FINANCIAL INFORMATION
(Financial information in thousands except for per share and property data)
|
| Year Ended December 31, |
| |||||||||||||||||
|
| 2017 |
|
| 2016 |
|
| 2015 |
|
| 2014 |
|
| 2013 |
| |||||
OPERATING DATA: |
|
|
|
|
|
|
|
|
|
|
|
|
|
|
|
|
|
|
|
|
Total revenues from continuing operations |
| $ | 2,471,406 |
|
| $ | 2,425,800 |
|
| $ | 2,744,965 |
|
| $ | 2,614,748 |
|
| $ | 2,387,702 |
|
Interest and other income |
| $ | 6,136 |
|
| $ | 65,773 |
|
| $ | 7,372 |
|
| $ | 4,462 |
|
| $ | 5,283 |
|
Net gain (loss) on sales of real estate properties |
| $ | 157,057 |
|
| $ | 4,044,055 |
|
| $ | 335,134 |
|
| $ | 212,685 |
|
| $ | — |
|
Income (loss) from continuing operations |
| $ | 628,381 |
|
| $ | 4,479,586 |
|
| $ | 907,621 |
|
| $ | 657,101 |
|
| $ | (168,174 | ) |
Discontinued operations, net |
| $ | — |
|
| $ | 518 |
|
| $ | 397 |
|
| $ | 1,582 |
|
| $ | 2,073,527 |
|
Net income |
| $ | 628,381 |
|
| $ | 4,480,104 |
|
| $ | 908,018 |
|
| $ | 658,683 |
|
| $ | 1,905,353 |
|
Net income available to Common Shares |
| $ | 600,363 |
|
| $ | 4,289,072 |
|
| $ | 863,277 |
|
| $ | 627,163 |
|
| $ | 1,826,468 |
|
Earnings per share – basic: |
|
|
|
|
|
|
|
|
|
|
|
|
|
|
|
|
|
|
|
|
Income (loss) from continuing operations available to Common Shares |
| $ | 1.64 |
|
| $ | 11.75 |
|
| $ | 2.37 |
|
| $ | 1.73 |
|
| $ | (0.47 | ) |
Net income available to Common Shares |
| $ | 1.64 |
|
| $ | 11.75 |
|
| $ | 2.37 |
|
| $ | 1.74 |
|
| $ | 5.16 |
|
Weighted average Common Shares outstanding |
|
| 366,968 |
|
|
| 365,002 |
|
|
| 363,498 |
|
|
| 361,181 |
|
|
| 354,305 |
|
Earnings per share – diluted: |
|
|
|
|
|
|
|
|
|
|
|
|
|
|
|
|
|
|
|
|
Income (loss) from continuing operations available to Common Shares |
| $ | 1.63 |
|
| $ | 11.68 |
|
| $ | 2.36 |
|
| $ | 1.72 |
|
| $ | (0.47 | ) |
Net income available to Common Shares |
| $ | 1.63 |
|
| $ | 11.68 |
|
| $ | 2.36 |
|
| $ | 1.73 |
|
| $ | 5.16 |
|
Weighted average Common Shares outstanding |
|
| 382,678 |
|
|
| 381,992 |
|
|
| 380,620 |
|
|
| 377,735 |
|
|
| 354,305 |
|
Distributions declared per Common Share outstanding |
| $ | 2.015 |
|
| $ | 13.015 |
|
| $ | 2.21 |
|
| $ | 2.00 |
|
| $ | 1.85 |
|
BALANCE SHEET DATA (at end of period): |
|
|
|
|
|
|
|
|
|
|
|
|
|
|
|
|
|
|
|
|
Real estate, before accumulated depreciation |
| $ | 26,026,896 |
|
| $ | 25,386,425 |
|
| $ | 25,182,352 |
|
| $ | 27,675,383 |
|
| $ | 26,800,948 |
|
Real estate, after accumulated depreciation |
| $ | 19,986,518 |
|
| $ | 20,026,036 |
|
| $ | 20,276,946 |
|
| $ | 22,242,578 |
|
| $ | 21,993,239 |
|
Real estate held for sale |
| $ | — |
|
| $ | — |
|
| $ | 2,181,135 |
|
| $ | — |
|
| $ | — |
|
Total assets |
| $ | 20,570,599 |
|
| $ | 20,704,148 |
|
| $ | 23,110,196 |
|
| $ | 22,902,160 |
|
| $ | 22,789,040 |
|
Total debt |
| $ | 8,957,291 |
|
| $ | 8,987,258 |
|
| $ | 10,921,366 |
|
| $ | 10,796,407 |
|
| $ | 10,720,749 |
|
Redeemable Noncontrolling Interests – Operating Partnership |
| $ | 366,955 |
|
| $ | 442,092 |
|
| $ | 566,783 |
|
| $ | 500,733 |
|
| $ | 363,144 |
|
Total shareholders’ equity |
| $ | 10,242,464 |
|
| $ | 10,229,078 |
|
| $ | 10,470,368 |
|
| $ | 10,368,456 |
|
| $ | 10,507,201 |
|
Total Noncontrolling Interests |
| $ | 231,399 |
|
| $ | 231,906 |
|
| $ | 225,987 |
|
| $ | 339,320 |
|
| $ | 337,995 |
|
OTHER DATA: |
|
|
|
|
|
|
|
|
|
|
|
|
|
|
|
|
|
|
|
|
Total properties (at end of period) |
|
| 305 |
|
|
| 302 |
|
|
| 394 |
|
|
| 391 |
|
|
| 390 |
|
Total apartment units (at end of period) |
|
| 78,611 |
|
|
| 77,458 |
|
|
| 109,652 |
|
|
| 109,225 |
|
|
| 109,855 |
|
Funds from operations available to Common Shares and Units – basic (1) |
| $ | 1,204,904 |
|
| $ | 1,123,530 |
|
| $ | 1,323,786 |
|
| $ | 1,190,915 |
|
| $ | 872,421 |
|
Normalized funds from operations available to Common Shares and Units – basic (1) |
| $ | 1,199,237 |
|
| $ | 1,179,650 |
|
| $ | 1,317,802 |
|
| $ | 1,196,446 |
|
| $ | 1,057,073 |
|
Cash flow provided by (used for): |
|
|
|
|
|
|
|
|
|
|
|
|
|
|
|
|
|
|
|
|
Operating activities |
| $ | 1,265,788 |
|
| $ | 1,214,123 |
|
| $ | 1,356,628 |
|
| $ | 1,324,611 |
|
| $ | 1,085,809 |
|
Investing activities |
| $ | (594,296 | ) |
| $ | 5,903,942 |
|
| $ | (695,814 | ) |
| $ | (678,468 | ) |
| $ | (120,454 | ) |
Financing activities |
| $ | (789,818 | ) |
| $ | (7,054,092 | ) |
| $ | (666,167 | ) |
| $ | (685,412 | ) |
| $ | (1,637,779 | ) |
33
ERP OPERATING LIMITED PARTNERSHIP
CONSOLIDATED HISTORICAL FINANCIAL INFORMATION
(Financial information in thousands except for per Unit and property data)
|
| Year Ended December 31, |
| |||||||||||||||||
|
| 2017 |
|
| 2016 |
|
| 2015 |
|
| 2014 |
|
| 2013 |
| |||||
OPERATING DATA: |
|
|
|
|
|
|
|
|
|
|
|
|
|
|
|
|
|
|
|
|
Total revenues from continuing operations |
| $ | 2,471,406 |
|
| $ | 2,425,800 |
|
| $ | 2,744,965 |
|
| $ | 2,614,748 |
|
| $ | 2,387,702 |
|
Interest and other income |
| $ | 6,136 |
|
| $ | 65,773 |
|
| $ | 7,372 |
|
| $ | 4,462 |
|
| $ | 5,283 |
|
Net gain (loss) on sales of real estate properties |
| $ | 157,057 |
|
| $ | 4,044,055 |
|
| $ | 335,134 |
|
| $ | 212,685 |
|
| $ | — |
|
Income (loss) from continuing operations |
| $ | 628,381 |
|
| $ | 4,479,586 |
|
| $ | 907,621 |
|
| $ | 657,101 |
|
| $ | (168,174 | ) |
Discontinued operations, net |
| $ | — |
|
| $ | 518 |
|
| $ | 397 |
|
| $ | 1,582 |
|
| $ | 2,073,527 |
|
Net income |
| $ | 628,381 |
|
| $ | 4,480,104 |
|
| $ | 908,018 |
|
| $ | 658,683 |
|
| $ | 1,905,353 |
|
Net income available to Units |
| $ | 622,967 |
|
| $ | 4,460,583 |
|
| $ | 897,518 |
|
| $ | 651,994 |
|
| $ | 1,901,746 |
|
Earnings per Unit – basic: |
|
|
|
|
|
|
|
|
|
|
|
|
|
|
|
|
|
|
|
|
Income (loss) from continuing operations available to Units |
| $ | 1.64 |
|
| $ | 11.75 |
|
| $ | 2.37 |
|
| $ | 1.73 |
|
| $ | (0.47 | ) |
Net income available to Units |
| $ | 1.64 |
|
| $ | 11.75 |
|
| $ | 2.37 |
|
| $ | 1.74 |
|
| $ | 5.16 |
|
Weighted average Units outstanding |
|
| 379,869 |
|
|
| 378,829 |
|
|
| 377,074 |
|
|
| 374,899 |
|
|
| 368,038 |
|
Earnings per Unit – diluted: |
|
|
|
|
|
|
|
|
|
|
|
|
|
|
|
|
|
|
|
|
Income (loss) from continuing operations available to Units |
| $ | 1.63 |
|
| $ | 11.68 |
|
| $ | 2.36 |
|
| $ | 1.72 |
|
| $ | (0.47 | ) |
Net income available to Units |
| $ | 1.63 |
|
| $ | 11.68 |
|
| $ | 2.36 |
|
| $ | 1.73 |
|
| $ | 5.16 |
|
Weighted average Units outstanding |
|
| 382,678 |
|
|
| 381,992 |
|
|
| 380,620 |
|
|
| 377,735 |
|
|
| 368,038 |
|
Distributions declared per Unit outstanding |
| $ | 2.015 |
|
| $ | 13.015 |
|
| $ | 2.21 |
|
| $ | 2.00 |
|
| $ | 1.85 |
|
BALANCE SHEET DATA (at end of period): |
|
|
|
|
|
|
|
|
|
|
|
|
|
|
|
|
|
|
|
|
Real estate, before accumulated depreciation |
| $ | 26,026,896 |
|
| $ | 25,386,425 |
|
| $ | 25,182,352 |
|
| $ | 27,675,383 |
|
| $ | 26,800,948 |
|
Real estate, after accumulated depreciation |
| $ | 19,986,518 |
|
| $ | 20,026,036 |
|
| $ | 20,276,946 |
|
| $ | 22,242,578 |
|
| $ | 21,993,239 |
|
Real estate held for sale |
| $ | — |
|
| $ | — |
|
| $ | 2,181,135 |
|
| $ | — |
|
| $ | — |
|
Total assets |
| $ | 20,570,599 |
|
| $ | 20,704,148 |
|
| $ | 23,110,196 |
|
| $ | 22,902,160 |
|
| $ | 22,789,040 |
|
Total debt |
| $ | 8,957,291 |
|
| $ | 8,987,258 |
|
| $ | 10,921,366 |
|
| $ | 10,796,407 |
|
| $ | 10,720,749 |
|
Redeemable Limited Partners |
| $ | 366,955 |
|
| $ | 442,092 |
|
| $ | 566,783 |
|
| $ | 500,733 |
|
| $ | 363,144 |
|
Total partners’ capital |
| $ | 10,469,155 |
|
| $ | 10,450,375 |
|
| $ | 10,691,747 |
|
| $ | 10,582,867 |
|
| $ | 10,718,613 |
|
Noncontrolling Interests – Partially Owned Properties |
| $ | 4,708 |
|
| $ | 10,609 |
|
| $ | 4,608 |
|
| $ | 124,909 |
|
| $ | 126,583 |
|
OTHER DATA: |
|
|
|
|
|
|
|
|
|
|
|
|
|
|
|
|
|
|
|
|
Total properties (at end of period) |
|
| 305 |
|
|
| 302 |
|
|
| 394 |
|
|
| 391 |
|
|
| 390 |
|
Total apartment units (at end of period) |
|
| 78,611 |
|
|
| 77,458 |
|
|
| 109,652 |
|
|
| 109,225 |
|
|
| 109,855 |
|
Funds from operations available to Units – basic (1) |
| $ | 1,204,904 |
|
| $ | 1,123,530 |
|
| $ | 1,323,786 |
|
| $ | 1,190,915 |
|
| $ | 872,421 |
|
Normalized funds from operations available to Units – basic (1) |
| $ | 1,199,237 |
|
| $ | 1,179,650 |
|
| $ | 1,317,802 |
|
| $ | 1,196,446 |
|
| $ | 1,057,073 |
|
Cash flow provided by (used for): |
|
|
|
|
|
|
|
|
|
|
|
|
|
|
|
|
|
|
|
|
Operating activities |
| $ | 1,265,788 |
|
| $ | 1,214,123 |
|
| $ | 1,356,628 |
|
| $ | 1,324,611 |
|
| $ | 1,085,809 |
|
Investing activities |
| $ | (594,296 | ) |
| $ | 5,903,942 |
|
| $ | (695,814 | ) |
| $ | (678,468 | ) |
| $ | (120,454 | ) |
Financing activities |
| $ | (789,818 | ) |
| $ | (7,054,092 | ) |
| $ | (666,167 | ) |
| $ | (685,412 | ) |
| $ | (1,637,779 | ) |
|
|
34
Item 7. Management’s Discussion and Analysis of Financial Condition and Results of Operations
The following discussion and analysis of the results of operations and financial condition of the Company and the Operating Partnership should be read in connection with the Consolidated Financial Statements and Notes thereto. Due to the Company’s ability to control the Operating Partnership and its subsidiaries, the Operating Partnership and each such subsidiary entity has been consolidated with the Company for financial reporting purposes, except for twoany unconsolidated operating properties.properties/entities. Capitalized terms used herein and not defined are as defined elsewhere in this Annual Report on Form 10-K10-K. In addition, please refer to the Definitions section below for the year ended December 31, 2017.various capitalized terms not immediately defined in this Item 7, Management’s Discussion and Analysis of Financial Condition and Results of Operations.
Forward-Looking Statements
Forward-looking statements in this Item 7 as well as elsewhere in this Annual Report on Form 10-K are intended to be made pursuant to the safe harbor provisions of the Private Securities Litigation Reform Act of 1995. These statements are based on current expectations, estimates, projections and assumptions made by management. While the Company’s management believes the assumptions underlying its forward-looking statements are reasonable, such information is inherently subject to uncertainties and may involve certain risks, which could cause actual results, performance or achievements of the Company to differ materially from anticipated future results, performance or achievements expressed or implied by such forward-looking statements. Many of these uncertainties and risks are difficult to predict and beyond management’s control.control, such as the current COVID-19 pandemic (see below for further discussion). Forward-looking statements are not guarantees of future performance, results or events. The forward-looking statements contained herein are made as of the date hereof and the Company undertakes no obligation to update or supplement these forward-looking statements. Factors
In addition, these forward-looking statements are subject to risks related to the COVID-19 pandemic, many of which are unknown, including the duration and severity of the pandemic, the extent of the adverse health impact on the general population and on our residents, customers and employees in particular, its impact on the employment rate and the economy and the corresponding impact on our residents’ and tenants’ ability to pay their rent on time or at all, the impact on resident housing preferences especially for urban apartment living, the extent and impact of governmental responses, the rollout and effectiveness of vaccines and the impact of operational changes we have implemented and may implement in response to the pandemic.
Additional factors that might cause such differences include, but are not limited to the following:
We intend to actively acquire, develop and renovate multifamily properties for rental operations as market conditions dictate. We may also acquire multifamily properties that are unoccupied or in the early stages of lease-up. We may be unable to lease these apartment properties on schedule, resulting in decreases in expected rental revenues and/or lower yields due to lower occupancy and rental rates as well as higher than expected concessions or higher than expected operating expenses. We may not be able to achieve rents that are consistent with expectations for acquired, developed or renovated properties. We may underestimate the costs necessary to bring an acquired property up to standards established for its intended market position, to complete a development property or to complete a renovation. Additionally, we expect that other real estate investors with capital will compete with us for attractive investment opportunities or may also develop properties in markets where we focus our development and acquisition efforts. This competition (or lack thereof) may increase (or depress) prices for multifamily properties. We may not be in a position or have the opportunity in the future to make suitable property acquisitions on favorable terms. We have acquired in the past and intend to continue to pursue the acquisition of properties, including large portfolios of properties, that could increase our size and result in alterations to our capital structure. The total number of apartment units under development, costs of development and estimated completion dates are subject to uncertainties arising from changing economic conditions (such as the cost of labor and construction materials), competition and local government regulation;
Debt financing and other capital required by the Company may not be available or may only be available on adverse terms;
Labor and materials required for maintenance, repair, capital expenditure or development may be more expensive than anticipated;
Occupancy levels and market rents may be adversely affected by national and local political, economic and market conditions including, without limitation, new construction and excess inventory of multifamily and owned housing/condominiums, increasing portions of owned housing/condominium stock being converted to rental use, rental housing subsidized by the government, other government programs that favor single family rental housing or owner occupied housing over multifamily rental housing, slow or negative employment growth and household formation, the availability of low-interest mortgages or the availability of mortgages requiring little or no down payment for single family home buyers, changes in social preferences, governmental regulations (including rent control or rent stabilization laws and regulations) and the potential for geopolitical instability, all of which are beyond the Company’s control; and
Additional factors as discussed in Part I of this Annual Report on Form 10-K, particularly those under “Item 1A. Item 1A, Risk Factors”.
Forward-looking statements and related uncertainties are also included in the Notes to Consolidated Financial Statements in this report. The 2021 guidance assumptions disclosed throughout this Item 7 are based on current expectations and are forward-looking.
35
See Item 1. 1, Business, for discussion regarding the Company’s overview.
Business Objectives and Operating and Investing Strategies
See Item 1. 1, Business, for discussion regarding the Company’s business objectives and operating and investing strategies.
COVID-19 Impact
On March 11, 2020, the World Health Organization declared the outbreak of COVID-19 a pandemic. The continued rapid development and fast-changing nature of the COVID-19 pandemic creates many unknowns that have had and could continue to have a significant future impact on the Company. Its duration, severity and the extent of the adverse health impact on the general population, our residents and employees, the rollout and effectiveness of vaccines and the potential long-term changes in customer preferences for living in our communities, are among the many unknowns. These, among other items, have impacted the economy, the unemployment rate and our operations and could materially affect our future consolidated results of operations, financial condition, liquidity, investments and overall performance. For additional details, see Item 1A, Risk Factors.
We have been supporting our residents and employees during the COVID-19 pandemic by:
• | Utilizing technology to allow our property teams to interact remotely with current and prospective residents, including a new touchless leasing process and a service process designed to limit in-person contact; |
• | Successfully implementing changes to the physical layout of our properties and remaining focused on further enhancing our existing commitment to health and safety during the pandemic; |
25
• | Continuing to provide additional paid leave for employees impacted by the pandemic and in 2020 paid special bonuses to certain on-site employees in recognition of their significant efforts; |
• | Continuing to support our corporate and regional employees by allowing them to work remotely during the pandemic; and |
• | Offering an extensive outreach process for residents and tenants financially impacted by the pandemic, including creating payment plans to assist them, among other support efforts. |
While the pandemic remains a significant health threat, cities continue to work towards safely re-opening their economies and to managing closures in ways that create the least amount of economic impact. We expect that employers will bring back employees to their offices deliberately and safely. We believe proximity to employment and to entertainment and social amenities in urban centers will continue to have value. Employers also continue to invest in the future, committing to long-term office obligations in our markets where they continue to create collaborative work environments.
During the year ended December 31, 2020, the Company collected approximately 97% of its expected Residential revenues in the second, third and fourth quarters of 2020. We believe that 2021 will be a year of recovery for the Company. Operating trends are improving and we believe that the first half of 2021 will be the low point in our financial results. Our affluent, well-employed resident base remains drawn to our nation’s great cities and we expect demand to accelerate and pricing to continue to improve as vaccines are widely administered and cities become more active.
Results of Operations
20172020 and 20162019 Transactions
In conjunction with our business objectives and operating strategy,and investing strategies, the Company continued to invest in apartment properties located in our coastal gateway markets and sell apartment properties located primarily infollowing tables provide a rollforward of the less dense portion of suburban markets and/or propertiestransactions that are functionally or locationally challengedoccurred during the years ended December 31, 20172020 and December 31, 2016 as follows:2019:
Year Ended December 31, 2017:
Portfolio Rollforward
($ in thousands)
|
| Properties |
|
| Apartment Units |
|
| Purchase Price |
|
| Acquisition Cap Rate |
| ||||
12/31/2019 |
|
| 309 |
|
|
| 79,962 |
|
|
|
|
|
|
|
|
|
Acquisitions: |
|
|
|
|
|
|
|
|
|
|
|
|
|
|
|
|
Consolidated Rental Properties – Not Stabilized (1) |
|
| 1 |
|
|
| 158 |
|
| $ | 48,860 |
|
|
| 4.7 | % |
|
|
|
|
|
|
|
|
|
| Sales Price |
|
| Disposition Yield |
| ||
Dispositions: |
|
|
|
|
|
|
|
|
|
|
|
|
|
|
|
|
Consolidated: |
|
|
|
|
|
|
|
|
|
|
|
|
|
|
|
|
Rental Properties |
|
| (6 | ) |
|
| (2,231 | ) |
| $ | (1,066,861 | ) |
|
| (4.5 | )% |
Land Parcels |
|
| — |
|
|
| — |
|
| $ | (55,510 | ) |
|
|
|
|
12/31/2020 |
|
| 304 |
|
|
| 77,889 |
|
|
|
|
|
|
|
|
|
(1) | The Company acquired one property in the third quarter of 2020 that is in lease-up and is expected to stabilize in its second year of ownership. |
Acquired fourThe consolidated apartment properties,property acquired was located in the Seattle (two properties), Boston and Los Angeles markets, consistingmarket. The consolidated properties disposed of 947 apartment units for approximately $468.0 million at a weighted average Acquisition Cap Rate (see definition below) of 4.8%;
Sold five consolidated apartment properties,were located in the Boston (three properties), New York andPhoenix, San Diego, San Francisco and Washington D.C. markets consisting of 1,194 apartment units for approximately $355.0 million, at a weighted average Disposition Yield (see definition below) of 5.1% and generatingthe sales generated an Unlevered IRR (see definition below) of 12.4%;10.2%.
26
Portfolio Rollforward
($ in thousands)
|
| Properties |
|
| Apartment Units |
|
| Purchase Price |
|
| Acquisition Cap Rate |
| ||||
12/31/2018 |
|
| 307 |
|
|
| 79,482 |
|
|
|
|
|
|
|
|
|
Acquisitions: |
|
|
|
|
|
|
|
|
|
|
|
|
|
|
|
|
Consolidated: |
|
|
|
|
|
|
|
|
|
|
|
|
|
|
|
|
Rental Properties |
|
| 9 |
|
|
| 2,412 |
|
| $ | 1,039,830 |
|
|
| 4.6 | % |
Rental Properties – Not Stabilized (1) |
|
| 4 |
|
|
| 1,128 |
|
| $ | 454,859 |
|
|
| 4.9 | % |
Land Parcels |
|
| — |
|
|
| — |
|
| $ | 19,832 |
|
|
|
|
|
|
|
|
|
|
|
|
|
|
| Sales Price |
|
| Disposition Yield |
| ||
Dispositions: |
|
|
|
|
|
|
|
|
|
|
|
|
|
|
|
|
Consolidated: |
|
|
|
|
|
|
|
|
|
|
|
|
|
|
|
|
Rental Properties |
|
| (11 | ) |
|
| (2,361 | ) |
| $ | (1,080,675 | ) |
|
| (4.6 | )% |
Land Parcels |
|
| — |
|
|
| — |
|
| $ | (2,100 | ) |
|
|
|
|
Unconsolidated: |
|
|
|
|
|
|
|
|
|
|
|
|
|
|
|
|
Rental Properties (2) |
|
| (2 | ) |
|
| (945 | ) |
| $ | (394,500 | ) |
|
| (4.7 | )% |
Completed Developments – Consolidated |
|
| 2 |
|
|
| 221 |
|
|
|
|
|
|
|
|
|
Configuration Changes |
|
| — |
|
|
| 25 |
|
|
|
|
|
|
|
|
|
12/31/2019 |
|
| 309 |
|
|
| 79,962 |
|
|
|
|
|
|
|
|
|
(1) | The Company acquired four properties during the year ended December 31, 2019, consisting of two properties in the Denver market and two properties in the Seattle market, all of which are in the final stages of completing lease-up and are expected to stabilize in the second year of ownership at the Acquisition Cap Rate listed above. |
(2) | The Company owned a 20% interest in unconsolidated rental properties located in San Jose, CA and South Florida. Sales price listed is the gross sales price. The Company received net sales proceeds of approximately $78.3 million and recognized a GAAP gain on sale of approximately $69.5 million. |
Started construction on two projects,The consolidated properties acquired were located in the New York, Seattle, Washington D.C., San Francisco, Los Angeles and Denver markets. The consolidated properties disposed of were located in the New York, Washington D.C., San Francisco and Boston markets and the sales generated an Unlevered IRR of 7.8%. The consolidated properties development completions were located in the Boston and Seattle markets, consisting of 221 apartment units totaling approximately $113.8 million of expected development costs; and
Substantially completedmarkets. Finally, the Company started construction on four projects, located in the Orange County, Washington D.C. and Seattle (two properties) markets, consisting of 1,393 apartment units totaling approximately $584.2 million of development costs and stabilized five developmenttwo consolidated projects, located in the San Francisco (three properties), Los Angeles and Orange CountyWashington D.C. markets, consisting of 1,931 apartments units totaling approximately $983.1 million of development costs.
Year Ended December 31, 2016:
Acquired four consolidated apartment properties consisting of 573 apartment units for approximately $249.3 million at a weighted average Acquisition Cap Rate of 4.8%;
Sold 98 consolidated apartment properties consisting of 29,440 apartment units for approximately $6.8 billion, which includes the sale of the Starwood Portfolio consisting of 72 consolidated apartment properties containing 23,262 apartment units for $5.365 billion, at a weighted average Disposition Yield of 5.4% and generating an Unlevered IRR of 11.8%;
Sold one unconsolidated property consisting of 336 apartments units for approximately $74.5 million (our share of the net sales proceeds approximated $12.4 million), generating a Disposition Yield of 5.6%;
Sold our entire interest in the management contracts and related rights associated with the military housing ventures at Joint Base Lewis McChord consisting of 5,161 apartment units for approximately $63.3 million and sold three land parcels for $57.5 million;
Started construction on one project consisting of 222354 apartment units totaling approximately $88.0$193.1 million of expected development costs; andcosts.
Substantially completed construction on five projects consisting of 2,141 apartment units totaling approximately $1.1 billion of development costs and stabilized six development projects consisting of 1,839 apartment units totaling approximately $894.2 million of development costs.
See also Note 4 in the Notes to Consolidated Financial Statements for additional discussion regarding the Company’s real estate transactions.
The Company’s guidance assumes consolidated rental acquisitions will be approximately equal to consolidated rental dispositions for the full year ending December 31, 2021. We currently budget spending approximately $220.0 million on development costs during the year ending December 31, 2021, primarily for properties currently under construction. Certain of these costs are expected to be funded by third-party construction mortgages and joint venture partner obligations. Work at all of our development projects continues with no material delays after some construction disruptions due to COVID-19.
Same Store Results
Properties that the Company owned and were stabilized (see definition below) for all of both 20172020 and 20162019 (the “2017“2020 Same Store Properties”), which represented 70,117 apartment units, and properties that the Company owned and were
36
stabilized for all of both 2016 and 2015 (the “2016 Same Store Properties”), which represented 69,87973,585 apartment units, impacted the Company’s results of operations. Both the 2017 Same Store Properties and 2016The 2020 Same Store Properties are discussed in the following paragraphs.
The Company’s primary financial measure for evaluating each of its apartment communities is net operating income (“NOI”). NOI represents rental income less direct property operating expenses (including real estate taxes and insurance). The Company believes that NOI is helpful to investors as a supplemental measure of its operating performance because it is a direct measure of the actual operating results of the Company’s apartment properties.
27
The following tables provide a rollforward of the apartment units included in Same Store Properties and a reconciliation of apartment units included in Same Store Properties to those included in Total Properties for the year ended December 31, 2017:2020:
|
| Year Ended December 31, 2017 |
| |||||
|
| Properties |
|
| Apartment Units |
| ||
Same Store Properties at December 31, 2016 |
|
| 272 |
|
|
| 69,879 |
|
2015 acquisitions |
|
| 4 |
|
|
| 625 |
|
2017 dispositions |
|
| (5 | ) |
|
| (1,194 | ) |
Lease-up properties stabilized |
|
| 4 |
|
|
| 800 |
|
Other |
|
| — |
|
|
| 7 |
|
Same Store Properties at December 31, 2017 |
|
| 275 |
|
|
| 70,117 |
|
|
| Year Ended December 31, 2020 |
| |||||
|
| Properties |
|
| Apartment Units |
| ||
Same Store Properties at December 31, 2019 |
|
| 279 |
|
|
| 71,830 |
|
2017 acquisitions |
|
| 2 |
|
|
| 510 |
|
2018 acquisitions |
|
| 5 |
|
|
| 1,461 |
|
2020 dispositions |
|
| (6 | ) |
|
| (2,231 | ) |
Lease-up properties stabilized |
|
| 5 |
|
|
| 2,015 |
|
Same Store Properties at December 31, 2020 |
|
| 285 |
|
|
| 73,585 |
|
|
| Year Ended December 31, 2017 |
| |||||
|
| Properties |
|
| Apartment Units |
| ||
Same Store |
|
| 275 |
|
|
| 70,117 |
|
Non-Same Store: |
|
|
|
|
|
|
|
|
2017 acquisitions - stabilized |
|
| 2 |
|
|
| 437 |
|
2017 acquisitions - not stabilized |
|
| 2 |
|
|
| 510 |
|
2016 acquisitions |
|
| 4 |
|
|
| 573 |
|
Properties removed from same store (1) |
|
| 2 |
|
|
| 356 |
|
Master-Leased properties (2) |
|
| 3 |
|
|
| 853 |
|
Lease-up properties not yet stabilized (3) |
|
| 14 |
|
|
| 4,819 |
|
Other |
|
| 1 |
|
|
| 1 |
|
Total Non-Same Store |
|
| 28 |
|
|
| 7,549 |
|
Unconsolidated properties |
|
| 2 |
|
|
| 945 |
|
Total Properties and Apartment Units |
|
| 305 |
|
|
| 78,611 |
|
|
| Year Ended December 31, 2020 |
| |||||
|
| Properties |
|
| Apartment Units |
| ||
Same Store |
|
| 285 |
|
|
| 73,585 |
|
Non-Same Store: |
|
|
|
|
|
|
|
|
2020 acquisitions |
|
| 1 |
|
|
| 158 |
|
2019 acquisitions |
|
| 13 |
|
|
| 3,540 |
|
Master-Leased properties (1) |
|
| 1 |
|
|
| 162 |
|
Lease-up properties not yet stabilized (2) |
|
| 3 |
|
|
| 443 |
|
Other |
|
| 1 |
|
|
| 1 |
|
Total Non-Same Store |
|
| 19 |
|
|
| 4,304 |
|
Total Properties and Apartment Units |
|
| 304 |
|
|
| 77,889 |
|
Note: Properties are considered “stabilized” when they have achieved 90% occupancy for three consecutive months. Properties are included in Same Storesame store when they are stabilized for all of the current and comparable periods presented.
(1) | Consists of one property containing |
|
|
| Consists of properties in various stages of lease-up and properties where lease-up has been completed but the properties were not stabilized for the comparable periods presented. |
37The following tables present reconciliations of operating income per the consolidated statements of operations to NOI, along with rental income, operating expenses and NOI per the consolidated statements of operations allocated between same store and non-same store results (amounts in thousands):
|
| Year Ended December 31, |
| |||||
|
| 2020 |
|
| 2019 |
| ||
Operating income |
| $ | 1,317,990 |
|
| $ | 1,356,160 |
|
Adjustments: |
|
|
|
|
|
|
|
|
Property management |
|
| 93,825 |
|
|
| 95,344 |
|
General and administrative |
|
| 48,305 |
|
|
| 52,757 |
|
Depreciation |
|
| 820,832 |
|
|
| 831,083 |
|
Net (gain) loss on sales of real estate properties |
|
| (531,807 | ) |
|
| (447,637 | ) |
Total NOI |
| $ | 1,749,145 |
|
| $ | 1,887,707 |
|
Rental income: |
|
|
|
|
|
|
|
|
Same store |
| $ | 2,419,018 |
|
| $ | 2,519,235 |
|
Non-same store/other |
|
| 152,687 |
|
|
| 181,456 |
|
Total rental income |
|
| 2,571,705 |
|
|
| 2,700,691 |
|
Operating expenses: |
|
|
|
|
|
|
|
|
Same store |
|
| 773,479 |
|
|
| 757,502 |
|
Non-same store/other |
|
| 49,081 |
|
|
| 55,482 |
|
Total operating expenses |
|
| 822,560 |
|
|
| 812,984 |
|
NOI: |
|
|
|
|
|
|
|
|
Same store |
|
| 1,645,539 |
|
|
| 1,761,733 |
|
Non-same store/other |
|
| 103,606 |
|
|
| 125,974 |
|
Total NOI |
| $ | 1,749,145 |
|
| $ | 1,887,707 |
|
28
Revenues from the 2017 and 2016 Same Store Properties increased $48.5 million and $78.1 million, respectively, primarily as a result of an increase in average rental rates charged to residents. Expenses from the 2017 and 2016 Same Store Properties increased $17.0 million and $20.2 million, respectively, primarily as a result of an increase in real estate taxes, on-site payroll costs and repairs and maintenance expenses. The following tables providetable provides comparative total same store results and statistics for the 2017 and 20162020 Same Store Properties:
2017
2020 vs. 20162019
Same Store Results/Statistics for 70,117Including 73,585 Same Store Apartment Units
$ in thousands (except for Average Rental Rate)
|
| Results |
|
| Statistics |
| ||||||||||||||||||
Description |
| Revenues |
|
| Expenses |
|
| NOI |
|
| Average Rental Rate (1) |
|
| Physical Occupancy (2) |
|
| Turnover (3) |
| ||||||
2017 |
| $ | 2,248,564 |
|
| $ | 656,321 |
|
| $ | 1,592,243 |
|
| $ | 2,670 |
|
|
| 96.0 | % |
|
| 52.9 | % |
2016 |
| $ | 2,200,094 |
|
| $ | 639,342 |
|
| $ | 1,560,752 |
|
| $ | 2,611 |
|
|
| 96.0 | % |
|
| 54.7 | % |
Change |
| $ | 48,470 |
|
| $ | 16,979 |
|
| $ | 31,491 |
|
| $ | 59 |
|
|
| 0.0 | % |
|
| (1.8 | )% |
Change |
|
| 2.2 | % |
|
| 2.7 | % |
|
| 2.0 | % |
|
| 2.3 | % |
|
|
|
|
|
|
|
|
2020 |
|
| 2019 |
| ||||||||||||||||||||||||||||||||||
|
| Residential |
|
| % Change |
|
| Non- Residential |
|
| % Change |
|
| Total |
|
| % Change |
|
|
|
| Residential |
|
| Non- Residential |
|
| Total |
| |||||||||
Revenues |
| $ | 2,356,344 |
|
|
| (2.9 | %) |
| $ | 62,674 |
| (1) |
| (33.2 | %) |
| $ | 2,419,018 |
|
|
| (4.0 | %) |
| Revenues |
| $ | 2,425,471 |
|
| $ | 93,764 |
|
| $ | 2,519,235 |
|
Expenses |
| $ | 751,504 |
|
|
| 2.1 | % |
| $ | 21,975 |
|
|
| 3.5 | % |
| $ | 773,479 |
|
|
| 2.1 | % |
| Expenses |
| $ | 736,279 |
|
| $ | 21,223 |
|
| $ | 757,502 |
|
NOI |
| $ | 1,604,840 |
|
|
| (5.0 | %) |
| $ | 40,699 |
|
|
| (43.9 | %) |
| $ | 1,645,539 |
|
|
| (6.6 | %) |
| NOI |
| $ | 1,689,192 |
|
| $ | 72,541 |
|
| $ | 1,761,733 |
|
|
|
|
|
|
|
|
|
|
|
|
|
|
|
|
|
|
|
|
|
|
|
|
|
|
|
|
|
|
|
|
|
|
|
|
|
|
|
|
Average Rental Rate |
| $ | 2,809 |
|
|
| (1.5 | %) |
|
|
|
|
|
|
|
|
|
|
|
|
|
|
|
|
| Average Rental Rate |
| $ | 2,852 |
|
|
|
|
|
|
|
|
|
Physical Occupancy |
|
| 95.1 | % |
|
| (1.3 | %) |
|
|
|
|
|
|
|
|
|
|
|
|
|
|
|
|
| Physical Occupancy |
|
| 96.4 | % |
|
|
|
|
|
|
|
|
Turnover |
|
| 52.3 | % |
|
| 2.5 | % |
|
|
|
|
|
|
|
|
|
|
|
|
|
|
|
|
| Turnover |
|
| 49.8 | % |
|
|
|
|
|
|
|
|
Note: Same store revenues for all leases are reflected on a straight-line basis in accordance with GAAP for the current and comparable periods.
(1) | Changes in same store Non-Residential revenues are primarily driven by the deferral/abatement of rents, higher bad debt, lower parking income and the non-cash write-off of $12.9 million of Non-Residential straight-line lease receivables predominantly in the third quarter of 2020. |
The following table provides results and statistics related to our Residential same store operations for the years ended December 31, 2020 and 2019:
2016
2020 vs. 20152019
Same Store Residential Results/Statistics by Market
|
|
|
|
|
|
|
|
|
|
|
|
|
|
|
|
|
|
|
|
|
| Increase (Decrease) from Prior Year |
| |||||||||||||||||||||
Markets/Metro Areas |
| Apartment Units |
|
| 2020 % of Actual NOI |
|
| 2020 Average Rental Rate |
|
| 2020 Weighted Average Physical Occupancy % |
|
| 2020 Turnover |
|
| Revenues |
|
| Expenses |
|
| NOI |
|
| Average Rental Rate |
|
| Physical Occupancy |
|
| Turnover |
| |||||||||||
Los Angeles |
|
| 15,968 |
|
|
| 20.1 | % |
| $ | 2,547 |
|
|
| 95.5 | % |
|
| 51.9 | % |
|
| (3.1 | %) |
|
| 0.8 | % |
|
| (4.8 | %) |
|
| (2.4 | %) |
|
| (0.7 | %) |
|
| (2.5 | %) |
Orange County |
|
| 4,028 |
|
|
| 5.0 | % |
|
| 2,252 |
|
|
| 96.7 | % |
|
| 45.3 | % |
|
| 0.2 | % |
|
| 0.8 | % |
|
| 0.0 | % |
|
| 0.0 | % |
|
| 0.2 | % |
|
| (6.5 | %) |
San Diego |
|
| 2,706 |
|
|
| 3.5 | % |
|
| 2,374 |
|
|
| 97.0 | % |
|
| 49.0 | % |
|
| 1.4 | % |
|
| 1.6 | % |
|
| 1.3 | % |
|
| 1.0 | % |
|
| 0.4 | % |
|
| (6.0 | %) |
Subtotal – Southern California |
|
| 22,702 |
|
|
| 28.6 | % |
|
| 2,473 |
|
|
| 95.9 | % |
|
| 50.4 | % |
|
| (2.1 | %) |
|
| 0.9 | % |
|
| (3.2 | %) |
|
| (1.7 | %) |
|
| (0.4 | %) |
|
| (3.6 | %) |
|
|
|
|
|
|
|
|
|
|
|
|
|
|
|
|
|
|
|
|
|
|
|
|
|
|
|
|
|
|
|
|
|
|
|
|
|
|
|
|
|
|
|
|
|
San Francisco |
|
| 12,183 |
|
|
| 20.6 | % |
|
| 3,234 |
|
|
| 94.7 | % |
|
| 55.3 | % |
|
| (3.9 | %) |
|
| 3.0 | % |
|
| (6.1 | %) |
|
| (2.5 | %) |
|
| (1.3 | %) |
|
| 4.2 | % |
Washington D.C. |
|
| 13,711 |
|
|
| 16.5 | % |
|
| 2,444 |
|
|
| 95.7 | % |
|
| 49.9 | % |
|
| (0.6 | %) |
|
| 0.9 | % |
|
| (1.2 | %) |
|
| 0.4 | % |
|
| (0.9 | %) |
|
| 3.2 | % |
New York |
|
| 9,475 |
|
|
| 13.3 | % |
|
| 3,826 |
|
|
| 93.0 | % |
|
| 50.9 | % |
|
| (6.2 | %) |
|
| 3.3 | % |
|
| (13.2 | %) |
|
| (2.4 | %) |
|
| (3.7 | %) |
|
| 12.1 | % |
Seattle |
|
| 8,442 |
|
|
| 10.4 | % |
|
| 2,433 |
|
|
| 95.5 | % |
|
| 53.6 | % |
|
| (0.3 | %) |
|
| 3.9 | % |
|
| (1.8 | %) |
|
| 0.7 | % |
|
| (0.9 | %) |
|
| (0.7 | %) |
Boston |
|
| 6,346 |
|
|
| 9.8 | % |
|
| 3,100 |
|
|
| 94.2 | % |
|
| 56.3 | % |
|
| (3.3 | %) |
|
| 0.6 | % |
|
| (4.8 | %) |
|
| (1.2 | %) |
|
| (2.0 | %) |
|
| 9.0 | % |
Denver |
|
| 726 |
|
|
| 0.8 | % |
|
| 2,101 |
|
|
| 94.5 | % |
|
| 70.8 | % |
|
| (2.4 | %) |
|
| 2.9 | % |
|
| (4.3 | %) |
|
| (1.0 | %) |
|
| (1.6 | %) |
|
| 4.7 | % |
|
|
|
|
|
|
|
|
|
|
|
|
|
|
|
|
|
|
|
|
|
|
|
|
|
|
|
|
|
|
|
|
|
|
|
|
|
|
|
|
|
|
|
|
|
Total |
|
| 73,585 |
|
|
| 100.0 | % |
| $ | 2,809 |
|
|
| 95.1 | % |
|
| 52.3 | % |
|
| (2.9 | %) |
|
| 2.1 | % |
|
| (5.0 | %) |
|
| (1.5 | %) |
|
| (1.3 | %) |
|
| 2.5 | % |
Note: The above table reflects Residential same store results only. Residential operations account for approximately 97.3% of total revenues for the year ended December 31, 2020.
The following table includes select statistics for Residential same store properties presented on a suburban and urban basis. Statistics for 69,879 Same Store Apartment UnitsJanuary 2021 are preliminary and Blended Rate is inclusive of Leasing Concessions. The impact the COVID-19 pandemic is having on the operating performance in our markets and submarkets varies, with urban markets more challenged than suburban markets as presented below.
$ in thousands (except for Average Rental Rate)
|
| Results |
|
| Statistics |
| ||||||||||||||||||
Description |
| Revenues |
|
| Expenses |
|
| NOI |
|
| Average Rental Rate (1) |
|
| Physical Occupancy (2) |
|
| Turnover (3) |
| ||||||
2016 |
| $ | 2,177,304 |
|
| $ | 634,120 |
|
| $ | 1,543,184 |
|
| $ | 2,597 |
|
|
| 96.0 | % |
|
| 54.4 | % |
2015 |
| $ | 2,099,166 |
|
| $ | 613,924 |
|
| $ | 1,485,242 |
|
| $ | 2,504 |
|
|
| 96.1 | % |
|
| 54.5 | % |
Change |
| $ | 78,138 |
|
| $ | 20,196 |
|
| $ | 57,942 |
|
| $ | 93 |
|
|
| (0.1 | )% |
|
| (0.1 | )% |
Change |
|
| 3.7 | % |
|
| 3.3 | % |
|
| 3.9 | % |
|
| 3.7 | % |
|
|
|
|
|
|
|
|
|
| % of Same Store Residential Revenues |
|
| Physical Occupancy on: |
|
| Percentage of Residents Renewing by Month |
|
| Blended Rate |
| ||||||||||||||||||||||||||||
|
| Dec YTD 2020 |
|
| Sep 30, 2020 |
|
| Dec 31, 2020 |
|
| Jan 31, 2021 |
|
| Jan 2020 |
|
| Dec 2020 |
|
| Jan 2021 (1) |
|
| Q4 2020 |
|
| Dec 2020 |
|
| Jan 2021 (1) |
| ||||||||||
Suburban (2) |
|
| 44 | % |
|
| 95.9 | % |
|
| 95.8 | % |
|
| 96.1 | % |
|
| 58 | % |
|
| 58 | % |
|
| 55 | % |
|
| (7.0 | %) |
|
| (7.3 | %) |
|
| (7.3 | %) |
Urban Other (2)(3) |
|
| 33 | % |
|
| 94.3 | % |
|
| 94.6 | % |
|
| 95.3 | % |
|
| 55 | % |
|
| 47 | % |
|
| 45 | % |
|
| (13.4 | %) |
|
| (14.3 | %) |
|
| (14.7 | %) |
Urban Core (2)(4) |
|
| 23 | % |
|
| 89.2 | % |
|
| 90.2 | % |
|
| 91.8 | % |
|
| 63 | % |
|
| 49 | % |
|
| 51 | % |
|
| (25.0 | %) |
|
| (26.6 | %) |
|
| (25.0 | %) |
Total |
|
| 100 | % |
|
| 94.2 | % |
|
| 94.4 | % |
|
| 95.1 | % |
|
| 58 | % |
|
| 53 | % |
|
| 52 | % |
|
| (13.0 | %) |
|
| (13.9 | %) |
|
| (14.1 | %) |
(1) |
|
(2) |
|
29
(3) | Includes all other Urban properties excluding Urban Core. |
|
|
The following tablestable provides guidance for our expected full year 2021 same store operating performance:
Full Year 2021 | ||
Physical Occupancy | 94.8% to 95.8% | |
Revenue change | (9.0%) to (7.0%) | |
Expense change | 3.0% to 4.0% | |
NOI change | (15.0%) to (12.0%) |
Although 2020 has been the most challenging year that we have faced in our business, we believe that initial signs of improvement have emerged and are optimistic that 2021 will be a year of recovery. We have begun to see improvements across our portfolio for both urban and suburban properties in Physical Occupancy and pricing. Notably, this is the first time this has occurred since July 2020. We continue to test price sensitivity in many markets by reducing both the value and quantity of Leasing Concessions being granted and are beginning to raise rents from recent prior months. While forward trends are improving, our reported results for 2021, particularly in the first half, will continue to be severely impacted by the pandemic. However, we believe our results will steadily improve through the second half of 2021 as recovery accelerates. In the meantime, the Company remains focused on the following performance indicators:
• | Demand – Demand continues to be robust and has carried us through much of the winter season with increased move-in activity well above the seasonal norms. Applications exceeded 2019 levels by approximately 25% in the fourth quarter of 2020 and we were able to generate sufficient activity for move-ins to outpace move-outs despite higher Turnover compared to 2019’s record low level. Applications have remained robust in January 2021, albeit below December 2020 levels, but that is not unexpected since improved Physical Occupancy has allowed us to start testing pricing increases and we have fewer apartment units available to lease. |
• | Pricing – We have seen improvement in the rents (net of Leasing Concessions) that we are able to charge on our apartments since December 2020. This trend, which is a good indicator of where rents including Leasing Concessions stand, has been improving across both urban and suburban markets since this time. However, New Lease Change remains negative as do Renewal Rates Achieved, which will continue to contribute to challenging Blended Rates. |
• | Renewal Rates – We continue to experience negotiation pressure on Renewal Rate Achieved as we are still renewing residents who signed leases pre-pandemic. In terms of the quantity of renewals, we have found some stability in the percent of residents renewing their leases which stands at approximately 52% in January 2021. We expect that to improve to approximately 54% for February and March 2021, which is still 6% below the record retention rates from 2019. |
In summary, the operating environment remains challenging but we are beginning to see what we believe are signs of improvement. See below for specific discussion on operating performance by geographic market:
• | Boston – Strong application volume and improved retention through the fourth quarter of 2020 resulted in steady gains in Physical Occupancy to position us at 95.4% as of January 31, 2021. This market has been reducing Leasing Concession use and now approximately 25% to 30% of our applications, as compared to approximately 50% of our applications back in November 2020, are using them. We have also been able to raise rents consecutively for the past four weeks as of January 31, 2021. Going forward, we expect continued modest improvement but acknowledge that a full recovery will require additional demand drivers to aid in the absorption of the new supply that is being delivered currently and anticipated through the first half of 2021. Despite these anticipated challenges in 2021, the performance over the last two months has definitely improved and has been stronger than our other urban core markets. We expect to regain more Physical Occupancy in 2021 which should allow us to recapture some of the pricing we lost in 2020. |
30
• | New York – New York continues to feel the outsized impact of the COVID-19 pandemic but there are early signs of recovery. We recently had our best Traffic week in the last twelve months and our best leasing week, in terms of applications, since August 2020. Leasing activity is still driven by deal seekers and intra-city movers who are running about 10% higher than normal. We still see residents continuing to leave the city with most of our residents moving to surrounding states with suburban New Jersey capturing the largest share, but that number is normalizing. Physical Occupancy has improved in the market and is at 91.2% at January 31, 2021, which is the first time it has exceeded 90% since September 2020. We believe the broader recovery in this market will be fueled by a lack of competitive new supply, the return to office and the continued growth of technology employers. Many of these technology firms continue to expand their investments in this market, even during the pandemic, supporting the view that the city will continue to thrive, as it has in the past, post-pandemic. For 2021, our focus for New York will be recapturing as much Physical Occupancy and rate as possible while lowering, or possibly eliminating, Leasing Concessions. Recovery in this market will take some time but it also has significant upside potential given 2020 declines. |
• | Washington, D.C. – We believe Washington, D.C. has been our most resilient market on the East Coast. Physical Occupancy remains solid at 96.1% at January 31, 2021, but the market continues to feel the impact of elevated supply and slowing absorption of new Class A multifamily properties. The market continues to benefit from federal government employment, which has actually seen a net increase over the last twelve months, but overall job growth has declined. Leasing Concession use increased in the fourth quarter of 2020, but has now been greatly reduced as of January 2021. These recent signs of improvement provide us with more confidence in the ability of the market to absorb more apartment units and allow for continued rate recovery which could make it one of our better performing markets in 2021. |
• | Seattle – We are seeing early indications of recovery. Both Physical Occupancy (95.9% at January 31, 2021) and Traffic (which normally increases at the beginning of the year) continue to improve in 2021. Traffic increased over January 2020 by approximately 6%, and we are seeing weekly application numbers that are closer to peak leasing season levels than typical first quarter levels. Leasing Concession use remains common in the market but strength in Physical Occupancy is allowing for a gradual reduction in use. In 2021, we expect to focus on maintaining strong Physical Occupancy while increasing pricing. |
• | San Francisco – This market remains our most challenged but even here we are seeing some signs of recovery. Physical Occupancy has improved to 93.8% at January 31, 2021, with our downtown assets at 92%, East Bay at 95.7% and both the Peninsula and South Bay right around 94% at the end of January 2021. The downtown portfolio especially remains pressured with about two-thirds of applicants receiving Leasing Concessions in the fourth quarter of 2020. January 2021, however, has shown improvement on this front with Leasing Concession use on only about 50% of applications. The recovery in this market is somewhat dependent on the return to office plans of technology companies, but while we acknowledge that work from home will play a role, we believe that the value of in-person collaboration and the incredible technology eco-structure of the area will make the San Francisco Bay Area attractive again. Like New York, San Francisco has significant potential due to steep declines in 2020, although recovery will take some time. |
• | Los Angeles – Our portfolio maintained Physical Occupancy above 95% throughout the fourth quarter of 2020 while contending with continued pressure from new supply in the Downtown/Koreatown-Mid Wilshire corridor. Leasing Concession use was modest and averaged approximately 20% of our applications. The suburban portfolio has very strong Physical Occupancy at or near 97% and the suburban submarkets continue to experience modest year-over-year revenue gains. Physical Occupancy was at 95.9% at January 31, 2021 for the entire market. In 2021, we expect Los Angeles to be one of our better performing markets as we now have opportunity to increase rates, but will need to work through bad debt. |
• | Orange County and San Diego – Both markets are primarily suburban and continue to stand out for their resilience throughout the pandemic. These markets have averaged approximately 97% Physical Occupancy through the fourth quarter of 2020 (Orange County and San Diego had Physical Occupancy of 97.2% and 97.4%, respectively, at January 31, 2021) and produced higher resident retention than in any of our other markets. They did so while maintaining positive Blended Rate results in December 2020 and January 2021. Both of these markets have opportunities to increase rents and we believe will continue to perform well throughout 2021. |
• | Denver – While a relatively small market for the Company, this portfolio is holding up well despite the pandemic. Physical Occupancy is at 96.7% at January 31, 2021 and both New Lease Change and Renewal Rate Achieved were improving in both December 2020 and January 2021, while Leasing Concession use has started to trend down starting in the first quarter of 2021. |
31
Despite strong rent collections throughout the pandemic, its economic impact on a small subset of our residents and non-residential tenants has led to higher levels of bad debt than we have historically experienced. We continue to work with our residents and non-residential tenants on payment plans and collections and our bad debt allowance policies remain consistent. We expect our reserves and bad debt expense to remain elevated in 2021. See Note 8 in the Notes to Consolidated Financial Statements for additional discussion of leases at December 31, 2020.
The following table provides comparative same store operating expenses for the 2017 and 20162020 Same Store Properties:
2017
2020 vs. 20162019
Total Same Store Operating Expenses for 70,11773,585 Same Store Apartment Units
$ in thousands
|
|
|
|
|
|
|
|
|
|
|
|
|
|
|
|
|
| % of Actual |
| |||||||||||||||||||||
|
|
|
|
|
|
|
|
|
|
|
|
|
|
|
|
|
| 2017 |
| |||||||||||||||||||||
|
| Actual |
|
| Actual |
|
| $ |
|
| % |
|
| Operating |
| |||||||||||||||||||||||||
|
| 2017 |
|
| 2016 |
|
| Change |
|
| Change |
|
| Expenses |
|
| 2020 |
|
| 2019 |
|
| $ Change (5) |
|
| % Change |
|
| % of 2020 Operating Expenses |
| ||||||||||
Real estate taxes |
| $ | 276,762 |
|
| $ | 268,084 |
|
| $ | 8,678 |
|
|
| 3.2 | % |
|
| 42.2 | % |
| $ | 337,939 |
|
| $ | 325,332 |
|
| $ | 12,607 |
|
|
| 3.9 | % |
|
| 43.7 | % |
On-site payroll (1) |
|
| 148,781 |
|
|
| 142,248 |
|
|
| 6,533 |
|
|
| 4.6 | % |
|
| 22.7 | % |
|
| 160,983 |
|
|
| 160,569 |
|
|
| 414 |
|
|
| 0.3 | % |
|
| 20.8 | % |
Utilities (2) |
|
| 89,938 |
|
|
| 88,159 |
|
|
| 1,779 |
|
|
| 2.0 | % |
|
| 13.7 | % |
|
| 102,768 |
|
|
| 101,137 |
|
|
| 1,631 |
|
|
| 1.6 | % |
|
| 13.3 | % |
Repairs and maintenance (3) |
|
| 83,683 |
|
|
| 82,378 |
|
|
| 1,305 |
|
|
| 1.6 | % |
|
| 12.7 | % |
|
| 93,620 |
|
|
| 94,766 |
|
|
| (1,146 | ) |
|
| (1.2 | )% |
|
| 12.1 | % |
Insurance |
|
| 16,683 |
|
|
| 17,345 |
|
|
| (662 | ) |
|
| (3.8 | )% |
|
| 2.5 | % |
|
| 24,310 |
|
|
| 20,597 |
|
|
| 3,713 |
|
|
| 18.0 | % |
|
| 3.2 | % |
Leasing and advertising |
|
| 9,282 |
|
|
| 10,118 |
|
|
| (836 | ) |
|
| (8.3 | )% |
|
| 1.4 | % |
|
| 10,321 |
|
|
| 10,241 |
|
|
| 80 |
|
|
| 0.8 | % |
|
| 1.3 | % |
Other on-site operating expenses (4) |
|
| 31,192 |
|
|
| 31,010 |
|
|
| 182 |
|
|
| 0.6 | % |
|
| 4.8 | % |
|
| 43,538 |
|
|
| 44,860 |
|
|
| (1,322 | ) |
|
| (2.9 | )% |
|
| 5.6 | % |
Same store operating expenses |
| $ | 656,321 |
|
| $ | 639,342 |
|
| $ | 16,979 |
|
|
| 2.7 | % |
|
| 100.0 | % | ||||||||||||||||||||
Total Same Store Operating Expenses (includes Residential and Non-Residential) |
| $ | 773,479 |
|
| $ | 757,502 |
|
| $ | 15,977 |
|
|
| 2.1 | % |
|
| 100.0 | % | ||||||||||||||||||||
38
Same Store Operating Expenses for 69,879 Same Store Apartment Units
$ in thousands
|
|
|
|
|
|
|
|
|
|
|
|
|
|
|
|
|
| % of Actual |
| |
|
|
|
|
|
|
|
|
|
|
|
|
|
|
|
|
|
| 2016 |
| |
|
| Actual |
|
| Actual |
|
| $ |
|
| % |
|
| Operating |
| |||||
|
| 2016 |
|
| 2015 |
|
| Change |
|
| Change |
|
| Expenses |
| |||||
Real estate taxes |
| $ | 264,689 |
|
| $ | 249,916 |
|
| $ | 14,773 |
|
|
| 5.9 | % |
|
| 41.7 | % |
On-site payroll (1) |
|
| 141,996 |
|
|
| 137,731 |
|
|
| 4,265 |
|
|
| 3.1 | % |
|
| 22.4 | % |
Utilities (2) |
|
| 88,261 |
|
|
| 91,586 |
|
|
| (3,325 | ) |
|
| (3.6 | )% |
|
| 13.9 | % |
Repairs and maintenance (3) |
|
| 81,600 |
|
|
| 79,366 |
|
|
| 2,234 |
|
|
| 2.8 | % |
|
| 12.9 | % |
Insurance |
|
| 17,055 |
|
|
| 16,428 |
|
|
| 627 |
|
|
| 3.8 | % |
|
| 2.7 | % |
Leasing and advertising |
|
| 9,928 |
|
|
| 8,341 |
|
|
| 1,587 |
|
|
| 19.0 | % |
|
| 1.6 | % |
Other on-site operating expenses (4) |
|
| 30,591 |
|
|
| 30,556 |
|
|
| 35 |
|
|
| 0.1 | % |
|
| 4.8 | % |
Same store operating expenses |
| $ | 634,120 |
|
| $ | 613,924 |
|
| $ | 20,196 |
|
|
| 3.3 | % |
|
| 100.0 | % |
(1) | On-site payroll – Includes payroll and related expenses for on-site personnel including property managers, leasing consultants and maintenance staff. |
(2) | Utilities – Represents gross expenses prior to any recoveries under the Resident Utility Billing System (“RUBS”). Recoveries are reflected in rental income. |
(3) | Repairs and maintenance – Includes general maintenance costs, apartment unit turnover costs including interior painting, routine landscaping, security, exterminating, fire protection, snow removal, elevator, roof and parking lot repairs and other miscellaneous building repair and maintenance costs. |
(4) | Other on-site operating expenses – Includes ground lease costs and administrative costs such as office supplies, telephone and data charges and association and business licensing fees. |
The following tables present reconciliations of operating income per the consolidated statements of operations to NOI, along with rental income, operating expenses and NOI per the consolidated statements of operations allocated between same store and non-same store results for the 2017 and 2016 Same Store Properties (amounts in thousands):
|
| Year Ended December 31, |
| |||||||||
|
| 2017 |
|
| 2016 |
|
| 2015 |
| |||
|
|
|
| |||||||||
Operating income |
| $ | 847,471 |
|
| $ | 856,086 |
|
| $ | 1,009,238 |
|
Adjustments: |
|
|
|
|
|
|
|
|
|
|
|
|
Fee and asset management revenue |
|
| (717 | ) |
|
| (3,567 | ) |
|
| (8,387 | ) |
Property management |
|
| 85,493 |
|
|
| 82,015 |
|
|
| 86,206 |
|
General and administrative |
|
| 52,224 |
|
|
| 57,840 |
|
|
| 64,664 |
|
Depreciation |
|
| 743,749 |
|
|
| 705,649 |
|
|
| 765,895 |
|
Impairment |
|
| 1,693 |
|
|
| — |
|
|
| — |
|
Total NOI |
| $ | 1,729,913 |
|
| $ | 1,698,023 |
|
| $ | 1,917,616 |
|
|
| Year Ended December 31, 2017 |
|
| Year Ended December 31, 2016 |
| ||||||||||
|
| (Results for 70,117 Same Store Apartment Units) |
|
| (Results for 69,879 Same Store Apartment Units) |
| ||||||||||
|
| 2017 |
|
| 2016 |
|
| 2016 |
|
| 2015 |
| ||||
|
|
|
|
|
|
|
|
|
|
|
|
|
|
|
|
|
Rental income: |
|
|
|
|
|
|
|
|
|
|
|
|
|
|
|
|
Same store |
| $ | 2,248,564 |
|
| $ | 2,200,094 |
|
| $ | 2,177,304 |
|
| $ | 2,099,166 |
|
Non-same store/other |
|
| 222,125 |
|
|
| 222,139 |
|
|
| 244,929 |
|
|
| 637,412 |
|
Total rental income |
|
| 2,470,689 |
|
|
| 2,422,233 |
|
|
| 2,422,233 |
|
|
| 2,736,578 |
|
Operating expenses: |
|
|
|
|
|
|
|
|
|
|
|
|
|
|
|
|
Same store |
|
| 656,321 |
|
|
| 639,342 |
|
|
| 634,120 |
|
|
| 613,924 |
|
Non-same store/other |
|
| 84,455 |
|
|
| 84,868 |
|
|
| 90,090 |
|
|
| 205,038 |
|
Total operating expenses |
|
| 740,776 |
|
|
| 724,210 |
|
|
| 724,210 |
|
|
| 818,962 |
|
NOI: |
|
|
|
|
|
|
|
|
|
|
|
|
|
|
|
|
Same store |
|
| 1,592,243 |
|
|
| 1,560,752 |
|
|
| 1,543,184 |
|
|
| 1,485,242 |
|
Non-same store/other |
|
| 137,670 |
|
|
| 137,271 |
|
|
| 154,839 |
|
|
| 432,374 |
|
Total NOI |
| $ | 1,729,913 |
|
| $ | 1,698,023 |
|
| $ | 1,698,023 |
|
| $ | 1,917,616 |
|
39
For properties that the Company acquired or completed that were stabilized prior to January 1, 2017 and that the Company expects to continue to own through December 31, 2018, the Company anticipates the following same store results for the full year ending December 31, 2018, which assumptions are based on current expectations and are forward-looking:
| The year-over-year changes are due primarily to: |
|
|
| Real estate taxes – Higher rates and assessed values continue to drive real estate tax growth across most markets. |
|
|
| On-site payroll – Increase driven by higher employee benefit-related costs, partially offset by the transition to an enhanced operating platform and less overtime. |
|
|
| Repairs and maintenance – Decrease primarily driven by deferral and cancellation of some projects as a result of COVID-19-related delays. |
|
|
| Insurance – Increase due to higher premiums on property insurance renewal due to challenging conditions in the insurance market. |
• | Other on-site operating expenses – Decrease primarily due to reduced ground lease expense and lower legal expenses due to legislative suspension of evictions in many markets. |
Same store revenues increased 2.2% during the year ended December 31, 2017 as compared to the same period in 2016, which was ahead of our original expectations and in line with our most recent guidance that was provided in October 2017, due to stronger renewal rates, lower turnover and gains in occupancy. The Company’s primary goal in 2017 was to focus on retaining existing residents to drive renewal rate growth which came in at 4.6% for the year ended December 31, 2017 as compared to the same period in 2016. Same store turnover declined by 1.8% for the year ended December 31, 2017 as compared to the same period in 2016. The Company’s primary focus for 2018 will continue to be on retaining existing residents. We currently estimate same store revenues to increase in a range from 1.0% to 2.25% for 2018 as compared to 2017.
Washington D.C. was the only market in our portfolio that did not meet or surpass our most recent guidance that was provided in October 2017. Same store revenues increased 1.3% during the year ended December 31, 2017 compared to the same period in 2016 as uncertainty in the market caused by the political environment slowed economic activity. While we expect to see slight improvement in new lease rates in 2018, we expect Washington D.C. to remain challenged. As a result, we expect to produce same store revenue growth of approximately 1.0% in this market in 2018.
In the New York market, elevated deliveries of new luxury supply both in established residential areas and newer residential areas like Long Island City are having an impact on our ability to raise rents. While technology sector job growth continues, there has been a reduction in the rate of job growth in the financial services sector, which is an important demand driver in this market. However, due in part to our strong same store occupancy levels (96.2% for the year ended December 31, 2017), we used fewer concessions during 2017 than we originally expected. Same store revenues increased 0.1% for the year ended December 31, 2017 as compared to the same period in 2016, which was above both our original expectations and our most recent guidance provided in October 2017. With new luxury supply elevated in 2018, we expect there to be a decline in same store revenues of approximately 0.75% in 2018.
Boston continues to feel the impact from an elevated level of deliveries of new supply in the downtown and Cambridge submarkets, though job growth has continued to improve. As a result, the additional supply has generally been absorbed thus far without significant disruption. Same store revenues increased 1.6% for the year ended December 31, 2017 as compared to the same period in 2016, which was in line with our original expectations and most recent guidance provided in October 2017. We believe renewal and occupancy rates will continue to remain strong while new lease rates will continue to be negative. We therefore expect 2018 same store revenue growth of approximately 1.6%, which is identical to 2017.
Seattle produced solid rental rate growth driven by the continued growth in technology jobs in the market, but showed signs of slowing rent growth towards the end of 2017. Same store revenues increased 5.6% for the year ended December 31, 2017 as compared to the same period in 2016, which exceeded our original expectations and is generally consistent with the most recent guidance provided in October 2017. We are more cautious on our 2018 outlook. With more moderate growth expected in both renewals and new leases primarily due to increased urban supply and moderating job growth, we expect Seattle to produce same store revenue growth of approximately 3.25% in 2018.
San Francisco performed better than expected in 2017 primarily as a result of strong occupancy and gains on renewals. The market is producing a slower rate of job growth in the technology sector compared to previous years. However, we continue to see strong demand throughout the market, although the rate at which we can increase rents remains somewhat modest due to new supply and a slower rate of job growth. As a result, same store revenues increased 2.0% for the year ended December 31, 2017 as compared to the same period in 2016, which exceeded our original expectations and is generally consistent with the most recent guidance provided in October 2017. While we expect to see slight improvement in new lease rates in 2018, we expect lower occupancy and renewal rates. As a result, we expect to produce same store revenue growth of approximately 1.75% in 2018.
Southern California, which includes Los Angeles, Orange County and San Diego, was one of our better performing markets in 2017. Widely dispersed new supply, very good economic growth and adequate levels of job growth in the market
40
are driving strong revenue growth. Same store revenues increased 3.9% for the year ended December 31, 2017 as compared to the same period in 2016, which slightly exceeded both our original expectations and the most recent guidance we provided in October 2017. We expect to produce same store revenue growth of approximately 3.25%in Los Angeles and 4.0% in both Orange County and San Diego in 2018.
Same store expenses increased 2.7% during the year ended December 31, 2017 as compared to the same period in 2016. The full year 2017 results were primarily due to the following items:
Real estate taxes increased 3.2% for the full year 2017 as compared to the same period in 2016, which was lower than our original expectations, primarily driven by favorable real estate tax appeal results;
Payroll costs increased 4.6% for the full year 2017 as compared to the same period in 2016 (which was consistent with our original expectations) primarily due to an increase in on-site staffing to assure the service levels necessary to remain competitive with new supply and higher on-site wages due to competition from new supply; and
Utilities increased 2.0% for the full year 2017 as compared to the same period in 2016 (which was consistent with our original expectations) primarily due to higher prices for natural gas and higher water and sewer costs, partially offset by lower usage and lower prices for electricity.
We anticipate same store expenses to increase in a range from 3.5%between 3.0% to 4.5%4.0% for 20182021 as compared to 20172020. The increase in same store expenses is expected to be primarily due to the following items:
Real estate taxes are estimated to increase between 4.75% and 5.75% due primarily to increased values and rates and the 421-a tax abatement benefits continuing to expire in New York (approximately 1.7 percentage points of the increase);
• | Real estate taxes are estimated to increase in the mid 3.0% range (which is slightly lower than the 3.9% increase we experienced between 2020 and 2019). While municipalities continue to search for methods to close budget gaps, we believe relief on assessed values provided by some jurisdictions and aggressive appeals activity should help control total expense growth. The timing and success of these appeals may have a significant impact on the ultimate expense growth reported. |
Payroll costs are estimated to increase approximately 5.0% primarily due to higher on-site wages due to competition from new supply; and
• | Payroll costs are estimated to increase approximately 2.0%. Our continued focus on improved efficiencies and utilizations are forecasted to balance payroll growth for the full year of 2021. |
Utilities are estimated to increase between 3.0% and 4.0% primarily due to increases in trash costs as well as anticipated increases in the commodity cost for electricity, natural gas and heating oil after enjoying several years of declining rates.
• | Utilities are estimated to increase between 4.0% and 5.0% primarily due to expected increases in natural gas costs. |
Same store NOI increased 2.0% for the full year 2017 as compared to the same period in 2016, which was at the high end32
• | Repairs and maintenance costs are estimated to increase between 4.0% and 5.0% primarily due to the resumption of activities that were delayed as a result of the COVID-19 pandemic and a difficult comparable period given this expense category declined between 2020 and 2019. |
The Company anticipates same store NOI growth of approximately 0.0% to 1.5%decline for the full year 20182021 by approximately 15.0% to 12.0% as a result of the above same store revenue and expense expectations.
expectations discussed above. Given the continued uncertainty resulting from the COVID-19 pandemic, we anticipate the possibility of greater variability around the midpoint, up or down, within these ranges than we would typically experience in the normal course of business.
See also Note 17 in the Notes to Consolidated Financial Statements for additional discussion regarding the Company’s segment disclosures.
Non-Same Store/Other Results
Non-same storestore/other NOI results increasedfor the year ended December 31, 2020 decreased approximately $0.4$22.4 million in 2017 compared to the same period in 2016 andof 2019. These results consist primarily of properties acquired in calendar years 20162019 and 2017,2020, operations from the Company’s development properties and operations prior to disposition from 20162019 and 20172020 sold properties. This difference is due primarily to:
A positive impact of higher NOI from development and newly stabilized development properties in lease-up of $42.7 million;
• | A positive impact of higher NOI from development and newly stabilized development properties in lease-up of $5.0 million; |
A positive impact of higher NOI from properties acquired in 2016 and 2017 of $12.0 million;
• | A positive impact of higher NOI from properties acquired in 2019 and 2020 of $34.5 million; and |
A positive impact of higher NOI from other non-same store properties (including three master leased properties) of $3.0 million; and
• | A negative impact of lost NOI from 2019 and 2020 dispositions of $61.1 million. |
A negative impact of lost NOI from 2016 and 2017 dispositions of $57.4 million.
41
Non-same store NOI results decreased approximately $277.5 million in 2016 compared to the same period in 2015 and consist primarily of properties acquired in calendar years 2015 and 2016, operations from the Company’s development properties and operations prior to disposition from 2015 and 2016 sold properties (including the Starwood Portfolio). This difference is due primarily to:
A positive impact of higher NOI from development and newly stabilized development properties in lease-up of $50.8 million and properties acquired in 2015 and 2016 of $15.2 million;
A negative impact of lower NOI from other non-same store properties (including three master-leased properties) of $1.2 million; and
A negative impact of lost NOI from 2015 and 2016 dispositions of $333.2 million.
The Company’s guidance assumes consolidated rental acquisitions of $500.0 million and consolidated rental dispositions of $500.0 million and assumes that the Acquisition Cap Rate will be 0.50% lower than the Disposition Yield for the full year ending December 31, 2018. The Company currently budgets one development start during the year ending December 31, 2018. We currently budget spending approximately $150.0 million on development costs during the year ending December 31, 2018, primarily for projects currently under construction and on the one project expected to start in 2018. We assume that this capital will be primarily sourced with excess operating cash flow, future debt offerings and borrowings on our revolving credit facility and/or commercial paper program. These 2018 assumptions are based on current expectations and are forward-looking.
Comparison of the year ended December 31, 20172020 to the year ended December 31, 2016 and the year ended December 31, 2016 to the year ended December 31, 20152019
For the year ended December 31, 2017, the Company reportedThe following table presents a reconciliation of diluted earnings per share/unit of $1.63 compared to $11.68 per share/unit for the year ended December 31, 2016. The difference is primarily due to approximately $10.16 per share/unit in higher gains on property sales and $0.14 per share/unit in higher gains on sales of non-operating assets in 2016 compared to 20172020 as a direct result of the significant sales activity in 2016 compared to 2017, partially offset by $0.29 per share/unit in higher debt extinguishment costs incurred in 2016 as compared to 2017. For the year ended December 31, 2016, the Company reported diluted earnings per share/unit of $11.68 compared to $2.36 per share/unit for the year ended December 31, 2015. The difference is primarily due to approximately $9.69 per share/unit in higher gains on property sales and $0.18 per share/unit in higher gains on sales of non-operating assets in 2016 compared to the same period in 2015 as a direct result of the significant sales activity in 2016, partially offset by $0.30 per share/unit in higher debt extinguishment costs and lower overall NOI as a result of the sales noted above in 2016 compared to 2015.
Income from continuing operations decreased approximately $3.9 billion for the year ended December 31, 2017 compared to the prior year. Income from continuing operations increased $3.6 billion for the year ended December 31, 2016 compared to the prior year. See below for further explanation.2019:
|
| Year Ended December 31 |
| |
Diluted earnings per share/unit for full year 2019 |
| $ | 2.60 |
|
Property NOI |
|
| (0.35 | ) |
Interest expense |
|
| 0.11 |
|
Debt extinguishment costs |
|
| (0.04 | ) |
Non-operating asset gains/losses |
|
| 0.08 |
|
Net gain/loss on property sales |
|
| 0.01 |
|
Other |
|
| 0.04 |
|
Diluted earnings per share/unit for full year 2020 |
| $ | 2.45 |
|
For the year ended December 31, 2017, consolidated rental income increased 2.0%, consolidated operating expenses (comprised of property and maintenance and real estate taxes and insurance) increased 2.3% and consolidated NOI increased 1.9% when compared to the year ended December 31, 2016.
The increasedecrease in consolidated NOI is primarily a result of the Company’s improvedlower NOI from same store and lease-up properties, partially offset by dilutionlargely due to the economic impact from the COVID-19 pandemic, and disposition activity. ForThe following table presents the changes in the components of consolidated NOI for the year ended December 31, 2016, consolidated rental income decreased 11.5%, consolidated operating expenses (comprised of property and maintenance and real estate taxes and insurance) decreased 11.6% and consolidated NOI decreased 11.5% when2020 as compared to the year ended December 31, 2015. The declines are all primarily a result of the Company’s significant disposition activitysame period in 2016.2019:
Fee and asset management revenues decreased approximately $2.9 million or 79.9% and $4.8 million or 57.5% during the year ended December 31, 2017 as compared to 2016 and the year ended December 31, 2016 as compared to 2015, respectively, primarily as a result of lower revenue earned on management of the Company’s military housing ventures at Joint Base Lewis McChord due to the sale of the Company’s entire interest in the management contracts and related rights associated with these ventures in the second quarter of 2016.
Year Ended December 31, 2020 | ||||
Consolidated rental income | (4.8 | %) | ||
Consolidated operating expenses (1) | 1.2 | % | ||
Consolidated NOI | (7.3 | %) | ||
(1) | Consolidated operating expenses are comprised of property and maintenance and real estate taxes and insurance. |
Property management expenses include off-site expenses associated with the self-management of the Company’s properties as well as management fees paid to any third partythird-party management companies. These expenses increaseddecreased approximately $3.5$1.5 million or 4.2%1.6% during the year ended December 31, 20172020 as compared to the prior year. The increase is primarily attributable to increases in education/conference fees, legal fees, office rent, and payroll-related costs. These expenses decreased approximately $4.2 million or 4.9% during the year ended December 31, 2016 compared to the prior year.2019. This decrease is primarily attributable to a decreasedecreases in payroll-related costs office rent(inclusive of lower performance bonuses), travel costs and education/training/conference fees,costs, partially offset by increases in computer operations costs.
33
information technology related costs specifically for various operating initiatives such as sales-focused improvements and service enhancements as well as increases in legal and professional fees. The Company suspended the majority of all travel and training/conference activities as a result of the COVID-19 pandemic. The Company anticipates that property management expenses will
42
approximate $88.5$96.5 million to $90.5$98.5 million for the year ending December 31, 2018. 2021.
General and administrative expenses, from continuing operations, which include corporate operating expenses, decreased approximately $5.6$4.5 million or 9.7% and $6.8 million or 10.6%8.4% during the year ended December 31, 20172020 as compared to 2016 and the year ended December 31, 2016 as compared to 2015, respectively,2019, primarily due to a decreasedecreases in payroll-related costs.costs (inclusive of lower performance bonuses) as a result of the Company’s executive succession program during the past two years, decreases in travel costs and training/conference activities which were mostly suspended as a result of the COVID-19 pandemic and decreases in office rent as a result of the consolidation of space at the Company’s corporate headquarters. The Company anticipates that general and administrative expenses will approximate $53.0 million to $55.0 million for the year ending December 31, 2018.2021.
Depreciation expense, which includes depreciation on non-real estate assets, increaseddecreased approximately $38.1$10.3 million or 5.4%1.2% during the year ended December 31, 20172020 as compared to 2019, primarily due to the prior year, primarilyCompany being a net seller during 2020, which resulted in lower depreciation from properties sold in 2019 and 2020 as a result ofcompared to the additional depreciation expense on properties acquired in 20172019 and 2020 and development properties placed in service in 2016 and 2017, partially offset by lower depreciation fromduring 2019.
Net gain on sales of real estate properties sold in 2016 and 2017. Depreciation expense decreasedincreased approximately $60.2$84.2 million or 7.9%18.8% during the year ended December 31, 20162020 as compared to the prior year,2019, primarily as a result of no depreciationthe sale of six consolidated apartment properties sold for a higher gain in 2020 as compared to the sale of eleven consolidated properties in 2019.
Interest and other income increased approximately $2.7 million or a partial period of depreciation expense85.4% during the year ended December 31, 2016 related2020 as compared to the significant property sales in 2016 (including the Starwood Portfolio),2019. The increase is primarily due to higher insurance/litigation settlement proceeds and other non-comparable items that occurred during 2020 but not during 2019, partially offset by additional depreciation expensedecreases in short-term investment income on properties acquiredcash and restricted deposit accounts in 20162020 as compared to 2019 due to a lower rate environment and development properties placed in service.lower overall invested balances.
Interest and other incomeOther expenses decreased approximately $59.6$0.7 million or 90.7% and increased approximately $58.4 million3.7% during the year ended December 31, 20172020 as compared to 20162019, primarily due to a decrease in various consulting costs related to a data analytics project which was completed in 2019 and the year ended December 31, 2016litigation and environmental settlements, partially offset by increases in advocacy contributions and pursuit costs in 2020 as compared to 2015, respectively, primarily due to the approximate $52.4 million gain from the sale of the Company’s entire interest in the management contracts and related rights associated with the military housing ventures at Joint Base Lewis McChord and approximate $6.0 million gain from the sale of 421-a real estate tax certificates during the year ended December 31, 2016, neither of which occurred in 2017 or 2015. The Company anticipates that interest and other income will approximate $0.5 million to $1.0 million for the year ending December 31, 2018, excluding certain non-comparable insurance/litigation settlement proceeds.
Other expenses decreased approximately $5.2 million or 50.0% and increased $7.4 million during the year ended December 31, 2017 as compared to 2016 and the year ended December 31, 2016 as compared to 2015, respectively, primarily due to higher litigation/environmental reserve and/or settlement costs in 2016, which did not occur at the same levels in 2017 and 2015, as well as a decrease in annual transaction costs of approximately $1.5 million in 2017. In addition, the Company anticipates that substantially all of its transactions will now be accounted for as asset acquisitions, which means that transaction costs will largely be capitalized, as a result of its adoption of the new definition of a business standard effective January 1, 2017. See Note 2 in the Notes to Consolidated Financial Statements for further discussion.2019.
Interest expense, including amortization of deferred financing costs, decreased approximately $102.5$27.7 million or 20.7% for6.9% during the year ended December 31, 20172020 as compared to 2019. The decrease is primarily due to lower overall debt balances outstanding between the prior year, primarilyperiods as a result of $109.9 million indeploying disposition proceeds to repay and discharge debt, as well as lower overall interest rates, partially offset by higher debt extinguishment costs in 20172020 as compared to 2016. Interest expense, including amortization of deferred financing costs, increased approximately $39.6 million or 8.7% for the year ended December 31, 2016 compared to the prior year, primarily as a result of prepayment penalties and debt extinguishment costs associated with the repayment of approximately $1.7 billion in debt principal prior to scheduled maturity, partially offset by lower interest expense as a result of these repayments.2019. The effective interest cost on all indebtedness, was 4.44%, 4.68% and 4.72%excluding debt extinguishment costs/prepayment penalties, for the yearsyear ended December 31, 2017, 2016 and 2015, respectively.2020 was 3.94% as compared to 4.20% in 2019. The Company capitalized interest of approximately $26.3 million, $51.5$10.2 million and $59.9$6.9 million forduring the years ended December 31, 2017, 20162020 and 2015,2019, respectively. The Company anticipates that interest expense, from continuing operations, excluding debt extinguishment costs/prepayment penalties, will approximate $370.5$270.0 million to $383.1$276.5 million and capitalized interest will approximate $4.0$14.5 million to $8.0$16.5 million for the year ending December 31, 2018. 2021.
Income and other tax expense from continuing operations decreased approximately $1.1 million or 70.4% and increased approximately $0.7$3.1 million or 75.9% during the year ended December 31, 20172020 as compared to 2016 and the year ended December 31, 2016 as compared to 2015, respectively,2019, primarily due to changesvarious alternative minimum tax credit refunds recognized in various state and local taxes related to the Company’s elevated disposition activity2019 that did not occur in 2016 compared to 2017 and 2015. The Company anticipates that income and other tax expense will approximate $0.5 million to $1.0 million for the year ending December 31, 2018.2020.
The 2018 guidance/projections provided above are based on current projections and are forward-looking.
Income (loss) from investments in unconsolidated entities decreased approximately $8.2 million and $10.2$69.2 million during the year ended December 31, 20172020 as compared to 2016 and the year ended December 31, 20162019, primarily as compared to 2015, respectively. The decrease in 2017 is primarily due to a result of a $69.5 million gain on the sale of onetwo unconsolidated apartment property totaling $8.8 millionproperties in 20162019 that did not occur in 2017. The decrease in 2016 is primarily due to $18.6 million in favorable litigation
43
settlements which occurred during the year ended December 31, 2015, partially offset by a gain on the sale of one unconsolidated apartment property totaling $8.8 million which occurred during the year ended December 31, 2016.2020.
Net gain (loss) on sales of real estate properties decreased approximately $3.9 billion or 96.1% and increased approximately $3.7 billion during the year ended December 31, 2017 as compared to 2016 and the year ended December 31, 2016 as compared to 2015, respectively, as a result of the sale of 98 consolidated apartment properties (including the Starwood Portfolio) during the year ended December 31, 2016 as compared to only five consolidated apartment property sales during the year ended December 31, 2017 and eight consolidated property sales during the year ended December 31, 2015, all of which did not meet the criteria for reporting discontinued operations.
Net gain (loss) on sales of land parcels increased approximately $3.4$32.2 million or 21.8% due to the gain on sale of one land parcel with a low basis during the year ended December 31, 20172020 as compared to 2019, primarily due to a higher gain on the sale of two land parcels in 2020 as compared to the gain on salessale of fourtwo land parcels in 2019.
Net (income) loss attributable to Noncontrolling Interests in partially owned properties decreased approximately $11.6 million during the year ended December 31, 2016. Net gain (loss) on sales2020 as compared to 2019, primarily as a result of land parcels increased approximately $15.7 million duenoncontrolling interest allocations related to the gain on sale of four land parcels duringone partially owned apartment property in 2020 as compared to no sales in 2019.
For comparison of the year ended December 31, 2016 as compared2019 to no land sales during the year ended December 31, 2015.2018, refer to Item 7, Management’s Discussion and Analysis of Financial Condition and Results of Operations, included in the Company’s and the Operating Partnership’s Annual Report on Form 10-K for the year ended December 31, 2019.
34
Liquidity and Capital Resources
The Company believes its current liquidity position is strong despite the impact of the COVID-19 pandemic. With approximately $2.0 billion in readily available liquidity, limited near-term maturities, very strong credit metricsand ample access to capital markets at historically low rates, the Companybelieves it is well positioned to meet its future obligations. See further discussion below.
Short-Term Liquidity and Cash Proceeds
The Company generally expects to meet its short-term liquidity requirements, including capital expenditures related to maintaining its existing properties and scheduled unsecured note and mortgage note repayments, through its working capital, net cash provided by operating activities and borrowings under the Company’s revolving credit facility and commercial paper program. Under normal operating conditions,Currently, the Company considers its cash provided by operating activities to be adequate to meet operating requirements and payments of distributions.
As of January 1, 2017,The following table presents the Company had approximately $77.2 million ofCompany’s balances for cash and cash equivalents, approximately $141.9 million of restricted deposits and the amount available borrowing capacity on its revolving credit facility was $1.96 billion (netas of $20.6 million which was restricted/dedicated to support letters of credit and net of $20.0 million in principal outstanding on the commercial paper program). After taking into effect the various transactions discussed in the following paragraphs and the net cash provided by operating activities, at December 31, 2017, the Company’s cash2020 and cash equivalents balance was approximately $58.3 million, the restricted deposits balance was approximately $50.1 million and the amount available on its revolving credit facility was $1.69 billion (net of $6.6 million which was restricted/dedicated to support letters of credit and net of $300.0 million2019 (amounts in principal outstanding on the commercial paper program).thousands):
|
| December 31, 2020 |
|
| December 31, 2019 |
| ||
Cash and cash equivalents |
| $ | 42,591 |
|
| $ | 45,753 |
|
Restricted deposits |
| $ | 57,137 |
|
| $ | 71,246 |
|
Unsecured revolving credit facility availability |
| $ | 1,984,051 |
|
| $ | 1,379,071 |
|
During the year ended December 31, 2017,2020, the Company generated proceeds from various transactions, which included the following:
Disposed of five consolidated rental properties and one land parcel, receiving net proceeds of approximately $384.6 million;
• | Disposed of six consolidated rental properties and two land parcels, receiving combined net proceeds of approximately $1.1 billion; |
Issued $400.0 million of ten-year 3.25% unsecured notes, receiving net proceeds of approximately $399.3 million before underwriting fees, hedge termination costs and other expenses;
• | Obtained $495.0 million in a 2.60% fixed rate mortgage loan pool maturing on May 1, 2030; and |
Issued $300.0 million of thirty-year 4.00% unsecured notes, receiving net proceeds of approximately $293.2 million before underwriting fees and other expenses; and
Issued approximately 0.9 million Common Shares related to share option exercises and ESPP purchases and received net proceeds of $35.3 million, which were contributed to the capital of the Operating Partnership in exchange for additional OP Units (on a one-for-one Common Share per OP Unit basis).
• | Issued Common Shares related to share option exercises and ESPP purchases and received net proceeds of $16.8 million, which were contributed to the capital of the Operating Partnership in exchange for additional OP Units (on a one-for-one Common Share per OP Unit basis). |
During the year ended December 31, 2017,2020, the above proceeds along with net cash flow from operations and borrowings from the Company’s revolving line of credit and commercial paper program were primarily utilized to:
Acquire four consolidated rental properties for approximately $466.4 million in cash;
• | Acquire one consolidated rental property for approximately $48.9 million in cash; |
Invest $276.4 million primarily in development projects;
• | Invest $230.3 million primarily in development projects; |
Repay $504.1 million of mortgage loans (inclusive of scheduled principal repayments) and incur prepayment penalties of approximately $12.3 million; and
• | Repay $168.3 million of mortgage loans (inclusive of scheduled principal repayments); and |
Repay $498.0 million of unsecured notes at maturity.
• | Repay $750.0 million of unsecured notes and incur prepayment penalties of approximately $25.8 million by discharging them pursuant to their indenture. |
44
Credit Facility and Commercial Paper Program
On November 3, 2016, theThe Company replaced its existinghas a $2.5 billion facility with a $2.0 billion unsecured revolving credit facility maturing January 10, 2022.November 1, 2024. The Company has the ability to increase available borrowings by an additional $750.0 million by adding additional bankslenders to the facility, or obtaining the agreement of existing bankslenders to increase their commitments.commitments or incurring one or more term loans. The interest rate on advances under the facility will generally be LIBOR plus a spread (currently 0.825%0.775%), or based on bids received from the lending group, and the Company pays an annual facility fee (currently 12.5 basis points)0.125%). Both the spread and the facility fee are dependent on the Company’s senior unsecured credit rating of the Company’s long-term debt.rating.
On February 2, 2015, the Company enteredThe unsecured revolving credit agreement contains provisions that establish a process for entering into an unsecured commercial paper note program inamendment to replace LIBOR under certain circumstances, such as the United States. anticipated phase-out of LIBOR by the end of 2021. At this time, it cannot be determined with certainty what interest rate(s) may succeed LIBOR, if any, and how any successor or alternative rates for LIBOR may affect borrowing costs or the availability of variable interest rate borrowings.
35
The Company may borrow up to a maximum of $500.0 million$1.0 billion under thisits commercial paper program subject to market conditions. The notes will be sold under customary terms in the United States commercial paper note market and will rank pari passu with all of the Company’s other unsecured senior indebtedness. As of February 16, 2018, there was a balance of $320.0 million outstanding onWhile the COVID-19 pandemic initially caused temporary disruptions in the commercial paper program.market in March 2020, the Company has maintained access to this market and expects to continue to be able to do so in the future.
AsThe Company limits its utilization of February 16, 2018, no amounts were outstanding and the amount available on the revolving credit facility was $1.67 billion (net of $6.6 million which was restricted/dedicatedin order to maintain liquidity to support letters of credit and net ofits $1.0 billion commercial paper program along with certain other obligations. The following table presents the $320.0 million in principal outstandingavailability on the commercial paper program). ThisCompany’s unsecured revolving credit facility may, among other potential uses, be used to fund property acquisitions, costs for certain properties under development and short-term liquidity requirements.as of February 12, 2021 (amounts in thousands):
|
| February 12, 2021 |
| |
Unsecured revolving credit facility commitment |
| $ | 2,500,000 |
|
Commercial paper balance outstanding |
|
| (470,000 | ) |
Unsecured revolving credit facility balance outstanding |
|
| — |
|
Other restricted amounts |
|
| (100,949 | ) |
Unsecured revolving credit facility availability |
| $ | 1,929,051 |
|
Dividend Policy
For the past several years, theThe Company adhered to a policy of paying its annual dividends/distributions based on 65% of the midpoint of the range of initial Normalized FFO guidance customarily provided at the beginning of each year as part of the Company’s fourth quarter earnings release. The Company’s 2017 regular annual dividend/distribution payout was $2.015 per share/unit and the Company paid four regular quarterly dividends/distributions of $0.50375 per share/unit in 2017.
Beginning in 2018, the Company will no longer determinedetermines its dividends/distributions as a fixed percentage of estimated Normalized FFO but will instead adopt a more conventional policy based on actual and projected financial conditions, the Company’s actual and projected liquidity and operating results, the Company’s projected cash needs for capital expenditures and other investment activities and such other factors as the Company’s Board of Trustees deems relevant. The Company currently expects to declaredeclared a dividend/distribution for the firsteach quarter in 2020 of 2018 of $0.54$0.6025 per share/unit, an annualized increase of 7.2%6.2% over the amount paid in 2017. This policy change is supported by the Company’s strong growth in property operations since the recent economic downturn and a significant reduction in its development activity resulting in a material increase in available cash flow.2019. All future dividends/distributions remain subject to the discretion of the Company’s Board of Trustees. The Company believes that its expected 2018 operating cash flow will be sufficient to cover capital expenditures and regular dividends/distributions.
Total dividends/distributions paid in January 20182021 amounted to $192.8$232.3 million (excluding distributions on Partially Owned Properties), which includedconsisted of certain distributions declared during the fourth quarter ended December 31, 2017.2020.
Long-Term Financing and Capital Needs
The Company expects to meet its long-term liquidity requirements, such as lump sum unsecured note and mortgage debt maturities, property acquisitions and financing of construction and development activities, through the issuance of secured and unsecured debt and equity securities including(including additional OP Units,Units), proceeds received from the disposition of certain properties and joint ventures, andalong with cash generated from operations after all distributions. In addition, theThe Company has a significant number of unencumbered properties available to secure additional mortgage borrowings in the event that the publicshould unsecured capital markets arebe unavailable or the cost of alternative sources of capital isbe too high. The fair value of and cash flow from these unencumbered properties are in excess of the requirements the Company must maintain in order to comply with covenants under its unsecured notes and line of credit and commercial paper program. credit. Of the $26.0$27.2 billion in investment in real estate on the Company’s balance sheet at December 31, 2017, $20.12020, $23.2 billion or 77.1%85.3% was unencumbered. However, there can be no assurances that these sources of capital will be available to the Company in the future on acceptable terms or otherwise.
EQR issues public equity from time to time and guarantees certain debt of the Operating Partnership.Partnership from time to time. EQR does not have any indebtedness as all debt is incurred by the Operating Partnership.
4536
The Company’s total debt summary and debt maturity schedules as of December 31, 20172020 are as follows:
Debt Summary as of December 31, 20172020
($ in thousands)
|
| Amounts (1) |
|
| % of Total |
|
| Weighted Average Rates (1) |
|
| Weighted Average Maturities (years) |
|
| Debt Balances |
|
| % of Total |
|
| Weighted Average Rates |
|
| Weighted Average Maturities (years) |
| ||||||||
Secured |
| $ | 3,618,722 |
|
|
| 40.4 | % |
|
| 4.33 | % |
|
| 5.6 |
|
| $ | 2,293,890 |
|
|
| 28.5 | % |
|
| 3.33 | % |
|
| 6.2 |
|
Unsecured |
|
| 5,338,569 |
|
|
| 59.6 | % |
|
| 4.17 | % |
|
| 10.6 |
|
|
| 5,750,366 |
|
|
| 71.5 | % |
|
| 3.91 | % |
|
| 10.3 |
|
Total |
| $ | 8,957,291 |
|
|
| 100.0 | % |
|
| 4.24 | % |
|
| 8.6 |
|
| $ | 8,044,256 |
|
|
| 100.0 | % |
|
| 3.76 | % |
|
| 9.0 |
|
Fixed Rate Debt: |
|
|
|
|
|
|
|
|
|
|
|
|
|
|
|
|
|
|
|
|
|
|
|
|
|
|
|
|
|
|
|
|
Secured – Conventional |
| $ | 2,982,344 |
|
|
| 33.3 | % |
|
| 4.90 | % |
|
| 4.0 |
|
| $ | 1,901,091 |
|
|
| 23.6 | % |
|
| 3.79 | % |
|
| 4.7 |
|
Unsecured – Public |
|
| 4,591,373 |
|
|
| 51.3 | % |
|
| 4.61 | % |
|
| 12.2 |
|
|
| 5,335,536 |
|
|
| 66.4 | % |
|
| 4.03 | % |
|
| 11.0 |
|
Fixed Rate Debt |
|
| 7,573,717 |
|
|
| 84.6 | % |
|
| 4.73 | % |
|
| 9.0 |
|
|
| 7,236,627 |
|
|
| 90.0 | % |
|
| 3.97 | % |
|
| 9.3 |
|
Floating Rate Debt: |
|
|
|
|
|
|
|
|
|
|
|
|
|
|
|
|
|
|
|
|
|
|
|
|
|
|
|
|
|
|
|
|
Secured – Conventional |
|
| 6,948 |
|
|
| 0.1 | % |
|
| 1.05 | % |
|
| 12.2 |
|
|
| 31,494 |
|
|
| 0.4 | % |
|
| 2.71 | % |
|
| 1.5 |
|
Secured – Tax Exempt |
|
| 629,430 |
|
|
| 7.0 | % |
|
| 1.56 | % |
|
| 12.2 |
|
|
| 361,305 |
|
|
| 4.5 | % |
|
| 1.00 | % |
|
| 15.0 |
|
Unsecured – Public (2) |
|
| 447,439 |
|
|
| 5.0 | % |
|
| 1.82 | % |
|
| 1.5 |
| ||||||||||||||||
Unsecured – Revolving Credit Facility |
|
| — |
|
|
| — |
|
|
| 2.00 | % |
|
| 3.9 |
|
|
| — |
|
|
| — |
|
|
| 1.47 | % |
|
| 3.8 |
|
Unsecured – Commercial Paper Program |
|
| 299,757 |
|
|
| 3.3 | % |
|
| 1.41 | % |
|
| — |
|
|
| 414,830 |
|
|
| 5.1 | % |
|
| 1.72 | % |
|
| — |
|
Floating Rate Debt |
|
| 1,383,574 |
|
|
| 15.4 | % |
|
| 1.62 | % |
|
| 6.3 |
|
|
| 807,629 |
|
|
| 10.0 | % |
|
| 1.34 | % |
|
| 7.0 |
|
Total |
| $ | 8,957,291 |
|
|
| 100.0 | % |
|
| 4.24 | % |
|
| 8.6 |
|
| $ | 8,044,256 |
|
|
| 100.0 | % |
|
| 3.76 | % |
|
| 9.0 |
|
|
|
|
|
Debt Maturity Schedule as of December 31, 20172020
($ in thousands)
Year |
| Fixed Rate (1) |
|
| Floating Rate (1) |
|
| Total |
|
| % of Total |
|
| Weighted Average Rates on Fixed Rate Debt (1) |
|
| Weighted Average Rates on Total Debt (1) |
|
| Fixed Rate |
|
| Floating Rate |
|
| Total |
|
| % of Total |
|
| Weighted Average Coupons on Fixed Rate Debt |
|
| Weighted Average Coupons on Total Debt |
| |||||||||||||||||||||||
2018 |
| $ | 49,734 |
|
| $ | 397,235 |
| (2) | $ | 446,969 |
|
|
| 4.9 | % |
|
| 5.55 | % |
|
| 2.17 | % | |||||||||||||||||||||||||||||||||||
2019 |
|
| 506,731 |
| (3) |
| 468,603 |
|
|
| 975,334 |
|
|
| 10.8 | % |
|
| 5.17 | % |
|
| 3.62 | % | |||||||||||||||||||||||||||||||||||
2020 |
|
| 1,678,592 |
| (4) |
| 400 |
|
|
| 1,678,992 |
|
|
| 18.5 | % |
|
| 5.49 | % |
|
| 5.49 | % | |||||||||||||||||||||||||||||||||||
2021 |
|
| 927,506 |
|
|
| 300 |
|
|
| 927,806 |
|
|
| 10.2 | % |
|
| 4.64 | % |
|
| 4.64 | % |
| $ | 35,665 |
|
| $ | 415,000 |
| (1) | $ | 450,665 |
|
|
| 5.5 | % |
|
| 4.41 | % |
|
| 0.64 | % | |||||||||||
2022 |
|
| 265,341 |
|
|
| 400 |
|
|
| 265,741 |
|
|
| 2.9 | % |
|
| 3.26 | % |
|
| 3.26 | % |
|
| 264,185 |
|
|
| 31,855 |
|
|
| 296,040 |
|
|
| 3.7 | % |
|
| 3.25 | % |
|
| 3.15 | % | |||||||||||
2023 |
|
| 1,326,800 |
|
|
| 4,400 |
|
|
| 1,331,200 |
|
|
| 14.7 | % |
|
| 3.74 | % |
|
| 3.73 | % |
|
| 1,325,588 |
|
|
| 3,500 |
|
|
| 1,329,088 |
|
|
| 16.4 | % |
|
| 3.74 | % |
|
| 3.73 | % | |||||||||||
2024 |
|
| 1,272 |
|
|
| 10,500 |
|
|
| 11,772 |
|
|
| 0.1 | % |
|
| 4.79 | % |
|
| 2.07 | % |
|
| — |
|
|
| 6,100 |
|
|
| 6,100 |
|
|
| 0.1 | % |
| N/A |
|
|
| 0.10 | % | ||||||||||||
2025 |
|
| 451,334 |
|
|
| 12,800 |
|
|
| 464,134 |
|
|
| 5.1 | % |
|
| 3.38 | % |
|
| 3.33 | % |
|
| 450,000 |
|
|
| 8,200 |
|
|
| 458,200 |
|
|
| 5.6 | % |
|
| 3.38 | % |
|
| 3.32 | % | |||||||||||
2026 |
|
| 593,424 |
|
|
| 14,000 |
|
|
| 607,424 |
|
|
| 6.7 | % |
|
| 3.59 | % |
|
| 3.54 | % |
|
| 592,025 |
|
|
| 9,000 |
|
|
| 601,025 |
|
|
| 7.4 | % |
|
| 3.58 | % |
|
| 3.53 | % | |||||||||||
2027 |
|
| 401,468 |
|
|
| 15,200 |
|
|
| 416,668 |
|
|
| 4.6 | % |
|
| 3.26 | % |
|
| 3.20 | % |
|
| 400,000 |
|
|
| 9,800 |
|
|
| 409,800 |
|
|
| 5.0 | % |
|
| 3.25 | % |
|
| 3.17 | % | |||||||||||
2028+ |
|
| 1,424,969 |
|
|
| 520,065 |
|
|
| 1,945,034 |
|
|
| 21.5 | % |
|
| 4.41 | % |
|
| 3.67 | % | |||||||||||||||||||||||||||||||||||
2028 |
|
| 900,000 |
|
|
| 42,380 |
|
|
| 942,380 |
|
|
| 11.6 | % |
|
| 3.79 | % |
|
| 3.62 | % | |||||||||||||||||||||||||||||||||||
2029 |
|
| 888,120 |
|
|
| 11,500 |
|
|
| 899,620 |
|
|
| 11.1 | % |
|
| 3.30 | % |
|
| 3.26 | % | |||||||||||||||||||||||||||||||||||
2030 |
|
| 1,095,000 |
|
|
| 12,600 |
|
|
| 1,107,600 |
|
|
| 13.6 | % |
|
| 2.55 | % |
|
| 2.52 | % | |||||||||||||||||||||||||||||||||||
2031+ |
|
| 1,350,850 |
|
|
| 275,535 |
|
|
| 1,626,385 |
|
|
| 20.0 | % |
|
| 4.39 | % |
|
| 3.67 | % | |||||||||||||||||||||||||||||||||||
Subtotal |
|
| 7,627,171 |
|
|
| 1,443,903 |
|
|
| 9,071,074 |
|
|
| 100.0 | % |
|
| 4.48 | % |
|
| 3.97 | % |
|
| 7,301,433 |
|
|
| 825,470 |
|
|
| 8,126,903 |
|
|
| 100.0 | % |
|
| 3.56 | % |
|
| 3.23 | % | |||||||||||
Deferred Financing Costs and Unamortized (Discount) |
|
| (53,454 | ) |
|
| (60,329 | ) |
|
| (113,783 | ) |
| N/A |
|
| N/A |
|
| N/A |
|
|
| (64,806 | ) |
|
| (17,841 | ) |
|
| (82,647 | ) |
| N/A |
|
| N/A |
|
| N/A |
| |||||||||||||||||
Total |
| $ | 7,573,717 |
|
| $ | 1,383,574 |
|
| $ | 8,957,291 |
|
|
| 100.0 | % |
|
| 4.48 | % |
|
| 3.97 | % |
| $ | 7,236,627 |
|
| $ | 807,629 |
|
| $ | 8,044,256 |
|
|
| 100.0 | % |
|
| 3.56 | % |
|
| 3.23 | % | |||||||||||
(1) |
|
|
|
|
|
|
|
46
See Note 89 in the Notes to Consolidated Financial Statements for additional discussion of the Company’s debt at December 31, 2017.2020.
The Company’s “Consolidated Debt-to-Total Market Capitalization Ratio” as of December 31, 20172020 is presented in the following table. The Company calculates the equity component of its market capitalization as the sum of (i) the total outstanding Common Shares and assumed conversion of all Units at the equivalent market value of the closing price of the Company’s Common Shares on the New York Stock Exchange and (ii) the liquidation value of all perpetual preferred shares outstanding.
37
Equity Residential
Capital Structure as of December 31, 20172020
(Amounts in thousands except for share/unit and per share amounts)
Secured Debt |
|
|
|
|
|
|
|
|
| $ | 3,618,722 |
|
|
| 40.4 | % |
|
|
|
|
|
|
|
|
|
|
|
|
| $ | 2,293,890 |
|
|
| 28.5 | % |
|
|
|
|
Unsecured Debt |
|
|
|
|
|
|
|
|
|
| 5,338,569 |
|
|
| 59.6 | % |
|
|
|
|
|
|
|
|
|
|
|
|
|
| 5,750,366 |
|
|
| 71.5 | % |
|
|
|
|
Total Debt |
|
|
|
|
|
|
|
|
|
| 8,957,291 |
|
|
| 100.0 | % |
|
| 26.9 | % |
|
|
|
|
|
|
|
|
|
| 8,044,256 |
|
|
| 100.0 | % |
|
| 26.0 | % |
Common Shares (includes Restricted Shares) |
|
| 368,018,082 |
|
|
| 96.4 | % |
|
|
|
|
|
|
|
|
|
|
|
|
|
| 372,302,000 |
|
|
| 96.4 | % |
|
|
|
|
|
|
|
|
|
|
|
|
Units (includes OP Units and Restricted Units) |
|
| 13,768,438 |
|
|
| 3.6 | % |
|
|
|
|
|
|
|
|
|
|
|
|
|
| 13,858,073 |
|
|
| 3.6 | % |
|
|
|
|
|
|
|
|
|
|
|
|
Total Shares and Units |
|
| 381,786,520 |
|
|
| 100.0 | % |
|
|
|
|
|
|
|
|
|
|
|
|
|
| 386,160,073 |
|
|
| 100.0 | % |
|
|
|
|
|
|
|
|
|
|
|
|
Common Share Price at December 31, 2017 |
| $ | 63.77 |
|
|
|
|
|
|
|
|
|
|
|
|
|
|
|
|
| ||||||||||||||||||||
Common Share Price at December 31, 2020 |
| $ | 59.28 |
|
|
|
|
|
|
|
|
|
|
|
|
|
|
|
|
| ||||||||||||||||||||
|
|
|
|
|
|
|
|
|
|
| 24,346,526 |
|
|
| 99.8 | % |
|
|
|
|
|
|
|
|
|
|
|
|
|
| 22,891,569 |
|
|
| 99.8 | % |
|
|
|
|
Perpetual Preferred Equity |
|
|
|
|
|
|
|
|
|
| 37,280 |
|
|
| 0.2 | % |
|
|
|
|
|
|
|
|
|
|
|
|
|
| 37,280 |
|
|
| 0.2 | % |
|
|
|
|
Total Equity |
|
|
|
|
|
|
|
|
|
| 24,383,806 |
|
|
| 100.0 | % |
|
| 73.1 | % |
|
|
|
|
|
|
|
|
|
| 22,928,849 |
|
|
| 100.0 | % |
|
| 74.0 | % |
Total Market Capitalization |
|
|
|
|
|
|
|
|
| $ | 33,341,097 |
|
|
|
|
|
|
| 100.0 | % |
|
|
|
|
|
|
|
|
| $ | 30,973,105 |
|
|
|
|
|
|
| 100.0 | % |
The Operating Partnership’s “Consolidated Debt-to-Total Market Capitalization Ratio” as of December 31, 20172020 is presented in the following table. The Operating Partnership calculates the equity component of its market capitalization as the sum of (i) the total outstanding Units at the equivalent market value of the closing price of the Company’s Common Shares on the New York Stock Exchange and (ii) the liquidation value of all perpetual preference units outstanding.
ERP Operating Limited Partnership
Capital Structure as of December 31, 20172020
(Amounts in thousands except for unit and per unit amounts)
Secured Debt |
|
|
|
|
|
| $ | 3,618,722 |
|
|
| 40.4 | % |
|
|
|
|
|
|
|
|
|
|
| $ | 2,293,890 |
|
|
| 28.5 | % |
|
|
|
|
Unsecured Debt |
|
|
|
|
|
|
| 5,338,569 |
|
|
| 59.6 | % |
|
|
|
|
|
|
|
|
|
|
|
| 5,750,366 |
|
|
| 71.5 | % |
|
|
|
|
Total Debt |
|
|
|
|
|
|
| 8,957,291 |
|
|
| 100.0 | % |
|
| 26.9 | % |
|
|
|
|
|
|
|
| 8,044,256 |
|
|
| 100.0 | % |
|
| 26.0 | % |
Total Outstanding Units |
|
| 381,786,520 |
|
|
|
|
|
|
|
|
|
|
|
|
|
|
|
| 386,160,073 |
|
|
|
|
|
|
|
|
|
|
|
|
|
|
|
Common Share Price at December 31, 2017 |
| $ | 63.77 |
|
|
|
|
|
|
|
|
|
|
|
|
|
| ||||||||||||||||||
Common Share Price at December 31, 2020 |
| $ | 59.28 |
|
|
|
|
|
|
|
|
|
|
|
|
|
|
| |||||||||||||||||
|
|
|
|
|
|
|
| 24,346,526 |
|
|
| 99.8 | % |
|
|
|
|
|
|
|
|
|
|
|
| 22,891,569 |
|
|
| 99.8 | % |
|
|
|
|
Perpetual Preference Units |
|
|
|
|
|
|
| 37,280 |
|
|
| 0.2 | % |
|
|
|
|
|
|
|
|
|
|
|
| 37,280 |
|
|
| 0.2 | % |
|
|
|
|
Total Equity |
|
|
|
|
|
|
| 24,383,806 |
|
|
| 100.0 | % |
|
| 73.1 | % |
|
|
|
|
|
|
|
| 22,928,849 |
|
|
| 100.0 | % |
|
| 74.0 | % |
Total Market Capitalization |
|
|
|
|
|
| $ | 33,341,097 |
|
|
|
|
|
|
| 100.0 | % |
|
|
|
|
|
|
| $ | 30,973,105 |
|
|
|
|
|
|
| 100.0 | % |
In September 2009, EQR announced the establishment of an At-The-Market (“ATM”) share offering program which would allow EQR to sell Common Shares from time to time into the existing trading market at current market prices as well as through negotiated transactions. Per the terms of ERPOP’s partnership agreement, EQR contributes the net proceeds from all equity offerings to the capital of ERPOP in exchange for additional OP Units (on a one-for-one Common Share per OP Unit basis). EQR may, but shall have no obligation to, sell Common Shares through the ATM share offering program in amounts and at times to be determined by EQR. Actual sales will depend on a variety of factors to be determined by EQR from time to time, including (among others) market conditions, the trading price of EQR’s Common Shares and determinations of the appropriate sources of funding for EQR. The program currently has a maturity of June 2019. EQR has the authority to issue 13.0 million shares but has not issued any shares under this program since September 2012. Through February 16, 2018, EQR has cumulatively issued approximately 16.7 million Common Shares at an average price of $48.53 per share for total consideration of approximately $809.9 million.
Depending on its analysis of market prices, economic conditions and other opportunities for the investment of available capital, EQR may repurchase its Common Shares pursuant to its existing share repurchase program authorized by the Board of Trustees. The Company may repurchase up to 13.0 million Common Shares under this program. No open market repurchases
47
have occurred since 2008. As of February 16, 2018, EQR has remaining authorization to repurchase up to 13.0 million of its shares.
EQR and ERPOP currently have an active universal shelf registration statement for the issuance of equity and debt securities that automatically became effective upon filing with the SEC onin June 28, 20162019 and expires onin June 28, 2019.2022. Per the terms of ERPOP’s partnership agreement, EQR contributes the net proceeds of all equity offerings to the capital of ERPOP in exchange for additional OP Units (on a one-for-one Common Share per OP Unit basis) or preference units (on a one-for-one preferred share per preference unit basis).
The Company has an At-The-Market (“ATM”) share offering program which allows EQR to sell Common Shares from time to time into the existing trading market at current market prices as well as through negotiated transactions. In June 2019, the Company extended the program maturity to June 2022. In connection with the extension, the Company may now also sell Common Shares under forward sale agreements. The use of a forward sale agreement would allow the Company to lock in a price on the sale of Common Shares at the time the agreement is executed, but defer receiving the proceeds from the sale until a later date. EQR has the authority to issue 13.0 million shares but has not issued any shares under this program since September 2012. EQR may, but shall have no obligation to, sell Common Shares through the ATM share offering program in amounts and at times to be determined by EQR. Actual sales will depend on a variety of factors, including (among others) market conditions, the trading price of EQR’s Common Shares and determinations of the appropriate sources of funding for EQR. Through February 12, 2021, EQR has cumulatively issued approximately 16.7 million Common Shares at an average price of $48.53 per share for total consideration of approximately $809.9 million.
The Company may repurchase up to 13.0 million Common Shares under its share repurchase program. No open market repurchases have occurred since 2008 and no repurchases of any kind have occurred since February 2014. EQR may, but shall have no obligation to, repurchase Common Shares through the share repurchase program in amounts and at times to be determined by EQR. Actual repurchases will depend on a variety of factors, including (among others) market conditions, the trading price of EQR’s
38
Common Shares and other opportunities for the investment of available capital. As of February 12, 2021, EQR has remaining authorization to repurchase up to 13.0 million of its shares.
ERPOP’s long-term senior debt ratings and short-term commercial paper ratings, as well as EQR’s long-term preferred equity ratings, whichhave been reaffirmed during the COVID-19 pandemic by all havethree rating agencies listed below and all continue to maintain a stable outlook, asoutlook. As of February 16, 201812, 2021, the ratings are as follows:
|
| Standard &
|
|
|
| Fitch |
|
| A- |
| A3 |
| A |
|
| A-2 |
| P-2 |
| F-1 |
|
| BBB |
| Baa1 |
| BBB+ |
|
|
See Note 18 in the Notes to Consolidated Financial Statements for discussion of the events, if any, which occurred subsequent to December 31, 2017.2020.
Debt Covenants
The Company’s unsecured debt includes certain financial and operating covenants including, among other things, maintenance of certain financial ratios. These provisions are contained in the indentures applicable to each note payable or the credit agreement for our line of credit. The Company was in compliance with its unsecured debt covenants for all periods presented. The following table presents the Company’s selected unsecured public debt covenants as of December 31, 2020 and 2019:
|
| December 31, 2020 |
|
| December 31, 2019 |
| ||
Debt to Adjusted Total Assets (not to exceed 60%) |
| 30.5% |
|
| 33.8% |
| ||
Secured Debt to Adjusted Total Assets (not to exceed 40%) |
| 9.6% |
|
| 8.2% |
| ||
Consolidated Income Available for Debt Service to Maximum Annual Service Charges (must be at least 1.5 to 1) |
|
| 5.42 |
|
|
| 5.07 |
|
Total Unencumbered Assets to Unsecured Debt (must be at least 125%) |
| 457.1% |
|
| 386.1% |
| ||
Note: These selected covenants represent the most restrictive financial covenants relating to ERPOP’s outstanding public debt securities and are defined in the indenture relating to such securities. The Company maintains substantial additional borrowing capacity and, as reflected by the above selected covenant information, believes it could currently incur substantial additional debt before it would breach any of its debt covenants.
Capitalization of Fixed Assets and Improvements to Real Estate
Our policy with respect to capital expenditures is generally to capitalize expenditures that improve the value of the property or extend the useful life of the component asset of the property. We track improvements to real estate in three major categories and several subcategories:
| ▪ | Replacements (inside the apartment unit). These include: |
flooring such as carpets, hardwood, vinyl or tile;
• | flooring such as carpets, hardwood, vinyl or tile; |
appliances;
• | appliances; |
mechanical equipment such as individual furnace/air units, hot water heaters, etc;
• | mechanical equipment such as individual furnace/air units, hot water heaters, smoke/carbon monoxide/water alarms, etc.; |
furniture and fixtures such as kitchen/bath cabinets, light fixtures, ceiling fans, sinks, tubs, toilets, mirrors, countertops, etc; and
• | furniture and fixtures such as kitchen/bath cabinets, light fixtures, ceiling fans, sinks, tubs, toilets, mirrors, countertops, etc.; and |
blinds.
• | blinds and window coverings. |
All replacements are depreciated over a five to ten-year estimated useful life. We expense as incurred all make-ready maintenance and turnover costs such as cleaning, interior painting of individual apartment units and the repair of any replacement item noted above.
| ▪ | Building improvements (outside the apartment unit). These include: |
• | roof replacement and major repairs; |
39
roof replacement and major repairs;
• | paving or major resurfacing of parking lots, curbs and sidewalks; |
paving or major resurfacing of parking lots, curbs and sidewalks;
• | amenities and common areas such as pools, exterior sports and playground equipment, lobbies, clubhouses, laundry rooms, alarm and security systems and offices; |
amenities and common areas such as pools, exterior sports and playground equipment, lobbies, clubhouses, laundry rooms, alarm and security systems and offices;
• | major building mechanical equipment systems; |
major building mechanical equipment systems;
• | interior and exterior structural repair and exterior painting and siding; |
interior and exterior structural repair and exterior painting and siding;
• | major landscaping and grounds improvement; and |
major landscaping and grounds improvement; and
vehicles and office and maintenance equipment.
• | vehicles and office and maintenance equipment. |
All building improvements are depreciated over a five to fifteen-year estimated useful life. We capitalize building improvements and upgrades only if the item: (i) exceeds $2,500 (selected projects must exceed $10,000)may be restricted by other thresholds); (ii) extends the useful life of the asset; and (iii) improves the value of the asset.
48
The third major category is renovations, which primarily consists of expenditures for kitchens and baths designed to reposition the apartment units/properties for higher rental levels in their respective markets. All renovation expenditures are depreciated over a ten-year estimated useful life.
For the year ended December 31, 2017,2020, our actual capital expenditures to real estate included the following (amounts in thousands except for apartment unit and per apartment unit amounts):
Capital Expenditures to Real Estate
For the Year Ended December 31, 20172020
|
| Same Stores Properties (5) |
|
| Non-Same Store Properties/Other (6) |
|
| Total |
|
| Same Store Avg. Per Apartment Unit |
|
| Same Store Properties (4) |
|
| Non-Same Store Properties/Other (5) |
|
| Total |
|
| Same Store Avg. Per Apartment Unit |
| ||||||||
Total Apartment Units |
|
| 70,117 |
|
|
| 7,549 |
|
|
| 77,666 |
|
|
|
|
|
|
| 73,585 |
|
|
| 4,304 |
|
|
| 77,889 |
|
|
|
|
|
|
|
|
|
|
|
|
|
|
|
|
|
|
|
|
|
|
|
|
|
|
|
|
|
|
|
|
|
|
|
|
|
|
Building Improvements |
| $ | 114,162 |
|
| $ | 3,966 |
|
| $ | 118,128 |
|
| $ | 1,628 |
|
| $ | 78,969 |
|
| $ | 2,905 |
|
| $ | 81,874 |
|
| $ | 1,073 |
|
Renovation Expenditures |
|
| 44,418 |
|
|
| 888 |
|
|
| 45,306 |
|
|
| 634 |
|
|
| 22,060 |
|
|
| 6 |
|
|
| 22,066 |
|
|
| 300 |
|
Replacements |
|
| 38,560 |
|
|
| 613 |
|
|
| 39,173 |
|
|
| 550 |
|
|
| 31,252 |
|
|
| 787 |
|
|
| 32,039 |
|
|
| 425 |
|
Total Capital Expenditures |
| $ | 197,140 |
|
| $ | 5,467 |
|
| $ | 202,607 |
|
| $ | 2,812 |
| ||||||||||||||||
Total Capital Expenditures to Real Estate |
| $ | 132,281 |
|
| $ | 3,698 |
|
| $ | 135,979 |
|
| $ | 1,798 |
| ||||||||||||||||
(1) |
|
| Building Improvements – Includes roof replacement, paving, building mechanical equipment systems, exterior siding and painting, major landscaping, furniture, fixtures and equipment for amenities and common areas, vehicles and office and maintenance equipment. |
| Renovation Expenditures – Apartment unit renovation costs (primarily kitchens and baths) designed to reposition these units for higher rental levels in their respective markets. Amounts for |
| Replacements – Includes appliances, mechanical equipment, fixtures and flooring (including hardwood and carpeting). |
| Same Store Properties – Primarily includes all properties acquired or completed that are stabilized prior to January 1, |
| Non-Same Store Properties/Other – Primarily includes all properties acquired during |
For the year ended December 31, 2016,2019, our actual capital expenditures to real estate included the following (amounts in thousands except for apartment unit and per apartment unit amounts):
Capital Expenditures to Real Estate
For the Year Ended December 31, 20162019
|
| Total Apartment Units (1) |
|
| Replacements (2) |
|
| Avg. Per Apartment Unit |
|
| Building Improvements (3) |
|
| Avg. Per Apartment Unit |
|
| Total |
|
| Avg. Per Apartment Unit |
| |||||||
Same Store Properties (4) |
|
| 69,879 |
|
| $ | 75,298 |
|
| $ | 1,077 |
|
| $ | 80,890 |
|
| $ | 1,158 |
|
| $ | 156,188 |
|
| $ | 2,235 |
|
Non-Same Store Properties (5) |
|
| 6,634 |
|
|
| 4,494 |
|
|
| 851 |
|
|
| 7,685 |
|
|
| 1,456 |
|
|
| 12,179 |
|
|
| 2,307 |
|
Other (6) |
|
| — |
|
|
| 2,744 |
|
|
|
|
|
|
| 1,066 |
|
|
|
|
|
|
| 3,810 |
|
|
|
|
|
Total |
|
| 76,513 |
|
| $ | 82,536 |
|
|
|
|
|
| $ | 89,641 |
|
|
|
|
|
| $ | 172,177 |
|
|
|
|
|
|
| Same Stores Properties (4) |
|
| Non-Same Store Properties/Other (5) |
|
| Total |
|
| Same Store Avg. Per Apartment Unit |
| ||||
Total Apartment Units |
|
| 71,830 |
|
|
| 8,132 |
|
|
| 79,962 |
|
|
|
|
|
|
|
|
|
|
|
|
|
|
|
|
|
|
|
|
|
|
Building Improvements (1) |
| $ | 91,256 |
|
| $ | 7,469 |
|
| $ | 98,725 |
|
| $ | 1,270 |
|
Renovation Expenditures (2) |
|
| 37,466 |
|
|
| 2,607 |
|
|
| 40,073 |
|
|
| 522 |
|
Replacements (3) |
|
| 37,063 |
|
|
| 2,562 |
|
|
| 39,625 |
|
|
| 516 |
|
Total Capital Expenditures to Real Estate |
| $ | 165,785 |
|
| $ | 12,638 |
|
| $ | 178,423 |
|
| $ | 2,308 |
|
40
(1) |
|
(2) |
|
(3) |
|
49
(4) | Same Store Properties – Primarily includes all properties acquired or completed |
(5) | Non-Same Store |
|
|
The COVID-19 pandemic has led us to temporarily slow our capital expenditures, including our renovation activities, to those deemed essential. Governmental movement restrictions, social distancing requirements, and in some cases, difficulty in procuring materials and labor make continuing these activities more difficult.
The Company estimates that during 20182021 it will spend approximately $2,900 $1,950 per same store apartment unit or $210.0$150.0 million of total capital expenditures to real estate. During 2018, the Company expects to spendestate for same store properties. Included in these total expected expenditures are approximately $60.0$25.0 million for apartment unit renovation expenditures on approximately 4,5001,250 same store apartment units at an average cost of approximately $13,300$20,000 per apartment unit renovated. The anticipated total capital expenditures to real estate amounts represent approximately the same percentage offor same store revenues, but an increase in the costproperties represent a higher absolute and per unit dollar amount as compared to 2020 but a lower absolute and inper unit dollar amount as compared to 2019, as the absolute dollar amounts over 2017. The Company plansanticipates slowly returning its capital expenditure activity to continue the elevated capital expenditures for investment in customer-facing building improvements (leasing offices, fitness centers, common areas, etc.) to enhance the quality of our properties and to protect our competitive position given the new luxury supply opening in many of our markets. We also expect to maintain our elevated spending on sustainability projects and renovation expenditures during 2018. The above assumptions are based on current expectations and are forward-looking.more normalized pre-COVID-19 levels.
During the year ended December 31, 2017,2020, the Company’s total non-real estate capital additions, such as computer software, computer equipment, and furniture and fixtures and leasehold improvements to the Company’s property management offices and its corporate offices, were approximately $1.5$20.1 million. The Company expects to fund approximately $6.6$2.1 million in total non-real estate capital additions in 2018.2021. These anticipated fundings represent an increase over 2017, which isare significantly lower than in 2020 primarily driven by anticipated hardware and software upgradesdue to various existing systemscorporate office renovations completed during 2018. The above assumption is based on current expectations and is forward-looking.2020.
Capital expenditures to real estate and non-real estate capital additions are generally funded from net cash provided by operating activities and from investment cash flow.
Derivative Instruments
In the normal course of business, the Company is exposed to the effect of interest rate changes. The Company seeksmay seek to manage these risks by following established risk management policies and procedures including the use of derivatives to hedge interest rate risk on debt instruments. The Company may also use derivatives to manage commodity prices in the daily operations of the business.
The Company has a policy of only entering into derivative contracts with major financial institutions based upon their credit ratings and other factors. When viewed in conjunction with the underlying and offsetting exposure that the derivatives are designed to hedge, the Company has not sustained a material loss from these instruments nor does it anticipate any material adverse effect on its net income or financial position in the future from the use of derivatives it currently has in place.
See Note 910 in the Notes to Consolidated Financial Statements for additional discussion of derivative instruments at December 31, 2017.2020.
50
The definition of certain terms described above or below are as follows:
• | Acquisition Cap Rate – NOI that the Company anticipates receiving in the next 12 months (or the year two or three stabilized NOI for properties that are in lease-up at acquisition) less an estimate of property management costs/management fees allocated to the project (generally ranging from 2.0% to 4.0% of revenues depending on the size and income streams of the asset) and less an estimate for in-the-unit replacement capital expenditures (generally ranging from $100-$450 per apartment unit depending on the age and condition of the asset) divided by the gross purchase price of the asset. The weighted average Acquisition Cap Rate for acquired properties is weighted based on the projected NOI streams and the relative purchase price for each respective property. |
• | Average Rental Rate– Total Residential rental revenues reflected on a straight-line basis in accordance with GAAP divided by the weighted average occupied apartment units for the reporting period presented. |
• | Blended Rate – The weighted average of New Lease Change and Renewal Rate Achieved. |
41
• | Development Yield – NOI that the Company anticipates receiving in the next 12 months following stabilization less an estimate of property management costs/management fees allocated to the project (generally ranging from 2.0% to 4.0% of revenues depending on the size and income streams of the asset) and less an estimate for in-the-unit replacement capital expenditures (generally ranging from $50-$150 per apartment unit depending on the type of asset) divided by the Total Budgeted Capital Cost of the asset. The weighted average Development Yield for development properties is weighted based on the projected NOI streams and the relative Total Budgeted Capital Cost for each respective property. |
Disposition Yield – NOI that the Company anticipates giving up in the next 12 months less an estimate of property management costs/management fees allocated to the project (generally ranging from 2.0% to 4.0% of revenues depending on the size and income streams of the asset) and less an estimate for in-the-unit replacement capital expenditures (generally ranging from $100-$450 per apartment unit depending on the age and condition of the asset) divided by the gross sale price of the asset. The weighted average Disposition Yield for sold properties is weighted based on the projected NOI streams and the relative sales price for each respective property.
• | Disposition Yield – NOI that the Company anticipates giving up in the next 12 months less an estimate of property management costs/management fees allocated to the project (generally ranging from 2.0% to 4.0% of revenues depending on the size and income streams of the asset) and less an estimate for in-the-unit replacement capital expenditures (generally ranging from $100-$450 per apartment unit depending on the age and condition of the asset) divided by the gross sales price of the asset. The weighted average Disposition Yield for sold properties is weighted based on the projected NOI streams and the relative sales price for each respective property. |
• | Leasing Concessions – Reflects upfront discounts on both new move-in and renewal leases on a straight-line basis. |
| • | New Lease Change – The net effective change in rent (inclusive of Leasing Concessions) for a lease with a new or transferring resident compared to the rent for the prior lease of the identical apartment unit, regardless of lease term. |
• | Non-Residential – Consists of revenues and expenses from retail and public parking garage operations. |
• | Percentage of Residents Renewing – Leases renewed expressed as a percentage of total renewal offers extended during the reporting period. |
• | Physical Occupancy – The weighted average occupied apartment units for the reporting period divided by the average of total apartment units available for rent for the reporting period. |
• | Renewal Rate Achieved – The net effective change in rent (inclusive of Leasing Concessions) for a new lease on an apartment unit where the lease has been renewed as compared to the rent for the prior lease of the identical apartment unit, regardless of lease term. |
• | Residential – Consists of multifamily apartment revenues and expenses. |
• | Same Store Residential Revenues – Revenues from our same store properties presented on a GAAP basis which reflects the impact of Leasing Concessions on a straight-line basis. |
• | % of Stabilized Budgeted NOI – Represents original budgeted 2021 NOI for stabilized properties and projected annual NOI at stabilization (defined as having achieved 90% occupancy for three consecutive months) for properties that are in lease-up. |
• | Traffic – Consists of an expression of interest in an apartment by completing an in-person tour, self-guided tour or virtual tour that may result in an application to lease. |
• | Turnover– Total Residential move-outs (including inter-property and intra-property transfers) divided by total Residential apartment units. |
• | Unlevered Internal Rate of Return (“IRR”) – The Unlevered IRR on sold properties is the compound annual rate of return calculated by the Company based on the timing and amount of: (i) the gross purchase price of the property plus any direct acquisition costs incurred by the Company; (ii) total revenues earned during the Company’s ownership period; (iii) total direct property operating expenses (including real estate taxes and insurance) incurred during the Company’s ownership period; (iv) capital expenditures incurred during the Company’s ownership period; and (v) the gross sales price of the property net of selling costs. |
• | Weighted Average Coupons – Contractual interest rate for each debt instrument weighted by principal balances as of December 31, 2020. In case of debt for which fair value hedges are in place, the rate payable under the corresponding derivatives is used in lieu of the contractual interest rate. |
• | Weighted Average Rates – Interest expense for each debt instrument for the year ended December 31, 2020 weighted by its average principal balance for the same period. Interest expense includes amortization of premiums, discounts and other comprehensive income on debt and related derivative instruments. In case of debt for which derivatives are in place, the income or expense recognized under the corresponding derivatives is included in the total interest expense for the period. |
Off-Balance Sheet Arrangements and Contractual Obligations
The Company has various unconsolidated interests in certain joint ventures. The Company does not believe that these unconsolidated investments have a materially different impact on its liquidity, cash flows, capital resources, credit or market risk than
42
its consolidated operating and/or other activities. See also Notes 2 andNote 6 in the Notes to Consolidated Financial Statements for additional discussion regarding the Company’s investments in partially owned entities. See also Note 16 in the Notes to Consolidated Financial Statements for discussion regarding the Company’s development projects.
The following table summarizes the Company’s contractual obligations for the next five years and thereafter as of December 31, 2017:2020:
Payments Due by Year (in thousands) | Payments Due by Year (in thousands) |
| Payments Due by Year (in thousands) |
| ||||||||||||||||||||||||||||||||||||||||||||||||||||||||||||
Contractual Obligations |
| 2018 |
|
| 2019 |
|
| 2020 |
|
| 2021 |
|
| 2022 |
|
| Thereafter |
|
| Unamortized Cost/Discounts |
|
| Total |
|
| 2021 |
|
| 2022 |
|
| 2023 |
|
| 2024 |
|
| 2025 |
|
| Thereafter |
|
| Unamortized Cost/Discounts |
|
| Total |
| ||||||||||||||||
Debt: |
|
|
|
|
|
|
|
|
|
|
|
|
|
|
|
|
|
|
|
|
|
|
|
|
|
|
|
|
|
|
|
|
|
|
|
|
|
|
|
|
|
|
|
|
|
|
|
|
|
|
|
|
|
|
|
|
|
|
|
|
|
|
|
|
Principal |
| $ | 446,969 |
|
| $ | 975,334 |
|
| $ | 1,678,992 |
|
| $ | 927,806 |
|
| $ | 265,741 |
|
| $ | 4,776,232 |
|
| $ | (113,783 | ) |
| $ | 8,957,291 |
|
| $ | 450,665 |
|
| $ | 296,040 |
|
| $ | 1,329,088 |
|
| $ | 6,100 |
|
| $ | 458,200 |
|
| $ | 5,586,810 |
|
| $ | (82,647 | ) |
| $ | 8,044,256 |
|
Interest |
|
| 351,717 |
|
|
| 320,525 |
|
|
| 251,656 |
|
|
| 214,538 |
|
|
| 175,055 |
|
|
| 1,677,696 |
|
|
| — |
|
|
| 2,991,187 |
|
|
| 261,125 |
|
|
| 256,206 |
|
|
| 233,804 |
|
|
| 200,591 |
|
|
| 191,694 |
|
|
| 1,491,050 |
|
|
| — |
|
|
| 2,634,470 |
|
Operating Leases: |
|
|
|
|
|
|
|
|
|
|
|
|
|
|
|
|
|
|
|
|
|
|
|
|
|
|
|
|
|
|
|
| ||||||||||||||||||||||||||||||||
Minimum Rent Payments (c) |
|
| 16,506 |
|
|
| 16,366 |
|
|
| 15,963 |
|
|
| 15,743 |
|
|
| 13,406 |
|
|
| 878,935 |
|
|
| — |
|
|
| 956,919 |
| ||||||||||||||||||||||||||||||||
Other Long-Term Liabilities: |
|
|
|
|
|
|
|
|
|
|
|
|
|
|
|
|
|
|
|
|
|
|
|
|
|
|
|
|
|
|
|
| ||||||||||||||||||||||||||||||||
Deferred Compensation (d) |
|
| 1,390 |
|
|
| 1,135 |
|
|
| 1,086 |
|
|
| 1,086 |
|
|
| 1,086 |
|
|
| 4,016 |
|
|
| — |
|
|
| 9,799 |
| ||||||||||||||||||||||||||||||||
Finance Leases (3): |
|
|
|
|
|
|
|
|
|
|
|
|
|
|
|
|
|
|
|
|
|
|
|
|
|
|
|
|
|
|
|
| ||||||||||||||||||||||||||||||||
Minimum Rent Payments |
|
| 578 |
|
|
| 590 |
|
|
| 601 |
|
|
| 614 |
|
|
| 626 |
|
|
| 33,224 |
|
|
| — |
|
|
| 36,233 |
| ||||||||||||||||||||||||||||||||
Operating Leases (3): |
|
|
|
|
|
|
|
|
|
|
|
|
|
|
|
|
|
|
|
|
|
|
|
|
|
|
|
|
|
|
|
| ||||||||||||||||||||||||||||||||
Minimum Rent Payments |
|
| 17,160 |
|
|
| 16,906 |
|
|
| 16,997 |
|
|
| 17,329 |
|
|
| 17,375 |
|
|
| 954,108 |
|
|
| — |
|
|
| 1,039,875 |
| ||||||||||||||||||||||||||||||||
Other Long-Term Liabilities (3): |
|
|
|
|
|
|
|
|
|
|
|
|
|
|
|
|
|
|
|
|
|
|
|
|
|
|
|
|
|
|
|
| ||||||||||||||||||||||||||||||||
Deferred Compensation |
|
| 769 |
|
|
| 1,130 |
|
|
| 1,005 |
|
|
| 723 |
|
|
| 723 |
|
|
| 3,976 |
|
|
| — |
|
|
| 8,326 |
| ||||||||||||||||||||||||||||||||
Total |
| $ | 816,582 |
|
| $ | 1,313,360 |
|
| $ | 1,947,697 |
|
| $ | 1,159,173 |
|
| $ | 455,288 |
|
| $ | 7,336,879 |
|
| $ | (113,783 | ) |
| $ | 12,915,196 |
|
| $ | 730,297 |
|
| $ | 570,872 |
|
| $ | 1,581,495 |
|
| $ | 225,357 |
|
| $ | 668,618 |
|
| $ | 8,069,168 |
|
| $ | (82,647 | ) |
| $ | 11,763,160 |
|
| Amounts include aggregate principal payments only. |
| Amounts include interest expected to be incurred on the Company’s secured and unsecured debt based on obligations outstanding at December 31, |
|
|
|
|
51
Critical Accounting Policies and Estimates
The preparation of financial statements in conformity with accounting principles generally accepted in the United States requires management to use judgment in the application of accounting policies, including making estimates and assumptions. If our judgment or interpretation of the facts and circumstances relating to various transactions had been different or different assumptions were made, it is possible that different accounting policies would have been applied, resulting in different financial results or different presentation of our financial statements.
The Company’s significant accounting policies are described in Note 2 in the Notes to Consolidated Financial Statements. These policies were followed in preparing the consolidated financial statements at and for the year ended December 31, 2017 and are materially consistent with the year ended December 31, 2016.2020.
The Company has identified fivethe significant accounting policies below as critical accounting policies. These critical accounting policies are those that have the most impact on the reporting of our financial condition and those requiring significant judgments and estimates. With respect to these critical accounting policies, management believes that the application of judgments and estimates is consistently applied and produces financial information that fairly presents the results of operations for all periods presented.
Impairment of Long-Lived Assets
The five critical accounting policies are:Company periodically evaluates its long-lived assets, including its investment in real estate, for indicators of impairment. The judgments regarding the existence of impairment indicators are based on factors such as operational performance, market conditions, legal, regulatory and environmental concerns, the Company’s intent and ability to hold the related asset, as well as any significant cost overruns on development properties. Future events could occur which would cause the Company to conclude that impairment indicators exist and an impairment loss is warranted. Assessing impairment can be complex and involves a high degree of subjectivity in determining if indicators are present and in estimating the future undiscounted cash flows or the fair value of an asset. In particular, these estimates are sensitive to significant assumptions, including the estimation of future rental revenues, operating expenses, discount and capitalization rates and our intent and ability to hold the related asset, all of which could be affected by our expectations about future market or economic conditions. These estimates can have a significant impact on the undiscounted cash flows or estimated fair value of an asset.
Acquisition of Investment Properties
The Company allocates the purchase price of properties that meet the definition of an asset acquisition to net tangible and identified intangible assets acquired based on their relative fair values. In making estimates of relative fair values for purposes of allocating purchase price, the Company utilizes a number of sources, including independent appraisals that may be obtained in
43
connection with the acquisition or financing of the respective property, our own analysis of recently acquired and existing comparable properties in our portfolio and other market data. The Company also considers information obtained about each property as a result of its pre-acquisition due diligence, marketing and leasing activities in estimating the relative fair value of the tangible and intangible assets acquired.
Impairment of Long-Lived Assets
The Company periodically evaluates its long-lived assets, including its investments in real estate, for indicators of impairment. The judgments regarding the existence of impairment indicators are based on factors such as operational performance, market conditions and legal and environmental concerns, as well as the Company’s ability to hold and its intent with regard to each asset. Future events could occur which would cause the Company to conclude that impairment indicators exist and an impairment loss is warranted.
Depreciation of Investment in Real Estate
The Company depreciates the building component of its investment in real estate over a 30-year estimated useful life, building improvements over a 5-year to 15-year estimated useful life, both the furniture, fixtures and equipment and replacement components over a 5-year to 10-year estimated useful life and the renovations component over a 10-year estimated useful life, all of which are judgmental determinations.
Cost Capitalization
See the Capitalization of Fixed Assets and Improvements to Real Estate section for a discussion of the Company’s policy with respect to capitalization vs. expensing of fixed asset/repair and maintenance costs. In addition, the Company capitalizes an allocation of the payroll and associated costs of employees directly responsible for and who spend their time on the execution and supervision of major capital and/or renovation projects. These costs are reflected on the balance sheets as increases to depreciable property.
For all development projects, the Company uses its professional judgment in determining whether such costs meet the criteria for capitalization or must be expensed as incurred. The Company capitalizes interest, real estate taxes and insurance and payroll and associated costs for those individuals directly responsible for and who spend their time on development activities, with capitalization ceasing no later than 90 days following issuance of the certificate of occupancy. These costs are reflected on the balance sheets as construction-in-progress for each specific property. The Company expenses as incurred all payroll costs of on-site employees working directly at our properties, except as noted above on our development properties prior to certificate of occupancy issuance and on specific major renovations at selected properties when additional incremental employees are hired.
52
During the years ended December 31, 2017, 2016 and 2015, the Company capitalized $14.7 million, $18.7 million and $22.3 million, respectively, of payroll and associated costs of employees directly responsible for and who spend their time on the execution and supervision of development activities as well as major capital and/or renovation projects.
Fair Value of Financial Instruments, Including Derivative Instruments
The valuation of financial instruments requires the Company to make estimates and judgments that affect the fair value of the instruments. The Company, where possible, bases the fair values of its financial instruments, including its derivative instruments, on listed market prices and third party quotes. Where these are not available, the Company bases its estimates on current instruments with similar terms and maturities or on other factors relevant to the financial instruments.
Funds From Operations and Normalized Funds From Operations
The following is the Company’s and the Operating Partnership’s reconciliation of net income to FFO available to Common Shares and Units / Units and Normalized FFO available to Common Shares and Units / Units for each of the fivethree years ended December 31, 2017:2020:
Funds From Operations and Normalized Funds From Operations
(Amounts in thousands)
|
| Year Ended December 31, |
|
| Year Ended December 31, |
| ||||||||||||||||||||||||||
|
| 2017 |
|
| 2016 |
|
| 2015 |
|
| 2014 |
|
| 2013 |
|
| 2020 |
|
| 2019 |
|
| 2018 |
| ||||||||
Net income |
| $ | 628,381 |
|
| $ | 4,480,104 |
|
| $ | 908,018 |
|
| $ | 658,683 |
|
| $ | 1,905,353 |
|
| $ | 962,501 |
|
| $ | 1,009,708 |
|
| $ | 685,192 |
|
Net (income) loss attributable to Noncontrolling Interests – Partially Owned Properties |
|
| (2,323 | ) |
|
| (16,430 | ) |
|
| (3,657 | ) |
|
| (2,544 | ) |
|
| 538 |
|
|
| (14,855 | ) |
|
| (3,297 | ) |
|
| (2,718 | ) |
Preferred distributions |
|
| (3,091 | ) |
|
| (3,091 | ) |
|
| (3,357 | ) |
|
| (4,145 | ) |
|
| (4,145 | ) | ||||||||||||
Premium on redemption of Preferred Shares/Preference Units |
|
| — |
|
|
| — |
|
|
| (3,486 | ) |
|
| — |
|
|
| — |
| ||||||||||||
Preferred/preference distributions |
|
| (3,090 | ) |
|
| (3,090 | ) |
|
| (3,090 | ) | ||||||||||||||||||||
Net income available to Common Shares and Units / Units |
|
| 622,967 |
|
|
| 4,460,583 |
|
|
| 897,518 |
|
|
| 651,994 |
|
|
| 1,901,746 |
|
|
| 944,556 |
|
|
| 1,003,321 |
|
|
| 679,384 |
|
Adjustments: |
|
|
|
|
|
|
|
|
|
|
|
|
|
|
|
|
|
|
|
|
|
|
|
|
|
|
|
|
|
|
|
|
Depreciation |
|
| 743,749 |
|
|
| 705,649 |
|
|
| 765,895 |
|
|
| 758,861 |
|
|
| 978,973 |
|
|
| 820,832 |
|
|
| 831,083 |
|
|
| 785,725 |
|
Depreciation – Non-real estate additions |
|
| (5,023 | ) |
|
| (5,224 | ) |
|
| (4,981 | ) |
|
| (4,643 | ) |
|
| (4,806 | ) |
|
| (4,564 | ) |
|
| (5,585 | ) |
|
| (4,561 | ) |
Depreciation – Partially Owned Properties |
|
| (4,526 | ) |
|
| (3,805 | ) |
|
| (4,332 | ) |
|
| (4,285 | ) |
|
| (6,499 | ) |
|
| (3,345 | ) |
|
| (3,599 | ) |
|
| (3,740 | ) |
Depreciation – Unconsolidated Properties |
|
| 4,577 |
|
|
| 4,745 |
|
|
| 4,920 |
|
|
| 6,754 |
|
|
| 3,661 |
|
|
| 2,454 |
|
|
| 2,997 |
|
|
| 4,451 |
|
Net (gain) loss on sales of unconsolidated entities – operating assets |
|
| (73 | ) |
|
| (8,841 | ) |
|
| (100 | ) |
|
| (4,902 | ) |
|
| (7 | ) | ||||||||||||
Net (gain) loss on sales of unconsolidated entities - operating assets |
|
| (1,636 | ) |
|
| (69,522 | ) |
|
| — |
| ||||||||||||||||||||
Net (gain) loss on sales of real estate properties |
|
| (157,057 | ) |
|
| (4,044,055 | ) |
|
| (335,134 | ) |
|
| (212,685 | ) |
|
| — |
|
|
| (531,807 | ) |
|
| (447,637 | ) |
|
| (256,810 | ) |
Noncontrolling Interests share of gain (loss) on sales of real estate properties |
|
| 290 |
|
|
| 14,521 |
|
|
| — |
|
|
| — |
|
|
| — |
|
|
| 11,655 |
|
|
| — |
|
|
| (284 | ) |
Discontinued operations: |
|
|
|
|
|
|
|
|
|
|
|
|
|
|
|
|
|
|
|
| ||||||||||||
Depreciation |
|
| — |
|
|
| — |
|
|
| — |
|
|
| — |
|
|
| 34,380 |
| ||||||||||||
Net (gain) loss on sales of discontinued operations |
|
| — |
|
|
| (43 | ) |
|
| — |
|
|
| (179 | ) |
|
| (2,036,505 | ) | ||||||||||||
Net incremental gain (loss) on sales of condominium units |
|
| — |
|
|
| — |
|
|
| — |
|
|
| — |
|
|
| 8 |
| ||||||||||||
Gain (loss) on sale of Equity Corporate Housing (ECH) |
|
| — |
|
|
| — |
|
|
| — |
|
|
| — |
|
|
| 1,470 |
| ||||||||||||
Impairment – operating assets |
|
| — |
|
|
| — |
|
|
| 702 |
| ||||||||||||||||||||
FFO available to Common Shares and Units / Units (1) (3) (4) |
|
| 1,204,904 |
|
|
| 1,123,530 |
|
|
| 1,323,786 |
|
|
| 1,190,915 |
|
|
| 872,421 |
|
|
| 1,238,145 |
|
|
| 1,311,058 |
|
|
| 1,204,867 |
|
Adjustments: |
|
|
|
|
|
|
|
|
|
|
|
|
|
|
|
|
|
|
|
|
|
|
|
|
|
|
|
|
|
|
|
|
Asset impairment and valuation allowances |
|
| 1,693 |
|
|
| — |
|
|
| — |
|
|
| — |
|
|
| — |
| ||||||||||||
Impairment – non-operating assets |
|
| — |
|
|
| — |
|
|
| — |
| ||||||||||||||||||||
Write-off of pursuit costs |
|
| 3,106 |
|
|
| 4,092 |
|
|
| 3,208 |
|
|
| 3,607 |
|
|
| 5,184 |
|
|
| 6,869 |
|
|
| 5,529 |
|
|
| 4,450 |
|
Debt extinguishment (gains) losses, including prepayment penalties, preferred share redemptions and non-cash convertible debt discounts |
|
| 11,789 |
|
|
| 121,694 |
|
|
| 5,704 |
|
|
| (1,110 | ) |
|
| 121,730 |
| ||||||||||||
(Gains) losses on sales of non-operating assets, net of income and tax expense (benefit) |
|
| (18,884 | ) |
|
| (73,301 | ) |
|
| (18,805 | ) |
|
| 2,421 |
|
|
| 36,096 |
| ||||||||||||
Debt extinguishment and preferred share redemption (gains) losses |
|
| 39,292 |
|
|
| 23,991 |
|
|
| 41,335 |
| ||||||||||||||||||||
Non-operating asset (gains) losses |
|
| (32,590 | ) |
|
| (940 | ) |
|
| (161 | ) | ||||||||||||||||||||
Other miscellaneous items |
|
| (3,371 | ) |
|
| 3,635 |
|
|
| 3,909 |
|
|
| 613 |
|
|
| 21,642 |
|
|
| 4,652 |
|
|
| 8,430 |
|
|
| (1,781 | ) |
Normalized FFO available to Common Shares and Units / Units (2) (3) (4) |
| $ | 1,199,237 |
|
| $ | 1,179,650 |
|
| $ | 1,317,802 |
|
| $ | 1,196,446 |
|
| $ | 1,057,073 |
|
| $ | 1,256,368 |
|
| $ | 1,348,068 |
|
| $ | 1,248,710 |
|
|
|
|
|
|
|
|
|
|
|
|
|
|
|
|
|
|
|
|
|
|
|
|
|
|
|
|
|
|
|
|
|
|
FFO (1) (3) |
| $ | 1,207,995 |
|
| $ | 1,126,621 |
|
| $ | 1,330,629 |
|
| $ | 1,195,060 |
|
| $ | 876,566 |
|
| $ | 1,241,235 |
|
| $ | 1,314,148 |
|
| $ | 1,207,957 |
|
Preferred/preference distributions |
|
| (3,091 | ) |
|
| (3,091 | ) |
|
| (3,357 | ) |
|
| (4,145 | ) |
|
| (4,145 | ) |
|
| (3,090 | ) |
|
| (3,090 | ) |
|
| (3,090 | ) |
Premium on redemption of Preferred Shares/Preference Units |
|
| — |
|
|
| — |
|
|
| (3,486 | ) |
|
| — |
|
|
| — |
| ||||||||||||
FFO available to Common Shares and Units / Units (1) (3) (4) |
| $ | 1,204,904 |
|
| $ | 1,123,530 |
|
| $ | 1,323,786 |
|
| $ | 1,190,915 |
|
| $ | 872,421 |
|
| $ | 1,238,145 |
|
| $ | 1,311,058 |
|
| $ | 1,204,867 |
|
|
|
|
|
|
|
|
|
|
|
|
|
|
|
|
|
|
|
|
|
|
|
|
|
|
|
|
|
|
|
|
|
|
Normalized FFO (2) (3) |
| $ | 1,202,328 |
|
| $ | 1,182,741 |
|
| $ | 1,321,159 |
|
| $ | 1,200,591 |
|
| $ | 1,061,218 |
|
| $ | 1,259,458 |
|
| $ | 1,351,158 |
|
| $ | 1,251,800 |
|
Preferred/preference distributions |
|
| (3,091 | ) |
|
| (3,091 | ) |
|
| (3,357 | ) |
|
| (4,145 | ) |
|
| (4,145 | ) |
|
| (3,090 | ) |
|
| (3,090 | ) |
|
| (3,090 | ) |
Normalized FFO available to Common Shares and Units / Units (2) (3) (4) |
| $ | 1,199,237 |
|
| $ | 1,179,650 |
|
| $ | 1,317,802 |
|
| $ | 1,196,446 |
|
| $ | 1,057,073 |
|
| $ | 1,256,368 |
|
| $ | 1,348,068 |
|
| $ | 1,248,710 |
|
(1) | The National Association of Real Estate Investment Trusts (“ |
53
the impact of any expenses relating to non-operating asset impairment and valuation allowances;
pursuit cost write-offs;
gains and losses from early debt extinguishment, including prepayment penalties, preferred share/preference unit redemptions and the cost related to the implied option value of non-cash convertible debt discounts;
gains and losses on the sales of non-operating assets, including gains and losses from land parcel sales, net of the effect of income tax benefits or expenses; and
other miscellaneous items.
• | the impact of any expenses relating to non-operating asset impairment; |
• | pursuit cost write-offs; |
• | gains and losses from early debt extinguishment and preferred share redemptions; |
44
• | gains and losses from non-operating assets; and |
• | other miscellaneous items. |
(3) | The Company believes that FFO and FFO available to Common Shares and Units / Units are helpful to investors as supplemental measures of the operating performance of a real estate company, because they are recognized measures of performance by the real estate industry and by excluding gains or losses from sales and impairment write-downs of depreciable real estate and excluding depreciation related to |
(4) | FFO available to Common Shares and Units / Units and Normalized FFO available to Common Shares and Units / Units are calculated on a basis consistent with net income available to Common Shares / Units and reflects adjustments to net income for preferred distributions and premiums on redemption of preferred shares/preference units in accordance with GAAP. The equity positions of various individuals and entities that contributed their properties to the Operating Partnership in exchange for OP Units are collectively referred to as the “Noncontrolling Interests – Operating Partnership”. Subject to certain restrictions, the Noncontrolling Interests – Operating Partnership may exchange their OP Units for Common Shares on a one-for-one basis. |
Item 7A. Quantitative and Qualitative Disclosures about Market Risk
The Company’s exposureCompany is exposed to market risk forfrom financial instruments primarily from changes in interest rates primarily relates torates. Such risks derive from the refinancing of its long-termdebt maturities, from exposure to interest rate fluctuations on floating rate debt and floating interest ratefrom derivative instruments that include its unsecured revolving credit facility, commercial paper program, floating rate tax-exempt debt and fair value hedges that convertutilized to swap fixed rate debt to floating rate debt. These exposuresor to interesthedge rates in anticipation of future debt issuances. Our operating results are, primarily driventherefore, affected by changes in long-term U.S. Treasuryshort-term interest rates, for refinancing activity, changes in short-term LIBOR borrowingprimarily London interbank offered rate (“LIBOR”) and Securities Industry and Financial Markets Association (“SIFMA”) indices, which directly impact borrowings under our revolving credit facility and interest on secured and unsecured borrowings contractually tied to such rates. Short-term interest rates andalso indirectly affect the SIFMA index for floating rate debt and changes indiscount on notes issued under our commercial paper market conditions. program. Additionally, we have exposure to long-term interest rates, particularly U.S. Treasuries as they are utilized to price our long-term borrowings and therefore affect the cost of refinancing existing debt or incurring additional debt.
The Company evaluates various factors includingmonitors and manages interest rates as part of its total debt, the current and future anticipated economic environment and other factors to manage this risk. We generally hedge a portion of future long-term debt issuances and target a levelrisk management process, by targeting adequate levels of floating rate exposure and an appropriate debt of 20% or less depending upon market conditions. To the extent the Company carries substantial cash balances, this will tendmaturity profile. From time to partially counterbalance any changes in interest rates.
The Company also utilizes certaintime, we may utilize derivative financial instruments to manage market risk. Derivatives are usedinterest rate exposure and to convert floating rate debt to a fixed rate basiscomply with the requirements of certain lenders, but not for trading or vice versa as well as to partially lock in rates on future debt issuances. Derivatives are used for hedging purposes rather than speculation. The Company does not enter into financial instruments for tradingspeculative purposes. See also Note 910 in the Notes to Consolidated Financial Statements for additional discussion of derivative instruments.
The fair values of the Company’s financial instruments (including such items in the financial statement captions as cash and cash equivalents, other assets, accounts payable and accrued expenses and other liabilities) approximate their carrying or contract values based on their nature, terms and interest rates that approximate current market rates. The fair value of the Company’s mortgage notes payable and unsecured debt (including its commercial paper and line of credit, if applicable) were approximately $3.6 billion and $5.6 billion, respectively, at December 31, 2017.
54
At December 31, 2017, the Company had total outstanding floatingvariable rate debt of approximately $1.4$0.8 billion, or 15.4%representing 10.0% of total debt, netand $1.4 billion, representing 15.3% of total debt, as of December 31, 2020 and 2019, respectively. If interest rates had been 100 basis points higher in 2020 and 2019 and average balances coincided with year end balances, our annual interest expense would have been $8.1 million and $13.8 million higher, respectively. Unsecured notes issued under the effects of any derivative instruments. If market rates of interest on all of the floatingCompany’s commercial paper program are treated as variable rate debt permanently increased by 16 basis points (a 10% increase fromfor the Company’s existing weighted averagepurposes of this calculation even though they do not have a stated interest rates),rate, given their short-term nature. The effect of derivatives, if applicable, is also considered when computing the increasetotal amount of variable rate debt.
Changes in interest expense onrates also affect the floatingestimated fair market value of our fixed rate debt, would decrease future earnings andcomputed using a discounted cash flows by approximately $2.2 million. If market ratesflow model. As of interest on all of the floating rate debt permanently decreased by 16 basis points (a 10% decrease from the Company’s existing weighted average interest rates), the decrease in interest expense on the floating rate debt would increase future earnings and cash flows by approximately $2.2 million.
At December 31, 2017,2020, the Company had total outstanding fixed rate debt of approximately $7.6$7.2 billion, or 84.6%90.0% of total debt, netwith an estimated fair market value of the effects of any derivative instruments.$8.2 billion. If marketinterest rates of interest permanently increased by 47had been 100 basis points (a 10% increase from the Company’s existing weighted average interest rates),lower as of December 31, 2020, the estimated fair market value of the Company’s fixed rate debt would behave increased by approximately $6.9 billion. If market rates$686.6 million. As of interest permanently decreased by 47 basis points (a 10% decrease from the Company’s existing weighted average interest rates), the estimated fair value of the Company’s fixed rate debt would be approximately $8.5 billion.
At December 31, 2017, the Company’s derivative instruments had a net asset fair value of approximately $3.5 million. If market rates of interest permanently increased by 24 basis points (a 10% increase from the Company’s existing weighted average interest rates), the net asset fair value of the Company’s derivative instruments would be approximately $7.7 million. If market rates of interest permanently decreased by 24 basis points (a 10% decrease from the Company’s existing weighted average interest rates), the net liability fair value of the Company’s derivative instruments would be approximately $0.7 million.
At December 31, 2016, the Company had total outstanding floating rate debt of approximately $1.1 billion, or 12.3% of total debt, net of the effects of any derivative instruments. If market rates of interest on all of the floating rate debt permanently increased by 11 basis points (a 10% increase from the Company’s existing weighted average interest rates), the increase in interest expense on the floating rate debt would decrease future earnings and cash flows by approximately $1.3 million. If market rates of interest on all of the floating rate debt permanently decreased by 11 basis points (a 10% decrease from the Company’s existing weighted average interest rates), the decrease in interest expense on the floating rate debt would increase future earnings and cash flows by approximately $1.3 million.
At December 31, 2016,2019, the Company had total outstanding fixed rate debt of approximately $7.9$7.7 billion, or 87.7%84.7% of total debt, netwith an estimated fair market value of the effects of any derivative instruments.$8.2 billion. If marketinterest rates of interest permanently increased by 49had been 100 basis points (a 10% increase from the Company’s existing weighted average interest rates),lower as of December 31, 2019, the estimated fair market value of the Company’s fixed rate debt would be approximately $7.2 billion. If market rates of interest permanently decreased by 49 basis points (a 10% decrease from the Company’s existing weighted average interest rates), the estimated fair value of the Company’s fixed rate debt would be approximately $8.8 billion.
At December 31, 2016, the Company’s derivative instruments had a net asset fair value of approximately $1.9 million. If market rates of interest permanentlyhave increased by 24 basis points (a 10% increase from the Company’s existing weighted average interest rates), the net asset fair value of the Company’s derivative instruments would be approximately $0.4 million. If market rates of interest permanently decreased by 24 basis points (a 10% decrease from the Company’s existing weighted average interest rates), the net asset fair value of the Company’s derivative instruments would be approximately $3.4$664.4 million.
These amounts were determined by considering the impact of hypothetical interest rates on the Company’s financial instruments. The foregoing assumptions apply to the entire amount of the Company’s debt and derivative instruments and do not differentiate among maturities. These analyses do not consider the effects of the changes in overall economic activity that could exist in such an environment. Further, in the event of changes of such magnitude, management would likely take actions to further mitigate its exposure to thethese changes. However, due to the uncertainty of the specific actions that would be taken and their possible effects, this analysis assumes no changes in the Company’s financial structure or results.
45
The Company cannot predict the effect of adverse changes in interest rates on its debt and derivative instruments and, therefore, its exposure to market risk, nor can there be any assurance that long-term debt will be available at advantageous pricing. Consequently, future results may differ materially from the estimated adverse changes discussed above.
Item 8. Financial Statements and Supplementary Data
See Index to Consolidated Financial Statements and Schedule on page F-1 of this Form 10-K.
55
Item 9. Changes in and Disagreements with AccountantsAccountants on Accounting and Financial Disclosure
None.
Item 9A. Controls and Procedures
Equity Residential
(a) Evaluation of Disclosure Controls and Procedures:
Effective as of December 31, 2017,2020, the Company carried out an evaluation, under the supervision and with the participation of the Company’s management, including the Chief Executive Officer and Chief Financial Officer, of the effectiveness of the Company’s disclosure controls and procedures pursuant to Exchange Act Rules 13a-15 and 15d-15. Based on that evaluation, the Chief Executive Officer and Chief Financial Officer concluded that the disclosure controls and procedures are effective to ensure that information required to be disclosed by the Company in its Exchange Act filings is recorded, processed, summarized and reported within the time periods specified in the SEC’s rules and forms.
(b) Management’s Report on Internal Control over Financial Reporting:
Equity Residential’s management is responsible for establishing and maintaining adequate internal control over financial reporting, as such term is defined in Rule 13a-15(f) under the Exchange Act. Under the supervision and with the participation of management, including the Company’s Chief Executive Officer and Chief Financial Officer, management conducted an evaluation of the effectiveness of internal control over financial reporting based on the framework in Internal Control – Integrated Framework issued by the Committee of Sponsoring Organizations of the Treadway Commission (2013 framework).
Because of its inherent limitations, internal control over financial reporting may not prevent or detect misstatements. Therefore, even those systems determined to be effective can only provide reasonable assurance with respect to financial statement preparation and presentation.
Based on the Company’s evaluation under the framework in Internal Control – Integrated Framework, management concluded that its internal control over financial reporting was effective as of December 31, 2017.2020. Our internal control over financial reporting has been audited as of December 31, 20172020 by Ernst & Young LLP, an independent registered public accounting firm, as stated in their report which is included herein.
(c) Changes in Internal Control over Financial Reporting:
There were no changes to the internal control over financial reporting of the Company identified in connection with the Company’s evaluation referred to above that occurred during the fourth quarter of 20172020 that have materially affected, or are reasonably likely to materially affect, the Company’s internal control over financial reporting.
ERP Operating Limited Partnership
(a) Evaluation of Disclosure Controls and Procedures:
Effective as of December 31, 2017,2020, the Operating Partnership carried out an evaluation, under the supervision and with the participation of the Operating Partnership’s management, including the Chief Executive Officer and Chief Financial Officer of EQR, of the effectiveness of the Operating Partnership’s disclosure controls and procedures pursuant to Exchange Act Rules 13a-15 and 15d-15. Based on that evaluation, the Chief Executive Officer and Chief Financial Officer concluded that the disclosure controls and procedures are effective to ensure that information required to be disclosed by the Operating Partnership in its Exchange Act filings is recorded, processed, summarized and reported within the time periods specified in the SEC’s rules and forms.
46
(b) Management’s Report on Internal Control over Financial Reporting:
ERP Operating Limited Partnership’s management is responsible for establishing and maintaining adequate internal control over financial reporting, as such term is defined in Rule 13a-15(f) under the Exchange Act. Under the supervision and with the participation of management, including the Chief Executive Officer and Chief Financial Officer of EQR, management conducted an evaluation of the effectiveness of internal control over financial reporting based on the framework in Internal Control – Integrated Framework issued by the Committee of Sponsoring Organizations of the Treadway Commission (2013 framework).
56
Because of its inherent limitations, internal control over financial reporting may not prevent or detect misstatements. Therefore, even those systems determined to be effective can only provide reasonable assurance with respect to financial statement preparation and presentation.
Based on the Operating Partnership’s evaluation under the framework in Internal Control – Integrated Framework, management concluded that its internal control over financial reporting was effective as of December 31, 2017.2020. Our internal control over financial reporting has been audited as of December 31, 20172020 by Ernst & Young LLP, an independent registered public accounting firm, as stated in their report which is included herein.
(c) Changes in Internal Control over Financial Reporting:
There were no changes to the internal control over financial reporting of the Operating Partnership identified in connection with the Operating Partnership’s evaluation referred to above that occurred during the fourth quarter of 20172020 that have materially affected, or are reasonably likely to materially affect, the Operating Partnership’s internal control over financial reporting.
None.
5747
Trustees, Executive Officers and Corporate Governance; Executive Compensation; Security Ownership of Certain Beneficial Owners and Management and Related Stockholder Matters; Certain Relationships and Related Transactions, and Trustee Independence; and Principal Accounting Fees and Services.Services
The information required by Item 10, Item 11, Item 12, Item 13 and Item 14 is incorporated by reference to, and will be contained in, Equity Residential’s Proxy Statement, which the Company intends to file no later than 120 days after the end of its fiscal year ended December 31, 2017,2020, and thus these items have been omitted in accordance with General Instruction G(3) to Form 10-K. Equity Residential is the general partner and 96.4% owner of ERP Operating Limited Partnership.
5848
Item 15. Exhibits, Financial Statement Schedules.Schedules
(a) The following documents are filed as part of this Report:
| (1) | Financial Statements: See Index to Consolidated Financial Statements and Schedule on page F-1 of this Form 10-K. |
| (2) | Exhibits: See the Exhibit Index. |
| (3) | Financial Statement Schedules: See Index to Consolidated Financial Statements and Schedule on page F-1 of this Form 10-K. |
Item 16. Form 10-K Summary.Summary
None.
5949
The exhibits listed below are filed as part of this report. References to exhibits or other filings under the caption “Location” indicate that the exhibit or other filing has been filed, that the indexed exhibit and the exhibit referred to are the same and that the exhibit referred to is incorporated by reference. The Commission file numbers for our Exchange Act filings referenced below are 1-12252 (Equity Residential) and 0-24920 (ERP Operating Limited Partnership).
Exhibit |
| Description |
| Location |
3.1 |
| Articles of Restatement of Declaration of Trust of Equity Residential dated December 9, 2004. |
| Included as Exhibit 3.1 to Equity |
|
|
|
|
|
3.2 |
| Eighth Amended and Restated Bylaws of Equity Residential, effective as of October 1, 2015. |
| Included as Exhibit 3.1 to Equity |
|
|
|
|
|
3.3 |
|
| Included as Exhibit 3.1 to Equity | |
|
|
|
|
|
3.4 |
| Included as Exhibit 3.1 to Equity Residential's Form 8-K dated May 4, 2020, filed on May 8, 2020. | ||
3.5 |
| Included as Exhibit 10.1 to Equity | ||
|
|
|
|
|
4.1 |
| Included as Exhibit 4.1 to Equity Residential's and ERP Operating Limited Partnership's Form 10-K for the year ended December 31, 2019. | ||
4.2 | Included as Exhibit 4.2 to Equity Residential's and ERP Operating Limited Partnership's Form 10-K for the year ended December 31, 2019. | |||
4.3 | Included as Exhibit 4.3 to Equity Residential's and ERP Operating Limited Partnership's Form 10-K for the year ended December 31, 2019. | |||
4.4 | Indenture, dated October 1, 1994, between the Operating Partnership and The Bank of New York Mellon Trust Company, N.A., as successor trustee |
| Included as Exhibit 4(a) to ERP Operating Limited | |
|
|
|
|
|
|
| First Supplemental Indenture to Indenture, dated as of September 9, 2004. |
| Included as Exhibit 4.2 to ERP Operating Limited |
|
|
|
|
|
|
| Second Supplemental Indenture to Indenture, dated as of August 23, 2006. |
| Included as Exhibit 4.1 to ERP Operating Limited |
|
|
|
|
|
|
| Third Supplemental Indenture to Indenture, dated as of June 4, 2007. |
| Included as Exhibit 4.1 to ERP Operating Limited |
|
|
|
|
|
|
| Fourth Supplemental Indenture to Indenture, dated as of December 12, 2011. |
| Included as Exhibit 4.2 to ERP Operating Limited |
|
|
|
|
|
|
| Fifth Supplemental Indenture to Indenture, dated as of February 1, 2016. |
| Included as Exhibit 4.6 to Equity |
|
|
|
|
|
|
| Form of |
| Included as Exhibit 4.1 to ERP Operating Limited |
4.11 | Included as Exhibit 4.1 to ERP Operating Limited Partnership's Form 8-K dated April 3, 2013, filed on April 8, 2013. | |||
4.12 | Included as Exhibit 4.1 to ERP Operating Limited Partnership's Form 8-K dated May 11, 2015, filed on May 13, 2015. | |||
4.13 | Included as Exhibit 1 to ERP Operating Limited Partnership’s Form 8-K, filed on August 13, 1996. | |||
4.14 | Included as Exhibit 4.1 to ERP Operating Limited Partnership's Form 8-K dated October 4, 2016, filed on October 7, 2016. | |||
4.15 | Included as Exhibit 4.1 to Equity Residential's and ERP Operating Limited Partnership's Form 8-K dated July 31, 2017, filed on August 2, 2017. | |||
50
4.16 | Included as Exhibit 4.1 to Equity Residential's and ERP Operating Limited Partnership's Form 8-K dated February 1, 2018, filed on February 6, 2018. | |||
4.17 | Included as Exhibit 4.1 to Equity Residential's and ERP Operating Limited Partnership's Form 8-K dated November 28, 2018, filed on November 29, 2018. | |||
4.18 | Included as Exhibit 4.1 to Equity Residential's and ERP Operating Limited Partnership's Form 8-K dated June 17, 2019, filed on June 20, 2019. | |||
4.19 | Included as Exhibit 4.1 to Equity Residential's and ERP Operating Limited Partnership's Form 8-K dated August 20, 2019, filed on August 22, 2019. | |||
4.20 | Included as Exhibit 4.2 to ERP Operating Limited Partnership's Form 8-K dated June 16, 2014, filed on June 18, 2014. | |||
|
|
|
|
|
|
|
| Included as Exhibit | |
|
| |||
|
| |||
|
| |||
|
|
|
|
|
|
|
|
| Included as Exhibit |
|
| |||
|
| |||
|
| |||
|
| |||
|
|
60
|
|
| ||
|
|
|
| |
10.1 | * | Noncompetition Agreement (Zell). |
| Included as an exhibit to Equity |
|
|
|
|
|
10.2 |
|
| Included as | |
|
|
|
|
|
10.3 |
|
|
| |
|
|
| ||
|
| |||
| Amended and Restated Limited Partnership Agreement of Lexford Properties, L.P. |
| Included as Exhibit 10.16 to Equity | |
|
|
|
|
|
| * |
| Included as Exhibit 99.1 to Equity | |
10.5 | * | Included as Exhibit 99.1 to Equity Residential's and ERP Operating Limited Partnership's Form 8-K dated June 16, 2011, filed on June 22, 2011. | ||
|
|
|
|
|
| * |
| Included as Exhibit 10.1 to Equity | |
|
|
|
|
|
| * |
| Included as Exhibit 10.1 to Equity | |
|
|
|
|
|
| * |
| Included as Exhibit 10.1 to Equity | |
|
|
|
|
|
| * |
| Included as Exhibit 10.1 to Equity | |
|
|
|
|
|
| * |
| Included as Exhibit 10.1 to Equity | |
|
|
|
|
|
| * |
| Included as Exhibit 10.18 to Equity | |
|
|
|
|
|
| * |
| Included as Exhibit 10.1 to Equity | |
|
|
|
|
|
| * | Equity Residential Second Restated 2002 Share Incentive Plan dated December 10, 2008. |
| Included as Exhibit 10.15 to Equity |
|
|
|
|
|
| * | First Amendment to Second Restated 2002 Share Incentive Plan. |
| Included as Exhibit 10.1 to Equity |
|
|
|
|
|
51
| * | Second Amendment to Second Restated 2002 Share Incentive Plan. |
| Included as Exhibit 10.3 to Equity |
|
|
|
|
|
| * | Third Amendment to Second Restated 2002 Share Incentive Plan. |
| Included as Exhibit 10.2 to Equity |
|
|
|
|
|
61
|
|
| ||
* | Fourth Amendment to Second Restated 2002 Share Incentive Plan. |
| Included as Exhibit 10.2 to Equity | |
|
|
|
|
|
| * | Form of |
| Included as Exhibit 10.1 to Equity |
|
|
|
|
|
| * | Form of Change in Control/Severance Agreement between the Company and other executive officers. |
| Included as Exhibit 10.13 to Equity |
|
|
|
|
|
| * |
| Included as Exhibit 10.1 to Equity | |
|
|
|
|
|
| * | Form of Indemnification Agreement between the Company and each trustee and executive officer. |
| Included as Exhibit 10.18 to Equity |
|
|
|
|
|
| * |
| Included as Exhibit 10.3 to Equity | |
|
|
|
|
|
| * |
| Included as Exhibit 10.24 to Equity | |
|
|
|
|
|
| * | Retirement Benefits Agreement between Samuel Zell and the Company dated October 18, 2001. |
| Included as Exhibit 10.18 to Equity |
|
|
|
|
|
| * |
| Included as Exhibit 10.1 to Equity | |
10.26 | * | Included as Exhibit 10.1 to Equity Residential's and ERP Operating Limited Partnership's Form 10-Q for the quarterly period ended March 31, 2020. | ||
10.27 | * | Included as Exhibit 10.2 to Equity Residential's and ERP Operating Limited Partnership's Form 10-Q for the quarterly period ended June 30, 2017. | ||
|
|
|
|
|
10.28 | * |
| Included as Exhibit | |
|
|
|
|
|
10.29 | * |
| ||
|
|
| ||
|
|
| Included as Exhibit 10.2 to Equity | |
|
|
|
|
|
|
|
| Included as Exhibit 1.1 to Equity | |
10.31 | Included as Exhibit 1.2 to Equity Residential's and ERP Operating Limited Partnership's Form 8-K dated and filed on June 6, 2019. | |||
10.32 | Archstone Residual JV, LLC Limited Liability Company Agreement. | Included as Exhibit 10.3 to Equity Residential's and ERP Operating Limited Partnership's Form 8-K dated February 27, 2013, filed on February 28, 2013. | ||
|
|
|
|
|
10.33 |
| Archstone Parallel Residual JV, LLC Limited Liability Company Agreement. |
| Included as Exhibit |
|
|
|
|
|
10.34 |
| Archstone Parallel Residual JV 2, LLC Limited Liability Company Agreement. |
| Included as Exhibit |
52
10.35 | Legacy Holdings JV, LLC Limited Liability Company Agreement. | Included as Exhibit 10.6 to Equity Residential's and ERP Operating Limited Partnership's Form 8-K dated February 27, 2013, filed on February 28, 2013. | ||
|
|
|
|
|
|
|
|
| |
|
|
| ||
|
| |||
62
|
|
| ||
List of Subsidiaries of Equity Residential and ERP Operating Limited |
| Attached herein. | ||
|
|
|
|
|
23.1 |
|
| Attached herein. | |
|
|
|
|
|
23.2 |
| Consent of Ernst & Young LLP - ERP Operating Limited Partnership. |
| Attached herein. |
|
|
|
|
|
24 |
|
| See the signature page to this report. | |
|
|
|
|
|
31.1 |
|
| Attached herein. | |
|
|
|
|
|
31.2 |
| Equity Residential - Certification of |
| Attached herein. |
|
|
|
|
|
31.3 |
|
| Attached herein. | |
|
|
|
|
|
31.4 |
|
| Attached herein. | |
|
|
|
|
|
32.1 |
|
| Attached herein. | |
|
|
|
|
|
32.2 |
|
| Attached herein. | |
|
|
|
|
|
32.3 |
|
| ||
|
| Attached herein. | ||
|
|
|
|
|
|
|
|
| Attached herein. |
101.INS | Inline XBRL Instance Document – the instance document does not appear in the Interactive Data File because XBRL tags are embedded within the Inline XBRL document. | |||
101.SCH | Inline XBRL Taxonomy Extension Schema Document. | |||
101.CAL | Inline XBRL Taxonomy Extension Calculation Linkbase Document. | |||
101.DEF | Inline XBRL Taxonomy Extension Definition Linkbase Document. | |||
101.LAB | Inline XBRL Taxonomy Extension Label Linkbase Document. | |||
101.PRE | Inline XBRL Taxonomy Extension Presentation Linkbase Document. | |||
104 | Cover Page Interactive Data File (embedded within the Inline XBRL document). |
*Management contracts and compensatory plans or arrangements filed as exhibits to this report are identified by an asterisk.
**Filed on paper – hyperlink is not required pursuant to Rule 105 of Regulation S-T.
6353
Pursuant to the requirements of Section 13 or 15(d) of the Securities Exchange Act of 1934, each registrant has duly caused this report to be signed on its behalf by the undersigned thereunto duly authorized.
|
| EQUITY RESIDENTIAL | ||
|
|
|
|
|
|
| By: |
| /s/ |
|
|
|
|
President and Chief Executive Officer (Principal Executive Officer) |
|
|
|
|
|
|
| Date: |
| February |
|
|
|
|
|
|
| ERP OPERATING LIMITED PARTNERSHIP BY: EQUITY RESIDENTIAL ITS GENERAL PARTNER | ||
|
|
|
|
|
|
| By: |
| /s/ |
|
|
|
|
President and Chief Executive Officer (Principal Executive Officer) |
|
|
|
|
|
|
| Date: |
| February |
ERP OPERATING LIMITED PARTNERSHIP
KNOW ALL MEN/WOMEN BY THESE PRESENTS, that each person whose signature appears below, hereby constitutes and appoints David J. Neithercut, Mark J. Parrell, Robert A. Garechana and Ian S. Kaufman, or any of them, his or her attorneys-in-fact and agents, with full power of substitution and resubstitution for him or her in any and all capacities, to do all acts and things which said attorneys and agents, or any of them, deem advisable to enable the company to comply with the Securities Exchange Act of 1934, as amended, and any requirements or regulations of the Securities and Exchange Commission in respect thereof, in connection with the company’s filing of an annual report on Form 10-K for the company’s fiscal year 2017,2020, including specifically, but without limitation of the general authority hereby granted, the power and authority to sign his or her name as a trustee or officer, or both, of the company, as indicated below opposite his or her signature, to the Form 10-K, and any amendment thereto; and each of the undersigned does hereby fully ratify and confirm all that said attorneys and agents, or any of them, or the substitute of any of them, shall do or cause to be done by virtue hereof.
Pursuant to the requirements of the Securities Exchange Act of 1934, this report has been signed below by the following persons on behalf of each registrant and in the capacities set forth below and on the dates indicated:
Name |
| Title |
| Date |
|
|
|
|
|
/s/ |
| President, Chief Executive Officer and Trustee |
| February |
|
| (Principal Executive Officer) |
|
|
|
|
|
|
|
/s/ |
| Executive Vice President and Chief Financial Officer |
| February |
|
| (Principal Financial Officer) |
|
|
|
|
|
|
|
/s/ Ian S. Kaufman |
| Senior Vice President and Chief Accounting Officer |
| February |
Ian S. Kaufman |
| (Principal Accounting Officer) |
|
|
|
|
|
|
|
/s/ |
| Trustee |
| February |
|
|
|
|
|
|
|
|
|
|
/s/ |
| Trustee |
| February |
|
|
|
|
|
|
|
|
|
|
/s/ Linda Walker Bynoe |
| Trustee |
| February |
Linda Walker Bynoe |
|
|
|
|
|
|
|
|
|
/s/ Connie K. Duckworth |
| Trustee |
| February |
Connie K. Duckworth |
|
|
|
|
|
|
|
|
|
/s/ Mary Kay Haben |
| Trustee |
| February |
Mary Kay Haben | ||||
/s/ T. Zia Huque | Trustee | February 18, 2021 | ||
T. Zia Huque |
|
|
|
|
|
|
|
|
|
/s/ Bradley A. Keywell |
| Trustee |
| February |
Bradley A. Keywell |
|
|
|
|
|
|
|
|
|
/s/ John E. Neal |
| Trustee |
| February |
John E. Neal | ||||
/s/ David J. Neithercut | Trustee | February 18, 2021 | ||
David J. Neithercut |
|
|
|
|
|
|
|
|
|
/s/ Mark S. Shapiro |
| Trustee |
| February |
Mark S. Shapiro |
|
|
|
|
|
|
|
|
|
/s/ Stephen E. Sterrett |
| Trustee |
| February |
Stephen E. Sterrett | ||||
|
|
| ||
|
|
|
|
|
|
|
|
|
|
/s/ Samuel Zell |
| Chairman of the Board of Trustees |
| February |
Samuel Zell | ||||
|
|
|
|
INDEX TO CONSOLIDATED FINANCIAL STATEMENTS AND SCHEDULE
EQUITY RESIDENTIAL
ERP OPERATING LIMITED PARTNERSHIP
|
| PAGE |
|
|
|
FINANCIAL STATEMENTS FILED AS PART OF THIS REPORT |
|
|
|
|
|
| F-2 to F-3 | |
|
|
|
|
| |
|
|
|
|
| |
|
|
|
|
| |
|
|
|
Financial Statements of Equity Residential: |
|
|
|
|
|
Consolidated Balance Sheets as of December 31, |
|
|
|
|
|
|
| |
|
|
|
|
| |
|
|
|
|
| |
|
|
|
Financial Statements of ERP Operating Limited Partnership: |
|
|
|
|
|
Consolidated Balance Sheets as of December 31, |
|
|
|
|
|
|
| |
|
|
|
|
| |
|
|
|
| F-22 to F-23 | |
|
|
|
| F-24 to | |
|
|
|
SCHEDULE FILED AS PART OF THIS REPORT |
|
|
|
|
|
| S-1 to |
All other schedules have been omitted because they are inapplicable, not required or the information is included elsewhere in the consolidated financial statements or notes thereto.
REPORT OF INDEPENDENT REGISTERED PUBLIC ACCOUNTING FIRM
To the Shareholders and Board of Trustees and Shareholders
Equity Residential
Opinion on the Financial Statements
We have audited the accompanying consolidated balance sheets of Equity Residential (the Company) as of December 31, 20172020 and 2016,2019, the related consolidated statements of operations and comprehensive income, changes in equity and cash flows for each of the three years in the period ended December 31, 2017,2020, and the related notes and financial statement schedule listed in the Index at Item 15(a) (collectively referred to as the “consolidated financial statements”). In our opinion, the consolidated financial statements present fairly, in all material respects, the financial position of the Company at December 31, 20172020 and 20162019, and the results of its operations and its cash flows for each of the three years in the period ended December 31, 2017,2020, in conformity with U.S. generally accepted accounting principles.
We also have audited, in accordance with the standards of the Public Company Accounting Oversight Board (United States) (PCAOB), the Company’sCompany's internal control over financial reporting as of December 31, 2017,2020, based on criteria established in Internal Control – Integrated Framework issued by the Committee of Sponsoring Organizations of the Treadway Commission (2013 framework) and our report dated February 22, 201818, 2021 expressed an unqualified opinion thereon.
Basis for Opinion
These financial statements are the responsibility of the Company’sCompany's management. Our responsibility is to express an opinion on the Company’s financial statements based on our audits. We are a public accounting firm registered with the PCAOB and are required to be independent with respect to the Company in accordance with the U.S. federal securities laws and the applicable rules and regulations of the Securities and Exchange Commission and the PCAOB.
We conducted our audits in accordance with the standards of the PCAOB. Those standards require that we plan and perform the audit to obtain reasonable assurance about whether the financial statements are free of material misstatement, whether due to error or fraud. Our audits included performing procedures to assess the risks of material misstatement of the financial statements, whether due to error or fraud, and performing procedures that respond to those risks. Such procedures included examining, on a test basis, evidence regarding the amounts and disclosures in the financial statements. Our audits also included evaluating the accounting principles used and significant estimates made by management, as well as evaluating the overall presentation of the financial statements. We believe that our audits provide a reasonable basis for our opinion.
Critical Audit Matter
The critical audit matter communicated below is a matter arising from the current period audit of the financial statements that was communicated or required to be communicated to the audit committee and that: (1) relates to accounts or disclosures that are material to the consolidated financial statements and (2) involved our especially challenging, subjective or complex judgments. The communication of the critical audit matter does not alter in any way our opinion on the consolidated financial statements, taken as a whole, and we are not, by communicating the critical audit matter below, providing a separate opinion on the critical audit matter or on the account or disclosure to which it relates.
F-2
| Impairment of Long-Lived Assets | |
| ||
Description of the Matter | At December 31, 2020, the Company’s net investment in real estate was approximately $19.3 billion. As more fully described in Note 2 to the consolidated financial statements, the Company periodically evaluates its long-lived assets, including its investment in real estate, for impairment. The judgments regarding the existence of impairment indicators are based on factors such as operational performance, market conditions, legal and environmental concerns, the Company’s intent and ability to hold the related asset, as well as any significant cost overruns on development properties. If the expected future undiscounted cash flows are less than the carrying amount of the long-lived asset, an impairment loss is recognized for the difference between the estimated fair value and the carrying amount. Auditing the Company's process to evaluate long-lived assets for impairment was complex due to a high degree of subjectivity in determining whether indicators of impairment were present, and in determining the future undiscounted cash flows and estimated fair values, if necessary, of long-lived assets where impairment indicators were determined to be present. In particular, these estimates were sensitive to significant assumptions, including the estimation of future rental revenues, operating expenses and capitalization rates, which are affected by expectations about future market or economic conditions. | |
|
| |
How We Addressed the Matter in Our Audit | We obtained an understanding, evaluated the design and tested the operating effectiveness of controls over the Company’s long-lived asset impairment evaluation and measurement process, including controls over management’s determination and review of the significant assumptions used in the analyses and described above. To test the Company’s evaluation of long-lived assets for impairment, we performed audit procedures that included, among others, evaluating the indicators of impairment identified by management and testing the significant assumptions and completeness and accuracy of operating data used by the Company in its analyses. We compared the significant assumptions used by management to current market data and performed sensitivity analyses of certain significant assumptions as discussed above. We also involved our valuation specialists to assist in evaluating certain assumptions used, including future rental revenues and operating expenses, and capitalization rates. | |
|
| /s/ ERNST & YOUNG LLP |
|
| ERNST & YOUNG LLP |
We have served as the Company’s auditor since 1996. |
|
|
Chicago, Illinois |
|
|
February |
|
|
F-2F-3
REPORT OF INDEPENDENT REGISTERED PUBLIC ACCOUNTING FIRM
To the Partners
ERP Operating Limited Partnership
Opinion on the Financial Statements
We have audited the accompanying consolidated balance sheets of ERP Operating Limited Partnership (the Operating Partnership) as of December 31, 2017 and 2016, the related consolidated statements of operations and comprehensive income, changes in capital and cash flows for each of the three years in the period ended December 31, 2017, and the related notes and financial statement schedule listed in the Index at Item 15(a) (collectively referred to as the “consolidated financial statements”). In our opinion, the consolidated financial statements present fairly, in all material respects, the financial position of the Operating Partnership at December 31, 2017 and 2016 and the results of its operations and its cash flows for each of the three years in the period ended December 31, 2017, in conformity with U.S. generally accepted accounting principles.
We also have audited, in accordance with the standards of the Public Company Accounting Oversight Board (United States) (PCAOB), the Operating Partnership’s internal control over financial reporting as of December 31, 2017, based on criteria established in Internal Control – Integrated Framework issued by the Committee of Sponsoring Organizations of the Treadway Commission (2013 framework) and our report dated February 22, 2018 expressed an unqualified opinion thereon.
Basis for Opinion
These financial statements are the responsibility of the Operating Partnership’s management. Our responsibility is to express an opinion on the Operating Partnership’s financial statements based on our audits. We are a public accounting firm registered with the PCAOB and are required to be independent with respect to the Operating Partnership in accordance with the U.S. federal securities laws and the applicable rules and regulations of the Securities and Exchange Commission and the PCAOB.
We conducted our audits in accordance with the standards of the PCAOB. Those standards require that we plan and perform the audit to obtain reasonable assurance about whether the financial statements are free of material misstatement, whether due to error or fraud. Our audits included performing procedures to assess the risks of material misstatement of the financial statements, whether due to error or fraud, and performing procedures that respond to those risks. Such procedures included examining, on a test basis, evidence regarding the amounts and disclosures in the financial statements. Our audits also included evaluating the accounting principles used and significant estimates made by management, as well as evaluating the overall presentation of the financial statements. We believe that our audits provide a reasonable basis for our opinion.
| ||
| ||
| ||
| ||
|
F-3
REPORT OF INDEPENDENT REGISTERED PUBLIC ACCOUNTING FIRM
To the Board of Trustees and Shareholders
Equity Residential
Opinion on Internal Control over Financial Reporting
We have audited Equity Residential’s internal control over financial reporting as of December 31, 2017, based on criteria established in Internal Control – Integrated Framework issued by the Committee of Sponsoring Organizations of the Treadway Commission (2013 framework) (the COSO criteria). In our opinion, Equity Residential (the Company) maintained, in all material respects, effective internal control over financial reporting as of December 31, 2017, based on the COSO criteria.
We also have audited, in accordance with the standards of the Public Company Accounting Oversight Board (United States) (PCAOB), the consolidated balance sheets of the Company as of December 31, 2017 and 2016, the related consolidated statements of operations and comprehensive income, changes in equity and cash flows for each of the three years in the period ended December 31, 2017, and the related notes and financial statement schedule listed in the Index at Item 15(a) and our report dated February 22, 2018 expressed an unqualified opinion thereon.
Basis for Opinion
The Company’s management is responsible for maintaining effective internal control over financial reporting, and for its assessment of the effectiveness of internal control over financial reporting included in the accompanying Management’s Report on Internal Control over Financial Reporting. Our responsibility is to express an opinion on the Company’s internal control over financial reporting based on our audit. We are a public accounting firm registered with the PCAOB and are required to be independent with respect to the Company in accordance with the U.S. federal securities laws and the applicable rules and regulations of the Securities and Exchange Commission and the PCAOB.
We conducted our audit in accordance with the standards of the PCAOB. Those standards require that we plan and perform the audit to obtain reasonable assurance about whether effective internal control over financial reporting was maintained in all material respects.
Our audit included obtaining an understanding of internal control over financial reporting, assessing the risk that a material weakness exists, testing and evaluating the design and operating effectiveness of internal control based on the assessed risk, and performing such other procedures as we considered necessary in the circumstances. We believe that our audit provides a reasonable basis for our opinion.
Definition and Limitations of Internal Control over Financial Reporting
A company’s internal control over financial reporting is a process designed to provide reasonable assurance regarding the reliability of financial reporting and the preparation of financial statements for external purposes in accordance with generally accepted accounting principles. A company’s internal control over financial reporting includes those policies and procedures that (1) pertain to the maintenance of records that, in reasonable detail, accurately and fairly reflect the transactions and dispositions of the assets of the company; (2) provide reasonable assurance that transactions are recorded as necessary to permit preparation of financial statements in accordance with generally accepted accounting principles, and that receipts and expenditures of the company are being made only in accordance with authorizations of management and trustees of the company; and (3) provide reasonable assurance regarding prevention or timely detection of unauthorized acquisition, use, or disposition of the company’s assets that could have a material effect on the financial statements.
Because of its inherent limitations, internal control over financial reporting may not prevent or detect misstatements. Also, projections of any evaluation of effectiveness to future periods are subject to the risk that controls may become inadequate because of changes in conditions, or that the degree of compliance with the policies or procedures may deteriorate.
| ||
| ||
| ||
|
F-4
REPORT OF INDEPENDENT REGISTERED PUBLIC ACCOUNTING FIRM
To the Partners
ERP Operating Limited Partnership
Opinion on the Financial Statements
We have audited the accompanying consolidated balance sheets of ERP Operating Limited Partnership (the Operating Partnership) as of December 31, 2020 and 2019, the related consolidated statements of operations and comprehensive income, changes in capital and cash flows for each of the three years in the period ended December 31, 2020, and the related notes and financial statement schedule listed in the Index at Item 15(a) (collectively referred to as the “consolidated financial statements”). In our opinion, the consolidated financial statements present fairly, in all material respects, the financial position of the Operating Partnership at December 31, 2020 and 2019, and the results of its operations and its cash flows for each of the three years in the period ended December 31, 2020, in conformity with U.S. generally accepted accounting principles.
We also have audited, in accordance with the standards of the Public Company Accounting Oversight Board (United States) (PCAOB), the Operating Partnership’s internal control over financial reporting as of December 31, 2020, based on criteria established in Internal Control – Integrated Framework issued by the Committee of Sponsoring Organizations of the Treadway Commission (2013 framework) and our report dated February 18, 2021 expressed an unqualified opinion thereon.
Basis for Opinion
These financial statements are the responsibility of the Operating Partnership’s management. Our responsibility is to express an opinion on the Operating Partnership’s financial statements based on our audits. We are a public accounting firm registered with the PCAOB and are required to be independent with respect to the Operating Partnership in accordance with the U.S. federal securities laws and the applicable rules and regulations of the Securities and Exchange Commission and the PCAOB.
We conducted our audits in accordance with the standards of the PCAOB. Those standards require that we plan and perform the audit to obtain reasonable assurance about whether the financial statements are free of material misstatement, whether due to error or fraud. Our audits included performing procedures to assess the risks of material misstatement of the financial statements, whether due to error or fraud, and performing procedures that respond to those risks. Such procedures included examining, on a test basis, evidence regarding the amounts and disclosures in the financial statements. Our audits also included evaluating the accounting principles used and significant estimates made by management, as well as evaluating the overall presentation of the financial statements. We believe that our audits provide a reasonable basis for our opinion.
Critical Audit Matter
The critical audit matter communicated below is a matter arising from the current period audit of the financial statements that was communicated or required to be communicated to the audit committee and that: (1) relates to accounts or disclosures that are material to the consolidated financial statements and (2) involved our especially challenging, subjective or complex judgments. The communication of the critical audit matter does not alter in any way our opinion on the consolidated financial statements, taken as a whole, and we are not, by communicating the critical audit matter below, providing a separate opinion on the critical audit matter or on the account or disclosure to which it relates.
F-4
Impairment of Long-Lived Assets | ||
Description of the Matter | At December 31, 2020, the Operating Partnership’s net investment in real estate was approximately $19.3 billion. As more fully described in Note 2 to the consolidated financial statements, the Operating Partnership periodically evaluates its long-lived assets, including its investment in real estate, for impairment. The judgments regarding the existence of impairment indicators are based on factors such as operational performance, market conditions, legal and environmental concerns, the Operating Partnership’s intent and ability to hold the related asset, as well as any significant cost overruns on development properties. If the expected future undiscounted cash flows are less than the carrying amount of the long-lived asset, an impairment loss is recognized for the difference between the estimated fair value and the carrying amount. Auditing the Operating Partnership’s process to evaluate long-lived assets for impairment was complex due to a high degree of subjectivity in determining whether indicators of impairment were present, and in determining the future undiscounted cash flows and estimated fair values, if necessary, of long-lived assets where impairment indicators were determined to be present. In particular, these estimates were sensitive to significant assumptions, including the estimation of future rental revenues, operating expenses and capitalization rates, which are affected by expectations about future market or economic conditions. | |
How We Addressed the Matter in Our Audit | We obtained an understanding, evaluated the design and tested the operating effectiveness of controls over the Operating Partnership’s long-lived asset impairment evaluation and measurement process, including controls over management’s determination and review of the significant assumptions used in the analyses and described above. To test the Operating Partnership’s evaluation of long-lived assets for impairment, we performed audit procedures that included, among others, evaluating the indicators of impairment identified by management and testing the significant assumptions and completeness and accuracy of operating data used by the Operating Partnership in its analyses. We compared the significant assumptions used by management to current market data and performed sensitivity analyses of certain significant assumptions as discussed above. We also involved our valuation specialists to assist in evaluating certain assumptions used, including future rental revenues and operating expenses, and capitalization rates. | |
/s/ ERNST & YOUNG LLP | ||
ERNST & YOUNG LLP | ||
We have served as the Operating Partnership’s auditor since 1996. | ||
Chicago, Illinois | ||
February 18, 2021 |
F-5
REPORT OF INDEPENDENT REGISTERED PUBLIC ACCOUNTING FIRM
To the Shareholders and Board of Trustees
Equity Residential
Opinion on Internal Control over Financial Reporting
We have audited ERP Operating Limited Partnership’sEquity Residential’s internal control over financial reporting as of December 31, 2017,2020, based on criteria established in Internal Control – Integrated Framework issued by the Committee of Sponsoring Organizations of the Treadway Commission (2013 framework) (the COSO criteria). In our opinion, ERP Operating Limited PartnershipEquity Residential (the Operating Partnership)Company) maintained, in all material respects, effective internal control over financial reporting as of December 31, 2017,2020, based on the COSO criteria.
We also have audited, in accordance with the standards of the Public Company Accounting Oversight Board (United States) (PCAOB), the consolidated balance sheets of the Operating PartnershipCompany as of December 31, 20172020 and 2016,2019, the related consolidated statements of operations and comprehensive income, changes in capitalequity and cash flows for each of the three years in the period ended December 31, 2017,2020, and the related notes and financial statement schedule listed in the Index at Item 15(a) and our report dated February 22, 201818, 2021 expressed an unqualified opinion thereon.
Basis for Opinion
The Operating Partnership’sCompany’s management is responsible for maintaining effective internal control over financial reporting, and for its assessment of the effectiveness of internal control over financial reporting included in the accompanying Management’sManagement's Report on Internal Control over Financial Reporting. Our responsibility is to express an opinion on the Operating Partnership’sCompany’s internal control over financial reporting based on our audit. We are a public accounting firm registered with the PCAOB and are required to be independent with respect to the Operating PartnershipCompany in accordance with the U.S. federal securities laws and the applicable rules and regulations of the Securities and Exchange Commission and the PCAOB.
We conducted our audit in accordance with the standards of the PCAOB. Those standards require that we plan and perform the audit to obtain reasonable assurance about whether effective internal control over financial reporting was maintained in all material respects.
Our audit included obtaining an understanding of internal control over financial reporting, assessing the risk that a material weakness exists, testing and evaluating the design and operating effectiveness of internal control based on the assessed risk, and performing such other procedures as we considered necessary in the circumstances. We believe that our audit provides a reasonable basis for our opinion.
Definition and Limitations of Internal Control over Financial Reporting
A company’s internal control over financial reporting is a process designed to provide reasonable assurance regarding the reliability of financial reporting and the preparation of financial statements for external purposes in accordance with generally accepted accounting principles. A company’s internal control over financial reporting includes those policies and procedures that (1) pertain to the maintenance of records that, in reasonable detail, accurately and fairly reflect the transactions and dispositions of the assets of the company; (2) provide reasonable assurance that transactions are recorded as necessary to permit preparation of financial statements in accordance with generally accepted accounting principles, and that receipts and expenditures of the company are being made only in accordance with authorizations of management and trustees of the company; and (3) provide reasonable assurance regarding prevention or timely detection of unauthorized acquisition, use, or disposition of the company’s assets that could have a material effect on the financial statements.
Because of its inherent limitations, internal control over financial reporting may not prevent or detect misstatements. Also, projections of any evaluation of effectiveness to future periods are subject to the risk that controls may become inadequate because of changes in conditions, or that the degree of compliance with the policies or procedures may deteriorate.
|
| /s/ ERNST & YOUNG LLP |
|
| ERNST & YOUNG LLP |
|
|
|
Chicago, Illinois |
|
|
February |
F-6
REPORT OF INDEPENDENT REGISTERED PUBLIC ACCOUNTING FIRM
To the Partners
ERP Operating Limited Partnership
Opinion on Internal Control over Financial Reporting
We have audited ERP Operating Limited Partnership’s internal control over financial reporting as of December 31, 2020, based on criteria established in Internal Control – Integrated Framework issued by the Committee of Sponsoring Organizations of the Treadway Commission (2013 framework) (the COSO criteria). In our opinion, ERP Operating Limited Partnership (the Operating Partnership) maintained, in all material respects, effective internal control over financial reporting as of December 31, 2020, based on the COSO criteria.
We also have audited, in accordance with the standards of the Public Company Accounting Oversight Board (United States) (PCAOB), the consolidated balance sheets of the Operating Partnership as of December 31, 2020 and 2019, the related consolidated statements of operations and comprehensive income, changes in capital and cash flows for each of the three years in the period ended December 31, 2020, and the related notes and financial statement schedule listed in the Index at Item 15(a) and our report dated February 18, 2021 expressed an unqualified opinion thereon.
Basis for Opinion
The Operating Partnership’s management is responsible for maintaining effective internal control over financial reporting, and for its assessment of the effectiveness of internal control over financial reporting included in the accompanying Management's Report on Internal Control over Financial Reporting. Our responsibility is to express an opinion on the Operating Partnership’s internal control over financial reporting based on our audit. We are a public accounting firm registered with the PCAOB and are required to be independent with respect to the Operating Partnership in accordance with the U.S. federal securities laws and the applicable rules and regulations of the Securities and Exchange Commission and the PCAOB.
We conducted our audit in accordance with the standards of the PCAOB. Those standards require that we plan and perform the audit to obtain reasonable assurance about whether effective internal control over financial reporting was maintained in all material respects.
Our audit included obtaining an understanding of internal control over financial reporting, assessing the risk that a material weakness exists, testing and evaluating the design and operating effectiveness of internal control based on the assessed risk, and performing such other procedures as we considered necessary in the circumstances. We believe that our audit provides a reasonable basis for our opinion.
Definition and Limitations of Internal Control over Financial Reporting
A company’s internal control over financial reporting is a process designed to provide reasonable assurance regarding the reliability of financial reporting and the preparation of financial statements for external purposes in accordance with generally accepted accounting principles. A company’s internal control over financial reporting includes those policies and procedures that (1) pertain to the maintenance of records that, in reasonable detail, accurately and fairly reflect the transactions and dispositions of the assets of the company; (2) provide reasonable assurance that transactions are recorded as necessary to permit preparation of financial statements in accordance with generally accepted accounting principles, and that receipts and expenditures of the company are being made only in accordance with authorizations of management and trustees of the company; and (3) provide reasonable assurance regarding prevention or timely detection of unauthorized acquisition, use, or disposition of the company’s assets that could have a material effect on the financial statements.
Because of its inherent limitations, internal control over financial reporting may not prevent or detect misstatements. Also, projections of any evaluation of effectiveness to future periods are subject to the risk that controls may become inadequate because of changes in conditions, or that the degree of compliance with the policies or procedures may deteriorate.
/s/ ERNST & YOUNG LLP | ||
ERNST & YOUNG LLP | ||
Chicago, Illinois | ||
February 18, 2021 |
|
|
F-5F-7
(Amounts in thousands except for share amounts)
|
| December 31, |
|
| December 31, |
|
| December 31, |
|
| December 31, |
| ||||
|
| 2017 |
|
| 2016 |
|
| 2020 |
|
| 2019 |
| ||||
ASSETS |
|
|
|
|
|
|
|
|
|
|
|
|
|
|
|
|
Investment in real estate |
|
|
|
|
|
|
|
| ||||||||
Land |
| $ | 5,996,024 |
|
| $ | 5,899,862 |
|
| $ | 5,785,367 |
|
| $ | 5,936,188 |
|
Depreciable property |
|
| 19,768,362 |
|
|
| 18,730,579 |
|
|
| 20,920,654 |
|
|
| 21,319,101 |
|
Projects under development |
|
| 163,547 |
|
|
| 637,168 |
|
|
| 411,134 |
|
|
| 181,630 |
|
Land held for development |
|
| 98,963 |
|
|
| 118,816 |
|
|
| 86,170 |
|
|
| 96,688 |
|
Investment in real estate |
|
| 26,026,896 |
|
|
| 25,386,425 |
|
|
| 27,203,325 |
|
|
| 27,533,607 |
|
Accumulated depreciation |
|
| (6,040,378 | ) |
|
| (5,360,389 | ) |
|
| (7,859,657 | ) |
|
| (7,276,786 | ) |
Investment in real estate, net |
|
| 19,986,518 |
|
|
| 20,026,036 |
|
|
| 19,343,668 |
|
|
| 20,256,821 |
|
Investments in unconsolidated entities |
|
| 52,782 |
|
|
| 52,238 |
| ||||||||
Cash and cash equivalents |
|
| 50,647 |
|
|
| 77,207 |
|
|
| 42,591 |
|
|
| 45,753 |
|
Investments in unconsolidated entities |
|
| 58,254 |
|
|
| 60,141 |
| ||||||||
Restricted deposits |
|
| 50,115 |
|
|
| 141,881 |
|
|
| 57,137 |
|
|
| 71,246 |
|
Right-of-use assets |
|
| 499,287 |
|
|
| 512,774 |
| ||||||||
Other assets |
|
| 425,065 |
|
|
| 398,883 |
|
|
| 291,426 |
|
|
| 233,937 |
|
Total assets |
| $ | 20,570,599 |
|
| $ | 20,704,148 |
|
| $ | 20,286,891 |
|
| $ | 21,172,769 |
|
|
|
|
|
|
|
|
|
|
|
|
|
|
|
|
|
|
LIABILITIES AND EQUITY |
|
|
|
|
|
|
|
|
|
|
|
|
|
|
|
|
Liabilities: |
|
|
|
|
|
|
|
|
|
|
|
|
|
|
|
|
Mortgage notes payable, net |
| $ | 3,618,722 |
|
| $ | 4,119,181 |
|
| $ | 2,293,890 |
|
| $ | 1,941,610 |
|
Notes, net |
|
| 5,038,812 |
|
|
| 4,848,079 |
|
|
| 5,335,536 |
|
|
| 6,077,513 |
|
Line of credit and commercial paper |
|
| 299,757 |
|
|
| 19,998 |
|
|
| 414,830 |
|
|
| 1,017,833 |
|
Accounts payable and accrued expenses |
|
| 114,766 |
|
|
| 147,482 |
|
|
| 107,366 |
|
|
| 94,350 |
|
Accrued interest payable |
|
| 58,035 |
|
|
| 60,946 |
|
|
| 65,896 |
|
|
| 66,852 |
|
Lease liabilities |
|
| 329,130 |
|
|
| 331,334 |
| ||||||||
Other liabilities |
|
| 341,852 |
|
|
| 350,466 |
|
|
| 345,064 |
|
|
| 346,963 |
|
Security deposits |
|
| 65,009 |
|
|
| 62,624 |
|
|
| 60,480 |
|
|
| 70,062 |
|
Distributions payable |
|
| 192,828 |
|
|
| 192,296 |
|
|
| 232,262 |
|
|
| 218,326 |
|
Total liabilities |
|
| 9,729,781 |
|
|
| 9,801,072 |
|
|
| 9,184,454 |
|
|
| 10,164,843 |
|
|
|
|
|
|
|
|
|
|
|
|
|
|
|
|
|
|
Commitments and contingencies |
|
|
|
|
|
|
|
|
|
|
|
|
|
|
|
|
|
|
|
|
|
|
|
|
|
|
|
|
|
|
|
|
|
Redeemable Noncontrolling Interests – Operating Partnership |
|
| 366,955 |
|
|
| 442,092 |
|
|
| 338,951 |
|
|
| 463,400 |
|
Equity: |
|
|
|
|
|
|
|
|
|
|
|
|
|
|
|
|
Shareholders’ equity: |
|
|
|
|
|
|
|
| ||||||||
Preferred Shares of beneficial interest, $0.01 par value; 100,000,000 shares authorized; 745,600 shares issued and outstanding as of December 31, 2017 and December 31, 2016 |
|
| 37,280 |
|
|
| 37,280 |
| ||||||||
Common Shares of beneficial interest, $0.01 par value; 1,000,000,000 shares authorized; 368,018,082 shares issued and outstanding as of December 31, 2017 and 365,870,924 shares issued and outstanding as of December 31, 2016 |
|
| 3,680 |
|
|
| 3,659 |
| ||||||||
Shareholders' equity: |
|
|
|
|
|
|
|
| ||||||||
Preferred Shares of beneficial interest, $0.01 par value; 100,000,000 shares authorized; 745,600 shares issued and outstanding as of December 31, 2020 and December 31, 2019 |
|
| 37,280 |
|
|
| 37,280 |
| ||||||||
Common Shares of beneficial interest, $0.01 par value; 1,000,000,000 shares authorized; 372,302,000 shares issued and outstanding as of December 31, 2020 and 371,670,884 shares issued and outstanding as of December 31, 2019 |
|
| 3,723 |
|
|
| 3,717 |
| ||||||||
Paid in capital |
|
| 8,886,586 |
|
|
| 8,758,422 |
|
|
| 9,128,599 |
|
|
| 8,965,577 |
|
Retained earnings |
|
| 1,403,530 |
|
|
| 1,543,626 |
|
|
| 1,399,715 |
|
|
| 1,386,495 |
|
Accumulated other comprehensive income (loss) |
|
| (88,612 | ) |
|
| (113,909 | ) |
|
| (43,666 | ) |
|
| (77,563 | ) |
Total shareholders’ equity |
|
| 10,242,464 |
|
|
| 10,229,078 |
| ||||||||
Total shareholders’ equity |
|
| 10,525,651 |
|
|
| 10,315,506 |
| ||||||||
Noncontrolling Interests: |
|
|
|
|
|
|
|
|
|
|
|
|
|
|
|
|
Operating Partnership |
|
| 226,691 |
|
|
| 221,297 |
|
|
| 233,162 |
|
|
| 227,837 |
|
Partially Owned Properties |
|
| 4,708 |
|
|
| 10,609 |
|
|
| 4,673 |
|
|
| 1,183 |
|
Total Noncontrolling Interests |
|
| 231,399 |
|
|
| 231,906 |
|
|
| 237,835 |
|
|
| 229,020 |
|
Total equity |
|
| 10,473,863 |
|
|
| 10,460,984 |
|
|
| 10,763,486 |
|
|
| 10,544,526 |
|
Total liabilities and equity |
| $ | 20,570,599 |
|
| $ | 20,704,148 |
|
| $ | 20,286,891 |
|
| $ | 21,172,769 |
|
See accompanying notes
F-6F-8
CONSOLIDATED STATEMENTS OF OPERATIONS AND COMPREHENSIVE INCOME
(Amounts in thousands except per share data)
|
| Year Ended December 31, |
|
| Year Ended December 31, |
| ||||||||||||||||||
|
| 2017 |
|
| 2016 |
|
| 2015 |
|
| 2020 |
|
| 2019 |
|
| 2018 |
| ||||||
REVENUES |
|
|
|
|
|
|
|
|
|
|
|
|
|
|
|
|
|
|
|
|
|
|
|
|
Rental income |
| $ | 2,470,689 |
|
| $ | 2,422,233 |
|
| $ | 2,736,578 |
|
| $ | 2,571,705 |
|
| $ | 2,700,691 |
|
| $ | 2,577,681 |
|
Fee and asset management |
|
| 717 |
|
|
| 3,567 |
|
|
| 8,387 |
| ||||||||||||
Total revenues |
|
| 2,471,406 |
|
|
| 2,425,800 |
|
|
| 2,744,965 |
| ||||||||||||
|
|
|
|
|
|
|
|
|
|
|
|
| ||||||||||||
EXPENSES |
|
|
|
|
|
|
|
|
|
|
|
|
|
|
|
|
|
|
|
|
|
|
|
|
Property and maintenance |
|
| 405,281 |
|
|
| 406,823 |
|
|
| 479,160 |
|
|
| 440,998 |
|
|
| 446,845 |
|
|
| 429,335 |
|
Real estate taxes and insurance |
|
| 335,495 |
|
|
| 317,387 |
|
|
| 339,802 |
|
|
| 381,562 |
|
|
| 366,139 |
|
|
| 357,814 |
|
Property management |
|
| 85,493 |
|
|
| 82,015 |
|
|
| 86,206 |
|
|
| 93,825 |
|
|
| 95,344 |
|
|
| 92,485 |
|
General and administrative |
|
| 52,224 |
|
|
| 57,840 |
|
|
| 64,664 |
|
|
| 48,305 |
|
|
| 52,757 |
|
|
| 53,813 |
|
Depreciation |
|
| 743,749 |
|
|
| 705,649 |
|
|
| 765,895 |
|
|
| 820,832 |
|
|
| 831,083 |
|
|
| 785,725 |
|
Total expenses |
|
| 1,785,522 |
|
|
| 1,792,168 |
|
|
| 1,719,172 |
| ||||||||||||
|
|
|
|
|
|
|
|
|
|
|
|
| ||||||||||||
Net gain (loss) on sales of real estate properties |
|
| 531,807 |
|
|
| 447,637 |
|
|
| 256,810 |
| ||||||||||||
Impairment |
|
| 1,693 |
|
|
| — |
|
|
| — |
|
|
| — |
|
|
| — |
|
|
| (702 | ) |
Total expenses |
|
| 1,623,935 |
|
|
| 1,569,714 |
|
|
| 1,735,727 |
| ||||||||||||
|
|
|
|
|
|
|
|
|
|
|
|
|
|
|
|
|
|
|
|
|
|
|
|
|
Operating income |
|
| 847,471 |
|
|
| 856,086 |
|
|
| 1,009,238 |
|
|
| 1,317,990 |
|
|
| 1,356,160 |
|
|
| 1,114,617 |
|
|
|
|
|
|
|
|
|
|
|
|
|
|
|
|
|
|
|
|
|
|
|
|
|
|
Interest and other income |
|
| 6,136 |
|
|
| 65,773 |
|
|
| 7,372 |
|
|
| 5,935 |
|
|
| 3,201 |
|
|
| 16,070 |
|
Other expenses |
|
| (5,186 | ) |
|
| (10,368 | ) |
|
| (2,942 | ) |
|
| (17,510 | ) |
|
| (18,177 | ) |
|
| (17,267 | ) |
Interest: |
|
|
|
|
|
|
|
|
|
|
|
|
|
|
|
|
|
|
|
|
|
|
|
|
Expense incurred, net |
|
| (383,890 | ) |
|
| (482,246 | ) |
|
| (444,487 | ) |
|
| (365,073 | ) |
|
| (390,076 | ) |
|
| (413,360 | ) |
Amortization of deferred financing costs |
|
| (8,526 | ) |
|
| (12,633 | ) |
|
| (10,801 | ) |
|
| (8,939 | ) |
|
| (11,670 | ) |
|
| (11,310 | ) |
Income before income and other taxes, income (loss) from investments in unconsolidated entities, net gain (loss) on sales of real estate properties and land parcels and discontinued operations |
|
| 456,005 |
|
|
| 416,612 |
|
|
| 558,380 |
| ||||||||||||
Income before income and other taxes, income (loss) from investments in unconsolidated entities and net gain (loss) on sales of land parcels |
|
| 932,403 |
|
|
| 939,438 |
|
|
| 688,750 |
| ||||||||||||
Income and other tax (expense) benefit |
|
| (478 | ) |
|
| (1,613 | ) |
|
| (917 | ) |
|
| (852 | ) |
|
| 2,281 |
|
|
| (878 | ) |
Income (loss) from investments in unconsolidated entities |
|
| (3,370 | ) |
|
| 4,801 |
|
|
| 15,025 |
|
|
| (3,284 | ) |
|
| 65,945 |
|
|
| (3,667 | ) |
Net gain (loss) on sales of real estate properties |
|
| 157,057 |
|
|
| 4,044,055 |
|
|
| 335,134 |
| ||||||||||||
Net gain (loss) on sales of land parcels |
|
| 19,167 |
|
|
| 15,731 |
|
|
| (1 | ) |
|
| 34,234 |
|
|
| 2,044 |
|
|
| 987 |
|
Income from continuing operations |
|
| 628,381 |
|
|
| 4,479,586 |
|
|
| 907,621 |
| ||||||||||||
Discontinued operations, net |
|
| — |
|
|
| 518 |
|
|
| 397 |
| ||||||||||||
Net income |
|
| 628,381 |
|
|
| 4,480,104 |
|
|
| 908,018 |
|
|
| 962,501 |
|
|
| 1,009,708 |
|
|
| 685,192 |
|
Net (income) loss attributable to Noncontrolling Interests: |
|
|
|
|
|
|
|
|
|
|
|
|
|
|
|
|
|
|
|
|
|
|
|
|
Operating Partnership |
|
| (22,604 | ) |
|
| (171,511 | ) |
|
| (34,241 | ) |
|
| (34,010 | ) |
|
| (36,034 | ) |
|
| (24,939 | ) |
Partially Owned Properties |
|
| (2,323 | ) |
|
| (16,430 | ) |
|
| (3,657 | ) |
|
| (14,855 | ) |
|
| (3,297 | ) |
|
| (2,718 | ) |
Net income attributable to controlling interests |
|
| 603,454 |
|
|
| 4,292,163 |
|
|
| 870,120 |
|
|
| 913,636 |
|
|
| 970,377 |
|
|
| 657,535 |
|
Preferred distributions |
|
| (3,091 | ) |
|
| (3,091 | ) |
|
| (3,357 | ) |
|
| (3,090 | ) |
|
| (3,090 | ) |
|
| (3,090 | ) |
Premium on redemption of Preferred Shares |
|
| — |
|
|
| — |
|
|
| (3,486 | ) | ||||||||||||
Net income available to Common Shares |
| $ | 600,363 |
|
| $ | 4,289,072 |
|
| $ | 863,277 |
|
| $ | 910,546 |
|
| $ | 967,287 |
|
| $ | 654,445 |
|
|
|
|
|
|
|
|
|
|
|
|
|
| ||||||||||||
Earnings per share – basic: |
|
|
|
|
|
|
|
|
|
|
|
|
|
|
|
|
|
|
|
|
|
|
|
|
Income from continuing operations available to Common Shares |
| $ | 1.64 |
|
| $ | 11.75 |
|
| $ | 2.37 |
| ||||||||||||
Net income available to Common Shares |
| $ | 1.64 |
|
| $ | 11.75 |
|
| $ | 2.37 |
| ||||||||||||
Weighted average Common Shares outstanding |
|
| 366,968 |
|
|
| 365,002 |
|
|
| 363,498 |
| ||||||||||||
Earnings per share – diluted: |
|
|
|
|
|
|
|
|
|
|
|
| ||||||||||||
Income from continuing operations available to Common Shares |
| $ | 1.63 |
|
| $ | 11.68 |
|
| $ | 2.36 |
| ||||||||||||
Net income available to Common Shares |
| $ | 1.63 |
|
| $ | 11.68 |
|
| $ | 2.36 |
|
| $ | 2.45 |
|
| $ | 2.61 |
|
| $ | 1.78 |
|
Weighted average Common Shares outstanding |
|
| 382,678 |
|
|
| 381,992 |
|
|
| 380,620 |
|
|
| 371,791 |
|
|
| 370,461 |
|
|
| 368,052 |
|
|
|
|
|
|
|
|
|
|
|
|
|
|
|
|
|
|
|
|
|
|
|
|
|
|
Distributions declared per Common Share outstanding |
| $ | 2.015 |
|
| $ | 13.015 |
|
| $ | 2.21 |
| ||||||||||||
Earnings per share – diluted: |
|
|
|
|
|
|
|
|
|
|
|
| ||||||||||||
Net income available to Common Shares |
| $ | 2.45 |
|
| $ | 2.60 |
|
| $ | 1.77 |
| ||||||||||||
Weighted average Common Shares outstanding |
|
| 385,874 |
|
|
| 386,333 |
|
|
| 383,695 |
| ||||||||||||
See accompanying notes
F-7F-9
CONSOLIDATED STATEMENTS OF OPERATIONS AND COMPREHENSIVE INCOME (Continued)
(Amounts in thousands except per share data)
|
| Year Ended December 31, |
|
| Year Ended December 31, |
| ||||||||||||||||||
|
| 2017 |
|
| 2016 |
|
| 2015 |
|
| 2020 |
|
| 2019 |
|
| 2018 |
| ||||||
Comprehensive income: |
|
|
|
|
|
|
|
|
|
|
|
|
|
|
|
|
|
|
|
|
|
|
|
|
Net income |
| $ | 628,381 |
|
| $ | 4,480,104 |
|
| $ | 908,018 |
|
| $ | 962,501 |
|
| $ | 1,009,708 |
|
| $ | 685,192 |
|
Other comprehensive income (loss): |
|
|
|
|
|
|
|
|
|
|
|
|
|
|
|
|
|
|
|
|
|
|
|
|
Other comprehensive income (loss) – derivative instruments: |
|
|
|
|
|
|
|
|
|
|
|
|
|
|
|
|
|
|
|
|
|
|
|
|
Unrealized holding gains (losses) arising during the year |
|
| 6,439 |
|
|
| (3,915 | ) |
|
| 2,219 |
|
|
| (1,190 | ) |
|
| (33,765 | ) |
|
| 5,174 |
|
Losses reclassified into earnings from other comprehensive income |
|
| 18,858 |
|
|
| 41,758 |
|
|
| 18,244 |
|
|
| 35,087 |
|
|
| 21,188 |
|
|
| 18,452 |
|
Other comprehensive income (loss) – foreign currency: |
|
|
|
|
|
|
|
|
|
|
|
| ||||||||||||
Currency translation adjustments arising during the year |
|
| — |
|
|
| 264 |
|
|
| (327 | ) | ||||||||||||
Other comprehensive income (loss) |
|
| 25,297 |
|
|
| 38,107 |
|
|
| 20,136 |
|
|
| 33,897 |
|
|
| (12,577 | ) |
|
| 23,626 |
|
Comprehensive income |
|
| 653,678 |
|
|
| 4,518,211 |
|
|
| 928,154 |
|
|
| 996,398 |
|
|
| 997,131 |
|
|
| 708,818 |
|
Comprehensive (income) attributable to Noncontrolling Interests |
|
| (25,845 | ) |
|
| (189,411 | ) |
|
| (38,668 | ) |
|
| (50,084 | ) |
|
| (38,872 | ) |
|
| (28,526 | ) |
Comprehensive income attributable to controlling interests |
| $ | 627,833 |
|
| $ | 4,328,800 |
|
| $ | 889,486 |
|
| $ | 946,314 |
|
| $ | 958,259 |
|
| $ | 680,292 |
|
See accompanying notes
F-8F-10
CONSOLIDATED STATEMENTS OF CASH FLOWS
(Amounts in thousands)
|
| Year Ended December 31, |
|
| Year Ended December 31, |
| ||||||||||||||||||
|
| 2017 |
|
| 2016 |
|
| 2015 |
|
| 2020 |
|
| 2019 |
|
| 2018 |
| ||||||
CASH FLOWS FROM OPERATING ACTIVITIES: |
|
|
|
|
|
|
|
|
|
|
|
|
|
|
|
|
|
|
|
|
|
|
|
|
Net income |
| $ | 628,381 |
|
| $ | 4,480,104 |
|
| $ | 908,018 |
|
| $ | 962,501 |
|
| $ | 1,009,708 |
|
| $ | 685,192 |
|
Adjustments to reconcile net income to net cash provided by operating activities: |
|
|
|
|
|
|
|
|
|
|
|
|
|
|
|
|
|
|
|
|
|
|
|
|
Depreciation |
|
| 743,749 |
|
|
| 705,649 |
|
|
| 765,895 |
|
|
| 820,832 |
|
|
| 831,083 |
|
|
| 785,725 |
|
Amortization of deferred financing costs |
|
| 8,526 |
|
|
| 12,633 |
|
|
| 10,801 |
|
|
| 8,939 |
|
|
| 11,670 |
|
|
| 11,310 |
|
Amortization of above/below market lease intangibles |
|
| 3,828 |
|
|
| 3,426 |
|
|
| 3,382 |
|
|
| (71 | ) |
|
| (71 | ) |
|
| 4,392 |
|
Amortization of discounts and premiums on debt |
|
| 3,536 |
|
|
| (17,986 | ) |
|
| (10,569 | ) |
|
| 5,231 |
|
|
| 11,780 |
|
|
| 22,781 |
|
Amortization of deferred settlements on derivative instruments |
|
| 18,847 |
|
|
| 41,680 |
|
|
| 18,075 |
|
|
| 35,075 |
|
|
| 21,176 |
|
|
| 18,440 |
|
Amortization of right-of-use assets |
|
| 11,682 |
|
|
| 11,764 |
|
|
| — |
| ||||||||||||
Impairment |
|
| 1,693 |
|
|
| — |
|
|
| — |
|
|
| — |
|
|
| — |
|
|
| 702 |
|
Write-off of pursuit costs |
|
| 3,106 |
|
|
| 4,092 |
|
|
| 2,878 |
|
|
| 6,869 |
|
|
| 5,529 |
|
|
| 4,450 |
|
(Income) loss from investments in unconsolidated entities |
|
| 3,370 |
|
|
| (4,801 | ) |
|
| (15,025 | ) |
|
| 3,284 |
|
|
| (65,945 | ) |
|
| 3,667 |
|
Distributions from unconsolidated entities – return on capital |
|
| 2,632 |
|
|
| 2,863 |
|
|
| 4,741 |
|
|
| 100 |
|
|
| 2,621 |
|
|
| 2,492 |
|
Net (gain) loss on sales of investment securities and other investments |
|
| — |
|
|
| (58,409 | ) |
|
| (526 | ) | ||||||||||||
Net (gain) loss on sales of real estate properties |
|
| (157,057 | ) |
|
| (4,044,055 | ) |
|
| (335,134 | ) |
|
| (531,807 | ) |
|
| (447,637 | ) |
|
| (256,810 | ) |
Net (gain) loss on sales of land parcels |
|
| (19,167 | ) |
|
| (15,731 | ) |
|
| 1 |
|
|
| (34,234 | ) |
|
| (2,044 | ) |
|
| (987 | ) |
Net (gain) loss on sales of discontinued operations |
|
| — |
|
|
| (43 | ) |
|
| — |
| ||||||||||||
Net (gain) loss on debt extinguishment |
|
| 12,258 |
|
|
| 114,666 |
|
|
| — |
|
|
| 26,150 |
|
|
| 13,647 |
|
|
| 22,110 |
|
Realized/unrealized (gain) loss on derivative instruments |
|
| — |
|
|
| 74 |
|
|
| 3,055 |
|
|
| 50 |
|
|
| — |
|
|
| 50 |
|
Compensation paid with Company Common Shares |
|
| 24,997 |
|
|
| 30,530 |
|
|
| 34,607 |
|
|
| 23,174 |
|
|
| 24,449 |
|
|
| 27,132 |
|
Other operating activities, net |
|
| 1,805 |
|
|
| (287 | ) |
|
| — |
| ||||||||||||
Changes in assets and liabilities: |
|
|
|
|
|
|
|
|
|
|
|
|
|
|
|
|
|
|
|
|
|
|
|
|
(Increase) decrease in other assets |
|
| (449 | ) |
|
| 31,147 |
|
|
| (41,803 | ) |
|
| (53,021 | ) |
|
| 6,278 |
|
|
| 4,097 |
|
Increase (decrease) in accounts payable and accrued expenses |
|
| 11,532 |
|
|
| (6,061 | ) |
|
| (1,667 | ) |
|
| 470 |
|
|
| 5,116 |
|
|
| (1,862 | ) |
Increase (decrease) in accrued interest payable |
|
| (2,911 | ) |
|
| (24,275 | ) |
|
| (4,319 | ) |
|
| (956 | ) |
|
| 4,230 |
|
|
| 4,587 |
|
Increase (decrease) in lease liabilities |
|
| (2,204 | ) |
|
| (2,269 | ) |
|
| — |
| ||||||||||||
Increase (decrease) in other liabilities |
|
| (23,468 | ) |
|
| (26,422 | ) |
|
| 12,269 |
|
|
| (8,751 | ) |
|
| 13,382 |
|
|
| 16,578 |
|
Increase (decrease) in security deposits |
|
| 2,385 |
|
|
| (14,958 | ) |
|
| 1,949 |
|
|
| (9,582 | ) |
|
| 2,804 |
|
|
| 2,249 |
|
Net cash provided by operating activities |
|
| 1,265,788 |
|
|
| 1,214,123 |
|
|
| 1,356,628 |
|
|
| 1,265,536 |
|
|
| 1,456,984 |
|
|
| 1,356,295 |
|
CASH FLOWS FROM INVESTING ACTIVITIES: |
|
|
|
|
|
|
|
|
|
|
|
|
|
|
|
|
|
|
|
|
|
|
|
|
Investment in real estate – acquisitions |
|
| (466,394 | ) |
|
| (205,880 | ) |
|
| (331,336 | ) |
|
| (48,898 | ) |
|
| (1,518,878 | ) |
|
| (708,092 | ) |
Investment in real estate – development/other |
|
| (276,382 | ) |
|
| (566,825 | ) |
|
| (653,897 | ) |
|
| (230,332 | ) |
|
| (195,692 | ) |
|
| (154,431 | ) |
Capital expenditures to real estate |
|
| (202,607 | ) |
|
| (172,177 | ) |
|
| (182,113 | ) |
|
| (135,979 | ) |
|
| (178,423 | ) |
|
| (188,501 | ) |
Non-real estate capital additions |
|
| (1,506 | ) |
|
| (5,731 | ) |
|
| (3,991 | ) |
|
| (20,100 | ) |
|
| (4,955 | ) |
|
| (4,505 | ) |
Interest capitalized for real estate under development |
|
| (26,290 | ) |
|
| (51,451 | ) |
|
| (59,885 | ) |
|
| (10,165 | ) |
|
| (6,884 | ) |
|
| (6,260 | ) |
Proceeds from disposition of real estate, net |
|
| 384,583 |
|
|
| 6,824,659 |
|
|
| 504,748 |
|
|
| 1,113,972 |
|
|
| 1,064,619 |
|
|
| 691,526 |
|
Investments in unconsolidated entities |
|
| (6,034 | ) |
|
| (5,266 | ) |
|
| (23,019 | ) |
|
| (5,775 | ) |
|
| (9,604 | ) |
|
| (6,571 | ) |
Distributions from unconsolidated entities – return of capital |
|
| 334 |
|
|
| 13,798 |
|
|
| 51,144 |
|
|
| 1,636 |
|
|
| 78,262 |
|
|
| — |
|
Proceeds from sale of investment securities and other investments |
|
| — |
|
|
| 72,815 |
|
|
| 2,535 |
| ||||||||||||
Purchase of investment securities and other investments |
|
| (773 | ) |
|
| (269 | ) |
|
| — |
| ||||||||||||
Net cash provided by (used for) investing activities |
|
| (594,296 | ) |
|
| 5,903,942 |
|
|
| (695,814 | ) |
|
| 663,586 |
|
|
| (771,824 | ) |
|
| (376,834 | ) |
See accompanying notes
F-9F-11
CONSOLIDATED STATEMENTS OF CASH FLOWS (Continued)
(Amounts in thousands)
|
| Year Ended December 31, |
|
| Year Ended December 31, |
| ||||||||||||||||||
|
| 2017 |
|
| 2016 |
|
| 2015 |
|
| 2020 |
|
| 2019 |
|
| 2018 |
| ||||||
CASH FLOWS FROM FINANCING ACTIVITIES: |
|
|
|
|
|
|
|
|
|
|
|
|
|
|
|
|
|
|
|
|
|
|
|
|
Debt financing costs |
| $ | (6,289 | ) |
| $ | (13,305 | ) |
| $ | (6,425 | ) |
| $ | (2,923 | ) |
| $ | (19,812 | ) |
| $ | (8,583 | ) |
Mortgage notes payable, net: |
|
|
|
|
|
|
|
|
|
|
|
|
|
|
|
|
|
|
|
|
|
|
|
|
Proceeds |
|
| 519,204 |
|
|
| 295,771 |
|
|
| 96,935 |
| ||||||||||||
Lump sum payoffs |
|
| (493,420 | ) |
|
| (583,122 | ) |
|
| (359,244 | ) |
|
| (160,522 | ) |
|
| (743,021 | ) |
|
| (1,347,939 | ) |
Scheduled principal repayments |
|
| (10,704 | ) |
|
| (8,544 | ) |
|
| (9,275 | ) |
|
| (7,759 | ) |
|
| (6,808 | ) |
|
| (6,629 | ) |
Net gain (loss) on debt extinguishment |
|
| (12,258 | ) |
|
| (31,732 | ) |
|
| — |
|
|
| (327 | ) |
|
| (3,381 | ) |
|
| (22,110 | ) |
Notes, net: |
|
|
|
|
|
|
|
|
|
|
|
|
|
|
|
|
|
|
|
|
|
|
|
|
Proceeds |
|
| 692,466 |
|
|
| 496,705 |
|
|
| 746,391 |
|
|
| — |
|
|
| 1,194,468 |
|
|
| 896,294 |
|
Lump sum payoffs |
|
| (497,975 | ) |
|
| (1,500,000 | ) |
|
| (300,000 | ) |
|
| (750,000 | ) |
|
| (1,050,000 | ) |
|
| — |
|
Net gain (loss) on debt extinguishment |
|
| — |
|
|
| (82,934 | ) |
|
| — |
|
|
| (25,823 | ) |
|
| (10,266 | ) |
|
| — |
|
Line of credit and commercial paper: |
|
|
|
|
|
|
|
|
|
|
|
|
|
|
|
|
|
|
|
|
|
|
|
|
Line of credit proceeds |
|
| 1,845,000 |
|
|
| 426,000 |
|
|
| 3,770,000 |
|
|
| 1,870,000 |
|
|
| 6,010,000 |
|
|
| 3,805,000 |
|
Line of credit repayments |
|
| (1,845,000 | ) |
|
| (426,000 | ) |
|
| (4,103,000 | ) |
|
| (1,890,000 | ) |
|
| (5,990,000 | ) |
|
| (3,805,000 | ) |
Commercial paper proceeds |
|
| 5,066,509 |
|
|
| 1,760,194 |
|
|
| 3,932,304 |
|
|
| 7,450,997 |
|
|
| 15,944,800 |
|
|
| 14,030,926 |
|
Commercial paper repayments |
|
| (4,786,750 | ) |
|
| (2,127,472 | ) |
|
| (3,545,028 | ) |
|
| (8,034,000 | ) |
|
| (15,446,150 | ) |
|
| (13,831,500 | ) |
Proceeds from (payments on) settlement of derivative instruments |
|
| 1,295 |
|
|
| (4,662 | ) |
|
| (13,938 | ) |
|
| (1,240 | ) |
|
| (41,616 | ) |
|
| 18,118 |
|
Prepaid finance ground lease |
|
| — |
|
|
| (34,734 | ) |
|
| — |
| ||||||||||||
Proceeds from Employee Share Purchase Plan (ESPP) |
|
| 3,744 |
|
|
| 3,686 |
|
|
| 4,404 |
|
|
| 4,508 |
|
|
| 3,116 |
|
|
| 3,879 |
|
Proceeds from exercise of options |
|
| 31,596 |
|
|
| 35,833 |
|
|
| 59,508 |
|
|
| 12,275 |
|
|
| 77,785 |
|
|
| 30,655 |
|
Redemption of Preferred Shares |
|
| — |
|
|
| — |
|
|
| (12,720 | ) | ||||||||||||
Premium on redemption of Preferred Shares |
|
| — |
|
|
| — |
|
|
| (3,486 | ) | ||||||||||||
Payment of offering costs |
|
| (51 | ) |
|
| (314 | ) |
|
| (79 | ) |
|
| — |
|
|
| (991 | ) |
|
| (27 | ) |
Other financing activities, net |
|
| (63 | ) |
|
| (49 | ) |
|
| (49 | ) |
|
| (63 | ) |
|
| (80 | ) |
|
| (78 | ) |
Acquisition of Noncontrolling Interests – Partially Owned Properties |
|
| — |
|
|
| — |
|
|
| (13 | ) | ||||||||||||
Contributions – Noncontrolling Interests – Partially Owned Properties |
|
| 125 |
|
|
| — |
|
|
| — |
|
|
| 417 |
|
|
| 7,337 |
|
|
| 125 |
|
Contributions – Noncontrolling Interests – Operating Partnership |
|
| — |
|
|
| 1 |
|
|
| 3 |
|
|
| 13 |
|
|
| 2 |
|
|
| 1 |
|
Distributions: |
|
|
|
|
|
|
|
|
|
|
|
|
|
|
|
|
|
|
|
|
|
|
|
|
Common Shares |
|
| (739,375 | ) |
|
| (4,771,725 | ) |
|
| (784,748 | ) |
|
| (883,938 | ) |
|
| (831,111 | ) |
|
| (782,122 | ) |
Preferred Shares |
|
| (3,091 | ) |
|
| (2,318 | ) |
|
| (3,357 | ) |
|
| (3,090 | ) |
|
| (3,090 | ) |
|
| (3,863 | ) |
Noncontrolling Interests – Operating Partnership |
|
| (27,291 | ) |
|
| (188,115 | ) |
|
| (30,869 | ) |
|
| (32,403 | ) |
|
| (29,615 | ) |
|
| (28,226 | ) |
Noncontrolling Interests – Partially Owned Properties |
|
| (8,286 | ) |
|
| (36,219 | ) |
|
| (6,559 | ) |
|
| (11,719 | ) |
|
| (7,078 | ) |
|
| (9,753 | ) |
Net cash provided by (used for) financing activities |
|
| (789,818 | ) |
|
| (7,054,092 | ) |
|
| (666,167 | ) |
|
| (1,946,393 | ) |
|
| (684,474 | ) |
|
| (963,910 | ) |
Net increase (decrease) in cash and cash equivalents and restricted deposits |
|
| (118,326 | ) |
|
| 63,973 |
|
|
| (5,353 | ) |
|
| (17,271 | ) |
|
| 686 |
|
|
| 15,551 |
|
Cash and cash equivalents and restricted deposits, beginning of year |
|
| 219,088 |
|
|
| 155,115 |
|
|
| 160,468 |
|
|
| 116,999 |
|
|
| 116,313 |
|
|
| 100,762 |
|
Cash and cash equivalents and restricted deposits, end of year |
| $ | 100,762 |
|
| $ | 219,088 |
|
| $ | 155,115 |
|
| $ | 99,728 |
|
| $ | 116,999 |
|
| $ | 116,313 |
|
|
|
|
|
|
|
|
|
|
|
|
|
|
|
|
|
|
|
|
|
|
|
|
|
|
Cash and cash equivalents and restricted deposits, end of year |
|
|
|
|
|
|
|
|
|
|
|
|
|
|
|
|
|
|
|
|
|
|
|
|
Cash and cash equivalents |
| $ | 50,647 |
|
| $ | 77,207 |
|
| $ | 42,276 |
|
| $ | 42,591 |
|
| $ | 45,753 |
|
| $ | 47,442 |
|
Restricted deposits |
|
| 50,115 |
|
|
| 141,881 |
|
|
| 112,839 |
|
|
| 57,137 |
|
|
| 71,246 |
|
|
| 68,871 |
|
Total cash and cash equivalents and restricted deposits, end of year |
| $ | 100,762 |
|
| $ | 219,088 |
|
| $ | 155,115 |
|
| $ | 99,728 |
|
| $ | 116,999 |
|
| $ | 116,313 |
|
See accompanying notes
F-10F-12
CONSOLIDATED STATEMENTS OF CASH FLOWS (Continued)
(Amounts in thousands)
|
| Year Ended December 31, |
|
| Year Ended December 31, |
| ||||||||||||||||||
|
| 2017 |
|
| 2016 |
|
| 2015 |
|
| 2020 |
|
| 2019 |
|
| 2018 |
| ||||||
SUPPLEMENTAL INFORMATION: |
|
|
|
|
|
|
|
|
|
|
|
|
|
|
|
|
|
|
|
|
|
|
|
|
Cash paid for interest, net of amounts capitalized |
| $ | 360,273 |
|
| $ | 482,152 |
|
| $ | 436,748 |
|
| $ | 320,854 |
|
| $ | 342,048 |
|
| $ | 358,156 |
|
Net cash paid for income and other taxes |
| $ | 640 |
|
| $ | 1,494 |
|
| $ | 1,264 |
| ||||||||||||
Real estate acquisitions/dispositions/other: |
|
|
|
|
|
|
|
|
|
|
|
| ||||||||||||
Mortgage loans assumed |
| $ | — |
|
| $ | 43,400 |
|
| $ | — |
| ||||||||||||
Net cash paid (received) for income and other taxes |
| $ | (1,038 | ) |
| $ | (585 | ) |
| $ | 853 |
| ||||||||||||
Amortization of deferred financing costs: |
|
|
|
|
|
|
|
|
|
|
|
|
|
|
|
|
|
|
|
|
|
|
|
|
Investment in real estate, net |
| $ | (240 | ) |
| $ | (120 | ) |
| $ | — |
| ||||||||||||
Other assets |
| $ | 2,412 |
|
| $ | 3,366 |
|
| $ | 3,054 |
|
| $ | 2,338 |
|
| $ | 2,987 |
|
| $ | 2,412 |
|
Mortgage notes payable, net |
| $ | 2,493 |
|
| $ | 3,978 |
|
| $ | 3,589 |
|
| $ | 1,815 |
|
| $ | 3,934 |
|
| $ | 4,792 |
|
Notes, net |
| $ | 3,621 |
|
| $ | 5,289 |
|
| $ | 4,158 |
|
| $ | 5,026 |
|
| $ | 4,869 |
|
| $ | 4,106 |
|
Amortization of discounts and premiums on debt: |
|
|
|
|
|
|
|
|
|
|
|
|
|
|
|
|
|
|
|
|
|
|
|
|
Mortgage notes payable, net |
| $ | 1,172 |
|
| $ | (21,158 | ) |
| $ | (13,126 | ) |
| $ | 2,234 |
|
| $ | 8,618 |
|
| $ | 20,144 |
|
Notes, net |
| $ | 2,364 |
|
| $ | 3,172 |
|
| $ | 2,557 |
|
| $ | 2,997 |
|
| $ | 3,162 |
|
| $ | 2,637 |
|
Amortization of deferred settlements on derivative instruments: |
|
|
|
|
|
|
|
|
|
|
|
|
|
|
|
|
|
|
|
|
|
|
|
|
Other liabilities |
| $ | (11 | ) |
| $ | (78 | ) |
| $ | (169 | ) |
| $ | (12 | ) |
| $ | (12 | ) |
| $ | (12 | ) |
Accumulated other comprehensive income |
| $ | 18,858 |
|
| $ | 41,758 |
|
| $ | 18,244 |
|
| $ | 35,087 |
|
| $ | 21,188 |
|
| $ | 18,452 |
|
Write-off of pursuit costs: |
|
|
|
|
|
|
|
|
|
|
|
|
|
|
|
|
|
|
|
|
|
|
|
|
Investment in real estate, net |
| $ | 2,965 |
|
| $ | 3,586 |
|
| $ | 2,804 |
|
| $ | 6,566 |
|
| $ | 5,451 |
|
| $ | 4,364 |
|
Other assets |
| $ | 17 |
|
| $ | 402 |
|
| $ | 74 |
|
| $ | 271 |
|
| $ | 62 |
|
| $ | 53 |
|
Accounts payable and accrued expenses |
| $ | 124 |
|
| $ | 104 |
|
| $ | — |
|
| $ | 32 |
|
| $ | 16 |
|
| $ | 33 |
|
(Income) loss from investments in unconsolidated entities: |
|
|
|
|
|
|
|
|
|
|
|
|
|
|
|
|
|
|
|
|
|
|
|
|
Investments in unconsolidated entities |
| $ | 1,955 |
|
| $ | (6,327 | ) |
| $ | (17,340 | ) |
| $ | 1,995 |
|
| $ | (67,268 | ) |
| $ | 2,304 |
|
Other liabilities |
| $ | 1,415 |
|
| $ | 1,526 |
|
| $ | 2,315 |
|
| $ | 1,289 |
|
| $ | 1,323 |
|
| $ | 1,363 |
|
Distributions from unconsolidated entities – return on capital: |
|
|
|
|
|
|
|
|
|
|
|
| ||||||||||||
Investments in unconsolidated entities |
| $ | 2,632 |
|
| $ | 2,863 |
|
| $ | 4,606 |
| ||||||||||||
Other liabilities |
| $ | — |
|
| $ | — |
|
| $ | 135 |
| ||||||||||||
Realized/unrealized (gain) loss on derivative instruments: |
|
|
|
|
|
|
|
|
|
|
|
|
|
|
|
|
|
|
|
|
|
|
|
|
Other assets |
| $ | (4,582 | ) |
| $ | 1,798 |
|
| $ | (3,573 | ) |
| $ | — |
|
| $ | 2,002 |
|
| $ | (14,977 | ) |
Notes, net |
| $ | (3,454 | ) |
| $ | (1,798 | ) |
| $ | 2,058 |
|
| $ | — |
|
| $ | 2,277 |
|
| $ | (680 | ) |
Other liabilities |
| $ | 1,597 |
|
| $ | 3,989 |
|
| $ | 2,351 |
|
| $ | 1,240 |
|
| $ | 29,486 |
|
| $ | 10,533 |
|
Accumulated other comprehensive income |
| $ | 6,439 |
|
| $ | (3,915 | ) |
| $ | 2,219 |
|
| $ | (1,190 | ) |
| $ | (33,765 | ) |
| $ | 5,174 |
|
Investments in unconsolidated entities: |
|
|
|
|
|
|
|
|
|
|
|
|
|
|
|
|
|
|
|
|
|
|
|
|
Investments in unconsolidated entities |
| $ | (3,034 | ) |
| $ | (2,326 | ) |
| $ | (1,404 | ) |
| $ | (4,275 | ) |
| $ | (7,504 | ) |
| $ | (4,891 | ) |
Other liabilities |
| $ | (3,000 | ) |
| $ | (2,940 | ) |
| $ | (21,615 | ) |
| $ | (1,500 | ) |
| $ | (2,100 | ) |
| $ | (1,680 | ) |
Debt financing costs: |
|
|
|
|
|
|
|
|
|
|
|
| ||||||||||||
Other assets |
| $ | (231 | ) |
| $ | (6,909 | ) |
| $ | (145 | ) | ||||||||||||
Mortgage notes payable, net |
| $ | (2,692 | ) |
| $ | (2,354 | ) |
| $ | (555 | ) | ||||||||||||
Notes, net |
| $ | — |
|
| $ | (10,549 | ) |
| $ | (7,883 | ) | ||||||||||||
Right-of-use assets and lease liabilities initial measurement and reclassifications: |
|
|
|
|
|
|
|
|
|
|
|
| ||||||||||||
Right-of-use assets |
| $ | — |
|
| $ | (489,517 | ) |
| $ | — |
| ||||||||||||
Other assets |
| $ | — |
|
| $ | 184,116 |
|
| $ | — |
| ||||||||||||
Lease liabilities |
| $ | — |
|
| $ | 333,603 |
|
| $ | — |
| ||||||||||||
Other liabilities |
| $ | — |
|
| $ | (28,202 | ) |
| $ | — |
| ||||||||||||
Proceeds from (payments on) settlement of derivative instruments: |
|
|
|
|
|
|
|
|
|
|
|
| ||||||||||||
Other assets |
| $ | — |
|
| $ | — |
|
| $ | 18,118 |
| ||||||||||||
Other liabilities |
| $ | (1,240 | ) |
| $ | (41,616 | ) |
| $ | — |
| ||||||||||||
See accompanying notes
F-11F-13
CONSOLIDATED STATEMENTS OF CASH FLOWS (Continued)
(Amounts in thousands)
|
| Year Ended December 31, |
| |||||||||
|
| 2017 |
|
| 2016 |
|
| 2015 |
| |||
SUPPLEMENTAL INFORMATION (continued): |
|
|
|
|
|
|
|
|
|
|
|
|
Distributions from unconsolidated entities - return of capital: |
|
|
|
|
|
|
|
|
|
|
|
|
Investments in unconsolidated entities |
| $ | 334 |
|
| $ | 14,014 |
|
| $ | 51,144 |
|
Other assets |
| $ | — |
|
| $ | (216 | ) |
| $ | — |
|
Debt financing costs: |
|
|
|
|
|
|
|
|
|
|
|
|
Other assets |
| $ | — |
|
| $ | (8,553 | ) |
| $ | — |
|
Mortgage notes payable, net |
| $ | — |
|
| $ | (507 | ) |
| $ | (35 | ) |
Notes, net |
| $ | (6,289 | ) |
| $ | (4,245 | ) |
| $ | (6,390 | ) |
Proceeds from (payments on) settlement of derivative instruments: |
|
|
|
|
|
|
|
|
|
|
|
|
Other assets |
| $ | 1,295 |
|
| $ | — |
|
| $ | 1,848 |
|
Other liabilities |
| $ | — |
|
| $ | (4,662 | ) |
| $ | (15,786 | ) |
Other: |
|
|
|
|
|
|
|
|
|
|
|
|
Foreign currency translation adjustments |
| $ | — |
|
| $ | (264 | ) |
| $ | 327 |
|
|
|
|
|
|
|
|
|
|
|
|
|
|
See accompanying notes
F-12
CONSOLIDATED STATEMENTS OF CHANGES IN EQUITY
(Amounts in thousands)thousands except per share data)
|
| Year Ended December 31, |
|
| Year Ended December 31, |
| ||||||||||||||||||
|
| 2017 |
|
| 2016 |
|
| 2015 |
|
| 2020 |
|
| 2019 |
|
| 2018 |
| ||||||
SHAREHOLDERS’ EQUITY |
|
|
|
|
|
|
|
|
|
|
|
| ||||||||||||
SHAREHOLDERS’ EQUITY |
|
|
|
|
|
|
|
|
|
|
|
| ||||||||||||
PREFERRED SHARES |
|
|
|
|
|
|
|
|
|
|
|
|
|
|
|
|
|
|
|
|
|
|
|
|
Balance, beginning of year |
| $ | 37,280 |
|
| $ | 37,280 |
|
| $ | 50,000 |
|
| $ | 37,280 |
|
| $ | 37,280 |
|
| $ | 37,280 |
|
Partial redemption of 8.29% Series K Cumulative Redeemable |
|
| — |
|
|
| — |
|
|
| (12,720 | ) | ||||||||||||
Balance, end of year |
| $ | 37,280 |
|
| $ | 37,280 |
|
| $ | 37,280 |
|
| $ | 37,280 |
|
| $ | 37,280 |
|
| $ | 37,280 |
|
COMMON SHARES, $0.01 PAR VALUE |
|
|
|
|
|
|
|
|
|
|
|
|
|
|
|
|
|
|
|
|
|
|
|
|
Balance, beginning of year |
| $ | 3,659 |
|
| $ | 3,648 |
|
| $ | 3,629 |
|
| $ | 3,717 |
|
| $ | 3,694 |
|
| $ | 3,680 |
|
Conversion of OP Units into Common Shares |
|
| 11 |
|
|
| 1 |
|
|
| 2 |
|
|
| 1 |
|
|
| 3 |
|
|
| 1 |
|
Exercise of share options |
|
| 8 |
|
|
| 8 |
|
|
| 14 |
|
|
| 2 |
|
|
| 17 |
|
|
| 11 |
|
Employee Share Purchase Plan (ESPP) |
|
| 1 |
|
|
| 1 |
|
|
| 1 |
|
|
| 1 |
|
|
| 1 |
|
|
| 1 |
|
Share-based employee compensation expense: |
|
|
|
|
|
|
|
|
|
|
|
|
|
|
|
|
|
|
|
|
|
|
|
|
Restricted shares |
|
| 1 |
|
|
| 1 |
|
|
| 2 |
|
|
| 2 |
|
|
| 2 |
|
|
| 1 |
|
Balance, end of year |
| $ | 3,680 |
|
| $ | 3,659 |
|
| $ | 3,648 |
|
| $ | 3,723 |
|
| $ | 3,717 |
|
| $ | 3,694 |
|
PAID IN CAPITAL |
|
|
|
|
|
|
|
|
|
|
|
|
|
|
|
|
|
|
|
|
|
|
|
|
Balance, beginning of year |
| $ | 8,758,422 |
|
| $ | 8,572,365 |
|
| $ | 8,536,340 |
|
| $ | 8,965,577 |
|
| $ | 8,935,453 |
|
| $ | 8,886,586 |
|
Common Share Issuance: |
|
|
|
|
|
|
|
|
|
|
|
|
|
|
|
|
|
|
|
|
|
|
|
|
Conversion of OP Units into Common Shares |
|
| 15,889 |
|
|
| 3,725 |
|
|
| 4,964 |
|
|
| 4,695 |
|
|
| 10,407 |
|
|
| 4,097 |
|
Exercise of share options |
|
| 31,588 |
|
|
| 35,825 |
|
|
| 59,494 |
|
|
| 12,273 |
|
|
| 77,768 |
|
|
| 30,644 |
|
Employee Share Purchase Plan (ESPP) |
|
| 3,743 |
|
|
| 3,685 |
|
|
| 4,403 |
|
|
| 4,507 |
|
|
| 3,115 |
|
|
| 3,878 |
|
Conversion of restricted shares to restricted units |
|
| — |
|
|
| — |
|
|
| (70 | ) | ||||||||||||
Share-based employee compensation expense: |
|
|
|
|
|
|
|
|
|
|
|
|
|
|
|
|
|
|
|
|
|
|
|
|
Restricted shares |
|
| 9,776 |
|
|
| 15,015 |
|
|
| 15,064 |
|
|
| 11,223 |
|
|
| 12,436 |
|
|
| 8,257 |
|
Share options |
|
| 6,835 |
|
|
| 3,432 |
|
|
| 3,756 |
|
|
| 2,349 |
|
|
| 2,675 |
|
|
| 9,734 |
|
ESPP discount |
|
| 747 |
|
|
| 650 |
|
|
| 884 |
|
|
| 944 |
|
|
| 642 |
|
|
| 767 |
|
Offering costs |
|
| (51 | ) |
|
| (314 | ) |
|
| (79 | ) |
|
| — |
|
|
| (991 | ) |
|
| (27 | ) |
Supplemental Executive Retirement Plan (SERP) |
|
| (594 | ) |
|
| 748 |
|
|
| 1,380 |
|
|
| (395 | ) |
|
| (1,675 | ) |
|
| (454 | ) |
Change in market value of Redeemable Noncontrolling Interests – Operating Partnership |
|
| 41,916 |
|
|
| 115,093 |
|
|
| (64,378 | ) |
|
| 125,224 |
|
|
| (82,283 | ) |
|
| (13,922 | ) |
Adjustment for Noncontrolling Interests ownership in Operating Partnership |
|
| 18,315 |
|
|
| 8,198 |
|
|
| 10,607 |
|
|
| 2,202 |
|
|
| 8,030 |
|
|
| 5,893 |
|
Balance, end of year |
| $ | 8,886,586 |
|
| $ | 8,758,422 |
|
| $ | 8,572,365 |
|
| $ | 9,128,599 |
|
| $ | 8,965,577 |
|
| $ | 8,935,453 |
|
RETAINED EARNINGS |
|
|
|
|
|
|
|
|
|
|
|
|
|
|
|
|
|
|
|
|
|
|
|
|
Balance, beginning of year |
| $ | 1,543,626 |
|
| $ | 2,009,091 |
|
| $ | 1,950,639 |
|
| $ | 1,386,495 |
|
| $ | 1,261,763 |
|
| $ | 1,403,530 |
|
Net income attributable to controlling interests |
|
| 603,454 |
|
|
| 4,292,163 |
|
|
| 870,120 |
|
|
| 913,636 |
|
|
| 970,377 |
|
|
| 657,535 |
|
Common Share distributions |
|
| (740,459 | ) |
|
| (4,754,537 | ) |
|
| (804,825 | ) |
|
| (897,326 | ) |
|
| (842,555 | ) |
|
| (796,212 | ) |
Preferred Share distributions |
|
| (3,091 | ) |
|
| (3,091 | ) |
|
| (3,357 | ) |
|
| (3,090 | ) |
|
| (3,090 | ) |
|
| (3,090 | ) |
Premium on redemption of Preferred Shares – cash charge |
|
| — |
|
|
| — |
|
|
| (3,486 | ) | ||||||||||||
Balance, end of year |
| $ | 1,403,530 |
|
| $ | 1,543,626 |
|
| $ | 2,009,091 |
|
| $ | 1,399,715 |
|
| $ | 1,386,495 |
|
| $ | 1,261,763 |
|
ACCUMULATED OTHER COMPREHENSIVE INCOME (LOSS) |
|
|
|
|
|
|
|
|
|
|
|
|
|
|
|
|
|
|
|
|
|
|
|
|
Balance, beginning of year |
| $ | (113,909 | ) |
| $ | (152,016 | ) |
| $ | (172,152 | ) |
| $ | (77,563 | ) |
| $ | (64,986 | ) |
| $ | (88,612 | ) |
Accumulated other comprehensive income (loss) – derivative instruments: |
|
|
|
|
|
|
|
|
|
|
|
|
|
|
|
|
|
|
|
|
|
|
|
|
Unrealized holding gains (losses) arising during the year |
|
| 6,439 |
|
|
| (3,915 | ) |
|
| 2,219 |
|
|
| (1,190 | ) |
|
| (33,765 | ) |
|
| 5,174 |
|
Losses reclassified into earnings from other comprehensive income |
|
| 18,858 |
|
|
| 41,758 |
|
|
| 18,244 |
|
|
| 35,087 |
|
|
| 21,188 |
|
|
| 18,452 |
|
Accumulated other comprehensive income (loss) – foreign currency: |
|
|
|
|
|
|
|
|
|
|
|
| ||||||||||||
Currency translation adjustments arising during the year |
|
| — |
|
|
| 264 |
|
|
| (327 | ) | ||||||||||||
Balance, end of year |
| $ | (88,612 | ) |
| $ | (113,909 | ) |
| $ | (152,016 | ) |
| $ | (43,666 | ) |
| $ | (77,563 | ) |
| $ | (64,986 | ) |
|
|
|
|
|
|
|
|
|
|
|
|
| ||||||||||||
DISTRIBUTIONS |
|
|
|
|
|
|
|
|
|
|
|
| ||||||||||||
Distributions declared per Common Share outstanding |
| $ | 2.41 |
|
| $ | 2.27 |
|
| $ | 2.16 |
| ||||||||||||
See accompanying notes
F-13F-14
CONSOLIDATED STATEMENTS OF CHANGES IN EQUITY (Continued)
(Amounts in thousands)thousandsexcept per share data)
|
| Year Ended December 31, |
|
| Year Ended December 31, |
| ||||||||||||||||||
|
| 2017 |
|
| 2016 |
|
| 2015 |
|
| 2020 |
|
| 2019 |
|
| 2018 |
| ||||||
NONCONTROLLING INTERESTS |
|
|
|
|
|
|
|
|
|
|
|
|
|
|
|
|
|
|
|
|
|
|
|
|
OPERATING PARTNERSHIP |
|
|
|
|
|
|
|
|
|
|
|
|
|
|
|
|
|
|
|
|
|
|
|
|
Balance, beginning of year |
| $ | 221,297 |
|
| $ | 221,379 |
|
| $ | 214,411 |
|
| $ | 227,837 |
|
| $ | 228,738 |
|
| $ | 226,691 |
|
Issuance of restricted units to Noncontrolling Interests |
|
| — |
|
|
| 1 |
|
|
| 3 |
|
|
| 13 |
|
|
| 2 |
|
|
| 1 |
|
Conversion of OP Units held by Noncontrolling Interests into OP Units held by General Partner |
|
| (15,900 | ) |
|
| (3,726 | ) |
|
| (4,966 | ) |
|
| (4,696 | ) |
|
| (10,410 | ) |
|
| (4,098 | ) |
Conversion of restricted shares to restricted units |
|
| — |
|
|
| — |
|
|
| 70 |
| ||||||||||||
Equity compensation associated with Noncontrolling Interests |
|
| 10,523 |
|
|
| 18,180 |
|
|
| 21,503 |
|
|
| 11,926 |
|
|
| 13,410 |
|
|
| 14,009 |
|
Net income attributable to Noncontrolling Interests |
|
| 22,604 |
|
|
| 171,511 |
|
|
| 34,241 |
|
|
| 34,010 |
|
|
| 36,034 |
|
|
| 24,939 |
|
Distributions to Noncontrolling Interests |
|
| (26,739 | ) |
|
| (187,448 | ) |
|
| (31,604 | ) |
|
| (32,951 | ) |
|
| (29,896 | ) |
|
| (28,682 | ) |
Change in carrying value of Redeemable Noncontrolling Interests – Operating Partnership |
|
| 33,221 |
|
|
| 9,598 |
|
|
| (1,672 | ) |
|
| (775 | ) |
|
| (2,011 | ) |
|
| 1,771 |
|
Adjustment for Noncontrolling Interests ownership in Operating Partnership |
|
| (18,315 | ) |
|
| (8,198 | ) |
|
| (10,607 | ) |
|
| (2,202 | ) |
|
| (8,030 | ) |
|
| (5,893 | ) |
Balance, end of year |
| $ | 226,691 |
|
| $ | 221,297 |
|
| $ | 221,379 |
|
| $ | 233,162 |
|
| $ | 227,837 |
|
| $ | 228,738 |
|
PARTIALLY OWNED PROPERTIES |
|
|
|
|
|
|
|
|
|
|
|
|
|
|
|
|
|
|
|
|
|
|
|
|
Balance, beginning of year |
| $ | 10,609 |
|
| $ | 4,608 |
|
| $ | 124,909 |
|
| $ | 1,183 |
|
| $ | (2,293 | ) |
| $ | 4,708 |
|
Net income attributable to Noncontrolling Interests |
|
| 2,323 |
|
|
| 16,430 |
|
|
| 3,657 |
|
|
| 14,855 |
|
|
| 3,297 |
|
|
| 2,718 |
|
Acquisitions of Noncontrolling Interests – Partially Owned Properties |
|
| — |
|
|
| — |
|
|
| (13 | ) | ||||||||||||
Contributions by Noncontrolling Interests |
|
| 125 |
|
|
| — |
|
|
| — |
|
|
| 417 |
|
|
| 7,337 |
|
|
| 125 |
|
Distributions to Noncontrolling Interests |
|
| (8,349 | ) |
|
| (36,268 | ) |
|
| (6,608 | ) |
|
| (11,782 | ) |
|
| (7,158 | ) |
|
| (9,831 | ) |
Deconsolidation of previously consolidated Noncontrolling Interests |
|
| — |
|
|
| — |
|
|
| (117,350 | ) | ||||||||||||
Other |
|
| — |
|
|
| 25,839 |
|
|
| — |
| ||||||||||||
Balance, end of year |
| $ | 4,708 |
|
| $ | 10,609 |
|
| $ | 4,608 |
|
| $ | 4,673 |
|
| $ | 1,183 |
|
| $ | (2,293 | ) |
See accompanying notes
F-14F-15
ERP OPERATING LIMITED PARTNERSHIP
(Amounts in thousands)
|
| December 31, |
|
| December 31, |
|
| December 31, |
|
| December 31, |
| ||||
|
| 2017 |
|
| 2016 |
|
| 2020 |
|
| 2019 |
| ||||
ASSETS |
|
|
|
|
|
|
|
|
|
|
|
|
|
|
|
|
Investment in real estate |
|
|
|
|
|
|
|
| ||||||||
Land |
| $ | 5,996,024 |
|
| $ | 5,899,862 |
|
| $ | 5,785,367 |
|
| $ | 5,936,188 |
|
Depreciable property |
|
| 19,768,362 |
|
|
| 18,730,579 |
|
|
| 20,920,654 |
|
|
| 21,319,101 |
|
Projects under development |
|
| 163,547 |
|
|
| 637,168 |
|
|
| 411,134 |
|
|
| 181,630 |
|
Land held for development |
|
| 98,963 |
|
|
| 118,816 |
|
|
| 86,170 |
|
|
| 96,688 |
|
Investment in real estate |
|
| 26,026,896 |
|
|
| 25,386,425 |
|
|
| 27,203,325 |
|
|
| 27,533,607 |
|
Accumulated depreciation |
|
| (6,040,378 | ) |
|
| (5,360,389 | ) |
|
| (7,859,657 | ) |
|
| (7,276,786 | ) |
Investment in real estate, net |
|
| 19,986,518 |
|
|
| 20,026,036 |
|
|
| 19,343,668 |
|
|
| 20,256,821 |
|
Investments in unconsolidated entities |
|
| 52,782 |
|
|
| 52,238 |
| ||||||||
Cash and cash equivalents |
|
| 50,647 |
|
|
| 77,207 |
|
|
| 42,591 |
|
|
| 45,753 |
|
Investments in unconsolidated entities |
|
| 58,254 |
|
|
| 60,141 |
| ||||||||
Restricted deposits |
|
| 50,115 |
|
|
| 141,881 |
|
|
| 57,137 |
|
|
| 71,246 |
|
Right-of-use assets |
|
| 499,287 |
|
|
| 512,774 |
| ||||||||
Other assets |
|
| 425,065 |
|
|
| 398,883 |
|
|
| 291,426 |
|
|
| 233,937 |
|
Total assets |
| $ | 20,570,599 |
|
| $ | 20,704,148 |
|
| $ | 20,286,891 |
|
| $ | 21,172,769 |
|
|
|
|
|
|
|
|
|
|
|
|
|
|
|
|
|
|
LIABILITIES AND CAPITAL |
|
|
|
|
|
|
|
|
|
|
|
|
|
|
|
|
Liabilities: |
|
|
|
|
|
|
|
|
|
|
|
|
|
|
|
|
Mortgage notes payable, net |
| $ | 3,618,722 |
|
| $ | 4,119,181 |
|
| $ | 2,293,890 |
|
| $ | 1,941,610 |
|
Notes, net |
|
| 5,038,812 |
|
|
| 4,848,079 |
|
|
| 5,335,536 |
|
|
| 6,077,513 |
|
Line of credit and commercial paper |
|
| 299,757 |
|
|
| 19,998 |
|
|
| 414,830 |
|
|
| 1,017,833 |
|
Accounts payable and accrued expenses |
|
| 114,766 |
|
|
| 147,482 |
|
|
| 107,366 |
|
|
| 94,350 |
|
Accrued interest payable |
|
| 58,035 |
|
|
| 60,946 |
|
|
| 65,896 |
|
|
| 66,852 |
|
Lease liabilities |
|
| 329,130 |
|
|
| 331,334 |
| ||||||||
Other liabilities |
|
| 341,852 |
|
|
| 350,466 |
|
|
| 345,064 |
|
|
| 346,963 |
|
Security deposits |
|
| 65,009 |
|
|
| 62,624 |
|
|
| 60,480 |
|
|
| 70,062 |
|
Distributions payable |
|
| 192,828 |
|
|
| 192,296 |
|
|
| 232,262 |
|
|
| 218,326 |
|
Total liabilities |
|
| 9,729,781 |
|
|
| 9,801,072 |
|
|
| 9,184,454 |
|
|
| 10,164,843 |
|
|
|
|
|
|
|
|
|
|
|
|
|
|
|
|
|
|
Commitments and contingencies |
|
|
|
|
|
|
|
|
|
|
|
|
|
|
|
|
|
|
|
|
|
|
|
|
|
|
|
|
|
|
|
|
|
Redeemable Limited Partners |
|
| 366,955 |
|
|
| 442,092 |
|
|
| 338,951 |
|
|
| 463,400 |
|
Capital: |
|
|
|
|
|
|
|
|
|
|
|
|
|
|
|
|
Partners’ Capital: |
|
|
|
|
|
|
|
| ||||||||
Partners’ Capital: |
|
|
|
|
|
|
|
| ||||||||
Preference Units |
|
| 37,280 |
|
|
| 37,280 |
|
|
| 37,280 |
|
|
| 37,280 |
|
General Partner |
|
| 10,293,796 |
|
|
| 10,305,707 |
|
|
| 10,532,037 |
|
|
| 10,355,789 |
|
Limited Partners |
|
| 226,691 |
|
|
| 221,297 |
|
|
| 233,162 |
|
|
| 227,837 |
|
Accumulated other comprehensive income (loss) |
|
| (88,612 | ) |
|
| (113,909 | ) |
|
| (43,666 | ) |
|
| (77,563 | ) |
Total partners’ capital |
|
| 10,469,155 |
|
|
| 10,450,375 |
| ||||||||
Total partners’ capital |
|
| 10,758,813 |
|
|
| 10,543,343 |
| ||||||||
Noncontrolling Interests – Partially Owned Properties |
|
| 4,708 |
|
|
| 10,609 |
|
|
| 4,673 |
|
|
| 1,183 |
|
Total capital |
|
| 10,473,863 |
|
|
| 10,460,984 |
|
|
| 10,763,486 |
|
|
| 10,544,526 |
|
Total liabilities and capital |
| $ | 20,570,599 |
|
| $ | 20,704,148 |
|
| $ | 20,286,891 |
|
| $ | 21,172,769 |
|
See accompanying notes
F-15F-16
ERP OPERATING LIMITED PARTNERSHIP
CONSOLIDATED STATEMENTS OF OPERATIONS AND COMPREHENSIVE INCOME
(Amounts in thousands except per Unit data)
|
| Year Ended December 31, |
|
| Year Ended December 31, |
| ||||||||||||||||||
|
| 2017 |
|
| 2016 |
|
| 2015 |
|
| 2020 |
|
| 2019 |
|
| 2018 |
| ||||||
REVENUES |
|
|
|
|
|
|
|
|
|
|
|
|
|
|
|
|
|
|
|
|
|
|
|
|
Rental income |
| $ | 2,470,689 |
|
| $ | 2,422,233 |
|
| $ | 2,736,578 |
|
| $ | 2,571,705 |
|
| $ | 2,700,691 |
|
| $ | 2,577,681 |
|
Fee and asset management |
|
| 717 |
|
|
| 3,567 |
|
|
| 8,387 |
| ||||||||||||
Total revenues |
|
| 2,471,406 |
|
|
| 2,425,800 |
|
|
| 2,744,965 |
| ||||||||||||
|
|
|
|
|
|
|
|
|
|
|
|
| ||||||||||||
EXPENSES |
|
|
|
|
|
|
|
|
|
|
|
|
|
|
|
|
|
|
|
|
|
|
|
|
Property and maintenance |
|
| 405,281 |
|
|
| 406,823 |
|
|
| 479,160 |
|
|
| 440,998 |
|
|
| 446,845 |
|
|
| 429,335 |
|
Real estate taxes and insurance |
|
| 335,495 |
|
|
| 317,387 |
|
|
| 339,802 |
|
|
| 381,562 |
|
|
| 366,139 |
|
|
| 357,814 |
|
Property management |
|
| 85,493 |
|
|
| 82,015 |
|
|
| 86,206 |
|
|
| 93,825 |
|
|
| 95,344 |
|
|
| 92,485 |
|
General and administrative |
|
| 52,224 |
|
|
| 57,840 |
|
|
| 64,664 |
|
|
| 48,305 |
|
|
| 52,757 |
|
|
| 53,813 |
|
Depreciation |
|
| 743,749 |
|
|
| 705,649 |
|
|
| 765,895 |
|
|
| 820,832 |
|
|
| 831,083 |
|
|
| 785,725 |
|
Total expenses |
|
| 1,785,522 |
|
|
| 1,792,168 |
|
|
| 1,719,172 |
| ||||||||||||
|
|
|
|
|
|
|
|
|
|
|
|
| ||||||||||||
Net gain (loss) on sales of real estate properties |
|
| 531,807 |
|
|
| 447,637 |
|
|
| 256,810 |
| ||||||||||||
Impairment |
|
| 1,693 |
|
|
| — |
|
|
| — |
|
|
| — |
|
|
| — |
|
|
| (702 | ) |
Total expenses |
|
| 1,623,935 |
|
|
| 1,569,714 |
|
|
| 1,735,727 |
| ||||||||||||
|
|
|
|
|
|
|
|
|
|
|
|
|
|
|
|
|
|
|
|
|
|
|
|
|
Operating income |
|
| 847,471 |
|
|
| 856,086 |
|
|
| 1,009,238 |
|
|
| 1,317,990 |
|
|
| 1,356,160 |
|
|
| 1,114,617 |
|
|
|
|
|
|
|
|
|
|
|
|
|
|
|
|
|
|
|
|
|
|
|
|
|
|
Interest and other income |
|
| 6,136 |
|
|
| 65,773 |
|
|
| 7,372 |
|
|
| 5,935 |
|
|
| 3,201 |
|
|
| 16,070 |
|
Other expenses |
|
| (5,186 | ) |
|
| (10,368 | ) |
|
| (2,942 | ) |
|
| (17,510 | ) |
|
| (18,177 | ) |
|
| (17,267 | ) |
Interest: |
|
|
|
|
|
|
|
|
|
|
|
|
|
|
|
|
|
|
|
|
|
|
|
|
Expense incurred, net |
|
| (383,890 | ) |
|
| (482,246 | ) |
|
| (444,487 | ) |
|
| (365,073 | ) |
|
| (390,076 | ) |
|
| (413,360 | ) |
Amortization of deferred financing costs |
|
| (8,526 | ) |
|
| (12,633 | ) |
|
| (10,801 | ) |
|
| (8,939 | ) |
|
| (11,670 | ) |
|
| (11,310 | ) |
Income before income and other taxes, income (loss) from investments in unconsolidated entities, net gain (loss) on sales of real estate properties and land parcels and discontinued operations |
|
| 456,005 |
|
|
| 416,612 |
|
|
| 558,380 |
| ||||||||||||
Income before income and other taxes, income (loss) from investments in unconsolidated entities and net gain (loss) on sales of land parcels |
|
| 932,403 |
|
|
| 939,438 |
|
|
| 688,750 |
| ||||||||||||
Income and other tax (expense) benefit |
|
| (478 | ) |
|
| (1,613 | ) |
|
| (917 | ) |
|
| (852 | ) |
|
| 2,281 |
|
|
| (878 | ) |
Income (loss) from investments in unconsolidated entities |
|
| (3,370 | ) |
|
| 4,801 |
|
|
| 15,025 |
|
|
| (3,284 | ) |
|
| 65,945 |
|
|
| (3,667 | ) |
Net gain (loss) on sales of real estate properties |
|
| 157,057 |
|
|
| 4,044,055 |
|
|
| 335,134 |
| ||||||||||||
Net gain (loss) on sales of land parcels |
|
| 19,167 |
|
|
| 15,731 |
|
|
| (1 | ) |
|
| 34,234 |
|
|
| 2,044 |
|
|
| 987 |
|
Income from continuing operations |
|
| 628,381 |
|
|
| 4,479,586 |
|
|
| 907,621 |
| ||||||||||||
Discontinued operations, net |
|
| — |
|
|
| 518 |
|
|
| 397 |
| ||||||||||||
Net income |
|
| 628,381 |
|
|
| 4,480,104 |
|
|
| 908,018 |
|
|
| 962,501 |
|
|
| 1,009,708 |
|
|
| 685,192 |
|
Net (income) loss attributable to Noncontrolling Interests – Partially Owned Properties |
|
| (2,323 | ) |
|
| (16,430 | ) |
|
| (3,657 | ) |
|
| (14,855 | ) |
|
| (3,297 | ) |
|
| (2,718 | ) |
Net income attributable to controlling interests |
| $ | 626,058 |
|
| $ | 4,463,674 |
|
| $ | 904,361 |
|
| $ | 947,646 |
|
| $ | 1,006,411 |
|
| $ | 682,474 |
|
ALLOCATION OF NET INCOME: |
|
|
|
|
|
|
|
|
|
|
|
|
|
|
|
|
|
|
|
|
|
|
|
|
Preference Units |
| $ | 3,091 |
|
| $ | 3,091 |
|
| $ | 3,357 |
|
| $ | 3,090 |
|
| $ | 3,090 |
|
| $ | 3,090 |
|
Premium on redemption of Preference Units |
| $ | — |
|
| $ | — |
|
| $ | 3,486 |
| ||||||||||||
|
|
|
|
|
|
|
|
|
|
|
|
|
|
|
|
|
|
|
|
|
|
|
|
|
General Partner |
| $ | 600,363 |
|
| $ | 4,289,072 |
|
| $ | 863,277 |
|
| $ | 910,546 |
|
| $ | 967,287 |
|
| $ | 654,445 |
|
Limited Partners |
|
| 22,604 |
|
|
| 171,511 |
|
|
| 34,241 |
|
|
| 34,010 |
|
|
| 36,034 |
|
|
| 24,939 |
|
Net income available to Units |
| $ | 622,967 |
|
| $ | 4,460,583 |
|
| $ | 897,518 |
|
| $ | 944,556 |
|
| $ | 1,003,321 |
|
| $ | 679,384 |
|
|
|
|
|
|
|
|
|
|
|
|
|
|
|
|
|
|
|
|
|
|
|
|
|
|
Earnings per Unit – basic: |
|
|
|
|
|
|
|
|
|
|
|
|
|
|
|
|
|
|
|
|
|
|
|
|
Income from continuing operations available to Units |
| $ | 1.64 |
|
| $ | 11.75 |
|
| $ | 2.37 |
| ||||||||||||
Net income available to Units |
| $ | 1.64 |
|
| $ | 11.75 |
|
| $ | 2.37 |
|
| $ | 2.45 |
|
| $ | 2.61 |
|
| $ | 1.78 |
|
Weighted average Units outstanding |
|
| 379,869 |
|
|
| 378,829 |
|
|
| 377,074 |
|
|
| 384,794 |
|
|
| 383,368 |
|
|
| 380,921 |
|
|
|
|
|
|
|
|
|
|
|
|
|
|
|
|
|
|
|
|
|
|
|
|
|
|
Earnings per Unit – diluted: |
|
|
|
|
|
|
|
|
|
|
|
|
|
|
|
|
|
|
|
|
|
|
|
|
Income from continuing operations available to Units |
| $ | 1.63 |
|
| $ | 11.68 |
|
| $ | 2.36 |
| ||||||||||||
Net income available to Units |
| $ | 1.63 |
|
| $ | 11.68 |
|
| $ | 2.36 |
|
| $ | 2.45 |
|
| $ | 2.60 |
|
| $ | 1.77 |
|
Weighted average Units outstanding |
|
| 382,678 |
|
|
| 381,992 |
|
|
| 380,620 |
|
|
| 385,874 |
|
|
| 386,333 |
|
|
| 383,695 |
|
|
|
|
|
|
|
|
|
|
|
|
|
| ||||||||||||
Distributions declared per Unit outstanding |
| $ | 2.015 |
|
| $ | 13.015 |
|
| $ | 2.21 |
| ||||||||||||
See accompanying notes
F-16F-17
ERP OPERATING LIMITED PARTNERSHIP
CONSOLIDATED STATEMENTS OF OPERATIONS AND COMPREHENSIVE INCOME (Continued)
(Amounts in thousands except per Unit data)
|
| Year Ended December 31, |
|
| Year Ended December 31, |
| ||||||||||||||||||
|
| 2017 |
|
| 2016 |
|
| 2015 |
|
| 2020 |
|
| 2019 |
|
| 2018 |
| ||||||
Comprehensive income: |
|
|
|
|
|
|
|
|
|
|
|
|
|
|
|
|
|
|
|
|
|
|
|
|
Net income |
| $ | 628,381 |
|
| $ | 4,480,104 |
|
| $ | 908,018 |
|
| $ | 962,501 |
|
| $ | 1,009,708 |
|
| $ | 685,192 |
|
Other comprehensive income (loss): |
|
|
|
|
|
|
|
|
|
|
|
|
|
|
|
|
|
|
|
|
|
|
|
|
Other comprehensive income (loss) – derivative instruments: |
|
|
|
|
|
|
|
|
|
|
|
|
|
|
|
|
|
|
|
|
|
|
|
|
Unrealized holding gains (losses) arising during the year |
|
| 6,439 |
|
|
| (3,915 | ) |
|
| 2,219 |
|
|
| (1,190 | ) |
|
| (33,765 | ) |
|
| 5,174 |
|
Losses reclassified into earnings from other comprehensive income |
|
| 18,858 |
|
|
| 41,758 |
|
|
| 18,244 |
|
|
| 35,087 |
|
|
| 21,188 |
|
|
| 18,452 |
|
Other comprehensive income (loss) – foreign currency: |
|
|
|
|
|
|
|
|
|
|
|
| ||||||||||||
Currency translation adjustments arising during the year |
|
| — |
|
|
| 264 |
|
|
| (327 | ) | ||||||||||||
Other comprehensive income (loss) |
|
| 25,297 |
|
|
| 38,107 |
|
|
| 20,136 |
|
|
| 33,897 |
|
|
| (12,577 | ) |
|
| 23,626 |
|
Comprehensive income |
|
| 653,678 |
|
|
| 4,518,211 |
|
|
| 928,154 |
|
|
| 996,398 |
|
|
| 997,131 |
|
|
| 708,818 |
|
Comprehensive (income) attributable to Noncontrolling Interests – Partially Owned Properties |
|
| (2,323 | ) |
|
| (16,430 | ) |
|
| (3,657 | ) |
|
| (14,855 | ) |
|
| (3,297 | ) |
|
| (2,718 | ) |
Comprehensive income attributable to controlling interests |
| $ | 651,355 |
|
| $ | 4,501,781 |
|
| $ | 924,497 |
|
| $ | 981,543 |
|
| $ | 993,834 |
|
| $ | 706,100 |
|
See accompanying notes
F-17F-18
ERP OPERATING LIMITED PARTNERSHIP
CONSOLIDATED STATEMENTS OF CASH FLOWS
(Amounts in thousands)
|
| Year Ended December 31, |
|
| Year Ended December 31, |
| ||||||||||||||||||
|
| 2017 |
|
| 2016 |
|
| 2015 |
|
| 2020 |
|
| 2019 |
|
| 2018 |
| ||||||
CASH FLOWS FROM OPERATING ACTIVITIES: |
|
|
|
|
|
|
|
|
|
|
|
|
|
|
|
|
|
|
|
|
|
|
|
|
Net income |
| $ | 628,381 |
|
| $ | 4,480,104 |
|
| $ | 908,018 |
|
| $ | 962,501 |
|
| $ | 1,009,708 |
|
| $ | 685,192 |
|
Adjustments to reconcile net income to net cash provided by operating activities: |
|
|
|
|
|
|
|
|
|
|
|
|
|
|
|
|
|
|
|
|
|
|
|
|
Depreciation |
|
| 743,749 |
|
|
| 705,649 |
|
|
| 765,895 |
|
|
| 820,832 |
|
|
| 831,083 |
|
|
| 785,725 |
|
Amortization of deferred financing costs |
|
| 8,526 |
|
|
| 12,633 |
|
|
| 10,801 |
|
|
| 8,939 |
|
|
| 11,670 |
|
|
| 11,310 |
|
Amortization of above/below market lease intangibles |
|
| 3,828 |
|
|
| 3,426 |
|
|
| 3,382 |
|
|
| (71 | ) |
|
| (71 | ) |
|
| 4,392 |
|
Amortization of discounts and premiums on debt |
|
| 3,536 |
|
|
| (17,986 | ) |
|
| (10,569 | ) |
|
| 5,231 |
|
|
| 11,780 |
|
|
| 22,781 |
|
Amortization of deferred settlements on derivative instruments |
|
| 18,847 |
|
|
| 41,680 |
|
|
| 18,075 |
|
|
| 35,075 |
|
|
| 21,176 |
|
|
| 18,440 |
|
Amortization of right-of-use assets |
|
| 11,682 |
|
|
| 11,764 |
|
|
| — |
| ||||||||||||
Impairment |
|
| 1,693 |
|
|
| — |
|
|
| — |
|
|
| — |
|
|
| — |
|
|
| 702 |
|
Write-off of pursuit costs |
|
| 3,106 |
|
|
| 4,092 |
|
|
| 2,878 |
|
|
| 6,869 |
|
|
| 5,529 |
|
|
| 4,450 |
|
(Income) loss from investments in unconsolidated entities |
|
| 3,370 |
|
|
| (4,801 | ) |
|
| (15,025 | ) |
|
| 3,284 |
|
|
| (65,945 | ) |
|
| 3,667 |
|
Distributions from unconsolidated entities – return on capital |
|
| 2,632 |
|
|
| 2,863 |
|
|
| 4,741 |
|
|
| 100 |
|
|
| 2,621 |
|
|
| 2,492 |
|
Net (gain) loss on sales of investment securities and other investments |
|
| — |
|
|
| (58,409 | ) |
|
| (526 | ) | ||||||||||||
Net (gain) loss on sales of real estate properties |
|
| (157,057 | ) |
|
| (4,044,055 | ) |
|
| (335,134 | ) |
|
| (531,807 | ) |
|
| (447,637 | ) |
|
| (256,810 | ) |
Net (gain) loss on sales of land parcels |
|
| (19,167 | ) |
|
| (15,731 | ) |
|
| 1 |
|
|
| (34,234 | ) |
|
| (2,044 | ) |
|
| (987 | ) |
Net (gain) loss on sales of discontinued operations |
|
| — |
|
|
| (43 | ) |
|
| — |
| ||||||||||||
Net (gain) loss on debt extinguishment |
|
| 12,258 |
|
|
| 114,666 |
|
|
| — |
|
|
| 26,150 |
|
|
| 13,647 |
|
|
| 22,110 |
|
Realized/unrealized (gain) loss on derivative instruments |
|
| — |
|
|
| 74 |
|
|
| 3,055 |
|
|
| 50 |
|
|
| — |
|
|
| 50 |
|
Compensation paid with Company Common Shares |
|
| 24,997 |
|
|
| 30,530 |
|
|
| 34,607 |
|
|
| 23,174 |
|
|
| 24,449 |
|
|
| 27,132 |
|
Other operating activities, net |
|
| 1,805 |
|
|
| (287 | ) |
|
| — |
| ||||||||||||
Changes in assets and liabilities: |
|
|
|
|
|
|
|
|
|
|
|
|
|
|
|
|
|
|
|
|
|
|
|
|
(Increase) decrease in other assets |
|
| (449 | ) |
|
| 31,147 |
|
|
| (41,803 | ) |
|
| (53,021 | ) |
|
| 6,278 |
|
|
| 4,097 |
|
Increase (decrease) in accounts payable and accrued expenses |
|
| 11,532 |
|
|
| (6,061 | ) |
|
| (1,667 | ) |
|
| 470 |
|
|
| 5,116 |
|
|
| (1,862 | ) |
Increase (decrease) in accrued interest payable |
|
| (2,911 | ) |
|
| (24,275 | ) |
|
| (4,319 | ) |
|
| (956 | ) |
|
| 4,230 |
|
|
| 4,587 |
|
Increase (decrease) in lease liabilities |
|
| (2,204 | ) |
|
| (2,269 | ) |
|
| — |
| ||||||||||||
Increase (decrease) in other liabilities |
|
| (23,468 | ) |
|
| (26,422 | ) |
|
| 12,269 |
|
|
| (8,751 | ) |
|
| 13,382 |
|
|
| 16,578 |
|
Increase (decrease) in security deposits |
|
| 2,385 |
|
|
| (14,958 | ) |
|
| 1,949 |
|
|
| (9,582 | ) |
|
| 2,804 |
|
|
| 2,249 |
|
Net cash provided by operating activities |
|
| 1,265,788 |
|
|
| 1,214,123 |
|
|
| 1,356,628 |
|
|
| 1,265,536 |
|
|
| 1,456,984 |
|
|
| 1,356,295 |
|
CASH FLOWS FROM INVESTING ACTIVITIES: |
|
|
|
|
|
|
|
|
|
|
|
|
|
|
|
|
|
|
|
|
|
|
|
|
Investment in real estate – acquisitions |
|
| (466,394 | ) |
|
| (205,880 | ) |
|
| (331,336 | ) |
|
| (48,898 | ) |
|
| (1,518,878 | ) |
|
| (708,092 | ) |
Investment in real estate – development/other |
|
| (276,382 | ) |
|
| (566,825 | ) |
|
| (653,897 | ) |
|
| (230,332 | ) |
|
| (195,692 | ) |
|
| (154,431 | ) |
Capital expenditures to real estate |
|
| (202,607 | ) |
|
| (172,177 | ) |
|
| (182,113 | ) |
|
| (135,979 | ) |
|
| (178,423 | ) |
|
| (188,501 | ) |
Non-real estate capital additions |
|
| (1,506 | ) |
|
| (5,731 | ) |
|
| (3,991 | ) |
|
| (20,100 | ) |
|
| (4,955 | ) |
|
| (4,505 | ) |
Interest capitalized for real estate under development |
|
| (26,290 | ) |
|
| (51,451 | ) |
|
| (59,885 | ) |
|
| (10,165 | ) |
|
| (6,884 | ) |
|
| (6,260 | ) |
Proceeds from disposition of real estate, net |
|
| 384,583 |
|
|
| 6,824,659 |
|
|
| 504,748 |
|
|
| 1,113,972 |
|
|
| 1,064,619 |
|
|
| 691,526 |
|
Investments in unconsolidated entities |
|
| (6,034 | ) |
|
| (5,266 | ) |
|
| (23,019 | ) |
|
| (5,775 | ) |
|
| (9,604 | ) |
|
| (6,571 | ) |
Distributions from unconsolidated entities – return of capital |
|
| 334 |
|
|
| 13,798 |
|
|
| 51,144 |
|
|
| 1,636 |
|
|
| 78,262 |
|
|
| — |
|
Proceeds from sale of investment securities and other investments |
|
| — |
|
|
| 72,815 |
|
|
| 2,535 |
| ||||||||||||
Purchase of investment securities and other investments |
|
| (773 | ) |
|
| (269 | ) |
|
| — |
| ||||||||||||
Net cash provided by (used for) investing activities |
|
| (594,296 | ) |
|
| 5,903,942 |
|
|
| (695,814 | ) |
|
| 663,586 |
|
|
| (771,824 | ) |
|
| (376,834 | ) |
See accompanying notes
F-18F-19
ERP OPERATING LIMITED PARTNERSHIP
CONSOLIDATED STATEMENTS OF CASH FLOWS (Continued)
(Amounts in thousands)
|
| Year Ended December 31, |
|
| Year Ended December 31, |
| ||||||||||||||||||
|
| 2017 |
|
| 2016 |
|
| 2015 |
|
| 2020 |
|
| 2019 |
|
| 2018 |
| ||||||
CASH FLOWS FROM FINANCING ACTIVITIES: |
|
|
|
|
|
|
|
|
|
|
|
|
|
|
|
|
|
|
|
|
|
|
|
|
Debt financing costs |
| $ | (6,289 | ) |
| $ | (13,305 | ) |
| $ | (6,425 | ) |
| $ | (2,923 | ) |
| $ | (19,812 | ) |
| $ | (8,583 | ) |
Mortgage notes payable, net: |
|
|
|
|
|
|
|
|
|
|
|
|
|
|
|
|
|
|
|
|
|
|
|
|
Proceeds |
|
| 519,204 |
|
|
| 295,771 |
|
|
| 96,935 |
| ||||||||||||
Lump sum payoffs |
|
| (493,420 | ) |
|
| (583,122 | ) |
|
| (359,244 | ) |
|
| (160,522 | ) |
|
| (743,021 | ) |
|
| (1,347,939 | ) |
Scheduled principal repayments |
|
| (10,704 | ) |
|
| (8,544 | ) |
|
| (9,275 | ) |
|
| (7,759 | ) |
|
| (6,808 | ) |
|
| (6,629 | ) |
Net gain (loss) on debt extinguishment |
|
| (12,258 | ) |
|
| (31,732 | ) |
|
| — |
|
|
| (327 | ) |
|
| (3,381 | ) |
|
| (22,110 | ) |
Notes, net: |
|
|
|
|
|
|
|
|
|
|
|
|
|
|
|
|
|
|
|
|
|
|
|
|
Proceeds |
|
| 692,466 |
|
|
| 496,705 |
|
|
| 746,391 |
|
|
| — |
|
|
| 1,194,468 |
|
|
| 896,294 |
|
Lump sum payoffs |
|
| (497,975 | ) |
|
| (1,500,000 | ) |
|
| (300,000 | ) |
|
| (750,000 | ) |
|
| (1,050,000 | ) |
|
| — |
|
Net gain (loss) on debt extinguishment |
|
| — |
|
|
| (82,934 | ) |
|
| — |
|
|
| (25,823 | ) |
|
| (10,266 | ) |
|
| — |
|
Line of credit and commercial paper: |
|
|
|
|
|
|
|
|
|
|
|
|
|
|
|
|
|
|
|
|
|
|
|
|
Line of credit proceeds |
|
| 1,845,000 |
|
|
| 426,000 |
|
|
| 3,770,000 |
|
|
| 1,870,000 |
|
|
| 6,010,000 |
|
|
| 3,805,000 |
|
Line of credit repayments |
|
| (1,845,000 | ) |
|
| (426,000 | ) |
|
| (4,103,000 | ) |
|
| (1,890,000 | ) |
|
| (5,990,000 | ) |
|
| (3,805,000 | ) |
Commercial paper proceeds |
|
| 5,066,509 |
|
|
| 1,760,194 |
|
|
| 3,932,304 |
|
|
| 7,450,997 |
|
|
| 15,944,800 |
|
|
| 14,030,926 |
|
Commercial paper repayments |
|
| (4,786,750 | ) |
|
| (2,127,472 | ) |
|
| (3,545,028 | ) |
|
| (8,034,000 | ) |
|
| (15,446,150 | ) |
|
| (13,831,500 | ) |
Proceeds from (payments on) settlement of derivative instruments |
|
| 1,295 |
|
|
| (4,662 | ) |
|
| (13,938 | ) |
|
| (1,240 | ) |
|
| (41,616 | ) |
|
| 18,118 |
|
Proceeds from EQR’s Employee Share Purchase Plan (ESPP) |
|
| 3,744 |
|
|
| 3,686 |
|
|
| 4,404 |
| ||||||||||||
Prepaid finance ground lease |
|
| — |
|
|
| (34,734 | ) |
|
| — |
| ||||||||||||
Proceeds from EQR’s Employee Share Purchase Plan (ESPP) |
|
| 4,508 |
|
|
| 3,116 |
|
|
| 3,879 |
| ||||||||||||
Proceeds from exercise of EQR options |
|
| 31,596 |
|
|
| 35,833 |
|
|
| 59,508 |
|
|
| 12,275 |
|
|
| 77,785 |
|
|
| 30,655 |
|
Redemption of Preference Units |
|
| — |
|
|
| — |
|
|
| (12,720 | ) | ||||||||||||
Premium on redemption of Preference Units |
|
| — |
|
|
| — |
|
|
| (3,486 | ) | ||||||||||||
Payment of offering costs |
|
| (51 | ) |
|
| (314 | ) |
|
| (79 | ) |
|
| — |
|
|
| (991 | ) |
|
| (27 | ) |
Other financing activities, net |
|
| (63 | ) |
|
| (49 | ) |
|
| (49 | ) |
|
| (63 | ) |
|
| (80 | ) |
|
| (78 | ) |
Acquisition of Noncontrolling Interests – Partially Owned Properties |
|
| — |
|
|
| — |
|
|
| (13 | ) | ||||||||||||
Contributions – Noncontrolling Interests – Partially Owned Properties |
|
| 125 |
|
|
| — |
|
|
| — |
|
|
| 417 |
|
|
| 7,337 |
|
|
| 125 |
|
Contributions – Limited Partners |
|
| — |
|
|
| 1 |
|
|
| 3 |
|
|
| 13 |
|
|
| 2 |
|
|
| 1 |
|
Distributions: |
|
|
|
|
|
|
|
|
|
|
|
|
|
|
|
|
|
|
|
|
|
|
|
|
OP Units – General Partner |
|
| (739,375 | ) |
|
| (4,771,725 | ) |
|
| (784,748 | ) |
|
| (883,938 | ) |
|
| (831,111 | ) |
|
| (782,122 | ) |
Preference Units |
|
| (3,091 | ) |
|
| (2,318 | ) |
|
| (3,357 | ) |
|
| (3,090 | ) |
|
| (3,090 | ) |
|
| (3,863 | ) |
OP Units – Limited Partners |
|
| (27,291 | ) |
|
| (188,115 | ) |
|
| (30,869 | ) |
|
| (32,403 | ) |
|
| (29,615 | ) |
|
| (28,226 | ) |
Noncontrolling Interests – Partially Owned Properties |
|
| (8,286 | ) |
|
| (36,219 | ) |
|
| (6,559 | ) |
|
| (11,719 | ) |
|
| (7,078 | ) |
|
| (9,753 | ) |
Net cash provided by (used for) financing activities |
|
| (789,818 | ) |
|
| (7,054,092 | ) |
|
| (666,167 | ) |
|
| (1,946,393 | ) |
|
| (684,474 | ) |
|
| (963,910 | ) |
Net increase (decrease) in cash and cash equivalents and restricted deposits |
|
| (118,326 | ) |
|
| 63,973 |
|
|
| (5,353 | ) |
|
| (17,271 | ) |
|
| 686 |
|
|
| 15,551 |
|
Cash and cash equivalents and restricted deposits, beginning of year |
|
| 219,088 |
|
|
| 155,115 |
|
|
| 160,468 |
|
|
| 116,999 |
|
|
| 116,313 |
|
|
| 100,762 |
|
Cash and cash equivalents and restricted deposits, end of year |
| $ | 100,762 |
|
| $ | 219,088 |
|
| $ | 155,115 |
|
| $ | 99,728 |
|
| $ | 116,999 |
|
| $ | 116,313 |
|
|
|
|
|
|
|
|
|
|
|
|
|
|
|
|
|
|
|
|
|
|
|
|
|
|
Cash and cash equivalents and restricted deposits, end of year |
|
|
|
|
|
|
|
|
|
|
|
|
|
|
|
|
|
|
|
|
|
|
|
|
Cash and cash equivalents |
| $ | 50,647 |
|
| $ | 77,207 |
|
| $ | 42,276 |
|
| $ | 42,591 |
|
| $ | 45,753 |
|
| $ | 47,442 |
|
Restricted deposits |
|
| 50,115 |
|
|
| 141,881 |
|
|
| 112,839 |
|
|
| 57,137 |
|
|
| 71,246 |
|
|
| 68,871 |
|
Total cash and cash equivalents and restricted deposits, end of year |
| $ | 100,762 |
|
| $ | 219,088 |
|
| $ | 155,115 |
|
| $ | 99,728 |
|
| $ | 116,999 |
|
| $ | 116,313 |
|
See accompanying notes
F-19F-20
ERP OPERATING LIMITED PARTNERSHIP
CONSOLIDATED STATEMENTS OF CASH FLOWS (Continued)
(Amounts in thousands)
|
| Year Ended December 31, |
|
| Year Ended December 31, |
| ||||||||||||||||||
|
| 2017 |
|
| 2016 |
|
| 2015 |
|
| 2020 |
|
| 2019 |
|
| 2018 |
| ||||||
SUPPLEMENTAL INFORMATION: |
|
|
|
|
|
|
|
|
|
|
|
|
|
|
|
|
|
|
|
|
|
|
|
|
Cash paid for interest, net of amounts capitalized |
| $ | 360,273 |
|
| $ | 482,152 |
|
| $ | 436,748 |
|
| $ | 320,854 |
|
| $ | 342,048 |
|
| $ | 358,156 |
|
Net cash paid for income and other taxes |
| $ | 640 |
|
| $ | 1,494 |
|
| $ | 1,264 |
| ||||||||||||
Real estate acquisitions/dispositions/other: |
|
|
|
|
|
|
|
|
|
|
|
| ||||||||||||
Mortgage loans assumed |
| $ | — |
|
| $ | 43,400 |
|
| $ | — |
| ||||||||||||
Net cash paid (received) for income and other taxes |
| $ | (1,038 | ) |
| $ | (585 | ) |
| $ | 853 |
| ||||||||||||
Amortization of deferred financing costs: |
|
|
|
|
|
|
|
|
|
|
|
|
|
|
|
|
|
|
|
|
|
|
|
|
Investment in real estate, net |
| $ | (240 | ) |
| $ | (120 | ) |
| $ | — |
| ||||||||||||
Other assets |
| $ | 2,412 |
|
| $ | 3,366 |
|
| $ | 3,054 |
|
| $ | 2,338 |
|
| $ | 2,987 |
|
| $ | 2,412 |
|
Mortgage notes payable, net |
| $ | 2,493 |
|
| $ | 3,978 |
|
| $ | 3,589 |
|
| $ | 1,815 |
|
| $ | 3,934 |
|
| $ | 4,792 |
|
Notes, net |
| $ | 3,621 |
|
| $ | 5,289 |
|
| $ | 4,158 |
|
| $ | 5,026 |
|
| $ | 4,869 |
|
| $ | 4,106 |
|
Amortization of discounts and premiums on debt: |
|
|
|
|
|
|
|
|
|
|
|
|
|
|
|
|
|
|
|
|
|
|
|
|
Mortgage notes payable, net |
| $ | 1,172 |
|
| $ | (21,158 | ) |
| $ | (13,126 | ) |
| $ | 2,234 |
|
| $ | 8,618 |
|
| $ | 20,144 |
|
Notes, net |
| $ | 2,364 |
|
| $ | 3,172 |
|
| $ | 2,557 |
|
| $ | 2,997 |
|
| $ | 3,162 |
|
| $ | 2,637 |
|
Amortization of deferred settlements on derivative instruments: |
|
|
|
|
|
|
|
|
|
|
|
|
|
|
|
|
|
|
|
|
|
|
|
|
Other liabilities |
| $ | (11 | ) |
| $ | (78 | ) |
| $ | (169 | ) |
| $ | (12 | ) |
| $ | (12 | ) |
| $ | (12 | ) |
Accumulated other comprehensive income |
| $ | 18,858 |
|
| $ | 41,758 |
|
| $ | 18,244 |
|
| $ | 35,087 |
|
| $ | 21,188 |
|
| $ | 18,452 |
|
Write-off of pursuit costs: |
|
|
|
|
|
|
|
|
|
|
|
|
|
|
|
|
|
|
|
|
|
|
|
|
Investment in real estate, net |
| $ | 2,965 |
|
| $ | 3,586 |
|
| $ | 2,804 |
|
| $ | 6,566 |
|
| $ | 5,451 |
|
| $ | 4,364 |
|
Other assets |
| $ | 17 |
|
| $ | 402 |
|
| $ | 74 |
|
| $ | 271 |
|
| $ | 62 |
|
| $ | 53 |
|
Accounts payable and accrued expenses |
| $ | 124 |
|
| $ | 104 |
|
| $ | — |
|
| $ | 32 |
|
| $ | 16 |
|
| $ | 33 |
|
(Income) loss from investments in unconsolidated entities: |
|
|
|
|
|
|
|
|
|
|
|
|
|
|
|
|
|
|
|
|
|
|
|
|
Investments in unconsolidated entities |
| $ | 1,955 |
|
| $ | (6,327 | ) |
| $ | (17,340 | ) |
| $ | 1,995 |
|
| $ | (67,268 | ) |
| $ | 2,304 |
|
Other liabilities |
| $ | 1,415 |
|
| $ | 1,526 |
|
| $ | 2,315 |
|
| $ | 1,289 |
|
| $ | 1,323 |
|
| $ | 1,363 |
|
Distributions from unconsolidated entities – return on capital: |
|
|
|
|
|
|
|
|
|
|
|
| ||||||||||||
Investments in unconsolidated entities |
| $ | 2,632 |
|
| $ | 2,863 |
|
| $ | 4,606 |
| ||||||||||||
Other liabilities |
| $ | — |
|
| $ | — |
|
| $ | 135 |
| ||||||||||||
Realized/unrealized (gain) loss on derivative instruments: |
|
|
|
|
|
|
|
|
|
|
|
|
|
|
|
|
|
|
|
|
|
|
|
|
Other assets |
| $ | (4,582 | ) |
| $ | 1,798 |
|
| $ | (3,573 | ) |
| $ | — |
|
| $ | 2,002 |
|
| $ | (14,977 | ) |
Notes, net |
| $ | (3,454 | ) |
| $ | (1,798 | ) |
| $ | 2,058 |
|
| $ | — |
|
| $ | 2,277 |
|
| $ | (680 | ) |
Other liabilities |
| $ | 1,597 |
|
| $ | 3,989 |
|
| $ | 2,351 |
|
| $ | 1,240 |
|
| $ | 29,486 |
|
| $ | 10,533 |
|
Accumulated other comprehensive income |
| $ | 6,439 |
|
| $ | (3,915 | ) |
| $ | 2,219 |
|
| $ | (1,190 | ) |
| $ | (33,765 | ) |
| $ | 5,174 |
|
Investments in unconsolidated entities: |
|
|
|
|
|
|
|
|
|
|
|
|
|
|
|
|
|
|
|
|
|
|
|
|
Investments in unconsolidated entities |
| $ | (3,034 | ) |
| $ | (2,326 | ) |
| $ | (1,404 | ) |
| $ | (4,275 | ) |
| $ | (7,504 | ) |
| $ | (4,891 | ) |
Other liabilities |
| $ | (3,000 | ) |
| $ | (2,940 | ) |
| $ | (21,615 | ) |
| $ | (1,500 | ) |
| $ | (2,100 | ) |
| $ | (1,680 | ) |
Debt financing costs: |
|
|
|
|
|
|
|
|
|
|
|
| ||||||||||||
Other assets |
| $ | (231 | ) |
| $ | (6,909 | ) |
| $ | (145 | ) | ||||||||||||
Mortgage notes payable, net |
| $ | (2,692 | ) |
| $ | (2,354 | ) |
| $ | (555 | ) | ||||||||||||
Notes, net |
| $ | — |
|
| $ | (10,549 | ) |
| $ | (7,883 | ) | ||||||||||||
Right-of-use assets and lease liabilities initial measurement and reclassifications: |
|
|
|
|
|
|
|
|
|
|
|
| ||||||||||||
Right-of-use assets |
| $ | — |
|
| $ | (489,517 | ) |
| $ | — |
| ||||||||||||
Other assets |
| $ | — |
|
| $ | 184,116 |
|
| $ | — |
| ||||||||||||
Lease liabilities |
| $ | — |
|
| $ | 333,603 |
|
| $ | — |
| ||||||||||||
Other liabilities |
| $ | — |
|
| $ | (28,202 | ) |
| $ | — |
| ||||||||||||
Proceeds from (payments on) settlement of derivative instruments: |
|
|
|
|
|
|
|
|
|
|
|
| ||||||||||||
Other assets |
| $ | — |
|
| $ | — |
|
| $ | 18,118 |
| ||||||||||||
Other liabilities |
| $ | (1,240 | ) |
| $ | (41,616 | ) |
| $ | — |
| ||||||||||||
See accompanying notes
F-20F-21
ERP OPERATING LIMITED PARTNERSHIP
CONSOLIDATED STATEMENTS OF CASH FLOWS (Continued)
(Amounts in thousands)
|
| Year Ended December 31, |
| |||||||||
|
| 2017 |
|
| 2016 |
|
| 2015 |
| |||
SUPPLEMENTAL INFORMATION (continued): |
|
|
|
|
|
|
|
|
|
|
|
|
Distributions from unconsolidated entities - return of capital: |
|
|
|
|
|
|
|
|
|
|
|
|
Investments in unconsolidated entities |
| $ | 334 |
|
| $ | 14,014 |
|
| $ | 51,144 |
|
Other assets |
| $ | — |
|
| $ | (216 | ) |
| $ | — |
|
Debt financing costs: |
|
|
|
|
|
|
|
|
|
|
|
|
Other assets |
| $ | — |
|
| $ | (8,553 | ) |
| $ | — |
|
Mortgage notes payable, net |
| $ | — |
|
| $ | (507 | ) |
| $ | (35 | ) |
Notes, net |
| $ | (6,289 | ) |
| $ | (4,245 | ) |
| $ | (6,390 | ) |
Proceeds from (payments on) settlement of derivative instruments: |
|
|
|
|
|
|
|
|
|
|
|
|
Other assets |
| $ | 1,295 |
|
| $ | — |
|
| $ | 1,848 |
|
Other liabilities |
| $ | — |
|
| $ | (4,662 | ) |
| $ | (15,786 | ) |
Other: |
|
|
|
|
|
|
|
|
|
|
|
|
Foreign currency translation adjustments |
| $ | — |
|
| $ | (264 | ) |
| $ | 327 |
|
|
|
|
|
|
|
|
|
|
|
|
|
|
See accompanying notes
F-21
ERP OPERATING LIMITED PARTNERSHIP
CONSOLIDATED STATEMENTS OF CHANGES IN CAPITAL
(Amounts in thousands)thousandsexcept per Unit data)
|
| Year Ended December 31, |
|
| Year Ended December 31, |
| ||||||||||||||||||
|
| 2017 |
|
| 2016 |
|
| 2015 |
|
| 2020 |
|
| 2019 |
|
| 2018 |
| ||||||
PARTNERS’ CAPITAL |
|
|
|
|
|
|
|
|
|
|
|
| ||||||||||||
PARTNERS’ CAPITAL |
|
|
|
|
|
|
|
|
|
|
|
| ||||||||||||
PREFERENCE UNITS |
|
|
|
|
|
|
|
|
|
|
|
|
|
|
|
|
|
|
|
|
|
|
|
|
Balance, beginning of year |
| $ | 37,280 |
|
| $ | 37,280 |
|
| $ | 50,000 |
|
| $ | 37,280 |
|
| $ | 37,280 |
|
| $ | 37,280 |
|
Partial redemption of 8.29% Series K Cumulative Redeemable |
|
| — |
|
|
| — |
|
|
| (12,720 | ) | ||||||||||||
Balance, end of year |
| $ | 37,280 |
|
| $ | 37,280 |
|
| $ | 37,280 |
|
| $ | 37,280 |
|
| $ | 37,280 |
|
| $ | 37,280 |
|
GENERAL PARTNER |
|
|
|
|
|
|
|
|
|
|
|
|
|
|
|
|
|
|
|
|
|
|
|
|
Balance, beginning of year |
| $ | 10,305,707 |
|
| $ | 10,585,104 |
|
| $ | 10,490,608 |
|
| $ | 10,355,789 |
|
| $ | 10,200,910 |
|
| $ | 10,293,796 |
|
OP Unit Issuance: |
|
|
|
|
|
|
|
|
|
|
|
|
|
|
|
|
|
|
|
|
|
|
|
|
Conversion of OP Units held by Limited Partners into OP Units held by General Partner |
|
| 15,900 |
|
|
| 3,726 |
|
|
| 4,966 |
|
|
| 4,696 |
|
|
| 10,410 |
|
|
| 4,098 |
|
Exercise of EQR share options |
|
| 31,596 |
|
|
| 35,833 |
|
|
| 59,508 |
|
|
| 12,275 |
|
|
| 77,785 |
|
|
| 30,655 |
|
EQR’s Employee Share Purchase Plan (ESPP) |
|
| 3,744 |
|
|
| 3,686 |
|
|
| 4,404 |
| ||||||||||||
Conversion of EQR restricted shares to restricted units |
|
| — |
|
|
| — |
|
|
| (70 | ) | ||||||||||||
EQR’s Employee Share Purchase Plan (ESPP) |
|
| 4,508 |
|
|
| 3,116 |
|
|
| 3,879 |
| ||||||||||||
Share-based employee compensation expense: |
|
|
|
|
|
|
|
|
|
|
|
|
|
|
|
|
|
|
|
|
|
|
|
|
EQR restricted shares |
|
| 9,777 |
|
|
| 15,016 |
|
|
| 15,066 |
|
|
| 11,225 |
|
|
| 12,438 |
|
|
| 8,258 |
|
EQR share options |
|
| 6,835 |
|
|
| 3,432 |
|
|
| 3,756 |
|
|
| 2,349 |
|
|
| 2,675 |
|
|
| 9,734 |
|
EQR ESPP discount |
|
| 747 |
|
|
| 650 |
|
|
| 884 |
|
|
| 944 |
|
|
| 642 |
|
|
| 767 |
|
Net income available to Units – General Partner |
|
| 600,363 |
|
|
| 4,289,072 |
|
|
| 863,277 |
|
|
| 910,546 |
|
|
| 967,287 |
|
|
| 654,445 |
|
OP Units – General Partner distributions |
|
| (740,459 | ) |
|
| (4,754,537 | ) |
|
| (804,825 | ) |
|
| (897,326 | ) |
|
| (842,555 | ) |
|
| (796,212 | ) |
Offering costs |
|
| (51 | ) |
|
| (314 | ) |
|
| (79 | ) |
|
| — |
|
|
| (991 | ) |
|
| (27 | ) |
Supplemental Executive Retirement Plan (SERP) |
|
| (594 | ) |
|
| 748 |
|
|
| 1,380 |
|
|
| (395 | ) |
|
| (1,675 | ) |
|
| (454 | ) |
Change in market value of Redeemable Limited Partners |
|
| 41,916 |
|
|
| 115,093 |
|
|
| (64,378 | ) |
|
| 125,224 |
|
|
| (82,283 | ) |
|
| (13,922 | ) |
Adjustment for Limited Partners ownership in Operating Partnership |
|
| 18,315 |
|
|
| 8,198 |
|
|
| 10,607 |
|
|
| 2,202 |
|
|
| 8,030 |
|
|
| 5,893 |
|
Balance, end of year |
| $ | 10,293,796 |
|
| $ | 10,305,707 |
|
| $ | 10,585,104 |
|
| $ | 10,532,037 |
|
| $ | 10,355,789 |
|
| $ | 10,200,910 |
|
LIMITED PARTNERS |
|
|
|
|
|
|
|
|
|
|
|
|
|
|
|
|
|
|
|
|
|
|
|
|
Balance, beginning of year |
| $ | 221,297 |
|
| $ | 221,379 |
|
| $ | 214,411 |
|
| $ | 227,837 |
|
| $ | 228,738 |
|
| $ | 226,691 |
|
Issuance of restricted units to Limited Partners |
|
| — |
|
|
| 1 |
|
|
| 3 |
|
|
| 13 |
|
|
| 2 |
|
|
| 1 |
|
Conversion of OP Units held by Limited Partners into OP Units held by General Partner |
|
| (15,900 | ) |
|
| (3,726 | ) |
|
| (4,966 | ) |
|
| (4,696 | ) |
|
| (10,410 | ) |
|
| (4,098 | ) |
Conversion of EQR restricted shares to restricted units |
|
| — |
|
|
| — |
|
|
| 70 |
| ||||||||||||
Equity compensation associated with Units – Limited Partners |
|
| 10,523 |
|
|
| 18,180 |
|
|
| 21,503 |
|
|
| 11,926 |
|
|
| 13,410 |
|
|
| 14,009 |
|
Net income available to Units – Limited Partners |
|
| 22,604 |
|
|
| 171,511 |
|
|
| 34,241 |
|
|
| 34,010 |
|
|
| 36,034 |
|
|
| 24,939 |
|
Units – Limited Partners distributions |
|
| (26,739 | ) |
|
| (187,448 | ) |
|
| (31,604 | ) |
|
| (32,951 | ) |
|
| (29,896 | ) |
|
| (28,682 | ) |
Change in carrying value of Redeemable Limited Partners |
|
| 33,221 |
|
|
| 9,598 |
|
|
| (1,672 | ) |
|
| (775 | ) |
|
| (2,011 | ) |
|
| 1,771 |
|
Adjustment for Limited Partners ownership in Operating Partnership |
|
| (18,315 | ) |
|
| (8,198 | ) |
|
| (10,607 | ) |
|
| (2,202 | ) |
|
| (8,030 | ) |
|
| (5,893 | ) |
Balance, end of year |
| $ | 226,691 |
|
| $ | 221,297 |
|
| $ | 221,379 |
|
| $ | 233,162 |
|
| $ | 227,837 |
|
| $ | 228,738 |
|
ACCUMULATED OTHER COMPREHENSIVE INCOME (LOSS) |
|
|
|
|
|
|
|
|
|
|
|
|
|
|
|
|
|
|
|
|
|
|
|
|
Balance, beginning of year |
| $ | (113,909 | ) |
| $ | (152,016 | ) |
| $ | (172,152 | ) |
| $ | (77,563 | ) |
| $ | (64,986 | ) |
| $ | (88,612 | ) |
Accumulated other comprehensive income (loss) – derivative instruments: |
|
|
|
|
|
|
|
|
|
|
|
|
|
|
|
|
|
|
|
|
|
|
|
|
Unrealized holding gains (losses) arising during the year |
|
| 6,439 |
|
|
| (3,915 | ) |
|
| 2,219 |
|
|
| (1,190 | ) |
|
| (33,765 | ) |
|
| 5,174 |
|
Losses reclassified into earnings from other comprehensive income |
|
| 18,858 |
|
|
| 41,758 |
|
|
| 18,244 |
|
|
| 35,087 |
|
|
| 21,188 |
|
|
| 18,452 |
|
Accumulated other comprehensive income (loss) – foreign currency: |
|
|
|
|
|
|
|
|
|
|
|
| ||||||||||||
Currency translation adjustments arising during the year |
|
| — |
|
|
| 264 |
|
|
| (327 | ) | ||||||||||||
Balance, end of year |
| $ | (88,612 | ) |
| $ | (113,909 | ) |
| $ | (152,016 | ) |
| $ | (43,666 | ) |
| $ | (77,563 | ) |
| $ | (64,986 | ) |
|
|
|
|
|
|
|
|
|
|
|
|
| ||||||||||||
DISTRIBUTIONS |
|
|
|
|
|
|
|
|
|
|
|
| ||||||||||||
Distributions declared per Unit outstanding |
| $ | 2.41 |
|
| $ | 2.27 |
|
| $ | 2.16 |
| ||||||||||||
See accompanying notes
F-22
ERP OPERATING LIMITED PARTNERSHIP
CONSOLIDATED STATEMENTS OF CHANGES IN CAPITAL (Continued)
(Amounts in thousands)thousandsexcept per Unit data)
|
| Year Ended December 31, |
|
| Year Ended December 31, |
| ||||||||||||||||||
|
| 2017 |
|
| 2016 |
|
| 2015 |
|
| 2020 |
|
| 2019 |
|
| 2018 |
| ||||||
NONCONTROLLING INTERESTS |
|
|
|
|
|
|
|
|
|
|
|
|
|
|
|
|
|
|
|
|
|
|
|
|
NONCONTROLLING INTERESTS – PARTIALLY OWNED PROPERTIES |
|
|
|
|
|
|
|
|
|
|
|
|
|
|
|
|
|
|
|
|
|
|
|
|
Balance, beginning of year |
| $ | 10,609 |
|
| $ | 4,608 |
|
| $ | 124,909 |
|
| $ | 1,183 |
|
| $ | (2,293 | ) |
| $ | 4,708 |
|
Net income attributable to Noncontrolling Interests |
|
| 2,323 |
|
|
| 16,430 |
|
|
| 3,657 |
|
|
| 14,855 |
|
|
| 3,297 |
|
|
| 2,718 |
|
Acquisitions of Noncontrolling Interests – Partially Owned Properties |
|
| — |
|
|
| — |
|
|
| (13 | ) | ||||||||||||
Contributions by Noncontrolling Interests |
|
| 125 |
|
|
| — |
|
|
| — |
|
|
| 417 |
|
|
| 7,337 |
|
|
| 125 |
|
Distributions to Noncontrolling Interests |
|
| (8,349 | ) |
|
| (36,268 | ) |
|
| (6,608 | ) |
|
| (11,782 | ) |
|
| (7,158 | ) |
|
| (9,831 | ) |
Deconsolidation of previously consolidated Noncontrolling Interests |
|
| — |
|
|
| — |
|
|
| (117,350 | ) | ||||||||||||
Other |
|
| — |
|
|
| 25,839 |
|
|
| — |
| ||||||||||||
Balance, end of year |
| $ | 4,708 |
|
| $ | 10,609 |
|
| $ | 4,608 |
|
| $ | 4,673 |
|
| $ | 1,183 |
|
| $ | (2,293 | ) |
See accompanying notes
F-23
ERP OPERATING LIMITED PARTNERSHIP
NOTES TO CONSOLIDATED FINANCIAL STATEMENTS
Equity Residential (“EQR”), a Maryland real estate investment trust (“REIT”) formed in March 1993, is an S&P 500 company focused on the acquisition, development and management of rental apartmentresidential properties located in urban and high-density suburban coastal gateway markets.around dynamic cities that attract high quality long-term renters, a business that is conducted on its behalf by ERP Operating Limited Partnership (“ERPOP”),. EQR is a Maryland real estate investment trust (“REIT”) formed in March 1993 and ERPOP is an Illinois limited partnership was formed in May 1993 to conduct the multifamily residential property business of Equity Residential. EQR has elected to be taxed as a REIT.1993. References to the “Company,” “we,” “us” or “our” mean collectively EQR, ERPOP and those entities/subsidiaries owned or controlled by EQR and/or ERPOP. References to the “Operating Partnership” mean collectively ERPOP and those entities/subsidiaries owned or controlled by ERPOP. Unless otherwise indicated, the notes to consolidated financial statements apply to both the Company and the Operating Partnership.
EQR is the general partner of, and as of December 31, 20172020 owned an approximate 96.4% ownership interest in, ERPOP. All of the Company’s property ownership, development and related business operations are conducted through the Operating Partnership and EQR has no material assets or liabilities other than its investment in ERPOP. EQR issues public equity from time to time, the net proceeds of which it is obligated to contribute to ERPOP, but does not have any indebtedness as all debt is incurred by the Operating Partnership. The Operating Partnership holds substantially all of the assets of the Company, including the Company’s ownership interests in its joint ventures. The Operating Partnership conducts the operations of the business and is structured as a partnership with no publicly traded equity.
As of December 31, 2017,2020, the Company, directly or indirectly through investments in title holding entities, owned all or a portion of 305304 properties located in 109 states and the District of Columbia consisting of 78,61177,889 apartment units. The ownership breakdown includes (table does not include various uncompleted development properties):
|
| Properties |
|
| Apartment Units |
|
| Properties |
|
| Apartment Units |
| ||||
Wholly Owned Properties |
|
| 283 |
|
|
| 73,598 |
|
|
| 287 |
|
|
| 74,328 |
|
Master-Leased Properties – Consolidated |
|
| 3 |
|
|
| 853 |
| ||||||||
Master-Leased Property – Consolidated |
|
| 1 |
|
|
| 162 |
| ||||||||
Partially Owned Properties – Consolidated |
|
| 17 |
|
|
| 3,215 |
|
|
| 16 |
|
|
| 3,399 |
|
Partially Owned Properties – Unconsolidated |
|
| 2 |
|
|
| 945 |
| ||||||||
|
|
| 305 |
|
|
| 78,611 |
|
|
| 304 |
|
|
| 77,889 |
|
The “Wholly Owned Properties” are accounted for under the consolidation method of accounting. The “Master-Leased PropertiesProperty – Consolidated” areis wholly owned by the Company but the entire project is leased to a third partythird-party corporate housing provider. These properties areThis property is consolidated and reflected as a real estate assetsasset while the master leases arelease is accounted for as an operating leases.lease. The “Partially Owned Properties – Consolidated” are controlled by the Company, but have partners with noncontrolling interests and are accounted for under the consolidation method of accounting and qualify as variable interest entities. The “Partially Owned Properties – Unconsolidated” are controlled by the Company’s partners but the Company has noncontrolling interests and are accounted for under the equity method of accounting.
COVID-19 Pandemic
The Company maintainscontinued rapid development and fast-changing nature of the novel coronavirus (“COVID-19”) pandemic creates many unknowns that have had and could continue to have a significant future impact on the Company. Its duration, severity and the extent of the adverse health impact on the general population, our residents and employees, the rollout and effectiveness of vaccines and the potential long-term ground leaseschanges in customer preferences for 14 operating properties. The Company ownsliving in our communities, are among the buildingmany unknowns. These, among other items, have impacted the economy, the unemployment rate and improvementsour operations and leases the land underlying the improvements under long-term ground leases. The expiration dates for these leases range from 2042 through 2113. These properties arecould materially affect our future consolidated results of operations, financial condition, liquidity, investments and reflected as real estate assets while the ground leases are accounted for as operating leases.overall performance.
2. | Summary of Significant Accounting Policies |
Basis of Presentation
Due to the Company’s ability as general partner to control either through ownership or by contract the Operating Partnership and its subsidiaries, the Operating Partnership and each such subsidiary has been consolidated with the Company for financial reporting purposes, except for twoany unconsolidated operating properties.properties/entities.
F-24
Real Estate Assets and Depreciation of Investment in Real Estate
Effective January 1, 2017 with the adoption of the new standard which clarified the definition of a business (discussed below in Recently Adopted Accounting Pronouncements), theThe Company expects that substantially all of its transactions will be accounted for as asset acquisitions. In an asset acquisition, the Company is required to capitalize transaction costs and allocate the purchase price on a relative fair value basis. For the yearyears ended December 31, 2017,2020 and 2019, all acquisitions were considered asset acquisitions.
For asset acquisitions, the Company allocates the purchase price of the net tangible and identified intangible assets on a relative fair value basis. In making estimates of relative fair values for purposes of allocating purchase price, the Company utilizes a number of sources, including independent appraisals that may be obtained in connection with the acquisition or financing of the respective property, our own analysis of recently acquired and existing comparable properties in our portfolio and other market data. The Company also considers information obtained about each property as a result of its pre-acquisition due diligence, marketing and leasing activities in estimating the relative fair value of the tangible and intangible assets/liabilities acquired. The Company allocates the purchase price of acquired real estate to various components as follows:
Land – Based on actual purchase price adjusted to an allocation of the relative fair value (as necessary) if acquired separately or market research/comparables if acquired with an operating property.
• | Land – Based on actual purchase price adjusted to an allocation of the relative fair value (as necessary) if acquired separately or market research/comparables if acquired with an operating property. |
Furniture, Fixtures and Equipment – Ranges between $10,000 and $25,000 per apartment unit acquired as an estimate of the allocation of the relative fair value of the appliances and fixtures inside an apartment unit. The per-apartment unit amount applied depends on the economic age of the apartment building acquired. Depreciation is calculated on the straight-line method over an estimated useful life of five to ten years.
• | Furniture, Fixtures and Equipment – Ranges between $15,000 and $40,000 per apartment unit acquired as an estimate of the allocation of the relative fair value of the appliances and fixtures inside an apartment unit. The per-apartment unit amount applied depends on the economic age of the apartment units acquired. Depreciation is calculated on the straight-line method over an estimated useful life of five to ten years. |
Lease Intangibles – The Company considers the value of acquired in-place leases and above/below market leases and the amortization period is the average remaining term of each respective acquired lease. In-place residential leases’ average term at acquisition approximates six months. In-place retail leases’ term at acquisition approximates the average remaining term of all acquired retail leases. See Note 4 for more information on above and below market leases.
• | Lease Intangibles – The Company considers the value of acquired in-place leases and above/below market leases and the amortization period is the average remaining term of each respective acquired lease. In-place residential leases’ average term at acquisition approximates six months. In-place non-residential leases’ term at acquisition approximates the average remaining term of all acquired non-residential leases. See Note 8 for more information on ground lease intangibles. |
Other Intangible Assets – The Company considers whether it has acquired other intangible assets, including any customer relationship intangibles and the amortization period is the estimated useful life of the acquired intangible asset.
• | Other Intangible Assets – The Company considers whether it has acquired other intangible assets, including any customer relationship intangibles and the amortization period is the estimated useful life of the acquired intangible asset. |
Building – Based on the allocation of the relative fair value determined on an “as-if vacant” basis. Depreciation is calculated on the straight-line method over an estimated useful life of thirty years.
• | Building – Based on the allocation of the relative fair value determined on an “as-if vacant” basis. Depreciation is calculated on the straight-line method over an estimated useful life of thirty years. |
Site Improvements – Based on replacement cost, which approximates the allocation of the relative fair value. Depreciation is calculated on the straight-line method over an estimated useful life of eight years.
Long-Term Debt – The Company calculates the allocation of the relative fair value by discounting the remaining contractual cash flows on each instrument at the current market rate for those borrowings.
• | Long-Term Debt – The Company calculates the allocation of the relative fair value by discounting the remaining contractual cash flows on each instrument at the current market rate for those borrowings. |
Replacements inside an apartment unit such as appliances and carpeting are depreciated over an estimated useful life of five to ten years. Renovation expenditures for ordinary maintenance and repairs are expensed to operations as incurred and significant renovations and improvements that improve and/or extend the useful life of the asset are capitalized over their estimated useful life, generally five to fifteen years. Initial direct leasing costs are expensed as incurred as such expense approximates the deferral and amortization of initial direct leasing costs over the lease terms.
Property sales or dispositions are recorded when titlecontrol transfers to unrelated third parties, contingencies have been removed and sufficient cash consideration has been received by the Company. Upon disposition, the related costs and accumulated depreciation are removed from the respective accounts. Any gain or loss on sale is recognized in accordance with accounting principles generally accepted in the United States.
The Company classifies real estate assets as real estate held for sale when it is probable a property will be disposed of (see below for further discussion).
of. The Company classifies properties under development and/or expansion and properties in the lease-up phase (including land) as construction-in-progress until construction has been completed and certificates of occupancy permits have been obtained.
F-25
Impairment of Long-Lived Assets
TheAt least quarterly, the Company periodically evaluates its long-lived assets, including its investmentsinvestment in real estate, for indicators of impairment. The judgments regarding the existence of impairment indicators are based on factors such as operational performance, market conditions, and legal, regulatory and environmental concerns, the Company’s intent and ability to hold the related asset, as well as the Company’s ability to hold and its intent with regard to each asset.any significant cost overruns on development properties. Future events could occur which would cause the Company to conclude that impairment indicators exist and an impairment loss is warranted. If an impairment indicators exist,indicator exists, the Company performs the following:
• | For long-lived operating assets to be held and used, the Company compares the expected future undiscounted cash flows for the long-lived asset against the carrying amount of that asset. If the sum of the estimated undiscounted cash flows is less than the carrying amount of the asset, the Company would make an estimate of the fair value for the particular asset |
F-25
and would record an impairment loss for the difference between the estimated fair value and the carrying amount of the asset. In determining the future undiscounted cash flows or the estimated fair value of an asset there is judgment in estimating the expected future rental revenues, operating expenses and discount and capitalization rates. |
• | For long-lived non-operating assets (projects under development and land held for development), management evaluates major cost overruns, market conditions that could affect lease-up projections, intent and ability to hold the asset and any other indicators of impairment. If any of the indicators were to suggest impairment was present, the carrying value of the asset would be adjusted accordingly to fair value. |
• | For long-lived assets to be disposed of, an impairment loss is recognized when the estimated fair value of the asset, less the estimated cost to sell, is less than the carrying amount of the asset measured at the time that the Company has determined it will sell the asset. Long-lived assets held for sale and the related liabilities are separately reported, with the long-lived assets reported at the lower of their carrying amounts or their estimated fair values, less their costs to sell, and are not depreciated after reclassification to real estate held for sale. |
Impairment of Investments in Unconsolidated Entities
At least quarterly, the Company evaluates its investments in unconsolidated entities, including any multifamily real estate assets held by a joint venture, for indicators of other than temporary impairment, considering whether there has been a change to events or circumstances that would impact recoverability of the Company’s investment as well as any changes with regards to the Company's intent and ability to hold the asset and any other indicators of impairment. If any of the indicators wereinvestment to suggest impairment was present, therecover its carrying value of the asset would be adjusted accordingly to fair value.
For long-lived assets to be disposed of, an impairment loss is recognized when the estimated fair value of the asset, less the estimated cost to sell, is less than the carrying amount of the asset measured at the time that the Company has determined it will sell the asset. Long-lived assets held for sale and the related liabilities are separately reported, with the long-lived assets reported at the lower of their carrying amounts or their estimated fair values, less their costs to sell, and are not depreciated after reclassification to real estate held for sale.
Cost Capitalization
See the Real Estate Assets and Depreciation of Investment in Real Estate section for a discussion of the Company’s policy with respect to capitalization vs. expensing of fixed asset/repair and maintenance costs. In addition, the Company capitalizes an allocation of the payroll and associated costs of employees directly responsible for and who spend their time on the execution and supervision of major capital and/or renovation projects. These costs are reflected on the balance sheets as increases to depreciable property.
For all development, capital and renovation projects, the Company uses its professional judgment in determining whether such costs meet the criteria for capitalization or must be expensed as incurred. The Company capitalizes interest, real estate taxes and insurance, andas well as payroll and associated costs for those individuals directly responsible for and who spend their time on the execution and supervision of development activities, with capitalization ceasing no later than 90 days following issuanceactivities. Additionally, the Company capitalizes payroll for those individuals directly responsible for and who spend their time on the execution and supervision of major capital and/or renovation projects. Capitalization ends when the asset, or a portion of the certificate of occupancy.asset, is substantially completed and ready for its intended use. These costs are reflected on the balance sheets as construction-in-progress for each specific property. The Company expenses as incurred all payroll costs of on-site employees working directly at our properties, except as noted above on our development properties priorincreases to certificate of occupancy issuance and on specific major renovations at selected properties when additional incremental employees are hired.depreciable property and/or construction-in-progress.
During the years ended December 31, 2017, 20162020, 2019 and 2015,2018, the Company capitalized $14.7$12.1 million, $18.7$14.2 million and $22.3$13.2 million, respectively, of payroll and associated costs of employees directly responsible for and who spend their time on the execution and supervision of development activities as well as major capital and/or renovation projects.
Cash and Cash Equivalents
The Company considers all demand deposits, money market accounts and investments in certificates of deposit and repurchase agreements purchased with a maturity of three months or less at the date of purchase to be cash equivalents. The Company maintains its cash and cash equivalents at financial institutions. The combined account balances at one or more institutions typically exceed the Federal DepositoryDeposit Insurance Corporation (“FDIC”) insurance coverage, and, as a result, there is a concentration of credit risk related to amounts on deposit in excess of FDIC insurance coverage. The Company believes that the risk is not significant, as the Company does not anticipate the financial institutions’ non-performance.
F-26
Fair Value of Financial Instruments, Including Derivative Instruments
The valuation of financial instruments requires the Company to make estimates and judgments that affect the fair value of the instruments. The Company, where possible, bases the fair values of its financial instruments, including its derivative instruments, on listed market prices and third partythird-party quotes. Where these are not available, the Company bases its estimates on current instruments with similar terms and maturities or on other factors relevant to the financial instruments.
In the normal course of business, the Company is exposed to the effect of interest rate changes. The Company seeksmay seek to manage these risks by following established risk management policies and procedures including the use of derivatives to hedge interest rate risk on debt instruments. The Company may also use derivatives to manage commodity prices in the daily operations of the business.
F-26
The Company has a policy of only entering into derivative contracts with major financial institutions based upon their credit ratings and other factors. When viewed in conjunction with the underlying and offsetting exposure that the derivatives are designed to hedge, the Company has not sustained a material loss from these instruments nor does it anticipate any material adverse effect on its net income or financial position in the future from the use of derivatives it currently has in place.
The Company recognizes all derivatives as either assets or liabilities in the consolidated balance sheets and measures those instruments at fair value. In addition, fair value adjustments will affect either shareholders’ equity/partners’ capital or net income depending on whether the derivative instruments qualify as a hedge for accounting purposes and, if so, the nature of the hedging activity. When the terms of an underlying transaction are modified, or when the underlying transaction is terminated or completed, all changes in the fair value of the instrument are marked-to-market with changes in value included in net income each period until the instrument matures. Any derivative instrument used for risk management that does not meet the hedging criteria is marked-to-market each period. The Company does not use derivatives for trading or speculative purposes.
Leases and Revenue Recognition
Rental income attributable to residential leases is recorded on a straight-line basis, which is not materially different than if it were recorded when due from residents and recognized monthly as it was earned. Leases entered into between a resident and a property for the rental of an apartment unit are generally year-to-year, renewable upon consent of both parties on an annual or monthly basis. Rental income attributable to retail/commercialnon-residential leases is also recorded on a straight-line basis. Retail/commercialNon-residential leases generally have five to ten year lease terms with market basedmarket-based renewal options. Fee and asset management revenue and interest income are recorded on an accrual basis.
The majority of the Company’s revenue is derived from residential, non-residential and other lease income, which are accounted for under the lease standard effective January 1, 2019 (discussed below in Recently Adopted Accounting Pronouncements). Our revenue streams have the same timing and pattern of revenue recognition across our reportable segments, with consistent allocations between the leasing and revenue recognition standards.
The Company is a lessor for its residential and non-residential leases and is a lessee for its corporate headquarters and regional offices and ground leases for land underlying current operating properties or projects under development. If applicable, lease agreements must be evaluated to determine the accounting treatment as a finance or operating lease in accordance with the lease standard. A lease is classified as a finance lease if it meets any of the following criteria: (a) Ownership of the underlying asset is transferred to the lessee by the end of the lease term; (b) the lessee has and is reasonably certain to exercise an option to purchase the underlying asset; (c) the lease term is for the major part of the remaining economic life of the underlying asset; (d) the present value of future minimum lease payments is equal to substantially all of the fair value of the underlying asset; and (e) the underlying asset is expected to have no alternative use to the lessor at the end of the lease term due to its specialized nature.
The lease standard also requires the recognition on the balance sheet of: (a) a liability for the lease obligation (initially measured at the present value of the future lease payments not yet paid over the lease term); and (b) an asset for its right to use the underlying asset (initially equal to the lease liability). See Recently Adopted Accounting Pronouncements below for additional details regarding the adoption of this standard. Rental revenues are recognized on a straight-line basis over the term of the lease when reasonably assured they are collectible. The Company uses estimates and judgments on the incremental borrowing rate used to calculate the present value of the future lease payments. See Note 8 for additional discussion.
The Company’s revenue streams that are not accounted for under the lease standard include:
• | Parking revenue – The Company’s parking revenue, not related to leasing, is derived primarily from monthly and transient daily parking and is accounted for at the point in time when control of the goods or services transfers to the customer and our performance obligation is satisfied. |
• | Other rental and non-rental related revenue – The Company receives other income, including, but not limited to: (a) ancillary income, such as laundry, renters insurance and cable income; (b) net settlement income or collections; and (c) miscellaneous fee income. |
• | Gains or losses on sales of real estate properties – The Company accounts for the sale of real estate properties and any related gain recognition in accordance with the accounting guidance applicable to sales of real estate, which establishes standards for recognition of profit on all real estate sales transactions. The Company recognizes the sale, and associated gain or loss from the disposition, provided that the earnings process is complete and the Company does not have significant continuing involvement. A gain or loss is recognized when the criteria for an asset to be derecognized are met, which include when a contract exists and the buyer obtained control of the nonfinancial asset that was sold. |
See Note 8 for the Company’s rental income detail allocated between the lease and revenue recognition standards.
F-27
The Company’s allowance for doubtful accounts (which offsets accounts receivable and is included within other assets on the consolidated balance sheets) and bad debts (which reduce rental income on the consolidated statements of operations and comprehensive income) have historically been very modest, particularly in our residential business, given the quality of our resident base and asset class. However, due to the impact of the COVID-19 pandemic, the allowance for doubtful accounts and bad debts became elevated during 2020 and will likely remain elevated in 2021. In accordance with the lease standard, if we determine the lease payments are not probable of collection (based on known troubled accounts, rent deferral plans granted, historical experience and other currently available evidence), we fully reserve for any unpaid amounts, deferred rent receivable, variable lease payments and straight-line receivable balances and recognize rental income only if cash is received. If the Company’s estimates of collectibility differ from the cash received, then the timing and amount of the Company’s reported revenue could be impacted. See Note 8 for additional details.
Share-Based Compensation
The Company expenses share-based compensation such asfor employee and trustee grants of restricted shares, restricted units and share options. Any common share of beneficial interest, $0.01 par value per share (the “Common Shares”), issued pursuant to EQR’s incentive equity compensation and employee share purchase plans will result in ERPOP issuing units of partnership interest (“OP Units”) to EQR on a one-for-one basis, with ERPOP receiving the net cash proceeds of such issuances. See Note 12 for further discussion.
The fair value of the option grants are recognized over the requisite service/vesting period of the options. The fair value for the Company’s share options was estimated at the time the share options were granted using the Black-Scholes option pricing model with the primary grant in each year having the following weighted average assumptions:
|
| 2017 |
|
| 2016 |
|
| 2015 |
| |||
Expected volatility (1) |
|
| 15.3 | % |
|
| 26.3 | % |
|
| 26.6 | % |
Expected life (2) |
| 5 years |
|
| 5 years |
|
| 5 years |
| |||
Expected dividend yield (3) |
|
| 3.08 | % |
|
| 3.04 | % |
|
| 3.13 | % |
Risk-free interest rate (4) |
|
| 1.93 | % |
|
| 1.27 | % |
|
| 1.29 | % |
Option valuation per share |
| $ | 5.86 |
|
| $ | 13.02 |
|
| $ | 13.68 |
|
|
|
|
|
|
|
F-27
|
|
The valuation method and assumptions are the same as those the Company used in accounting for option expense in its consolidated financial statements. The Black-Scholes option valuation model was developed for use in estimating the fair value of traded options that have no vesting restrictions and are fully transferable. This model is only one method of valuing options. Because the Company’s share options have characteristics significantly different from those of traded options, and because changes in the subjective input assumptions can materially affect the fair value estimate, the actual value of the options to the recipient may be significantly different.
Income and Other Taxes
DueEQR has elected to the structure of EQRbe taxed as a REIT andREIT. This, along with the nature of the operations of its operating properties, noresulted in 0 provision for federal income taxes has been made at the EQR level. In addition, ERPOP generally is not liable for federal income taxes as the partners recognize their proportionateallocable share of income or loss in their tax returns; therefore no provision for federal income taxes has been made at the ERPOP level. Historically, the Company has generally only incurred certain state and local income, excise and franchise taxes. The Company has elected Taxabletaxable REIT Subsidiarysubsidiary (“TRS”) status for certain of its corporate subsidiaries and, as a result, these entities will incur both federal and state income taxes on any taxable income of such entities after consideration of any net operating losses.
Deferred tax assets and liabilities are recognized for future tax consequences attributable to differences between the financial statement carrying amounts of existing assets and liabilities and their respective tax bases. These assets and liabilities are measured using enacted tax rates for which the temporary differences are expected to be recovered or settled. The effects of changes in tax rates on deferred tax assets and liabilities are recognized in earnings in the period enacted. The Company’s deferred tax assets were generally the result of tax affected suspended interest deductions, net operating losses, differing depreciable lives on capitalized assets and the timing of expense recognition for certain accrued liabilities. The Company elected REIT status for its primary TRS upon filing the 2016 tax return in the third quarter of 2017, with the election retroactive to January 1, 2016. As a result, the Company wrote-off its deferred tax assets, which were fully reserved, in the third quarter of 2017.
In December 2017,On March 27, 2020, the President signed into law H.R. 1, informally titled the Tax CutsCoronavirus Aid, Relief, and JobsEconomic Security Act (the “Tax“CARES Act”). The TaxCARES Act iswas enacted to provide economic relief to companies and individuals in response to the COVID-19 pandemic. Included in the CARES Act are tax provisions which increase allowable interest expense deductions for 2019 and 2020 and increase the ability for taxpayers to use net operating losses. These provisions did not expected to haveresult in a material impact on our REITto the Company’s taxable income or subsidiary entities, our ability to continue to qualify as a REIT or on our results of operations. However, the complete impact of the Tax Act is not yet fully known and there can be no assurances that it will have a neutral or favorable impact. tax liabilities.
The Company providedCARES Act also allowed corporations to request accelerated refunds of their alternative minimum tax (“AMT”) credit. Prior to enactment of this provision, the remaining credits would have been refunded in installments in 2020, 2021 and 2022. We received a refund of our remaining $1.6 million in AMT credits during the year ended December 31, 2020.
The Company’s provision for income franchise and excise taxes allocatedother tax expense (benefit) was as follows in the consolidated statements of operations and comprehensive income for the years ended December 31, 2017, 20162020, 2019 and 20152018 (amounts in thousands):
|
| Year Ended December 31, |
| |||||||||
|
| 2017 |
|
| 2016 |
|
| 2015 |
| |||
Income and other tax expense (benefit) (1) |
| $ | 478 |
|
| $ | 1,613 |
|
| $ | 917 |
|
Discontinued operations, net (2) |
|
| — |
|
|
| 12 |
|
|
| 15 |
|
Provision for income, franchise and excise taxes (3) |
| $ | 478 |
|
| $ | 1,625 |
|
| $ | 932 |
|
|
| Year Ended December 31, |
| |||||||||
|
| 2020 |
|
| 2019 |
|
| 2018 |
| |||
State and local income, franchise and excise tax (benefit) |
| $ | 852 |
|
| $ | 963 |
|
| $ | 878 |
|
Alternative minimum tax credit (benefit) (1) |
|
| — |
|
|
| (3,244 | ) |
|
| — |
|
Income and other tax expense (benefit) (2) |
| $ | 852 |
|
| $ | (2,281 | ) |
| $ | 878 |
|
(1) |
|
(2) |
|
| All provisions for income tax amounts are current and none are deferred. |
F-28
During the years ended December 31, 2017, 20162020, 2019 and 2015,2018, the Company’s tax treatmentcharacter of the Company’s dividends and distributions were as follows (unaudited):
|
| Year Ended December 31, |
|
| Year Ended December 31, |
| ||||||||||||||||||
|
| 2017 (1) |
|
| 2016 |
|
| 2015 |
|
| 2020 (1) |
|
| 2019 (2) |
|
| 2018 (3) |
| ||||||
Tax treatment of dividends and distributions: |
|
|
|
|
|
|
|
|
|
|
|
| ||||||||||||
Tax character of dividends and distributions: |
|
|
|
|
|
|
|
|
|
|
|
| ||||||||||||
Ordinary dividends |
| $ | 1.22126 |
|
| $ | 0.722 |
|
| $ | 1.591 |
|
| $ | 1.34739 |
|
| $ | 1.39604 |
|
| $ | 1.84454 |
|
Qualified dividends |
|
| — |
|
|
| — |
|
|
| 0.037 |
| ||||||||||||
Long-term capital gain |
|
| 0.18959 |
|
|
| 9.176 |
|
|
| 0.443 |
|
|
| 0.77923 |
|
|
| 0.61243 |
|
|
| 0.21423 |
|
Unrecaptured section 1250 gain |
|
| 0.10040 |
|
|
| 3.117 |
|
|
| 0.139 |
|
|
| 0.24838 |
|
|
| 0.23403 |
|
|
| 0.06498 |
|
Dividends and distributions per |
|
|
|
|
|
|
|
|
|
|
|
|
|
|
|
|
|
|
|
|
|
|
|
|
Common Share/Unit outstanding |
| $ | 1.51125 |
|
| $ | 13.015 |
|
| $ | 2.210 |
|
| $ | 2.37500 |
|
| $ | 2.24250 |
|
| $ | 2.12375 |
|
(1) | The Company’s fourth quarter |
(2) | The Company’s fourth quarter 2019 dividends and distributions of $0.5675 per Common Share/Unit outstanding was included as taxable income in calendar year 2020. |
(3) | The Company’s fourth quarter 2018 dividends and distributions of $0.54 per Common Share/Unit outstanding was included as taxable income in calendar year 2019. |
The unaudited cost of land and depreciable property, net of accumulated depreciation, for federal income tax purposes as of December 31, 20172020 and 20162019 was approximately $14.8$13.8 billion and $15.8$13.7 billion, respectively.
Principles of Consolidation
The Company may hold an interest in subsidiaries, partnerships, joint ventures and other similar entities and accounts for these interests in accordance with the consolidation guidance. The Company first determines whether to consolidate the entity as a variable interest entity (“VIE”) or account for the interest under the equity method of accounting. Equity investors of VIEs do not have sufficient equity at risk to finance their activities without additional subordinated financial support or do not have substantive participating rights. The Company consolidates an entity when it is considered to be the primary beneficiary or when it controls the entity through ownership of a majority voting interest. A primary beneficiary has the power to direct the activities that most significantly impact the VIE’s performance and has the obligation to absorb the expected losses or the right to receive the expected residual returns that could potentially be significant to the VIE. In evaluating whether the entity is a VIE, the Company considers several factors, including, but not limited to, funding and financing sources, business purpose of the entity, related parties, developer and property management fees and agreement terms regarding major decisions, participating and voting rights, contributions and distributions.
Noncontrolling Interests
A noncontrolling interest in a subsidiary (minority interest) is an ownership interest in the consolidated entity that should be reported as equity in the consolidated financial statements and separate from the parent company’s equity. In addition, consolidated net income is required to be reported at amounts that include the amounts attributable to both the parent and the noncontrolling interest and the amount of consolidated net income attributable to the parent and the noncontrolling interest are required to be disclosed on the face of the consolidated statements of operations and comprehensive income. See Note 3 for further discussion.
Operating Partnership: Net income is allocated to noncontrolling interests based on their respective ownership percentage of the Operating Partnership. The ownership percentage is calculated by dividing the number of OP Units held by the noncontrolling interests by the total OP Units held by the noncontrolling interests and EQR. Issuance of additional Common Shares and OP Units changes the ownership interests of both the noncontrolling interests and EQR. Such transactions and the related proceeds are treated as capital transactions.
Partially Owned Properties: The Company reflects noncontrolling interests in partially owned properties on the balance sheet for the portion of properties consolidated by the Company that are not wholly owned by the Company. The earnings or losses from those properties attributable to the noncontrolling interests are generally based on ownership percentage and are reflected as noncontrolling interests in partially owned properties in the consolidated statements of operations and comprehensive income.
Partners’ Capital
The “Limited Partners” of ERPOP include various individuals and entities that contributed their properties to ERPOP in exchange for OP Units. The “General Partner” of ERPOP is EQR. Net income is allocated to the Limited Partners based on their respective ownership percentage of ERPOP. The ownership percentage is calculated by dividing the number of OP Units held by the Limited Partners by the total OP Units held by the Limited Partners and the General Partner. Issuance of additional Common Shares
F-29
and OP Units changes the ownership interests of both the Limited Partners and EQR. Such transactions and the related proceeds are treated as capital transactions.
Redeemable Noncontrolling Interests – Operating Partnership / Redeemable Limited Partners
The Company classifies Redeemable Noncontrolling Interests – Operating Partnership / Redeemable Limited Partners in the mezzanine section of the consolidated balance sheets for the portion of OP Units that EQR is required, either by contract or securities law, to deliver registered Common Shares to the exchanging OP Unit holder. The redeemable noncontrolling interest units / redeemable limited partner units are adjusted to the greater of carrying value or fair market value based on the Common Share price of EQR at the end of each respective reporting period. See Note 3 for further discussion.
Use of Estimates
In preparation of the Company’s financial statements in conformity with accounting principles generally accepted in the United States, management makes estimates and assumptions that affect the reported amounts of assets and liabilities and
F-29
disclosure of contingent assets and liabilities at the date of the financial statements as well as the reported amounts of revenues and expenses during the reporting period. Actual results could differ from these estimates. In response to the COVID-19 pandemic, management evaluated whether its estimates, such as lease collectibility (discussed below in Recently Adopted Accounting Pronouncements) and impairment, required revised approaches and generally concluded that no revisions were necessary at this time.
Reclassifications
Certain reclassifications considered necessary for a fair presentation have been made to the prior period financial statements in order to conform to the current year presentation. These reclassifications have not changed the results of operations or equity/capital.
Recently Issued Accounting Pronouncements
In May 2014,August 2020, the Financial Accounting Standards Board (the “(“FASB”) issued a comprehensive new revenue recognition standard entitled Revenue from Contracts with Customers that will supersede nearly all existing revenue recognition guidance. The new standard specifically excludes lease revenue. The new standard’s core principle is that a company will recognize revenue when it transfers promised goods or servicesan amendment to customersthe debt and equity financial instruments standards which simplifies the accounting for convertible instruments and accounting for contracts in an amount that reflectsentity’s own equity. Instead of being required to assess whether an equity contract permits settlement in unregistered shares, which may require a legal analysis under the consideration to which the company expects to be entitled in exchange for those goods or services. Companiessecurities laws, entities will likely need to use more judgment and make more estimates than under current revenue recognition guidance. These may include identifying performance obligations in the contract, estimating the amount of variable consideration, if any, to include in the transaction price and allocating the transaction price to each separate performance obligation. The new standardonly analyze whether cash settlements are explicitly required when registered shares are unavailable. As a result, such contracts may be applied retrospectively to each prior period presented or prospectively withclassified in permanent rather than mezzanine equity, which may affect the cumulative effect, if any, recognized as of the date of adoption. The Company selected the modified retrospective transition method as of the date of adoption effective January 1, 2018. Approximately 95% of total revenues consist of rental income from leasing arrangements, which is specifically excluded from the standard. The Company analyzed its remaining revenue streams, inclusive of gains and losses on sales, and concluded there are no changes in revenue recognition with the adoption of the new standard. As such, adoption of the standard did not result in a cumulative adjustment recognized as of January 1, 2018, and other than certain changes in disclosures which will be required in 2018, the standard did not have a material impact onway the Company’s consolidatedOP Units are presented on its financial position, results of operations, equity/capital or cash flows.
In January 2016, the FASB issued a new standard which requires companies to measure all equity securities with readily determinable fair values at fair value on the balance sheet, with changes in fair value recognized in net income.statements. The new standard wasupdate is effective for the Company beginning on January 1, 2018 and it did not have a material effect on its consolidated results of operations or financial position.
In February 2016, the FASB issued a new leases standard which sets out principles for the recognition, measurement, presentation and disclosure of leases for both parties to a contract (i.e. lessors and lessees). The new standard requires the following:
Lessors – Leases will be accounted for using an approach that is substantially equivalent to existing guidance for operating, sales-type and financing leases,2022, but aligned with the new revenue recognition standard. Lessors will be required to allocate lease payments to separate lease and non-lease components of each lease agreement, with the non-lease components evaluated under the new revenue recognition standard.
Lessees – Leases will be accounted for using a dual approach, classifying leases as either operating or finance based on the principle of whether or not the lease is effectively a financed purchase of the leased asset by the lessee. This classification will determine whether the lease expense is recognized on a straight-line basis over the term of the lease (for operating leases) or based on an effective interest method with a front-loaded expense recognition (for finance leases). A lessee is also required to record a right-of-use asset and a lease liability on its balance sheet for all leases with a term of greater than 12 months regardless of their classification as operating or finance leases. Leases with a term of 12 months or less will be accounted for similar to existing guidance for operating leases.
The new standard will be effective for the Company beginning on January 1, 2019, with early adoption permitted, though the Company currently anticipates adopting the new standard on the effective date. The new standard must be adopted using a modified retrospective method, which requires application of the new guidance at the beginning of the earliest comparative period presented and provides for certain practical expedients, which the Company currently anticipates electing. The Company anticipates that its residential and retail/commercial leases where it is the lessor will continue to be accounted for as operating leases under the new standard. Therefore, the Company does not currently anticipate significant changes in the accounting for its lease revenues. The Company is also the lessee under various corporate office and ground leases, which it will be required to recognize right of use assets and related lease liabilities on its consolidated balance sheets upon adoption. The Company currently anticipates that its corporate office leases where it is the lessee will continue to be accounted for as
F-30
operating leases under the new standard. Based on its anticipated election of the practical expedients, the Company would not be required to reassess the classification of existing ground leases and therefore these leases would continue to be accounted for as operating leases. However, in the event we modify existing ground leases and/or enter into new ground leases after adoption of the new standard, such leases will likely be classified as finance leases. The Company will continue to evaluate the impact of adopting the new leases standard on its consolidated results of operations and financial position.
In June 2016, the FASB issued a new standard which requires companies to adopt a new approach for estimating credit losses on certain types of financial instruments, such as trade and other receivables and loans. The standard will require entities to estimate a lifetime expected credit loss for most financial instruments, including trade receivables. The new standard will be effective for the Company beginning on January 1, 2020, with early adoption permittedallowed beginning January 1, 2019.2021. The Company is currently evaluating the impact of adopting the new standard on its consolidated results of operations and financial position.
In February 2017,March 2020, the FASB issued a newan amendment to the reference rate reform standard which clarifies provides the option for a limited period of time to ease the potential burden in accounting for, or recognizing the effects of, reference rate reform on contract modifications and hedge accounting. An example of such reform is the expected market transition from the London Interbank Offered Rate (“LIBOR”) and other interbank offered rates to alternative reference rates. Entities that make this optional expedient election would not have to remeasure the contracts at the modification date or reassess the accounting treatment if certain criteria are met and would continue applying hedge accounting for partial sales of nonfinancial assets (i.e. real estate). The standard clarifies that partial sales transactions include contributions of nonfinancial assets to a joint venture or other noncontrolled investee. Companies must recognize a full gain or loss on transfers of nonfinancial assets to equity method investees. The standard requires companies to derecognize distinct nonfinancial assets or distinct in substance nonfinancial assets in partial sale transactions when it does not have a controlling financial interest in the legal entity that holds the asset and transfers control of the asset. Once the distinct nonfinancial asset is transferred, the company is required to measure any non-controlling interest it receives or retains at fair value and recognize a full gain or loss on the transaction. If a company transfers ownership interests in a consolidated subsidiary and continues to maintain a controlling financial interest, the company does not derecognize the assets or liabilities, and accounts for the transaction as an equity transaction and no gain or loss is recognized.relationships affected by reference rate reform. The new standard was effective for the Company beginning on January 1, 2018. The Company adopted the new standard concurrently with the new revenue recognition standard. The Company has not had a partial sale of nonfinancial assets in the current or comparative periods, therefore the adoption of this standard did not have a material impact on its consolidated results of operationsupon issuance and financial position.
In August 2017, the FASB issued a final standard which makes changes to the hedge accounting model to enable entities to better portray their risk management activities in the financial statements. The new standard expands an entity’s ability to hedge nonfinancial and financial risk components, reduces complexity in fair value hedges of interest rate risk and eases certain documentation and assessment requirements. The new standard also eliminates the requirement to separately measure and report hedge ineffectiveness and generally requires the entire change in the fair value of any hedging instrument toelections can be presented in the same income statement line as the hedged instrument. The new standard will be effective for the Company beginning on January 1, 2019 and early adoption is permitted.made through December 31, 2022. The Company is currently evaluating its options with regards to existing contracts and hedging relationships and the impact of adopting the new standardthis update on its consolidated results of operations and financial position.
Recently Adopted Accounting Pronouncements
In February 2015,April 2020, a FASB staff question and answer document was issued which intended to reduce the FASB issued new consolidation guidance which made changeschallenges of evaluating the enforceable rights and obligations of leases for concessions granted to bothlessees in response to the variable interest modelCOVID-19 pandemic. We elected not to evaluate whether qualifying concessions provided by the Company in response to the COVID-19 pandemic are a lease modification, subject to the criteria that the total payments under the amended lease cannot result in a substantial increase in the rights of the lessor or obligations of the lessee. We also elected to treat the concessions as though they were contemplated as part of the existing contracts and therefore will not apply lease modification rules to the qualifying lease concession amendments. As such, deferrals deemed collectible are recorded as rental receivables with no change to timing of rental revenues and deferrals deemed non-collectible and abatements reduce rental revenues in the deferral/abatement period and cause rental revenues to effectively follow a cash basis related to the changes. The accounting elections provided by the FASB mainly apply to the Company’s non-residential leases and the voting model. Among other changes,majority of the newamendments will not require a straight-line adjustment. See Note 8 for additional discussion.
F-30
In February 2016, the FASB issued a lease standard specifically eliminatedwhich sets out principles for the presumption in the current voting model thatrecognition, measurement, presentation and disclosure of leases for both parties to a general partner controls a limited partnership or similar entity unless that presumption can be overcome. Generally, only a single limited partner that is able to exercise substantive kick-out rights will consolidate.contract (i.e. lessors and lessees). The Company adopted this new standard as required effective January 1, 2016. While2019 using a modified retrospective method and the Company applied the guidance as of the adoption date and elected certain practical expedients. The standard impacted our consolidated balance sheets but did not impact our consolidated statements of operations. Right-of-use (“ROU”) assets and lease liabilities where the Company is the lessee were recognized for various corporate office leases and ground leases. The Company recorded ROU assets and related lease liabilities to its opening balance sheet upon adoption on January 1, 2019 of $434.2 million and $278.3 million, respectively.
The Company elected the practical expedient to not reassess the classification of existing operating leases. As of January 1, 2019, any new or modified ground leases may be classified as financing leases unless they meet certain conditions. When there is a material lease modification, the Company is required to reassess the classification and remeasure the lease liability.
In July 2018, the FASB issued an amendment to the lease standard, which includes a practical expedient that provides lessors an option not to separate lease and non-lease components when certain criteria are met and instead account for those components as a single component under the lease standard. The amendment also provides a transition option that permits the application of the new guidance as of the adoption date rather than to all periods presented. The Company elected the practical expedient to account for both its lease and non-lease components as a single component under the lease standard did not result in anyand elected the new transition option as of the date of adoption effective January 1, 2019. See Note 8 for additional discussion regarding the lease standard.
In August 2017, the FASB issued a final standard which makes changes to conclusions about whether a joint venture was consolidated or unconsolidated, the Company determined thathedge accounting model to enable entities to better portray their risk management activities in the financial statements. The standard expands an entity’s ability to hedge nonfinancial and financial risk components, reduces complexity in fair value hedges of interest rate risk and eases certain documentation and assessment requirements. The standard also eliminates the requirement to separately measure and report hedge ineffectiveness and generally requires the entire change in the fair value of its joint ventures andany hedging instrument to be presented in the Operating Partnership qualifiedsame income statement line as variable interest entities (“VIEs”) and therefore required additional disclosures. See Note 6 for further discussion.
In March 2016, the FASB issued a new standard which simplified several aspects of the accounting for employee share-based payment transactions, including income tax consequences, classification of awards as equity or liability, statement of cash flows classification and policy election options for forfeitures.hedged instrument. The Company adopted this new standard as required effective January 1, 2017.2019 and it did not have a material effect on its consolidated results of operations and financial position.
In June 2016, the FASB issued a standard which requires companies to adopt a new approach for estimating credit losses on certain types of financial instruments, such as trade and other receivables and loans. The standard requires entities to estimate a lifetime expected credit loss for most financial instruments, including trade receivables. In November 2018, the FASB issued an amendment excluding operating lease receivables accounted for under the lease standard from the scope of the credit losses standard. The Company will continueadopted this standard as required effective January 1, 2020 and it did not have a material effect on its consolidated results of operations and financial position.
InMay2014,theFASBissuedacomprehensiverevenuerecognition standard entitled Revenue from Contracts with Customers that superseded nearly all existing revenue recognition guidance. Thestandardspecificallyexcludesleaserevenue. The standard may be applied retrospectively to estimateeach prior period presented or prospectively with the numbercumulative effect, if any, recognized as of awards expected to be forfeitedthe date of adoption. The Company selected the modified retrospective transition method as of the date of adoption as required effectiveJanuary1,2018. The majorityofrental income consistsof revenue from leasing arrangements, which is specifically excluded from the standard. The Company analyzed its remaining revenue streams, inclusive of fee and adjustasset management and gains and losses on sales, and concluded these revenue streams have the estimate when it is no longer probable that the employee will fulfill the service condition, as was requiredsame timing and pattern of revenue recognition under the old standard. Thenew guidance, and therefore the Company had no changes in revenue recognition with the adoption of thisthe standard. As such, adoption of the standard did not result in a cumulative adjustment recognized as of January 1, 2018, and the standard did not have a material impact on ourthe Company’s consolidated financial position, results of operations, equity/capital or financial position.
In August 2016 and October 2016, the FASB issued new standards to clarify how specific transactions are classified and presented on the statement of cash flows. Among other clarifications,
Additionally, as part of the new standards specifically provide guidancerevenue recognition standard, the FASB issued amendments related to partial sales of real estate. Adoption of the partial sales standard did not result in a change of accounting for the following items within the statement of cash flows which have required significant judgment in the past:
F-31
|
|
The portion of the cash payment made to settle a zero-coupon bond or a bond with an insignificant cash coupon attributable to accreted interestCompany related to a debt discount is to be classified as a cash outflow within operating activities, andits disposition process. We concluded that the portion attributable to the principal is to be classified within financing activities;
Insurance settlement proceeds are to be classified based on the nature of the loss;
Companies must elect to classify distributions received from equity method investees using either a cumulative earnings approach or a look-through approach and the election must be disclosed; and
Restricted cash will be included with cash and cash equivalents on the statement of cash flows. Total cash and cash equivalents and restricted cash are to be reconciled to the related line items on the balance sheet.
The new standards must be applied retrospectively to all periods presented in the consolidated financial statements. The Company adopted the new standard in the fourth quarter of 2017 andCompany’s typical dispositions will continue to applymeet the look-through approachcriteria for distributions received from equity method investees. While overall cash flows did not change, there are changes between cash flow classifications due primarily to the debt prepayment penalties that the Company has incurred in the comparative period. As of December 31, 2016sale and 2015, the following cash flows were reclassified (amounts in thousands):
|
| Year Ended December 31, 2016 |
| |||||||||
|
| As Originally Presented |
|
| Reclassification Adjustments |
|
| As Presented Herein |
| |||
Cash Flows from Operating Activities: |
|
|
|
|
|
|
|
|
|
|
|
|
Amortization of discounts and premiums on debt |
| $ | (17,378 | ) |
| $ | (608 | ) |
| $ | (17,986 | ) |
Net (gain) loss on debt extinguishment |
| $ | — |
|
| $ | 114,666 |
|
| $ | 114,666 |
|
(Increase) decrease in deposits - restricted |
| $ | 11,450 |
|
| $ | (11,450 | ) |
| $ | — |
|
(Increase) decrease in mortgage deposits |
| $ | (26 | ) |
| $ | 26 |
|
| $ | — |
|
Net cash provided by operating activities |
| $ | 1,111,489 |
|
| $ | 102,634 |
|
| $ | 1,214,123 |
|
|
|
|
|
|
|
|
|
|
|
|
|
|
Cash Flows from Investing Activities: |
|
|
|
|
|
|
|
|
|
|
|
|
(Increase) decrease in deposits on real estate acquisitions and investments, net |
| $ | (32,503 | ) |
| $ | 32,503 |
|
| $ | — |
|
(Increase) decrease in mortgage deposits |
| $ | 534 |
|
| $ | (534 | ) |
| $ | — |
|
Net cash provided by investing activities |
| $ | 5,871,973 |
|
| $ | 31,969 |
|
| $ | 5,903,942 |
|
|
|
|
|
|
|
|
|
|
|
|
|
|
Cash Flows from Financing Activities: |
|
|
|
|
|
|
|
|
|
|
|
|
Mortgage deposits |
| $ | (8,497 | ) |
| $ | 8,497 |
|
| $ | — |
|
Mortgage notes payable, net: Net gain (loss) on debt extinguishment |
| $ | — |
|
| $ | (31,732 | ) |
| $ | (31,732 | ) |
Notes, net: Net gain (loss) on debt extinguishment |
| $ | — |
|
| $ | (82,934 | ) |
| $ | (82,934 | ) |
Line of credit and commercial paper: Commercial paper proceeds |
| $ | 1,759,586 |
|
| $ | 608 |
|
| $ | 1,760,194 |
|
Net cash (used for) financing activities |
| $ | (6,948,531 | ) |
| $ | (105,561 | ) |
| $ | (7,054,092 | ) |
|
|
|
|
|
|
|
|
|
|
|
|
|
Cash and cash equivalents, beginning of year |
| $ | 42,276 |
|
|
|
|
|
|
|
|
|
(adjustments for restricted deposits, beginning of year) |
|
|
|
|
| $ | 112,839 |
|
|
|
|
|
Cash and cash equivalents and restricted deposits, beginning of year |
|
|
|
|
|
|
|
|
| $ | 155,115 |
|
|
|
|
|
|
|
|
|
|
|
|
|
|
Cash and cash equivalents, end of year |
| $ | 77,207 |
|
|
|
|
|
|
|
|
|
(adjustments for restricted deposits, end of year) |
|
|
|
|
| $ | 141,881 |
|
|
|
|
|
Cash and cash equivalents and restricted deposits, end of year |
|
|
|
|
|
|
|
|
| $ | 219,088 |
|
F-32
|
| Year Ended December 31, 2015 |
| |||||||||
|
| As Originally Presented |
|
| Reclassification Adjustments |
|
| As Presented Herein |
| |||
Cash Flows from Operating Activities: |
|
|
|
|
|
|
|
|
|
|
|
|
Amortization of discounts and premiums on debt |
| $ | (9,492 | ) |
| $ | (1,077 | ) |
| $ | (10,569 | ) |
Write-off of pursuit costs |
| $ | 3,208 |
|
| $ | (330 | ) |
| $ | 2,878 |
|
(Increase) decrease in deposits - restricted |
| $ | (1,794 | ) |
| $ | 1,794 |
|
| $ | — |
|
(Increase) decrease in mortgage deposits |
| $ | 258 |
|
| $ | (258 | ) |
| $ | — |
|
Net cash provided by operating activities |
| $ | 1,356,499 |
|
| $ | 129 |
|
| $ | 1,356,628 |
|
|
|
|
|
|
|
|
|
|
|
|
|
|
Cash Flows from Investing Activities: |
|
|
|
|
|
|
|
|
|
|
|
|
(Increase) decrease in deposits on real estate acquisitions and investments, net |
| $ | 17,874 |
|
| $ | (17,874 | ) |
| $ | — |
|
(Increase) decrease in mortgage deposits |
| $ | (531 | ) |
| $ | 531 |
|
| $ | — |
|
Net cash (used for) investing activities |
| $ | (678,471 | ) |
| $ | (17,343 | ) |
| $ | (695,814 | ) |
|
|
|
|
|
|
|
|
|
|
|
|
|
Cash Flows from Financing Activities: |
|
|
|
|
|
|
|
|
|
|
|
|
Mortgage deposits |
| $ | (8,588 | ) |
| $ | 8,588 |
|
| $ | — |
|
Line of credit and commercial paper: Commercial paper proceeds |
| $ | 3,931,227 |
|
| $ | 1,077 |
|
| $ | 3,932,304 |
|
Net cash (used for) financing activities |
| $ | (675,832 | ) |
| $ | 9,665 |
|
| $ | (666,167 | ) |
|
|
|
|
|
|
|
|
|
|
|
|
|
Cash and cash equivalents, beginning of year |
| $ | 40,080 |
|
|
|
|
|
|
|
|
|
(adjustments for restricted deposits, beginning of year) |
|
|
|
|
| $ | 120,388 |
|
|
|
|
|
Cash and cash equivalents and restricted deposits, beginning of year |
|
|
|
|
|
|
|
|
| $ | 160,468 |
|
|
|
|
|
|
|
|
|
|
|
|
|
|
Cash and cash equivalents, end of year |
| $ | 42,276 |
|
|
|
|
|
|
|
|
|
(adjustments for restricted deposits, end of year) |
|
|
|
|
| $ | 112,839 |
|
|
|
|
|
Cash and cash equivalents and restricted deposits, end of year |
|
|
|
|
|
|
|
|
| $ | 155,115 |
|
In January 2017, the FASB issued a new standard which clarified the definition of a business. The standard’s objective was to add additional guidance that assists companies in determining whether transactions should be accounted for as an asset acquisition or a business combination. The new standard first requires an entity to evaluate if substantially all of the fair value of the gross assets acquired is concentrated in a single identifiable asset or a group of similar identifiable assets. If this threshold is met, the set is not a business. If this threshold is not met, the entity next evaluates whether the set meets the requirement that a business include, at a minimum, an input and a substantive process that together significantly contribute to the ability to create outputs. Among other differences, transaction costs associated with asset acquisitions are capitalized while those associated with business combinations are expensed as incurred. In addition, purchase price in an asset acquisition is allocated on a relative fair value basis while in a business combination it is generally measured at fair value. The new standard will be applied prospectively to any transactions occurring within the period of adoption. The Company early adopted the new standard as allowed effective January 1, 2017. The Company anticipates that substantially all of its transactions will now be accounted for as asset acquisitions, which means transaction costs will largely be capitalized as noted above.profit recognition under both standards.
Other
The Company is the controlling partner in various consolidated partnerships owning 1716 properties and 3,215consisting of 3,399 apartment units having a noncontrolling interest book valuebalance of $4.7 million at December 31, 2017.2020. The Company is required to make certain disclosures regarding noncontrolling interests in consolidated limited-life subsidiaries. Of the consolidated entities described above, the Company is the controlling partner in limited-life partnerships owning four3 properties having a noncontrolling interest deficit balance of $8.8$5.5 million. These fourthree partnership agreements contain provisions that require the partnerships to be liquidated through the sale of their assets upon reaching a date specified in each respective partnership agreement. The Company, as controlling partner, has an obligation to cause the property owning partnerships to distribute the proceeds of liquidation to the Noncontrolling Interests in
F-31
these Partially Owned Properties only to the extent that the net proceeds received by the partnerships from the sale of their assets warrant a distribution based on the partnership agreements. As of December 31, 2017,2020, the Company estimates the value of Noncontrolling Interest distributions for these fourthree properties would have been approximately $65.4$72.8 million (“Settlement Value”) had the partnerships been liquidated. This Settlement Value is based on estimated third partythird-party consideration realized by the partnerships upon disposition of the fourthree Partially Owned Properties and is net of all other assets and liabilities, including yield maintenance on the mortgages encumbering the properties, that would have been due on December 31, 20172020 had those mortgages been prepaid. Due to, among other things, the inherent uncertainty in the sale of real estate assets, the amount of any potential distribution to the Noncontrolling Interests in the Company’s Partially Owned Properties is subject to change. To the extent that the partnerships’ underlying assets are
F-33
worth less than the underlying liabilities, the Company has no obligation to remit any consideration to the Noncontrolling Interests in these Partially Owned Properties.
3. | Equity, Capital and Other Interests |
EquityThe Company refers to “Common Shares” and Redeemable Noncontrolling Interests“Units” (which refer to both OP Units and restricted units) as equity securities for EQR and “General Partner Units” and “Limited Partner Units” as equity securities for ERPOP. To provide a streamlined and more readable presentation of Equity Residentialthe disclosures for the Company and the Operating Partnership, several sections below refer to the respective terminology for each with the same financial information and separate sections are provided, where needed, to further distinguish any differences in financial information and terminology.
The following tables presenttable presents the changes in the Company’s issued and outstanding Common Shares and “Units” (which includes OP Units and restricted units) for the years ended December 31, 2017, 20162020, 2019 and 2015:2018:
|
| 2017 |
|
| 2016 |
|
| 2015 |
|
| 2020 |
|
| 2019 |
|
| 2018 |
| ||||||
Common Shares |
|
|
|
|
|
|
|
|
|
|
|
|
|
|
|
|
|
|
|
|
|
|
|
|
Common Shares outstanding at January 1, |
|
| 365,870,924 |
|
|
| 364,755,444 |
|
|
| 362,855,454 |
|
|
| 371,670,884 |
|
|
| 369,405,161 |
|
|
| 368,018,082 |
|
Common Shares Issued: |
|
|
|
|
|
|
|
|
|
|
|
|
|
|
|
|
|
|
|
|
|
|
|
|
Conversion of OP Units |
|
| 1,149,284 |
|
|
| 88,838 |
|
|
| 208,307 |
|
|
| 122,505 |
|
|
| 313,940 |
|
|
| 131,477 |
|
Exercise of share options |
|
| 846,137 |
|
|
| 815,044 |
|
|
| 1,456,363 |
|
|
| 239,695 |
|
|
| 1,745,050 |
|
|
| 1,056,388 |
|
Employee Share Purchase Plan (ESPP) |
|
| 68,286 |
|
|
| 63,909 |
|
|
| 68,462 |
|
|
| 90,196 |
|
|
| 48,131 |
|
|
| 75,414 |
|
Restricted share grants, net |
|
| 83,451 |
|
|
| 147,689 |
|
|
| 168,142 |
|
|
| 178,720 |
|
|
| 158,602 |
|
|
| 123,800 |
|
Common Shares Other: |
|
|
|
|
|
|
|
|
|
|
|
| ||||||||||||
Conversion of restricted shares to restricted units |
|
| — |
|
|
| — |
|
|
| (1,284 | ) | ||||||||||||
Common Shares outstanding at December 31, |
|
| 368,018,082 |
|
|
| 365,870,924 |
|
|
| 364,755,444 |
|
|
| 372,302,000 |
|
|
| 371,670,884 |
|
|
| 369,405,161 |
|
Units |
|
|
|
|
|
|
|
|
|
|
|
|
|
|
|
|
|
|
|
|
|
|
|
|
Units outstanding at January 1, |
|
| 14,626,075 |
|
|
| 14,427,164 |
|
|
| 14,298,691 |
|
|
| 13,731,315 |
|
|
| 13,904,035 |
|
|
| 13,768,438 |
|
Restricted unit grants, net |
|
| 291,647 |
|
|
| 287,749 |
|
|
| 335,496 |
|
|
| 249,263 |
|
|
| 141,220 |
|
|
| 267,074 |
|
Conversion of restricted shares to restricted units |
|
| — |
|
|
| — |
|
|
| 1,284 |
| ||||||||||||
Conversion of OP Units to Common Shares |
|
| (1,149,284 | ) |
|
| (88,838 | ) |
|
| (208,307 | ) |
|
| (122,505 | ) |
|
| (313,940 | ) |
|
| (131,477 | ) |
Units outstanding at December 31, |
|
| 13,768,438 |
|
|
| 14,626,075 |
|
|
| 14,427,164 |
|
|
| 13,858,073 |
|
|
| 13,731,315 |
|
|
| 13,904,035 |
|
Total Common Shares and Units outstanding at December 31, |
|
| 381,786,520 |
|
|
| 380,496,999 |
|
|
| 379,182,608 |
|
|
| 386,160,073 |
|
|
| 385,402,199 |
|
|
| 383,309,196 |
|
Units Ownership Interest in Operating Partnership |
|
| 3.6 | % |
|
| 3.8 | % |
|
| 3.8 | % |
|
| 3.6 | % |
|
| 3.6 | % |
|
| 3.6 | % |
The following table presents the changes in the Operating Partnership’s issued and outstanding General Partner Units and Limited Partner Units for the years ended December 31, 2020, 2019 and 2018:
|
| 2020 |
|
| 2019 |
|
| 2018 |
| |||
General and Limited Partner Units |
|
|
|
|
|
|
|
|
|
|
|
|
General and Limited Partner Units outstanding at January 1, |
|
| 385,402,199 |
|
|
| 383,309,196 |
|
|
| 381,786,520 |
|
Issued to General Partner: |
|
|
|
|
|
|
|
|
|
|
|
|
Exercise of EQR share options |
|
| 239,695 |
|
|
| 1,745,050 |
|
|
| 1,056,388 |
|
EQR’s Employee Share Purchase Plan (ESPP) |
|
| 90,196 |
|
|
| 48,131 |
|
|
| 75,414 |
|
EQR’s restricted share grants, net |
|
| 178,720 |
|
|
| 158,602 |
|
|
| 123,800 |
|
Issued to Limited Partners: |
|
|
|
|
|
|
|
|
|
|
|
|
Restricted unit grants, net |
|
| 249,263 |
|
|
| 141,220 |
|
|
| 267,074 |
|
General and Limited Partner Units outstanding at December 31, |
|
| 386,160,073 |
|
|
| 385,402,199 |
|
|
| 383,309,196 |
|
Limited Partner Units |
|
|
|
|
|
|
|
|
|
|
|
|
Limited Partner Units outstanding at January 1, |
|
| 13,731,315 |
|
|
| 13,904,035 |
|
|
| 13,768,438 |
|
Limited Partner restricted unit grants, net |
|
| 249,263 |
|
|
| 141,220 |
|
|
| 267,074 |
|
Conversion of Limited Partner OP Units to EQR Common Shares |
|
| (122,505 | ) |
|
| (313,940 | ) |
|
| (131,477 | ) |
Limited Partner Units outstanding at December 31, |
|
| 13,858,073 |
|
|
| 13,731,315 |
|
|
| 13,904,035 |
|
Limited Partner Units Ownership Interest in Operating Partnership |
|
| 3.6 | % |
|
| 3.6 | % |
|
| 3.6 | % |
F-32
The equity positions of various individuals and entities that contributed their properties to the Operating Partnership in exchange for OP Units, as well as the equity positions of the holders of restricted units, are collectively referred to as the “Noncontrolling Interests – Operating Partnership”. and “Limited Partners Capital,” respectively, for the Company and the Operating Partnership. Subject to certain exceptions (including the “book-up” requirements of restricted units), the Noncontrolling Interests – Operating PartnershipPartnership/Limited Partners Capital may exchange their Units with EQR for Common Shares on a one-for-one basis. The carrying value of the Noncontrolling Interests – Operating PartnershipPartnership/Limited Partners Capital (including redeemable interests) is allocated based on the number of Noncontrolling Interests – Operating Partnership UnitsPartnership/Limited Partners Capital in total in proportion to the number of Noncontrolling Interests – Operating Partnership UnitsPartnership/Limited Partners Capital in total plus the total number of Common Shares.Shares/General Partner Units. Net income is allocated to the Noncontrolling Interests – Operating PartnershipPartnership/Limited Partners Capital based on the weighted average ownership percentage during the period.
The Operating Partnership has the right but not the obligation to make a cash payment instead of issuing Common Shares to any and all holders of Noncontrolling Interests – Operating Partnership UnitsPartnership/Limited Partners Capital requesting an exchange of their OP UnitsNoncontrolling Interests – Operating Partnership/Limited Partners Capital with EQR. Once the Operating Partnership elects not to redeem the Noncontrolling Interests – Operating Partnership UnitsPartnership/Limited Partners Capital for cash, EQR is obligated to deliver Common Shares to the exchanging holder of the Noncontrolling Interests – Operating Partnership Units.Partnership/Limited Partners Capital.
The Noncontrolling Interests – Operating Partnership UnitsPartnership/Limited Partners Capital are classified as either mezzanine equity or permanent equity. If EQR is required, either by contract or securities law, to deliver registered Common Shares, such Noncontrolling Interests – Operating PartnershipPartnership/Limited Partners Capital are differentiated and referred to as “Redeemable Noncontrolling Interests – Operating Partnership”. and “Redeemable Limited Partners,” respectively. Instruments that require settlement in registered shares cannot be classified in permanent equity as it is not always completely within an issuer’s control to deliver registered shares. Therefore, settlement in cash is assumed and that responsibility for settlement in cash is deemed to fall to the Operating Partnership as the primary source of cash for EQR, resulting in presentation in the mezzanine section of the balance sheet. The Redeemable Noncontrolling Interests – Operating PartnershipPartnership/Redeemable Limited Partners are adjusted to the greater of carrying value or fair market value based on the Common Share price of EQR at the end of each respective reporting period. EQR has the ability to deliver unregistered Common Shares for the remaining portion of the Noncontrolling Interests – Operating Partnership UnitsPartnership/Limited Partners Capital that are classified in permanent equity at December 31, 20172020 and 2016.2019.
F-34
The carrying value of the Redeemable Noncontrolling Interests – Operating PartnershipPartnership/Redeemable Limited Partners is allocated based on the number of Redeemable Noncontrolling Interests – Operating Partnership UnitsPartnership/Redeemable Limited Partners in proportion to the number of Noncontrolling Interests – Operating Partnership UnitsPartnership/Limited Partners Capital in total. Such percentage of the total carrying value of Units/Limited Partner Units which is ascribed to the Redeemable Noncontrolling Interests – Operating PartnershipPartnership/Redeemable Limited Partners is then adjusted to the greater of carrying value or fair market value as described above. As of December 31, 2017,2020 and 2019, the Redeemable Noncontrolling Interests – Operating PartnershipPartnership/Redeemable Limited Partners have a redemption value of approximately $367.0$339.0 million and $463.4 million, respectively, which represents the value of Common Shares that would be issued in exchange for the Redeemable Noncontrolling Interests – Operating Partnership Units.Partnership/Redeemable Limited Partners.
The following table presents the changes in the redemption value of the Redeemable Noncontrolling Interests – Operating PartnershipPartnership/Redeemable Limited Partners for the years ended December 31, 2017, 20162020, 2019 and 2015,2018, respectively (amounts in thousands):
| 2017 |
|
| 2016 |
|
| 2015 |
|
| 2020 |
|
| 2019 |
|
| 2018 |
| ||||||
Balance at January 1, | $ | 442,092 |
|
| $ | 566,783 |
|
| $ | 500,733 |
|
| $ | 463,400 |
|
| $ | 379,106 |
|
| $ | 366,955 |
|
Change in market value |
| (41,916 | ) |
|
| (115,093 | ) |
|
| 64,378 |
|
|
| (125,224 | ) |
|
| 82,283 |
|
|
| 13,922 |
|
Change in carrying value |
| (33,221 | ) |
|
| (9,598 | ) |
|
| 1,672 |
|
|
| 775 |
|
|
| 2,011 |
|
|
| (1,771 | ) |
Balance at December 31, | $ | 366,955 |
|
| $ | 442,092 |
|
| $ | 566,783 |
|
| $ | 338,951 |
|
| $ | 463,400 |
|
| $ | 379,106 |
|
Net proceeds from EQR Common Share and Preferred Share (see definition below) offerings and proceeds from exercise of options for Common Shares are contributed by EQR to ERPOP. In return for those contributions, EQR receives a number of OP Units in ERPOP equal to the number of Common Shares it has issued in the equity offering (or in the case of a preferred equity offering, a number of preference units in ERPOP equal in number and having the same terms as the Preferred Shares issued in the equity offering). As a result, the net offering proceeds from Common Shares and Preferred Shares are allocated for the Company between shareholders’ equity and Noncontrolling Interests – Operating Partnership and for the Operating Partnership between General Partner’s Capital and Limited Partners Capital to account for the change in their respective percentage ownership of the underlying equityequity.
F-33
The Company’s declaration of trust authorizes it to issue up to 100,000,000 preferred shares of beneficial interest, $0.01 par value per share (the “Preferred Shares”), with specific rights, preferences and other attributes as the Board of Trustees may determine, which may include preferences, powers and rights that are senior to the rights of holders of the Company’s Common Shares.
The following table presents the Company’s issued and outstanding Preferred SharesShares/Preference Units as of December 31, 20172020 and 2016:
2019:
|
|
|
|
|
|
|
| Amounts in thousands |
| |||||
|
|
|
| Annual |
|
|
|
|
|
|
|
|
| |
|
| Call |
| Dividend Per |
|
| December 31, |
|
| December 31, |
| |||
|
| Date (1) |
| Share (2) |
|
| 2017 |
|
| 2016 |
| |||
Preferred Shares of beneficial interest, $0.01 par value; 100,000,000 shares authorized: |
|
|
|
|
|
|
|
|
|
|
|
|
|
|
8.29% Series K Cumulative Redeemable Preferred; liquidation value $50 per share; 745,600 shares issued and outstanding as of December 31, 2017 and 2016 |
| 12/10/26 |
| $ | 4.145 |
|
| $ | 37,280 |
|
| $ | 37,280 |
|
|
|
|
|
|
|
|
| $ | 37,280 |
|
| $ | 37,280 |
|
|
|
|
|
|
|
|
| Amounts in thousands |
| |||||
|
|
|
| Annual |
|
|
|
|
|
|
|
|
| |
|
| Call |
| Dividend Per |
|
| December 31, |
|
| December 31, |
| |||
|
| Date (1) |
| Share/Unit (2) |
|
| 2020 |
|
| 2019 |
| |||
Preferred Shares/Preference Units of beneficial interest, $0.01 par value; 100,000,000 shares authorized: |
|
|
|
|
|
|
|
|
|
|
|
|
|
|
8.29% Series K Cumulative Redeemable Preferred Shares/Preference Units; liquidation value $50 per share/unit; 745,600 shares/units issued and outstanding as of December 31, 2020 and 2019 |
| 12/10/26 |
| $ | 4.145 |
|
| $ | 37,280 |
|
| $ | 37,280 |
|
|
|
|
|
|
|
|
| $ | 37,280 |
|
| $ | 37,280 |
|
(1) | On or after the call date, redeemable |
(2) | Dividends on Preferred |
During 2015, the Company repurchased and retired 254,400 Series K Preferred Shares with a par value of $12.7 million for total cash consideration of approximately $16.3 million. As a result of this partial redemption, the Company incurred a cash charge of approximately $3.5 million which was recorded as a premium on the redemption of Preferred Shares.
F-35
Capital and Redeemable Limited Partners of ERP Operating Limited Partnership
The following tables present the changes in the Operating Partnership’s issued and outstanding Units and in the limited partners’ Units for the years ended December 31, 2017, 2016 and 2015:
|
| 2017 |
|
| 2016 |
|
| 2015 |
| |||
General and Limited Partner Units |
|
|
|
|
|
|
|
|
|
|
|
|
General and Limited Partner Units outstanding at January 1, |
|
| 380,496,999 |
|
|
| 379,182,608 |
|
|
| 377,154,145 |
|
Issued to General Partner: |
|
|
|
|
|
|
|
|
|
|
|
|
Exercise of EQR share options |
|
| 846,137 |
|
|
| 815,044 |
|
|
| 1,456,363 |
|
EQR’s Employee Share Purchase Plan (ESPP) |
|
| 68,286 |
|
|
| 63,909 |
|
|
| 68,462 |
|
EQR’s restricted share grants, net |
|
| 83,451 |
|
|
| 147,689 |
|
|
| 168,142 |
|
Issued to Limited Partners: |
|
|
|
|
|
|
|
|
|
|
|
|
Restricted unit grants, net |
|
| 291,647 |
|
|
| 287,749 |
|
|
| 335,496 |
|
General and Limited Partner Units outstanding at December 31, |
|
| 381,786,520 |
|
|
| 380,496,999 |
|
|
| 379,182,608 |
|
Limited Partner Units |
|
|
|
|
|
|
|
|
|
|
|
|
Limited Partner Units outstanding at January 1, |
|
| 14,626,075 |
|
|
| 14,427,164 |
|
|
| 14,298,691 |
|
Limited Partner restricted unit grants, net |
|
| 291,647 |
|
|
| 287,749 |
|
|
| 335,496 |
|
Conversion of EQR restricted shares to restricted units |
|
| — |
|
|
| — |
|
|
| 1,284 |
|
Conversion of Limited Partner OP Units to EQR Common Shares |
|
| (1,149,284 | ) |
|
| (88,838 | ) |
|
| (208,307 | ) |
Limited Partner Units outstanding at December 31, |
|
| 13,768,438 |
|
|
| 14,626,075 |
|
|
| 14,427,164 |
|
Limited Partner Units Ownership Interest in Operating Partnership |
|
| 3.6 | % |
|
| 3.8 | % |
|
| 3.8 | % |
The Limited Partners of the Operating Partnership as of December 31, 2017 include various individuals and entities that contributed their properties to the Operating Partnership in exchange for OP Units, as well as the equity positions of the holders of restricted units. Subject to certain exceptions (including the “book-up” requirements of restricted units), Limited Partners may exchange their Units with EQR for Common Shares on a one-for-one basis. The carrying value of the Limited Partner Units (including redeemable interests) is allocated based on the number of Limited Partner Units in total in proportion to the number of Limited Partner Units in total plus the number of General Partner Units. Net income is allocated to the Limited Partner Units based on the weighted average ownership percentage during the period.
The Operating Partnership has the right but not the obligation to make a cash payment instead of issuing Common Shares to any and all holders of Limited Partner Units requesting an exchange of their OP Units with EQR. Once the Operating Partnership elects not to redeem the Limited Partner Units for cash, EQR is obligated to deliver Common Shares to the exchanging limited partner.
The Limited Partner Units are classified as either mezzanine equity or permanent equity. If EQR is required, either by contract or securities law, to deliver registered Common Shares, such Limited Partner Units are differentiated and referred to as “Redeemable Limited Partner Units”. Instruments that require settlement in registered shares cannot be classified in permanent equity as it is not always completely within an issuer’s control to deliver registered shares. Therefore, settlement in cash is assumed and that responsibility for settlement in cash is deemed to fall to the Operating Partnership as the primary source of cash for EQR, resulting in presentation in the mezzanine section of the balance sheet. The Redeemable Limited Partner Units are adjusted to the greater of carrying value or fair market value based on the Common Share price of EQR at the end of each respective reporting period. EQR has the ability to deliver unregistered Common Shares for the remaining portion of the Limited Partner Units that are classified in permanent equity at December 31, 2017 and 2016.
The carrying value of the Redeemable Limited Partner Units is allocated based on the number of Redeemable Limited Partner Units in proportion to the number of Limited Partner Units in total. Such percentage of the total carrying value of Limited Partner Units which is ascribed to the Redeemable Limited Partner Units is then adjusted to the greater of carrying value or fair market value as described above. As of December 31, 2017, the Redeemable Limited Partner Units have a redemption value of approximately $367.0 million, which represents the value of Common Shares that would be issued in exchange for the Redeemable Limited Partner Units.
F-36
The following table presents the changes in the redemption value of the Redeemable Limited Partners for the years ended December 31, 2017, 2016 and 2015, respectively (amounts in thousands):
|
| 2017 |
|
| 2016 |
|
| 2015 |
| |||
Balance at January 1, |
| $ | 442,092 |
|
| $ | 566,783 |
|
| $ | 500,733 |
|
Change in market value |
|
| (41,916 | ) |
|
| (115,093 | ) |
|
| 64,378 |
|
Change in carrying value |
|
| (33,221 | ) |
|
| (9,598 | ) |
|
| 1,672 |
|
Balance at December 31, |
| $ | 366,955 |
|
| $ | 442,092 |
|
| $ | 566,783 |
|
EQR contributes all net proceeds from its various equity offerings (including proceeds from exercise of options for Common Shares) to ERPOP. In return for those contributions, EQR receives a number of OP Units in ERPOP equal to the number of Common Shares it has issued in the equity offering (or in the case of a preferred equity offering, a number of preference units in ERPOP equal in number and having the same terms as the preferred shares issued in the equity offering).
The following table presents the Operating Partnership’s issued and outstanding “Preference Units” as of December 31, 2017 and 2016:
|
|
|
|
|
|
|
| Amounts in thousands |
| |||||
|
|
|
| Annual |
|
|
|
|
|
|
|
|
| |
|
| Call |
| Dividend Per |
|
| December 31, |
|
| December 31, |
| |||
|
| Date (1) |
| Unit (2) |
|
| 2017 |
|
| 2016 |
| |||
Preference Units: |
|
|
|
|
|
|
|
|
|
|
|
|
|
|
8.29% Series K Cumulative Redeemable Preference Units; liquidation value $50 per unit; 745,600 units issued and outstanding as of December 31, 2017 and 2016 |
| 12/10/26 |
| $ | 4.145 |
|
| $ | 37,280 |
|
| $ | 37,280 |
|
|
|
|
|
|
|
|
| $ | 37,280 |
|
| $ | 37,280 |
|
|
|
|
|
During 2015, the Operating Partnership repurchased and retired 254,400 Series K Preference Units with a par value of $12.7 million for total cash consideration of approximately $16.3 million, in conjunction with the concurrent redemption of the corresponding Company Preferred Shares. As a result of this partial redemption, the Operating Partnership incurred a cash charge of approximately $3.5 million which was recorded as a premium of the redemption of Preference Units.
Other
EQR and ERPOP currently have an active universal shelf registration statement for the issuance of equity and debt securities that automatically became effective upon filing with the SEC onin June 28, 20162019 and expires onin June 28, 2019.2022. Per the terms of ERPOP’s partnership agreement, EQR contributes the net proceeds of all equity offerings to the capital of ERPOP in exchange for additional OP Units (on a one-for-one Common Share per OP Unit basis) or preference units (on a one-for-one preferred share per preference unit basis).
In September 2009, theThe Company announced the establishment ofhas an At-The-Market (“ATM”) share offering program which would allowallows EQR to sell Common Shares from time to time into the existing trading market at current market prices as well as through negotiated transactions. PerIn June 2019, the termsCompany extended the program maturity to June 2022. In connection with the extension, the Company may now also sell Common Shares under forward sale agreements. The use of ERPOP’s partnershipa forward sale agreement EQR contributeswould allow the netCompany to lock in a price on the sale of Common Shares at the time the agreement is executed, but defer receiving the proceeds from all equity offerings to the capital of ERPOP in exchange for additional OP Units (onsale until a one-for-one Common Share per OP Unit basis). The program currently has a maturity of June 2019.later date. EQR has the authority to issue 13.0 million shares but has not issued any shares under this program since September 2012.
The Company may repurchase up to 13.0 million Common Shares under its share repurchase program. No shares were repurchased during the years ended December 31, 2017NaN open market repurchases have occurred since 2008 and 2016.0 repurchases of any kind have occurred since February 2014. As of December 31, 2017,2020, EQR has remaining authorization to repurchase up to 13.0 million of its shares under the repurchase program.shares.
F-37F-34
4. Real Estate and Lease Intangibles
4. | Real Estate |
The following table summarizes the carrying amounts for the Company’s investment in real estate (at cost) as of December 31, 20172020 and 20162019 (amounts in thousands):
|
| 2017 |
|
| 2016 |
|
| 2020 |
|
| 2019 |
| ||||
Land |
| $ | 5,996,024 |
|
| $ | 5,899,862 |
|
| $ | 5,785,367 |
|
| $ | 5,936,188 |
|
Depreciable property: |
|
|
|
|
|
|
|
|
|
|
|
|
|
|
|
|
Buildings and improvements |
|
| 17,743,042 |
|
|
| 16,913,430 |
|
|
| 18,464,484 |
|
|
| 18,904,686 |
|
Furniture, fixtures and equipment |
|
| 1,548,961 |
|
|
| 1,346,300 |
|
|
| 1,970,033 |
|
|
| 1,916,458 |
|
In-Place lease intangibles |
|
| 476,359 |
|
|
| 470,849 |
|
|
| 486,137 |
|
|
| 497,957 |
|
Projects under development: |
|
|
|
|
|
|
|
|
|
|
|
|
|
|
|
|
Land |
|
| 43,226 |
|
|
| 115,876 |
|
|
| 23,531 |
|
|
| 23,531 |
|
Construction-in-progress |
|
| 120,321 |
|
|
| 521,292 |
|
|
| 387,603 |
|
|
| 158,099 |
|
Land held for development: |
|
|
|
|
|
|
|
|
|
|
|
|
|
|
|
|
Land |
|
| 62,538 |
|
|
| 84,440 |
|
|
| 46,160 |
|
|
| 64,460 |
|
Construction-in-progress |
|
| 36,425 |
|
|
| 34,376 |
|
|
| 40,010 |
|
|
| 32,228 |
|
Investment in real estate |
|
| 26,026,896 |
|
|
| 25,386,425 |
|
|
| 27,203,325 |
|
|
| 27,533,607 |
|
Accumulated depreciation |
|
| (6,040,378 | ) |
|
| (5,360,389 | ) |
|
| (7,859,657 | ) |
|
| (7,276,786 | ) |
Investment in real estate, net |
| $ | 19,986,518 |
|
| $ | 20,026,036 |
|
| $ | 19,343,668 |
|
| $ | 20,256,821 |
|
The following table summarizes the carrying amounts for the Company’s above and below market ground and retail lease intangibles as of December 31, 2017 and 2016 (amounts in thousands):
Description |
| Balance Sheet Location |
| 2017 |
|
| 2016 |
| ||
Assets |
|
|
|
|
|
|
|
|
|
|
Ground lease intangibles – below market |
| Other Assets |
| $ | 191,918 |
|
| $ | 178,251 |
|
Retail lease intangibles – above market |
| Other Assets |
|
| 1,260 |
|
|
| 1,260 |
|
Lease intangible assets |
|
|
|
| 193,178 |
|
|
| 179,511 |
|
Accumulated amortization |
|
|
|
| (22,434 | ) |
|
| (17,972 | ) |
Lease intangible assets, net |
|
|
| $ | 170,744 |
|
| $ | 161,539 |
|
|
|
|
|
|
|
|
|
|
|
|
Liabilities |
|
|
|
|
|
|
|
|
|
|
Ground lease intangibles – above market |
| Other Liabilities |
| $ | 2,400 |
|
| $ | 2,400 |
|
Retail lease intangibles – below market |
| Other Liabilities |
|
| 5,270 |
|
|
| 5,270 |
|
Lease intangible liabilities |
|
|
|
| 7,670 |
|
|
| 7,670 |
|
Accumulated amortization |
|
|
|
| (5,143 | ) |
|
| (4,509 | ) |
Lease intangible liabilities, net |
|
|
| $ | 2,527 |
|
| $ | 3,161 |
|
The following table provides a summary of the effect of the amortization for above and below market ground and retail lease intangibles on the Company’s accompanying consolidated statements of operations and comprehensive income for the years ended December 31, 2017, 2016 and 2015 (amounts in thousands):
Description |
| Income Statement Location |
| 2017 |
|
| 2016 |
|
| 2015 |
| |||
Ground lease intangible amortization |
| Property and Maintenance |
| $ | (4,369 | ) |
| $ | (4,321 | ) |
| $ | (4,321 | ) |
Retail lease intangible amortization |
| Rental Income |
|
| 541 |
|
|
| 895 |
|
|
| 939 |
|
Total amortization of above/below market lease intangibles |
|
|
| $ | (3,828 | ) |
| $ | (3,426 | ) |
| $ | (3,382 | ) |
The following table provides a summary of the aggregate amortization for above and below market ground and retail lease intangibles for each of the next five years (amounts in thousands):
|
| 2018 |
|
| 2019 |
|
| 2020 |
|
| 2021 |
|
| 2022 |
|
| |||||
Ground lease intangibles |
| $ | (4,463 | ) |
| $ | (4,463 | ) |
| $ | (4,463 | ) |
| $ | (4,463 | ) |
| $ | (4,463 | ) |
|
Retail lease intangibles |
| 71 |
|
|
| 71 |
|
|
| 71 |
|
|
| 71 |
|
|
| 27 |
|
| |
Total |
| $ | (4,392 | ) |
| $ | (4,392 | ) |
| $ | (4,392 | ) |
| $ | (4,392 | ) |
| $ | (4,436 | ) |
|
F-38
During the year ended December 31, 2017,2020, the Company acquired the entire equity interest in the following from unaffiliated parties (purchase price in thousands):
|
| Properties |
|
| Apartment Units |
|
| Purchase Price |
|
| Properties |
|
| Apartment Units |
|
| Purchase Price |
| ||||||
Rental Properties – Consolidated (1) |
|
| 4 |
|
|
| 947 |
|
| $ | 468,050 |
|
|
| 1 |
|
|
| 158 |
|
| $ | 48,860 |
|
Total |
|
| 4 |
|
|
| 947 |
|
| $ | 468,050 |
|
|
| 1 |
|
|
| 158 |
|
| $ | 48,860 |
|
(1) | Purchase price includes an allocation of approximately |
During the year ended December 31, 2016,2019, the Company acquired the entire equity interest in the following from unaffiliated parties (purchase price in thousands):
|
| Properties |
|
| Apartment Units |
|
| Purchase Price |
|
| Properties |
|
| Apartment Units |
|
| Purchase Price |
| ||||||
Rental Properties – Consolidated (1) |
|
| 4 |
|
|
| 573 |
|
| $ | 249,334 |
|
|
| 13 |
|
|
| 3,540 |
|
| $ | 1,494,689 |
|
Land Parcels (four) (2) |
|
| — |
|
|
| — |
|
|
| 19,832 |
| ||||||||||||
Total |
|
| 4 |
|
|
| 573 |
|
| $ | 249,334 |
|
|
| 13 |
|
|
| 3,540 |
|
| $ | 1,514,521 |
|
(1) | Purchase price includes an allocation of approximately |
(2) | Purchase price includes an allocation of approximately $16.7 million to |
During the year ended December 31, 2017,2020, the Company disposed of the following to unaffiliated parties (sales price in thousands):
|
| Properties |
|
| Apartment Units |
|
| Sales Price |
|
| Properties |
|
| Apartment Units |
|
| Sales Price |
| ||||||
Rental Properties – Consolidated |
|
| 5 |
|
|
| 1,194 |
|
| $ | 354,950 |
|
|
| 6 |
|
|
| 2,231 |
|
| $ | 1,066,861 |
|
Land Parcels (one) |
|
| — |
|
|
| — |
|
|
| 33,450 |
| ||||||||||||
Land Parcels (two) |
|
| — |
|
|
| — |
|
|
| 55,510 |
| ||||||||||||
Total |
|
| 5 |
|
|
| 1,194 |
|
| $ | 388,400 |
|
|
| 6 |
|
|
| 2,231 |
|
| $ | 1,122,371 |
|
The Company recognized a net gain on sales of real estate properties of approximately $157.1$531.8 million and a net gain on sales of land parcels of approximately $19.2$34.2 million on the above sales.
F-35
During the year ended December 31, 2016,2019, the Company disposed of the following to unaffiliated parties (sales price in thousands):
|
| Properties |
|
| Apartment Units |
|
| Sales Price |
| |||
Consolidated: |
|
|
|
|
|
|
|
|
|
|
|
|
Rental Properties (1) |
|
| 98 |
|
|
| 29,440 |
|
| $ | 6,811,503 |
|
Land Parcels |
|
| — |
|
|
| — |
|
|
| 57,455 |
|
Unconsolidated: |
|
|
|
|
|
|
|
|
|
|
|
|
Rental Properties (2) |
|
| 1 |
|
|
| 336 |
|
|
| 74,500 |
|
Total |
|
| 99 |
|
|
| 29,776 |
|
| $ | 6,943,458 |
|
|
| Properties |
|
| Apartment Units |
|
| Sales Price |
| |||
Rental Properties – Consolidated |
|
| 11 |
|
|
| 2,361 |
|
| $ | 1,080,675 |
|
Rental Properties – Unconsolidated (1) |
|
| 2 |
|
|
| 945 |
|
|
| 394,500 |
|
Land Parcels (two) |
|
| — |
|
|
| — |
|
|
| 2,100 |
|
Total |
|
| 13 |
|
|
| 3,306 |
|
| $ | 1,477,275 |
|
(1) |
|
| The Company owned a 20% interest in |
The Company recognized a net gain on sales of real estate properties of approximately $4.0 billion (inclusive of $3.2 billion on the Starwood Portfolio sale), a net gain on sales of land parcels of approximately $15.7$447.6 million, and a net gain on sales of unconsolidated entities (included in income (loss) from investments in unconsolidated entities in the consolidated statements of operations and comprehensive income) of approximately $8.9$69.5 million and a net gain on sale of land parcels of approximately $2.0 million on the above sales.
Starwood Disposition
The Company executed an agreement with controlled affiliates of Starwood Capital Group (“Starwood”) on October 23, 2015 to sell a portfolio of 72 operating properties consisting of 23,262 apartment units located in five markets across the United States for $5.365 billion (the “Starwood Transaction” or “Starwood Portfolio”). The Starwood Portfolio included substantially all of the assets in the Company’s South Florida and Denver markets and certain suburban assets in the Washington D.C.,
F-39
Seattle and Los Angeles markets. On January 26 and 27, 2016, the Company closed on the sale of the entire portfolio described above.
The following table provides the operating segments/locations of the properties and apartment units sold in the Starwood Transaction. The sale of these properties represents the continuation of the Company’s long-term strategy of investing in the urban and high-density suburban areas of its coastal gateway markets. See Note 11 for further discussion.
Markets/Metro Areas |
| Properties |
|
| Apartment Units |
| ||
South Florida |
|
| 33 |
|
|
| 10,742 |
|
Denver |
|
| 18 |
|
|
| 6,635 |
|
Washington D.C. |
|
| 10 |
|
|
| 3,020 |
|
Seattle |
|
| 8 |
|
|
| 1,721 |
|
Los Angeles |
|
| 3 |
|
|
| 1,144 |
|
Total |
|
| 72 |
|
|
| 23,262 |
|
The Company used proceeds from the Starwood Transaction and other 2016 sales discussed above to pay special dividends of $8.00 per share/unit (approximately $3.0 billion) on March 10, 2016 and $3.00 per share/unit (approximately $1.1 billion) on October 14, 2016. The Company used the majority of the remaining proceeds to reduce aggregate indebtedness in order to make the transaction leverage neutral. See Note 8 for further discussion.
Impairment
During the year ended December 31, 2017,2018, the Company recorded an approximate $1.7$0.7 million non-cash asset impairment charge on a land parcel currently being marketed for sale, which is included in land held for development on the consolidated balance sheets and includedproperty located in the non-same store/other segment discussed in Note 17. The charge was the result of an analysis of the parcel’s estimated fair value (determined using internally developed models based onSan Francisco market assumptions and potential sales data from the marketing process) compareddue to its current capitalized carrying value. The parcel now has a carrying value of $0.2 million.
Other
In December 2011, the Company and Toll Brothers (NYSE: TOL) jointly acquired a vacant land parcel at 400 Park Avenue South in New York City. The Company’s and Toll Brothers’ allocated portions of the purchase price were approximately $76.1 million and $57.9 million, respectively. The acquisition was financed through contributions by the Company and Toll Brothers of approximately $102.5 million and $75.7 million, respectively, which included the land purchase noted above, restricted deposits and taxes and fees. Until the core and shell of the building were complete, the building and land were owned jointly and were required to be consolidated on the Company’s balance sheets as the Company was the managing member and Toll Brothers did not have substantive kick-out or participating rights. In July 2015, the Company recorded the master condominium declaration for this development project andphysical property damage as a result the Toll Brothers’ portionof a fire at 1 of the property was deconsolidated frombuildings at the Company’s balance sheets. The Company now solely owns the rental portion of the building (floors 2-22) and the ground floor retail and Toll Brothers solely owns the for sale portion of the building (floors 23-40). The joint venture no longer owns any real property. In conjunction with this transaction, the Company reduced investment in real estate by $116.7 million, noncontrolling interests in partially owned properties by $117.3 million and accrued retainage by $1.1 million and increased other liabilities by $1.7 million (to account for Toll Brothers’ restricted cash still held by the Company). The deconsolidation of the Toll Brothers’ portion of the project had no impact on the consolidated results of operations and comprehensive income.
5. | Commitments to Acquire/Dispose of Real Estate |
The Company has not entered into a separateany agreements to acquire rental properties or land parcels as of the date of filing.
The Company has entered into an agreement to acquiredispose the following (purchase(sales price and net book value in thousands):
|
| Properties |
|
| Apartment Units |
|
| Purchase Price |
| |||
Rental Properties - Consolidated |
|
| 1 |
|
|
| 117 |
|
| $ | 53,700 |
|
Total |
|
| 1 |
|
|
| 117 |
|
| $ | 53,700 |
|
F-40
In addition to the properties that were subsequently disposed of as discussed in Note 18, the Company has entered into separate agreements to dispose of the following (sales price in thousands):
|
| Properties |
|
| Apartment Units |
|
| Sales Price |
| |||
Rental Properties - Consolidated |
|
| 2 |
|
|
| 455 |
|
| $ | 177,020 |
|
Land Parcels (one) |
|
| — |
|
|
| — |
|
|
| 2,700 |
|
Total |
|
| 2 |
|
|
| 455 |
|
| $ | 179,720 |
|
|
| Properties |
|
| Apartment Units |
|
| Sales Price |
|
| Net Book Value at December 31, 2020 |
| ||||
Rental Properties – Consolidated |
|
| 1 |
|
|
| 263 |
|
| $ | 84,250 |
|
| $ | 17,748 |
|
Total |
|
| 1 |
|
|
| 263 |
|
| $ | 84,250 |
|
| $ | 17,748 |
|
The closingsclosing of thesethis pending transactions aretransaction is subject to certain conditions and restrictions,restrictions; therefore, there can be no assurance that these transactionsthis transaction will be consummated or that the final terms will not differ in material respects from thoseany agreements summarized above. See Note 18 for discussion of the properties acquired or disposed of, if any, subsequent to December 31, 2020.
6. | Investments in Partially Owned Entities |
The Company has co-investedinvested in various properties with unrelated third parties which are either consolidated or accounted for under the equity method of accounting (unconsolidated). The following tables and information summarize the Company’s investments in partially owned entities as
Consolidated VIEs
In accordance with accounting standards for consolidation of December 31, 2017 (amounts in thousands except for project and apartment unit amounts):
|
| Consolidated |
|
| Unconsolidated |
| ||||||||||
|
| (VIE) |
|
| (Non-VIE) |
|
| (VIE) (1) |
|
| Total |
| ||||
Total properties |
|
| 17 |
|
|
| 2 |
|
|
| — |
|
|
| 2 |
|
Total apartment units |
|
| 3,215 |
|
|
| 945 |
|
|
| — |
|
|
| 945 |
|
Balance sheet information at 12/31/17 (at 100%): |
|
|
|
|
|
|
|
|
|
|
|
|
|
|
|
|
ASSETS |
|
|
|
|
|
|
|
|
|
|
|
|
|
|
|
|
Investment in real estate |
| $ | 649,777 |
|
| $ | 236,749 |
|
| $ | 172,995 |
|
| $ | 409,744 |
|
Accumulated depreciation |
|
| (236,543 | ) |
|
| (43,512 | ) |
|
| (50,045 | ) |
|
| (93,557 | ) |
Investment in real estate, net |
|
| 413,234 |
|
|
| 193,237 |
|
|
| 122,950 |
|
|
| 316,187 |
|
Cash and cash equivalents |
|
| 34,954 |
|
|
| 5,245 |
|
|
| 60 |
|
|
| 5,305 |
|
Investments in unconsolidated entities |
|
| 44,451 |
|
|
| — |
|
|
| — |
|
|
| — |
|
Restricted deposits |
|
| 393 |
|
|
| 258 |
|
|
| — |
|
|
| 258 |
|
Other assets |
|
| 25,851 |
|
|
| 323 |
|
|
| 395 |
|
|
| 718 |
|
Total assets |
| $ | 518,883 |
|
| $ | 199,063 |
|
| $ | 123,405 |
|
| $ | 322,468 |
|
|
|
|
|
|
|
|
|
|
|
|
|
|
|
|
|
|
LIABILITIES AND EQUITY/CAPITAL |
|
|
|
|
|
|
|
|
|
|
|
|
|
|
|
|
Mortgage notes payable, net (2) |
| $ | 302,347 |
|
| $ | 145,424 |
|
| $ | — |
|
| $ | 145,424 |
|
Accounts payable & accrued expenses |
|
| 1,110 |
|
|
| 181 |
|
|
| 295 |
|
|
| 476 |
|
Accrued interest payable |
|
| 1,037 |
|
|
| 691 |
|
|
| — |
|
|
| 691 |
|
Other liabilities |
|
| 465 |
|
|
| 291 |
|
|
| 6 |
|
|
| 297 |
|
Security deposits |
|
| 2,053 |
|
|
| 485 |
|
|
| — |
|
|
| 485 |
|
Total liabilities |
|
| 307,012 |
|
|
| 147,072 |
|
|
| 301 |
|
|
| 147,373 |
|
Noncontrolling Interests – Partially Owned Properties/Partners’ equity |
|
| 4,708 |
|
|
| 52,850 |
|
|
| 84,302 |
|
|
| 137,152 |
|
Company equity/General and Limited Partners’ Capital |
|
| 207,163 |
|
|
| (859 | ) |
|
| 38,802 |
|
|
| 37,943 |
|
Total equity/capital |
|
| 211,871 |
|
|
| 51,991 |
|
|
| 123,104 |
|
|
| 175,095 |
|
Total liabilities and equity/capital |
| $ | 518,883 |
|
| $ | 199,063 |
|
| $ | 123,405 |
|
| $ | 322,468 |
|
F-41
|
| Consolidated |
|
| Unconsolidated |
| ||||||||||
|
| (VIE) |
|
| (Non-VIE) |
|
| (VIE) (1) |
|
| Total |
| ||||
Operating information for the year ended 12/31/17 (at 100%): |
|
|
|
|
|
|
|
|
|
|
|
|
|
|
|
|
Operating revenue |
| $ | 93,472 |
|
| $ | 26,898 |
|
| $ | 5,243 |
|
| $ | 32,141 |
|
Operating expenses |
|
| 22,412 |
|
|
| 8,936 |
|
|
| 2,463 |
|
|
| 11,399 |
|
Net operating income |
|
| 71,060 |
|
|
| 17,962 |
|
|
| 2,780 |
|
|
| 20,742 |
|
Property management |
|
| 3,401 |
|
|
| 784 |
|
|
| 75 |
|
|
| 859 |
|
General and administrative |
|
| 279 |
|
|
| 3 |
|
|
| — |
|
|
| 3 |
|
Depreciation |
|
| 25,505 |
|
|
| 10,633 |
|
|
| 5,501 |
|
|
| 16,134 |
|
Operating income (loss) |
|
| 41,875 |
|
|
| 6,542 |
|
|
| (2,796 | ) |
|
| 3,746 |
|
Interest and other income |
|
| 77 |
|
|
| — |
|
|
| — |
|
|
| — |
|
Interest: |
|
|
|
|
|
|
|
|
|
|
|
|
|
|
|
|
Expense incurred, net |
|
| (13,316 | ) |
|
| (8,289 | ) |
|
| — |
|
|
| (8,289 | ) |
Amortization of deferred financing costs |
|
| (270 | ) |
|
| (1 | ) |
|
| — |
|
|
| (1 | ) |
Income (loss) before income and other taxes and income (loss) from investments in unconsolidated entities |
|
| 28,366 |
|
|
| (1,748 | ) |
|
| (2,796 | ) |
|
| (4,544 | ) |
Income and other tax (expense) benefit |
|
| (27 | ) |
|
| (13 | ) |
|
| — |
|
|
| (13 | ) |
Income (loss) from investments in unconsolidated entities |
|
| (1,549 | ) |
|
| — |
|
|
| — |
|
|
| — |
|
Net income (loss) |
| $ | 26,790 |
|
| $ | (1,761 | ) |
| $ | (2,796 | ) |
| $ | (4,557 | ) |
|
|
|
|
Note: The above tables exclude EQR’s ownership interest in ERPOP, private equity fund investments, and the Company’s interests in unconsolidated joint ventures established in connection with the acquisition of certain real estate related assets from Archstone Enterprise LP (“Archstone”). These ventures owned certain Archstone assets and succeeded to certain residual Archstone liabilities/litigation, as well as responsibility for tax protection arrangements and third-party preferred interests in former Archstone subsidiaries. The preferred interests had an aggregate liquidation value of $37.3 million at December 31, 2017. The ventures are owned 60% by the Company. See below for further discussion.
Operating Properties
The Company has various equity interests in certain limited partnerships owning 16 properties containing 2,783 apartment units. Each partnership owns a multifamily property. The Company is the general partner of these limited partnerships and is responsible for managing the operations and affairs of the partnerships as well as making all decisions regarding the businesses of the partnerships. The limited partners are not able to exercise substantive kick-out or participating rights. As a result, the partnerships qualify as VIEs. The Company has a controlling financial interest in the VIEs, and, thus, is the VIEs’ primary beneficiary. The Company has both the power to direct the activities of the VIEs that most significantly impact the VIEs’ economic performance as well as the obligation to absorb losses or the right to receive benefits from the VIEs that could potentially be significant to the VIEs. As a result, the partnerships are required to be consolidated on the Company’s financial statements.
The Company has a 75% equity interest in the Wisconsin Place joint venture. The project contains a mixed-use site located in Chevy Chase, Maryland consisting of residential, retail, office and accessory uses, including underground parking facilities. The joint venture owns the 432 unit residential component, but has no ownership interest in the retail and office components. At December 31, 2017, the residential component had a net book value of $160.9 million. The Company is the managing member and is responsible for conducting all administrative day-to-day matters and affairs of the joint venture as well as implementing all decisions with respect to the joint venture. The limited partner is not able to exercise substantive kick-out or participating rights. As a result, the joint venture qualifies as a VIE. The Company has a controlling financial interest in the VIE and, thus, is the VIE’s primary beneficiary. The Company has both the power to direct the activities of the VIE that most significantly impact the VIE’s economic performance as well as the obligation to absorb losses or the right to receive benefits from the VIE that could potentially be significant to the VIE. As a result, the entity that owns the residential component is required to be consolidated on the Company’s financial statements.
The Wisconsin Place joint venture also retains an unconsolidated interest in an entity that owns the land underlying the entire project and owns and operates the parking facility. At December 31, 2017, the basis of this investment was $44.5 million. The joint venture, as a limited partner, does not have substantive kick-out or participating rights in the entity. As a result, the entity qualifies as a VIE. The joint venture does not have a controlling financial interest in the VIE and is not the VIE’s primary beneficiary. The joint venture does not have the power to direct the activities of the VIE that most significantly impact the VIE’s economic performance or the obligation to absorb losses or the right to receive benefits from the VIE that
F-42
could potentially be significant to the VIE. As a result, the entity that owns the land and owns and operates the parking facility is unconsolidated and recorded using the equity method of accounting.
The Company has a 20% equity interest in each of the Nexus Sawgrass and Domain joint ventures. The Nexus Sawgrass joint venture owns a 501 unit apartment property located in Sunrise, Florida and the Company’s interest had a basis of $4.2 million at December 31, 2017. The Domain joint venture owns a 444 unit apartment property located in San Jose, California and the Company’s interest had a basis of $8.2 million at December 31, 2017. Both properties were funded with long-term, non-recourse secured loans from the partner. The mortgage loan on Nexus Sawgrass has a current unconsolidated outstanding balance of $48.6 million, bears interest at 5.60% and matures January 1, 2021. The mortgage loan on Domain has a current unconsolidated outstanding balance of $96.8 million, bears interest at 5.75% and matures January 1, 2022. While the Company is the managing member of both of the joint ventures, the joint venture partner has significant participating rights and has active involvement in the oversight of the operations. As a result, the entities do not qualify as VIEs. The Company alone does not have the power to direct the activities of the entities that most significantly impact the entities’ economic performance and as a result, the entities are unconsolidated and recorded using the equity method of accounting.
Other
consolidates ERPOP on EQR’s financial statements. As the sole general partner of ERPOP, EQR has exclusive control of ERPOP’s day-to-day management. The limited partners are not able to exercise substantive kick-out or participating rights. As a result, ERPOP qualifies as a VIE. EQR has a controlling financial interest in ERPOP and, thus, is ERPOP’s primary beneficiary. EQR has the power to direct the activities of ERPOP that most significantly impact ERPOP’s economic performance as well as the obligation to absorb losses or the right to receive benefits from ERPOP that could potentially be significant to ERPOP. As a result, ERPOP is required to be consolidated on EQR’s financial statements.
The Company agreed to a maximum investment of $5.0 million each for two privatehas various equity funds, both of which primarily focus on real estate technology investments. interests in certain joint ventures owning 16 properties containing 3,399 apartment units. The Company accountsis the general partner or managing member of these joint ventures and is responsible for both investments undermanaging the equity method of accounting. As of December 31, 2017, the Company’s interest in these investments had a combined basis of $2.1 million.
On February 27, 2013, in connection with the acquisition of Archstone, subsidiariesoperations and affairs of the Company entered into three limited liability company agreements (collectively,joint ventures as well as making all decisions regarding the “Residual JV”). The Residual JV owned certain Archstone assets and succeeded to certain residual Archstone liabilities/litigation. The Residual JV is owned 60% by the Company and 40% by its joint venture partner. The Company’s basis at December 31, 2017 was a net obligation of $0.7 million. The Residual JV is managed by a Management Committee consisting of two members from eachbusinesses of the Company and its joint venture partner. Bothventures. The limited partners have equal participation in the Management Committee and all significantor non-managing members are not able to exercise substantive kick-out or participating rights are shared by both partners.rights. As a result, the Residual JV does notjoint ventures qualify as a VIE.VIEs. The Company alone does not havehas a controlling financial interest in the VIEs and, thus, is the VIEs’ primary beneficiary. The Company has both the power to direct the activities of the Residual JVVIEs that most significantly impact the Residual JV’sVIEs’ economic performance and as well as the obligation to
F-36
absorb losses or the right to receive benefits from the VIEs that could potentially be significant to the VIEs. As a result, the Residual JV isjoint ventures are required to be consolidated on the Company’s financial statements.
The Company also has two separate consolidated joint ventures which each own land parcels that are being/will be developed into multifamily rental properties. These joint ventures have been deemed to be VIEs and are consolidated due to the Company being the primary beneficiary.
The consolidated assets and liabilities related to the VIEs discussed above were approximately $784.1 million and $224.0 million, respectively, at December 31, 2020 and approximately $754.7 million and $323.1 million, respectively, at December 31, 2019.
Investments in Unconsolidated Entities
The following table and information summarizes the Company’s investments in unconsolidated and recorded usingentities, which are accounted for under the equity method of accounting. The Residual JV has sold allaccounting as the requirements for consolidation are not met, as of the real estate assets that were acquired as part of the acquisition of Archstone, including all of the German assets, and is in the process of winding down all remaining activities.
On February 27, 2013, in connection with the acquisition of Archstone, a subsidiary of the Company entered into a limited liability company agreement (the “Legacy JV”), through which they assumed obligations of Archstone in the form of preferred interests, some of which are governed by tax protection arrangements. At December 31, 2017, the remaining preferred interests had an aggregate liquidation value of $37.3 million, our share of which is included2020 and 2019 (amounts in other liabilities in the accompanying consolidated balance sheets. Obligations of the Legacy JV are borne 60% by the Company and 40% by its joint venture partner. The Legacy JV is managed by a Management Committee consisting of two members from each of the Company and its joint venture partner. Both partners have equal participation in the Management Committee and all significant participating rights are shared by both partners. As a result, the Legacy JV does not qualify as a VIE. The Company alone does not have the power to direct the activities of the Legacy JV that most significantly impact the Legacy JV’s economic performance and as a result, the Legacy JV is unconsolidated and recorded using the equity method of accounting.thousands except for ownership percentage):
F-43
| December 31, 2020 |
|
| December 31, 2019 |
|
| Ownership Percentage |
| |||
Investments in Unconsolidated Entities: |
|
|
|
|
|
|
|
|
|
|
|
Operating Property (VIE) (1) | $ | 38,288 |
|
| $ | 40,361 |
|
| 33.3% |
| |
Real Estate Technology (2) |
| 14,866 |
|
|
| 12,318 |
|
| Varies |
| |
Other |
| (372 | ) |
|
| (441 | ) |
| Varies |
| |
Investments in Unconsolidated Entities | $ | 52,782 |
|
| $ | 52,238 |
|
|
|
|
|
(1) | Represents an unconsolidated interest in an entity that owns the land underlying one of the consolidated joint venture properties noted above and owns and operates a related parking facility. The joint venture, as a limited partner, does not have substantive kick-out or participating rights in the entity. As a result, the entity qualifies as a VIE. The joint venture does not have a controlling financial interest in the VIE and is not the VIE’s primary beneficiary. The joint venture does not have the power to direct the activities of the VIE that most significantly impact the VIE’s economic performance or the obligation to absorb losses or the right to receive benefits from the VIE that could potentially be significant to the VIE. As a result, the entity that owns the land and owns and operates the parking facility is unconsolidated and recorded using the equity method of accounting. |
(2) | Represents unconsolidated investments in 5 separate real estate technology funds/companies. |
The following table presents the Company’s restricted deposits as of December 31, 20172020 and 20162019 (amounts in thousands):
|
| December 31, 2017 |
|
| December 31, 2016 |
|
| December 31, 2020 |
|
| December 31, 2019 |
| ||||
Mortgage escrow deposits: |
|
|
|
|
|
|
|
|
|
|
|
|
|
|
|
|
Real estate taxes and insurance |
| $ | 845 |
|
| $ | 2,003 |
| ||||||||
Replacement reserves |
|
| 8,347 |
|
|
| 3,428 |
|
| $ | 9,877 |
|
| $ | 8,543 |
|
Mortgage principal reserves/sinking funds |
|
| 3,167 |
|
|
| 58,652 |
|
|
| 14,168 |
|
|
| 9,689 |
|
Other |
|
| 852 |
|
|
| 852 |
| ||||||||
Mortgage escrow deposits |
|
| 13,211 |
|
|
| 64,935 |
|
|
| 24,045 |
|
|
| 18,232 |
|
Restricted cash: |
|
|
|
|
|
|
|
|
|
|
|
|
|
|
|
|
Tax-deferred (1031) exchange proceeds |
|
| — |
|
|
| 38,847 |
|
|
| — |
|
|
| 14,232 |
|
Earnest money on pending acquisitions |
|
| 750 |
|
|
| — |
| ||||||||
Restricted deposits on real estate investments |
|
| 58 |
|
|
| 733 |
|
|
| 307 |
|
|
| 658 |
|
Resident security and utility deposits |
|
| 35,183 |
|
|
| 37,007 |
|
|
| 31,412 |
|
|
| 37,140 |
|
Other |
|
| 913 |
|
|
| 359 |
|
|
| 1,373 |
|
|
| 984 |
|
Restricted cash |
|
| 36,904 |
|
|
| 76,946 |
|
|
| 33,092 |
|
|
| 53,014 |
|
Restricted deposits |
| $ | 50,115 |
|
| $ | 141,881 |
|
| $ | 57,137 |
|
| $ | 71,246 |
|
8. | Leases |
Lessor Accounting
The Company is the lessor for its residential and non-residential leases and these leases will continue to be accounted for as operating leases under the lease standard as described in Note 2.
For the years ended December 31, 2020 and 2019, approximately 98% and 97%, respectively, of the Company’s total lease revenue is generated from residential apartment leases that are generally twelve months or less in length. The residential apartment leases may include lease income related to such items as utility recoveries, parking, storage and pet rent that the Company treats as a
F-37
single lease component because the amenities cannot be leased on their own and the timing and pattern of revenue recognition are the same. The collection of lease payments at lease commencement is probable and therefore the Company subsequently recognizes lease income over the lease term on a straight-line basis. Residential leases are renewable upon consent of both parties on an annual or monthly basis.
For the years ended December 31, 2020 and 2019, approximately 2% and 3%, respectively, of the Company’s total lease revenue is generated by non-residential leases that are generally for terms ranging between five to ten years. The non-residential leases generally consist of ground floor retail spaces and master-leased parking garages that serve as additional amenities for our residents. The non-residential leases may include lease income related to such items as utility recoveries, parking rent and storage rent that the Company treats as a single lease component because the amenities cannot be leased on their own and the timing and pattern of revenue recognition are the same. The collection of lease payments at lease commencement is probable and therefore the Company subsequently recognizes lease income over the lease term on a straight-line basis. Non-residential leases are renewable with market-based renewal options.
The Company elected the practical expedient to account for both its lease and non-lease components (specifically common area maintenance charges) as a single lease component under the lease standard.
The following table presents the lease income types relating to lease payments for residential and non-residential leases along with the total other rental income for the years ended December 31, 2020 and 2019 (amounts in thousands):
|
| Year Ended December 31, 2020 |
|
| Year Ended December 31, 2019 |
| ||||||||||||||||||
Income Type |
| Residential Leases |
|
| Non-Residential Leases |
|
| Total |
|
| Residential Leases |
|
| Non-Residential Leases |
|
| Total |
| ||||||
Residential and non-residential rent |
| $ | 2,336,778 |
|
| $ | 51,663 |
|
| $ | 2,388,441 |
|
| $ | 2,414,201 |
|
| $ | 71,988 |
|
| $ | 2,486,189 |
|
Utility recoveries (RUBS income) (1) |
|
| 70,699 |
|
|
| 677 |
|
|
| 71,376 |
|
|
| 67,659 |
|
|
| 917 |
|
|
| 68,576 |
|
Parking rent |
|
| 38,743 |
|
|
| 412 |
|
|
| 39,155 |
|
|
| 37,557 |
|
|
| 348 |
|
|
| 37,905 |
|
Storage rent |
|
| 3,674 |
|
|
| 84 |
|
|
| 3,758 |
|
|
| 3,745 |
|
|
| 71 |
|
|
| 3,816 |
|
Pet rent |
|
| 11,457 |
|
|
| — |
|
|
| 11,457 |
|
|
| 11,617 |
|
|
| — |
|
|
| 11,617 |
|
Total lease revenue |
| $ | 2,461,351 |
|
| $ | 52,836 |
|
|
| 2,514,187 |
|
| $ | 2,534,779 |
|
| $ | 73,324 |
|
|
| 2,608,103 |
|
Parking revenue |
|
|
|
|
|
|
|
|
|
| 22,210 |
|
|
|
|
|
|
|
|
|
|
| 28,272 |
|
Other revenue |
|
|
|
|
|
|
|
|
|
| 35,308 |
|
|
|
|
|
|
|
|
|
|
| 64,316 |
|
Total other rental income (2) |
|
|
|
|
|
|
|
|
|
| 57,518 |
|
|
|
|
|
|
|
|
|
|
| 92,588 |
|
Rental income |
|
|
|
|
|
|
|
|
| $ | 2,571,705 |
|
|
|
|
|
|
|
|
|
| $ | 2,700,691 |
|
(1) | RUBS income primarily consists of variable payments representing the recovery of utility costs from residents. |
(2) | Other rental income is accounted for under the revenue recognition standard. |
The economic impact of the pandemic on a subset of our residents and tenants has led to elevated levels of bad debt. We continue to work with our residents and tenants on payment plans and collections and our bad debt allowance policies remain consistent.
The following table presents residential and non-residential accounts receivable and straight-line receivable balances for the Company’s properties as of December 31, 2020 and 2019 (amounts in thousands):
|
| Residential |
|
| Non-Residential |
| ||||||||||
Balance Sheet (Other assets): |
| December 31, 2020 |
|
| December 31, 2019 |
|
| December 31, 2020 |
|
| December 31, 2019 |
| ||||
Resident/tenant accounts receivable balances |
| $ | 30,856 |
|
| $ | 4,040 |
|
| $ | 7,598 |
|
| $ | 1,766 |
|
Allowance for doubtful accounts |
|
| (24,021 | ) |
|
| (1,190 | ) |
|
| (6,527 | ) |
|
| (1,412 | ) |
Net receivable balances |
| $ | 6,835 |
| (1) | $ | 2,850 |
|
| $ | 1,071 |
|
| $ | 354 |
|
|
|
|
|
|
|
|
|
|
|
|
|
|
|
|
|
|
Straight-line receivable balances |
| $ | 19,992 |
|
| $ | 1,841 |
|
| $ | 13,413 |
|
| $ | 26,450 |
|
(1) | The Company held residential security deposits approximating 31.6% of the net receivable balance at December 31, 2020. |
The following table presents residential bad debt for the Company’s properties for the years ended December 31, 2020 and 2019 (amounts in thousands):
|
| Year Ended December 31, |
| |||||
Income Statement (Rental income): |
|
| 2020 |
|
|
| 2019 |
|
Bad debt, net |
| $ | 42,505 |
|
| $ | 12,067 |
|
% of rental income |
|
| 1.7 | % |
|
| 0.5 | % |
DuringF-38
Due to the impact of COVID-19 and the resulting economic impact on our non-residential tenants, rental revenues declined as a result of a non-cash write-off of non-residential straight-line lease receivables of $13.2 million during the year ended December 31, 2017,2020.In addition, rental revenues declined by $7.3 million during the year ended December 31, 2020 as a result of rent payment deferrals/abatements granted to our non-residential tenants.
Lessee Accounting
The Company is the lessee under various corporate office and ground leases for which the Company received approximately $60.5 millionrecognized ROU assets and related lease liabilities effective January 1, 2019. The following table presents the Company’s ROU assets and related lease liabilities as of December 31, 2020 and 2019 (amounts in thousands):
|
| 2020 |
|
| 2019 |
| ||
Right-of-use assets: |
|
|
|
|
|
|
|
|
Corporate office leases (operating) |
| $ | 39,203 |
|
| $ | 41,596 |
|
Ground leases (finance) |
|
| 57,584 |
|
|
| 57,982 |
|
Ground leases (operating) |
|
| 402,500 |
|
|
| 413,196 |
|
Right-of-use assets |
| $ | 499,287 |
|
| $ | 512,774 |
|
Lease liabilities: |
|
|
|
|
|
|
|
|
Corporate office leases (operating) |
| $ | 40,470 |
|
| $ | 43,105 |
|
Ground leases (finance) |
|
| 23,350 |
|
|
| 23,239 |
|
Ground leases (operating) |
|
| 265,310 |
|
|
| 264,990 |
|
Lease liabilities |
| $ | 329,130 |
|
| $ | 331,334 |
|
As the standard requires the recognition of a liability for the lease obligation, discount rates are used to determine the net present value of the lease payments. The discount rate for the lease is the rate implicit in the lease or, if that rate cannot be readily determined, the incremental borrowing rate. As the Company does not know the amount of the lessors’ initial direct costs, it cannot readily determine the rate implicit in the lease and instead must apply the incremental borrowing rate. The Company has estimated the discount rate ranges of 3.3% to 3.9% for corporate office leases and 4.4% to 5.5% for ground leases at adoption. Since the Company’s credit backs the corporate office lease obligations and the lease terms are generally ten years or less, the discount rate range was estimated by using the Company’s borrowing rates for actual pricing data. The discount rate range for ground leases takes into account various factors, including the longer life of the ground leases, and was estimated by using the Company’s borrowing rates for actual pricing data through 30 years and other long-term market rates.
Corporate office leases
The Company leases 9 corporate offices with lease expiration dates ranging from 2021 through 2042 (inclusive of applicable extension options). See Note 15 for details on a corporate office lease with a related party.
Ground leases
The Company maintains long-term ground leases for 14 operating properties and two projects under development with lease expiration dates ranging from 2042 through 2118 (inclusive of applicable purchase options). The Company owns the returnbuilding and improvements.
Additional disclosures
The following tables illustrate the quantitative disclosures for lessees as of various mortgage principal reserves/sinking funds on certain tax-exempt mortgage bond deals.and for the years ended December 31, 2020 and 2019 (amounts in thousands):
F-39
|
| Year Ended December 31, 2020 |
|
| Year Ended December 31, 2019 |
| ||
Lease cost: |
|
|
|
|
|
|
|
|
Finance lease cost: |
|
|
|
|
|
|
|
|
Amortization of right-of-use assets |
| $ | — |
|
| $ | — |
|
Interest on lease liabilities (capitalized) |
|
| 1,029 |
|
|
| 225 |
|
Operating lease cost: |
|
|
|
|
|
|
|
|
Corporate office leases |
|
| 3,747 |
|
|
| 3,937 |
|
Ground leases |
|
| 22,102 |
|
|
| 22,198 |
|
Variable lease cost: |
|
|
|
|
|
|
|
|
Corporate office leases |
|
| 1,307 |
|
|
| 1,489 |
|
Ground leases |
|
| 3,304 |
|
|
| 3,700 |
|
Total lease cost |
| $ | 31,489 |
|
| $ | 31,549 |
|
|
| December 31, 2020 |
|
| December 31, 2019 |
| ||
Other information: |
|
|
|
|
|
|
|
|
Cash paid for amounts included in the measurement of lease liabilities: |
|
|
|
|
|
|
|
|
Investing cash flows from finance leases (capitalized) |
| $ | 567 |
|
| $ | 34,922 |
|
Operating cash flows from operating leases: |
|
|
|
|
|
|
|
|
Corporate office leases |
| $ | 5,296 |
|
| $ | 5,494 |
|
Ground leases |
| $ | 16,552 |
|
| $ | 16,837 |
|
ROU assets obtained in exchange for new finance lease liabilities |
| $ | — |
|
| $ | 23,201 |
|
ROU assets obtained in exchange for new operating lease liabilities: |
|
|
|
|
|
|
|
|
Corporate office leases |
| $ | — |
|
| $ | 44,298 |
|
Ground leases |
| $ | — |
|
| $ | 422,018 |
|
Weighted-average remaining lease term – finance leases (1) |
| 18.7 years |
|
| 19.7 years |
| ||
Weighted-average remaining lease term – operating leases: |
|
|
|
|
|
|
|
|
Corporate office leases |
| 17.4 years |
|
| 18.1 years |
| ||
Ground leases |
| 55.3 years |
|
| 56.2 years |
| ||
Weighted-average discount rate – finance leases |
|
| 3.0 | % |
|
| 3.0 | % |
Weighted-average discount rate – operating leases: |
|
|
|
|
|
|
|
|
Corporate office leases |
|
| 3.2 | % |
|
| 3.2 | % |
Ground leases |
|
| 5.0 | % |
|
| 5.0 | % |
| The weighted-average remaining lease term – finance leases does not include the remaining term of a fully prepaid finance lease entered into during the year ended December 31, 2019. |
The following table summarizes the Company’s undiscounted cash flows for contractual obligations for minimum rent payments/receipts under operating and financing leases for the next five years and thereafter as of December 31, 2020:
(Payments)/Receipts Due by Year (in thousands) |
| |||||||||||||||||||||||||||
|
| 2021 |
|
| 2022 |
|
| 2023 |
|
| 2024 |
|
| 2025 |
|
| Thereafter |
|
| Total |
| |||||||
Finance Leases: |
|
|
|
|
|
|
|
|
|
|
|
|
|
|
|
|
|
|
|
|
|
|
|
|
|
|
|
|
Minimum Rent Payments (a) |
| $ | (578 | ) |
| $ | (590 | ) |
| $ | (601 | ) |
| $ | (614 | ) |
| $ | (626 | ) |
| $ | (33,224 | ) |
| $ | (36,233 | ) |
Operating Leases: |
|
|
|
|
|
|
|
|
|
|
|
|
|
|
|
|
|
|
|
|
|
|
|
|
|
|
|
|
Minimum Rent Payments (a) |
| $ | (17,160 | ) |
| $ | (16,906 | ) |
| $ | (16,997 | ) |
| $ | (17,329 | ) |
| $ | (17,375 | ) |
| $ | (954,108 | ) |
| $ | (1,039,875 | ) |
Minimum Rent Receipts (b) |
| $ | 59,430 |
|
| $ | 54,656 |
|
| $ | 51,091 |
|
| $ | 45,166 |
|
| $ | 38,847 |
|
| $ | 126,732 |
|
| $ | 375,922 |
|
(a) | Minimum basic rent due for corporate office leases and base rent due on ground leases where the Company is the lessee. |
(b) | Minimum basic rent receipts due for various non-residential space where the Company is the lessor. Excludes residential leases due to their short-term nature. |
The following table provides a reconciliation of lease liabilities from our undiscounted cash flows for minimum rent payments as of December 31, 2020 (amounts in thousands):
|
| 2020 |
| |
Total minimum rent payments |
| $ | 1,076,108 |
|
Less: Lease discount |
|
| 746,978 |
|
Lease liabilities |
| $ | 329,130 |
|
F-40
9. | Debt |
EQR does not have any indebtedness as all debt is incurred by the Operating Partnership. EQR guarantees the Operating Partnership’s revolving credit facility up to the maximum amount andWeighted average interest rates noted below for the full termyears ended December 31, 2020 and 2019 include the effect of the facility.any derivative instruments and amortization of premiums/discounts/OCI (other comprehensive income) on debt and derivatives.
Mortgage Notes Payable
As of December 31, 2017, the Company had outstanding mortgage debt of approximately $3.6 billion.
During the year ended December 31, 2017, the Company:
Repaid $300.0 million of 5.987% mortgage debt held in a Fannie Mae loan pool maturing in 2019 and incurred a prepayment penalty of approximately $10.8 million;
Repaid $193.4 million of conventional fixed-rate mortgage loans maturing in 2017 through 2048 and incurred a prepayment penalty of approximately $1.5 million; and
Repaid $10.7 million of scheduled principal repayments on various mortgage debt.
The Company recorded $0.3 million of write-offs of unamortized deferred financing costs during the year ended December 31, 2017 as additional interest expense related to debt extinguishment of mortgages. The Company also recorded $0.7 million of write-offs of net unamortized premiums during the year ended December 31, 2017 as a reduction of interest expense related to debt extinguishment of mortgages.
As of December 31, 2017, the Company had $598.6 million of secured debt subject to third party credit enhancement.
As of December 31, 2017, scheduled maturities for the Company’s outstanding mortgage indebtedness were at various dates through May 28, 2061. At December 31, 2017, the interest rate range on the Company’s mortgage debt was 0.10% to 6.90%. During the year ended December 31, 2017, the weighted average interest rate on the Company’s mortgage debt was 4.33%.
The historical cost, net of accumulated depreciation, of encumbered properties was $4.4 billion and $5.0 billion at December 31, 2017 and 2016, respectively.
As of December 31, 2016, the Company had outstanding mortgage debt of approximately $4.1 billion.
F-44
During the year ended December 31, 2016, the Company:
Repaid $440.8 million of 6.256% mortgage debt held in a Fannie Mae loan pool maturing in 2017 and incurred a prepayment penalty of approximately $29.3 million;
Repaid $65.5 million of various tax-exempt mortgage bonds maturing in 2026 through 2037 and incurred a prepayment penalty of approximately $0.2 million;
Repaid $75.9 million of conventional fixed-rate mortgage loans and incurred prepayment penalties of approximately $2.2 million;
Repaid $0.9 million of conventional floating-rate mortgage loans;
Repaid $8.5 million of scheduled principal repayments on various mortgage debt; and
Assumed $43.4 million of mortgage debt on one acquired property.
The Company recorded $1.6 million of write-offs of unamortized deferred financing costs during the year ended December 31, 2016 as additional interest expense related to debt extinguishment of mortgages. The Company also recorded $20.7 million of write-offs of net unamortized premiums during the year ended December 31, 2016 as a reduction of interest expense related to debt extinguishment of mortgages.
As of December 31, 2016, the Company had $601.9 million of secured debt subject to third party credit enhancement.
As of December 31, 2016, scheduled maturities for the Company’s outstanding mortgage indebtedness were at various dates through May 28, 2061. At December 31, 2016, the interest rate range on the Company’s mortgage debt was 0.10% to 7.20%. During the year ended December 31, 2016, the weighted average interest rate on the Company’s mortgage debt was 4.34%.
Notes
The following tables summarize the Company’s unsecured note balancesmortgage notes payable activity for the years ended December 31, 2020 and 2019, respectively (amounts in thousands):
|
| Mortgage notes payable, net as of December 31, 2019 |
|
| Proceeds |
|
| Lump sum payoffs |
|
| Scheduled principal repayments |
|
| Amortization of premiums/ discounts |
|
| Amortization of deferred financing costs, net (1) |
|
| Mortgage notes payable, net as of December 31, 2020 |
| |||||||
Fixed Rate Debt: |
|
|
|
|
|
|
|
|
|
|
|
|
|
|
|
|
|
|
|
|
|
|
|
|
|
|
|
|
Secured – Conventional |
| $ | 1,574,699 |
|
| $ | 495,000 |
| (2) | $ | (160,522 | ) |
| $ | (7,759 | ) |
| $ | 988 |
|
| $ | (1,315 | ) |
| $ | 1,901,091 |
|
Floating Rate Debt: |
|
|
|
|
|
|
|
|
|
|
|
|
|
|
|
|
|
|
|
|
|
|
|
|
|
|
|
|
Secured – Conventional |
|
| 7,050 |
|
|
| 24,204 |
|
|
| — |
|
|
| — |
|
|
| — |
|
|
| 240 |
|
|
| 31,494 |
|
Secured – Tax Exempt |
|
| 359,861 |
|
|
| — |
|
|
| — |
|
|
| — |
|
|
| 1,246 |
|
|
| 198 |
|
|
| 361,305 |
|
Floating Rate Debt |
|
| 366,911 |
|
|
| 24,204 |
|
|
| — |
|
|
| — |
|
|
| 1,246 |
|
|
| 438 |
|
|
| 392,799 |
|
Total |
| $ | 1,941,610 |
|
| $ | 519,204 |
|
| $ | (160,522 | ) |
| $ | (7,759 | ) |
| $ | 2,234 |
|
| $ | (877 | ) |
| $ | 2,293,890 |
|
(1) | Represents amortization of deferred financing costs, net of debt financing costs. |
(2) | Obtained a 2.60% fixed rate mortgage loan pool maturing on May 1, 2030. |
|
| Mortgage notes payable, net as of December 31, 2018 |
|
| Proceeds |
|
| Lump sum payoffs |
|
| Scheduled principal repayments |
|
| Amortization of premiums/ discounts |
|
| Amortization of deferred financing costs, net (1) |
|
| Mortgage notes payable, net as of December 31, 2019 |
| |||||||
Fixed Rate Debt: |
|
|
|
|
|
|
|
|
|
|
|
|
|
|
|
|
|
|
|
|
|
|
|
|
|
|
|
|
Secured – Conventional |
| $ | 1,885,407 |
|
| $ | 288,120 |
| (2) | $ | (584,536 | ) |
| $ | (6,308 | ) |
| $ | (7,999 | ) |
| $ | 15 |
|
| $ | 1,574,699 |
|
Floating Rate Debt: |
|
|
|
|
|
|
|
|
|
|
|
|
|
|
|
|
|
|
|
|
|
|
|
|
|
|
|
|
Secured – Conventional |
|
| 6,357 |
|
|
| 7,651 |
| (3) |
| (5,920 | ) |
|
| (500 | ) |
|
| — |
|
|
| (538 | ) |
|
| 7,050 |
|
Secured – Tax Exempt |
|
| 493,706 |
|
|
| — |
|
|
| (152,565 | ) |
|
| — |
|
|
| 16,617 |
|
|
| 2,103 |
|
|
| 359,861 |
|
Floating Rate Debt |
|
| 500,063 |
|
|
| 7,651 |
|
|
| (158,485 | ) |
|
| (500 | ) |
|
| 16,617 |
|
|
| 1,565 |
|
|
| 366,911 |
|
Total |
| $ | 2,385,470 |
|
| $ | 295,771 |
|
| $ | (743,021 | ) |
| $ | (6,808 | ) |
| $ | 8,618 |
|
| $ | 1,580 |
|
| $ | 1,941,610 |
|
(1) | Represents amortization of deferred financing costs, net of debt financing costs. |
(2) | Obtained 3.94% fixed rate mortgage debt held in a Fannie Mae loan pool maturing on March 1, 2029. |
(3) | Obtained variable rate construction mortgage debt that is non-recourse to the Company maturing on June 25, 2022 (total commitment of $67.6 million). |
The following table summarizes the Company’s debt extinguishment costs on mortgages recorded as additional interest expense during the years ended December 31, 2020 and 2019, respectively (amounts in thousands):
Description |
| 2020 |
|
| 2019 |
| ||
Prepayment premiums/penalties |
| $ | 327 |
|
| $ | 3,381 |
|
Write-offs of unamortized deferred financing costs |
|
| 63 |
|
|
| 2,273 |
|
Write-offs of unamortized (premiums)/discounts/OCI |
|
| (190 | ) |
|
| 6,153 |
|
Total |
| $ | 200 |
|
| $ | 11,807 |
|
The following table summarizes certain interest rate and maturity date information as of and for the years ended December 31, 20172020 and 2016,2019, respectively:
December 31, 2017 (Amounts in thousands) |
| Net Principal Balance |
|
| Interest Rate Ranges |
| Weighted Average Interest Rate |
|
| Maturity Date Ranges | ||
Fixed Rate Public Notes (1) |
| $ | 4,591,373 |
|
| 2.85% - 7.57% |
| 4.61% |
|
| 2020-2047 | |
Floating Rate Public Notes (1) |
|
| 447,439 |
|
| (1) |
| 1.82% |
|
| 2019 | |
Totals |
| $ | 5,038,812 |
|
|
|
|
|
|
|
|
|
|
| December 31, 2020 |
|
| December 31, 2019 |
|
Interest Rate Ranges |
| 0.06% - 4.71% |
|
| 0.10% - 5.29% |
|
Weighted Average Interest Rate |
| 3.33% |
|
| 3.84% |
|
Maturity Date Ranges |
| 2021-2061 |
|
| 2020-2061 |
|
F-41
As of both December 31, 2020 and 2019, the Company had $281.7 million of secured debt (primarily tax-exempt bonds) subject to third-party credit enhancement.
The historical cost, net of accumulated depreciation, of encumbered properties was $2.9 billion and $2.7 billion at December 31, 2020 and 2019, respectively.
Notes
The following tables summarize the Company’s notes activity for the years ended December 31, 2020 and 2019, respectively (amounts in thousands):
December 31, 2016 (Amounts in thousands) |
| Net Principal Balance |
|
| Interest Rate Ranges |
| Weighted Average Interest Rate |
|
| Maturity Date Ranges | ||
Fixed Rate Public Notes (1) |
| $ | 4,397,829 |
|
| 2.85% - 7.57% |
| 4.90% |
|
| 2017 - 2045 | |
Floating Rate Public Notes (1) |
|
| 450,250 |
|
| (1) |
| 1.28% |
|
| 2019 | |
Totals |
| $ | 4,848,079 |
|
|
|
|
|
|
|
|
|
|
| Notes, net as of December 31, 2019 |
|
| Proceeds |
|
| Lump sum payoffs |
|
| Realized/unrealized (gain) loss on derivative instruments |
|
| Amortization of premiums/ discounts |
|
| Amortization of deferred financing costs, net (1) |
|
| Notes, net as of December 31, 2020 |
| |||||||
Fixed Rate Debt: |
|
|
|
|
|
|
|
|
|
|
|
|
|
|
|
|
|
|
|
|
|
|
|
|
|
|
|
|
Unsecured – Public |
| $ | 6,077,513 |
|
| $ | — |
|
| $ | (750,000 | ) |
| $ | — |
|
| $ | 2,997 |
|
| $ | 5,026 |
|
| $ | 5,335,536 |
|
(1) |
|
|
| Notes, net as of December 31, 2018 |
|
| Proceeds |
|
| Lump sum payoffs |
|
| Realized/unrealized (gain) loss on derivative instruments |
|
| Amortization of premiums/ discounts |
|
| Amortization of deferred financing costs, net (1) |
|
| Notes, net as of December 31, 2019 |
| |||||||
Fixed Rate Debt: |
|
|
|
|
|
|
|
|
|
|
|
|
|
|
|
|
|
|
|
|
|
|
|
|
|
|
|
|
Unsecured – Public |
| $ | 5,485,884 |
|
| $ | 1,194,468 |
| (2) | $ | (600,000 | ) |
| $ | — |
|
| $ | 3,117 |
|
| $ | (5,956 | ) |
| $ | 6,077,513 |
|
Floating Rate Debt: |
|
|
|
|
|
|
|
|
|
|
|
|
|
|
|
|
|
|
|
|
|
|
|
|
|
|
|
|
Unsecured – Public |
|
| 447,402 |
|
|
| — |
|
|
| (450,000 | ) |
|
| 2,277 |
|
|
| 45 |
|
|
| 276 |
|
|
| — |
|
Total |
| $ | 5,933,286 |
|
| $ | 1,194,468 |
|
| $ | (1,050,000 | ) |
| $ | 2,277 |
|
| $ | 3,162 |
|
| $ | (5,680 | ) |
| $ | 6,077,513 |
|
(1) | Represents amortization of deferred financing costs, net of debt financing costs. |
(2) | Issued $600.0 million of ten-year 3.00% unsecured notes, receiving net proceeds of approximately $597.5 million before underwriting fees, hedge termination costs and other expenses. Additionally, issued $600.0 million of ten-year 2.50% unsecured notes, receiving net proceeds of approximately $597.0 million before underwriting fees and other expenses. |
The following table summarizes the Company’s debt extinguishment costs on notes recorded as additional interest expense during the years ended December 31, 2020 and 2019, respectively (amounts in thousands):
Description |
| 2020 |
|
| 2019 |
| ||
Prepayment premiums/penalties |
| $ | 25,823 |
|
| $ | 10,266 |
|
Write-offs of unamortized deferred financing costs |
|
| 571 |
|
|
| 287 |
|
Write-offs of unamortized (premiums)/discounts/OCI |
|
| 12,698 |
|
|
| 1,043 |
|
Total |
| $ | 39,092 |
|
| $ | 11,596 |
|
The following table summarizes certain interest rate and maturity date information as of and for the years ended December 31, 2020 and 2019, respectively:
|
| December 31, 2020 |
|
| December 31, 2019 |
|
Interest Rate Ranges |
| 2.50% - 7.57% |
|
| 2.50% - 7.57% |
|
Weighted Average Interest Rate |
| 4.03% |
|
| 4.21% |
|
Maturity Date Ranges |
| 2023-2047 |
|
| 2021-2047 |
|
The Company’s unsecured public debt containsnotes contain certain financial and operating covenants including, among other things, maintenance of certain financial ratios. The Company was in compliance with its unsecured public debt covenants for both the years ended December 31, 20172020 and 2016.2019.
EQR and ERPOP currently have an active universal shelf registration statement for the issuance of equity and debt securities that automatically became effective upon filing with the SEC onin June 28, 20162019 and expires onin June 28, 2019. Per the terms of ERPOP’s partnership agreement, EQR contributes the net proceeds of all equity offerings to the capital of ERPOP in exchange for additional OP Units (on a one-for-one Common Share per OP Unit basis) or preference units (on a one-for-one preferred share per preference unit basis).2022.
During the year ended December 31, 2017, the Company:
Repaid $394.1 million of 5.75% unsecured notes at maturity;
Repaid $103.9 million of 7.125% unsecured notes at maturity;
F-45F-42
Issued $300.0 million of thirty-year 4.00% unsecured notes, receiving net proceeds of approximately $293.2 million before underwriting fees and other expenses, at an all-in effective interest rate of 4.11%.
During the year ended December 31, 2016, the Company:
Repaid $228.9 million of 5.125% unsecured notes maturing in 2016 and incurred a prepayment penalty of approximately $1.4 million and repaid the remaining $271.1 million of 5.125% unsecured notes at maturity;
Repaid $400.0 million of 5.375% unsecured notes maturing in 2016 and incurred a prepayment penalty of approximately $9.5 million;
Repaid $255.9 million of 5.750% unsecured notes maturing in 2017 and incurred a prepayment penalty of approximately $16.5 million;
Repaid $46.1 million of 7.125% unsecured notes maturing in 2017 and incurred a prepayment penalty of approximately $4.6 million;
Repaid $250.0 million of 4.625% unsecured notes maturing in 2021 and incurred a prepayment penalty of approximately $31.6 million;
Repaid $48.0 million of 7.570% unsecured notes maturing in 2026 and incurred a prepayment penalty of approximately $19.3 million; and
Issued $500.0 million of ten-year 2.85% unsecured notes, receiving net proceeds of $496.7 million before underwriting fees, hedge termination costs and other expenses, at an all-in effective interest rate of approximately 3.10% after termination of a forward starting swap in conjunction with the issuance (see Note 9 for further discussion).
The Company recorded $1.9 million of write-offs of unamortized deferred financing costs during the year ended December 31, 2016 as additional interest expense related to debt extinguishment of unsecured notes. The Company also recorded $25.2 million of write-offs of net unamortized premiums/discounts/OCI/treasury locks during the year ended December 31, 2016 as additional interest expense related to debt extinguishment of unsecured notes.
Line of Credit and Commercial Paper
On November 3, 2016,1, 2019, the Company replaced its existing $2.5$2.0 billion facility with a $2.0$2.5 billion unsecured revolving credit facility maturing January 10, 2022. November 1, 2024. The Company has the ability to increase available borrowings by an additional $750.0 million by adding additional bankslenders to the facility, or obtaining the agreement of existing bankslenders to increase their commitments.commitments or incurring one or more term loans. The interest rate on advances under the facility will generally be LIBOR plus a spread (currently 0.825%0.775%), or based on bids received from the lending group, and the Company pays an annual facility fee (currently 12.5 basis points)0.125%). Both the spread and the facility fee are dependent on the Company’s senior unsecured credit rating ofrating. The weighted average interest rates on the Company’s long-term debt. revolving credit facility were 1.47% and 3.12% for the years ended December 31, 2020 and 2019, respectively.
On February 2, 2015,November 4, 2019, the Company entered into an unsecuredincreased the maximum aggregate amount outstanding for its commercial paper note program in the United States. The Company may borrow up to a maximum offrom $500.0 million under this program subject to market conditions.$1.0 billion. The notes will be soldundercustomarytermsintheUnitedStatescommercialpapernotemarket subject to market conditions andwillrankparipassuwithalloftheCompany’s otherunsecuredseniorindebtedness. As of December 31, 2017, there was a balance of $299.8 million outstanding on the commercial paper program ($300.0 million in principal outstanding net of an unamortized discount of $0.2 million). As of December 31, 2016, there was a balance of $20.0 million on the commercial paper program. Thenotesbearinterest at various floating rates with a weighted average interest rate of 1.41%1.72% and 0.90%2.42% for the years ended December 31, 20172020 and 2016,2019, respectively, and a weighted average maturity of 1845 days and 440 days as of December 31, 20172020 and 2016,2019, respectively.
As of The weighted average amount outstanding for the years ended December 31, 2017, the amount available on2020 and 2019 was approximately $276.6 million and $434.4 million, respectively.
The Company limits its utilization of the revolving credit facility was $1.69 billion (net of $6.6 million which was restricted/dedicatedin order to maintain liquidity to support letters of credit and net of the $300.0 million in principal outstanding on theits $1.0 billion commercial paper program). Duringprogram along with certain other obligations. The following table presents the year ended December 31, 2017, the weighted average interest rate on the revolving credit facility was 2.00%. As of December 31, 2016, the amount available on the revolving credit facility was $1.96 billion (net of $20.6 million which was restricted/dedicated to support letters of credit and net of the $20.0 million in principal outstanding on the commercial paper program). During the year ended December 31, 2016, the weighted average interest rate on the revolving credit facility was 1.37%.
F-46
On April 24, 2017, the Company executed a new letter of credit facility with a third party financial institution which is not backed or collateralized by borrowingsavailability on the Company’s unsecured revolving credit facility. Asfacility as of December 31, 2017, there was $9.0 million2020 and 2019 (amounts in lettersthousands):
|
| December 31, 2020 |
|
| December 31, 2019 |
| ||
Unsecured revolving credit facility commitment |
| $ | 2,500,000 |
|
| $ | 2,500,000 |
|
Commercial paper balance outstanding |
|
| (415,000 | ) |
|
| (1,000,000 | ) |
Unsecured revolving credit facility balance outstanding |
|
| — |
|
|
| (20,000 | ) |
Other restricted amounts |
|
| (100,949 | ) |
|
| (100,929 | ) |
Unsecured revolving credit facility availability |
| $ | 1,984,051 |
|
| $ | 1,379,071 |
|
The following table summarizes the Company’s debt extinguishment costs on the line of credit outstanding on this facility.recorded as additional interest expense during the years ended December 31, 2020 and 2019, respectively (amounts in thousands):
Description |
| 2020 |
|
| 2019 |
| ||
Write-offs of unamortized deferred financing costs |
| $ | — |
|
| $ | 588 |
|
Total |
| $ | — |
|
| $ | 588 |
|
Debt Maturity Table
The following table provides a summary of the aggregate payments of principal on all debt for each of the next five years and thereafter as of December 31, 20172020 (amounts in thousands):
Year |
| Total |
|
| Total |
| ||
2018 |
| $ | 446,969 |
| ||||
2019 |
|
| 975,334 |
| ||||
2020 |
|
| 1,678,992 |
| ||||
2021 |
|
| 927,806 |
| ||||
2021 (1) |
| $ | 450,665 |
| ||||
2022 |
|
| 265,741 |
|
|
| 296,040 |
|
2023 |
|
| 1,329,088 |
| ||||
2024 |
|
| 6,100 |
| ||||
2025 |
|
| 458,200 |
| ||||
Thereafter |
|
| 4,776,232 |
|
|
| 5,586,810 |
|
Subtotal |
|
| 9,071,074 |
|
|
| 8,126,903 |
|
Deferred Financing Costs and Unamortized (Discount) |
|
| (113,783 | ) |
|
| (82,647 | ) |
Total |
| $ | 8,957,291 |
|
| $ | 8,044,256 |
|
| Includes $415.0 million in principal outstanding on the Company’s commercial paper program. |
10. | Derivative and Other Fair Value Instruments |
The valuation of financial instruments requires the Company to make estimates and judgments that affect the fair value of the instruments. The Company, where possible, bases the fair values of its financial instruments, including its derivative instruments, on
F-43
listed market prices and third partythird-party quotes. Where these are not available, the Company bases its estimates on current instruments with similar terms and maturities or on other factors relevant to the financial instruments.
In the normal course of business, the Company is exposed to the effect of interest rate changes. The Company seeksmay seek to manage these risks by following established risk management policies and procedures including the use of derivatives to hedge interest rate risk on debt instruments. The Company may also use derivatives to manage commodity prices in the daily operations of the business.
A three-level valuation hierarchy exists for disclosure of fair value measurements. The valuation hierarchy is based upon the transparency of inputs to the valuation of an asset or liability as of the measurement date. A financial instrument’s categorization within the valuation hierarchy is based upon the lowest level of input that is significant to the fair value measurement. The three levels are defined as follows:
Level 1 – Inputs to the valuation methodology are quoted prices (unadjusted) for identical assets or liabilities in active markets.
• | Level 1 – Inputs to the valuation methodology are quoted prices (unadjusted) for identical assets or liabilities in active markets. |
Level 2 – Inputs to the valuation methodology include quoted prices for similar assets and liabilities in active markets, and inputs that are observable for the asset or liability, either directly or indirectly, for substantially the full term of the financial instrument.
• | Level 2 – Inputs to the valuation methodology include quoted prices for similar assets and liabilities in active markets, and inputs that are observable for the asset or liability, either directly or indirectly, for substantially the full term of the financial instrument. |
Level 3 – Inputs to the valuation methodology are unobservable and significant to the fair value measurement.
• | Level 3 – Inputs to the valuation methodology are unobservable and significant to the fair value measurement. |
The Company’s derivative positions are valued using models developed by the respective counterparty as well as models developedapplied internally by the Company that use as their basisinputs readily observable market parameters (such as forward yield curves and credit default swap data). Employee holdings other than Common Shares withinThe following table summarizes the supplemental executive retirement plan (the “SERP”) are valued using quoted market prices for identical assets and are included in other assets and other liabilities oninputs to the consolidated balance sheets. Redeemable Noncontrolling Interests – Operating Partnership/Redeemable Limited Partners are valued using the quoted market price of Common Shares. The fair values disclosed for mortgage notes payable and unsecured debt (including its commercial paper and line of credit, if applicable) were calculated using indicative rates provided by lenders of similar loans in the case of mortgage notes payable and the private unsecured debt (including its commercial paper and line of credit, if applicable) and quoted market pricesvaluations for each underlying issuance in the casetype of the public unsecured notes.fair value measurement:
Fair Value Measurement Type | Valuation Inputs | |
Employee holdings (other than Common Shares) within the supplemental executive retirement plan (the “SERP”) | Quoted market prices for identical assets. These holdings are included in other assets and other liabilities on the consolidated balance sheets. | |
Redeemable Noncontrolling Interests – Operating Partnership/Redeemable Limited Partners | Quoted market price of Common Shares. | |
Mortgage notes payable and private unsecured debt (including its commercial paper and line of credit, if applicable) | Indicative rates provided by lenders of similar loans. | |
Public unsecured notes | Quoted market prices for each underlying issuance. |
The fair values of the Company’s financial instruments (other than mortgage notes payable, unsecured notes, commercial paper, line of credit and derivative instruments), including cash and cash equivalents and other financial instruments, approximate their carrying or contract value. The following table provides a summary of the carrying and fair values for the
F-47
Company’s mortgage notes payable and unsecured debt (including its commercial paper and line of credit, if applicable) at December 31, 20172020 and 2016,2019, respectively (amounts in thousands):
|
| December 31, 2017 |
|
| December 31, 2016 |
|
| December 31, 2020 |
|
| December 31, 2019 |
| ||||||||||||||||||||
|
| Estimated Fair Value (Level 2) |
|
| Carrying Value |
|
| Estimated Fair Value (Level 2) |
|
| Carrying Value |
|
| Carrying Value |
|
| Estimated Fair Value (Level 2) |
|
| Carrying Value |
|
| Estimated Fair Value (Level 2) |
| ||||||||
Mortgage notes payable, net |
| $ | 3,615,384 |
|
| $ | 3,618,722 |
|
| $ | 4,161,001 |
|
| $ | 4,119,181 |
|
| $ | 2,293,890 |
|
| $ | 2,313,263 |
|
| $ | 1,941,610 |
|
| $ | 1,930,710 |
|
Unsecured debt, net |
|
| 5,619,744 |
|
|
| 5,338,569 |
|
|
| 5,030,330 |
|
|
| 4,868,077 |
|
|
| 5,750,366 |
|
|
| 6,686,612 |
|
|
| 7,095,346 |
|
|
| 7,677,289 |
|
Total debt, net |
| $ | 9,235,128 |
|
| $ | 8,957,291 |
|
| $ | 9,191,331 |
|
| $ | 8,987,258 |
|
| $ | 8,044,256 |
|
| $ | 8,999,875 |
|
| $ | 9,036,956 |
|
| $ | 9,607,999 |
|
The following table summarizes the Company’s consolidated derivative instruments at December 31, 2017 (dollar amounts are in thousands):F-44
|
| Fair Value Hedges (1) |
|
| Forward Starting Swaps (2) |
| ||
Current Notional Balance |
| $ | 450,000 |
|
| $ | 250,000 |
|
Lowest Interest Rate |
|
| 2.375 | % |
|
| 2.1478 | % |
Highest Interest Rate |
|
| 2.375 | % |
|
| 2.2895 | % |
Earliest Maturity Date |
| 2019 |
|
| 2028 |
| ||
Latest Maturity Date |
| 2019 |
|
| 2029 |
| ||
|
|
|
|
The following tables provide a summary of the fair value measurements for each major category of assets and liabilities measured at fair value on a recurring basis and the location within the accompanying consolidated balance sheets at December 31, 20172020 and 2016,2019, respectively (amounts in thousands):
|
|
|
|
|
|
|
| Fair Value Measurements at Reporting Date Using |
| |||||||||
Description |
| Balance Sheet Location |
| 12/31/2017 |
|
| Quoted Prices in Active Markets for Identical Assets/Liabilities (Level 1) |
|
| Significant Other Observable Inputs (Level 2) |
|
| Significant Unobservable Inputs (Level 3) |
| ||||
Assets |
|
|
|
|
|
|
|
|
|
|
|
|
|
|
|
|
|
|
Derivatives designated as hedging instruments: |
|
|
|
|
|
|
|
|
|
|
|
|
|
|
|
|
|
|
Interest Rate Contracts: |
|
|
|
|
|
|
|
|
|
|
|
|
|
|
|
|
|
|
Forward Starting Swaps |
| Other Assets |
| $ | 5,143 |
|
| $ | — |
|
| $ | 5,143 |
|
| $ | — |
|
Supplemental Executive Retirement Plan |
| Other Assets |
|
| 140,159 |
|
|
| 140,159 |
|
|
| — |
|
|
| — |
|
Total |
|
|
| $ | 145,302 |
|
| $ | 140,159 |
|
| $ | 5,143 |
|
| $ | — |
|
|
|
|
|
|
|
|
|
|
|
|
|
|
|
|
|
|
|
|
Liabilities |
|
|
|
|
|
|
|
|
|
|
|
|
|
|
|
|
|
|
Derivatives designated as hedging instruments: |
|
|
|
|
|
|
|
|
|
|
|
|
|
|
|
|
|
|
Interest Rate Contracts: |
|
|
|
|
|
|
|
|
|
|
|
|
|
|
|
|
|
|
Fair Value Hedges |
| Other Liabilities |
| $ | 1,597 |
|
| $ | — |
|
| $ | 1,597 |
|
| $ | — |
|
Supplemental Executive Retirement Plan |
| Other Liabilities |
|
| 140,159 |
|
|
| 140,159 |
|
|
| — |
|
|
| — |
|
Total |
|
|
| $ | 141,756 |
|
| $ | 140,159 |
|
| $ | 1,597 |
|
| $ | — |
|
|
|
|
|
|
|
|
|
|
|
|
|
|
|
|
|
|
|
|
Redeemable Noncontrolling Interests – |
|
|
|
|
|
|
|
|
|
|
|
|
|
|
|
|
|
|
Operating Partnership/Redeemable |
|
|
|
|
|
|
|
|
|
|
|
|
|
|
|
|
|
|
Limited Partners |
| Mezzanine |
| $ | 366,955 |
|
| $ | — |
|
| $ | 366,955 |
|
| $ | — |
|
F-48
|
|
|
|
|
|
|
| Fair Value Measurements at Reporting Date Using |
|
|
|
|
|
|
|
| Fair Value Measurements at Reporting Date Using |
| |||||||||||||||||||
Description |
| Balance Sheet Location |
| 12/31/2016 |
|
| Quoted Prices in Active Markets for Identical Assets/Liabilities (Level 1) |
|
| Significant Other Observable Inputs (Level 2) |
|
| Significant Unobservable Inputs (Level 3) |
|
| Balance Sheet Location |
| 12/31/2020 |
|
| Quoted Prices in Active Markets for Identical Assets/Liabilities (Level 1) |
|
| Significant Other Observable Inputs (Level 2) |
|
| Significant Unobservable Inputs (Level 3) |
| |||||||||
Assets |
|
|
|
|
|
|
|
|
|
|
|
|
|
|
|
|
|
|
|
|
|
|
|
|
|
|
|
|
|
|
|
|
|
|
|
| |
Derivatives designated as hedging instruments: |
|
|
|
|
|
|
|
|
|
|
|
|
|
|
|
|
|
| |||||||||||||||||||
Interest Rate Contracts: |
|
|
|
|
|
|
|
|
|
|
|
|
|
|
|
|
|
| |||||||||||||||||||
Fair Value Hedges |
| Other Assets |
| $ | 1,857 |
|
| $ | — |
|
| $ | 1,857 |
|
| $ | — |
| |||||||||||||||||||
Supplemental Executive Retirement Plan |
| Other Assets |
|
| 124,420 |
|
|
| 124,420 |
|
|
| — |
|
|
| — |
|
| Other Assets |
| $ | 160,293 |
|
| $ | 160,293 |
|
| $ | 0 |
|
| $ | 0 |
| |
Total |
|
|
| $ | 126,277 |
|
| $ | 124,420 |
|
| $ | 1,857 |
|
| $ | — |
| |||||||||||||||||||
|
|
|
|
|
|
|
|
|
|
|
|
|
|
|
|
|
|
|
|
|
|
|
|
|
|
|
|
|
|
|
|
|
|
|
|
| |
Liabilities |
|
|
|
|
|
|
|
|
|
|
|
|
|
|
|
|
|
|
|
|
|
|
|
|
|
|
|
|
|
|
|
|
|
|
|
| |
Supplemental Executive Retirement Plan |
| Other Liabilities |
| $ | 124,420 |
|
| $ | 124,420 |
|
| $ | — |
|
| $ | — |
|
| Other Liabilities |
| $ | 160,293 |
|
| $ | 160,293 |
|
| $ | 0 |
|
| $ | 0 |
| |
Total |
|
|
| $ | 124,420 |
|
| $ | 124,420 |
|
| $ | — |
|
| $ | — |
| |||||||||||||||||||
|
|
|
|
|
|
|
|
|
|
|
|
|
|
|
|
|
|
|
|
|
|
|
|
|
|
|
|
|
|
|
|
|
|
|
|
| |
Redeemable Noncontrolling Interests – |
|
|
|
|
|
|
|
|
|
|
|
|
|
|
|
|
|
|
|
|
|
|
|
|
|
|
|
|
|
|
|
|
|
|
|
| |
Operating Partnership/Redeemable |
|
|
|
|
|
|
|
|
|
|
|
|
|
|
|
|
|
|
|
|
|
|
|
|
|
|
|
|
|
|
|
|
|
|
|
| |
Limited Partners |
| Mezzanine |
| $ | 442,092 |
|
| $ | — |
|
| $ | 442,092 |
|
| $ | — |
|
| Mezzanine |
| $ | 338,951 |
|
| $ | 0 |
|
| $ | 338,951 |
|
| $ | 0 |
| |
|
|
|
|
|
|
|
| Fair Value Measurements at Reporting Date Using |
| |||||||||
Description |
| Balance Sheet Location |
| 12/31/2019 |
|
| Quoted Prices in Active Markets for Identical Assets/Liabilities (Level 1) |
|
| Significant Other Observable Inputs (Level 2) |
|
| Significant Unobservable Inputs (Level 3) |
| ||||
Assets |
|
|
|
|
|
|
|
|
|
|
|
|
|
|
|
|
|
|
Supplemental Executive Retirement Plan |
| Other Assets |
| $ | 151,889 |
|
| $ | 151,889 |
|
| $ | 0 |
|
| $ | 0 |
|
|
|
|
|
|
|
|
|
|
|
|
|
|
|
|
|
|
|
|
Liabilities |
|
|
|
|
|
|
|
|
|
|
|
|
|
|
|
|
|
|
Supplemental Executive Retirement Plan |
| Other Liabilities |
| $ | 151,889 |
|
| $ | 151,889 |
|
| $ | 0 |
|
| $ | 0 |
|
|
|
|
|
|
|
|
|
|
|
|
|
|
|
|
|
|
|
|
Redeemable Noncontrolling Interests – |
|
|
|
|
|
|
|
|
|
|
|
|
|
|
|
|
|
|
Operating Partnership/Redeemable |
|
|
|
|
|
|
|
|
|
|
|
|
|
|
|
|
|
|
Limited Partners |
| Mezzanine |
| $ | 463,400 |
|
| $ | 0 |
|
| $ | 463,400 |
|
| $ | 0 |
|
The following tables provide a summary of the effect of fair value hedges on the Company’s accompanying consolidated statements of operations and comprehensive income for the years ended December 31, 2017, 20162020, 2019 and 2015,2018, respectively (amounts in thousands):
December 31, 2017 Type of Fair Value Hedge |
| Location of Gain/(Loss) Recognized in Income on Derivative |
| Amount of Gain/(Loss) Recognized in Income on Derivative |
|
| Hedged Item |
| Income Statement Location of Hedged Item Gain/(Loss) |
| Amount of Gain/(Loss) Recognized in Income on Hedged Item |
| ||||||||||||||||
December 31, 2020 Type of Fair Value Hedge |
| Location of Gain/(Loss) Recognized in Income on Derivative |
| Amount of Gain/(Loss) Recognized in Income on Derivative |
|
| Hedged Item |
| Income Statement Location of Hedged Item Gain/(Loss) |
| Amount of Gain/(Loss) Recognized in Income on Hedged Item |
| ||||||||||||||||
Derivatives designated as hedging instruments: |
|
|
|
|
|
|
|
|
|
|
|
|
|
|
|
|
|
|
|
|
|
|
|
|
|
|
|
|
Interest Rate Contracts: |
|
|
|
|
|
|
|
|
|
|
|
|
|
|
|
|
|
|
|
|
|
|
|
|
|
|
|
|
Interest Rate Swaps |
| Interest expense |
| $ | (3,454 | ) |
| Fixed rate debt |
| Interest expense |
| $ | 3,454 |
|
| N/A |
| $ | 0 |
|
| N/A |
| N/A |
| $ | 0 |
|
Total |
|
|
| $ | (3,454 | ) |
|
|
|
|
| $ | 3,454 |
|
|
|
| $ | 0 |
|
|
|
|
|
| $ | 0 |
|
December 31, 2016 Type of Fair Value Hedge |
| Location of Gain/(Loss) Recognized in Income on Derivative |
| Amount of Gain/(Loss) Recognized in Income on Derivative |
|
| Hedged Item |
| Income Statement Location of Hedged Item Gain/(Loss) |
| Amount of Gain/(Loss) Recognized in Income on Hedged Item |
| ||||||||||||||||
December 31, 2019 Type of Fair Value Hedge |
| Location of Gain/(Loss) Recognized in Income on Derivative |
| Amount of Gain/(Loss) Recognized in Income on Derivative |
|
| Hedged Item |
| Income Statement Location of Hedged Item Gain/(Loss) |
| Amount of Gain/(Loss) Recognized in Income on Hedged Item |
| ||||||||||||||||
Derivatives designated as hedging instruments: |
|
|
|
|
|
|
|
|
|
|
|
|
|
|
|
|
|
|
|
|
|
|
|
|
|
|
|
|
Interest Rate Contracts: |
|
|
|
|
|
|
|
|
|
|
|
|
|
|
|
|
|
|
|
|
|
|
|
|
|
|
|
|
Interest Rate Swaps |
| Interest expense |
| $ | (1,798 | ) |
| Fixed rate debt |
| Interest expense |
| $ | 1,798 |
|
| Interest expense |
| $ | 2,277 |
|
| Fixed rate debt |
| Interest expense |
| $ | (2,277 | ) |
Total |
|
|
| $ | (1,798 | ) |
|
|
|
|
| $ | 1,798 |
|
|
|
| $ | 2,277 |
|
|
|
|
|
| $ | (2,277 | ) |
December 31, 2015 Type of Fair Value Hedge |
| Location of Gain/(Loss) Recognized in Income on Derivative |
| Amount of Gain/(Loss) Recognized in Income on Derivative |
|
| Hedged Item |
| Income Statement Location of Hedged Item Gain/(Loss) |
| Amount of Gain/(Loss) Recognized in Income on Hedged Item |
| ||
Derivatives designated as hedging instruments: |
|
|
|
|
|
|
|
|
|
|
|
|
|
|
Interest Rate Contracts: |
|
|
|
|
|
|
|
|
|
|
|
|
|
|
Interest Rate Swaps |
| Interest expense |
| $ | 2,058 |
|
| Fixed rate debt |
| Interest expense |
| $ | (2,058 | ) |
Total |
|
|
| $ | 2,058 |
|
|
|
|
|
| $ | (2,058 | ) |
F-49F-45
December 31, 2018 Type of Fair Value Hedge |
| Location of Gain/(Loss) Recognized in Income on Derivative |
| Amount of Gain/(Loss) Recognized in Income on Derivative |
|
| Hedged Item |
| Income Statement Location of Hedged Item Gain/(Loss) |
| Amount of Gain/(Loss) Recognized in Income on Hedged Item |
| ||
Derivatives designated as hedging instruments: |
|
|
|
|
|
|
|
|
|
|
|
|
|
|
Interest Rate Contracts: |
|
|
|
|
|
|
|
|
|
|
|
|
|
|
Interest Rate Swaps |
| Interest expense |
| $ | (680 | ) |
| Fixed rate debt |
| Interest expense |
| $ | 680 |
|
Total |
|
|
| $ | (680 | ) |
|
|
|
|
| $ | 680 |
|
The following tables provide a summary of the effect of cash flow hedges on the Company’s accompanying consolidated statements of operations and comprehensive income for the years ended December 31, 2017, 20162020, 2019 and 2015,2018, respectively (amounts in thousands):
|
| Effective Portion |
|
| Ineffective Portion |
|
| Effective Portion |
| |||||||||||||||||
December 31, 2017 Type of Cash Flow Hedge |
| Amount of Gain/(Loss) Recognized in OCI on Derivative |
|
| Location of Gain/(Loss) Reclassified from Accumulated OCI into Income |
| Amount of Gain/(Loss) Reclassified from Accumulated OCI into Income |
|
| Location of Gain/(Loss) Recognized in Income on Derivative |
| Amount of Gain/(Loss) Reclassified from Accumulated OCI into Income |
| |||||||||||||
December 31, 2020 Type of Cash Flow Hedge |
| Amount of Gain/(Loss) Recognized in OCI on Derivative |
|
| Location of Gain/(Loss) Reclassified from Accumulated OCI into Income |
| Amount of Gain/(Loss) Reclassified from Accumulated OCI into Income |
| ||||||||||||||||||
Derivatives designated as hedging instruments: |
|
|
|
|
|
|
|
|
|
|
|
|
|
|
|
|
|
|
|
|
|
|
|
|
|
|
Interest Rate Contracts: |
|
|
|
|
|
|
|
|
|
|
|
|
|
|
|
|
|
|
|
|
|
|
|
|
|
|
Forward Starting Swaps |
| $ | 6,439 |
|
| Interest expense |
| $ | (18,858 | ) |
| Interest expense |
| $ | — |
|
| $ | (1,190 | ) |
| Interest expense |
| $ | (35,087 | ) |
Total |
| $ | 6,439 |
|
|
|
| $ | (18,858 | ) |
|
|
| $ | — |
|
| $ | (1,190 | ) |
|
|
| $ | (35,087 | ) |
|
| Effective Portion |
|
| Ineffective Portion |
|
| Effective Portion |
| |||||||||||||||||
December 31, 2016 Type of Cash Flow Hedge |
| Amount of Gain/(Loss) Recognized in OCI on Derivative |
|
| Location of Gain/(Loss) Reclassified from Accumulated OCI into Income |
| Amount of Gain/(Loss) Reclassified from Accumulated OCI into Income |
|
| Location of Gain/(Loss) Recognized in Income on Derivative |
| Amount of Gain/(Loss) Reclassified from Accumulated OCI into Income |
| |||||||||||||
December 31, 2019 Type of Cash Flow Hedge |
| Amount of Gain/(Loss) Recognized in OCI on Derivative |
|
| Location of Gain/(Loss) Reclassified from Accumulated OCI into Income |
| Amount of Gain/(Loss) Reclassified from Accumulated OCI into Income |
| ||||||||||||||||||
Derivatives designated as hedging instruments: |
|
|
|
|
|
|
|
|
|
|
|
|
|
|
|
|
|
|
|
|
|
|
|
|
|
|
Interest Rate Contracts: |
|
|
|
|
|
|
|
|
|
|
|
|
|
|
|
|
|
|
|
|
|
|
|
|
|
|
Forward Starting Swaps |
| $ | (3,989 | ) |
| Interest expense |
| $ | (41,758 | ) |
| Interest expense |
| $ | (74 | ) |
| $ | (33,765 | ) |
| Interest expense |
| $ | (21,188 | ) |
Total |
| $ | (3,989 | ) |
|
|
| $ | (41,758 | ) |
|
|
| $ | (74 | ) |
| $ | (33,765 | ) |
|
|
| $ | (21,188 | ) |
|
| Effective Portion |
|
| Ineffective Portion |
|
| Effective Portion |
|
| Ineffective Portion |
| ||||||||||||||||||||
December 31, 2015 Type of Cash Flow Hedge |
| Amount of Gain/(Loss) Recognized in OCI on Derivative |
|
| Location of Gain/(Loss) Reclassified from Accumulated OCI into Income |
| Amount of Gain/(Loss) Reclassified from Accumulated OCI into Income |
|
| Location of Gain/(Loss) Recognized in Income on Derivative |
| Amount of Gain/(Loss) Reclassified from Accumulated OCI into Income |
| |||||||||||||||||||
December 31, 2018 Type of Cash Flow Hedge |
| Amount of Gain/(Loss) Recognized in OCI on Derivative |
|
| Location of Gain/(Loss) Reclassified from Accumulated OCI into Income |
| Amount of Gain/(Loss) Reclassified from Accumulated OCI into Income |
|
| Location of Gain/(Loss) Recognized in Income on Derivative |
| Amount of Gain/(Loss) Reclassified from Accumulated OCI into Income |
| |||||||||||||||||||
Derivatives designated as hedging instruments: |
|
|
|
|
|
|
|
|
|
|
|
|
|
|
|
|
|
|
|
|
|
|
|
|
|
|
|
|
|
|
|
|
Interest Rate Contracts: |
|
|
|
|
|
|
|
|
|
|
|
|
|
|
|
|
|
|
|
|
|
|
|
|
|
|
|
|
|
|
|
|
Forward Starting Swaps |
| $ | (814 | ) |
| Interest expense |
| $ | (18,244 | ) |
| Interest expense |
| $ | (3,033 | ) |
| $ | 5,124 |
|
| Interest expense |
| $ | (18,452 | ) |
| N/A |
| $ | 0 |
|
Total |
| $ | (814 | ) |
|
|
| $ | (18,244 | ) |
|
|
| $ | (3,033 | ) |
| $ | 5,124 |
|
|
|
| $ | (18,452 | ) |
|
|
| $ | 0 |
|
As of December 31, 20172020 and 2016,2019, there were approximately $88.6$43.7 million and $113.9$77.6 million in deferred losses, net, included in accumulated other comprehensive income (loss), respectively, related to derivative instruments. Based oninstruments, of which an estimated $10.2 million may be recognized as additional interest expense during the estimated fair values of the net derivative instruments attwelve months ending December 31, 2017,2021.
In April 2020, the Company may recognize an estimated $21.2paid approximately $1.2 million to settle 2 forward starting swaps in conjunction with the issuance of $495.0 million of ten-year secured conventional mortgage notes. The entire $1.2 million was initially deferred as a component of accumulated other comprehensive income (loss) and will be recognized as additionalan increase to interest expense duringover the year ending December 31, 2018.first five years of the mortgage notes.
In July 2019, 6 fair value interest rate swaps matured in conjunction with the maturity of $450.0 million of 2.375% unsecured notes.
In August 2017,June 2019, the Company paid approximately $41.8 million to settle 10 forward starting swaps in conjunction with the issuance of $600.0 million of ten-year unsecured public notes. The accrued interest of approximately $0.2 million was recorded as an
F-46
increase to interest expense. The remaining $41.6 million will be deferred as a component of accumulated other comprehensive income (loss) and will be recognized as an increase to interest expense over the first nine years and eleven months of the notes.
In November 2018, the Company received $1.3approximately $16.4 million to settle four6 forward starting ten-year swaps in conjunction with the issuance of $400.0 million of ten-year fixed rate unsecured public notes. The accrued interest of approximately $120,000 was recorded as an increase to interest expense. The remaining $16.5 million will be deferred as a component of accumulated other comprehensive income (loss) and will be recognized as a decrease to interest expense over the first nine years and nine months of the notes.
In February 2018, the Company received approximately $1.6 million to settle 2 forward starting swaps in conjunction with the issuance of $500.0 million of ten-year unsecured public notes. The entire $1.3$1.6 million was initially deferred as a component of accumulated other comprehensive income (loss) and will be recognized as a decrease to interest expense over the ten-year term of the notes.
In October 2016, the Company paid $4.7 million to settle a forward starting ten-year swap in conjunction with the issuance of $500.0 million of ten-year fixed rate public notes. The ineffective portion of approximately $74,000 and accrued interest of approximately $9,000 were recorded as increases to interest expense. The remaining amount of approximately $4.6 million will be deferred as a component of accumulated other comprehensive income (loss) and recognized as an increase to interest expense over the approximate term of the notes.
In May 2015, the Company paid a net $15.1 million to settle nine forward starting ten-year swaps in conjunction with the issuance of $450.0 million of ten-year fixed rate public notes. The ineffective portion of approximately $30,000 and accrued interest of approximately $1.2 million were recorded as increases to interest expense. The remaining amount of approximately $13.9 million will be deferred as a component of accumulated other comprehensive income (loss) and recognized as an increase to interest expense over the first 9 years and 10.5 months of the notes.
During the year ended December 31, 2015, the Company recorded approximately $3.0 million of deferred accumulated other comprehensive income (loss) as additional interest expense due to the ineffectiveness of certain forward starting swaps.
F-50
Equity Residential
The following tables set forth the computation of net income per share – basic and net income per share – diluted for the Company (amounts in thousands except per share amounts):
|
| Year Ended December 31, |
| |||||||||
|
| 2017 |
|
| 2016 |
|
| 2015 |
| |||
Numerator for net income per share – basic: |
|
|
|
|
|
|
|
|
|
|
|
|
Income from continuing operations |
| $ | 628,381 |
|
| $ | 4,479,586 |
|
| $ | 907,621 |
|
Allocation to Noncontrolling Interests – Operating Partnership, net |
|
| (22,604 | ) |
|
| (171,491 | ) |
|
| (34,226 | ) |
Net (income) loss attributable to Noncontrolling Interests – Partially Owned Properties |
|
| (2,323 | ) |
|
| (16,430 | ) |
|
| (3,657 | ) |
Preferred distributions |
|
| (3,091 | ) |
|
| (3,091 | ) |
|
| (3,357 | ) |
Premium on redemption of Preferred Shares |
|
| — |
|
|
| — |
|
|
| (3,486 | ) |
Income from continuing operations available to Common Shares, net of Noncontrolling Interests |
|
| 600,363 |
|
|
| 4,288,574 |
|
|
| 862,895 |
|
Discontinued operations, net of Noncontrolling Interests |
|
| — |
|
|
| 498 |
|
|
| 382 |
|
Numerator for net income per share – basic |
| $ | 600,363 |
|
| $ | 4,289,072 |
|
| $ | 863,277 |
|
Numerator for net income per share – diluted: |
|
|
|
|
|
|
|
|
|
|
|
|
Income from continuing operations |
| $ | 628,381 |
|
| $ | 4,479,586 |
|
| $ | 907,621 |
|
Net (income) loss attributable to Noncontrolling Interests – Partially Owned Properties |
|
| (2,323 | ) |
|
| (16,430 | ) |
|
| (3,657 | ) |
Preferred distributions |
|
| (3,091 | ) |
|
| (3,091 | ) |
|
| (3,357 | ) |
Premium on redemption of Preferred Shares |
|
| — |
|
|
| — |
|
|
| (3,486 | ) |
Income from continuing operations available to Common Shares |
|
| 622,967 |
|
|
| 4,460,065 |
|
|
| 897,121 |
|
Discontinued operations, net |
|
| — |
|
|
| 518 |
|
|
| 397 |
|
Numerator for net income per share – diluted |
| $ | 622,967 |
|
| $ | 4,460,583 |
|
| $ | 897,518 |
|
Denominator for net income per share – basic and diluted: |
|
|
|
|
|
|
|
|
|
|
|
|
Denominator for net income per share – basic |
|
| 366,968 |
|
|
| 365,002 |
|
|
| 363,498 |
|
Effect of dilutive securities: |
|
|
|
|
|
|
|
|
|
|
|
|
OP Units |
|
| 12,901 |
|
|
| 13,827 |
|
|
| 13,576 |
|
Long-term compensation shares/units |
|
| 2,809 |
|
|
| 3,163 |
|
|
| 3,546 |
|
Denominator for net income per share – diluted |
|
| 382,678 |
|
|
| 381,992 |
|
|
| 380,620 |
|
Net income per share – basic |
| $ | 1.64 |
|
| $ | 11.75 |
|
| $ | 2.37 |
|
Net income per share – diluted |
| $ | 1.63 |
|
| $ | 11.68 |
|
| $ | 2.36 |
|
Net income per share – basic: |
|
|
|
|
|
|
|
|
|
|
|
|
Income from continuing operations available to Common Shares, net of Noncontrolling Interests |
| $ | 1.64 |
|
| $ | 11.75 |
|
| $ | 2.37 |
|
Discontinued operations, net of Noncontrolling Interests |
|
| — |
|
|
| — |
|
|
| — |
|
Net income per share – basic |
| $ | 1.64 |
|
| $ | 11.75 |
|
| $ | 2.37 |
|
Net income per share – diluted: |
|
|
|
|
|
|
|
|
|
|
|
|
Income from continuing operations available to Common Shares |
| $ | 1.63 |
|
| $ | 11.68 |
|
| $ | 2.36 |
|
Discontinued operations, net |
|
| — |
|
|
| — |
|
|
| — |
|
Net income per share – diluted |
| $ | 1.63 |
|
| $ | 11.68 |
|
| $ | 2.36 |
|
|
| Year Ended December 31, |
| |||||||||
|
| 2020 |
|
| 2019 |
|
| 2018 |
| |||
Numerator for net income per share – basic: |
|
|
|
|
|
|
|
|
|
|
|
|
Net income |
| $ | 962,501 |
|
| $ | 1,009,708 |
|
| $ | 685,192 |
|
Allocation to Noncontrolling Interests – Operating Partnership |
|
| (34,010 | ) |
|
| (36,034 | ) |
|
| (24,939 | ) |
Net (income) loss attributable to Noncontrolling Interests – Partially Owned Properties |
|
| (14,855 | ) |
|
| (3,297 | ) |
|
| (2,718 | ) |
Preferred distributions |
|
| (3,090 | ) |
|
| (3,090 | ) |
|
| (3,090 | ) |
Numerator for net income per share – basic |
| $ | 910,546 |
|
| $ | 967,287 |
|
| $ | 654,445 |
|
Numerator for net income per share – diluted: |
|
|
|
|
|
|
|
|
|
|
|
|
Net income |
| $ | 962,501 |
|
| $ | 1,009,708 |
|
| $ | 685,192 |
|
Net (income) loss attributable to Noncontrolling Interests – Partially Owned Properties |
|
| (14,855 | ) |
|
| (3,297 | ) |
|
| (2,718 | ) |
Preferred distributions |
|
| (3,090 | ) |
|
| (3,090 | ) |
|
| (3,090 | ) |
Numerator for net income per share – diluted |
| $ | 944,556 |
|
| $ | 1,003,321 |
|
| $ | 679,384 |
|
Denominator for net income per share – basic and diluted: |
|
|
|
|
|
|
|
|
|
|
|
|
Denominator for net income per share – basic |
|
| 371,791 |
|
|
| 370,461 |
|
|
| 368,052 |
|
Effect of dilutive securities: |
|
|
|
|
|
|
|
|
|
|
|
|
OP Units |
|
| 13,003 |
|
|
| 12,907 |
|
|
| 12,869 |
|
Long-term compensation shares/units |
|
| 1,080 |
|
|
| 2,965 |
|
|
| 2,774 |
|
Denominator for net income per share – diluted |
|
| 385,874 |
|
|
| 386,333 |
|
|
| 383,695 |
|
Net income per share – basic |
| $ | 2.45 |
|
| $ | 2.61 |
|
| $ | 1.78 |
|
Net income per share – diluted |
| $ | 2.45 |
|
| $ | 2.60 |
|
| $ | 1.77 |
|
F-51F-47
ERP Operating Limited Partnership
The following tables set forth the computation of net income per Unit – basic and net income per Unit – diluted for the Operating Partnership (amounts in thousands except per Unit amounts):
|
| Year Ended December 31, |
| |||||||||
|
| 2017 |
|
| 2016 |
|
| 2015 |
| |||
Numerator for net income per Unit – basic and diluted: |
|
|
|
|
|
|
|
|
|
|
|
|
Income from continuing operations |
| $ | 628,381 |
|
| $ | 4,479,586 |
|
| $ | 907,621 |
|
Net (income) loss attributable to Noncontrolling Interests – Partially Owned Properties |
|
| (2,323 | ) |
|
| (16,430 | ) |
|
| (3,657 | ) |
Allocation to Preference Units |
|
| (3,091 | ) |
|
| (3,091 | ) |
|
| (3,357 | ) |
Allocation to premium on redemption of Preference Units |
|
| — |
|
|
| — |
|
|
| (3,486 | ) |
Income from continuing operations available to Units |
|
| 622,967 |
|
|
| 4,460,065 |
|
|
| 897,121 |
|
Discontinued operations, net |
|
| — |
|
|
| 518 |
|
|
| 397 |
|
Numerator for net income per Unit – basic and diluted |
| $ | 622,967 |
|
| $ | 4,460,583 |
|
| $ | 897,518 |
|
Denominator for net income per Unit – basic and diluted: |
|
|
|
|
|
|
|
|
|
|
|
|
Denominator for net income per Unit – basic |
|
| 379,869 |
|
|
| 378,829 |
|
|
| 377,074 |
|
Effect of dilutive securities: |
|
|
|
|
|
|
|
|
|
|
|
|
Dilution for Units issuable upon assumed exercise/vesting of the Company’s long-term compensation shares/units |
|
| 2,809 |
|
|
| 3,163 |
|
|
| 3,546 |
|
Denominator for net income per Unit – diluted |
|
| 382,678 |
|
|
| 381,992 |
|
|
| 380,620 |
|
Net income per Unit – basic |
| $ | 1.64 |
|
| $ | 11.75 |
|
| $ | 2.37 |
|
Net income per Unit – diluted |
| $ | 1.63 |
|
| $ | 11.68 |
|
| $ | 2.36 |
|
Net income per Unit – basic: |
|
|
|
|
|
|
|
|
|
|
|
|
Income from continuing operations available to Units |
| $ | 1.64 |
|
| $ | 11.75 |
|
| $ | 2.37 |
|
Discontinued operations, net |
|
| — |
|
|
| — |
|
|
| — |
|
Net income per Unit – basic |
| $ | 1.64 |
|
| $ | 11.75 |
|
| $ | 2.37 |
|
Net income per Unit – diluted: |
|
|
|
|
|
|
|
|
|
|
|
|
Income from continuing operations available to Units |
| $ | 1.63 |
|
| $ | 11.68 |
|
| $ | 2.36 |
|
Discontinued operations, net |
|
| — |
|
|
| — |
|
|
| — |
|
Net income per Unit – diluted |
| $ | 1.63 |
|
| $ | 11.68 |
|
| $ | 2.36 |
|
|
| Year Ended December 31, |
| |||||||||
|
| 2020 |
|
| 2019 |
|
| 2018 |
| |||
Numerator for net income per Unit – basic and diluted: |
|
|
|
|
|
|
|
|
|
|
|
|
Net income |
| $ | 962,501 |
|
| $ | 1,009,708 |
|
| $ | 685,192 |
|
Net (income) loss attributable to Noncontrolling Interests – Partially Owned Properties |
|
| (14,855 | ) |
|
| (3,297 | ) |
|
| (2,718 | ) |
Allocation to Preference Units |
|
| (3,090 | ) |
|
| (3,090 | ) |
|
| (3,090 | ) |
Numerator for net income per Unit – basic and diluted |
| $ | 944,556 |
|
| $ | 1,003,321 |
|
| $ | 679,384 |
|
Denominator for net income per Unit – basic and diluted: |
|
|
|
|
|
|
|
|
|
|
|
|
Denominator for net income per Unit – basic |
|
| 384,794 |
|
|
| 383,368 |
|
|
| 380,921 |
|
Effect of dilutive securities: |
|
|
|
|
|
|
|
|
|
|
|
|
Dilution for Units issuable upon assumed exercise/vesting of the Company’s long-term compensation shares/units |
|
| 1,080 |
|
|
| 2,965 |
|
|
| 2,774 |
|
Denominator for net income per Unit – diluted |
|
| 385,874 |
|
|
| 386,333 |
|
|
| 383,695 |
|
Net income per Unit – basic |
| $ | 2.45 |
|
| $ | 2.61 |
|
| $ | 1.78 |
|
Net income per Unit – diluted |
| $ | 2.45 |
|
| $ | 2.60 |
|
| $ | 1.77 |
|
|
|
|
|
|
|
|
|
|
|
|
|
|
|
|
The Company concluded that the Starwood Transaction did not qualify for discontinued operations reporting as it did not represent a strategic shift that had a major effect on the Company’s operations and financial results. The Company has been investing only in its coastal gateway markets (Boston, New York, Washington D.C., Southern California, San Francisco and Seattle) and has not been acquiring or developing any new assets in its other markets. Over the past several years, the Company has been repositioning its portfolio by selling its suburban assets located in markets outside its coastal gateway markets. The sale of the Starwood Portfolio represented the continuation of the above strategy. However, the Company concluded that the Starwood Transaction did qualify as an individually significant component of the Company as the amount received upon disposal exceeded 10% of total assets, and NOI (see definition in Note 17) of the Starwood Portfolio represented approximately 1.2% of consolidated NOI (for the approximate one-month period owned in 2016) for the year ended December 31, 2016 and approximately 15.7% of consolidated NOI for the year ended December 31, 2015. As a result, the following table summarizes the results of operations attributable to the Starwood Transaction for the years ended December 31, 2016 and 2015 (amounts in thousands):
F-52
|
| Year Ended December 31, |
| |||||
|
| 2016 |
|
| 2015 |
| ||
REVENUES |
|
|
|
|
|
|
|
|
Rental income |
| $ | 30,785 |
|
| $ | 427,433 |
|
Total revenues |
|
| 30,785 |
|
|
| 427,433 |
|
EXPENSES |
|
|
|
|
|
|
|
|
Property and maintenance |
|
| 7,838 |
|
|
| 78,189 |
|
Real estate taxes and insurance |
|
| 2,912 |
|
|
| 48,403 |
|
Property management |
|
| 2 |
|
|
| 11 |
|
General and administrative |
|
| 23 |
|
|
| 38 |
|
Depreciation |
|
| — |
|
|
| 87,616 |
|
Total expenses |
|
| 10,775 |
|
|
| 214,257 |
|
Operating income |
|
| 20,010 |
|
|
| 213,176 |
|
Interest and other income |
|
| 21 |
|
|
| 1 |
|
Other expenses |
|
| — |
|
|
| (35 | ) |
Interest: |
|
|
|
|
|
|
|
|
Expense incurred, net |
|
| (380 | ) |
|
| (680 | ) |
Amortization of deferred financing costs |
|
| (707 | ) |
|
| (559 | ) |
Income and other tax (expense) benefit |
|
| (1 | ) |
|
| (1 | ) |
Net gain (loss) on sales of real estate properties |
|
| 3,161,097 |
|
|
| — |
|
Income from operations attributable to controlling interests – Operating Partnership |
|
| 3,180,040 |
|
|
| 211,902 |
|
Income from operations attributable to Noncontrolling Interests – Operating Partnership |
|
| (122,152 | ) |
|
| (8,083 | ) |
Income from operations attributable to controlling interests – Company |
| $ | 3,057,888 |
|
| $ | 203,819 |
|
12. | Share Incentive Plans |
Any Common Shares issued pursuant to EQR’s incentive equity compensation and employee share purchase plans will result in ERPOP issuing OP Units to EQR on a one-for-one basis with ERPOP receiving the net cash proceeds of such issuances.
On June 16, 2011, the shareholdersOverview of EQR approved the Company’s 2011Share Incentive Plans
The 2019 Share Incentive Plan (the “2019 Plan”), as amended (the “2011 Plan”). The 2011 Plan originally reserved 12,980,741approved by the Company’s shareholders on June 27, 2019, expires on June 27, 2029 and reserves 11,331,958 Common Shares for issuance, which was subsequently adjusted to 14,725,321 Common Shares in accordance with the provisions of the 2011 Plan as a result of the option adjustments required for the special dividends paid in conjunction with the Starwood Transaction. In conjunction with the approval of the 2011 Plan, no furtherissuance. All future awards maywill be granted under the 2002 Share Incentive2019 Plan. The 2011 Plan expires on June 16, 2021. As of December 31, 2017, 6,913,2462020, 10,512,390 shares were available for future issuance.
Pursuant to the 2019 Plan, the 2011 Share Incentive Plan (the “2011 Plan”) and the 2002 Share Incentive Plan (the “2002 Plan”), as restated and amended (collectively the “Share Incentive Plans”), officers, trustees, and key employees and consultants of the Company and its subsidiaries may be granted share options to acquire Common Shares (“Options”), including non-qualified share options (“NQSOs”), incentive share options (“ISOs”) and share appreciation rights (“SARs”), or may be granted restricted or non-restricted shares/units (including long-term incentive plan awards), subject to conditions and restrictions as described in the Share Incentive Plans.restrictions. Options, SARs, restricted shares (including long-term incentive plan awards) and restricted units (including long-term incentive plan awards) are sometimes collectively referred to herein as “Awards”. “Awards.”
The 2011 Plan and the 2002 Share Incentive Plan, as restated and amended, will both terminate at such time aswhen all outstanding Awards have expired or have been exercised/vested. The Board of Trustees may at any time amend or terminate the Share Incentive Plans, but termination will not affect Awards previously granted.granted, absent immediate vesting and cash settlement. Any Options which had vested prior to such a termination would remain exercisable by the holder.
F-48
Employee Long-Term Compensation Awards
The Options arefollowing table summarizes the terms of Awards generally granted to employees:
Options | Restricted Shares | Restricted Units | ||||
Overview | Options exercised after vesting result in issuance of new Common Shares. | Restricted shareholders generally have the same voting rights and receive quarterly dividend payments on their shares at the same rate and on the same date as any other Common Share holder (1). | When certain conditions are met, restricted units convert into an equal number of OP Units, which the holder may exchange for Common Shares on a one-for-one basis or at the option of the Company the cash value of such shares. Restricted unitholders receive quarterly distribution payments on their restricted units at the same rate and on the same date as any other OP Unit holder (1). | |||
Grant/Exercise Price | Granted at the fair market value of Common Shares as of the grant date. | Granted at the fair market value of Common Shares as of the grant date. | Granted at varying discount rates to the fair market value of Common Shares as of the grant date (2). | |||
Vesting Period | In three equal installments over a three-year period from the grant date. | Three years from the grant date. | Three years from the grant date. | |||
Expiration | Ten years from the grant date. | Not applicable. | Ten years from the grant date (2). | |||
Upon Employee Termination | Unvested options are canceled. | Unvested restricted shares are canceled. | Unvested restricted units are canceled. |
(1) | Dividends/distributions paid on unvested restricted shares and units are included as a component of retained earnings and Noncontrolling Interest – Operating Partnership/Limited Partners Capital, respectively, and have not been considered in reducing net income available to Common Shares/Units in a manner similar to the Company’s preferred share/preference unit dividends for the earnings per share/Unit calculation. |
(2) | A restricted unit will automatically convert to an OP Unit when the capital account of each restricted unit increases (“books-up”) to a specified target. The probability of a book-up occurring within the ten-year contractual life along with the liquidity risk associated with various hold period restrictions are both reflected in the discount. If the capital target is not attained within ten years following the date of issuance, the restricted unit will automatically be canceled and no compensation will be payable to the holder of such canceled restricted unit. If the capital target is attained and the restricted unit is converted to an OP Unit, it will not expire. |
Valuation Method of Share Options
The fair value of the Company’s Common Shares atOption grants is recognized over the date of grant, vest in three equal installments over a three-yearrequisite service/vesting period are exercisable upon vesting and expire ten years from the date of grant (see additional valuation discussion in Note 2). The exercise price for all Options under the Share Incentive Plans is equal to the fair market value of the underlying Common SharesOptions. The fair value for the Company’s Options was estimated at the time the Options were granted using the Black-Scholes option pricing model with the primary grant in each year having the following weighted average assumptions:
|
| 2020 |
|
| 2019 |
|
| 2018 |
| |||
Expected volatility (1) |
|
| 15.2 | % |
|
| 16.3 | % |
|
| 14.8 | % |
Expected life (2) |
| 5 years |
|
| 5 years |
|
| 5 years |
| |||
Expected dividend yield (3) |
|
| 3.04 | % |
|
| 3.10 | % |
|
| 3.09 | % |
Risk-free interest rate (4) |
|
| 1.32 | % |
|
| 2.43 | % |
|
| 2.52 | % |
Option valuation per share |
| $ | 7.23 |
|
| $ | 8.06 |
|
| $ | 6.15 |
|
(1) | Expected volatility – Estimated based on the historical five-year volatility (the period matching the expected life) of EQR’s share price measured on a monthly basis. |
(2) | Expected life – Approximates the actual weighted average life of all Options granted since the Company went public in 1993. |
(3) | Expected dividend yield – Calculated by averaging the historical annual yield on EQR shares for a period matching the expected life of each grant, with the annual yield calculated by dividing actual regular dividends (excluding any special dividends) by the average price of EQR’s shares in a given year. |
(4) | Risk-free interest rate – The most current U.S. Treasury rate available at the grant date for a period matching the expected life of each grant. |
The valuation method and assumptions are the same as those the Company used in accounting for Option expense in its consolidated financial statements. The Black-Scholes option valuation model was developed for use in estimating the fair value of traded options that have no vesting restrictions and are fully transferable. This model is granted. If employment is terminated prior to vesting,only one method of valuing options. Because the Company’s Options have characteristics significantly different from those of traded options, and because changes in the subjective input assumptions can materially affect the fair value estimate, the actual value of the Options are generally canceled. Options exercised result in new Common Shares being issued onto the open market. recipient may be significantly different.
F-53F-49
Restricted shares are generally granted at the fair market value of the Company’s Common Shares at the date of grant. Restricted shares that have been awarded through December 31, 2017 generally vest three years from the award date. In addition, the Company’s unvested restricted shareholders have the same voting rights as any other Common Share holder. During the three-year period of restriction, the Company’s unvested restricted shareholders receive quarterly dividend payments on their shares at the same rate and on the same date as any other Common Share holder. As a result, dividends paid on unvested restricted shares are included as a component of retained earnings (included in general partner’s capital in the Operating Partnership’s financial statements) and have not been considered in reducing net income available to Common Shares/Units in a manner similar to the Company’s preferred share/preference unit dividends for the earnings per share/Unit calculation. If employment is terminated prior to the lapsing of the restriction, the shares are generally canceled.
Restricted units are a class of partnership interests that under certain conditions, including vesting, are convertible by the holder into an equal number of OP Units, which are redeemable by the holder for Common Shares on a one-for-one basis or the cash value of such shares at the option of the Company. In connection with the grant of long-term incentive compensation for services provided during a year, officers of the Company are allowed to choose between restricted shares and restricted units. In January 2011, March 2014 and June 2015, certain holders of restricted shares converted these shares into restricted units. Restricted units are generally granted at a 3% discount to the fair market value of the Company’s Common Shares at the date of grant due to the book-up risk associated with restricted units (see below for more details) and generally vest three years from the award date. In addition, restricted unit holders receive quarterly dividend payments on their restricted units at the same rate and on the same date as any other OP Unit holder. As a result, dividends paid on restricted units are included as a component of Noncontrolling Interests – Operating Partnership/Limited Partners’ capital and have not been considered in reducing net income available to Common Shares/Units in a manner similar to the Company’s preferred share/preference unit dividends for the earnings per share/Unit calculation. If employment is terminated prior to vesting, the restricted units are generally canceled. A restricted unit will automatically convert to an OP Unit when the capital account of each restricted unit increases (“books-up”) to a specified target. If the capital target is not attained within ten years following the date of issuance, the restricted unit will automatically be canceled and no compensation will be payable to the holder of such canceled restricted unit.Long-Term Incentive Plan
The Company also allows eligible employees the ability to receive immediately vested Options and allows officers the ability to receive immediately vested restricted units (subject to the book-up provisions described above and a two-year hold restriction) in-lieu of any percentage of their annual cash bonus.
In January 2015, the Company revised itsCompany’s executive compensation program forallows the Chairman, Chief Executive Officer and certain other Executive Officers. The long-term portion of the revised program will allow these individualsexecutive officers to earn from 0% to 200% of the target number of long-term incentive (“LTI”) plan awards, payable in the form of restricted shares and/or restricted units, as determined byunits. No payout would be made for any return below 50% of the target performance metric. The Company’s relative and absolute Total Shareholder Return (“TSR”) and Normalized Funds from Operations (“FFO”) results over a forward-looking three-year performance period. The Company’s TSR will beperiod determine the restricted shares and/or restricted units awarded and are compared to pre-established quantitative performance metrics. In connection with the grant of LTI plan awards, the individuals are allowed to choose between restricted shares and restricted units. The grant date fair value of the awards is estimated using a Monte Carlo model for the TSR portion of the awards, and the resulting expense is recorded over the service period regardless of whether the TSR performance measures are achieved ifwhile the required serviceNormalized FFO portion of the awards is delivered. These awards generally vest three years fromadjusted based on the award date. The grant date fair value is amortized into expense over the service period.final achievement obtained. If the executive is retirement-eligible, the grant date fair value is amortized into expense over the first year. All other awards are amortized into expense over the three year performance/vesting period. In addition, the awards granted as restricted units will receive quarterly partial dividend payments equal to 10% of any common share dividend on the same date as any other OP Unit holder during the three-year performance period. As a result, dividends paid on restricted units are included as a component of Noncontrolling Interests – Operating Partnership/Limited Partners’ capital and have not been considered in reducing net income available to Common Shares/Units in a manner similar to the Company’s preferred share/preference unit dividends for the earnings per share/Unit calculation. The awards granted as restricted shares will not receive dividends during the three-year performancevesting period. At the end of the three-year performance period, cumulative dividends will be paid for the three-year performance period for any restricted shares or restricted units actually earned, less any dividends already paid on the restricted units. If employment is terminated prior to vesting, the restricted shares and restricted units are generally canceled.Once
The LTI participants receive distributions on only restricted units awarded equal to 10% of the Company’s absolute and relative TSR is calculated atquarterly distributions paid on OP Units during the performance period. At the end of the three-year performance period, the executive will earn a certain number ofLTI participants receive dividends/distributions actually earned on restricted shares and/or restricted units. No payout would be made forunits awarded during the performance period, less any return below 50%distributions already paid on the restricted units.
The grant date fair value of the target performance metric.TSR portion of the LTI awards is estimated using a multifactor Monte Carlo model to determine share prices for an absolute award for which the payout of the award only depends on EQR’s TSR and a set of relative awards for which the payout of the award depends on the spread of EQR’s TSR to the TSR of two indices: (a) the FTSE Nareit Apartment Index; and (b) the FTSE Nareit Equity Index. The grant date fair value of the Normalized FFO portion of the LTI awards is estimated using the closing price of EQR Common Shares on the grant date for the restricted shares and a discounted closing price of EQR Common Shares on the grant date for the restricted units to reflect the “book-up” and liquidity risk inherent in the units. The individual prices determined above are then weighted to arrive at the final values for each restricted share/unit as follows:
|
| 2020 |
|
| 2019 |
|
| 2018 |
| |||
Weighted average fair value per restricted share |
| $ | 75.89 |
|
| $ | 65.36 |
|
| $ | 63.86 |
|
Weighted average fair value per restricted unit |
| $ | 72.69 |
|
| $ | 63.12 |
|
| $ | 62.20 |
|
The valuation method and assumptions are the same as those the Company used in accounting for restricted share/unit expense in its consolidated financial statements. The Monte Carlo valuation model is only one method of valuing awards. Because the Company’s restricted shares/units have characteristics significantly different from those of traded shares/units, and because changes in the subjective input assumptions can materially affect the fair value estimate, the actual value of the restricted shares/units to the recipient may be significantly different.
Trustees
All Trustees, with the exception of the Company’s non-executive Chairman and employee Trustees, are granted options,Options, restricted shares and/or restricted units that vest one-year from the grant date that corresponds to the term for which he or she has been elected to serve. The non-executiveSince 2016, the Chairman has only receivesreceived awards under the LTI plan (see further discussion above).
F-50
Retirement Benefits
The Company’s Share Incentive Plans provide for certain benefits upon retirement. For employees hired prior to January 1, 2009,The following table summarizes the terms of each retirement generally means the termination of employment (other than for cause): (i) on or after age 62; or (ii) prior to age 62 after meeting the requirements of the Rule of 70 (described below). For employees hired after January 1,
F-54
Table of Contentseligibility category.
2009, retirement generally means the termination of employment (other than for cause) after meeting the requirements of the Rule of 70. For Trustees, retirement generally means termination of service on the Board (other than for cause) on or after age 72.
The Rule of 70 is met when an employee’s years of service with the Company (which must be at least 15 years) plus his or her age (which must be at least 55 years) on the date of termination equals or exceeds 70 years. In addition, the employee must give the Company at least 6 months’ advance written notice of his or her intention to retire and sign a release upon termination of employment, releasing the Company from customary claims and agreeing to ongoing non-competition and employee non-solicitation provisions.
Age 62 for Employees | Rule of 70 for Employees | Age 72 for Trustees | ||||
Eligibility | For employees hired prior to January 1, 2009 and who were age 59 or older as of February 1, 2019. | All employees (1). | All non-employee Trustees. | |||
Effect on unvested restricted shares, restricted units and Options | Awards immediately vest and Options continue to be exercisable for the balance of the applicable ten-year option period. | Awards continue to vest per the original vesting schedule, subject to certain conditions, and Options continue to be exercisable for the balance of the applicable ten-year option period. | Awards immediately vest and Options continue to be exercisable for the balance of the applicable ten-year option period. | |||
Effect on LTI Plan | Awards are prorated in proportion to the number of days worked in the first year of the three-year performance period and the individual does not receive any payout of shares or units until the final payout is determined at the end of the three-year performance period. | |||||
(1) | The Rule of 70 is met when an employee’s years of service with the Company (which must be at least 15 years) plus his or her age (which must be at least 55 years) on the date of termination equals or exceeds 70 years. In addition, the employee must give the Company at least six months’ advance written notice of his or her intention to retire along with agreeing to certain other conditions. |
Under the Company’s definitions of retirement, severalsome of its executive officers including its Chief Executive Officer, and its non-executive Chairman are retirement eligible.
For employees hired prior to January 1, 2009 who retire at or after age 62 (or for Trustees who retire at or after age 72), such employee’s or Trustee’s unvested restricted shares, restricted unitsCompensation Expense and share options would immediately vest, and share options would continue to be exercisable for the balance of the applicable ten-year option period, as is provided under the Share Incentive Plans. For all other employees (those hired after January 1, 2009 and those hired before such date who choose to retire prior to age 62), upon such retirement under the Rule of 70 definition of retirement of employees, such employee’s unvested restricted shares, restricted units and share options would continue to vest per the original vesting schedule (subject to immediate vesting upon the occurrence of a subsequent change in control of the Company or the employee’s death), and options would continue to be exercisable for the balance of the applicable ten-year option period, subject to the employee’s compliance with the non-competition and employee non-solicitation provisions. The Rule of 70 does not apply to Trustees. For the individuals mentioned above who receive awards under the LTI plan and retire at or after age 62 (age 72 for the Chairman of the Board) or under the Rule of 70, the award would be prorated in proportion to the number of days worked in the first year of the three-year performance period and the award would continue to vest per the original vesting schedule, subject to the individual’s compliance with the non-competition and employee non-solicitation provisions. The individual would not receive any payout of shares or units until the final payout is determined at the end of the three-year performance period. If an employee violates the non-competition and employee non-solicitation provisions after such retirement, all unvested restricted shares, unvested restricted units and unvested and vested share options at the time of the violation would be void, unless otherwise determined by the Compensation Committee of the Board of Trustees.Award Activity
The following tables summarize compensation information regarding the restricted shares, restricted units, share optionsOptions and Employee Share Purchase Plan (“ESPP”) for the three years ended December 31, 2017, 20162020, 2019 and 2015 (amounts in thousands):
2018.
|
| Year Ended December 31, 2017 |
|
| Year Ended December 31, 2020 |
| ||||||||||||||||||||||||||||||||||
|
| Compensation Expense |
|
| Compensation Capitalized |
|
| Restricted Units/Options In-Lieu of Bonus (1) |
|
| Compensation Equity |
|
| Dividends Incurred |
|
| Compensation Expense |
|
| Compensation Capitalized |
|
| Restricted Units/Options In-Lieu of Bonus (1) |
|
| Compensation Equity |
|
| Dividends Incurred |
| ||||||||||
Restricted shares (2) |
| $ | 9,209 |
|
| $ | 568 |
|
| $ | — |
|
| $ | 9,777 |
|
| $ | 761 |
|
| $ | 10,053 |
|
| $ | 1,172 |
|
| $ | 0 |
|
| $ | 11,225 |
|
| $ | 1,172 |
|
Restricted units (2) |
|
| 10,214 |
|
|
| 119 |
|
|
| 190 |
|
|
| 10,523 |
|
|
| 741 |
|
|
| 10,103 |
|
|
| 80 |
|
|
| 1,743 |
|
|
| 11,926 |
|
|
| 1,855 |
|
Share options |
|
| 4,893 |
|
|
| 323 |
|
|
| 1,619 |
|
|
| 6,835 |
|
|
| — |
| ||||||||||||||||||||
Options |
|
| 2,156 |
|
|
| 193 |
|
|
| 0 |
|
|
| 2,349 |
|
|
| 0 |
| ||||||||||||||||||||
ESPP discount |
|
| 681 |
|
|
| 66 |
|
|
| — |
|
|
| 747 |
|
|
| — |
|
|
| 862 |
|
|
| 82 |
|
|
| 0 |
|
|
| 944 |
|
|
| 0 |
|
Total |
| $ | 24,997 |
|
| $ | 1,076 |
|
| $ | 1,809 |
|
| $ | 27,882 |
|
| $ | 1,502 |
|
| $ | 23,174 |
|
| $ | 1,527 |
|
| $ | 1,743 |
|
| $ | 26,444 |
|
| $ | 3,027 |
|
|
| Year Ended December 31, 2016 |
|
| Year Ended December 31, 2019 |
| ||||||||||||||||||||||||||||||||||
|
| Compensation Expense |
|
| Compensation Capitalized |
|
| Restricted Units In-Lieu of Bonus (1) |
|
| Compensation Equity |
|
| Dividends Incurred |
|
| Compensation Expense |
|
| Compensation Capitalized |
|
| Restricted Units/Options In-Lieu of Bonus (1) |
|
| Compensation Equity |
|
| Dividends Incurred |
| ||||||||||
Restricted shares (2) |
| $ | 13,539 |
|
| $ | 1,477 |
|
| $ | — |
|
| $ | 15,016 |
|
| $ | 6,494 |
|
| $ | 11,522 |
|
| $ | 916 |
|
| $ | 0 |
|
| $ | 12,438 |
|
| $ | 979 |
|
Restricted units (2) |
|
| 13,567 |
|
|
| 591 |
|
|
| 4,022 |
|
|
| 18,180 |
|
|
| 7,762 |
|
|
| 9,905 |
|
|
| 240 |
|
|
| 3,265 |
|
|
| 13,410 |
|
|
| 825 |
|
Share options |
|
| 2,839 |
|
|
| 593 |
|
|
| — |
|
|
| 3,432 |
|
|
| — |
| ||||||||||||||||||||
Options |
|
| 2,420 |
|
|
| 254 |
|
|
| 1 |
|
|
| 2,675 |
|
|
| 0 |
| ||||||||||||||||||||
ESPP discount |
|
| 585 |
|
|
| 65 |
|
|
| — |
|
|
| 650 |
|
|
| — |
|
|
| 602 |
|
|
| 40 |
|
|
| 0 |
|
|
| 642 |
|
|
| 0 |
|
Total |
| $ | 30,530 |
|
| $ | 2,726 |
|
| $ | 4,022 |
|
| $ | 37,278 |
|
| $ | 14,256 |
|
| $ | 24,449 |
|
| $ | 1,450 |
|
| $ | 3,266 |
|
| $ | 29,165 |
|
| $ | 1,804 |
|
|
| Year Ended December 31, 2015 |
|
| Year Ended December 31, 2018 |
| ||||||||||||||||||||||||||||||||||
|
| Compensation Expense |
|
| Compensation Capitalized |
|
| Restricted Units In-Lieu of Bonus (1) |
|
| Compensation Equity |
|
| Dividends Incurred |
|
| Compensation Expense |
|
| Compensation Capitalized |
|
| Restricted Units/Options In-Lieu of Bonus (1) |
|
| Compensation Equity |
|
| Dividends Incurred |
| ||||||||||
Restricted shares (2) |
| $ | 13,755 |
|
| $ | 1,311 |
|
| $ | — |
|
| $ | 15,066 |
|
| $ | 1,160 |
|
| $ | 7,406 |
|
| $ | 852 |
|
| $ | 0 |
|
| $ | 8,258 |
|
| $ | 754 |
|
Restricted units (2) |
|
| 17,311 |
|
|
| 538 |
|
|
| 3,654 |
|
|
| 21,503 |
|
|
| 1,619 |
|
|
| 12,310 |
|
|
| 36 |
|
|
| 1,663 |
|
|
| 14,009 |
|
|
| 963 |
|
Share options |
|
| 2,746 |
|
|
| 1,010 |
|
|
| — |
|
|
| 3,756 |
|
|
| — |
| ||||||||||||||||||||
Options |
|
| 6,683 |
|
|
| 296 |
|
|
| 2,755 |
|
|
| 9,734 |
|
|
| 0 |
| ||||||||||||||||||||
ESPP discount |
|
| 795 |
|
|
| 89 |
|
|
| — |
|
|
| 884 |
|
|
| — |
|
|
| 733 |
|
|
| 34 |
|
|
| 0 |
|
|
| 767 |
|
|
| 0 |
|
Total |
| $ | 34,607 |
|
| $ | 2,948 |
|
| $ | 3,654 |
|
| $ | 41,209 |
|
| $ | 2,779 |
|
| $ | 27,132 |
|
| $ | 1,218 |
|
| $ | 4,418 |
|
| $ | 32,768 |
|
| $ | 1,717 |
|
F-55F-51
(2) | Includes LTI plan awards granted under the executive compensation program. |
Compensation expense is generally recognized for Awards as follows:
Restricted shares, restricted units and share options – Straight-line method over the vesting period of the options, shares or units regardless of cliff or ratable vesting distinctions.
• | Restricted shares, restricted units and Options – Straight-line method over the vesting period of the Options, shares or units regardless of cliff or ratable vesting distinctions. |
LTI plan awards – Target amount is recognized under the straight-line method over the vesting period of the shares or units regardless of cliff or ratable vesting distinctions.
• | LTI plan awards – Target amount is recognized under the straight-line method over the vesting period of the shares or units regardless of cliff or ratable vesting distinctions. |
ESPP discount – Immediately upon the purchase of common shares each quarter.
• | ESPP discount – Immediately upon the purchase of Common Shares each quarter. |
The Company accelerates the recognition of compensation expense for all Awards for those individuals approaching or meeting the retirement age criteria discussed above. The total compensation expense related to Awards not yet vested at December 31, 20172020 is $7.3$10.5 million (excluding(including the accelerated expenses for individuals approaching or meeting the retirement age criteria discussed above), which is expected to be recognized over a weighted average term of 1.311.27 years.
See Note 2 for additional information regarding the Company’s share-based compensation.
The table below summarizes the Award activity of the Share Incentive Plans for the three years ended December 31, 2017, 20162020, 2019 and 2015:2018:
|
| Common Shares Subject to Options |
|
| Weighted Average Exercise Price per Option |
|
| Restricted Shares |
|
| Weighted Average Fair Value per Restricted Share |
|
| Restricted Units |
|
| Weighted Average Fair Value per Restricted Unit |
|
| Common Shares Subject to Options |
|
| Weighted Average Exercise Price per Option |
|
| Restricted Shares |
|
| Weighted Average Fair Value per Restricted Share |
|
| Restricted Units |
|
| Weighted Average Fair Value per Restricted Unit |
| ||||||||||||
Balance at December 31, 2014 |
|
| 7,030,620 |
|
| $ | 46.16 |
|
|
| 482,466 |
|
| $ | 56.89 |
|
|
| 623,948 |
|
| $ | 53.38 |
| ||||||||||||||||||||||||
Balance at December 31, 2017 |
|
| 6,483,832 |
|
| $ | 46.46 |
|
|
| 369,741 |
|
| $ | 73.67 |
|
|
| 901,260 |
|
| $ | 77.61 |
| ||||||||||||||||||||||||
Awards granted (1) (5) |
|
| 171,150 |
|
| $ | 80.15 |
|
|
| 174,112 |
|
| $ | 79.65 |
|
|
| 337,505 |
|
| $ | 81.87 |
|
|
| 1,730,942 |
|
| $ | 60.40 |
|
|
| 129,303 |
|
| $ | 62.25 |
|
|
| 267,074 |
|
| $ | 61.60 |
|
Awards exercised/vested (2) (3) (4) |
|
| (1,456,363 | ) |
| $ | 42.64 |
|
|
| (127,174 | ) |
| $ | 60.21 |
|
|
| (72,003 | ) |
| $ | 57.12 |
|
|
| (1,056,388 | ) |
| $ | 29.05 |
|
|
| (194,116 | ) |
| $ | 77.32 |
|
|
| (28,486 | ) |
| $ | 55.50 |
|
Awards forfeited |
|
| (9,550 | ) |
| $ | 64.53 |
|
|
| (5,970 | ) |
| $ | 62.11 |
|
|
| (2,009 | ) |
| $ | 64.39 |
|
|
| (38,133 | ) |
| $ | 60.74 |
|
|
| (5,503 | ) |
| $ | 65.77 |
|
|
| 0 |
|
| $ | 0 |
|
Awards expired |
|
| (1,492 | ) |
| $ | 39.86 |
|
|
| — |
|
|
| — |
|
|
| — |
|
|
| — |
|
|
| (8,018 | ) |
| $ | 59.70 |
|
|
| 0 |
|
| $ | 0 |
|
|
| 0 |
|
| $ | 0 |
|
Conversion of restricted shares to restricted units |
|
| — |
|
|
| — |
|
|
| (1,284 | ) |
|
| — |
|
|
| 1,284 |
|
|
| — |
| ||||||||||||||||||||||||
Balance at December 31, 2015 |
|
| 5,734,365 |
|
| $ | 48.04 |
|
|
| 522,150 |
|
| $ | 63.67 |
|
|
| 888,725 |
|
| $ | 63.91 |
| ||||||||||||||||||||||||
Balance at December 31, 2018 |
|
| 7,112,235 |
|
| $ | 52.35 |
|
|
| 299,425 |
|
| $ | 66.52 |
|
|
| 1,139,848 |
|
| $ | 71.07 |
| ||||||||||||||||||||||||
Awards granted (1) (5) |
|
| 154,016 |
|
| $ | 64.99 |
|
|
| 154,296 |
|
| $ | 75.19 |
|
|
| 289,273 |
|
| $ | 81.05 |
|
|
| 234,147 |
|
| $ | 72.10 |
|
|
| 163,799 |
|
| $ | 73.96 |
|
|
| 141,772 |
|
| $ | 67.22 |
|
Awards exercised/vested (2) (3) (4) |
|
| (815,044 | ) |
| $ | 38.01 |
|
|
| (217,805 | ) |
| $ | 57.75 |
|
|
| (374,217 | ) |
| $ | 52.73 |
|
|
| (1,745,050 | ) |
| $ | 44.72 |
|
|
| (151,321 | ) |
| $ | 75.41 |
|
|
| (422,784 | ) |
| $ | 70.77 |
|
Awards forfeited |
|
| (10,512 | ) |
| $ | 63.43 |
|
|
| (6,607 | ) |
| $ | 70.73 |
|
|
| (1,524 | ) |
| $ | 86.35 |
|
|
| (30,489 | ) |
| $ | 61.92 |
|
|
| (5,197 | ) |
| $ | 65.35 |
|
|
| (552 | ) |
| $ | 69.43 |
|
Awards expired |
|
| (710 | ) |
| $ | 68.40 |
|
|
| — |
|
|
| — |
|
|
| — |
|
|
| — |
|
|
| (3,299 | ) |
| $ | 40.39 |
|
|
| 0 |
|
| $ | 0 |
|
|
| 0 |
|
| $ | 0 |
|
Special dividend adjustment (6) |
|
| 960,986 |
|
| N/A |
|
|
| — |
|
|
| — |
|
|
| — |
|
|
| — |
| |||||||||||||||||||||||||
Balance at December 31, 2016 |
|
| 6,023,101 |
|
| $ | 42.05 |
|
|
| 452,034 |
|
| $ | 70.35 |
|
|
| 802,257 |
|
| $ | 75.26 |
| ||||||||||||||||||||||||
Balance at December 31, 2019 |
|
| 5,567,544 |
|
| $ | 55.52 |
|
|
| 306,706 |
|
| $ | 66.15 |
|
|
| 858,284 |
|
| $ | 64.95 |
| ||||||||||||||||||||||||
Awards granted (1) (5) |
|
| 1,337,898 |
|
| $ | 60.88 |
|
|
| 93,867 |
|
| $ | 61.94 |
|
|
| 291,921 |
|
| $ | 68.57 |
|
|
| 317,731 |
|
| $ | 76.26 |
|
|
| 179,911 |
|
| $ | 77.44 |
|
|
| 249,263 |
|
| $ | 72.00 |
|
Awards exercised/vested (2) (3) (4) |
|
| (846,137 | ) |
| $ | 37.26 |
|
|
| (165,744 | ) |
| $ | 58.04 |
|
|
| (192,644 | ) |
| $ | 54.16 |
|
|
| (239,695 | ) |
| $ | 50.31 |
|
|
| (131,792 | ) |
| $ | 66.32 |
|
|
| (227,747 | ) |
| $ | 68.47 |
|
Awards forfeited |
|
| (27,547 | ) |
| $ | 61.85 |
|
|
| (10,416 | ) |
| $ | 72.44 |
|
|
| (274 | ) |
| $ | 75.50 |
|
|
| (1,344 | ) |
| $ | 72.69 |
|
|
| (1,191 | ) |
| $ | 73.45 |
|
|
| 0 |
|
| $ | 0 |
|
Awards expired |
|
| (3,483 | ) |
| $ | 65.91 |
|
|
| — |
|
|
| — |
|
|
| — |
|
|
| — |
|
|
| (1,484 | ) |
| $ | 47.18 |
|
|
| 0 |
|
| $ | 0 |
|
|
| 0 |
|
| $ | 0 |
|
Balance at December 31, 2017 |
|
| 6,483,832 |
|
| $ | 46.46 |
|
|
| 369,741 |
|
| $ | 73.67 |
|
|
| 901,260 |
|
| $ | 77.61 |
| ||||||||||||||||||||||||
Balance at December 31, 2020 |
|
| 5,642,752 |
|
| $ | 56.91 |
|
|
| 353,634 |
|
| $ | 71.81 |
|
|
| 879,800 |
|
| $ | 66.78 |
| ||||||||||||||||||||||||
(1) |
| The weighted average grant date fair value for Options granted during the years ended December 31, |
(2) |
| The aggregate intrinsic value of |
(3) |
| The fair value of restricted shares vested during the years ended December 31, |
(4) |
| The fair value of restricted units vested during the years ended December 31, |
(5) | Includes LTI plan awards granted under the executive compensation program. |
F-56
|
The following table summarizes information regarding optionsOptions outstanding and exercisable at December 31, 20172020 (aggregate intrinsic value is in thousands):
|
| Options |
|
| Weighted Average Remaining Contractual Life in Years |
|
| Weighted Average Exercise Price |
|
| Aggregate Intrinsic Value (1) |
|
| Options |
|
| Weighted Average Remaining Contractual Life in Years |
|
| Weighted Average Exercise Price |
|
| Aggregate Intrinsic Value (1) |
| ||||||||
Options Outstanding |
|
| 6,483,832 |
|
|
| 4.96 |
|
| $ | 46.06 |
|
| $ | 113,379 |
|
|
| 5,642,752 |
|
|
| 4.64 |
|
| $ | 56.91 |
|
| $ | 26,881 |
|
Options Exercisable |
|
| 5,336,043 |
|
|
| 4.10 |
|
| $ | 43.24 |
|
| $ | 110,332 |
|
|
| 4,985,668 |
|
|
| 4.16 |
|
| $ | 55.12 |
|
| $ | 26,804 |
|
Vested and expected to vest |
|
| 6,413,817 |
|
|
| 2.80 |
|
| $ | 34.39 |
|
| $ | 113,201 |
|
|
| 648,552 |
|
|
| 8.32 |
|
| $ | 70.40 |
|
| $ | 77 |
|
F-52
(1) |
| The aggregate intrinsic values were calculated as the excess, if any, between the Company’s closing share price of |
As of December 31, 20162019 and 2015, 5,610,6772018, 4,750,481 Options (with a weighted average exercise price of $40.91)$54.13) and 4,436,9905,328,020 Options (with a weighted average exercise price of $45.11)$49.57) were exercisable, respectively.
13. | Employee Plans |
The Company established an Employee Share Purchase Plan to provide each employee and trustee the ability to annually acquire up to $100,000 of Common Shares of EQR. The Company registered 7,000,000 Common Shares under the ESPP, of which 2,837,8772,624,136 Common Shares remained available for purchase at December 31, 2017.2020. The Common Shares may be purchased quarterly at a price equal to 85% of the lesser of: (a) the closing price for a share on the last day of such quarter; and (b) the greater of: (i) the closing price for a share on the first day of such quarter, and (ii) the average closing price for a share for all the business days in the quarter. The following table summarizes information regarding the Common Shares issued under the ESPP (thewith the net proceeds noted below werebeing contributed to ERPOP in exchange for OP Units)Units (amounts in thousands except share and per share amounts):
|
| Year Ended December 31, |
| |||||||||||||||||||||
|
| 2017 |
|
| 2016 |
|
| 2015 |
|
| Year Ended December 31, |
| ||||||||||||
|
| (Amounts in thousands except share and per share amounts) |
|
| 2020 |
|
| 2019 |
|
| 2018 |
| ||||||||||||
Shares issued |
|
| 68,286 |
|
|
| 63,909 |
|
|
| 68,462 |
|
|
| 90,196 |
|
|
| 48,131 |
|
|
| 75,414 |
|
Issuance price ranges |
| $52.79 – $58.06 |
|
| $51.85 – $63.37 |
|
| $63.70 – $65.90 |
|
| $46.23 – $63.84 |
|
| $59.56 – $72.91 |
|
| $47.80 – $57.09 |
| ||||||
Issuance proceeds |
| $3,744 |
|
| $3,686 |
|
| $4,404 |
|
| $4,508 |
|
| $3,116 |
|
| $3,879 |
| ||||||
The Company established a defined contribution plan (the “401(k) Plan”) to provide retirement benefits for employees that meet minimum employment criteria. The Company matches dollar for dollar up to the first 4% of eligible compensation that a participant contributes to the 401(k) Plan for all employees except those defined as highly compensated employees, whose match is 3%. Participants are vested in the Company’s contributions over five years. The Company recognized an expense in the amount of $4.6$5.2 million, $4.9$5.0 million and $5.5$4.9 million for the years ended December 31, 2017, 20162020, 2019 and 2015,2018, respectively.
The Company established the SERP to provide certain officers and trustees an opportunity to defer a portion of their eligible compensation in order to save for retirement. The SERP is restricted to investments in Common Shares, certain marketable securities that have been specifically approved and cash equivalents. The deferred compensation liability represented in the SERP and the securities issued to fund such deferred compensation liability are consolidated by the Company and carried on the Company’s balance sheets, and the Company’s Common Shares held in the SERP are accounted for as a reduction to paid in capital (included in general partner’s capital in the Operating Partnership’s financial statements).
14. | Distribution Reinvestment Plan |
On September 30, 2014, the Company filed with the SEC a Form S-3 Registration Statement to register 4,790,000 Common Shares pursuant to a Distribution Reinvestment Plan (the “2014 DRIP”), which included the remaining shares available for issuance under a previous registration. The registration was automatically declared effective the same day and will expire when all 4,790,000 shares have been issued. The Company has 4,691,2984,650,334 Common Shares available for issuance under the 2014 DRIP at December 31, 2017.2020.
The 2014 DRIP provides holders of record and beneficial owners of Common Shares and Preferred Shares with a simple and convenient method of reinvesting cash dividends/distributions in additional Common Shares. Common Shares purchased
F-57
under the 2014 DRIP may, at the option of EQR, be directly issued by EQR or purchased by EQR’s transfer agent in the open market using participants’ funds. The net proceeds from any Common Share issuances are contributed to ERPOP in exchange for OP Units.
F-53
15. | Transactions with Related Parties |
The Company leases its corporate headquarters from an entity controlled byaffiliated with EQR’s Chairman of the Board of Trustees. The lease terminatesterm expires on January 31, 2022. AmountsNovember 30, 2032 and contains two five-year extension options. The amount incurred for such office space for the years ended December 31, 2017, 20162020, 2019 and 2015, respectively,2018 were approximately $2.8$2.1 million, $2.7$2.6 million and $2.6 million.$2.5 million, respectively. The Company believes these amounts equalapproximate market rates for such rental space.
16. | Commitments and Contingencies |
The Company, as an owner of real estate, is subject to various Federal, state and local laws, including, but not limited to, rent regulations and environmental laws. Compliance by the Company with existing laws has not had a material adverse effect on the Company. However, the Company cannot predict the impact of new or changed laws or regulations, whether related to COVID-19 or otherwise, on its current properties or on properties that it may acquire in the future. As of December 31, 2017, the Company does have environmental reserves totaling approximately $2.8 million related to two of its properties.
The Company has established a reserve related to various litigation matters associated with its Massachusetts properties and periodically assesses the adequacy of the reserve and makes adjustments as necessary. As of December 31, 2017, the reserve totaled approximately $0.9 million. While no assurances can be given, the Company does not believe that the ultimate resolution of any of these remaining litigation matters, if adversely determined, would have a material adverse effect on the Company.
The Company does not believe there is any litigation pending or threatened against it that, individually or in the aggregate, may reasonably be expected to have a material adverse effect on the Company.
As of December 31, 2017,2020, the Company has four2 wholly owned projects and 1 partially owned project totaling 892824 apartment units in various stages of development with remaining commitments to fund of approximately $136.1$191.7 million (inclusive of applicable construction mortgage and joint venture partner obligations) and estimated completion dates ranging through September 30, 2021. The Company completed and stabilized 2 projects during the year ended December 31, 2019, as well as other completed development projects that are in various stages of lease-up or are stabilized.2020.
As of December 31, 2017,2020, the Company has two unconsolidated operating properties (Nexus Sawgrass and Domain) that are owned with the same third party2 joint venture partner.agreements with third-party partners for the consolidated development of multifamily rental properties, one of which is currently under construction as noted above. The development commitment to fund the project under construction is included in the development funding totals above for the one joint venture project where construction has started. The joint venture agreements with thiseach partner are primarily deal-specific regarding profit-sharing, equity contributions, returns on investment,include a buy-sell agreements and other customary provisions. The buy-sell arrangements contain provisionsprovision that provideprovides the right, but not the obligation, for the Company to acquire theeach respective partner’s interests or sell its interests at any time following the occurrence of certain pre-defined events described in the joint venture agreements. See Note 6 for furtheradditional discussion.
During the years ended December 31, 2017, 2016 and 2015, total operating lease expense for ground leases and office space, including a portion of real estate taxes, insurance, repairs and utilities, aggregated $26.6 million, $26.2 million and $24.5 million, respectively.
The Company has entered into a retirement benefits agreement with its Chairman of the Board of Trustees and deferred compensation agreements with its Vice Chairman and oneother former chief executive officer.officers. During the years ended December 31, 2017, 20162020, 2019 and 2015,2018, the Company recognized compensation expense of $0.5 million, $0.4 million $0.3 million and $0.4$0.3 million, respectively, related to these agreements.
The following table summarizes the Company’s contractual obligations for minimum rent payments under operating leases and deferred compensation for the next five years and thereafter as of December 31, 2017:2020:
(Payments)/Receipts Due by Year (in thousands) |
| |||||||||||||||||||||||||||
|
| 2018 |
|
| 2019 |
|
| 2020 |
|
| 2021 |
|
| 2022 |
|
| Thereafter |
|
| Total |
| |||||||
Operating Leases: |
|
|
|
|
|
|
|
|
|
|
|
|
|
|
|
|
|
|
|
|
|
|
|
|
|
|
|
|
Minimum Rent Payments (a) |
| $ | (16,506 | ) |
| $ | (16,366 | ) |
| $ | (15,963 | ) |
| $ | (15,743 | ) |
| $ | (13,406 | ) |
| $ | (878,935 | ) |
| $ | (956,919 | ) |
Minimum Rent Receipts (b) |
| $ | 67,318 |
|
| $ | 61,704 |
|
| $ | 57,913 |
|
| $ | 53,851 |
|
| $ | 49,951 |
|
| $ | 206,151 |
|
| $ | 496,888 |
|
Other Long-Term Liabilities: |
|
|
|
|
|
|
|
|
|
|
|
|
|
|
|
|
|
|
|
|
|
|
|
|
|
|
|
|
Deferred Compensation (c) |
| $ | (1,390 | ) |
| $ | (1,135 | ) |
| $ | (1,086 | ) |
| $ | (1,086 | ) |
| $ | (1,086 | ) |
| $ | (4,016 | ) |
| $ | (9,799 | ) |
(Payments)/Receipts Due by Year (in thousands) |
| |||||||||||||||||||||||||||
|
| 2021 |
|
| 2022 |
|
| 2023 |
|
| 2024 |
|
| 2025 |
|
| Thereafter |
|
| Total |
| |||||||
Other Long-Term Liabilities: |
|
|
|
|
|
|
|
|
|
|
|
|
|
|
|
|
|
|
|
|
|
|
|
|
|
|
|
|
Deferred Compensation (1) |
| $ | (769 | ) |
| $ | (1,130 | ) |
| $ | (1,005 | ) |
| $ | (723 | ) |
| $ | (723 | ) |
| $ | (3,976 | ) |
| $ | (8,326 | ) |
F-58
|
|
|
|
| Estimated payments to the Company’s Chairman |
17. | Reportable Segments |
Operating segments are defined as components of an enterprise that engage in business activities from which they may earn revenues and incur expenses and about which discrete financial information is available that is evaluated regularly by the chief operating decision maker. The chief operating decision maker decides how resources are allocated and assesses performance on a recurring basis at least quarterly.
The Company’s primary business is the acquisition, development and management of multifamily residential properties, which includes the generation of rental and other related income through the leasing of apartment units to residents. The chief operating decision maker evaluates the Company’s operating performance geographically by market and both on a same store and non-same store basis. While the Company does maintain a non-residential presence, it accounts for approximately 2.7% of total revenues and is designed as an amenity for our residential residents. The chief operating decision maker evaluates the performance of each property on a consolidated residential and non-residential basis. The Company’s geographic consolidated same store operating segments located in its coastal gateway markets represent its reportable segments. The Company’s operating segments located in its other markets (Phoenix) that are not material have also been included in the tables presented below.
The Company’s fee and asset management and development activities are other business activities that do not constitute an operating segment and as such, have been aggregated in the “Other” category in the tables presented below.
F-54
All revenues are from external customers and there is no0 customer who contributed 10% or more of the Company’s total revenues during the three years ended December 31, 2017, 2016 or 2015.2020, 2019 and 2018, respectively.
The primary financial measure for the Company’s rental real estate segment is net operating income (“NOI”), which represents rental income less: 1) property and maintenance expense and 2) real estate taxes and insurance expense (all as reflected in the accompanying consolidated statements of operations and comprehensive income). The Company believes that NOI is helpful to investors as a supplemental measure of its operating performance because it is a direct measure of the actual operating results of the Company’s apartment properties. Revenues for all leases are reflected on a straight-line basis in accordance with GAAP for the current and comparable periods.
The following table presents a reconciliation of NOI from our rental real estate specific to continuing operations for the years ended December 31, 2017, 20162020, 2019 and 2015,2018, respectively (amounts in thousands):
|
| Year Ended December 31, |
|
| Year Ended December 31, |
| ||||||||||||||||||
|
| 2017 |
|
| 2016 |
|
| 2015 |
|
| 2020 |
|
| 2019 |
|
| 2018 |
| ||||||
Rental income |
| $ | 2,470,689 |
|
| $ | 2,422,233 |
|
| $ | 2,736,578 |
|
| $ | 2,571,705 |
|
| $ | 2,700,691 |
|
| $ | 2,577,681 |
|
Property and maintenance expense |
|
| (405,281 | ) |
|
| (406,823 | ) |
|
| (479,160 | ) |
|
| (440,998 | ) |
|
| (446,845 | ) |
|
| (429,335 | ) |
Real estate taxes and insurance expense |
|
| (335,495 | ) |
|
| (317,387 | ) |
|
| (339,802 | ) |
|
| (381,562 | ) |
|
| (366,139 | ) |
|
| (357,814 | ) |
Total operating expenses |
|
| (740,776 | ) |
|
| (724,210 | ) |
|
| (818,962 | ) |
|
| (822,560 | ) |
|
| (812,984 | ) |
|
| (787,149 | ) |
Net operating income |
| $ | 1,729,913 |
|
| $ | 1,698,023 |
|
| $ | 1,917,616 |
|
| $ | 1,749,145 |
|
| $ | 1,887,707 |
|
| $ | 1,790,532 |
|
F-59
The following tables present NOI for each segment from our rental real estate specific to continuing operations for the years ended December 31, 2017, 20162020, 2019 and 2015,2018, respectively, as well as total assets and capital expenditures at December 31, 20172020 and 2016,2019, respectively (amounts in thousands):
|
| Year Ended December 31, 2017 |
|
| Year Ended December 31, 2016 |
|
| Year Ended December 31, 2015 |
|
| Year Ended December 31, 2020 |
|
| Year Ended December 31, 2019 |
|
| Year Ended December 31, 2018 |
| ||||||||||||||||||||||||||||||||||||||||||||||||||||||
|
| Rental Income |
|
| Operating Expenses |
|
| NOI |
|
| Rental Income |
|
| Operating Expenses |
|
| NOI |
|
| Rental Income |
|
| Operating Expenses |
|
| NOI |
|
| Rental Income |
|
| Operating Expenses |
|
| NOI |
|
| Rental Income |
|
| Operating Expenses |
|
| NOI |
|
| Rental Income |
|
| Operating Expenses |
|
| NOI |
| ||||||||||||||||||
Same store (1) |
|
|
|
|
|
|
|
|
|
|
|
|
|
|
|
|
|
|
|
|
|
|
|
|
|
|
|
|
|
|
|
|
|
|
|
|
|
|
|
|
|
|
|
|
|
|
|
|
|
|
|
|
|
|
|
|
|
|
|
|
|
|
|
|
|
|
|
|
|
|
|
|
Los Angeles |
| $ | 396,375 |
|
| $ | 111,854 |
|
| $ | 284,521 |
|
| $ | 382,425 |
|
| $ | 111,055 |
|
| $ | 271,370 |
|
| $ | 349,285 |
|
| $ | 104,614 |
|
| $ | 244,671 |
|
| $ | 468,450 |
|
| $ | 145,342 |
|
| $ | 323,108 |
|
| $ | 485,084 |
|
| $ | 144,314 |
|
| $ | 340,770 |
|
| $ | 451,592 |
|
| $ | 129,455 |
|
| $ | 322,137 |
|
Orange County |
|
| 88,527 |
|
|
| 21,544 |
|
|
| 66,983 |
|
|
| 84,590 |
|
|
| 20,600 |
|
|
| 63,990 |
|
|
| 75,068 |
|
|
| 18,550 |
|
|
| 56,518 |
|
|
| 105,236 |
|
|
| 24,545 |
|
|
| 80,691 |
|
|
| 105,087 |
|
|
| 24,359 |
|
|
| 80,728 |
|
|
| 101,198 |
|
|
| 24,468 |
|
|
| 76,730 |
|
San Diego |
|
| 88,507 |
|
|
| 23,073 |
|
|
| 65,434 |
|
|
| 84,646 |
|
|
| 22,366 |
|
|
| 62,280 |
|
|
| 83,491 |
|
|
| 22,938 |
|
|
| 60,553 |
|
|
| 74,737 |
|
|
| 18,176 |
|
|
| 56,561 |
|
|
| 73,698 |
|
|
| 17,889 |
|
|
| 55,809 |
|
|
| 91,971 |
|
|
| 24,024 |
|
|
| 67,947 |
|
Subtotal - Southern California |
|
| 573,409 |
|
|
| 156,471 |
|
|
| 416,938 |
|
|
| 551,661 |
|
|
| 154,021 |
|
|
| 397,640 |
|
|
| 507,844 |
|
|
| 146,102 |
|
|
| 361,742 |
|
|
| 648,423 |
|
|
| 188,063 |
|
|
| 460,360 |
|
|
| 663,869 |
|
|
| 186,562 |
|
|
| 477,307 |
|
|
| 644,761 |
|
|
| 177,947 |
|
|
| 466,814 |
|
|
|
|
|
|
|
|
|
|
|
|
|
|
|
|
|
|
|
|
|
|
|
|
|
|
|
|
|
|
|
|
|
|
|
|
|
|
|
|
|
|
|
|
|
|
|
|
|
|
|
|
|
|
|
|
|
|
|
|
|
|
|
|
|
|
|
|
|
|
|
|
|
|
San Francisco |
|
| 451,724 |
|
|
| 119,183 |
|
|
| 332,541 |
|
|
| 473,102 |
|
|
| 115,702 |
|
|
| 357,400 |
|
|
| 463,492 |
|
|
| 112,331 |
|
|
| 351,161 |
| ||||||||||||||||||||||||||||||||||||
Washington D.C. |
|
| 430,056 |
|
|
| 129,717 |
|
|
| 300,339 |
|
|
| 424,350 |
|
|
| 126,154 |
|
|
| 298,196 |
|
|
| 417,985 |
|
|
| 123,450 |
|
|
| 294,535 |
|
|
| 389,533 |
|
|
| 120,533 |
|
|
| 269,000 |
|
|
| 394,171 |
|
|
| 119,419 |
|
|
| 274,752 |
|
|
| 403,761 |
|
|
| 123,345 |
|
|
| 280,416 |
|
New York |
|
| 457,100 |
|
|
| 165,173 |
|
|
| 291,927 |
|
|
| 456,664 |
|
|
| 159,302 |
|
|
| 297,362 |
|
|
| 450,460 |
|
|
| 152,682 |
|
|
| 297,778 |
|
|
| 426,016 |
|
|
| 198,228 |
|
|
| 227,788 |
|
|
| 464,270 |
|
|
| 191,514 |
|
|
| 272,756 |
|
|
| 444,112 |
|
|
| 178,055 |
|
|
| 266,057 |
|
San Francisco |
|
| 378,939 |
|
|
| 91,777 |
|
|
| 287,162 |
|
|
| 371,633 |
|
|
| 90,393 |
|
|
| 281,240 |
|
|
| 343,089 |
|
|
| 84,603 |
|
|
| 258,486 |
| ||||||||||||||||||||||||||||||||||||
Seattle |
|
| 245,559 |
|
|
| 71,003 |
|
|
| 174,556 |
|
|
| 252,311 |
|
|
| 68,717 |
|
|
| 183,594 |
|
|
| 200,222 |
|
|
| 55,871 |
|
|
| 144,351 |
| ||||||||||||||||||||||||||||||||||||
Boston |
|
| 228,724 |
|
|
| 63,148 |
|
|
| 165,576 |
|
|
| 225,014 |
|
|
| 62,650 |
|
|
| 162,364 |
|
|
| 232,462 |
|
|
| 67,252 |
|
|
| 165,210 |
|
|
| 240,158 |
|
|
| 71,611 |
|
|
| 168,547 |
|
|
| 253,297 |
|
|
| 70,875 |
|
|
| 182,422 |
|
|
| 218,778 |
|
|
| 60,409 |
|
|
| 158,369 |
|
Seattle |
|
| 178,497 |
|
|
| 49,383 |
|
|
| 129,114 |
|
|
| 168,975 |
|
|
| 46,255 |
|
|
| 122,720 |
|
|
| 145,646 |
|
|
| 39,307 |
|
|
| 106,339 |
| ||||||||||||||||||||||||||||||||||||
Other Markets |
|
| 1,839 |
|
|
| 652 |
|
|
| 1,187 |
|
|
| 1,797 |
|
|
| 567 |
|
|
| 1,230 |
|
|
| 1,680 |
|
|
| 528 |
|
|
| 1,152 |
|
|
| 17,605 |
|
|
| 4,858 |
|
|
| 12,747 |
|
|
| 18,215 |
|
|
| 4,713 |
|
|
| 13,502 |
|
|
| 1,940 |
|
|
| 658 |
|
|
| 1,282 |
|
Total same store |
|
| 2,248,564 |
|
|
| 656,321 |
|
|
| 1,592,243 |
|
|
| 2,200,094 |
|
|
| 639,342 |
|
|
| 1,560,752 |
|
|
| 2,099,166 |
|
|
| 613,924 |
|
|
| 1,485,242 |
|
|
| 2,419,018 |
|
|
| 773,479 |
|
|
| 1,645,539 |
|
|
| 2,519,235 |
|
|
| 757,502 |
|
|
| 1,761,733 |
|
|
| 2,377,066 |
|
|
| 708,616 |
|
|
| 1,668,450 |
|
|
|
|
|
|
|
|
|
|
|
|
|
|
|
|
|
|
|
|
|
|
|
|
|
|
|
|
|
|
|
|
|
|
|
|
|
|
|
|
|
|
|
|
|
|
|
|
|
|
|
|
|
|
|
|
|
|
|
|
|
|
|
|
|
|
|
|
|
|
|
|
|
|
Non-same store/other (2) (3) |
|
|
|
|
|
|
|
|
|
|
|
|
|
|
|
|
|
|
|
|
|
|
|
|
|
|
|
|
|
|
|
|
|
|
|
|
|
|
|
|
|
|
|
|
|
|
|
|
|
|
|
|
|
|
|
|
|
|
|
|
|
|
|
|
|
|
|
|
|
|
|
|
Non-same store |
|
| 207,974 |
|
|
| 72,723 |
|
|
| 135,251 |
|
|
| 117,143 |
|
|
| 41,877 |
|
|
| 75,266 |
|
|
| 72,123 |
|
|
| 27,078 |
|
|
| 45,045 |
|
|
| 116,103 |
|
|
| 35,952 |
|
|
| 80,151 |
|
|
| 58,751 |
|
|
| 17,702 |
|
|
| 41,049 |
|
|
| 103,688 |
|
|
| 36,874 |
|
|
| 66,814 |
|
Other (3) |
|
| 14,151 |
|
|
| 11,732 |
|
|
| 2,419 |
|
|
| 104,996 |
|
|
| 42,991 |
|
|
| 62,005 |
|
|
| 565,289 |
|
|
| 177,960 |
|
|
| 387,329 |
|
|
| 36,584 |
|
|
| 13,129 |
|
|
| 23,455 |
|
|
| 122,705 |
|
|
| 37,780 |
|
|
| 84,925 |
|
|
| 96,927 |
|
|
| 41,659 |
|
|
| 55,268 |
|
Total non-same store/other |
|
| 222,125 |
|
|
| 84,455 |
|
|
| 137,670 |
|
|
| 222,139 |
|
|
| 84,868 |
|
|
| 137,271 |
|
|
| 637,412 |
|
|
| 205,038 |
|
|
| 432,374 |
|
|
| 152,687 |
|
|
| 49,081 |
|
|
| 103,606 |
|
|
| 181,456 |
|
|
| 55,482 |
|
|
| 125,974 |
|
|
| 200,615 |
|
|
| 78,533 |
|
|
| 122,082 |
|
|
|
|
|
|
|
|
|
|
|
|
|
|
|
|
|
|
|
|
|
|
|
|
|
|
|
|
|
|
|
|
|
|
|
|
|
|
|
|
|
|
|
|
|
|
|
|
|
|
|
|
|
|
|
|
|
|
|
|
|
|
|
|
|
|
|
|
|
|
|
|
|
|
Totals |
| $ | 2,470,689 |
|
| $ | 740,776 |
|
| $ | 1,729,913 |
|
| $ | 2,422,233 |
|
| $ | 724,210 |
|
| $ | 1,698,023 |
|
| $ | 2,736,578 |
|
| $ | 818,962 |
|
| $ | 1,917,616 |
|
| $ | 2,571,705 |
|
| $ | 822,560 |
|
| $ | 1,749,145 |
|
| $ | 2,700,691 |
|
| $ | 812,984 |
|
| $ | 1,887,707 |
|
| $ | 2,577,681 |
|
| $ | 787,149 |
|
| $ | 1,790,532 |
|
(1) | For the years ended December 31, |
(2) | For the years ended December 31, |
(3) | Other includes development, other corporate operations and operations prior to |
F-55
|
| Year Ended December 31, 2017 |
|
| Year Ended December 31, 2016 |
|
| Year Ended December 31, 2020 |
|
| Year Ended December 31, 2019 |
| ||||||||||||||||||||
|
| Total Assets |
|
| Capital Expenditures |
|
| Total Assets |
|
| Capital Expenditures |
|
| Total Assets |
|
| Capital Expenditures |
|
| Total Assets |
|
| Capital Expenditures |
| ||||||||
Same store (1) |
|
|
|
|
|
|
|
|
|
|
|
|
|
|
|
|
|
|
|
|
|
|
|
|
|
|
|
|
|
|
|
|
Los Angeles |
| $ | 2,601,569 |
|
| $ | 26,679 |
|
| $ | 2,678,787 |
|
| $ | 26,335 |
|
| $ | 3,007,621 |
|
| $ | 22,817 |
|
| $ | 3,110,659 |
|
| $ | 32,611 |
|
Orange County |
|
| 328,593 |
|
|
| 9,237 |
|
|
| 336,195 |
|
|
| 6,876 |
|
|
| 389,007 |
|
|
| 7,260 |
|
|
| 404,545 |
|
|
| 9,276 |
|
San Diego |
|
| 421,267 |
|
|
| 4,922 |
|
|
| 436,005 |
|
|
| 4,851 |
|
|
| 242,429 |
|
|
| 3,430 |
|
|
| 252,051 |
|
|
| 3,947 |
|
Subtotal - Southern California |
|
| 3,351,429 |
|
|
| 40,838 |
|
|
| 3,450,987 |
|
|
| 38,062 |
|
|
| 3,639,057 |
|
|
| 33,507 |
|
|
| 3,767,255 |
|
|
| 45,834 |
|
|
|
|
|
|
|
|
|
|
|
|
|
|
|
|
|
|
|
|
|
|
|
|
|
|
|
|
|
|
|
|
|
|
San Francisco |
|
| 3,233,901 |
|
|
| 18,983 |
|
|
| 3,345,882 |
|
|
| 25,925 |
| ||||||||||||||||
Washington D.C. |
|
| 3,803,185 |
|
|
| 35,423 |
|
|
| 3,916,264 |
|
|
| 33,867 |
|
|
| 3,066,702 |
|
|
| 23,626 |
|
|
| 3,174,721 |
|
|
| 22,409 |
|
New York |
|
| 4,123,841 |
|
|
| 32,209 |
|
|
| 4,256,087 |
|
|
| 25,171 |
|
|
| 3,950,286 |
|
|
| 25,609 |
|
|
| 4,004,078 |
|
|
| 26,976 |
|
San Francisco |
|
| 2,467,872 |
|
|
| 38,392 |
|
|
| 2,521,729 |
|
|
| 24,455 |
| ||||||||||||||||
Seattle |
|
| 1,802,952 |
|
|
| 11,372 |
|
|
| 1,871,232 |
|
|
| 22,023 |
| ||||||||||||||||
Boston |
|
| 1,653,997 |
|
|
| 28,696 |
|
|
| 1,702,675 |
|
|
| 18,396 |
|
|
| 1,758,665 |
|
|
| 18,367 |
|
|
| 1,822,373 |
|
|
| 27,267 |
|
Seattle |
|
| 1,165,031 |
|
|
| 21,479 |
|
|
| 1,191,591 |
|
|
| 14,019 |
| ||||||||||||||||
Other Markets |
|
| 12,768 |
|
|
| 103 |
|
|
| 12,902 |
|
|
| 67 |
| ||||||||||||||||
Denver |
|
| 247,133 |
|
|
| 817 |
|
|
| 255,974 |
|
|
| 701 |
| ||||||||||||||||
Total same store |
|
| 16,578,123 |
|
|
| 197,140 |
|
|
| 17,052,235 |
|
|
| 154,037 |
|
|
| 17,698,696 |
|
|
| 132,281 |
|
|
| 18,241,515 |
|
|
| 171,135 |
|
|
|
|
|
|
|
|
|
|
|
|
|
|
|
|
|
|
|
|
|
|
|
|
|
|
|
|
|
|
|
|
|
|
Non-same store/other (2) (3) |
|
|
|
|
|
|
|
|
|
|
|
|
|
|
|
|
|
|
|
|
|
|
|
|
|
|
|
|
|
|
|
|
Non-same store |
|
| 3,221,468 |
|
|
| 4,849 |
|
|
| 2,727,875 |
|
|
| 10,965 |
|
|
| 1,664,892 |
|
|
| 2,627 |
|
|
| 1,681,367 |
|
|
| 1,864 |
|
Other (3) |
|
| 771,008 |
|
|
| 618 |
|
|
| 924,038 |
|
|
| 7,175 |
|
|
| 923,303 |
|
|
| 1,071 |
|
|
| 1,249,887 |
|
|
| 5,424 |
|
Total non-same store/other |
|
| 3,992,476 |
|
|
| 5,467 |
|
|
| 3,651,913 |
|
|
| 18,140 |
|
|
| 2,588,195 |
|
|
| 3,698 |
|
|
| 2,931,254 |
|
|
| 7,288 |
|
|
|
|
|
|
|
|
|
|
|
|
|
|
|
|
|
|
|
|
|
|
|
|
|
|
|
|
|
|
|
|
|
|
Totals |
| $ | 20,570,599 |
|
| $ | 202,607 |
|
| $ | 20,704,148 |
|
| $ | 172,177 |
|
| $ | 20,286,891 |
|
| $ | 135,979 |
|
| $ | 21,172,769 |
|
| $ | 178,423 |
|
(1) | Same store primarily includes all properties acquired or completed that were stabilized prior to January 1, |
(2) | Non-same store primarily includes properties acquired after January 1, |
(3) | Other includes development, other corporate operations and capital expenditures for properties sold. |
F-60
Subsequent Events
Subsequent toThere have been no material subsequent events occurring since December 31, 2017, the Company:
Sold two partially owned properties consisting of 331 apartment units for $113.0 million;
Entered into $250.0 million of forward starting swaps to hedge changes in interest rates related to future secured or unsecured debt issuances;
Repaid $550.0 million of 6.08% mortgage debt prior to the March 1, 2020 maturity date, incurred a prepayment penalty of approximately $22.1 million and wrote-off unamortized deferred financing costs of approximately $0.4 million;
Repaid $43.4 million of 5.75% mortgage debt prior to the April 1, 2018 maturity date;
Issued $500.0 million of ten-year 3.50% unsecured notes, receiving net proceeds of approximately $497.0 million before underwriting fees, hedge termination costs and other expenses, at an all-in effective interest rate of 3.61%; and
Received approximately $1.6 million to settle two forward starting swaps in conjunction with the issuance of the $500.0 million unsecured notes discussed above.
Other
During the year ended December 31, 2014, the Operating Partnership issued the 3.00% Series P Cumulative Redeemable Preference Units with a liquidation value of approximately $18.4 million in conjunction with the buyout of its partner’s 95% interest in a previously unconsolidated development property. The Series P Preference Units were classified as a liability due in part to the fact that the holder could put the units back to the Operating Partnership for cash. Dividends were paid quarterly on the Series P Preference Units. During the year ended December 31, 2016, the Company purchased all of the issued and outstanding Series P Preference Units at a par value of $18.4 million and retired these units in conjunction with the purchase. In conjunction with this transaction, the Company reduced other liabilities by $18.4 million.
During the year ended December 31, 2016, the Company sold its entire interest in the management contracts and related rights associated with the military housing ventures at Joint Base Lewis McChord consisting of 5,161 apartment units for approximately $63.3 million and recognized a gain on sale of approximately $52.4 million, which is included in interest and other income in the accompanying consolidated statements of operations and comprehensive income.
|
|
Equity Residential
The following unaudited quarterly data has been prepared on the basis of a December 31 year-end. Amounts are in thousands, except for per share amounts.
|
| First Quarter |
|
| Second Quarter |
|
| Third Quarter |
|
| Fourth Quarter |
| ||||
2017 |
| 3/31 |
|
| 6/30 |
|
| 9/30 |
|
| 12/31 |
| ||||
Total revenues |
| $ | 604,100 |
|
| $ | 612,480 |
|
| $ | 624,122 |
|
| $ | 630,704 |
|
Operating income |
|
| 204,371 |
|
|
| 210,550 |
|
|
| 217,786 |
|
|
| 214,764 |
|
Income from continuing operations |
|
| 149,941 |
|
|
| 204,160 |
|
|
| 144,196 |
|
|
| 130,084 |
|
Net income * |
|
| 149,941 |
|
|
| 204,160 |
|
|
| 144,196 |
|
|
| 130,084 |
|
Net income available to Common Shares |
|
| 142,969 |
|
|
| 195,268 |
|
|
| 137,457 |
|
|
| 124,669 |
|
Earnings per share – basic: |
|
|
|
|
|
|
|
|
|
|
|
|
|
|
|
|
Net income available to Common Shares |
| $ | 0.39 |
|
| $ | 0.53 |
|
| $ | 0.37 |
|
| $ | 0.34 |
|
Weighted average Common Shares outstanding |
|
| 366,605 |
|
|
| 366,820 |
|
|
| 366,996 |
|
|
| 367,442 |
|
Earnings per share – diluted: |
|
|
|
|
|
|
|
|
|
|
|
|
|
|
|
|
Net income available to Common Shares |
| $ | 0.39 |
|
| $ | 0.53 |
|
| $ | 0.37 |
|
| $ | 0.34 |
|
Weighted average Common Shares outstanding |
|
| 382,280 |
|
|
| 382,692 |
|
|
| 382,945 |
|
|
| 383,105 |
|
F-61
|
| First Quarter |
|
| Second Quarter |
|
| Third Quarter |
|
| Fourth Quarter |
| ||||||||||||
2016 |
| 3/31 |
|
| 6/30 |
|
| 9/30 |
|
| 12/31 |
| ||||||||||||
Total revenues |
| $ | 619,083 |
|
| $ | 595,154 |
|
| $ | 606,074 |
|
| $ | 605,489 |
| ||||||||
Operating income |
|
| 216,625 |
|
|
| 206,018 |
|
|
| 209,373 |
|
|
| 224,070 |
| ||||||||
Income from continuing operations |
|
| 3,731,988 |
|
|
| 228,365 |
|
|
| 217,246 |
|
|
| 301,987 |
| ||||||||
Discontinued operations, net |
|
| (157 | ) |
|
| 35 |
|
|
| 246 |
|
|
| 394 |
| ||||||||
Net income * |
|
| 3,731,831 |
|
|
| 228,400 |
|
|
| 217,492 |
|
|
| 302,381 |
| ||||||||
Net income available to Common Shares |
|
| 3,586,985 |
|
|
| 218,067 |
|
|
| 207,543 |
|
|
| 276,477 |
| ||||||||
Earnings per share – basic: |
|
|
|
|
|
|
|
|
|
|
|
|
|
|
|
| ||||||||
Net income available to Common Shares |
| $ | 9.84 |
|
| $ | 0.60 |
|
| $ | 0.57 |
|
| $ | 0.76 |
| ||||||||
Weighted average Common Shares outstanding |
|
| 364,592 |
|
|
| 365,047 |
|
|
| 365,109 |
|
|
| 365,256 |
| ||||||||
Earnings per share – diluted: |
|
|
|
|
|
|
|
|
|
|
|
|
|
|
|
| ||||||||
Net income available to Common Shares |
| $ | 9.76 |
|
| $ | 0.59 |
|
| $ | 0.56 |
|
| $ | 0.75 |
| ||||||||
Weighted average Common Shares outstanding |
|
| 382,243 |
|
|
| 382,065 |
|
|
| 382,373 |
|
|
| 381,860 |
| ||||||||
* The Company did not have any extraordinary items or cumulative effect of change in accounting principle during the years ended December 31, 2017 and 2016. Therefore, income before extraordinary items and cumulative effect of change in accounting principle is not shown as it was equal to the net income amounts disclosed above.
ERP Operating Limited Partnership
The following unaudited quarterly data has been prepared on the basis of a December 31 year-end. Amounts are in thousands, except for per Unit amounts.
|
| First Quarter |
|
| Second Quarter |
|
| Third Quarter |
|
| Fourth Quarter |
| ||||
2017 |
| 3/31 |
|
| 6/30 |
|
| 9/30 |
|
| 12/31 |
| ||||
Total revenues |
| $ | 604,100 |
|
| $ | 612,480 |
|
| $ | 624,122 |
|
| $ | 630,704 |
|
Operating income |
|
| 204,371 |
|
|
| 210,550 |
|
|
| 217,786 |
|
|
| 214,764 |
|
Income from continuing operations |
|
| 149,941 |
|
|
| 204,160 |
|
|
| 144,196 |
|
|
| 130,084 |
|
Net income * |
|
| 149,941 |
|
|
| 204,160 |
|
|
| 144,196 |
|
|
| 130,084 |
|
Net income available to Units |
|
| 148,380 |
|
|
| 202,622 |
|
|
| 142,623 |
|
|
| 129,342 |
|
Earnings per Unit – basic: |
|
|
|
|
|
|
|
|
|
|
|
|
|
|
|
|
Net income available to Units |
| $ | 0.39 |
|
| $ | 0.53 |
|
| $ | 0.37 |
|
| $ | 0.34 |
|
Weighted average Units outstanding |
|
| 379,504 |
|
|
| 379,733 |
|
|
| 379,906 |
|
|
| 380,325 |
|
Earnings per Unit – diluted: |
|
|
|
|
|
|
|
|
|
|
|
|
|
|
|
|
Net income available to Units |
| $ | 0.39 |
|
| $ | 0.53 |
|
| $ | 0.37 |
|
| $ | 0.34 |
|
Weighted average Units outstanding |
|
| 382,280 |
|
|
| 382,692 |
|
|
| 382,945 |
|
|
| 383,105 |
|
|
| First Quarter |
|
| Second Quarter |
|
| Third Quarter |
|
| Fourth Quarter |
| ||||||||||
2016 |
| 3/31 |
|
| 6/30 |
|
| 9/30 |
|
| 12/31 |
| ||||||||||
Total revenues |
| $ | 619,083 |
|
| $ | 595,154 |
|
| $ | 606,074 |
|
| $ | 605,489 |
| ||||||
Operating income |
|
| 216,625 |
|
|
| 206,018 |
|
|
| 209,373 |
|
|
| 224,070 |
| ||||||
Income from continuing operations |
|
| 3,731,988 |
|
|
| 228,365 |
|
|
| 217,246 |
|
|
| 301,987 |
| ||||||
Discontinued operations, net |
|
| (157 | ) |
|
| 35 |
|
|
| 246 |
|
|
| 394 |
| ||||||
Net income * |
|
| 3,731,831 |
|
|
| 228,400 |
|
|
| 217,492 |
|
|
| 302,381 |
| ||||||
Net income available to Units |
|
| 3,730,294 |
|
|
| 226,847 |
|
|
| 215,896 |
|
|
| 287,546 |
| ||||||
Earnings per Unit – basic: |
|
|
|
|
|
|
|
|
|
|
|
|
|
|
|
| ||||||
Net income available to Units |
| $ | 9.84 |
|
| $ | 0.60 |
|
| $ | 0.57 |
|
| $ | 0.76 |
| ||||||
Weighted average Units outstanding |
|
| 378,289 |
|
|
| 378,934 |
|
|
| 379,008 |
|
|
| 379,081 |
| ||||||
Earnings per Unit – diluted: |
|
|
|
|
|
|
|
|
|
|
|
|
|
|
|
| ||||||
Net income available to Units |
| $ | 9.76 |
|
| $ | 0.59 |
|
| $ | 0.56 |
|
| $ | 0.75 |
| ||||||
Weighted average Units outstanding |
|
| 382,243 |
|
|
| 382,065 |
|
|
| 382,373 |
|
|
| 381,860 |
| ||||||
* The Operating Partnership did not have any extraordinary items or cumulative effect of change in accounting principle during the years ended December 31, 2017 and 2016. Therefore, income before extraordinary items and cumulative effect of change in accounting principle is not shown as it was equal to the net income amounts disclosed above.2020.
F-62
F-56
ERP OPERATING LIMITED PARTNERSHIP
Schedule III - Real Estate and Accumulated Depreciation
Overall Summary
December 31, 20172020
|
| Properties (H) |
|
| Apartment Units (H) |
|
| Investment in Real Estate, Gross |
|
| Accumulated Depreciation |
|
| Investment in Real Estate, Net |
|
| Encumbrances (1) |
|
| Properties |
|
| Apartment Units |
|
| Investment in Real Estate, Gross |
|
| Accumulated Depreciation |
|
| Investment in Real Estate, Net |
|
| Encumbrances (1) |
| ||||||||||||
Wholly Owned Unencumbered |
|
| 215 |
|
|
| 55,954 |
|
| $ | 19,776,737,815 |
|
| $ | (4,363,244,353 | ) |
| $ | 15,413,493,462 |
|
| $ | — |
|
|
| 246 |
|
|
| 64,363 |
|
| $ | 22,528,561,227 |
|
| $ | (6,521,859,521 | ) |
| $ | 16,006,701,706 |
|
| $ | 0 |
|
Wholly Owned Encumbered |
|
| 71 |
|
|
| 18,497 |
|
|
| 5,600,381,309 |
|
|
| (1,440,591,113 | ) |
|
| 4,159,790,196 |
|
|
| 3,316,375,422 |
|
|
| 42 |
|
|
| 10,127 |
|
|
| 3,704,582,050 |
|
|
| (1,032,587,859 | ) |
|
| 2,671,994,191 |
|
|
| 2,088,144,904 |
|
Wholly Owned Properties |
|
| 286 |
|
|
| 74,451 |
|
|
| 25,377,119,124 |
|
|
| (5,803,835,466 | ) |
|
| 19,573,283,658 |
|
|
| 3,316,375,422 |
|
|
| 288 |
|
|
| 74,490 |
|
|
| 26,233,143,277 |
|
|
| (7,554,447,380 | ) |
|
| 18,678,695,897 |
|
|
| 2,088,144,904 |
|
Partially Owned Unencumbered |
|
| 9 |
|
|
| 1,527 |
|
|
| 289,986,862 |
|
|
| (108,651,639 | ) |
|
| 181,335,223 |
|
|
| — |
|
|
| 14 |
|
|
| 2,699 |
|
|
| 672,990,027 |
|
|
| (231,543,640 | ) |
|
| 441,446,387 |
|
|
| 0 |
|
Partially Owned Encumbered |
|
| 8 |
|
|
| 1,688 |
|
|
| 359,790,405 |
|
|
| (127,891,086 | ) |
|
| 231,899,319 |
|
|
| 302,346,576 |
|
|
| 2 |
|
|
| 700 |
|
|
| 297,191,796 |
|
|
| (73,666,183 | ) |
|
| 223,525,613 |
|
|
| 205,744,819 |
|
Partially Owned Properties |
|
| 17 |
|
|
| 3,215 |
|
|
| 649,777,267 |
|
|
| (236,542,725 | ) |
|
| 413,234,542 |
|
|
| 302,346,576 |
|
|
| 16 |
|
|
| 3,399 |
|
|
| 970,181,823 |
|
|
| (305,209,823 | ) |
|
| 664,972,000 |
|
|
| 205,744,819 |
|
Total Unencumbered Properties |
|
| 224 |
|
|
| 57,481 |
|
|
| 20,066,724,677 |
|
|
| (4,471,895,992 | ) |
|
| 15,594,828,685 |
|
|
| — |
|
|
| 260 |
|
|
| 67,062 |
|
|
| 23,201,551,254 |
|
|
| (6,753,403,161 | ) |
|
| 16,448,148,093 |
|
|
| 0 |
|
Total Encumbered Properties |
|
| 79 |
|
|
| 20,185 |
|
|
| 5,960,171,714 |
|
|
| (1,568,482,199 | ) |
|
| 4,391,689,515 |
|
|
| 3,618,721,998 |
|
|
| 44 |
|
|
| 10,827 |
|
|
| 4,001,773,846 |
|
|
| (1,106,254,042 | ) |
|
| 2,895,519,804 |
|
|
| 2,293,889,723 |
|
Total Consolidated Investment in Real Estate |
|
| 303 |
|
|
| 77,666 |
|
| $ | 26,026,896,391 |
|
| $ | (6,040,378,191 | ) |
| $ | 19,986,518,200 |
|
| $ | 3,618,721,998 |
|
|
| 304 |
|
|
| 77,889 |
|
| $ | 27,203,325,100 |
|
| $ | (7,859,657,203 | ) |
| $ | 19,343,667,897 |
|
| $ | 2,293,889,723 |
|
(1) | See attached Encumbrances Reconciliation. |
S-1
ERP OPERATING LIMITED PARTNERSHIP
Schedule III - Real Estate and Accumulated Depreciation
Encumbrances Reconciliation
December 31, 20172020
Portfolio/Entity Encumbrances |
| Number of Properties Encumbered by |
|
| See Properties With Note: |
| Amount |
|
| Number of Properties Encumbered by |
|
| See Properties With Note: |
| Amount |
| ||||
EQR-Wellfan 2008 LP (R) |
|
| 10 |
|
| I |
| $ | 549,547,007 |
| ||||||||||
Archstone Master Property Holdings LLC |
|
| 13 |
|
| J |
|
| 797,306,782 |
|
|
| 13 |
|
| H |
| $ | 798,691,865 |
|
Portfolio/Entity Encumbrances |
|
| 23 |
|
|
|
|
| 1,346,853,789 |
|
|
| 13 |
|
|
|
|
| 798,691,865 |
|
Individual Property Encumbrances |
|
|
|
|
|
|
|
| 2,271,868,209 |
|
|
|
|
|
|
|
|
| 1,495,197,858 |
|
Total Encumbrances per Financial Statements |
|
|
|
|
|
|
| $ | 3,618,721,998 |
|
|
|
|
|
|
|
| $ | 2,293,889,723 |
|
S-2
ERP OPERATING LIMITED PARTNERSHIP
Schedule III – Real Estate and Accumulated Depreciation
(Amounts in thousands)
The changes in total real estate for the years ended December 31, 2017, 20162020, 2019 and 20152018 are as follows:
|
| 2017 |
|
| 2016 |
|
| 2015 |
|
| 2020 |
|
| 2019 |
|
| 2018 |
| ||||||
Balance, beginning of year |
| $ | 25,386,425 |
|
| $ | 28,542,697 |
|
| $ | 27,675,383 |
|
| $ | 27,533,607 |
|
| $ | 26,511,022 |
|
| $ | 26,026,896 |
|
Acquisitions and development |
|
| 710,960 |
|
|
| 832,803 |
|
|
| 964,645 |
|
|
| 298,847 |
|
|
| 1,704,320 |
|
|
| 855,254 |
|
Improvements |
|
| 204,113 |
|
|
| 174,981 |
|
|
| 186,104 |
|
|
| 154,433 |
|
|
| 180,944 |
|
|
| 192,661 |
|
Dispositions and other |
|
| (274,602 | ) |
|
| (4,164,056 | ) |
|
| (283,435 | ) |
|
| (783,562 | ) |
|
| (862,679 | ) |
|
| (563,789 | ) |
Balance, end of year |
| $ | 26,026,896 |
|
| $ | 25,386,425 |
|
| $ | 28,542,697 |
|
| $ | 27,203,325 |
|
| $ | 27,533,607 |
|
| $ | 26,511,022 |
|
The changes in accumulated depreciation for the years ended December 31, 2017, 20162020, 2019 and 20152018 are as follows:
|
| 2017 |
|
| 2016 |
|
| 2015 |
| |||
Balance, beginning of year |
| $ | 5,360,389 |
|
| $ | 6,084,616 |
|
| $ | 5,432,805 |
|
Depreciation |
|
| 743,749 |
|
|
| 705,649 |
|
|
| 765,895 |
|
Dispositions and other |
|
| (63,760 | ) |
|
| (1,429,876 | ) |
|
| (114,084 | ) |
Balance, end of year (1) |
| $ | 6,040,378 |
|
| $ | 5,360,389 |
|
| $ | 6,084,616 |
|
|
|
|
| 2020 |
|
| 2019 |
|
| 2018 |
| |||
Balance, beginning of year |
| $ | 7,276,786 |
|
| $ | 6,696,281 |
|
| $ | 6,040,378 |
|
Depreciation |
|
| 820,832 |
|
|
| 831,083 |
|
|
| 785,725 |
|
Dispositions and other |
|
| (237,961 | ) |
|
| (250,578 | ) |
|
| (129,822 | ) |
Balance, end of year |
| $ | 7,859,657 |
|
| $ | 7,276,786 |
|
| $ | 6,696,281 |
|
S-3
ERP OPERATING LIMITED PARTNERSHIP
Schedule III - Real Estate and Accumulated Depreciation
December 31, 20172020
Description | Description |
|
| Initial Cost to Company |
|
| Cost Capitalized Subsequent to Acquisition (Improvements, net) (E) |
|
| Gross Amount Carried at Close of Period 12/31/17 |
|
|
|
| Description |
|
| Initial Cost to Company |
|
| Cost Capitalized Subsequent to Acquisition (Improvements, net) (E) |
|
| Gross Amount Carried at Close of Period 12/31/20 |
|
|
|
| ||||||||||||||||||||||||||||||||||||||||||||||||||||||||||||||||||||
Apartment Name |
| Location |
| Retail/ Commercial Space |
|
| Date of Construction |
| Apartment Units (H) |
|
| Land |
|
| Building & Fixtures |
|
| Building & Fixtures |
|
| Land |
|
| Building & Fixtures (A) |
|
| Total (B) |
|
| Accumulated Depreciation (C) |
|
| Investment in Real Estate, Net at 12/31/17 |
|
| Encumbrances |
|
| Location |
| Non-Residential Components |
|
| Date of Construction |
| Apartment Units |
|
| Land |
|
| Building & Fixtures |
|
| Building & Fixtures |
|
| Land |
|
| Building & Fixtures (A) |
|
| Total (B) |
|
| Accumulated Depreciation (C) |
|
| Investment in Real Estate, Net at 12/31/20 |
|
| Encumbrances |
| ||||||||||||||||||||||
Wholly Owned Unencumbered: |
|
|
|
|
|
|
|
|
|
|
|
|
|
|
|
|
|
|
|
|
|
|
|
|
|
|
|
|
|
|
|
|
|
|
|
|
|
|
|
|
|
|
|
|
|
|
|
|
|
|
|
|
|
|
|
|
|
|
|
|
|
|
|
|
|
|
|
|
|
|
|
|
|
|
|
|
|
|
|
|
|
|
|
|
|
|
|
|
|
|
|
|
|
|
|
|
100 K Street |
| Washington, D.C. |
|
| — |
|
| (F) |
|
| — |
|
| $ | 15,600,000 |
|
| $ | 30,003,159 |
|
| $ | — |
|
| $ | 15,600,000 |
|
| $ | 30,003,159 |
|
| $ | 45,603,159 |
|
| $ | — |
|
| $ | 45,603,159 |
|
| $ | — |
| ||||||||||||||||||||||||||||||||||||||||||||||||
100 K Apartments (fka 100K Street) |
| Washington, D.C. |
|
| — |
|
| 2018 |
|
| 222 |
|
| $ | 15,600,000 |
|
| $ | 70,296,069 |
|
| $ | 18,484 |
|
| $ | 15,600,000 |
|
| $ | 70,314,553 |
|
| $ | 85,914,553 |
|
| $ | (6,076,767 | ) |
| $ | 79,837,786 |
|
| $ | 0 |
| ||||||||||||||||||||||||||||||||||||||||||||||||
140 Riverside Boulevard |
| New York, NY |
| G |
|
| 2003 |
|
| 354 |
|
|
| 103,539,100 |
|
|
| 94,082,725 |
|
|
| 8,607,947 |
|
|
| 103,539,100 |
|
|
| 102,690,672 |
|
|
| 206,229,772 |
|
|
| (44,828,691 | ) |
|
| 161,401,081 |
|
|
| — |
|
| New York, NY |
| G |
|
| 2003 |
|
| 354 |
|
|
| 103,539,100 |
|
|
| 94,082,725 |
|
|
| 10,817,358 |
|
|
| 103,539,100 |
|
|
| 104,900,083 |
|
|
| 208,439,183 |
|
|
| (56,324,733 | ) |
|
| 152,114,450 |
|
|
| 0 |
| ||
160 Riverside Boulevard |
| New York, NY |
| G |
|
| 2001 |
|
| 455 |
|
|
| 139,933,500 |
|
|
| 190,964,745 |
|
|
| 14,965,349 |
|
|
| 139,933,500 |
|
|
| 205,930,094 |
|
|
| 345,863,594 |
|
|
| (89,280,987 | ) |
|
| 256,582,607 |
|
|
| — |
|
| New York, NY |
| G |
|
| 2001 |
|
| 455 |
|
|
| 139,933,500 |
|
|
| 190,964,745 |
|
|
| 18,135,193 |
|
|
| 139,933,500 |
|
|
| 209,099,938 |
|
|
| 349,033,438 |
|
|
| (112,149,211 | ) |
|
| 236,884,227 |
|
|
| 0 |
| ||
170 Amsterdam |
| New York, NY |
| G |
|
| 2015 |
|
| 236 |
|
|
| — |
|
|
| 112,081,768 |
|
|
| 135,722 |
|
|
| — |
|
|
| 112,217,490 |
|
|
| 112,217,490 |
|
|
| (11,505,275 | ) |
|
| 100,712,215 |
|
|
| — |
|
| New York, NY |
| G |
|
| 2015 |
|
| 236 |
|
|
| 0 |
|
|
| 112,096,955 |
|
|
| 734,040 |
|
|
| 0 |
|
|
| 112,830,995 |
|
|
| 112,830,995 |
|
|
| (25,078,672 | ) |
|
| 87,752,323 |
|
|
| 0 |
| ||
175 Kent |
| Brooklyn, NY |
| G |
|
| 2011 |
|
| 113 |
|
|
| 22,037,831 |
|
|
| 53,962,169 |
|
|
| 1,534,419 |
|
|
| 22,037,831 |
|
|
| 55,496,588 |
|
|
| 77,534,419 |
|
|
| (14,450,457 | ) |
|
| 63,083,962 |
|
|
| — |
|
| Brooklyn, NY |
| G |
|
| 2011 |
|
| 113 |
|
|
| 22,037,831 |
|
|
| 53,962,169 |
|
|
| 2,476,612 |
|
|
| 22,037,831 |
|
|
| 56,438,781 |
|
|
| 78,476,612 |
|
|
| (20,147,633 | ) |
|
| 58,328,979 |
|
|
| 0 |
| ||
180 Montague (fka Brooklyn Heights) |
| Brooklyn, NY |
| G |
|
| 2000 |
|
| 193 |
|
|
| 32,400,000 |
|
|
| 92,675,228 |
|
|
| 3,547,996 |
|
|
| 32,400,000 |
|
|
| 96,223,224 |
|
|
| 128,623,224 |
|
|
| (20,134,074 | ) |
|
| 108,489,150 |
|
|
| — |
|
| Brooklyn, NY |
| G |
|
| 2000 |
|
| 193 |
|
|
| 32,400,000 |
|
|
| 92,675,228 |
|
|
| 5,346,485 |
|
|
| 32,400,000 |
|
|
| 98,021,713 |
|
|
| 130,421,713 |
|
|
| (30,697,551 | ) |
|
| 99,724,162 |
|
|
| 0 |
| ||
180 Riverside Boulevard |
| New York, NY |
| G |
|
| 1998 |
|
| 516 |
|
|
| 144,968,250 |
|
|
| 138,346,681 |
|
|
| 12,874,009 |
|
|
| 144,968,250 |
|
|
| 151,220,690 |
|
|
| 296,188,940 |
|
|
| (67,181,115 | ) |
|
| 229,007,825 |
|
|
| — |
|
| New York, NY |
| G |
|
| 1998 |
|
| 516 |
|
|
| 144,968,250 |
|
|
| 138,346,681 |
|
|
| 16,593,445 |
|
|
| 144,968,250 |
|
|
| 154,940,126 |
|
|
| 299,908,376 |
|
|
| (83,930,689 | ) |
|
| 215,977,687 |
|
|
| 0 |
| ||
1111 Belle Pre (fka The Madison) |
| Alexandria, VA |
| G |
|
| 2014 |
|
| 360 |
|
|
| 18,937,702 |
|
|
| 94,759,478 |
|
|
| 148,954 |
|
|
| 18,937,702 |
|
|
| 94,908,432 |
|
|
| 113,846,134 |
|
|
| (17,565,898 | ) |
|
| 96,280,236 |
|
|
| — |
| |||||||||||||||||||||||||||||||||||||||||||||||||
1210 Mass |
| Washington, D.C. |
| G |
|
| 2004 |
|
| 144 |
|
|
| 9,213,513 |
|
|
| 36,559,189 |
|
|
| 2,403,479 |
|
|
| 9,213,513 |
|
|
| 38,962,668 |
|
|
| 48,176,181 |
|
|
| (16,940,349 | ) |
|
| 31,235,832 |
|
|
| — |
|
| Washington, D.C. |
| G |
|
| 2004 |
|
| 144 |
|
|
| 9,213,512 |
|
|
| 36,559,189 |
|
|
| 3,222,293 |
|
|
| 9,213,512 |
|
|
| 39,781,482 |
|
|
| 48,994,994 |
|
|
| (21,574,097 | ) |
|
| 27,420,897 |
|
|
| 0 |
| ||
1401 E. Madison |
| Seattle, WA |
| G |
|
| (F) |
|
| — |
|
|
| 10,401,958 |
|
|
| 7,932,051 |
|
|
| — |
|
|
| 10,401,958 |
|
|
| 7,932,051 |
|
|
| 18,334,009 |
|
|
| — |
|
|
| 18,334,009 |
|
|
| — |
| |||||||||||||||||||||||||||||||||||||||||||||||||
1401 Joyce on Pentagon Row |
| Arlington, VA |
|
| — |
|
| 2004 |
|
| 326 |
|
|
| 9,780,000 |
|
|
| 89,668,165 |
|
|
| 5,636,363 |
|
|
| 9,780,000 |
|
|
| 95,304,528 |
|
|
| 105,084,528 |
|
|
| (41,418,326 | ) |
|
| 63,666,202 |
|
|
| 0 |
| ||||||||||||||||||||||||||||||||||||||||||||||||
1500 Mass Ave |
| Washington, D.C. |
| G |
|
| 1951 |
|
| 556 |
|
|
| 54,638,298 |
|
|
| 40,361,702 |
|
|
| 14,859,237 |
|
|
| 54,638,298 |
|
|
| 55,220,939 |
|
|
| 109,859,237 |
|
|
| (24,493,269 | ) |
|
| 85,365,968 |
|
|
| — |
|
| Washington, D.C. |
| G |
|
| 1951 |
|
| 556 |
|
|
| 54,638,298 |
|
|
| 40,361,702 |
|
|
| 16,685,633 |
|
|
| 54,638,298 |
|
|
| 57,047,335 |
|
|
| 111,685,633 |
|
|
| (31,601,970 | ) |
|
| 80,083,663 |
|
|
| 0 |
| ||
1800 Oak (fka Rosslyn) |
| Arlington, VA |
| G |
|
| 2003 |
|
| 314 |
|
|
| 31,400,000 |
|
|
| 109,005,734 |
|
|
| 3,172,464 |
|
|
| 31,400,000 |
|
|
| 112,178,198 |
|
|
| 143,578,198 |
|
|
| (23,997,938 | ) |
|
| 119,580,260 |
|
|
| — |
|
| Arlington, VA |
| G |
|
| 2003 |
|
| 314 |
|
|
| 31,400,000 |
|
|
| 109,005,734 |
|
|
| 8,912,514 |
|
|
| 31,400,000 |
|
|
| 117,918,248 |
|
|
| 149,318,248 |
|
|
| (37,308,243 | ) |
|
| 112,010,005 |
|
|
| 0 |
| ||
2201 Pershing Drive |
| Arlington, VA |
| G |
|
| 2012 |
|
| 188 |
|
|
| 11,321,198 |
|
|
| 49,674,175 |
|
|
| 2,176,089 |
|
|
| 11,321,198 |
|
|
| 51,850,264 |
|
|
| 63,171,462 |
|
|
| (11,636,674 | ) |
|
| 51,534,788 |
|
|
| — |
|
| Arlington, VA |
| G |
|
| 2012 |
|
| 188 |
|
|
| 11,321,198 |
|
|
| 49,674,175 |
|
|
| 2,798,189 |
|
|
| 11,321,198 |
|
|
| 52,472,364 |
|
|
| 63,793,562 |
|
|
| (17,223,799 | ) |
|
| 46,569,763 |
|
|
| 0 |
| ||
2201 Wilson |
| Arlington, VA |
| G |
|
| 2000 |
|
| 219 |
|
|
| 21,900,000 |
|
|
| 78,724,663 |
|
|
| 3,493,731 |
|
|
| 21,900,000 |
|
|
| 82,218,394 |
|
|
| 104,118,394 |
|
|
| (17,067,795 | ) |
|
| 87,050,599 |
|
|
| — |
|
| Arlington, VA |
| G |
|
| 2000 |
|
| 219 |
|
|
| 21,900,000 |
|
|
| 78,724,663 |
|
|
| 5,288,939 |
|
|
| 21,900,000 |
|
|
| 84,013,602 |
|
|
| 105,913,602 |
|
|
| (26,463,239 | ) |
|
| 79,450,363 |
|
|
| 0 |
| ||
2400 M St |
| Washington, D.C. |
| G |
|
| 2006 |
|
| 359 |
|
|
| 30,006,593 |
|
|
| 114,013,785 |
|
|
| 4,296,314 |
|
|
| 30,006,593 |
|
|
| 118,310,099 |
|
|
| 148,316,692 |
|
|
| (49,487,043 | ) |
|
| 98,829,649 |
|
|
| — |
|
| Washington, D.C. |
| G |
|
| 2006 |
|
| 359 |
|
|
| 30,006,593 |
|
|
| 114,013,785 |
|
|
| 4,779,484 |
|
|
| 30,006,593 |
|
|
| 118,793,269 |
|
|
| 148,799,862 |
|
|
| (61,688,804 | ) |
|
| 87,111,058 |
|
|
| 0 |
| ||
249 Third Street (fka Kendall Square II) |
| Cambridge, MA |
| G |
|
| (F) |
|
| — |
|
|
| 4,603,326 |
|
|
| 4,330,982 |
|
|
| — |
|
|
| 4,603,326 |
|
|
| 4,330,982 |
|
|
| 8,934,308 |
|
|
| — |
|
|
| 8,934,308 |
|
|
| — |
| |||||||||||||||||||||||||||||||||||||||||||||||||
315 on A |
| Boston, MA |
| G |
|
| 2013 |
|
| 202 |
|
|
| 14,450,070 |
|
|
| 115,824,930 |
|
|
| 623,402 |
|
|
| 14,450,070 |
|
|
| 116,448,332 |
|
|
| 130,898,402 |
|
|
| (14,489,301 | ) |
|
| 116,409,101 |
|
|
| — |
|
| Boston, MA |
| G |
|
| 2013 |
|
| 202 |
|
|
| 14,450,070 |
|
|
| 115,824,930 |
|
|
| 1,442,998 |
|
|
| 14,450,070 |
|
|
| 117,267,928 |
|
|
| 131,717,998 |
|
|
| (27,148,732 | ) |
|
| 104,569,266 |
|
|
| 0 |
| ||
340 Fremont (fka Rincon Hill) |
| San Francisco, CA |
|
| — |
|
| 2016 |
|
| 348 |
|
|
| 42,000,000 |
|
|
| 247,606,631 |
|
|
| 4,551 |
|
|
| 42,000,000 |
|
|
| 247,611,182 |
|
|
| 289,611,182 |
|
|
| (14,159,585 | ) |
|
| 275,451,597 |
|
|
| — |
|
| San Francisco, CA |
|
| — |
|
| 2016 |
|
| 348 |
|
|
| 42,000,000 |
|
|
| 248,608,702 |
|
|
| 366,576 |
|
|
| 42,000,000 |
|
|
| 248,975,278 |
|
|
| 290,975,278 |
|
|
| (43,051,114 | ) |
|
| 247,924,164 |
|
|
| 0 |
|
341 Nevins |
| Brooklyn, NY |
|
| — |
|
| (F) |
|
| 0 |
|
|
| 3,621,717 |
|
|
| 261,079 |
|
|
| 0 |
|
|
| 3,621,717 |
|
|
| 261,079 |
|
|
| 3,882,796 |
|
|
| 0 |
|
|
| 3,882,796 |
|
|
| 0 |
| ||||||||||||||||||||||||||||||||||||||||||||||||
3003 Van Ness (fka Van Ness) |
| Washington, D.C. |
|
| — |
|
| 1970 |
|
| 625 |
|
|
| 56,300,000 |
|
|
| 141,191,580 |
|
|
| 5,117,966 |
|
|
| 56,300,000 |
|
|
| 146,309,546 |
|
|
| 202,609,546 |
|
|
| (33,088,622 | ) |
|
| 169,520,924 |
|
|
| — |
|
| Washington, D.C. |
|
| — |
|
| 1970 |
|
| 625 |
|
|
| 56,300,000 |
|
|
| 141,191,580 |
|
|
| 8,427,901 |
|
|
| 56,300,000 |
|
|
| 149,619,481 |
|
|
| 205,919,481 |
|
|
| (49,200,506 | ) |
|
| 156,718,975 |
|
|
| 0 |
|
45 Worthington (CityView II) |
| Boston, MA |
|
| — |
|
| (F) |
|
| — |
|
|
| — |
|
|
| 2,349,475 |
|
|
| — |
|
|
| — |
|
|
| 2,349,475 |
|
|
| 2,349,475 |
|
|
| — |
|
|
| 2,349,475 |
|
|
| — |
| ||||||||||||||||||||||||||||||||||||||||||||||||
420 East 80th Street |
| New York, NY |
|
| — |
|
| 1961 |
|
| 155 |
|
|
| 39,277,000 |
|
|
| 23,026,984 |
|
|
| 4,675,293 |
|
|
| 39,277,000 |
|
|
| 27,702,277 |
|
|
| 66,979,277 |
|
|
| (13,594,720 | ) |
|
| 53,384,557 |
|
|
| — |
| ||||||||||||||||||||||||||||||||||||||||||||||||
425 Mass |
| Washington, D.C. |
| G |
|
| 2009 |
|
| 559 |
|
|
| 28,150,000 |
|
|
| 138,600,000 |
|
|
| 3,974,856 |
|
|
| 28,150,000 |
|
|
| 142,574,856 |
|
|
| 170,724,856 |
|
|
| (44,144,101 | ) |
|
| 126,580,755 |
|
|
| — |
|
| Washington, D.C. |
| G |
|
| 2009 |
|
| 559 |
|
|
| 28,150,000 |
|
|
| 138,600,000 |
|
|
| 5,317,169 |
|
|
| 28,150,000 |
|
|
| 143,917,169 |
|
|
| 172,067,169 |
|
|
| (58,212,092 | ) |
|
| 113,855,077 |
|
|
| 0 |
| ||
455 Eye Street |
| Washington, D.C. |
| G |
|
| 2017 |
|
| 174 |
|
|
| 11,941,407 |
|
|
| 61,030,786 |
|
|
| — |
|
|
| 11,941,407 |
|
|
| 61,030,786 |
|
|
| 72,972,193 |
|
|
| (1,082,263 | ) |
|
| 71,889,930 |
|
|
| — |
|
| Washington, D.C. |
| G |
|
| 2017 |
|
| 174 |
|
|
| 11,941,407 |
|
|
| 61,418,689 |
|
|
| 59,540 |
|
|
| 11,941,407 |
|
|
| 61,478,229 |
|
|
| 73,419,636 |
|
|
| (8,480,027 | ) |
|
| 64,939,609 |
|
|
| 0 |
| ||
4701 Willard |
| Chevy Chase, MD |
| G |
|
| 1966 |
|
| 517 |
|
|
| 76,921,130 |
|
|
| 153,947,682 |
|
|
| 29,902,775 |
|
|
| 76,921,130 |
|
|
| 183,850,457 |
|
|
| 260,771,587 |
|
|
| (50,471,131 | ) |
|
| 210,300,456 |
|
|
| — |
| |||||||||||||||||||||||||||||||||||||||||||||||||
4885 Edgemoor Lane |
| Bethesda, MD |
|
| — |
|
| (F) |
|
| — |
|
|
| — |
|
|
| 1,958,883 |
|
|
| — |
|
|
| — |
|
|
| 1,958,883 |
|
|
| 1,958,883 |
|
|
| — |
|
|
| 1,958,883 |
|
|
| — |
| ||||||||||||||||||||||||||||||||||||||||||||||||
4th and Hill |
| Los Angeles, CA |
|
| — |
|
| (F) |
|
| — |
|
|
| 13,131,456 |
|
|
| 13,790,436 |
|
|
| — |
|
|
| 13,131,456 |
|
|
| 13,790,436 |
|
|
| 26,921,892 |
|
|
| — |
|
|
| 26,921,892 |
|
|
| — |
|
| Los Angeles, CA |
|
| — |
|
| (F) |
|
| 0 |
|
|
| 13,131,456 |
|
|
| 18,548,300 |
|
|
| 0 |
|
|
| 13,131,456 |
|
|
| 18,548,300 |
|
|
| 31,679,756 |
|
|
| 0 |
|
|
| 31,679,756 |
|
|
| 0 |
|
55 West Fifth I & II (fka Townhouse Plaza and Gardens) |
| San Mateo, CA |
|
| — |
|
| 1964/1972 |
|
| 241 |
|
|
| 21,041,710 |
|
|
| 71,931,323 |
|
|
| 14,359,593 |
|
|
| 21,041,710 |
|
|
| 86,290,916 |
|
|
| 107,332,626 |
|
|
| (32,617,071 | ) |
|
| 74,715,555 |
|
|
| 0 |
| ||||||||||||||||||||||||||||||||||||||||||||||||
600 Washington |
| New York, NY |
| G |
|
| 2004 |
|
| 135 |
|
|
| 32,852,000 |
|
|
| 43,140,551 |
|
|
| 870,871 |
|
|
| 32,852,000 |
|
|
| 44,011,422 |
|
|
| 76,863,422 |
|
|
| (19,355,357 | ) |
|
| 57,508,065 |
|
|
| — |
|
| New York, NY |
| G |
|
| 2004 |
|
| 135 |
|
|
| 32,852,000 |
|
|
| 43,140,551 |
|
|
| 2,440,539 |
|
|
| 32,852,000 |
|
|
| 45,581,090 |
|
|
| 78,433,090 |
|
|
| (23,873,446 | ) |
|
| 54,559,644 |
|
|
| 0 |
| ||
660 Washington (fka Boston Common) |
| Boston, MA |
| G |
|
| 2006 |
|
| 420 |
|
|
| 106,100,000 |
|
|
| 166,311,679 |
|
|
| 2,888,133 |
|
|
| 106,100,000 |
|
|
| 169,199,812 |
|
|
| 275,299,812 |
|
|
| (35,392,580 | ) |
|
| 239,907,232 |
|
|
| — |
|
| Boston, MA |
| G |
|
| 2006 |
|
| 420 |
|
|
| 106,100,000 |
|
|
| 166,311,679 |
|
|
| 7,631,972 |
|
|
| 106,100,000 |
|
|
| 173,943,651 |
|
|
| 280,043,651 |
|
|
| (52,935,820 | ) |
|
| 227,107,831 |
|
|
| 0 |
| ||
70 Greene |
| Jersey City, NJ |
| G |
|
| 2010 |
|
| 480 |
|
|
| 28,108,899 |
|
|
| 236,763,553 |
|
|
| 1,657,070 |
|
|
| 28,108,899 |
|
|
| 238,420,623 |
|
|
| 266,529,522 |
|
|
| (65,784,128 | ) |
|
| 200,745,394 |
|
|
| — |
|
| Jersey City, NJ |
| G |
|
| 2010 |
|
| 480 |
|
|
| 28,108,899 |
|
|
| 236,763,553 |
|
|
| 3,894,770 |
|
|
| 28,108,899 |
|
|
| 240,658,323 |
|
|
| 268,767,222 |
|
|
| (90,074,628 | ) |
|
| 178,692,594 |
|
|
| 0 |
| ||
71 Broadway |
| New York, NY |
| G |
|
| 1997 |
|
| 238 |
|
|
| 22,611,600 |
|
|
| 77,492,171 |
|
|
| 14,064,394 |
|
|
| 22,611,600 |
|
|
| 91,556,565 |
|
|
| 114,168,165 |
|
|
| (43,472,173 | ) |
|
| 70,695,992 |
|
|
| — |
|
| New York, NY |
| G |
|
| 1997 |
|
| 238 |
|
|
| 22,611,600 |
|
|
| 77,492,171 |
|
|
| 18,570,618 |
|
|
| 22,611,600 |
|
|
| 96,062,789 |
|
|
| 118,674,389 |
|
|
| (55,283,708 | ) |
|
| 63,390,681 |
|
|
| 0 |
| ||
77 Bluxome |
| San Francisco, CA |
|
| — |
|
| 2007 |
|
| 102 |
|
|
| 5,249,124 |
|
|
| 18,609,876 |
|
|
| 402,201 |
|
|
| 5,249,124 |
|
|
| 19,012,077 |
|
|
| 24,261,201 |
|
|
| (5,178,232 | ) |
|
| 19,082,969 |
|
|
| — |
|
| San Francisco, CA |
|
| — |
|
| 2007 |
|
| 102 |
|
|
| 5,249,124 |
|
|
| 18,609,876 |
|
|
| 498,937 |
|
|
| 5,249,124 |
|
|
| 19,108,813 |
|
|
| 24,357,937 |
|
|
| (7,020,181 | ) |
|
| 17,337,756 |
|
|
| 0 |
|
77 Park Avenue (fka Hoboken) |
| Hoboken, NJ |
| G |
|
| 2000 |
|
| 301 |
|
|
| 27,900,000 |
|
|
| 168,992,440 |
|
|
| 6,060,186 |
|
|
| 27,900,000 |
|
|
| 175,052,626 |
|
|
| 202,952,626 |
|
|
| (35,032,130 | ) |
|
| 167,920,496 |
|
|
| — |
|
| Hoboken, NJ |
| G |
|
| 2000 |
|
| 301 |
|
|
| 27,900,000 |
|
|
| 168,992,440 |
|
|
| 8,837,952 |
|
|
| 27,900,000 |
|
|
| 177,830,392 |
|
|
| 205,730,392 |
|
|
| (54,327,929 | ) |
|
| 151,402,463 |
|
|
| 0 |
| ||
777 Sixth |
| New York, NY |
| G |
|
| 2002 |
|
| 294 |
|
|
| 65,352,706 |
|
|
| 65,747,294 |
|
|
| 3,136,354 |
|
|
| 65,352,706 |
|
|
| 68,883,648 |
|
|
| 134,236,354 |
|
|
| (26,152,102 | ) |
|
| 108,084,252 |
|
|
| — |
|
| New York, NY |
| G |
|
| 2002 |
|
| 294 |
|
|
| 65,352,706 |
|
|
| 65,747,294 |
|
|
| 5,748,406 |
|
|
| 65,352,706 |
|
|
| 71,495,700 |
|
|
| 136,848,406 |
|
|
| (33,061,181 | ) |
|
| 103,787,225 |
|
|
| 0 |
| ||
88 Hillside |
| Daly City, CA |
| G |
|
| 2011 |
|
| 95 |
|
|
| 7,786,800 |
|
|
| 31,587,325 |
|
|
| 2,479,165 |
|
|
| 7,786,800 |
|
|
| 34,066,490 |
|
|
| 41,853,290 |
|
|
| (8,687,690 | ) |
|
| 33,165,600 |
|
|
| — |
|
| Daly City, CA |
| G |
|
| 2011 |
|
| 95 |
|
|
| 7,786,800 |
|
|
| 31,587,325 |
|
|
| 3,442,015 |
|
|
| 7,786,800 |
|
|
| 35,029,340 |
|
|
| 42,816,140 |
|
|
| (12,829,331 | ) |
|
| 29,986,809 |
|
|
| 0 |
| ||
855 Brannan |
| San Francisco, CA |
| G |
|
| (F) |
|
| — |
|
|
| 41,363,921 |
|
|
| 255,551,895 |
|
|
| 249 |
|
|
| 41,363,921 |
|
|
| 255,552,144 |
|
|
| 296,916,065 |
|
|
| (1,845,523 | ) |
|
| 295,070,542 |
|
|
| — |
|
| San Francisco, CA |
| G |
|
| 2018 |
|
| 449 |
|
|
| 41,363,921 |
|
|
| 282,133,994 |
|
|
| 132,534 |
|
|
| 41,363,921 |
|
|
| 282,266,528 |
|
|
| 323,630,449 |
|
|
| (34,706,782 | ) |
|
| 288,923,667 |
|
|
| 0 |
| ||
929 Mass (fka 929 House) |
| Cambridge, MA |
| G |
|
| 1975 |
|
| 127 |
|
|
| 3,252,993 |
|
|
| 21,745,595 |
|
|
| 8,432,225 |
|
|
| 3,252,993 |
|
|
| 30,177,820 |
|
|
| 33,430,813 |
|
|
| (21,091,399 | ) |
|
| 12,339,414 |
|
|
| 0 |
| |||||||||||||||||||||||||||||||||||||||||||||||||
Academy Village |
| North Hollywood, CA |
|
| — |
|
| 1989 |
|
| 248 |
|
|
| 25,000,000 |
|
|
| 23,593,194 |
|
|
| 11,156,576 |
|
|
| 25,000,000 |
|
|
| 34,749,770 |
|
|
| 59,749,770 |
|
|
| (21,580,086 | ) |
|
| 38,169,684 |
|
|
| 0 |
| ||||||||||||||||||||||||||||||||||||||||||||||||
Acappella |
| Pasadena, CA |
|
| — |
|
| 2002 |
|
| 143 |
|
|
| 5,839,548 |
|
|
| 29,360,452 |
|
|
| 2,048,185 |
|
|
| 5,839,548 |
|
|
| 31,408,637 |
|
|
| 37,248,185 |
|
|
| (10,041,304 | ) |
|
| 27,206,881 |
|
|
| — |
|
| Pasadena, CA |
|
| — |
|
| 2002 |
|
| 143 |
|
|
| 5,839,548 |
|
|
| 29,360,452 |
|
|
| 2,419,827 |
|
|
| 5,839,548 |
|
|
| 31,780,279 |
|
|
| 37,619,827 |
|
|
| (13,423,512 | ) |
|
| 24,196,315 |
|
|
| 0 |
|
Acton Courtyard |
| Berkeley, CA |
| G |
|
| 2003 |
|
| 71 |
|
|
| 5,550,000 |
|
|
| 15,785,509 |
|
|
| 215,312 |
|
|
| 5,550,000 |
|
|
| 16,000,821 |
|
|
| 21,550,821 |
|
|
| (6,583,929 | ) |
|
| 14,966,892 |
|
|
| — |
|
| Berkeley, CA |
| G |
|
| 2003 |
|
| 71 |
|
|
| 5,550,000 |
|
|
| 15,785,509 |
|
|
| 445,554 |
|
|
| 5,550,000 |
|
|
| 16,231,063 |
|
|
| 21,781,063 |
|
|
| (8,147,133 | ) |
|
| 13,633,930 |
|
|
| 0 |
| ||
Alban Towers |
| Washington, D.C. |
|
| — |
|
| 1934 |
|
| 229 |
|
|
| 18,900,000 |
|
|
| 89,794,201 |
|
|
| 3,280,842 |
|
|
| 18,900,000 |
|
|
| 93,075,043 |
|
|
| 111,975,043 |
|
|
| (18,879,861 | ) |
|
| 93,095,182 |
|
|
| — |
|
| Washington, D.C. |
|
| — |
|
| 1934 |
|
| 229 |
|
|
| 18,900,000 |
|
|
| 89,794,201 |
|
|
| 7,195,879 |
|
|
| 18,900,000 |
|
|
| 96,990,080 |
|
|
| 115,890,080 |
|
|
| (29,449,847 | ) |
|
| 86,440,233 |
|
|
| 0 |
|
Alborada |
| Fremont, CA |
|
| — |
|
| 1999 |
|
| 442 |
|
|
| 24,310,000 |
|
|
| 59,214,129 |
|
|
| 9,118,031 |
|
|
| 24,310,000 |
|
|
| 68,332,160 |
|
|
| 92,642,160 |
|
|
| (39,048,480 | ) |
|
| 53,593,680 |
|
|
| — |
|
| Fremont, CA |
|
| — |
|
| 1999 |
|
| 442 |
|
|
| 24,310,000 |
|
|
| 59,214,129 |
|
|
| 9,737,294 |
|
|
| 24,310,000 |
|
|
| 68,951,423 |
|
|
| 93,261,423 |
|
|
| (47,184,982 | ) |
|
| 46,076,441 |
|
|
| 0 |
|
Alcott Apartments (fka West End Tower) |
| Boston, MA |
| G |
|
| (F) |
|
| 0 |
|
|
| 10,424,000 |
|
|
| 257,358,529 |
|
|
| 0 |
|
|
| 10,424,000 |
|
|
| 257,358,529 |
|
|
| 267,782,529 |
|
|
| 0 |
|
|
| 267,782,529 |
|
|
| 0 |
| |||||||||||||||||||||||||||||||||||||||||||||||||
Altitude (fka Village at Howard Hughes, The (Lots 1 & 2)) |
| Los Angeles, CA |
|
| — |
|
| 2016 |
|
| 545 |
|
|
| 43,783,485 |
|
|
| 147,964,006 |
|
|
| 61,899 |
|
|
| 43,783,485 |
|
|
| 148,025,905 |
|
|
| 191,809,390 |
|
|
| (8,474,037 | ) |
|
| 183,335,353 |
|
|
| — |
|
| Los Angeles, CA |
|
| — |
|
| 2016 |
|
| 545 |
|
|
| 43,783,485 |
|
|
| 150,235,105 |
|
|
| 612,403 |
|
|
| 43,783,485 |
|
|
| 150,847,508 |
|
|
| 194,630,993 |
|
|
| (26,754,900 | ) |
|
| 167,876,093 |
|
|
| 0 |
|
Alton, The (fka Millikan) |
| Irvine, CA |
|
| — |
|
| 2017 |
|
| 344 |
|
|
| 11,049,027 |
|
|
| 95,745,832 |
|
|
| 4,433 |
|
|
| 11,049,027 |
|
|
| 95,750,265 |
|
|
| 106,799,292 |
|
|
| (3,470,417 | ) |
|
| 103,328,875 |
|
|
| — |
|
| Irvine, CA |
|
| — |
|
| 2017 |
|
| 344 |
|
|
| 11,049,027 |
|
|
| 96,524,128 |
|
|
| 243,844 |
|
|
| 11,049,027 |
|
|
| 96,767,972 |
|
|
| 107,816,999 |
|
|
| (15,320,884 | ) |
|
| 92,496,115 |
|
|
| 0 |
|
Arbor Terrace |
| Sunnyvale, CA |
|
| — |
|
| 1979 |
|
| 175 |
|
|
| 9,057,300 |
|
|
| 18,483,642 |
|
|
| 7,806,335 |
|
|
| 9,057,300 |
|
|
| 26,289,977 |
|
|
| 35,347,277 |
|
|
| (15,015,023 | ) |
|
| 20,332,254 |
|
|
| — |
|
| Sunnyvale, CA |
|
| — |
|
| 1979 |
|
| 175 |
|
|
| 9,057,300 |
|
|
| 18,483,642 |
|
|
| 11,966,964 |
|
|
| 9,057,300 |
|
|
| 30,450,606 |
|
|
| 39,507,906 |
|
|
| (19,584,926 | ) |
|
| 19,922,980 |
|
|
| 0 |
|
Artech Building |
| Berkeley, CA |
| G |
|
| 2002 |
|
| 27 |
|
|
| 1,642,000 |
|
|
| 9,152,518 |
|
|
| 493,478 |
|
|
| 1,642,000 |
|
|
| 9,645,996 |
|
|
| 11,287,996 |
|
|
| (3,706,713 | ) |
|
| 7,581,283 |
|
|
| — |
| |||||||||||||||||||||||||||||||||||||||||||||||||
Artisan on Second |
| Los Angeles, CA |
|
| — |
|
| 2008 |
|
| 118 |
|
|
| 8,000,400 |
|
|
| 36,074,600 |
|
|
| 880,695 |
|
|
| 8,000,400 |
|
|
| 36,955,295 |
|
|
| 44,955,695 |
|
|
| (10,464,974 | ) |
|
| 34,490,721 |
|
|
| — |
| ||||||||||||||||||||||||||||||||||||||||||||||||
Artistry Emeryville (fka Emeryville) |
| Emeryville, CA |
|
| — |
|
| 1994 |
|
| 261 |
|
|
| 12,300,000 |
|
|
| 61,466,267 |
|
|
| 4,320,134 |
|
|
| 12,300,000 |
|
|
| 65,786,401 |
|
|
| 78,086,401 |
|
|
| (14,859,853 | ) |
|
| 63,226,548 |
|
|
| — |
| ||||||||||||||||||||||||||||||||||||||||||||||||
Atelier |
| Brooklyn, NY |
|
| — |
|
| 2015 |
|
| 120 |
|
|
| 32,401,680 |
|
|
| 47,135,432 |
|
|
| 276,205 |
|
|
| 32,401,680 |
|
|
| 47,411,637 |
|
|
| 79,813,317 |
|
|
| (4,883,375 | ) |
|
| 74,929,942 |
|
|
| — |
| ||||||||||||||||||||||||||||||||||||||||||||||||
Avenue Two |
| Redwood City, CA |
|
| — |
|
| 1972 |
|
| 123 |
|
|
| 7,995,000 |
|
|
| 18,005,000 |
|
|
| 2,027,422 |
|
|
| 7,995,000 |
|
|
| 20,032,422 |
|
|
| 28,027,422 |
|
|
| (5,941,287 | ) |
|
| 22,086,135 |
|
|
| — |
| ||||||||||||||||||||||||||||||||||||||||||||||||
Arches, The |
| Sunnyvale, CA |
|
| — |
|
| 1974 |
|
| 410 |
|
|
| 26,650,000 |
|
|
| 62,850,000 |
|
|
| 3,279,238 |
|
|
| 26,650,000 |
|
|
| 66,129,238 |
|
|
| 92,779,238 |
|
|
| (27,016,180 | ) |
|
| 65,763,058 |
|
|
| 0 |
| ||||||||||||||||||||||||||||||||||||||||||||||||
S-4
ERP OPERATING LIMITED PARTNERSHIP
Schedule III - Real Estate and Accumulated Depreciation
December 31, 20172020
Description | Description |
|
| Initial Cost to Company |
|
| Cost Capitalized Subsequent to Acquisition (Improvements, net) (E) |
|
| Gross Amount Carried at Close of Period 12/31/17 |
|
|
|
| Description |
|
| Initial Cost to Company |
|
| Cost Capitalized Subsequent to Acquisition (Improvements, net) (E) |
|
| Gross Amount Carried at Close of Period 12/31/20 |
|
|
|
| ||||||||||||||||||||||||||||||||||||||||||||||||||||||||||||||||||||
Apartment Name |
| Location |
| Retail/ Commercial Space |
|
| Date of Construction |
| Apartment Units (H) |
|
| Land |
|
| Building & Fixtures |
|
| Building & Fixtures |
|
| Land |
|
| Building & Fixtures (A) |
|
| Total (B) |
|
| Accumulated Depreciation (C) |
|
| Investment in Real Estate, Net at 12/31/17 |
|
| Encumbrances |
|
| Location |
| Non-Residential Components |
|
| Date of Construction |
| Apartment Units |
|
| Land |
|
| Building & Fixtures |
|
| Building & Fixtures |
|
| Land |
|
| Building & Fixtures (A) |
|
| Total (B) |
|
| Accumulated Depreciation (C) |
|
| Investment in Real Estate, Net at 12/31/20 |
|
| Encumbrances |
| ||||||||||||||||||||||
Artisan on Second |
| Los Angeles, CA |
|
| — |
|
| 2008 |
|
| 118 |
|
|
| 8,000,400 |
|
|
| 36,074,600 |
|
|
| 1,298,143 |
|
|
| 8,000,400 |
|
|
| 37,372,743 |
|
|
| 45,373,143 |
|
|
| (14,173,055 | ) |
|
| 31,200,088 |
|
|
| 0 |
| ||||||||||||||||||||||||||||||||||||||||||||||||
Artistry Emeryville (fka Emeryville) |
| Emeryville, CA |
|
| — |
|
| 1994 |
|
| 267 |
|
|
| 12,300,000 |
|
|
| 61,466,267 |
|
|
| 7,368,364 |
|
|
| 12,300,000 |
|
|
| 68,834,631 |
|
|
| 81,134,631 |
|
|
| (23,980,609 | ) |
|
| 57,154,022 |
|
|
| 0 |
| ||||||||||||||||||||||||||||||||||||||||||||||||
Atelier |
| Brooklyn, NY |
| G |
|
| 2015 |
|
| 120 |
|
|
| 32,401,680 |
|
|
| 47,135,432 |
|
|
| 515,334 |
|
|
| 32,401,680 |
|
|
| 47,650,766 |
|
|
| 80,052,446 |
|
|
| (10,219,483 | ) |
|
| 69,832,963 |
|
|
| 0 |
| |||||||||||||||||||||||||||||||||||||||||||||||||
Avenue Two |
| Redwood City, CA |
|
| — |
|
| 1972 |
|
| 123 |
|
|
| 7,995,000 |
|
|
| 18,005,000 |
|
|
| 2,509,228 |
|
|
| 7,995,000 |
|
|
| 20,514,228 |
|
|
| 28,509,228 |
|
|
| (8,409,710 | ) |
|
| 20,099,518 |
|
|
| 0 |
| ||||||||||||||||||||||||||||||||||||||||||||||||
Axis at Shady Grove |
| Rockville, MD |
|
| — |
|
| 2016 |
|
| 366 |
|
|
| 14,745,774 |
|
|
| 90,503,831 |
|
|
| 240,588 |
|
|
| 14,745,774 |
|
|
| 90,744,419 |
|
|
| 105,490,193 |
|
|
| (11,084,271 | ) |
|
| 94,405,922 |
|
|
| 0 |
| ||||||||||||||||||||||||||||||||||||||||||||||||
Azure (fka Mission Bay-Block 13) |
| San Francisco, CA |
|
| — |
|
| 2015 |
|
| 273 |
|
|
| 32,855,115 |
|
|
| 152,627,844 |
|
|
| 141,813 |
|
|
| 32,855,115 |
|
|
| 152,769,657 |
|
|
| 185,624,772 |
|
|
| (13,532,368 | ) |
|
| 172,092,404 |
|
|
| — |
|
| San Francisco, CA |
|
| — |
|
| 2015 |
|
| 273 |
|
|
| 32,855,115 |
|
|
| 153,567,641 |
|
|
| 479,066 |
|
|
| 32,855,115 |
|
|
| 154,046,707 |
|
|
| 186,901,822 |
|
|
| (30,930,604 | ) |
|
| 155,971,218 |
|
|
| 0 |
|
Bay Hill |
| Long Beach, CA |
|
| — |
|
| 2002 |
|
| 160 |
|
|
| 7,600,000 |
|
|
| 27,437,239 |
|
|
| 3,327,400 |
|
|
| 7,600,000 |
|
|
| 30,764,639 |
|
|
| 38,364,639 |
|
|
| (14,290,928 | ) |
|
| 24,073,711 |
|
|
| — |
|
| Long Beach, CA |
|
| — |
|
| 2002 |
|
| 160 |
|
|
| 7,600,000 |
|
|
| 27,437,239 |
|
|
| 4,043,249 |
|
|
| 7,600,000 |
|
|
| 31,480,488 |
|
|
| 39,080,488 |
|
|
| (17,947,925 | ) |
|
| 21,132,563 |
|
|
| 0 |
|
Beatrice, The |
| New York, NY |
| G |
|
| 2010 |
|
| 302 |
|
|
| 114,351,405 |
|
|
| 165,648,595 |
|
|
| 1,368,317 |
|
|
| 114,351,405 |
|
|
| 167,016,912 |
|
|
| 281,368,317 |
|
|
| (40,862,593 | ) |
|
| 240,505,724 |
|
|
| — |
|
| New York, NY |
|
| — |
|
| 2010 |
|
| 302 |
|
|
| 114,351,405 |
|
|
| 165,648,595 |
|
|
| 2,437,470 |
|
|
| 114,351,405 |
|
|
| 168,086,065 |
|
|
| 282,437,470 |
|
|
| (56,957,402 | ) |
|
| 225,480,068 |
|
|
| 0 |
| |
Bella Vista I, II, III Combined |
| Woodland Hills, CA |
|
| — |
|
| 2003-2007 |
|
| 579 |
|
|
| 31,682,754 |
|
|
| 121,095,786 |
|
|
| 11,255,581 |
|
|
| 31,682,754 |
|
|
| 132,351,367 |
|
|
| 164,034,121 |
|
|
| (68,433,638 | ) |
|
| 95,600,483 |
|
|
| 0 |
| ||||||||||||||||||||||||||||||||||||||||||||||||
Belle Arts Condominium Homes, LLC |
| Bellevue, WA |
|
| — |
|
| 2000 |
|
| 1 |
|
|
| 63,158 |
|
|
| 236,157 |
|
|
| 2,098 |
|
|
| 63,158 |
|
|
| 238,255 |
|
|
| 301,413 |
|
|
| (75,056 | ) |
|
| 226,357 |
|
|
| — |
|
| Bellevue, WA |
|
| — |
|
| 2000 |
|
| 1 |
|
|
| 63,158 |
|
|
| 236,157 |
|
|
| 2,098 |
|
|
| 63,158 |
|
|
| 238,255 |
|
|
| 301,413 |
|
|
| (99,931 | ) |
|
| 201,482 |
|
|
| 0 |
|
Belle Fontaine |
| Marina Del Rey, CA |
|
| — |
|
| 2003 |
|
| 102 |
|
|
| 9,098,808 |
|
|
| 28,701,192 |
|
|
| 771,386 |
|
|
| 9,098,808 |
|
|
| 29,472,578 |
|
|
| 38,571,386 |
|
|
| (7,870,020 | ) |
|
| 30,701,366 |
|
|
| — |
|
| Marina Del Rey, CA |
|
| — |
|
| 2003 |
|
| 102 |
|
|
| 9,098,808 |
|
|
| 28,701,192 |
|
|
| 2,356,766 |
|
|
| 9,098,808 |
|
|
| 31,057,958 |
|
|
| 40,156,766 |
|
|
| (11,041,933 | ) |
|
| 29,114,833 |
|
|
| 0 |
|
Breakwater at Marina Del Rey |
| Marina Del Rey, CA |
|
| — |
|
| 1964-1969 |
|
| 224 |
|
|
| — |
|
|
| 73,189,262 |
|
|
| 1,974,133 |
|
|
| — |
|
|
| 75,163,395 |
|
|
| 75,163,395 |
|
|
| (17,008,793 | ) |
|
| 58,154,602 |
|
|
| — |
|
| Marina Del Rey, CA |
|
| — |
|
| 1964-1969 |
|
| 224 |
|
|
| 0 |
|
|
| 73,189,262 |
|
|
| 2,420,327 |
|
|
| 0 |
|
|
| 75,609,589 |
|
|
| 75,609,589 |
|
|
| (25,201,234 | ) |
|
| 50,408,355 |
|
|
| 0 |
|
Briarwood (CA) |
| Sunnyvale, CA |
|
| — |
|
| 1985 |
|
| 192 |
|
|
| 9,991,500 |
|
|
| 22,247,278 |
|
|
| 3,973,927 |
|
|
| 9,991,500 |
|
|
| 26,221,205 |
|
|
| 36,212,705 |
|
|
| (16,926,737 | ) |
|
| 19,285,968 |
|
|
| — |
|
| Sunnyvale, CA |
|
| — |
|
| 1985 |
|
| 192 |
|
|
| 9,991,500 |
|
|
| 22,247,278 |
|
|
| 4,418,254 |
|
|
| 9,991,500 |
|
|
| 26,665,532 |
|
|
| 36,657,032 |
|
|
| (20,063,847 | ) |
|
| 16,593,185 |
|
|
| 0 |
|
Bridford Lakes II |
| Greensboro, NC |
|
| — |
|
| (F) |
|
| — |
|
|
| 200,000 |
|
|
| — |
|
|
| — |
|
|
| 200,000 |
|
|
| — |
|
|
| 200,000 |
|
|
| — |
|
|
| 200,000 |
|
|
| — |
| ||||||||||||||||||||||||||||||||||||||||||||||||
Brodie, The |
| Westminster, CO |
|
| — |
|
| 2016 |
|
| 312 |
|
|
| 8,639,904 |
|
|
| 79,254,618 |
|
|
| 685,818 |
|
|
| 8,639,904 |
|
|
| 79,940,436 |
|
|
| 88,580,340 |
|
|
| (8,800,355 | ) |
|
| 79,779,985 |
|
|
| 0 |
| ||||||||||||||||||||||||||||||||||||||||||||||||
Brooklyner, The (fka 111 Lawrence) |
| Brooklyn, NY |
| G |
|
| 2010 |
|
| 490 |
|
|
| 40,099,922 |
|
|
| 221,438,631 |
|
|
| 2,859,816 |
|
|
| 40,099,922 |
|
|
| 224,298,447 |
|
|
| 264,398,369 |
|
|
| (53,947,636 | ) |
|
| 210,450,733 |
|
|
| — |
|
| Brooklyn, NY |
| G |
|
| 2010 |
|
| 490 |
|
|
| 40,099,922 |
|
|
| 221,438,631 |
|
|
| 5,139,174 |
|
|
| 40,099,922 |
|
|
| 226,577,805 |
|
|
| 266,677,727 |
|
|
| (77,766,873 | ) |
|
| 188,910,854 |
|
|
| 0 |
| ||
C on Pico |
| Los Angeles, CA |
|
| — |
|
| 2014 |
|
| 94 |
|
|
| 17,125,766 |
|
|
| 28,074,234 |
|
|
| 63,493 |
|
|
| 17,125,766 |
|
|
| 28,137,727 |
|
|
| 45,263,493 |
|
|
| (2,749,575 | ) |
|
| 42,513,918 |
|
|
| — |
|
| Los Angeles, CA |
|
| — |
|
| 2014 |
|
| 94 |
|
|
| 17,125,766 |
|
|
| 28,074,234 |
|
|
| 607,130 |
|
|
| 17,125,766 |
|
|
| 28,681,364 |
|
|
| 45,807,130 |
|
|
| (6,042,014 | ) |
|
| 39,765,116 |
|
|
| 0 |
|
Carlyle Mill |
| Alexandria, VA |
|
| — |
|
| 2002 |
|
| 317 |
|
|
| 10,000,000 |
|
|
| 51,367,913 |
|
|
| 8,305,516 |
|
|
| 10,000,000 |
|
|
| 59,673,429 |
|
|
| 69,673,429 |
|
|
| (30,572,284 | ) |
|
| 39,101,145 |
|
|
| — |
|
| Alexandria, VA |
|
| — |
|
| 2002 |
|
| 317 |
|
|
| 10,000,000 |
|
|
| 51,367,913 |
|
|
| 9,482,880 |
|
|
| 10,000,000 |
|
|
| 60,850,793 |
|
|
| 70,850,793 |
|
|
| (37,283,170 | ) |
|
| 33,567,623 |
|
|
| 0 |
|
Carmel Terrace |
| San Diego, CA |
|
| — |
|
| 1988-1989 |
|
| 384 |
|
|
| 2,288,300 |
|
|
| 20,596,281 |
|
|
| 12,821,204 |
|
|
| 2,288,300 |
|
|
| 33,417,485 |
|
|
| 35,705,785 |
|
|
| (29,568,634 | ) |
|
| 6,137,151 |
|
|
| 0 |
| ||||||||||||||||||||||||||||||||||||||||||||||||
Cascade |
| Seattle, WA |
| G |
|
| 2017 |
|
| 477 |
|
|
| 23,751,564 |
|
|
| 145,844,715 |
|
|
| — |
|
|
| 23,751,564 |
|
|
| 145,844,715 |
|
|
| 169,596,279 |
|
|
| (2,364,423 | ) |
|
| 167,231,856 |
|
|
| — |
|
| Seattle, WA |
| G |
|
| 2017 |
|
| 477 |
|
|
| 23,751,564 |
|
|
| 149,384,842 |
|
|
| 58,556 |
|
|
| 23,751,564 |
|
|
| 149,443,398 |
|
|
| 173,194,962 |
|
|
| (20,377,508 | ) |
|
| 152,817,454 |
|
|
| 0 |
| ||
Centennial (fka Centennial Court & Centennial Tower) |
| Seattle, WA |
| G |
|
| 1991/2001 |
|
| 408 |
|
|
| 9,700,000 |
|
|
| 70,080,378 |
|
|
| 11,471,751 |
|
|
| 9,700,000 |
|
|
| 81,552,129 |
|
|
| 91,252,129 |
|
|
| (36,965,435 | ) |
|
| 54,286,694 |
|
|
| — |
|
| Seattle, WA |
| G |
|
| 1991/2001 |
|
| 408 |
|
|
| 9,700,000 |
|
|
| 70,080,378 |
|
|
| 14,204,709 |
|
|
| 9,700,000 |
|
|
| 84,285,087 |
|
|
| 93,985,087 |
|
|
| (47,446,620 | ) |
|
| 46,538,467 |
|
|
| 0 |
| ||
Centre Club Combined |
| Ontario, CA |
|
| — |
|
| 1994 & 2002 |
|
| 412 |
|
|
| 7,436,000 |
|
|
| 33,014,789 |
|
|
| 8,651,651 |
|
|
| 7,436,000 |
|
|
| 41,666,440 |
|
|
| 49,102,440 |
|
|
| (23,210,064 | ) |
|
| 25,892,376 |
|
|
| — |
|
| Ontario, CA |
|
| — |
|
| 1994 & 2002 |
|
| 412 |
|
|
| 7,436,000 |
|
|
| 33,014,789 |
|
|
| 9,778,429 |
|
|
| 7,436,000 |
|
|
| 42,793,218 |
|
|
| 50,229,218 |
|
|
| (28,483,810 | ) |
|
| 21,745,408 |
|
|
| 0 |
|
Chelsea Square |
| Redmond, WA |
|
| — |
|
| 1991 |
|
| 113 |
|
|
| 3,397,100 |
|
|
| 9,289,074 |
|
|
| 3,046,308 |
|
|
| 3,397,100 |
|
|
| 12,335,382 |
|
|
| 15,732,482 |
|
|
| (9,272,305 | ) |
|
| 6,460,177 |
|
|
| 0 |
| ||||||||||||||||||||||||||||||||||||||||||||||||
Chloe on Madison (fka 1401 E. Madison) |
| Seattle, WA |
| G |
|
| 2019 |
|
| 137 |
|
|
| 10,401,958 |
|
|
| 53,750,777 |
|
|
| 2,916 |
|
|
| 10,401,958 |
|
|
| 53,753,693 |
|
|
| 64,155,651 |
|
|
| (2,655,541 | ) |
|
| 61,500,110 |
|
|
| 0 |
| |||||||||||||||||||||||||||||||||||||||||||||||||
Chloe on Union (fka Chloe) |
| Seattle, WA |
| G |
|
| 2010 |
|
| 117 |
|
|
| 14,835,571 |
|
|
| 39,359,650 |
|
|
| 2,872,330 |
|
|
| 14,835,571 |
|
|
| 42,231,980 |
|
|
| 57,067,551 |
|
|
| (6,417,475 | ) |
|
| 50,650,076 |
|
|
| 0 |
| |||||||||||||||||||||||||||||||||||||||||||||||||
Church Corner |
| Cambridge, MA |
| G |
|
| 1987 |
|
| 85 |
|
|
| 5,220,000 |
|
|
| 16,744,643 |
|
|
| 2,757,280 |
|
|
| 5,220,000 |
|
|
| 19,501,923 |
|
|
| 24,721,923 |
|
|
| (9,327,871 | ) |
|
| 15,394,052 |
|
|
| — |
|
| Cambridge, MA |
| G |
|
| 1987 |
|
| 85 |
|
|
| 5,220,000 |
|
|
| 16,744,643 |
|
|
| 3,414,899 |
|
|
| 5,220,000 |
|
|
| 20,159,542 |
|
|
| 25,379,542 |
|
|
| (11,781,658 | ) |
|
| 13,597,884 |
|
|
| 0 |
| ||
City Gate at Cupertino (fka Cupertino) |
| Cupertino, CA |
|
| — |
|
| 1998 |
|
| 311 |
|
|
| 40,400,000 |
|
|
| 95,937,046 |
|
|
| 7,063,652 |
|
|
| 40,400,000 |
|
|
| 103,000,698 |
|
|
| 143,400,698 |
|
|
| (21,491,582 | ) |
|
| 121,909,116 |
|
|
| — |
|
| Cupertino, CA |
|
| — |
|
| 1998 |
|
| 311 |
|
|
| 40,400,000 |
|
|
| 95,937,046 |
|
|
| 7,718,239 |
|
|
| 40,400,000 |
|
|
| 103,655,285 |
|
|
| 144,055,285 |
|
|
| (33,293,690 | ) |
|
| 110,761,595 |
|
|
| 0 |
|
City Pointe |
| Fullerton, CA |
| G |
|
| 2004 |
|
| 183 |
|
|
| 6,863,792 |
|
|
| 36,476,208 |
|
|
| 1,132,781 |
|
|
| 6,863,792 |
|
|
| 37,608,989 |
|
|
| 44,472,781 |
|
|
| (12,911,899 | ) |
|
| 31,560,882 |
|
|
| — |
| |||||||||||||||||||||||||||||||||||||||||||||||||
City Square Bellevue (fka Bellevue) |
| Bellevue, WA |
| G |
|
| 1998 |
|
| 191 |
|
|
| 15,100,000 |
|
|
| 41,876,257 |
|
|
| 3,341,276 |
|
|
| 15,100,000 |
|
|
| 45,217,533 |
|
|
| 60,317,533 |
|
|
| (9,816,078 | ) |
|
| 50,501,455 |
|
|
| — |
|
| Bellevue, WA |
| G |
|
| 1998 |
|
| 191 |
|
|
| 15,100,000 |
|
|
| 41,876,257 |
|
|
| 3,956,888 |
|
|
| 15,100,000 |
|
|
| 45,833,145 |
|
|
| 60,933,145 |
|
|
| (15,186,445 | ) |
|
| 45,746,700 |
|
|
| 0 |
| ||
CityView at Longwood |
| Boston, MA |
| G |
|
| 1970 |
|
| 295 |
|
|
| 14,704,898 |
|
|
| 79,195,102 |
|
|
| 12,908,253 |
|
|
| 14,704,898 |
|
|
| 92,103,355 |
|
|
| 106,808,253 |
|
|
| (29,583,293 | ) |
|
| 77,224,960 |
|
|
| — |
| |||||||||||||||||||||||||||||||||||||||||||||||||
Clarendon, The |
| Arlington, VA |
| G |
|
| 2005 |
|
| 292 |
|
|
| 30,400,340 |
|
|
| 103,824,660 |
|
|
| 2,206,298 |
|
|
| 30,400,340 |
|
|
| 106,030,958 |
|
|
| 136,431,298 |
|
|
| (30,102,780 | ) |
|
| 106,328,518 |
|
|
| — |
|
| Arlington, VA |
| G |
|
| 2005 |
|
| 292 |
|
|
| 30,400,340 |
|
|
| 103,824,660 |
|
|
| 2,799,573 |
|
|
| 30,400,340 |
|
|
| 106,624,233 |
|
|
| 137,024,573 |
|
|
| (40,439,940 | ) |
|
| 96,584,633 |
|
|
| 0 |
| ||
Cleo, The |
| Los Angeles, CA |
|
| — |
|
| 1989 |
|
| 92 |
|
|
| 6,615,467 |
|
|
| 14,829,335 |
|
|
| 3,872,824 |
|
|
| 6,615,467 |
|
|
| 18,702,159 |
|
|
| 25,317,626 |
|
|
| (8,706,067 | ) |
|
| 16,611,559 |
|
|
| — |
|
| Los Angeles, CA |
|
| — |
|
| 1989 |
|
| 92 |
|
|
| 6,615,467 |
|
|
| 14,829,335 |
|
|
| 4,278,181 |
|
|
| 6,615,467 |
|
|
| 19,107,516 |
|
|
| 25,722,983 |
|
|
| (10,359,000 | ) |
|
| 15,363,983 |
|
|
| 0 |
|
Connecticut Heights |
| Washington, D.C. |
|
| — |
|
| 1974 |
|
| 518 |
|
|
| 27,600,000 |
|
|
| 114,002,295 |
|
|
| 6,582,335 |
|
|
| 27,600,000 |
|
|
| 120,584,630 |
|
|
| 148,184,630 |
|
|
| (24,518,831 | ) |
|
| 123,665,799 |
|
|
| — |
|
| Washington, D.C. |
|
| — |
|
| 1974 |
|
| 518 |
|
|
| 27,600,000 |
|
|
| 114,002,295 |
|
|
| 10,672,491 |
|
|
| 27,600,000 |
|
|
| 124,674,786 |
|
|
| 152,274,786 |
|
|
| (38,864,851 | ) |
|
| 113,409,935 |
|
|
| 0 |
|
Corcoran House at DuPont Circle (fka DuPont Circle) |
| Washington, D.C. |
| G |
|
| 1961 |
|
| 138 |
|
|
| 13,500,000 |
|
|
| 26,913,113 |
|
|
| 1,863,273 |
|
|
| 13,500,000 |
|
|
| 28,776,386 |
|
|
| 42,276,386 |
|
|
| (6,924,238 | ) |
|
| 35,352,148 |
|
|
| — |
|
| Washington, D.C. |
| G |
|
| 1961 |
|
| 138 |
|
|
| 13,500,000 |
|
|
| 26,913,113 |
|
|
| 4,106,014 |
|
|
| 13,500,000 |
|
|
| 31,019,127 |
|
|
| 44,519,127 |
|
|
| (10,154,028 | ) |
|
| 34,365,099 |
|
|
| 0 |
| ||
Courthouse Plaza |
| Arlington, VA |
| G |
|
| 1990 |
|
| 396 |
|
|
| — |
|
|
| 87,386,024 |
|
|
| 5,468,028 |
|
|
| — |
|
|
| 92,854,052 |
|
|
| 92,854,052 |
|
|
| (21,556,859 | ) |
|
| 71,297,193 |
|
|
| — |
|
| Arlington, VA |
| G |
|
| 1990 |
|
| 396 |
|
|
| 0 |
|
|
| 87,386,024 |
|
|
| 6,926,335 |
|
|
| 0 |
|
|
| 94,312,359 |
|
|
| 94,312,359 |
|
|
| (31,836,593 | ) |
|
| 62,475,766 |
|
|
| 0 |
| ||
Creekside (San Mateo) |
| San Mateo, CA |
|
| — |
|
| 1985 |
|
| 192 |
|
|
| 9,606,600 |
|
|
| 21,193,231 |
|
|
| 4,232,377 |
|
|
| 9,606,600 |
|
|
| 25,425,608 |
|
|
| 35,032,208 |
|
|
| (16,783,870 | ) |
|
| 18,248,338 |
|
|
| — |
|
| San Mateo, CA |
|
| — |
|
| 1985 |
|
| 192 |
|
|
| 9,606,600 |
|
|
| 21,193,232 |
|
|
| 5,528,464 |
|
|
| 9,606,600 |
|
|
| 26,721,696 |
|
|
| 36,328,296 |
|
|
| (19,983,009 | ) |
|
| 16,345,287 |
|
|
| 0 |
|
Cronins Landing |
| Waltham, MA |
| G |
|
| 1998 |
|
| 281 |
|
|
| 32,300,000 |
|
|
| 85,119,324 |
|
|
| 6,002,941 |
|
|
| 32,300,000 |
|
|
| 91,122,265 |
|
|
| 123,422,265 |
|
|
| (19,414,857 | ) |
|
| 104,007,408 |
|
|
| — |
|
| Waltham, MA |
| G |
|
| 1998 |
|
| 281 |
|
|
| 32,300,000 |
|
|
| 85,119,324 |
|
|
| 12,705,880 |
|
|
| 32,300,000 |
|
|
| 97,825,204 |
|
|
| 130,125,204 |
|
|
| (31,367,886 | ) |
|
| 98,757,318 |
|
|
| 0 |
| ||
Crystal Place |
| Arlington, VA |
|
| — |
|
| 1986 |
|
| 181 |
|
|
| 17,200,000 |
|
|
| 47,918,975 |
|
|
| 3,541,443 |
|
|
| 17,200,000 |
|
|
| 51,460,418 |
|
|
| 68,660,418 |
|
|
| (11,376,670 | ) |
|
| 57,283,748 |
|
|
| — |
|
| Arlington, VA |
|
| — |
|
| 1986 |
|
| 181 |
|
|
| 17,200,000 |
|
|
| 47,918,975 |
|
|
| 4,101,843 |
|
|
| 17,200,000 |
|
|
| 52,020,818 |
|
|
| 69,220,818 |
|
|
| (17,674,647 | ) |
|
| 51,546,171 |
|
|
| 0 |
|
Dalton, The |
| Alexandria, VA |
| G |
|
| 2018 |
|
| 270 |
|
|
| 22,947,777 |
|
|
| 95,334,754 |
|
|
| 95,439 |
|
|
| 22,947,777 |
|
|
| 95,430,193 |
|
|
| 118,377,970 |
|
|
| (7,103,749 | ) |
|
| 111,274,221 |
|
|
| 0 |
| |||||||||||||||||||||||||||||||||||||||||||||||||
Deerwood (SD) |
| San Diego, CA |
|
| — |
|
| 1990 |
|
| 316 |
|
|
| 2,082,095 |
|
|
| 18,739,815 |
|
|
| 16,342,739 |
|
|
| 2,082,095 |
|
|
| 35,082,554 |
|
|
| 37,164,649 |
|
|
| (31,387,018 | ) |
|
| 5,777,631 |
|
|
| 0 |
| ||||||||||||||||||||||||||||||||||||||||||||||||
Del Mar Ridge |
| San Diego, CA |
|
| — |
|
| 1998 |
|
| 181 |
|
|
| 7,801,824 |
|
|
| 36,948,176 |
|
|
| 4,478,037 |
|
|
| 7,801,824 |
|
|
| 41,426,213 |
|
|
| 49,228,037 |
|
|
| (19,145,873 | ) |
|
| 30,082,164 |
|
|
| 0 |
| ||||||||||||||||||||||||||||||||||||||||||||||||
Eagle Canyon |
| Chino Hills, CA |
|
| — |
|
| 1985 |
|
| 252 |
|
|
| 1,808,900 |
|
|
| 16,274,361 |
|
|
| 9,576,378 |
|
|
| 1,808,900 |
|
|
| 25,850,739 |
|
|
| 27,659,639 |
|
|
| (18,419,631 | ) |
|
| 9,240,008 |
|
|
| — |
|
| Chino Hills, CA |
|
| — |
|
| 1985 |
|
| 252 |
|
|
| 1,808,900 |
|
|
| 16,274,361 |
|
|
| 11,453,379 |
|
|
| 1,808,900 |
|
|
| 27,727,740 |
|
|
| 29,536,640 |
|
|
| (21,958,570 | ) |
|
| 7,578,070 |
|
|
| 0 |
|
Edge, The (fka 4885 Edgemoor Lane) |
| Bethesda, MD |
|
| — |
|
| (F) |
|
| 0 |
|
|
| 0 |
|
|
| 52,311,710 |
|
|
| 0 |
|
|
| 0 |
|
|
| 52,311,710 |
|
|
| 52,311,710 |
|
|
| 0 |
|
|
| 52,311,710 |
|
|
| 0 |
| ||||||||||||||||||||||||||||||||||||||||||||||||
Edgemont at Bethesda Metro |
| Bethesda, MD |
|
| — |
|
| 1989 |
|
| 122 |
|
|
| 13,092,552 |
|
|
| 43,907,448 |
|
|
| 1,433,098 |
|
|
| 13,092,552 |
|
|
| 45,340,546 |
|
|
| 58,433,098 |
|
|
| (11,970,483 | ) |
|
| 46,462,615 |
|
|
| — |
|
| Bethesda, MD |
|
| — |
|
| 1989 |
|
| 122 |
|
|
| 13,092,552 |
|
|
| 43,907,448 |
|
|
| 2,485,329 |
|
|
| 13,092,552 |
|
|
| 46,392,777 |
|
|
| 59,485,329 |
|
|
| (16,714,861 | ) |
|
| 42,770,468 |
|
|
| 0 |
|
Elevé |
| Glendale, CA |
| G |
|
| 2013 |
|
| 208 |
|
|
| 14,080,560 |
|
|
| 56,419,440 |
|
|
| 574,833 |
|
|
| 14,080,560 |
|
|
| 56,994,273 |
|
|
| 71,074,833 |
|
|
| (9,935,529 | ) |
|
| 61,139,304 |
|
|
| — |
| |||||||||||||||||||||||||||||||||||||||||||||||||
Emerson Place |
| Boston, MA |
| G |
|
| 1962 |
|
| 444 |
|
|
| 14,855,000 |
|
|
| 57,566,636 |
|
|
| 27,713,125 |
|
|
| 14,855,000 |
|
|
| 85,279,761 |
|
|
| 100,134,761 |
|
|
| (55,294,608 | ) |
|
| 44,840,153 |
|
|
| — |
|
| Boston, MA |
| G |
|
| 1962 |
|
| 444 |
|
|
| 14,855,000 |
|
|
| 57,566,636 |
|
|
| 36,095,829 |
|
|
| 14,855,000 |
|
|
| 93,662,465 |
|
|
| 108,517,465 |
|
|
| (67,775,615 | ) |
|
| 40,741,850 |
|
|
| 0 |
| ||
Encore at Sherman Oaks, The |
| Sherman Oaks, CA |
|
| — |
|
| 1988 |
|
| 174 |
|
|
| 8,700,000 |
|
|
| 25,446,003 |
|
|
| 1,503,675 |
|
|
| 8,700,000 |
|
|
| 26,949,678 |
|
|
| 35,649,678 |
|
|
| (8,805,442 | ) |
|
| 26,844,236 |
|
|
| — |
|
| Sherman Oaks, CA |
|
| — |
|
| 1988 |
|
| 174 |
|
|
| 8,700,000 |
|
|
| 25,446,003 |
|
|
| 4,521,390 |
|
|
| 8,700,000 |
|
|
| 29,967,393 |
|
|
| 38,667,393 |
|
|
| (11,941,930 | ) |
|
| 26,725,463 |
|
|
| 0 |
|
Fountains at Emerald Park (fka Emerald Park) |
| Dublin, CA |
|
| — |
|
| 2000 |
|
| 324 |
|
|
| 25,900,000 |
|
|
| 83,986,217 |
|
|
| 1,101,209 |
|
|
| 25,900,000 |
|
|
| 85,087,426 |
|
|
| 110,987,426 |
|
|
| (18,972,556 | ) |
|
| 92,014,870 |
|
|
| — |
| ||||||||||||||||||||||||||||||||||||||||||||||||
Fremont Center |
| Fremont, CA |
| G |
|
| 2002 |
|
| 322 |
|
|
| 25,800,000 |
|
|
| 78,753,114 |
|
|
| 3,691,593 |
|
|
| 25,800,000 |
|
|
| 82,444,707 |
|
|
| 108,244,707 |
|
|
| (18,108,606 | ) |
|
| 90,136,101 |
|
|
| — |
| |||||||||||||||||||||||||||||||||||||||||||||||||
Gallery, The |
| Hermosa Beach, CA |
|
| — |
|
| 1971 |
|
| 169 |
|
|
| 18,144,000 |
|
|
| 46,567,941 |
|
|
| 2,765,229 |
|
|
| 18,144,000 |
|
|
| 49,333,170 |
|
|
| 67,477,170 |
|
|
| (21,549,332 | ) |
|
| 45,927,838 |
|
|
| — |
| ||||||||||||||||||||||||||||||||||||||||||||||||
Garden Garage |
| Boston, MA |
|
| — |
|
| (F) |
|
| — |
|
|
| — |
|
|
| 12,858,392 |
|
|
| — |
|
|
| — |
|
|
| 12,858,392 |
|
|
| 12,858,392 |
|
|
| — |
|
|
| 12,858,392 |
|
|
| — |
| ||||||||||||||||||||||||||||||||||||||||||||||||
Gateway at Malden Center |
| Malden, MA |
| G |
|
| 1988 |
|
| 203 |
|
|
| 9,209,780 |
|
|
| 25,722,666 |
|
|
| 14,271,535 |
|
|
| 9,209,780 |
|
|
| 39,994,201 |
|
|
| 49,203,981 |
|
|
| (23,167,536 | ) |
|
| 26,036,445 |
|
|
| — |
| |||||||||||||||||||||||||||||||||||||||||||||||||
Geary Court Yard |
| San Francisco, CA |
|
| — |
|
| 1990 |
|
| 164 |
|
|
| 1,722,400 |
|
|
| 15,471,429 |
|
|
| 4,981,389 |
|
|
| 1,722,400 |
|
|
| 20,452,818 |
|
|
| 22,175,218 |
|
|
| (13,455,847 | ) |
|
| 8,719,371 |
|
|
| — |
| ||||||||||||||||||||||||||||||||||||||||||||||||
Girard |
| Boston, MA |
| G |
|
| 2016 |
|
| 160 |
|
|
| — |
|
|
| 102,450,329 |
|
|
| 412,971 |
|
|
| — |
|
|
| 102,863,300 |
|
|
| 102,863,300 |
|
|
| (2,991,518 | ) |
|
| 99,871,782 |
|
|
| — |
| |||||||||||||||||||||||||||||||||||||||||||||||||
Hampshire Place |
| Los Angeles, CA |
|
| — |
|
| 1989 |
|
| 259 |
|
|
| 10,806,000 |
|
|
| 30,335,330 |
|
|
| 5,889,198 |
|
|
| 10,806,000 |
|
|
| 36,224,528 |
|
|
| 47,030,528 |
|
|
| (16,825,383 | ) |
|
| 30,205,145 |
|
|
| — |
| ||||||||||||||||||||||||||||||||||||||||||||||||
Harbor Steps |
| Seattle, WA |
| G |
|
| 2000 |
|
| 758 |
|
|
| 59,387,158 |
|
|
| 158,829,432 |
|
|
| 28,544,042 |
|
|
| 59,387,158 |
|
|
| 187,373,474 |
|
|
| 246,760,632 |
|
|
| (80,511,164 | ) |
|
| 166,249,468 |
|
|
| — |
| |||||||||||||||||||||||||||||||||||||||||||||||||
Helios (fka 2nd+Pine) |
| Seattle, WA |
| G |
|
| 2017 |
|
| 398 |
|
|
| 18,061,674 |
|
|
| 202,039,273 |
|
|
| — |
|
|
| 18,061,674 |
|
|
| 202,039,273 |
|
|
| 220,100,947 |
|
|
| (3,845,290 | ) |
|
| 216,255,657 |
|
|
| — |
| |||||||||||||||||||||||||||||||||||||||||||||||||
Heritage at Stone Ridge |
| Burlington, MA |
|
| — |
|
| 2005 |
|
| 180 |
|
|
| 10,800,000 |
|
|
| 31,808,335 |
|
|
| 2,313,536 |
|
|
| 10,800,000 |
|
|
| 34,121,871 |
|
|
| 44,921,871 |
|
|
| (15,330,866 | ) |
|
| 29,591,005 |
|
|
| — |
| ||||||||||||||||||||||||||||||||||||||||||||||||
Heritage Ridge |
| Lynwood, WA |
|
| — |
|
| 1999 |
|
| 197 |
|
|
| 6,895,000 |
|
|
| 18,983,597 |
|
|
| 3,339,062 |
|
|
| 6,895,000 |
|
|
| 22,322,659 |
|
|
| 29,217,659 |
|
|
| (10,066,945 | ) |
|
| 19,150,714 |
|
|
| — |
| ||||||||||||||||||||||||||||||||||||||||||||||||
Hesby |
| North Hollywood, CA |
|
| — |
|
| 2013 |
|
| 308 |
|
|
| 23,299,892 |
|
|
| 102,700,108 |
|
|
| 575,827 |
|
|
| 23,299,892 |
|
|
| 103,275,935 |
|
|
| 126,575,827 |
|
|
| (17,235,969 | ) |
|
| 109,339,858 |
|
|
| — |
| ||||||||||||||||||||||||||||||||||||||||||||||||
Highlands at South Plainfield |
| South Plainfield, NJ |
|
| — |
|
| 2000 |
|
| 252 |
|
|
| 10,080,000 |
|
|
| 37,526,912 |
|
|
| 1,968,410 |
|
|
| 10,080,000 |
|
|
| 39,495,322 |
|
|
| 49,575,322 |
|
|
| (17,281,612 | ) |
|
| 32,293,710 |
|
|
| — |
| ||||||||||||||||||||||||||||||||||||||||||||||||
Hikari |
| Los Angeles, CA |
| G |
|
| 2007 |
|
| 128 |
|
|
| 9,435,760 |
|
|
| 32,564,240 |
|
|
| 813,913 |
|
|
| 9,435,760 |
|
|
| 33,378,153 |
|
|
| 42,813,913 |
|
|
| (9,383,982 | ) |
|
| 33,429,931 |
|
|
| — |
| |||||||||||||||||||||||||||||||||||||||||||||||||
Hudson Crossing |
| New York, NY |
| G |
|
| 2003 |
|
| 259 |
|
|
| 23,420,000 |
|
|
| 69,977,699 |
|
|
| 2,333,449 |
|
|
| 23,420,000 |
|
|
| 72,311,148 |
|
|
| 95,731,148 |
|
|
| (33,463,902 | ) |
|
| 62,267,246 |
|
|
| — |
| |||||||||||||||||||||||||||||||||||||||||||||||||
Eviva on Cherokee |
| Denver, CO |
|
| — |
|
| 2017 |
|
| 274 |
|
|
| 10,507,626 |
|
|
| 100,037,204 |
|
|
| 512,431 |
|
|
| 10,507,626 |
|
|
| 100,549,635 |
|
|
| 111,057,261 |
|
|
| (10,488,698 | ) |
|
| 100,568,563 |
|
|
| 0 |
| ||||||||||||||||||||||||||||||||||||||||||||||||
S-5
ERP OPERATING LIMITED PARTNERSHIP
Schedule III - Real Estate and Accumulated Depreciation
December 31, 20172020
Description |
|
| Initial Cost to Company |
|
| Cost Capitalized Subsequent to Acquisition (Improvements, net) (E) |
|
| Gross Amount Carried at Close of Period 12/31/17 |
|
|
|
| |||||||||||||||||||||||||||||||||||
Apartment Name |
| Location |
| Retail/ Commercial Space |
|
| Date of Construction |
| Apartment Units (H) |
|
| Land |
|
| Building & Fixtures |
|
| Building & Fixtures |
|
| Land |
|
| Building & Fixtures (A) |
|
| Total (B) |
|
| Accumulated Depreciation (C) |
|
| Investment in Real Estate, Net at 12/31/17 |
|
| Encumbrances |
| |||||||||||
Hudson Pointe |
| Jersey City, NJ |
|
| — |
|
| 2003 |
|
| 182 |
|
|
| 5,350,000 |
|
|
| 41,114,074 |
|
|
| 6,026,931 |
|
|
| 5,350,000 |
|
|
| 47,141,005 |
|
|
| 52,491,005 |
|
|
| (22,111,343 | ) |
|
| 30,379,662 |
|
|
| — |
|
Hunt Club II |
| Charlotte, NC |
|
| — |
|
| (F) |
|
| — |
|
|
| 100,000 |
|
|
| — |
|
|
| — |
|
|
| 100,000 |
|
|
| — |
|
|
| 100,000 |
|
|
| — |
|
|
| 100,000 |
|
|
| — |
|
Ivory Wood |
| Bothell, WA |
|
| — |
|
| 2000 |
|
| 144 |
|
|
| 2,732,800 |
|
|
| 13,888,282 |
|
|
| 1,259,914 |
|
|
| 2,732,800 |
|
|
| 15,148,196 |
|
|
| 17,880,996 |
|
|
| (7,400,504 | ) |
|
| 10,480,492 |
|
|
| — |
|
Jia (fka Chinatown Gateway) |
| Los Angeles, CA |
| G |
|
| 2014 |
|
| 280 |
|
|
| 14,791,831 |
|
|
| 77,426,315 |
|
|
| 281,313 |
|
|
| 14,791,831 |
|
|
| 77,707,628 |
|
|
| 92,499,459 |
|
|
| (15,513,371 | ) |
|
| 76,986,088 |
|
|
| — |
| |
Junction 47 (fka West Seattle) |
| Seattle, WA |
| G |
|
| 2015 |
|
| 206 |
|
|
| 11,726,305 |
|
|
| 56,108,989 |
|
|
| 36,260 |
|
|
| 11,726,305 |
|
|
| 56,145,249 |
|
|
| 67,871,554 |
|
|
| (5,156,854 | ) |
|
| 62,714,700 |
|
|
| — |
| |
Kelvin, The (fka Modera) |
| Irvine, CA |
|
| — |
|
| 2015 |
|
| 194 |
|
|
| 15,521,552 |
|
|
| 64,853,448 |
|
|
| 385,466 |
|
|
| 15,521,552 |
|
|
| 65,238,914 |
|
|
| 80,760,466 |
|
|
| (7,677,409 | ) |
|
| 73,083,057 |
|
|
| — |
|
Landings at Port Imperial |
| W. New York, NJ |
|
| — |
|
| 1999 |
|
| 276 |
|
|
| 27,246,045 |
|
|
| 37,741,050 |
|
|
| 10,790,636 |
|
|
| 27,246,045 |
|
|
| 48,531,686 |
|
|
| 75,777,731 |
|
|
| (29,235,083 | ) |
|
| 46,542,648 |
|
|
| — |
|
Lincoln Heights |
| Quincy, MA |
|
| — |
|
| 1991 |
|
| 336 |
|
|
| 5,928,400 |
|
|
| 33,595,262 |
|
|
| 13,797,904 |
|
|
| 5,928,400 |
|
|
| 47,393,166 |
|
|
| 53,321,566 |
|
|
| (34,170,500 | ) |
|
| 19,151,066 |
|
|
| — |
|
Lindley Apartments |
| Encino, CA |
|
| — |
|
| 2004 |
|
| 129 |
|
|
| 5,805,000 |
|
|
| 25,705,000 |
|
|
| 1,086,410 |
|
|
| 5,805,000 |
|
|
| 26,791,410 |
|
|
| 32,596,410 |
|
|
| (8,393,740 | ) |
|
| 24,202,670 |
|
|
| — |
|
Lofts 590 |
| Arlington, VA |
|
| — |
|
| 2005 |
|
| 212 |
|
|
| 20,100,000 |
|
|
| 67,909,023 |
|
|
| 688,579 |
|
|
| 20,100,000 |
|
|
| 68,597,602 |
|
|
| 88,697,602 |
|
|
| (13,789,656 | ) |
|
| 74,907,946 |
|
|
| — |
|
Lofts at Kendall Square (fka Kendall Square) |
| Cambridge, MA |
|
| — |
|
| 1998 |
|
| 186 |
|
|
| 18,696,674 |
|
|
| 78,445,657 |
|
|
| 5,737,350 |
|
|
| 18,696,674 |
|
|
| 84,183,007 |
|
|
| 102,879,681 |
|
|
| (17,496,435 | ) |
|
| 85,383,246 |
|
|
| — |
|
Longacre House |
| New York, NY |
| G |
|
| 2000 |
|
| 293 |
|
|
| 73,170,045 |
|
|
| 53,962,510 |
|
|
| 2,572,439 |
|
|
| 73,170,045 |
|
|
| 56,534,949 |
|
|
| 129,704,994 |
|
|
| (22,561,960 | ) |
|
| 107,143,034 |
|
|
| — |
| |
Longfellow Place |
| Boston, MA |
| G |
|
| 1975 |
|
| 710 |
|
|
| 47,096,917 |
|
|
| 150,143,916 |
|
|
| 86,838,642 |
|
|
| 47,096,917 |
|
|
| 236,982,558 |
|
|
| 284,079,475 |
|
|
| (154,305,979 | ) |
|
| 129,773,496 |
|
|
| — |
| |
Mantena |
| New York, NY |
| G |
|
| 2012 |
|
| 98 |
|
|
| 22,346,513 |
|
|
| 61,501,158 |
|
|
| 813,638 |
|
|
| 22,346,513 |
|
|
| 62,314,796 |
|
|
| 84,661,309 |
|
|
| (13,828,043 | ) |
|
| 70,833,266 |
|
|
| — |
| |
Marina 41 (fka Marina Del Rey) |
| Marina Del Rey, CA |
|
| — |
|
| 1973 |
|
| 623 |
|
|
| — |
|
|
| 168,842,442 |
|
|
| 6,492,153 |
|
|
| — |
|
|
| 175,334,595 |
|
|
| 175,334,595 |
|
|
| (40,843,073 | ) |
|
| 134,491,522 |
|
|
| — |
|
Mariposa at Playa Del Rey (fka Playa Del Rey) |
| Playa Del Rey, CA |
|
| — |
|
| 2004 |
|
| 354 |
|
|
| 60,900,000 |
|
|
| 89,311,482 |
|
|
| 5,201,127 |
|
|
| 60,900,000 |
|
|
| 94,512,609 |
|
|
| 155,412,609 |
|
|
| (21,025,902 | ) |
|
| 134,386,707 |
|
|
| — |
|
Milano Lofts |
| Los Angeles, CA |
| G |
|
| 1925/2006 |
|
| 99 |
|
|
| 8,125,216 |
|
|
| 27,378,784 |
|
|
| 1,088,041 |
|
|
| 8,125,216 |
|
|
| 28,466,825 |
|
|
| 36,592,041 |
|
|
| (6,979,083 | ) |
|
| 29,612,958 |
|
|
| — |
| |
Mosaic at Metro |
| Hyattsville, MD |
|
| — |
|
| 2008 |
|
| 260 |
|
|
| — |
|
|
| 59,580,898 |
|
|
| 955,743 |
|
|
| — |
|
|
| 60,536,641 |
|
|
| 60,536,641 |
|
|
| (19,462,344 | ) |
|
| 41,074,297 |
|
|
| — |
|
Mountain View Redevelopment |
| Mountain View, CA |
|
| — |
|
| (F) |
|
| — |
|
|
| — |
|
|
| 17,876 |
|
|
| — |
|
|
| — |
|
|
| 17,876 |
|
|
| 17,876 |
|
|
| — |
|
|
| 17,876 |
|
|
| — |
|
Mozaic at Union Station |
| Los Angeles, CA |
|
| — |
|
| 2007 |
|
| 272 |
|
|
| 8,500,000 |
|
|
| 52,529,446 |
|
|
| 2,126,281 |
|
|
| 8,500,000 |
|
|
| 54,655,727 |
|
|
| 63,155,727 |
|
|
| (22,181,465 | ) |
|
| 40,974,262 |
|
|
| — |
|
Murray Hill Tower (fka Murray Hill) |
| New York, NY |
| G |
|
| 1974 |
|
| 270 |
|
|
| 75,800,000 |
|
|
| 102,705,401 |
|
|
| 8,886,567 |
|
|
| 75,800,000 |
|
|
| 111,591,968 |
|
|
| 187,391,968 |
|
|
| (25,690,086 | ) |
|
| 161,701,882 |
|
|
| — |
| |
North Pier at Harborside |
| Jersey City, NJ |
|
| — |
|
| 2003 |
|
| 297 |
|
|
| 4,000,159 |
|
|
| 94,290,590 |
|
|
| 4,047,215 |
|
|
| 4,000,159 |
|
|
| 98,337,805 |
|
|
| 102,337,964 |
|
|
| (46,111,052 | ) |
|
| 56,226,912 |
|
|
| — |
|
Northglen |
| Valencia, CA |
|
| — |
|
| 1988 |
|
| 234 |
|
|
| 9,360,000 |
|
|
| 20,778,553 |
|
|
| 4,506,094 |
|
|
| 9,360,000 |
|
|
| 25,284,647 |
|
|
| 34,644,647 |
|
|
| (14,197,899 | ) |
|
| 20,446,748 |
|
|
| — |
|
Northpark |
| Burlingame, CA |
|
| — |
|
| 1972 |
|
| 510 |
|
|
| 38,607,000 |
|
|
| 77,472,217 |
|
|
| 13,899,131 |
|
|
| 38,607,000 |
|
|
| 91,371,348 |
|
|
| 129,978,348 |
|
|
| (32,707,629 | ) |
|
| 97,270,719 |
|
|
| — |
|
Northridge |
| Pleasant Hill, CA |
|
| — |
|
| 1974 |
|
| 221 |
|
|
| 5,524,000 |
|
|
| 14,691,705 |
|
|
| 10,828,364 |
|
|
| 5,524,000 |
|
|
| 25,520,069 |
|
|
| 31,044,069 |
|
|
| (18,623,618 | ) |
|
| 12,420,451 |
|
|
| — |
|
Oak Park Combined |
| Agoura Hills, CA |
|
| — |
|
| 1989 & 1990 |
|
| 444 |
|
|
| 3,390,700 |
|
|
| 30,517,274 |
|
|
| 10,331,701 |
|
|
| 3,390,700 |
|
|
| 40,848,975 |
|
|
| 44,239,675 |
|
|
| (30,282,737 | ) |
|
| 13,956,938 |
|
|
| — |
|
Oakwood Boston |
| Boston, MA |
| G |
|
| 1901 |
|
| 94 |
|
|
| 22,200,000 |
|
|
| 28,672,979 |
|
|
| 1,616,791 |
|
|
| 22,200,000 |
|
|
| 30,289,770 |
|
|
| 52,489,770 |
|
|
| (7,037,665 | ) |
|
| 45,452,105 |
|
|
| — |
| |
Oakwood Crystal City |
| Arlington, VA |
|
| — |
|
| 1987 |
|
| 162 |
|
|
| 15,400,000 |
|
|
| 35,474,336 |
|
|
| 3,757,149 |
|
|
| 15,400,000 |
|
|
| 39,231,485 |
|
|
| 54,631,485 |
|
|
| (8,406,119 | ) |
|
| 46,225,366 |
|
|
| — |
|
Oakwood Marina Del Rey |
| Marina Del Rey, CA |
| G |
|
| 1969 |
|
| 597 |
|
|
| — |
|
|
| 120,795,359 |
|
|
| 2,723,823 |
|
|
| — |
|
|
| 123,519,182 |
|
|
| 123,519,182 |
|
|
| (29,036,612 | ) |
|
| 94,482,570 |
|
|
| — |
| |
Oaks |
| Santa Clarita, CA |
|
| — |
|
| 2000 |
|
| 520 |
|
|
| 23,400,000 |
|
|
| 61,020,438 |
|
|
| 5,585,786 |
|
|
| 23,400,000 |
|
|
| 66,606,224 |
|
|
| 90,006,224 |
|
|
| (34,133,995 | ) |
|
| 55,872,229 |
|
|
| — |
|
Ocean Crest |
| Solana Beach, CA |
|
| — |
|
| 1986 |
|
| 146 |
|
|
| 5,111,200 |
|
|
| 11,910,438 |
|
|
| 4,250,627 |
|
|
| 5,111,200 |
|
|
| 16,161,065 |
|
|
| 21,272,265 |
|
|
| (10,492,882 | ) |
|
| 10,779,383 |
|
|
| — |
|
Odin (fka Tallman) |
| Seattle, WA |
|
| — |
|
| 2015 |
|
| 301 |
|
|
| 16,807,519 |
|
|
| 63,645,480 |
|
|
| 9,233 |
|
|
| 16,807,519 |
|
|
| 63,654,713 |
|
|
| 80,462,232 |
|
|
| (5,819,185 | ) |
|
| 74,643,047 |
|
|
| — |
|
Old Town Lofts |
| Redmond, WA |
| G |
|
| 2014 |
|
| 149 |
|
|
| 7,740,467 |
|
|
| 44,146,181 |
|
|
| 784,750 |
|
|
| 7,740,467 |
|
|
| 44,930,931 |
|
|
| 52,671,398 |
|
|
| (5,125,092 | ) |
|
| 47,546,306 |
|
|
| — |
| |
One Henry Adams |
| San Francisco, CA |
| G |
|
| 2016 |
|
| 241 |
|
|
| 30,224,393 |
|
|
| 137,031,168 |
|
|
| 6,724 |
|
|
| 30,224,393 |
|
|
| 137,037,892 |
|
|
| 167,262,285 |
|
|
| (5,417,321 | ) |
|
| 161,844,964 |
|
|
| — |
| |
Pacific Place |
| Los Angeles, CA |
|
| — |
|
| 2008 |
|
| 430 |
|
|
| 32,250,000 |
|
|
| 110,750,000 |
|
|
| 1,483,644 |
|
|
| 32,250,000 |
|
|
| 112,233,644 |
|
|
| 144,483,644 |
|
|
| (23,253,190 | ) |
|
| 121,230,454 |
|
|
| — |
|
Packard Building |
| Seattle, WA |
| G |
|
| 2010 |
|
| 61 |
|
|
| 5,911,041 |
|
|
| 19,954,959 |
|
|
| 226,050 |
|
|
| 5,911,041 |
|
|
| 20,181,009 |
|
|
| 26,092,050 |
|
|
| (2,148,366 | ) |
|
| 23,943,684 |
|
|
| — |
| |
Parc 77 |
| New York, NY |
| G |
|
| 1903 |
|
| 137 |
|
|
| 40,504,000 |
|
|
| 18,025,679 |
|
|
| 6,041,700 |
|
|
| 40,504,000 |
|
|
| 24,067,379 |
|
|
| 64,571,379 |
|
|
| (12,290,428 | ) |
|
| 52,280,951 |
|
|
| — |
| |
Parc Cameron |
| New York, NY |
| G |
|
| 1927 |
|
| 166 |
|
|
| 37,600,000 |
|
|
| 9,855,597 |
|
|
| 7,300,028 |
|
|
| 37,600,000 |
|
|
| 17,155,625 |
|
|
| 54,755,625 |
|
|
| (10,340,621 | ) |
|
| 44,415,004 |
|
|
| — |
| |
Parc Coliseum |
| New York, NY |
| G |
|
| 1910 |
|
| 177 |
|
|
| 52,654,000 |
|
|
| 23,045,751 |
|
|
| 8,978,751 |
|
|
| 52,654,000 |
|
|
| 32,024,502 |
|
|
| 84,678,502 |
|
|
| (16,948,295 | ) |
|
| 67,730,207 |
|
|
| — |
| |
Parc East Towers |
| New York, NY |
| G |
|
| 1977 |
|
| 324 |
|
|
| 102,163,000 |
|
|
| 108,989,402 |
|
|
| 10,236,255 |
|
|
| 102,163,000 |
|
|
| 119,225,657 |
|
|
| 221,388,657 |
|
|
| (48,273,891 | ) |
|
| 173,114,766 |
|
|
| — |
| |
Parc on Powell (fka Parkside at Emeryville) |
| Emeryville, CA |
| G |
|
| 2015 |
|
| 173 |
|
|
| 16,667,059 |
|
|
| 65,071,885 |
|
|
| 224,676 |
|
|
| 16,667,059 |
|
|
| 65,296,561 |
|
|
| 81,963,620 |
|
|
| (6,675,129 | ) |
|
| 75,288,491 |
|
|
| — |
| |
Park at Pentagon Row (fka Pentagon City) |
| Arlington, VA |
| G |
|
| 1990 |
|
| 298 |
|
|
| 28,300,000 |
|
|
| 78,838,184 |
|
|
| 1,995,147 |
|
|
| 28,300,000 |
|
|
| 80,833,331 |
|
|
| 109,133,331 |
|
|
| (17,268,528 | ) |
|
| 91,864,803 |
|
|
| — |
| |
Park Connecticut |
| Washington, D.C. |
|
| — |
|
| 2000 |
|
| 142 |
|
|
| 13,700,000 |
|
|
| 59,087,519 |
|
|
| 1,447,815 |
|
|
| 13,700,000 |
|
|
| 60,535,334 |
|
|
| 74,235,334 |
|
|
| (12,311,907 | ) |
|
| 61,923,427 |
|
|
| — |
|
Park Hacienda (fka Hacienda) |
| Pleasanton, CA |
|
| — |
|
| 2000 |
|
| 540 |
|
|
| 43,200,000 |
|
|
| 128,753,359 |
|
|
| 2,520,251 |
|
|
| 43,200,000 |
|
|
| 131,273,610 |
|
|
| 174,473,610 |
|
|
| (29,930,085 | ) |
|
| 144,543,525 |
|
|
| — |
|
Park West (CA) |
| Los Angeles, CA |
|
| — |
|
| 1987/1990 |
|
| 444 |
|
|
| 3,033,500 |
|
|
| 27,302,383 |
|
|
| 10,420,073 |
|
|
| 3,033,500 |
|
|
| 37,722,456 |
|
|
| 40,755,956 |
|
|
| (27,786,714 | ) |
|
| 12,969,242 |
|
|
| — |
|
Parkside |
| Union City, CA |
|
| — |
|
| 1979 |
|
| 208 |
|
|
| 6,246,700 |
|
|
| 11,827,453 |
|
|
| 5,452,846 |
|
|
| 6,246,700 |
|
|
| 17,280,299 |
|
|
| 23,526,999 |
|
|
| (11,589,006 | ) |
|
| 11,937,993 |
|
|
| — |
|
Pearl, The |
| Seattle, WA |
| G |
|
| 2008 |
|
| 80 |
|
|
| 6,972,585 |
|
|
| 26,527,415 |
|
|
| 556,995 |
|
|
| 6,972,585 |
|
|
| 27,084,410 |
|
|
| 34,056,995 |
|
|
| (2,841,186 | ) |
|
| 31,215,809 |
|
|
| — |
| |
Description |
|
| Initial Cost to Company |
|
| Cost Capitalized Subsequent to Acquisition (Improvements, net) (E) |
|
| Gross Amount Carried at Close of Period 12/31/20 |
|
|
|
| |||||||||||||||||||||||||||||||||||
Apartment Name |
| Location |
| Non-Residential Components |
|
| Date of Construction |
| Apartment Units |
|
| Land |
|
| Building & Fixtures |
|
| Building & Fixtures |
|
| Land |
|
| Building & Fixtures (A) |
|
| Total (B) |
|
| Accumulated Depreciation (C) |
|
| Investment in Real Estate, Net at 12/31/20 |
|
| Encumbrances |
| |||||||||||
Fountains at Emerald Park (fka Emerald Park) |
| Dublin, CA |
|
| — |
|
| 2000 |
|
| 324 |
|
|
| 25,900,000 |
|
|
| 83,986,217 |
|
|
| 4,735,333 |
|
|
| 25,900,000 |
|
|
| 88,721,550 |
|
|
| 114,621,550 |
|
|
| (28,555,812 | ) |
|
| 86,065,738 |
|
|
| 0 |
|
Fremont Center |
| Fremont, CA |
| G |
|
| 2002 |
|
| 322 |
|
|
| 25,800,000 |
|
|
| 78,753,114 |
|
|
| 5,103,474 |
|
|
| 25,800,000 |
|
|
| 83,856,588 |
|
|
| 109,656,588 |
|
|
| (27,673,493 | ) |
|
| 81,983,095 |
|
|
| 0 |
| |
Gaithersburg Station |
| Gaithersburg, MD |
| G |
|
| 2013 |
|
| 400 |
|
|
| 17,500,000 |
|
|
| 74,678,917 |
|
|
| 4,636,691 |
|
|
| 17,500,000 |
|
|
| 79,315,608 |
|
|
| 96,815,608 |
|
|
| (23,625,030 | ) |
|
| 73,190,578 |
|
|
| 0 |
| |
Gallery, The |
| Hermosa Beach, CA |
|
| — |
|
| 1971 |
|
| 169 |
|
|
| 18,144,000 |
|
|
| 46,567,941 |
|
|
| 3,103,348 |
|
|
| 18,144,000 |
|
|
| 49,671,289 |
|
|
| 67,815,289 |
|
|
| (26,326,719 | ) |
|
| 41,488,570 |
|
|
| 0 |
|
Gateway at Malden Center |
| Malden, MA |
| G |
|
| 1988 |
|
| 203 |
|
|
| 9,209,780 |
|
|
| 25,722,666 |
|
|
| 17,360,595 |
|
|
| 9,209,780 |
|
|
| 43,083,261 |
|
|
| 52,293,041 |
|
|
| (28,698,550 | ) |
|
| 23,594,491 |
|
|
| 0 |
| |
Geary Court Yard |
| San Francisco, CA |
|
| — |
|
| 1990 |
|
| 165 |
|
|
| 1,722,400 |
|
|
| 15,471,429 |
|
|
| 6,286,909 |
|
|
| 1,722,400 |
|
|
| 21,758,338 |
|
|
| 23,480,738 |
|
|
| (16,463,219 | ) |
|
| 7,017,519 |
|
|
| 0 |
|
Girard |
| Boston, MA |
| G |
|
| 2016 |
|
| 160 |
|
|
| 0 |
|
|
| 102,450,328 |
|
|
| 921,575 |
|
|
| 0 |
|
|
| 103,371,903 |
|
|
| 103,371,903 |
|
|
| (14,956,283 | ) |
|
| 88,415,620 |
|
|
| 0 |
| |
Hampshire Place |
| Los Angeles, CA |
|
| — |
|
| 1989 |
|
| 259 |
|
|
| 10,806,000 |
|
|
| 30,335,330 |
|
|
| 8,663,329 |
|
|
| 10,806,000 |
|
|
| 38,998,659 |
|
|
| 49,804,659 |
|
|
| (21,516,455 | ) |
|
| 28,288,204 |
|
|
| 0 |
|
Harbor Steps |
| Seattle, WA |
| G |
|
| 2000 |
|
| 761 |
|
|
| 59,403,601 |
|
|
| 158,829,432 |
|
|
| 43,131,840 |
|
|
| 59,403,601 |
|
|
| 201,961,272 |
|
|
| 261,364,873 |
|
|
| (105,902,659 | ) |
|
| 155,462,214 |
|
|
| 0 |
| |
Hathaway |
| Long Beach, CA |
|
| — |
|
| 1987 |
|
| 385 |
|
|
| 2,512,500 |
|
|
| 22,611,912 |
|
|
| 14,527,190 |
|
|
| 2,512,500 |
|
|
| 37,139,102 |
|
|
| 39,651,602 |
|
|
| (28,554,178 | ) |
|
| 11,097,424 |
|
|
| 0 |
|
Helios (fka 2nd+Pine) |
| Seattle, WA |
| G |
|
| 2017 |
|
| 398 |
|
|
| 18,061,674 |
|
|
| 206,761,817 |
|
|
| 183,520 |
|
|
| 18,061,674 |
|
|
| 206,945,337 |
|
|
| 225,007,011 |
|
|
| (28,336,441 | ) |
|
| 196,670,570 |
|
|
| 0 |
| |
Heritage at Stone Ridge |
| Burlington, MA |
|
| — |
|
| 2005 |
|
| 180 |
|
|
| 10,800,000 |
|
|
| 31,808,335 |
|
|
| 3,054,858 |
|
|
| 10,800,000 |
|
|
| 34,863,193 |
|
|
| 45,663,193 |
|
|
| (19,026,623 | ) |
|
| 26,636,570 |
|
|
| 0 |
|
Heritage Ridge |
| Lynwood, WA |
|
| — |
|
| 1999 |
|
| 197 |
|
|
| 6,895,000 |
|
|
| 18,983,597 |
|
|
| 4,683,392 |
|
|
| 6,895,000 |
|
|
| 23,666,989 |
|
|
| 30,561,989 |
|
|
| (12,962,130 | ) |
|
| 17,599,859 |
|
|
| 0 |
|
Hesby |
| North Hollywood, CA |
|
| — |
|
| 2013 |
|
| 308 |
|
|
| 23,299,892 |
|
|
| 102,700,108 |
|
|
| 2,406,522 |
|
|
| 23,299,892 |
|
|
| 105,106,630 |
|
|
| 128,406,522 |
|
|
| (28,701,909 | ) |
|
| 99,704,613 |
|
|
| 0 |
|
Highlands at South Plainfield |
| South Plainfield, NJ |
|
| — |
|
| 2000 |
|
| 252 |
|
|
| 10,080,000 |
|
|
| 37,526,912 |
|
|
| 2,930,209 |
|
|
| 10,080,000 |
|
|
| 40,457,121 |
|
|
| 50,537,121 |
|
|
| (21,704,492 | ) |
|
| 28,832,629 |
|
|
| 0 |
|
Hikari |
| Los Angeles, CA |
| G |
|
| 2007 |
|
| 128 |
|
|
| 9,435,760 |
|
|
| 32,564,240 |
|
|
| 1,055,340 |
|
|
| 9,435,760 |
|
|
| 33,619,580 |
|
|
| 43,055,340 |
|
|
| (12,719,419 | ) |
|
| 30,335,921 |
|
|
| 0 |
| |
Hillside ll |
| Daly City, CA |
|
| — |
|
| (F) |
|
| 0 |
|
|
| 0 |
|
|
| 1,892,874 |
|
|
| 0 |
|
|
| 0 |
|
|
| 1,892,874 |
|
|
| 1,892,874 |
|
|
| 0 |
|
|
| 1,892,874 |
|
|
| 0 |
|
Hudson Crossing |
| New York, NY |
| G |
|
| 2003 |
|
| 259 |
|
|
| 23,420,000 |
|
|
| 69,977,699 |
|
|
| 3,305,385 |
|
|
| 23,420,000 |
|
|
| 73,283,084 |
|
|
| 96,703,084 |
|
|
| (41,028,871 | ) |
|
| 55,674,213 |
|
|
| 0 |
| |
Hudson Pointe |
| Jersey City, NJ |
|
| — |
|
| 2003 |
|
| 182 |
|
|
| 5,350,000 |
|
|
| 41,114,074 |
|
|
| 7,258,907 |
|
|
| 5,350,000 |
|
|
| 48,372,981 |
|
|
| 53,722,981 |
|
|
| (28,021,673 | ) |
|
| 25,701,308 |
|
|
| 0 |
|
Huxley, The |
| Redwood City, CA |
|
| — |
|
| 2018 |
|
| 137 |
|
|
| 18,775,028 |
|
|
| 89,336,651 |
|
|
| 38,505 |
|
|
| 18,775,028 |
|
|
| 89,375,156 |
|
|
| 108,150,184 |
|
|
| (7,124,237 | ) |
|
| 101,025,947 |
|
|
| 0 |
|
Ivory Wood |
| Bothell, WA |
|
| — |
|
| 2000 |
|
| 144 |
|
|
| 2,732,800 |
|
|
| 13,888,282 |
|
|
| 1,964,134 |
|
|
| 2,732,800 |
|
|
| 15,852,416 |
|
|
| 18,585,216 |
|
|
| (9,126,262 | ) |
|
| 9,458,954 |
|
|
| 0 |
|
Jia (fka Chinatown Gateway) |
| Los Angeles, CA |
| G |
|
| 2014 |
|
| 280 |
|
|
| 14,791,831 |
|
|
| 78,218,492 |
|
|
| 917,303 |
|
|
| 14,791,831 |
|
|
| 79,135,795 |
|
|
| 93,927,626 |
|
|
| (25,013,639 | ) |
|
| 68,913,987 |
|
|
| 0 |
| |
Junction 47 (fka West Seattle) |
| Seattle, WA |
| G |
|
| 2015 |
|
| 206 |
|
|
| 11,726,305 |
|
|
| 56,584,312 |
|
|
| 256,046 |
|
|
| 11,726,305 |
|
|
| 56,840,358 |
|
|
| 68,566,663 |
|
|
| (12,195,811 | ) |
|
| 56,370,852 |
|
|
| 0 |
| |
Kelvin, The (fka Modera) |
| Irvine, CA |
|
| — |
|
| 2015 |
|
| 194 |
|
|
| 15,521,552 |
|
|
| 64,853,448 |
|
|
| 778,776 |
|
|
| 15,521,552 |
|
|
| 65,632,224 |
|
|
| 81,153,776 |
|
|
| (15,146,860 | ) |
|
| 66,006,916 |
|
|
| 0 |
|
Laguna Clara |
| Santa Clara, CA |
|
| — |
|
| 1972 |
|
| 264 |
|
|
| 13,642,420 |
|
|
| 31,270,480 |
|
|
| 7,218,616 |
|
|
| 13,642,420 |
|
|
| 38,489,096 |
|
|
| 52,131,516 |
|
|
| (21,078,780 | ) |
|
| 31,052,736 |
|
|
| 0 |
|
Landings at Port Imperial |
| W. New York, NJ |
|
| — |
|
| 1999 |
|
| 276 |
|
|
| 27,246,045 |
|
|
| 37,741,050 |
|
|
| 15,622,471 |
|
|
| 27,246,045 |
|
|
| 53,363,521 |
|
|
| 80,609,566 |
|
|
| (35,393,712 | ) |
|
| 45,215,854 |
|
|
| 0 |
|
Lane |
| Seattle, WA |
| G |
|
| 2019 |
|
| 217 |
|
|
| 13,142,946 |
|
|
| 71,933,303 |
|
|
| 65,928 |
|
|
| 13,142,946 |
|
|
| 71,999,231 |
|
|
| 85,142,177 |
|
|
| (4,558,633 | ) |
|
| 80,583,544 |
|
|
| 0 |
| |
Lex, The |
| San Jose, CA |
|
| — |
|
| 2017 |
|
| 387 |
|
|
| 21,817,512 |
|
|
| 158,778,598 |
|
|
| 462,150 |
|
|
| 21,817,512 |
|
|
| 159,240,748 |
|
|
| 181,058,260 |
|
|
| (15,000,565 | ) |
|
| 166,057,695 |
|
|
| 0 |
|
Liberty Park |
| Braintree, MA |
|
| — |
|
| 2000 |
|
| 202 |
|
|
| 5,977,504 |
|
|
| 26,749,111 |
|
|
| 7,808,575 |
|
|
| 5,977,504 |
|
|
| 34,557,686 |
|
|
| 40,535,190 |
|
|
| (21,422,606 | ) |
|
| 19,112,584 |
|
|
| 0 |
|
Liberty Tower |
| Arlington, VA |
| G |
|
| 2008 |
|
| 235 |
|
|
| 16,382,822 |
|
|
| 83,817,078 |
|
|
| 4,517,251 |
|
|
| 16,382,822 |
|
|
| 88,334,329 |
|
|
| 104,717,151 |
|
|
| (34,837,074 | ) |
|
| 69,880,077 |
|
|
| 0 |
| |
Lincoln Heights |
| Quincy, MA |
|
| — |
|
| 1991 |
|
| 336 |
|
|
| 5,928,400 |
|
|
| 33,595,262 |
|
|
| 15,212,279 |
|
|
| 5,928,400 |
|
|
| 48,807,541 |
|
|
| 54,735,941 |
|
|
| (39,401,499 | ) |
|
| 15,334,442 |
|
|
| 0 |
|
Lofts at Kendall Square (fka Kendall Square) |
| Cambridge, MA |
|
| — |
|
| 1998 |
|
| 186 |
|
|
| 18,696,674 |
|
|
| 78,445,657 |
|
|
| 7,530,710 |
|
|
| 18,696,674 |
|
|
| 85,976,367 |
|
|
| 104,673,041 |
|
|
| (27,734,674 | ) |
|
| 76,938,367 |
|
|
| 0 |
|
Lofts at Kendall Square ll (fka 249 Third Street) |
| Cambridge, MA |
| G |
|
| 2019 |
|
| 84 |
|
|
| 4,603,326 |
|
|
| 44,438,432 |
|
|
| (503 | ) |
|
| 4,603,326 |
|
|
| 44,437,929 |
|
|
| 49,041,255 |
|
|
| (2,109,619 | ) |
|
| 46,931,636 |
|
|
| 0 |
| |
Longacre House |
| New York, NY |
| G |
|
| 2000 |
|
| 293 |
|
|
| 73,170,045 |
|
|
| 53,962,510 |
|
|
| 5,401,688 |
|
|
| 73,170,045 |
|
|
| 59,364,198 |
|
|
| 132,534,243 |
|
|
| (28,246,752 | ) |
|
| 104,287,491 |
|
|
| 0 |
| |
Longfellow Place |
| Boston, MA |
| G |
|
| 1975 |
|
| 710 |
|
|
| 38,264,917 |
|
|
| 132,175,915 |
|
|
| 89,681,781 |
|
|
| 38,264,917 |
|
|
| 221,857,696 |
|
|
| 260,122,613 |
|
|
| (163,889,861 | ) |
|
| 96,232,752 |
|
|
| 0 |
| |
Madox |
| Jersey City, NJ |
| G |
|
| 2013 |
|
| 131 |
|
|
| 9,679,635 |
|
|
| 64,594,205 |
|
|
| 961,691 |
|
|
| 9,679,635 |
|
|
| 65,555,896 |
|
|
| 75,235,531 |
|
|
| (7,494,654 | ) |
|
| 67,740,877 |
|
|
| 0 |
| |
Mantena |
| New York, NY |
| G |
|
| 2012 |
|
| 98 |
|
|
| 22,346,513 |
|
|
| 61,501,158 |
|
|
| 1,480,793 |
|
|
| 22,346,513 |
|
|
| 62,981,951 |
|
|
| 85,328,464 |
|
|
| (20,145,143 | ) |
|
| 65,183,321 |
|
|
| 0 |
| |
Marina 41 (fka Marina Del Rey) |
| Marina Del Rey, CA |
|
| — |
|
| 1973 |
|
| 623 |
|
|
| 0 |
|
|
| 168,842,442 |
|
|
| 9,623,804 |
|
|
| 0 |
|
|
| 178,466,246 |
|
|
| 178,466,246 |
|
|
| (59,646,703 | ) |
|
| 118,819,543 |
|
|
| 0 |
|
Mariposa at Playa Del Rey (fka Playa Del Rey) |
| Playa Del Rey, CA |
|
| — |
|
| 2004 |
|
| 354 |
|
|
| 60,900,000 |
|
|
| 89,311,482 |
|
|
| 7,039,392 |
|
|
| 60,900,000 |
|
|
| 96,350,874 |
|
|
| 157,250,874 |
|
|
| (31,786,197 | ) |
|
| 125,464,677 |
|
|
| 0 |
|
Mark on 8th |
| Seattle, WA |
| G |
|
| 2016 |
|
| 174 |
|
|
| 23,004,387 |
|
|
| 51,148,861 |
|
|
| 172,242 |
|
|
| 23,004,387 |
|
|
| 51,321,103 |
|
|
| 74,325,490 |
|
|
| (6,791,552 | ) |
|
| 67,533,938 |
|
|
| 0 |
| |
Market Street Village |
| San Diego, CA |
|
| — |
|
| 2006 |
|
| 229 |
|
|
| 13,740,000 |
|
|
| 40,757,301 |
|
|
| 2,627,968 |
|
|
| 13,740,000 |
|
|
| 43,385,269 |
|
|
| 57,125,269 |
|
|
| (22,558,686 | ) |
|
| 34,566,583 |
|
|
| 0 |
|
Milano Lofts |
| Los Angeles, CA |
| G |
|
| 1925/2006 |
|
| 99 |
|
|
| 8,125,216 |
|
|
| 27,378,784 |
|
|
| 4,435,789 |
|
|
| 8,125,216 |
|
|
| 31,814,573 |
|
|
| 39,939,789 |
|
|
| (10,534,953 | ) |
|
| 29,404,836 |
|
|
| 0 |
| |
Mill Creek |
| Milpitas, CA |
|
| — |
|
| 1991 |
|
| 516 |
|
|
| 12,858,693 |
|
|
| 57,168,503 |
|
|
| 18,006,191 |
|
|
| 12,858,693 |
|
|
| 75,174,694 |
|
|
| 88,033,387 |
|
|
| (43,305,918 | ) |
|
| 44,727,469 |
|
|
| 0 |
|
S-6
ERP OPERATING LIMITED PARTNERSHIP
Schedule III - Real Estate and Accumulated Depreciation
December 31, 20172020
Description |
|
| Initial Cost to Company |
|
| Cost Capitalized Subsequent to Acquisition (Improvements, net) (E) |
|
| Gross Amount Carried at Close of Period 12/31/17 |
|
|
|
| |||||||||||||||||||||||||||||||||||
Apartment Name |
| Location |
| Retail/ Commercial Space |
|
| Date of Construction |
| Apartment Units (H) |
|
| Land |
|
| Building & Fixtures |
|
| Building & Fixtures |
|
| Land |
|
| Building & Fixtures (A) |
|
| Total (B) |
|
| Accumulated Depreciation (C) |
|
| Investment in Real Estate, Net at 12/31/17 |
|
| Encumbrances |
| |||||||||||
Pegasus |
| Los Angeles, CA |
| G |
|
| 1949/2003 |
|
| 322 |
|
|
| 18,094,052 |
|
|
| 81,905,948 |
|
|
| 4,943,360 |
|
|
| 18,094,052 |
|
|
| 86,849,308 |
|
|
| 104,943,360 |
|
|
| (26,155,411 | ) |
|
| 78,787,949 |
|
|
| — |
| |
Playa Pacifica |
| Hermosa Beach, CA |
|
| — |
|
| 1972 |
|
| 285 |
|
|
| 35,100,000 |
|
|
| 33,473,822 |
|
|
| 22,912,647 |
|
|
| 35,100,000 |
|
|
| 56,386,469 |
|
|
| 91,486,469 |
|
|
| (25,547,975 | ) |
|
| 65,938,494 |
|
|
| — |
|
Portofino |
| Chino Hills, CA |
|
| — |
|
| 1989 |
|
| 176 |
|
|
| 3,572,400 |
|
|
| 14,660,994 |
|
|
| 3,713,205 |
|
|
| 3,572,400 |
|
|
| 18,374,199 |
|
|
| 21,946,599 |
|
|
| (12,779,600 | ) |
|
| 9,166,999 |
|
|
| — |
|
Portofino (Val) |
| Valencia, CA |
|
| — |
|
| 1989 |
|
| 216 |
|
|
| 8,640,000 |
|
|
| 21,487,126 |
|
|
| 5,380,999 |
|
|
| 8,640,000 |
|
|
| 26,868,125 |
|
|
| 35,508,125 |
|
|
| (15,359,183 | ) |
|
| 20,148,942 |
|
|
| — |
|
Portside Towers |
| Jersey City, NJ |
| G |
|
| 1992-1997 |
|
| 527 |
|
|
| 22,487,006 |
|
|
| 96,842,913 |
|
|
| 21,767,146 |
|
|
| 22,487,006 |
|
|
| 118,610,059 |
|
|
| 141,097,065 |
|
|
| (80,249,602 | ) |
|
| 60,847,463 |
|
|
| — |
| |
Potrero 1010 |
| San Francisco, CA |
| G |
|
| 2016 |
|
| 453 |
|
|
| 40,830,011 |
|
|
| 178,932,843 |
|
|
| 16,775 |
|
|
| 40,830,011 |
|
|
| 178,949,618 |
|
|
| 219,779,629 |
|
|
| (11,563,892 | ) |
|
| 208,215,737 |
|
|
| — |
| |
Prado (fka Glendale) |
| Glendale, CA |
|
| — |
|
| 1988 |
|
| 264 |
|
|
| — |
|
|
| 67,977,313 |
|
|
| 3,211,660 |
|
|
| — |
|
|
| 71,188,973 |
|
|
| 71,188,973 |
|
|
| (15,429,230 | ) |
|
| 55,759,743 |
|
|
| — |
|
Prime, The |
| Arlington, VA |
|
| — |
|
| 2002 |
|
| 256 |
|
|
| 32,000,000 |
|
|
| 64,436,539 |
|
|
| 1,417,186 |
|
|
| 32,000,000 |
|
|
| 65,853,725 |
|
|
| 97,853,725 |
|
|
| (27,697,067 | ) |
|
| 70,156,658 |
|
|
| — |
|
Prism at Park Avenue South (fka 400 Park Avenue South) |
| New York, NY |
| G |
|
| 2015 |
|
| 269 |
|
|
| 76,292,169 |
|
|
| 172,553,723 |
|
|
| 90,272 |
|
|
| 76,292,169 |
|
|
| 172,643,995 |
|
|
| 248,936,164 |
|
|
| (18,802,832 | ) |
|
| 230,133,332 |
|
|
| — |
| |
Promenade at Town Center I & II |
| Valencia, CA |
|
| — |
|
| 2001 |
|
| 564 |
|
|
| 28,200,000 |
|
|
| 69,795,915 |
|
|
| 8,077,724 |
|
|
| 28,200,000 |
|
|
| 77,873,639 |
|
|
| 106,073,639 |
|
|
| (38,490,478 | ) |
|
| 67,583,161 |
|
|
| — |
|
Providence |
| Bothell, WA |
|
| — |
|
| 2000 |
|
| 200 |
|
|
| 3,573,621 |
|
|
| 19,055,505 |
|
|
| 2,051,612 |
|
|
| 3,573,621 |
|
|
| 21,107,117 |
|
|
| 24,680,738 |
|
|
| (10,234,226 | ) |
|
| 14,446,512 |
|
|
| — |
|
Quarry Hills |
| Quincy, MA |
|
| — |
|
| 2006 |
|
| 316 |
|
|
| 26,900,000 |
|
|
| 84,411,162 |
|
|
| 2,089,632 |
|
|
| 26,900,000 |
|
|
| 86,500,794 |
|
|
| 113,400,794 |
|
|
| (19,076,341 | ) |
|
| 94,324,453 |
|
|
| — |
|
Radius Koreatown |
| Los Angeles, CA |
|
| — |
|
| 2014/2016 |
|
| 301 |
|
|
| 32,494,154 |
|
|
| 84,645,202 |
|
|
| 22,940 |
|
|
| 32,494,154 |
|
|
| 84,668,142 |
|
|
| 117,162,296 |
|
|
| (2,949,192 | ) |
|
| 114,213,104 |
|
|
| — |
|
Red 160 (fka Redmond Way) |
| Redmond, WA |
| G |
|
| 2011 |
|
| 250 |
|
|
| 15,546,376 |
|
|
| 65,320,010 |
|
|
| 1,166,488 |
|
|
| 15,546,376 |
|
|
| 66,486,498 |
|
|
| 82,032,874 |
|
|
| (16,019,260 | ) |
|
| 66,013,614 |
|
|
| — |
| |
Redmond Court |
| Bellevue, WA |
|
| — |
|
| 1977 |
|
| 206 |
|
|
| 10,300,000 |
|
|
| 33,488,745 |
|
|
| 900,433 |
|
|
| 10,300,000 |
|
|
| 34,389,178 |
|
|
| 44,689,178 |
|
|
| (8,390,947 | ) |
|
| 36,298,231 |
|
|
| — |
|
Regency Palms |
| Huntington Beach, CA |
|
| — |
|
| 1969 |
|
| 310 |
|
|
| 1,857,400 |
|
|
| 16,713,254 |
|
|
| 6,014,242 |
|
|
| 1,857,400 |
|
|
| 22,727,496 |
|
|
| 24,584,896 |
|
|
| (17,510,000 | ) |
|
| 7,074,896 |
|
|
| — |
|
Renaissance Villas |
| Berkeley, CA |
| G |
|
| 1998 |
|
| 34 |
|
|
| 2,458,000 |
|
|
| 4,542,000 |
|
|
| 184,192 |
|
|
| 2,458,000 |
|
|
| 4,726,192 |
|
|
| 7,184,192 |
|
|
| (1,859,882 | ) |
|
| 5,324,310 |
|
|
| — |
| |
Reserve at Empire Lakes |
| Rancho Cucamonga, CA |
|
| — |
|
| 2005 |
|
| 467 |
|
|
| 16,345,000 |
|
|
| 73,080,670 |
|
|
| 3,031,630 |
|
|
| 16,345,000 |
|
|
| 76,112,300 |
|
|
| 92,457,300 |
|
|
| (33,721,496 | ) |
|
| 58,735,804 |
|
|
| — |
|
Reserve at Mountain View (fka Mountain View) |
| Mountain View, CA |
|
| — |
|
| 1965 |
|
| 180 |
|
|
| 27,000,000 |
|
|
| 33,029,605 |
|
|
| 6,606,368 |
|
|
| 27,000,000 |
|
|
| 39,635,973 |
|
|
| 66,635,973 |
|
|
| (8,901,550 | ) |
|
| 57,734,423 |
|
|
| — |
|
Reserve at Potomac Yard |
| Alexandria, VA |
|
| — |
|
| 2002 |
|
| 588 |
|
|
| 11,918,917 |
|
|
| 68,862,641 |
|
|
| 13,703,091 |
|
|
| 11,918,917 |
|
|
| 82,565,732 |
|
|
| 94,484,649 |
|
|
| (38,310,647 | ) |
|
| 56,174,002 |
|
|
| — |
|
Reserve at Town Center I-III (WA) |
| Mill Creek, WA |
| G |
|
| 2001, 2009, 2014 |
|
| 584 |
|
|
| 16,768,705 |
|
|
| 77,511,523 |
|
|
| 3,631,274 |
|
|
| 16,768,705 |
|
|
| 81,142,797 |
|
|
| 97,911,502 |
|
|
| (30,389,852 | ) |
|
| 67,521,650 |
|
|
| — |
| |
Residences at Westgate I (fka Westgate II) |
| Pasadena, CA |
| G |
|
| 2014 |
|
| 252 |
|
|
| 17,859,785 |
|
|
| 109,033,369 |
|
|
| 244,721 |
|
|
| 17,859,785 |
|
|
| 109,278,090 |
|
|
| 127,137,875 |
|
|
| (16,997,966 | ) |
|
| 110,139,909 |
|
|
| — |
| |
Residences at Westgate II (fka Westgate III) |
| Pasadena, CA |
| G |
|
| 2015 |
|
| 88 |
|
|
| 12,118,248 |
|
|
| 40,420,828 |
|
|
| 50,108 |
|
|
| 12,118,248 |
|
|
| 40,470,936 |
|
|
| 52,589,184 |
|
|
| (4,259,073 | ) |
|
| 48,330,111 |
|
|
| — |
| |
Rianna I |
| Seattle, WA |
| G |
|
| 2000 |
|
| 78 |
|
|
| 2,268,160 |
|
|
| 14,864,482 |
|
|
| 594,152 |
|
|
| 2,268,160 |
|
|
| 15,458,634 |
|
|
| 17,726,794 |
|
|
| (5,412,019 | ) |
|
| 12,314,775 |
|
|
| — |
| |
Rianna II |
| Seattle, WA |
| G |
|
| 2002 |
|
| 78 |
|
|
| 2,161,840 |
|
|
| 14,433,614 |
|
|
| 387,624 |
|
|
| 2,161,840 |
|
|
| 14,821,238 |
|
|
| 16,983,078 |
|
|
| (5,134,291 | ) |
|
| 11,848,787 |
|
|
| — |
| |
Ridgewood Village I&II |
| San Diego, CA |
|
| — |
|
| 1997 |
|
| 408 |
|
|
| 11,809,500 |
|
|
| 34,004,048 |
|
|
| 5,628,651 |
|
|
| 11,809,500 |
|
|
| 39,632,699 |
|
|
| 51,442,199 |
|
|
| (24,659,415 | ) |
|
| 26,782,784 |
|
|
| — |
|
Riva Terra I (fka Redwood Shores) |
| Redwood City, CA |
|
| — |
|
| 1986 |
|
| 304 |
|
|
| 34,963,355 |
|
|
| 84,587,658 |
|
|
| 3,238,246 |
|
|
| 34,963,355 |
|
|
| 87,825,904 |
|
|
| 122,789,259 |
|
|
| (20,223,427 | ) |
|
| 102,565,832 |
|
|
| — |
|
Riva Terra II (fka Harborside) |
| Redwood City, CA |
|
| — |
|
| 1986 |
|
| 149 |
|
|
| 17,136,645 |
|
|
| 40,536,531 |
|
|
| 2,064,253 |
|
|
| 17,136,645 |
|
|
| 42,600,784 |
|
|
| 59,737,429 |
|
|
| (9,084,137 | ) |
|
| 50,653,292 |
|
|
| — |
|
Riverpark |
| Redmond, WA |
| G |
|
| 2009 |
|
| 321 |
|
|
| 14,355,000 |
|
|
| 80,894,049 |
|
|
| 3,514,535 |
|
|
| 14,355,000 |
|
|
| 84,408,584 |
|
|
| 98,763,584 |
|
|
| (21,590,814 | ) |
|
| 77,172,770 |
|
|
| — |
| |
Rosecliff II |
| Quincy, MA |
|
| — |
|
| 2005 |
|
| 130 |
|
|
| 4,922,840 |
|
|
| 30,202,160 |
|
|
| 1,107,943 |
|
|
| 4,922,840 |
|
|
| 31,310,103 |
|
|
| 36,232,943 |
|
|
| (9,015,949 | ) |
|
| 27,216,994 |
|
|
| — |
|
Sakura Crossing |
| Los Angeles, CA |
| G |
|
| 2009 |
|
| 230 |
|
|
| 14,641,990 |
|
|
| 42,858,010 |
|
|
| 945,394 |
|
|
| 14,641,990 |
|
|
| 43,803,404 |
|
|
| 58,445,394 |
|
|
| (13,215,641 | ) |
|
| 45,229,753 |
|
|
| — |
| |
Seventh & James |
| Seattle, WA |
|
| — |
|
| 1992 |
|
| 96 |
|
|
| 663,800 |
|
|
| 5,974,803 |
|
|
| 3,891,414 |
|
|
| 663,800 |
|
|
| 9,866,217 |
|
|
| 10,530,017 |
|
|
| (7,394,440 | ) |
|
| 3,135,577 |
|
|
| — |
|
Sheffield Court |
| Arlington, VA |
|
| — |
|
| 1986 |
|
| 597 |
|
|
| 3,342,381 |
|
|
| 31,337,332 |
|
|
| 14,580,051 |
|
|
| 3,342,381 |
|
|
| 45,917,383 |
|
|
| 49,259,764 |
|
|
| (35,827,987 | ) |
|
| 13,431,777 |
|
|
| — |
|
Skycrest |
| Valencia, CA |
|
| — |
|
| 1999 |
|
| 264 |
|
|
| 10,560,000 |
|
|
| 25,574,457 |
|
|
| 4,456,198 |
|
|
| 10,560,000 |
|
|
| 30,030,655 |
|
|
| 40,590,655 |
|
|
| (17,139,075 | ) |
|
| 23,451,580 |
|
|
| — |
|
Skylark |
| Union City, CA |
|
| — |
|
| 1986 |
|
| 174 |
|
|
| 1,781,600 |
|
|
| 16,731,916 |
|
|
| 5,392,507 |
|
|
| 1,781,600 |
|
|
| 22,124,423 |
|
|
| 23,906,023 |
|
|
| (13,428,913 | ) |
|
| 10,477,110 |
|
|
| — |
|
Skyline Terrace |
| Burlingame, CA |
|
| — |
|
| 1967 & 1987 |
|
| 138 |
|
|
| 16,836,000 |
|
|
| 35,414,000 |
|
|
| 5,163,764 |
|
|
| 16,836,000 |
|
|
| 40,577,764 |
|
|
| 57,413,764 |
|
|
| (13,281,197 | ) |
|
| 44,132,567 |
|
|
| — |
|
Skyline Towers |
| Falls Church, VA |
| G |
|
| 1971 |
|
| 939 |
|
|
| 78,278,200 |
|
|
| 91,485,591 |
|
|
| 43,209,046 |
|
|
| 78,278,200 |
|
|
| 134,694,637 |
|
|
| 212,972,837 |
|
|
| (72,629,553 | ) |
|
| 140,343,284 |
|
|
| — |
| |
SoMa II |
| San Francisco, CA |
|
| — |
|
| (F) |
|
| — |
|
|
| 29,406,606 |
|
|
| 5,393,139 |
|
|
| — |
|
|
| 29,406,606 |
|
|
| 5,393,139 |
|
|
| 34,799,745 |
|
|
| — |
|
|
| 34,799,745 |
|
|
| — |
|
Sonterra at Foothill Ranch |
| Foothill Ranch, CA |
|
| — |
|
| 1997 |
|
| 300 |
|
|
| 7,503,400 |
|
|
| 24,048,507 |
|
|
| 5,811,134 |
|
|
| 7,503,400 |
|
|
| 29,859,641 |
|
|
| 37,363,041 |
|
|
| (18,657,410 | ) |
|
| 18,705,631 |
|
|
| — |
|
South City Station (fka South San Francisco) |
| San Francisco, CA |
| G |
|
| 2007 |
|
| 360 |
|
|
| 68,900,000 |
|
|
| 79,476,861 |
|
|
| 2,784,286 |
|
|
| 68,900,000 |
|
|
| 82,261,147 |
|
|
| 151,161,147 |
|
|
| (18,547,168 | ) |
|
| 132,613,979 |
|
|
| — |
| |
Southwood |
| Palo Alto, CA |
|
| — |
|
| 1985 |
|
| 100 |
|
|
| 6,936,600 |
|
|
| 14,324,069 |
|
|
| 4,215,343 |
|
|
| 6,936,600 |
|
|
| 18,539,412 |
|
|
| 25,476,012 |
|
|
| (12,007,752 | ) |
|
| 13,468,260 |
|
|
| — |
|
Springbrook Estates |
| Riverside, CA |
|
| — |
|
| (F) |
|
| — |
|
|
| 18,200,000 |
|
|
| — |
|
|
| — |
|
|
| 18,200,000 |
|
|
| — |
|
|
| 18,200,000 |
|
|
| — |
|
|
| 18,200,000 |
|
|
| — |
|
Springline |
| Seattle, WA |
| G |
|
| 2016 |
|
| 136 |
|
|
| 9,163,666 |
|
|
| 47,910,981 |
|
|
| 149,570 |
|
|
| 9,163,666 |
|
|
| 48,060,551 |
|
|
| 57,224,217 |
|
|
| (2,733,027 | ) |
|
| 54,491,190 |
|
|
| — |
| |
Summerset Village II |
| Chatsworth, CA |
|
| — |
|
| (F) |
|
| — |
|
|
| 260,646 |
|
|
| — |
|
|
| — |
|
|
| 260,646 |
|
|
| — |
|
|
| 260,646 |
|
|
| — |
|
|
| 260,646 |
|
|
| — |
|
Summit at Sausalito (fka Sausalito) |
| Sausalito, CA |
|
| — |
|
| 1978 |
|
| 198 |
|
|
| 26,000,000 |
|
|
| 28,435,024 |
|
|
| 6,286,153 |
|
|
| 26,000,000 |
|
|
| 34,721,177 |
|
|
| 60,721,177 |
|
|
| (9,412,796 | ) |
|
| 51,308,381 |
|
|
| — |
|
Description |
|
| Initial Cost to Company |
|
| Cost Capitalized Subsequent to Acquisition (Improvements, net) (E) |
|
| Gross Amount Carried at Close of Period 12/31/20 |
|
|
|
| |||||||||||||||||||||||||||||||||||
Apartment Name |
| Location |
| Non-Residential Components |
|
| Date of Construction |
| Apartment Units |
|
| Land |
|
| Building & Fixtures |
|
| Building & Fixtures |
|
| Land |
|
| Building & Fixtures (A) |
|
| Total (B) |
|
| Accumulated Depreciation (C) |
|
| Investment in Real Estate, Net at 12/31/20 |
|
| Encumbrances |
| |||||||||||
Mosaic at Metro |
| Hyattsville, MD |
|
| — |
|
| 2008 |
|
| 260 |
|
|
| 0 |
|
|
| 59,580,898 |
|
|
| 1,669,692 |
|
|
| 0 |
|
|
| 61,250,590 |
|
|
| 61,250,590 |
|
|
| (25,749,117 | ) |
|
| 35,501,473 |
|
|
| 0 |
|
Mountain View Redevelopment |
| Mountain View, CA |
|
| — |
|
| (F) |
|
| 0 |
|
|
| 0 |
|
|
| 1,630,338 |
|
|
| 0 |
|
|
| 0 |
|
|
| 1,630,338 |
|
|
| 1,630,338 |
|
|
| 0 |
|
|
| 1,630,338 |
|
|
| 0 |
|
Mozaic at Union Station |
| Los Angeles, CA |
|
| — |
|
| 2007 |
|
| 272 |
|
|
| 8,500,000 |
|
|
| 52,529,446 |
|
|
| 2,595,464 |
|
|
| 8,500,000 |
|
|
| 55,124,910 |
|
|
| 63,624,910 |
|
|
| (27,902,570 | ) |
|
| 35,722,340 |
|
|
| 0 |
|
Murray Hill Tower (fka Murray Hill) |
| New York, NY |
| G |
|
| 1974 |
|
| 270 |
|
|
| 75,800,000 |
|
|
| 102,705,401 |
|
|
| 11,586,703 |
|
|
| 75,800,000 |
|
|
| 114,292,104 |
|
|
| 190,092,104 |
|
|
| (38,926,014 | ) |
|
| 151,166,090 |
|
|
| 0 |
| |
Next on Sixth |
| Los Angeles, CA |
| G |
|
| 2017 |
|
| 398 |
|
|
| 52,509,906 |
|
|
| 136,635,650 |
|
|
| 161,352 |
|
|
| 52,509,906 |
|
|
| 136,797,002 |
|
|
| 189,306,908 |
|
|
| (13,325,292 | ) |
|
| 175,981,616 |
|
|
| 0 |
| |
North Pier at Harborside |
| Jersey City, NJ |
|
| — |
|
| 2003 |
|
| 297 |
|
|
| 4,000,159 |
|
|
| 94,290,590 |
|
|
| 7,943,309 |
|
|
| 4,000,159 |
|
|
| 102,233,899 |
|
|
| 106,234,058 |
|
|
| (57,060,669 | ) |
|
| 49,173,389 |
|
|
| 0 |
|
Northglen |
| Valencia, CA |
|
| — |
|
| 1988 |
|
| 234 |
|
|
| 9,360,000 |
|
|
| 20,778,553 |
|
|
| 7,159,183 |
|
|
| 9,360,000 |
|
|
| 27,937,736 |
|
|
| 37,297,736 |
|
|
| (17,739,770 | ) |
|
| 19,557,966 |
|
|
| 0 |
|
Northpark |
| Burlingame, CA |
|
| — |
|
| 1972 |
|
| 510 |
|
|
| 38,607,000 |
|
|
| 77,472,217 |
|
|
| 15,619,323 |
|
|
| 38,607,000 |
|
|
| 93,091,540 |
|
|
| 131,698,540 |
|
|
| (43,765,024 | ) |
|
| 87,933,516 |
|
|
| 0 |
|
Notch |
| Newcastle, WA |
|
| — |
|
| 2020 |
|
| 158 |
|
|
| 5,463,324 |
|
|
| 43,490,989 |
|
|
| 5,378 |
|
|
| 5,463,324 |
|
|
| 43,496,367 |
|
|
| 48,959,691 |
|
|
| (1,267,355 | ) |
|
| 47,692,336 |
|
|
| 0 |
|
Oak Park Combined |
| Agoura Hills, CA |
|
| — |
|
| 1989 & 1990 |
|
| 444 |
|
|
| 3,390,700 |
|
|
| 30,517,274 |
|
|
| 11,540,745 |
|
|
| 3,390,700 |
|
|
| 42,058,019 |
|
|
| 45,448,719 |
|
|
| (35,268,612 | ) |
|
| 10,180,107 |
|
|
| 0 |
|
Oaks |
| Santa Clarita, CA |
|
| — |
|
| 2000 |
|
| 520 |
|
|
| 23,400,000 |
|
|
| 61,020,438 |
|
|
| 8,845,874 |
|
|
| 23,400,000 |
|
|
| 69,866,312 |
|
|
| 93,266,312 |
|
|
| (41,469,709 | ) |
|
| 51,796,603 |
|
|
| 0 |
|
Oakwood Crystal City |
| Arlington, VA |
|
| — |
|
| 1987 |
|
| 162 |
|
|
| 15,400,000 |
|
|
| 35,474,336 |
|
|
| 4,223,339 |
|
|
| 15,400,000 |
|
|
| 39,697,675 |
|
|
| 55,097,675 |
|
|
| (13,360,668 | ) |
|
| 41,737,007 |
|
|
| 0 |
|
Ocean Crest |
| Solana Beach, CA |
|
| — |
|
| 1986 |
|
| 146 |
|
|
| 5,111,200 |
|
|
| 11,910,438 |
|
|
| 5,063,378 |
|
|
| 5,111,200 |
|
|
| 16,973,816 |
|
|
| 22,085,016 |
|
|
| (12,541,852 | ) |
|
| 9,543,164 |
|
|
| 0 |
|
Odin (fka Tallman) |
| Seattle, WA |
|
| — |
|
| 2015 |
|
| 301 |
|
|
| 16,807,519 |
|
|
| 64,519,515 |
|
|
| 95,579 |
|
|
| 16,807,519 |
|
|
| 64,615,094 |
|
|
| 81,422,613 |
|
|
| (13,686,832 | ) |
|
| 67,735,781 |
|
|
| 0 |
|
One Henry Adams |
| San Francisco, CA |
| G |
|
| 2016 |
|
| 241 |
|
|
| 30,224,393 |
|
|
| 139,564,405 |
|
|
| 75,093 |
|
|
| 30,224,393 |
|
|
| 139,639,498 |
|
|
| 169,863,891 |
|
|
| (22,296,095 | ) |
|
| 147,567,796 |
|
|
| 0 |
| |
One India Street (fka Oakwood Boston) |
| Boston, MA |
| G |
|
| 1901 |
|
| 94 |
|
|
| 22,200,000 |
|
|
| 28,672,979 |
|
|
| 6,922,941 |
|
|
| 22,200,000 |
|
|
| 35,595,920 |
|
|
| 57,795,920 |
|
|
| (11,405,705 | ) |
|
| 46,390,215 |
|
|
| 0 |
| |
Pacific Place |
| Los Angeles, CA |
|
| — |
|
| 2008 |
|
| 430 |
|
|
| 32,250,000 |
|
|
| 110,750,000 |
|
|
| 2,166,746 |
|
|
| 32,250,000 |
|
|
| 112,916,746 |
|
|
| 145,166,746 |
|
|
| (35,114,578 | ) |
|
| 110,052,168 |
|
|
| 0 |
|
Packard Building |
| Seattle, WA |
| G |
|
| 2010 |
|
| 61 |
|
|
| 5,911,041 |
|
|
| 19,954,959 |
|
|
| 1,230,863 |
|
|
| 5,911,041 |
|
|
| 21,185,822 |
|
|
| 27,096,863 |
|
|
| (4,881,973 | ) |
|
| 22,214,890 |
|
|
| 0 |
| |
Parc 77 |
| New York, NY |
| G |
|
| 1903 |
|
| 137 |
|
|
| 40,504,000 |
|
|
| 18,025,679 |
|
|
| 6,888,757 |
|
|
| 40,504,000 |
|
|
| 24,914,436 |
|
|
| 65,418,436 |
|
|
| (14,944,137 | ) |
|
| 50,474,299 |
|
|
| 0 |
| |
Parc Cameron |
| New York, NY |
| G |
|
| 1927 |
|
| 166 |
|
|
| 37,600,000 |
|
|
| 9,855,597 |
|
|
| 7,768,599 |
|
|
| 37,600,000 |
|
|
| 17,624,196 |
|
|
| 55,224,196 |
|
|
| (12,262,578 | ) |
|
| 42,961,618 |
|
|
| 0 |
| |
Parc Coliseum |
| New York, NY |
| G |
|
| 1910 |
|
| 177 |
|
|
| 52,654,000 |
|
|
| 23,045,751 |
|
|
| 9,759,837 |
|
|
| 52,654,000 |
|
|
| 32,805,588 |
|
|
| 85,459,588 |
|
|
| (20,290,750 | ) |
|
| 65,168,838 |
|
|
| 0 |
| |
Parc East Towers |
| New York, NY |
| G |
|
| 1977 |
|
| 324 |
|
|
| 102,163,000 |
|
|
| 108,989,402 |
|
|
| 13,101,902 |
|
|
| 102,163,000 |
|
|
| 122,091,304 |
|
|
| 224,254,304 |
|
|
| (60,987,908 | ) |
|
| 163,266,396 |
|
|
| 0 |
| |
Parc on Powell (fka Parkside at Emeryville) |
| Emeryville, CA |
| G |
|
| 2015 |
|
| 173 |
|
|
| 16,667,059 |
|
|
| 65,100,751 |
|
|
| 753,908 |
|
|
| 16,667,059 |
|
|
| 65,854,659 |
|
|
| 82,521,718 |
|
|
| (14,664,513 | ) |
|
| 67,857,205 |
|
|
| 0 |
| |
Park Connecticut |
| Washington, D.C. |
|
| — |
|
| 2000 |
|
| 142 |
|
|
| 13,700,000 |
|
|
| 59,087,519 |
|
|
| 2,161,224 |
|
|
| 13,700,000 |
|
|
| 61,248,743 |
|
|
| 74,948,743 |
|
|
| (18,692,087 | ) |
|
| 56,256,656 |
|
|
| 0 |
|
Park West (CA) |
| Los Angeles, CA |
|
| — |
|
| 1987/1990 |
|
| 444 |
|
|
| 3,033,500 |
|
|
| 27,302,383 |
|
|
| 12,931,215 |
|
|
| 3,033,500 |
|
|
| 40,233,598 |
|
|
| 43,267,098 |
|
|
| (32,562,373 | ) |
|
| 10,704,725 |
|
|
| 0 |
|
Parkside |
| Union City, CA |
|
| — |
|
| 1979 |
|
| 208 |
|
|
| 6,246,700 |
|
|
| 11,827,453 |
|
|
| 8,446,035 |
|
|
| 6,246,700 |
|
|
| 20,273,488 |
|
|
| 26,520,188 |
|
|
| (14,157,450 | ) |
|
| 12,362,738 |
|
|
| 0 |
|
Pearl, The (WA) |
| Seattle, WA |
| G |
|
| 2008 |
|
| 80 |
|
|
| 6,972,585 |
|
|
| 26,527,415 |
|
|
| 1,126,346 |
|
|
| 6,972,585 |
|
|
| 27,653,761 |
|
|
| 34,626,346 |
|
|
| (6,325,802 | ) |
|
| 28,300,544 |
|
|
| 0 |
| |
Pearl MDR (fka Oakwood Marina Del Rey) |
| Marina Del Rey, CA |
| G |
|
| 1969 |
|
| 597 |
|
|
| 0 |
|
|
| 120,795,359 |
|
|
| 6,550,150 |
|
|
| 0 |
|
|
| 127,345,509 |
|
|
| 127,345,509 |
|
|
| (43,885,705 | ) |
|
| 83,459,804 |
|
|
| 0 |
| |
Pegasus |
| Los Angeles, CA |
| G |
|
| 1949/2003 |
|
| 322 |
|
|
| 18,094,052 |
|
|
| 81,905,948 |
|
|
| 7,302,934 |
|
|
| 18,094,052 |
|
|
| 89,208,882 |
|
|
| 107,302,934 |
|
|
| (35,775,990 | ) |
|
| 71,526,944 |
|
|
| 0 |
| |
Playa Pacifica |
| Hermosa Beach, CA |
|
| — |
|
| 1972 |
|
| 285 |
|
|
| 35,100,000 |
|
|
| 33,473,822 |
|
|
| 24,084,348 |
|
|
| 35,100,000 |
|
|
| 57,558,170 |
|
|
| 92,658,170 |
|
|
| (34,060,220 | ) |
|
| 58,597,950 |
|
|
| 0 |
|
Portofino |
| Chino Hills, CA |
|
| — |
|
| 1989 |
|
| 176 |
|
|
| 3,572,400 |
|
|
| 14,660,994 |
|
|
| 3,963,453 |
|
|
| 3,572,400 |
|
|
| 18,624,447 |
|
|
| 22,196,847 |
|
|
| (14,859,876 | ) |
|
| 7,336,971 |
|
|
| 0 |
|
Portofino (Val) |
| Valencia, CA |
|
| — |
|
| 1989 |
|
| 216 |
|
|
| 8,640,000 |
|
|
| 21,487,126 |
|
|
| 6,277,627 |
|
|
| 8,640,000 |
|
|
| 27,764,753 |
|
|
| 36,404,753 |
|
|
| (18,614,995 | ) |
|
| 17,789,758 |
|
|
| 0 |
|
Portside Towers |
| Jersey City, NJ |
| G |
|
| 1992-1997 |
|
| 527 |
|
|
| 22,487,006 |
|
|
| 96,842,913 |
|
|
| 26,069,539 |
|
|
| 22,487,006 |
|
|
| 122,912,452 |
|
|
| 145,399,458 |
|
|
| (93,853,487 | ) |
|
| 51,545,971 |
|
|
| 0 |
| |
Potrero 1010 |
| San Francisco, CA |
| G |
|
| 2016 |
|
| 453 |
|
|
| 40,830,011 |
|
|
| 181,855,868 |
|
|
| 989,838 |
|
|
| 40,830,011 |
|
|
| 182,845,706 |
|
|
| 223,675,717 |
|
|
| (33,782,465 | ) |
|
| 189,893,252 |
|
|
| 0 |
| |
Prado (fka Glendale) |
| Glendale, CA |
|
| — |
|
| 1988 |
|
| 264 |
|
|
| 0 |
|
|
| 67,977,313 |
|
|
| 6,662,673 |
|
|
| 0 |
|
|
| 74,639,986 |
|
|
| 74,639,986 |
|
|
| (24,014,696 | ) |
|
| 50,625,290 |
|
|
| 0 |
|
Prime, The |
| Arlington, VA |
|
| — |
|
| 2002 |
|
| 281 |
|
|
| 34,625,000 |
|
|
| 77,879,740 |
|
|
| 4,771,834 |
|
|
| 34,625,000 |
|
|
| 82,651,574 |
|
|
| 117,276,574 |
|
|
| (35,430,836 | ) |
|
| 81,845,738 |
|
|
| 0 |
|
Prism at Park Avenue South (fka 400 Park Avenue South) |
| New York, NY |
| G |
|
| 2015 |
|
| 269 |
|
|
| 76,292,169 |
|
|
| 171,726,887 |
|
|
| 231,618 |
|
|
| 76,292,169 |
|
|
| 171,958,505 |
|
|
| 248,250,674 |
|
|
| (38,979,951 | ) |
|
| 209,270,723 |
|
|
| 0 |
| |
Promenade at Town Center I & II |
| Valencia, CA |
|
| — |
|
| 2001 |
|
| 564 |
|
|
| 28,200,000 |
|
|
| 69,795,915 |
|
|
| 12,726,006 |
|
|
| 28,200,000 |
|
|
| 82,521,921 |
|
|
| 110,721,921 |
|
|
| (47,521,592 | ) |
|
| 63,200,329 |
|
|
| 0 |
|
Providence |
| Bothell, WA |
|
| — |
|
| 2000 |
|
| 200 |
|
|
| 3,573,621 |
|
|
| 19,055,505 |
|
|
| 5,058,503 |
|
|
| 3,573,621 |
|
|
| 24,114,008 |
|
|
| 27,687,629 |
|
|
| (13,078,610 | ) |
|
| 14,609,019 |
|
|
| 0 |
|
Quarry Hills |
| Quincy, MA |
|
| — |
|
| 2006 |
|
| 316 |
|
|
| 26,900,000 |
|
|
| 84,411,162 |
|
|
| 4,822,863 |
|
|
| 26,900,000 |
|
|
| 89,234,025 |
|
|
| 116,134,025 |
|
|
| (28,874,667 | ) |
|
| 87,259,358 |
|
|
| 0 |
|
Radius Uptown |
| Denver, CO |
|
| — |
|
| 2017 |
|
| 372 |
|
|
| 13,644,960 |
|
|
| 121,899,084 |
|
|
| 1,070,656 |
|
|
| 13,644,960 |
|
|
| 122,969,740 |
|
|
| 136,614,700 |
|
|
| (14,861,159 | ) |
|
| 121,753,541 |
|
|
| 0 |
|
Red 160 (fka Redmond Way) |
| Redmond, WA |
| G |
|
| 2011 |
|
| 250 |
|
|
| 15,546,376 |
|
|
| 65,320,010 |
|
|
| 1,554,405 |
|
|
| 15,546,376 |
|
|
| 66,874,415 |
|
|
| 82,420,791 |
|
|
| (22,940,448 | ) |
|
| 59,480,343 |
|
|
| 0 |
| |
Redmond Court |
| Bellevue, WA |
|
| — |
|
| 1977 |
|
| 206 |
|
|
| 10,300,000 |
|
|
| 33,488,745 |
|
|
| 1,923,709 |
|
|
| 10,300,000 |
|
|
| 35,412,454 |
|
|
| 45,712,454 |
|
|
| (12,697,765 | ) |
|
| 33,014,689 |
|
|
| 0 |
|
S-7
ERP OPERATING LIMITED PARTNERSHIP
Schedule III - Real Estate and Accumulated Depreciation
December 31, 20172020
Description |
|
| Initial Cost to Company |
|
| Cost Capitalized Subsequent to Acquisition (Improvements, net) (E) |
|
| Gross Amount Carried at Close of Period 12/31/17 |
|
|
|
| |||||||||||||||||||||||||||||||||||||
Apartment Name |
| Location |
| Retail/ Commercial Space |
|
| Date of Construction |
|
| Apartment Units (H) |
|
| Land |
|
| Building & Fixtures |
|
| Building & Fixtures |
|
| Land |
|
| Building & Fixtures (A) |
|
| Total (B) |
|
| Accumulated Depreciation (C) |
|
| Investment in Real Estate, Net at 12/31/17 |
|
| Encumbrances |
| ||||||||||||
Ten23 (fka 500 West 23rd Street) |
| New York, NY |
| G |
|
| 2011 |
|
|
| 111 |
|
|
| — |
|
|
| 58,881,873 |
|
|
| 200,907 |
|
|
| — |
|
|
| 59,082,780 |
|
|
| 59,082,780 |
|
|
| (12,278,031 | ) |
|
| 46,804,749 |
|
|
| — |
| ||
Terraces, The |
| San Francisco, CA |
| G |
|
| 1975 |
|
|
| 117 |
|
|
| 14,087,610 |
|
|
| 16,314,151 |
|
|
| 1,262,327 |
|
|
| 14,087,610 |
|
|
| 17,576,478 |
|
|
| 31,664,088 |
|
|
| (5,789,387 | ) |
|
| 25,874,701 |
|
|
| — |
| ||
Third Square |
| Cambridge, MA |
| G |
|
| 2008/2009 |
|
|
| 471 |
|
|
| 26,767,171 |
|
|
| 218,822,728 |
|
|
| 6,733,059 |
|
|
| 26,767,171 |
|
|
| 225,555,787 |
|
|
| 252,322,958 |
|
|
| (70,108,714 | ) |
|
| 182,214,244 |
|
|
| — |
| ||
Three20 |
| Seattle, WA |
| G |
|
| 2013 |
|
|
| 134 |
|
|
| 7,030,766 |
|
|
| 29,005,762 |
|
|
| 729,045 |
|
|
| 7,030,766 |
|
|
| 29,734,807 |
|
|
| 36,765,573 |
|
|
| (5,577,508 | ) |
|
| 31,188,065 |
|
|
| — |
| ||
Town Center South Commercial Tract |
| St. Charles, MD |
|
| — |
|
| (F) |
|
|
| — |
|
|
| 1,500,000 |
|
|
| 9,394 |
|
|
| — |
|
|
| 1,500,000 |
|
|
| 9,394 |
|
|
| 1,509,394 |
|
|
| — |
|
|
| 1,509,394 |
|
|
| — |
| |
Town Square at Mark Center II |
| Alexandria, VA |
|
| — |
|
| 2001 |
|
|
| 272 |
|
|
| 15,568,464 |
|
|
| 55,029,607 |
|
|
| 3,744,364 |
|
|
| 15,568,464 |
|
|
| 58,773,971 |
|
|
| 74,342,435 |
|
|
| (19,047,027 | ) |
|
| 55,295,408 |
|
|
| — |
| |
Urbana (fka Market Street Landing) |
| Seattle, WA |
| G |
|
| 2014 |
|
|
| 287 |
|
|
| 12,542,418 |
|
|
| 75,766,505 |
|
|
| 346,564 |
|
|
| 12,542,418 |
|
|
| 76,113,069 |
|
|
| 88,655,487 |
|
|
| (14,010,017 | ) |
|
| 74,645,470 |
|
|
| — |
| ||
Uwajimaya Village |
| Seattle, WA |
|
| — |
|
| 2002 |
|
|
| 176 |
|
|
| 8,800,000 |
|
|
| 22,188,288 |
|
|
| 1,728,090 |
|
|
| 8,800,000 |
|
|
| 23,916,378 |
|
|
| 32,716,378 |
|
|
| (10,901,158 | ) |
|
| 21,815,220 |
|
|
| — |
| |
Vantage Pointe |
| San Diego, CA |
| G |
|
| 2009 |
|
|
| 679 |
|
|
| 9,403,960 |
|
|
| 190,596,040 |
|
|
| 9,156,867 |
|
|
| 9,403,960 |
|
|
| 199,752,907 |
|
|
| 209,156,867 |
|
|
| (59,435,552 | ) |
|
| 149,721,315 |
|
|
| — |
| ||
Veloce |
| Redmond, WA |
| G |
|
| 2009 |
|
|
| 322 |
|
|
| 15,322,724 |
|
|
| 76,176,594 |
|
|
| 1,246,516 |
|
|
| 15,322,724 |
|
|
| 77,423,110 |
|
|
| 92,745,834 |
|
|
| (17,729,126 | ) |
|
| 75,016,708 |
|
|
| — |
| ||
Venn at Main |
| Bellevue, WA |
| G |
|
| 2016 |
|
|
| 350 |
|
|
| 26,626,498 |
|
|
| 151,653,323 |
|
|
| 139,573 |
|
|
| 26,626,498 |
|
|
| 151,792,896 |
|
|
| 178,419,394 |
|
|
| (3,058,972 | ) |
|
| 175,360,422 |
|
|
| — |
| ||
Verde Condominium Homes (fka Mission Verde, LLC) |
| San Jose, CA |
|
| — |
|
| 1986 |
|
|
| 108 |
|
|
| 5,190,700 |
|
|
| 9,679,109 |
|
|
| 4,309,244 |
|
|
| 5,190,700 |
|
|
| 13,988,353 |
|
|
| 19,179,053 |
|
|
| (9,877,543 | ) |
|
| 9,301,510 |
|
|
| — |
| |
Veridian (fka Silver Spring) |
| Silver Spring, MD |
| G |
|
| 2009 |
|
|
| 457 |
|
|
| 18,539,817 |
|
|
| 130,407,365 |
|
|
| 3,078,639 |
|
|
| 18,539,817 |
|
|
| 133,486,004 |
|
|
| 152,025,821 |
|
|
| (39,137,932 | ) |
|
| 112,887,889 |
|
|
| — |
| ||
Villa Solana |
| Laguna Hills, CA |
|
| — |
|
| 1984 |
|
|
| 272 |
|
|
| 1,665,100 |
|
|
| 14,985,678 |
|
|
| 9,752,842 |
|
|
| 1,665,100 |
|
|
| 24,738,520 |
|
|
| 26,403,620 |
|
|
| (19,582,595 | ) |
|
| 6,821,025 |
|
|
| — |
| |
Village at Del Mar Heights, The (fka Del Mar Heights) |
| San Diego, CA |
|
| — |
|
| 1986 |
|
|
| 168 |
|
|
| 15,100,000 |
|
|
| 40,859,396 |
|
|
| 1,315,901 |
|
|
| 15,100,000 |
|
|
| 42,175,297 |
|
|
| 57,275,297 |
|
|
| (9,628,990 | ) |
|
| 47,646,307 |
|
|
| — |
| |
Vintage |
| Ontario, CA |
|
| — |
|
| 2005-2007 |
|
|
| 300 |
|
|
| 7,059,230 |
|
|
| 47,677,762 |
|
|
| 1,233,489 |
|
|
| 7,059,230 |
|
|
| 48,911,251 |
|
|
| 55,970,481 |
|
|
| (20,304,558 | ) |
|
| 35,665,923 |
|
|
| — |
| |
Virginia Square |
| Arlington, VA |
| G |
|
| 2002 |
|
|
| 231 |
|
|
| — |
|
|
| 85,940,003 |
|
|
| 4,594,826 |
|
|
| — |
|
|
| 90,534,829 |
|
|
| 90,534,829 |
|
|
| (18,797,549 | ) |
|
| 71,737,280 |
|
|
| — |
| ||
Vista 99 (fka Tasman) |
| San Jose, CA |
|
| — |
|
| 2016 |
|
|
| 554 |
|
|
| 27,709,329 |
|
|
| 176,023,094 |
|
|
| 113,479 |
|
|
| 27,709,329 |
|
|
| 176,136,573 |
|
|
| 203,845,902 |
|
|
| (12,631,445 | ) |
|
| 191,214,457 |
|
|
| — |
| |
Vista Del Lago |
| Mission Viejo, CA |
|
| — |
|
| 1986-1988 |
|
|
| 608 |
|
|
| 4,525,800 |
|
|
| 40,736,293 |
|
|
| 16,741,744 |
|
|
| 4,525,800 |
|
|
| 57,478,037 |
|
|
| 62,003,837 |
|
|
| (46,045,156 | ) |
|
| 15,958,681 |
|
|
| — |
| |
Vista on Courthouse |
| Arlington, VA |
|
| — |
|
| 2008 |
|
|
| 220 |
|
|
| 15,550,260 |
|
|
| 69,449,740 |
|
|
| 1,823,317 |
|
|
| 15,550,260 |
|
|
| 71,273,057 |
|
|
| 86,823,317 |
|
|
| (23,435,882 | ) |
|
| 63,387,435 |
|
|
| — |
| |
Walden Park |
| Cambridge, MA |
|
| — |
|
| 1966 |
|
|
| 232 |
|
|
| 12,448,888 |
|
|
| 52,044,448 |
|
|
| 4,293,327 |
|
|
| 12,448,888 |
|
|
| 56,337,775 |
|
|
| 68,786,663 |
|
|
| (17,603,707 | ) |
|
| 51,182,956 |
|
|
| — |
| |
Water Park Towers |
| Arlington, VA |
|
| — |
|
| 1989 |
|
|
| 362 |
|
|
| 34,400,000 |
|
|
| 108,485,859 |
|
|
| 9,546,702 |
|
|
| 34,400,000 |
|
|
| 118,032,561 |
|
|
| 152,432,561 |
|
|
| (25,460,371 | ) |
|
| 126,972,190 |
|
|
| — |
| |
Watertown Square |
| Watertown, MA |
| G |
|
| 2005 |
|
|
| 134 |
|
|
| 16,800,000 |
|
|
| 34,074,056 |
|
|
| 1,348,261 |
|
|
| 16,800,000 |
|
|
| 35,422,317 |
|
|
| 52,222,317 |
|
|
| (7,618,267 | ) |
|
| 44,604,050 |
|
|
| — |
| ||
West 96th |
| New York, NY |
| G |
|
| 1987 |
|
|
| 207 |
|
|
| 84,800,000 |
|
|
| 67,055,502 |
|
|
| 5,265,243 |
|
|
| 84,800,000 |
|
|
| 72,320,745 |
|
|
| 157,120,745 |
|
|
| (17,919,572 | ) |
|
| 139,201,173 |
|
|
| — |
| ||
West End Apartments (fka Emerson Place/CRP II) |
| Boston, MA |
| G |
|
| 2008 |
|
|
| 310 |
|
|
| 469,546 |
|
|
| 163,123,022 |
|
|
| 2,821,262 |
|
|
| 469,546 |
|
|
| 165,944,284 |
|
|
| 166,413,830 |
|
|
| (55,691,880 | ) |
|
| 110,721,950 |
|
|
| — |
| ||
Westchester at Rockville |
| Rockville, MD |
|
| — |
|
| 2009 |
|
|
| 192 |
|
|
| 10,600,000 |
|
|
| 44,135,207 |
|
|
| 703,338 |
|
|
| 10,600,000 |
|
|
| 44,838,545 |
|
|
| 55,438,545 |
|
|
| (9,691,644 | ) |
|
| 45,746,901 |
|
|
| — |
| |
Westmont |
| New York, NY |
| G |
|
| 1986 |
|
|
| 163 |
|
|
| 64,900,000 |
|
|
| 61,143,259 |
|
|
| 2,724,370 |
|
|
| 64,900,000 |
|
|
| 63,867,629 |
|
|
| 128,767,629 |
|
|
| (14,415,326 | ) |
|
| 114,352,303 |
|
|
| — |
| ||
Westside |
| Los Angeles, CA |
|
| — |
|
| 2004 |
|
|
| 204 |
|
|
| 34,200,000 |
|
|
| 56,962,630 |
|
|
| 2,861,832 |
|
|
| 34,200,000 |
|
|
| 59,824,462 |
|
|
| 94,024,462 |
|
|
| (12,610,533 | ) |
|
| 81,413,929 |
|
|
| — |
| |
Westside Barrington (fka Westside Villas III) |
| Los Angeles, CA |
|
| — |
|
| 1999 |
|
|
| 36 |
|
|
| 3,060,000 |
|
|
| 5,538,871 |
|
|
| 920,282 |
|
|
| 3,060,000 |
|
|
| 6,459,153 |
|
|
| 9,519,153 |
|
|
| (3,618,136 | ) |
|
| 5,901,017 |
|
|
| — |
| |
Westside Barry (Westside Villas VI) |
| Los Angeles, CA |
|
| — |
|
| 1989 |
|
|
| 18 |
|
|
| 1,530,000 |
|
|
| 3,023,523 |
|
|
| 599,854 |
|
|
| 1,530,000 |
|
|
| 3,623,377 |
|
|
| 5,153,377 |
|
|
| (2,053,667 | ) |
|
| 3,099,710 |
|
|
| — |
| |
Westside Beloit (fka Westside Villas I) |
| Los Angeles, CA |
|
| — |
|
| 1999 |
|
|
| 21 |
|
|
| 1,785,000 |
|
|
| 3,233,254 |
|
|
| 628,089 |
|
|
| 1,785,000 |
|
|
| 3,861,343 |
|
|
| 5,646,343 |
|
|
| (2,239,628 | ) |
|
| 3,406,715 |
|
|
| — |
| |
Westside Bundy (fka Westside Villas II) |
| Los Angeles, CA |
|
| — |
|
| 1999 |
|
|
| 23 |
|
|
| 1,955,000 |
|
|
| 3,541,435 |
|
|
| 642,479 |
|
|
| 1,955,000 |
|
|
| 4,183,914 |
|
|
| 6,138,914 |
|
|
| (2,324,838 | ) |
|
| 3,814,076 |
|
|
| — |
| |
Westside Butler (fka Westside Villas IV) |
| Los Angeles, CA |
|
| — |
|
| 1999 |
|
|
| 36 |
|
|
| 3,060,000 |
|
|
| 5,539,390 |
|
|
| 949,817 |
|
|
| 3,060,000 |
|
|
| 6,489,207 |
|
|
| 9,549,207 |
|
|
| (3,619,180 | ) |
|
| 5,930,027 |
|
|
| — |
| |
Westside Villas (fka Westside Villas V &VII) |
| Los Angeles, CA |
|
| — |
|
| 1999 & 2001 |
|
|
| 113 |
|
|
| 9,605,000 |
|
|
| 19,983,385 |
|
|
| 2,493,267 |
|
|
| 9,605,000 |
|
|
| 22,476,652 |
|
|
| 32,081,652 |
|
|
| (12,289,331 | ) |
|
| 19,792,321 |
|
|
| — |
| |
Windridge (CA) |
| Laguna Niguel, CA |
|
| — |
|
| 1989 |
|
|
| 344 |
|
|
| 2,662,900 |
|
|
| 23,985,497 |
|
|
| 10,800,566 |
|
|
| 2,662,900 |
|
|
| 34,786,063 |
|
|
| 37,448,963 |
|
|
| (25,964,327 | ) |
|
| 11,484,636 |
|
|
| — |
| |
Wood Creek I |
| Pleasant Hill, CA |
|
| — |
|
| 1987 |
|
|
| 256 |
|
|
| 9,729,900 |
|
|
| 23,009,768 |
|
|
| 8,661,346 |
|
|
| 9,729,900 |
|
|
| 31,671,114 |
|
|
| 41,401,014 |
|
|
| (21,717,920 | ) |
|
| 19,683,094 |
|
|
| — |
| |
Management Business |
| Chicago, IL |
|
| — |
|
| (D) |
|
|
| — |
|
|
| — |
|
|
| — |
|
|
| 112,328,951 |
|
|
| — |
|
|
| 112,328,951 |
|
|
| 112,328,951 |
|
|
| (92,675,414 | ) |
|
| 19,653,537 |
|
|
| — |
| |
Operating Partnership |
| Chicago, IL |
|
| — |
|
| (F) |
|
|
| — |
|
|
| — |
|
|
| 9,047,067 |
|
|
| — |
|
|
| — |
|
|
| 9,047,067 |
|
|
| 9,047,067 |
|
|
| — |
|
|
| 9,047,067 |
|
|
| — |
| |
Other |
| N/A |
|
| — |
|
|
| — |
|
|
| — |
|
|
| — |
|
|
| — |
|
|
| 70,353 |
|
|
| — |
|
|
| 70,353 |
|
|
| 70,353 |
|
|
| (15,311 | ) |
|
| 55,042 |
|
|
| — |
|
Wholly Owned Unencumbered |
|
|
|
|
|
|
|
|
|
|
|
| 55,954 |
|
|
| 4,618,857,608 |
|
|
| 14,026,732,412 |
|
|
| 1,131,147,795 |
|
|
| 4,618,857,608 |
|
|
| 15,157,880,207 |
|
|
| 19,776,737,815 |
|
|
| (4,363,244,353 | ) |
|
| 15,413,493,462 |
|
|
| — |
|
|
|
|
|
|
|
|
|
|
|
|
|
|
|
|
|
|
|
|
|
|
|
|
|
|
|
|
|
|
|
|
|
|
|
|
|
|
|
|
|
|
|
|
|
|
|
|
|
|
|
|
Wholly Owned Encumbered: |
|
|
|
|
|
|
|
|
|
|
|
|
|
|
|
|
|
|
|
|
|
|
|
|
|
|
|
|
|
|
|
|
|
|
|
|
|
|
|
|
|
|
|
|
|
|
|
|
|
|
101 West End |
| New York, NY |
| G |
|
| 2000 |
|
|
| 506 |
|
|
| 190,600,000 |
|
|
| 131,374,708 |
|
|
| 4,465,890 |
|
|
| 190,600,000 |
|
|
| 135,840,598 |
|
|
| 326,440,598 |
|
|
| (33,939,026 | ) |
|
| 292,501,572 |
|
|
| 103,730,409 |
| ||
1401 Joyce on Pentagon Row |
| Arlington, VA |
|
| — |
|
| 2004 |
|
|
| 326 |
|
|
| 9,780,000 |
|
|
| 89,668,165 |
|
|
| 4,811,215 |
|
|
| 9,780,000 |
|
|
| 94,479,380 |
|
|
| 104,259,380 |
|
|
| (31,540,500 | ) |
|
| 72,718,880 |
|
|
| 57,354,529 |
| |
2501 Porter |
| Washington, D.C. |
|
| — |
|
| 1988 |
|
|
| 202 |
|
|
| 13,000,000 |
|
|
| 75,271,179 |
|
|
| 4,572,192 |
|
|
| 13,000,000 |
|
|
| 79,843,371 |
|
|
| 92,843,371 |
|
|
| (16,734,740 | ) |
|
| 76,108,631 |
|
| (J) |
| ||
300 East 39th (fka East 39th) |
| New York, NY |
| G |
|
| 2001 |
|
|
| 254 |
|
|
| 48,900,000 |
|
|
| 96,174,639 |
|
|
| 3,532,467 |
|
|
| 48,900,000 |
|
|
| 99,707,106 |
|
|
| 148,607,106 |
|
|
| (21,799,732 | ) |
|
| 126,807,374 |
|
|
| 60,451,283 |
| ||
303 East 83rd (fka Camargue) |
| New York, NY |
| G |
|
| 1976 |
|
|
| 261 |
|
|
| 79,400,000 |
|
|
| 79,122,624 |
|
|
| 3,673,574 |
|
|
| 79,400,000 |
|
|
| 82,796,198 |
|
|
| 162,196,198 |
|
|
| (18,995,345 | ) |
|
| 143,200,853 |
|
| (J) |
| |||
425 Broadway |
| Santa Monica, CA |
| G |
|
| 2001 |
|
|
| 101 |
|
|
| 12,600,000 |
|
|
| 34,394,772 |
|
|
| 3,577,985 |
|
|
| 12,600,000 |
|
|
| 37,972,757 |
|
|
| 50,572,757 |
|
|
| (8,081,082 | ) |
|
| 42,491,675 |
|
| (J) |
| |||
Description |
|
| Initial Cost to Company |
|
| Cost Capitalized Subsequent to Acquisition (Improvements, net) (E) |
|
| Gross Amount Carried at Close of Period 12/31/20 |
|
|
|
| |||||||||||||||||||||||||||||||||||
Apartment Name |
| Location |
| Non-Residential Components |
|
| Date of Construction |
| Apartment Units |
|
| Land |
|
| Building & Fixtures |
|
| Building & Fixtures |
|
| Land |
|
| Building & Fixtures (A) |
|
| Total (B) |
|
| Accumulated Depreciation (C) |
|
| Investment in Real Estate, Net at 12/31/20 |
|
| Encumbrances |
| |||||||||||
Regency Palms |
| Huntington Beach, CA |
|
| — |
|
| 1969 |
|
| 310 |
|
|
| 1,857,400 |
|
|
| 16,713,254 |
|
|
| 8,166,256 |
|
|
| 1,857,400 |
|
|
| 24,879,510 |
|
|
| 26,736,910 |
|
|
| (20,072,599 | ) |
|
| 6,664,311 |
|
|
| 0 |
|
Reserve at Clarendon Centre, The |
| Arlington, VA |
| G |
|
| 2003 |
|
| 252 |
|
|
| 10,500,000 |
|
|
| 52,812,935 |
|
|
| 5,015,196 |
|
|
| 10,500,000 |
|
|
| 57,828,131 |
|
|
| 68,328,131 |
|
|
| (34,812,389 | ) |
|
| 33,515,742 |
|
|
| 0 |
| |
Reserve at Eisenhower, The |
| Alexandria, VA |
|
| — |
|
| 2002 |
|
| 226 |
|
|
| 6,500,000 |
|
|
| 34,585,060 |
|
|
| 5,104,139 |
|
|
| 6,500,000 |
|
|
| 39,689,199 |
|
|
| 46,189,199 |
|
|
| (23,797,415 | ) |
|
| 22,391,784 |
|
|
| 0 |
|
Reserve at Empire Lakes |
| Rancho Cucamonga, CA |
|
| — |
|
| 2005 |
|
| 467 |
|
|
| 16,345,000 |
|
|
| 73,080,670 |
|
|
| 5,402,223 |
|
|
| 16,345,000 |
|
|
| 78,482,893 |
|
|
| 94,827,893 |
|
|
| (41,826,076 | ) |
|
| 53,001,817 |
|
|
| 0 |
|
Reserve at Fairfax Corner |
| Fairfax, VA |
|
| — |
|
| 2001 |
|
| 652 |
|
|
| 15,804,057 |
|
|
| 63,129,051 |
|
|
| 13,200,537 |
|
|
| 15,804,057 |
|
|
| 76,329,588 |
|
|
| 92,133,645 |
|
|
| (47,641,317 | ) |
|
| 44,492,328 |
|
|
| 0 |
|
Reserve at Mountain View (fka Mountain View) |
| Mountain View, CA |
|
| — |
|
| 1965 |
|
| 180 |
|
|
| 27,000,000 |
|
|
| 33,029,605 |
|
|
| 7,682,065 |
|
|
| 27,000,000 |
|
|
| 40,711,670 |
|
|
| 67,711,670 |
|
|
| (14,792,142 | ) |
|
| 52,919,528 |
|
|
| 0 |
|
Reserve at Potomac Yard |
| Alexandria, VA |
|
| — |
|
| 2002 |
|
| 588 |
|
|
| 11,918,917 |
|
|
| 68,862,641 |
|
|
| 18,128,215 |
|
|
| 11,918,917 |
|
|
| 86,990,856 |
|
|
| 98,909,773 |
|
|
| (49,807,938 | ) |
|
| 49,101,835 |
|
|
| 0 |
|
Reserve at Town Center I-III (WA) |
| Mill Creek, WA |
| G |
|
| 2001, 2009, 2014 |
|
| 584 |
|
|
| 16,768,705 |
|
|
| 77,623,664 |
|
|
| 9,950,448 |
|
|
| 16,768,705 |
|
|
| 87,574,112 |
|
|
| 104,342,817 |
|
|
| (39,942,888 | ) |
|
| 64,399,929 |
|
|
| 0 |
| |
Residences at Westgate I (fka Westgate II) |
| Pasadena, CA |
| G |
|
| 2014 |
|
| 252 |
|
|
| 17,859,785 |
|
|
| 109,261,438 |
|
|
| 603,327 |
|
|
| 17,859,785 |
|
|
| 109,864,765 |
|
|
| 127,724,550 |
|
|
| (30,747,047 | ) |
|
| 96,977,503 |
|
|
| 0 |
| |
Residences at Westgate II (fka Westgate III) |
| Pasadena, CA |
| G |
|
| 2015 |
|
| 88 |
|
|
| 12,118,248 |
|
|
| 40,486,467 |
|
|
| 119,401 |
|
|
| 12,118,248 |
|
|
| 40,605,868 |
|
|
| 52,724,116 |
|
|
| (9,059,400 | ) |
|
| 43,664,716 |
|
|
| 0 |
| |
Rianna I & II |
| Seattle, WA |
| G |
|
| 2000/2002 |
|
| 156 |
|
|
| 4,430,000 |
|
|
| 29,298,096 |
|
|
| 1,594,173 |
|
|
| 4,430,000 |
|
|
| 30,892,269 |
|
|
| 35,322,269 |
|
|
| (13,558,016 | ) |
|
| 21,764,253 |
|
|
| 0 |
| |
Ridgewood Village I&II |
| San Diego, CA |
|
| — |
|
| 1997 |
|
| 408 |
|
|
| 11,809,500 |
|
|
| 34,004,048 |
|
|
| 6,762,215 |
|
|
| 11,809,500 |
|
|
| 40,766,263 |
|
|
| 52,575,763 |
|
|
| (29,418,122 | ) |
|
| 23,157,641 |
|
|
| 0 |
|
Riva Terra I (fka Redwood Shores) |
| Redwood City, CA |
|
| — |
|
| 1986 |
|
| 304 |
|
|
| 34,963,355 |
|
|
| 84,587,658 |
|
|
| 8,097,405 |
|
|
| 34,963,355 |
|
|
| 92,685,063 |
|
|
| 127,648,418 |
|
|
| (31,553,572 | ) |
|
| 96,094,846 |
|
|
| 0 |
|
Riva Terra II (fka Harborside) |
| Redwood City, CA |
|
| — |
|
| 1986 |
|
| 149 |
|
|
| 17,136,645 |
|
|
| 40,536,531 |
|
|
| 4,063,635 |
|
|
| 17,136,645 |
|
|
| 44,600,166 |
|
|
| 61,736,811 |
|
|
| (13,928,284 | ) |
|
| 47,808,527 |
|
|
| 0 |
|
Riverpark |
| Redmond, WA |
| G |
|
| 2009 |
|
| 321 |
|
|
| 14,355,000 |
|
|
| 80,894,049 |
|
|
| 4,803,736 |
|
|
| 14,355,000 |
|
|
| 85,697,785 |
|
|
| 100,052,785 |
|
|
| (30,548,447 | ) |
|
| 69,504,338 |
|
|
| 0 |
| |
Rivington, The |
| Hoboken, NJ |
|
| — |
|
| 1999 |
|
| 240 |
|
|
| 34,340,640 |
|
|
| 112,730,596 |
|
|
| 3,283,711 |
|
|
| 34,340,640 |
|
|
| 116,014,307 |
|
|
| 150,354,947 |
|
|
| (15,662,554 | ) |
|
| 134,692,393 |
|
|
| 0 |
|
Rosecliff II |
| Quincy, MA |
|
| — |
|
| 2005 |
|
| 130 |
|
|
| 4,922,840 |
|
|
| 30,202,160 |
|
|
| 1,801,272 |
|
|
| 4,922,840 |
|
|
| 32,003,432 |
|
|
| 36,926,272 |
|
|
| (12,228,816 | ) |
|
| 24,697,456 |
|
|
| 0 |
|
Sakura Crossing |
| Los Angeles, CA |
| G |
|
| 2009 |
|
| 230 |
|
|
| 14,641,990 |
|
|
| 42,858,010 |
|
|
| 1,561,995 |
|
|
| 14,641,990 |
|
|
| 44,420,005 |
|
|
| 59,061,995 |
|
|
| (17,561,315 | ) |
|
| 41,500,680 |
|
|
| 0 |
| |
Saxton |
| Seattle, WA |
| G |
|
| 2019 |
|
| 325 |
|
|
| 38,805,400 |
|
|
| 128,652,023 |
|
|
| 373,996 |
|
|
| 38,805,400 |
|
|
| 129,026,019 |
|
|
| 167,831,419 |
|
|
| (9,518,028 | ) |
|
| 158,313,391 |
|
|
| 0 |
| |
Seventh & James |
| Seattle, WA |
| G |
|
| 1992 |
|
| 96 |
|
|
| 663,800 |
|
|
| 5,974,803 |
|
|
| 4,639,194 |
|
|
| 663,800 |
|
|
| 10,613,997 |
|
|
| 11,277,797 |
|
|
| (8,600,004 | ) |
|
| 2,677,793 |
|
|
| 0 |
| |
Sheffield Court |
| Arlington, VA |
|
| — |
|
| 1986 |
|
| 597 |
|
|
| 3,342,381 |
|
|
| 31,337,332 |
|
|
| 18,847,422 |
|
|
| 3,342,381 |
|
|
| 50,184,754 |
|
|
| 53,527,135 |
|
|
| (41,685,265 | ) |
|
| 11,841,870 |
|
|
| 0 |
|
Siena Terrace |
| Lake Forest, CA |
|
| — |
|
| 1988 |
|
| 356 |
|
|
| 8,900,000 |
|
|
| 24,083,024 |
|
|
| 8,661,820 |
|
|
| 8,900,000 |
|
|
| 32,744,844 |
|
|
| 41,644,844 |
|
|
| (24,001,604 | ) |
|
| 17,643,240 |
|
|
| 0 |
|
Skycrest |
| Valencia, CA |
|
| — |
|
| 1999 |
|
| 264 |
|
|
| 10,560,000 |
|
|
| 25,574,457 |
|
|
| 6,581,900 |
|
|
| 10,560,000 |
|
|
| 32,156,357 |
|
|
| 42,716,357 |
|
|
| (21,036,234 | ) |
|
| 21,680,123 |
|
|
| 0 |
|
Skylark |
| Union City, CA |
|
| — |
|
| 1986 |
|
| 174 |
|
|
| 1,781,600 |
|
|
| 16,731,916 |
|
|
| 5,763,877 |
|
|
| 1,781,600 |
|
|
| 22,495,793 |
|
|
| 24,277,393 |
|
|
| (16,357,971 | ) |
|
| 7,919,422 |
|
|
| 0 |
|
Skyview |
| Rancho Santa Margarita, CA |
|
| — |
|
| 1999 |
|
| 260 |
|
|
| 3,380,000 |
|
|
| 21,952,863 |
|
|
| 6,109,768 |
|
|
| 3,380,000 |
|
|
| 28,062,631 |
|
|
| 31,442,631 |
|
|
| (20,168,570 | ) |
|
| 11,274,061 |
|
|
| 0 |
|
SoMa II |
| San Francisco, CA |
|
| — |
|
| (F) |
|
| 0 |
|
|
| 29,406,606 |
|
|
| 5,913,784 |
|
|
| 0 |
|
|
| 29,406,606 |
|
|
| 5,913,784 |
|
|
| 35,320,390 |
|
|
| 0 |
|
|
| 35,320,390 |
|
|
| 0 |
|
Sonterra at Foothill Ranch |
| Foothill Ranch, CA |
|
| — |
|
| 1997 |
|
| 300 |
|
|
| 7,503,400 |
|
|
| 24,048,507 |
|
|
| 6,242,034 |
|
|
| 7,503,400 |
|
|
| 30,290,541 |
|
|
| 37,793,941 |
|
|
| (22,570,636 | ) |
|
| 15,223,305 |
|
|
| 0 |
|
South City Station (fka South San Francisco) |
| San Francisco, CA |
| G |
|
| 2007 |
|
| 368 |
|
|
| 68,900,000 |
|
|
| 79,476,861 |
|
|
| 5,874,314 |
|
|
| 68,900,000 |
|
|
| 85,351,175 |
|
|
| 154,251,175 |
|
|
| (27,619,642 | ) |
|
| 126,631,533 |
|
|
| 0 |
| |
Southwood |
| Palo Alto, CA |
|
| — |
|
| 1985 |
|
| 100 |
|
|
| 6,936,600 |
|
|
| 14,324,069 |
|
|
| 7,029,392 |
|
|
| 6,936,600 |
|
|
| 21,353,461 |
|
|
| 28,290,061 |
|
|
| (14,889,800 | ) |
|
| 13,400,261 |
|
|
| 0 |
|
Springline |
| Seattle, WA |
| G |
|
| 2016 |
|
| 136 |
|
|
| 9,163,667 |
|
|
| 47,910,981 |
|
|
| 462,653 |
|
|
| 9,163,667 |
|
|
| 48,373,634 |
|
|
| 57,537,301 |
|
|
| (8,167,981 | ) |
|
| 49,369,320 |
|
|
| 0 |
| |
STOA |
| Los Angeles, CA |
| G |
|
| 2017 |
|
| 237 |
|
|
| 25,326,048 |
|
|
| 79,976,031 |
|
|
| 466,898 |
|
|
| 25,326,048 |
|
|
| 80,442,929 |
|
|
| 105,768,977 |
|
|
| (8,160,539 | ) |
|
| 97,608,438 |
|
|
| 0 |
| |
Summerset Village |
| Chatsworth, CA |
|
| — |
|
| 1985 |
|
| 280 |
|
|
| 2,890,450 |
|
|
| 23,670,889 |
|
|
| 8,738,634 |
|
|
| 2,890,450 |
|
|
| 32,409,523 |
|
|
| 35,299,973 |
|
|
| (26,387,722 | ) |
|
| 8,912,251 |
|
|
| 0 |
|
Summit at Sausalito (fka Sausalito) |
| Sausalito, CA |
|
| — |
|
| 1978 |
|
| 198 |
|
|
| 26,000,000 |
|
|
| 28,435,024 |
|
|
| 9,988,645 |
|
|
| 26,000,000 |
|
|
| 38,423,669 |
|
|
| 64,423,669 |
|
|
| (15,803,477 | ) |
|
| 48,620,192 |
|
|
| 0 |
|
Ten23 (fka 500 West 23rd Street) |
| New York, NY |
| G |
|
| 2011 |
|
| 111 |
|
|
| 0 |
|
|
| 58,881,873 |
|
|
| 1,160,581 |
|
|
| 0 |
|
|
| 60,042,454 |
|
|
| 60,042,454 |
|
|
| (18,298,459 | ) |
|
| 41,743,995 |
|
|
| 0 |
| |
Terraces, The |
| San Francisco, CA |
| G |
|
| 1975 |
|
| 117 |
|
|
| 14,087,610 |
|
|
| 16,314,151 |
|
|
| 2,504,676 |
|
|
| 14,087,610 |
|
|
| 18,818,827 |
|
|
| 32,906,437 |
|
|
| (7,920,298 | ) |
|
| 24,986,139 |
|
|
| 0 |
| |
Third Square |
| Cambridge, MA |
| G |
|
| 2008/2009 |
|
| 471 |
|
|
| 26,767,171 |
|
|
| 218,822,728 |
|
|
| 9,395,974 |
|
|
| 26,767,171 |
|
|
| 228,218,702 |
|
|
| 254,985,873 |
|
|
| (94,757,814 | ) |
|
| 160,228,059 |
|
|
| 0 |
| |
Three20 |
| Seattle, WA |
| G |
|
| 2013 |
|
| 134 |
|
|
| 7,030,766 |
|
|
| 29,005,762 |
|
|
| 969,854 |
|
|
| 7,030,766 |
|
|
| 29,975,616 |
|
|
| 37,006,382 |
|
|
| (8,984,046 | ) |
|
| 28,022,336 |
|
|
| 0 |
| |
Toscana |
| Irvine, CA |
|
| — |
|
| 1991/1993 |
|
| 563 |
|
|
| 39,410,000 |
|
|
| 50,806,072 |
|
|
| 25,605,818 |
|
|
| 39,410,000 |
|
|
| 76,411,890 |
|
|
| 115,821,890 |
|
|
| (48,052,411 | ) |
|
| 67,769,479 |
|
|
| 0 |
|
Town Square at Mark Center I&II |
| Alexandria, VA |
|
| — |
|
| 1996 |
|
| 678 |
|
|
| 39,928,464 |
|
|
| 141,208,321 |
|
|
| 14,623,345 |
|
|
| 39,928,464 |
|
|
| 155,831,666 |
|
|
| 195,760,130 |
|
|
| (76,590,730 | ) |
|
| 119,169,400 |
|
|
| 0 |
|
Troy Boston |
| Boston, MA |
| G |
|
| 2015 |
|
| 378 |
|
|
| 34,641,051 |
|
|
| 181,607,331 |
|
|
| 2,157,467 |
|
|
| 34,641,051 |
|
|
| 183,764,798 |
|
|
| 218,405,849 |
|
|
| (23,789,711 | ) |
|
| 194,616,138 |
|
|
| 0 |
| |
Urbana (fka Market Street Landing) |
| Seattle, WA |
| G |
|
| 2014 |
|
| 289 |
|
|
| 12,542,418 |
|
|
| 75,800,090 |
|
|
| 2,625,630 |
|
|
| 12,542,418 |
|
|
| 78,425,720 |
|
|
| 90,968,138 |
|
|
| (23,312,467 | ) |
|
| 67,655,671 |
|
|
| 0 |
| |
S-8
ERP OPERATING LIMITED PARTNERSHIP
Schedule III - Real Estate and Accumulated Depreciation
December 31, 20172020
Description |
|
| Initial Cost to Company |
|
| Cost Capitalized Subsequent to Acquisition (Improvements, net) (E) |
|
| Gross Amount Carried at Close of Period 12/31/17 |
|
|
|
| |||||||||||||||||||||||||||||||||||
Apartment Name |
| Location |
| Retail/ Commercial Space |
|
| Date of Construction |
| Apartment Units (H) |
|
| Land |
|
| Building & Fixtures |
|
| Building & Fixtures |
|
| Land |
|
| Building & Fixtures (A) |
|
| Total (B) |
|
| Accumulated Depreciation (C) |
|
| Investment in Real Estate, Net at 12/31/17 |
|
| Encumbrances |
| |||||||||||
55 West Fifth I & II (fka Townhouse Plaza and Gardens) |
| San Mateo, CA |
|
| — |
|
| 1964/1972 |
|
| 241 |
|
|
| 21,041,710 |
|
|
| 71,931,323 |
|
|
| 12,415,912 |
|
|
| 21,041,710 |
|
|
| 84,347,235 |
|
|
| 105,388,945 |
|
|
| (21,523,119 | ) |
|
| 83,865,826 |
|
|
| 26,356,053 |
|
800 Sixth Ave (fka Chelsea) |
| New York, NY |
| G |
|
| 2003 |
|
| 266 |
|
|
| 59,900,000 |
|
|
| 155,861,605 |
|
|
| 2,180,446 |
|
|
| 59,900,000 |
|
|
| 158,042,051 |
|
|
| 217,942,051 |
|
|
| (32,855,478 | ) |
|
| 185,086,573 |
|
|
| 77,654,125 |
| |
929 Mass (fka 929 House) |
| Cambridge, MA |
| G |
|
| 1975 |
|
| 127 |
|
|
| 3,252,993 |
|
|
| 21,745,595 |
|
|
| 6,801,241 |
|
|
| 3,252,993 |
|
|
| 28,546,836 |
|
|
| 31,799,829 |
|
|
| (17,379,493 | ) |
|
| 14,420,336 |
|
|
| 578,381 |
| |
Academy Village |
| North Hollywood, CA |
|
| — |
|
| 1989 |
|
| 248 |
|
|
| 25,000,000 |
|
|
| 23,593,194 |
|
|
| 8,511,551 |
|
|
| 25,000,000 |
|
|
| 32,104,745 |
|
|
| 57,104,745 |
|
|
| (18,102,739 | ) |
|
| 39,002,006 |
|
|
| 19,965,907 |
|
Alcyone |
| Seattle, WA |
| G |
|
| 2004 |
|
| 162 |
|
|
| 11,379,497 |
|
|
| 49,360,503 |
|
|
| 973,758 |
|
|
| 11,379,497 |
|
|
| 50,334,261 |
|
|
| 61,713,758 |
|
|
| (7,663,311 | ) |
|
| 54,050,447 |
|
|
| 28,247,417 |
| |
Arches, The |
| Sunnyvale, CA |
|
| — |
|
| 1974 |
|
| 410 |
|
|
| 26,650,000 |
|
|
| 62,850,000 |
|
|
| 1,807,099 |
|
|
| 26,650,000 |
|
|
| 64,657,099 |
|
|
| 91,307,099 |
|
|
| (20,704,043 | ) |
|
| 70,603,056 |
|
| (I) |
| |
Artisan Square |
| Northridge, CA |
|
| — |
|
| 2002 |
|
| 140 |
|
|
| 7,000,000 |
|
|
| 20,537,359 |
|
|
| 1,462,204 |
|
|
| 7,000,000 |
|
|
| 21,999,563 |
|
|
| 28,999,563 |
|
|
| (11,523,867 | ) |
|
| 17,475,696 |
|
|
| 22,757,833 |
|
Avanti |
| Anaheim, CA |
|
| — |
|
| 1987 |
|
| 162 |
|
|
| 12,960,000 |
|
|
| 18,497,682 |
|
|
| 3,682,239 |
|
|
| 12,960,000 |
|
|
| 22,179,921 |
|
|
| 35,139,921 |
|
|
| (9,463,903 | ) |
|
| 25,676,018 |
|
|
| 25,012,978 |
|
Avenir Apartments |
| Boston, MA |
| G |
|
| 2009 |
|
| 241 |
|
|
| — |
|
|
| 114,321,618 |
|
|
| 1,981,881 |
|
|
| — |
|
|
| 116,303,499 |
|
|
| 116,303,499 |
|
|
| (24,093,714 | ) |
|
| 92,209,785 |
|
|
| 88,921,043 |
| |
Bella Vista I, II, III Combined |
| Woodland Hills, CA |
|
| — |
|
| 2003-2007 |
|
| 579 |
|
|
| 31,682,754 |
|
|
| 121,095,786 |
|
|
| 6,014,382 |
|
|
| 31,682,754 |
|
|
| 127,110,168 |
|
|
| 158,792,922 |
|
|
| (53,777,824 | ) |
|
| 105,015,098 |
|
|
| 57,907,496 |
|
Berkeleyan |
| Berkeley, CA |
| G |
|
| 1998 |
|
| 56 |
|
|
| 4,377,000 |
|
|
| 16,022,110 |
|
|
| 382,895 |
|
|
| 4,377,000 |
|
|
| 16,405,005 |
|
|
| 20,782,005 |
|
|
| (6,678,279 | ) |
|
| 14,103,726 |
|
|
| 8,194,316 |
| |
Calvert Woodley |
| Washington, D.C. |
|
| — |
|
| 1962 |
|
| 136 |
|
|
| 12,600,000 |
|
|
| 43,527,379 |
|
|
| 2,058,223 |
|
|
| 12,600,000 |
|
|
| 45,585,602 |
|
|
| 58,185,602 |
|
|
| (10,036,657 | ) |
|
| 48,148,945 |
|
| (J) |
| |
Carmel Terrace |
| San Diego, CA |
|
| — |
|
| 1988-1989 |
|
| 384 |
|
|
| 2,288,300 |
|
|
| 20,596,281 |
|
|
| 11,891,883 |
|
|
| 2,288,300 |
|
|
| 32,488,164 |
|
|
| 34,776,464 |
|
|
| (26,616,700 | ) |
|
| 8,159,764 |
|
| (I) |
| |
Chelsea Square |
| Redmond, WA |
|
| — |
|
| 1991 |
|
| 113 |
|
|
| 3,397,100 |
|
|
| 9,289,074 |
|
|
| 2,525,829 |
|
|
| 3,397,100 |
|
|
| 11,814,903 |
|
|
| 15,212,003 |
|
|
| (7,732,982 | ) |
|
| 7,479,021 |
|
|
| 9,219,668 |
|
Citrus Suites |
| Santa Monica, CA |
|
| — |
|
| 1978 |
|
| 70 |
|
|
| 9,000,000 |
|
|
| 16,950,326 |
|
|
| 1,886,846 |
|
|
| 9,000,000 |
|
|
| 18,837,172 |
|
|
| 27,837,172 |
|
|
| (4,064,530 | ) |
|
| 23,772,642 |
|
| (J) |
| |
Cleveland House |
| Washington, D.C. |
|
| — |
|
| 1953 |
|
| 214 |
|
|
| 18,300,000 |
|
|
| 66,392,414 |
|
|
| 3,953,014 |
|
|
| 18,300,000 |
|
|
| 70,345,428 |
|
|
| 88,645,428 |
|
|
| (15,198,718 | ) |
|
| 73,446,710 |
|
| (J) |
| |
Columbia Crossing |
| Arlington, VA |
|
| — |
|
| 1991 |
|
| 247 |
|
|
| 23,500,000 |
|
|
| 53,045,073 |
|
|
| 2,637,583 |
|
|
| 23,500,000 |
|
|
| 55,682,656 |
|
|
| 79,182,656 |
|
|
| (12,776,595 | ) |
|
| 66,406,061 |
|
| (J) |
| |
Deerwood (SD) |
| San Diego, CA |
|
| — |
|
| 1990 |
|
| 316 |
|
|
| 2,082,095 |
|
|
| 18,739,815 |
|
|
| 14,811,438 |
|
|
| 2,082,095 |
|
|
| 33,551,253 |
|
|
| 35,633,348 |
|
|
| (28,255,938 | ) |
|
| 7,377,410 |
|
| (I) |
| |
Del Mar Ridge |
| San Diego, CA |
|
| — |
|
| 1998 |
|
| 181 |
|
|
| 7,801,824 |
|
|
| 36,948,176 |
|
|
| 3,819,678 |
|
|
| 7,801,824 |
|
|
| 40,767,854 |
|
|
| 48,569,678 |
|
|
| (14,687,909 | ) |
|
| 33,881,769 |
|
|
| 39,502,426 |
|
Estancia at Santa Clara (fka Santa Clara) |
| Santa Clara, CA |
|
| — |
|
| 2000 |
|
| 450 |
|
|
| — |
|
|
| 123,759,804 |
|
|
| 1,306,632 |
|
|
| — |
|
|
| 125,066,436 |
|
|
| 125,066,436 |
|
|
| (27,568,376 | ) |
|
| 97,498,060 |
|
| (J) |
| |
Fairchase |
| Fairfax, VA |
|
| — |
|
| 2007 |
|
| 392 |
|
|
| 23,500,000 |
|
|
| 87,722,321 |
|
|
| 956,574 |
|
|
| 23,500,000 |
|
|
| 88,678,895 |
|
|
| 112,178,895 |
|
|
| (18,576,327 | ) |
|
| 93,602,568 |
|
| (J) |
| |
Fairfield |
| Stamford, CT |
| G |
|
| 1996 |
|
| 263 |
|
|
| 6,510,200 |
|
|
| 39,690,120 |
|
|
| 7,711,222 |
|
|
| 6,510,200 |
|
|
| 47,401,342 |
|
|
| 53,911,542 |
|
|
| (32,614,560 | ) |
|
| 21,296,982 |
|
|
| 31,314,687 |
| |
Fine Arts Building |
| Berkeley, CA |
| G |
|
| 2004 |
|
| 100 |
|
|
| 7,817,000 |
|
|
| 26,462,772 |
|
|
| 379,630 |
|
|
| 7,817,000 |
|
|
| 26,842,402 |
|
|
| 34,659,402 |
|
|
| (10,821,726 | ) |
|
| 23,837,676 |
|
|
| 15,964,066 |
| |
Flats at DuPont Circle |
| Washington, D.C. |
|
| — |
|
| 1967 |
|
| 306 |
|
|
| 35,200,000 |
|
|
| 108,768,198 |
|
|
| 1,152,022 |
|
|
| 35,200,000 |
|
|
| 109,920,220 |
|
|
| 145,120,220 |
|
|
| (22,256,517 | ) |
|
| 122,863,703 |
|
| (J) |
| |
Gaia Building |
| Berkeley, CA |
| G |
|
| 2000 |
|
| 91 |
|
|
| 7,113,000 |
|
|
| 25,623,826 |
|
|
| 317,100 |
|
|
| 7,113,000 |
|
|
| 25,940,926 |
|
|
| 33,053,926 |
|
|
| (10,427,553 | ) |
|
| 22,626,373 |
|
|
| 14,501,551 |
| |
Gaithersburg Station |
| Gaithersburg, MD |
| G |
|
| 2013 |
|
| 389 |
|
|
| 17,500,000 |
|
|
| 74,678,917 |
|
|
| 814,507 |
|
|
| 17,500,000 |
|
|
| 75,493,424 |
|
|
| 92,993,424 |
|
|
| (15,197,790 | ) |
|
| 77,795,634 |
|
|
| 95,368,543 |
| |
Glo |
| Los Angeles, CA |
| G |
|
| 2008 |
|
| 201 |
|
|
| 16,047,022 |
|
|
| 48,650,963 |
|
|
| 3,068,235 |
|
|
| 16,047,022 |
|
|
| 51,719,198 |
|
|
| 67,766,220 |
|
|
| (14,061,824 | ) |
|
| 53,704,396 |
|
|
| 32,031,227 |
| |
Hathaway |
| Long Beach, CA |
|
| — |
|
| 1987 |
|
| 385 |
|
|
| 2,512,500 |
|
|
| 22,611,912 |
|
|
| 9,165,543 |
|
|
| 2,512,500 |
|
|
| 31,777,455 |
|
|
| 34,289,955 |
|
|
| (24,359,922 | ) |
|
| 9,930,033 |
|
|
| 46,479,980 |
|
Heights on Capitol Hill |
| Seattle, WA |
| G |
|
| 2006 |
|
| 104 |
|
|
| 5,425,000 |
|
|
| 21,138,028 |
|
|
| 1,483,284 |
|
|
| 5,425,000 |
|
|
| 22,621,312 |
|
|
| 28,046,312 |
|
|
| (9,090,011 | ) |
|
| 18,956,301 |
|
|
| 25,887,074 |
| |
Kelvin Court (fka Alta Pacific) |
| Irvine, CA |
|
| — |
|
| 2008 |
|
| 132 |
|
|
| 10,752,145 |
|
|
| 34,628,115 |
|
|
| 648,366 |
|
|
| 10,752,145 |
|
|
| 35,276,481 |
|
|
| 46,028,626 |
|
|
| (11,953,874 | ) |
|
| 34,074,752 |
|
|
| 26,226,033 |
|
Kenwood Mews |
| Burbank, CA |
|
| — |
|
| 1991 |
|
| 141 |
|
|
| 14,100,000 |
|
|
| 24,662,883 |
|
|
| 3,580,534 |
|
|
| 14,100,000 |
|
|
| 28,243,417 |
|
|
| 42,343,417 |
|
|
| (12,733,507 | ) |
|
| 29,609,910 |
|
| (I) |
| |
La Terrazza at Colma Station |
| Colma, CA |
| G |
|
| 2005 |
|
| 155 |
|
|
| — |
|
|
| 41,251,044 |
|
|
| 1,206,497 |
|
|
| — |
|
|
| 42,457,541 |
|
|
| 42,457,541 |
|
|
| (16,832,082 | ) |
|
| 25,625,459 |
|
|
| 24,987,438 |
| |
Laguna Clara |
| Santa Clara, CA |
|
| — |
|
| 1972 |
|
| 264 |
|
|
| 13,642,420 |
|
|
| 29,707,475 |
|
|
| 4,969,596 |
|
|
| 13,642,420 |
|
|
| 34,677,071 |
|
|
| 48,319,491 |
|
|
| (18,383,225 | ) |
|
| 29,936,266 |
|
| (I) |
| |
Liberty Park |
| Braintree, MA |
|
| — |
|
| 2000 |
|
| 202 |
|
|
| 5,977,504 |
|
|
| 26,749,111 |
|
|
| 6,357,010 |
|
|
| 5,977,504 |
|
|
| 33,106,121 |
|
|
| 39,083,625 |
|
|
| (17,080,472 | ) |
|
| 22,003,153 |
|
|
| 24,956,877 |
|
Liberty Tower |
| Arlington, VA |
| G |
|
| 2008 |
|
| 235 |
|
|
| 16,382,822 |
|
|
| 83,817,078 |
|
|
| 1,975,311 |
|
|
| 16,382,822 |
|
|
| 85,792,389 |
|
|
| 102,175,211 |
|
|
| (26,194,514 | ) |
|
| 75,980,697 |
|
|
| 43,515,440 |
| |
Longview Place |
| Waltham, MA |
|
| — |
|
| 2004 |
|
| 348 |
|
|
| 20,880,000 |
|
|
| 90,255,509 |
|
|
| 5,422,745 |
|
|
| 20,880,000 |
|
|
| 95,678,254 |
|
|
| 116,558,254 |
|
|
| (41,854,802 | ) |
|
| 74,703,452 |
|
|
| 70,793,963 |
|
Market Street Village |
| San Diego, CA |
|
| — |
|
| 2006 |
|
| 229 |
|
|
| 13,740,000 |
|
|
| 40,757,301 |
|
|
| 2,123,013 |
|
|
| 13,740,000 |
|
|
| 42,880,314 |
|
|
| 56,620,314 |
|
|
| (18,041,199 | ) |
|
| 38,579,115 |
|
| (I) |
| |
Metro on First |
| Seattle, WA |
| G |
|
| 2002 |
|
| 102 |
|
|
| 8,540,000 |
|
|
| 12,209,981 |
|
|
| 2,141,118 |
|
|
| 8,540,000 |
|
|
| 14,351,099 |
|
|
| 22,891,099 |
|
|
| (5,948,086 | ) |
|
| 16,943,013 |
|
|
| 22,629,291 |
| |
Mill Creek |
| Milpitas, CA |
|
| — |
|
| 1991 |
|
| 516 |
|
|
| 12,858,693 |
|
|
| 57,168,503 |
|
|
| 9,899,985 |
|
|
| 12,858,693 |
|
|
| 67,068,488 |
|
|
| 79,927,181 |
|
|
| (33,621,630 | ) |
|
| 46,305,551 |
|
|
| 69,262,254 |
|
Moda |
| Seattle, WA |
| G |
|
| 2009 |
|
| 251 |
|
|
| 12,649,228 |
|
|
| 36,842,012 |
|
|
| 1,017,073 |
|
|
| 12,649,228 |
|
|
| 37,859,085 |
|
|
| 50,508,313 |
|
|
| (12,489,032 | ) |
|
| 38,019,281 |
|
| (K) |
| ||
Montierra (CA) |
| San Diego, CA |
|
| — |
|
| 1990 |
|
| 272 |
|
|
| 8,160,000 |
|
|
| 29,360,938 |
|
|
| 7,947,448 |
|
|
| 8,160,000 |
|
|
| 37,308,386 |
|
|
| 45,468,386 |
|
|
| (24,130,197 | ) |
|
| 21,338,189 |
|
| (I) |
| |
Olympus Towers |
| Seattle, WA |
| G |
|
| 2000 |
|
| 328 |
|
|
| 14,752,034 |
|
|
| 73,335,425 |
|
|
| 8,745,325 |
|
|
| 14,752,034 |
|
|
| 82,080,750 |
|
|
| 96,832,784 |
|
|
| (39,929,257 | ) |
|
| 56,903,527 |
|
|
| 49,788,935 |
| |
Park Place at San Mateo (fka San Mateo) |
| San Mateo, CA |
| G |
|
| 2001 |
|
| 575 |
|
|
| 71,900,000 |
|
|
| 211,907,141 |
|
|
| 11,404,928 |
|
|
| 71,900,000 |
|
|
| 223,312,069 |
|
|
| 295,212,069 |
|
|
| (47,760,787 | ) |
|
| 247,451,282 |
|
| (J) |
| ||
Reserve at Clarendon Centre, The |
| Arlington, VA |
| G |
|
| 2003 |
|
| 252 |
|
|
| 10,500,000 |
|
|
| 52,812,935 |
|
|
| 4,599,506 |
|
|
| 10,500,000 |
|
|
| 57,412,441 |
|
|
| 67,912,441 |
|
|
| (28,603,885 | ) |
|
| 39,308,556 |
|
| (I) |
| ||
Reserve at Eisenhower, The |
| Alexandria, VA |
|
| — |
|
| 2002 |
|
| 226 |
|
|
| 6,500,000 |
|
|
| 34,585,060 |
|
|
| 3,865,452 |
|
|
| 6,500,000 |
|
|
| 38,450,512 |
|
|
| 44,950,512 |
|
|
| (19,227,311 | ) |
|
| 25,723,201 |
|
| (I) |
| |
Reserve at Fairfax Corner |
| Fairfax, VA |
|
| — |
|
| 2001 |
|
| 652 |
|
|
| 15,804,057 |
|
|
| 63,129,051 |
|
|
| 11,326,169 |
|
|
| 15,804,057 |
|
|
| 74,455,220 |
|
|
| 90,259,277 |
|
|
| (38,763,866 | ) |
|
| 51,495,411 |
|
|
| 84,677,136 |
|
Siena Terrace |
| Lake Forest, CA |
|
| — |
|
| 1988 |
|
| 356 |
|
|
| 8,900,000 |
|
|
| 24,083,024 |
|
|
| 7,129,612 |
|
|
| 8,900,000 |
|
|
| 31,212,636 |
|
|
| 40,112,636 |
|
|
| (20,109,124 | ) |
|
| 20,003,512 |
|
|
| 64,414,512 |
|
Skyview |
| Rancho Santa Margarita, CA |
|
| — |
|
| 1999 |
|
| 260 |
|
|
| 3,380,000 |
|
|
| 21,952,863 |
|
|
| 5,298,716 |
|
|
| 3,380,000 |
|
|
| 27,251,579 |
|
|
| 30,631,579 |
|
|
| (16,612,037 | ) |
|
| 14,019,542 |
|
|
| 47,183,965 |
|
SoMa Square Apartments (fka South Market) |
| San Francisco, CA |
| G |
|
| 1986 |
|
| 410 |
|
|
| 79,900,000 |
|
|
| 177,316,977 |
|
|
| 9,300,349 |
|
|
| 79,900,000 |
|
|
| 186,617,326 |
|
|
| 266,517,326 |
|
|
| (38,289,333 | ) |
|
| 228,227,993 |
|
| (J) |
| ||
Description |
|
| Initial Cost to Company |
|
| Cost Capitalized Subsequent to Acquisition (Improvements, net) (E) |
|
| Gross Amount Carried at Close of Period 12/31/20 |
|
|
|
| |||||||||||||||||||||||||||||||||||||
Apartment Name |
| Location |
| Non-Residential Components |
|
| Date of Construction |
|
| Apartment Units |
|
| Land |
|
| Building & Fixtures |
|
| Building & Fixtures |
|
| Land |
|
| Building & Fixtures (A) |
|
| Total (B) |
|
| Accumulated Depreciation (C) |
|
| Investment in Real Estate, Net at 12/31/20 |
|
| Encumbrances |
| ||||||||||||
Uwajimaya Village |
| Seattle, WA |
|
| — |
|
| 2002 |
|
|
| 176 |
|
|
| 8,800,000 |
|
|
| 22,188,288 |
|
|
| 5,060,085 |
|
|
| 8,800,000 |
|
|
| 27,248,373 |
|
|
| 36,048,373 |
|
|
| (13,875,497 | ) |
|
| 22,172,876 |
|
|
| 0 |
| |
Veloce |
| Redmond, WA |
| G |
|
| 2009 |
|
|
| 322 |
|
|
| 15,322,724 |
|
|
| 76,176,594 |
|
|
| 2,058,051 |
|
|
| 15,322,724 |
|
|
| 78,234,645 |
|
|
| 93,557,369 |
|
|
| (25,659,124 | ) |
|
| 67,898,245 |
|
|
| 0 |
| ||
Venue at the Promenade |
| Castle Rock, CO |
|
| — |
|
| 2017 |
|
|
| 312 |
|
|
| 8,355,048 |
|
|
| 83,752,689 |
|
|
| 166,209 |
|
|
| 8,355,048 |
|
|
| 83,918,898 |
|
|
| 92,273,946 |
|
|
| (7,716,962 | ) |
|
| 84,556,984 |
|
|
| 0 |
| |
Verde Condominium Homes (fka Mission Verde, LLC) |
| San Jose, CA |
|
| — |
|
| 1986 |
|
|
| 108 |
|
|
| 5,190,700 |
|
|
| 9,679,109 |
|
|
| 4,635,959 |
|
|
| 5,190,700 |
|
|
| 14,315,068 |
|
|
| 19,505,768 |
|
|
| (11,286,870 | ) |
|
| 8,218,898 |
|
|
| 0 |
| |
Veridian (fka Silver Spring) |
| Silver Spring, MD |
| G |
|
| 2009 |
|
|
| 457 |
|
|
| 18,539,817 |
|
|
| 130,407,365 |
|
|
| 4,297,795 |
|
|
| 18,539,817 |
|
|
| 134,705,160 |
|
|
| 153,244,977 |
|
|
| (53,262,783 | ) |
|
| 99,982,194 |
|
|
| 0 |
| ||
Versailles |
| Woodland Hills, CA |
|
| — |
|
| 1991 |
|
|
| 253 |
|
|
| 12,650,000 |
|
|
| 33,656,292 |
|
|
| 8,575,157 |
|
|
| 12,650,000 |
|
|
| 42,231,449 |
|
|
| 54,881,449 |
|
|
| (26,065,056 | ) |
|
| 28,816,393 |
|
|
| 0 |
| |
Versailles (K-Town) |
| Los Angeles, CA |
|
| — |
|
| 2008 |
|
|
| 225 |
|
|
| 10,590,975 |
|
|
| 44,409,025 |
|
|
| 1,913,803 |
|
|
| 10,590,975 |
|
|
| 46,322,828 |
|
|
| 56,913,803 |
|
|
| (20,170,940 | ) |
|
| 36,742,863 |
|
|
| 0 |
| |
Victor on Venice |
| Los Angeles, CA |
| G |
|
| 2006 |
|
|
| 115 |
|
|
| 10,350,000 |
|
|
| 35,433,437 |
|
|
| 2,023,741 |
|
|
| 10,350,000 |
|
|
| 37,457,178 |
|
|
| 47,807,178 |
|
|
| (18,425,633 | ) |
|
| 29,381,545 |
|
|
| 0 |
| ||
Villa Solana |
| Laguna Hills, CA |
|
| — |
|
| 1984 |
|
|
| 272 |
|
|
| 1,665,100 |
|
|
| 14,985,678 |
|
|
| 12,946,281 |
|
|
| 1,665,100 |
|
|
| 27,931,959 |
|
|
| 29,597,059 |
|
|
| (23,035,555 | ) |
|
| 6,561,504 |
|
|
| 0 |
| |
Village at Del Mar Heights, The (fka Del Mar Heights) |
| San Diego, CA |
|
| — |
|
| 1986 |
|
|
| 168 |
|
|
| 15,100,000 |
|
|
| 40,859,396 |
|
|
| 3,573,169 |
|
|
| 15,100,000 |
|
|
| 44,432,565 |
|
|
| 59,532,565 |
|
|
| (15,023,903 | ) |
|
| 44,508,662 |
|
|
| 0 |
| |
Virginia Square |
| Arlington, VA |
| G |
|
| 2002 |
|
|
| 231 |
|
|
| 0 |
|
|
| 85,940,003 |
|
|
| 6,137,694 |
|
|
| 0 |
|
|
| 92,077,697 |
|
|
| 92,077,697 |
|
|
| (29,622,313 | ) |
|
| 62,455,384 |
|
|
| 0 |
| ||
Vista 99 (fka Tasman) |
| San Jose, CA |
|
| — |
|
| 2016 |
|
|
| 554 |
|
|
| 27,709,329 |
|
|
| 177,555,213 |
|
|
| 840,226 |
|
|
| 27,709,329 |
|
|
| 178,395,439 |
|
|
| 206,104,768 |
|
|
| (33,946,303 | ) |
|
| 172,158,465 |
|
|
| 0 |
| |
Vista Del Lago |
| Mission Viejo, CA |
|
| — |
|
| 1986-1988 |
|
|
| 608 |
|
|
| 4,525,800 |
|
|
| 40,736,293 |
|
|
| 19,765,337 |
|
|
| 4,525,800 |
|
|
| 60,501,630 |
|
|
| 65,027,430 |
|
|
| (52,909,405 | ) |
|
| 12,118,025 |
|
|
| 0 |
| |
Walden Park |
| Cambridge, MA |
|
| — |
|
| 1966 |
|
|
| 232 |
|
|
| 12,448,888 |
|
|
| 52,044,448 |
|
|
| 4,982,240 |
|
|
| 12,448,888 |
|
|
| 57,026,688 |
|
|
| 69,475,576 |
|
|
| (23,325,875 | ) |
|
| 46,149,701 |
|
|
| 0 |
| |
Water Park Towers |
| Arlington, VA |
|
| — |
|
| 1989 |
|
|
| 362 |
|
|
| 34,400,000 |
|
|
| 108,485,859 |
|
|
| 10,793,415 |
|
|
| 34,400,000 |
|
|
| 119,279,274 |
|
|
| 153,679,274 |
|
|
| (39,652,580 | ) |
|
| 114,026,694 |
|
|
| 0 |
| |
Watertown Square |
| Watertown, MA |
| G |
|
| 2005 |
|
|
| 134 |
|
|
| 16,800,000 |
|
|
| 34,074,056 |
|
|
| 1,904,484 |
|
|
| 16,800,000 |
|
|
| 35,978,540 |
|
|
| 52,778,540 |
|
|
| (11,625,233 | ) |
|
| 41,153,307 |
|
|
| 0 |
| ||
West 96th |
| New York, NY |
| G |
|
| 1987 |
|
|
| 207 |
|
|
| 84,800,000 |
|
|
| 67,055,502 |
|
|
| 6,658,093 |
|
|
| 84,800,000 |
|
|
| 73,713,595 |
|
|
| 158,513,595 |
|
|
| (26,104,839 | ) |
|
| 132,408,756 |
|
|
| 0 |
| ||
West End Apartments (fka Emerson Place/CRP II) |
| Boston, MA |
| G |
|
| 2008 |
|
|
| 310 |
|
|
| 469,546 |
|
|
| 163,123,022 |
|
|
| 5,461,544 |
|
|
| 469,546 |
|
|
| 168,584,566 |
|
|
| 169,054,112 |
|
|
| (73,099,324 | ) |
|
| 95,954,788 |
|
|
| 0 |
| ||
Westchester at Rockville |
| Rockville, MD |
|
| — |
|
| 2009 |
|
|
| 192 |
|
|
| 10,600,000 |
|
|
| 44,135,207 |
|
|
| 1,316,004 |
|
|
| 10,600,000 |
|
|
| 45,451,211 |
|
|
| 56,051,211 |
|
|
| (14,255,122 | ) |
|
| 41,796,089 |
|
|
| 0 |
| |
Westmont |
| New York, NY |
| G |
|
| 1986 |
|
|
| 163 |
|
|
| 64,900,000 |
|
|
| 61,143,259 |
|
|
| 6,257,673 |
|
|
| 64,900,000 |
|
|
| 67,400,932 |
|
|
| 132,300,932 |
|
|
| (21,887,315 | ) |
|
| 110,413,617 |
|
|
| 0 |
| ||
Westside |
| Los Angeles, CA |
|
| — |
|
| 2004 |
|
|
| 204 |
|
|
| 34,200,000 |
|
|
| 56,962,630 |
|
|
| 3,357,625 |
|
|
| 34,200,000 |
|
|
| 60,320,255 |
|
|
| 94,520,255 |
|
|
| (19,197,241 | ) |
|
| 75,323,014 |
|
|
| 0 |
| |
Westside Barrington (fka Westside Villas III) |
| Los Angeles, CA |
|
| — |
|
| 1999 |
|
|
| 36 |
|
|
| 3,060,000 |
|
|
| 5,538,871 |
|
|
| 1,182,445 |
|
|
| 3,060,000 |
|
|
| 6,721,316 |
|
|
| 9,781,316 |
|
|
| (4,457,210 | ) |
|
| 5,324,106 |
|
|
| 0 |
| |
Westside Barry (Westside Villas VI) |
| Los Angeles, CA |
|
| — |
|
| 1989 |
|
|
| 18 |
|
|
| 1,530,000 |
|
|
| 3,023,523 |
|
|
| 764,582 |
|
|
| 1,530,000 |
|
|
| 3,788,105 |
|
|
| 5,318,105 |
|
|
| (2,501,385 | ) |
|
| 2,816,720 |
|
|
| 0 |
| |
Westside Beloit (fka Westside Villas I) |
| Los Angeles, CA |
|
| — |
|
| 1999 |
|
|
| 21 |
|
|
| 1,785,000 |
|
|
| 3,233,254 |
|
|
| 778,767 |
|
|
| 1,785,000 |
|
|
| 4,012,021 |
|
|
| 5,797,021 |
|
|
| (2,711,404 | ) |
|
| 3,085,617 |
|
|
| 0 |
| |
Westside Bundy (fka Westside Villas II) |
| Los Angeles, CA |
|
| — |
|
| 1999 |
|
|
| 23 |
|
|
| 1,955,000 |
|
|
| 3,541,435 |
|
|
| 794,239 |
|
|
| 1,955,000 |
|
|
| 4,335,674 |
|
|
| 6,290,674 |
|
|
| (2,865,440 | ) |
|
| 3,425,234 |
|
|
| 0 |
| |
Westside Butler (fka Westside Villas IV) |
| Los Angeles, CA |
|
| — |
|
| 1999 |
|
|
| 36 |
|
|
| 3,060,000 |
|
|
| 5,539,390 |
|
|
| 1,223,921 |
|
|
| 3,060,000 |
|
|
| 6,763,311 |
|
|
| 9,823,311 |
|
|
| (4,471,969 | ) |
|
| 5,351,342 |
|
|
| 0 |
| |
Westside Villas (fka Westside Villas V &VII) |
| Los Angeles, CA |
|
| — |
|
| 1999 & 2001 |
|
|
| 113 |
|
|
| 9,605,000 |
|
|
| 19,983,385 |
|
|
| 2,909,316 |
|
|
| 9,605,000 |
|
|
| 22,892,701 |
|
|
| 32,497,701 |
|
|
| (14,993,719 | ) |
|
| 17,503,982 |
|
|
| 0 |
| |
Windridge (CA) |
| Laguna Niguel, CA |
|
| — |
|
| 1989 |
|
|
| 344 |
|
|
| 2,662,900 |
|
|
| 23,985,497 |
|
|
| 13,127,981 |
|
|
| 2,662,900 |
|
|
| 37,113,478 |
|
|
| 39,776,378 |
|
|
| (30,933,234 | ) |
|
| 8,843,144 |
|
|
| 0 |
| |
Wood Creek I |
| Pleasant Hill, CA |
|
| — |
|
| 1987 |
|
|
| 256 |
|
|
| 9,729,900 |
|
|
| 23,009,768 |
|
|
| 10,421,107 |
|
|
| 9,729,900 |
|
|
| 33,430,875 |
|
|
| 43,160,775 |
|
|
| (25,852,279 | ) |
|
| 17,308,496 |
|
|
| 0 |
| |
Woodleaf |
| Campbell, CA |
|
| — |
|
| 1984 |
|
|
| 178 |
|
|
| 8,550,600 |
|
|
| 16,988,182 |
|
|
| 6,182,183 |
|
|
| 8,550,600 |
|
|
| 23,170,365 |
|
|
| 31,720,965 |
|
|
| (17,242,110 | ) |
|
| 14,478,855 |
|
|
| 0 |
| |
Management Business |
| Chicago, IL |
|
| — |
|
| (D) |
|
|
| 0 |
|
|
| 0 |
|
|
| 0 |
|
|
| 138,223,005 |
|
|
| 0 |
|
|
| 138,223,005 |
|
|
| 138,223,005 |
|
|
| (104,607,870 | ) |
|
| 33,615,135 |
|
|
| 0 |
| |
Operating Partnership |
| Chicago, IL |
|
| — |
|
| (F) |
|
|
| 0 |
|
|
| 0 |
|
|
| 1,543,343 |
|
|
| 0 |
|
|
| 0 |
|
|
| 1,543,343 |
|
|
| 1,543,343 |
|
|
| 0 |
|
|
| 1,543,343 |
|
|
| 0 |
| |
Other |
| N/A |
|
| — |
|
|
| — |
|
|
| 0 |
|
|
| 0 |
|
|
| 0 |
|
|
| 107,757 |
|
|
| 0 |
|
|
| 107,757 |
|
|
| 107,757 |
|
|
| (66,902 | ) |
|
| 40,855 |
|
|
| 0 |
|
Wholly Owned Unencumbered |
|
|
|
|
|
|
|
|
|
|
|
| 64,363 |
|
|
| 4,875,308,605 |
|
|
| 16,033,230,297 |
|
|
| 1,620,022,325 |
|
|
| 4,875,308,605 |
|
|
| 17,653,252,622 |
|
|
| 22,528,561,227 |
|
|
| (6,521,859,521 | ) |
|
| 16,006,701,706 |
|
|
| 0 |
|
|
|
|
|
|
|
|
|
|
|
|
|
|
|
|
|
|
|
|
|
|
|
|
|
|
|
|
|
|
|
|
|
|
|
|
|
|
|
|
|
|
|
|
|
|
|
|
|
|
|
|
Wholly Owned Encumbered: |
|
|
|
|
|
|
|
|
|
|
|
|
|
|
|
|
|
|
|
|
|
|
|
|
|
|
|
|
|
|
|
|
|
|
|
|
|
|
|
|
|
|
|
|
|
|
|
|
|
|
1111 Belle Pre (fka The Madison) |
| Alexandria, VA |
| G |
|
| 2014 |
|
|
| 360 |
|
|
| 18,937,702 |
|
|
| 94,758,679 |
|
|
| 517,009 |
|
|
| 18,937,702 |
|
|
| 95,275,688 |
|
|
| 114,213,390 |
|
|
| (28,767,103 | ) |
|
| 85,446,287 |
|
|
| 86,236,221 |
| ||
2501 Porter |
| Washington, D.C. |
|
| — |
|
| 1988 |
|
|
| 202 |
|
|
| 13,000,000 |
|
|
| 75,271,179 |
|
|
| 7,046,134 |
|
|
| 13,000,000 |
|
|
| 82,317,313 |
|
|
| 95,317,313 |
|
|
| (27,334,401 | ) |
|
| 67,982,912 |
|
| (H) |
| ||
300 East 39th (fka East 39th) |
| New York, NY |
| G |
|
| 2001 |
|
|
| 254 |
|
|
| 48,900,000 |
|
|
| 96,174,639 |
|
|
| 5,841,752 |
|
|
| 48,900,000 |
|
|
| 102,016,391 |
|
|
| 150,916,391 |
|
|
| (32,773,924 | ) |
|
| 118,142,467 |
|
|
| 62,517,552 |
| ||
303 East 83rd (fka Camargue) |
| New York, NY |
| G |
|
| 1976 |
|
|
| 261 |
|
|
| 79,400,000 |
|
|
| 79,122,624 |
|
|
| 10,883,739 |
|
|
| 79,400,000 |
|
|
| 90,006,363 |
|
|
| 169,406,363 |
|
|
| (30,023,726 | ) |
|
| 139,382,637 |
|
| (H) |
| |||
425 Broadway |
| Santa Monica, CA |
| G |
|
| 2001 |
|
|
| 101 |
|
|
| 12,600,000 |
|
|
| 34,394,772 |
|
|
| 3,879,039 |
|
|
| 12,600,000 |
|
|
| 38,273,811 |
|
|
| 50,873,811 |
|
|
| (12,637,343 | ) |
|
| 38,236,468 |
|
| (H) |
| |||
Alcyone |
| Seattle, WA |
| G |
|
| 2004 |
|
|
| 162 |
|
|
| 11,379,497 |
|
|
| 49,360,503 |
|
|
| 1,621,195 |
|
|
| 11,379,497 |
|
|
| 50,981,698 |
|
|
| 62,361,195 |
|
|
| (13,657,401 | ) |
|
| 48,703,794 |
|
|
| 26,717,175 |
| ||
Artisan Square |
| Northridge, CA |
|
| — |
|
| 2002 |
|
|
| 140 |
|
|
| 7,000,000 |
|
|
| 20,537,359 |
|
|
| 2,177,087 |
|
|
| 7,000,000 |
|
|
| 22,714,446 |
|
|
| 29,714,446 |
|
|
| (13,941,438 | ) |
|
| 15,773,008 |
|
|
| 35,608,719 |
| |
Avanti |
| Anaheim, CA |
|
| — |
|
| 1987 |
|
|
| 162 |
|
|
| 12,960,000 |
|
|
| 18,497,682 |
|
|
| 4,201,662 |
|
|
| 12,960,000 |
|
|
| 22,699,344 |
|
|
| 35,659,344 |
|
|
| (12,149,740 | ) |
|
| 23,509,604 |
|
|
| 28,029,688 |
| |
S-9
ERP OPERATING LIMITED PARTNERSHIP
Schedule III - Real Estate and Accumulated Depreciation
December 31, 20172020
Description |
|
| Initial Cost to Company |
|
| Cost Capitalized Subsequent to Acquisition (Improvements, net) (E) |
|
| Gross Amount Carried at Close of Period 12/31/17 |
|
|
|
| |||||||||||||||||||||||||||||||||||
Apartment Name |
| Location |
| Retail/ Commercial Space |
|
| Date of Construction |
| Apartment Units (H) |
|
| Land |
|
| Building & Fixtures |
|
| Building & Fixtures |
|
| Land |
|
| Building & Fixtures (A) |
|
| Total (B) |
|
| Accumulated Depreciation (C) |
|
| Investment in Real Estate, Net at 12/31/17 |
|
| Encumbrances |
| |||||||||||
Square One |
| Seattle, WA |
|
| — |
|
| 2014 |
|
| 112 |
|
|
| 7,222,544 |
|
|
| 26,277,456 |
|
|
| 29,629 |
|
|
| 7,222,544 |
|
|
| 26,307,085 |
|
|
| 33,529,629 |
|
|
| (4,313,830 | ) |
|
| 29,215,799 |
|
| (K) |
| |
Summerset Village |
| Chatsworth, CA |
|
| — |
|
| 1985 |
|
| 280 |
|
|
| 2,629,804 |
|
|
| 23,670,889 |
|
|
| 7,787,016 |
|
|
| 2,629,804 |
|
|
| 31,457,905 |
|
|
| 34,087,709 |
|
|
| (22,465,064 | ) |
|
| 11,622,645 |
|
|
| 38,007,297 |
|
Talleyrand |
| Tarrytown, NY |
|
| — |
|
| 1997-1998 |
|
| 300 |
|
|
| 12,000,000 |
|
|
| 49,838,160 |
|
|
| 6,352,043 |
|
|
| 12,000,000 |
|
|
| 56,190,203 |
|
|
| 68,190,203 |
|
|
| (31,701,891 | ) |
|
| 36,488,312 |
|
|
| 34,811,455 |
|
Teresina |
| Chula Vista, CA |
|
| — |
|
| 2000 |
|
| 440 |
|
|
| 28,600,000 |
|
|
| 61,916,670 |
|
|
| 5,715,027 |
|
|
| 28,600,000 |
|
|
| 67,631,697 |
|
|
| 96,231,697 |
|
|
| (29,443,097 | ) |
|
| 66,788,600 |
|
|
| 38,425,773 |
|
Toscana |
| Irvine, CA |
|
| — |
|
| 1991/1993 |
|
| 563 |
|
|
| 39,410,000 |
|
|
| 50,806,072 |
|
|
| 17,577,052 |
|
|
| 39,410,000 |
|
|
| 68,383,124 |
|
|
| 107,793,124 |
|
|
| (37,833,043 | ) |
|
| 69,960,081 |
|
|
| 98,047,399 |
|
Touriel Building |
| Berkeley, CA |
| G |
|
| 2004 |
|
| 35 |
|
|
| 2,736,000 |
|
|
| 7,810,027 |
|
|
| 186,222 |
|
|
| 2,736,000 |
|
|
| 7,996,249 |
|
|
| 10,732,249 |
|
|
| (3,315,964 | ) |
|
| 7,416,285 |
|
|
| 4,969,645 |
| |
Town Square at Mark Center I (fka Millbrook I) |
| Alexandria, VA |
|
| — |
|
| 1996 |
|
| 406 |
|
|
| 24,360,000 |
|
|
| 86,178,714 |
|
|
| 7,407,814 |
|
|
| 24,360,000 |
|
|
| 93,586,528 |
|
|
| 117,946,528 |
|
|
| (41,076,185 | ) |
|
| 76,870,343 |
|
|
| 60,225,838 |
|
Vantage Hollywood |
| Los Angeles, CA |
|
| — |
|
| 1987 |
|
| 298 |
|
|
| 42,580,326 |
|
|
| 56,014,674 |
|
|
| 457,365 |
|
|
| 42,580,326 |
|
|
| 56,472,039 |
|
|
| 99,052,365 |
|
|
| (7,801,330 | ) |
|
| 91,251,035 |
|
|
| 41,416,137 |
|
Versailles |
| Woodland Hills, CA |
|
| — |
|
| 1991 |
|
| 253 |
|
|
| 12,650,000 |
|
|
| 33,656,292 |
|
|
| 7,159,381 |
|
|
| 12,650,000 |
|
|
| 40,815,673 |
|
|
| 53,465,673 |
|
|
| (21,305,317 | ) |
|
| 32,160,356 |
|
|
| 30,347,501 |
|
Versailles (K-Town) |
| Los Angeles, CA |
|
| — |
|
| 2008 |
|
| 225 |
|
|
| 10,590,975 |
|
|
| 44,409,025 |
|
|
| 1,547,377 |
|
|
| 10,590,975 |
|
|
| 45,956,402 |
|
|
| 56,547,377 |
|
|
| (15,658,207 | ) |
|
| 40,889,170 |
|
|
| 45,964,864 |
|
Victor on Venice |
| Los Angeles, CA |
| G |
|
| 2006 |
|
| 115 |
|
|
| 10,350,000 |
|
|
| 35,433,437 |
|
|
| 797,872 |
|
|
| 10,350,000 |
|
|
| 36,231,309 |
|
|
| 46,581,309 |
|
|
| (14,701,990 | ) |
|
| 31,879,319 |
|
| (I) |
| ||
Vintage at 425 Broadway (fka Promenade) |
| Santa Monica, CA |
| G |
|
| 1934/2001 |
|
| 60 |
|
|
| 9,000,000 |
|
|
| 13,961,523 |
|
|
| 1,555,558 |
|
|
| 9,000,000 |
|
|
| 15,517,081 |
|
|
| 24,517,081 |
|
|
| (3,564,636 | ) |
|
| 20,952,445 |
|
| (J) |
| ||
West 54th |
| New York, NY |
| G |
|
| 2001 |
|
| 222 |
|
|
| 60,900,000 |
|
|
| 48,193,837 |
|
|
| 3,225,501 |
|
|
| 60,900,000 |
|
|
| 51,419,338 |
|
|
| 112,319,338 |
|
|
| (12,886,577 | ) |
|
| 99,432,761 |
|
|
| 47,667,759 |
| |
Westgate (fka Westgate I) |
| Pasadena, CA |
|
| — |
|
| 2010 |
|
| 480 |
|
|
| 22,898,848 |
|
|
| 133,484,573 |
|
|
| 2,262,866 |
|
|
| 22,898,848 |
|
|
| 135,747,439 |
|
|
| 158,646,287 |
|
|
| (32,510,875 | ) |
|
| 126,135,412 |
|
|
| 95,981,749 |
|
Woodleaf |
| Campbell, CA |
|
| — |
|
| 1984 |
|
| 178 |
|
|
| 8,550,600 |
|
|
| 16,988,183 |
|
|
| 5,069,445 |
|
|
| 8,550,600 |
|
|
| 22,057,628 |
|
|
| 30,608,228 |
|
|
| (14,254,057 | ) |
|
| 16,354,171 |
|
|
| 17,819,380 |
|
Portfolio/Entity Encumbrances (1) |
|
|
|
|
|
|
|
|
|
| — |
|
|
| — |
|
|
| — |
|
|
| — |
|
|
| — |
|
|
| — |
|
|
| — |
|
|
| — |
|
|
| — |
|
|
| 1,346,853,789 |
|
Wholly Owned Encumbered |
|
|
|
|
|
|
|
|
|
| 18,497 |
|
|
| 1,401,915,995 |
|
|
| 3,881,590,219 |
|
|
| 316,875,095 |
|
|
| 1,401,915,995 |
|
|
| 4,198,465,314 |
|
|
| 5,600,381,309 |
|
|
| (1,440,591,113 | ) |
|
| 4,159,790,196 |
|
|
| 3,316,375,422 |
|
|
|
|
|
|
|
|
|
|
|
|
|
|
|
|
|
|
|
|
|
|
|
|
|
|
|
|
|
|
|
|
|
|
|
|
|
|
|
|
|
|
|
|
|
|
|
|
|
|
Partially Owned Unencumbered: |
|
|
|
|
|
|
|
|
|
|
|
|
|
|
|
|
|
|
|
|
|
|
|
|
|
|
|
|
|
|
|
|
|
|
|
|
|
|
|
|
|
|
|
|
|
|
|
|
2300 Elliott |
| Seattle, WA |
|
| — |
|
| 1992 |
|
| 92 |
|
|
| 796,800 |
|
|
| 7,173,725 |
|
|
| 6,717,795 |
|
|
| 796,800 |
|
|
| 13,891,520 |
|
|
| 14,688,320 |
|
|
| (10,921,953 | ) |
|
| 3,766,367 |
|
|
| — |
|
Canyon Ridge |
| San Diego, CA |
|
| — |
|
| 1989 |
|
| 162 |
|
|
| 4,869,448 |
|
|
| 11,955,064 |
|
|
| 3,954,912 |
|
|
| 4,869,448 |
|
|
| 15,909,976 |
|
|
| 20,779,424 |
|
|
| (10,552,909 | ) |
|
| 10,226,515 |
|
|
| — |
|
Country Oaks |
| Agoura Hills, CA |
|
| — |
|
| 1985 |
|
| 256 |
|
|
| 6,105,000 |
|
|
| 29,561,865 |
|
|
| 6,647,900 |
|
|
| 6,105,000 |
|
|
| 36,209,765 |
|
|
| 42,314,765 |
|
|
| (19,712,219 | ) |
|
| 22,602,546 |
|
|
| — |
|
Harrison Square (fka Elliot Bay) |
| Seattle, WA |
| G |
|
| 1992 |
|
| 166 |
|
|
| 7,600,000 |
|
|
| 35,844,345 |
|
|
| 5,069,730 |
|
|
| 7,600,000 |
|
|
| 40,914,075 |
|
|
| 48,514,075 |
|
|
| (9,358,506 | ) |
|
| 39,155,569 |
|
|
| — |
| |
Monterra in Mill Creek |
| Mill Creek, WA |
|
| — |
|
| 2003 |
|
| 139 |
|
|
| 2,800,000 |
|
|
| 13,255,123 |
|
|
| 1,003,101 |
|
|
| 2,800,000 |
|
|
| 14,258,224 |
|
|
| 17,058,224 |
|
|
| (6,620,281 | ) |
|
| 10,437,943 |
|
|
| — |
|
Rosecliff |
| Quincy, MA |
|
| — |
|
| 1990 |
|
| 156 |
|
|
| 5,460,000 |
|
|
| 15,721,570 |
|
|
| 3,530,721 |
|
|
| 5,460,000 |
|
|
| 19,252,291 |
|
|
| 24,712,291 |
|
|
| (12,249,762 | ) |
|
| 12,462,529 |
|
|
| — |
|
Strayhorse at Arrowhead Ranch |
| Glendale, AZ |
|
| — |
|
| 1998 |
|
| 136 |
|
|
| 4,400,000 |
|
|
| 12,968,002 |
|
|
| 802,003 |
|
|
| 4,400,000 |
|
|
| 13,770,005 |
|
|
| 18,170,005 |
|
|
| (6,164,596 | ) |
|
| 12,005,409 |
|
|
| — |
|
Via Ventura (CA) (fka Ventura) |
| Ventura, CA |
|
| — |
|
| 2002 |
|
| 192 |
|
|
| 8,600,000 |
|
|
| 44,308,202 |
|
|
| 845,940 |
|
|
| 8,600,000 |
|
|
| 45,154,142 |
|
|
| 53,754,142 |
|
|
| (10,983,822 | ) |
|
| 42,770,320 |
|
|
| — |
|
Wood Creek II (fka Willow Brook (CA)) |
| Pleasant Hill, CA |
|
| — |
|
| 1985 |
|
| 228 |
|
|
| 5,055,000 |
|
|
| 38,388,672 |
|
|
| 6,551,944 |
|
|
| 5,055,000 |
|
|
| 44,940,616 |
|
|
| 49,995,616 |
|
|
| (22,087,591 | ) |
|
| 27,908,025 |
|
|
| — |
|
Partially Owned Unencumbered |
|
|
|
|
|
|
|
|
|
| 1,527 |
|
|
| 45,686,248 |
|
|
| 209,176,568 |
|
|
| 35,124,046 |
|
|
| 45,686,248 |
|
|
| 244,300,614 |
|
|
| 289,986,862 |
|
|
| (108,651,639 | ) |
|
| 181,335,223 |
|
|
| — |
|
|
|
|
|
|
|
|
|
|
|
|
|
|
|
|
|
|
|
|
|
|
|
|
|
|
|
|
|
|
|
|
|
|
|
|
|
|
|
|
|
|
|
|
|
|
|
|
|
|
Partially Owned Encumbered: |
|
|
|
|
|
|
|
|
|
|
|
|
|
|
|
|
|
|
|
|
|
|
|
|
|
|
|
|
|
|
|
|
|
|
|
|
|
|
|
|
|
|
|
|
|
|
|
|
Bellevue Meadows |
| Bellevue, WA |
|
| — |
|
| 1983 |
|
| 180 |
|
|
| 4,507,100 |
|
|
| 12,574,814 |
|
|
| 5,487,604 |
|
|
| 4,507,100 |
|
|
| 18,062,418 |
|
|
| 22,569,518 |
|
|
| (12,705,342 | ) |
|
| 9,864,176 |
|
|
| 16,504,927 |
|
Canyon Creek (CA) |
| San Ramon, CA |
|
| — |
|
| 1984 |
|
| 268 |
|
|
| 5,425,000 |
|
|
| 18,812,120 |
|
|
| 7,580,209 |
|
|
| 5,425,000 |
|
|
| 26,392,329 |
|
|
| 31,817,329 |
|
|
| (16,113,349 | ) |
|
| 15,703,980 |
|
|
| 28,129,557 |
|
Lantern Cove |
| Foster City, CA |
|
| — |
|
| 1985 |
|
| 232 |
|
|
| 6,945,000 |
|
|
| 23,064,976 |
|
|
| 6,401,023 |
|
|
| 6,945,000 |
|
|
| 29,465,999 |
|
|
| 36,410,999 |
|
|
| (17,362,236 | ) |
|
| 19,048,763 |
|
|
| 36,410,267 |
|
Schooner Bay I |
| Foster City, CA |
|
| — |
|
| 1985 |
|
| 168 |
|
|
| 5,345,000 |
|
|
| 20,390,618 |
|
|
| 5,132,524 |
|
|
| 5,345,000 |
|
|
| 25,523,142 |
|
|
| 30,868,142 |
|
|
| (15,015,057 | ) |
|
| 15,853,085 |
|
|
| 28,825,496 |
|
Schooner Bay II |
| Foster City, CA |
|
| — |
|
| 1985 |
|
| 144 |
|
|
| 4,550,000 |
|
|
| 18,064,764 |
|
|
| 4,600,065 |
|
|
| 4,550,000 |
|
|
| 22,664,829 |
|
|
| 27,214,829 |
|
|
| (13,411,541 | ) |
|
| 13,803,288 |
|
|
| 26,130,631 |
|
Surrey Downs |
| Bellevue, WA |
|
| — |
|
| 1986 |
|
| 122 |
|
|
| 3,057,100 |
|
|
| 7,848,618 |
|
|
| 3,159,103 |
|
|
| 3,057,100 |
|
|
| 11,007,721 |
|
|
| 14,064,821 |
|
|
| (7,377,616 | ) |
|
| 6,687,205 |
|
|
| 9,810,499 |
|
Virgil Square |
| Los Angeles, CA |
|
| — |
|
| 1979 |
|
| 142 |
|
|
| 5,500,000 |
|
|
| 15,216,613 |
|
|
| 2,890,085 |
|
|
| 5,500,000 |
|
|
| 18,106,698 |
|
|
| 23,606,698 |
|
|
| (8,612,798 | ) |
|
| 14,993,900 |
|
|
| 9,877,693 |
|
Wisconsin Place |
| Chevy Chase, MD |
|
| — |
|
| 2009 |
|
| 432 |
|
|
| — |
|
|
| 172,089,355 |
|
|
| 1,148,714 |
|
|
| — |
|
|
| 173,238,069 |
|
|
| 173,238,069 |
|
|
| (37,293,147 | ) |
|
| 135,944,922 |
|
|
| 146,657,506 |
|
Partially Owned Encumbered |
|
|
|
|
|
|
|
|
|
| 1,688 |
|
|
| 35,329,200 |
|
|
| 288,061,878 |
|
|
| 36,399,327 |
|
|
| 35,329,200 |
|
|
| 324,461,205 |
|
|
| 359,790,405 |
|
|
| (127,891,086 | ) |
|
| 231,899,319 |
|
|
| 302,346,576 |
|
|
|
|
|
|
|
|
|
|
|
|
|
|
|
|
|
|
|
|
|
|
|
|
|
|
|
|
|
|
|
|
|
|
|
|
|
|
|
|
|
|
|
|
|
|
|
|
|
|
Total Consolidated Investment in Real Estate |
|
|
|
|
|
|
|
|
|
| 77,666 |
|
| $ | 6,101,789,051 |
|
| $ | 18,405,561,077 |
|
| $ | 1,519,546,263 |
|
| $ | 6,101,789,051 |
|
| $ | 19,925,107,340 |
|
| $ | 26,026,896,391 |
|
| $ | (6,040,378,191 | ) |
| $ | 19,986,518,200 |
|
| $ | 3,618,721,998 |
|
Description |
|
| Initial Cost to Company |
|
| Cost Capitalized Subsequent to Acquisition (Improvements, net) (E) |
|
| Gross Amount Carried at Close of Period 12/31/20 |
|
|
|
| |||||||||||||||||||||||||||||||||||
Apartment Name |
| Location |
| Non-Residential Components |
|
| Date of Construction |
| Apartment Units |
|
| Land |
|
| Building & Fixtures |
|
| Building & Fixtures |
|
| Land |
|
| Building & Fixtures (A) |
|
| Total (B) |
|
| Accumulated Depreciation (C) |
|
| Investment in Real Estate, Net at 12/31/20 |
|
| Encumbrances |
| |||||||||||
Avenir Apartments |
| Boston, MA |
| G |
|
| 2009 |
|
| 241 |
|
|
| 0 |
|
|
| 114,321,619 |
|
|
| 6,957,817 |
|
|
| 0 |
|
|
| 121,279,436 |
|
|
| 121,279,436 |
|
|
| (36,961,367 | ) |
|
| 84,318,069 |
|
|
| 83,594,553 |
| |
Calvert Woodley |
| Washington, D.C. |
|
| — |
|
| 1962 |
|
| 136 |
|
|
| 12,600,000 |
|
|
| 43,527,379 |
|
|
| 2,813,918 |
|
|
| 12,600,000 |
|
|
| 46,341,297 |
|
|
| 58,941,297 |
|
|
| (14,908,145 | ) |
|
| 44,033,152 |
|
| (H) |
| |
Citrus Suites |
| Santa Monica, CA |
|
| — |
|
| 1978 |
|
| 70 |
|
|
| 9,000,000 |
|
|
| 16,950,326 |
|
|
| 2,159,124 |
|
|
| 9,000,000 |
|
|
| 19,109,450 |
|
|
| 28,109,450 |
|
|
| (6,341,008 | ) |
|
| 21,768,442 |
|
| (H) |
| |
City Pointe |
| Fullerton, CA |
| G |
|
| 2004 |
|
| 183 |
|
|
| 6,863,792 |
|
|
| 36,476,208 |
|
|
| 3,982,736 |
|
|
| 6,863,792 |
|
|
| 40,458,944 |
|
|
| 47,322,736 |
|
|
| (16,998,993 | ) |
|
| 30,323,743 |
|
|
| 39,604,834 |
| |
Cleveland House |
| Washington, D.C. |
|
| — |
|
| 1953 |
|
| 214 |
|
|
| 18,300,000 |
|
|
| 66,392,414 |
|
|
| 6,478,149 |
|
|
| 18,300,000 |
|
|
| 72,870,563 |
|
|
| 91,170,563 |
|
|
| (23,146,687 | ) |
|
| 68,023,876 |
|
| (H) |
| |
Columbia Crossing |
| Arlington, VA |
|
| — |
|
| 1991 |
|
| 247 |
|
|
| 23,500,000 |
|
|
| 53,045,073 |
|
|
| 3,332,258 |
|
|
| 23,500,000 |
|
|
| 56,377,331 |
|
|
| 79,877,331 |
|
|
| (18,786,207 | ) |
|
| 61,091,124 |
|
| (H) |
| |
Elevé |
| Glendale, CA |
| G |
|
| 2013 |
|
| 208 |
|
|
| 14,080,560 |
|
|
| 56,419,440 |
|
|
| 1,113,113 |
|
|
| 14,080,560 |
|
|
| 57,532,553 |
|
|
| 71,613,113 |
|
|
| (16,339,803 | ) |
|
| 55,273,310 |
|
|
| 38,377,191 |
| |
Estancia at Santa Clara (fka Santa Clara) |
| Santa Clara, CA |
|
| — |
|
| 2000 |
|
| 450 |
|
|
| 0 |
|
|
| 123,759,804 |
|
|
| 2,978,093 |
|
|
| 0 |
|
|
| 126,737,897 |
|
|
| 126,737,897 |
|
|
| (41,055,149 | ) |
|
| 85,682,748 |
|
| (H) |
| |
Fairchase |
| Fairfax, VA |
|
| — |
|
| 2007 |
|
| 392 |
|
|
| 23,500,000 |
|
|
| 87,722,321 |
|
|
| 1,898,989 |
|
|
| 23,500,000 |
|
|
| 89,621,310 |
|
|
| 113,121,310 |
|
|
| (27,669,103 | ) |
|
| 85,452,207 |
|
| (H) |
| |
Fairfield |
| Stamford, CT |
| G |
|
| 1996 |
|
| 263 |
|
|
| 6,510,200 |
|
|
| 39,690,120 |
|
|
| 9,558,884 |
|
|
| 6,510,200 |
|
|
| 49,249,004 |
|
|
| 55,759,204 |
|
|
| (38,011,328 | ) |
|
| 17,747,876 |
|
|
| 31,415,078 |
| |
Flats at DuPont Circle |
| Washington, D.C. |
|
| — |
|
| 1967 |
|
| 306 |
|
|
| 35,200,000 |
|
|
| 108,768,198 |
|
|
| 4,360,800 |
|
|
| 35,200,000 |
|
|
| 113,128,998 |
|
|
| 148,328,998 |
|
|
| (33,817,504 | ) |
|
| 114,511,494 |
|
| (H) |
| |
Glo |
| Los Angeles, CA |
| G |
|
| 2008 |
|
| 201 |
|
|
| 16,047,023 |
|
|
| 48,650,963 |
|
|
| 3,698,250 |
|
|
| 16,047,023 |
|
|
| 52,349,213 |
|
|
| 68,396,236 |
|
|
| (19,833,118 | ) |
|
| 48,563,118 |
|
|
| 32,536,206 |
| |
Heights on Capitol Hill |
| Seattle, WA |
| G |
|
| 2006 |
|
| 104 |
|
|
| 5,425,000 |
|
|
| 21,138,028 |
|
|
| 1,918,209 |
|
|
| 5,425,000 |
|
|
| 23,056,237 |
|
|
| 28,481,237 |
|
|
| (11,613,731 | ) |
|
| 16,867,506 |
|
|
| 22,574,473 |
| |
Kelvin Court (fka Alta Pacific) |
| Irvine, CA |
|
| — |
|
| 2008 |
|
| 132 |
|
|
| 10,752,145 |
|
|
| 34,846,856 |
|
|
| 960,195 |
|
|
| 10,752,145 |
|
|
| 35,807,051 |
|
|
| 46,559,196 |
|
|
| (15,665,700 | ) |
|
| 30,893,496 |
|
|
| 26,250,120 |
|
Kenwood Mews |
| Burbank, CA |
|
| — |
|
| 1991 |
|
| 141 |
|
|
| 14,100,000 |
|
|
| 24,662,883 |
|
|
| 4,295,836 |
|
|
| 14,100,000 |
|
|
| 28,958,719 |
|
|
| 43,058,719 |
|
|
| (16,005,176 | ) |
|
| 27,053,543 |
|
|
| 37,607,274 |
|
La Terrazza at Colma Station |
| Colma, CA |
| G |
|
| 2005 |
|
| 155 |
|
|
| 0 |
|
|
| 41,251,044 |
|
|
| 3,595,476 |
|
|
| 0 |
|
|
| 44,846,520 |
|
|
| 44,846,520 |
|
|
| (21,415,715 | ) |
|
| 23,430,805 |
|
|
| 25,018,990 |
| |
Lindley Apartments |
| Encino, CA |
|
| — |
|
| 2004 |
|
| 129 |
|
|
| 5,805,000 |
|
|
| 25,705,000 |
|
|
| 2,226,777 |
|
|
| 5,805,000 |
|
|
| 27,931,777 |
|
|
| 33,736,777 |
|
|
| (11,253,531 | ) |
|
| 22,483,246 |
|
|
| 28,028,542 |
|
Lofts 590 |
| Arlington, VA |
|
| — |
|
| 2005 |
|
| 212 |
|
|
| 20,100,000 |
|
|
| 67,909,023 |
|
|
| 948,447 |
|
|
| 20,100,000 |
|
|
| 68,857,470 |
|
|
| 88,957,470 |
|
|
| (20,702,192 | ) |
|
| 68,255,278 |
|
|
| 42,977,538 |
|
Longview Place |
| Waltham, MA |
|
| — |
|
| 2004 |
|
| 348 |
|
|
| 20,880,000 |
|
|
| 90,255,509 |
|
|
| 11,851,439 |
|
|
| 20,880,000 |
|
|
| 102,106,948 |
|
|
| 122,986,948 |
|
|
| (53,169,019 | ) |
|
| 69,817,929 |
|
|
| 84,236,459 |
|
Metro on First |
| Seattle, WA |
| G |
|
| 2002 |
|
| 102 |
|
|
| 8,540,000 |
|
|
| 12,209,981 |
|
|
| 2,503,132 |
|
|
| 8,540,000 |
|
|
| 14,713,113 |
|
|
| 23,253,113 |
|
|
| (7,824,496 | ) |
|
| 15,428,617 |
|
|
| 21,479,983 |
| |
Moda |
| Seattle, WA |
| G |
|
| 2009 |
|
| 251 |
|
|
| 12,649,228 |
|
|
| 36,842,012 |
|
|
| 2,077,059 |
|
|
| 12,649,228 |
|
|
| 38,919,071 |
|
|
| 51,568,299 |
|
|
| (16,192,358 | ) |
|
| 35,375,941 |
|
| (I) |
| ||
Montierra (CA) |
| San Diego, CA |
|
| — |
|
| 1990 |
|
| 272 |
|
|
| 8,160,000 |
|
|
| 29,360,938 |
|
|
| 8,739,937 |
|
|
| 8,160,000 |
|
|
| 38,100,875 |
|
|
| 46,260,875 |
|
|
| (27,667,597 | ) |
|
| 18,593,278 |
|
|
| 60,994,469 |
|
Old Town Lofts |
| Redmond, WA |
| G |
|
| 2014 |
|
| 149 |
|
|
| 7,740,467 |
|
|
| 44,146,181 |
|
|
| 911,878 |
|
|
| 7,740,467 |
|
|
| 45,058,059 |
|
|
| 52,798,526 |
|
|
| (10,447,662 | ) |
|
| 42,350,864 |
|
|
| 35,552,619 |
| |
Olympus Towers |
| Seattle, WA |
| G |
|
| 2000 |
|
| 328 |
|
|
| 14,752,034 |
|
|
| 73,335,425 |
|
|
| 11,508,550 |
|
|
| 14,752,034 |
|
|
| 84,843,975 |
|
|
| 99,596,009 |
|
|
| (49,773,869 | ) |
|
| 49,822,140 |
|
|
| 94,702,663 |
| |
Park Place at San Mateo (fka San Mateo) |
| San Mateo, CA |
| G |
|
| 2001 |
|
| 575 |
|
|
| 71,900,000 |
|
|
| 211,907,141 |
|
|
| 14,964,633 |
|
|
| 71,900,000 |
|
|
| 226,871,774 |
|
|
| 298,771,774 |
|
|
| (72,984,554 | ) |
|
| 225,787,220 |
|
| (H) |
| ||
Skyhouse Denver |
| Denver, CO |
| G |
|
| 2017 |
|
| 354 |
|
|
| 13,562,331 |
|
|
| 126,360,318 |
|
|
| 677,621 |
|
|
| 13,562,331 |
|
|
| 127,037,939 |
|
|
| 140,600,270 |
|
|
| (15,522,629 | ) |
|
| 125,077,641 |
|
|
| 74,151,572 |
| |
SoMa Square Apartments (fka South Market) |
| San Francisco, CA |
| G |
|
| 1986 |
|
| 410 |
|
|
| 79,900,000 |
|
|
| 177,316,977 |
|
|
| 16,836,498 |
|
|
| 79,900,000 |
|
|
| 194,153,475 |
|
|
| 274,053,475 |
|
|
| (60,659,528 | ) |
|
| 213,393,947 |
|
| (H) |
| ||
Square One |
| Seattle, WA |
|
| — |
|
| 2014 |
|
| 112 |
|
|
| 7,222,544 |
|
|
| 26,277,456 |
|
|
| 133,045 |
|
|
| 7,222,544 |
|
|
| 26,410,501 |
|
|
| 33,633,045 |
|
|
| (7,302,057 | ) |
|
| 26,330,988 |
|
| (I) |
| |
Teresina |
| Chula Vista, CA |
|
| — |
|
| 2000 |
|
| 440 |
|
|
| 28,600,000 |
|
|
| 61,916,670 |
|
|
| 8,105,506 |
|
|
| 28,600,000 |
|
|
| 70,022,176 |
|
|
| 98,622,176 |
|
|
| (36,713,370 | ) |
|
| 61,908,806 |
|
|
| 37,940,000 |
|
Vantage Hollywood |
| Los Angeles, CA |
|
| — |
|
| 1987 |
|
| 298 |
|
|
| 42,580,326 |
|
|
| 56,014,674 |
|
|
| 3,323,418 |
|
|
| 42,580,326 |
|
|
| 59,338,092 |
|
|
| 101,918,418 |
|
|
| (16,037,599 | ) |
|
| 85,880,819 |
|
|
| 38,562,939 |
|
Vintage |
| Ontario, CA |
|
| — |
|
| 2005-2007 |
|
| 300 |
|
|
| 7,059,230 |
|
|
| 47,677,762 |
|
|
| 1,982,739 |
|
|
| 7,059,230 |
|
|
| 49,660,501 |
|
|
| 56,719,731 |
|
|
| (25,190,161 | ) |
|
| 31,529,570 |
|
|
| 49,111,234 |
|
Vintage at 425 Broadway (fka Promenade) |
| Santa Monica, CA |
| G |
|
| 1934/2001 |
|
| 60 |
|
|
| 9,000,000 |
|
|
| 13,961,523 |
|
|
| 1,968,533 |
|
|
| 9,000,000 |
|
|
| 15,930,056 |
|
|
| 24,930,056 |
|
|
| (5,447,549 | ) |
|
| 19,482,507 |
|
| (H) |
| ||
West 54th |
| New York, NY |
| G |
|
| 2001 |
|
| 222 |
|
|
| 60,900,000 |
|
|
| 48,193,837 |
|
|
| 4,524,296 |
|
|
| 60,900,000 |
|
|
| 52,718,133 |
|
|
| 113,618,133 |
|
|
| (18,850,602 | ) |
|
| 94,767,531 |
|
|
| 49,193,451 |
| |
Westgate (fka Westgate I) |
| Pasadena, CA |
|
| — |
|
| 2010 |
|
| 480 |
|
|
| 22,898,848 |
|
|
| 133,467,158 |
|
|
| 4,125,453 |
|
|
| 22,898,848 |
|
|
| 137,592,611 |
|
|
| 160,491,459 |
|
|
| (46,995,276 | ) |
|
| 113,496,183 |
|
|
| 96,433,496 |
|
Portfolio/Entity Encumbrances (1) |
|
|
|
|
|
|
|
|
|
| 0 |
|
|
| 0 |
|
|
| 0 |
|
|
| 0 |
|
|
| 0 |
|
|
| 0 |
|
|
| 0 |
|
|
| 0 |
|
|
| 0 |
|
|
| 798,691,865 |
|
Wholly Owned Encumbered |
|
|
|
|
|
|
|
|
|
| 10,127 |
|
|
| 842,305,927 |
|
|
| 2,668,597,698 |
|
|
| 193,678,425 |
|
|
| 842,305,927 |
|
|
| 2,862,276,123 |
|
|
| 3,704,582,050 |
|
|
| (1,032,587,859 | ) |
|
| 2,671,994,191 |
|
|
| 2,088,144,904 |
|
|
|
|
|
|
|
|
|
|
|
|
|
|
|
|
|
|
|
|
|
|
|
|
|
|
|
|
|
|
|
|
|
|
|
|
|
|
|
|
|
|
|
|
|
|
|
|
|
|
Partially Owned Unencumbered: |
|
|
|
|
|
|
|
|
|
|
|
|
|
|
|
|
|
|
|
|
|
|
|
|
|
|
|
|
|
|
|
|
|
|
|
|
|
|
|
|
|
|
|
|
|
|
|
|
2300 Elliott |
| Seattle, WA |
| G |
|
| 1992 |
|
| 92 |
|
|
| 796,800 |
|
|
| 7,173,725 |
|
|
| 7,820,623 |
|
|
| 796,800 |
|
|
| 14,994,348 |
|
|
| 15,791,148 |
|
|
| (12,389,244 | ) |
|
| 3,401,904 |
|
|
| 0 |
| |
9th & W |
| Washington, DC |
| G |
|
| (F) |
|
| 0 |
|
|
| 0 |
|
|
| 7,017,002 |
|
|
| 0 |
|
|
| 0 |
|
|
| 7,017,002 |
|
|
| 7,017,002 |
|
|
| 0 |
|
|
| 7,017,002 |
|
|
| 0 |
| |
Bellevue Meadows |
| Bellevue, WA |
|
| — |
|
| 1983 |
|
| 180 |
|
|
| 4,507,100 |
|
|
| 12,574,814 |
|
|
| 6,087,865 |
|
|
| 4,507,100 |
|
|
| 18,662,679 |
|
|
| 23,169,779 |
|
|
| (14,585,459 | ) |
|
| 8,584,320 |
|
|
| 0 |
|
Canyon Ridge |
| San Diego, CA |
|
| — |
|
| 1989 |
|
| 162 |
|
|
| 4,869,448 |
|
|
| 11,955,063 |
|
|
| 4,258,637 |
|
|
| 4,869,448 |
|
|
| 16,213,700 |
|
|
| 21,083,148 |
|
|
| (12,460,975 | ) |
|
| 8,622,173 |
|
|
| 0 |
|
Country Oaks |
| Agoura Hills, CA |
|
| — |
|
| 1985 |
|
| 256 |
|
|
| 6,105,000 |
|
|
| 29,561,865 |
|
|
| 7,563,839 |
|
|
| 6,105,000 |
|
|
| 37,125,704 |
|
|
| 43,230,704 |
|
|
| (23,902,034 | ) |
|
| 19,328,670 |
|
|
| 0 |
|
Harrison Square (fka Elliot Bay) |
| Seattle, WA |
| G |
|
| 1992 |
|
| 166 |
|
|
| 7,600,000 |
|
|
| 35,844,345 |
|
|
| 5,832,090 |
|
|
| 7,600,000 |
|
|
| 41,676,435 |
|
|
| 49,276,435 |
|
|
| (14,608,832 | ) |
|
| 34,667,603 |
|
|
| 0 |
| |
|
|
S-10
ERP OPERATING LIMITED PARTNERSHIP
Schedule III - Real Estate and Accumulated Depreciation
December 31, 20172020
Description |
|
| Initial Cost to Company |
|
| Cost Capitalized Subsequent to Acquisition (Improvements, net) (E) |
|
| Gross Amount Carried at Close of Period 12/31/20 |
|
|
|
| |||||||||||||||||||||||||||||||||||
Apartment Name |
| Location |
| Non-Residential Components |
|
| Date of Construction |
| Apartment Units |
|
| Land |
|
| Building & Fixtures |
|
| Building & Fixtures |
|
| Land |
|
| Building & Fixtures (A) |
|
| Total (B) |
|
| Accumulated Depreciation (C) |
|
| Investment in Real Estate, Net at 12/31/20 |
|
| Encumbrances |
| |||||||||||
Lantern Cove |
| Foster City, CA |
|
| — |
|
| 1985 |
|
| 232 |
|
|
| 6,945,000 |
|
|
| 23,064,976 |
|
|
| 7,999,330 |
|
|
| 6,945,000 |
|
|
| 31,064,306 |
|
|
| 38,009,306 |
|
|
| (21,090,571 | ) |
|
| 16,918,735 |
|
|
| 0 |
|
Radius Koreatown |
| Los Angeles, CA |
|
| — |
|
| 2014/2016 |
|
| 301 |
|
|
| 32,494,154 |
|
|
| 84,645,202 |
|
|
| 394,749 |
|
|
| 32,494,154 |
|
|
| 85,039,951 |
|
|
| 117,534,105 |
|
|
| (15,147,227 | ) |
|
| 102,386,878 |
|
|
| 0 |
|
Rosecliff |
| Quincy, MA |
|
| — |
|
| 1990 |
|
| 156 |
|
|
| 5,460,000 |
|
|
| 15,721,570 |
|
|
| 4,712,510 |
|
|
| 5,460,000 |
|
|
| 20,434,080 |
|
|
| 25,894,080 |
|
|
| (14,750,661 | ) |
|
| 11,143,419 |
|
|
| 0 |
|
Schooner Bay I |
| Foster City, CA |
|
| — |
|
| 1985 |
|
| 168 |
|
|
| 5,345,000 |
|
|
| 20,390,618 |
|
|
| 7,030,910 |
|
|
| 5,345,000 |
|
|
| 27,421,528 |
|
|
| 32,766,528 |
|
|
| (18,045,457 | ) |
|
| 14,721,071 |
|
|
| 0 |
|
Schooner Bay II |
| Foster City, CA |
|
| — |
|
| 1985 |
|
| 144 |
|
|
| 4,550,000 |
|
|
| 18,064,764 |
|
|
| 5,732,766 |
|
|
| 4,550,000 |
|
|
| 23,797,530 |
|
|
| 28,347,530 |
|
|
| (16,050,917 | ) |
|
| 12,296,613 |
|
|
| 0 |
|
Surrey Downs |
| Bellevue, WA |
|
| — |
|
| 1986 |
|
| 122 |
|
|
| 3,057,100 |
|
|
| 7,848,618 |
|
|
| 3,698,582 |
|
|
| 3,057,100 |
|
|
| 11,547,200 |
|
|
| 14,604,300 |
|
|
| (8,809,623 | ) |
|
| 5,794,677 |
|
|
| 0 |
|
Venn at Main |
| Bellevue, WA |
| G |
|
| 2016 |
|
| 350 |
|
|
| 26,626,497 |
|
|
| 151,520,448 |
|
|
| 518,736 |
|
|
| 26,626,497 |
|
|
| 152,039,184 |
|
|
| 178,665,681 |
|
|
| (21,480,824 | ) |
|
| 157,184,857 |
|
|
| 0 |
| |
Virgil Square |
| Los Angeles, CA |
|
| — |
|
| 1979 |
|
| 142 |
|
|
| 5,500,000 |
|
|
| 15,216,613 |
|
|
| 3,833,548 |
|
|
| 5,500,000 |
|
|
| 19,050,161 |
|
|
| 24,550,161 |
|
|
| (10,768,560 | ) |
|
| 13,781,601 |
|
|
| 0 |
|
Wood Creek II (fka Willow Brook (CA)) |
| Pleasant Hill, CA |
|
| — |
|
| 1985 |
|
| 228 |
|
|
| 5,055,000 |
|
|
| 38,388,672 |
|
|
| 9,606,448 |
|
|
| 5,055,000 |
|
|
| 47,995,120 |
|
|
| 53,050,120 |
|
|
| (27,453,256 | ) |
|
| 25,596,864 |
|
|
| 0 |
|
Partially Owned Unencumbered |
|
|
|
|
|
|
|
|
|
| 2,699 |
|
|
| 118,911,099 |
|
|
| 478,988,295 |
|
|
| 75,090,633 |
|
|
| 118,911,099 |
|
|
| 554,078,928 |
|
|
| 672,990,027 |
|
|
| (231,543,640 | ) |
|
| 441,446,387 |
|
|
| 0 |
|
|
|
|
|
|
|
|
|
|
|
|
|
|
|
|
|
|
|
|
|
|
|
|
|
|
|
|
|
|
|
|
|
|
|
|
|
|
|
|
|
|
|
|
|
|
|
|
|
|
Partially Owned Encumbered: |
|
|
|
|
|
|
|
|
|
|
|
|
|
|
|
|
|
|
|
|
|
|
|
|
|
|
|
|
|
|
|
|
|
|
|
|
|
|
|
|
|
|
|
|
|
|
|
|
Aero Apartments |
| Alameda, CA |
| G |
|
| (F) |
|
| 0 |
|
|
| 13,107,242 |
|
|
| 77,932,171 |
|
|
| 0 |
|
|
| 13,107,242 |
|
|
| 77,932,171 |
|
|
| 91,039,413 |
|
|
| 0 |
|
|
| 91,039,413 |
|
|
| 31,493,854 |
| |
Canyon Creek (CA) |
| San Ramon, CA |
|
| — |
|
| 1984 |
|
| 268 |
|
|
| 5,425,000 |
|
|
| 18,812,120 |
|
|
| 8,138,492 |
|
|
| 5,425,000 |
|
|
| 26,950,612 |
|
|
| 32,375,612 |
|
|
| (19,317,572 | ) |
|
| 13,058,040 |
|
|
| 28,193,080 |
|
Wisconsin Place |
| Chevy Chase, MD |
|
| — |
|
| 2009 |
|
| 432 |
|
|
| 0 |
|
|
| 172,089,355 |
|
|
| 1,687,416 |
|
|
| 0 |
|
|
| 173,776,771 |
|
|
| 173,776,771 |
|
|
| (54,348,611 | ) |
|
| 119,428,160 |
|
|
| 146,057,885 |
|
Partially Owned Encumbered |
|
|
|
|
|
|
|
|
|
| 700 |
|
|
| 18,532,242 |
|
|
| 268,833,646 |
|
|
| 9,825,908 |
|
|
| 18,532,242 |
|
|
| 278,659,554 |
|
|
| 297,191,796 |
|
|
| (73,666,183 | ) |
|
| 223,525,613 |
|
|
| 205,744,819 |
|
|
|
|
|
|
|
|
|
|
|
|
|
|
|
|
|
|
|
|
|
|
|
|
|
|
|
|
|
|
|
|
|
|
|
|
|
|
|
|
|
|
|
|
|
|
|
|
|
|
Total Consolidated Investment in Real Estate |
|
|
|
|
|
|
|
|
|
| 77,889 |
|
| $ | 5,855,057,873 |
|
| $ | 19,449,649,936 |
|
| $ | 1,898,617,291 |
|
| $ | 5,855,057,873 |
|
| $ | 21,348,267,227 |
|
| $ | 27,203,325,100 |
|
| $ | (7,859,657,203 | ) |
| $ | 19,343,667,897 |
|
| $ | 2,293,889,723 |
|
(1)See attached Encumbrances Reconciliation.
S-11
EQUITY RESIDENTIAL
ERP OPERATING LIMITED PARTNERSHIP
Schedule III - Real Estate and Accumulated Depreciation
December 31, 2020
NOTES:
| (A) | The balance of furniture & fixtures included in the total investment in real estate amount was |
| (B) | The cost, net of accumulated depreciation, for Federal Income Tax purposes as of December 31, |
| (C) | The life to compute depreciation for building is 30 years, for building improvements ranges from 5 to 15 years, for furniture & fixtures, replacements and renovations is 5 to 10 years and for lease intangibles is the average remaining term of each respective lease. |
| (D) | This asset consists of costs owned by the Management Business acquired/added at various acquisition dates and largely represents furniture, fixtures and equipment |
| (E) | Primarily represents capital expenditures for building improvements, replacements and renovations incurred subsequent to each property’s acquisition date. |
| (F) | Primarily represents land and/or construction-in-progress on projects either held for future development or projects currently under development. |
| (G) | A portion of these properties includes and/or will include |
|
|
|
|
|
|
| Boot property for Bond Partnership mortgage pool. |
S-11S-12