 | ||||||||
UNIVERSAL INSURANCE HOLDINGS, INC. | ||||||||
| (Exact name of registrant as specified in its charter) | ||||||||
| ☒ | ANNUAL REPORT PURSUANT TO SECTION 13 OR 15(d) OF THE SECURITIES EXCHANGE ACT OF 1934 | ||||
2023
| ☐ | TRANSITION REPORT PURSUANT TO SECTION 13 OR 15(d) OF THE SECURITIES EXCHANGE ACT OF 1934 | ||||
UNIVERSAL INSURANCE HOLDINGS, INC.
(Exact name of registrant as specified in its charter)
| ||||||||
UNIVERSAL INSURANCE HOLDINGS, INC. | ||||||||
| (Exact name of registrant as specified in its charter) | ||||||||
| Delaware | 65-0231984 | ||||
| (State or other jurisdiction of
| (I.R.S. Employer
| ||||
(Zip Code)
| Title of each class | Trading Symbol(s) | Name of each exchange on which registered | ||||||
Common Stock, | UVE | New York Stock Exchange | ||||||
Securities registered pursuant to Section 12(g) of the Act:
None.
| Securities registered pursuant to Section 12(g) of the Act: None. | ||||||||
Indicate by check mark if disclosure of delinquent filers pursuant to Item 405 of Regulation S-K (§ 229.405 of this chapter) is not contained herein, and will not be contained, to the best of registrant’s knowledge, in definitive proxy or information statements incorporated by reference in Part III of this Form 10-K or any amendment to this Form 10-K. ☐
| Large accelerated filer |
| Accelerated filer |
| ||||||||||
| Non-accelerated filer | ☐ | Smaller reporting company | ☐ | ||||||||||
| Emerging growth company | ☐ |
|
| ||||||||||
State the aggregate
2023, the last trading day of the registrant’s most recently completed second fiscal quarter: $405,608,782
this Annual Report on Form 10-K, to the extent not set forth herein, is incorporated herein by reference to the registrant’s definitive proxy statement relating to the Annual Meeting of Shareholders to be held in 2024, which definitive proxy statement shall be filed with the Securities and Exchange Commission within 120 days after the end of the fiscal year to which this Annual Report on Form 10-K relates.
Page No. | ||||||||||||||||
| Item 1. | ||||||||||||||||
|
| |||||||||||||||
Item 1A. |
| |||||||||||||||
Item 1B. |
| |||||||||||||||
| Item 1C. | ||||||||||||||||
Item 2. |
| |||||||||||||||
Item 3. |
| |||||||||||||||
Item 4. |
| |||||||||||||||
Item 5. |
| |||||||||||||||
| Item 6. | ||||||||||||||||
|
| |||||||||||||||
Item 7. |
| |||||||||||||||
Item 7A. |
| |||||||||||||||
Item 8. |
| |||||||||||||||
Item 9. |
| |||||||||||||||
Item 9A. |
| |||||||||||||||
Item 9B. |
| |||||||||||||||
| Item 9C. | ||||||||||||||||
Item 10. |
| |||||||||||||||
Item 11. |
| |||||||||||||||
Item 12. |
| |||||||||||||||
Item 13. |
| |||||||||||||||
Item 14. |
| |||||||||||||||
Item 15. |
| |||||||||||||||
Item 16. |
| |||||||||||||||
|
| |||||||||||||||
|
| |||||||||||||||
2
DOCUMENTS INCORPORATED BY REFERENCE
Information called for in PART III of this Form 10-K is incorporated by reference to the registrant’s definitive Proxy Statement to be filed within 120 days of the close of the registrant’s fiscal year in connection with the registrant’s annual meeting of shareholders.
INTRODUCTION
We generate revenues primarily from the collection of premiums. Other sources of revenue include: commissions paid by our reinsurers to our reinsurance intermediary subsidiary on reinsurance it places for the Insurance Entities; policy fees collected from policyholders by our managing general agent subsidiary; service revenue frombenefits, solicited claims handling on ceded claims; and financing fees charged to policyholders who choose to defer premium payments. We also generate income by investing our assets.
Over the past several years, we have grown our business both within Floridaother first-party litigation), technological advancements in distribution, underwriting, claims management and elsewhere in the United States through our distribution network of approximately 8,800 licensed independent agents. In writing business, we adhere to a disciplined underwriting approach – writing risks that are priced adequately and meet our underwriting standards – designed to achieve profitable growth as opposed to merely increasing the total number of policies written. We believe we are better positioned than many of our competitors to expand profitably and service our policyholders due to our established internal capabilities; protection afforded us by our reinsurance program; our experienced management team that successfully navigated prior active hurricane seasons, including 2017, 2016, 2005 and 2004; our strong surplus and capital base; our success in growing organically in Florida without relying on the
3
assumption of policies from Citizens Property Insurance Corporation (“Citizens”), the Florida state-sponsored insurer of last resort; and our growing geographic diversification. We also believe that our reinsurance program is structured such that, in the event of an active hurricane season, we are able to pay policyholder claims, maintain sufficient surplus to grow profitably and take advantage of the resulting market dislocation that could potentially follow.
Below is an organization chart that summarizes our corporate structure:

The Insurance Entities are our insurance operating subsidiaries. Most of our policies are written by UPCIC. Universal Risk Advisors (“URA”) is our managing general agent and manages our distribution network and negotiates our reinsurance. Universal Inspection Corporation (“UIC”) conducts inspections as part of our underwriting process, and Universal Adjusting Corporation (“UAC”) manages our claims processing and adjustment functions. Blue Atlantic Reinsurance Corporation (“BARC”) is our reinsurance intermediary. These service companies are vertically aligned with our Insurance Entities to maintain quality throughout the policy origination and claim settlement process. In addition, our servicing subsidiaries help reduce the costs typically associated with outsourced business functions, enhance our ability to expand geographically due to economies of scale in our operations and allow us to expand our business incrementally and more effectively.
OUR STRATEGY
Pursue Profitable Growth with a Focus on Organic Development
We continue to pursue profitable growth both within Florida and through expansion into other states, while continuing to expand Universal DirectSM and adding new products when prudent (such as the Fire, Commercial Multi-Peril, and Other Liability (collectively, “Commercial Residential”) lines of business in Florida that we introduced in late in 2016). Each of these areas is discussed further below.
4
|
Other States – We intend to continue our geographical expansion outside of Florida primarily to take advantage of opportunities to write profitable business as well as to diversify our revenue and risk. We target states with underserved homeowners insurance markets where we believe there is price adequacy for our products and where policyholders would benefit from our market knowledge and integrated service model. In new markets, we seek to replicate the successful growth strategy we implemented in Florida, including the careful appointment of new agents that we believe will generate profitable business for our Company. We intend to leverage our existing agent network to generate new relationships and business. We will continue in our commitment to careful, profitable business growth through such independent agents, with the intent to grow quickly when the opportunity arises, including following any market dislocation. Our strategy involves taking the time to learn about each new market and its unique risks in order to carefully develop our own policy forms, rates and informed underwriting standards. We also believe further geographic diversification will decrease our relative reinsurance costs as our risk profile changes to include more risks not tied to the Florida hurricane exposure. We believe that such diversification will produce more earnings stability as we expand to states with different market cycles than Florida and where the risks insured could offset Florida losses during an active hurricane season such as 2017 which included the impact of Hurricane Irma. Apart from Florida, we currently write homeowners insurance policies in Alabama, Delaware, Georgia, Hawaii, Indiana, Maryland, Massachusetts, Michigan, Minnesota, New Jersey, New York, North Carolina, Pennsylvania, South Carolina, and Virginia, and are also licensed to issue policies in Illinois, Iowa, New Hampshire, and West Virginia. As of December 31, 2017, policies outside of Florida accounted for 26% of our total insured value, or $51.8 billion, as compared to 21% as of December 31, 2016.
|
|
New Products – We evaluate potential new product offerings, such as the Commercial Residential business we launched in Florida late in 2016, and look to add new products to our portfolio when prudent after careful consideration and substantial planning and development. On August 3, 2016 we announced that APPCIC received authorization from the FLOIR to amend its Certificate of Authority to add Commercial Residential lines of business in Florida. During the fourth quarter of 2016, our rates were approved and we wrote our first Commercial Residential policy.Expansion into the Commercial Residential business is a step forward for the Company, and will allow us to tap into a large complementary market that will advance our organic growth strategy. We believe there is an opportunity in the Commercial Residential marketplace in Florida and expect to leverage our robust independent agent distribution network to grow this new product. While we view the Commercial Residential market as an untapped opportunity, we intend to approach this expansion cautiously in order to establish a solid framework onto which we can build our Commercial Residential portfolio in order to ensure proper risk selection and that adequate pricing is achieved.
5
Optimize our Reinsurance Program as our Risk Profile Changes
We will continue to obtain what we believe to be appropriate reinsurance limits, coverage and terms so that our policyholders and shareholders are adequately protected in the event of an active hurricane season. Significant additional new capital entering portions of the reinsurance marketplace has afforded us the opportunity to obtain favorable pricing and contract terms in recent years. Our dedicated reinsurance team at BARC includes seasoned industry professionals whom we hired from Willis Re almost 12 years ago, as well as additional key personnel more recently from leading global reinsurance intermediaries. BARC differentiates us from our competitors by enabling us to act as our own reinsurance intermediary, developing a bespoke reinsurance program tailored to our needs in both soft and hard reinsurance markets. This team has developed and enhanced existing strong long-term relationships with world leading reinsurance companies, providing better efficiency in the manner in which we buy reinsurance. We had in excess of 60 reinsurance partners for the 2017-2018 reinsurance year from companies in the United States, Bermuda, London, Continental Europe and Asia. BARC works in conjunction with URA in providing these services. We also receive reinsurance intermediary services from Guy Carpenter and thereby benefit from its depth of experience and knowledge of market standards. Guy Carpenter works closely with our teams at BARC and URA in designing our reinsurance program and allowing us to obtain favorable pricing. Our internal team and Guy Carpenter continually evaluate prevailing costsoverall operational efficiencies, and the levelrisk appetite of coverage that we determine is necessary in order to proactively capitalize on favorable market conditions.
Effective June 1, 2015, we eliminated our quota share reinsurance arrangements; purchased additional excess of loss catastrophe cover; and converted from a two-tower reinsurance program to a single tower reinsurance program covering our nationwide business based on our improving financial condition, our evaluation of market conditions and our changing coverage needs. We also supplemented this nationwide reinsurance program with a stand-alone supplemental non-Florida catastrophe reinsurance program for the 2017-2018 period, which provides coverage for catastrophic events affecting states outside of Florida in which we write policies. We believe that restructuring our reinsurance program in this manner and continuously re-evaluating that structure has allowed us to take advantage of attractive reinsurance pricing and terms and to retain profitable business by eliminating our quota share program, while still maintaining reinsurance coverage that we believe is sufficient to protect our policyholders and shareholders. As an example, our reinsurance program generally performed as designed following Hurricane Irma in 2017, limiting the net loss and loss adjustment expenses (“LAE”) to our net retention levels. Further, fees generated from our service subsidiary companies produced income after Hurricane Irma, and this, combined with other benefits derived from our reinsurance program, helped to offset losses and reduce the overall effect that Hurricane Irma had on our consolidated financial statements. See Item 7 – Management’s Discussion and Analysis of Financial Condition and Results of Operations - “Overview” for further discussion about Hurricane Irma.
Continue to Build and Enhance Our Claims Operations
Over the last decade, we have developed a proprietary claims administration system that allows us to efficiently process nearly all aspects of claims resolution for our policyholders. Our technology system has shortened claims handling and processing times, reduced associated claims resolution costs and has generated positive feedback from our policyholders and independent insurance agents. In addition, we launched our Fast Track (“Fast Track”) initiative in 2015, which expedites the claims settlement process to close certain types of claims in as little as 24 hours. The initiative sends select field adjusters to make on-site evaluations, with authorization to make payments to policyholders for certain types of claims. Our internal claims operation allows us to identify any trends or problems that may become apparent as claims are processed such that we can revise and bolster our underwriting guidelines as necessary in order to continue adequately pricing risks. Further, we continue to retain select third-party Florida claims administrators and adjusters as well as one national administrator to perform field services for and adjust a portion of our claims in order to maintain our relationships with them so that they can assist us during periods of high claims volume in providing high quality and timely service to our policyholders. We recognize the importance of claims processing and will continue to invest in this functionality.
Maintain an Emphasis on Underwriting Discipline
We seek to generate a consistent underwriting profit on the business we write in hard and soft markets through carefully developed underwriting guidelines informed by our experience in evaluating risks and in handling and processing claims. By focusing on identifying and assessing key risks and exposures in the market, we believe we are able to accurately price eligible risks and generate consistent profits. We assumed only one small group of policies from Citizens’ predecessor in 1998 when we first began our operations. Since then, we have grown our business by leveraging our network of approximately 4,300 independent agents in Florida, and by expanding to other geographic areas that present market opportunities. We periodically review the renewal rates and quality of business generated by our independent agents to ensure underwriting profitability and work with agents where we believe improvement is warranted. As a result of this organic expansion and our vertically integrated structure, all of our operating units possess extensive knowledge of the personal residential homeowners insurance market.
6
Provide High Quality Service to our Policyholders
We strive to provide excellent customer service to each of our policyholders throughout every aspect of our business. We believe our vertically integrated business model provides a superior level of customer service for our policyholders, enhancing our reputation and increasing the likelihood that our policyholders will renew their policies with us. We believe that when policyholders have high levels of customer satisfaction with our Company, we are able to strengthen our reputation and relationships with our independent insurance agent network. We are committed to managing our losses, loss adjustment expenses and claims administration procedures through prudent underwriting and the use of internal claims adjustment services. We believe our personnel growth and commitment to an in-house claims handling process has improved the policyholder experience and, therefore, our relationship with the policyholders agents, which we believe increases retention of policies in-force. Our monthly weighted average renewal retention rate for the year ended December 31, 2017 was 88.1%.
OUR COMPETITIVE STRENGTHS
We believe that our success, historical growth and ability to capitalize on our future growth prospects are a result of the following competitive strengths of our business and management team.
Experienced Leadership Team
We have a deep and experienced leadership team with extensive experience in the Florida personal residential homeowners insurance market. Our Chief Executive Officer, Sean P. Downes, has more than 25 years of experience in the insurance industry. Prior to Mr. Downes’ arrival, all of our claims processing was outsourced to third parties. When Mr. Downes joined our company in 1999, he oversaw our claims operations and later oversaw the development of our vertically integrated structure. Mr. Downes has worked in the Florida insurance industry during all of its most recent active hurricane seasons. In particular, Mr. Downes led the claims team of a multi-line insurance claims adjusting corporation following Hurricane Andrew and served as Chief Operating Officer of UPCIC during the 2005 and 2004 active hurricane seasons. Jon W. Springer, our President and Chief Risk Officer, has over 25 years of experience in the insurance industry, including nine years leading a team of reinsurance specialists for Willis Re before joining us to implement and oversee our reinsurance program. Prior to becoming our President and Chief Risk Officer, Mr. Springer was Chief Operating Officer and an Executive Vice President of URA and BARC.
We believe this leadership team has led us in a strategic direction that has realized many benefits for our shareholders and policyholders, evidenced in part by the 155.0% increase in our stockholders’ equity and the 136.1% increase in policyholders’ surplus that we have realized since their tenure began. Further, they are supported by a group of highly qualified individuals with industry expertise and extensive operational experience, which enables us to capitalize on our experience of having emerged from the 2004, 2005, and 2017 active hurricane seasons in sound financial condition, whereas many of our competitors are new to the market and have not experienced the challenges of an active Florida hurricane season.
Vertically Integrated Structure
We are vertically integrated with substantially all aspects of insurance underwriting, policy issuance, general administration and claims processing and settlement performed internally. Our ability to provide these services ourselves allows us to compress the cycle time of claim resolution in order to promptly pay valid claims and to control claims handling costs. In particular, by performing our own claims adjustment processes, we can better expedite meritorious claims as well as devote attention to potentially suspicious or inflated claims. As a result, we are generally able to begin the adjustment and mitigation process much earlier than if we relied more heavily on third parties, thereby reducing LAE and ultimate loss payouts. Our statutory net loss and LAE ratio for the nine months ended September 30, 2017 was 53.0%, lower than most of our peer companies. We are also able to retain a significant portion of the management and service fees that we and, indirectly, our reinsurers would otherwise pay to third parties for rendering such services. We do, however, intend to continue having a small portion of claims handled by select third parties, as we believe that maintaining relationships with third-party service providers will benefit us in the event we need their assistance in handling claims due to a catastrophic event.
In the future, we will continue to capitalize on our vertically integrated structure by retaining certain fees that we pay to our subsidiary service providers for, managing general agent, reinsurance brokerage, adjusting and other services. We currently administer 100% of all claims and outsource 35% of on-site field adjustment assignments, and thereby retain a corresponding portion of fees that would have otherwise been paid to external adjusters. These cost efficiencies will help us better withstand the financial impact of potential catastrophic storms. We also continue to retain select third-party claims adjusters to perform field services and adjust the remaining portion of our claims in order to maintain our relationships with them, so they can assist us during periods of high claims volume in providing high quality and timely service to our policyholders. Accordingly, we believe we are able to reduce expenses during non-catastrophe years while providing a high level of customer service during all years.
7
Robust Independent Agent Distribution Network
We have developed long-term relationships with a network of approximately 8,800 licensed independent insurance agents – with approximately 4,300 in Florida and approximately 4,500 outside of Florida. Of our 4,300 independent Florida agents, approximately 1,600 have written business with us for over a decade. Our relationships with our Florida independent agents are critical to our success in growing our business in the future and are key differentiators when compared with competitors that have relied upon assumptions of policies from Citizens for their growth and, as a result, may not have developed the same degree of loyalty with as large a group of independent agents in Florida. We believe we have been able to build this network due to our reputation, commitment to the Florida market, experience, and integrity in the underwriting process, as well as our consistency in offering our products through hard and soft markets. Further, the responsiveness of our operating units due to our vertically integrated structure enhances our relationships with our independent agents. By developing and controlling our proprietary technology system, we can rapidly respond to enhancement requests from our independent agents regarding our policy processing system.
Strong Balance Sheet, with a Proven Capital Return Strategy
We have a strong balance sheet, including a stable investment portfolio, a conservative reserve position, a strong and growing capital base, and a proven capital return strategy. Our investment portfolio is largely fixed maturities with a modest allocation of equities and real estate. Our fixed maturities portfolio is ~99% investment grade securities with a AA- average credit rating. We have a strong and growing capital position that contains minimal goodwill, no intangible assets, and minimal debt. We take a conservative approach to loss reserving, and have made substantial efforts in recent years to improve our claims operation, including the addition of our Fast Track team (which has reduced claim resolution time) and an intensified effort to collect subrogation. Since the Company was formed in 1997, we have posted substantial growth in stockholders’ equity and book value per share. We have demonstrated an ability and willingness to return capital to our shareholders, paying both a regular dividend and, over each of the past six years a special dividend, as well as repurchasing shares of our common stock in the open market and in private transactions.
MARKET
Florida
According to the U.S. Census Bureau, at June 30, 2017, Florida was the third largest state in terms of population, with approximately 21 million people. The University of Florida Bureau of Economic and Business Research estimates that Florida is expected to reach a population of approximately 26 million people by 2040, an increase of 41% from 2010. Property ownership and development represent key drivers of the Florida economy. Because of its location, Florida is exposed to an increased risk of hurricanes during the entire six months of the Atlantic hurricane season, which spans from June 1 through November 30. Eight hurricanes in 2004 and 2005, including Hurricanes Charley, Katrina, Rita and Wilma, caused combined estimated nationwide property damage of over $127 billion, a significant portion of which occurred in Florida. In September 2017, Hurricane Irma caused an estimated $17.2 billion in property damage, the majority of which occurred in Florida. Given the potential for significant personal property damage, the availability of personal residential insurance and claims servicing are vitally important to Florida residents.
The Florida residential insurance market is highly fragmented and dominated by in-state insurance companies, and the state’s residual insurance market, Citizens. Significant dislocation in the Florida property insurance market began following Hurricane Andrew in 1992 and accelerated following the 2004 and 2005 hurricane seasons. National and regional insurers significantly reduced their share of the market in Florida between 1999 and 2012. As national and regional insurance companies reduced their exposure in Florida, Citizens, which was at the time and remains today, by law, an insurer of last resort, increased efforts to provide affordable residential insurance to those residents unable to obtain coverage in the private market. As a result, Citizens’ policy count grew from roughly 800,000 policies in 2005 to a peak level of approximately 1.5 million policies in late 2011. To reduce Citizens’ risk exposure, beginning in 2010, Florida’s elected officials encouraged Citizens to focus on reducing the size of its portfolio by returning policies to the private market. Depopulation efforts have been successful, as Citizens’ policy count at September 30, 2017 was approximately 452,000. To be eligible for a Citizens policy, an applicant must either be denied comparable coverage offers from the private insurance market or have received coverage offerings from the private insurance market requiring premium payments that are more than 15% higher than a comparable Citizens policy.
According to data compiled by the FLOIR, Citizens was the second largest residential insurer in Florida as of September 30, 2017, with a market share of approximately 8.1% based on total direct premiums written in-force for personal residential insurance (excluding mobile homeowners and farmowners). As of December 31, 2017, less than 1,000 of our 618,280 Florida in-force policies, or 0.1%, were assumed from Citizens’ predecessor, as compared to some of our competitors that collectively have assumed more than 785,000 policies from Citizens since January 1, 2014. We believe we have the opportunity to significantly expand the size of our personal residential homeowners insurance business both inside and outside of Florida by pursuing organic growth, and have demonstrated this ability within Florida since 1998 and outside of Florida since 2008.
8
All residential insurance companies that write business in Florida, including the Insurance Entities, are required to obtain a form of reinsurance through the Florida Hurricane Catastrophe Fund (the “FHCF”), a state-sponsored entity that provides a layer of reinsurance protection at a price that is typically lower than what would otherwise be available in the general market. The purpose of the FHCF is to protect and advance the state’s interest in maintaining insurance capacity in Florida by providing reimbursements to insurers for a portion of their catastrophe hurricane losses. Currently, the FHCF provides $17 billion of aggregate capacity annually to its participating insurers, which may be adjusted by statute from time to time.
Other States
While we are concentrated in Florida, part of our strategy is to continue our geographic expansion outside of Florida primarily, to take advantage of opportunities to write profitable business as well as to diversify our revenue and risk. We are targeting states with underserved homeowners insurance markets where we believe there is price adequacy for our products and where policyholders would benefit from our market knowledge and integrated service model. We currently write homeowners insurance policies in Alabama, Delaware, Georgia, Hawaii, Indiana, Maryland, Massachusetts, Michigan, Minnesota, New Jersey, New York, North Carolina, Pennsylvania, South Carolina, and Virginia, and are also licensed to issue policies in Illinois, Iowa, New Hampshire, and West Virginia. We look to expand to markets that have opportunities for reasoned, profitable growth and that allow us to position ourselves to take advantage of market dislocation opportunities similar to what we capitalized on in Florida (e.g. following the 2017, 2005 and 2004 hurricane seasons).
COMPETITION
The market for personal residential homeowners insurance is highly competitive. In our primary market, Florida, there are approximately 127 licensed insurance companies that write residential homeowners insurance policies. See “Item 1A—Risk Factors—Risks Relating to Our Business—Our future results are dependent in part on our ability to successfully operate in a highly competitive insurance industry.”
The table below shows policy count, direct written premium in-force and total insured value by market share (excluding mobile homeowners and farmowners) for the top 20 personal residential homeowners insurance companies by direct written premium in Florida as of September 30, 2017, which is the most recent date that the information is publicly available. We compete to varying degrees with all of these companies and others, including large national carriers.
9
| Florida Homeowners Insurance Market - Personal Residential - |
| ||||||||||||||||||||||
|
| Ranked by Direct Written Premium In-Force* |
| |||||||||||||||||||||
|
|
|
|
|
|
|
|
|
| Direct |
|
|
|
|
|
|
|
|
|
|
|
|
| |
|
|
|
|
|
|
|
|
|
| Written |
|
|
|
|
|
|
|
|
|
|
|
|
| |
|
| Policies |
|
| Percentage |
|
| Premium |
|
| Percentage |
|
| Total Insured |
|
| Percentage |
| ||||||
Company Name |
| in-Force |
|
| Distribution |
|
| in-Force |
|
| Distribution |
|
| Value** |
|
| Distribution |
| ||||||
Universal Insurance Holdings, Inc. |
|
| 612,670 |
|
|
| 10.5 | % |
| $ | 927,593 |
|
|
| 10.1 | % |
| $ | 140,293,797 |
|
|
| 7.5 | % |
Citizens Property Insurance Corporation |
|
| 389,990 |
|
|
| 6.7 | % |
|
| 745,951 |
|
|
| 8.1 | % |
|
| 93,360,665 |
|
|
| 5.0 | % |
Tower Hill |
|
| 353,530 |
|
|
| 6.0 | % |
|
| 635,426 |
|
|
| 6.9 | % |
|
| 152,405,375 |
|
|
| 8.1 | % |
Federated National Insurance Company |
|
| 277,379 |
|
|
| 4.7 | % |
|
| 487,640 |
|
|
| 5.3 | % |
|
| 98,376,805 |
|
|
| 5.2 | % |
Heritage Insurance Holdings, Inc. |
|
| 232,854 |
|
|
| 4.0 | % |
|
| 439,461 |
|
|
| 4.8 | % |
|
| 75,153,790 |
|
|
| 4.0 | % |
USAA |
|
| 219,057 |
|
|
| 3.7 | % |
|
| 403,752 |
|
|
| 4.4 | % |
|
| 66,863,296 |
|
|
| 3.6 | % |
Progressive |
|
| 341,891 |
|
|
| 5.8 | % |
|
| 398,679 |
|
|
| 4.3 | % |
|
| 112,792,465 |
|
|
| 6.0 | % |
Security First Insurance Company |
|
| 342,192 |
|
|
| 5.8 | % |
|
| 378,932 |
|
|
| 4.1 | % |
|
| 94,267,005 |
|
|
| 5.0 | % |
HCI Group, Inc. |
|
| 135,154 |
|
|
| 2.3 | % |
|
| 345,804 |
|
|
| 3.8 | % |
|
| 42,596,761 |
|
|
| 2.3 | % |
United Insurance Holdings Corp. |
|
| 177,340 |
|
|
| 3.0 | % |
|
| 301,781 |
|
|
| 3.3 | % |
|
| 71,438,025 |
|
|
| 3.8 | % |
First Protective Insurance Company |
|
| 117,170 |
|
|
| 2.0 | % |
|
| 295,098 |
|
|
| 3.2 | % |
|
| 66,800,316 |
|
|
| 3.6 | % |
St. Johns Insurance Company, Inc. |
|
| 169,181 |
|
|
| 2.9 | % |
|
| 257,153 |
|
|
| 2.8 | % |
|
| 72,357,431 |
|
|
| 3.9 | % |
American Integrity Insurance Company of Florida |
|
| 237,913 |
|
|
| 4.1 | % |
|
| 256,563 |
|
|
| 2.8 | % |
|
| 82,883,738 |
|
|
| 4.4 | % |
People’s Trust Insurance Company |
|
| 129,626 |
|
|
| 2.2 | % |
|
| 248,733 |
|
|
| 2.7 | % |
|
| 38,458,616 |
|
|
| 2.1 | % |
Florida Peninsula Holdings, LLC |
|
| 114,201 |
|
|
| 1.9 | % |
|
| 244,551 |
|
|
| 2.7 | % |
|
| 41,938,043 |
|
|
| 2.2 | % |
Federal Insurance Company |
|
| 33,479 |
|
|
| 0.6 | % |
|
| 200,750 |
|
|
| 2.2 | % |
|
| 62,136,743 |
|
|
| 3.3 | % |
Southern Fidelity |
|
| 131,073 |
|
|
| 2.2 | % |
|
| 179,617 |
|
|
| 2.0 | % |
|
| 33,363,734 |
|
|
| 1.8 | % |
American International Group, Inc. |
|
| 14,894 |
|
|
| 0.3 | % |
|
| 172,063 |
|
|
| 1.9 | % |
|
| 45,122,732 |
|
|
| 2.4 | % |
Allstate Corp. (Castle Key) |
|
| 168,793 |
|
|
| 2.9 | % |
|
| 169,003 |
|
|
| 1.8 | % |
|
| 31,979,446 |
|
|
| 1.7 | % |
Safepoint Insurance Company |
|
| 71,904 |
|
|
| 1.2 | % |
|
| 140,932 |
|
|
| 1.5 | % |
|
| 16,695,872 |
|
|
| 0.9 | % |
Total - Top 20 Insurers |
|
| 4,270,291 |
|
|
| 72.8 | % |
| $ | 7,229,482 |
|
|
| 78.7 | % |
| $ | 1,439,284,655 |
|
|
| 76.8 | % |
|
|
|
|
|
|
|
|
|
|
|
|
|
|
|
|
|
|
|
|
|
|
|
|
|
Total - All Insurers |
|
| 5,858,776 |
|
|
| 100.0 | % |
| $ | 9,167,584 |
|
|
| 100.0 | % |
| $ | 1,875,697,224 |
|
|
| 100.0 | % |
|
|
|
|
We compete primarily on the basis of the strength of our distribution networks, high-quality service to our independent agents and policyholders, our reputation and commitment to the Florida market, claims handling ability, product features tailored to our markets and price, among other factors. Our successful track record in writing residential homeowners insurance in catastrophe-exposed areas has enabled us to develop sophisticated risk selection and pricing techniques that endeavorstrive to identify desirable risks and accurately reflectprice the risk of loss while allowing us to be competitive in our target markets. This risk selection and pricing approach allows us to profitably offer competitive products in areas that have a high demand for property insurance yet are underserved by the national carriers. Each of the Insurance Entities is currently rated “A” (“Exceptional”) by Demotech, Inc. (“Demotech”), a rating agency specializing in evaluating the financial stability of insurers.
PRODUCTS AND DISTRIBUTION
Products
Our focus and our primary product is personal residential homeowner insurance, which accounts for the vast majority of business that we write. Our homeowners insurance products provide policyholders with the ability to receive homeowners, renters, condominium, dwelling, fire, other structures, personal property, personal liability and personal articles coverages. For the year ended December 31, 2017, we wrote an average of 19,829 new policies per month, an increase of 18.3% as compared to the prior year, and residential
10
homeowners policies produced direct written premium of $982.4 million. Homeowners insurance policies accounted for 93.0% of our total direct written premium, with the remaining 7.0% comprised of Commercial Residential and fire and allied lines coverage.
The nature of our business, with respect to both claims and sales, tends to be seasonal over the course of a year, reflecting consumer behaviors in connection with the Florida residential real estate market and the need to be insured before the start of the hurricane season. The amount of written premium tends to increase just prior to the second quarter of our fiscal year and to decrease approaching the fourth quarter. We also face cyclicality resulting from hard and soft market cycles. See “Item 1A—Risk Factors—Risks Relating to Our Business—Our financial condition and operating results and the financial condition and operating results of our Insurance Entities may be adversely affected by the cyclical nature of the property and casualty insurance business.”
The geographical distribution of our policies in-force, in-force premium and total insured value for Florida by county were as follows as of December 31, 2017 (dollars in thousands, rounded to the nearest thousand):
|
| As of December 31, 2017 |
| |||||||||||||||||||||
|
|
|
|
|
|
|
|
|
| In-Force |
|
|
|
|
|
| Total Insured |
|
|
|
|
| ||
County |
| Count |
|
| % |
|
| Premium |
|
| % |
|
| Value |
|
| % |
| ||||||
South Florida |
|
|
|
|
|
|
|
|
|
|
|
|
|
|
|
|
|
|
|
|
|
|
|
|
Broward |
|
| 92,991 |
|
|
| 15.1 | % |
| $ | 184,217 |
|
|
| 19.9 | % |
| $ | 24,626,640 |
|
|
| 16.8 | % |
Palm Beach |
|
| 79,122 |
|
|
| 12.8 | % |
|
| 144,032 |
|
|
| 15.6 | % |
|
| 21,790,700 |
|
|
| 14.9 | % |
Miami-Dade |
|
| 82,352 |
|
|
| 13.3 | % |
|
| 165,001 |
|
|
| 17.8 | % |
|
| 18,516,985 |
|
|
| 12.6 | % |
South Florida exposure |
|
| 254,465 |
|
|
| 41.2 | % |
|
| 493,250 |
|
|
| 53.3 | % |
|
| 64,934,325 |
|
|
| 44.3 | % |
|
|
|
|
|
|
|
|
|
|
|
|
|
|
|
|
|
|
|
|
|
|
|
|
|
Other significant* Florida counties |
|
|
|
|
|
|
|
|
|
|
|
|
|
|
|
|
|
|
|
|
|
|
|
|
Pinellas |
|
| 39,366 |
|
|
| 6.4 | % |
|
| 45,955 |
|
|
| 5.0 | % |
|
| 6,893,810 |
|
|
| 4.7 | % |
Hillsborough |
|
| 26,248 |
|
|
| 4.2 | % |
|
| 33,540 |
|
|
| 3.6 | % |
|
| 6,188,844 |
|
|
| 4.2 | % |
Escambia |
|
| 19,173 |
|
|
| 3.1 | % |
|
| 29,943 |
|
|
| 3.2 | % |
|
| 5,489,568 |
|
|
| 3.8 | % |
Collier |
|
| 21,039 |
|
|
| 3.4 | % |
|
| 27,011 |
|
|
| 2.9 | % |
|
| 3,572,248 |
|
|
| 2.4 | % |
Lee |
|
| 26,534 |
|
|
| 4.3 | % |
|
| 26,254 |
|
|
| 2.8 | % |
|
| 4,158,638 |
|
|
| 2.8 | % |
Polk |
|
| 18,309 |
|
|
| 3.0 | % |
|
| 25,030 |
|
|
| 2.7 | % |
|
| 5,529,038 |
|
|
| 3.8 | % |
Pasco |
|
| 23,575 |
|
|
| 3.8 | % |
|
| 24,170 |
|
|
| 2.6 | % |
|
| 7,615,170 |
|
|
| 5.2 | % |
Brevard |
|
| 19,354 |
|
|
| 3.1 | % |
|
| 24,078 |
|
|
| 2.6 | % |
|
| 3,944,004 |
|
|
| 2.7 | % |
Total other significant* counties |
|
| 193,598 |
|
|
| 31.3 | % |
|
| 235,981 |
|
|
| 25.4 | % |
|
| 43,391,320 |
|
|
| 29.6 | % |
|
|
|
|
|
|
|
|
|
|
|
|
|
|
|
|
|
|
|
|
|
|
|
|
|
|
|
|
|
|
|
|
|
|
| In-Force |
|
|
|
|
|
| Total Insured |
|
|
|
|
| ||
Summary for all of Florida |
| Count |
|
| % |
|
| Premium |
|
| % |
|
| Value |
|
| % |
| ||||||
South Florida exposure |
|
| 254,465 |
|
|
| 41.2 | % |
|
| 493,250 |
|
|
| 53.3 | % |
|
| 64,934,325 |
|
|
| 44.3 | % |
Total other significant* counties |
|
| 193,598 |
|
|
| 31.3 | % |
|
| 235,981 |
|
|
| 25.4 | % |
|
| 43,391,320 |
|
|
| 29.6 | % |
Other Florida counties |
|
| 170,217 |
|
|
| 27.5 | % |
|
| 196,856 |
|
|
| 21.3 | % |
|
| 38,298,825 |
|
|
| 26.1 | % |
Total Florida |
|
| 618,280 |
|
|
| 100.0 | % |
| $ | 926,087 |
|
|
| 100.0 | % |
| $ | 146,624,470 |
|
|
| 100.0 | % |
|
|
11
The geographical distribution of our policies in-force, in-force premium and total insured value across all states were as follows, as of December 31, 2017, 2016 and 2015 (dollars in thousands, rounded to the nearest thousand):
|
| As of December 31, 2017 |
| |||||||||||||||||||||
|
|
|
|
|
|
|
|
|
| In-Force |
|
|
|
|
|
| Total Insured |
|
|
|
|
| ||
State |
| Count |
|
| % |
|
| Premium |
|
| % |
|
| Value |
|
| % |
| ||||||
Florida |
|
| 618,280 |
|
|
| 80.9 | % |
| $ | 926,087 |
|
|
| 87.6 | % |
| $ | 146,624,470 |
|
|
| 73.9 | % |
North Carolina |
|
| 48,866 |
|
|
| 6.4 | % |
|
| 36,993 |
|
|
| 3.5 | % |
|
| 14,275,508 |
|
|
| 7.2 | % |
Georgia |
|
| 31,305 |
|
|
| 4.1 | % |
|
| 32,343 |
|
|
| 3.1 | % |
|
| 11,380,109 |
|
|
| 5.7 | % |
South Carolina |
|
| 13,769 |
|
|
| 1.8 | % |
|
| 13,372 |
|
|
| 1.3 | % |
|
| 4,120,728 |
|
|
| 2.1 | % |
Massachusetts |
|
| 10,132 |
|
|
| 1.3 | % |
|
| 13,162 |
|
|
| 1.2 | % |
|
| 5,857,450 |
|
|
| 3.0 | % |
Indiana |
|
| 11,622 |
|
|
| 1.5 | % |
|
| 9,236 |
|
|
| 0.9 | % |
|
| 3,768,044 |
|
|
| 1.9 | % |
Pennsylvania |
|
| 10,554 |
|
|
| 1.4 | % |
|
| 7,292 |
|
|
| 0.7 | % |
|
| 4,047,997 |
|
|
| 2.1 | % |
Minnesota |
|
| 4,769 |
|
|
| 0.6 | % |
|
| 5,198 |
|
|
| 0.5 | % |
|
| 2,103,731 |
|
|
| 1.1 | % |
Virginia |
|
| 4,908 |
|
|
| 0.6 | % |
|
| 3,867 |
|
|
| 0.4 | % |
|
| 2,263,923 |
|
|
| 1.1 | % |
Alabama |
|
| 2,861 |
|
|
| 0.4 | % |
|
| 2,934 |
|
|
| 0.3 | % |
|
| 895,380 |
|
|
| 0.5 | % |
Maryland |
|
| 2,354 |
|
|
| 0.3 | % |
|
| 1,901 |
|
|
| 0.2 | % |
|
| 869,685 |
|
|
| 0.4 | % |
Hawaii |
|
| 2,009 |
|
|
| 0.3 | % |
|
| 1,830 |
|
|
| 0.2 | % |
|
| 842,740 |
|
|
| 0.4 | % |
Michigan |
|
| 1,330 |
|
|
| 0.2 | % |
|
| 1,574 |
|
|
| 0.1 | % |
|
| 491,906 |
|
|
| 0.2 | % |
Delaware |
|
| 828 |
|
|
| 0.1 | % |
|
| 903 |
|
|
| 0.0 | % |
|
| 400,076 |
|
|
| 0.2 | % |
New Jersey |
|
| 877 |
|
|
| 0.1 | % |
|
| 858 |
|
|
| 0.0 | % |
|
| 428,072 |
|
|
| 0.2 | % |
New York |
|
| 54 |
|
|
| 0.0 | % |
|
| 52 |
|
|
| 0.0 | % |
|
| 27,191 |
|
|
| 0.0 | % |
Total |
|
| 764,518 |
|
|
| 100.0 | % |
|
| 1,057,602 |
|
|
| 100.0 | % |
|
| 198,397,010 |
|
|
| 100.0 | % |
|
| As of December 31, 2016 |
| |||||||||||||||||||||
|
|
|
|
|
|
|
|
|
| In-Force |
|
|
|
|
|
| Total Insured |
|
|
|
|
| ||
State |
| Count |
|
| % |
|
| Premium |
|
| % |
|
| Value |
|
| % |
| ||||||
Florida |
|
| 577,783 |
|
|
| 84.6 | % |
| $ | 862,332 |
|
|
| 90.2 | % |
| $ | 134,493,470 |
|
|
| 79.1 | % |
North Carolina |
|
| 41,393 |
|
|
| 6.1 | % |
|
| 30,858 |
|
|
| 3.2 | % |
|
| 11,972,066 |
|
|
| 7.0 | % |
Georgia |
|
| 24,257 |
|
|
| 3.6 | % |
|
| 23,849 |
|
|
| 2.5 | % |
|
| 8,450,315 |
|
|
| 5.0 | % |
South Carolina |
|
| 12,230 |
|
|
| 1.8 | % |
|
| 12,393 |
|
|
| 1.3 | % |
|
| 3,592,203 |
|
|
| 2.1 | % |
Massachusetts |
|
| 7,451 |
|
|
| 1.1 | % |
|
| 9,964 |
|
|
| 1.0 | % |
|
| 4,352,990 |
|
|
| 2.6 | % |
Indiana |
|
| 6,835 |
|
|
| 1.0 | % |
|
| 5,381 |
|
|
| 0.6 | % |
|
| 2,162,967 |
|
|
| 1.3 | % |
Pennsylvania |
|
| 5,303 |
|
|
| 0.8 | % |
|
| 3,677 |
|
|
| 0.4 | % |
|
| 1,925,226 |
|
|
| 1.1 | % |
Minnesota |
|
| 2,089 |
|
|
| 0.3 | % |
|
| 2,251 |
|
|
| 0.2 | % |
|
| 896,969 |
|
|
| 0.5 | % |
Virginia |
|
| 269 |
|
|
| 0.0 | % |
|
| 224 |
|
|
| 0.0 | % |
|
| 130,556 |
|
|
| 0.1 | % |
Alabama |
|
| 624 |
|
|
| 0.1 | % |
|
| 624 |
|
|
| 0.1 | % |
|
| 182,456 |
|
|
| 0.1 | % |
Maryland |
|
| 1,756 |
|
|
| 0.2 | % |
|
| 1,413 |
|
|
| 0.1 | % |
|
| 640,919 |
|
|
| 0.4 | % |
Hawaii |
|
| 1,767 |
|
|
| 0.2 | % |
|
| 1,689 |
|
|
| 0.2 | % |
|
| 756,428 |
|
|
| 0.4 | % |
Michigan |
|
| 538 |
|
|
| 0.1 | % |
|
| 651 |
|
|
| 0.1 | % |
|
| 190,360 |
|
|
| 0.1 | % |
Delaware |
|
| 621 |
|
|
| 0.1 | % |
|
| 663 |
|
|
| 0.1 | % |
|
| 289,941 |
|
|
| 0.2 | % |
New Jersey |
|
| — |
|
|
| — |
|
|
| — |
|
|
| — |
|
|
| — |
|
|
| — |
|
New York |
|
| — |
|
|
| — |
|
|
| — |
|
|
| — |
|
|
| — |
|
|
| — |
|
Total |
|
| 682,916 |
|
|
| 100.0 | % |
|
| 955,969 |
|
|
| 100.0 | % |
|
| 170,036,866 |
|
|
| 100.0 | % |
12
| As of December 31, 2015 |
| ||||||||||||||||||||||
|
|
|
|
|
|
|
|
|
| In-Force |
|
|
|
|
|
| Total Insured |
|
|
|
|
| ||
State |
| Count |
|
| % |
|
| Premium |
|
| % |
|
| Value |
|
| % |
| ||||||
Florida |
|
| 550,800 |
|
|
| 88.2 | % |
| $ | 821,631 |
|
|
| 92.6 | % |
| $ | 127,705,731 |
|
|
| 84.0 | % |
North Carolina |
|
| 34,084 |
|
|
| 5.4 | % |
|
| 25,411 |
|
|
| 2.9 | % |
|
| 9,981,069 |
|
|
| 6.6 | % |
Georgia |
|
| 17,425 |
|
|
| 2.8 | % |
|
| 16,013 |
|
|
| 1.8 | % |
|
| 5,716,851 |
|
|
| 3.8 | % |
South Carolina |
|
| 10,479 |
|
|
| 1.7 | % |
|
| 11,744 |
|
|
| 1.3 | % |
|
| 3,135,568 |
|
|
| 2.1 | % |
Massachusetts |
|
| 4,720 |
|
|
| 0.8 | % |
|
| 6,455 |
|
|
| 0.7 | % |
|
| 2,790,054 |
|
|
| 1.8 | % |
Indiana |
|
| 2,694 |
|
|
| 0.4 | % |
|
| 2,146 |
|
|
| 0.3 | % |
|
| 851,536 |
|
|
| 0.6 | % |
Pennsylvania |
|
| 1,017 |
|
|
| 0.2 | % |
|
| 738 |
|
|
| 0.1 | % |
|
| 360,991 |
|
|
| 0.2 | % |
Minnesota |
|
| 251 |
|
|
| 0.0 | % |
|
| 277 |
|
|
| 0.0 | % |
|
| 108,337 |
|
|
| 0.1 | % |
Virginia |
|
| — |
|
|
| — |
|
|
| — |
|
|
| — |
|
|
| — |
|
|
| — |
|
Alabama |
|
| — |
|
|
| — |
|
|
| — |
|
|
| — |
|
|
| — |
|
|
| — |
|
Maryland |
|
| 1,278 |
|
|
| 0.2 | % |
|
| 1,026 |
|
|
| 0.1 | % |
|
| 464,081 |
|
|
| 0.3 | % |
Hawaii |
|
| 1,523 |
|
|
| 0.2 | % |
|
| 1,547 |
|
|
| 0.2 | % |
|
| 680,701 |
|
|
| 0.4 | % |
Michigan |
|
| — |
|
|
| — |
|
|
| — |
|
|
| — |
|
|
| — |
|
|
| — |
|
Delaware |
|
| 396 |
|
|
| 0.1 | % |
|
| 407 |
|
|
| 0.0 | % |
|
| 181,857 |
|
|
| 0.1 | % |
New Jersey |
|
| — |
|
|
| — |
|
|
| — |
|
|
| — |
|
|
| — |
|
|
| — |
|
New York |
|
| — |
|
|
| — |
|
|
| — |
|
|
| — |
|
|
| — |
|
|
| — |
|
Total |
|
| 624,667 |
|
|
| 100.0 | % |
|
| 887,395 |
|
|
| 100.0 | % |
|
| 151,976,776 |
|
|
| 100.0 | % |
Also see “Item 7—Management’s Discussion and Analysis of Financial Condition and Results of Operations” and “Item 1A—Risk Factors—Risks Relating to Our Business—Because we conduct the substantial majority of our business in Florida, our financial results depend on the regulatory, economic and weather conditions in Florida” for discussion on geographical diversification.
Product Pricing
The premiums we charge are based on rates specific to individual risks and locations and are generally subject to regulatory review and approval before they are implemented.review. We periodically submit our rate revisions to regulators as required by law or as we deem necessary or appropriate for our business. The premiums we charge to policyholders are affected by legislative enactments and administrative rules, including state-mandated programs in Florida requiring residential property insurance companies like us to provide premium discounts when policyholders verify that insured properties have certain construction features, orsuch as windstorm loss reduction features.
13
The following table shows UPCIC’s most recently approved rate changes. All percentage increasesthe customer experience include reliability and decreases are expressed as statewide averages.
|
| 2017 Rate Changes |
|
| 2016 Rate Changes |
|
| 2015 Rate Changes |
| |||||||||||||||
|
|
|
|
|
| Percentage Increase |
|
|
|
|
|
| Percentage Increase |
|
|
|
|
|
| Percentage Increase |
| |||
|
| Effective Dates |
| State |
| (Decrease) |
|
| Effective Dates |
| State |
| (Decrease) |
|
| Effective Dates |
| State |
| (Decrease) |
| |||
Homeowners |
| December 7, 2017 for new business; January 26, 2018 for renewal business |
| FL |
| 3.40% |
|
| None |
| FL |
| None |
|
| April 15, 2015 for new business; May 25, 2015 for renewal business |
| FL |
|
| 2.20% |
| ||
|
|
|
|
|
|
|
|
|
|
|
|
|
|
|
|
|
|
|
|
|
|
|
|
|
|
| None |
| NC |
| None |
|
| None |
| NC |
| None |
|
| June 1, 2015 for new business and renewal business |
| NC |
|
| 0.60% |
| ||
|
|
|
|
|
|
|
|
|
|
|
|
|
|
|
|
|
|
|
|
|
|
|
|
|
|
| None |
| SC |
| None |
|
| None |
| SC |
| None |
|
| November 20, 2015 for new business; January 6, 2016 for renewal business |
| SC |
|
| 2.46% |
| ||
|
|
|
|
|
|
|
|
|
|
|
|
|
|
|
|
|
|
|
|
|
|
|
|
|
|
| None |
| GA |
|
| None |
|
| June 1, 2016 for new business and renewal business |
| GA |
|
| 7.50% |
|
| None |
| GA |
| None |
| |
|
|
|
|
|
|
|
|
|
|
|
|
|
|
|
|
|
|
|
|
|
|
|
|
|
Fire |
| February 3, 2018 for new business; March 25, 2018 for renewal business |
| FL |
|
| 6.00% |
|
| August 31, 2016 for new business; October 19, 2016 for renewal business |
| FL |
|
| 3.70% |
|
| April 20, 2015 for new business; June 5, 2015 for renewal business |
| FL |
|
| 4.90% |
|
|
|
|
|
|
|
|
|
|
|
|
|
|
|
|
|
|
|
|
|
|
|
|
|
|
|
| None |
| NC |
| None |
|
| None |
| NC |
| None |
|
| April 1, 2015 for new business and renewal business |
| NC |
|
| 1.22% |
| ||
Distribution
value, financial strength, and ease-of-use. We marketstrive to provide excellent reliability and sellvalue through the strength of our products primarily throughdistribution networks, high-quality service to our network of approximately 8,800 licensedpolicyholders and independent agents, which we continueour claims handling ability and product features tailored to build bothour markets.
A key part of our distribution strategy is to utilize an attractive commission-based compensation plan as an incentiveinsurer. Excess-of-loss reinsurance indemnifies the primary insurer for independent agents to place business with us. We also attempt to provide excellent service to our independent agents and brokers, maintaining a
14
long-standing partnership with our independent agents and a consistent presence in our target markets through hard and soft market cycles. Our internal staff and specialists provide support to our independent agents, including use of various technologies to assist with the delivery of service to our policyholders. Our independent agents have access to all policy and payment information through our online, proprietary system. This system allows our independent agents to provide quotes within minutes, and because we control our technology, we are able to quickly respond to agents who need troubleshooting assistance or who offer recommendations for improvement. This system has evolved into a highly valued tool that enables agents to quickly understand the status of a policy and assist their clients with any policy-related questions. We regularly monitor and enhance the system to provide the best point of sale tools possible. Agents are provided dedicated internal contacts should they need assistance, and agencies are proactively contacted on a quarterly basis to solicit feedback.
As a result of the superior service and compensation we provide, we have relatively little turnover among many of our key independent agents. Approximately 1,600, or 18%, of our independent agents have relationships with us that span a decade or more.
In addition to distributing our products through our independent agent network, we also utilize our unique direct-to-consumer platform, Universal DirectSM, to sell products directly to consumers. In April 2016, the Company launched a direct-to-consumer online platform called Universal DirectSM, which enables homeowners to directly purchase, pay for and bind homeowners policies online without the need to directly interface with any intermediaries. Universal DirectSM was offered in all 16 states in which the Company offers policies as of December 31, 2017. During the year ended December 31, 2017, 7,361 policies were written representing $8.6 million in direct written premium, as compared to 1,320 policies written representing $1.4 million in direct written premium during the year ended December 31, 2016.
Services
We are vertically integrated with substantially all aspects of insurance underwriting, policy issuance, general administration and claims processing and settlement performed internally, which allows us to retain a majority of the economics associated with the issuance and administration of our insurance policies in-force. Vertical integration also maintains quality service throughout the policy life cycle. Below is a summary of the services we provide.
Underwriting
All underwriting is performed internally utilizing our state-approved underwriting manuals as the basis of our rate-making and risk assessment. Our manuals have been developed and enhanced over a number of years based on our deep knowledge of the homeowners insurance industry, and based on an ongoing analysis of our own loss experience. Initially, all new business must be submitted to us through our proprietary policy processing system and risk criteria, which allows our independent agent partners to generate quotes and bind policies subject to compliance with our binding authority guidelines and risk criteria. Policies that are bound by either independent agents or through Universal DirectSM are further reviewed by our underwriting staff for accuracy of data, including reports of on-site inspections. Our underwriting process is constantly evolving as new and different type of risks and claim types become prevalent. However, see “Item 1A—Risk Factors—Risks Relating to Our Business—The failure of the risk mitigation strategies we utilize could have a material adverse effect on our financial condition or results of operations.”
Policy Administration
We have developed a proprietary suite of applications that provide underwriting, policy and claim administration services, including billing, policy maintenance, inspections, refunds, commissions and data analysis. Our proprietary rating engine aligns with various state requirements to support our geographic expansion. This sophisticated policy processing system is solely managed by our employees, and enhancements are implemented while adhering to strict internal control requirements to ensure business continuity.
Claims Administration
We closely manage all aspects of the claims process, from processing the initial filing to claim conclusion. When a policyholder contacts us to report a claim, members of our claims department create a claim file and aggregate the appropriate supporting documentation. Claims are then reviewed by our managers and staff adjusters, who assess the extent of the loss, complete on-site investigations when required, and determine the resources needed to adjust each claim. We perform or supervise the adjusting services rendered for our policyholders at all stages of the claims process, which we believe allows us to reduce cost and provide a high level of customer service. We assign a small percentage of field inspections to third-party adjusters in order to maintain relationships that will allow us to continue to provide high quality and timely service following a catastrophe or any other period of unusually high claim volume, such as the increase in claims that occurred after Hurricane Irma in September 2017.
15
We manage our reinsurance program through our internal reinsurance intermediary, BARC, in conjunction with URA. Approximately 10 years ago, we hired a dedicated team of reinsurance specialists from Willis Re, including our President and Chief Risk Officer, Jon W. Springer, to design a customized reinsurance strategy for us and to develop our in-house analytical capabilities. Our reinsurance team has an average of 25 years of knowledge and expertise of the reinsurance industry. We have two experienced actuaries and analytics modeling personnel on staff at BARC to assist in evaluating and designing our reinsurance program. Not only do we receive a portion of the fees that otherwise would be paidloss in commissions to a third-party reinsurance intermediary, we also develop and maintain long-term relationships with our reinsurers. We also utilize Guy Carpenter as a third-party reinsurance intermediary as needed, enabling us to capitalize on its market experience and knowledge as well as our internal capabilities. Guy Carpenter works closely with our teams at BARC and URA in designing our reinsurance program to obtain favorable pricing, as well as continually evaluating prevailing costs and the levelexcess of coverage we feel we need in order to capitalize on favorable market conditions.
REINSURANCE
an agreed upon amount or retention.
May 31, 2024.
UPCIC’s 2017-2018 Reinsurance Program
Third-Party Reinsurance
Our annual reinsurance program, which is segmented into layersimpact. Furthermore, as part of coverage, as is industry practice, protects us against excess propertyour operational excellence initiatives, we continually look to enable new technology to refine our data intelligence on catastrophe losses. Our 2017-2018 reinsurance program includes the mandatory coverage required by lawrisk modeling.
16
The total cost of UPCIC’s private catastrophe reinsurance program for all states as described below, effective June 1, 2017 through May 31, 2018, is $155.5 million. In addition, UPCIC has purchased reinstatement premium protection as described below, the cost of which is $25.7 million. The largest private participants in UPCIC’s reinsurance program include leading reinsurance companies and providers such as Nephila Capital, Everest Re, RenaissanceRe, Chubb Tempest Re and Lloyd’s of London syndicates.
hurricane season. We have usedhistorically experienced higher direct premiums written in the model results noted above to stress test the completeness of the program by simulating a recurrence of the 2004 calendar year, in which four large catastrophic hurricanes made landfall in Florida. This season is considered to be the worst catastrophic year in Florida’s recorded history. Assuming the reoccurrence of the 2004 calendar year events, including the same geographic path of each such hurricane, the modeled estimated net loss to us in 2017 with the reinsurance coverage described herein would be approximately $84 million (after tax, net of all reinsurance recoveries), the same as it would have been in 2016. We estimate that, based on our portfolio of insured risks as of December 31, 2017second and 2016, a repeat of the four 2004 calendar year events would have exhausted approximately 27.0% and 25.0%, respectively,third quarters of our property catastrophe reinsurance coverage.
UPCIC’s Retention
UPCIC has a net retention of $35 million per catastrophe event for losses incurred, in all states, up to a first event loss of $2.778 billion. UPCIC also purchases a separate underlying catastrophe program to further reduce its retention for all losses occurring in any state other than Florida (the “Other States Reinsurance Program”). UPCIC retains only $5 million under its Other States Reinsurance Programfiscal year and lower direct premiums written in the first event and only $1 million under its Other States Reinsurance Program for the second through fourth events. These retention amounts are grossquarters of any potential tax benefit we would receive in paying such losses.
First Layer
Immediately above UPCIC’s net retention,our fiscal year. Correspondingly, we have $55 millionhistorically experienced a higher volume of reinsurance coverage from third-party reinsurers for up to four separate catastrophic events, for all states. Specifically, we have purchased reinsurance coverage forclaims submitted in the first and third catastrophic events, and each such coverage allows for one reinstatement upon the payment of reinstatement premiums, which would cover the second and fourth catastrophic events. This coverage has been obtained from three contracts as follows:
68.33%quarters of $55 millionour fiscal year during and immediately subsequent to the peak of hurricane season, and a lower volume of claims submitted in excess of $35 million provides coverage on a multi-year basis through May 31, 2019;
31.67% of $55 million in excess of $35 million provides coverage for the 2017-2018 period; and
100% of $55 million in excess of $35 million and in excess of $110 million otherwise recoverable (from the first and second events) provides the third and fourth event coverage for the 2017-2018 period.
For the first two contracts above, to the extent that allquarters of our coverage or a portion thereof is exhausted in a catastrophic event, we have purchased reinstatement premium protection to pay the required premium necessary for the reinstatement of these coverages.
Second Layer
Above the first layer, for losses exceeding $90 million, we have purchased a second layer of coverage for losses up to $445 million – in other words, for the next $355 million of losses. This coverage has been obtained from two contracts as follows:
58% of $355 million in excess of $90 million provides coverage through May 31, 2020; and
42% of $355 million in excess of $90 million provides coverage for the 2017-2018 period
In this layer, to the extent that all of our coverage or a portion thereof is exhausted in a catastrophic event, we have purchased reinstatement premium protection insurance to pay the required premium necessary for the reinstatement of these coverages. Both of these contracts extend coverage to all states.
Third Layer
Above the first and second layers, we have purchased a third layer of coverage for losses up to $540 million – in other words, for the next $95 million of losses. This coverage was obtained from two contracts as follows:
68.33% of $95 million in excess of $445 million provides coverage on a multi-year basis through May 31, 2019; and
31.67% of $95 million in excess of $445 million provides coverage for the 2017-2018 period.
In this layer, to the extent that all of our coverage or a portion thereof is exhausted in a catastrophic event, we have purchased reinstatement premium protection insurance to pay the required premium necessary for the reinstatement of these coverages. Both of these contracts extend coverage to all states.
17
Fourth, Fifth and Sixth Layers
In the fourth, fifth and sixth layers, we have purchased reinsurance for $55 million of coverage in excess of $540 million in losses incurred by us (net of the FHCF layer), $193 million of coverage in excess of $595 million in losses incurred by us (net of the FHCF layer), and $125 million of coverage in excess of $788 million, respectively, for a total of $878 million of coverage (net of the FHCF layer) by third-party reinsurers. With respect to the fourth layer, to the extent that all of our coverage or a portion thereof is exhausted in a catastrophic event, we have purchased reinstatement premium protection to pay the required premium necessary for the reinstatement of this coverage. All three layers’ coverage extends to all states.
UPCIC structures its reinsurance coverage into layers and utilizes a cascading feature such that the second, third, fourth, fifth and sixth reinsurance layers all attach at $90 million. Any layers above the $90 million attachment point are excess of loss over the immediately preceding layer. If the aggregate limit of the preceding layer is exhausted, the next layer cascades down in its place for future events. This means that, unless losses exhaust the top layer of our coverage, we are exposed to only $35 million in losses, pre-tax, per catastrophe for each of the first four events. In addition to tax benefits that could reduce our ultimate loss, we anticipate that certain fees paid to our subsidiary service providers by our Insurance Entities and, indirectly, our reinsurers, would also increase during an active hurricane season, which could also offset claim-related losses we would have to pay on our insurance policies. The subsidiary companies, and UPCIC in particular, experienced a significant volume of claims from Hurricane Irma which surpassed the Company’s per occurrence retention of $35 million and triggered its reinsurance program. The program responded according exactly to plan and the weighted average of funds received from third party reinsurance partners was less than 4 business days. Fees paid to our subsidiary service providers increased due to both the volume of claims administered as well as additional premiums paid to reinstate reinsurance coverage.
Other States Reinsurance Program
The total cost of UPCIC’s private catastrophe reinsurance program for other states as described below, effective June 1, 2017 through May 31, 2018, is $8.9 million. In addition, UPCIC has purchased reinstatement premium protection as described below, the cost of which is $1.85 million.
Effective June 1, 2017 through June 1, 2018, under an excess catastrophe contract specifically covering risks located outside the state of Florida and intended to further reduce UPCIC’s $35 million net retention, as noted above, UPCIC has obtained catastrophe coverage of $30 million in excess of $5 million covering certain loss occurrences, including hurricanes, in states outside of Florida. This catastrophe coverage has a second full limit available with additional premium calculated pro rata as to amount and 100% as to time, as applicable. All catastrophe layers are placed with a cascading feature so that all capacity could be made available in excess of $5 million under certain loss scenarios. Further, UPCIC purchased subsequent catastrophe event excess of loss reinsurance specifically covering risks outside of Florida to cover certain levels of loss through four catastrophe events including hurricanes. Specifically, UPCIC obtained catastrophe coverage that covers 100% of $4,000,000 excess of $1,000,000 in excess of $4,000,000 otherwise recoverable. This coverage has two free reinstatements and a total of $12,000,000 of coverage available to UPCIC.
In certain circumstances involving a first catastrophic event impacting both Florida and other states, UPCIC’s retention could result in pre-tax net liability as low as $5,000,000 – the $35 million net retention under the all states reinsurance program could be offset by as much as $30 million in coverage under the Other States Reinsurance Program – or 1.6% of UPCIC’s statutory policyholders’ surplus as of December 31, 2017.
FHCF
UPCIC’s third-party reinsurance program supplements the FHCF coverage we are required to purchase every year. The limit and retention of the FHCF coverage we receive each year is subject to upward or downward adjustment based on, among other things, submitted exposures to the FHCF by all participants. As of June 1, 2017, we estimate our FHCF coverage includes a maximum provisional limit of 90% of $2,075.5 million, or $1,868 million, in excess of $618 million. The estimated premium that UPCIC plans to cede to the FHCF for the 2017 hurricane season is $124 million.
Coverage purchased from third-party reinsurers, as described above, adjusts to provide coverage for certain losses not otherwise covered by the FHCF. The FHCF coverage cannot be reinstated once exhausted, but it does provide coverage for multiple events. The FHCF coverage extends only to losses to our Florida portfolio due to a declared hurricane that causes storm losses in Florida.
The third-party reinsurance we purchase for UPCIC is therefore net of FHCF recovery. When our FHCF and third-party reinsurance coverages are taken together, UPCIC has reinsurance coverage of up to $2,778 million for the first event, as illustrated by the graphic below. Should a catastrophic event occur, we would retain up to $35 million pre-tax for each catastrophic event, and would also be responsible for any additional losses that exceed our top layer of coverage.
18

19
UPCIC Other States (Non-Florida) 1st Event
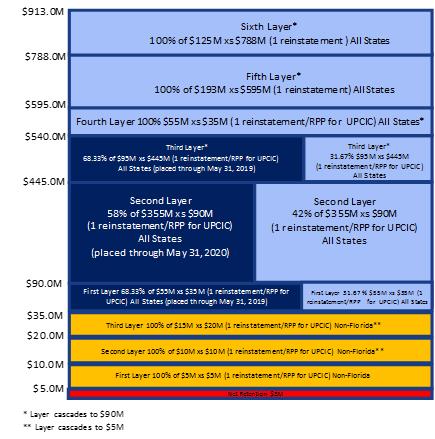
APPCIC’s 2017-2018 Reinsurance Program
Third-Party Reinsurance
The total cost of APPCIC’s private catastrophe and multiple line excess reinsurance program, effective June 1, 2017 through May 31, 2018, is $1.88 million. In addition, APPCIC has purchased reinstatement premium protection as described below, the cost of which is $59,500. The largest private participants in APPCIC’s reinsurance program include leading reinsurance companies such as Everest Re, Chubb Tempest Re, Hiscox, Hannover Ruck, and Lloyd’s of London syndicates.
APPCIC’s Retention
APPCIC has a net retention of $2 million for all losses per catastrophe event for losses incurred up to a first event loss of $28.1 million. This retention amount is gross of any potential tax benefit we would receive in paying such losses.
First Layer
Immediately above APPCIC’s net retention we have $3.2 million of reinsurance coverage from third-party reinsurers. Specifically, we have purchased reinsurance coverage for the first event, and such coverage allows for one reinstatement upon the payment of reinstatement premiums, which would cover the second and potentially more catastrophic events. We have purchased reinstatement premium protection to pay the required premium necessary for the initial reinstatement of this coverage for a second catastrophic event.
Second and Third Layers
In the second and third layers, we have purchased reinsurance for $1.7 million of coverage in excess of $5.2 million in losses incurred by us (net of the FHCF layer) and $7 million of coverage in excess of $6.9 million in losses incurred by us (net of the FHCF layer), respectively.
20
APPCIC structures its reinsurance coverage into layers and utilizes a cascading feature such that the second and third reinsurance layers all attach at $2 million. Any layers above the $2 million attachment point are excess of loss over the immediately preceding layer. If the aggregate limit of the preceding layer is exhausted, the next layer cascades down in its place for future events. This means that, unless losses exhaust the top layer of our coverage, we are only exposed to $2 million in losses, pre-tax, per catastrophe for each of the first two events. In addition to tax benefits that could reduce our ultimate loss, we anticipate that certain fees paid to our subsidiary service providers by our Insurance Entities and, indirectly, our reinsurers would also increase during an active hurricane season, which could also offset losses we would have to pay on our insurance policies.
FHCF
APPCIC’s third-party reinsurance program is used to supplement the FHCF reinsurance we are required to purchase every year. The limit and retention of the FHCF coverage we receive each year is subject to upward or downward adjustment based on, among other things, submitted exposures to the FHCF by all participants. As of June 1, 2017, we estimate our FHCF coverage includes a maximum provisional limit of 90% of $15.8 million, or $14.2 million, in excess of $4.7 million. The estimated premium that APPCIC plans to cede to the FHCF for the 2017 hurricane season is $943 thousand. Factoring in our estimated coverage under the FHCF, we purchase coverage alongside our FHCF coverage from third-party reinsurers as described above, which adjusts to provide coverage for certain losses not otherwise covered by the FHCF. The FHCF coverage cannot be reinstated once exhausted, but it does provide coverage for multiple events. The FHCF coverage extends only to losses to our portfolio due to a declared hurricane that causes storm losses in Florida.
The third-party reinsurance we purchase for APPCIC is therefore net of FHCF recovery. When our FHCF and third-party reinsurance coverages are taken together, APPCIC has reinsurance coverage of up to $28.1 million, as illustrated by the graphic below. Should a catastrophic event occur, we would retain $2 million pre-tax for each catastrophic event, and would also be responsible for any additional losses that exceed our top layer of coverage.
APPCIC 1st Event
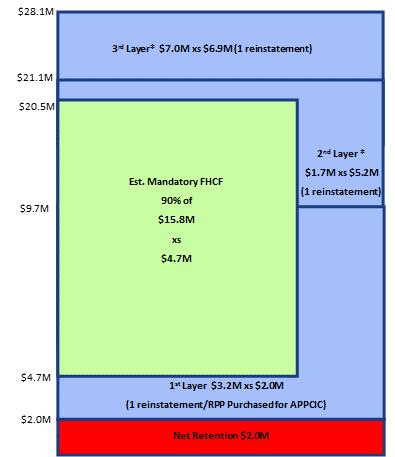
21
APPCIC also purchases extensive multiple line excess per risk reinsurance with various reinsurers due to the high valued risks it insures in both the personal residential and commercial multiple peril lines of business. Under this multiple line excess per risk contract, APPCIC has coverage of $8.5 million in excess of $500 thousand ultimate net loss for each risk and each property loss, and $1 million in excess of $0.3 million for each casualty loss. A $19.5 million aggregate limit applies to the term of the contract for property related losses and a $2.0 million aggregate limit applies to the term of the contract for casualty-related losses. This contract also contains a profit sharing feature available to APPCIC if the contract meets specific performance measures.
INVESTMENTS
We invest excess funds for each of the Insurance Entities and UVE. We have retained third-party investment advisers to advise us and manage our investment portfolio and short-term cash investments. Our Board’s Investment Committee oversees these advisers and reports overall investment results to our Board of Directors, at least on a quarterly basis.
The investment activities of the Insurance Entities are subject to regulation and supervision by the FLOIR. See “—Government Regulation and Initiatives.” The Insurance Entities may only make investments that are consistent with regulatory guidelines, and our investment policies for the Insurance Entities accordingly limit the amount of investments in, among other things, non-investment grade fixed maturity securities (including high-yield bonds) and the amount of total investments in preferred stock and common stock. While we seek to appropriately limit the size and scope of investments in our portfolio, UVE is not similarly restricted by Florida law. Therefore, the investments made by UVE may differ from those made by the Insurance Entities. We do not purchase securities on margin.
The primary objectives of our investment portfolio are the preservation of capital and providing adequate liquidity for claims payments and other cash needs. Our investment portfolio’s secondary investment objective is to provide a total rate of return with an emphasis on investment income. We focus on relatively short-term investments, with approximately 8.0% of the fair value of our portfolio with contractual maturities due in one year or less, and another 44.7% due after one year but before five years.
See “Item 8—Note 3 (Investments)” and “Item 1A—Risk Factors—Risks Relating to Investments” for more information about our investments.
LIABILITY FOR UNPAID LOSSES AND LAE
We generally use the terms “loss” or “losses” to refer to both loss and LAE net of estimated subrogation recoveries. We establish reserves for both reported and unreported unpaid losses that have occurred at or before the balance sheet date for amounts we estimate we will be required to pay in the future. Our policy is to establish these loss reserves after considering all information known to us at each reporting period. Accordingly, at any given point in time, our loss reserve represents our best estimate of the ultimate settlement and administration cost of our insured claims incurred and unpaid net of estimated receivables for subrogation. Since the process of estimating loss reserves requires significant judgment due to a number of variables, such as fluctuations in inflation, judicial decisions, legislative changes and changes in claims handling procedures, our ultimate liability will likely differ from these estimates. See “Item 1A—Risk Factors—Risks Relating to Our Business—Actual claims incurred may exceed current reserves established for claims and may adversely affect our operating results and financial condition.” We revise our reserve for unpaid losses as additional information becomes available, and reflect adjustments, if any, in our earnings in the periods in which we determine the adjustments are necessary.
When a claim involving a probable loss is reported, we establish a liability for the estimated amount of our ultimate loss and LAE payments. The estimate of the amount of the ultimate loss is based upon such factors as the type of loss, jurisdiction of the occurrence, knowledge of the circumstances surrounding the claim, severity of injury or damage, potential for ultimate exposure, estimate of liability on the part of the insured, past experience with similar claims and the applicable policy provisions. Opportunities for subrogation are also identified for further analysis and collection from third parties. All newly reported claims begin with an initial average liability. That claim is then evaluated and the liability is adjusted upward or downward according to the facts and damages of that particular claim. As discussed above, we maintain an in-house claims staff that monitors and directs all aspects of our claims process, and oversees claims processed by third parties. In addition, management aggregates liabilities to provide for losses incurred but not reported (“IBNR”). We utilize independent actuaries to help establish liabilities for unpaid losses, anticipated loss recoveries, and LAE. We do not discount the liability for unpaid losses and LAE for financial statement purposes.
The estimates of the liability for unpaid losses, anticipated subrogation recoveries, and LAE are subject to the effect of trends in claims severity and frequency and are continually reviewed. As part of this process, we review historical data and consider various factors, including known and anticipated legal developments, changes in social attitudes, inflation and economic conditions. As loss and expense experience develops and other data become available, these estimates are revised, as required, resulting in increases or decreases to the existing liability for unpaid losses and LAE. Adjustments are reflected in results of operations in the period in which
22
they are made and the liabilities may deviate substantially from prior estimates. See “Item 1A—Risk Factors—Risks Relating to Our Business—Actual claims incurred may exceed current reserves established for claims and may adversely affect our operating results and financial condition.”
ENTERPRISE RISK MANAGEMENT
We maintain a dedicated Enterprise Risk Management (“ERM”) function that is responsible for analyzing and reporting the Company’s risks; facilitating monitoring to ensure the Company’s risks remain within its appetites, limits and tolerances; and ensuring, on an ongoing basis, that our ERM objectives are met. This includes ensuring proper risk controls are in place; risks are effectively identified, assessed, and managed; and key risks to which the Company is exposed are appropriately disclosed. The ERM function plays an important role in fostering the Company’s risk management culture and practices.
In light of the segment of the insurance industry in which we operate, we maintain a moderate to high appetite for underwriting risk that seeks to provide profitable growth for our shareholders while managing our risk with disciplined pricing and portfolio management standards. We mitigate our underwriting risk with sound reinsurance protection, effective operational policies and procedures, and capital management strategies.
Enterprise Risk Management Structure and Governance
Our Board of Directors (“the Board”) oversees enterprise risk through its standing committees. The Risk Committee receives a comprehensive periodic risk reports, which describes the Company’s key risk exposures using quantitative and qualitative assessments and includes information about breaches or exceptions. The Company also has other risk-focused committees such as the Audit Committee and the Investment Committee. These other committees are comprised of various risk and technical experts and have overlapping membership, enabling consistent and holistic management of risks. These committees report directly or indirectly to the Board.
Enterprise Risk Management Framework
Our ERM framework provides a platform to assess the risk/return profiles of risks throughout the organization to enable enhanced
decision making by business leaders. The ERM framework also guides the development and implementation of mitigation strategies to reduce exposures to these risks to acceptable levels. Our ERM framework includes the following elements:
Risk Culture: Risk management is an integral part of the Company’s culture and is embedded in our business processes in accordance with our risk philosophy. As the cornerstone of the ERM framework, a culture of prudent risk management reinforced by senior management plays an important role in the effective management of risks we assume relative to risk targets and limits. Our Risk Assessment Process uses qualitative and quantitative methods to assess key risks through a comprehensive approach, which analyzes established and emerging risks in conjunction with other risks.
Risk Appetite and Tolerance Statements: We communicate to management the amount of risk the Company is willing to accept through risk tolerance statements, which take into account the interactions and aggregation of risks across multiple risk areas. These statements provide a framework for managing the Company from an overall risk point of view.
Risk Targets and Limits: Risk targets are established and managed in conjunction with strategic planning and set the desired range of risk that the Company seeks to assume. Risk Limits establish the maximum amount of each risk that the Company is willing to assume to remain within the Company’s risk tolerance.
Business Specific Limits/Controls: These limits/controls provide additional safeguards against undesired risk exposures and are embedded in business processes. Examples include: maximum retention limits, pricing and underwriting reviews, per issuer limits, concentration limits, and standard treaty language.
Proactive risk monitoring and reporting enable early detection and mitigation of emerging risks. We monitor adherence to risk targets and limits through the ERM function, which reports regularly to the Risk Committee. The frequency of monitoring is tailored to the significance of each risk. Risk escalation channels coupled with open communication lines enhance the mitigants explained above. The Company has devoted significant resources to developing its ERM program and expects to continue to do so in the future. Nonetheless, the risk remains that the Company’s policies and procedures to identify, manage, and monitor risks may not be fully effective. Many of the Company’s methods for managing risk are based on historical information, which may not be a good predictor of future risk exposures. Management of operational, legal, and regulatory risk relies on policies and procedures which may not be fully effective under all scenarios.
23
Government Regulation and Initiatives
We are subject to extensive regulation in the markets we serve, primarily at the state level, and will bebecome subject to the regulations of any otheradditional states in which we seek to conduct business in the future. These regulations cover all aspects of our business and are generally designed to protect the interests of policyholders, as opposed to the interests of shareholders. Such regulations relate to authorized lines of business, capital and surplus requirements, allowable rates and forms, investment parameters, underwriting limitations, transactions with affiliates, dividend limitations, changes in control, market conduct, maximum amount allowable for premium financing service charges, and a variety of other financial and non-financial components of our business.
Financial Reporting
From time to time, states also enact legislation designed to increase consumer protections and curtail fraud or abuses in the insurance market.
inflation on claims costs and related expenses.
NAIC
The NAIC is an organization whose mandate is In addition, insurance companies and other companies are subject to benefit state insurance regulatoryother types of audits, examinations or other similar inquiries by governmental authorities and consumers by promulgating model insurance laws and regulations for adoption bybased on the states. The NAIC also provides standardized insurance industry accounting and reporting guidance through its Accounting Practices and Procedures Manual (the “Manual”). However, model insurance laws and regulations are only effective when adopted by the states, and statutory accounting and reporting principles continue to be established by individual state laws, regulations and permitted practices. Changes to the Manual or modifications by the various state insurance departments may impact the statutory capital and surplusnature of the Insurance Entities. We cannot predict what additional compliance costs these pending model laws or regulations may impose if adopted by Florida or other states in the future.
business they conduct.
24
summary report in May 2023.
after a catastrophe event. Most states, including Florida, also have insurance laws requiring that rate schedules and other information be filed withfor review by the insurance regulatory authority. The insurance regulatory authority may disapprove a rate filing if it finds that the proposed rates arewould be inadequate, excessive, or unfairly discriminatory. Rates, which are not necessarily uniform for all insurers, vary by many factors including class of business, hazard covered, risk location and size of risk.
25
fees, premium taxes, and assessments in order to maintain its licenses.
Several states, including Florida, have insurance mechanismsorder to attract energetic and entrepreneurial talent. To that end, we provide insuranceextensive training and development sessions, strong benefits, and competitive pay to consumers who are not otherwise able to obtain coverageemployees at all levels in the private insurance market. The largest such insurance mechanism is Citizens. The degreeorganization, including equity awards to which these state-authorized insurance mechanisms compete with private insurers such as the Insurance Entities varies over time depending on marketkey contributors.
EMPLOYEES
As of February 9, 2018, we had 558 full-time employees. broaden perspectives.
AVAILABLE INFORMATION
26
sec.gov.
| ITEM 1A. | RISK FACTORS | ||||
Risks Relating to
BUSINESS AND OPERATIONS
conditions, the frequency and severity of which could be affected by climate change.
The loss estimates developedbusiness. In addition, changes to Florida’s insurance laws often are followed by extended implementation periods, ensuing regulatory rule making timelines, and even periods of uncertainty as opponents of the models we usechanges challenge them in court or seek to avoid their effects by revising their business practices. Further, some changes apply only to policies issued after the new laws’ effective dates, creating extended periods in which existing and some newly reported claims remain subject to prior adverse conditions. Resulting delays in the effectiveness of new laws, even when intended to be beneficial for the insurance industry, limit or delay their impact on our business.
operations.
quantifiable and are subject to change over time. The current Florida homeowners’ insurance market is adversely impacted by changes in claimant behaviors resulting in losses and LAE exceeding historical trends, amounts experienced in other states, and amounts we previously estimated. The increases in losses and LAE are attributable to the active solicitation of claims activity by policyholder representatives, high levels of represented claims compared to historical patterns or patterns seen in other states, and a proliferation of inflated claims filed by policyholder representatives and vendors. These trends are facilitated by Florida’s legal climate, including the threat of one-way attorneys’ fees against insurers pursuant to a statute that existed prior to December 16, 2022, and the relatively high cost of defending against inflated claims in relation to amounts in dispute. Some of the law changes apply only to policies with effective dates after December 16, 2022, resulting in an extended period during which our losses and LAE will continue to be influenced by pre-reform laws and market conditions.
The full extent of the ongoing disruptions and claims behaviors in the Florida market, and the extent to which legislative efforts aimed at mitigating these concerns will be successful, is unknown and still unfolding.
27
underwrite, or if emerging trends outpace our ability to adjust prices timely, or if we lose desirable exposures to competitors by overpricing our risks, we may experience underwriting losses depleting surplus at the Insurance Entities and capital at the holding company.
•the availability of sufficient and reliable data;
•regulatory review periods or delays in reviewing and approving filed rate changes or our failure to gain regulatory approval;
•the uncertainties that inherently underlie estimates and assumptions;
•our ability to stay competitive as evolving competitive technologies emerge such as artificial intelligence (“AI”) and machine learning to make pricing, underwriting, or other decisions;
legislatively imposed consumer initiatives.
In addition,As a result, we could underprice risks, which, would negatively affect our profit marginsin the past, has, and, in the future, could result in significant underwriting losses.losses negatively impacting the profitability and financial condition of our Insurance Entities and the consolidated group. We also could also overprice our risks, which could reduce the number of policies we writethereby making our products relatively less attractive than other alternatives, thereby negatively impacting our competitive position and potentially leading to a reduction in demand for our competitiveness. products and in our market share.
If our policies are overpriced or underpriced by geographic area, policy type, or other characteristics, we may not be able to achieve desirable diversification of our risks. These concerns are compounded when Florida’s statutorily-created residual property insurance market, Citizens, provides insurance based on rates substantially below its actuarial indication and at resulting premiums lower than those of admitted insurers such as the Insurance Entities.
severity and frequency.
•engaging in rigorous underwriting;
•carefully evaluating terms and conditions of our policies and binding guidelines; and
•ceding risk to reinsurers.
28
requirements. These independent insurance agents maintain the primary customer relationship. Independent agents typically represent other insurance companies in addition to representing us, and such agents are not obligated to sell or promote our products. Other insurance companies may pay higher commissions than we do, provide services to the agents that we do not provide, or may be more attractive to the agents than we are. In Florida the statutorily-created residual market currently offers policies at premium levels that in many areas and for most coverage types are lower than premiums the Insurance Entities charge, which are subject to regulatory review, governed by actuarial standards, and cannot be inadequate, excessive, or unfairly discriminatory. We cannot provide assurance that we will retain our current relationships, or be able to establish new relationships, with independent agents. The loss of these marketing relationships could adversely affect our ability to attract new agents, retain our agency network, or write new or renewal insurance policies, which could materially adversely affect our business, financial condition, and results of operations.
not accurately predict existing or future losses.
Further, in accordance with Florida law and regulatory requirements, we must use a model that has been reviewed and deemed acceptable by a state commission in accordance with standards over which we have no control and that might not align with our business. For these reasons and other factors that might not be known to us, the accuracy of models in estimating insured losses from prior storms has varied considerably by catastrophe when compared to actual results from those catastrophes.
29
competition, a significant reduction in premium rates, less favorable policy terms, and fewer opportunities to underwrite insurance risks. This couldIn addition, certain law changes take effect only with respect to new or renewal policies issued after the changes are adopted, which can favor new entrants to the market over insurers like the Insurance Entities that continue to service policies issued before the law changes and claims received under those policies. These conditions can have a material adverse effect on our results of operations and cash flows. In addition to these considerations, changes in the frequency and severity of losses suffered by insureds and insurers, including changes resulting from multiple and/or catastrophic hurricanes mayand from increases in represented and litigated claims, affect the cycles of the property and casualty insurance business significantly. Negative market conditions maycan impair our ability to write insurance at rates that we consider adequate and appropriate relative to the risk written. IfTo the extent that we cannot write insurance at appropriate rates, our business would be materially and adversely affected. We cannot predict whether market conditions will improve, remain constant or deteriorate. An extended period of negative market conditions could have a material adverse effect on our business, financial condition and results of operations.
Because we conduct the substantial majority of our business in Florida, our financial results depend on the regulatory, economic and weather conditions in Florida.
Though we are licensed to transact insurance business in Alabama, Delaware, Florida, Georgia, Hawaii, Illinois, Indiana, Iowa, Maryland, Massachusetts, Michigan, Minnesota, New Hampshire, New Jersey, North Carolina, New York, Pennsylvania, South Carolina, Virginia and West Virginia, we write a substantial majority of our premium in Florida. Therefore, prevailing regulatory, legal, economic, political, demographic, competitive, weather and other conditions in Florida disproportionately affect our revenues and profitability. Changes in conditions could make doing business in Florida less attractive for us and would have a more pronounced effect on us than it would on other insurance companies that are more geographically diversified throughout the United States. Further, a single catastrophic event, or a series of such events, specifically affecting Florida, particularly in the more densely populated areas of the state, could have a disproportionately adverse impact on our business, financial condition and results of operations. This is particularly true in certain Florida counties where we write a high concentration of policies, which mirrors the distribution and concentration of the population in Florida. We currently have a large concentration of in-force policies written in the coastal counties of Broward, Palm Beach and Miami-Dade such that a catastrophic event, or series of catastrophic events, in these counties could have a significant impact on our business, financial condition and results of operations. While we actively manage our exposure to catastrophic events through our underwriting process and the purchase of reinsurance, the fact that our business is concentrated in Florida subjects us to increased exposure to certain catastrophic events and destructive weather patterns such as hurricanes, tropical storms and tornadoes.
Changing climate conditions may adversely affect our financial condition, profitability or cash flows.
Although the incidence and severity of weather conditions are largely unpredictable, the frequency and severity of property claims generally increase when severe weather conditions occur. Longer-term weather trends may be changing and new types of catastrophe losses may be developing due to climate change, a phenomenon that has been associated with extreme weather events linked to rising temperatures, including effects on global weather patterns, greenhouse gases, sea, land and air temperature, sea levels, rain and snow. The science regarding climate change is still emerging and developing. However, to the extent the frequency or severity of weather events is exacerbated due to climate change, we may experience increases in catastrophe losses in both coastal and non-coastal areas. This may cause an increase in claims-related and/or reinsurance costs or may negatively affect our ability to provide homeowners insurance to our policyholders in the future. Governmental entities may also respond to climate change by enacting laws and regulations that may adversely affect our cost of providing homeowners insurance in the future.
effective.
30
Our future operations will depend
results.
•the accuracy of our adjusters as they make their assessments and submit their estimates of damages;
•the training, background, and experience of our claims representatives;
•the ability of our claims departmentprofessionals to ensure consistent and timely claims handling;
•the ability of our claims departmentprofessionals to translate the information provided by adjusters into acceptable claims resolutions; and
|
|
our financial condition and reputation.
31
involve human error, such as employees falling victim to phishing schemes or computer coding errors that may inadvertently leave data exposed. Our systems also may inadvertently expose, through a computer programming error or otherwise, confidential information as well as that of our customers and third parties with whom we interact. interconnectedness of our systems, the process of enhancing our protective measures can itself create a risk of systems disruptions and security issues. technology, particularly with respect to artificial intelligence, which may result in interruptions to our business or even in a competitive disadvantage. In addition, changes in technology typically outpace corresponding regulations, which may lead to periods of uncertainty in the permissible uses of certain technology and to differences or even inconsistencies in the regulatory approaches across jurisdictions. The absence of regulations or conflicts in regulations may further limit our ability to implement new technology in an effective and timely manner. business and financial results. portfolio. business both directly and potentially indirectly through reputational damage. In ultimately might not be beneficial at all. cash flows, see costs. Any such failure also could adversely affect our financial strength and stability ratings. new indebtedness is high. Our indebtedness, including the We conduct our insurance operations primarily from two locations, our The current facilities are expected to be adequate for our operations for the near future. MARKET FOR REGISTRANT’S COMMON EQUITY, RELATED STOCKHOLDER MATTERS AND ISSUER PURCHASES OF EQUITY SECURITIES Dividends For the Year Ended December 31, 2017 High Low Declared First Quarter $ 29.10 $ 23.35 $ 0.14 Second Quarter $ 26.20 $ 22.25 $ 0.14 Third Quarter $ 25.95 $ 16.50 $ 0.14 Fourth Quarter $ 27.35 $ 23.15 $ 0.27 Dividends For the Year Ended December 31, 2016 High Low Declared First Quarter $ 22.49 $ 16.44 $ 0.14 Second Quarter $ 19.77 $ 16.41 $ 0.14 Third Quarter $ 25.71 $ 18.26 $ 0.14 Fourth Quarter $ 28.50 $ 19.40 $ 0.27 “UVE.” As of February common stock. A substantially greater number of holders of our common stock are “street name” or beneficial holders, whose shares are held of record by banks, brokers, and other financial institutions. Period Ended Index 12/31/13 12/31/14 12/31/15 12/31/16 12/31/17 Universal Insurance Holdings, Inc. $ 351.12 $ 514.25 $ 599.24 $ 757.98 $ 750.52 S&P 500 Index 132.39 150.51 152.59 170.84 208.14 Russell 2000 Index 138.82 145.62 139.19 168.85 193.58 S&P Insurance Select Industry Index 146.15 157.85 167.93 204.57 231.75 Period Ended Index 12/31/13 12/31/14 12/31/15 12/31/16 12/31/17 Universal Insurance Holdings, Inc. $ 351.12 $ 514.25 $ 599.24 $ 757.98 $ 750.52 NYSE Composite Index 126.28 134.81 129.29 144.73 171.83 SNL Insurance P&C Index 132.48 152.15 157.39 185.75 212.37 Total Number of Maximum Number Shares Purchased of Shares That As Part of May Yet be Publicly Purchased Under Total Number of Average Price Announced the Plans or Shares Purchased Paid per Share (1) Plans or Programs Programs (2) 10/1/17 - 10/31/17 - $ - - - 11/1/17 - 11/30/17 - $ - - - 12/1/17 - 12/31/17 10,000 $ 25.67 10,000 723,572 Total for the three months ended December 31, 2017 10,000 $ 25.67 10,000 723,572 We may repurchase shares from time to time at our discretion, based on ongoing assessments of our capital needs, the market price of our common stock and general market conditions. We will fund the share repurchase program with cash from operations. During •On •On Years Ended December 31, 2017 2016 2015 2014 2013 Income Data: Direct premiums written $ 1,055,886 $ 954,617 $ 883,409 $ 789,577 $ 783,894 Change in unearned premium (56,688 ) (33,390 ) (46,617 ) (12,260 ) 4,583 Direct premium earned 999,198 921,227 836,792 777,317 788,477 Ceded premium earned (310,405 ) (288,811 ) (332,793 ) (450,440 ) (520,822 ) Premiums earned, net 688,793 632,416 503,999 326,877 267,655 Investment income 13,460 9,540 5,155 2,375 1,928 Other revenues (1) 47,093 41,039 36,330 34,397 38,466 Total revenue 751,916 685,289 546,544 369,276 301,159 Losses and loss adjustment expenses 350,428 301,229 187,739 123,275 108,615 Policy acquisition costs 138,846 125,979 88,218 33,502 21,685 Other operating costs 92,158 95,198 95,564 84,895 70,303 Total expenses 581,432 522,406 371,521 241,672 200,603 Income before income taxes 170,484 162,883 175,023 127,604 100,556 Income taxes, net 63,549 63,473 68,539 54,616 41,579 Net income $ 106,935 $ 99,410 $ 106,484 $ 72,988 $ 58,977 Per Share Data: Basic earnings per common share $ 3.07 $ 2.85 $ 3.06 $ 2.17 $ 1.64 Diluted earnings per common share $ 2.99 $ 2.79 $ 2.97 $ 2.08 $ 1.56 Dividends declared per common share $ 0.69 $ 0.69 $ 0.63 $ 0.55 $ 0.49 As of December 31, 2017 2016 2015 2014 2013 Balance Sheet Data: Total invested assets $ 730,023 $ 651,601 $ 489,435 $ 423,581 $ 354,440 Cash and cash equivalents 213,486 105,730 197,014 115,397 117,275 Total assets 1,454,999 1,060,007 993,548 911,774 920,090 Unpaid losses and loss adjustment expenses 248,425 58,494 98,840 134,353 159,222 Unearned premiums 532,444 475,756 442,366 395,748 383,488 Long-term debt 12,868 15,028 24,050 30,610 37,240 Total liabilities 1,015,011 688,817 700,456 692,858 744,481 Total stockholders' equity $ 439,988 $ 371,190 $ 293,092 $ 199,916 $ 175,609 Shares outstanding end of period 34,735 35,052 35,110 34,102 35,366 Book value per share $ 12.67 $ 10.59 $ 8.35 $ 5.86 $ 4.97 Return on average equity (ROE) 25.7 % 29.4 % 41.8 % 38.4 % 34.8 % Selected Data: Loss and loss adjustment expense ratio (2) 50.9 % 47.6 % 37.2 % 37.7 % 40.6 % General and administrative expense ratio (3) 33.5 % 34.9 % 36.3 % 35.8 % 33.9 % Combined Ratio (4) 84.4 % 82.5 % 73.5 % 73.5 % 74.5 % 1A—Risk Factors.” Other Revenue Sources. In recent years, in response to rising claims costs, increased reinsurance costs, and deteriorating conditions in the Florida residential market, most admitted market competitors have implemented significant rate increases. Meanwhile, Citizens’ rate increases are limited by law, resulting in its policies typically being priced lower than admitted market policies. This causes Citizens to become viewed as a desirable alternative to the admitted market as admitted market insurers continue to manage through the hard market challenges. Our Insurance Entities likewise have taken and continue to take action to manage through this hard market by increasing rates, tactically managing exposures, and implementing Florida statutory reforms intended to curtail claims-related abuses, while also seeking to maintain their competitive position in the Florida market, supporting our current policyholders and agents. For the Years Ended Growth Year Over Year December 31, 2017 December 31, 2016 State Direct Written Premium % Direct Written Premium % $ % Florida $ 923,962 87.5 % $ 860,647 90.2 % $ 63,315 7.4 % Other states 131,924 12.5 % 93,970 9.8 % 37,954 40.4 % Grand total $ 1,055,886 100.0 % $ 954,617 100.0 % $ 101,269 10.6 % general and administrative expenses as a percentage of premiums earned, net. General and administrative expenses is comprised of policy acquisition costs and other operating costs, which includes such items as underwriting costs, facilities, and corporate overhead. The Developing and implementing our reinsurance strategy to adequately protect A.M. Best S&P Various Lloyd’s of London Syndicates A+ insurance companies depends on income from underwriting, investment and service operations. Underwriting results are considered profitable when the combined ratio is under 100% and unprofitable when the combined ratio is over 100%. •Five-year accident year table on incurred claim and allocated claim adjustment expenses, net of reinsurance including columns of: •Five-year accident year table on cumulative paid claims and allocated claim adjustment expenses, net of reinsurance, consolidated financial statements. Another example would be when a change in economic conditions is expected to affect the cost of repairs to property; actuarial judgment is applied to determine appropriate development factors to use in the reserve estimate that will most accurately reflect the expected impacts on severity development. •Adverse changes in loss cost trends, including inflationary pressures in home repair costs; •Judicial expansion of policy coverage and the impact of new theories of liability; and •Plaintiffs targeting property and casualty insurers in purported class action or other litigation related to claims-handling and other practices. actuary. tax in the event of reasonably likely changes in the severity of claims considered in establishing loss and LAE reserves. The range of reasonably likely changes in the severity of our claims was established based on a review of changes in loss year development and applied loss and LAE reserves as a whole. The selected range of changes does not indicate what could be the potential best or worst case or likely scenarios (dollars in thousands): liability are periodically reviewed, and any adjustments are reflected in current earnings. (in thousands) Years Ended December 31, Change 2017 2016 $ % PREMIUMS EARNED AND OTHER REVENUES Direct premiums written $ 1,055,886 $ 954,617 $ 101,269 10.6 % Change in unearned premium (56,688 ) (33,390 ) (23,298 ) 69.8 % Direct premium earned $ 999,198 $ 921,227 $ 77,971 8.5 % Ceded premium earned (310,405 ) (288,811 ) (21,594 ) 7.5 % Premiums earned, net 688,793 632,416 56,377 8.9 % Net investment income (expense) 13,460 9,540 3,920 41.1 % Net realized gains (losses) on investments 2,570 2,294 276 12.0 % Commission revenue 21,253 17,733 3,520 19.8 % Policy fees 18,838 16,880 1,958 11.6 % Other revenue 7,002 6,426 576 9.0 % Total premiums earned and other revenues 751,916 685,289 66,627 9.7 % OPERATING COSTS AND EXPENSES Losses and loss adjustment expenses 350,428 301,229 49,199 16.3 % General and administrative expenses 231,004 221,177 9,827 4.4 % Total operating costs and expenses 581,432 522,406 59,026 11.3 % INCOME BEFORE INCOME TAXES 170,484 162,883 7,601 4.7 % Income tax expense 63,549 63,473 76 0.1 % NET INCOME $ 106,935 $ 99,410 $ 7,525 7.6 % Other comprehensive income (loss), net of taxes 127 (2,402 ) 2,529 NM COMPREHENSIVE INCOME $ 107,062 $ 97,008 $ 10,054 10.4 % For the Year Ended December 31, 2017 Direct Loss Ratio Ceded Loss Ratio Net Loss Ratio Premiums earned $ 999,198 $ 310,405 $ 688,793 Losses and loss adjustment expenses (LAE): Hurricane Irma losses and loss adjustment expenses $ 446,700 44.7 % $ 417,543 134.5 % $ 29,157 4.2 % All other losses and loss adjustment expenses 332,422 33.3 % 11,151 3.6 % 321,271 46.7 % Total losses and loss adjustment expenses $ 779,122 78.0 % $ 428,694 138.1 % $ 350,428 50.9 % For the Year Ended December 31, 2016 Direct Loss Ratio Ceded Loss Ratio Net Loss Ratio Premiums earned $ 921,227 $ 288,811 $ 632,416 Losses and loss adjustment expenses: Weather events* $ 51,400 5.6 % $ 5,300 1.8 % $ 46,100 7.3 % All other losses and loss adjustment expenses 251,636 27.3 % (3,493 ) -1.2 % 255,129 40.3 % Total losses and loss adjustment expenses $ 303,036 32.9 % $ 1,807 0.6 % $ 301,229 47.6 % For the Years Ended December 31, Change 2017 2016 $ % $ Ratio $ Ratio Premiums earned, net $ 688,793 $ 632,416 $ 56,377 8.9 % General and administrative expenses: Policy acquisition costs 138,846 20.2 % 125,979 19.9 % 12,867 10.2 % Other operating costs 92,158 13.3 % 95,198 15.1 % (3,040 ) (3.2 %) Total general and administrative expenses $ 231,004 33.5 % $ 221,177 35.0 % $ 9,827 4.4 % (in thousands) Years Ended December 31, Change 2016 2015 $ % PREMIUMS EARNED AND OTHER REVENUES Direct premiums written $ 954,617 $ 883,409 $ 71,208 8.1 % Change in unearned premium (33,390 ) (46,617 ) 13,227 -28.4 % Direct premiums earned 921,227 836,792 84,435 10.1 % Ceded premiums earned (288,811 ) (332,793 ) 43,982 -13.2 % Premiums earned, net 632,416 503,999 128,417 25.5 % Net investment income (expense) 9,540 5,155 4,385 85.1 % Net realized gains (losses) on investments 2,294 1,060 1,234 116.4 % Commission revenue 17,733 14,870 2,863 19.3 % Policy fees 16,880 15,440 1,440 9.3 % Other revenue 6,426 6,020 406 6.7 % Total premiums earned and other revenues 685,289 546,544 138,745 25.4 % OPERATING COSTS AND EXPENSES Losses and loss adjustment expenses 301,229 187,739 113,490 60.5 % General and administrative expenses 221,177 183,782 37,395 20.3 % Total operating costs and expenses 522,406 371,521 150,885 40.6 % INCOME BEFORE INCOME TAXES 162,883 175,023 (12,140 ) -6.9 % Income tax expense 63,473 68,539 (5,066 ) -7.4 % NET INCOME $ 99,410 $ 106,484 $ (7,074 ) -6.6 % Other comprehensive income (loss), net of taxes (2,402 ) (2,171 ) (231 ) 10.6 % COMPREHENSIVE INCOME $ 97,008 $ 104,313 $ (7,305 ) -7.0 % For the Year Ended December 31, 2016 Direct Loss Ratio Ceded Loss Ratio Net Loss Ratio Premiums earned $ 921,227 $ 288,811 $ 632,416 Losses and loss adjustment expenses: Losses and loss adjustment expenses $ 251,636 27.3 % $ (3,493 ) -1.2 % $ 255,129 40.3 % Weather events* 51,400 5.6 % 5,300 1.8 % 46,100 7.3 % Total losses and loss adjustment expenses $ 303,036 32.9 % $ 1,807 0.6 % $ 301,229 47.6 % For the Year Ended December 31, 2015 Direct Loss Ratio Ceded Loss Ratio Net Loss Ratio Premiums earned $ 836,792 $ 332,793 $ 503,999 Total losses and loss adjustment expenses $ 214,491 25.6 % $ 26,752 8.0 % $ 187,739 37.2 % For the Years Ended December 31, Change 2016 2015 $ % $ Ratio $ Ratio Premiums earned, net $ 632,416 $ 503,999 $ 128,417 25.5 % General and administrative expenses: Policy acquisition costs 125,979 19.9 % 88,218 17.5 % 37,761 42.8 % Other operating costs 95,198 15.1 % 95,564 19.0 % (366 ) (0.4 %) Total general and administrative expenses $ 221,177 35.0 % $ 183,782 36.5 % $ 37,395 20.3 % The following table As of December 31, Type of Investment 2017 2016 Fixed maturities $ 639,334 $ 584,361 Equity securities 62,215 50,803 Short-term investments 10,000 5,002 Investment real estate, net 18,474 11,435 Total $ 730,023 $ 651,601 dates presented (in thousands): As of December 31, 2017 2016 Stockholders' equity $ 439,988 $ 371,190 Total long-term debt 12,868 15,028 Total capital $ 452,856 $ 386,218 Debt-to-total capital ratio 2.8 % 3.9 % Debt-to-equity ratio 2.9 % 4.0 % Dividend Shareholders Dividend Cash Dividend 2017 Declared Date Record Date Payable Date Per Share Amount First Quarter January 23, 2017 February 17, 2017 March 2, 2017 $ 0.14 Second Quarter April 12, 2017 June 14, 2017 July 3, 2017 $ 0.14 Third Quarter August 31, 2017 September 12, 2017 October 24, 2017 $ 0.14 Fourth Quarter November 16, 2017 November 27, 2017 December 4, 2017 $ 0.27 Year Ended December 31, 2017 2016 2015 Balance at beginning of year $ 58,494 $ 98,840 $ 134,353 Less: Reinsurance recoverable (106 ) (13,540 ) (47,350 ) Net balance at beginning of year 58,388 85,300 87,003 Incurred (recovered) related to: Current year 322,929 305,919 188,040 Prior years 27,499 (4,690 ) (301 ) Total incurred 350,428 301,229 187,739 Paid related to: Current year 215,274 229,761 123,952 Prior years 127,522 98,380 65,490 Total paid 342,796 328,141 189,442 Net balance at end of year 66,020 58,388 85,300 Plus: Reinsurance recoverable 182,405 106 13,540 Balance at end of year $ 248,425 $ 58,494 $ 98,840 Years Ended December 31, 2017 2016 Unpaid Loss and LAE, net $ 58,669 $ 63,699 IBNR loss and LAE, net 7,351 (5,311 ) Total unpaid loss and LAE, net $ 66,020 $ 58,388 Reinsurance recoverable on unpaid loss and LAE $ 57,261 $ 856 Reinsurance recoverable on IBNR loss and LAE 125,144 (750 ) Total reinsurance recoverable on unpaid loss and LAE $ 182,405 $ 106 Years Ended December 31, 2017 2016 Loss Ratio (1) UPCIC 56 % 50 % APPCIC 82 % 30 % Expense Ratio (1) UPCIC 35 % 36 % APPCIC 47 % 55 % Combined Ratio (1) UPCIC 91 % 86 % APPCIC 129 % 85 % Less than Over 5 Total 1 year 1-3 years 3-5 years years Unpaid losses and LAE, direct (1) $ 248,425 $ 126,697 $ 71,795 $ 39,003 $ 10,930 Long-term debt 14,205 1,755 5,061 3,205 4,184 Total contractual obligations $ 262,630 $ 128,452 $ 76,856 $ 42,208 $ 15,114 December 31, 2017 Amortized Cost Fair Value 2018 2019 2020 2021 2022 Thereafter Other (1) Total Total Fixed income Financial Instruments $ 51,846 $ 85,309 $ 61,215 $ 60,968 $ 27,832 $ 132,530 $ 234,015 $ 653,715 $ 649,334 Weighted average interest rate 1.87 % 1.82 % 2.18 % 2.16 % 2.76 % 4.02 % 3.08 % 2.83 % 2.83 % December 31, 2016 Amortized Cost Fair Value 2017 2018 2019 2020 2021 Thereafter Other (1) Total Total Fixed income Financial Instruments $ 48,919 $ 46,183 $ 84,855 $ 41,500 $ 57,071 $ 88,861 $ 229,072 $ 596,461 $ 589,363 Weighted average interest rate 2.03 % 2.41 % 1.87 % 2.15 % 2.26 % 4.53 % 2.96 % 2.79 % 2.78 % December 31, 2017 December 31, 2016 Fair Value Percent Fair Value Percent Equity securities: Common stock $ 18,811 30.2 % $ 93 0.2 % Mutual funds 43,404 69.8 % 50,710 99.8 % Total equity securities $ 62,215 100.0 % $ 50,803 100.0 % December 31, 2017 2016 ASSETS Fixed maturities, at fair value $ 639,334 $ 584,361 Equity securities, at fair value 62,215 50,803 Short-term investments, at fair value 10,000 5,002 Investment real estate, net 18,474 11,435 Total invested assets 730,023 651,601 Cash and cash equivalents 213,486 105,730 Restricted cash and cash equivalents 2,635 2,635 Prepaid reinsurance premiums 132,806 124,385 Reinsurance recoverable 182,405 106 Premiums receivable, net 56,500 53,833 Property and equipment, net 32,866 32,162 Deferred policy acquisition costs, net 73,059 64,912 Income taxes recoverable 9,472 3,262 Deferred income tax asset, net 9,286 10,674 Other assets 12,461 10,707 Total assets $ 1,454,999 $ 1,060,007 LIABILITIES AND STOCKHOLDERS' EQUITY LIABILITIES: Unpaid losses and loss adjustment expenses $ 248,425 $ 58,494 Unearned premiums 532,444 475,756 Advance premium 26,216 17,796 Accounts payable 2,866 3,187 Book overdraft 36,715 — Reinsurance payable, net 110,381 80,891 Income taxes payable — — Other liabilities and accrued expenses 45,096 37,665 Long-term debt 12,868 15,028 Total liabilities 1,015,011 688,817 Commitments and Contingencies (Note 15) STOCKHOLDERS' EQUITY: Cumulative convertible preferred stock, $.01 par value — — Authorized shares - 1,000 Issued shares - 10 and 10 Outstanding shares - 10 and 10 Minimum liquidation preference - $9.99 and $9.99 per share Common stock, $.01 par value 458 453 Authorized shares - 55,000 Issued shares - 45,778 and 45,324 Outstanding shares - 34,735 and 35,052 Treasury shares, at cost - 11,043 and 10,272 (105,123 ) (86,982 ) Additional paid-in capital 86,186 82,263 Accumulated other comprehensive income (loss), net of taxes (6,281 ) (6,408 ) Retained earnings 464,748 381,864 Total stockholders' equity 439,988 371,190 Total liabilities and stockholders' equity $ 1,454,999 $ 1,060,007 For the Years Ended December 31, 2017 2016 2015 PREMIUMS EARNED AND OTHER REVENUES Direct premiums written $ 1,055,886 $ 954,617 $ 883,409 Change in unearned premium (56,688 ) (33,390 ) (46,617 ) Direct premium earned 999,198 921,227 836,792 Ceded premium earned (310,405 ) (288,811 ) (332,793 ) Premiums earned, net 688,793 632,416 503,999 Net investment income (expense) 13,460 9,540 5,155 Net realized gains (losses) on investments 2,570 2,294 1,060 Commission revenue 21,253 17,733 14,870 Policy fees 18,838 16,880 15,440 Other revenue 7,002 6,426 6,020 Total premiums earned and other revenues 751,916 685,289 546,544 OPERATING COSTS AND EXPENSES Losses and loss adjustment expenses 350,428 301,229 187,739 General and administrative expenses 231,004 221,177 183,782 Total operating costs and expenses 581,432 522,406 371,521 INCOME BEFORE INCOME TAXES 170,484 162,883 175,023 Income tax expense 63,549 63,473 68,539 NET INCOME $ 106,935 $ 99,410 $ 106,484 Basic earnings per common share $ 3.07 $ 2.85 $ 3.06 Weighted average common shares outstanding - Basic 34,841 34,919 34,799 Diluted earnings per common share $ 2.99 $ 2.79 $ 2.97 Weighted average common shares outstanding - Diluted 35,809 35,650 35,884 Cash dividend declared per common share $ 0.69 $ 0.69 $ 0.63 For the Years Ended December 31, 2017 2016 2015 Net income $ 106,935 $ 99,410 $ 106,484 Other comprehensive income (loss) 127 (2,402 ) (2,171 ) Comprehensive income (loss) $ 107,062 $ 97,008 $ 104,313 Accumulated Common Preferred Common Preferred Additional Other Total Shares Shares Stock Stock Paid-In Retained Comprehensive Treasury Stockholders' Issued Issued Amount Amount Capital Earnings Income (Loss) Stock Equity Balance, December 31, 2014 44,769 12 $ 448 $ — $ 40,987 $ 222,469 $ (1,835 ) $ (62,153 ) $ 199,916 Stock option exercises 751 — 7 — �� 3,807 — — (8,101 ) (4,287 ) Grants and vesting of restricted stock 615 — 6 — (6 ) — — (7,344 ) (7,344 ) Purchase of preferred stock — (2 ) — — (256 ) — — — (256 ) Purchases of treasury stock — — — — — — — (18,649 ) (18,649 ) Reclassification of contingently redeemable common stock to common stock — — — — 19,000 — — — 19,000 Retirement of treasury shares (610 ) — (6 ) — (15,439 ) — — 15,445 — Share-based compensation — — — — 17,386 — — — 17,386 Net income — — — — — 106,484 — — 106,484 Change in net unrealized gains (losses) (1) — — — — — — (2,171 ) — (2,171 ) Excess tax benefit (shortfall), net (2) — — — — 5,310 — — — 5,310 Declaration of dividends — — — — — (22,297 ) — — (22,297 ) Balance, December 31, 2015 45,525 10 455 — 70,789 306,656 (4,006 ) (80,802 ) 293,092 Stock option exercises 124 — 1 — 905 — — (6,238 ) (5,332 ) Purchases of treasury stock — — — — — — — (8,510 ) (8,510 ) Treasury shares reissued — — — — 7,670 — — 2,330 10,000 Retirement of treasury shares (325 ) — (3 ) — (6,235 ) — — 6,238 — Share-based compensation — — — — 10,288 — — — 10,288 Net income — — — — — 99,410 — — 99,410 Change in net unrealized gains (losses) (1) — — — — — — (2,402 ) — (2,402 ) Excess tax benefit (shortfall), net (2) — — — — (1,154 ) — — — (1,154 ) Declaration of dividends — — — — — (24,202 ) — — (24,202 ) Balance, December 31, 2016 45,324 10 453 — 82,263 381,864 (6,408 ) (86,982 ) 371,190 Vesting of performance share units 115 — 1 — (1 ) — — (1,183 ) (1,183 ) Stock option exercises 804 — 8 — 5,578 — — (11,625 ) (6,039 ) Common stock issued 26 — 1 — 634 — — — 635 Purchases of treasury stock — — — — — — — (18,141 ) (18,141 ) Retirement of treasury shares (491 ) — (5 ) — (12,803 ) — — 12,808 — Share-based compensation — — — — 10,515 — — — 10,515 Net income — — — — — 106,935 — — 106,935 Change in net unrealized gains (losses) (1) — — — — — — 127 — 127 Declaration of dividends — — — — — (24,051 ) — — (24,051 ) Balance, December 31, 2017 45,778 10 $ 458 $ — $ 86,186 $ 464,748 $ (6,281 ) $ (105,123 ) $ 439,988 For the Years Ended December 31, 2017 2016 2015 Cash flows from operating activities: Net Income $ 106,935 $ 99,410 $ 106,484 Adjustments to reconcile net income to net cash provided by operating activities: Bad debt expense 501 406 611 Depreciation and amortization 4,058 3,242 2,033 Amortization of share-based compensation 10,515 10,288 17,386 Amortization of original issue discount on debt 10 149 521 Accretion of deferred credit — (149 ) (521 ) Book overdraft increase (decrease) 36,715 — (5,924 ) Net realized (gains) losses on investments (2,570 ) (2,294 ) (1,060 ) Amortization of premium/accretion of discount, net 3,994 3,481 1,831 Deferred income taxes 1,309 4,724 (693 ) Excess tax (benefits) shortfall from share-based compensation (5,793 ) 1,154 (5,310 ) Other 35 31 42 Issuance of common stock 634 — — Net change in assets and liabilities relating to operating activities: Prepaid reinsurance premiums (8,421 ) (9,712 ) 75,832 Reinsurance recoverable (182,299 ) 22,747 32,334 Reinsurance receivable, net 186 167 7,115 Premiums receivable, net (3,162 ) (3,249 ) (385 ) Accrued investment income (708 ) (1,514 ) (298 ) Income taxes recoverable (417 ) 1,004 255 Deferred policy acquisition costs, net (8,147 ) (4,893 ) (34,359 ) Other assets (1,860 ) 767 (2,533 ) Unpaid losses and loss adjustment expenses 189,931 (40,346 ) (35,513 ) Unearned premiums 56,688 33,390 46,618 Accounts payable (321 ) 2,809 (3,743 ) Reinsurance payable, net 29,490 7,306 7,519 Income taxes payable — — 3,510 Other liabilities and accrued expenses 9,287 (505 ) 625 Advance premium 8,420 (7,017 ) 6,894 Net cash provided by (used in) operating activities 245,010 121,396 219,271 Cash flows from investing activities: Proceeds from sale of property and equipment 23 36 86 Purchases of property and equipment (4,618 ) (8,223 ) (11,869 ) Payments to acquire a business — — (1,000 ) Purchases of equity securities (89,302 ) (66,688 ) (65,038 ) Purchases of fixed maturities (180,604 ) (320,131 ) (178,198 ) Purchases of short-term investments (10,000 ) — (87,538 ) Purchases of investment real estate, net (7,218 ) (5,496 ) (6,220 ) Proceeds from sales of equity securities 77,640 60,558 41,456 Proceeds from sales of fixed maturities 26,179 86,018 38,379 Proceeds from sales of short-term investments — — 12,500 Maturities of fixed maturities 97,191 54,615 74,390 Maturities of short-term investments 5,000 25,000 100,000 Net cash provided by (used in) investing activities (85,709 ) (174,311 ) (83,052 ) Cash flows from financing activities: Preferred stock dividend (10 ) (10 ) (10 ) Common stock dividend (24,001 ) (24,192 ) (22,287 ) Issuance of common stock for stock option exercises — 119 511 Purchase of treasury stock (18,141 ) (8,510 ) (18,649 ) Sale of treasury stock — 2,965 — Purchase of preferred stock — — (256 ) Payments related to tax withholding for share-based compensation (7,223 ) (5,451 ) (12,141 ) Excess tax benefits (shortfall) from share-based compensation — (1,154 ) 5,310 Repayment of debt (2,170 ) (2,136 ) (8,470 ) Borrowings under promissory note — — 1,390 Net cash provided by (used in) financing activities (51,545 ) (38,369 ) (54,602 ) Net increase (decrease) in cash and cash equivalents 107,756 (91,284 ) 81,617 Cash and cash equivalents at beginning of period 105,730 197,014 115,397 Cash and cash equivalents at end of period $ 213,486 $ 105,730 $ 197,014 Supplemental cash and non-cash flow disclosures: Interest paid $ 348 $ 421 $ 963 Income taxes paid $ 68,883 $ 63,378 $ 65,383 Income tax refund $ 434 $ 5,633 $ — Company. December 31, 2017 Cost or Gross Gross Amortized Unrealized Unrealized Cost Gains Losses Fair Value Fixed Maturities: U.S. government obligations and agencies $ 60,481 $ — $ (877 ) $ 59,604 Corporate bonds 228,336 476 (1,308 ) 227,504 Mortgage-backed and asset-backed securities 221,956 19 (2,523 ) 219,452 Municipal bonds 120,883 599 (1,187 ) 120,295 Redeemable preferred stock 12,059 485 (65 ) 12,479 Equity Securities: Common stock 22,584 47 (3,820 ) 18,811 Mutual funds 45,456 179 (2,231 ) 43,404 Short-term investments 10,000 — — 10,000 Total $ 721,755 $ 1,805 $ (12,011 ) $ 711,549 December 31, 2016 Cost or Gross Gross Amortized Unrealized Unrealized Cost Gains Losses Fair Value Fixed Maturities: U.S. government obligations and agencies $ 74,937 $ — $ (670 ) $ 74,267 Corporate bonds 192,328 402 (1,300 ) 191,430 Mortgage-backed and asset-backed securities 216,679 135 (2,038 ) 214,776 Municipal bonds 94,794 130 (3,727 ) 91,197 Redeemable preferred stock 12,723 125 (157 ) 12,691 Equity Securities: Common stock 214 — (121 ) 93 Mutual funds 53,900 407 (3,597 ) 50,710 Short-term investments 5,000 2 — 5,002 Total $ 650,575 $ 1,201 $ (11,610 ) $ 640,166 December 31, 2017 December 31, 2016 % of Total % of Total Comparable Ratings Fair Value Fair Value Fair Value Fair Value AAA $ 135,237 20.8 % $ 131,260 22.3 % AA 292,496 45.1 % 275,480 46.7 % A 134,505 20.7 % 107,418 18.2 % BBB 80,566 12.4 % 67,263 11.4 % BB and Below 2,919 0.4 % 3,444 0.6 % No Rating Available 3,611 0.6 % 4,498 0.8 % Total $ 649,334 100.0 % $ 589,363 100.0 % December 31, 2017 December 31, 2016 Cost or Cost or Amortized Amortized Cost Fair Value Cost Fair Value Mortgage-backed securities: Agency $ 118,014 $ 116,014 $ 110,724 $ 109,022 Non-agency 17,676 17,488 19,408 19,265 Asset-backed securities: Auto loan receivables 35,105 34,962 37,390 37,429 Credit card receivables 38,844 38,719 38,640 38,568 Other receivables 12,317 12,269 10,517 10,492 Total $ 221,956 $ 219,452 $ 216,679 $ 214,776 December 31, 2017 Less Than 12 Months 12 Months or Longer Number of Unrealized Number of Unrealized Issues Fair Value Losses Issues Fair Value Losses Fixed maturities: U.S. government obligations and agencies 7 $ 35,464 $ (301 ) 9 $ 24,140 $ (576 ) Corporate bonds 159 142,208 (792 ) 39 29,796 (516 ) Mortgage-backed and asset-backed securities 83 137,481 (955 ) 37 70,218 (1,568 ) Municipal bonds 36 28,265 (246 ) 30 48,370 (941 ) Redeemable preferred stock 21 2,464 (65 ) — — — Equity securities: Common stock 2 17,846 (3,820 ) — — — Mutual funds 3 25,338 (135 ) 1 9,171 (2,096 ) Total 311 $ 389,066 $ (6,314 ) 116 $ 181,695 $ (5,697 ) December 31, 2016 Less Than 12 Months 12 Months or Longer Number of Unrealized Number of Unrealized Issues Fair Value Losses Issues Fair Value Losses Fixed maturities: U.S. government obligations and agencies 11 $ 70,453 $ (608 ) 2 $ 3,504 $ (62 ) Corporate bonds 116 96,379 (1,219 ) 4 3,250 (80 ) Mortgage-backed and asset-backed securities 73 149,928 (1,923 ) 5 9,660 (115 ) Municipal bonds 69 79,402 (3,726 ) — — — Redeemable preferred stock 50 6,340 (158 ) — — — Equity securities: Common stock 1 18 (7 ) 2 75 (115 ) Mutual funds 3 28,020 (774 ) 2 11,529 (2,823 ) Total 323 $ 430,540 $ (8,415 ) 15 $ 28,018 $ (3,195 ) December 31, 2017 Cost or Amortized Cost Fair Value Due in one year or less $ 51,846 $ 51,804 Due after one year through five years 235,323 233,849 Due after five years through ten years 56,806 56,677 Due after ten years 75,725 75,073 Mortgage-backed and asset-backed securities 221,956 219,452 Perpetual maturity securities 12,059 12,479 Total $ 653,715 $ 649,334 Years Ended December 31, 2017 2016 Proceeds from sales and maturities (fair value) $ 206,010 $ 226,191 Gross realized gains $ 2,873 $ 2,329 Gross realized losses $ (303 ) $ (35 ) Years Ended December 31, 2017 2016 2015 Fixed maturities $ 12,375 $ 9,523 $ 5,642 Equity securities 1,799 1,414 1,143 Short-term investments 22 75 246 Other (1) 1,459 734 409 Total investment income 15,655 11,746 7,440 Less: Investment expenses (2) (2,195 ) (2,206 ) (2,285 ) Net investment (expense) income $ 13,460 $ 9,540 $ 5,155 December 31, 2017 December 31, 2016 Income Producing: Investment real estate $ 6,918 $ 6,918 Less: Accumulated depreciation (460 ) (281 ) 6,458 6,637 Non-Income Producing: Properties under development 12,016 4,798 Investment real estate, net $ 18,474 $ 11,435 Ratings as of December 31, 2017 Standard and Poor's Moody's Due from as of AM Best Rating Investors December 31, Reinsurer Company Services Service, Inc. 2017 2016 Allianz Risk Transfer A+ AA- n/a $ 105,573 $ — Florida Hurricane Catastrophe Fund (1) n/a n/a n/a 52,054 46,364 Renaissance Reinsurance Ltd A+ AA- A1 22,545 — Total (2) $ 180,172 $ 46,364 For the Year Ended December 31, 2017 Losses and Loss Premiums Premiums Adjustment Written Earned Expenses Direct $ 1,055,886 $ 999,198 $ 779,122 Ceded (318,826 ) (310,405 ) (428,694 ) Net $ 737,060 $ 688,793 $ 350,428 For the Year Ended December 31, 2016 Losses and Loss Premiums Premiums Adjustment Written Earned Expenses Direct $ 954,617 $ 921,227 $ 303,036 Ceded (298,523 ) (288,811 ) (1,807 ) Net $ 656,094 $ 632,416 $ 301,229 For the Year Ended December 31, 2015 Losses and Loss Premiums Premiums Adjustment Written Earned Expenses Direct $ 883,409 $ 836,792 $ 214,491 Ceded (256,961 ) (332,793 ) (26,752 ) Net $ 626,448 $ 503,999 $ 187,739 As of December 31, 2017 2016 Prepaid reinsurance premiums $ 132,806 $ 124,385 Reinsurance recoverable on unpaid losses and LAE $ 182,405 $ 106 Reinsurance recoverable (payable) on paid losses — (1,532 ) Reinsurance receivable, net — 186 Reinsurance recoverable (payable) and receivable $ 182,405 $ (1,240 ) Years Ended December 31, 2017 2016 2015 DPAC, beginning of year $ 64,912 $ 60,019 $ 54,603 Capitalized Costs 144,849 130,243 116,954 Amortization of DPAC (136,702 ) (125,350 ) (111,538 ) DPAC, end of year $ 73,059 $ 64,912 $ 60,019 DRCC, beginning of year $ — $ — $ 28,943 Ceding Commissions Written — — (5,276 ) Earned Ceding Commissions — — (23,667 ) DRCC, end of year $ — $ — $ — DPAC (DRCC), net, beginning of year $ 64,912 $ 60,019 $ 25,660 Capitalized Costs, net 144,849 130,243 122,230 Amortization of DPAC (DRCC), net (136,702 ) (125,350 ) (87,871 ) DPAC (DRCC), net, end of year $ 73,059 $ 64,912 $ 60,019 As of December 31, 2017 2016 Ten percent of total liabilities UPCIC $ 72,633 $ 57,560 APPCIC $ 572 $ 464 Statutory capital and surplus UPCIC $ 307,686 $ 313,753 APPCIC $ 16,633 $ 17,280 Years Ended December 31, 2017 2016* 2015 Capital Contributions $ — $ 2,000 $ — As of December 31, 2017 2016 Restricted cash and cash equivalents $ 2,635 $ 2,635 Investments $ 3,910 $ 3,952 As of December 31, 2017 2016 Land $ 4,489 $ 4,489 Building 17,644 17,633 Computers 5,589 5,577 Furniture 1,637 1,381 Automobiles and other vehicles 6,857 5,523 Software 2,646 2,035 Total 38,862 36,638 Less: Accumulated depreciation (10,829 ) (8,527 ) Net of accumulated deprecation 28,033 28,111 Construction in progress 4,833 4,051 Property and equipment, net $ 32,866 $ 32,162 For the Years Ended December 31, 2017 2016 2015 Realized gain (loss) on disposal $ (35 ) $ (31 ) $ (26 ) As of December 31, 2017 2016 Surplus note $ 12,868 $ 14,338 Promissory note — 690 Total $ 12,868 $ 15,028 compliance. 2018 $ 1,471 2019 1,471 2020 1,471 2021 1,471 2022 1,471 Thereafter 5,513 Total $ 12,868 common stock. As of December 31, 2017 2016 Shares issued and outstanding 10 10 Conversion factor 2.50 2.50 Common shares resulting if converted 25 25 2022. Issued Treasury Outstanding Shares Shares Shares Balance, as of December 31, 2014 44,769 (9,667 ) 35,102 Shares repurchased — (748 ) (748 ) Options exercised 751 — 751 Restricted stock grant 615 — 615 Shares acquired through cashless exercise (1) — (610 ) (610 ) Shares cancelled (610 ) 610 — Balance, as of December 31, 2015 45,525 (10,415 ) 35,110 Shares repurchased — (441 ) (441 ) Shares reissued — 584 584 Options exercised 124 — 124 Shares acquired through cashless exercise (1) — (325 ) (325 ) Shares cancelled (325 ) 325 — Balance, as of December 31, 2016 45,324 (10,272 ) 35,052 Shares repurchased — (771 ) (771 ) Vesting of performance share units 115 — 115 Shares reissued — — — Options exercised 804 — 804 Common stock issued 26 — 26 Shares acquired through cashless exercise (1) — (491 ) (491 ) Shares cancelled (491 ) 491 — Balance, as of December 31, 2017 45,778 (11,043 ) 34,735 data): For the Years Ended December 31, 2017 2016 2015 Per Share Aggregate Per Share Aggregate Per Share Aggregate Amount Amount Amount Amount Amount Amount First Quarter $ 0.14 $ 4,932 $ 0.14 $ 4,915 $ 0.12 $ 4,237 Second Quarter $ 0.14 $ 4,887 $ 0.14 $ 4,913 $ 0.12 $ 4,283 Third Quarter $ 0.14 $ 4,830 $ 0.14 4,903 $ 0.12 $ 4,275 Fourth Quarter $ 0.27 9,392 $ 0.27 9,461 $ 0.27 $ 9,492 Registrant incentive plan. For the Year Ended December 31, 2017 Stock Options Performance Share Units Weighted Weighted Average Weighted Average Exercise Aggregate Average Number Grant Date Number of Price per Intrinsic Remaining of Share Fair Value Options (2) Share (1) Value Term Units (2) per Share (1) Outstanding as of December 31, 2016 3,214 $ 15.77 173 $ 23.18 Granted 797 27.20 147 27.20 Forfeited — — n/a n/a Exercised (804 ) 6.95 n/a n/a Vested n/a n/a (115 ) 23.18 Expired — — n/a n/a Outstanding as of December 31, 2017 3,207 $ 20.82 $ 20,935 6.18 205 $ 26.07 Exercisable as of December 31, 2017 1,325 $ 18.62 $ 11,570 4.47 The following table provides certain information in connection with the Company’s share-based compensation arrangements for the periods presented (in thousands): Years Ended December 31, 2017 2016 2015 Compensation expense: Stock options $ 6,907 $ 3,641 $ 1,389 Restricted stock — 3,433 15,997 Performance share units 3,608 3,214 — Total $ 10,515 $ 10,288 $ 17,386 Deferred tax benefits: Stock options $ 2,640 $ 1,392 $ 532 Restricted stock — 1,312 4,816 Performance share units 1,379 1,229 — Total $ 4,019 $ 3,933 $ 5,348 Realized tax benefits: Stock options $ 5,831 $ 724 $ 5,369 Restricted stock — 4,326 — Performance share units 1,264 — — Total $ 7,095 $ 5,050 $ 5,369 Excess tax benefits (shortfall) (1): Stock options $ 5,548 $ 642 $ 5,310 Restricted stock — (1,796 ) — Performance share units 245 — — Total $ 5,793 $ (1,154 ) $ 5,310 Weighted average fair value per option or share: Stock option grants $ 10.18 $ 6.01 $ 6.34 Restricted stock grants $ — $ — $ 26.04 Performance share unit grants $ 27.20 $ 23.18 $ — Intrinsic value of options exercised $ 15,256 $ 1,894 $ 14,734 Fair value of restricted stock vested $ — $ 11,319 $ 17,505 Fair value of performance share units vested $ 3,307 $ — $ — Cash received for strike price and tax withholdings $ — $ 119 $ 519 Shares acquired through cashless exercise (2) 491 325 611 Value of shares acquired through cashless exercise (2) $ 12,808 $ 6,238 $ 15,445 As of December 31, 2017 Stock Performance Options Share Units Unrecognized expense $ 9,064 $ 1,176 Weighted average remaining years 1.69 1.31 outstanding. Expected volatilities are based on historical volatilities of our Common Stock. The dividend yield was based on expected dividends at the time of grant. Years Ended December 31, 2017 2016 2015 Weighted-average risk-free interest rate 1.94 % 1.40 % 0.54 % Expected term of option in years 5.84 5.44 3.38 Weighted-average volatility 45.1 % 45.2 % 44.3 % Dividend yield 2.0 % 3.4 % 3.4 % Weighted average grant date fair value per share $ 10.18 $ 6.01 $ 6.34 Performance Share Units and Restricted Stock Each restricted stock unit has a value equal to one share of common stock and generally vests over a one- to three-year service period commencing on the grant date. See Years Ended December 31, 2017 2016 2015 SPC Global RE Advisors LLC $ — $ — $ 90 There were no For the Years Ended December 31, 2017 2016 2015 Current: Federal $ 53,962 $ 50,645 $ 61,830 State and local 8,278 8,105 7,402 Total current expense (benefit) 62,240 58,750 69,232 Deferred: Federal 851 4,106 (775 ) State and local 458 617 82 Total deferred expense (benefit) 1,309 4,723 (693 ) Income tax expense $ 63,549 $ 63,473 $ 68,539 For the Years Ended December 31, 2017 2016 2015 Expected provision at federal statutory tax rate 35.0 % 35.0 % 35.0 % Increases (decreases) resulting from: State income tax, net of federal tax benefit 3.2 % 3.2 % 3.4 % Effect of change in tax rate 2.8 % — 0.1 % Disallowed meals & entertainment 0.4 % 0.3 % 0.2 % Disallowed compensation 0.4 % 0.4 % 1.1 % Excess tax benefit (3.4 %) — — Other, net (1.1 %) 0.1 % (0.6 %) Total income tax expense (benefit) 37.3 % 39.0 % 39.2 % As of December 31, 2017 2016 Deferred income tax assets: Unearned premiums $ 19,916 $ 26,861 Advanced premiums 1,275 1,314 Unpaid losses and LAE 385 374 Share-based compensation 3,894 3,256 Accrued wages 288 297 Allowance for uncollectible receivables 224 284 Additional tax basis of securities 33 51 Capital loss carryforwards 822 759 Other comprehensive income 2,544 3,982 Other 84 131 Total deferred income tax assets 29,465 37,309 Valuation allowance (523 ) (133 ) Deferred income tax assets, net of valuation allowance 28,942 37,176 Deferred income tax liabilities: Deferred policy acquisition costs, net (18,205 ) (24,812 ) Prepaid expenses (435 ) (504 ) Fixed assets (881 ) (880 ) Other (135 ) (306 ) Total deferred income tax liabilities (19,656 ) (26,502 ) Net deferred income tax asset $ 9,286 $ 10,674 2022. In loss periods, the impact of common shares issuable upon the exercises of stock options, non-vested performance share units, non-vested restricted stock units, non-vested restricted stock, and conversion of preferred stock are excluded from the calculation of diluted loss per share, as the inclusion of common shares issuable upon the exercise of stock options, non-vested performance share units, non-vested restricted stock units, non-vested restricted stocks, and conversion of preferred stock would have an anti-dilutive effect. There is no difference between basic and diluted income or loss per share. Years Ended December 31, 2017 2016 2015 Numerator for EPS: Net income $ 106,935 $ 99,410 $ 106,484 Less: Preferred stock dividends (10 ) (10 ) (10 ) Income available to common stockholders $ 106,925 $ 99,400 $ 106,474 Denominator for EPS: Weighted average common shares outstanding 34,841 34,919 34,799 Plus: Assumed conversion of share-based compensation (1) 943 706 1,056 Assumed conversion of preferred stock 25 25 29 Weighted average diluted common shares outstanding 35,809 35,650 35,884 Basic earnings per common share $ 3.07 $ 2.85 $ 3.06 Diluted earnings per common share $ 2.99 $ 2.79 $ 2.97 Weighted average number of antidilutive shares 1,504 1,583 311 Years Ended December 31, 2017 2016 2015 Pre-tax Tax After-tax Pre-tax Tax After-tax Pre-tax Tax After-tax Net unrealized gains (losses) on investments available for sale arising during the period $ 2,773 1,058 $ 1,715 $ (1,594 ) (609 ) $ (985 ) $ (2,480 ) $ (963 ) $ (1,517 ) Less: Amounts reclassified from accumulated other comprehensive income (loss) (2,570 ) (982 ) (1,588 ) (2,294 ) (877 ) (1,417 ) (1,060 ) (406 ) (654 ) Net current period other comprehensive income (loss) $ 203 $ 76 $ 127 $ (3,888 ) $ (1,486 ) $ (2,402 ) $ (3,540 ) $ (1,369 ) $ (2,171 ) Amounts Reclassified from Accumulated Other Comprehensive Income Details about Accumulated Other Years Ended December 31, Affected Line Item in the Statement Comprehensive Income Components 2017 2016 2015 Where Net Income is Presented Unrealized gains (losses) on investments available for sale $ 2,570 $ 2,294 $ 1,060 Net realized gains (losses) on investments (982 ) (877 ) (406 ) Income taxes, current $ 1,588 $ 1,417 $ 654 Net of tax •Level 1 •Level 2 •Level 3 Recurring Basis Fair Value Measurements As of December 31, 2017 Level 1 Level 2 Level 3 Total Fixed maturities: U.S. government obligations and agencies $ — $ 59,604 $ — $ 59,604 Corporate bonds — 227,504 — 227,504 Mortgage-backed and asset-backed securities — 219,452 — 219,452 Municipal bonds — 120,295 — 120,295 Redeemable preferred stock — 12,479 — 12,479 Equity securities: Common stock 18,811 — — 18,811 Mutual funds 43,404 — — 43,404 Short-term investments — 10,000 — 10,000 Total assets accounted for at fair value $ 62,215 $ 649,334 $ — $ 711,549 Fair Value Measurements As of December 31, 2016 Level 1 Level 2 Level 3 Total Fixed maturities: U.S. government obligations and agencies $ — $ 74,267 $ — $ 74,267 Corporate bonds — 191,430 — 191,430 Mortgage-backed and asset-backed securities — 214,776 — 214,776 Municipal bonds — 91,197 — 91,197 Redeemable preferred stock — 12,691 — 12,691 Equity securities: Common stock 93 — — 93 Mutual funds 50,710 — — 50,710 Short-term investments — 5,002 — 5,002 Total assets accounted for at fair value $ 50,803 $ 589,363 $ — $ 640,166 As of December 31, 2017 2016 (Level 3) (Level 3) Carrying Estimated Carrying Estimated Value Fair Value Value Fair Value Liabilities (debt): Surplus note $ 12,868 $ 11,630 $ 14,338 $ 13,282 Promissory note $ — $ — $ 690 $ 690 note (Level 2). determined based on pricing from quoted prices for similar assets in active markets and was included as Level 2. Incurred Claims and Allocated Claim Adjustment Expenses, Net of Reinsurance As of December 31, 2017 Total of Incurred- but-Not-Reported For the Years Ended December 31, Liabilities Plus Accident Year 2013* 2014* 2015* 2016 2017 Expected Development (Redundancy) on Reported Claims Cumulative Number of Reported Claims 2013 * $ 100,111 $ 96,993 $ 96,012 $ 88,493 $ 91,065 $ (4,704 ) 20,440 2014 * 111,739 118,289 112,251 112,278 (10,886 ) 22,420 2015 * 170,381 187,431 194,600 (15,635 ) 26,703 2016 269,814 286,252 (17,785 ) 39,885 2017 303,944 49,600 93,080 Total $ 988,139 *UNAUDITED Cumulative Paid Claims and Allocated Claim Adjustment Expenses, Net of Reinsurance For the Years Ended December 31, Accident Year 2013* 2014* 2015* 2016 2017 2013 * $ 61,117 $ 88,843 $ 93,489 $ 95,059 $ 95,383 2014 * 69,703 112,059 119,798 122,579 2015 * 115,328 191,481 208,592 2016 204,122 297,374 2017 205,200 Total $ 929,128 All outstanding liabilities before 2013, net of reinsurance* (3,469 ) Liabilities for claims and claim adjustment expenses, net of reinsurance $ 55,542 *UNAUDITED December 31, 2017 Liabilities for unpaid claims and claim adjustment expenses, net of reinsurance $ 55,542 Reinsurance recoverable on unpaid claims 182,405 Unallocated claims adjustment expenses and other 10,478 Total gross liability for unpaid claims and claim adjustment expense $ 248,425 Average Annual Percentage Payout of Incurred Claims by Age, Net of Reinsurance Years 1 2 3 4 5 51.0 % 17.7 % 11.2 % 9.1 % 6.6 % Set forth in the following table is the change in liability for unpaid losses and LAE for the periods presented (in thousands): Years Ended December 31, 2017 2016 2015 Balance at beginning of year $ 58,494 $ 98,840 $ 134,353 Less: Reinsurance recoverable (106 ) (13,540 ) (47,350 ) Net balance at beginning of period 58,388 85,300 87,003 Incurred (recovered) related to: Current year 322,929 305,919 188,040 Prior years 27,499 (4,690 ) (301 ) Total incurred 350,428 301,229 187,739 Paid related to: Current year 215,274 229,761 123,952 Prior years 127,522 98,380 65,490 Total paid 342,796 328,141 189,442 Net balance at end of period 66,020 58,388 85,300 Plus: Reinsurance recoverable 182,405 106 13,540 Balance at end of year $ 248,425 $ 58,494 $ 98,840 policyholder demands related to roof repairs and significant attorney representation. In 2023, adverse development was due to represented and litigated claims, and Florida weather claims for accident years 2017 and later. One of management’s objectives in 2023 was to strengthen reserves on those prior period claims which do not benefit from the new legislation signed in late 2022 that eliminated the one-way attorneys’ fee statute and assignments of benefits and made other reforms intended to improve the Florida market. •Case reserves, which are the reserves established by the claims examiner on reported claims. •Incurred but not reported, •LAE, which are the estimated expenses associated with the settlement of case reserves and IBNR. year from the reported date unless delayed by some form of litigation or dispute. because they each provide insight into emerging patterns. These methods are each variations on two primary actuarial techniques: “chain ladder development” techniques and “counts and average” techniques. The “chain ladder development” actuarial technique is an estimation process in which historical payment and reserving patterns are applied to actual paid and/or reported amounts (paid losses, recovered subrogation or LAE plus individual case reserves established by claim adjusters) for an accident period to create an estimate of how losses or recoveries are likely to develop over time. The “counts and average” technique includes an evaluation of historical and projected costs per claim, and late-reported claim “Separate Account UVE-01,” a VIE in the normal course of business and consolidated the VIE since the Company is the primary beneficiary. See First Second Third Fourth Quarter Quarter Quarter Quarter For the Year Ended December 31, 2017 Premiums earned, net $ 161,559 $ 169,009 $ 174,517 $ 183,708 Investment income 2,704 3,223 3,085 4,448 Total revenues 174,874 185,487 190,243 201,312 Total expenses 127,503 137,564 173,644 142,721 Net income 31,199 29,376 9,964 36,396 Basic earnings per share $ 0.89 $ 0.84 $ 0.29 $ 1.05 Diluted earnings per share $ 0.86 $ 0.82 $ 0.28 $ 1.03 For the Year Ended December 31, 2016 Premiums earned, net $ 152,448 $ 156,461 $ 159,534 $ 163,973 Investment income 1,605 2,142 2,304 3,489 Total revenues 164,446 169,802 172,436 178,605 Total expenses 123,347 114,908 128,273 155,878 Net income 25,226 33,647 26,882 13,655 Basic earnings per share $ 0.73 $ 0.96 $ 0.77 $ 0.39 Diluted earnings per share $ 0.71 $ 0.94 $ 0.75 $ 0.38 25.1%. 2023. 2023. 2023. SECURITY OWNERSHIP OF CERTAIN BENEFICIAL OWNERS AND MANAGEMENT AND RELATED STOCKHOLDER MATTERS 2022. 2021. 2021. 2021. 2021. Page Schedules required to be filed under the provisions of Regulation S-X Article 7: 32 By: /s/ Chief Executive Officer and Director February /s/ Frank C. Wilcox Chief Financial Officer February Frank C. Wilcox Gary L. Ropiecki Chief Information Officer, Chief Administrative Officer and February Kimberly D. Shannon A. Brown February Scott P. Callahan /s/ February /s/ Richard D. Peterson February Richard D. Peterson /s/ Michael A. Pietrangelo February Michael A. Pietrangelo /s/ Ozzie A. Schindler February Ozzie A. Schindler Jon W. Springer February Joel M. Wilentz As of December 31, 2017 2016 ASSETS Cash and cash equivalents $ 67,509 $ 3,951 Investments in subsidiaries and undistributed earnings 359,847 362,759 Fixed maturities, at fair value 3,111 3,003 Equity maturities, at fair value 5,238 625 Income taxes recoverable 9,472 3,262 Deferred income taxes 9,286 10,674 Other assets 431 1,003 Total assets $ 454,894 $ 385,277 LIABILITIES AND STOCKHOLDERS' EQUITY LIABILITIES: Accounts payable $ 4 $ 50 Dividends payable 40 — Other accrued expenses 14,862 14,037 Total liabilities 14,906 14,087 STOCKHOLDERS' EQUITY: Cumulative convertible preferred stock, $.01 par value — — Authorized shares - 1,000 Issued shares - 10 and 10 Outstanding shares - 10 and 10 Minimum liquidation preference - $9.99 and $9.99 per share Common stock, $.01 par value 458 453 Authorized shares - 55,000 Issued shares - 45,778 and 45,324 Outstanding shares - 34,735 and 35,052 Treasury shares, at cost - 11,043 and 10,272 (105,123 ) (86,982 ) Additional paid-in capital 86,186 82,263 Accumulated other comprehensive income (loss), net of taxes (6,281 ) (6,408 ) Retained earnings 464,748 381,864 Total stockholders' equity 439,988 371,190 Total liabilities and stockholders' equity $ 454,894 $ 385,277 For the Years Ended December 31, 2017 2016 2015 REVENUES Net investment income (expense) $ 259 $ (35 ) $ 22 Net realized gains (losses) on investments 255 667 66 Management fee 151 138 140 Other revenue 12 80 — Total revenues 677 850 228 OPERATING COSTS AND EXPENSES General and administrative expenses 30,819 35,342 48,056 Total operating cost and expenses 30,819 35,342 48,056 LOSS BEFORE INCOME TAXES AND EQUITY IN NET EARNINGS OF SUBSIDIARIES (30,142 ) (34,492 ) (47,828 ) Benefit from income taxes (18,296 ) (12,055 ) (17,495 ) LOSS BEFORE EQUITY IN NET EARNINGS OF SUBSIDIARIES (11,846 ) (22,437 ) (30,333 ) Equity in net income of subsidiaries 118,781 121,847 136,817 CONSOLIDATED NET INCOME $ 106,935 $ 99,410 $ 106,484 For the Years Ended December 31, 2017 2016 2015 Cash flows from operating activities Net Income $ 106,935 $ 99,410 $ 106,484 Adjustments to reconcile net income to net cash provided by (used in) operating activities: Equity in net income of subsidiaries (118,781 ) (121,847 ) (136,817 ) Distribution of income from subsidiaries 122,156 46,914 58,224 Depreciation 3 2 4 Amortization of share-based compensation 10,515 10,288 17,386 Amortization of original issue discount on debt 10 149 521 Accretion of deferred credit — (149 ) (521 ) Net realized (gains) losses on investments (255 ) (667 ) (66 ) Deferred income taxes 1,309 4,724 (693 ) Excess tax benefits from share-based compensation (5,793 ) 1,154 (5,310 ) Issuance of common stock 634 — — Net changes in assets and liabilities relating to operating activities: Income taxes recoverable (417 ) 1,004 255 Income taxes payable — — 3,510 Other operating assets and liabilities 574 (596 ) (1,338 ) Other liabilities and accrued expenses 778 (2,896 ) — Net cash provided by (used in) operating activities 117,668 37,490 41,639 Cash flows from investing activities: Purchases of equity securities, available for sale (4,990 ) (2,037 ) (1,442 ) Purchase of fixed maturities, available for sale (3,000 ) (3,000 ) — Proceeds from sales of equity securities, available for sale 3,255 2,456 1,481 Proceeds from sales of fixed maturities, available for sale — 3,229 — Net cash provided by (used in) investing activities (4,735 ) 648 39 Cash flows from financing activities: Repayment of debt — — (7,000 ) Preferred stock dividend (10 ) (10 ) (10 ) Common stock dividend (24,001 ) (24,192 ) (22,287 ) Issuance of common stock for stock option exercises — 119 511 Purchase of treasury stock (18,141 ) (8,510 ) (18,649 ) Sale of treasury stock — 2,965 — Purchase of preferred stock — — (256 ) Payments related to tax withholding for share-based compensation (7,223 ) (5,451 ) (12,141 ) Excess tax benefits (shortfall) from share-based compensation — (1,154 ) 5,310 Net cash provided by (used in) financing activities (49,375 ) (36,233 ) (54,522 ) Net increase (decrease) in cash and cash equivalents 63,558 1,905 (12,844 ) Cash and cash equivalents at beginning of period 3,951 2,046 14,890 Cash and cash equivalents at end of period $ 67,509 $ 3,951 $ 2,046 2021. surplus. Intercompany note receivable is stated separately in the accompanying Condensed Consolidated Balance Sheets. Additions Charges to Beginning Charges to Other Ending Balance Earnings Accounts Deductions Balance Description Year Ended December 31, 2017: Allowance for doubtful accounts $ 527 505 — 352 $ 680 Year Ended December 31, 2016: Allowance for doubtful accounts $ 344 397 — 214 $ 527 Year Ended December 31, 2015: Allowance for doubtful accounts $ 357 395 — 408 $ 344 As of December 31, For the Year Ended December 31, Reserves Incurred Incurred for Unpaid Loss and Loss and Net Losses and LAE Current LAE Prior Paid Losses Investment LAE Year Years and LAE Income 2017 $ 248,425 $ 322,929 $ 27,499 $ 342,796 $ 13,460 2016 $ 58,494 $ 305,919 $ (4,690 ) $ 328,141 $ 9,540 2015 $ 98,840 $ 188,040 $ (301 ) $ 189,442 $ 5,155 As of December 31, For the Year Ended December 31, Deferred Policy Net Net Acquisition Amortization Premiums Premiums Unearned Cost ("DPAC"), Net of DPAC, Net Written Earned Premiums 2017 $ 73,059 $ (136,702 ) $ 737,060 $ 688,793 $ 532,444 2016 $ 64,912 $ (125,350 ) $ 656,094 $ 632,416 $ 475,756 2015 $ 60,019 $ (87,871 ) $ 626,448 $ 503,999 $ 442,366 Universal Insurance Holdings, Inc. whole. Our future results are dependent in part on our ability to successfully operate in a highly competitive insurance industry.The property and casualty insurance industry is highly competitive. We compete against large national carriers that have greater capital resources and longer operating histories, regional carriers, and managing general agencies, as well as newly formed and less-capitalized companies that might have more aggressive underwriting or pricing strategies. Many of these entities may also be affiliated with other entities that have greater financial and other resources than we have. Competitors mayWhen competitors attempt to increase market share by lowering rates. In that case,rates, we wouldcan experience reductions in our underwriting margins, or a decline in sales of our insurance policies could decline as customers purchase lower-priced products from our competitors. Competitors also might adopt more prompt or more effective solutions to adverse market conditions than we are able to implement, providing those competitors with a competitive advantage through lower losses and loss adjustment expenses, more competitive premium levels, or the ability to expand their businesses. Additionally, due to statutorily-imposed limits on rate increases, Florida’s residual property insurance market, Citizens, often charges lower premiums in hard insurance markets than what the Insurance Entities are able to charge in accordance with applicable regulatory filings, actuarial standards and prudent financial management. In hard markets such as the current Florida market, insurance agents and their customers therefore increasingly choose Citizens over private market insurers like the Insurance Entities for their residential property insurance coverage. Additionally, some law changes intended to alleviate abuses in the property insurance market are interpreted as applying only prospectively to policies issued or renewed after the new laws’ effective dates, potentially creating competitive advantages for insurers that enter markets or expand writings after the laws’ effective dates as compared to insurers like the Insurance Entities, which continue to have certain policy and claims servicing obligations on previously issued policies.Additionally, technological changes also present competitive risks. For example, our competitive position could be impacted if we are unable to deploy, in a cost effective and competitive manner, technology such as AI and machine learning that collects and analyzes a wide variety of data points (so-called “big data” analysis) to make underwriting or other decisions, or if our competitors collect and use data which we do not have the ability to access or use. In addition, innovations, such as telematics and other usage-based methods of determining premiums, can impact product design and pricing and are becoming an increasingly important competitive factor.Because of the competitive nature of the insurance industry, including competition for producers such as independent agents, there can be no assurance that we will continue to develop and maintain productive relationships with independent agents, effectively compete with our industry rivals, or that competitive pressures will not have a material adverse effect on our business, operating results or financial condition.21A downgrade in our Financial Stability Rating®financial strength or stability ratings may have an adverse effect on our competitive position, the marketability of our product offerings, and our liquidity, operating results and financial condition.Residential property insurers like the Insurance Entities must maintain financial strength or stability ratings from at least one rating organization acceptable to each of the Federal Home Loan Mortgage Corporation (“Freddie Mac’) and the Federal National Mortgage Association (“Fannie Mae”). Our Insurance Entities maintain Financial Stability Ratings®Ratings® of “A” (“Exceptional”) by Demotech and insurance financial strength ratings of “A-” by Kroll. These and similar ratings are important factors in establishing the competitive position of insurance companies and generally have an effect on an insurance company’scompany’s business. On an ongoing basis, rating agencies review the financial performance and condition of insurers and could downgrade or change the outlook on an insurer’sinsurer’s ratings due to, for example, a change in an insurer’sinsurer’s statutory capital; a change in a rating agency’sagency’s determination of the amount of risk-adjusted capital required to maintain a particular rating; a change in the perceived adequacy of an insurer’sinsurer’s reinsurance program; an increase in the perceived risk of an insurer’sinsurer’s investment portfolio; a reduced confidence in management or a host of other considerations that may or may not be within an insurer’sinsurer’s knowledge or control. Demotech has assigned a Financial Stability Rating® of A for each Insurance Entity. Because these ratings are subject to continuous review, the retention of these ratings cannot be assured. A downgrade in or withdrawal of these ratings, or a decision by Demotecha rating agency to require us to make a capital infusion into the Insurance Entities or otherwise alter operations to maintain their ratings,its rating, may adversely affect our liquidity, operating results and financial condition. A downgrade to or loss of a rating also might cause reputational damage to us among customers, insurance agents, reinsurers, creditors, regulators or others that could affect our ability to write and retain business. In addition, our failure to maintain aat least one financial strength or stability rating acceptable in the secondary mortgage market would adversely affect our ability to write new and renewal business. Further, a downgrade to or reduction of our financial strength or stability ratings below acceptable levels could constitute a default under credit obligations of UVE. Financial Stability Ratings® strength and stability ratings are primarily directed towards policyholders of the Insurance Entities, and are not evaluations directed toward the protection of our shareholders, and are not recommendations to buy, sell or hold securities.Breaches of our information systems or denial of service on our website could have an adverse impact on our business and reputation.Our ability to effectively operate our business depends on our ability, and the ability of certain third-party vendors and business partners, to access our computer systems to perform necessary business functions, such as providing quotes and product pricing, billing and processing premiums, administering claims and reporting our financial results. Our business and operations rely on the secure and efficient processing, storage and transmission of customer and company data, including policyholders’ personally identifiablenonpublic personal information, including financial information, and proprietary business information, on our computer systems and networks. There have been several highly publicized cases involvingUnauthorized access to personally identifiable information, even if not financial services companies, consumer-based companies and other companies, as well as governmental and political organizations, reporting breaches in the security of their websites, networks or other systems. Some of the publicized breaches have involved sophisticated and targetedinformation, could be damaging to all affected parties. Breaches can involve attacks intended to obtain unauthorized access to confidentialnonpublic personal information, destroy data, disrupt or degrade service, sabotage systems or cause other damage, including through the introduction of computer viruses or malware, cyberattacks and other means. There havemeans; breaches can also been several highly publicized cases where hackers have requested “ransom” payments in exchange for not disclosing customer information.Our computer systems may beare vulnerable to unauthorized access and hackers, computer viruses and other scenarios in which our data may be exposed or compromised. Cyber-attacksCyberattacks can originate from a variety of sources, including third parties who are affiliated with foreign governments or employees acting negligently or in a manner adverse to our interests. Third parties may seek to gain access to our systems either directly or using equipment or security passwords belonging to employees, customers, third-party service providers, or other users of our systems.Our computer systems have been, and likely will continue to be, subject to cyber hacking activities, computer viruses, other malicious codes, or other computer-related penetrations. To date, we are not awareThis is especially the case as the number of a material breach of cybersecurity.our employees working remotely has increased. We commit significant resources to administrative and technical controls to prevent cyber incidents and protect our information technology, but our preventative actions to reduce the risk of cyber threats may be insufficient to prevent physical and electronic break-ins and other cyber-attackscyberattacks or security breaches.breaches, including those due to human vulnerabilities. Any such event could damage our computers or systems; compromise our confidential information as well as that of our customers and third parties with whom we interact; significantly impede or interrupt business operations, including denial of service on our website; and could result in violations of applicable privacy and other laws, financial loss to us or to our policyholders, loss of confidence in our security measures, customer dissatisfaction, significant litigation exposure and reputational harm, all of which could have a material adverse effect on us. We may be required to expend significant additional resources to modify our protective measures or to investigate and remediate vulnerabilities, exposures, or information security events. Due to the complexity and32The increasedincrease in the use of cloud technologies and in consumer preference for online transactions can heighten these and other operational risks. Certain aspects of the security of such technologies are unpredictable or beyond our control, and this lack of transparency may inhibit our ability to discover a failure by cloud service providers to adequately safeguard their systems and prevent cyber-attackscyberattacks that could disrupt our operations and result in misappropriation, corruption or loss of confidential and other information. In addition, there is a risk that encryption and other protective measures, despite their sophistication, may be defeated, particularly to the extent that new computing technologies vastly increase the speed and computing power available.22In addition, any significant data security breach of our independent agents or third-party vendors could harm our business and reputation.We may not be able to effectively implement or adapt to changes in technology.Developments in technology are affecting the insurance business. For example, insurance companies are beginning to use artificial intelligence in a number of applications, including risk assessment, claims processing, customer service, fraud detection, and predictive analytics and modeling. We believe that the development and implementation of new technologies will require additional investment of our capital resources in the future, and it is possible that we may not be able to effectively implement or adapt to new technologies. We have not determined the amount of resources and the time that this development and implementation may require, which may result in short-term, unexpected interruptions to our business, or may result in a competitive disadvantage in price and/or efficiency, as we endeavor to develop or implement new technologies.Lack of effectiveness of exclusions and other loss limitation methods in the insurance policies we write or changes in laws and/or potential regulatory approaches relating to them could have a material adverse effect on our financial condition or our results of operations.ManyAll of the policies we issue include exclusions or other conditions that define and limit coverage, whichcoverage. These exclusions and conditions are designed to manage our exposure to certain risk types of risksor risk characteristics and expanding theories of legal liability. In addition, our policies and applicable law limitlimits the time period during which a policyholder may bring a claim under the policy. It is possible that a courtregulatory authority would refuse to approve or regulatory authoritya court could nullify or void an exclusion or limitation or interpret existing coverages more broadly than we anticipate, or that legislation could be enacted modifying or barring the use of these exclusions or limitations.limitations, or that legislation purporting to implement limitations or exclusions will be determined by courts to be ineffective or less effective than anticipated. This could result in higher than anticipated losses and LAE by extending coverage beyond our underwriting intent or increasing the number or size of claims, which could have a material adverse effect on our operating results. In some instances, these changesthe intended effects of approved policy language and court interpretations of the same may not become apparent until sometime after we have issued the insurance policies that are affected by the change.and case law sets a precedent for legal interpretation of them. As a result, the full extent of liability under our insurance contracts may not be known for many years after a policy is issued.Risks Relating to InvestmentsRISKS RELATING TO INVESTMENTSWe are subject to market risk, which may adversely affect investment income.Our primary market risk exposures are changes in equity prices and interest rates. A declinerates, which impact our investment income and returns. Fluctuations in interest rates could expose us to increased financial risk. Declines in market interest rates couldcan have an adverse effect on our investment income asto the extent that we invest cash in new interest-bearing investments that may yield less than our portfolio’sportfolio’s average rate of return. A decline in market interest rates could also lead us toreturn or purchase longer-term or riskier assets in order to obtain adequate investment yields resulting in a duration gap when compared to the duration of liabilities. An increaseConversely, increases in market interest rates could also can have an adverse effect on the value of our investment portfolio by decreasing the fair values of the fixed maturityavailable-for-sale debt securities that comprise a large portion of our investment portfolio. A declineSimilarly, declines in the qualityequities markets adversely affect our existing portfolio. Increases in the equities markets might increase returns on our existing portfolio but reduce the attractiveness of future investments. In addition, high inflation, such as what we are seeing in the current economic environment, could also adversely impact our investment portfolio as a result of adverse economic conditions or otherwise could cause realized losses on securities.Our overall financial performance is dependentdepends in part on the returns on our investment portfolio, which could have a material adverse effect on our financial condition or results of operations or cause such results to be volatile.The performance of our investment portfolio is independent of the revenue and income generated from our insurance operations, and there is typically no direct correlation between the financial results of these two activities. Thus, to the extent that our investment portfolio does not perform well due to the factors discussed above or otherwise, our results of operations may be materially adversely affected even if our insurance operations perform favorably. Further, because the returns on our investment portfolio could be volatile,are subject to market volatility, our overall results of operations could likewise be volatile from period to period even if we do not experience significant financial variances in our insurance operations.3323Risks Relating to the Insurance IndustryRISKS RELATING TO THE INSURANCE INDUSTRYWe are subject to extensive regulation and potential further restrictive regulation may increase our operating costs and limit our growth and profitability.The laws and regulations affecting the insurance industry are complex and subject to change. Compliance with these laws and regulations may increase the costs of running our business and may even slow our ability to respond effectively and quickly to operational opportunities. Moreover, these laws and regulations are administered and enforced by a number of different governmental authorities, including state insurance regulators, the U.S. Department of Justice, and state attorneys general, each of which exercises a degree of interpretive latitude. Consequently, we are also subject to the risk that compliance with any particular regulator’s or enforcement authority’s interpretation of a legal issue may not result in compliance with another’s interpretation of the same issue, particularly when compliance is judged in hindsight. In addition, there is risk that any particular regulator’sregulator’s or enforcement authority’sauthority’s interpretation of a legal issue may change over time to our detriment, or that changes in the overall legal environment may cause us to change our views regarding the actions we need to take from a legal risk management perspective, thus necessitating changes to our practices that may, in some cases, limit our ability to grow and achieve or improve the profitability of our business. We also have been affected by, and in the future may continue to be affected by, decisions or inaction by state legislatures that result in the continuation or worsening of adverse market conditions. Furthermore, in some cases, these laws and regulations are designed to protect or benefit the interests of a specific constituency rather than a range of constituencies. For example, state insurance laws and regulations are generally intended to protect or benefit purchasers or users of insurance products, and not shareholders.shareholders of insurance companies. In many respects, these laws and regulations limit our ability to grow and improve the profitability of our business or effectively respond to changing market conditions, and may place constraints on our ability to meetingmeet our revenue and net profit goals.The Insurance Entities are highly regulated by state insurance authorities in Florida, the state in which is where each is domiciled, and UPCIC isdomiciled. The Insurance Entities are also regulated by state insurance authorities in the other states in which it conductsthey conduct business. Such regulations, among other things, require that certain transactions between the Insurance Entities and their affiliates must be fair and reasonable and require prior notice and non-disapproval of such transactions by the applicable state insurance authority. State regulations also limit the amount of dividends and other payments that can be made by the Insurance Entities without prior regulatory approval and impose restrictions on the amount and type of investments the Insurance Entities may have.make. Other state regulations require insurance companies to file insurance premium rate schedulesrates and policy forms for review, and approval, restrict our ability to cancel or non-renew policies and determine the accounting standards we use in preparation of our consolidated financial statements. These regulations also affect many other aspects of the Insurance Entities’Entities’ businesses. Compliance with applicable laws and regulations is time consuming and personnel-intensive, and changes in these laws and regulations may materially increase our direct and indirect compliance efforts and other expenses of doing business. If the Insurance Entities fail to comply with applicable regulatory requirements, the regulatory agencies can revoke or suspend the Insurance Entities’ licenses, withhold or withdraw required approvals, require corrective action, impose operating limitations, impose penalties and fines or pursue other remedies available under applicable laws and regulations.State insurance regulatory agencies conduct periodic examinations of the Insurance Entities on a wide variety of matters, including policy forms, premium rates, licensing, trade and claims practices, investment standards and practices, statutory capital and surplus requirements, reserve, and loss ratio requirements and transactions among affiliates. Further, the Insurance Entities are required to file quarterly, annual, and other reports with state insurance regulatory agencies relating to financial condition, holding company issues, and other matters. We also are subject to the oversight and jurisdiction of certain other non-insurance regulatory agencies. These agencies typically have the authority to review, examine, or investigate certain aspects of our business related to the laws they administer.Regulatory authorities have relatively broad discretion to deny or revoke licenses for various reasons, including the violation of regulations. If we do not have the requisite licenses and approvals or do not comply with applicable regulatory requirements, insurance regulatory authorities could preclude or temporarily suspend us from carrying on some or all of our activities or otherwise penalize us. This could adversely affect our ability to operate our business.State legislatures and insurance regulators regularly re-examine existing laws and regulations applicable to insurance companies and their products. Changes in these laws and regulations, or in interpretations thereof, can be made for the benefit of the consumer, or for other reasons, at the direct or indirect expense of insurers, and thus could have an adverse effect on our financial condition and results of operations.recent years,other instances, decisions by policymakers to not address adverse market conditions through effective changes to underlying statutes has caused, and in the future might continue to cause, an adverse effect on our financial conditions and results of operations. Changes to state laws and regulations can increase our costs of operations as we strive to interpret and implement them and can create civil and regulatory exposure if we fail to implement them correctly. In addition, many law changes apply only to policies issued or renewed after the laws’ effective dates, and in some cases the laws are subject to legal challenges that further limit or postpone their effectiveness or cause uncertainties in their implementation. Further, experience has shown that when laws or regulations are enacted to address certain perceived problems in the insurance regulatory framework has come under public scrutinymarket, the effectiveness of those laws or regulations can be limited or negated by shifts in behaviors by consumers, vendors and members of Congresstheir representatives. Therefore, law changes that are intended or perceived to have discussed proposalsa beneficial effect on our business might take longer than anticipated to provide for federal chartering of insurance companies. We can make no assurances regarding the potential impact of stateproduce those benefits, might be less effective than anticipated, or federal measures that may change the nature or scope of insurance regulation.24UVE is a holding company and, consequently, its cash flow is dependent on dividends and other permissible payments from its subsidiaries.UVE is a holding company that conducts no insurance operations of its own. All operations are conducted by the Insurance Entities and by other operating subsidiaries, thatmost of which support the business of the Insurance Entities. As a holding company, UVE’sUVE’s sources of cash flow consist primarily of dividends and other permissible payments from its subsidiaries. The ability of our non-insurance company subsidiaries to pay dividends may be adversely affected by reductions in the premiums or number of policies written by the Insurance Entities, by changes in the terms of the parties’parties’ contracts, or by changes in the regulation of insurance holding company systems. UVE depends on such payments for general corporate purposes, for its capital management activities and for payment of any dividends to its common shareholders. The ability of the Insurance Entities to make such payments is limited by applicable law, as set forth in “Item“Item 1—Business—Government Regulation and Initiatives—Regulation—Restrictions on Dividends and Distributions.” For more details on our34““Part II—Item 7—Management’sManagement’s Discussion and Analysis of Financial Condition and Results of Operations—Liquidity and Capital Resources.”Regulations limiting rate changes and requiring us to participate in loss sharing or assessments may decrease our profitability.From time to time, public policy preferences and perceptions affect the insurance market, including insurers’ efforts to effectively maintain rates that allow us to reach targeted levels of rate adequacy and profitability. Despite efforts to address rate needs and other operational issues analytically, facts and history demonstrate that public policymakers, when faced with untoward events and adverse public sentiment, canhave acted and may in the future act in ways that impede our ability to maintain a satisfactory correlation between rates and risk. This has included, and in the future may include, policymakers’ failures to take steps to address the causes of adverse market conditions. Such acts or failures to act may affect our ability to obtain approval for or implement rate changes that may be requiredwe believe are necessary to attain rate adequacy along with targeted levels of profitability and returns on equity. Additionally, because the Insurance Entities often must obtain regulatory approval prior to changing rates, delays in the filing, review or implementation of rate changes can adversely affect our ability to attain rate adequacy. This is especially the case in hard markets such as the current Florida market, where many insurers are submitting filings for significant rate increases and thereby adding to the FLOIR’s workload and affecting its ability to timely review filings. When state regulations allow our Insurance Entities to implement rate changes while filings are pending, we risk having to refund premiums if the implemented changes are greater than those ultimately approved. Our ability to affordpay for reinsurance required to appropriately reduce our catastrophe risk may be dependent upon thealso depends in part on our ability to adjust rates for our cost.Additionally, we are required to participate in guaranty funds for insolvent insurance companies and other statutory insurance entities. The guaranty funds and other statutory entities periodically levy assessments against all applicable insurance companies doing business in the state and the amounts and timing of those assessments are unpredictable. Although we seek to recoup these assessments from our policyholders, we might not be able to fully do so and at any point in time or for any period, our operating results and financial condition could be adversely affected by any of these factors.The amount of statutory capital and surplus that each of the Insurance Entities has and the amount of statutory capital and surplus it must hold can vary and are sensitive to a number of factors outside of our control, including market conditions and the regulatory environment and rules.The Insurance Entities are subject to RBC standards and other minimum capital and surplus requirements imposed under applicable state laws. The RBC standards, based upon the Risk-Based Capital Model Act adopted by the NAIC, require us to report our results of RBC calculations to the FLOIR and the NAIC. These RBC standards provide for different levels of regulatory attention depending upon the ratio of an insurance company’s total adjusted capital, as calculated in accordance with NAIC guidelines, to its authorized control level RBC. Authorized control level RBC is determined using the NAIC’s RBC formula, which measures the minimum amount of capital that an insurance company needs to support its overall business operations.An insurance company with total adjusted capital that (i) is at less than 200% of its authorized control level RBC, or (ii) falls below 300% of its RBC requirement and also fails a trend test, is deemed to be at a “company action level,” which would require the insurance company to file a plan that, among other things, contains proposals of corrective actions the company intends to take that are reasonably expected to result in the elimination of the company action level event. Additional action level events occur when the insurer’s total adjusted capital falls below 150%, 100%, and 70% of its authorized control level RBC. The lower the percentage, the more severe the regulatory response, including, in the event of a mandatory control level event (total adjusted capital falls below 70% of the insurer’s authorized control level RBC), placing the insurance company into receivership.In addition, the Insurance Entities are required to maintain certain minimum capital and surplus and to limit premiums written premiums to specified multiples of capital and surplus. Our Insurance Entities could exceed these ratios if their volume increases faster than anticipated or if their surplus declines due to catastrophe or non-catastrophe losses or excessive underwriting and operational expenses.25Any failure by the Insurance Entities to meet the applicable RBC or minimum statutory capital requirements imposed by the laws of Florida (or other states where we currently or may eventually conduct business) could subject them to further examination or corrective action imposed by state regulators, including limitations on our writing of additional business, state supervision or liquidation,receivership, which could have a material adverse impact on our reputation and financial condition.Any changes in existing RBC requirements, minimum statutory capital requirements, or applicable writings ratios may require us to increase our statutory capital levels, which we may be unable to do, or require us to reduce the amount of premiums we write, which could adversely affect our business and our operating results.RISKS RELATING TO DEBT OBLIGATIONSTo service our debt, we will require a significant amount of cash. Our Insurance Entities are subjectability to examinationgenerate cash depends on many factors.In November 2021, we issued and actions by state insurance departments.The Insurance Entities are subjectsold $100 million of 5.625% Senior Unsecured Notes due 2026 (the “Notes”).extensive regulation in the states in which they do business. State insurance regulatory agencies conduct periodic examinations of the Insurance Entitiesmake payments on a wide variety of matters,or to refinance our indebtedness, including policy forms, premium rates, licensing, trade and claims practices, investment standards and practices, statutory capital and surplus requirements, reserve and loss ratio requirements and transactions among affiliates. Further, the Insurance Entities are required to file quarterly, annual and other reports with state insurance regulatory agencies relating to financial condition, holding company issues and other matters. If an insurance company fails to obtain required licenses or approvals, or if the Insurance Entities fail to comply with other regulatory requirements,35the regulatory agencies can suspend or revoke their licenses, withdraw or withhold required approvals, require corrective action and impose operating limitations, penalties or other remedies available under applicable laws and regulations. See “Item 1—Business—Government Regulation and Initiatives.”Risks Relating to Debt ObligationsAdverse capital and credit market conditions may significantly affect our ability to meet liquidity needs orour obligations under the Notes, and to fund our operations depends on our ability to obtain credit on acceptable terms.The capital and credit markets at times have experienced extreme volatility and disruption. In some cases, the markets have exerted downward pressure on the availability of liquidity and credit capacity. In the event that we need access to additional capital to pay our operating expenses, make payments on our indebtedness, pay for capital expenditures or fund acquisitions, our ability to obtain such capital may be limited and the cost of any such capital may be significant. Our access to additional financinggenerate cash. This will depend on a variety of factors such asour financial and operating performance, which are subject to our loss and loss adjustment experience, weather and climate trends, and general economic, financial, competitive, legislative, regulatory, and capital market conditions the general availability of credit, the overall availability of creditthat are beyond our control. If our cash flows and capital resources are insufficient to fund our debt service obligations, we may be unable to obtain new financing or to fund our obligations to our industry,customers and credit capacity, as well as lenders’ perception ofbusiness partners, implement our long-business plans, sell assets, seek additional capital, or short-term financial prospects. Similarly,restructure or refinance our access to fundsindebtedness, including the Notes. As a result, we may be impaired if regulatory authoritiesunable to meet our obligations under the Notes. In the absence of sufficient capital resources, we could face substantial liquidity problems and might be required to dispose of material assets or rating agencies take negative actions against us. If a combination of these factors wereoperations to occur, our internal sources of liquidity may prove to be insufficient,meet debt service and in such case, weother obligations. We may not be able to successfullyconsummate those dispositions of assets or obtain financing on favorable terms.RISKS RELATING TO OWNERSHIP OF OUR COMMON STOCKThe pricethe proceeds that we could realize from them, and these proceeds may not be adequate to meet any debt service obligations then due, including obligations under the Notes.Our indebtedness could adversely affect our financial results and prevent us from fulfilling our obligations under the Notes.In addition to the currently outstanding indebtedness of our common stockthe Company and its subsidiaries, we may fluctuate significantly, and you could lose all or part of your investment.Volatilityneed to borrow substantial additional amounts in the market price of our common stock may prevent you from being able to sell your shares at or abovefuture, including by accessing the price you paid for them. The market price for our common stock could fluctuate significantly for various reasons, including:our operating and financial performance and prospects;our quarterly or annual earnings or those of other companiescapital markets. If new indebtedness is incurred in our industry;the public’s reactionaddition to our press releases, our other public announcements and our filings withcurrent debt levels, the SEC;changes in, or failure to meet, earnings estimates or recommendations by research analysts who track our common stock orrelated risks that we now face could increase, particularly if the stockcost of other companies in our industry;being targeted by short sellers;failure of research analysts to cover our common stock;general economic, industry and market conditions;strategic actions by us, our customers or our competitors, such as acquisitions or restructurings;new laws or regulations or new interpretations of existing laws or regulations applicable to our business, or other adverse regulatory actions;changes in accounting standards, policies, guidance, interpretations or principles;material litigation or government investigations;changes in general conditionsindebtedness we may incur in the United States and global economies or financial markets, including those resulting from war, incidents of terrorism or responses to such events;negative perceptions of the residential insurance market or the prospects of residential insurers in Florida or other key markets in which we operate;changes in key personnel;36the granting or exercise of employee stock options; andvolume of trading in our common stock.In addition, in recent years, the stock market has regularly experienced significant price and volume fluctuations. This volatility has had a significant impact on the market price of securities issued by many companies, including companies in our industry. The changes frequently appear to occur without regard to the operating performance of the affected companies. Hence, the price of our common stockfuture, could fluctuate based upon factors that have little or nothing to do with us and these fluctuations could materially reduce our share price.Any issuance of preferred stock could make it difficultimportant consequences for another company to acquire us or could otherwise adversely affect holders of our common stock, which could depress the price of our common stock.Our Board of Directors has the authority to issue preferred stock and to determine the preferences, limitations and relative rights of shares of preferred stock and to fix the number of shares constituting any series and the designation of such series, without any further vote or action by our stockholders. Our preferred stock could be issued with voting, liquidation, dividend and other rights superior to the rights of our common stock. The issuance of preferred stock may delay or prevent a change in control of us, discouraging bids for our common stock at a premium over the market price, and adversely affect the market price and the voting and other rights of the holders of our common stock.Future sales of our common stock may depress our stock price.Sales of a substantial number of shares of our common stock in the public market or otherwise, by us or by a major shareholder, could depress the market price of our common stock and impairNotes, including:•limiting our ability to raisesatisfy our obligations with respect to the Notes;•increasing our vulnerability to general adverse economic conditions;•limiting our ability to obtain additional financing to fund future working capital, through the sale of additional equity securities.In addition, we may issue additional sharescapital expenditures, and other general corporate requirements;•requiring a substantial portion of our common stockcash flows from operations for the payment of principal of and interest on our indebtedness and thereby reducing our ability to use our cash flows to fund working capital, capital expenditures, and general corporate requirements;•limiting our flexibility in planning for, or reacting to, changes in our business and the industry; and•putting us at a disadvantage compared to competitors with less indebtedness.ITEM 1B. UNRESOLVED STAFF COMMENTS None.ITEM 1C. CYBERSECURITY The Company recognizes the critical importance of developing, implementing, and maintaining robust cybersecurity measures to safeguard our information systems and protect the confidentiality, integrity, and availability of our data that is created, collected, stored, and used to operate our business.26The Company evaluates cybersecurity risks through its comprehensive Enterprise Risk Management (“ERM”) framework, which is governed by the Risk Committee of the Board and encompasses the spectrum of risks, including cybersecurity risks and threats, that are integral to the Company’s strategic objectives. Cybersecurity risks and threats are managed by a dedicated security team within the Information Technology (“IT”) Department, under the leadership of the Chief Information Officer (“CIO”), who is also a member of the Risk Committee (Executive Director). This team collaborates with various departments across the Company, including legal, compliance, and human resources, to ensure a comprehensive approach to cybersecurity.The Risk Committee provides assurances to management and the Board that the Company has identified, and evaluated key risks and implemented mitigating controls, including the Company’s Incident Management and Information Security Plan, to assess, identify, and manage cybersecurity risks.Risk Management and StrategyThe Company’s process for assessing, identifying, evaluating and managing cybersecurity risks as part of its broader ERM program includes:•Risk Identification and Prioritization: The Company employs various methods to assess and identify cybersecurity risks, which methods may, from time to time, include tabletop exercises to test our preparedness and incident response process, business unit assessments, control gap analyses, threat modeling, impact analyses, internal audits, external audits, penetration tests, and engaging third parties to conduct analyses of our information security program. This process includes evaluating the likelihood and impact of potential cybersecurity incidents.•Continuous Risk Monitoring: The Company actively monitors cybersecurity risks including third-party risk from vendors and suppliers. Significant fluctuations in the futureprevalence or impact of such risks are reported to the Risk Committee on a quarterly basis.•Mitigation Strategies: While continuous backups to a warm failover site are performed, the Company’s Incident Management and Information Security Plan is designed to identify and respond to security incidents and threats in amountsa timely manner to minimize the loss or compromise of information assets and to facilitate incident resolution. In general, our incident response process follows the framework established by the National Institute of Standards and Technology (“NIST”) and focuses on four phases: preparation; detection and analysis; containment, eradication, and recovery; and post-incident remediation. We also conduct mandatory annual cybersecurity training for all employees.Cybersecurity Risks and Business ImpactTo date, the Company has not been subject to cyberattacks that, may be significant. The sale of substantial amounts ofindividually or in the aggregate, have been material to our common stock,operations or the perceptionfinancial condition. We do not believe that these sales may occur, could adverselyrisks from cybersecurity threats are reasonably likely to materially affect our stock price.Asstrategy, results of December 31, 2017, there were 1,325,024 shares issuable uponoperations or financial condition over the exerciselong term. See the discussion of outstanding and exercisable stock options, 1,882,092 shares issuable upon the exercise of outstanding stock options that are unvested and 204,580 additional shares of performance share units outstanding. The market pricecybersecurity risk in Item 1A, “Risk Factors.”GovernanceRole of the common shares may be depressedBoard and Management in Cybersecurity Risk OversightThe Board’s Risk Committee provides oversight of cybersecurity and privacy risks, including overseeing management’s efforts to monitor and mitigate those risks and reviewing with management any significant privacy and cybersecurity incidents and the effectiveness of the Incident Management and Information Security Plan. The CIO and IT Management continuously address key management personnel on relevant cybersecurity issues, which can span a wide range of topics, including but not limited to recent developments, evolving standards, vulnerability assessments, third-party and independent reviews, and the current threat environment.IT DepartmentThe Company has appointed our CIO to establish, implement, and carryout our cybersecurity risk management policies and processes, including the Incident Management and Information Security Plan, and to facilitate the communication of such matters to the Risk Committee and the Board. Our CIO and other IT senior members of management responsible for our cybersecurity program have extensive experience assessing and managing cybersecurity risks. Our CIO and Security Team have over 30 years of experience in information technology and cybersecurity positions.Internal AuditPeriodic audits are performed by our Internal Audit team as part of the Company’s compliance with the Information Security Plan and the overall ERM framework.27Chief Risk OfficerThe ERM structure is further bolstered by the potential exercisesupport of these options or granta dedicated Chief Risk Officer, who provides specialized expertise and oversight in the broader domain of these shares. The holders of these options are likely to exercise them when we would otherwise be able to obtain additional capital on more favorable terms than those provided by the options.risk management.None.company-owned campusgeneral corporate offices located at 1110 West Commercial Boulevard, Fort Lauderdale, Florida 33309 which contains approximately 68,500 square feetand an office building located at 5341 Northwest 33rd Avenue, Fort Lauderdale, Florida 33309.The majority of office space. Theour operations is conducted from these two facilities. We believe that our facilities on our campusand equipment are generally well maintained, in good operating condition and suitable and adequate for our present operations.There are no mortgagesmortgage or lease arrangements for the buildings on our campus and all are adequately covered by insurance.real estate owned property.Lawsuits and other legal proceedings are filed against the Company from time to time. These legal matters include regulatory and contract considerations for which the Company obtains internal or third-party legal or other assistance, such as actuarial services, to provide guidance, and when applicable, to represent and protect the Company’s interest.Many of these lawsuitslegal proceedings involve claims under policies that we underwrite and reserve for as an insurer. We are also involved in various other legal proceedings and litigation unrelated to claims under our policies that arise in the ordinary course of business operations. Management believes that any liabilities that may arise as a result of these legal matters will not have a material adverse effect on our financial condition or results of operations. The Company contests liability and/or the amount of damages as it considers appropriate inaccording to the facts and circumstances of each pending matter.In accordance with applicable accounting guidance, the Company establishes reserves intended to encompass claims-related legal proceedings and establishes an accrued liability for legal matters when those matters present loss contingencies that are both probable and estimable.37Legal proceedings are subject to many uncertain factors that generally cannot be predicted with assurance,certainty, and the Company may be exposed to losses in excess of any amounts accrued. The Company currently estimates that the reasonably possible losses for legal proceedings, whether in excess of a related accrued liability, including reserves, or where there is no accrued liability, and for which the Company is able to estimate a possible loss, are immaterial. This represents management’s estimate of possible loss with respect to these matters and is based on currently available information. These estimates of possible loss do not represent our maximum loss exposure, and actual results may vary significantly from current estimates.Not Applicable3828PARTPART IIITEM 5. Our common stock, par value $0.01 per share, (“Common Stock”), is quotedlisted and traded on the New York Stock Exchange LLC (“NYSE”) under the symbol UVE.The following table sets forth the daily close prices of the Common Stock, as reported by the NYSE:14, 2018,21, 2024, there were 34 registered51 shareholders of record of our Common Stock.As of December 31, 20172023 and 2016,2022, there was one shareholder of our Series A Cumulative Convertible Preferred Stock (“Series A Preferred Stock”). We declared and paid aggregate dividends to this holder of record of the company’s Series A Preferred Stock of $10,000 for each of the years ended December 31, 20172023 and 2016.Applicable provisions of the Delaware General Corporation Law may affect our ability to declare and pay dividends on our Common Stock. In particular, pursuant to the Delaware General Corporation Law, a company may pay dividends out of its surplus, as defined, or out of its net profits, for the fiscal year in which the dividend is declared and/or the preceding year. Surplus is defined in the Delaware General Corporation Law to be the excess of net assets of the company over capital. Capital is defined to be the aggregate par value of shares issued. See “Part I – Restrictions on Dividends and Distributions,” “Item 1A –Risk Factors – Risks Relating to Insurance Industry”, and “Part II, Item 7 – Management’s Discussion and Analysis of Financial Condition and Results of Operations.”39Stock Performance GraphThe following graph comparesand table compare the cumulative total stockholder return of UVE’s Common Stockour common stock from December 31, 20122018 through December 31, 20172023 with the cumulative total return of theperformance of: (i) Standard & Poor’s (“S&P”) 500 Index, (ii) Russell 2000 Index and (iii) S&P Insurance Select Industry Index. TheWe are a constituent of the Russell 2000 Index and the S&P Insurance Select Industry Index. S&P Insurance Select Industry Index consists of all publicly traded insurance underwriters in the property and casualty sector in the United States.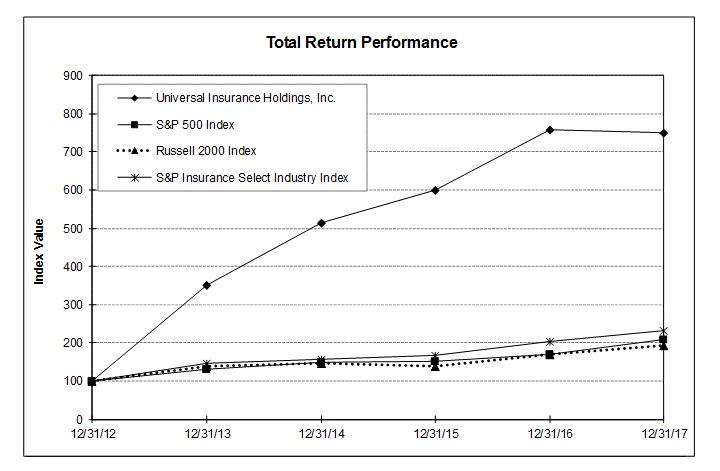

Period Ended Index 12/31/2019 12/31/2020 12/31/2021 12/31/2022 12/31/2023 Universal Insurance Holdings, Inc. $ 75.76 $ 42.81 $ 50.68 $ 33.69 $ 53.28 S&P 500 Index 131.49 155.68 200.37 164.08 207.21 Russell 2000 Index 125.52 150.58 172.90 137.56 160.85 S&P Insurance Select Industry Index 127.65 124.08 152.79 158.63 178.52 29We have generated these comparisons using data supplied by S&P Global Market Intelligence (Centennial, Colorado). The graph assumesand table assume an investment of $100 in UVE’s Common Stockour common stock and in each of the three indices on December 31, 20122018 with all dividends being reinvested on the ex-dividend date. The closing price of UVE’s Common Stock onour common stock as of December 29, 20172023 (the last trading day of the year) was $27.35$15.98 per share. The stock price performance onin the graph isand table are not necessarilyintended to forecast the future performance of our common stock and may not be indicative of future price performance.The stock prices used to calculate total shareholder return for UVE are based upon the prices of our common shares quoted and traded on NYSE.In prior years, we have compared our performance to the SNL Insurance P&C, which includes all publicly traded insurance underwriters in the property and casualty sector in the United States, as well as the NYSE Composite Index. In our Form 10-K for the year ended December 31, 2018, we will no longer use these indices because the indices reflected above are more widely recognized as benchmark indices by the investor community. Additionally, we added the Russell 2000 Index since we are a constituent and it provides an appropriate small and mid-cap benchmark index.40
We believe that the increase in stock price and increase in the total return performance relative to other indices since the first quarter of 2013 is generally attributable to the changes made in the Company’s executive leadership, which has led to an increase in our profitability, as well as to our focus on long-term capital growth and strategic initiatives intended to increase shareholder value such as share repurchases and increasing cash dividends per share over that timeframe. Other contributing factors may include moving to the NYSE, obtaining greater analyst coverage and engaging a leading global investment adviser to manage our investment portfolio, among others.Future Dividend PolicyFuture cash dividend payments are subject to business conditions, our financial position and requirements for working capital and other corporate purposes.Unregistered Salespurposes, as well as to compliance with the applicable provisions of the Delaware General Corporation Law. Subject to these qualifications, we expect to continue our regular practice of paying a comparable quarterly dividend to our stockholders. See “Part I—Business—Government Regulation—Restrictions on Dividends and Distributions” and “Part II—Item 7—Management’s Discussion and Analysis of Financial Condition and Results of Operations.”Registrant Purchases of Equity Securities and UseTotal Number of
Shares PurchasedAverage Price
Paid per Share (1)Total Number of
Shares Purchased
As Part of
Publicly
Announced
Plans or ProgramsMaximum Number
of Shares That
May Yet be
Purchased Under
the Plans or
Programs (2)10/1/2023 - 10/31/2023 — $ — — 558,098 11/1/2023 - 11/30/2023 128,462 $ 16.27 128,462 344,127 12/1/2023 - 12/31/2023 94,925 $ 16.28 94,925 262,123 Total for the three months ended December 31, 2023 223,387 $ 16.28 223,387 262,123 (1)Average price paid per share does not reflect brokerage commissions paid to acquire shares in open market transactions.(2)Number of ProceedsThe table below presents our purchasesshares was calculated using a closing price at December 29, 2023 of UVE Common Stock during the three months ended December 31, 2017.41
$15.98 per share.(1)Average price paid per share does not reflect brokerage commissions paid to acquire shares in open market transactions.(2)Number of shares was calculated using a closing price at December 29, 2017 of $27.35 per share.2017,2023, there were two authorized repurchase plans in effect:were repurchased.June 13, 2016, we announced that theDecember 15, 2022, our Board of Directors authorized a successor share repurchase program under which the Company is authorized to repurchase of up to $20$8.0 million of shares of our outstanding common stock through December 31, 201715, 2024 (the “2017“December 2024 Share Repurchase Program”)pursuant to, which represents the unused portion of those authorized under the predecessor November 2022 Share Repurchase Program. Under the December 2024 Share Repurchase Program, we repurchased 861,296587,126 shares of our common stock at an aggregate cost of approximately $20.0 million. We completed$8.0 million. As of December 31, 2023, all amounts authorized under the 2017December 2024 Share Repurchase Program in December 2017.September 5, 2017,June 12, 2023, our Board of Directors authorized the repurchase of up to $20$20.0 million of our outstanding common stock through December 31, 2018 (the “2018June 10, 2025 (“The June 2025 Share Repurchase Program”). We, pursuant to which we repurchased 8,1921,112,953 shares of our common stock at an aggregate cost of approximately $15.9 million. As of December 31, 2023, we have the ability to purchase up to approximately $4.1 million of our common stock authorized under the 2018June 2025 Share Repurchase ProgramProgram.In total, during the year ended December 31, 2017 at an aggregate cost of approximately $0.2 million.During the year ended December 31, 2017,2023, we repurchased an aggregate of 770,5591,513,644 shares of UVE’sour common stock inpursuant to the open market.42ITEM 6.SELECTED FINANCIAL DATAThe following selected consolidated financial data should be read in conjunction with the consolidated financial statements and notes thereto and “Item 7—Management’s Discussion and Analysis of Financial Condition and Results of Operations” appearing elsewhere in the Annual Report on Form 10-K.The following tables provide selected financial information as of and for the periods presented (in thousands, except per share data):ITEM 6. (1)Other revenue consists of commission revenue, policy fees, and other revenue.(2)The loss and loss adjustment expense ratio is calculated by dividing losses and loss adjustment expenses by premiums earned, net.30(3)The general and administrative expense ratio is calculated by dividing general and administrative expense, excluding interest expense, by premiums earned, net. Interest expense was $348 thousand, $421 thousand, $963 thousand, $1,486 thousand and $1,166 thousand for the years ended December 31, 2017, 2016, 2015, 2014, and 2013, respectively.(4)The combined ratio is the sum of the losses and loss adjustment expense ratio and the general and administrative expense ratio.43The following Management’s Discussion and Analysis of Financial Condition and Results of Operations (“MD&A”) is intended to help the reader understand theassist in an understanding of our financial condition and results of operations and financial condition of UVE. MD&A is provided as a supplement to, and should be read in conjunction with our consolidated financial statements and accompanying notes in Part II,“Item 8—Financial Statements and Supplementary Data” below. Except for the historical information contained herein, the discussions in this MD&A contain forward-looking statements that involve risks and uncertainties. Our future results could differ materially from those discussed herein. Factors that could cause or contribute to such differences include, but are not limited to, those discussed above under “Cautionary Note Regarding Forward-Looking Statements” and “Part I— Item 8 below.OverviewUVE isWe are a vertically integrated holding company offering homeowners insurance to our customers. In addition, we generate revenue from our investment portfolio, reinsurance brokerage services, the largest privatereceipt of managing general agency fees from policy holders, and from other sources of revenue (collectively “Other Revenue Sources”). We develop, market, and underwrite insurance products for consumers predominantly in the personal residential insurance company in Florida by direct written premium in-force, with approximately 10.1% market share ashomeowners lines of September 30, 2017, according to the most recent data reported by the FLOIR. Webusiness and perform substantially all aspects ofinsurance-related services for our Insurance Entities, including risk management, claims management, and distribution. Our Insurance Entities offer insurance underwriting, policy issuance, general administrationproducts through both appointed independent insurance agents and claims processing and settlement internally through our vertically integrated operations. Our wholly-owned licensed insurance subsidiaries, UPCIC and APPCIC,online distribution channel. We currently write personal residential insurance policies predominantly in Florida with $924.0 million in direct written premium for the year ended December 31, 2017. UPCIC also writes residential homeownerssell insurance policies in Alabama, Delaware, Georgia, Hawaii, Indiana, Maryland, Massachusetts, Michigan, Minnesota, New Jersey, New York, North Carolina, Pennsylvania, South Carolina,18 states with Florida representing 81.4% of our direct premiums written, with licenses to write insurance in two additional states. We seek to produce an underwriting profit (defined as earned premium-net minus losses, LAE, policy acquisition costs and Virginiaother operating costs) over the long term, along with $131.9 million in direct written premium for the year ended December 31, 2017, and is licensed to issue policies in Iowa, New Hampshire, and West Virginia. We believe thatgrowing our longevity in the Florida market and our resulting depth of experience will enable us to continue to successfully grow our business in both hard and soft markets.RevenuesWe generate revenuesrevenue primarily from the collection of insurance premiums. The nature of our business tends to be seasonal, reflecting consumer behaviors in connection with the Florida residential real estate market and the hurricane season. The amount of direct written premium tends to increase just prior to the second quarter of our fiscal year and tends to decrease approaching the fourth quarter. Other sources of revenue include: commissions paid by our reinsurers to our reinsurance intermediary subsidiary BARC on reinsurance it places for the Insurance Entities, service revenue from claims handling on ceded claims,Entities; policy fees collected from policyholders by our managing general agent subsidiary, URA,ERA (formerly Universal Risk Advisors, Inc.); and financing fees charged to policyholders who choose to defer premium payments.payments reflected in other income. In addition, our subsidiary Alder receives fees from the Insurance Entities for claims-handling services. The Insurance Entities are reimbursed for these fees on claims that are subject to recovery under the Insurance Entities’ respective reinsurance programs. These fees, after expenses, are recorded in the consolidated financial statements as an adjustment to LAE. We also generate income by investing our assets.Over the past several years, we have grown our business both within Florida and elsewhere in the United States through our distribution network of approximately 8,800 licensed independent agents. Our goals are to profitably grow our business, invest in our vertically integrated structure, expand our independent agent network, and return value to shareholders. Some of our key strategies include increasing our policies in force in Florida through continued profitable and organic growth; expanding into other states to diversify our revenue and risk; optimizing our reinsurance program; and continuing to provide high quality service to our policyholders. We believe each of these strategies has contributed towards an increase in earnings and earnings per share as well as an improvement in our overall financial condition. See “—Results of Operations” below for a discussion of our annual results for 2017 compared to the same period in 2016.Our overall organic growth strategy emphasizes taking prudent measures to increase our footprint, policy count and improve the qualityThe nature of our business rather than merely increasing our market share. Our focus on long-term capital strength and organic growth allows ustends to be selectiveseasonal during the year, reflecting consumer behaviors in connection with the Florida residential real estate market and the hurricane season. The amount of direct premiums written tends to be highest in the risks we accept. Our goal is to write risks that are priced adequatelysecond and meet our underwriting standards. We believe that our strategy of organically expanding our premium growth through our independent agent distribution network and through Universal DirectSM, streamlining claims management and balancing appropriate pricing with disciplined underwriting standards will maximize our profitable growth. We also intend to continue our expansion outside of Florida in markets that allow us to write profitable business and to diversify our revenue and risk. Upon entering new markets, we leverage our existing independent agent network to generate new local relationships and business and we take the time to learn about each new market and any of its unique risks in order to carefully develop our own policy forms, rates and informed underwriting standards. Our expansion efforts differ from manythird quarters of our competitors that have grownfiscal year and lowest in the first and fourth quarters.Trends and Geographical DistributionFlorida TrendsWe are currently working through a cycle to improve long-term rate adequacy and earnings for the Insurance Entities by adjusting rates, managing exposures, and implementing Florida statutory reforms intended to curtail claims-related abuses, while taking advantage of what we believe to be opportunities in a dislocated market. The Florida personal lines homeowners’ market in recent years, primarily through assumptionand continuing currently, can be characterized as a “hard market,” where insurance premium rates have been escalating, insurers have been reducing coverages, and underwriting standards have tightened as insurers closely monitor insurance rates and manage coverage capacity. Due to conditions in the Florida market and factors more generally affecting the U.S. and global reinsurance markets, reinsurance capacity in recent years has also been subject to less favorable pricing and terms. These market forces decrease competition among admitted insurers, and ultimately result in the increased use of policies from Citizens, Florida’s statutorywhich was created to be the State’s residual property insurance market.31In December 2022, the Florida legislature enacted substantial reforms intended to mitigate rising claims costs and resulting premium increases while also enhancing service to policyholders. These laws have required insurers, including the Insurance Entities, to implement faster claims-response standards and to comply with additional regulatory oversight requirements intended to increase consumer protections. The reforms also seek to curtail certain claimants’ abusive claims practices against insurance carriers, which have contributed substantially to the Florida market’s recent problems of escalating claim costs. Among the reforms, the Florida legislature eliminated policyholders’ former one-way statutory right to attorneys’ fees reimbursement and eliminated the ability of policyholders to assign their insurance benefits to third parties. The Florida legislature also reduced the post-loss time period for submitting claims to one year as contrasted with prior laws permitting claims to be reported two years or even three years after loss events, which led to extended solicitations of claims by contractors, public adjusters, and attorneys and challenges for insurers in evaluating the cause and amount of the late-reported claims.The most significant statutory reforms took effect for policies issued after December 16, 2022. Policies written before this date might benefit from procedural changes made by the legislature but remain subject to substantive laws previously in effect. Claims associated with policies issued prior to the reforms typically continue to be adversely impacted by the concerns that have plagued the market in recent years, including disproportionately high incidences of represented and litigated claims. As a result, losses and loss adjustment expenses associated with these claims remain high, exceeding historical patterns in Florida and in other states. Although the Insurance Entities’ number of remaining claims subject to pre-reform laws continues to decline, it will be several years before all of these claims are settled or brought to an adjudicated conclusion. We are optimistic that the legislative reforms will gradually improve the Florida claims environment as the number of claims associated with the pre-reform era continues to decline and more of the Insurance Entities’ claims benefit from the reforms.We seek to achieve rate adequacy for the Insurance Entities, recognizing the effects of the recent Florida claims environment on losses, LAE and expenses, while also taking into account potential benefits associated with the reforms. We have continued to experience increased costs for losses and LAE in the Florida market, where an industry has developed around the solicitation, filing, and litigation of personal residential claims. These dynamics have worsened due to the litigation financing industry, which in some cases funds these actions. In addition, rising inflation, as seen in the cost of labor and material supplies, has further escalated costs associated with the settlement of claims. These conditions and the resulting increases in losses and LAE are chief contributing factors for the rate increases in this market. Adverse actions by public adjusters and lawyers have resulted in a pattern of continued increases in year-over-year levels of represented claims, increases in purported claim amounts, and increased demands for attorneys’ fees. Active solicitation of personal residential claims in Florida by policyholder representatives, remediation companies, and repair companies has led to an increase in the frequency and severity of personal residential claims in Florida, exceeding historical levels and levels seen in other jurisdictions. Information prepared by the FLOIR shows that claims in Florida are litigated at a substantially disproportionate rate when compared to other states. This is largely due to a Florida statute in effect prior to December 16, 2022, providing a one-way right of attorneys’ fees against insurers which has, when coupled with certain other statutes and judicial rulings, produced a legal environment in Florida that encourages litigation, in many cases without regard to the underlying merits of the claims. The one-way right to attorneys’ fees essentially means that unless an insurer’s position is substantially upheld in litigation, the insurer must pay the plaintiff’s attorneys’ fees in addition to its own defense costs. This affects not only pre-reform claims that are litigated to resolution, but also the settlement discussions that take place with nearly all litigated pre-reform claims. This also affects a large number of claims from inception or during the adjusting process as a substantial percentage of policyholders obtain representation early in the process, sometimes even before notifying insurers of their claims. These market conditions also add, and will continue to add, complexity to efforts to efficiently and expeditiously adjust claims. This is due to an increasing number of policyholders who have one or more recent prior losses with the Insurance Entities or with other insurers, which then require evaluation during subsequent claims and determinations regarding whether property has been repaired consistently with the scope and amount of damage previously asserted. The law changes referenced above are intended to curtail the abuses and mitigate the costs associated with represented and litigated claims, assignments of benefits, and late-reported claims. Because many of the reforms apply only to new or renewal policies issued after the effective date of the law change, the impact of the new laws on claims and claims-related costs will not be known for several years. This is especially the case as many of the Insurance Entities’ pre-reform claims that remain open have not been conducive to resolution through the claims adjusting process or efficient alternative dispute resolution methods.Despite our initiatives in implementing law changes and responding to adverse claims behaviors and trends, our costs to settle claims in Florida have increased for the reasons noted herein. For example, the Company continues to adjust its estimate of expected losses and has increased its current year gross loss estimates and increased estimates associated with prior years’ claims when indicated. Over the past four years, even as we have increased our estimates of expected losses each year, we have recorded adverse claim development on prior years’ loss reserves and further strengthened current year losses during the year to address the increasing impact that Florida’s market disruptions had on claim cost trends, especially rising costs from one-way attorneys’ fees as well as the impact of rising costs of building materials and labor. The full extent and duration of these market disruptions on the claim settlement process and inflationary pressures are unknown and still unfolding, and we will monitor the impact of such disruptions on the recording and reporting of claim costs.32The Company has taken a series of steps over time to mitigate the financial impact of these negative trends in the Florida market. We also have closely monitored rate levels, especially in the Florida market, and have submitted rate filings based upon evolving data. However, because rate filings rely upon past loss and expense data and take time to develop, file and implement, we can experience significant delays between identifying needed rate adjustments, filing the associated rate changes, and ultimately collecting and earning the resulting increased premiums. This is particularly the case in an era of rising costs such as the current Florida market, in which the costs of losses and loss adjustment expenses continue to increase due to Florida’s outsized claims litigation environment and inflationary pressure. Similarly, the Company evaluates and periodically adjusts its policy forms in response to market factors and competitive considerations. While policy form changes can be beneficial in the Company’s risk management initiatives, like with rate adjustments, we can experience delays between identifying desired changes, filing and gaining regulatory approval of the changes, and implementing the new forms.The Company also updates its claims-handling procedures over time in response to market trends. The Company has adopted initiatives to adjust and pay straightforward, meritorious claims as promptly as possible to mitigate the adverse impacts that can be seen with claims that remain open for longer periods. The Company also has increasingly used video and other technology to facilitate reviews of damaged property and improve efficiency in the claims process. In addition, we develop in-house expertise, often in the form of dedicated internal units, to respond to certain types of claims such as water damage claims, represented claims, and large-loss claims. The Company additionally has established significant in-house legal services to address the high volume of litigated or represented claims as cost-effectively as possible, as well as a subrogation unit that seeks to mitigate losses for the benefit of policyholders and the Company when damages are caused by third parties.Summary of Recent Rate IncreasesIn November 2022, UPCIC filed a 3.7% rate increase on Florida personal residential homeowners’ line of business, effective February 15, 2023, for new business and April 1, 2023, for renewals.In April 2023, UPCIC submitted and received approval for a rate decrease of 1.4% for Homeowners’, and a rate decrease of 1.6% for Dwelling Fire in the State of Florida, effective July 15, 2023, for new and renewal business. This filing resulted from UPCIC’s statutorily required participation in Florida’s Reinsurance to Assist Policyholders Program (“RAP”). This program is unrelated to the FHCF and allows insurers to access a layer of reinsurance coverage that is below the FHCF industry retention at no cost to the insurer. In exchange the Insurance Entities adopted a corresponding one-year rate reduction. Under current law, the RAP program expires with the reinsurance contract year ending May 31, 2024. Accordingly, the rate decrease that was temporarily implemented in response to the RAP coverage will expire one year from its effective date, on July 15, 2024.In July 2023, UPCIC filed a 7.5% rate increase on Florida personal residential homeowners’ line of business, effective July 17, 2023, for new business and November 4, 2023, for renewal business. Additionally, in October 2023, UPCIC filed a 4.1% rate increase on Florida personal dwelling-fire lines of business, effective January 15, 2024, for both new and renewal business. Both of these rate increases were implemented under file-and-use rating laws and are pending review with regulators.Throughout 2023, the following rate changes for UPCIC have become effective in states other than Florida:•Georgia: +9.8% effective January 10, 2023, for renewal business•Virginia: +7.3% effective February 23, 2023 for new business, and April 14, 2023 for renewal business•Minnesota: +8.0% effective February 23,2023, for new business, and April 29, 2023, for renewal business•Alabama: +9.5% effective February 13, 2023, for new business, and April 4, 2023, for renewal business•Indiana: +6.0% effective March 22, 2023, for new business, and May 11, 2023, for renewal business•Pennsylvania: +5.0% effective June 1, 2023, for new business, and July 21, 2023, for renewal business•New Jersey: +6.7% effective August 21, 2023, for new business, and October 10, 2023, for renewal business•Georgia: +14.8% effective November 21, 2023 for new business, and January 10, 2024, for renewal businessIn addition to this, a file and use rate filing was made in Massachusetts for a rate increase of 11.9% which would become effective November 1, 2023, for new business, and December 21, 2023, for renewal business upon approval.An additional three rate increases were filed in 2023 which are currently pending approval:•South Carolina: +7.8% effective January 16, 2024 for new business, and March 6, 2024 for renewal business•Maryland: +13.3% effective January 22, 2024 for new business, and March 12, 2024, for renewal business•New York: +14.7% effective March 11, 2024, for new business, and April 30, 2024, for renewal business•Indiana: +8.0% effective March 22, 2024 for new business, and May 11, 2024, for renewal businessGeographical Distribution33Direct premiums written continue to increase across in 16 of the 18 states in which we conduct business year-over-year. As a result of our organic growthbusiness strategy, rate changes and disciplined underwriting initiatives, we have seen increasesa decrease in total policy count in 9 out of 19 states, but an increase in in-force premium and total insured value in alla majority of states for overthe past two years. The percentage of our total insured valueDirect premiums written for states outside of Florida increased from 21% as of December 31, 2016 to 26% as of December 31, 2017.15.9%, representing a $49.0 million increase during 2023. Direct premiums written for Florida increased 1.8%, representing a $27.1 million increase during 2023. The following table provides direct premiums written premium for Florida and other states for the years ended December 31, 20172023 and 20162022 (dollars in thousands):For the Years Ended For the Years Ended Growth
Year Over YearDecember 31, 2023 State State Direct Premiums Written % Direct Premiums Written % $ % Florida $ 1,565,197 81.4 81.4 % $ 1,538,143 83.3 83.3 % $ 27,054 1.8 1.8 % Other states 356,636 18.6 18.6 % 307,643 16.7 16.7 % 48,993 15.9 15.9 % Grand total $ 1,921,833 100.0 100.0 % $ 1,845,786 100.0 100.0 % $ 76,047 4.1 4.1 % 44TableWe seek to prudently grow and generate long-term rate adequate premium in each state where we offer policies. Our diversification strategy seeks to increase business outside of ContentsHurricane Irma OverviewHurricane Irma made initial landfallFlorida and to improve geographical distribution within Florida.The geographical distribution of our policies in force, premium in force and total insured value across all states were as follows, as of December 31, 2023, 2022 and 2021 (dollars in thousands, rounded to the nearest thousand):As of December 31, 2023 Policies Premium Total Insured State In Force % In Force % Value % Florida 567,893 70.1 % $ 1,577,210 81.5 % $ 188,516,949 58.3 % North Carolina 56,787 7.0 % 70,170 3.6 % 25,990,577 8.0 % Georgia 31,335 3.9 % 54,315 2.8 % 16,704,678 5.2 % Massachusetts 21,443 2.6 % 33,902 1.8 % 16,702,823 5.2 % Virginia 19,213 2.4 % 25,736 1.3 % 12,788,156 4.0 % New Jersey 18,606 2.3 % 25,712 1.3 % 13,358,747 4.1 % Alabama 16,440 2.0 % 29,589 1.5 % 7,404,975 2.3 % South Carolina 19,201 2.4 % 28,184 1.5 % 8,997,564 2.8 % Indiana 12,584 1.6 % 18,386 1.0 % 5,326,469 1.6 % Minnesota 9,446 1.2 % 19,407 1.0 % 5,613,856 1.7 % Pennsylvania 9,439 1.2 % 12,648 0.7 % 4,965,478 1.5 % Maryland 8,671 1.1 % 9,379 0.4 % 4,431,977 1.4 % New York 7,102 0.9 % 12,359 0.6 % 5,771,055 1.8 % Michigan 4,890 0.6 % 7,641 0.4 % 2,634,991 0.8 % Delaware 2,341 0.2 % 3,330 0.2 % 1,531,896 0.5 % Hawaii 858 0.1 % 1,100 0.1 % 510,735 0.2 % Illinois 2,491 0.3 % 3,720 0.2 % 1,498,349 0.4 % New Hampshire 318 — % 358 — % 230,587 0.1 % Iowa 874 0.1 % 1,222 0.1 % 476,843 0.1 % Total 809,932 100.0 % $ 1,934,368 100.0 % $ 323,456,705 100.0 % 34As of December 31, 2022 Policies Premium Total Insured State In Force % In Force % Value % Florida 615,796 72.5 % $ 1,547,383 83.4 % $ 201,237,145 62.4 % North Carolina 54,988 6.5 % 60,990 3.3 % 23,135,353 7.2 % Georgia 35,174 4.2 % 53,250 2.9 % 17,684,518 5.5 % Massachusetts 18,849 2.2 % 28,729 1.5 % 13,886,783 4.3 % Virginia 20,123 2.4 % 24,622 1.3 % 12,691,444 3.9 % New Jersey 17,965 2.1 % 23,551 1.3 % 12,434,136 3.9 % Alabama 14,218 1.7 % 22,794 1.2 % 6,043,021 1.9 % South Carolina 17,260 2.0 % 20,304 1.1 % 7,344,000 2.3 % Indiana 14,441 1.7 % 18,804 1.0 % 5,885,207 1.8 % Minnesota 9,545 1.1 % 18,100 1.0 % 5,456,394 1.7 % Pennsylvania 11,179 1.3 % 13,700 0.7 % 5,645,993 1.7 % Maryland 6,840 0.8 % 6,642 0.4 % 3,116,236 1.0 % New York 3,897 0.5 % 5,963 0.3 % 2,912,117 0.9 % Michigan 3,497 0.4 % 4,995 0.3 % 1,756,525 0.5 % Delaware 1,939 0.2 % 2,645 0.1 % 1,220,586 0.4 % Hawaii 1,566 0.2 % 1,901 0.1 % 875,158 0.3 % Illinois 1,057 0.1 % 1,435 0.1 % 588,925 0.2 % New Hampshire 350 0.1 % 306 — % 239,970 0.1 % Iowa 172 — % 225 — % 89,629 — % Total 848,856 100.0 % $ 1,856,339 100.0 % $ 322,243,140 100.0 % As of December 31, 2021 Policies Premium Total Insured State In Force % In Force % Value % Florida 695,533 73.7 % $ 1,395,476 83.1 % $ 203,062,948 63.3 % North Carolina 58,644 6.2 % 57,534 3.4 % 22,703,801 7.1 % Georgia 41,097 4.4 % 53,956 3.2 % 19,057,338 5.9 % Massachusetts 16,793 1.8 % 23,790 1.4 % 11,467,490 3.6 % Virginia 23,306 2.5 % 21,069 1.3 % 13,854,648 4.3 % Alabama 14,484 1.5 % 19,966 1.2 % 5,725,381 1.8 % Indiana 17,744 1.9 % 19,018 1.1 % 6,810,107 2.1 % Minnesota 11,934 1.2 % 18,216 1.1 % 6,372,221 2.0 % New Jersey 14,844 1.6 % 18,054 1.1 % 9,523,904 3.0 % South Carolina 17,563 1.8 % 17,976 1.1 % 6,860,210 2.1 % Pennsylvania 13,930 1.5 % 14,688 0.9 % 6,528,352 2.0 % Maryland 6,615 0.7 % 6,003 0.4 % 2,802,756 0.9 % Michigan 3,476 0.4 % 4,572 0.3 % 1,585,940 0.5 % New York 2,808 0.3 % 3,814 0.2 % 1,898,297 0.6 % Delaware 1,819 0.2 % 2,316 0.1 % 1,061,987 0.3 % Hawaii 1,773 0.2 % 1,974 0.1 % 903,844 0.3 % Illinois 786 0.1 % 1,006 — % 409,660 0.1 % New Hampshire 369 — % 301 — % 235,154 0.1 % Iowa 75 — % 92 — % 34,396 — % Total 943,593 100.0 % $ 1,679,821 100.0 % $ 320,898,434 100.0 % 35KEY PERFORMANCE INDICATORSThe Company considers the measures and ratios in the Florida Keysfollowing discussion to be key performance indicators for its businesses. Management believes that these indicators are helpful in understanding the underlying trends in the Company’s businesses. Some of these indicators are reported on September 10, 2017a quarterly basis and others on an annual basis. Please also refer to “Item 8—Note 2 (Summary of Significant Accounting Policies)” for definitions of certain other terms we use when describing our financial results.These indicators may not be comparable to other performance measures used by the Company’s competitors and should only be evaluated together with our consolidated financial statements and accompanying notes.In addition to our key performance indicators and other financial measures presented in accordance with United States Generally Accepted Accounting Principles (“GAAP”), management also uses certain non-GAAP financial measures to evaluate the Company's financial performance and the overall growth in value generated for the Company’s common shareholders. Management believes that non-GAAP financial measures, which may be defined differently by other companies, help to explain the Company’s results to investors in a manner that allows for a more complete understanding of the underlying trends in the Company’s business. The non-GAAP measures should not be viewed as a Category 4 stormsubstitute for those determined in accordance with GAAP. The calculation of these key financial measures including the reconciliation of non-GAAP measures to the nearest GAAP measure are found below under “—Non-GAAP Financial Measures.”Definitions of Key Performance Indicators and GAAP and Non-GAAP MeasuresAdjusted book value per common share― is a non-GAAP measure that is calculated as adjusted common stockholders’ equity divided by common shares outstanding at the end of the period. Management believes this metric is meaningful, as it allows investors to evaluate underlying book value growth by excluding the impact of unrealized gains and losses due to interest rate volatility.Adjusted common stockholders’ equity― is a non-GAAP measure that is calculated by GAAP common stockholders’ equity, excluding accumulated other comprehensive income (loss). Management believes this metric is meaningful, as it allows investors to evaluate underlying growth in stockholders’ equity by excluding the impact of unrealized gains and losses due to interest rate volatility.Adjusted net income (loss) attributable to common stockholders― is a non-GAAP measure that is calculated by GAAP net income (loss) attributable to common stockholders, excluding net realized gains (losses) on investment and net changes in unrealized gains (losses) on investments, net of tax. Management believes this metric is meaningful, as it allows investors to evaluate underlying profitability and enhances comparability across periods, by excluding items that are heavily impacted by investment market fluctuations and other economic factors and are not indicative of operating trends.Adjusted operating income (loss)― is a non-GAAP measure that is computed by GAAP operating income (loss), excluding net realized gains (losses) on investment and net changes in unrealized gains (losses) on investments. Management believes this metric is meaningful, as it allows investors to evaluate underlying profitability and enhances comparability across periods, by excluding items that are heavily impacted by investment market fluctuations and other economic factors and are not indicative of operating trends.Adjusted operating income (loss) margin― is a non-GAAP measure that is computed by adjusted operating income (loss) divided by core revenue. Management believes this metric is meaningful, as it allows investors to evaluate underlying profitability and enhances comparability across periods, by excluding items that are heavily impacted by investment market fluctuations and other economic factors and are not indicative of operating trends.Adjusted return on common equity (Adjusted “ROCE”) ― is a non-GAAP measure, that is calculated by actual or annualized adjusted net income attributable to common stockholders divided by average adjusted common stockholders’ equity, with the Saffir-Simpson Hurricane Scale. Hurricane Irma wasdenominator excluding current period income statement net realized gains (losses) on investments and net changes in unrealized gains (losses) on investments, net of tax. Management believes this metric is meaningful, as it allows investors to evaluate underlying profitability and enhances comparability across periods, by excluding items that are heavily impacted by investment market fluctuations and other economic factors and are not indicative of operating trends.Book Value Per Common Share ― total stockholders’ equity, adjusted for preferred stock liquidation, divided by the number of common shares outstanding as of a reporting period. Book value per common share is the excess of assets over liabilities at a reporting period attributed to each share of stock. Changes in book value per common share informs shareholders of retained equity in the Company on a per share basis which may assist in understanding market value trends for the Company’s stock.Combined Ratio ― the combined ratiois a measure of underwriting profitability for a reporting period and is calculated by dividing total operating costs and expenses (which is made up of losses and LAE and general and administrative expenses) by premiums earned, net, which is net of ceded premiums earned. Changes to the combined ratio over time provide management with an extremely destructive event that causedunderstanding of costs to operate its business in relation to net premiums it is earning and the impact of rate, underwriting and other business management actions on underwriting profitability. A combined ratio below 100% indicates underwriting profit; a wide swathcombined ratio above 100% indicates underwriting losses.36Core Loss Ratio― a common operational metric used in the insurance industry to describe the ratio of damage acrosscurrent accident year expected losses and LAE, excluding current accident year weather events beyond those expected, to premiums earned. Core loss ratio is an important measure identifying profitability trends of premiums in force. Core losses consists of losses and LAE excluding current accident year weather events beyond those expected and prior years’ reserve development. The financial benefit from the entire Florida peninsula and throughoutmanagement of claims, including claim fees ceded to reinsurers, is recorded in the Southeastern United States. Although Hurricane Irma was a devastating catastrophic event, the ultimate netcondensed consolidated financial impact to UVE was substantially limited by both our comprehensive reinsurance program and benefits receivedstatements as a resultreduction to core losses. The core loss ratio can be measured on a direct basis, using direct earned premiums, or on a net basis, using premiums earned, net (i.e., direct premiums earned less ceded premiums earned).Core revenue― is a non-GAAP measure that is calculated by total GAAP revenue, excluding net realized gains (losses) on investments and net changes in unrealized gains (losses) on investments. Management believes this metric is meaningful, as it allows investors to evaluate underlying revenue trends and enhances comparability across periods, by excluding items that are heavily impacted by investment market fluctuations and other economic factors and are not indicative of operating trends.Debt-to-Equity Ratio ― long-term debt divided by stockholders’ equity. This ratio helps management measure the amount of financing leverage in place in relation to equity and future leverage capacity.Debt-to-Total Capital Ratio― long-term debt divided by the sum of total stockholders’ equity and long-term debt (often referred to as total capital resources). This ratio helps management measure the amount of financing leverage in place (long-term debt) in relation to total capital resources and future leverage capacity.Diluted adjusted earnings per common share ― is a non-GAAP measure that is calculated by adjusted net income available to common stockholders divided by weighted average diluted common shares outstanding. Management believes this metric is meaningful, as it allows investors to evaluate underlying revenue trends and enhances comparability across periods, by excluding items that are heavily impacted by investment market fluctuations and other economic factors and are not indicative of operating trends.Direct Premiums Written (“DPW”) ― reflects the total value of policies issued during a periodbefore considering premiums ceded to reinsurers. Direct premiums written, comprised of renewal premiums, endorsements, and new business, is initially recorded as unearned premium in the balance sheet which is then earned pro-rata over the next year or remaining policy term. Direct premiums written reflects current trends in the Company’s sale of property and casualty insurance products and amounts that will be recognized as earned premiums in the future.DPW (Florida) ― includes only DPW in the state of Florida. This measure allows management to analyze growth in our vertically integrated structureprimary market and is also a measure of business concentration risk.Expense Ratio (Including Policy Acquisition Cost Ratio and Other Operating Cost Ratio) ― calculated as discussed below.initialexpense ratio, including the sub-expense ratios of policy acquisition cost ratio and other operating cost ratio, are indicators to management of the Company’s cost efficiency in acquiring and servicing its business and the impact of expense items to overall profitability.Losses and Loss Adjustment Expense Ratio or Loss and LAE Ratio ― a measure of the cost of claims and claim settlement expenses incurred in a reporting period as a percentage of premiums earned in that same reporting period. Losses and LAE incurred in a reporting period includes both amounts related to the current accident year and prior accident years, if any, referred to as development. Ultimate losses and LAE are based on actuarial estimates with changes in those estimates recognized in the period the estimates are revised. Losses and LAE consist of claim costs arising from claims occurring and settling in the current period, an estimate of claim costs for reported but unpaid claims, an estimate of unpaid claim costs for incurred-but-not-reported claims and an estimate of claim settlement expenses associated with reported and unreported claims which occurred during the reporting period. The loss and LAE ratio can be measured on a direct basis, which includes losses and LAE divided by direct earned premiums, or on a net basis, which includes losses and LAE after amounts have been ceded to reinsurers divided by net earned premiums (i.e., direct premium earned less ceded premium earned). The net loss and LAE reportedratio is a measure of underwriting profitability after giving consideration to the effect of reinsurance. Trends in the net loss and LAE ratio are an indication to management of current and future profitability.Monthly Weighted Average Renewal Retention Rate ― measures the monthly average of policyholders that renew their policies over the period of a calendar year. This measure allows management to assess customer retention.Premiums Earned, Net ― the pro-rata portion of current and previously written premiums that the Company recognizes as earned premium during the reporting period, net of ceded premium earned. Ceded premiums are premiums paid or payable by the Company for reinsurance protection. Written premiums are considered earned and are recognized pro-rata over the policy coverage period. Premiums earned, net is a measure that allows management to identify revenue trends.Policies in Force ― represents the number of active policies with coverage in effect as of the end of the reporting period. The change in the thirdnumber of policies in force is a growth measure and provides management with an indication of progress toward achieving strategic objectives. Inherent seasonality in our business makes this measure more useful when comparing each quarter’s balance to the same quarter in prior years.37Premium in Force ― is the amount of 2017 relatedthe annual direct written premiums previously recorded by the Company for policies which are still active as of the reporting date. This measure assists management in measuring the level of insured exposure and progress toward meeting revenue goals for the current year, and provides an indication of business available for renewal in the next 12 months. Inherent seasonality in our business makes this measure more useful when comparing each quarter’s balance to Hurricane Irma was $37.0 million. In the fourthsame quarter in prior years.Return on Average Common Equity (“ROCE”) ― calculated by actual net income (loss) attributable to common stockholders divided by average common stockholders’ equity. ROCE is a capital profitability measure of how efficiently management creates profits.Total Insured Value ― represents the amount of insurance limits available on a policy for a single loss based on all policies active as of the reporting date.This measure assists management in measuring the level of insured exposure.Unearned Premiums― represents the portion of direct premiums corresponding to the time period remaining on an insurance policy and available for future earning by the Company. Trends in unearned premiums generally indicate expansion, if growing, or contraction, if reducing, which are important indicators to management. Inherent seasonality in our business makes this amount loweredmeasure more useful when comparing each quarter’s balance to $27.8 million by favorable revisions to cededthe same quarter in prior years.Weather events― an estimate of losses and LAE of $9.2 million to reflect recoveries related to our Other States Reinsurance Program (as further discussed below). Additionally, our service company subsidiaries generated substantial additional revenues following Hurricane Irma that led to approximately $35.0 million of estimated pretax profit generated by service company subsidiariesfrom weather events occurring during the fourth quartercurrent accident year that exceed initial estimates of 2017. In total,expected weather events when establishing the core loss ratio for each accident year. This metric informs management of factors impacting overall current year profitability.REINSURANCEReinsurance enables our Insurance Entities to limit potential exposures to catastrophic events. Reinsurance contracts are typically classified as treaty or facultative contracts. Treaty reinsurance provides coverage for all or a portion of a specified group or class of risks ceded by the year ended December 31, 2017,primary insurer, while facultative reinsurance provides coverage for specific individual risks. Within each classification, reinsurance can be further classified as quota share or excess of loss. Quota-share reinsurance is where the Company estimates that profit attributable to increased service revenues exceededprimary insurer and the Company’s net retained losses attributable to Hurricane Irma by approximately $7.2 million on a pretax basis.The discussion below provides additional commentary surrounding the various effects of Hurricane Irma on the Company’s financial results.Comprehensive Reinsurance ProgramOur comprehensive reinsurance program substantially limited the net losses from Hurricane Irma, as gross losses and LAE were contained well within the limits of our catastrophe reinsurance program, and certain aspects of our program served to reduce our overall net retention.During the quarter ended September 30, 2017, the Company recorded gross losses and loss adjustment expenses of $452.0 million resulting from Hurricane Irma, reflecting gross losses and LAE of $450.0 million at UPCIC and $2.0 million at APPCIC. The Company’s reinsurance protection performed as expected, reducing exposure to the maximum retention limits, limiting net losses and loss adjustment expenses from Hurricane Irma to $37.0 million. Under the Company’s reinsurance program, UPCIC cedes losses and LAE greater than $35.0 million in all states up to a maximum of $2.78 billion, while APPCIC cedes losses and LAE greater than $2.0 million up to a maximum amount of $28.1 million.During the quarter ended December 31, 2017, the Company revised its estimated gross losses and loss adjustment expenses to $446.7 million, reflecting gross losses and LAE of $444.7 million at UPCIC and $2.0 million at APPCIC. This revision to gross losses at UPCIC was to account for claims experience during the fourth quarter, and we note that as of February 9, 2018, the Company has received 68,634 claims relating to Hurricane Irma, of which 57,799,reinsurer share proportionally or approximately 84%, have already been closed. As discussed above, the Company’s reinsurance program limited net losses and loss adjustment expenses from Hurricane Irma to $37 million. Because gross losses and LAE in states outside of Florida are projected to be $12.8 million (which is above our $5.0 million Non-Florida retention) additional recoveries from our Other States Reinsurance Program during the fourth quarter served to reduce UPCIC’s aggregate retention from $35.0 million to $27.2 million. After adding in APPCIC’s net retention of $2.0 million, this resulted in a total net retention of losses and loss adjustment expenses of $29.2 million related to Hurricane Irma for the year ended December 31, 2017.Additionally, the Company experienced approximately $2.4 million of gross losses and loss adjustment expenses related to hailstorms in Minnesota that occurred in June 2017. As a result of Hurricane Irma satisfying an otherwise recoverable provision within our Other States Reinsurance Program, the Company’s retention in states outside of Florida was reduced to $1.0 million from $5.0 million. This resulted in an effective savings of $1.4 million recordedpro-rata in the fourth quarter of 2017 on the Minnesota hailstorm events, as the Company retained only the first $1.0 million ofdirect premiums and losses on the event. Through May 31, 2018, our Other States Reinsurance Program will continue to have a net retention of $1.0 million as a result of the otherwise recoverable provision having been satisfied.See “—2017/2018 Reinsurance Program” belowinsurer. Excess-of-loss reinsurance indemnifies the direct insurer or reinsurer for all or a more detailed discussionportion of the Company’s reinsurance program.Vertically Integrated StructureAs previously described, due to our vertically integrated structure, the Company retains certain revenues and/loss in excess of an agreed upon amount or fees that are paid to our subsidiary service companies for various services provided, including reinsurance brokerage, claims adjusting and other services. This benefit is particularly notable during large catastrophic events such as Hurricane Irma, which result in a substantial number of claims by our policyholders, leading to increased activity at our service company subsidiaries. This higher activity led to an increase in service income that helped to reduce the effect that Hurricane Irma had on our consolidated financial statements.45During a major storm such as Hurricane Irma when losses exceed our net retention, claims service costs are passed on to our reinsurance partners, who reimburse the Insurance Entities for losses and loss adjustment expenses that were incurred relating to losses above the Company’s net retention. These reimbursements for loss adjustment expenses benefit the Company’s service entities by providing incremental revenue which is funded by the reinsurers, resulting in incremental profits to the service entities. The billing for services between the Company’s service companies and Insurance Entities is based on “arm’s length” market rates and approved by our regulator, the FLOIR.As a result of Hurricane Irma, the quarter and year ended December 31, 2017 included the benefit of additional net revenues within our service provider subsidiaries, particularly UAC and BARC, which led to a higher level of profitability than would otherwise be the case in a quarter or year with more typical service activity. In aggregate, the Company estimates that these additional revenues at service company subsidiaries resulted in approximately $35.0 million of net pretax benefit during the fourth quarter and full year 2017. This benefit related primarily to two factors: (1) as a result of the increased level of claims following Hurricane Irma, UAC, which manages our claims processing and adjustment functions, experienced a significant increase in net revenues and net profit in the months following the storm, and (2) Commission Revenue included a benefit of approximately $2.0 million related to reinstatement premium commissions received by BARC.Other FactorsIn addition to the items discussed above, Hurricane Irma resulted in various other effects on our ongoing business, in particular with respect to premium writings and policy fee income. We experienced an increased level of premium volume, including an increase in both new and renewal business, as well as a corresponding increase in policy fee income, during both the quarter ending September 30, 2017 and the quarter ending December 31, 2017.Several days after Hurricane Irma made landfall, the FLOIR issued an emergency order that temporarily suspended policy cancellations and nonrenewals by insurance companies. Specifically, the order barred insurance companies from cancelling or non-renewing policies between September 4, 2017 and October 15, 2017; barred the cancellation or nonrenewal of policies covering residential properties damaged by Hurricane Irma until at least 90 days after the properties are repaired; and required that any cancellations or nonrenewals issued or mailed from August 25, 2017 through September 3, 2017 were withdrawn and reissued no earlier than October 15, 2017. The effect of the emergency order, coupled with policyholders’ increased attention to maintaining coverage prior to and following the hurricane, resulted in increased levels of premium and policy fee volume as compared to both the prior year and our internal expectations.In addition, the emergency order extended the time periods applicable to certain actions, including reviews of rate filings. This resulted in an extension of the review period for our previously submitted Florida rate filing (which was for an average statewide increase of 3.4%). We initially anticipated that the FLOIR’s review of our rate filing would be completed in September 2017, but as a result of Hurricane Irma and the corresponding emergency order, the rates were approved in early December 2017. We began using the newly approved rates on December 7, 2017 for new business and on January 26, 2018 for renewal business.The Tax Cuts and Jobs Act of 2017 (“the Tax Act”)On December 22, 2017, the Tax Cuts and Jobs Act of 2017 (“the Tax Act”) was enacted, thereby significantly changing the Internal Revenue Code. Notable changes include a reduction in the federal corporate tax rate from 35.0% to 21.0% effective January 1, 2018. The Tax Act's impact on the Company in 2017 was a non-cash charge to earnings for the re-measurement of deferred taxes. Although the Company anticipates an overall benefit from the reduction of lower tax rates in 2018, we are unable to make definitive estimates on the impact of the reduction, due to the final impact of the Act being subject to changes in interpretations, assumptions, and additional guidance that may be issued by the Internal Revenue Service. See “Item 8—Note 12 (Income Taxes).”2017 Highlights•Direct premiums written overall grew $101.3 million, or 10.6%, to $1,055.9 million, compared year-over-year to 2016.Net earned premiums grew by $56.4 million, or 8.9%, to $688.8 million, compared year-over-year to 2016.Total revenues increased by $66.6 million, or 9.7%, to $751.9 million, compared year-over-year to 2016.Although Hurricane Irma caused substantial losses, our vertically integrated structure and comprehensive reinsurance program substantially limited the overall financial impact from this damaging storm.46Net income increased by $7.5 million, or 7.6%, to $106.9 million, compared year-over-year to 2016.Diluted EPS increased by $0.20 to $2.99 per common share, compared year-over-year to 2016.Declared and paid dividends per common share of $0.69, including a $0.13 special dividend in December 2017.Repurchased approximately 771,000 shares in 2017 at an aggregate cost of $18.1 million.•Offered Universal DirectSM in all 16 states in which the Company writes policies as of December 31, 2017.UPCIC received a Certificate of Authority from Illinois and Iowa.UPCIC commenced writing homeowners policies in New Jersey and New York.UPCIC received regulatory approval for and implemented an overall 3.4% rate increase in Florida.2017 – 2018 Reinsurance Programusour balance sheet and Insurance Entities in the event of one or more catastrophes while maintaining efficient reinsurance costs has been a key focusstrategic priority for us. In order to limit the Insurance Entities’ potential exposure to catastrophic events, we purchase significant reinsurance from third-party reinsurers and the FHCF. The FLOIR requires the Insurance Entities, like all residential property insurance companies doing business in Florida, to have a certain amount of capital and reinsurance coverage in order to cover losses upon the occurrence of a single catastrophic event and a series of catastrophic events occurring in the same hurricane season. The Insurance Entities’ respective 2023-2024 reinsurance programs meet the FLOIR’s requirements, which are based on, among other things, successfully demonstrating cohesive and comprehensive reinsurance programs that protect the policyholders of our leadership team. Insurance Entities as well as satisfying a series of stress test catastrophe loss scenarios based on past historical events. Similarly, the Insurance Entities’ respective 2023-2024 reinsurance programs meet the stress test and review requirements of Demotech, Inc., for maintaining Financial Stability Ratings® of A (Exceptional) and of Kroll for maintaining insurer financial strength ratings of “A-”.We believe that ourthe Insurance Entities’ retentions under their respective reinsurance program isprograms are appropriate and structured such that if we were to experience an active hurricane season likeprotect policyholders. We test the hurricane seasons in 2017, 2016, 2005 and 2004 we are able to pay policyholder claims, maintain sufficient surplus to grow profitably and take advantagesufficiency of the resulting market dislocation that could potentially follow. reinsurance programs by subjecting the Insurance Entities’ personal residential exposures to statistical testing using a third-party hurricane model, RMS RiskLink v18.1 (Build 1945). This model combines simulations of the natural occurrence patterns and characteristics of hurricanes, tornadoes, earthquakes and other catastrophes with information on property values, construction types and occupancy classes. The model outputs provide information concerning the potential for large losses before they occur, so companies can prepare for their financial impact. Furthermore, as part of our operational excellence initiatives, we continually look to enable new technology to refine our data intelligence on catastrophe risk modeling.Effective June 1, 2017, we2023, the Insurance Entities entered into multiple reinsurance agreements comprising our 2017-20182023-2024 reinsurance program. See “Item 8—1—Note 4 (Reinsurance).”UPCIC/APPCIC 2023-2024 All States Reinsurance GenerallyWe use reinsuranceProgram•First event All States retention of $45 million.•All States first event tower extends to reduce our exposure to catastrophic losses primarily through excess of loss reinsurance. We believe that the overall terms$2.61 billion with no co-participation in any of the 2017-2018layers, no limitation on loss adjustment expenses for the non-catastrophe bond Cosaint Re Pte. Ltd. traditional reinsurance program are more favorable than the 2016-2017 and 2015-2016 reinsurance program. We eliminated our quota share reinsurance arrangements effective June 1, 2015; purchased additional excess of loss catastrophe cover; converted the exposure of all UPCIC states from a two-tower reinsurance program to a single tower reinsurance program; purchased a stand-alone non-Florida supplemental catastrophe reinsurance program; realized cost reductions in part due to market conditions and our preparation and efforts to manage risk exposure; and further enhanced our reinsurance coverage terms and conditions.We believe that restructuring our reinsurance program and re-evaluating that structure on an ongoing basis has allowed us to take advantage of attractive reinsurance pricing, while still maintaining reinsurance coverage that we believe is sufficient to protect our policyholders and shareholders. While we believe the changes to the current reinsurance program are beneficial, there can be no assurance that our actual results of operations or financial condition will be positively affected. The Insurance Entities remain responsible for insured losses notwithstanding the failure of any reinsurer to make payments otherwise due to the Insurance Entities. Below is a description of our 2017-2018 reinsurance program for each of the Insurance Entities.UPCIC Reinsurance ProgramUPCIC’s reinsurance program, which runs from June 1 through May 31 of the following year, consists of various forms of catastrophe coverage. Under the 2017-2018 reinsurance program, UPCIC has a net retention of $35 million per catastrophe event for all losses incurred up toaccelerated deposit premiums.•Assuming a first event losscompletely exhausts the $2.61 billion tower, the second event exhaustion point would be $912 million.38•Full reinstatement available on $867 million of $2.778 billion. UPCIC also purchasesnon-FHCF and non-RAP first event catastrophe coverage for guaranteed second event coverage. For all layers purchased between $45 million and the RAP layer, to the extent that all of our coverage or a separate supplemental underlying cover to further reduce its retention for all losses occurringportion thereof is exhausted in states outside of Florida. With this cover, UPCIC retains only $5 million under its program in its non-Florida states. In certain circumstances involving a catastrophic event affecting both Florida and other states, UPCIC’s retention could result in pre-tax net liability as low as $5 million –reinstatement premium is due, we have purchased enough reinstatement premium protection ("RPP") limit to pay the $35 million net retention underpremium necessary for the all states reinsurance program could be offset by as much as $30 million in coverage under the Other States (non-Florida) Reinsurance Program. These retention amounts are grossreinstatement of any potential tax benefit we would receive in paying such losses. UPCIC has mandatory catastrophe coverage through the FHCF plus voluntary catastrophe coverage with private reinsurers.UPCIC structures its reinsurance coverage into layers and utilizesthese coverages or have secured a cascading feature such that thespecific second third, fourth, fifth and sixth reinsurance layers all attach at $90 million. Any layers above the $90 million attachment point are excessevent contract.•First event layer of loss over the immediately preceding layer. If the aggregate limit100% of the preceding layer is exhausted, the next layer cascades down in its place for future events. Further, UPCIC buys four dedicated limits of $55$66 million in excess of $35$45 million established by Universal in captive insurance arrangement. While the Company retains the risk that otherwise would be transferred to third-party reinsurers for this layer, the additional risk is substantially offset by the savings in premiums that would otherwise have been paid to third-party reinsurers.•Specific 2nd event private market excess of loss coverage of $66 million in excess of $45 million sitting behind captive arrangement.•Specific 3rd and 4th event private market catastrophe excess of loss coverage of $86 million in excess of $25 million provides frequency protection for multiple events during the treaty period including a $20 million reduction in retention for a 3rd and 4th event.•For the FHCF Reimbursement Contracts effective June 1, 2023, both UPCIC and APPCIC have continued the election of the 90% coverage level. We estimate the total mandatory FHCF layer will provide approximately $1.316 billion of coverage for UPCIC, which insures to the benefit of the open market coverage secured from private reinsurers and Cosaint Re Pte. Ltd (covers UPCIC only) and we estimate the total mandatory FHCF layer will provide approximately $22.5 million of coverage for APPCIC, which insures to the benefit of the open market coverage secured from private reinsurers.•For the participation in the RAP program for the first four2023-2024 period, we estimate the total RAP layer will provide approximately $202.8 million of coverage for UPCIC and $3.5 million of coverage for APPCIC, both of which inure to the benefit of the open market coverage secured from private reinsurers.•To further insulate future years, UPCIC has secured $277 million of catastrophe events. This means47that, unless losses exhaust the top layer of our coverage, we are exposed to only $35$150 million in losses, pre-tax, per catastrophe for each of the first four events.The estimated total net cost of UPCIC’s FHCFthis year’s program and catastrophe related coverage, including reinstatement premium protection coverage, is $315.9 million. The largest private participants in UPCIC’s program include Allianz Risk Transfer, Axis Specialty Limited, Everest Reinsurance, Renaissance Reinsurance, Chubb Tempest Reinsurance various Lloyd’s of London syndicates,its third and FHCF. final year.ReinsurersThe table below provides the A.M. Best and S&P financial strength ratings for each of the largest rated third-party reinsurers in UPCIC’s 2017-20182023-2024 reinsurance program.program:Reinsurer Allianz Risk TransferN/A A+AA-Axis Specialty LimitedA+A+Everest Reinsurance CompanyA+A+Renaissance ReA+AA-Chubb Tempest ReA++AAA AFlorida Hurricane Catastrophe FundA+ -AA- DaVinci Reinsurance Ltd. A A+ Renaissance Reinsurance Ltd. A+ A+ Chubb Tempest Reinsurance Ltd. A++ AA Allianz Risk Transfer AG. Bermuda Branch A+ AA Markel Bermuda Ltd. A A (1)No rating is available, because the fund is not rated.The cost of the 2023-2024 all states reinsurance programs for UPCIC and APPCIC is projected to be $620.6 million, prior to any potential reinstatement premiums due, and represents approximately 31.97% of projected direct premium earned for the 12-month treaty period.SELECTED FINANCIAL DATA The following selected historical consolidated financial data should be read in conjunction with our consolidated financial statements and notes thereto and “Item 7—Management’s Discussion and Analysis of Financial Condition and Results of39Operations” set forth elsewhere in the Annual Report on Form 10-K. The historical results are not necessarily indicative of the results to be expected in any future period.The following tables present historical selected consolidated financial data of Universal Insurance Holdings, Inc. and Subsidiaries for the five years ended December 31, 2023 (in thousands, except per share data):Years Ended December 31, 2023 2022 2021 2020 2019 Statement of Income Data: Revenues: Direct premiums written $ 1,921,833 $ 1,845,786 $ 1,671,252 $ 1,517,479 $ 1,292,721 Change in unearned premium (46,704) (86,085) (74,634) (121,856) (59,600) Direct premium earned 1,875,129 1,759,701 1,596,618 1,395,623 1,233,121 Ceded premium earned (623,193) (631,075) (561,155) (472,060) (390,619) Premiums earned, net 1,251,936 1,128,626 1,035,463 923,563 842,502 Net investment income (1) 48,449 25,785 12,535 20,393 30,743 Other revenue (2) 80,380 81,044 71,993 65,437 55,633 Total revenues 1,391,582 1,222,658 1,121,851 1,072,770 939,351 Costs and expenses: Losses and loss adjustment expenses 992,636 938,399 779,205 758,810 603,406 Policy acquisition costs 208,011 214,259 226,167 199,102 177,530 Other operating costs 96,055 90,638 87,428 90,532 94,655 Total expenses 1,296,702 1,243,296 1,092,800 1,048,444 875,591 Interest and amortization of debt issuance costs 6,531 6,609 638 95 243 Income (loss) before income tax expense (benefit) 88,349 (27,247) 28,413 24,231 63,517 Income tax expense (benefit) 21,526 (4,990) 8,006 5,126 17,003 Net income (loss) $ 66,823 $ (22,257) $ 20,407 $ 19,105 $ 46,514 Per Share Data: Basic earnings (loss) per common share $ 2.24 $ (0.72) $ 0.65 $ 0.60 $ 1.37 Diluted earnings (loss) per common share $ 2.22 $ (0.72) $ 0.65 $ 0.60 $ 1.36 Dividends declared per common share $ 0.77 $ 0.77 $ 0.77 $ 0.77 $ 0.77 As of December 31, 2023 2022 2021 2020 2019 Balance Sheet Data: Total invested assets $ 1,160,784 $ 1,105,806 $ 1,093,680 $ 919,924 $ 914,586 Cash and cash equivalents 397,306 388,706 250,508 167,156 182,109 Total assets 2,316,561 2,890,154 2,056,141 1,758,741 1,719,852 Unpaid losses and loss adjustment expenses 510,117 1,038,790 346,216 322,465 267,760 Unearned premiums 990,559 943,854 857,769 783,135 661,279 Long-term debt (3) 102,006 102,769 103,676 8,456 9,926 Total liabilities 1,975,264 2,602,258 1,626,439 1,309,479 1,225,951 Total stockholders’ equity $ 341,297 $ 287,896 $ 429,702 $ 449,262 $ 493,901 Shares outstanding end of period 28,966 30,389 31,221 31,137 32,638 Book value per share $ 11.78 $ 9.47 $ 13.76 $ 14.43 $ 15.13 Return on average common equity (ROCE) 21.2 % (6.2) % 4.6 % 4.1 % 9.2 % Selected Data: Loss and loss adjustment expense ratio (4) 79.3 % 83.2 % 75.3 % 82.1 % 71.6 % General and administrative expense ratio (5) 24.3 % 27.0 % 30.2 % 31.4 % 32.3 % Combined Ratio (6) 103.6 % 110.2 % 105.5 % 113.5 % 103.9 % (1)Net investment income excludes net realized gains (losses) on sale of investments and net change in unrealized gains (losses) on investments.(2)Other revenue consists of commission revenue, policy fees, and other revenue.40(3)For the year ended December 31, 2023 and 2022, long-term debt includes a private placement of $100 million of 5.625% Senior Unsecured Notes due 2026. See “Part II—Item 8—Note 7 (Long-term debt).”(4)The loss and loss adjustment expense ratio is calculated by dividing losses and loss adjustment expenses by premiums earned, net.(5)The general and administrative expense ratio is calculated by dividing general and administrative expense by premiums earned, net.(6)The combined ratio is the sum of the losses and loss adjustment expense ratio and the general and administrative expense ratio.41RESULTS OF OPERATIONS AND ANALYSIS OF FINANCIAL CONDITION2023 Financial and Business Highlights (comparisons are to 2022 unless otherwise specified)•Rate filings and automatic policy inflation adjustments to policy insured values are increasing written and earned premium as the new rates and property insured values take effect on policy renewals and new business, and earn prospectively over the policy period.•Management is continuing its efforts to prudently manage new business risk selection, improve risk exposure diversification, while rate increases are taking effect to improve profitability. As a result of management’s efforts to manage exposures, the number of total policies in force has been decreasing. Offsetting the impact of lower policies in force are increases in written and earned premiums driven by rate increases and inflation increases to insured values.•UPCIC filed with its regulators in Hawaii to withdraw from the state. There were 858 policies in Hawaii as of December 31, 2023. The withdrawal and nonrenewal of policies in Hawaii are expected to be completed within the next year.•UPCIC filed its initial rate filing in Wisconsin (a new expansion state in 2023), which was subsequently approved.•Costs for the 2023 reinsurance were lower than 2022 because of Florida’s RAP program as well as existing multi-year reinsurance agreements previously placed in the 2023-2024 reinsurance program. RAP is a one-time, no-cost reinsurance benefit to the Insurance Entities which in exchange provided a rate decrease to policyholders of approximately 1.4%. The lower reinsurance costs, effective June 1 2023, have a favorable effect on financial ratios which are based on net earned premium.•The Insurance Entities concluded a mandatory commutation with the FHCF relating to the 2017/18 contract year, which covered Hurricane Irma. Additionally, commutations with certain other reinsurers were concluded during the year, which the Insurance Entities deemed were in their best interests.•Net investment income increased as cash and maturing interest earning investments are redeployed into higher interest rate investments.•For the year ended December 31, 2023, the net loss ratio declined to 79.3% from 83.2% due to the absence of major hurricane events in 2023 when compared to Hurricane Ian in 2022, offset by higher prior year development in 2023 including reserve strengthening of pre-reform losses. See “Overview—Trends and Geographical Distribution—Florida Trends” above and “Losses and Loss Adjustment Expenses” below.•General and administrative expenses have declined year-over-year, including a decline in the expense ratio, as a result of management’s efforts in this area. Over the past two years, commissions paid on renewal policies in Florida have been reduced to 8% from 10%. The rollout to this new lower commission rate was concluded in May 2023. The benefit of lower commission rates is realized over 12 months as policies are renewed under the lower commission rate structure. Further reducing the expense ratio was continued net earned premium growth.•The Company continued to return shareholder value with quarterly dividends and share repurchases. Also, during the year, the Company approved a new share repurchase plan permitting share repurchases not to exceed $20.0 million during the period between June 12, 2023, until June 10, 2025. The Company’s current share repurchase authorization program has $4.1 million remaining.•The Company entered into a June 30, 2023 committed, unsecured $40.0 million (previously $37.5 million) revolving credit line with JP Morgan Chase. As of December 31, 2023, the Company has not borrowed any amount under this revolving loan.•All three rating agencies, Kroll (A- stable), Demotech (A rating) and Egan-Jones (A rating), updated and affirmed their previous ratings.42All comparisons for the year ended December 31, 2023 results of operations are to the corresponding prior year period (unless otherwise specified).YEAR ENDED DECEMBER 31, 2023 COMPARED TO YEAR ENDED DECEMBER 31, 2022Net income was $66.8 million for the year ended December 31, 2023, compared to a net loss of $22.3 million for the year ended December 31, 2022. Benefiting the year ended December 31, 2023 were increases in premiums earned, net, an increase in net investment income, the change in unrealized gains in the current year compared to unrealized losses in the prior year, offset by an increase in losses and loss adjustment expenses, net. In 2023, direct premium earned and premiums earned, net were up 6.6% and 10.9%, respectively compared to direct premium earned and premiums earned in 2022, due to premium growth in the majority of states in which we are licensed and writing during the past 12 months as a result of rate increases implemented during 2022 and 2023, in addition to an increase in policies in force in 11 states. Premiums earned, net, were favorably impacted by a decrease in reinsurance expenses for the 2023-2024 contract year primarily due to the Insurance Entities’ mandatory participation in Florida’s RAP program, which allowed insurers to access a layer of reinsurance coverage below the FHCF industry retention at no cost to the insurers. The lower reinsurance costs, effective June 1 2023, have a favorable effect on financial ratios which are based on net earned premium. For the year ended December 31, 2023, the loss ratio declined to 79.3% from 83.2% in 2022 due to the absence of major hurricane events in 2023 when compared to Hurricane Ian in 2022, offset by higher prior year development in 2023. See 2023 Reinsurance ProgramAPPCIC’sRatio Benefit noted below. As a result of the above and as further explained below, the combined ratio for the year ended December 31, 2023 was 103.6% compared to 110.2% for the year ended December 31, 2022. See “Overview—Trends and Geographical Distribution—Florida Trends” regarding our response to the Florida market.A detailed discussion of our results of operations follows the table below (in thousands, except per share data).(in thousands) Years Ended December 31, Change 2023 2022 $ % REVENUES Direct premiums written $ 1,921,833 $ 1,845,786 $ 76,047 4.1 % Change in unearned premium (46,704) (86,085) 39,381 (45.7) % Direct premium earned 1,875,129 1,759,701 115,428 6.6 % Ceded premium earned (623,193) (631,075) 7,882 (1.2) % Premiums earned, net 1,251,936 1,128,626 123,310 10.9 % Net investment income 48,449 25,785 22,664 87.9 % Net realized gains (losses) on investments (1,229) 348 (1,577) NM Net change in unrealized gains (losses) on investments 12,046 (13,145) 25,191 NM Commission revenue 54,058 53,168 890 1.7 % Policy fees 18,881 20,182 (1,301) (6.4) % Other revenue 7,441 7,694 (253) (3.3) % Total revenues 1,391,582 1,222,658 168,924 13.8 % OPERATING COSTS AND EXPENSES Losses and loss adjustment expenses 992,636 938,399 54,237 5.8 % General and administrative expenses 304,066 304,897 (831) (0.3) % Total operating costs and expenses 1,296,702 1,243,296 53,406 4.3 % Interest and amortization of debt issuance costs 6,531 6,609 (78) (1.2) % INCOME (LOSS) BEFORE INCOME TAX EXPENSE (BENEFIT) 88,349 (27,247) 115,596 NM Income tax expense (benefit) 21,526 (4,990) 26,516 NM NET INCOME (LOSS) $ 66,823 $ (22,257) $ 89,080 NM Other comprehensive income (loss), net of taxes 29,610 (88,214) 117,824 NM COMPREHENSIVE INCOME (LOSS) $ 96,433 $ (110,471) $ 206,904 NM DILUTED EARNINGS (LOSS) PER SHARE DATA: Diluted earnings (loss) per common share $ 2.22 $ (0.72) $ 2.94 NM Weighted average diluted common shares outstanding 30,147 30,751 (604) (2.0) % NM - Not Meaningful 43RevenuesDirect premiums written increased by $76.0 million, or 4.1%, for the year ended December 31, 2023, driven by premium growth within our Florida business of $27.1 million, or 1.8%, and premium growth in our other states business of $49.0 million, or 15.9%, as compared to the prior year. Rate increases approved in 2022 and 2023 for Florida and for certain other states and policy inflation adjustments were the principal driver of higher written premiums, in addition to an increase in policies in force in 11 other states. In total, policies in force declined 38,924, or 4.6%, from 848,856 at December 31, 2022 to 809,932 at December 31, 2023. A summary of the recent rate increases which are driving increases in written premium is discussed above under “Overview—Trends and Geographical Distribution—Florida Trends.”Rate changes are applied on new business submissions and renewals from the effective date of their renewal, and then are earned subsequently over the policy period. The recent rate and inflation increases in Florida are in response to rising claim costs driven by higher costs of material and labor associated with claims, the cost of weather events, the rising cost of catastrophe and other reinsurance protecting policyholders and, more importantly, the impact of an increased cost and use of litigation by policyholders on claims as claim settlements increasingly have involved inflated demands, representation, and litigation. In addition, the Insurance Entities’ policies provide for coverage limits to be adjusted at renewal to adjust insured value coverage limits for the impact of changes in inflation. This is based on third-party industry data sources that monitor inflation factors such as changes in costs for residential building materials and labor.During 2023, management continued efforts to tactically manage policy counts and exposures intended to slow the growth of exposures relating to new business compared to prior years while filed rate increases are taking effect. The impact of policy reductions through attrition attributable to selective underwriting, together with selected policy non-renewals, have resulted in a decrease in policies in force of 38,924, or 4.6%, during 2023 from 848,856 at December 31, 2022 to 809,932 at December 31, 2023. Direct premiums written continue to increase across the majority of states in which we conduct business. As a result of our business strategy, rate changes and disciplined underwriting initiatives, we have seen an overall decrease in policies in force in the aggregate, but an increase in premium in force, and an increase in total insured value in a majority of states for the past two years. We actively wrote policies in 18 states during 2023 and 19 states during 2022. In addition, we are authorized to do business in Tennessee and Wisconsin. In 2023, UPCIC filed with its regulators in Hawaii to withdraw from the state, with the withdrawal and nonrenewal of policies expected to be completed within the next year. At December 31, 2023, policies in force decreased by 38,924 policies, or 4.6%, premium in force increased $78.0 million, or 4.2%, and total insured value increased $1.2 billion, or 0.4%, compared to December 31, 2022.Direct premium earned increased by $115.4 million, or 6.6%, for the year ended December 31, 2023, reflecting the earning of premiums written over the past 12 months, including the benefit of rate changes due to primary rate filings, filings to cover increased reinsurance costs as well as policy premium adjustments due to increases in insured values caused by inflation.ReinsuranceReinsurance enables our Insurance Entities to limit potential exposures to catastrophic events and other covered events. Ceded premium represents premiums paid to reinsurers for this protection and is a cost which reduces net written and net earned premiums. Hurricane Ian triggered reinstatement premiums, increasing ceded premiums written by $24.6 million which were earned prospectively effective September 28, 2022 to May 31, 2023, increasing ceded premiums earned for the year ended December 31, 2023 by $15.0 million, in addition to $2.2 million of reinstatement premiums in December 2023 which were also attributable to Hurricane Ian, and which were earned immediately. In total, ceded premium earned decreased $7.9 million, or 1.2%, for the year ended December 31, 2023 as compared to the same period of the prior year. The decrease in reinsurance cost reflects several factors, including the Insurance Entities’ mandatory participation in the RAP program for the 2023/2024 reinsurance program, which allowed insurers to access a layer of reinsurance coverage that is below the FHCF industry retention at no cost to the insurer. In exchange, the Insurance Entities adopted a 1.4% one-year rate reduction. Also benefiting the year were lower reinstatement premiums in the second half of the year. Reinsurance costs, as a percentage of direct premium earned, decreased from 35.9% in 2022 to 33.2% in 2023. Reinsurance costs associated with each year’s reinsurance program are earned over the annual policy period which typically runs from June 1st to May 31st. See the discussion above for the Insurance Entities’ 2022-2023 reinsurance programs and “Part II—Item 8— Note 4 (Reinsurance).”2023 Reinsurance Ratio BenefitCosts for the 2023 reinsurance was lower than 2022 because of Florida’s RAP program in the 2023-2024 reinsurance program. This is a one time, no cost reinsurance benefit to the Insurance Entities which in exchange provided a rate decrease to policyholders of approximately 1.4%. The lower reinsurance costs, effective June 1 2023, have a favorable effect on financial ratios which are based on net earned premium.Premiums earned, net of ceded premium earned, grew by 10.9%, or $123.3 million, to $1,251.9 million for the year ended December 31, 2023, reflecting an increase in direct premium earned and decreased costs for reinsurance.Investment ResultsNet investment income was $48.4 million for the year ended December 31, 2023, compared to $25.8 million for the same period in 2022, an increase of $22.7 million, or 87.9%. Invested cash balances along with liquidity generated by our investment portfolio from maturities, principal repayments, and interest payments received were invested in higher rates, resulting in an increase in investment returns on our portfolio and cash balances.44We look to optimize our investment portfolio on a rolling basis, which, from time-to-time, results in portfolio shaping opportunities. During the year ended December 31, 2023, sales of available-for-sale debt securities and sales of equity securities resulted in a net realized loss of $1.2 million.There was a $12.0 million net unrealized gain on investments during the year ended December 31, 2023, largely driven by our portfolio optimization efforts in the private and public equity markets, coupled with the overall domestic equity market appreciation tailwind during 2023, compared to a $13.1 million net unrealized loss on investments during the year ended December 31, 2022.Total invested assets were $1.16 billion as of December 31, 2023 compared to $1.11 billion as of December 31, 2022. The increase is primarily attributable to unrealized gains on our fixed income and equity portfolio, and increases in net investment income. Cash and cash equivalents were $397.3 million at December 31, 2023 compared to $388.7 million at December 31, 2022, an increase of 2.2%. See below “—Analysis of Financial Condition” for more information. Cash and cash equivalents are invested short-term until needed to settle loss and LAE payments, reinsurance premium payments, and operating cash needs or until they are deployed by our investment advisors.Commissions, Policy Fees and Other RevenueCommission revenue is comprised principally of brokerage commissions we earn from traditional open market third-party reinsurers, which excludes reinsurance provided by the State of Florida as well as catastrophe bond participants. Commission revenue is earned pro-rata over the reinsurance policy period which runs from June 1st to May 31st of the following year. For the year ended December 31, 2023, commission revenue was $54.1 million, compared to $53.2 million for the year ended December 31, 2022. The increase in commission revenue of $0.9 million, or 1.7%, for the year ended December 31, 2023 was primarily due to reinstatement premiums attributable to Hurricane Ian which were earned through May 31, 2023, or the conclusion of the 2022-2023 reinsurance contract period.Policy fees for the year ended December 31, 2023 were $18.9 million compared to $20.2 million for the same period in 2022. The decrease of $1.3 million, or 6.4%, was the result of a decrease in the combined total number of new and renewal policies written during the year ended December 31, 2023 compared to the same period in 2022 in states where we are permitted to charge this fee.Other revenue, representing revenue from policy installment fees, premium financing, and other miscellaneous income, was $7.4 million for the year ended December 31, 2023 compared to $7.7 million for the same period in 2022.Non-GAAPCore revenue, representing total GAAP revenue, excluding net realized gains (losses) on investments and net changes in unrealized gains (losses) on investments, was $1.4 billion for the year ended December 31, 2023 compared to $1.2 billion for the same period in 2022.Operating Costs and ExpensesLosses and Loss Adjustment ExpensesLosses and LAE experience over the past several years including both 2023 and 2022, reflects an adverse litigation environment and other market conditions in Florida that the Florida Legislature has been attempting to address with the passage of legislation spanning several years with the most significant changes made during a special session held in December 2022.Losses and LAE, net of reinsurance recoveries was $992.6 million for the year ended December 31, 2023, resulting in a net loss ratio of 79.3%, compared to $938.4 million, and 83.2%, respectively, for the year ended December 31, 2022. For the year ended December 31, 2023, the decline in loss ratio was primarily due to the absence of major hurricane events in 2023, in contrast to 2022 which saw Hurricane Ian make landfall on Florida’s gulf coast, offset by higher prior year development in 2023. See 2023 Reinsurance Ratio Benefit noted above.Prior year development includes changes in previous estimates for unpaid Losses and LAE for all events occurring in prior years including hurricanes, other weather, and non-weather claims affected by pre-reform market conditions in Florida as well as changes in prior estimates resulting from the evaluation of claims in anticipation of the commutation of Hurricane Irma losses with the FHCF. In recent years, we have strengthened reserves as a result of adverse development due to Florida homeowners, tenants and condo owners coverages arising from non-weather and weather events. Similar to other carriers operating in the Florida homeowners marketplace, we have experienced deterioration in water and hurricane claims due to an unfavorable claims environment characterized by increases in policyholder demands related to roof repairs and significant attorney representation. In 2023, adverse development was due to represented and litigated claims, and Florida weather claims for accident years 2017 and later. One of management’s objectives in 2023 was to strengthen reserves on those prior period claims which do not benefit from the new legislation signed in late 2022 that eliminated the one-way attorneys’ fee statute and assignments of benefits and made other reforms intended to improve the Florida market. Prior year development was $110.6 million, or 8.8 net loss ratio points for the year ended December 31, 2023, compared to $25.0 million for 2022, or 2.2 net loss ratio points. We continue to see adverse claim trends on Florida losses which occurred prior to the effective date of recent legislation (December 16, 2022) introduced in Florida, which was intended to curtail the impact of certain abusive claims45practices, however prior years claims not covered by the new legislation continued to experience adverse development, as claims settled above previously estimated amounts.We believe the legislation passed in late 2022 represents a positive step towards reducing claim costs in Florida and management is optimistic about its eventual benefits. However, the full transition to these new laws will take many years. Many of the reforms apply only prospectively and provide only marginal benefit for claims filed prior to the new laws’ effective date. The transition to the new laws therefore involves first renewing policies during the year following the effective date, such that the policies, and subsequent claims under those policies, are governed by the new requirements. As for prior policy periods, insurers must continue to adjust claims under the prior laws that were subject to abuse while awaiting the expiration of claim reporting periods and statute of limitations periods applicable to those policies. Therefore, it will be several years until the abusive claim practices permitted under the prior laws, including those resulting from requiring insurance companies to pay claimants’ litigation costs, are fully extinguished and the full benefit of the new legislation can be realized. See “Overview—Trends and Geographical Distribution—Florida Trends.”Excluding prior year development recorded in 2023, for prior accident years, all other losses and LAE, net for the current accident year are estimated to be $882.1 million or 70.5 net loss ratio points for the year ended December 31, 2023, compared to $802.4 million, or 71.1 net loss ratio points in 2022. See 2023 ratio benefit noted above. This category also reflects savings from activities performed by affiliates within our holding company system on behalf of our Insurance Entities and our reinsurers when losses and LAE are ceded under our reinsurance contracts. When claims are adjusted by our claims team and files handled by our legal group in this litigious environment in Florida, there are synergies achieved by having these two functions within the same consolidated group that could not be achieved through third parties. This synergistic relationship results in more efficient handling and coordination of claims including represented claims handled by our legal group of close to 500 employees. By choosing not to outsource these activities, we also save money for the consolidated group by generating a potential financial benefit outside of the Insurance Entities that serves to reduce LAE at the consolidated level (contra LAE). During 2023 these claims related activities generated a financial benefit of $50.4 million compared to $62.4 million during 2022General and Administrative ExpensesFor the year ended December 31, 2023, general and administrative expenses were $304.1 million, compared to $304.9 million during the same period in 2022, as follows (dollars in thousands):For the Years Ended December 31, Change 2023 2022 $ % $ Ratio $ Ratio Premiums earned, net $ 1,251,936 $ 1,128,626 $ 123,310 10.9 % General and administrative expenses: Policy acquisition costs 208,011 16.6 % 214,259 19.0 % (6,248) (2.9) % Other operating costs 96,055 7.7 % 90,638 8.0 % 5,417 6.0 % Total general and administrative expenses $ 304,066 24.3 % $ 304,897 27.0 % $ (831) (0.3) % General and administrative expenses decreased by $0.8 million, which was the result of decreases in policy acquisition costs of $6.2 million offset by an increase in other operating costs of $5.4 million. The total general and administrative expense ratio was 24.3% for the year ended December 31, 2023 compared to 27.0% for the year ended December 31, 2022.•The decrease in policy acquisition costs of $6.2 million was primarily attributable to an increase in reinsurance profit commissions which were received as a result of commutations with reinsurers concluded during the year and lower total commissions expense for the year offset by slightly higher premium taxes.•The increase in other operating costs of $5.4 million primarily reflects an increase in salaries, performance bonuses, and stock based compensation and an increase in other miscellaneous operating expenses. The other operating cost ratio was 7.7% for the year ended December 31, 2023 compared to 8.0% in the year ended December 31, 2022. This reduction primarily reflects the increase in premiums earned, net for the year.As a result of the above, the combined ratio for the year ended December 31, 2023was 103.6%compared to 110.2% for the same period in 2022. The decrease was due to the absence of a hurricane in the current year compared to Hurricane Ian in 2022, in addition to an increase in premiums earned, net, offset by higher prior year development.46Interest and Amortization of Debt Issuance CostsInterest and amortization of debt issuance costs for the year ended December 31, 2023 was $6.5 million compared to $6.6 million for the same period in 2022.Income Tax Expense (Benefit)Income tax expense was $21.5 million for the year ended December 31, 2023, compared to income tax benefit of $(5.0) million for the year ended December 31, 2022. Our effective tax rate (“ETR”) increased to 24.4% for the year ended December 31, 2023, as compared to 18.3% for the year ended December 31, 2022. See “Part II—Item 8—Note 12 (Income Taxes)” for a table of items reconciling statutory rates to the effective rate for years 2023 and 2022.Comprehensive Income (Loss)Other comprehensive income, net of taxes for the year ended December 31, 2023 was $29.6 million compared to other comprehensive loss of $88.2 million for the same period in 2022, reflecting after-tax changes in fair value of available-for-sale debt securities held in our investment portfolio and reclassifications out of accumulated other comprehensive income for available-for-sale debt securities sold. The improvement in 2023 reflects investment actions and relative stability in market prices during 2023 compared to 2022. During 2023, maturing securities and investment returns were reinvested at market rates, reducing unrealized losses on maturing securities. The maturity of the remaining securities in an unrealized loss position has also reduced during the year. Over time, unrealized losses on securities in an unrealized loss position lessens as the remaining maturity shortens and securities approach their maturity or par value. See discussion above and “Part II—Item 8—Note 14 (Other Comprehensive Income (Loss))” for additional information about the amounts comprising other comprehensive income (loss), net of taxes for these periods.Non-GAAPAdjusted operating income (loss) represents GAAP operating income (loss), excluding net realized gains (losses) on investments and net changes in unrealized gains (losses) on investments. Adjusted operating income was $84.1 million for the year ended December 31, 2023 compared to adjusted operating income of $7.8 million for the same period in 2022.Adjusted operating income (loss) margin represents adjusted operating income (loss) divided by core revenue. Adjusted operating income margin was 6.1% for the year ended December 31, 2023 compared to adjusted operating loss margin of 0.6% for the same period in 2022.Adjusted net income (loss) attributable to common stockholders represents GAAP net income (loss) attributable to common stockholders, excluding net realized gains (losses) on investments and net changes in unrealized gains (losses) on investments, net of tax. Adjusted net income attributable to common stockholders was $58.7 million for the year ended December 31, 2023 compared to adjusted net loss attributable to common stockholders of $12.6 million for the same period in 2022.Diluted adjusted earnings (loss) per common share represents adjusted net income (loss) available to common stockholders divided by weighted average diluted common shares outstanding. Diluted adjusted income per common share was $1.95 for the year ended December 31, 2023 compared to diluted adjusted loss per common share of $0.41 for the same period in 2022.47YEAR ENDED DECEMBER 31, 2022 COMPARED TO YEAR ENDED DECEMBER 31, 2021Net loss was $22.3 million for the year ended December 31, 2022, due primarily to the $111 million net loss and LAE from Hurricane Ian, compared to net income of $20.4 million for the same period in 2021. Benefiting the year ended December 31, 2022 were increases in premiums earned, net, an increase in net investment income, an increase in commission revenue, and a decrease in acquisition costs offset by an increase in unrealized losses, a decrease in realized gains, a decrease in revenue from policy fees, and an increase in losses and loss adjustment expenses. Direct premium earned and premiums earned, net were up 10.2% and 9.0%, respectively, due to premium growth in the majority of states in which we are licensed and writing during the past 12 months as a result of rate increases implemented during 2021 and 2022, partially offset by higher costs for reinsurance flowing through to premiums earned, net. Renewal commissions to agents were lowered to 8% from 10% during 2022 resulting in lower acquisition costs compared to the prior year. The net loss and LAE ratio was 83.2% for the year ended December 31, 2022, compared to 75.3% for the year ended 2021 reflecting the impact of Hurricane Ian, and higher core net losses, an increase in the cost of litigated claims, and increased other weather losses compared to the prior year, partially offset by lower prior years’ reserve development. As a result of the above and as further explained below, the combined ratio for the year ended December 31, 2022 was 110.2% compared to 105.5% for the year ended December 31, 2021. See “Overview—Trends and Geographical Distribution—Florida Trends” regarding our response to the Florida market.A detailed discussion of our results of operations follows the table below (in thousands, except per share data).Years Ended December 31, Change 2022 2021 $ % REVENUES Direct premiums written $ 1,845,786 $ 1,671,252 $ 174,534 10.4 % Change in unearned premium (86,085) (74,634) (11,451) 15.3 % Direct premium earned 1,759,701 1,596,618 163,083 10.2 % Ceded premium earned (631,075) (561,155) (69,920) 12.5 % Premiums earned, net 1,128,626 1,035,463 93,163 9.0 % Net investment income 25,785 12,535 13,250 105.7 % Net realized gains (losses) on investments 348 5,892 (5,544) (94.1) % Net change in unrealized gains (losses) on investments (13,145) (4,032) (9,113) 226.0 % Commission revenue 53,168 41,649 11,519 27.7 % Policy fees 20,182 22,713 (2,531) (11.1) % Other revenue 7,694 7,631 63 0.8 % Total revenues 1,222,658 1,121,851 100,807 9.0 % OPERATING COSTS AND EXPENSES Losses and loss adjustment expenses 938,399 779,205 159,194 20.4 % General and administrative expenses 304,897 313,595 (8,698) (2.8) % Total operating costs and expenses 1,243,296 1,092,800 150,496 13.8 % Interest and amortization of debt issuance costs 6,609 638 5,971 935.9 % INCOME (LOSS) BEFORE INCOME TAX EXPENSE (27,247) 28,413 (55,660) NM Income tax expense (4,990) 8,006 (12,996) NM NET INCOME (LOSS) $ (22,257) $ 20,407 $ (42,664) NM Other comprehensive income (loss), net of taxes (88,214) (18,911) (69,303) 366.5 % COMPREHENSIVE INCOME (LOSS) $ (110,471) $ 1,496 $ (111,967) NM DILUTED EARNINGS PER SHARE DATA: Diluted earnings per common share $ (0.72) $ 0.65 $ (1.37) NM Weighted average diluted common shares outstanding 30,751 31,307 (556) (1.8) % NM - Not Meaningful 48RevenuesDirect premiums written increased by $174.5 million, or 10.4%, for the year ended December 31, 2022, driven by premium growth within our Florida business of $149.8 million, or 10.8%, and premium growth in our other states business of $24.7 million, or 8.7%, as compared to the same period of the prior year. Rate increases approved in 2021 and 2022 for Florida and for certain other states and policy inflation adjustments were the principal driver of higher written premiums. In total, policies in force declined 94,737, or 10.0%, from 943,593 at December 31, 2021 to 848,856 at December 31, 2022. A summary of the recent rate increases which are driving increases in written premium is discussed above under “Overview—Trends and Geographical Distribution—Florida Trends.”Rate changes are applied on new business submissions and renewals from the effective date of their renewal, and then are earned subsequently over the policy period. The recent rate and inflation increases in Florida are in response to rising claim costs driven by higher costs of material and labor associated with claims, the cost of weather events, the rising cost of catastrophe, and other reinsurance protecting policyholders and, more importantly, the impact of an increased use of litigation by policyholders on claims as claim settlements increasingly have involved inflated demands, representation, and litigation. In addition, the Insurance Entities’ policies provide for coverage limits to be adjusted at renewal to adjust insured value coverage limits for the impact of changes in inflation. This is based on third-party industry data sources that monitor inflation factors such as changes in costs for residential building materials and labor.During 2022, management continued efforts to prudently manage policy counts and exposures intended to slow the growth of exposures relating to new business compared to prior years while filed rate increases are taking effect. Reduced new business writings, declines in renewal retentions in 2022 and the impact of selected policy non-renewals have resulted in a decrease in policies in force of 94,737, or 10.0%, during 2022 from 943,593 at December 31, 2021 to 848,856 at December 31, 2022. Direct premiums written continue to increase across the majority of states in which we conduct business. As a result of our business strategy, rate changes, and disciplined underwriting initiatives, we have seen a decrease in policies in force, but an increase in premium in force and an increase in total insured value in a majority of states for the past two years. We actively wrote policies in 19 states during 2022 and 2021. In addition, we are authorized to do business in Tennessee and Wisconsin and are proceeding with product filings in those states. At December 31, 2022, policies in force decreased by 94,737 policies, or 10.0%, premium in force increased $176.5 million, or 10.5%, and total insured value increased $1.3 billion, or 0.4%, compared to December 31, 2021.Direct premium earned increased by $163.1 million, or 10.2%, for the year ended December 31, 2022, reflecting the earning of premiums written over the past 12 months, including the benefit of rate changes due to primary rate filings, filings to cover increased reinsurance costs as well as policy premium adjustments due to increases in insured values caused by inflation.Reinsurance enables our Insurance Entities to limit potential exposures to catastrophic events and other covered events. Ceded premium represents premiums paid to reinsurers for this protection and is a cost which reduces net written and net earned premiums. Hurricane Ian triggered reinstatement premiums, increasing ceded premiums written by $24.6 million which were earned prospectively effective September 28, 2022 to May 31, 2023, increasing ceded premiums earned for the year ended December 31, 2022 by $9.5 million. In total, ceded premium earned increased $69.9 million, or 12.5%, for the year ended December 31, 2022 as compared to the same period of the prior year. The increase in reinsurance costs reflects an increase in the value of exposures we insure; increased pricing when compared to the expired reinsurance program and differences in the structure and design of the respective programs. Reinsurance costs, as a percentage of direct premium earned, increased from 35.1% in 2021 to 35.9% in 2022. Reinsurance costs associated with each year’s reinsurance program are earned over the annual policy period which typically runs from June 1st to May 31st. See the discussion above for the Insurance Entities’ 2022-2023 reinsurance programs and “Part II—Item 8— Note 4 (Reinsurance).”Premiums earned, net of ceded premium earned, grew by 9.0%, or $93.2 million, to $1.1 billion for the year ended December 31, 2022, reflecting an increase in direct premium earned offset by increased costs for reinsurance.Net investment income was $25.8 million for the year ended December 31, 2022, compared to $12.5 million for the same period in 2021, an increase of $13.3 million, or 105.7%. 2022 saw significant increases in fixed income investment yields as the Federal Reserve took actions to address the market concerns of inflation and full employment. As a result, liquidity generated by our portfolio from maturities, principal repayments, interest payments, and new deposits were invested at higher rates, resulting in an increase in investment returns on our portfolio.Total invested assets were $1.11 billion as of December 31, 2022 compared to $1.09 billion as of December 31, 2021. The increase is primarily attributable to new cash deposits, offset by increased unrealized losses on our portfolio due to a decline in bond prices, which move inversely with the rate increases seen throughout 2022. Unrealized losses reverse over time as debt instruments are generally held to maturity. Cash and cash equivalents were $388.7 million at December 31, 2022 compared to $250.5 million at December 31, 2021, an increase of 55.2%. This increase is largely attributable to cash calls to reinsurers to support Hurricane Ian claim settlement liquidity and changes in operational cash flows since year end. See below “—Analysis of Financial Condition” for more information. Cash and cash equivalents are invested short-term until needed to settle loss and LAE payments, reinsurance premium payments and operating cash needs or until they are deployed by our investment advisors.Yields from cash and cash equivalents, short-term investments, and the available-for-sale debt portfolio are dependent on the composition of the portfolio, future market forces, monetary policy, and interest rate policy from the Federal Reserve. During most of 2021, the Federal Reserve broadly maintained lower interest rates, which impacted the effective yields on newly purchased available-for-sale debt securities and overnight cash purchases and short-term investments. This overall trend changed in late 2021, and throughout 2022, as inflation worries began to impact the financial markets, including the markets’ concern over future Federal Reserve actions of rate hikes and other actions to address inflation concerns. As a result, we saw49increased yields on securities purchased in late 2021, and throughout 2022, and increased unrealized losses on our portfolio, reflected after-tax in the equity section of our balance sheet as increased market yields negatively impacted the fair value of much of our available-for-sale debt securities.We sell invested assets from our portfolio from time to time to meet our investment objectives or to take advantage of market opportunities. During the year ended December 31, 2022, sales of available-for-sale debt securities resulted in net realized losses of $1.8 million and sales of equity securities resulted in a net realized gain of $2.2 million, in total generating net realized gains of $0.4 million. During the year ended December 31, 2021, sales of available-for-sale debt securities resulted in a net realized gain of $0.2 million, sales of equity securities resulted in a net realized gain of $2.8 million, the sale of two investment real estate properties, which includes one classified as assets held for sale in 2021, resulted in a realized gain of $2.7 million, and one real estate property classified as assets held for sale in 2021 resulted in a realized gain of $0.2 million, in total generating a net realized gain of $5.9 million. See “Part II—Item 8—Note 3 (Investments).”There was a $13.1 million net unrealized loss in equity securities during the year ended December 31, 2022 compared to a $4.0 million net unrealized loss in equity securities during the year ended December 31, 2021. Net change in unrealized gains or losses for equity securities still held at the end of the reported period are recorded at fair value in the Consolidated Balance Sheet with changes in the fair value of equity securities reported in current period earnings in the Consolidated Statements of Income within net change in unrealized gains (losses) on investments as they occur.Commission revenue is comprised principally of brokerage commissions we earn from traditional open market third-party reinsurers, which excludes reinsurance provided by the State of Florida as well as catastrophe bond participants. Commission revenue is earned pro-rata over the reinsurance policy period which runs from June 1st to May 31st of the following year. Reinstatement premiums for Hurricane Ian resulted in $13.1 million of additional brokerage commissions which will be earned prospectively from September 28, 2022 to May 31, 2023, increasing brokerage commission revenue earned of $5.0 million from September 28, 2022 through December 31, 2022. For the year ended December 31, 2022, commission revenue was $53.2 million, compared to $41.7 million for the year ended December 31, 2021. The increase in commission revenue of $11.5 million, or 27.7%, for the year ended December 31, 2022 was primarily due to increased commissions from third-party reinsurers earned on increased reinsurance premiums which is attributable to growth in our insured values, as well as the difference in pricing and structure associated with our reinsurance program when compared to the prior year.Policy fees for the year ended December 31, 2022 were $20.2 million compared to $22.7 million for the same period in 2021. The decrease of $2.5 million, or 11.1%, was the result of a decrease in the combined total number of new and renewal policies written during the year ended December 31, 2022 compared to the same period in 2021 in states where we are permitted to charge this fee.Other revenue, representing revenue from policy installment fees, premium financing, and other miscellaneous income, was $7.7 million for the year ended December 31, 2022 compared to $7.6 million for the same period in 2021.Core revenue, representing total GAAP revenue, excluding net realized gains (losses) on investments and net changes in unrealized gains (losses) on investments, was $1,235.5 million for the year ended December 31, 2022 compared to $1,120.0 million for the same period in 2021.Operating Costs and ExpensesLosses and Loss Adjustment ExpensesLosses and LAE, net of reinsurance recoveries was $938.4 million for the year ended December 31, 2022, resulting in a net loss ratio of 83.2%, compared to $779.2 million, and 75.3%, respectively, for the year ended December 31, 2021.Hurricane Ian resulted in $111.0 million of net losses and LAE for the 2022 accident year, or 9.9 net loss ratio points, compared to $28.0 million of weather above plan in 2021, or 2.7 net loss ratio points.Prior year development includes changes in estimated losses and LAE for all events occurring in prior years including hurricanes and other weather. Prior year development was $25.0 million, or 2.2 net loss ratio points for the year ended December 31, 2022, compared to $54.5 million for 2021, or 5.3 net loss ratio points.Excluding Hurricane Ian and prior year development recorded in 2022, all other losses and LAE, net for the current accident year are estimated to be $802.4 million or 71.1 net loss ratio points for the year ended December 31, 2022, compared to $696.7 million, or 67.3 net loss ratio points estimated in 2021. Throughout 2022, management increased its current accident year loss pick (plan) primarily to reduce volatility in weather above plan. This category also reflects savings from activities performed by affiliates within our holding company system on behalf of our Insurance Entities and our reinsurers when losses and LAE are ceded under our reinsurance contracts. When claims are adjusted by our claims team and files handled by our legal group in this litigious environment, there are synergies achieved by having these two functions within the same consolidated group that could not be achieved through third parties. This synergistic relationship results in more efficient handling and coordination of claims including represented claims handled by our legal group of close to 500 employees. By choosing not to outsource these activities, we also save money for the consolidated group by generating a potential profit margin outside of the Insurance Entities that serves to offset LAE at the consolidated level (contra LAE). During 2022 these claims related activities generated a profit margin of $62.4 million compared to $11.9 million during 2021.50Losses and LAE experience over the past several years including both 2022 and 2021, reflects an adverse litigation environment and other market conditions in Florida that the Florida Legislature has been attempting to address with the passage of legislation spanning several years with the most significant changes made during a special session held in December 2022.General and Administrative ExpensesFor the year ended December 31, 2022, general and administrative expenses were $304.9 million, compared to $313.6 million during the same period in 2021, as follows (dollars in thousands):For the Years Ended December 31, Change 2022 2021 $ % $ Ratio $ Ratio Premiums earned, net $ 1,128,626 $ 1,035,463 $ 93,163 9.0 % General and administrative expenses: Policy acquisition costs 214,259 19.0 % 226,167 21.8 % (11,908) (5.3) % Other operating costs 90,638 8.0 % 87,428 8.4 % 3,210 3.7 % Total general and administrative expenses $ 304,897 27.0 % $ 313,595 30.2 % $ (8,698) (2.8) % General and administrative expenses decreased by $8.7 million, which was the result of decreases in policy acquisition costs of $11.9 million offset by an increase in other operating costs of $3.2 million. The total general and administrative expense ratio was 27.0% for the year ended December 31, 2022 compared to 30.2% for the year ended December 31, 2021.•The decrease in policy acquisition costs of $11.9 million reflects a reduction in the commission rate paid to agents on the renewal of Florida policies which was reduced by two percentage points to 10% effective April 1, 2021, which also reduced the ratio of policy acquisition to net premiums earned. The commission rate paid to agents on the renewal of Florida policies was reduced by an additional two percentage points to 8% effective May 1, 2022, which will benefit future periods as the new rate structure applies prospectively.•The increase in other operating costs of $3.2 million primarily reflects an increase in performance bonuses partially offset by a decrease in share-based compensation. The other operating cost ratio was 8.0% for the year ended December 31, 2022 compared to 8.4% in the year ended December 31, 2021. This reduction reflects several factors including economies of scale as we continue to grow premium and spending discipline.As a result of the above, the combined ratio for the year ended December 31, 2022was 110.2%compared to 105.5% for the same period in 2021. The increase was the result of the impact of Hurricane Ian and higher core losses.Interest and Amortization of Debt Issuance CostsInterest and amortization of debt issuance costs for the year ended December 31, 2022 was $6.6 million compared to $0.6 million for the same period in 2021. The increase of $6.0 million, or 935.9%, in interest and amortization of debt issuance costs is the result of the issuance of additional debt in the fourth quarter of 2021. See “Part II—Item 8—Note 7 (Long-term debt)” for additional details.Income Tax Expense (Benefit)Income tax benefit was $5.0 million for the year ended December 31, 2022, compared to income tax expense of $8.0 million for the year ended December 31, 2021. Our effective tax rate decreased to 18.3% for the year ended December 31, 2022, as compared to 28.2% for the year ended December 31, 2021. See “Part II—Item 8—Note 12 (Income Taxes)” for a table of items reconciling statutory rates to the effective rate for years 2022 and 2021.Comprehensive Income (Loss)Other comprehensive loss, net of taxes for the year ended December 31, 2022 was $88.2 million compared to other comprehensive loss of $18.9 million for the same period in 2021, reflecting after-tax changes in fair value of available-for-sale debt securities held in our investment portfolio and reclassifications out of accumulated other comprehensive income for available-for-sale debt securities sold. We saw increased market yields on securities purchased in late 2021 and 2022 and increased unrealized losses on our portfolio, reflected after-tax in the equity section of our balance sheet as increased interest rates negatively impacted the fair value on much of our available-for-sale debt securities. See discussion above and “Part II—Item 8—Note 14 (Other Comprehensive Income (Loss))” for additional information about the amounts comprising other comprehensive income (loss), net of taxes for these periods.51Non-GAAPAdjusted operating income (loss) represents GAAP operating income (loss), excluding net realized gains (losses) on investments and net changes in unrealized gains (losses) on investments. Adjusted operating loss was $7.8 million for the year ended December 31, 2022 compared to adjusted operating income of $27.2 million for the same period in 2021.Adjusted operating income (loss) margin represents adjusted operating income (loss) divided by core revenue. Adjusted operating loss margin was 0.6% for the year ended December 31, 2022 compared to adjusted operating income margin of 2.4% for the same period in 2021.Adjusted net income (loss) attributable to common stockholders represents GAAP net income (loss) attributable to common stockholders, excluding net realized gains (losses) on investments and net changes in unrealized gains (losses) on investments, net of tax. Adjusted net loss attributable to common stockholders was $12.6 million for the year ended December 31, 2022 compared to adjusted net income attributable to common stockholders of $19.0 million for the same period in 2021.Diluted adjusted earnings (loss) per common share represents adjusted net income (loss) available to common stockholders divided by weighted average diluted common shares outstanding. Diluted adjusted loss per common share was $0.41 for the year ended December 31, 2022 compared to diluted adjusted earnings per share of $0.61 for the same period in 2021.52ANALYSIS OF FINANCIAL CONDITION AS OF DECEMBER 31, 2023 COMPARED TO DECEMBER 31, 2022We believe that cash flows generated from operations will be sufficient to meet our working capital requirements for at least the next 12 months. We invest amounts considered to be in excess of current working capital requirements.The following table summarizes, by type, the carrying values of investments as of the dates presented (in thousands): As of December 31, Type of Investment 2023 2022 Available-for-sale debt securities $ 1,064,330 $ 1,014,626 Equity securities 80,495 85,469 Other investments, at fair value 10,434 — Investment real estate, net 5,525 5,711 Total $ 1,160,784 $ 1,105,806 See “Part II—Item 8—Consolidated Statements of Cash Flows” and “Item 8—Note 3 (Investments)” for explanations on changes in investments.Prepaid reinsurance premiums represent the portion of unearned ceded written premium that will be earned pro-rata over the coverage period of our reinsurance program, which runs from June 1 throughst to May 31st of the following year. The decrease of $46.2 million to $236.3 million as of December 31, 2023 was primarily due to decreased reinsurance costs relating to our 2023-2024 catastrophe reinsurance program beginning June 1, 2023, less amortization of ceded written premium for the reinsurance costs earned since the beginning of the new program. See “Part II— Item7— “Reinsurance Program” regarding the Company’s reinsurance placement and participation in the Florida RAP program.Reinsurance recoverable represents the estimated amount of paid and unpaid losses, LAE, and other expenses that are expected to be recovered from reinsurers. The decrease of $589.7 million to $219.1 million as of December 31, 2023 was primarily due to the settlement and collection of Hurricane Ian claims and amounts recoverable from reinsurers relating to other ceded events. In addition commutations concluded during the year consistsreduced reinsurance recoverable.Premiums receivable, net represents amounts receivable from policyholders. The increase in premiums receivable, net of various forms$7.5 million to $77.1 million as of catastropheDecember 31, 2023 is consistent with premium trends including seasonality and multiple lineconsumer payment behaviors.Property, plant, and equipment, net represents long-term assets held and used in the operations of the business. The decrease in property, plant, and equipment, net of $3.8 million to $47.6 million as of December 31, 2023 is a result of disposals and depreciation of assets held.Deferred policy acquisition costs (“DPAC”) increased by $6.3 million to $110.0 million as of December 31, 2023, and is consistent with written premium trends and changes in commissions paid to agents. In 2023, DPAC was impacted by the reductions to Florida renewal commissions implemented during 2022 and other changes to the Company’s commission structure. See “Item 1—Note 5 (Insurance Operations)” for a roll-forward in the balance of our DPAC.Income taxes payable represents the difference between estimated tax obligations and tax payments made to taxing authorities. As of December 31, 2023, the balance payable was $5.9 million, representing amounts due to taxing authorities at that date, compared to a balance recoverable of $1.5 million as of December 31, 2022.Deferred income taxes represent the estimated tax asset or tax liability caused by temporary differences between the tax return basis of certain assets and liabilities and amounts recorded in the financial statements. During the year ended December 31, 2023, deferred income tax asset, net decreased by $14.1 million to $43.2 million, primarily due to a decrease in unrealized losses on investments, and deferred acquisition costs, and an increase in unearned premiums. Deferred income taxes reverse in future years as the temporary differences between book and tax reverse.See “Part II—Item 8—Note 17 (Liability for Unpaid Losses and Loss Adjustment Expenses)” for a roll-forward in the balance of our unpaid losses and LAE. Unpaid losses and LAE decreased by $528.7 million to $510.1 million as of December 31, 2023. The majority of the increase in 2022 was a result of losses recorded in the third quarter of 2022 for Hurricane Ian and in the fourth quarter of 2022 for Hurricane Nicole. Overall, unpaid losses and LAE decreased, as a result of payment of current and prior year claims especially the settlement of Hurricane Ian claims. Unpaid losses and LAE are net of estimated subrogation recoveries of $144.1 million as of December 31, 2023 compared to $134.4 million as of December 31, 2022.Unearned premiums represent the portion of direct premiums written that will be earned pro-rata in the future. The increase of $46.7 million from December 31, 2022 to $990.6 million as of December 31, 2023 reflects the increases in written premiums as the result of rate increases.53Advance premium represents premium payments made by policyholders ahead of the effective date of the policies. The decrease of $6.3 million from December 31, 2022 to $48.7 million as of December 31, 2023 reflects customer payment behavior and the payment behavior of mortgage escrow service providers as well as premium trends.We exclude net negative cash balances, if any, from cash and cash equivalents that we have with any single financial institution based on aggregating the book balance of all accounts at the institution which have the right of offset. If the aggregation results in a net negative book balance, that balance is reclassified from cash and cash equivalents in our Consolidated Balance Sheet to book overdraft. These amounts represent outstanding checks or drafts not yet presented to the financial institution in excess of loss coverage.amounts on deposit at the financial institutions. We maintain a short-term cash investment strategy sweep to maximize investment returns on cash balances. There were $14.6 million book overdrafts as of December 31, 2023, none as of December 31, 2022. The increase of $14.6 million is the result of lower cash balances available for offset as of December 31, 2023 compared to December 31, 2022. See “—Liquidity and Capital Resources” for more information.Reinsurance payable, net, represents the unpaid reinsurance premium installments owed to reinsurers, unpaid reinstatement premiums due to reinsurers, and cash advances received from reinsurers, if any. On June 1st of each year, we renew our core catastrophe reinsurance program and record the estimated annual cost of our reinsurance program. These estimated annual costs are increased or decreased during the year based on premium adjustments or as a result of new placements during the year. The annual cost initially increases reinsurance payable, which is then reduced as installment payments are made over the policy period of the reinsurance, which typically runs from June 1st to May 31st. The balance decreased by $192.7 million to $191.9 million as of December 31, 2023 as a result of timing of the above items and decline in costs of reinsurance expense for the current treaty period in 2023 and the reduction in cash advances received in 2022 after Hurricane Ian which have been utilized during the claim settlement process in 2023 of Ian claims. See “—Liquidity and Capital Resources” for more information about timing of reinsurance premium installment payments.Other liabilities and accrued expenses increased by $31.8 million to $90.6 million as of December 31, 2023, primarily driven by an increase in amounts payable for securities resulting from trades executed that had not settled as of December 31, 2023.Capital resources, net increased by $52.6 million for the year ended December 31, 2023, reflecting a net increase in total stockholders’ equity, partially offset by a decline in long-term debt. The change in stockholders’ equity was the result of our 2023 net income offset by treasury share purchases and dividends to shareholders. See “Part II—Item 8—Consolidated Statements of Stockholders’ Equity” and “Item 8—Note 8 (Stockholders’ Equity)” for an explanation of changes in treasury stock. The reduction in long-term debt was primarily the result of principal payments on long-term debt of $1.5 million offset by amortization of debt issuance costs of $0.7 million on our 5.625% Senior Unsecured Notes due 2026 during 2023 . See “—Liquidity and Capital Resources” for more information.Additional paid-in-capital increased by $2.6 million primarily from share-based compensation expense of $5.0 million for the year ended December 31, 2023. This was largely offset by $2.1 million in connection with the settlement of certain restricted stock units.Liquidity and Capital ResourcesLiquidityLiquidity is a measure of a company’s ability to generate sufficient cash flows to meet its short- and long-term obligations. Funds generated from operations have been sufficient and we expect them to be sufficient to meet our current and long term liquidity requirements.The balance of cash and cash equivalents, excluding restricted cash, as of December 31, 2023 was $397.3 million, compared to $388.7 million at December 31, 2022. See “Part II—Item 8—Consolidated Statements of Cash Flows” for a reconciliation of the balance of cash and cash equivalents between December 31, 2023 and 2022. This increase was driven by cash flows generated from operating activities in excess of cash flows used in investing and financing activities. Our cash investment strategy at times includes cash investments where the right of offset against other bank accounts does not exist. A book overdraft occurs when aggregating the book balance of all accounts at a financial institution for accounts which have the right of offset, and if the aggregation results in a net negative book balance, that balance is reclassified from cash and cash equivalents in our Consolidated Balance Sheet to book overdraft. Cash and cash equivalents balances are available to settle book overdrafts, and to pay reinsurance premiums, expenses and claims. Reinsurance premiums are paid in installments during the reinsurance policy period, which runs from June 1st to May 31st of the following year. The FHCF reimbursement premiums are paid in three installments on August 1st, October 1st and December 1st, and third-party reinsurance premiums are generally paid in four installments on July 1st, October 1st, January 1st and April 1st, resulting in significant payments at those times. See “Part II—Item 8—Note 15 (Commitments and Contingencies)” and additional discussion below under the caption “—Material Cash Requirements” for more information.54During 2023, there was one significant hurricane, Hurricane Idalia, which was below the Company’s reinsurance attachment point. The Company’s reinsurance program provides sufficient liquidity in the form of cash advances for paid losses ceded to the reinsurers in the case of weather events with losses above the Company’s reinsurance attachment point. During 2022, Hurricane Ian generated $1.0 billion in gross losses, or $111 million net after the benefit of reinsurance. The Company routinely collected amounts ceded to reinsurers and, as in the past did not have to use funds in the Company’s investment portfolio. See “—Results of Operations” for more information.The balance of restricted cash and cash equivalents as of December 31, 2023 and 2022 represents cash equivalents on deposit with certain regulatory agencies in the various states in which our Insurance Entities do business.Liquidity is required at the holding company for us to cover the payment of holding company general operating expenses and contingencies, dividends to shareholders (if and when authorized and declared by our Board of Directors), payment for the possible repurchase of our common stock (if and when authorized by our Board of Directors), payment of our tax obligations to taxing authorities, settlement of taxes between subsidiaries in accordance with our tax sharing agreement, capital contributions to subsidiaries or surplus note contributions to the Insurance Entities, if needed, and interest and principal payments on outstanding debt obligations of the holding company. Effective in 2021 for UPCIC and 2022 for APPCIC, the holding company has put in place an ongoing surplus note arrangement with the Insurance Entities, which has been approved by the FLOIR as the Insurance Entities’ domestic regulator. Surplus notes are unsecured debt issued by the Insurance Entities that are subordinated to all claims by policyholders and creditors, with interest and principal payments on the surplus notes to the holding company being made only upon the FLOIR’s express approval. Surplus notes are considered bonds in function and payout structure, but are accounted for as equity in the statutory reporting of the Insurance Entities. The holding company has outstanding with the Insurance Entities $134.0 million in surplus notes. Under the 2017-2018arrangement, interest accrues at a variable rate (currently 10.54%) on the outstanding surplus note balances and, if approved by the FLOIR, is payable annually to the holding company. The declaration and payment of future dividends to our shareholders, and any future repurchases of our common stock, will be at the discretion of our Board of Directors and will depend upon many factors, including our operating results, financial condition, debt covenants, and any regulatory constraints. New regulations or changes to existing regulations imposed on the Company and its affiliates may also impact the amount and timing of future dividend payments to the parent. Principal sources of liquidity for the holding company include dividends paid by our service entities generated from income earned on fees paid by the Insurance Entities to affiliated companies for general agency, inspections and claims adjusting services. Dividends are also paid from income earned from brokerage commissions we earn from third-party reinsurers on reinsurance program, APPCIC hascontracts placed by our wholly-owned subsidiary, BARC and policy fees. We also maintain high quality investments in our portfolio as a source of liquidity along with ongoing interest and dividend income from those investments. As discussed in “Item 8—Note 5 (Insurance Operations),” there are limitations on the dividends the Insurance Entities may pay to their immediate parent company, Protection Solutions, Inc. (“PSI,” formerly known as Universal Insurance Holding Company of Florida).The maximum amount of dividends that can be paid by Florida insurance companies without prior approval of the FLOIR is subject to restrictions as referenced below and in “Item 8—Note 5 (Insurance Operations).” Dividends from the Insurance Entities can only be paid from accumulated unassigned funds derived from net retention on its catastrophe programoperating profits and net realized capital gains. Subject to such accumulated unassigned funds, the maximum dividend that may be paid by the Insurance Entities to PSI without prior approval (an “ordinary dividend”) is further limited to the lesser of $2 million for all losses per catastrophe event for losses incurred up to a first event loss of $28.1 million. The retention amount is gross of any potential tax benefit we would receive in paying such losses. APPCIC has mandatory catastrophe coverage through the FHCF plus voluntary catastrophe coverage with private reinsurers.APPCIC structures its catastrophe reinsurance coverage into layers and utilizes a cascading feature such that the second and third reinsurance layers all attach at $2 million. Any layers above the $2 million attachment point are excess of loss over the immediately preceding layer. If the aggregate limitstatutory net income from operations of the preceding layercalendar year or statutory unassigned surplus as of the preceding year end. During the years ended December 31, 2023 and 2022 the Insurance Entities did not pay dividends to PSI. As of December 31, 2023, the Insurance Entities did not have the capacity to pay ordinary dividends.On November 23, 2021, we issued $100 million of 5.625% Senior Unsecured Notes due 2026. We used the net proceeds to support the Insurance Entities’ statutory capital requirements and for general corporate purposes. If necessary, the Company also has amounts available under our unsecured revolving loan as discussed in “Part II—Item 8—Note 7 (Long-term debt).”Liquidity for the Insurance Entities is exhausted,primarily required to cover payments for reinsurance premiums, claims payments including potential payments of catastrophe losses (offset by recovery of any reimbursement amounts under our reinsurance agreements), fees paid to affiliates for managing general agency services, inspections and claims adjusting services, agent commissions, premium and income taxes, regulatory assessments, general operating expenses, and interest and principal payments on debt obligations. The principal source of liquidity for the next layer cascades down in its place for future events. This means that, unlessInsurance Entities consists of the revenue generated from the collection of premiums earned, net, interest and dividend income from the investment portfolio, the collection of reinsurance recoverable and financing fees.Our insurance operations provide liquidity as premiums are generally received months or even years before potential losses exhaustare paid under the top layerpolicies written. In the event of catastrophic events, many of our reinsurance agreements provide for “cash advance” whereby reinsurers advance or prepay amounts to us, thereby providing liquidity, which we utilize in the claim settlement process. In addition, the Insurance Entities maintain substantial investments in highly liquid, marketable securities, which would generate funds upon sale. The average credit rating on our available-for-sale securities was A+ as of December 31, 2023 and December 31, 2022. Credit ratings are a measure of collection risk on invested assets. Credit ratings are provided by third party nationally recognized rating agencies and are periodically updated. Management establishes guidelines for minimum credit rating and overall credit rating for all investments. The duration of our available-for-sale securities was 3.7 years as of December 31, 2023 compared to 4.0 years at December 31, 2022. Duration is a measure of a bond’s sensitivity to interest rate changes and is used by management to limit the potential impact of longer-term investments.55The Insurance Entities are responsible for losses related to catastrophic events in excess of coverage weprovided by the Insurance Entities’ reinsurance programs and retentions before our reinsurance protection commences. Also, the Insurance Entities are only exposedresponsible for all other losses that otherwise may not be covered by the reinsurance programs and any amounts arising in the event of a reinsurer default. Losses or a default by reinsurers may have a material adverse effect on either of the Insurance Entities or on our business, financial condition, results of operations and liquidity.Capital ResourcesCapital resources provide protection for policyholders, furnish the financial strength to $2support the business of underwriting insurance risks and facilitate continued business growth. The following table provides our stockholders’ equity, total long-term debt, total capital resources, debt-to-total capital ratio and debt-to-equity ratio for the periods presented (dollars in thousands): As of December 31, 2023 2022 Stockholders’ equity $ 341,297 $ 287,896 Total long-term debt 102,006 102,769 Total capital resources $ 443,303 $ 390,665 Debt-to-total capital ratio 23.0 % 26.3 % Debt-to-equity ratio 29.9 % 35.7 % Capital resources, net increased by $52.6 million for the year ended December 31, 2023, reflecting a net increase in losses, pre-tax,total stockholders’ equity. The change in stockholders’ equity was the result of our 2023 net income offset by treasury share purchases and dividends to shareholders.The debt-to-total capital ratio is total long-term debt divided by total capital resources, whereas the debt-to-equity ratio is total long-term debt divided by stockholders’ equity. These ratios help management measure the amount of financing leverage in place in relation to equity and future leverage capacity.Adjusted common stockholders’ equity, representing GAAP common stockholders’ equity, excluding accumulated other comprehensive income (loss), was $415.4 million as of December 31, 2023 and $391.6 million as of December 31, 2022.Adjusted book value per catastropheshare common share, representing adjusted common stockholders’ equity divided by outstanding common shares at the end of the reporting period, was $14.34 as of December 31, 2023 and $12.89 as of December 31, 2022.Adjusted return on common equity representing actual or annualized adjusted net income (loss) attributable to common stockholders divided by average adjusted common stockholders' equity, with the denominator excluding current period income statement net realized gains (losses) on investments and net changes in unrealized gains (losses) on investments, net of tax, was 14.7% as of December 31, 2023 and (3.0)% as of December 31, 2022.The Insurance Entities are required annually to comply with the NAIC RBC requirements. RBC requirements prescribe a method of measuring the amount of capital appropriate for an insurance company to support its overall business operations in light of its size and risk profile. NAIC’s RBC requirements are used by regulators to determine appropriate regulatory actions relating to insurers who show signs of weak or deteriorating condition. As of December 31, 2023, based on calculations using the appropriate NAIC RBC formula, the Insurance Entities reported respective total adjusted capital in excess of the requirements. Failure by the Insurance Entities to maintain the required level of statutory capital and surplus could result in the suspension of their authority to write new or renewal business, other regulatory actions, or ultimately, in the revocation of their certificate of authority by the FLOIR.In 2006, UPCIC entered into a $25.0 million surplus note with the State Board of Administration of Florida (the “SBA”) under Florida’s Insurance Capital Build-Up Incentive Program (the “ICBUI”). The surplus note has a twenty-year term, with quarterly payments of interest based on the 10-year Constant Maturity Treasury Index. As of December 31, 2023, UPCIC’s net written premium to surplus ratio and gross written premium to surplus ratio were in excess of the required minimums and, therefore, UPCIC is not subject to increases in interest rates. See “Part II—Item 8—Note 7 (Long-term debt)” for additional details. At December 31, 2023, UPCIC was in compliance with the terms of the surplus note and with each of the first two events.APPCIC’s multiple lineloan’s covenants as implemented by rules promulgated by the SBA. Total adjusted capital and surplus, which includes the surplus note, was in excess of loss reinsuranceregulatory requirements for both UPCIC and APPCIC.Revolving LoanAs discussed in “Part II—Item 8—Note 7 (Long-term Debt),” the Company entered into a committed and unsecured $40.0 million revolving credit line with JP Morgan Chase Bank N.A. This agreement succeeded the previous $37.5 million revolving credit line with J.P. Morgan Chase, N.A. As of December 31, 2023, the Company has not borrowed any amount under this revolving loan. The Company must pay an annual commitment of 0.50% of the unused portion of the commitment. Borrowings mature on June 29, 2024, 364 days after the inception date and carries an interest rate of prime rate plus a margin of562%. The credit line is subject to annual renewals. The credit line contains customary financial and other covenants, with which the Company is in compliance.Long-term DebtIn November 2021, we issued and sold $100 million of 5.625% Senior Unsecured Notes due 2026 (the “Notes”) to certain institutional accredited investors and qualified institutional buyers. The Notes mature on November 26, 2026, at which time the entire $100.0 million of principal is due and payable. At any time on or after November 23, 2023, the Company may redeem all or part of the Notes. See “Part II—Item 8—Note 7 (Long-term debt)” for additional details. As of December 31, 2023, we were in compliance with all applicable covenants.We will also continue to evaluate opportunities to access the debt capital markets to raise additional capital. We anticipate any proceeds would be used for general corporate purposes, including investing in the capital and surplus of the Insurance Entities.In addition to the liquidity generally provided from operations, we maintain a conservative, well-diversified investment portfolio, predominantly comprised of fixed income securities with an average credit rating of A+, that focuses on capital preservation and providing an adequate source of liquidity for potential claim payments and other cash needs. The portfolio’s secondary investment objective is to provide a total rate of return with emphasis on investment income. Historically, we have consistently generated funds from operations, allowing our cash and invested assets to grow. We have not had to liquidate investment holdings to fund either operations or financing activities.Looking ForwardWe continue to monitor a range of financial metrics related to our business. Although we have not experienced material adverse impacts on our business or liquidity, conditions are subject to change depending on the extent of the economic outcomes, and the pace and extent of an economic recovery. Uncertainties regarding the impact of the COVID-19 pandemic tapered in 2023, including mitigated assessed risk by the Federal Reserve regarding the economic concerns of inflation, employment, and recession. We will continue to monitor the broader lasting economic impacts of the COVID-19 pandemic.Common Stock RepurchasesWe may repurchase shares from time to time at our discretion, based on ongoing assessments of our capital needs, the market price of our common stock, and general market conditions. We will fund the share repurchase program haswith cash from operations. During 2023, there were two authorized repurchase plans in effect:•On December 15, 2022, our Board of Directors authorized a property retention of $0.5 million with coveragesuccessor share repurchase program under which the Company is authorized to repurchase up to $8.5$8.0 million per individual propertyof shares of our common stock through December 15, 2024 (the “December 2024 Share Repurchase Program”), which represents the unused portion of a previous share repurchase program authorization from November 2022. Under the December 2024 Share Repurchase Program, we repurchased 587,126 shares of our common stock at an aggregate cost of approximately $8.0 million. As of December 31, 2023, all amounts authorized under the December 2024 Program were repurchased.•On June 12, 2023, our Board of Directors authorized the repurchase of up to $20.0 million of our common stock through June 10, 2025 (“The June 2025 Share Repurchase Program”) pursuant to which we repurchased 1,112,953 shares of our common stock at an aggregate cost of approximately $15.9 million. As of December 31, 2023, we have the ability to purchase up to approximately $4.1 million of our common stock under the June 2025 Share Repurchase Program.In total, during the year ended December 31, 2023, we repurchased an aggregate of 1,513,644 shares of our common stock in the open market at an aggregate purchase price of $22.0 million. Also see “Part II—Item 5—Market for Registrant’s Common Equity, Related Stockholder Matters and Issuer Purchases of Equity Securities—Registrant Purchases of Equity Securities” for share repurchase activity during the three months ended December 31, 2023.Cash DividendsThe following table summarizes the dividends declared and paid by the Company during the year ended December 31, 2023:Dividend Shareholders Dividend Cash Dividend 2023 Declared Date Record Date Payable Date Per Share Amount First Quarter February 9, 2023 March 9, 2023 March 16, 2023 $ 0.16 Second Quarter April 12, 2023 May 12, 2023 May 19, 2023 $ 0.16 Third Quarter July 20, 2023 August 4, 2023 August 11, 2023 $ 0.16 Fourth Quarter November 15, 2023 December 8, 2023 December 15, 2023 $ 0.29 57Reinsurance RecoverableThe following table provides total unpaid loss and aLAE, net of related reinsurance recoverable for the dates presented (in thousands):Years Ended December 31, 2023 2022 Unpaid loss and LAE, net $ 44,508 $ 44,164 IBNR loss and LAE, net 282,174 195,946 Total unpaid loss and LAE, net $ 326,682 $ 240,110 Reinsurance recoverable on unpaid loss and LAE $ 49,249 $ 156,683 Reinsurance recoverable on IBNR loss and LAE 134,185 641,997 Total reinsurance recoverable on unpaid loss and LAE $ 183,434 $ 798,680 Statutory Loss RatiosUnderwriting results of insurance companies are frequently measured by their combined ratios, which is the sum of the loss and expense ratios described in the following paragraph. However, investment income, federal income taxes and other non-underwriting income or expense are not reflected in the combined ratio. The profitability of property and casualty retention of $0.3 million with coverage up to $1.0 million per individual casualty loss.The estimated total net cost of APPCIC’s FHCF, per risk and catastrophe related coverage, including reinstatement premium protection coverage is $2.8 million. The largest private participants in APPCIC’s program include Everest Reinsurance Company, Chubb Tempest Reinsurance Ltd., Hiscox Insurance Co (Bermuda) Ltd, Hannover Ruck SE and various Lloyd’s of London syndicates. Thefollowing table below provides the A.M. Beststatutory loss ratios, expense ratios and S&Pcombined ratios for the periods indicated for the Insurance Entities:Years Ended December 31, 2023 2022 Loss and LAE Ratio (1) UPCIC 86 % 85 % APPCIC 58 % 57 % Expense Ratio (1) UPCIC 25 % 33 % APPCIC 33 % 28 % Combined Ratio (1) UPCIC 111 % 118 % APPCIC 91 % 85 % (1)The ratios are net of ceded premiums and losses and LAE, including premiums ceded to our catastrophe reinsurers which comprise a significant cost, and losses and LAE ceded to reinsurers. The expense ratio includes management fees and commissions, which are based on market rates, paid to an affiliate of the Insurance Entities in the amount of $122.0 million and $135.8 million for UPCIC for the years ended December 31, 2023 and 2022, respectively, and $2.8 million and $1.7 million for APPCIC for the years ended December 31, 2023 and 2022, respectively. The management fees and commissions paid to the affiliate are eliminated in consolidation.RatingsThe Insurance Entities’ financial strength and stability are rated by certain independent insurance rating agencies to measure the Insurance Entities’ ability to meet their financial obligations to its policyholders. For the Insurance Entities’ policies to be considered acceptable to the secondary mortgage market, the Insurance Entities must maintain a specified rating level with at least one independent insurance rating agency recognized by each of the Federal Home Loan Mortgage Corporation (“Freddie Mac”) and the Federal National Mortgage Association (“Fannie Mae”) or alternatively must qualify for an exception to the rating requirement. The Insurance Entities currently maintain acceptable ratings from two rating agencies recognized by Freddie Mac and Fannie Mae.In 2023, Demotech, Inc. affirmed the Financial Stability Rating® of “A” for the Insurance Entities and Kroll affirmed its insurer financial strength ratings for eachof “A-”. According to Demotech, Inc., the assigned rating represents a company’s continued positive surplus related to policyholders, liquidity of invested assets, an acceptable level of financial leverage, reasonable loss and LAE reserves, and realistic pricing. According to Kroll, its category of “A” ratings, inclusive of A+, A, and A- ratings,58indicates an insurer’s financial condition is strong and it is very likely to meet its policy obligations under difficult economic, financial, and business conditions. The ratings of the largest third-party reinsurersInsurance Entities are subject to at least annual review by the respective rating agencies, and may be revised upward or downward or revoked at the sole discretion of the rating agencies. Insurer financial stability or financial strength ratings primarily directed towards policyholders, and are not evaluations directed toward the protection of investors in APPCIC’s 2017-2018a company, including holders of a company’s common stock, and are not recommendations to buy, sell, or hold securities.The “A” rating on the 5.625% Senior Unsecured Notes due 2026 was reaffirmed by Egan-Jones Ratings Company in 2023. There are three notches in the rating categories assigned by Egan-Jones Ratings Company (e.g., A-, A, and A+), except for AAA and those deep into speculative grade, i.e., CC, C, and D, which do not have notches. According to Egan-Jones Ratings Company, the assigned rating pertains solely to their view of current and prospective credit quality. Their rating does not address pricing, liquidity, or other risks associated with holding investments in the issuer (UVE). Their rating is dependent on numerous factors including the reliability, accuracy, and quality of the data used in determining the credit rating.Off-Balance Sheet ArrangementsThe Company does not have any off-balance sheet arrangements that are reasonably likely to have a material effect on the financial condition, results of operations, liquidity, or capital resources of the Company, except for multi-year reinsurance contract commitments for future years that will be recorded at the commencement of the coverage period. See “Part II—Item 8—Note 15 (Commitments and Contingencies)” for more information.Material Cash RequirementsThe following table represents our material cash requirements for which cash flows are fixed or determinable as of December 31, 2023 (in thousands):Total Next 12 months Beyond 12 months Reinsurance payable and multi-year commitments (1) $ 317,197 $ 264,551 $ 52,646 Unpaid losses and LAE, direct (2) 510,117 287,030 223,087 Long-term debt (3) 121,198 7,256 113,942 Total material cash requirements $ 948,512 $ 558,837 $ 389,675 (1)Amount represents the payment of reinsurance premiums payable under multi-year commitments. See “Part II—Item 8—Note 15 (Commitments and Contingencies).”(2)There are generally no notional or stated amounts related to unpaid losses and LAE. Both the amounts and timing of future loss and LAE payments are estimates and subject to the inherent variability of legal and market conditions affecting the obligations and make the timing of cash outflows uncertain. The ultimate amount and timing of unpaid losses and LAE could differ materially from the amounts in the table above. Further, the unpaid losses and LAE do not represent all the obligations that will arise under the contracts, but rather only the estimated liability incurred through December 31, 2023. Unpaid losses and LAE are net of estimated subrogation recoveries. In addition, these balances exclude amounts recoverable from our reinsurance program. See “Part II—Item 8—Note 4 (Reinsurance).” and Note 17 (Liability for Unpaid Losses and Loss Adjustment Expenses).”
(3)Long-term debt consists of a Surplus note and 5.625% Senior unsecured notes. See “Part II—Item 8—Note 7 (Long-term debt).”ReinsurerA.M. BestS&PEverest Reinsurance CompanyA+A+Chubb Tempest Reinsurance Ltd.A++AAHiscox Insurance Co (Bermuda) Ltd.AAHannover Ruck SEA+AA-Various Lloyd’s of London SyndicatesAA+critical accounting policiesImpact of Inflation and Changing PricesThe financial statements and related data presented herein have been prepared in accordance with GAAP, which require the measurement of financial position and operating results in terms of historical dollars without considering changes in the relative purchasing power of money over time due to inflation. Our primary assets are monetary in nature. As a result, interest rates have a more significant impact on our performance than the effects of the general levels of inflation. Interest rates do not necessarily move in the same direction or with the same magnitude as the cost of paying losses and LAE.Insurance premiums are established before we know the amount of loss and LAE and the extent to which inflation may affect such expenses. Consequently, we attempt to anticipate the future impact of inflation when establishing rate levels. While we attempt to charge adequate rates, we may be limited in raising premium levels for competitive and regulatory reasons. Inflation also affects the market value of our investment portfolio and the investment rate of return. Any future economic changes which result in prolonged and increasing levels of inflation could cause increases in the dollar amount of incurred loss and LAE and thereby materially adversely affect future liability requirements.59Arrangements with Variable Interest EntitiesWe entered into a reinsurance captive arrangement with a VIE in the normal course of business, and consolidated the VIE since we are the primary beneficiary.For a further discussion of our involvement with the VIE, see “Part II—Item 8—Note 2 (Summary of Significant Accounting Policies)” and “Item 8—Note 18 (Variable Interest Entities).”CRITICAL ACCOUNTING POLICIES AND ESTIMATESThe preparation of financial statements in conformity with U.S. GAAP requires management to make estimates and assumptions that affect the reported amounts of assets and liabilities and disclosure of contingent assets and liabilities at the date of the financial statements and the reported amounts of revenues and expenses during the reporting periods. Our primary use of estimates include, use48of estimate in the recognition of liabilities for unpaid losses, loss adjustment expenses, subrogation recoveries and reinsurance recoveries which are described below.Recognition of Premium RevenuesDirect and ceded premiums are recognized as revenue on a pro rata basis over the policy term or over the term of the reinsurance agreement. The portion of direct premiums that will be earned in the future are deferred and reported as unearned premiums. The portion of ceded premiums that will be earned in the future is deferred and reported as prepaid reinsurance premiums.Liability for Unpaid Losses and LAEA liability, net of estimated subrogation, is established to provide for the estimated costs of paying losses and LAE under insurance policies the Insurance Entities have issued. Underwriting results are significantly influenced by an estimate of a liability for unpaid losses and LAE. The liability is an estimate of amounts necessary to settle all outstanding claims, including claims that have been incurred, but not yet reported as of the financial statement date. The Company estimatesprocess of estimating loss reserves requires significant judgment due to a number of variables, such as the type, severity and accrues itsjurisdiction of loss, economic conditions including inflation, social attitudes, judicial decisions and legislative development, and changes in claims handling procedures. These variables will inherently result in an ultimate liability that will differ from initial estimates. We revise our reserve for unpaid losses as additional information becomes available, and reflect adjustments, if any, in our earnings in the periods in which we determine the adjustments are necessary. We estimate and accrue our right to subrogate reported or estimated claims against other parties. Subrogated claims are recorded at amounts estimated to be received from the subrogated parties, net of expenses and netted against unpaid losses and LAE.See “Item 8 — “Part II—Item 8—Note 17 (Liability for Unpaid Losses and Loss Adjustment Expenses)” for a discussion of the Company’s basis and methodologies used to establish its liability for unpaid losses and loss adjustment expensesLAE along with the following quantitative disclosures:
◦IBNR—Total of Incurred-but-not-reported liabilities plus expected development (redundancy) on reported claims by accident year, andoIBNR-Total of Incurred-but-not-reported liabilities plus expected development on reported claims by accident year and
◦Claim counts—cumulative number of reported claims by accident year.oClaim counts-cumulative number of reported claims by accident yearconsolidated balance sheet,Reconciliation of tables to the consolidated financial statements- •Reconciliation of net incurred and paid claims development tabletables to the liability for claimsunpaid losses and claim adjustment expensesLAE in the Consolidated Balance Sheet.Duration- •Duration—a table of the average historical claims duration for the past five years,•Reconciliation of the change in liability for unpaid losses and LAE presented in the consolidated financial statements.We utilize independent actuaries to help establish liabilities for unpaid losses, anticipated loss recoveries, and LAE. We do not discount the liability for unpaid losses and LAE for financial statement purposes. In establishing the liability for unpaid losses and LAE, actuarial judgment is relied upon in order to make appropriate assumptions to estimate a best estimate of ultimate losses. There are inherent uncertainties associated with this estimation process, especially when a company is undergoing changes in its claims settlement practices, when a company has limited experience in a certain area or when behaviors of policyholders are influenced by external factors and/or market dynamics. Claims reported in 2013 and 2014, forAs an example, benefited from several initiatives designed to expedite claim closure rates and reduce settlement costs on claims introduced in our claims department during those 24 months. A morea dramatic change occurred during calendar year 2015 when we realigned our adjusting teams as well as launched our Fast Track initiative, reducing settlement costs and strengthening case reserve adequacy for claims reported during the year. These changes have had a meaningful influence on development pattern selections applied to 2013 through 2017 accident year claims in the reserving estimates for each of the methods described in “Item 8 — 8—Note 17 (Liability for Unpaid Losses and Loss Adjustment Expenses).”. More recently, since 2016 there has been a significant increase in efforts to pursue subrogation against third parties responsible for property damage losses to our insureds. As a result, anticipated subrogation recoveries are reviewed and estimated on a stand-alone basis in the Company’s reserve analysis. Market dynamics in Florida include the continuing expansionuse of assignmentassignments of benefits (“AOB”) and the resulting increase in litigation against the Company. As a result of the continuing and growing use of AOB’sAOBs, as well as the continued overall increase in this manner,represented claims and claims-related abuses in Florida, we have increased our estimates of ultimate losses for the most recent and prior accident years.60Reserve estimates are developed based on the processes and historical development trends discussed in “Item 8 — 8—Note 17 (Liability for Unpaid Losses and Loss Adjustment Expenses)” to the consolidated financial statements. These estimates are considered in conjunction with known facts and interpretations of circumstances and factors including our experience with similar cases, actual claims paid, differing payment patterns and pending levels of unpaid claims, loss management programs, product mix and contractual terms, changes in law and regulation, judicial decisions, and economic conditions. When these types of changes are experienced, actuarial judgment is applied in the determination and selection of development factors in order to better reflect new trends or expectations. For example, if a change in law is expected to have a significant impact on the development of claim severity, actuarial judgment is applied to determine appropriate development factors that will most accurately reflect the expected impact on that specific estimate. ThisAs an example, appropriately describes the reserving methodology selection for useCompany considered and included the effects of the enacted legislation in estimating sinkhole liabilities after the passingdeveloping its ultimate loss projections and reserve estimates as of legislation,December 31, 2023, as noted in “Item 8 —Note8—Note 17 (Liability for Unpaid Losses and Loss Adjustment Expenses)” to the49Changes in homeowners current year claim severity are generally influenced by inflation in the cost of building materials, the cost of construction and property repair services, the cost of replacing home furnishings and other contents, the types of claims that qualify for coverage, deductiblesthe presence of third party representation, such as legal or repair contractors (which serve to inflate claim expenses), and other economic and environmental factors. We employ various loss management programs to mitigate the effecteffects of these factors.Key assumptions that may materially affect the estimate of the reserve for loss and LAE relate to the effects of emerging claim and coverage issues. As industry practices and legal, judicial, social and other environmental conditions change, unexpected and unintended issues related to claimclaims and coveragecoverages may emerge. These issues may adversely affect our business by either extending coverage beyond our underwriting intent, lengthening the time to final settlement, or by increasing the number or size of claims. Key assumptions that are premised on future emergence that are inconsistent with historical loss reserve development patterns include but are not limited to:As loss experience for the current year develops for each type of loss, the reserves for loss and LAE are monitored relative to initial assumptions until they are judged to have sufficient statistical credibility. From that point in time and forward, reserves are re-estimated using statistical actuarial processes to reflect the impact loss trends have on development factors incorporated into the actuarial estimation processes.Causes of Reserve Estimate UncertaintySince reserves are estimates of the unpaid portions of claims and claims expenses that have occurred, the establishment of appropriate reserves, including reserves for catastrophes, requires regular reevaluation and refinement of estimates to determine ultimate loss and LAE estimates.At each reporting date, the highest degree of uncertainty in reserve estimates arises from claims remaining to be settled for the current accident year and the most recent preceding accident year, and claims that have occurred but have not been reported. The estimate for the current accident year contains the greatest degree of uncertainty because it contains the greatest proportion of losses that have not been reported or settled but must be estimated as of the current reporting date. During the first year after the end of an accident year, a large portion of the total losses for that accident year are settled. When accident year losses paid through the end of the first year following the initial accident year are incorporated into updated actuarial estimates, the trends inherent in the settlement of claims emerge more clearly. Consequently, this is the point in time at which the largest re-estimates of losses for an accident year can occur. After the second year, the losses paid for the accident year typically relate to claims that are more difficult to settle, such as those involving litigation.Reserves for Catastrophe LossesLoss and LAE reserves also include reserves for catastrophe losses. Catastrophe losses are an inherent risk of the property-casualty insurance industry that have contributed, and will continue to contribute, to potentially material year-to-year fluctuations in results of operations and financial position. A catastrophe is an event that produces significant insured losses before reinsurance and involves multiple first party policyholders, or an event that produces a number of claims in excess of a preset, per-event threshold of average claims in a specific area, occurring within a certain amount of time following the event. Catastrophes are commonly caused by various natural events including high winds, tornadoes, wildfires, winter storms, tropical storms and hurricanes.5061The estimation of claims and claims expense reserves for catastrophes also comprises estimates of losses from reported and unreported claims, primarily for damage to property. In general, estimates for catastrophe reserves are based on claim adjuster inspections and the application of historical loss development factors as described previously and in “Item 8 —Note8—Note 17 (Liability for Unpaid Losses and Loss Adjustment Expenses)” to the consolidated financial statements. However, depending on the nature of the catastrophe, as noted above, the estimation process can be further complicated. For example, for hurricanes, complications could include the inability of insureds to be able to promptly report losses, a prevalence of solicited and late-reported claims creating or compounding challenges with determining the cause and amount of loss, limitations placed on claims adjusting staff affecting their ability to inspect losses, determining whether losses are covered by our homeowners policy (generally for damage caused by wind or wind driven rain) or are specifically excluded from coverage such as losses caused by flood, estimating additional living expenses or assessing the impact of demand surge and exposure to mold damage. The effects of numerous other considerations, include the timing of a catastrophe in relation to other events, such as at or near the end of a financial reporting period, which can affect the availability of information needed to estimate reserves for that reporting period. In these situations, practices are adapted to accommodate these circumstances in order to determine a best estimate of losses from a catastrophe.Key Actuarial Assumptions That Affect the Loss and LAE EstimateThe aggregation of estimates for reported losses and IBNR forms the reserve liability recorded in the Consolidated Balance Sheets.At any given point in time, the recorded loss reserve representsand LAE reserves represent our best estimate of the ultimate settlement and administration cost of insured claims incurred and unpaid. Since the process of estimating loss and LAE reserves requires significant judgment due to a number of variables, such as fluctuations in inflation, judicial decisions, legislative changes and changes in claims handling procedures, ultimate liability may exceed or be less than these estimates. Reserves for losses and LAE are revised as additional information becomes available, and adjustments, if any, are reflected in earnings in the periods in which they are determined.In selecting development factors and averages described in “Item 8 —Note8—Note 17 (Liability for Unpaid Losses and Loss Adjustment Expenses)” to the consolidated financial statements, due consideration is given to how the historical experience patterns change from one year to the next over the course of several consecutive years of recent history. Predictions surrounding these patterns drive the estimates that are produced by each method, and are based on statistical techniques that follow standard actuarial practices.In compliance with annual statutory reporting requirements, our appointed independent actuary provides a Statement of Actuarial Opinion (“SAO”) indicating that carried loss and LAE reserves recorded at each annual balance sheet date make a reasonable provision for all of the Insurance Entities’ unpaid loss and LAE obligations under the terms of contracts and agreements with our policyholders. Recorded reserves are compared to the indicated range provided in the actuary’s report accompanying the SAO. At December 31, 2017,2023, the recorded amount for net loss and LAE falls within the range determined by the Company’s appointed independent actuaries and approximates their best estimate.Potential Reserve Estimate VariabilityThe methods employed by actuaries include a range of estimated unpaid losses, each reflecting a level of uncertainty. Projections of loss and LAE liabilities are subject to potentially large variability in the estimation process since the ultimate disposition of claims incurred prior to the financial statement date, whether reported or not, is subject to the outcome of events that have not yet occurred. Examples of these events include jury decisions, court interpretations, legislative changes, public attitudes, and social/economic conditions such as inflation. Any estimate of future costs is subject to the inherent limitation on one’s ability to predict the aggregate course of future events. It should therefore be expected that the actual emergence of losses and LAE will vary, perhaps materially, from any estimate.In selecting the range of reasonable estimates, the range of indications produced by the various methods is inspected,evaluated, the relative strengths and weaknesses of each method are considered, and from those inputs a range of estimates can be selected. For reasons cited above, this range of estimated ultimate losses is typically smaller for older, more mature accident periods and greater for more recent, less mature accident periods. The greatest level of uncertainty is associated with the most recent accident years, and particularly years during which catastrophe events occurred.The inherent uncertainty associated with our loss and LAE liability is magnified due to our concentration of property business in catastrophe-exposed coastaland litigious states, primarily Florida. As anIn 2018, for example, loss and expense payments for Hurricane Irma claims exceeded initial liability estimates that were established at year-end 2017, which was shortly after the 2004 and 2005 hurricanes created great uncertainty in determining ultimate losses for these natural catastrophesevent occurred. This unexpected development was partially due to issues relatedthe influence of plaintiff attorneys in the claim filing process; both at initial contact prior to applicabilitycoverage validation or damage assessment, and after claims were settled and closed which resulted in a large number of deductibles, availability and cost of repair services and materials, and other factors.claims being reopened during the year. In 2019, UPCIC experiencedcontinued to experience unanticipated unfavorable loss development on catastrophe losses from claims related to 2004 and 2005 being reopened and new claims being opened due to public adjusters encouraging policyholders to file new claims, and from homeowners’ association assessments related to condominium policies.claims. Due to the relatively low frequency and inherent uncertainty of catastrophe events, the parameters of theutilized in loss estimation methodologies are updated on an annual basis aswhenever new information emerges.5162TableThe following table summarizes the effect on net loss and LAE reserves and net loss, net of ContentsYear ended December 31, 2023 Percent Change in Change in Reserves Reserves Net Income -20.0% $ 408,094 (115) % -15.0% 433,599 (87) % -10.0% 459,105 (58) % -5.0% 484,611 (29) % Base 510,117 — 5.0% 535,623 29 % 10.0% 561,129 58 % 15.0% 586,635 87 % 20.0% 612,140 115 % Adequacy of Reserve EstimatesWe believe our net loss and LAE reserves are appropriately established based on available methodology, facts, technology, laws, and regulations. We calculate and record a single best reserve estimate, in conformance with generally accepted actuarial standards, for reported and unreported losses and IBNRLAE losses and as a result we believe no other estimate is better than our recorded amount.Due to the uncertainties involved, the ultimate cost of losses and LAE may vary materially from recorded amounts, which are based on our best estimates. The liability for unpaid losses and LAE at December 31, 20172023 is $248.4$510.1 million.Recent Accounting Pronouncements Not Yet AdoptedIn December 2023, the Financial Accounting Standards Board (“FASB”) issued Accounting Standards Update (“ASU”) No. 2023-09, Income Taxes (Topic 740), which will require that public business entities on an annual basis (1) disclose specific categories in the rate reconciliation and (2) provide additional information for reconciling items that meet a quantitative threshold (if the effect of those reconciling items is equal to or greater than 5 percent of the amount computed by multiplying pretax income [or loss] by the applicable statutory income tax rate). The impact to our consolidated financial statements, if any, will be dependent on the timing and terms of any future modifications related to a change in effective tax rate. The amendments in this ASU are effective for annual periods beginning after December 15, 2024.NON-GAAP FINANCIAL MEASURESNon-GAAP financial measures should be considered in addition to, and not as a substitute for or superior to, financial measures presented in accordance with GAAP. For more information regarding our key performance indicators, please refer to the section titled “Management’s Discussion and Analysis of Financial Condition and Results of Operations – Key Performance Indicators.”The following table presents the reconciliation of GAAP revenue (total premiums earned and other revenues) to core revenue, which is a non-GAAP measure (in thousands):Years Ended December 31, 2023 2022 2021 GAAP revenue $ 1,391,582 $ 1,222,658 $ 1,121,851 less: Net realized gains (losses) on investments (1,229) 348 5,892 less: Net change in unrealized gains (losses) on investments 12,046 (13,145) (4,032) Core Revenue $ 1,380,765 $ 1,235,455 $ 1,119,991 63The following table presents the reconciliation of GAAP operating income (loss) to adjusted operating income (loss), which is a non-GAAP measure (in thousands):Years Ended December 31, 2023 2022 2021 GAAP income (loss) before income tax expense (benefit) $ 88,349 $ (27,247) $ 28,413 add: Interest and amortization of debt issuance costs 6,531 6,609 638 GAAP operating income (loss) 94,880 (20,638) 29,051 less: Net realized gains (losses) on investments (1,229) 348 5,892 less: Net changes in unrealized gains (losses) on investments 12,046 (13,145) (4,032) Adjusted operating income (loss) $ 84,063 $ (7,841) $ 27,191 The following table presents the reconciliation of operating income (loss) margin to adjusted operation income (loss) margin, which is a non-GAAP measure (in thousands):Years Ended December 31, 2023 2022 2021 GAAP operating income (loss) $ 94,880 $ (20,638) $ 29,051 GAAP revenue 1,391,582 1,222,658 1,121,851 GAAP operating income (loss) margin 6.8 % (1.7) % 2.6 % Adjusted operating income (loss) 84,063 (7,841) 27,191 Core revenue 1,380,765 1,235,455 1,119,991 Adjusted operating income (loss) margin 6.1 % (0.6) % 2.4 % The following table presents the reconciliation of GAAP net income (loss) available to common stockholders to adjusted net income (loss) available to common stockholders, which is a non-GAAP measure (in thousands):Years Ended December 31, 2023 2022 2021 GAAP net income (loss) $ 66,823 $ (22,257) $ 20,407 less: Preferred dividends 10 10 10 GAAP net income (loss) available to common stockholders 66,813 (22,267) 20,397 less: Net realized gains (losses) on investments (1,229) 348 5,892 less: Net changes in unrealized gains (losses) on investments 12,046 (13,145) (4,032) add: Income tax effect on above adjustments 2,661 (3,148) 422 Adjusted net income (loss) available to common stockholders $ 58,657 $ (12,618) $ 18,959 Weighted average common shares outstanding - Diluted 30,147 30,751 31,307 Diluted earnings (loss) per common share $ 2.22 $ (0.72) $ 0.65 Diluted adjusted earnings (loss) per common share $ 1.95 $ (0.41) $ 0.61 64The following table presents the reconciliation of GAAP stockholders’ equity to adjusted stockholders’ equity and book value per common share to adjusted book value per common share, which is a non-GAAP measure (in thousands):As of December 31, December 31, December 31, 2023 2022 2021 GAAP Stockholders' equity $ 341,297 $ 287,896 $ 429,702 less: Preferred equity 100 100 100 Common stockholders' equity 341,197 287,796 429,602 less: Accumulated other comprehensive income (loss), net of taxes (74,172) (103,782) (15,568) Adjusted common stockholders' equity $ 415,369 $ 391,578 $ 445,170 Common shares outstanding 28,966 30,389 31,221 Book value per common share $ 11.78 $ 9.47 $ 13.76 Adjusted book value per common share $ 14.34 $ 12.89 $ 14.26 The following table presents the reconciliation of GAAP ROCE to adjusted ROCE, which is a non-GAAP measure (in thousands):Years Ended December 31, 2023 2022 2021 Actual net income (loss) available to common stockholders' 66,813 (22,267) 20,397 Average common stockholders' equity 314,497 358,699 439,382 ROCE 21.2 % (6.2) % 4.6 % Adjusted net income (loss) available to common stockholders $ 58,657 $ (12,618) $ 18,959 Adjusted average common stockholders' equity* $ 399,396 $ 423,199 $ 444,776 Adjusted ROCE 14.7 % (3.0) % 4.3 % *Adjusted average common stockholders’ equity excludes current period after-tax net realized gains (losses) on investments and net change in unrealized gains (losses) on investments.ITEM 7A. QUANTITATIVE AND QUALITATIVE DISCLOSURES ABOUT MARKET RISK Market risk is the potential for economic losses due to adverse changes in fair market value of available-for-sale debt securities, equity securities (“Financial Instruments”), and investment real estate. We carry all of our Financial Instruments at fair market value and investment real estate at net book value in our statement of financial condition. Our investment portfolio as of December 31, 2023 is comprised of available-for-sale debt securities and equity securities, carried at fair market value, which expose us to changing market conditions, specifically interest rates and equity price changes.The primary objectives of the investment portfolio are the preservation of capital and providing adequate liquidity for potential claim payments and other cash needs. The portfolio’s secondary investment objective is to provide a total rate of return with an emphasis on investment income. None of our investments in risk-sensitive Financial Instruments were entered into for trading purposes.See “Part II—Item 8—Note 3 (Investments)” and “Item 1—Business—Investments” for more information about our Financial Instruments.Interest Rate RiskInterest rate risk is the sensitivity of the fair market value of a fixed-rate Financial Instrument to changes in interest rates. Generally, when interest rates rise, the fair market value of our fixed-rate Financial Instruments declines.65The following tables provide information about our fixed income Financial Instruments as of December 31, 2023 compared to December 31, 2022, which are sensitive to changes in interest rates. The tables present the expected cash flows of Financial Instruments based on years to effective maturity using amortized cost compared to fair market value and the related book yield compared to coupon yield (dollars in thousands):December 31, 2023 2024 2025 2026 2027 2028 Thereafter Other Total Amortized cost $ 92,428 $ 160,575 $ 185,761 $ 166,111 $ 103,731 $ 450,811 $ 3,502 $ 1,162,919 Fair market value $ 91,247 $ 153,712 $ 173,781 $ 153,506 $ 97,304 $ 391,765 $ 3,015 $ 1,064,330 Coupon rate 2.77 % 2.96 % 2.73 % 2.71 % 3.41 % 3.02 % 4.22 % 2.94 % Book yield 2.34 % 2.16 % 2.01 % 2.11 % 2.94 % 2.49 % 1.38 % 2.34 % * Years to effective maturity - 4.6 years December 31, 2022 2023 2024 2025 2026 2027 Thereafter Other Total Amortized cost $ 76,691 $ 108,112 $ 141,162 $ 157,809 $ 162,156 $ 504,378 $ 2,544 $ 1,152,852 Fair market value $ 75,226 $ 103,211 $ 129,284 $ 140,825 $ 143,000 $ 420,963 $ 2,117 $ 1,014,626 Coupon rate 1.80 % 2.51 % 2.69 % 2.44 % 2.65 % 2.88 % 4.35 % 2.65 % Book yield 1.56 % 1.31 % 1.58 % 1.54 % 1.88 % 2.23 % 4.24 % 1.88 % * Years to effective maturity - 5.0 years All securities, except those with perpetual maturities, were categorized in the tables above utilizing years to effective maturity. Effective maturity takes into consideration all forms of potential prepayment, such as call features or prepayment schedules, that shorten the lifespan of contractual maturity dates.Equity Price RiskEquity price risk is the potential for loss in fair value of Financial Instruments in common stock and mutual funds from adverse changes in the prices of those Financial Instruments.The following table provides information about the Financial Instruments in our investment portfolio subject to price risk as of the dates presented (in thousands):December 31, 2023 December 31, 2022 Fair Value Percent Fair Value Percent Equity Securities: Common stock $ 15,438 19.2 % $ 15,313 17.9 % Mutual funds 65,057 80.8 % 70,156 82.1 % Total equity securities $ 80,495 100.0 % $ 85,469 100.0 % A hypothetical decrease of 20% in the market prices of each of the equity securities held at December 31, 2023 and 2022 would have resulted in a decrease of $16.1 million and $17.1 million, respectively, in the fair value of those securities.ITEM 8. FINANCIAL STATEMENTS AND SUPPLEMENTARY DATA PAGE Report of Independent Registered Public Accounting Firm(PCAOB ID: 166)66Report of Independent Registered Public Accounting FirmTo the Stockholders and Board of DirectorsUniversal Insurance Holdings, Inc.Opinions on the Financial Statements and Internal Control over Financial ReportingWe have audited the accompanying consolidated balance sheets of Universal Insurance Holdings, Inc. (the “Company”) as of December 31, 2023 and 2022, the related consolidated statements of income, comprehensive income, stockholders' equity, and cash flows for each of the years in the three-year period ended December 31, 2023, and the related notes (collectively referred to as the “financial statements”). We also have audited the Company's internal control over financial reporting as of December 31, 2023, based on criteria established in Internal Control-Integrated Framework (2013) issued by the Committee of Sponsoring Organizations of the Treadway Commission (the “COSO framework”).In our opinion, the financial statements referred to above present fairly, in all material respects, the financial position of the Company as of December 31, 2023 and 2022, and the results of its operations and its cash flows for each of the years in the three-year period ended December 31, 2023, in conformity with accounting principles generally accepted in the United States of America. Also in our opinion, the Company maintained, in all material respects, effective internal control over financial reporting as of December 31, 2023, based on criteria established in the COSO framework.Basis for OpinionThe Company's management is responsible for these financial statements, for maintaining effective internal control over financial reporting, and for its assessment of the effectiveness of internal control over financial reporting, included in the accompanying “Management’s Report on Internal Control Over Financial Reporting.” Our responsibility is to express an opinion on the Company’s financial statements and an opinion on the Company's internal control over financial reporting based on our audits. We are a public accounting firm registered with the Public Company Accounting Oversight Board (United States) (the “PCAOB”) and are required to be independent with respect to the Company in accordance with the U.S. federal securities laws and the applicable rules and regulations of the Securities and Exchange Commission and the PCAOB.We conducted our audits in accordance with the standards of the PCAOB. Those standards require that we plan and perform the audits to obtain reasonable assurance about whether the financial statements are free of material misstatement, whether due to error or fraud, and whether effective internal control over financial reporting was maintained in all material respects.Our audits of the financial statements included performing procedures to assess the risks of material misstatement of the financial statements, whether due to error or fraud, and performing procedures that respond to those risks. Such procedures included examining, on a test basis, evidence regarding the amounts and disclosures in the financial statements. Our audits also included evaluating the accounting principles used and significant estimates made by management, as well as evaluating the overall presentation of the financial statements. Our audit of internal control over financial reporting included obtaining an understanding of internal control over financial reporting, assessing the risk that a material weakness exists, and testing and evaluating the design and operating effectiveness of internal control based on the assessed risk. Our audits also included performing such other procedures as we considered necessary in the circumstances. We believe that our audits provide a reasonable basis for our opinions.Definition and Limitations of Internal Control over Financial ReportingA company's internal control over financial reporting is a process designed to provide reasonable assurance regarding the reliability of financial reporting and the preparation of financial statements for external purposes in accordance with generally accepted accounting principles. A company's internal control over financial reporting includes those policies and procedures that (1) pertain to the maintenance of records that, in reasonable detail, accurately and fairly reflect the transactions and dispositions of the assets of the company; (2) provide reasonable assurance that transactions are recorded as necessary to permit preparation of financial statements in accordance with generally accepted accounting principles, and that receipts and expenditures of the company are being made only in accordance with authorizations of management and directors of the company; and (3) provide reasonable assurance regarding prevention or timely detection of unauthorized acquisition, use, or disposition of the company's assets that could have a material effect on the financial statements.Because of its inherent limitations, internal control over financial reporting may not prevent or detect misstatements. Also, projections of any evaluation of effectiveness to future periods are subject to the risk that controls may become inadequate because of changes in conditions, or that the degree of compliance with the policies or procedures may deteriorate.Critical Audit MatterThe critical audit matter communicated below is a matter arising from the current period audit of the financial statements that was communicated or required to be communicated to the audit committee and that (1) relates to accounts or disclosures that67are material to the financial statements and (2) involved especially challenging, subjective, or complex judgments. The communication of critical audit matters does not alter in any way our opinion on the financial statements, taken as a whole, and we are not, by communicating the critical audit matter below, providing a separate opinion on the critical audit matter or on the accounts or disclosures to which it relates.Liability for Unpaid Losses and Loss Adjustment Expenses - Refer to Notes 2 and 17 to the Financial StatementsCritical Audit Matter DescriptionThe Company’s estimated liability for unpaid losses and loss adjustment expenses (LAE) totaled $510.1 million at December 31, 2023. The balance consists of three components: (1) an amount determined from current loss reports for individual cases reported but unpaid based on past experience of similar cases settled, (2) an amount for claims incurred but not reported and development of reported claims based on a range of actuarial methodologies and assumptions, and (3) an amount for expenses for investigating and the settlement of reported and unreported claims. Estimating the liability for unpaid losses and LAE requires significant judgment relating to factors such as claim development patterns, severity, type and jurisdiction of loss, economic conditions, legislative developments, and a variety of actuarial assumptions. Management engages an independent actuarial firm to prepare an actuarial analysis of unpaid losses and LAE and provide a statement of actuarial opinion on management’s estimate of unpaid losses and LAE. Estimating the liability for unpaid losses and LAE is inherently uncertain, dependent on management’s judgment, and significantly impacted by claim and actuarial factors and conditions that may change over time. The ultimate settlement of unpaid losses and LAE may vary materially from the recorded liability, and such variance may adversely affect the Company’s financial results. For these reasons, we identified the estimate of unpaid losses and LAE as a critical audit matter, as it involved especially subjective auditor judgment.How the Critical Audit Matter was Addressed in the AuditsOur audit procedures related to the liability for unpaid losses and LAE included the following, among others:•We obtained an understanding, evaluated the design, and tested the operating effectiveness of key controls over the process and data used by management to estimate the liability for unpaid losses and LAE, including those controls related to the estimation and management’s review of the estimated liability for unpaid losses and LAE.•We tested the completeness, integrity, and accuracy of the underlying data used by the Company’s actuary, such as paid loss data, case reserve data, loss adjustment expense data, and loss development tables.•We evaluated management’s prior year estimate for unpaid losses and LAE and the factors leading to changes in the estimate recognized in the current year. With the assistance of our actuarial specialist, we assessed the reasonableness of management’s revisions to the estimate for unpaid losses and LAE.•With assistance from our actuarial specialist, we evaluated the appropriateness and respective weighting of the actuarial methodologies selected by management used to develop the unpaid losses and LAE reserve estimate. As part of this evaluation, we tested the reasonableness of significant assumptions by comparing them to current and forecasted company and industry data./s/ Plante & Moran, PLLCWe have served as the Company’s auditor since 2002.East Lansing, MichiganFebruary 28, 202468UNIVERSAL INSURANCE HOLDINGS, INC. AND SUBSIDIARIESCONSOLIDATED BALANCE SHEETS(in thousands, except per share data)As of December 31, 2023 2022 ASSETS Available-for-sale debt securities, at fair value, net of allowance for credit loss of $566 and $920 (amortized cost: $1,162,919 and $1,152,852) $ 1,064,330 $ 1,014,626 Equity securities, at fair value (cost: $91,052 and $102,431) 80,495 85,469 Other investments, at fair value (cost: $4,794 and $0) 10,434 — Investment real estate, net 5,525 5,711 Total invested assets 1,160,784 1,105,806 Cash and cash equivalents 397,306 388,706 Restricted cash and cash equivalents 2,635 2,635 Prepaid reinsurance premiums 236,254 282,427 Reinsurance recoverable 219,102 808,850 Premiums receivable, net 77,064 69,574 Property and equipment, net 47,628 51,404 Deferred policy acquisition costs 109,985 103,654 Income taxes recoverable — 1,528 Deferred income tax asset, net 43,175 57,258 Other assets 22,628 18,312 Total assets $ 2,316,561 $ 2,890,154 LIABILITIES AND STOCKHOLDERS’ EQUITY LIABILITIES: Unpaid losses and loss adjustment expenses $ 510,117 $ 1,038,790 Unearned premiums 990,559 943,854 Advance premium 48,660 54,964 Income taxes payable 5,886 — Book overdraft 14,597 — Reinsurance payable, net 191,850 384,504 Commission payable 20,989 18,541 Other liabilities and accrued expenses 90,600 58,836 Long-term debt, net 102,006 102,769 Total liabilities 1,975,264 2,602,258 Commitments and Contingencies (Note 15) STOCKHOLDERS’ EQUITY: Cumulative convertible preferred stock, $.01 par value — — Authorized shares - 1,000 Issued shares - 10 and 10 Outstanding shares - 10 and 10 Minimum liquidation preference - $9.99 and $9.99 per share Common stock, $.01 par value 472 472 Authorized shares - 55,000 Issued shares - 47,269 and 47,179 Outstanding shares - 28,966 and 30,389 Treasury shares, at cost - 18,303 and 16,790 (260,779) (238,758) Additional paid-in capital 115,086 112,509 Accumulated other comprehensive income (loss), net of taxes (74,172) (103,782) Retained earnings 560,690 517,455 Total stockholders’ equity 341,297 287,896 Total liabilities and stockholders’ equity $ 2,316,561 $ 2,890,154 The accompanying notes to consolidated financial statements are an integral part of these statements.69UNIVERSAL INSURANCE HOLDINGS, INC. AND SUBSIDIARIESCONSOLIDATED STATEMENTS OF INCOME(in thousands, except per share data)For the Years Ended December 31, 2023 2022 2021 REVENUES Direct premiums written $ 1,921,833 $ 1,845,786 $ 1,671,252 Change in unearned premium (46,704) (86,085) (74,634) Direct premium earned 1,875,129 1,759,701 1,596,618 Ceded premium earned (623,193) (631,075) (561,155) Premiums earned, net 1,251,936 1,128,626 1,035,463 Net investment income 48,449 25,785 12,535 Net realized gains (losses) on investments (1,229) 348 5,892 Net change in unrealized gains (losses) on investments 12,046 (13,145) (4,032) Commission revenue 54,058 53,168 41,649 Policy fees 18,881 20,182 22,713 Other revenue 7,441 7,694 7,631 Total revenues 1,391,582 1,222,658 1,121,851 OPERATING COSTS AND EXPENSES Losses and loss adjustment expenses 992,636 938,399 779,205 General and administrative expenses 304,066 304,897 313,595 Total operating costs and expenses 1,296,702 1,243,296 1,092,800 Interest and amortization of debt issuance costs 6,531 6,609 638 INCOME (LOSS) BEFORE INCOME TAX EXPENSE (BENEFIT) 88,349 (27,247) 28,413 Income tax expense (benefit) 21,526 (4,990) 8,006 NET INCOME (LOSS) $ 66,823 $ (22,257) $ 20,407 Basic earnings (loss) per common share $ 2.24 $ (0.72) $ 0.65 Weighted average common shares outstanding - Basic 29,829 30,751 31,218 Diluted earnings (loss) per common share $ 2.22 $ (0.72) $ 0.65 Weighted average common shares outstanding - Diluted 30,147 30,751 31,307 Cash dividend declared per common share $ 0.77 $ 0.77 $ 0.77 CONSOLIDATED STATEMENTS OF COMPREHENSIVE INCOME For the Years Ended December 31, 2023 2022 2021 Net income (loss) $ 66,823 $ (22,257) $ 20,407 Other comprehensive income (loss), net of taxes 29,610 (88,214) (18,911) Comprehensive income (loss) $ 96,433 $ (110,471) $ 1,496 The accompanying notes to consolidated financial statements are an integral part of these statements.70UNIVERSAL INSURANCE HOLDINGS, INC. AND SUBSIDIARIESCONSOLIDATED STATEMENTS OF STOCKHOLDERS’ EQUITYFOR THE YEARS ENDED DECEMBER 31, 2023, 2022 and 2021(in thousands, except per share data)Treasury Shares Common
Shares
IssuedPreferred
Shares
IssuedCommon
Stock
AmountPreferred
Stock
AmountAdditional
Paid-In
CapitalRetained
EarningsAccumulated
Other
Comprehensive
Income (Loss)Treasury
StockTotal
Stockholders’
EquityBalance, December 31, 2020 (15,680) 46,817 10 $ 468 $ — $ 103,445 $ 567,512 $ 3,343 $ (225,506) $ 449,262 Vesting of performance share units (16) (1) 62 — — — — — — (241) (241) Vesting of restricted stock units (53) (1) 208 — 2 — (2) — — (815) (815) Retirement of treasury shares 69 (1) (69) — — — (1,056) — — 1,056 — Purchases of treasury stock (117) — — — — — — — (1,609) (1,609) Share-based compensation — — — — — 5,815 — — — 5,815 Net income (loss) — — — — — — 20,407 — — 20,407 Other comprehensive income (loss), net of taxes — — — — — — — (18,911) — (18,911) Declaration of dividends($0.77 per common share and$1.00 per preferred share)— — — — — — (24,206) — — (24,206) Balance, December 31, 2021 (15,797) 47,018 10 470 — 108,202 563,713 (15,568) (227,115) 429,702 Vesting of performance share units (9) (1) 33 — 1 — (1) — — (104) (104) Grants of restricted stock awards — (1) 53 — — — — — — — — Vesting of restricted stock units (27) (1) 111 — 1 — (1) — — (314) (314) Retirement of treasury shares 36 (1) (36) — — — (418) — — 418 — Purchases of treasury stock (993) — — — — — — — (11,643) (11,643) Share-based compensation — — — — — 4,727 — — — 4,727 Net income (loss) — — — — — — (22,257) — — (22,257) Other comprehensive income (loss), net of taxes — — — — — — — (88,214) — (88,214) Declaration of dividends($0.77 per common share and$1.00 per preferred share)— — — — — — (24,001) — — (24,001) Balance, December 31, 2022 (16,790) 47,179 10 472 — 112,509 517,455 (103,782) (238,758) 287,896 Vesting of performance share units (6) (1) 16 — — — — — — (64) (64) Grants of restricted stock awards — (1) 36 — — — — — — — — Vesting of restricted stock units (16) (1) 48 — — — — — — (160) (160) Stock option exercises (82) (1) 94 — — — 1,391 — — (115) 1,276 Retirement of treasury shares 104 (1) (104) — — — (1,730) — — 339 (1,391) Purchases of treasury stock (1,513) — — — — — — — (22,021) (22,021) Share-based compensation — — — — — 5,006 — — — 5,006 Other (2) — — — — — (2,090) — — — (2,090) Net income (loss) — — — — — — 66,823 — — 66,823 Other comprehensive income (loss), net of taxes — — — — — — — 29,610 — 29,610 Declaration of dividends($0.77 per common share and$1.00 per preferred share)— — — — — — (23,588) — — (23,588) Balance, December 31, 2023 (18,303) 47,269 10 $ 472 $ — $ 115,086 $ 560,690 $ (74,172) $ (260,779) $ 341,297 (1) All shares acquired represent shares tendered to cover the strike price for options and tax withholdings on the intrinsic value of stock options exercised, restricted stock vested, performance share units vested, or restricted stock units vested. These shares have been cancelled by the Company. (2) The Other line within Paid-in Capital includes $2.1 million in connection with the cash settlement of certain restricted stock units. The accompanying notes to consolidated financial statements are an integral part of these statements. 71UNIVERSAL INSURANCE HOLDINGS, INC. AND SUBSIDIARIESCONSOLIDATED STATEMENTS OF CASH FLOWS(in thousands)For the Years Ended December 31, 2023 2022 2021 Cash flows from operating activities: Net Income (loss) $ 66,823 $ (22,257) $ 20,407 Adjustments to reconcile net income (loss) to net cash provided by operating activities: Bad debt expense 504 708 463 Depreciation and amortization 7,313 7,296 6,913 Amortization of share-based compensation 2,916 4,727 5,815 Amortization of debt issuance costs 708 703 56 Provision for (or reversal of) credit losses on available-for-sale debt securities (354) 431 303 Book overdraft increase (decrease) 14,597 (26,759) (32,640) Net realized (gains) losses on sale of investments 1,229 (348) (5,892) Net change in unrealized (gains) losses on investments (12,046) 13,145 4,032 Amortization of premium/accretion of discount, net 6,563 8,125 9,730 Deferred income taxes 4,409 (12,126) (4,267) Excess tax (benefit) shortfall from share-based compensation (20) 222 661 Loss (gain) on disposal of assets 642 (21) 148 Net change in assets and liabilities relating to operating activities: Prepaid reinsurance premiums 46,173 (41,434) (25,270) Reinsurance recoverable 589,748 (623,261) (25,172) Income taxes payable 5,886 — — Premiums receivable, net (7,992) (5,358) 1,495 Accrued investment income (1,332) (2,059) (1,256) Income taxes recoverable 1,548 15,197 12,968 Deferred policy acquisition costs, net (6,331) 5,168 1,792 Other assets (3,000) (853) 697 Unpaid losses and loss adjustment expenses (528,673) 692,574 23,751 Unearned premiums 46,705 86,085 74,634 Commission payable 2,448 (3,774) (1,494) Reinsurance payable, net (192,654) 195,842 178,351 Other liabilities and accrued expenses 31,465 31,272 (15,979) Advance premium (6,304) 1,270 4,132 Net cash provided by (used in) operating activities 70,971 324,515 234,378 Cash flows from investing activities: Proceeds from sale of property and equipment 42 97 162 Purchases of property and equipment (4,019) (4,899) (7,226) Purchases of equity securities (33,455) (76,629) (55,447) Purchases of available-for-sale debt securities (146,424) (200,011) (450,383) Purchases of other investments (4,794) — — Purchases of investment real estate, net — (6) (7) Proceeds from sales of equity securities 45,095 34,178 85,103 Proceeds from sales of available-for-sale debt securities 19,222 29,439 96,966 Proceeds from sales of investment real estate — — 2,591 Proceeds from sale of assets held for sale — — 9,296 Maturities of available-for-sale debt securities 109,082 68,970 89,541 Net cash provided by (used in) investing activities (15,251) (148,861) (229,404) Cash flows from financing activities: Proceeds from issuance of long-term debt — — 100,000 Debt issuance costs paid — (140) (3,365) Preferred stock dividend (10) (10) (10) Common stock dividend (23,279) (23,774) (24,191) Purchase of treasury stock (22,021) (11,643) (1,609) Payments related to tax withholding for share-based compensation (339) (418) (1,056) Repayment of debt (1,471) (1,471) (1,471) Net cash provided by (used in) financing activities (47,120) (37,456) 68,298 The accompanying notes to consolidated financial statements are an integral part of these statements.72UNIVERSAL INSURANCE HOLDINGS, INC. AND SUBSIDIARIESCONSOLIDATED STATEMENTS OF CASH FLOWS (continued)(in thousands)For the Years Ended December 31, 2023 2022 2021 Cash and cash equivalents, and restricted cash and cash equivalents: Net increase (decrease) during the period 8,600 138,198 73,272 Balance, beginning of period 391,341 253,143 179,871 Balance, end of period $ 399,941 $ 391,341 $ 253,143 Supplemental cash and non-cash flow disclosures: Interest paid $ 5,823 $ 5,797 $ 127 Income taxes paid $ 9,702 $ 4,202 $ 24 Income tax refund $ 5 $ 12,485 $ 1,381 The following table summarizes our cash and cash equivalents and restricted cash and cash equivalents within the Consolidated Balance Sheets (in thousands):As of December 31, 2023 2022 2021 Cash and cash equivalents $ 397,306 $ 388,706 $ 250,508 Restricted cash and cash equivalents (1) 2,635 2,635 2,635 Total cash and cash equivalents and restricted cash and cash equivalents $ 399,941 $ 391,341 $ 253,143 (1) See “—Note 5 (Insurance Operations),” for a discussion of the nature of the restrictions for restricted cash and cash equivalents.The accompanying notes to consolidated financial statements are an integral part of these statements.73UNIVERSAL INSURANCE HOLDINGS, INC. AND SUBSIDIARIESNOTES TO CONSOLIDATED FINANCIAL STATEMENTSNOTE 1 – NATURE OF OPERATIONS AND BASIS OF PRESENTATIONNature of Operations, Basis of Presentation and ConsolidationUniversal Insurance Holdings, Inc. (“UVE,” and together with its wholly-owned subsidiaries, “the Company”) is a Delaware corporation incorporated in 1990. The Company is a vertically integrated insurance holding company performing all aspects of insurance underwriting, distribution, and claims. Through its wholly-owned insurance company subsidiaries, Universal Property & Casualty Insurance Company (“UPCIC”) and American Platinum Property and Casualty Insurance Company (“APPCIC,” and together with UPCIC, the “Insurance Entities”), the Company is principally engaged in the property and casualty insurance business offered primarily through its network of independent agents. Risk from catastrophic losses is managed through the use of reinsurance agreements. The Company’s primary product is residential homeowners’ insurance offered in 18 states as of December 31, 2023, including Florida, which comprises the majority of the Company’s policies in force. See “—Note 5 (Insurance Operations)” for more information regarding the Company’s insurance operations.The Company generates revenues primarily from the collection of premiums and investment returns on funds invested on cash flows in excess of those retained and used for claims-paying obligations and insurance operations. Other significant sources of revenue include brokerage commissions collected from reinsurers on certain reinsurance programs placed on behalf of the Insurance Entities, policy fees collected from policyholders by the Company’s wholly-owned managing general agent (“MGA”) subsidiary and payment plan fees charged to policyholders who choose to pay their premiums in installments. The Company’s wholly-owned adjusting company receives claims-handling fees from the Insurance Entities. The Insurance Entities are reimbursed for these fees on claims that are subject to recovery under the Insurance Entities’ respective reinsurance programs. These fees, after expenses, are recorded in the Consolidated Financial Statements as an adjustment to losses and loss adjustment expense (“LAE”).The Consolidated Financial Statements have been prepared in conformity with generally accepted accounting principles in the United States of America (“GAAP”). The Consolidated Financial Statements include the accounts of UVE and its wholly-owned subsidiaries, as well as variable interest entities (“VIE”) in which the Company is determined to be the primary beneficiary. All material intercompany balances and transactions have been eliminated in consolidation.To conform to the current period presentation, certain amounts in the prior periods’ consolidated financial statements and notes have been reclassified. Such reclassifications were of an immaterial amount and had no effect on net income or stockholders’ equity.Use of EstimatesThe preparation of financial statements in conformity with GAAP requires management to make estimates and assumptions that affect the reported amounts of assets and liabilities and disclosure of contingent assets and liabilities as of the date of the consolidated financial statements and the reported amounts of revenues and expenses during the reporting periods. The Company’s primary use of estimates is in the recognition of liabilities for unpaid losses, loss adjustment expenses, subrogation recoveries, reinsurance recoveries, and valuation of level 3 investments. Actual results could differ from those estimates.NOTE 2 – SUMMARY OF SIGNIFICANT ACCOUNTING POLICIESRecently Adopted Accounting PronouncementsNoneAccounting PoliciesThe significant accounting policies followed by the Company are summarized as follows:Consolidation Policy: The Financial Statements include the accounts of the Company, its wholly-owned subsidiaries and VIEs in which the Company is determined to be the primary beneficiary. This analysis includes a review of the VIE’s capital structure, related contractual relationships and terms, nature of the VIE’s operations and purpose, nature of the VIE’s interests issued, and the Company’s involvement with the entity. When assessing the need to consolidate a VIE, the Company evaluates the design of the VIE as well as the related risks to which the entity was designed to expose the variable interest holders. The primary beneficiary is the entity that has both (i) the power to direct the activities of the VIE that most significantly affect the entity’s economic performance and (ii) the obligation to absorb losses or the right to receive benefits that could be potentially significant to the VIE. While also considering these factors, the consolidation conclusion depends on the Company’s decision-making ability and its ability to influence activities that significantly affect the economic performance of the VIE.Cash and Cash Equivalents.The Company includes in cash equivalents all short-term, highly liquid investments that are readily convertible to known amounts of cash and have an original maturity of three months or less. These amounts are carried at cost, which approximates fair value. The Company excludes any net negative cash balances from cash and cash equivalents that the Company has with any single financial institution. These amounts represent outstanding checks or drafts not yet74presented to the financial institution and are reclassified to liabilities and presented as book overdraft in the Company’s Consolidated Balance Sheets.Restricted Cash and Cash Equivalents.The Company classifies amounts of cash and cash equivalents that are restricted in terms of their use and withdrawal separately in the face of the Consolidated Balance Sheets. See “—Note 5 (Insurance Operations)” for discussions on the nature of the restrictions.Investment, Securities Available for Sale. The Company’s investments in debt securities and short-term investments are classified as available-for-sale with maturities of greater than three months. Available-for-sale debt securities and short-term investments are recorded at fair value in the Consolidated Balance Sheet, net of any allowance for credit losses, if any. Unrealized gains and losses, excluding the credit loss portion, on available-for-sale debt securities and short-term investments are excluded from earnings and reported as a component of other comprehensive income (“OCI”), net of related deferred taxes until reclassified to earnings upon the consummation of a sales transaction with an unrelated third party. Gains and losses realized on the disposition of available-for-sale debt securities are determined on the first in, first out (“FIFO”) basis and credited or charged to income. Premium and discount on investment securities are amortized and accreted using the interest method and charged or credited to investment income.Allowance for Credit Losses-Available-For-Sale Securities. For available-for-sale debt securities in an unrealized loss position, the Company first assesses whether it intends to sell, or is more likely than not that it will be required to sell, the security before recovery of its amortized cost basis. If either of the criteria regarding intent or requirement to sell is met, the security’s amortized cost basis is written down to fair value through income. For available-for-sale debt securities that do not meet the aforementioned criteria, the Company evaluates whether the decline in fair value has resulted from credit losses or other factors. In making this assessment, management considers the extent to which fair value is less than amortized cost, any changes to the rating of the security by rating agencies, market sentiment, and trends and adverse conditions specifically related to the security, among other quantitative and qualitative factors utilized at establishing an estimate for credit losses. If the assessment indicates that a credit loss exists, the present values of cash flows expected to be collected from the security are compared to the amortized cost basis of the security. If the present value of cash flows expected to be collected is less than the amortized cost basis, a credit loss exists and an allowance for credit losses is recorded for the credit loss, limited by the amount that fair value is less than the amortized cost basis. Any impairment that has not been recorded through an allowance for credit losses is recognized in OCI.Changes in the allowance for credit losses are recorded as a provision for (or reversal of) credit loss expense and are reported as general and administrative expenses. Losses are charged against the allowance when management believes an available-for-sale debt security is confirmed as uncollected or when either of the criteria regarding intent or requirement to sell is met.Accrued interest receivable on available-for-sale securities totaled $8.3 million and $7.0 million as of December 31, 2023 and December 31, 2022, respectively and is evaluated in the estimate for credit losses. Accrued interest receivable is included under Other Assets in the Consolidated Balance Sheet.Investment, Equity Securities.The Company’s investments in equity securities are recorded at fair value in the Consolidated Balance Sheet with changes in the fair value of equity securities reported in current period earnings in the Consolidated Statements of Income within net change in unrealized gains (losses) on investments as they occur.Investment Real Estate.Investment real estate is recorded at cost less accumulated depreciation. Depreciation is calculated on a straight-line basis over the estimated useful life of the assets. Real estate taxes, interest, and other costs incurred during development and construction of properties are capitalized. Income and expenses from income producing real estate are reported under net investment income. Investment real estate is evaluated for impairment when events or circumstances indicate the carrying value may not be recoverable.Other Investments.The inputs used by management in estimating the fair value of Level 3 investments may include valuations and other reporting provided by representatives of the portfolio companies, original transaction prices, recent transactions for identical or similar instruments, and comparisons to fair values of comparable investments, and may include adjustments to reflect illiquidity or non-transferability. The Company has policies with respect to its investments, which may assist the Company in assessing the quality of information provided by, or on behalf of, each portfolio investment and in determining whether such information continues to be provided by a reliable source or whether further investigation is necessary. Any such investigation, as applicable, may or may not require management to forego its normal reliance on the value supplied by, or on behalf of, such portfolio investment and to independently recommend the fair value of the Company’s interest in such portfolio investments for approval by the Board, consistent with the Company’s valuation procedures.Assets Held for Sale. The Company considers properties, including land, to be assets held for sale when (1) management commits to a plan to sell the property; (2) it is unlikely that the disposal plan will be significantly modified or discontinued; (3) the property is available for immediate sale in its present condition; (4) actions required to complete the sale of the property have been initiated; (5) sale of the property is probable and the Company expects the completed sale will occur within one year; and (6) the property is actively being marketed for sale at a price that is reasonable given our estimate of current market value. Upon designation of a property as an asset held for sale, we record the property’s value at the lower of its carrying value or its estimated fair value, less estimated costs to sell, and the Company ceases depreciation. Assets held for sale are stated separately in the accompanying Consolidated Balance Sheets. There were no assets held for sale as of December 31, 2023 and December 31, 2022.Property and Equipment.Property and equipment is recorded at cost less accumulated depreciation and is depreciated on the straight-line basis over the estimated useful life of the assets. Estimated useful life of all property and equipment ranges from three years for equipment to twenty-seven-and-one-half years for buildings and improvements. Expenditures for improvements are capitalized and depreciated over the remaining useful life of the asset. Routine repairs and maintenance are expensed as incurred. Software is capitalized and amortized over three years.75Premiums Receivable. Generally, premiums are collected prior to or during the policy period as permitted under the Insurance Entities’ payment plans. Credit risk is minimized through the effective administration of policy payment plans whereby the rules governing policy cancellation minimize circumstances in which the Company extends insurance coverage without having received the corresponding premiums. The Company performs a policy-level evaluation to determine the extent the premiums receivable balance exceeds the unearned premiums balance. Under ASC 326 and given the short-term nature of these receivables, the Company employed the aging method to estimate credit losses by pooling receivables based on the levels of delinquency and evaluating current conditions and reasonable and supportable forecasts. As of the years ended December 31, 2023 and 2022, the Company recorded estimated credit losses of $0.6 million and $0.9 million, respectively.Recognition of Premium Revenues.Direct and ceded premiums are recognized as revenue on a pro rata basis over the policy term or over the term of the reinsurance agreement. The portion of direct premiums that will be earned in the future is deferred and reported as unearned premiums. The portion of ceded premiums that will be earned in the future is deferred and reported as prepaid reinsurance premiums (ceded unearned premiums).Recognition of Commission Revenue. Commission revenue generated from reinsurance brokerage commission earned on ceded premium by the Insurance Entities is recognized pro-rata over the term of the reinsurance agreements which coincides with the completion of the contract drafting, billing, claims settlement, reporting between the parties, and other service obligations under the brokerage agreements to the parties of the reinsurance agreements.Policy Fees.Policy fees, which represents fees paid by policyholders to the MGA’s on all new and renewal insurance policies, are generally recognized as income upon policy inception, which coincides with the completion of our service obligation when the policy is issued.Other Revenue. The Company offers its policyholders the option of paying their policy premiums in full at inception or in installments. The Company charges fees to its policyholders that elect to pay their premium in installments and records such fees as revenue when the service obligation is met by the Company.Deferred Policy Acquisition Costs/Costs. The Company defers direct commissions and premium taxes relating to the successfulacquisition or renewal of insurance policies and defers the costs until recognized as expense over the terms of the policies to which they are related. Deferred Ceding CommissionsWe incurpolicy acquisition costs are recorded at their estimated realizable value.Goodwill.Goodwill arising from the acquisition of a business is initially measured at cost and not subject to amortization. The Company assesses goodwill for potential impairments at the end of each fiscal year, or during the year if an event or other circumstance indicates that the Company may not be able to recover the carrying amount of the asset. Goodwill is included under Other Assets in the Consolidated Balance Sheets.Debt, Net of Debt Issuance Costs. The Company records debt, net in the Consolidated Balance Sheets at carrying value. The Company incurs specific incremental costs in connection with the productionissuance of newthe Company’s debt instruments. These debt issuance costs include issue costs and renewal insurance policies whichother direct costs payable to third parties and are recorded as a direct deduction from the carrying value of the associated debt liability in the Consolidated Balance Sheets. The Company amortizes the deferred and recognizedfinancing costs as interest expense over the lifeterm of the underlying insurance policy. Acquisition costs not yet recognizedrelated debt using the interest method in the Consolidated Statements of Income.Insurance Liabilities. Unpaid losses and loss adjustment expenses (“LAE”) are deferredprovided for as claims are incurred. The provision for unpaid losses and LAE includes: (1) the accumulation of individual case estimates for claims and claim adjustment expenses reported as “Deferred Policy Acquisition Costs”. Acquisition costs are commissions and state premium taxes incurred in acquiring insurance policies that relatedprior to the successful productionclose of newthe accounting period; (2) estimates for unreported claims based on industry data and renewal business. We have collected ceding commissionsactuarial analysis; and (3) estimates of expenses for investigating and adjusting claims based on the experience of the Company and the industry. The Company estimates and accrues its right to subrogate reported or estimated claims against other parties. Subrogated claims are recorded at amounts estimated to be received from certain reinsurersthe subrogated parties, net of related costs and netted against unpaid losses and LAE.Inherent in connection with our usethe estimates of quota share reinsurance contracts. We recordultimate claims and subrogation are expected trends in claim severity, frequency, and other factors that may vary as claims are settled. The amount of uncertainty in the estimates is significantly affected by such factors as the amount of ceding commissions or defer such amounts overclaims experience relative to the termsdevelopment period, knowledge of the applicable reinsurance contracts.actual facts and circumstances, and the amount of insurance risk retained. In addition, the Company’s policyholders are subject to adverse weather conditions, such as hurricanes, tornadoes, ice storms, and tropical storms. The deferred ceding commissions were offset againstactuarial methods for making estimates for unpaid losses, LAE and subrogation recoveries and for establishing the deferred policy acquisition costs with theresulting net result presented as “deferred policy acquisition costs, net” on our Consolidated Balance Sheets. As of December 31, 2017, deferred policy acquisition costs, were $73.1 million compared to deferred policy acquisition costs of $64.9 million as of December 31, 2016.Provision for Premium DeficiencyWedeferredunamortized policy acquisition costs and expected policy maintenance costs under a group of existing policy contracts will exceed anticipated future premiums and investment income. The determination of the provisionpremiums. No accruals for premium deficiency requires estimation of the costs of losses, catastrophic reinsurance and policy maintenance to be incurred and investment income to be earned over the remaining policy period. Management has determined that a provision for premium deficiency was not warrantedwere considered necessary as of December 31, 2017.ReinsuranceIn2023 and 2022.Reinsurance. Ceded written premium is recorded upon the normal courseeffective date of business, we seekthe reinsurance contracts and earned over the contract period. Amounts recoverable from reinsurers are estimated in a manner consistent with the provisions of the reinsurance agreements and consistent with the establishment of the gross insurance liability to the Company. Reinsurance premiums, losses and LAE are accounted for on a basis consistent with those used in accounting for the original policies issued and the terms of the reinsurance contracts. Under ASC 326 and given the short-term nature of these receivables, the Company considered the effects of credit enhancements (i.e. funds withheld liability, letters of credit, and trust arrangements) and other qualitative factors that allowed it to conclude there was no material risk exposure. There is no estimated credit loss allowance as of December 31, 2023 and December 31, 2022.76Income Taxes. The Company accounts for income taxes under the asset and liability method, that recognizes the amount of income taxes payable or refundable for the current year and recognizes deferred tax assets and liabilities based on the tax rates expected to be in effect during the periods in which the temporary differences reverse. Temporary differences arise when income or expenses are recognized in different periods in the consolidated financial statements than on the tax returns. The effect on deferred tax assets and liabilities of a change in tax rates is recognized in income in the period that includes the enactment date. Deferred tax assets are reduced by a valuation allowance if it is more likely than not that all, or some portion, of the benefits related to deferred tax assets will not be realized. Income taxes include both estimated federal and state income taxes.Income (Loss) Per Share of Common Stock. Basic earnings per share excludes dilution and is computed by dividing the Company’s net income (loss) available to common stockholders, by the weighted-average number of shares of Common Stock outstanding during the period. Diluted earnings per share is computed by dividing the Company’s net income (loss) available to common stockholders, by the weighted average number of shares of Common Stock outstanding during the period plus the impact of all potentially dilutive common shares, primarily preferred stock, unvested shares, and options. The dilutive impact of stock options and unvested shares is determined by applying the treasury stock method and the dilutive impact of the preferred stock is determined by applying the “if converted” method.Fair Value Measurements. The Company’s policy is to record transfers of assets and liabilities, if any, between Level 1, Level 2, and Level 3 at their fair values as of the end of each reporting period, consistent with the date of the determination of fair value. There were no transfers during the years ended December 31, 2023 or 2022.Share-based Compensation.The Company accounts for share-based compensation based on the estimated grant-date fair value. The Company recognizes these compensation costs in general and administrative expenses and generally amortizes them on a straight-line basis over the requisite service period of the award, which is the vesting term. Individual tranches of performance-based awards are amortized separately since the vesting of each tranche is either subject to annual measures or time vesting. The fair value of stock option awards is estimated using the Black-Scholes option pricing model with the grant-date assumptions discussed in “—Note 9 (Share-Based Compensation).” The fair value of the restricted share grants, performance share units and restricted stock units are determined based on themarket price on the date of grant.Statutory Accounting. UPCIC and APPCIC are highly regulated and prepare and file financial statements in conformity with the statutory accounting practices prescribed or permitted by the Florida Office of Insurance Regulation (the “FLOIR”) and the National Association of Insurance Commissioners (“NAIC”), which differ from GAAP. The FLOIR requires insurance companies domiciled in Florida to prepare their statutory financial statements in accordance with the NAIC Accounting Practices and Procedures Manual (the “Manual”), as modified by the FLOIR. Accordingly, the admitted assets, liabilities and capital and surplus of UPCIC and APPCIC as of December 31, 2023 and 2022 and the results of operations and cash flows, for the years ended December 31, 2023, 2022 and 2021, for their regulatory filings have been prepared in accordance with statutory accounting principles as promulgated by the FLOIR and the NAIC. The statutory accounting principles are more restrictive than GAAP and are designed primarily to demonstrate the ability to meet obligations to policyholders and claimants.NOTE 3 – INVESTMENTSAvailable-for-Sale SecuritiesThe following table provides the amortized cost and fair value of available-for-sale debt securities as of the dates presented (in thousands):December 31, 2023 Amortized
CostAllowance for Expected Credit Losses Gross
Unrealized
GainsGross
Unrealized
LossesFair Value Debt Securities: U.S. government obligations and agencies $ 23,886 $ — $ 49 $ (677) $ 23,258 Corporate bonds 779,177 (469) 1,097 (64,091) 715,714 Mortgage-backed and asset-backed securities 334,460 — 969 (32,283) 303,146 Municipal bonds 15,916 (4) — (1,873) 14,039 Redeemable preferred stock 9,480 (93) — (1,214) 8,173 Total $ 1,162,919 $ (566) $ 2,115 $ (100,138) $ 1,064,330 77December 31, 2022 Amortized
CostAllowance for Expected Credit Losses Gross
Unrealized
GainsGross
Unrealized
LossesFair Value Debt Securities: U.S. government obligations and agencies $ 12,602 $ — $ — $ (938) $ 11,664 Corporate bonds 788,737 (729) 130 (93,077) 695,061 Mortgage-backed and asset-backed securities 327,166 — 148 (39,707) 287,607 Municipal bonds 14,924 (2) — (2,551) 12,371 Redeemable preferred stock 9,423 (189) — (1,311) 7,923 Total $ 1,152,852 $ (920) $ 278 $ (137,584) $ 1,014,626 The following table provides the credit quality of available-for-sale debt securities with contractual maturities as of the dates presented (dollars in thousands):December 31, 2023 December 31, 2022 % of Total % of Total Average Credit Ratings Fair Value Fair Value Fair Value Fair Value AAA $ 333,516 31.3 % $ 297,475 29.3 % AA 128,249 12.0 % 154,975 15.3 % A 356,090 33.5 % 327,427 32.3 % BBB 245,823 23.1 % 232,316 22.9 % No Rating Available 652 0.1 % 2,433 0.2 % Total $ 1,064,330 100.0 % $ 1,014,626 100.0 % The table above includes credit quality ratings by Standard and Poor’s Rating Services, Inc. (“S&P”), Moody’s Investors Service, Inc. and Fitch Ratings, Inc. The Company has presented the highest rating of the three rating agencies for each investment position.The following table summarizes the amortized cost and fair value of mortgage-backed and asset-backed securities as of the dates presented (in thousands):December 31, 2023 December 31, 2022 Amortized
CostFair Value Amortized
CostFair Value Mortgage-backed securities: Agency $ 165,507 $ 145,686 $ 157,672 $ 133,928 Non-agency 63,729 55,102 60,328 50,478 Asset-backed securities: Auto loan receivables 53,686 52,869 62,128 59,370 Credit card receivables 3,414 3,428 657 612 Other receivables 48,124 46,061 46,381 43,219 Total $ 334,460 $ 303,146 $ 327,166 $ 287,607 78The following tables summarize available-for-sale debt securities, aggregated by major security type and length of time that individual securities have been in a continuous unrealized loss position, for which no allowance for expected credit losses has been recorded as of the dates presented (in thousands):December 31, 2023 Less Than 12 Months 12 Months or Longer Number of
IssuesFair Value Unrealized
LossesNumber of
IssuesFair Value Unrealized
LossesDebt Securities: U.S. government obligations and agencies 3 $ 9,045 $ (108) 5 $ 6,811 $ (569) Corporate bonds 12 1,387 (9) 287 365,893 (37,088) Mortgage-backed and asset-backed securities 18 18,150 (316) 173 216,220 (31,967) Municipal bonds 1 293 (1) 3 7,010 (1,069) Redeemable preferred stock 1 529 (30) 3 1,052 (158) Total 35 $ 29,404 $ (464) 471 $ 596,986 $ (70,851) December 31, 2022 Less Than 12 Months 12 Months or Longer Number of
IssuesFair Value Unrealized
LossesNumber of
IssuesFair Value Unrealized
LossesDebt Securities: U.S. government obligations and agencies 2 $ 2,721 $ (110) 5 $ 8,943 $ (828) Corporate bonds 40 26,563 (2,910) 247 325,992 (46,451) Mortgage-backed and asset-backed securities 64 52,751 (2,974) 146 219,189 (36,733) Municipal bonds — — — 3 6,621 (1,458) Redeemable preferred stock 1 95 (51) — — — Total 107 $ 82,130 $ (6,045) 401 $ 560,745 $ (85,470) Unrealized losses on available-for-sale debt securities in the above table as of December 31, 2023 and 2022 have not been recognized into income as credit losses because the issuers are of high credit quality (investment grade securities), management does not intend to sell and it is likely management will not be required to sell the securities prior to their anticipated recovery, and the decline in fair value is largely due to changes in interest rates and other market conditions. There were no material factors impacting any one category or specific security requiring an accrual for credit loss. The issuers continue to make principal and interest payments on the bonds. The fair value is expected to recover as the bonds approach maturity.The following table presents a reconciliation of the beginning and ending balances for expected credit losses on available-for-sale debt securities (in thousands):Corporate Bonds Municipal Bonds Redeemable
Preferred StockTotal Balance, December 31, 2021 $ 371 $ 1 $ 117 $ 489 Provision for (or reversal of) credit loss expense 358 1 72 431 Balance, December 31, 2022 729 2 189 920 Provision for (or reversal of) credit loss expense (260) 2 (96) (354) Balance, December 31, 2023 $ 469 $ 4 $ 93 $ 566 See “—Note 2 (Summary of Significant Accounting Policies — Allowance for Credit Losses-Available-For-Sale Securities)” for more information about the methodology and significant inputs used to measure the amount related to expected credit losses on available-for-sale debt securities.79The following table presents the amortized cost and fair value of investments with maturities as of the date presented (in thousands): December 31, 2023 Amortized Cost Fair Value Due in one year or less $ 92,428 $ 91,247 Due after one year through five years 616,178 578,304 Due after five years through ten years 426,700 371,982 Due after ten years 24,111 19,784 Perpetual maturity securities 3,502 3,013 Total $ 1,162,919 $ 1,064,330 All securities, except those with perpetual maturities, were categorized in the table above utilizing years to effective maturity. Effective maturity takes into consideration all forms of potential prepayment, such as call features or prepayment schedules, that shorten the lifespan of contractual maturity dates.The following table provides certain information related to available-for-sale debt securities, equity securities and investment real estate during the periods presented (in thousands):Years Ended December 31, 2023 2022 2021 Proceeds from sales and maturities (fair value): Available-for-sale debt securities $ 128,304 $ 98,409 $ 186,507 Equity securities $ 45,095 $ 34,178 $ 85,103 Gross realized gains on sale of securities: Available-for-sale debt securities $ 36 $ 242 $ 2,649 Equity securities $ 1,744 $ 2,240 $ 3,005 Gross realized losses on sale of securities: Available-for-sale debt securities $ (1,527) $ (2,060) $ (2,434) Equity securities $ (1,482) $ (74) $ (208) Realized gains on sales of investment real estate (1) $ — $ — $ 401 (1) During the year ended December 31, 2021 the Company completed the sale of a non-income producing investment real estate property. The Company received net cash proceeds of approximately $2.6 million and recognized a pre-tax gain of approximately $0.4 million that is included in net realized gains (losses) on investments in the Consolidated Statements of Income for the year ended December 31, 2021 This investment real estate property was not previously reported under assets held for sale since it was actively marketed and sold within the first quarter of 2021. The following table presents the components of net investment income, comprised primarily of interest and dividends for the periods presented (in thousands):Years Ended December 31, 2023 2022 2021 Available-for-sale debt securities $ 24,793 $ 18,699 $ 11,926 Equity securities 4,019 3,288 2,651 Cash and cash equivalents (1) 21,448 5,945 51 Other (2) 523 492 928 Total investment income 50,783 28,424 15,556 Less: Investment expenses (3) (2,334) (2,639) (3,021) Net investment income $ 48,449 $ 25,785 $ 12,535 (1) Includes interest earned on restricted cash and cash equivalents. (2) Includes investment income earned on real estate investments. (3) Includes custodial fees, investment accounting and advisory fees, and expenses associated with real estate investments. 80Equity SecuritiesThe following table provides the unrealized gains (losses) recognized for the periods presented on equity securities still held at the end of the reported period (in thousands):Years Ended December 31, 2023 2022 2021 Unrealized gains (losses) recognized during the reported period
on equity securities still held at the end of the reported period$ 3,723 $ (13,197) $ (3,459) Investment Real EstateInvestment real estate consisted of the following as of the dates presented (in thousands):As of December 31, 2023 2022 Income Producing: Investment real estate $ 7,097 $ 7,097 Less: Accumulated depreciation (1,572) (1,386) Investment real estate, net $ 5,525 $ 5,711 The following table provides the depreciation expense related to investment real estate for the periods presented (in thousands):Years Ended December 31, 2023 2022 2021 Depreciation expense on investment real estate $ 186 $ 186 $ 186 Other InvestmentsThe Company has an ownership interest in a limited partnership that is not registered or readily tradable on a securities exchange. This partnership is private equity fund managed by general partners who make decisions with regard to financial policies and operations. As such, the Company is not the primary beneficiary and does not consolidate these partnerships.Other investments consisted of the following as of the dates presented (in thousands):As of December 31, 2023 2022 Investment in private equity limited partnership $ 10,434 $ — The following table provides the unrealized gains (losses) recognized for the periods presented on investment in private equity limited partnership still held at the end of the reported period (in thousands):As of December 31, 2023 2022 Unrealized gains (losses) recognized during the reported period on investment in private equity limited partnership still held at the end of the reported period $ 5,640 $ — For the year ended December 31, 2023, the Company recognized net change in unrealized gain of $5.6 million on this investment which is recognized in net change in unrealized gains (losses) on investments in the Consolidated Statement of Income. At December 31, 2023 and 2022 the Company’s net cumulative contributed capital to the partnership totaled $4.8 million and $0, respectively.81NOTE 4 – REINSURANCEThe Company seeks to reduce theits risk of loss that may arise from catastrophes or other events that cause unfavorable underwriting results by reinsuring certain levels of risk in various areas of exposure with other insurance enterprises or reinsurers. While ceding premiumsreinsurers, generally as of the beginning of the hurricane season on June 1st of each year. The Company’s current reinsurance programs consist principally of catastrophe excess of loss reinsurance, subject to reinsurers reduces our riskthe terms and conditions of exposure in the eventapplicable agreements. Notwithstanding the purchase of catastrophicsuch reinsurance, the Company is responsible for certain retained loss amounts before reinsurance attaches and for insured losses it also reduces our potential for greater profits inrelated to catastrophes and other events that exceed coverage provided by or otherwise are not within the event that such catastrophic events do not occur. We believe that the extent of our reinsurance level of protection is typical of, or exceeds, that of other insurers actively writing in the Florida personal residential insurance market. Amounts recoverable from reinsurers are estimated in a manner consistent with the provisionsscope of the reinsurance agreement and consistent withprograms. The Company remains responsible for the establishmentsettlement of our gross liability. The Insurance Entities’ reinsurance policies do not relieve them from their obligationsinsured losses irrespective of whether any of the reinsurers fail to policyholders. Failure of reinsurers to honor their obligations could result in losses; consequently, allowances are establishedmake payments otherwise due.To reduce credit risk for amounts deemed uncollectible from reinsurers. No such allowance was deemed necessary as of December 31, 2017.52year ended December 31, 2017 COMPARED TO YEAR ENDED December 31, 2016Net income increased by $7.5 million, or 7.6%, to $106.9 million for the year ended December 31, 2017 compared to $99.4 million for the year ended December 31, 2016. Net income for the year ended December 31, 2017 included growth within each revenue category, continued underwriting profitability despite the impact from Hurricane Irma during the year, and a reduction in our effective tax rate. Diluted earnings per common share increased by $0.20 to $2.99 for the year ended December 31, 2017 compared to $2.79 per share for the year ended December 31, 2016, primarily as a result of an increase in net income and offset by modest increase in weighted average diluted shares outstanding. A more detailed discussion of this and other factors follows the table below.For the year ended December 31, 2017, our growth in direct premiums written increased by 10.6% overall to $1,055.9 million, including an increase of 7.4% to $924.0 million within Florida and an increase of 40.4% to $131.9 million in our Other States book. Growth within Florida includes both continued organic growth and the positive effect of increased policyholder retention and the associated premium volume surrounding Hurricane Irma (as discussed above in the Recent Developments - Hurricane Irma Overview), while growth in our Other States book includes continued expansion within states where we already had a presence prior to 2017, as well as the addition of two new states during the year (New Jersey and New York).Direct premiums earned increased by 8.5% to $999.2 million for the year ended December 31, 2017, from $921.2 million in the prior year. The increase in direct earned premium reflects the growth within both our Florida and Other States books, as discussed above, which has occurred over the past 12 months.Ceded premium earned was $310.4 million for the year ended December 31, 2017, compared to $288.8 million for the year ended December 31, 2016. The increase in ceded earned premiums of $21.6 million is attributable to increased costs associated with our 2017/2018 reinsurance program (which runs from June 1 to May 31 of the following year), reflecting increased ceded exposure from policy growth as well as coverage and limit improvements as compared to the 2016/2017 reinsurance program. Our overall reinsurance spend as a percentage of direct premiums earned held steady at 31% for the year ended December 31, 2017 as compared to the prior year.Net premiums earned increased by 8.9% to $688.8 million for the year ended December 31, 2017, compared to $632.4 million for the year ended December 31, 2016. The growth was the result of the increase in direct premiums earned and was partially offset by the increase in ceded premium earned, both of which are discussed above.53Net investment income was $13.5 million for the year ended December 31, 2017, compared to $9.5 million for the year ended December 31, 2016, representing an increase of 41.1%. The $4.0 million increase in net investment income is principally the result of the increasing size of our investment portfolio, coupled with favorable market trends and actions taken to increase portfolio yield while maintaining high credit quality. Total average investments were $666.3 million with an average credit rating of AA- during the year ended December 31, 2017 compared to $592.6 million with an average credit rating of AA- for the same period in 2016.We periodically sell investment securities from our portfolio of securities available for sale when opportunities arise or when circumstances could result in greater losses if such securities continue to be held. We sold investment securities available for sale during the year ended December 31, 2017 resulting in a net realized gain of $2.6 million compared to a net realized gain of $2.3 million during the year ended December 31, 2016.Commission revenue is comprised principally of brokerage commissions we earndue from reinsurers, on reinsurance placed for the Insurance Entities. ForEntities seek to do business with financially sound reinsurance companies and regularly evaluate the year ended December 31, 2017, commission revenue grew by $3.6 million, or 19.8%, to $21.3 million, compared to $17.7 million for the year ended December 31, 2016. The increase was the resultfinancial strength of overall changes in the structure of the reinsurance programs in effect, the amount of premiums paid for reinsurance on our growing exposures and the types of reinsurance contracts used in each program, as well as a benefit of approximately $2.0 million related to reinstatement premium commissions received by BARC following Hurricane Irma, discussed above in the Recent Developments - Hurricane Irma Overview.Policy fees are fees collected from policyholders by our wholly-owned managing general agent for business that is written through that subsidiary. Policy fees for the year ended December 31, 2017 grew by $1.9 million, or 11.6% to $18.8 million compared to $16.9 million for the year ended December 31, 2016. The increase was the result of growth in the number of policies written during the year ended December 31, 2017 compared to the same period in 2016.Other revenue represents revenue from policy installment fees, premium financing and other miscellaneous income. Other revenue for the year ended December 31, 2017 grew by $576,000, or 9.0%, to $7.0 million compared to $6.4 million for the year ended December 31, 2016. The increase reflects growth in the number of policies written during the year ended December 31, 2017 compared to the same period in 2016, as well as consumer behavior underlying the composition of our insurance portfolio.Losses and LAE, net of reinsurance were $350.4 million for the year ended December 31, 2017 compared to $301.2 million for the same period in 2016 as follows: *Includes only weather events beyond expectedSee “Item 8— Note 17 (Liability for Unpaid Losses and Loss Adjustment Expenses)” for change in liability for unpaid losses and LAE.During the year ended December 31, 2017, the Company recorded gross losses and LAE of $446.7 million resulting from Hurricane Irma. The Company’s reinsurance program limited losses from Hurricane Irma to $29.2 million, which added 4.2 percentage points to the net losses and LAE ratio for the year ended December 31, 2017. For additional details surrounding Hurricane Irma losses, see54Recent Developments - Hurricane Irma Overview discussed above. In addition, the Company experienced approximately $2.4 million of gross losses and loss adjustment expenses related to hailstorms in Minnesota that occurred in June/July of 2017, for which the Company ultimately recorded only $1.0 million of net losses and LAE. This recovery was a result of aggregate loss clauses within our reinsurance program triggered by Hurricane Irma. Weather events in 2016 were comprised of a series of severe storms in the first quarter, as well as the impact of Hurricane Hermine in the third quarter and Hurricane Matthew in the fourth quarter.In the fourth quarter of 2017, the Company recorded reserve of $44.7 million for the reserve strengthening comprised of 1) $26.4 million for unfavorable prior year reserve development related to accident years 2013, 2015 and 2016 and 2) $18.3 million for unfavorable development for the 2017 accident year. Each year reserve re-estimates, as described in “Item 8-Note 17 (Liability for Unpaid Losses and Loss Adjustment Expenses)”, are conducted and the difference between indicated reserves based on new reserve estimates and the previously recorded estimate is recorded and included in “Losses and loss adjustment expenses” in the Consolidated Statements of Income. An AOB is a document signed by a policyholder that allows a third party to be paid for services performed for an insured homeowner who would normally be reimbursed by the insurance company directly after making a claim. The Company has generally seen an increase in the use of AOB’s by Florida policyholders. Claims paid under an AOB often involve unnecessary litigation and as a result cost the Company significantly more than claims settled when an AOB is not involved. Reserve re-estimates in 2017 resulted in unfavorable prior year reserve development of $27.7 million, compared to favorable prior year reserve development of $4.7 million in 2016. Unfavorable prior year loss reserve development in 2017 related to accident years 2013, 2015, and 2016, primarily as a result of increased litigation frequency surrounding the AOB issue within our Florida policies.All other losses and loss adjustment expenses on a net basis were $321.3 million for the year ended December 31, 2017, compared to $255.1 million during the same period in 2016. The increase reflects increased losses due to growth in exposures and an increase in the losses and LAE ratio excluding Hurricane Irma of 6.4 percentage points when compared to calendar year 2016 as presented in the table above. The 6.4 percentage point increase reflects prior accident year reserve development accounting 4.0 percentage points, continued geographic expansion into states outside of Florida where non-catastrophe loss ratios are generally higher than in Florida, and the marketplace dynamics inside of Florida including increased challenges faced by insurers when policyholders assign benefits underlying their policies to third parties and the growth in litigation arising from these assignments.For the year ended December 31, 2017, general and administrative expenses were $231.0 million, compared to $221.2 million for the same period in 2016 as detailed below (dollars in thousands):For the year ended December 31, 2017, general and administrative expenses increased by $9.8 million, or 4.4% to $231.0 million, driven by an increase in policy acquisition costs of $12.9 million, or 10.2%, and which was partially offset by a decrease in other operating costs of $3.0 million, or 3.2%. The increase in policy acquisition costs primarily reflects the growth in premium volume described above but also includes an increase in the amount of bonus commissions paid to independent agents for achieving certain levels of premium production and retention. Other operating costs decreased $3.0 million primarily driven by decrease in insurance cost, legal and consulting. The operating expense ratio improved as result of economies of scale.Income tax expense for the year ended December 31, 2017 increased by $0.1 million, or 0.1%, to $63.5 million as compared to $63.5 million for the year ended December 31, 2016. See “Item 8—Note 12 (Income Taxes)” for a reconciliation from the statutory income tax rates to our effective tax rates for these periods.Comprehensive income includes net income and other comprehensive income or loss. Other comprehensive income, net of taxes for the year ended December 31, 2017 was $0.1 million compared to a loss of $2.4 million for the same period in 2016. Other comprehensive income (loss) represents after tax changes to equity which are not recognized in net income, including changes in the fair value of securities available for sale held in our investment portfolio and any reclassifications out of cumulative other comprehensive income for securities sold.See “Item 8—Note 14 (Other Comprehensive Income (Loss)).”55YEAR ended December 31, 2016 COMPARED TO YEAR ENDED DECEMBER 31, 2015Net income decreased by $7.1 million, or 6.6%, to $99.4 million for the year ended December 31, 2016 compared to the year ended December 31, 2015. Net income was impacted by $51.4 million in gross losses and LAE associated with weather events occurring in 2016. Weather events in 2016 were comprised of a series of severe storms in the first quarter of 2016 and then the impact of two hurricanes in 2016, Hermine in the third quarter and Matthew in the fourth quarter. Premium growth and the elimination of our quota share reinsurance contracts effective June 1, 2015, and a lower expense ratio are significant factors behind our 2016 results and comparison to prior years periods. Diluted earnings per common share decreased by $0.18, or 6.0%, to $2.79 for the year ended December 31, 2016 compared to $2.97 per share the year ended December 31, 2015, as a result of a decrease in net income and a slight decrease in weighted average shares outstanding (diluted). A more detailed discussion of this and other factors follows the table below.Premium earned, net in the current period includes premium written over the past 12 months and any changes in rates or policy count during that time. Premiums earned, net were $632.4 million for the year ended December 31, 2016, compared to $504.0 million for the year ended December 31, 2015. The increase in net earned premiums of $128.4 million, or 25.5%, includes an increase in direct earned premiums of $84.4 million and a decrease in ceded earned premiums of $44.0 million. The increase in direct earned premium includes organic growth in all states during 2016 as well as rate changes that took effect over the past twelve months. Direct written premiums increased $71.2 million or 8.1% which was made up of an increase in Florida business of $42.9 million or 5.3% over the prior year and direct written premiums in other states increased $28.3 million or 43.0% over the prior year.Our reinsurance programs run from June 1 to May 31 of the following year. In June 2015, we eliminated quota share reinsurance on a cut off basis. Ceded earned quota share premiums in 2015 were $97.5 million and none in 2016 as a result of the termination of the quota share. Ceded earned premiums relating to our catastrophe reinsurance program were $235.3 million in 2015 compared to $288.8 million in 2016. The increase in the ceded earned premiums relating to our catastrophe reinsurance program relate to coverage and limit improvements over 2015.Net investment income was $9.5 million for the year ended December 31, 2016, an increase of 85.1%, compared to $5.2 million for the year ended December 31, 2015. The increase in net investment income of $4.4 million is principally the result of increases in our fixed income investment portfolio fueled by cash flows generated from operations and actions taken to increase yield by investing these new funds along with maturities in higher yield securities while maintaining high credit quality. Total average investments were $592.6 million during the year ended December 31, 2016 compared to $470.4 million in the same period in 2015.56We sold investment securities available for sale during the year ended December 31, 2016 resulting in a net realized gain of $2.3 million compared to a net realized gain of $1.1 million during the year ended December 31, 2015.Commission revenue is comprised principally of brokerage commissions we earn from reinsurers on reinsurance placed for the Insurance Entities. For the year ended December 31, 2016 commission revenue was $17.7 million, compared to $14.9 million for the year ended December 31, 2015. The increase in commission revenue of $2.9 million, or 19.3%, was the result of overall changes in the structure of the reinsurance programs in effect during the year ended December 31, 2016, compared to the year ended December 31, 2015, including an increase in our exposures covered by reinsurance.Policy fees for the year ended December 31, 2016, were $16.9 million compared to $15.4 million for the same period in 2015. The increase of $1.4 million, or 9.3%, was the result of an increase in policies written during the year ended December 31, 2016 compared to the same period in 2015.Other revenue for the year ended December 31, 2016 was $6.4 million compared to $6.0 million for the same period in 2015. Other revenue represents revenue from policy installment fees, premium financing and other miscellaneous income. The increase of $406 thousand, or 6.7% reflects an increase in the number of policies written during the year ended December 31, 2016 compared to the same period in 2015 and consumer behavior underlying the composition of our insurance portfolio.Losses and LAE, net of reinsurance were $301.2 million for the year ended December 31, 2016 compared to $187.7 million for the same period in 2015 as follows:* Includes only weather events beyond expected.See “Item 8— Note 17 (Liability for Unpaid Losses and Loss Adjustment Expenses)” for change in liability for unpaid losses and LAE.On a direct basis, loss and LAE increased $88.5 million year over year principally as a result of weather events occurring in 2016 ($51.4 million), coupled with increased losses and LAE as a result of increases in premiums earned ($23.0 million) and increased losses and LAE related to the current year. Weather events in 2016 were comprised of a series of severe storms in the first quarter of 2016 and then the impact of two hurricanes in 2016, Hermine in the third quarter and Matthew in the fourth quarter. Ceded losses in 2016 were down $24.9 million principally as a result of the termination of the quota share reinsurance agreement in 2015. As a result of the above, the net loss and LAE ratios, or net losses and LAE as a percentage of net earned premiums, were 47.6% and 37.2% during the years ended December 31, 2016 and 2015, respectively.Each year reserve re-estimates, as described in “Item 8-Note 17 (Liability for Unpaid Losses and Loss Adjustment Expenses)”, are conducted and the difference between indicated reserves based on new reserve estimates and the previously recorded estimate is recorded and included in “Losses and loss adjustment expenses” in the Consolidated Statements of Income. Reserve re-estimates in 2016 and 2015 resulted in favorable development of $4.7 million and $0.3 million, respectively.For the year ended December 31, 2016, general and administrative expenses were $221.2 million, compared to $183.8 million for the same period in 2015 as follows (dollars in thousands):57For the year ended December 31, 2016, general and administrative expenses were $221.2 million, compared to $183.8 million for the same period in 2015. The overall net increase in general and administrative expenses of $37.4 million, or 20.3%, includes a $37.5 million increase in acquisitions costs, a $7.0 million increase in other operating costs and a $7.1 million decrease in stock-based compensation. The increase in acquisition and operating costs were incurred to support the increase of policies in force. The increase in acquisition costs also reflects the absence, during 2016, of ceding commission subsequent to the elimination of quota share reinsurance in June 2015. The expense ratio-net or general and administrative expenses as a percentage of net earned premiums, was 35.0% for the year ended December 31, 2016 compared to 36.5% for the same period in 2015. The decrease in the expense ratio resulted from the economies of scale caused by our higher premium volume as compared to the prior period and a reduction in stock-based compensation, partially offset by an increase in net acquisition costs resulting from the absence of ceding commission in 2016.Income taxes decreased by $5.1 million, or 7.4% primarily as a result of a decrease in income before income taxes. The effective tax rate decreased to 39.0% from 39.2% for the years ended December 31, 2016 and 2015, respectively. See “Item 8—Note 12 (Income Taxes)” for a reconciliation from the statutory income tax rates to our effective tax rates for these periods.Comprehensive income includes net income and other comprehensive income or loss. The other comprehensive loss for the years ended December 31, 2016 and 2015, reflect after tax changes in fair value of securities held in our portfolio of securities available for sale and reclassification out of cumulative other comprehensive income for securities sold. See “Item 8—Note 14 (Other Comprehensive Income (Loss)).”ANALYSIS OF FINANCIAL CONDITION AS OF DECEMBER 31, 2017 COMPARED TO DECEMBER 31, 2016We believe that cash flows generated from operations will be sufficient to meet our working capital requirements for at least the next twelve months. Our policy is to invest amounts considered to be in excess of current working capital requirements.summarizes, by type,presents ratings from rating agencies and the carrying valuesunsecured amounts due from the reinsurers whose aggregate balance exceeded 3% of investmentsthe Company’s stockholders’ equity as of the dates presented (in thousands): Ratings as of December 31, 2023 Standard AM Best and Poor’s
RatingMoody’s
InvestorsDue from as of
December 31,Reinsurer Company Services, Inc. Service, Inc. 2023 2022 Florida Hurricane Catastrophe Fund “FHCF” (1) n/a n/a n/a 91,275 134,411 Various Lloyd’s of London Syndicates (2) A A+ n/a 22,832 101,482 Allianz Risk Transfer (Bermuda) Ltd. n/a n/a n/a — 285,323 Chubb Tempest Reinsurance Ltd. n/a n/a n/a — 51,319 Markel Bermuda Ltd. n/a n/a n/a — 50,981 DaVinci Reinsurance Ltd. n/a n/a n/a — 48,115 Renaissance Reinsurance Ltd. n/a n/a n/a — 38,768 D E Shaw Re (Bermuda) Ltd. n/a n/a n/a — 16,680 Munich Reinsurance America Inc. n/a n/a n/a — 14,616 Everest Reinsurance Co n/a n/a n/a — 11,536 Upsilon RFO Re Ltd. n/a n/a n/a — 11,201 Lumen Re Ltd. n/a n/a n/a — 8,913 Total (3) $ 114,107 $ 773,345 See “Item 8—(1)No rating is available, because the fund is not rated.(2)No rating available for Moody’s Investors Service, Inc.(3)Amounts represent prepaid reinsurance premiums and net recoverables for paid and unpaid losses, including incurred but not reported reserves, and loss adjustment expenses.The Company’s reinsurance arrangements had the following effect on certain items in the Consolidated Statements of Cash Flows”Income for explanations of changes in investments.Prepaidthe periods presented (in thousands):For the Year Ended December 31, 2023 Premiums
WrittenPremiums
EarnedLosses and Loss
Adjustment
ExpensesDirect $ 1,921,833 $ 1,875,129 $ 1,046,854 Ceded (577,020) (623,193) (54,218) Net $ 1,344,813 $ 1,251,936 $ 992,636 82For the Year Ended December 31, 2022 Premiums
WrittenPremiums
EarnedLosses and Loss
Adjustment
ExpensesDirect $ 1,845,786 $ 1,759,701 $ 1,972,541 Ceded (672,508) (631,075) (1,034,142) Net $ 1,173,278 $ 1,128,626 $ 938,399 For the Year Ended December 31, 2021 Premiums
WrittenPremiums
EarnedLosses and Loss
Adjustment
ExpensesDirect $ 1,671,252 $ 1,596,618 $ 1,189,444 Ceded (586,425) (561,155) (410,239) Net $ 1,084,827 $ 1,035,463 $ 779,205 The following prepaid reinsurance premiums represent the portion of unearned ceded written premium that will be earned pro rataand reinsurance recoverable are reflected in the future. The increase of $8.4 million to $132.8 millionConsolidated Balance Sheets as of December 31, 2017 was due primarily to ceded written premium for increased reinsurance costs relating to our 2017-2018 catastrophe reinsurance program beginning June 1, 2017.Reinsurance recoverable represents the estimated amount of losses and LAE that are recoverable from reinsurers. The increase of $182.3 million to $182.4 million as of December 31, 2017 was primarily due to Hurricane Irma.Premiums receivable, net represents amounts receivable from policyholders. The increase in premiums receivable, net of $2.7 million to $56.5 million as of December 31, 2017 relates to both the growth in and seasonality of the Company’s business.As of December 31, 2023 2022 Prepaid reinsurance premiums $ 236,254 $ 282,427 Reinsurance recoverable on paid losses and LAE $ 35,667 $ 10,170 Reinsurance recoverable on unpaid losses and LAE 183,435 798,680 Reinsurance recoverable $ 219,102 $ 808,850 NOTE 5 – INSURANCE OPERATIONSDeferred policy acquisition costs increased $8.1 million to $73.1 million as of December 31, 2017, which is in line with the underlying premium growth. See “Item 8 — Note 5 (Insurance Operations)” for a roll-forward in the balance of our deferred policy acquisition costs.58Income taxes recoverable increased $6.2 million to $9.5 million as of December 31, 2017, from $3.3 million as of December 31, 2016. The increase represents amounts due from taxing jurisdictions within one year and when income taxes payments exceed income tax liabilities. Income taxes recoverable as of December 31, 2017 were $9.5 million, which represents amounts recoverable or to be applied to future periods for federal and state income taxes.Deferred income tax assets and liabilities represent temporary differences between U.S. GAAP and tax basis of a company's assets and liabilities. During the year ended December 31, 2017, net deferred tax assets decreased by $1.4 million to $9.3 million, primarily due to the re-measurement of deferred tax assets and liabilities as a result of the enactment of the Tax Cuts and Jobs Act of 2017 on December 22, 2017. The legislation made broad and complex changes to the Internal Revenue Code including a reduction in the federal corporate tax rate from 35% to 21% effective January 1, 2018. Affecting the Company in 2017 was a $4.7 million non-cash charge to earnings for the re-measurement of net deferred tax assets as a result of the new lower rates.See “Item 8 — Note 17 (Liability for Unpaid Losses and Loss Adjustment Expenses)” for a roll-forward in the balance of our unpaid losses and LAE. Unpaid losses and LAE increased $189.9 million to $248.4 million during the year ended December 31, 2017. The increase in 2017 was a result of losses recorded in the third and fourth quarters of 2017 for Hurricane Irma. Unpaid losses and LAE are net of estimated subrogation recoveries. Policy Acquisition CostsThe Company recorded $446.7 million in losses for Hurricane Irma and paid $263.9 million by December 31, 2017, offset by $270.1 million in reinsurance payments.Unearned premium represents the portion of direct written premium that will be earned pro rata in the future. The increase of $56.7 million to $532.4 million as of December 31, 2017 reflects both organic growth and seasonality of our business as described under “– Overview”.Advance premium represents premium payments made by policyholders ahead of the effective date of the policies. The increase of $8.4 million to $26.2 million as of December 31, 2017 reflects both organic growth and seasonality of our business as described under “– Overview”.Reinsurance payable, net increase of $29.5 million to $110.4 million as of December 31, 2017, which represents the unpaid ceded written premiums owed to reinsurersdefers certain costs in connection with written premium, called Deferred Policy Acquisition Costs (“DPAC”). DPAC is amortized over the renewaleffective period of the Company’s 2017/2018 catastrophe reinsurance program, (which began June 1, 2017), includes $26.8 million in cash advances received from reinsurers in connection with Hurricane Irma’s anticipated recoveries.Book overdrafts represent outstanding checks or drafts in excess of cash on depositrelated insurance policies83The following table presents the beginning and are examined monthly to determine if legal right of offset exists for accounts withending balances and the same banking institution. In 2017, the Company implemented a new short-term investment cash sweep to maximize investment returns on cash balances. Due to the sweep activities, certain outstanding items were recorded as book overdrafts totaling $36.7 million as of December 31, 2017.Other liabilities and accrued expenses increased by $7.4 million to $45.1 million as of December 31, 2017 as a result of increased expenses that relate to Hurricane Irma and costs, such as commissions and taxes, related to increases in our business.Capital resources increased net by $66.6 million and includes increases in stockholders’ equity of $68.8 million offset by a reduction in long-term debt of $2.2 million. The increases in stockholders’ equity was principally the result of 2017 net income offset by treasury stock purchases, dividends to shareholders and stock based compensation. The reduction in long-term debt was the result of principal payments on debt during 2017. See “– Liquidity and Capital Resources” and “Item 8 – Note 8 (Stockholders’ Equity)” for explanation of changes in treasury stock.Additional paid-in-capital increased $3.9 million resulting from share-based compensation expense of $10.5 million, stock option exercises of $5.6 million and common stock issued of $0.6 millionDPAC for the year ended December 31, 2017. This was offset by the common stock value acquired through cashless stock option exerciseperiods presented (in thousands):Years Ended December 31, 2023 2022 2021 DPAC, beginning of year $ 103,654 $ 108,822 $ 110,614 Capitalized Costs 217,286 212,067 222,329 Amortization of DPAC (210,955) (217,235) (224,121) DPAC, end of year $ 109,985 $ 103,654 $ 108,822 Regulatory Requirements and tax withholdings on the intrinsic value of stock option exerciseRestrictionsThe Insurance Entities are subject to regulations and performance units vested for share-based payment transactions of $12.8 million for the year ended December 31, 2017.Accumulated other comprehensive income (loss), net of taxes decreased to a $6.3 million loss as of December 31, 2017, compared to a $6.4 million loss as of December 31, 2016. This decrease reflects the after-tax changes in fair value of our investment portfolio’s unrealized losses during 2017.Liquidity and Capital ResourcesLiquidityLiquidity is a measure of a company’s ability to generate sufficient cash flows to meet its short and long-term obligations. Funds generated from operations have been sufficient to meet our liquidity requirements and we expect that, in the future, funds from operations will continue to meet such requirements.59The balance of cash and cash equivalents as of December 31, 2017 was $213.5 million, compared to $105.7 million at December 31, 2016. See “Item 8—Consolidated Statements of Cash Flows” for a reconciliationstandards of the balance of cash and cash equivalents between December 31, 2017 and 2016.FLOIR. The increase in cash and cash equivalents was driven by significant cash flows generated from operating activities in excess of those used for investing and financing activities. In 2017, the Company implemented a new short-term investment cash sweep to maximize investment returns on cash balances. Due to the sweep activities, certain outstanding items were recorded as “Book Overdraft” in the Consolidated Financial Statements. Cash and cash equivalents balances are available to settle book overdrafts, pay expenses and to pay claims.During the third and fourth quarters of 2017, Hurricane Irma was a significant liquidity event to the Company. The Company’s reinsurance program performed as expected providing sufficient liquidity in the form of cash advances for paid losses ceded to the reinsurers. During 2017, the Company collected a total of $270.1 million from reinsurers and paid $263.9 million of losses that were covered under the reinsurance program. In addition, certain costs were recovered from the reinsurers. All ceded losses during 2017 were out of amounts prefunded to the Company under the cash advance provision of the reinsurance agreements, and did not affect the Company’s investment portfolio.The balance of restricted cash and cash equivalents as of December 31, 2017 and 2016 includes cash equivalents on deposit with regulatory agencies in the various states in which our Insurance Entities do business.Liquidity for UVEare also subject to regulations and its non-insurance subsidiariesstandards of regulatory authorities in other states where they are licensed, although as Florida-domiciled insurers, their principal regulatory authority is required to cover the paymentFLOIR. These standards and regulations include a requirement that the Insurance Entities maintain specified levels of general operating expenses,statutory capital and restrict the timing and amount of dividends to shareholders (if and when authorized and declared by our Board of Directors), payment for the possible repurchase of our common stock (if and when authorized by our Board of Directors), payment of income taxes, and interest and principal payments on outstanding debt obligations, if any. The declaration and payment of future dividends by UVE to its shareholders, and any future repurchases of UVE common stock, willother distributions that may be at the discretion of our Board of Directors and will depend upon many factors, including our operating results, financial condition, debt covenants and any regulatory constraints. Principal sources of liquidity for UVE and its non-insurance subsidiaries include revenues generated from fees paid by the Insurance Entities to affiliated companies for policy administration, inspectionsthe parent company. Except in the case of extraordinary dividends, these standards generally permit dividends to be paid from statutory unassigned funds of the regulated subsidiary and claims adjusting services. Additional sourcesare limited based on the regulated subsidiary’s level of liquidity include brokerage commissions earned on reinsurance contracts, and policy fees. UVE also maintains investments, which are a source of ongoing interest and dividendstatutory net income and would generate funds upon sale. As discussed in “Item 8 – Note 5 (Insurance Operations),” there are limitations on the dividends the Insurance Entities may pay to their immediate parent company, UVECF.The maximum amount of dividends that can be paid by Florida insurance companies without prior approval of the Commissioner of the FLOIR is subject to restrictions relating to statutory capital and surplus. The maximum dividend that may be paid by the Insurance Entities to UVECFtheir immediate parent company, Protection Solutions, Inc. (“PSI,” formerly known as Universal Insurance Holding Company of Florida), without prior regulatory approval is limited toby the lesser of statutory net income from operationsprovisions of the Florida Insurance Code. These dividends are referred to as “ordinary dividends.” However, if the dividend, together with other dividends paid within the preceding calendar year12 months, exceeds this statutory limit or is paid from sources other than earned surplus, the entire dividend is generally considered an “extraordinary dividend” and must receive prior regulatory approval.In accordance with Florida Insurance Code, and based on the calculations performed by the Company as of December 31, 2023, UPCIC and APPCIC currently are not able to pay any ordinary dividends during 2024. For the years ended December 31, 2023 and 2022, no dividends were paid from the Insurance Entities to PSI.The Florida Insurance Code requires a residential property insurance company to maintain statutory unassigned surplus as to policyholders of at least $15.0 million or ten percent of the insurer’s total liabilities, whichever is greater. The following table presents the amount of capital and surplus calculated in accordance with statutory accounting principles, which differs from GAAP, and an amount representing ten percent of total liabilities for each of the Insurance Entities as of the preceding year end. Duringdates presented (in thousands):As of December 31, 2023* 2022 Statutory capital and surplus UPCIC $ 350,933 $ 400,866 APPCIC $ 25,526 $ 22,786 Ten percent of total liabilities UPCIC $ 151,367 $ 151,190 APPCIC $ 2,398 $ 2,023 * Unaudited As of the year ended December 31, 2017, UPCIC paid $30.0 million to UVECF.dates in the table above, the Insurance Entities each exceeded the minimum statutory capitalization requirement. The Insurance Entities did not pay dividends to UVECF duringalso met the yearcapitalization requirements of the other states in which they are licensed as of December 31, 2016.Liquidity2023. Annually, the Insurance Entities each are also required to adhere to prescribed premium-to-capital surplus ratios and each have met those requirements.The following table summarizes combined net income (loss) for the Insurance Entities is primarily required to cover payments for reinsurance premiums, claims payments including potential payments of catastrophe losses offset by recovery of any reimbursement amounts under our reinsurance agreements, fees paid to affiliates for managing general agency services, inspections and claims adjusting services, agent commissions, premiums and income taxes, regulatory assessments, general operating expenses, and interest and principal payments on debt obligations. The principal source of liquidity for the Insurance Entities consists of the revenue generated from the collection of net premiums, interest and dividend income from the investment portfolio and the collection of reinsurance recoverable.Our insurance operations provide liquiditydetermined in that premiums are generally received months or even years before losses are paid under the policies written. In the event of catastrophic events, many of the Company’s reinsurance agreements provide for “cash advance” whereby reinsurers advance or prepay amounts to the Company, providing liquidity, which the Company utilizes in the claim settlement process. In addition, the Insurance Entities maintain substantial investments in highly liquid, marketable securities, which would generate funds upon sale.The Insurance Entities are responsible for losses related to catastrophic events in excess of coverage provided by the Insurance Entities’ reinsurance programs or deductibles before the Company’s reinsurance protection commences. Also, the Company is responsible for all other losses that otherwise may not be covered by the reinsurance programs and any amounts arising in the event of a reinsurer default. Losses or a reinsurer default may have a material adverse effect on either of the Insurance Entities or our business, financial condition, results of operations and liquidity.As noted above, the Tax Act has decreased theaccordance with statutory corporate tax rate from 35.0% to 21.0% for tax years beginning after December 31, 2017. The Act’s impact on the Company in 2017 was a non-cash charge to earnings for the re-measurement of net deferred taxes. Going forward the Company expects to see an overall benefit from the Act, primarily from lower statutory tax rates offset by certain other provisions, principally the provision limiting the deductibility of certain executive compensation.60Capital resources provide protection for policyholders, furnish the financial strength to support the business of underwriting insurance risks, and facilitate continued business growth. The following table provides our stockholder equity, total long-term debt, total capital, debt to equity capital ratio and debt-to-equity ratioaccounting practices for the periods presented (dollars in(in thousands):Years Ended December 31, 2023* 2022 2021 Combined net income (loss) $ (97,144) $ (141,777) $ (102,515) * Unaudited 84The Insurance Entities each are required annually to comply with the NAIC RBCrisk-based capital (“RBC”) requirements. RBC requirements prescribe a method of measuring the amount of capital appropriate for an insurance company to support its overall business operations in light of its size and risk profile. NAIC’sNAIC RBC requirements are used by regulators to determine appropriate regulatory actions relating to insurers who show signs of a weak or deteriorating condition. As of December 31, 2017,2023, based on calculations using the appropriate NAIC RBC formula, the Insurance Entities’Entities each reported and respective total adjusted capital was in excess of the requirements. Failure by theThe Insurance Entities are required by various state laws and regulations to maintain certain assets in depository accounts. The following table represents assets held by insurance regulators as of the required leveldates presented (in thousands):As of December 31, 2023 2022 Restricted cash and cash equivalents $ 2,635 $ 2,635 Investments $ 3,329 $ 3,246 NOTE 6 – PROPERTY AND EQUIPMENTProperty and equipment consisted of statutory capitalthe following as of the dates presented (in thousands):As of December 31, 2023 2022 Land $ 5,344 $ 5,344 Building 41,534 40,344 Computers 8,811 11,887 Furniture 3,688 3,956 Automobiles and other vehicles 12,370 11,786 Software 6,218 6,894 Total 77,965 80,211 Less: Accumulated depreciation and amortization (31,203) (29,143) Net of accumulated depreciation and amortization 46,762 51,068 Construction in progress 866 336 Property and equipment, net $ 47,628 $ 51,404 Depreciation and surplus could result inamortization expense was $7.1 million, $7.1 million and $6.6 million for the suspensionyears ended December 31, 2023, 2022 and 2021, respectively.NOTE 7 – LONG-TERM DEBTLong-term debt consists of their authority to write new or renewal business, other regulatory actions, or ultimately, in the revocationfollowing as of their certificate of authority by the FLOIR.Indates presented (in thousands):As of December 31, 2023 2022 Surplus note $ 4,044 $ 5,515 5.625% Senior unsecured notes100,000 100,000 Total principal amount 104,044 105,515 Less: unamortized debt issuance costs (2,038) (2,746) Total long-term debt, net $ 102,006 $ 102,769 Surplus NoteOn November 9, 2006, UPCIC entered into a $25.0 million surplus note with the State Board of Administration of Florida (the “SBA”) under Florida’s Insurance Capital Build-Up Incentive Program (the “ICBUI”). The surplus note has a twenty-year term and accrues interest, adjusted quarterly based on the 10-year Constant Maturity Treasury Index. The carrying amount of the surplus note is included in the statutory capital and surplus of UPCIC.85The effective interest rate paid on the surplus note was 4.30%, 2.83% and 1.50% for the years ended December 31, 2023, 2022 and 2021, respectively. Any payment of principal or interest by UPCIC on the surplus note must be approved by the Commissioner of the FLOIR. Quarterly principal payments of $368 thousand are due through 2026. Aggregate principal payments of approximately $1.5 million were made during each of the years ended December 31, 2023, 2022 and 2021.UPCIC is in compliance with each of the loan’s covenants as implemented by rules promulgated by the SBA. An event of default will occur under the surplus note, as amended, if UPCIC: (i) defaults in the payment of the surplus note; (ii) fails to submit quarterly filings to the FLOIR; (iii) fails to maintain at least $50 million of surplus during the term of the surplus note, except for certain situations; (iv) misuses proceeds of the surplus note; (v) makes any misrepresentations in the application for the program; (vi) pays any dividend when principal or interest payments are past due under the surplus note; or (vii) fails to maintain a level of surplus and reinsurance sufficient to cover in excess of UPCIC’s 1-in-100 year probable maximum loss as determined by a hurricane loss model accepted by the Florida Commission on Hurricane Loss Projection Methodology as certified by the FLOIR annually. To avoid a penalty rate, UPCIC must maintain either a ratio of net written premium to surplus of at least 2:1 or a ratio of gross written premiumpremiums to surplus of at least 6:1 according to a calculation method set forth in the surplus note. As of December 31, 2017,2023, UPCIC’s net written premium to surplus ratio and gross written premium to surplus ratio werewas in excess of the required minimums and, therefore, UPCIC is not subject to increases in interest rates. At December 31, 2017, UPCIC was in compliance with the terms of the surplus note. Total adjusted capital surplus, which includes thepenalty rate. The surplus note wasranks subordinate in excessright of regulatory requirements for both UPCICpayment to the Senior Unsecured Notes and APPCIC.The Company may repurchase shares from time to time at its discretion, based on ongoing assessments of the capital needs ofUnsecured Revolving Loan described below.Senior Unsecured NotesOn November 23, 2021, the Company the market price of its common stockentered into Note Purchase Agreements with certain institutional accredited investors and general market conditions. The Company will fund the share repurchase program with cash from operations. During the year ended December 31, 2017, there were two authorized repurchase plans in effect:Company.On June 13, 2016, the Company announced that its Board of Directors authorized the repurchase of up to $20 million of the Company’s outstanding common stock through December 31, 2017 qualified institutional buyers pursuant to which the Company repurchased 861,296 sharesissued and sold $100 million of our common stock at an average price of $23.18 per share on the open market5.625% Senior Unsecured Notes due 2026 (the “Notes”). The Company completedPurchase Agreements contain certain customary representations, warranties and covenants made by the 2017 Share Repurchase Program in December 2017.On September 5, 2017, our Board of Directors authorized the repurchase of up to $20 million of the Company’s outstanding common stock through December 31, 2018. The Company repurchased 8,192 shares of common stock under the 2018 Share Repurchase Program during the year ended December 31, 2017 at an aggregate cost of approximately $0.2 million.During the year ended December 31, 2017, we repurchased an aggregate of 770,559 shares of UVE’s common stock in the open market. Also see “Part II, Item 5 — Unregistered Sales of Equity SecuritiesThe Notes were offered and Use of Proceeds” for share repurchase activity during the three months ended December 31, 2017.61The following table summarizes the dividends declared and paidsold by the Company duringin a private placement transaction in reliance on exemptions from the year ended December 31, 2017:Liability for Unpaid Losses and LAEWe are required to periodically estimate and reflect on our balance sheet the amount needed to pay losses and related LAE on reported and unreported claims, net of estimated subrogation. See “Item 1—Business—Liability for Unpaid Losses and LAE,” for a description of this process. The following table sets forth a reconciliation of beginning and ending liability for unpaid losses and LAE, net of subrogation as shown in our consolidated financial statements for the periods presented (in thousands):During 2017 the liability for unpaid losses and loss adjustment expenses increased by $189.9 million from $58.5 million as of December 31, 2016 to $248.4 million as of December 31, 2017. This increase was primarily a result of Hurricane Irma, for which the Company has reinsurance recoverable of $182.4 million. Other factors leading to the increase include the increase in our underlying exposure due to increased writings in Florida and other states, as well as prior year adverse development reserve of $27.5 million, primarily driven by AOB related claims within our Florida book, including the increased litigation frequency experienced during 2017 surrounding the AOB issue.Based upon consultations with our independent actuarial consultants and their statement of opinion on losses and LAE, we believe that the liability for unpaid losses and LAE is currently adequate to cover all claims and related expenses that may arise from incidents reported and IBNR, net of estimated subrogation. Our carried reserves as of December 31, 2017 were confirmed by our year end independent actuarial analysis and are in excess of their point or central estimate of their findings. Our annual actuarial process includes two reviews during the year by our independent actuarial firm. We use these external reviews to confirm data and emerging trends to observed changes. The actuarial process, including the external independent reviews, results in re-estimates of carried reserves for both current and prior accident years. See “Item 7- (Liability for Unpaid Losses and LAE)” and “Item 8 - Note 17 (Liability for Unpaid Losses and Loss Adjustment Expenses)” for a further discussionregistration requirements of the actuarial estimation process usedSecurities Act of 1933, as amended. On March 24, 2022, the Registration Statement registering the exchange of Notes for loss and LAE reserving. As a result of the ongoing actuarial process, reserves for the current accident year were strengthened in the fourth quarter to align with 2016 full year actuarial loss estimates and the impact of weather events that occurred in 2016. Re-estimates of each prior accident year’s ultimate losses and LAE were performed during the year and changes resulting in both favorable and unfavorable development were recorded. We believe the changes we have made in adjudicating and settling claims are conservatively reflected in the actuarial process. We will continue to validate our actuarial process as the benefits of our accelerated claims settlement62process become more apparent and will continue to monitor policyholder AOB and the resulting increase in litigation. The cumulative redundancy or deficiency in prior year reserve changes is reflected in the chart above.The following table provides total unpaid loss and LAE, net of related reinsurance recoverable for the dates presented (in thousands):Underwriting results of insurance companies are frequently measuredregistered Notes was declared effective by their combined ratios, which is the sum of the loss and expense ratios described in the following paragraph. However, investment income, federal income taxes and other non-underwriting income or expense are not reflected in the combined ratio. The profitability of property and casualty insurance companies depends on income from underwriting, investment and service operations. Underwriting results are considered profitable when the combined ratio is under 100% and unprofitable when the combined ratio is over 100%.The following table provides the statutory loss ratios, expense ratios and combined ratios for the periods indicated for the Insurance Entities:(1)The ratios are net of ceded premiums and losses, including premiums ceded to the Company’s catastrophe reinsurers which comprise a significant cost, and losses and LAE ceded to reinsurers. The expense ratio includes management fees and commissions, which are based on market rates, paid to an affiliate of the Insurance Entities in the amount of $84.7 million and $78.0 million for UPCIC for the years ended December 31, 2017 and 2016, respectively, and $0.6 million and $0.7 million for the years ended December 31, 2017 and 2016, respectively, for APPCIC. The management fees and commissions paid to the affiliate are eliminated in consolidation.RatingsThe Insurance Entities’ financial strength is rated by a rating agency to measure the Insurance Entities’ ability to meet their financial obligations to its policyholders. The agency maintains a letter scale Financial Stability Rating® system ranging from A” (A double prime) to L (licensed by state regulatory authorities).In November 2017, Demotech, Inc. affirmed the Financial Stability Rating® of “A” for the Insurance Entities. According to Demotech, Inc., the assigned rating represents a company’s continued positive surplus related to policyholders, liquidity of invested assets, an acceptable level of financial leverage, reasonable loss and loss adjustment expense reserves, and realistic pricing. The ratings of the Insurance Entities are subject to at least annual review by Demotech, Inc., and may be revised upward or downward or revoked at the sole discretion of Demotech, Inc. Financial Stability Ratings® are primarily directed towards policyholders, and are not evaluations directed toward the protection of investors in a company, including holders of a company’s common stock, and are not recommendations to buy, sell or hold securities. See “Item 1A—Risk Factors—A downgrade in our Financial Stability Rating® may63have an adverse effect on our competitive position, the marketability of our product offerings, and our liquidity, operating results and financial condition.”Contractual ObligationsThe following table represents our contractual obligations for which cash flows are fixed or determinable as of December 31, 2017 (in thousands):(1)There are generally no notional or stated amounts related to unpaid losses and LAE. Both the amounts and timing of future loss and LAE payments are estimates and subject to the inherent variability of legal and market conditions affecting the obligations and make the timing of cash outflows uncertain. The ultimate amount and timing of unpaid losses and LAE could differ materially from the amounts in the table above. Further, the unpaid losses and LAE do not represent all of the obligations that will arise under the contracts, but rather only the estimated liability incurred through December 31, 2017.Impact of Inflation and Changing PricesThe financial statements and related data presented herein have been prepared in accordance with U.S. generally accepted accounting principles which require the measurement of financial position and operating results in terms of historical dollars without considering changes in the relative purchasing power of money over time due to inflation. Our primary assets are monetary in nature. As a result, interest rates have a more significant impact on our performance than the effects of the general levels of inflation. Interest rates do not necessarily move in the same direction or with the same magnitude as the cost of paying losses and LAE.Insurance premiums are established before we know the amount of loss and LAE and the extent to which inflation may affect such expenses. Consequently, we attempt to anticipate the future impact of inflation when establishing rate levels. While we attempt to charge adequate rates, we may be limited in raising premium levels for competitive and regulatory reasons. Inflation also affects the market value of our investment portfolio and the investment rate of return. Any future economic changes which result in prolonged and increasing levels of inflation could cause increases in the dollar amount of incurred loss and LAE and thereby materially adversely affect future liability requirements.Recent Accounting Pronouncements Not Yet AdoptedIn February 2018, the FASB revised U.S. GAAP with the issuance of ASU 2018-02, Income Statement-Reporting Comprehensive Income (Topic 220)- Reclassification of Certain Tax Effects from Accumulated Other Comprehensive Income in response to the enactment on December 22, 2017 of the Tax Act. Topic 220 allows for a reclassification from accumulated OCI to retained earnings for the stranded tax effects resulting from the remeasurement of deferred tax balances. Prior to the issuance of Topic 220, OCI was not impacted by the remeasurement of deferred taxes. Without this reclassification the tax effects of items in OCI would not reflect the appropriate tax rate. When Topic 220 is adopted, the Company will be required to provide certain disclosures regarding its accounting policy and effect of the implementation of the reclassification of the stranded tax effects in OCI. The ASU is effective for all entities for fiscal years beginning after December 15, 2018, and interim periods within those fiscal years. Early adoption is permitted. When adopted by the Company this ASU will result in a reclassification of approximately $1.4 million from OCI to retained earnings.64In March 2017, the Financial Accounting Standards Board (“FASB”) revised U.S. GAAP with the issuance of Accounting Standards Update (“ASU”) 2017-08, Receivables – Nonrefundable Fees and Other Costs to amend the amortization period for certain purchased callable debt securities held at a premium. Current U.S. GAAP excludes certain callable debt securities from consideration of early repayment of principal even if the holder is certain that the call will be exercised. The new ASU shortens the amortization period of certain purchased callable debt securities to the earliest call date. The ASU is effective for fiscal years beginning after December 15, 2018, including interim periods within those fiscal years. Early adoption is permitted. Under the current U.S. GAAP, you could consider the call dates and estimate if you had a large number of similar securities and you were basing your judgment on actual experience. Our service provider (who processes the accounting for our investment transactions) has many similar securities on their system and can make that type of determination. As a result, we currently account for the amortization under the proposed ASU and there will be no impact to our results of operations, financial position or liquidity.In November 2016, the FASB revised U.S. GAAP with the issuance of the ASU 2016-18, Statement of Cash Flows (Topic 230: Restricted Cash to reduce diversity in the classification and presentation of changes in restricted cash in the statement of cash flows. The new ASU requires that the statement of cash flows explain the change during the period in the total of cash, cash equivalents, and amounts generally described as restricted cash or restricted cash equivalents. Entities will also be required to reconcile such total to amounts on the balance sheet and disclose the nature of the restrictions. The ASU is effective for fiscal years beginning after December 15, 2017, including interim periods within those fiscal years. Early adoption is permitted, including adoption in an interim period. The balance of restricted cash is currently not material and is not expected to be material and we will comply with the new ASU requirements at the time of adoption. The adoption of this ASU will result in a change in the presentation only in the statement of cash flows which is not expected to be material.In August 2016, the FASB revised U.S. GAAP with the issuance of ASU 2016-15, Classification of Certain Cash Receipts and Cash Payments intended to reduce diversity in practice in practice in how certain cash receipts and cash payments are presented and classified in the statement of cash flows. The new ASU will apply to: 1) debt prepayment or debt extinguishment costs, 2) settlement of zero-coupon debt instruments, 3) contingent consideration payments made after business combination, 4) proceeds from the settlement of insurance claims, 5) proceeds from the settlement of corporate-owned life insurance policies, 6) distributions received from equity method investments, 7) beneficial interests in securitization transactions, and 8) separately identifiable cash flows and application of the predominance principle. The ASU is effective for fiscal years beginning after December 15, 2017, including interim periods within those fiscal years. Historically, the items outlined above have not been applicable to the Company. Should they occur in the future, we will address them in accordance with the new ASU upon and subsequent to adoption.In June 2016, the FASB revised U.S. GAAP with the issuance of ASU 2016-13, Financial Instruments -Credit Losses (Topic 326) that introduces a new process for recognizing credit losses on financial instruments based on an estimate of current expected credit losses. The new ASU will apply to: 1) loans, accounts receivable, trade receivables, and other financial assets measured at amortized cost, 2) loan commitments and certain other off-balance sheet credit exposures, 3) debt securities and other financial assets measured at fair value through other comprehensive income, and 4) beneficial interests in securitized financial assets. The ASU changes the current practice of recording a permanent write down, (other than temporary impairment), for probable credit losses, which is more restrictive than the new ASU requirement that would estimate credit losses, then recorded through a temporary allowance account that can be re-measured as estimated credit losses change. The ASU further limited estimated credit losses relating to available for sale securities to the amount which fair value is below amortized cost. The ASU is effective for fiscal years beginning after December 15, 2019, including interim periods within those fiscal years. We are currently evaluating the impact that this standard will have on our consolidated financial statements.In January 2016, the FASB revised U.S. GAAP with the issuance of ASU 2016-01, Financial Instruments - Overall (Subtopic 825-10): Recognition and Measurement of Financial Assets and Financial Liabilities to improve the recognition and measurement of financial instruments. The new ASU requires certain equity investments to be measured at fair value with changes in fair value reported in earnings and requires changes in instrument-specific credit risk for financial liabilities recorded at fair value under the fair value option to be reported in other comprehensive income (“OCI”). The new ASU is effective for fiscal years beginning after December 15, 2017. The adoption of this ASU will impact how we account for unrealized gains and losses for equity investments which will be through the income statement and may result in a change of presentation in the statement of cash flows. Upon adoption on January 1st 2018, a cumulative effect adjustment of $4.4 million to the balance sheet will be made to reclassify unrealized losses on equity securities to retained earnings from other comprehensive income.65Market risk is the potential for economic losses due to adverse changes in fair value of fixed maturities, equity securities and short-term investments (“Financial Instruments”) and investment real estate. We carry all of our Financial Instruments at market value and investment real estate at net book value in our statement of financial condition. Our investment portfolio as of December 31, 2017, is comprised of fixed maturities and equity securities exposing us to changes in interest rates and equity prices.The primary objectives of the portfolio are the preservation of capital and providing adequate liquidity for claims payments and other cash needs. The portfolio’s secondary investment objective is to provide a total rate of return with an emphasis on investment income. None of our investments in risk-sensitive Financial Instruments were entered into for trading purposes.See “Item 8—Note 3 (Investments)” and “Item 1—Business—Investments” for more information about our Financial Instruments.Interest Rate RiskInterest rate risk is the sensitivity of a fixed-rate Financial Instrument to changes in interest rates. Generally, when interest rates rise, the fair value of our fixed-rate Financial Instruments declines.The following table provides information about our fixed income Financial Instruments, which are sensitive to changes in interest rates. The table presents cash flows of principal amounts and related weighted average interest rates by expected maturity dates for Financial Instruments available for sale as of the dates presented (in thousands):(1)Comprised of mortgage-backed and asset-backed securities which have multiple maturity dates, and perpetual maturity securities, and are presented separately for the purposes of this table.The tables above represent average contract rates that differ from the book yield of the fixed maturities. The fixed income Financial Instruments in our available for sale portfolio are comprised of United States government and agency securities, corporate bonds, municipal bonds, redeemable preferred stock, mortgage-backed and asset-backed securities and certificates of deposit. Duration is a measure of interest rate sensitivity expressed as a number of years. The weighted average duration of the fixed maturity Financial Instruments in our available for sale portfolio at December 31, 2017 was 2.6 years.To a lesser extent, we also have exposure to interest on our debt obligations which are in the form of a surplus note. The surplus note accrues interest at an adjustable rate based on the 10-year Constant Maturity Treasury rate.Equity Price RiskEquity price risk is the potential for loss in fair value of Financial Instruments in common stock and mutual funds from adverse changes in the prices of those Financial Instruments.66The following table provides information about the Financial Instruments in our available for sale portfolio subject to price risk as of the dates presented (in thousands):A hypothetical decrease of 20% in the market prices of each of the equity securities held at December 31, 2017 and 2016 would have resulted in a decrease of $12.4 million and $10.2 million, respectively, in the fair value of those securities.6768Report of Independent Registered Public Accounting FirmTo the Stockholders and Board of Directors of
Universal Insurance Holdings, Inc. and SubsidiariesOpinions on the Financial Statements and Internal Control over Financial ReportingWe have audited the accompanying balance sheets of Universal Insurance Holdings, Inc. and Subsidiaries (the “Company”) as of December 31, 2017 and 2016, the related statements of income, comprehensive income, stockholders' equity, and cash flows for each of the years in the three-year period ended December 31, 2017, and the related notes and schedules (collectively referred to as the “financial statements”). We also have audited the Company's internal control over financial reporting as of December 31, 2017, based on criteria established in Internal Control-Integrated Framework (2013) issued by the Committee of Sponsoring Organizations of the Treadway Commission (the “COSO framework”).In our opinion, the financial statements referred to above present fairly, in all material respects, the financial position of the Company as of December 31, 2017 and 2016 and the results of its operations and its cash flows for each of the years in the three-year period ended December 31, 2017, in conformity with accounting principles generally accepted in the United States of America. Also in our opinion, the Company maintained, in all material respects, effective internal control over financial reporting as of December 31, 2017, based on criteria established in the COSO framework.Basis for OpinionThe Company's management is responsible for these financial statements, for maintaining effective internal control over financial reporting, and for its assessment of the effectiveness of internal control over financial reporting, included in the accompanying “Management’s Report on Internal Control over Financial Reporting.” Our responsibility is to express an opinion on the Company’s financial statements and an opinion on the Company's internal control over financial reporting based on our audits. We are a public accounting firm registered with the Public Company Accounting Oversight Board (United States) (“PCAOB”) and are required to be independent with respect to the Company in accordance with the U.S. federal securities laws and the applicable rules and regulations of the Securities and Exchange Commission, and the PCAOB.We conducted our audits in accordance with the standardsall of the PCAOB. Those standards requireNotes have since been exchanged for registered Notes with identical financial terms.The Notes are senior unsecured debt obligations that we planbear interest at the rate of 5.625% per annum, payable semi-annually in arrears on May 30th and performNovember 30th of each year, beginning on May 30, 2022. The Notes are subject to adjustment from time to time in the audits to obtain reasonable assurance about whether the financial statements are freeevent of material misstatement, whether due to errora downgrade or fraud, and whether effective internal control over financial reporting was maintained in all material respects.Our auditssubsequent upgrade of the financial statements included performing proceduresrating assigned to assess the risksNotes.material misstatementprincipal is due and payable. At any time on or after November 30, 2023, the Company may redeem all or part of the financial statements, whether due to error or fraud, and performing procedures that respond to those risks. Such procedures included examining, on a test basis, evidence regarding the amounts and disclosures in the financial statements. Our audits also included evaluating the accounting principles used and significant estimates made by management,Notes at redemption prices (expressed as well as evaluating the overall presentationpercentages of the financial statements. Our audit of internal control over financial reporting included obtainingprincipal amount) equal to (i) 102.81250% for the twelve-month period beginning on November 30, 2023; (ii) 101.40625% for the twelve-month period beginning on November 30, 2024 and (iii) 100.000% at any time thereafter, plus accrued and unpaid interest up to, but not including the redemption date.On November 23, 2021, the Company entered into an understanding of internal control over financial reporting, assessing the risk that a material weakness exists, and testing and evaluating the design and operating effectiveness of internal control based on the assessed risk. Our audits also included performing such other procedures as we considered necessary in the circumstances. We believe that our audits provide a reasonable basis for our opinions.Definition and Limitations of Internal Control over Financial ReportingA company's internal control over financial reporting is a process designed to provide reasonable assurance regarding the reliability of financial reporting and the preparation of financial statements for external purposes in accordance with generally accepted accounting principles. A company's internal control over financial reporting includes those policies and procedures that (1) pertainindenture, relating to the maintenanceissuance of records that, in reasonable detail, accuratelythe Notes (the “Indenture”), with UMB Bank National Association, as trustee. The Notes are not subject to any sinking fund and fairly reflectare not convertible into or exchangeable, other than pursuant to the transactions and dispositions of theExchange Offer, for any other securities or assets of the company; (2) provide reasonable assurance that transactionsCompany or any of its subsidiaries. The Notes are recorded as necessarynot subject to permit preparation of financial statements in accordance with generally accepted accounting principles, and that receipts and expendituresredemption at the option of the companyholder.being made onlycustomary in accordanceagreements used in connection with authorizations of management and directors of the company; and (3) provide reasonable assurance regarding prevention or timely detection of unauthorized acquisition, use, or disposition of the company's assets that could have a material effect on the financial statements.Because of its inherent limitations, internal control over financial reporting may not prevent or detect misstatements. Also, projections of any evaluation of effectiveness to future periods are subject to the risk that controls may become inadequate because of changes in conditions, or that the degree of compliance with the policies or procedures may deteriorate./s/ Plante & Moran, PLLCCertified Public AccountantsWe have served as the Company’s auditor since 2002.Chicago, IllinoisFebruary 23, 201869UNIVERSAL INSURANCE HOLDINGS, INC. AND SUBSIDIARIES(in thousands, except per share data)The accompanying notes to consolidated financial statements are an integral part of these statements.70UNIVERSAL INSURANCE HOLDINGS, INC. AND SUBSIDIARIESCONSOLIDATED STATEMENTS OF INCOME(in thousands, except per share data)CONSOLIDATED STATEMENTS OF COMPREHENSIVE INCOMEThe accompanying notes to consolidated financial statements are an integral part of these statements.71UNIVERSAL INSURANCE HOLDINGS, INC. AND SUBSIDIARIESCONSOLIDATED STATEMENTS OF STOCKHOLDERS’ EQUITYFOR THE YEARS ENDED DECEMBER 31, 2017, 2016 and 2015(in thousands) (1)Represents change in fair value of available for sale investments, net of income tax provision of $76 thousand for the year ended December 31, 2017 and a change in fair value of available for sale investments, net of income tax benefit of $1,486 thousand and $1,369 thousand for the years ended December 31, 2016 and 2015, respectively.(2)Excess tax benefits (shortfall), net for the years ended December 31, 2016 and 2015 were recognized in additional paid-in capital. For the year ended December 31, 2017 excess tax benefits (shortfall) were recognized in income tax expense in the consolidated statements of income when the share-based awards vest or are settled. See “—Note 2 (Summary of Significant Accounting Policies – Recently Adopted Accounting Pronouncements).”The accompanying notes to consolidated financial statements are an integral part of these statements.72UNIVERSAL INSURANCE HOLDINGS, INC. AND SUBSIDIARIESCONSOLIDATED STATEMENTS OF CASH FLOWS(in thousands)The accompanying notes to consolidated financial statements are an integral part of these statements.73UNIVERSAL INSURANCE HOLDINGS, INC. AND SUBSIDIARIESNOTES TO CONSOLIDATED FINANCIAL STATEMENTSNOTE 1 – NATURE OF OPERATIONS AND BASIS OF PRESENTATIONNature of Operations, Basis of Presentation and ConsolidationUniversal Insurance Holdings, Inc. (“UVE”) is a Delaware corporation incorporated in 1990. UVE with its wholly-owned subsidiaries (the “Company”), is a vertically integrated insurance holding company performing all aspects of insurance underwriting, distribution and claims. Through its wholly-owned insurance company subsidiaries, Universal Property & Casualty Insurance Company (“UPCIC”) and American Platinum Property and Casualty Insurance Company (“APPCIC”), together referred to as the “Insurance Entities,” the Company is principally engaged in the property and casualty insurance business offered primarily through its network of independent agents. Risk from catastrophic losses is managed through the use of reinsurance agreements. The Company’s primary product is residential homeowners’ insurance currently offered in sixteen states assimilar transactions.2017,2023, the Company was in compliance with all applicable covenants, including Florida, which comprises the vast majorityfinancial covenants.The Notes are unsecured senior obligations of the Company’s in-force policies. See “— Note 5 (Insurance Operations),” for more information regardingCompany, are not obligations of, and are not guaranteed by, any subsidiary of the Company’s insurance operations.Company generates revenues primarily fromNotes rank equally in right of payment to the collection of premiums and invests funds in excess of those retained for claims-paying obligations and insurance operations. Other significant sources of revenue include brokerage commissions collected from reinsurers on certain reinsurance programs placed by the Insurance Entities, policy fees collected from policyholders by our wholly-owned managing general agency subsidiary and payment plan fees charged to policyholders who choose to pay their premiums in installments.The consolidated financial statements have been prepared in conformity with generally accepted accounting principles in the United States of America (“U.S. GAAP”). The consolidated financial statements include the accounts of UVE and its wholly-owned subsidiaries. All material intercompany balances and transactions have been eliminated in consolidation.To conform to current period presentation, certain amounts in the prior periods’ consolidated financial statements and notes have been reclassified. Such reclassifications were of an immaterial amount and had no effect on net income or stockholders’ equity.Consolidated Statement of Cash Flows – Additional DisclosureAs discussed in “—Note 8 (Stockholders’ Equity)”, in April 2016Unsecured Revolving Loan described below.Unsecured Revolving LoanOn June 30, 2023, the Company entered into a Purchasecommitted and Exchange Agreementunsecured $40.0 million revolving credit line with RenaissanceRe Ventures Ltd. pursuant to whichJP Morgan Chase Bank, N.A. This agreement succeeded the Company sold an aggregate of 583,771 shares of UVE common stock at a price of $17.13 per share for a total consideration of $10previous $37.5 million of which $7.035 million represents cancellation of outstanding indebtedness, non-cash portion, and the balance of $2.965 million was received in cash. The non-cash portion of the transaction has been excluded from the consolidated statement of cash flows.Use of EstimatesThe preparation of financial statements in conformityrevolving credit line with U.S. GAAP requires management to make estimates and assumptions that affect the reported amounts of assets and liabilities and disclosure of contingent assets and liabilities as of the date of the consolidated financial statements and the reported amounts of revenues and expenses during the reporting periods. The Company’s primary use of estimates are in the recognition of liabilities for unpaid losses, loss adjustment expenses, and subrogation recoveries, and reinsurance recoveries. Actual results could differ from those estimates.NOTE 2 – SUMMARY OF SIGNIFICANT ACCOUNTING POLICIESThe significant accounting policies followed by the Company are summarized as follows:Cash and Cash Equivalents. The Company includes in cash equivalents all short-term, highly liquid investments that are readily convertible to known amounts of cash and have an original maturity of three months or less. These amounts are carried at cost, which approximates fair value. The Company excludes any net negative cash balances from cash and cash equivalents that the Company has with any single financial institution. These amounts represent outstanding checks or drafts not yet presented to the financial institution and are reclassified to liabilities and presented as book overdraft in the Company’s Consolidated Balance Sheets.Restricted Cash and Cash Equivalents. The Company classifies amounts of cash and cash equivalents that are restricted in terms of their use and withdrawal separatelyJ.P. Morgan Chase, N.A., entered into on the face the Consolidated Balance Sheets. See “—Note 5 (Insurance Operations),” for a discussion of the nature of the restrictions.74Investment Securities, Available for Sale. All investment securities are classified as available for sale and consist of fixed maturities, equity securities and short-term investments with maturities of greater than three months. Investment securities available for sale are recorded at fair value on the consolidated balance sheet. Unrealized gains and losses on securities available for sale are excluded from earnings and reported as a component of other comprehensive income, net of related deferred taxes until reclassified to earnings upon the consummation of sales transaction with an unrelated third party or when the decline in fair value is deemed other than temporary.Gains and losses realized on the disposition of investment securities available for sale are determined on the FIFO basis and credited or charged to income. Premium and discount on investment securities are amortized and accreted using the interest method and charged or credited to investment income.Other Than Temporary Impairment. The assessment of whether the impairment of a security’s fair value is other than temporary is performed using a portfolio review as well as a case-by-case review considering a wide range of factors. There are a number of assumptions and estimates inherent in evaluating impairments and determining if they are other than temporary, including: 1) the Company’s ability and intent to hold the investment for a period of time sufficient to allow for an anticipated recovery in value; 2) the expected recoverability of principal and interest; 3) the extent and length of time to which the fair value has been less than amortized cost for fixed maturity securities or cost for equity securities and short-term investments referred to as severity and duration; 4) the financial condition, near-term and long-term prospects of the issue or issuer, including relevant industry conditions and trends, and implications of rating agency actions and offering prices referred to as credit quality; and 5) the specific reasons that a security is in a significant unrealized loss position, including market conditions which could affect liquidity. Additionally, once assumptions and estimates are made, any number of changes in facts and circumstances could cause the Company to subsequently determine that an impairment is other than temporary, including: 1) general economic conditions that are worse than previously forecasted or that have a greater adverse effect on a particular issuer or industry sector than originally estimated; 2) changes in the facts and circumstances related to a particular issue or issuer’s ability to meet all of its contractual obligations; and 3) changes in facts and circumstances obtained that causes a change in our ability or intent to hold a security to maturity or until it recovers in value. Management’s intent and ability to hold securities is a determination that is made at each respective balance sheet date giving consideration to factors known to management for each individual issuer of securities such as credit quality and other publicly available information.Investment Real Estate. Investment real estate is recorded at cost less accumulated depreciation. Depreciation is calculated on a straight-line basis over the estimated useful life of the assets. Real estate taxes, interest and other costs incurred during development and construction of properties are capitalized. Income and expenses from income producing real estate are reported under net investment income. Investment real estate is evaluated for impairment when events or circumstances indicate the carrying value may not be recoverable.Premiums Receivable. Generally, premiums are collected prior to or during the policy period as permitted under the Insurance Entities payment plans. Credit risk is minimized through the effective administration of policy payment plans whereby rules governing policy cancellation minimize exposure to credit risk. The Company performs a policy level evaluation to determine the extent the premiums receivable balance exceeds the unearned premiums balance. The Company then ages this exposure to establish an allowance for doubtful accounts based on prior credit experience.October 31, 2022. As of December 31, 2017 and 2016,2023, the Company recorded allowances for doubtful accounts in the amountshas not borrowed any amount under this revolving loan.$680 thousand and $527 thousand, respectively.Property and Equipment. Property and equipment is recorded at cost less accumulated depreciation and are depreciated on the straight-line basis over the estimated useful life assets. Estimated useful life of all property and equipment ranges from three for equipment to twenty-seven-and-one-half years for buildings and improvements. Expenditures for improvements are capitalized and depreciated over the remaining useful life of the asset. Routine repairs and maintenance are expensed as incurred. Website development costs are capitalized and amortized over three years. Software is capitalized and amortized over three years. The Company reviews its property and equipment for impairment annually and/or whenever changes in circumstances indicate that the carrying amount may not be recoverable.Recognition of Premium Revenues. Direct and ceded premiums are recognized as revenue on a pro rata basis over the policy term or over the term of the reinsurance agreement. The portion of direct premiums that will be earned in the future is deferred and reported as unearned premiums. The portion of ceded premiums that will be earned in the future is deferred and reported as prepaid reinsurance premiums (ceded unearned premiums).Recognition of Commission Revenue. Commission revenue generated from reinsurance brokerage commission earned on ceded premium by the Insurance Entities is recognized over the term of the reinsurance agreements.Policy Fees. Policy fees, which represents fees paid by policyholders to the Managing General Agent (MGA)’s on all new and renewal insurance policies, are recognized as income upon policy inception.Other Revenue. The Company offers its policyholders the option of paying their policy premiums in full at inception or in installments. The Company charges fees to its policyholders that elect to pay their premium in installments and records such fees as revenue as the Company bills the fees to the policyholder.75Deferred Policy Acquisition Costs. The Company defers direct commissions and premium taxes relating to the successful acquisition or renewal of insurance policies and defers the costs until recognized as expense over the terms of the policies to which they are related. Commissions on ceded premiums are deferred and amortized over the effective period of the related reinsurance policies. Deferred policy acquisition costs and deferred ceding commissions are netted for balance sheet presentation purposes and are recorded at their estimated realizable value.Intangible Assets. Goodwill and indefinite-lived intangible assets arising from the acquisition of a business is initially measured at cost and not subject to amortization. We assess goodwill and indefinite-lived intangible assets for potential impairments at the end of each fiscal year, or during the year if an event or other circumstance indicates that we may not be able to recover the carrying amount of the asset. Goodwill is included under Other Assets in the Consolidated Balance Sheets.Insurance Liabilities. Unpaid losses and loss adjustment expenses (“LAE”) are provided for as claims are incurred. The provision for unpaid losses and loss adjustment expenses includes: (1) the accumulation of individual case estimates for claims and claim adjustment expenses reported prior to the close of the accounting period; (2) estimates for unreported claims based on industry data; and (3) estimates of expenses for investigating and adjusting claims based on the experience of the Company and the industry. The Company estimates and accrues its right to subrogate reported or estimated claims against other parties. Subrogated claims are recorded at amounts estimated to be received from the subrogated parties, net of related costs and netted against unpaid losses and LAE.Inherent in the estimates of ultimate claims and subrogation are expected trends in claim severity, frequency and other factors that may vary as claims are settled. The amount of uncertainty in the estimates is significantly affected by such factors as the amount of claims experience relative to the development period, knowledge of the actual facts and circumstances and the amount of insurance risk retained. In addition, the Company’s policyholders are subject to adverse weather conditions, such as hurricanes, tornados, ice storms and tropical storms. The actuarial methods for making estimates for unpaid losses, LAE and subrogation recoveries and for establishing the resulting net liability are periodically reviewed, and any adjustments are reflected in current earnings.Provision for Premium Deficiency. It is the Company’s policy to evaluate and recognize losses on insurance contracts when estimated future claims, deferred policy acquisition costs and maintenance costs under a group of existing contracts will exceed anticipated future premiums. No accruals for premium deficiency were considered necessary as of December 31, 2017 and 2016.Reinsurance. Ceded written premium is recorded upon the effective date of the reinsurance contracts and earned over the contract period. Amounts recoverable from reinsurers are estimated in a manner consistent with the provisions of the reinsurance agreements and consistent with the establishment of the gross liability to the Company. Allowances are established for amounts deemed uncollectible if any.Income Taxes. The Company accounts for income taxes under the asset and liability method, that recognizes the amount of income taxes payable or refundable for the current year and recognizes deferred tax assets and liabilities based on the tax rates expected to be in effect during the periods in which the temporary differences reverse. Temporary differences arise when income or expenses are recognized in different periods on the consolidated financial statements than on the tax returns. The effect on deferred tax assets and liabilities of a change in tax rates is recognized in income in the period that includes the enactment date. Deferred tax assets are reduced by a valuation allowance if it is more likely than not that all, or someunused portion of the benefits related to deferred tax assets will not be realized. Income taxes includes both, estimated federalcommitment. state income taxes.Income (Loss) Per Sharecarry an interest rate of Common Stock. Basic earnings per share excludes dilution and is computed by dividing the Company’s net income (loss) available to common stockholders, by the weighted-average numberprime rate plus a margin of shares of Common Stock outstanding during the period. Diluted earnings per share is computed by dividing the Company’s net income (loss) by the weighted average number of shares of Common Stock outstanding during the period plus the impact of all potentially dilutive common shares, primarily preferred stock, unvested shares and options. The dilutive impact of stock options and unvested shares is determined by applying the treasury stock method and the dilutive impact of the preferred stock is determined by applying the “if converted” method.Fair Value Measurements2%. The Company’s policy is to record transfers of assets and liabilities, if any, between Level 1 and Level 2 at their fair values as of the end of each reporting period, consistent with the date of the determination of fair value. There were no transfers during the years ended December 31, 2017 or 2016.Share-based Compensation. The Company accounts for share-based compensation based on the estimated grant-date fair value. The Company recognizes these compensation costs in general and administrative expenses and generally amortizes them on a straight-line basis over the requisite service period of the award, which is the vesting term. Individual tranches of performance-based awards are amortized separately since the vesting of each tranchecredit line is subject to independent annual measures.renewals. The fair value of stock option76awards are estimated using the Black-Scholes option pricing modelcredit line contains customary financial and other covenants, with the grant-date assumptions discussed in “—Note 9 (Share-Based Compensation).” The fair value of the restricted share grants are determined based on the market price on the date of grant.Statutory Accounting. UPCIC and APPCIC are highly regulated and prepare and file financial statements in conformity with the statutory accounting practices prescribed or permitted by the Florida Office of Insurance Regulation (the “FLOIR”) and the National Association of Insurance Commissioners (“NAIC”) which differ from U.S. GAAP. The FLOIR requires that insurance companies domiciled in Florida prepare their statutory financial statements in accordance with the Manual (the “Manual”), as modified by the FLOIR. Accordingly, the admitted assets, liabilities and capital and surplus of UPCIC and APPCIC as of December 31, 2017 and 2016 and the results of operations and cash flows, for the years ended December 31, 2017, 2016 and 2015, for their regulatory filings have been prepared in accordance with statutory accounting principles as promulgated by the FLOIR and the NAIC. The statutory accounting principles are more restrictive than U.S. GAAP and are designed primarily to demonstrate the ability to meet obligations to policyholders and claimants.Recently Adopted Accounting PronouncementsIn March 2016, the Financial Accounting Standards Board (“FASB”) revised U.S. GAAP with the issuance of Accounting Standard Update (“ASU”) 2016-09, Compensation-Stock Compensation (Topic 718): Improvements to Employee Share-Based Payment Accounting, which simplifies several aspects of the accounting for share-based payment transactions. The new ASU requires excess income tax benefits (windfalls) and deficiencies (shortfalls) to be recognized in the income statement when the awards vest or are settled. The former guidance required the recognition of excess tax benefits or deficiencies in stockholders’ equity. In addition, all income tax-related cash flows resulting from share-based payments will be reported as operating activities in the statement of cash flows under the new ASU. The ASU also, allows the Company to repurchase more of an employee's shares for tax withholding purposes without triggering liability accounting; clarifies that all cash payments for tax withholdings made on an employee’s behalf should be presented as a financing activity on the Company’s statement of cash flows; provides an accounting policy election to account for forfeitures as they occur; and modifies the calculation of dilutive earnings per share to no longer use proceeds from tax benefits or deficiencies. The Company adopted this ASU effective January 1, 2017, which resulted in the recognition of an excess tax benefit of $5.8 million for the twelve months ended December 31, 2017.NOTE 3 – INVESTMENTSSecurities Available for SaleThe following table provides the cost or amortized cost and fair value of securities available for sale as of the dates presented (in thousands):77The following table provides the credit quality of investment securities with contractual maturities or the issuer of such securities as of the dates presented (in thousands):The tables above include comparable credit quality ratings by Standard and Poor’s Rating Services, Inc., Moody’s Investors Service, Inc. and Fitch Ratings, Inc.The following table summarizes the cost or amortized cost and fair value of mortgage-backed and asset-backed securities as of the dates presented (in thousands):78The following table summarizes the fair value and gross unrealized losses on securities available for sale, aggregated by major investment category and length of time that individual securities have been in a continuous unrealized loss position as of the dates presented (in thousands):Evaluating Investments in Other Than Temporary Impairment (“OTTI”)As of December 31, 2017, the Company held fixed maturity and equity securities that were in an unrealized loss position as presented in the table above. For fixed maturity securities with significant declines in value, the Company performs quarterly fundamental credit analysis on a security-by-security basis, which includes consideration of credit quality and credit ratings, review of relevant industry analyst reports and other available market data. For fixed maturity, equity securities and short-term investments, the Company considers whether it has the intent and ability to hold the securities for a period of time sufficient to recover its cost basis. Where the Company lacks the intent and ability to hold to recovery, or believes the recovery period is extended, the security’s decline in fair value is considered other than temporary and is recorded in earnings. Based on our analysis, our fixed income portfolio is of high quality and we believe we will recover the amortized cost basis of our fixed income securities. We continually monitor the credit quality of our fixed income investments to assess if it is probable that we will receive our contractual or estimated cash flows in the form of principal and interest. Additionally, the Company considers management’s intent and ability to hold the securities until recovery and its credit analysis of the individual issuers of the securities. Based on this process and analysis, management has no reason to believe the unrealized losses for securities available for sale as of December 31, 2017 are other than temporary.As of December 31, 2017, the Company held approximately $9.2 million equity securities that were in an unrealized loss position twelve months or longer. The unrealized loss on these securities was $2.1 million. Based on our analysis, the company believes each security will recover in a reasonable period of time and the Company has the intent and ability to hold them until recovery. There were no OTTI losses recognized in the periods on the equity portfolio.79The following table presents the amortized cost and fair value of investments with contractual maturities as of the date presented (in thousands): Expected maturities may differ from contractual maturities because borrowers may have the right to call or prepay with or without penalty.The following table provides certain information related to securities available for sale during the periods presented (in thousands):The following table presents the components of net investment income, comprised primarily of interest and dividends, for the periods presented (in thousands):(1)Includes interest earned on cash and cash equivalents and restricted cash and cash equivalents. Also includes investment income earned on real estate investments.(2)Includes bank fees, investment accounting and advisory fees, and expenses associated with real estate investments.Investment Real EstateInvestment real estate consisted of the following as of the dates presented (in thousands):80NOTE 4 – REINSURANCEThe Company seeks to reduce its risk of loss by reinsuring certain levels of risk in various areas of exposure with other insurance enterprises or reinsurers, generally as of the beginning of the hurricane season on June 1st of each year. The Company’s current reinsurance program consists of catastrophe excess of loss reinsurance, subject to the terms and conditions of the applicable agreements. The Company is responsible for deductible amounts before reinsurance attaches and insured losses related to catastrophes and other events in excess of coverage provided by its reinsurance program. The Company remains responsible for the settlement of insured losses irrespective of whether any of its reinsurers fail to make payments otherwise due to the Company.The Company eliminated the quota share ceded by UPCIC to its reinsurers beginning with the reinsurance program effective June 1, 2015. Under the quota share contracts that were effective June 1, 2014 through May 31, 2015, the quota share ceded by UPCIC to its reinsurers was 30%. By eliminating the quota share, the Company expects to increase its profitability by retaining all premiums. The elimination of the quota share also decreases the amount of losses and LAE that may be ceded by UPCIC and effectively increases the amount of risk retained by UPCIC and the Company. The elimination of the quota share also eliminates ceding commissions earned from the Company’s quota share reinsurer during the contract term and eliminates deferred ceding commissions, netted against deferred policy acquisition costs.The following table presents quota-share cession rates by reinsurance program and the years they were in effect:Reinsurance ProgramCession RateJune 2014 - May 201530%June 2015 - May 20160%June 2016 - May 20170%June 2017 - May 20180%Amounts recoverable from reinsurers are estimated in a manner consistent with the terms of the reinsurance contracts. Reinsurance premiums, losses and LAE are accounted for on a basis consistent with those used in accounting for the original policies issued and the terms of the reinsurance contracts. Ceding commissions received in connection with quota share reinsurance are deferred and netted against deferred policy acquisition costs and amortized over the effective period of the related insurance policies.To reduce credit risk for amounts due from reinsurers, the Insurance Entities seek to do business with financially sound reinsurance companies and regularly evaluate the financial strength of all reinsurers used.The following table presents ratings from rating agencies and the unsecured amounts due from the Company’s reinsurers whose aggregate balance exceeded 3% of the Company’s stockholders’ equity as of the dates presented (in thousands):(1)No rating is available, because the fund is not rated.(2)Amounts represent prepaid reinsurance premiums reinsurance receivables, net recoverables for paid and unpaid losses, including incurred but not reported reserves, loss adjustment expenses, and offsetting reinsurance payables.81The Company’s reinsurance arrangements had the following effect on certain items in the Consolidated Statements of Income for the periods presented (in thousands):The following prepaid reinsurance premiums (payable) and reinsurance recoverable and receivable are reflected in the Consolidated Balance Sheets as of the dates presented (in thousands):NOTE 5 – INSURANCE OPERATIONSDeferred Policy Acquisition Costs, netThe Company defers certain costs in connection with written policies, called Deferred Policy Acquisition Costs (“DPAC”), net of corresponding amounts of ceded reinsurance commissions, called Deferred Reinsurance Ceding Commissions (“DRCC”). Net DPAC is amortized over the effective period of the related insurance and reinsurance policies.82The following table presents the beginning and ending balances and the changes in DPAC, net of DRCC, for the periods presented (in thousands):Regulatory Requirements and RestrictionsThe Insurance Entities are subject to regulations and standards of the FLOIR. UPCIC also is subject to regulations and standards of regulatory authorities in other states where it is licensed, although as a Florida-domiciled insurer its principal regulatory authority is the FLOIR. These standards require the Insurance Entities to maintain specified levels of statutory capital and restrict the timing and amount of dividends and other distributions that may be paid by the Insurance Entities to the parent company. Except in the case of extraordinary dividends, these standards generally permit dividends to be paid from statutory unassigned surplus of the regulated subsidiary and are limited based on the regulated subsidiary’s level of statutory net income and statutory capital and surplus. The maximum dividend that may be paid by UPCIC and APPCIC to their immediate parent company, Universal Insurance Holding Company of the Florida (“UVECF”), without prior regulatory approval is limited by the provisions of Florida Insurance Code. These dividends are referred to as “ordinary dividends.” However, if the dividend, together with other dividends paid within the preceding twelve months, exceeds this statutory limit or is paid from sources other than earned surplus, the entire dividend is generally considered an “extraordinary dividend” and must receive prior regulatory approval.In accordance with Florida Insurance Code, and based on the calculations performed by the Company as of December 31, 2017, UPCIC has the capacity to pay ordinary dividends of $36.2 million during 2018. APPCIC does not meet the earning’s or surplus regulatory requirements to pay ordinary dividends during 2018. For the year ended December 31, 2017, UPCIC paid dividends of $30.0 million to UVECF. No dividends were paid from APPCIC to UVECF for the year ended December 31, 2017. The Florida Insurance Code requires insurance companies to maintain capitalization equivalent to the greater of ten percent of the insurer’s total liabilities but not less than $10.0 million. The following table presents the amount of capital and surplus calculated in accordance with statutory accounting principles, which differ from U.S. GAAP, and an amount representing ten percent of total liabilities for both UPCIC and APPCIC as of the dates presented (in thousands):As of the dates in the table above, both UPCIC and APPCIC exceeded the minimum statutory capitalization requirement. UPCIC also met the capitalization requirements of the other states in which it is licensed as of December 31, 2017. UPCIC and APPCIC are also required to adhere to prescribed premium-to-capital surplus ratios and have met those requirements at such dates. Combined net income for UPCIC and APPCIC, as determined in accordance with statutory accounting practices is $35.6 million, $58.2 million and $53.6 million for the years ended December 31, 2017, 2016 and 2015, respectively.83Through UVECF, the Insurance Entities’ parent company, UVE made capital contributions for the periods presented (in thousands):*UVECF made this contribution to APPCIC’s capital in conjunction with APPCIC’s request for FLOIR approval to transact commercial residential insurance products in Florida. The FLOIR granted APPCIC’s request.UPCIC and APPCIC are required annually to comply with the NAIC risk-based capital (“RBC”) requirements. RBC requirements prescribe a method of measuring the amount of capital appropriate for an insurance company to support its overall business operations in light of its size and risk profile. NAIC RBC requirements are used by regulators to determine appropriate regulatory actions relating to insurers who show signs of a weak or deteriorating condition. As of December 31, 2017, based on calculations using the appropriate NAIC RBC formula, UPCIC’s and APPCIC’s reported total adjusted capital was in excess of the requirements.The Insurance Entities are required by various state laws and regulations to maintain certain assets in depository accounts. The following table represents assets held by insurance regulators as of the dates presented (in thousands):NOTE 6 – PROPERTY AND EQUIPMENTProperty and equipment consisted of the following as of the dates presented (in thousands):Depreciation and amortization was $3.9 million, $3.1 million and $1.9 million for the years ended December 31, 2017, 2016 and 2015, respectively.The following table provides realized gains (losses) on the disposal of property and equipment during the periods presented (in thousands):84Long-term debt consists of the following as of the dates presented (in thousands):Surplus NoteOn November 9, 2006, UPCIC entered into a $25.0 million surplus note with the State Board of Administration of Florida (the “SBA”) under Florida’s Insurance Capital Build-Up Incentive Program (the “ICBUI”). The surplus note has a twenty-year term and accrues interest, adjusted quarterly based on the 10-year Constant Maturity Treasury Index. The carrying amount of the surplus note is included in the statutory capital and surplus of UPCIC of approximately $12.9 million as of December 31, 2017.The effective interest rate paid on the surplus note was 2.31%, 1.88% and 2.21% for years ended December 31, 2017, 2016 and 2015, respectively. Any payment of principal or interest by UPCIC on the surplus note must be approved by the Commissioner of the OIR. Quarterly principal payments of $368 thousand are due through 2026. Aggregate principal payments of $1.5 million were made during each of the years ended December 31, 2017, 2016 and 2015.UPCIC is in compliance with each of the loan’s covenants as implemented by rules promulgated by the SBA. An event of default will occur under the surplus note, as amended, if UPCIC: (i) defaults in the payment of the surplus note; (ii) fails to submit quarterly filings to the FLOIR; (iii) fails to maintain at least $50 million of surplus during the term of the surplus note, except for certain situations; (iv) misuses proceeds of the surplus note; (v) makes any misrepresentations in the application for the program; (vi) pays any dividend when principal or interest payments are past due under the surplus note; or (vii) fails to maintain a level of surplus and reinsurance sufficient to cover in excess of UPCIC’s 1-in-100 year probable maximum loss as determined by a hurricane loss model accepted by the Florida Commission on Hurricane Loss Projection Methodology as certified by the FLOIR annually. To avoid a penalty rate, UPCIC must maintain either a ratio of net written premium to surplus of 2:1 or a ratio of gross written premiums to surplus of 6:1 according to a calculation method set forth in the surplus note. As of December 31, 2017, UPCIC’s net written premium to surplus ratio and gross written premium to surplus ratio were in excess of the required minimums and, therefore, UPCIC is not subject to increases in interest rates.86MaturitiesThe following table provides an estimate of aggregate principal payments to be made for the amounts due on the surplus notelong-term debt as of December 31, 20172023 (in thousands):2024 $ 1,471 2025 1,471 2026 101,102 2027 — 2028 — Thereafter — Total long-term debt maturities 104,044 Less: unamortized debt issuance costs (2,038) Total long-term debt maturities, net $ 102,006 Interest ExpenseInterestThe following table provides interest expense was $0.3 million, $0.4 million, and $1.0 million forrelated to long-term debt during the years ended December 31, 2017, 2016 and 2015, respectively.85Years Ended December 31, 2023 2022 2021 Interest Expense: Surplus notes $ 198 $ 172 $ 113 5.625% Senior unsecured notes 5,625 5,734 469 Non-cash expense (1) 708 703 56 Total $ 6,531 $ 6,609 $ 638 NOTE 8 – STOCKHOLDERS’ EQUITYCumulative Convertible Preferred StockAs of December 31, 20172023 and 2016,2022, the Company had shares outstanding of Series A Preferred Stock. Each share of Series A Preferred Stock is convertible by the Company into shares of Common Stock.The following table provides certain information for the convertible Series A preferred stock as of the dates presented (in thousands, except conversion factor): As of December 31, 2023 2022 The Series A Preferred Stock pays a cumulative dividend of $0.25 per share per quarter. The Company declared and paid aggregate dividends to the holder of record of the Company’s Series A Preferred Stock of $10 thousand for each of the years ended December 31, 20172023 and 2016.87Common StockThe following table summarizesShares RepurchasedFrom time to time, the activity relating toCompany’s Board of Directors may authorize share repurchase programs under which the Company may repurchase shares of the Company’s Common Stock duringcommon stock in the open market. The following table presents repurchases of the Company’s common stock for the periods presented (in thousands):In April 2016, the Company sold 583,771 shares of UVE common stock in a private placement to RenRe Ventures at a price of $17.13 per share for total consideration of $10 million, which was comprised of $2.965 million in cash and $7.035 million in cancellation of outstanding indebtedness, including accrued interest.Total Number of Shares Average Dollar Repurchased During the Year Aggregate Price per Plan Expiration Amount Ended December 31, Purchase Share Completed or Date Authorized Date (1) Authorized 2023 2022 Price Repurchased Expired June 12, 2023 June 10, 2025 $ 20,000 1,112,953 — $ 15,867 $ 14.26 December 15, 2022 December 15, 2024 $ 7,997 400,691 186,435 $ 7,997 $ 13.62 August 2023 November 3, 2020 November 3, 2022 $ 20,000 — 806,324 $ 9,800 $ 12.15 November 2022 (1)In June 2016, UVE announced that itsNovember 2020, our Board of Directors authorized a share repurchase program under which UVE may repurchase in the open market in compliance with Exchange Act Rule 10b-18of up to $20 million of its outstandingshares of common stock, which expired in November 2022. At the end of this prior authorization, the Company had repurchased slightly more than $12 million of shares of common stock. On December 15, 2022, our Board of Directors authorized a successor share repurchase program under which the Company was authorized to repurchase up to $8.0 million of shares of common stock through December 31, 2017. UVE repurchased 861,296 shares, at an aggregate price15, 2024, which represents the unused portion of approximately $20.0 million, pursuant to such repurchase program through December 31, 2017.86In September 2017, the predecessor authorization. On June 12, 2023, our Board of Directors authorized a sharethe repurchase program under which UVE may repurchase in the open market in compliance with Exchange Act Rule 10b-18,of up to $20$20.0 million of its outstanding shares ofour common stock through December 31, 2018. UVEJune 10, 2025 (“The June 2025 Share Repurchase Program”) pursuant to which we repurchased 8,1921,112,953 shares of our common stock at an aggregate pricecost of approximately $0.2 million, pursuant to such repurchase program through December 31, 2017.During the year ended December 31, 2017, UVE repurchased an aggregate of 770,559 shares of its common stock in the open market in compliance with Exchange Act Rule 10b-18 at a total cost of $18.1$15.9 million.Dividends DeclaredThe Company declared dividends on its outstanding shares of common stock to its shareholders of record as follows for the periods presented (in thousands, except per share amounts): For the Years Ended December 31, 2023 2022 2021 Per Share
AmountPer Share
AmountAggregate
Amount (1)Per Share
AmountAggregate
Amount (1)Per Share
AmountAggregate
Amount (1)(1)Includes dividend equivalents due to employees who hold performance share units, restricted share units or restricted stock awards which are subject to time-vesting conditions.Applicable provisions of the Delaware General Corporation Law may affect the ability of the Company to declare and pay dividends on its Common Stock. In particular, pursuant to the Delaware General Corporation Law, a company may pay dividends out of its surplus, as defined, or out of its net profits, for the fiscal year in which the dividend is declared and/or the preceding year. Surplus is defined in the Delaware General Corporation Law to be the excess of net assets of the company over capital. Capital is defined to be the aggregate par value of shares issued. Moreover, the ability of the Company to pay dividends, if and when declared by its Board of Directors, may be restricted by regulatory limits on the amount of dividends, which the Insurance Entities are permitted to pay the Company.88Restrictions limiting the payment of dividends by UVEUVE pays dividends to shareholders, which are funded by earnings on investments and distributions from the earnings of its consolidated subsidiaries. Generally, other than as disclosed above and in “—Note 7 (Long-Term Debt)(Long-term debt),” there are no restrictions for UVE limiting the payment of dividends. However, UVE’s ability to pay dividends to shareholders may be affected by restrictions on the ability of the Insurance Entities to pay dividends to UVE through UVECF.PSI. See “—Note 5 (Insurance(Insurance Operations),” for a discussion of these restrictions. There are no such restrictions for UVE’s non-insurance consolidated subsidiaries. Notwithstanding the restriction on the net assets of the Insurance Entities, UVE received distributions from the earnings of its non-insurance consolidated subsidiaries of $122.2$164.1 million, $46.9$231.9 million, and $58.2$149.9 million during the years ended December 31, 2017, 20162023, 2022 and 2015,2021, respectively. During the year ended December 31, 2016, UVE made a capital contributioncontributions of $2.0$72.0 million, $84.0 million, and $92.0 million to APPCIC, in conjunction with APPCIC’s plan to begin writing commercial residential products in Florida. There were no capital contributions by UVE to the Insurance EntitiesUPCIC during the years ended December 31, 20172023, 2022, and 2015. The Company prepares2021, respectively. UVE made no capital contributions to APPCIC during the year ended December 31, 2023, $3 million during the year ended December 31, 2022, and files a consolidated federal tax return formade no contributions during the year ended December 31, 2021.During 2023, UVE and its consolidated subsidiariesdid not enter into subordinated surplus debentures with all U.S. GAAP tax related entries recorded on the booksUPCIC or APPCIC. During 2022, $110.0 million in subordinated surplus debentures were made to UPCIC by UVE. See “—Schedule II - Condensed Financial Information of UVE.NOTE 9 – SHARE-BASED COMPENSATIONEquity Compensation PlanUnderPlansIn prior periods the Company’sCompany managed its equity compensation under the 2009 Omnibus Incentive Plan as amended (the “Incentive“2009 Plan”), 2,064,493. In April 2021, the Company’s Board of Directors adopted, subject to shareholder approval, the 2021 Omnibus Incentive Plan (the “2021 Plan”). The 2021 Plan was approved by the Company’s shareholders effective June 11, 2021, at which time the 2009 Plan was terminated. Shares reserved for future issuance under the 2009 Plan are no longer available and no further grants will be made under this plan.At the inception of the Company’s 2021 Plan, 1,835,000 shares were initially reserved for issuance. At December 31, 2023, no shares remained reserved for issuance and were available for new awards under the Incentive Plan as of December 31, 2017.Awards under the Incentive Plan may include incentive stock options, non-qualified stock option awards (“Stock Option”), stock appreciation rights, non-vested shares of Common Stock (“Restricted Stock”),common stock, restricted stock units,awards (“RSAs”), performance share units (“PSUs”), restricted stock units (“RSUs”), and other share-based awards and cash-based incentive awards. Awards under the Incentive Plan may be granted to employees, directors, consultants or other persons providing services to the Company or its affiliates.8789The following table provides certain information related to Stock Options, RSAs, PSUs and PSUs duringRSUs for the year ended December 31, 20172023 (in thousands, except per share data):For the Year Ended December 31, 2023 For the Year Ended December 31, 2023 Stock Options Stock Options Restricted Stock Awards Performance
Share UnitsRestricted
Stock UnitsNumber of
Options (2)Number of
Options (2)Weighted
Average
Exercise
Price per
Share (1)Aggregate
Intrinsic
ValueWeighted
Average
Remaining
TermNumber of
Shares (2)Weighted
Average
Grant Date
Fair Value
per Share (1)Number
of Share
Units (2)Weighted
Average
Grant Date
Fair Value
per Share Units (1)Number
of Share Units (2)Weighted Average Grant Date
Fair Value
per Share Units (1)2009 Omnibus Plan Outstanding as of December 31, 2022Outstanding as of December 31, 2022Outstanding as of December 31, 2022Exercised (94) 14.77 14.77 n/a n/a n/a Expired (7) 29.17 29.17 n/a n/a n/a Outstanding as of December 31, 2023Exercisable as of December 31, 20232021 Omnibus Plan 2021 Omnibus Plan 2021 Omnibus Plan Outstanding as of December 31, 2022Outstanding as of December 31, 2022Outstanding as of December 31, 2022Granted Forfeited Exercised Exercised — — n/a n/a Vested Expired Expired — — n/a n/a Outstanding as of December 31, 2023Exercisable as of December 31, 2023 (1)Unless otherwise specified, such as in the case of the exercise of Stock Options, the per share prices were determined using the closing price of the Company’s Common Stock as quoted on the exchanges on which the Company was listed. Shares issued upon exercise of options represent original issuances in private transactions pursuant to Section 4(2) of the Securities Act of 1933, as amended or issuances under the Company’s Incentive Plan.(2)All shares outstanding as of December 31, 2023, are expected to vest.(1)n/a Unless otherwise specified, such as in the case of the exercise of Stock Options, the per share prices were determined using the closing price of the Company’s Common Stock as quoted on the exchanges on which the Company was listed. Shares issued upon exercise of options represent original issuances in private transactions pursuant to Section 4(2) of the Securities Act of 1933, as amended or issuances under the Company's Incentive Plan.(2)All shares outstanding as of December 31, 2017 are expected to vest.90n/aNot applicable88(1)Excess tax benefits (shortfalls) for the years ended December 31, 2016 and 2015 were recognized in additional paid in capital and within income through December 31, 2017.(2)All shares acquired represent shares tendered to cover the strike price for options and tax withholdings on the intrinsic value of options exercised, Restricted Stock vested or PSUs vested. These shares have been canceled by the Company.Years Ended December 31, 2023 2022 2021 Compensation expense: Stock options $ 996 $ 1,882 $ 2,390 Restricted stock 588 372 — Performance share units 868 466 671 Restricted stock units 2,554 2,007 2,754 Total $ 5,006 $ 4,727 $ 5,815 Deferred tax benefits: Stock options $ 41 $ 126 $ 226 Restricted stock — — — Performance share units — — — Restricted stock units 481 387 606 Total $ 522 $ 513 $ 832 Realized tax benefits: Stock options $ 82 $ — $ — Restricted stock 207 — — Performance share units — — 64 Restricted stock units 501 286 590 Total $ 790 $ 286 $ 654 Excess tax benefits (shortfall): Stock options $ 7 $ (88) $ (600) Restricted stock 47 — — Performance share units — — (76) Restricted stock units (34) (134) 15 Total $ 20 $ (222) $ (661) Weighted average fair value per option or share: Stock option grants $ — $ 1.64 $ 2.66 Restricted stock grants $ 16.23 $ 12.32 $ — Performance share unit grants $ 18.26 $ 12.19 $ 14.68 Restricted stock unit grants $ 16.68 $ 9.96 $ 16.79 Intrinsic value of options exercised $ 315 $ — $ — Fair value of restricted stock vested $ 843 $ — $ — Fair value of performance share units vested $ 164 $ 386 $ 925 Fair value of restricted stock units vested $ 3,108 $ 1,310 $ 3,212 Cash received for strike price and tax withholdings $ 41 $ 61 $ 84 Shares acquired through cashless exercise (1) 104 36 69 Value of shares acquired through cashless exercise (1) $ 339 $ 418 $ 1,056 (1)All shares acquired represent shares tendered to cover the strike price for options and tax withholdings on the intrinsic value of Stock Options exercised, Restricted Stock vested, PSUs vested or RSUs vested. These shares have been canceled by the Company.91The following table provides the amount of unrecognized compensation expense as of the most recent balance sheet date and the weighted average period over which those expenses will be recorded for both Stock Options, Restricted Stock, PSUs, and PSUsRSUs (dollars in thousands):As of December 31, 2023 As of December 31, 2023 Stock
OptionsStock
OptionsRestricted Stock Performance
Share UnitsRestricted
Stock UnitsWeighted average remaining years 1.08 0.5 1.67 2.35 Stock OptionsStock Options granted by the Company generally expire between 5five to 10ten years from the grant date and generally vest over a 1one- to 3 yearthree-year service period commencing on the grant date.The Company used the modified Black-Scholes model to estimate the fair value of employee Stock Options on the date of grant utilizing the assumptions noted below. The risk-free rate is based on the U.S. Treasury bill yield curve in effect at the time of grant for the expected term of the option. The expected term of options granted represents the period of time that the options are expected to be89The following table provides the assumptions utilized in the Black-Scholes model for Stock Options granted during the periods presented: Years Ended December 31, 2023 2022 2021 Weighted-average risk-free interest rate — % 2.21 % 0.86 % Expected term of option in years 0.00 5.74 6.00 Weighted-average volatility — % 29.8 % 34.8 % Dividend yield — % 6.9 % 5.2 % Weighted-average grant date fair value per share Restricted Stock, GrantsgrantsUnitsRestricted Stock, Performance Share Units and Restricted Stock Units are awarded to certain employees in consideration for services rendered pursuant to terms of employment agreements and or to provide to those employees with a continued incentive to share in the success of the Company. Restricted Stock generally vests over a three yearone- to three-year service period commencing on the grant date.Performance Share UnitsPSUs are awarded to certain employees in consideration for services rendered pursuant to terms of employment agreements and provide those employees with a continued incentive to share in the success of the Company. Each performance share unit has a value equal to one share of common stock and generally vests over a three yearthree-year service period commencing on the grant date.NOTE 10 – EMPLOYEE BENEFIT PLANEffective January 1, 2009, the Company adopted a qualified retirement plan covering substantially all employees. It is designed to help the employees meet their financial needs during their retirement years. Eligibility for participation in the plan is generally based on employee’s date of hire or on completion of a specified period of service. Employer contributions to this plan are made in cash.The plan titled the “Universal Property & Casualty 401(K)401(k) Profit Sharing Plan and Trust”Plan” (the “401(k) Plan”) is a defined contribution plan that allows employees to defer compensation through contributions to the 401(k) Plan. The contributions are invested on the employees’ behalf, and the benefits paid to employees are based on contributions and any earnings or loss.losses. The 401(k) Plan includes a Company contribution of 100 percent of each eligible participant’s contribution that does not exceedup to a maximum of five percent of theirthe participant’s compensation during the 401(k) Plan year. The Company may make additional profit-sharing contributions. However, no additional profit-sharing contribution was made during the years ended December 31, 2017, 20162023, 2022, and 2015.The2021.Aggregate contributions paid by the Company accrued for aggregate contributions ofwere approximately $1.6$3.7 million, $1.2$3.4 million, and $1.0$2.9 million to the 401(k) Plan duringfor the years ended December 31, 2017, 20162023, 2022, and 2015,2021, respectively.NOTE 11 – RELATED PARTY TRANSACTIONSScott P. Callahan, a director of the Company, provided the Company with consulting services and advice with respect to the Company’s reinsurance and related matters through SPC Global RE Advisors LLC, an entity affiliated with Mr. Callahan. The Company entered into the consulting agreement with SPC Global RE Advisors LLC effective June 6, 2013. The Company and SPC Global RE Advisors LLC terminated the consulting agreement on September 18, 2015 by mutual consent.The following table provides payments made by the Company to related parties for the periods presented (in thousands):amounts due to SPC Global RE Advisors LLC as ofrelated party transactions for the years ended December 31, 2015. Payments due to SPC Global RE Advisors LLC were generally made in the month the services were provided.9092NOTE 12 – INCOME TAXESSignificant components of the income tax provision are as follows for the periods presented (in thousands):For the Years Ended December 31, 2023 2023 2023 Current: Current: Federal Federal State and local State and local Total current expense Total current expense Total current expense Deferred: Deferred: Federal Federal State and local State and local Total deferred expense (benefit) Total deferred expense (benefit) Income tax expense (benefit) Income tax expense (benefit) Income tax expense (benefit) The following table reconciles the statutory federal income tax rate to the Company’s effective income tax rate for the periods presented:For the Years Ended December 31, For the Years Ended December 31, 2023 2023 2022 2021 Federal statutory tax rate Federal statutory tax rate 21.0 % 21.0 % 21.0 % State income tax, net of federal tax benefit State income tax, net of federal tax benefit 2.2 % (1.4) % 1.7 % Effect of change in tax rate — % 2.0 % 0.1 % Disallowed meals & expenses Disallowed meals & expenses 0.2 % (0.4) % 0.1 % Disallowed compensation 1.5 % (3.7) % 2.1 % Excess tax (benefit) shortfall Excess tax (benefit) shortfall Excess tax (benefit) shortfall — % (0.8) % 2.3 % Other, net (0.5) % 1.6 % 0.9 % Effective income tax rate Effective income tax rate 24.4 % 18.3 % 28.2 % During the year ended December 31, 2017, the Company’sThe Company recognized an excess income tax benefit of $5.8$0.02 million was reflected as an income tax benefit in the consolidated statements of income as a component of the provision for income taxes as a result of the adoption of the accounting guidance for share-based payment transactions. See “–Note 2 (Significant Accounting Policies – Recently Adopted Accounting Pronouncements)” for more information.Recent changes in federal tax law and applicable statutory rates have affected the Company’s balances of deferred income tax assets and liabilities. On December 22, 2017, the Tax Cuts and Jobs Act of 2017 was signed into law. Under US GAAP, the effect of a change in tax law is recorded discretely as a component of the income tax provision related to continuing operations in the period of enactment. The effect of the change in tax law resulted in a reduction to the Company’s net deferred income tax assets of $4.7 million and a corresponding offset to income tax expense in the consolidated statement of income for the year ended December 31, 2017.In addition, during the year ended December 31, 2017, the Company recorded another discrete item as a credit to2023 and an excess income tax expenseshortfall of $1.2$0.2 million resultingduring the year ended December 31, 2022 from anticipated recoveries of income taxes paidstock-based compensation awards that vested and/or were exercised.The Company adopted the standard for Corporate Alternative Minimum Tax (“CAMT”), reflected in the Inflation Reduction Act, enacted on August 16, 2022, for the 2014-2015 tax years.Additional factors giving risereporting period beginning January 1, 2023. The Company was not subject to the differences inprovisions of the Company’s effective tax rate, when compared to statutory rates inCAMT section for the current and prior years, include non-deductible executive compensation, tax-exempt interest income, and the current expansion outside of Florida into non-income taxing state jurisdictions.9193The Company accounts for income taxes using a balance sheet approach. As of December 31, 20172023 and 2016,2022, the significant components of the Company’s deferred income taxes consisted of the following (in thousands):As of December 31, As of December 31, 2023 2023 2022 Unearned premiums Unearned premiums Net operating loss carryforwards Net operating loss carryforwards Net operating loss carryforwards Unrealized gain/loss Deferred income tax liabilities: Deferred income tax liabilities: Deferred policy acquisition costs, net Deferred policy acquisition costs, net Fixed assets Fixed assets Unpaid loss and LAE transition adjustment Unpaid loss and LAE transition adjustment Unpaid loss and LAE transition adjustment At each balance sheet date, management assesses the need to establish a valuation allowance that reduces deferred income tax assets when it is more likely than not that all, or some portion, of the deferred income tax assets will not be realized. A valuation allowance would be based on all available information including the Company’s assessment of uncertain tax positions and projections of future taxable income and capital gain from each tax-paying component in each jurisdiction, principally derived from business plans and available tax planning strategies.Deferred tax assets and liabilities are recorded based on the difference between the financial statement and tax basis of assets and liabilities at the enacted tax rates. The Company reviews its deferred tax assets regularly for recoverability. Management believeshas reviewed all available evidence, both positive and negative, in determining the need for a valuation allowance with respect to the gross deferred tax assets. In determining the manner in which available evidence should be weighted, management has determined that it is more likely thanthe need for a valuation allowance was not that a portionwarranted as of the benefit relating to the state capital loss carryforward will not be realized. In recognition of this risk, the Company has provided an additional valuation allowance during 2017 of $297 thousand on the balance of the deferred income tax asset as ofperiods ending December 31, 2017. If management’s assumptions change2023 and determine the Company will be able to realize these capital loss carryforwards, the income tax benefits related to any reversal of the valuation allowance on deferred income tax assets as of December 31, 2017, will be accounted for as a future reduction in income tax expense.The Company has adopted Accounting for Uncertainty in Income Taxes (“ASC 740”) which clarifies the accounting for uncertainty in income taxes recognized in an enterprise’s financial statements. ASC 740 provides a threshold for the financial statement recognition and measurement of an income tax position taken or expected to be taken in an income tax return. The Company’s policy is to classify interest and penalties related to unrecognized tax positions, if any, in its provision for income taxes. As of December 31, 20172023, 2022, and 2016,2021, the Company determined that no uncertain tax liabilities are required.The Company filed a consolidated federal income tax return for the tax years ended December 31, 2016, 20152022, 2021 and 20142020 and intends to file the same for the tax year ended December 31, 2017.2023. The tax allocation agreement between the Company and the Insurance Entities provideprovides that they will incur income taxes based on a computation of taxes as if they were stand-alone taxpayers. The computations are made utilizing the financial statements of the Insurance Entities prepared on a statutory basis of accounting and prior to consolidating entries which include the conversion of certain balances and transactions of the statutory financial statements to a U.S. GAAP basis.The Company files its income tax returns as prescribed by the tax laws of the jurisdictions in which it operates. TheAs of December 31, 2023, the Company’s 20142020 through 20162022 tax years are still subject to examination by the Internal Revenue Service and various tax years remain open to examination in certain state jurisdiction. In February 2018, the Company received notification from the Internal Revenue Service for an examination of the 2015 tax return.9294NOTE 13 – EARNINGS (LOSS) PER SHAREBasic earnings (loss) per share (“EPS”) is computed based on the weighted average number of common shares outstanding for the period, excluding any dilutive common share equivalents. Diluted EPS reflects the potential dilution resulting from exercisesthe impact of common shares issuable upon the exercise of stock options, vesting ofnon-vested performance share units, vesting ofnon-vested restricted stock units, non-vested restricted stock, and conversion of preferred stock.The following table reconciles the numerator (i.e., income) and denominator (i.e., shares) of the basic and diluted earnings (loss) per share computations for the periods presented (in thousands, except per share data):Years Ended December 31, Years Ended December 31, 2023 2023 2022 2021 Net income (loss) Net income (loss) Net income (loss) Income (loss) available to common stockholders Denominator for EPS: Basic earnings (loss) per common share Diluted earnings (loss) per common share
(1)Represents the dilutive effect of common shares issuable upon the exercise of stock options, non-vested performance share units, non-vested restricted stock units and non-vested restricted stock.(1)Represents the dilutive effect of unexercised Stock Options, unvested Performance Share Units, and unvested Restricted Stock.95NOTE 14 – OTHER COMPREHENSIVE INCOME (LOSS)The following table provides the components of other comprehensive income (loss) on a pretaxpre-tax and after-tax basis for the periods presented (in thousands):Years Ended December 31, 2023 2022 2021 Pre-tax Tax After-tax Pre-tax Tax After-tax Pre-tax Tax After-tax Net changes related to available-for-sale debt securities: Unrealized holding gains
(losses) arising during
the period$ 37,793 $ 9,306 $ 28,487 $ (118,832) $ (29,247) $ (89,585) $ (24,477) $ (5,731) $ (18,746) Less: Reclassification adjustments (gains) losses realized in net income1,490 367 1,123 1,818 447 1,371 (215) (50) (165) Change in accumulated other
comprehensive income (loss)$ 39,283 $ 9,673 $ 29,610 $ (117,014) $ (28,800) $ (88,214) $ (24,692) $ (5,781) $ (18,911) The following table provides the reclassificationsreclassification adjustments for gains and losses out of accumulated other comprehensive incomeAOCI for the periods presented (in thousands):Amounts Reclassified from
Accumulated Other
Comprehensive IncomeDetails about Accumulated Other Details about Accumulated Other Years Ended December 31, Affected Line Item in the Statement Comprehensive Income Components 2023 2022 2021 Where Net Income is Presented Unrealized gains (losses) on
available-for-sale debt securities$ $ $ (1,491) $ (1,818) $ 215 Net realized gains (losses) on investments 367 367 447 (50) Income taxes, current Total reclassification for the period Total reclassification for the period $ (1,124) $ (1,371) $ 165 Net of tax 93NOTE 15 – COMMITMENTS AND CONTINGENCIESObligations under Multi-Year Reinsurance ContractsThe Company purchases reinsurance coverage to protect its capital and to limit its losses when certain major events occur. The Company’s reinsurance commitments generally run from June 1st of the current year to May 31st of the following year. Certain of the Company’s reinsurance agreements are for periods longer than one year. Amounts payable for coverage during the current June 1st to May 31st contract period are recorded as “Reinsurance Payable, net” in the Consolidated Balance Sheet. Multi-year contract commitments for future years will be recorded at the commencement of the coverage period. Amounts payable for future reinsurance contract years that the Company is obligated to pay are: (1) $72.7 million in 2024; and (2) $52.6 million in 2025.LitigationLawsuits and other legal proceedings are filed against the Company from time to time. These legal matters include regulatory and contract considerations for which the Company obtains internal or third-party legal or other assistance, such as actuarial services, to provide guidance, and when applicable, to represent and protect the Company’s interest.Many of these lawsuitslegal proceedings involve claims under policies that we underwritethe Company underwrites and reservereserves for as an insurer. We areThe Company is also involved in various other legal proceedings and litigation unrelated to claims under ourthe Company’s policies that arise in the ordinary course of business operations. Management believes that any liabilities that may arise as a result of these legal matters will not have a material adverse effect on ourthe Company’s financial condition or results of operations. The Company contests liability and/or the amount of damages as it considers appropriate inaccording to the facts and circumstances of each pending matter.In accordance with applicable accounting guidance, the Company establishes an accrued liability for legal matters when those matters present loss contingencies that are both probable and estimable.96Legal proceedings are subject to many uncertain factors that generally cannot be predicted with assurance,certainty, and the Company may be exposed to losses in excess of any amounts accrued. The Company currently estimates that the reasonably possible losses for legal proceedings, whether in excess of a related accrued liability, including reserves, or where there is no accrued liability, and for which the Company is able to estimate a possible loss, are immaterial. This represents management’s estimate of possible loss with respect to these matters and is based on currently available information. These estimates of possible loss do not represent our maximum loss exposure, and actual results may vary significantly from current estimates.97NOTE 16 – FAIR VALUE MEASUREMENTSU.S. GAAP defines fair value as the price that would be received to sell an asset or paid to transfer a liability in an orderly transaction between market participants as of the measurement date. U.S. GAAP describes three approaches to measuring the fair value of assets and liabilities: the market approach, the income approach, and the cost approach. Each approach includes multiple valuation techniques. U.S. GAAP does not prescribe which valuation technique should be used when measuring fair value, but does establish a fair value hierarchy that prioritizes the inputs used in applying the various techniques. Inputs broadly refer to the assumptions that market participants use to make pricing decisions, including assumptions about risk. Level 1 inputs are given the highest priority in the hierarchy while Level 3 inputs are given the lowest priority. Assets and liabilities carried at fair value are classified in one of the following three categories based on the nature of the inputs to the valuation technique used:–— Observable inputs that reflect unadjusted quoted prices for identical assets or liabilities in active markets as of the reporting date. Active markets are those in which transactions for the asset or liability occur in sufficient frequency and volume to provide pricing information on an ongoing basis.–— Observable market-based inputs or unobservable inputs that are corroborated by market data.–— Unobservable inputs that are not corroborated by market data. These inputs reflect management’s best estimate of fair value using its own assumptions about the assumptions a market participant would use in pricing the asset or liability.Summary of significant valuation techniquesSignificant Valuation Techniques for assets measuredAssets Measured at fair valueFair Value on a recurring basisLevel 1Common stock: Comprise actively traded, exchange-listed U.S. and international equity securities. Valuation is based on unadjusted quoted prices for identical assets in active markets that the Company can access.Mutual funds: Comprise actively traded funds. Valuation is based on daily quoted net asset values for identical assets in active markets that the Company can access.Level 2U.S. government obligations and agencies: Comprise U.S. Treasury Bills or Notes or U.S. Treasury Inflation Protected Securities. The primary inputs to the valuation include quoted prices for identical assets in inactive markets or similar assets in active or inactive markets, contractual cash flows, benchmark yields and credit spreads.Corporate bonds: Comprise investment-grade fixed incomedebt securities. The primary inputs to the valuation include quoted prices for identical assets in inactive markets or similar assets in active or inactive markets, contractual cash flows, benchmark yields, and credit spreads.Mortgage-backed and asset-backed securities: Comprise securities that are collateralized by mortgage obligations and other assets. The primary inputs to the valuation include quoted prices for identical assets in inactive markets or similar assets in active or inactive markets, contractual cash flows, benchmark yields, collateral performance, and credit spreads.94Municipal bonds:Comprise fixed incomedebt securities issued by a state, municipality, or county. The primary inputs to the valuation include quoted prices for identical assets in inactive markets or similar assets in active or inactive markets, contractual cash flows, benchmark yields and credit spreads.Redeemable preferred stock: Comprise preferred stock securities that are redeemable. The primary inputs to the valuation include quoted prices for identical or similar assets in markets that are not active.Other: Comprise investment securities subject to re-measurement with original maturities beyond one year. The primary inputs to the valuation include quoted prices for identical or similar assets in markets that are not active.Short-term investments: Comprise investment securities subject to re-measurement with original maturities within one year but more than three months. The primary inputs to the valuation include quoted prices for identical or similar assets in markets that are not active.As required by U.S. GAAP, assets and liabilities are classified in their entirety based on the lowest level of input that is significant to the fair value measurement. The Company’s assessment of the significance of a particular input to the fair value measurement requires judgment, and may affect the placement of the asset or liability within the fair value hierarchy levels.Level 3Other investments in private equity funds: Comprise of passive interest in non-marketable private equity fund securities. The primary inputs to the valuation include the cost basis of consideration tendered for the investments, the Trailing-Twelve Month (TTM) EBITDA, and TTM EBITDA Multiple.98The following tables set forth by level within the fair value hierarchy the Company’s assets that were measured at fair value on a recurring basis as of the dates presented (in thousands):Fair Value Measurements Fair Value Measurements As of December 31, 2023 As of December 31, 2023 Level 1 Level 1 Level 2 Level 3 Total Available-For-Sale Debt Securities: U.S. government obligations and agencies U.S. government obligations and agencies Equity Securities: Common stock Common stock Investment in Private Equity Limited Partnership Fair Value Measurements Fair Value Measurements As of December 31, 2022 As of December 31, 2022 Level 1 Level 1 Level 2 Level 3 Total Available-For-Sale Debt Securities: U.S. government obligations and agencies U.S. government obligations and agencies Equity Securities: Common stock Common stock Investment in Private Equity Limited Partnership Total assets accounted for at fair value Total assets accounted for at fair value 99The following table summarizes quantitative information related to the significant unobservable inputs for Level 3 investments, which were carried at fair value as of the dates presented (in thousands):As of December 31, 2023 Range Fair Value Valuation Methodology Unobservable Input Weighted Average Mean Minimum Maximum Assets: Investment in Private Equity Limited Partnership $ 10,434 Market Approach Trailing Twelve Month EBITDA Multiple 5.3x 5.3x 5.3x As of December 31, 2022 (1) Range Fair Value Valuation Methodology Unobservable Input Weighted Average Mean Minimum Maximum Assets: Investment in Private Equity Limited Partnership $ — Market Approach Trailing Twelve Month EBITDA Multiple n/a n/a n/a (1) The Company made the initial investment in the private equity limited partnership in 2023, resulting in no balances or data being applicable as of December 31, 2022.These estimates may be subjective in nature and involve uncertainties and matters of significant judgment and, therefore, cannot be determined with precision.The Company utilizes third-party independent pricing services that provide a price quote for each fixed maturity, equityavailable-for-sale debt security and short-term investment.equity security. Management reviews the methodology used by the pricing services. If management believes that the price used by the pricing service does not reflect an orderly transaction between participants, management will use an alternative valuation methodology. There were no adjustments made by the Company to the prices obtained from the independent pricing source for any fixed maturities or equity securitiessecurity included in the tables above.95The following table summarizes the carrying value and estimated fair values of the Company’s financial instruments that are not carried at fair value as of the dates presented (in thousands):As of December 31, 2023 2022 Carrying
ValueEstimated
Fair ValueCarrying
ValueEstimated
Fair ValueLiabilities (debt): Surplus note (1) $ 4,044 $ 3,783 $ 5,515 $ 5,126 5.625% Senior unsecured notes (2) 100,000 98,953 100,000 100,350 Total debt $ 104,044 $ 102,736 $ 105,515 $ 105,476 Level 3Long-term debt: (1) The fair value of the surplus note was determined by management from the expected cash flows discounted using the interest rate quoted by the holder. The SBA is the holder of the surplus note and the quoted interest rate is below prevailing rates quoted by private lending institutions. However, as the Company’s use of funds from the surplus note is limited by the terms of the agreement, the Company has determined the interest rate quoted by the SBA to be appropriate for purposes of establishing the fair value of the note.100(2) The fair value of the promissory notesenior unsecured notes was not materially different than its carrying value.101NOTE 17 – LIABILITY FOR UNPAID LOSSES AND LOSS ADJUSTMENT EXPENSESSet forth in the following tables is information about unpaid losses and loss adjustment expenses as of December 31, 2017,2023, net of reinsurance and estimated subrogation, as well as cumulative claim counts and the total of incurred-but-not-reported (“IBNR”) liabilities plus expected development on reported claims included within the liability for unpaid losses and LAE (in thousands).The liability for losses and loss adjustment expenses includes an amount determined from loss reports and individual cases and an amount, based on past experience, for losses incurred but not reported.IBNR. Such liabilities are necessarily based on estimates and, although management believes that the amount is adequate, the ultimate liability may be in excess of or less than the amounts provided. The methods for making such estimates and for establishing the resulting liability are continually reviewed, and any adjustments are reflected in earnings currently. The reserve for losses and loss adjustment expenses is reported net of receivables for salvage and subrogation of approximately $85$144.1 million and $76$134.4 million at December 31, 20172023 and 2016,2022, respectively.The information about unpaid losses and loss adjustment expenses for the years ended December 31, 20132019 to 2015,2022, is presented as supplementary information and is unaudited.As of December 31, 2023 Total of IBNR Plus Expected Incurred Loss and Defense & Cost Containment Expenses, Net of Reinsurance Development (Redundancy) Cumulative Number For the Years Ended December 31, on Reported Claims of Reported Claims Accident Year 2019 * 2020 * 2021 * 2022 * 2023 2019 $ 446,419 $ 452,029 $ 467,198 $ 470,372 $ 487,459 $ (4,404) 47,695 2020 617,795 637,764 635,412 725,486 (4,604) 81,106 2021 641,679 646,977 695,957 (19,332) 60,580 2022 793,341 717,840 (19,946) 103,936 2023 823,511 344,113 45,849 Total $ 3,450,253 96TableCumulative Paid Loss and Defense & Cost Containment Expenses, Net of Reinsurance For the Years Ended December 31, Accident Year 2019 * 2020 * 2021 * 2022 * 2023 2019 $ 335,991 $ 446,997 $ 463,924 $ 480,967 $ 499,468 2020 452,560 604,201 645,553 734,607 2021 461,709 665,008 725,118 2022 518,829 736,066 2023 460,721 Total $ 3,155,980 All outstanding liabilities before 2019, net of reinsurance 14,586 Liabilities for unpaid claims and claim adjustment expenses, net of reinsurance $ 308,859 * Presented as unaudited required supplementary information. Set forth is the supplementary information about average historical claims duration as of ContentsDecember 31, 2023:Average Annual Percentage Payout of Incurred Claims by Age, Net of Reinsurance Years 1 2 3 4 5 56.3 % 19.4 % 12.3 % 5.9 % 3.0 % 102Set forth is the following reconciliation of the net incurred and paid claims development tables to the liability for unpaid losses and LAE in the consolidated Balance Sheet as of December 31, 20172023 (in thousands):December 31, 2023 Liabilities for unpaid claims and claim adjustment expenses, net of reinsurance $ 308,859 Reinsurance recoverable on unpaid claims 183,435 Liabilities for adjusting and other claim payments 17,823 Total gross liability for unpaid claims and claim adjustment expense $ 510,117 Set forth is the supplementary information about average historical claims duration as of December 31, 2017:Years Ended December 31, Years Ended December 31, 2023 2023 2022 2021 Current year Current year Paid related to: 97As a result of changes in estimates of insured events in prior years, the loss and loss adjustment expense increased by $27.5 million in 2017. During 20172023, the liability for unpaid losses and loss adjustment expenses, increasedprior to reinsurance, decreased by $189.9$528.7 million from $58.5$1.0 billion as of December 31, 2022 to $510.1 million as of December 31, 2016 to $248.4 million as of December 31, 2017. This increase was primarily a result of Hurricane Irma, for which the Company has reinsurance recoverable of $182.4 million. Other factors leading to the increase include the increase in our underlying exposure due to increased writings in Florida and other states, as well as prior year adverse development reserve of $27.5 million, primarily driven by assignment of benefits (“AOB”) related claims within our Florida book, including the increased litigation frequency experienced during 2017 surrounding the AOB issue. Total reserve re-estimates conducted in 2016 and 2015, resulted in favorable development of $4.7 million in 2016, and $0.3 million in 2015.2023. The favorable development in 2016decrease was principally the result of the settlement of Hurricane Ian claims, other prior hurricanes and claims arising in the current and prior accident years.Prior year development includes changes in previous estimates for unpaid Losses and LAE for all events occurring in prior years including hurricanes, other weather, and non-weather claims affected by pre-reform market conditions in Florida as well as changes in prior estimates resulting from the evaluation of claims in anticipation of the commutation of Hurricane Irma losses with the FHCF. In recent years, the Company has strengthened reserves as a result of adverse development due to Florida homeowners, tenants and condo owners coverages arising from non-weather and weather events. Similar to other carriers operating in the Florida homeowners marketplace, the Company has experienced deterioration in water and hurricane claims due to an unfavorable claims environment characterized by increases in estimated subrogation recoveries.Losses and LAE experience over the past several years including both 2023 and 2022, reflects an adverse litigation environment and other market conditions in Florida that the Florida Legislature has been attempting to address with the passage of legislation spanning several years with the most significant changes made during a special session held in December 2022. The Company considered and included the effects of the enacted legislation in developing its ultimate loss projections and reserve estimates as of December 31, 2023.In addition to the actions taken by the Florida legislature, management has been taking actions to improve losses and LAE experience through several means including operational initiatives designed to improve the efficiency and effectiveness of the claims cycle and reduce the impact of litigation; implementing pricing increases to address the loss experience as well as inflation and the increasing cost of reinsurance; reducing undesirable exposures; and securing efficient reinsurance programs to protect against catastrophes.103Basis for estimating liabilities for unpaid claims and claim adjustment expensesThe Company establishes a liability to provide for the estimated unpaid portion of the costs of paying losses and LAE under insurance policies the Insurance Entities have issued. Predominately all of the Company’s claims relate to the Company’s core product, homeowners insurance and the various policy forms in which it is available. The liability for unpaid losses and LAE consists of the following: Ceded reinsurance for both paid and unpaid claims are reported separately as reinsurance recoverable. (“IBNR”), which are anticipated losses expected to be reported to the companyCompany and development of reported claims, including anticipated recoveries from either subrogation orand ceded reinsurance.Underwriting results are significantly influenced by the Company’s practices in establishing its estimated liability for unpaid losses and LAE. The liability is an estimate of amounts necessary to ultimately settle all current and future claims and LAE on claimslosses occurring during the policy coverage period each year as of the financial statement date.Characteristics of ReservesThe liability for unpaid losses and LAE, also known as reserves, areis established based on estimates of the ultimate future amounts needed to settle claims, either known or unknown, less losses and LAE that have been paid to date. ClaimsHistorically, claims are typically reported promptly with relatively little reporting lag between the date of occurrence and the date the loss is reported. Certain numbers of claims are not known immediately after a loss and insureds are delayed at reporting those losses to us. In the current Florida market, an increased number of claims are reported well after the purported dates of loss. Reporting delays at times are material. In addition, claims which the Insurance Entities believed were settled often are reopened based on newly reported claim demands from our insureds as a result of third party representation. The Company is seeing increased litigation and changes to consumer behavior over the reporting and settlement process especially with Florida-based claims. The Company’s claim settlement data suggests that the Company’s typical insurance claims have an average settlement time of less than one year.Reserves are estimated for both reported and unreported claims, and include estimates of all expenses associated with processing and settling all incurred claims, including consideration for anticipated subrogation recoveries that will offset future loss payments. The companyCompany updates reserve estimates periodically as new information becomes available or as events emerge that may affect the resolution of unsettled claims. Changes in prior year reserve estimates (reserve re-estimates), which may be material, are determined by comparing updated estimates of ultimate losses to prior estimates, and the differences are recorded as losses and LAE in the Consolidated Statements of Income in the period such changes are determined. Estimating the ultimate cost of losses and LAE is an inherently uncertain and complex process involving a high degree of subjective judgment and is subject to the interpretation and usage of numerous uncertain variables as discussed further below.Reserves for losses and LAE are determined in three primary sectors. These sectors are (1) the estimation of reserves for Florida non-catastrophe losses, (2) hurricane losses, and (3) non-Florida non-catastrophe losses, and any other losses. Evaluations are performed for gross loss, LAE, and subrogation separately, and on a net and direct basis for each sector. The analyses for non-catastrophe losses are further separated into data groupings of like exposure or type of loss. These groups are property damage on homeowner policy forms HO-3 and HO-8 combined, property damage on homeowner policy forms HO-4 and HO-6 combined, property damage on dwelling fire policies, sinkhole claims, and water damage claims. Although these sectors are aggregated into the single tables noted above, analyses are performed in these three sectors, due to the analogous nature of the product and similar claim settlement traits.As claims are reported, the claims department establishes an estimate of the liability for each individual claim called case reserves. For certain liability claims of sufficient size and complexity, the field adjusting staff establishes case reserve estimates of ultimate cost, based on their assessment of facts and circumstances related to each individual claim. Opportunities for subrogation are also identified for further analysis and collection. For other claims which occur in large volumes and settle in a relatively short time frame, it is not practical or efficient to set case reserves for each claim, and an initial case reserve of $2,500 is set for these claims. In the normal course of business, wethe Company may also supplement ourits claims processes by utilizing third party adjusters, appraisers, engineers, inspectors, other professionals, and information sources to assess and settle catastrophe and non-catastrophe related claims.Reserve estimates for both unpaid losses and LAE are derived using several different actuarial estimation methods in order to provide the actuary with multiple predictive viewpoints to consider for each of the sectors discussed above. Each of the methods has merit,98104counts, for open claims by accident period. An accident period refers to classification of claims based on the date in which the claims occurred, regardless of the date they were reported to the company. These analyses are used to prepare estimates of required reserves for payments or recoveries to be made in the future. Transactions are organized into half-year accident periods for purposes of the reserve estimates. Key data elements used to determine ourthe Company’s reserve estimates include historical claim counts, loss and LAE payments, subrogation received, case reserves, earned policy exposures, and the related development factors applicable to this data.The first method for estimating unpaid amounts for each sector is a chain ladder method called the paid development method. This method is based upon the assumption that the relative change in a given accident period’s paid losses from one evaluation point to the next is similar to the relative change in prior periods’ paid losses at similar evaluation points. In utilizing this method, actual 6-month historical loss activity is evaluated. Successive periods can be arranged to form a triangle of data. Paid-to-Paid (“PTP”) development factors are calculated to measure the change in cumulative paid losses, LAE, and subrogation recoveries, from one evaluation point to the next. These historical PTP factors form the basis for selecting the PTP factors used in projecting the current valuation of losses to an ultimate basis. In addition, a tail factor is selected to account for loss development beyond the observed experience. The tail factor is based on trends shown in the data and consideration of industry loss development benchmarks. Utilization of a paid development method has the advantage of avoiding potential distortions in the data due to changes in case reserving methodology. This method’s implicit assumption is that the rate of payment of claims has been relatively consistent over time, and that there have been no material changes in the rate at which claims have been reported or settled. In instances where changes in settlement rates are detected, the PTP factors are adjusted accordingly, utilizing appropriate actuarial techniques. These adjusted techniques each produce additional development method estimates for consideration.A second method is the reported development method. This method is similar to the paid development method; however, case reserves are considered in the analysis. Successive periods of reported loss estimates (including paid loss, subrogation recoveries, paid LAE and held case reserves) are organized similar to the paid development method in order to evaluate and select Report-to-Report (“RTR”) development factors. This method has the advantage of recognizing the information provided by current case reserves. Its implicit assumption is that the relative adequacy of case reserves is consistent over time, and that there have been no material changes in the rate at which claims have been reported or settled. In cases where significant reserve strengthening or other changes have occurred, RTR factors are adjusted accordingly, utilizing appropriate actuarial techniques.A third method is the Bornhuetter-Ferguson (“B-F”) method, which is also utilized for estimating unpaid loss and LAE amounts. Each B-F technique is a blend of chain ladder development methods and an expected loss method, whereby the total reserve estimate equals the unpaid portion of a predetermined expected unpaid ultimate loss projection. The unpaid portion is determined based on assumptions underlying the development methods. As an experience year matures and expected unreported (or unpaid) losses become smaller, the initial expected loss assumption becomes gradually less important. This has the advantage of stability, but it is less responsive to actual results that have emerged. Two parameters are needed in each application of the B-F method: an initial assumption of expected losses and the expected reporting or payment pattern. Initial expected losses for each accident period other than the current year is determined using the estimated ultimate loss ratio from the prior analysis. Initial expected losses for the current year’s accident periods are determined based on trends in historical loss ratios, rate changes, and underlying loss trends. The expected reporting pattern is based on the reported or paid loss development method described above. This method is often used in situations where the reported loss experience is relatively immature or lacks sufficient credibility for the application of other methods.A fourth method, called the counts and averages method, is utilized for estimates of loss, subrogation and LAE for each Florida sector. In this method, an estimate of unpaid losses or expenses is determined by separately projecting ultimate reported claim counts and ultimate claim severities (cost or recoveries per claim) on open and unreported claims for each accident period. Typically, chain ladder development methods are used to project ultimate claim counts and claim severities based on historical data using the same methodology described in the paid and reported development methods above. Estimated ultimate losses are then calculated as the product of the two items. This method is intended to avoid data distortions that may exist with the other methods for the most recent years as a result of changes in case reserve levels, settlement rates, and claims handling fees. In addition, it may provide insight into the drivers of loss experience. For example, this method is utilized for sinkhole losses due to unique settlement patterns that have emerged since the passage of legislation that codified claim settlement practices with respect to sinkhole related claims and subsequent policy form changes wethe Company implemented. The method is also utilized to evaluate segments impacted by the implementation of our Fast Track Initiative, which is an initiative to settle claims on an accelerated basis. These claims are expected to be reported and settled at different rates and ultimate values than historically observed, requiring a departure from traditional development methodologies.99The implicit assumption of these techniques is that the selected factors and averages combine to form development patterns or severity trends that are predictive of future loss development of incurred claims. In selecting relevant parameters utilized in each estimation method, due consideration is given to how the patterns of development change from one year to the next over the course of several consecutive years of recent history. Furthermore, the effects of inflation and other anticipated trends are considered in the reserving process in order to generate selections that include adequate provisions to estimate the cost of claims that settle in the future. Finally, in addition to paid loss, reported loss, subrogation recoveries, and LAE development triangles, various diagnostic triangles, such as triangles showing historical patterns in the ratio of paid-to-reported losses and closed-to-reported claim counts are prepared. These diagnostic triangles are utilized in order to monitor the stability of various determinants of loss development, such as consistency in claims settlement and case reserving.Estimates of unpaid losses for hurricane experience are developed using a combination of company-specific and industry patterns, due to the relatively infrequent nature of storms and the high severity typically associated with them. Development patterns and other benchmarks are based on consideration of all reliable information, such as historical events with similar landfall statistics, the range of estimates developed from industry catastrophe models, and claim reporting and handling105statistics from our field units. It is common for the company to update its projection of unpaid losses and LAE for a significant hurricane event on a monthly, or even weekly basis, for the first 6-months following an event.Estimation methods described above each produce estimates of ultimate losses and LAE. Based on the results of these methods, a single estimate (commonly referred to as an actuarial point/central estimate) of the ultimate loss and LAE is selected accordingly for each accident-year claim grouping. Estimated IBNR reserves are determined by subtracting reported losses from the selected ultimate loss, and the paid LAE from the ultimate LAE. The estimated loss IBNR reserves are added to case reserves to determine total estimated unpaid losses. Note that estimated IBNR reserves can be negative for an individual accident-year claim grouping if the selected ultimate loss includes a provision for anticipated subrogation, or if there is a possibility that case reserves are overstated. No case reserves are carried for LAE, therefore the estimated LAE IBNR reserves equal the total estimated unpaid LAE. For each sector, the reserving methods are carried out on both a net and direct basis in order to estimate liabilities accordingly. When selecting a single actuarial point/central estimate on a net basis, careful consideration is given for the reinsurance arrangements that were in place during each accident year, exposure period and segment being reviewed.How Reserve Estimates are Established and UpdatedReserve estimates are developed for both open claims and unreported claims. The actuarial methods described above are used to derive claim settlement patterns by determining development factors to be applied to specific data elements. Development factors are calculated for data elements such as claim counts reported and settled, paid losses and paid losses combined with case reserves, loss expense payments, and subrogation recoveries. Historical development patterns for these data elements are used as the assumptions to calculate reserve estimates.Often, different estimates are prepared for each detailed component, incorporating alternative analyses of changing claim settlement patterns and other influences on losses, from which a best estimate is selected for each component, occasionally incorporating additional analyses and actuarial judgment as described above. These estimates are not based on a single set of assumptions. Based on a review of these estimates, the best estimate of required reserves is recorded for each accident year and the required reserves are summed to create the reserve balance carried onin the Consolidated Balance Sheets.Reserves are re-estimated periodically by combining historical payment and reserving patterns with current actual results. When actual development of claims reported, paid losses or case reserve changes are different than the historical development pattern used in a prior period reserve estimate, and as actuarial studies validate new trends based on indications of updated development factor calculations, new ultimate loss and LAE predictions are determined. This process incorporates the historic and latest trends, and other underlying changes in the data elements used to calculate reserve estimates. The difference between indicated reserves based on new reserve estimates and the previously recorded estimate of reserves is the amount of reserve re-estimates. The resulting increase or decrease in the reserve re-estimates is recorded and included in “Losses and loss adjustment expenses” in the Consolidated Statements of Income.Claim frequencyThe methodology used to determine claim counts is based first around the event and then based on coverage. One event could have one or more claims based on the policy coverage, for example an event could have a claim for the first party coverage and a claim for third party liability regardless of the number of third party claimants. If multiple third-party liability claims are reported together, they would be counted as one claim.100NOTE 18 – VARIABLE INTEREST ENTITIESThe Company entered into a reinsurance captive arrangement with Isosceles Insurance Ltd. acting in respect of ContentsThe reinsurance captive arrangement entered into in the prior year, which was effective June 1, 2022 through May 31, 2023, was subject to a full policy limit loss of $66 million on September 28, 2022 triggered when Hurricane Ian made landfall on the Gulf Coast of Florida. Amounts due under this policy were fully paid in September 2022 to UPCIC.The Company has used the VIE to provide certain reinsurance coverage to the Insurance Entities (UPCIC and APPCIC). In 2023, the Insurance Entities entered into a reinsurance transaction whereby the VIE provided catastrophe reinsurance protection to the Insurance Entities for the period of June 1, 2023 through May 31, 2024.Effective December 6, 2023, this captive reinsurance policy was commuted whereby the Insurance Entities and UIH received funds previously held in trust by the VIE as agreed to under the commutation. There were no agreements in place with the VIE at December 31, 2023 as a result of the commutation.106NOTE 1819 – QUARTERLY RESULTS FOR 20172023 AND 20162022 (UNAUDITED)The following table provides a summary of quarterly results for the periods presented (in thousands except per share data):First
QuarterSecond
QuarterThird
QuarterFourth
QuarterFor the Year Ended December 31, 2023 Premiums earned, net 282,224 303,274 331,040 335,398 Net investment income 10,698 11,282 12,755 13,714 Total revenues 316,508 339,570 360,048 375,456 Total expenses 282,081 300,402 366,294 347,925 Net income (loss) 24,173 28,566 (5,915) 19,999 Basic earnings (loss) per share $ 0.80 $ 0.94 $ (0.20) $ 0.69 Diluted earnings (loss) per share $ 0.79 $ 0.93 $ (0.20) $ 0.68 For the Year Ended December 31, 2022 Premiums earned, net 269,064 277,061 290,631 291,870 Net investment income 4,042 5,221 6,074 10,448 Total revenues 287,482 292,006 312,810 330,360 Total expenses 263,403 279,595 404,417 295,881 Net income (loss) 17,537 7,370 (72,275) 25,111 Basic earnings (loss) per share $ 0.56 $ 0.24 $ (2.36) $ 0.83 Diluted earnings (loss) per share $ 0.56 $ 0.24 $ (2.36) $ 0.82 Total revenuesDirect premiums written increased by $16.5 million, or 4.0%, to $432.6 million for the quarter ended December 31, 2023, driven by premium growth within our Florida business of $2.0 million, or 0.6%, and premium growth in our other states business of $14.6 million, or 18.6%, as compared to the prior year fourth quarter. Rate increases approved in 2022 and 2023 for Florida and for certain other states and policy inflation adjustments were the principal driver of higher written premiums, in addition to an increase in policies in force. In total, policies in force increased by 2,379 or 0.3% during the fourth quarter, of 2017 exceeded 2016 principally drivenand declined by increased policy and premium counts year38,924 or 4.6% over year driven by organic growth in, and outside of Florida. The fourth quarter included a benefit within loss and LAEthe last 12 months. Expense ratio excluding interest decreased to 21.8% from Hurricane Irma due to reinsurance recoveries recognized during the quarter from our Other States Reinsurance Program, as well as additional income generated by our service company subsidiaries following Hurricane Irma. These benefits were largely offset by unfavorable reserve development for both current and prior accident years. The fourth quarter of 2016 was impacted by severe weather event losses of $26.6 million as a result of Hurricane Matthew. Net income for the fourth quarter of 2017 increased 166.5%, or $22.7 million, to $36.4 million, compared to net income of $13.7 million in the fourth quarter of 2016.NOTE 1920 – SUBSEQUENT EVENTSThe Company performed an evaluation of subsequent events through the date the financial statements were issued and determined there were no recognized or unrecognized subsequent events that would require an adjustment or additional disclosure in the consolidated financial statements as of December 31, 2017.On January 22, 2018,February 8, 2024, the Company declared a quarterly cash dividend of $0.14$0.16 per share on its outstandingof common stock payable on March 12, 2018,15, 2024, to shareholders of record on February 28, 2018.101107NONENone.Evaluation of Disclosure Controls and ProceduresThe Company maintains disclosure controls and procedures that are designed to ensure that information required to be disclosed in the reports that the Company files or submits under the Exchange Act is recorded, processed, summarized and reported within the time periods specified in the Securities and Exchange Commission’s rules and forms, and that such information is accumulated and communicated to the Company’s management, including its Chief Executive Officer and Chief Financial Officer, as appropriate, to allow timely decisions regarding required disclosure.As of the end of the period covered by this report, the Company carried out an evaluation, under the supervision and with the participation of its principal executive officerChief Executive Officer and principal financial officer,Chief Financial Officer, of the effectiveness of the design and operation of the Company’s disclosure controls and procedures pursuant to Rule 13a-15 under the Exchange Act. Based on that evaluation, the Company’s Chief Executive Officer and Chief Financial Officer concluded that disclosure controls and procedures were effective as of December 31, 2017.Management’s Report on Internal Control over Financial ReportingThe management of the Company is responsible for establishing and maintaining adequate internal control over financial reporting. The Company’s internal control system was designed to provide reasonable assurance to the Company’s management and Board of Directors regarding the preparation and fair presentation of published financial statements.All internal control systems, no matter how well designed, have inherent limitations. Therefore, even those systems determined to be effective can provide only reasonable assurance with respect to financial statement preparation and presentation.Management assessed the effectiveness of the Company’s internal control over financial reporting as of December 31, 2017.2023. In making this assessment, management used the criteria set forth by the Committee of Sponsoring Organizations of the Treadway Commission in the 2013 Internal Control – Integrated Framework. Based on this assessment under the framework in 2013 Internal Control – Integrated Framework, management concluded that our internal control over financial reporting was effective as of December 31, 2017.Plante & Moran, PLLC, the independent registered public accounting firm who also audited the Company’s consolidated financial statements included in this Form 10-K, has issued their attestation report on the Company’s internal control over financial reporting is presented above atin Part IV, Item 15 of this report under “Report of Independent Registered Public Accounting Firm.”Changes in Internal Control Over Financial ReportingThere werewas no changeschange in the Company’s internal control over financial reporting during the fourth quarter of 20172023 that havehas materially affected, or areis reasonably likely to materially affect, the Company’s internal control over financial reporting.NONE102(c) During the quarter ended December 31, 2023, no director or Section 16 officer adopted or terminated any Rule 10b5-1 plans or non-Rule 10b5-1 trading arrangements.Not applicable.108PART IIICode of Business Conduct and EthicsThe Company has adopted a Code of Business Conduct and Ethics that is applicable to all directors, officers and employees of the Company.Company, including our principal executive, principal financial and principal accounting officers, or persons performing similar functions. The codeCode is available on the Company’s website at www.universalinsuranceholdings.com.https://UniversalInsuranceHoldings.com. A copy of the Company’s Code of Business Conduct and Ethics may be obtained free of charge by written request to Frank C. Wilcox, CFO,Gary L. Ropiecki, Secretary, Universal Insurance Holdings, Inc., 1110 West Commercial Boulevard, Suite 100, Fort Lauderdale, FL 33309.For We intend to disclose future amendments to certain provisions of the Code of Business Conduct and Ethics, and waivers of the Code of Business Conduct and Ethics granted to executive officers and directors, on the website within four business days following the date of the amendment or waiver.Additional information regardingrequired by Item 10 of Part III is included in the section titled “Proposal 1: Election of Directors” of our Directors, Executive Officers and Corporate Governance, reference is made to our definitive proxy statementProxy Statement for ourthe 2024 Annual Meeting of Shareholders which will be filed with the Securities(“2024 Proxy Statement”) and Exchange Commission within 120 days after December 31, 2017 and which is incorporated herein by reference (the “2018 Proxy Statement”).reference.For information regarding Executive Compensation, referenceInformation required by Item 11 of Part III is made to such disclosureincluded in the 2018section titled “Proposal 2: Advisory Vote to Approve the Compensation of Our Named Executive Officers” of our 2024 Proxy Statement whichand is incorporated herein by reference.ITEM 12. For information regarding Security OwnershipInformation required by Item 12 of Certain Beneficial Owners and Management and Related Stockholder Matters, referencePart III is made to such disclosureincluded in the 2018section titled “Beneficial Ownership” of our 2024 Proxy Statement whichand is incorporated herein by reference.For information regarding CertainInformation required by Item 13 of Part III is included in the section titled “Certain Relationships and Related Transactions, and Director Independence, reference is made to such disclosure in the 2018Party Transactions” of our 2024 Proxy Statement whichand is incorporated herein by reference.For information regarding Principal AccountantInformation required by Item 14 of Part III is included in the section titled “Accounting Fees and Services, reference is made to such disclosure in the 2018Services” of our 2024 Proxy Statement whichand is incorporated herein by reference.103PART IV
(1)Financial Statements(1)Financial StatementsThe following consolidated financial statements of the Company and the report of the Independent Registered Public Accounting Firm thereon are filed with this report at Item 8:Report of Independent Registered Public Accounting Firm.Consolidated Balance Sheets as of December 31, 20172023 and 2016.Consolidated Statements of Income for the Years Ended December 31, 2017, 20162023, 2022 and 2015.Consolidated Statements of Comprehensive Income for the Years Ended December 31, 2017, 20162023, 2022 and 2015.Consolidated Statements of Stockholders’ Equity for the Years Ended December 31, 2017, 20162023, 2022 and 2015.Consolidated Statements of Cash Flows for the Years Ended December 31, 2017, 20162023, 2022 and 2015.Notes to Consolidated Financial Statements.
(2)Financial Statement Schedules(2)Financial Statement Schedules109The following additional financial statement schedules are furnished herewith pursuant to the requirements of Form 10-K.108112113114All other schedules are omitted because they are not applicable, or not required, or because the required information is included in the Consolidated Financial Statements or in notes thereto.(3)ExhibitsNone.(3)Exhibits3.1Registrant’sAmended and Restated Certificate of Incorporation, as amended (14)(filed as Exhibit 3.1 to the Company’s Annual Report on Form 10‑K filed on February 24, 2017 and incorporated herein by reference)3.2 3.24.110.1The Universal Insurance Holdings, Inc. Second AmendedInc. (filed as Exhibit 3.2 to the Company’s Current Report on Form 8-K filed on June 19, 2017 and Restated 2009 Omnibus Incentive Plan (4)4.1 Description of the Registrant’s Securities Registered Pursuant to Section 12 of the Securities Exchange Act of 1934 (filed as Exhibit 4.1 to the Company’s Annual Report on Form 10‑K filed on March 2, 2020 and incorporated herein by reference)10.210.310.4Director Services Agreement, dated July 12, 2007, by and between the Company and Joel M. Wilentz (1)10.510.610.710.8Employment Agreement, dated January 12, 2016, by and between the Company and Sean P. Downes (10)10.910410.10Director Services Agreement, dated June 6, 2013, by and between the Company and Darryl L. Lewis (6)10.11Amendment to Second Amended and Restated 2009 Omnibus Incentive Plan (7)10.12 (filed as Exhibit 10.1 to the Company’s Current Report on Form 8-K filed on November 10, 2009 and incorporated herein by reference) 10.2 10.13Addendum No. 1 to the Surplus Note between the Company and the State Board of Administration (2)of Florida (filed as Exhibit 10.2 to the Company’s Current Report on Form 8-K filed on November 10, 2009 and incorporated herein by reference)10.3 Credit Agreement, dated August 31, 2021, by and between the Company and JPMorgan Chase Bank, N.A.(filed as Exhibit 10.1 to the Company’s Quarterly Report on Form 10-Q filed on October 27, 2021 and incorporated herein by reference)10.14Amendment No. 1 Credit Agreement, dated August 30, 2022, by and between the Company and JPMorgan Chase Bank, N.A. (filed as Exhibit 10.1 to the Company’s Quarterly Report on Form 10-Q on November 2, 2022 and incorporated herein by reference)10.5 Credit Agreement, dated October 31, 2022, by and between the Company and JPMorgan Chase Bank, N.A. (filed as Exhibit 10.2 to the Company’s Quarterly Report on Form 10-Q on November 2, 2022 and incorporated herein by reference)10.6 Credit Agreement, dated June 30, 2023, by and between the Company and JPMorgan Chase Bank, N.A. (filed as Exhibit 10.1 to the Company’s Quarterly Report on Form 10-Q filed on July 31, 2023 and incorporated herein by reference)10.7 Indenture, dated November 23, 2021 by and between the Company and UMB Bank National Association as trustee.(filed as Exhibit 4.1 to the Company’s Current Report on Form 8-K filed on November 23, 2021 and incorporated herein by reference)10.8 Multiple Line Quota Share Reinsurance Contract between the Company and Everest Reinsurance Company (2) (filed as Exhibit 10.3 to the Company’s Current Report on Form 8-K filed on November 10, 2009 and incorporated herein by reference)10.9 Universal Insurance Holdings, Inc. Second Amended and Restated 2009 Omnibus Incentive Plan, as amended through June 8, 2012 (filed as Exhibit 4.1 to the Company’s Current Report on Form 8-K filed on June 14, 2012 and incorporated herein by reference) †10.15Amendment to Second Amended and Restated 2009 Omnibus Incentive Plan (filed as Exhibit 4.12 to the Company’s Registration Statement on Form S-8 filed on June 6, 2013 and incorporated herein by reference) †10.11 Universal Insurance Holdings, Inc. 2021 Omnibus Incentive Plan, (filed as Exhibit 99.1 to the Company’s Registration Statement on Form S-8 filed on July 14, 2021 and incorporated herein by reference) †10.12 Form of Non-qualified Stock Option Agreement (filed as Exhibit 10.6 to the Company’s Annual Report on Form 10‑K filed on March 1, 2019 and incorporated herein by reference) †10.13 Form of Performance Share Award (filed as Exhibit 10.7 to the Company’s Annual Report on Form 10‑K filed on March 1, 2019 and incorporated herein by reference) †11010.14 Form of Restricted Stock Agreement (filed as Exhibit 10.8 to the Company’s Annual Report on Form 10‑K filed on March 1, 2019 and incorporated herein by reference) †10.15 Form of Restricted Stock Unit Agreement (filed as Exhibit 10.9 to the Company’s Annual Report on Form 10‑K filed on March 2, 2020 and incorporated herein by reference) †10.16 Form of Notice of Grant of Restricted Stock Units Pursuant to the 2021 Omnibus Incentive Plan (filed as Exhibit 10.1 to the Company’s Quarterly Report on Form 10-Q filed on May 2, 2023 and incorporated herein by reference)†10.17 Form of Notice of Grant on Non-Qualified Stock Option and Terms and Conditions of Non-Qualified Stock Option under the 2021 Omnibus Incentive Plan (filed as Exhibit 10.4 to the Company’s Quarterly Report on Form 10-Q filed on May 2, 2022 and incorporated herein by reference)†10.18 Form of Notice of Grant of Restricted Stock and Terms and Conditions of Restricted Stock Award under the 2021 Omnibus Incentive Plan (filed as Exhibit 10.2 to the Company’s Quarterly Report on Form 10-Q filed on July 31, 2023 and incorporated herein by reference)†10.19 Form of Notice of Grant on Performance Share Units and Terms and Conditions of Performance Share Units under the 2021 Omnibus Incentive Plan (filed as Exhibit 10.2 to the Company’s Quarterly Report on Form 10-Q filed on July 29, 2022 and incorporated herein by reference)†10.20 Form of Non-Employee Director Option Grant (filed as Exhibit 10.9 to the Company’s Annual Report on Form 10‑K filed on March 1, 2019 and incorporated herein by reference) †10.21 10.22 Employment Agreement, dated February 12, 2020, between Stephen J. Donaghy and the Company (filed as Exhibit 10.1 to the Company’s Current Report on Form 8-K filed on February 18, 2020 and incorporated herein by reference) †10.23 10.24 Amended and Restated Employment Agreement, dated April 7, 2022 between Stephen J. Donaghy and the Company (filed as Exhibit 10.1 to the Company’s Current Report on Form 10-K filed on April 8, 2022 and incorporated herein by reference) †10.25 Amended and Restated Employment Agreement, dated January 1, 2024, between Frank C. Wilcox and the Company (filed as Exhibit 10.2 to the Company’s Current Report on Form 8-K filed on January 3, 2024 and incorporated herein by reference) †10.26 Amended and Restated Employment Agreement, dated January 1, 2024, between Kimberly Cooper Campos and the Company (filed as Exhibit 10.1 to the Company’s Current Report on Form 8-K filed on January 3, 2024 and incorporated herein by reference) †10.27 10.28 Director Services Agreement, dated June 5, 2014,6, 2013, by and between the Company and Ralph J. Palmieri (8)Scott P. Callahan (filed as Exhibit 10.2 to the Company’s Current Report on Form 8-K filed on June 6, 2013 and incorporated herein by reference) †10.29 10.16Director Services Agreement, dated June 5, 2014, by and between the Company and Richard D. Peterson (8)(filed as Exhibit 10.3 to the Company’s Current Report on Form 8-K filed on June 6, 2014 and incorporated herein by reference) †10.30 10.17Performance Share UnitDirector Services Agreement, dated January 1, 2016,July 12, 2007, by and between the Company and Sean P. Downes (12)Ozzie A. Schindler (filed as Exhibit 10.9 to the Company’s Current Report on Form 8-K filed on August 10, 2007 and incorporated herein by reference) †10.31 10.18Performance Share UnitDirector Services Agreement, dated January 1, 2016,July 12, 2007, by and between the Company and Jon W. Springer (12)Joel M. Wilentz (filed as Exhibit 10.11 to the Company’s Current Report on Form 8-K filed on August 10, 2007 and incorporated herein by reference) †10.32 Form of Indemnification Agreement (filed as Exhibit 10.1 to the Company’s Current Report on Form 8-K filed on November 15, 2012 and incorporated herein by reference) †142111123.1 23.131.1 31.131.2 31.297 101. INSXBRL Instance Document101. SCHXBRL Taxonomy Extension Schema Document101. CALXBRL Taxonomy Extension Calculation Linkbase Document101. DEFXBRL Taxonomy Extension Definition Linkbase Document101. LABXBRL Taxonomy Extension Label Linkbase Document101. PREXBRL Taxonomy Extension Presentation Linkbase Document-----------(1)Incorporated by reference to the Registrant’s Current Report on Form 8-K, filed on August 10, 2007.(2)Incorporated by reference to the Registrant’s Current Report on Form 8-K, filed on November 10, 2009.(3)Incorporated by reference to the Registrant’sThe following materials from Universal Insurance Holdings, Inc. Annual Report on Form 10-K for the fiscal year ended December 31, 2011 filed on March 26, 2012.104 (4)Incorporated by reference toThe cover page from the Registrant’s Current Report on Form 8-K, file with on June 14, 2012.(5)Incorporated by reference to the Registrant’s Current Report on Form 8-K, file on November 15, 2012.(6)Incorporated by reference to the Registrant’s Current Report on Form 8-K, filed on June 6, 2013.(7)Incorporated by reference to the Registrant’s Registration Statement on Form S-8 (File No. 333-189122) deemed effective on June 6, 2013.(8)Incorporated by reference to the Registrant’s Current Report on Form 8-K, filed on June 6, 2014.(9)Incorporated by reference to the Registrant’s Current Report on Form 8-K, filed on June 19, 2017.(10)Incorporated by reference to the Registrant’s Current Report on Form 8-K, filed on January 19, 2016.(11)Incorporated by reference to the Registrant’s Current Report on Form 8-K, filed February 22, 2013.(12)Incorporated by reference to the Registrant’s Current Report on Form 8-K, filed January 19, 2016.105Incorporated by reference to the Registrant’sCompany’s Annual Report on Form 10-K for the fiscal year ended December 31, 2015, filed February 24, 2016.------------------ (14)Incorporated by reference to the Registrant’s Annual Report on Form 10-K for the year ended December 31, 2016, filed February 24, 2017.† Indicates management contract or compensatory plan or arrangement. 106ITEM 16. FORM 10-K SUMMARY None.112TableSIGNATURESPursuant to the requirements of ContentsIn accordance with Section 13 or 15(d) of the Securities Exchange Act of 1934, as amended, the Registrantregistrant has duly caused this report on Form 10-K to be signed on its behalf by the undersigned, hereuntothereunto duly authorized.UNIVERSAL INSURANCE HOLDINGS, INC.Dated:Date: February 23, 201828, 2024Sean P. Downes Sean P. Downes,Stephen J. Donaghy, Chief Executive Officer and Principal Executive OfficerBy:/s/ Frank C. Wilcox Frank C. Wilcox, Chief Financial Officer and Principal Accounting OfficerIn accordance withPursuant to the requirements of the Securities Exchange Act of 1934, this report has been signed below by the following persons on behalf of the registrant and in the capacities and on the dates indicated./s/ Sean P. Downes Stephen J. Donaghy (Principal23, 2018Sean P. DownesExecutive Officer)/s/ Jon W. Springer President, Chief Risk Officer and DirectorFebruary 23, 2018Jon W. Springer (Principal Accounting Officer)23, 2018/s/ Gary L. Ropiecki Corporate Secretary and Principal Accounting Officer February 28, 2024 /s/ Sean P. Downes Executive Chairman February 28, 2024 Sean P. Downes /s/ Kimberly D. CooperCampos23, 2018CooperDirector Director/s/ Shannon A. Brown Director February 28, 2024 /s/ Scott P. Callahan Director Director23, 2018Darryl L. Lewis Director Director23, 2018Darryl L. Lewis/s/ Francis X. McCahill, III Director February 28, 2024 Francis X. McCahill, III /s/ Ralph J. PalmieriDirectorFebruary 23, 2018Ralph J. PalmieriDirector Director23, 2018Director Director23, 2018Director Director23, 2018/s/ Jon W. Springer Director February 28, 2024 /s/ Joel M. Wilentz Director Director23, 2018107113SCHEDULE II – CONDENSED FINANCIAL INFORMATION OF REGISTRANTUniversal Insurance Holdings, Inc. had no long-term obligations, guarantees or material contingencies as of December 31, 2017 and 2016. The following summarizes the major categories of the parent company’s financial statements (in thousands, except per share data):CONDENSED BALANCE SHEETSAs of December 31, As of December 31, 2023 2023 2022 Cash and cash equivalents Cash and cash equivalents Available-for-sale debt securities, at fair value Equity securities, at fair value Deferred income tax asset, net Intercompany note receivable LIABILITIES AND STOCKHOLDERS’ EQUITY LIABILITIES: LIABILITIES: Accounts payable Accounts payable Income taxes payable Income taxes payable Income taxes payable Book overdraft Long-term debt, net STOCKHOLDERS’ EQUITY: Cumulative convertible preferred stock, $.01 par value Cumulative convertible preferred stock, $.01 par value Issued shares - 10 and 10 Issued shares - 10 and 10 Outstanding shares - 10 and 10 Outstanding shares - 10 and 10 Minimum liquidation preference - $9.99 and $9.99 per share Minimum liquidation preference - $9.99 and $9.99 per share Common stock, $.01 par value Common stock, $.01 par value Issued shares - 47,269 and 47,179 Issued shares - 47,269 and 47,179 Issued shares - 47,269 and 47,179 Outstanding shares - 28,966 and 30,389 Outstanding shares - 28,966 and 30,389 Outstanding shares - 28,966 and 30,389 Treasury shares, at cost - 18,303 and 16,790 Treasury shares, at cost - 18,303 and 16,790 Treasury shares, at cost - 18,303 and 16,790 Total stockholders’ equity Total liabilities and stockholders’ equity See accompanying notes to condensed financial statements108114CONDENSED STATEMENTS OF INCOMEFor the Years Ended December 31, 2023 2022 2021 REVENUES Net investment income $ 3,755 $ 930 $ 2 Net realized gains (losses) on investments 943 1,462 405 Net change in unrealized gains (losses) on investments 810 (518) — Management fee 119 123 137 Interest income on intercompany note receivable 13,919 9,686 415 Other revenue 18 1 — Total revenues 19,564 11,684 959 OPERATING COSTS AND EXPENSES General and administrative expenses 13,997 12,223 10,552 Total operating cost and expenses 13,997 12,223 10,552 Interest and amortization of debt issuance costs 6,333 6,437 525 LOSS BEFORE INCOME TAX EXPENSE (BENEFIT) AND EQUITY
IN NET EARNINGS (LOSS) OF SUBSIDIARIES(766) (6,976) (10,118) Income tax expense (benefit) 1,038 (670) (2,800) LOSS BEFORE EQUITY IN NET EARNINGS (LOSS) OF SUBSIDIARIES (1,804) (6,306) (7,318) Equity in net income (loss) of subsidiaries 68,627 (15,951) 27,712 CONSOLIDATED NET INCOME (LOSS) $ 66,823 $ (22,257) $ 20,394 See accompanying notes to condensed financial statements109115CONDENSED STATEMENTS OF CASH FLOWSFor the Years Ended December 31, 2023 2022 2021 Cash flows from operating activities: Net cash provided by (used in) operating activities $ 205,614 $ 210,368 $ 151,952 Cash flows from investing activities: Capital contributions to affiliates (1) (89,490) (129,490) (95,498) Issuance of intercompany note receivable (1) — (114,000) (20,000) Purchases of equity securities (6,300) (33,189) — Purchase of available-for-sale debt securities (1,854) (4,026) — Proceeds from sales of equity securities 19,512 20,187 — Net cash provided by (used in) investing activities (78,132) (260,518) (115,498) Cash flows from financing activities: Proceeds from issuance of long-term debt — — 100,000 Debt issuance costs paid — (140) (3,365) Preferred stock dividend (10) (10) (10) Common stock dividend (23,279) (23,774) (24,191) Purchase of treasury stock (22,021) (11,643) (1,609) Payments related to tax withholding for share-based compensation (339) (418) (1,056) Net cash provided by (used in) financing activities (45,649) (35,985) 69,769 Net increase (decrease) in cash and cash equivalents 81,833 (86,135) 106,223 Cash and cash equivalents at beginning of period 83,022 169,157 62,934 Cash and cash equivalents at end of period $ 164,855 $ 83,022 $ 169,157 Supplemental information: Interest paid $ 5,625 $ 5,625 $ — (1) Eliminated in consolidation.See accompanying notes to condensed financial statements110116NOTE 1 – GENERALThe financial statements of the Registrant should be read in conjunction with the consolidated financial statements in “Item 8.”Nature of Operations and Basis of PresentationUniversal Insurance Holdings, Inc. (the “Company”) is a Delaware corporation incorporated in 1990. The Parent Company is an insurance holding company whose wholly-owned subsidiaries perform all aspects of insurance underwriting, distribution and claims. Through its wholly-owned subsidiaries, including Universal Property & Casualty Insurance Company (“UPCIC”) and American Platinum Property and Casualty Insurance Company (“APPCIC”), the Parent Company is principally engaged in the property and casualty insurance business offered primarily through a network of independent agents. Risk from catastrophic losses is managed through the use of reinsurance agreements.The Parent Company generates revenues from earnings on investments and management fees. The Parent Company also receives distributions of earnings from its insurance and non-insurance subsidiaries.Certain amounts in the prior periods’ condensedconsolidated financial statements have been reclassified in order to conform to current period presentation. Such reclassifications had no effect on net income or stockholders’ equity.Dividends received fromCapital Contributions to SubsidiariesDuring the years ended December 31, 2023, 2022, and 2021, the Parent Company made capital contributions of $72.0 million, $84.0 million and $92.0 million, respectively, to UPCIC to increase UPCIC’s statutory capital and surplus.During the year ended December 31, 2017, UPCIC paid dividends of $30.0 million2023, the Parent Company did not make a capital contribution to Universal Insurance Holdings, Inc. No dividends were paid from APPCIC to Universal Insurance Holdings, Inc. forAPPCIC. During the year ended December 31, 2017.2022, the Parent Company made capital contributions of $3.0 million to increase APPCIC’s statutory capital and surplus. There were no capital contributions by the Parent Company to APPCIC during 2021.Dividends received from SubsidiariesThe Parent Company received distributions from the earnings of its non-insurance consolidated subsidiaries of $164.1 million, $231.9 million, and $149.9 million during the years ended December 31, 2023, 2022, and 2021, respectively. There were no dividends paid by UPCIC and APPCIC to Universal Insurance Holdings, Inc.the Parent Company during the years ended December 31, 20162023, 2022, and 2015.Capitalization of SubsidiariesNOTE 2 - INTERCOMPANY NOTE RECEIVABLEDuring the years ended December 31, 2023, the Parent Company did not fund Subordinated Surplus Debentures (“Surplus Debentures”) to UPCIC. During the year ended December 31, 2016, Universal2022, the Parent Company funded $110.0 million of surplus debentures through PSI, the Insurance Holdings, Inc. made aEntities’ parent company, to UPCIC to increase UPCIC’s statutory capital contribution of $2.0 million to APPCIC, in conjunction with APPCIC’s plan to begin writing commercial residential products in Florida. There were no capital contributions by Universal Insurance Holdings, Inc. to APPCIC duringand surplus.During the yearsyear ended December 31, 20172023 the Parent Company did not fund surplus debentures to APPCIC. During the year ended December 31, 2022, the Parent Company funded $4.0 million Surplus Debenture through PSI to APPCIC to increase APPCIC statutory capital and 2015.Effective in 2021 for UPCIC and 2022 for APPCIC, the holding company has put in place an ongoing surplus note arrangement with the Insurance Entities, which has been approved by the Florida Office of Insurance Regulation (“FLOIR”) as the Insurance Entities’ domestic regulator. Surplus debentures are unsecured debt issued by the Insurance Entities that are subordinated to all claims by policyholders and creditors, with interest and principal payments on the surplus note to the holding company being made only upon the FLOIR’s express approval. Surplus debentures are considered bonds in function and payout structure, but are accounted for as equity in the statutory reporting of the Insurance Entities. The holding company has outstanding with the Insurance Entities $134.0 million in surplus notes. Under the arrangement, interest accrues at a variable rate (currently 10.54%) on the outstanding surplus note balances and, if approved by the FLOIR, is payable annually to the holding company. In 2023, UPCIC received approval from its Florida regulator to permit UPCIC to pay interest accruing from surplus notes outstanding during 2023.NOTE 23 – LONG-TERM DEBTSee “Part II—Item 8—Note 7 (Long-term debt)” for information relating to long-term debt.117NOTE 4 – SUBSEQUENT EVENTSThe Parent Company performed an evaluation of subsequent events through the date the financial statements were issued and determined there were no recognized or unrecognized subsequent events that would require an adjustment or additional disclosure in the consolidated financial statements as of December 31, 2017.On January 22, 2018,2023.In February 2024, the Parent Company declared a quarterly cash dividend of $0.14$0.16 per share on its outstandingof common stock payable on March 12, 2018,15, 2024, to shareholders of record on February 28, 2018.111118SCHEDULESCHEDULE V – VALUATION ALLOWANCES AND QUALIFYING ACCOUNTSThe following table summarizes activity in the Company’s allowance for doubtful accountsestimated credit losses for the periods presented (in thousands):112 Additions Beginning
BalanceCharges to
EarningsCharges to
Other
AccountsDeductions Ending
BalanceDescription Year Ended December 31, 2023 Estimated credit losses $ 920 510 — 832 $ 598 Year Ended December 31, 2022 Estimated credit losses $ 584 711 — 375 $ 920 Year Ended December 31, 2021 Estimated credit losses $ 631 466 — 513 $ 584 119SCHEDULESCHEDULE VI – SUPPLEMENTAL INFORMATION CONCERNING CONSOLIDATED PROPERTYAND CASUALTY INSURANCE OPERATIONSThe following table provides certain information related to the Company’s property and casualty operations as of, and for the periods presented (in thousands): As of
December 31,For the Year Ended December 31, Reserves
for Unpaid
Losses and
LAEIncurred
Loss and
LAE Current
YearIncurred
Loss and
LAE Prior
YearsPaid Losses
and LAENet
Investment
Income2023 $ 510,117 $ 882,064 110,573 $ 906,064 $ 48,449 2022 $ 1,038,790 $ 913,419 $ 24,980 $ 928,645 $ 25,785 2021 $ 346,216 $ 724,755 $ 54,450 $ 751,792 $ 12,535 113 As of
December 31,For the Year Ended December 31, Deferred
Policy
Acquisition
Cost (“DPAC”)Amortization
of DPAC, NetNet
Premiums
WrittenNet
Premiums
EarnedUnearned
Premiums2023 $ 109,985 $ (210,955) $ 1,344,813 $ 1,251,936 $ 990,559 2022 $ 103,654 $ (217,235) $ 1,173,278 $ 1,128,626 $ 943,854 2021 $ 108,822 $ (224,121) $ 1,084,827 $ 1,035,463 $ 857,769 120Report of IndependentIndependent Registered Public Accounting Firmon Supplemental InformationTo Thethe Stockholders and Board of Directors and Stockholders ofWe have audited, in accordance with the standards of the Public Company Accounting Oversight Board (United States) (PCAOB), the consolidated financial statements of Universal Insurance Holdings, Inc. and SubsidiariesFort Lauderdale, FloridaWe have audited the accompanying consolidated balance sheets of Universal Insurance Holdings, Inc. and Subsidiaries(the "Company"“Company”) as of December 31, 2017 and 2016, and the related consolidated statements of income, comprehensive income, stockholders' equity and cash flows for each of the years in the three-year period ended December 31, 2017,2023 and the Company's internal control over financial reporting as of December 31, 2017, basedissued our report thereon dated February 28, 2024, which expressed an unqualified opinion on criteria established in the 2013 Internal Control-Integrated Framework issued by the Committee of Sponsoring Organizations of the Treadway Commission (COSO); suchthose consolidated financial statements and report areis included elsewhereat Item 8 in this Form 10-K and are incorporated herein by reference. Our audits also included10-K. The supplemental information contained in the consolidated financial statement schedules of the Company listed in the accompanying index at Item 15. These15 in this Form 10-K has been subjected to audit procedures performed in conjunction with the audit of the Company's consolidated financial statement schedules arestatements. The supplemental information is the responsibility of the Company’sCompany's management. Our responsibility isaudit procedures included determining whether the supplemental information reconciles to express an opinion based on our audits.the consolidated financial statements or the underlying accounting and other records, as applicable, and performing procedures to test the completeness and accuracy of the information presented in the supplemental information. In our opinion, such consolidated financial statement schedules, when consideredthe supplemental information is fairly stated, in all material respects, in relation to the basic consolidated financial statements taken as a whole, present fairly, in all material respects, the information set forth therein./s/ Plante & Moran, PLLCCertified Public AccountantsChicago, IllinoisEast Lansing, MichiganFebruary 23, 2018114121