Page Number | |||
1 | |||
Item 1. | 1 | ||
Item 1A. |
| ||
Item 1B. |
| ||
Item |
| ||
Item |
| ||
Item |
| ||
Item 4. | 18 | ||
| |||
Item 5. |
| ||
Item 6. |
| ||
Item 7. | Management’s Discussion and Analysis of Financial Condition and Results of Operations |
| |
Item 7A. |
| ||
Item 8. |
| ||
Item 9. | Changes in and Disagreements with Accountants on Accounting and Financial Disclosure |
| |
Item 9A. |
| ||
Item 9B. |
| ||
Item 9C. | Disclosure Regarding Foreign Jurisdictions that Prevent Inspections | 72 | |
| |||
Item 10. |
| ||
Item 11. |
| ||
Item 12. | Security Ownership of Certain Beneficial Owners and Management and Related Stockholder Matters |
| |
Item 13. | Certain Relationships and Related Transactions, and Director Independence |
| |
Item 14. |
| ||
| |||
Item 15. |
| ||
Item 16. | 75 | ||
| |||
PART I
Item 1. Business
Our Business
Gaia, Inc., was incorporated under the laws of the State of Colorado on July 7, 1988 and (“Gaia,” “we” or “us”) operates a global digital video subscription service and on-line community that catersstrives to connect a unique and underserved subscribermember base. Our digital content library includes over 10,000 titles and live events, with a growing selection of over 8,000 titles is available to our subscribers on most internet-connected devices anytime, anywhere commercial free.in Spanish, German and French. Our subscribersmembers have unlimited access to athis vast library of inspiring films, cutting edge documentaries, interviews, yoga classes, transformation relatedlive events, transformation-related content and more – 90%88% of which is exclusively available to our subscribersmembers for digital streaming.streaming on most internet-connected devices anytime, anywhere, commercial free.
Our mission is to create a transformational network that empowers a global conscious community. Content on our network is currently curatedorganized into three channels,four primary channels— Yoga, Transformation, Alternative Healing, and Seeking Truth,Truth— and delivered directly to our subscribersmembers through our streaming platform. We curate programming for these channels by producing content in our in-house production studioslifestyle campus with a staff of media professionals. This produced and owned content currently represents about 80%comprises approximately 75% of total views.our members' viewing time. We complement our produced and owned content through long term predominately exclusive, licensing agreements.
Our Content Channels
From the beginning, we have focused on establishing exclusive rights to unique content through in-house productions, licensing and strategic content acquisitions. Today, our network includes the following channels:
Yoga – Through our Yoga channel, our subscribersmembers enjoy unlimited access to streaming yoga, Eastern arts, and other movement-based classes. Currently, we are one of the world’s largest providers of streaming yoga classes. Blending ancient philosophy with anytime, anywhere access through modern technology, our classes on Eastern arts like T’ai Chi, Qigong, Ayurveda and more encourage the holistic integration of body, mind and spirit.
Transformation– Through our Transformation channel, we feature a wealth of content in the niche areas of alternative health, spiritual growth, personal development and expanded consciousness. Our original and licensed content empowers subscribersmembers to live stronger, healthier, more productive and enlightened lives.
Alternative Healing – Our Alternative Healing channel features content focused on food and nutrition, holistic healing, alternative and integrative medicines, and longevity. Blending modern science with cutting edge research around neuroplasticity, energy healing, aging, and wellness, this channel fuels our members’ pursuit of optimal health.
Seeking Truth – As an alternative to mainstream media, our Seeking Truth channel provides new and enlightening perspectives for today’s changing world. Through thought-provoking questions like who“who are we and why are we here,we”, and topics that include ancient wisdom and metaphysics, we go beyond the boundaries of mainstream media, and encourage our viewers to find empowerment through knowledge and awareness. Through this channel, our subscribersmembers have access to top names in the genre who conduct exclusive interviews and presentations not found anywhere else.
The Streaming Video Market and Gaia
Consumption of streaming video is expanding rapidly as more and more people augment their use of, or replace broadcast television with, streaming video to watch their favorite content on services like Netflix, Amazon Prime, Hulu Plus, HBO Now and Gaia.a growing array of digital streaming services. The streaming video market includes various free, ad-supported and subscription service offerings focused on various genres, including films, broadcast and original series, fitness and educational content.
Gaia’s position in the streaming video landscape is firmly supported by its wide variety of exclusive and unique content and lifestyle events, which provides a complementary offering to other, mostly entertainment-based, streaming video services. Our original content is developed and produced in-house in our production studioslifestyle campus near Boulder, Colorado. Over 90%88% of our content is available for streaming exclusively on Gaia to most
1
internet-connected devices. By offering exclusive and unique content over a streaming service, we believe we will be able to significantly expand our target subscribermember base. Gaia believes the current size of our potential target market representscan be defined as approximately 15% of internet users that currently pay for a subscription streaming video service.
We believe that we differentiate ourselves from our competition and have been able to grow our business through the following demonstrated competitive strengths:
Exclusive Content and Ubiquitous Access – We have amassed a library of unique content for which we hold exclusive worldwide streaming distribution rights and have established exclusive relationships with certain key talent in our areas of focus. Over 90%88% of our titles are available to our subscribersmembers for streaming on virtually anymost internet-connected devicedevices exclusively on Gaia.
Gaia Unplugged – We are able to leverage our content licensing and ownership advantage to enable “subscriber download” as part of our subscription. A Gaia subscription allows subscribers to download and view titles in our library without being actively connected to the internet as long as they remain a paying subscriber.
Proprietary and Curated Content – Proprietary and curated content lies at the core of our business model. Our media offerings introduce customersmembers to us and help establish usGaia as an authority in the conscious media market. Our in-house produced and owned content representscomprises approximately 80%75% of our subscribers’members’ viewing time. Our licensed content has initial terms ranging predominately from 3 to 2010 years. With the growth in demand for digital rights, we expect that our large library of produced and acquired content combined with our internal production capabilities, live events and community will be a key driver in our ability to grow efficiently and act as a hedge against the rising costs of digital rights.
International Rights – The strength of our proprietary content library created by our original content production strategy and our unique approach to content licensing have provided us with a library of niche content to which we hold exclusive worldwide distribution rights that we believe would be difficult to acquire in today’s market. By obtaining these rights, we have created a significantmeaningful barrier to entry for competitors in our content niches and have given ourselves the potential to reach a worldwide subscribermember base with no additional licensing costs. Based on viewership, approximately 90%Over 98% of our library istitles are available worldwide.
Unique SubscriberMember Base – We believe that our unique and exclusive content allows us to cater to a subscribermember base that traditional media companies have mostly ignored. We believe this subscribermember base can be significantly expanded as more and more people enter our niche categories and begin accessing streaming content over the internet.
Unique Content Strength – We believe that our unique focus, combined with our content exclusivity, positions us as a complementary service to larger streaming video providers who are primarily entertainment driven. In addition, this focus has allowed an opportunity for significant advantages:
Yoga, we— We continue to build on our yoga heritage by expanding the teachers and styles in our vast content library. We understand yoga is more than just a physical practice and have an established consumer brand, a vast libraryvariety of popular content focused on the lifestyle and knowledge and expertise on developing new content.
Transformation, we— We bring a unique focus to an otherwise crowded field. This channel empowers subscribersmembers through programs about alternativemeditation to expand consciousness, develop and integrative medicines, holistic healing, longevity, meditation,understand spirituality in a modern world, and includes other shows on conscious topics that puts Gaia in the center of a rapidly growing market.
Alternative Healing— We offer depth and breadth of content on emerging topics including neuroplasticity, alternative and integrative medicines, holistic healing and longevity. Included in this channel are hundreds of recipes to help our members put their new knowledge into practice in the kitchen.
2
Growth Drivers
Our core strategy is to grow our streaming subscription business domestically and internationally using the following drivers:
Investment in Streaming Content – We believe that our investment in streaming content leads to more awareness and viewership of our unique content. This leads to subscribermember acquisition and revenue growth, allowing us to invest more into our content library and enabling the growth cycle to continue. By investing in our in-house studios, digital asset management system and digital delivery platforms, we can produce and distribute new digital content at low incremental costs. With our end-to-end production capabilities and unique, exclusive relationships with thought leaders in our areas of focus, we believe we can develop content much more efficiently than our competitors.
Continuous Service Improvements – We have found that incremental improvements in our service and quality enhance our subscribermember satisfaction and retention. In October 2016, we relaunched gaia.com with an entirely new technology stack at its core. The new site wasWe have built our platform to optimize the speed and performance of streaming video playback, provide a unique and customized site experience for every subscribermember and provide the foundation for our planned expansion into foreign languages. We continue to refine our technology, user interfaces, recommendation algorithms and delivery infrastructure to improve the customer experience.member experience as the underlying technology continues to evolve.
Overall Adoption and Growth of internetInternet TV on Every Screen – Domestically, cable TV subscribersmembers have been declining, while the demand for digital content services accessible on various devices has continued to grow. Gaia is accessible on a broad array of devices, including, but not limited to: Apple TV, iPad, iPhone, Roku, Chromecast, Android devices, including phones, tablets andRoku, Amazon Fire, laptops, desktop computersselect smart TVs, and TVs through an HDMI cord.Chromecast. Through this accessibility, we believe that we enhance the value of our service to subscribersmembers as well as position ourselves for continued growth as internet and mobile delivery of content becomescontinues to become the preferred method for more popular.consumers globally.
International Market Expansion – We believe the international streaming segment represents a significant long-term growth opportunity for us as people around the world begin to adopt the viewing behaviors of the U.S. market. Our exclusive worldwide streaming rights allowhave allowed us to expand internationally by adding foreign language support to our service without having to invest in local foreign operations. Today, approximately 30%43% of our subscribersmembers are outside of the United States.
Events+ Premium Membership and GaiaSphere – In 2019, we held our inaugural event at the GaiaSphere, a 300-person live event studio located on our campus in Colorado. With the opening of the GaiaSphere, we also launched the Events+ premium annual membership to allow for digital access to these exclusive events via live streaming and on demand. Through GaiaSphere and the Events+ premium offering, we have expanded our reach to a larger audience of talent that will contribute to our content library, as well as drive incremental revenue growth. Our Events+ offering consists of on-demand access to past events and the ability to participate via live streaming while events are happening.
3
Member Driven Growth Enablement – We believe the empowerment of our existing members to drive awareness of and interest in Gaia will be a key driver of future growth and engagement of the Gaia global community. To support this awareness, we allow existing members the ability to share Gaia content with their connections free of charge over a limited time window. This product feature allows us to leverage our existing members’ desire to share our content to ultimately drive more interest and awareness, which will lead to member growth that is not wholly dependent on marketing expenditures.
Complement our Existing Business with Selective Strategic Acquisitions – Our growth strategy is not solely dependent on acquisitions. However, we will consider strategic acquisitions that complement our existing business, increase our content library, expand our geographical reach and add to our subscribermember base. We willWhen evaluating potential acquisitions, we focus on companies with unique media content, a strong brand identity and subscribersmembers that augment our existing subscribermember base.
Marketing
We are buildingbuild awareness and demand for the Gaia brand through various channels focusing on mobile and video. Organic search, paid search, digital and social media, email marketing, ambassador marketing, as well as various strategic partnerships make up our continually optimized portfolio of subscribermember acquisition and retention tools. Rejoining subscribersmembers are an important source of subscribermember additions, many of which come back to Gaia.comGaia after receiving special communications via email.email or seeing our digital advertising for new content.
We maintain a website at www.gaia.com. The website address has been included only as a textual reference. Our website andHistory
Incorporated under the information containedlaws of the State of Colorado on the website, or connected to the website, are not incorporated by reference into this Form 10-K.
History
WeJuly 7, 1988, Gaia started as a conscious media and products company distributing conscious and non-theatrical media, with a maximum reach of approximately 70,000 retail doors in the United States. Over the past few years we divested several businesses, including our DVD distribution business and our Gaiam Brand consumer products business, for combined gains of over $150 million.media.
We also expanded the number of conscious media titles with our 2007 acquisition of the entire content library of Wisdom Television. Wisdom operated for 20 years as a cable and satellite channel. Wisdom was the only TV channel that remained dedicated, year after year, to conscious media. With our acquisition of their digital media library we expanded our unique library of content directed at independent and progressive thinkers.
In October 2012, we broughtlaunched our streaming video service out of beta-test status, and focused our efforts on growing our streaming subscription services domestically and internationally by expanding our streaming content, enhancing our user interface and extending our streaming content to even more internet-connected devices.
In 2013,2016, we divested all of our product businesses and focused on scaling our streaming video service and community. Since then we have launched Spanish, German and French language offerings. We have continued to invest in our international offerings, including original programming in these languages.
In 2019, we further expanded the digital yogaalternative healing content available to our subscribers,members and expanded our presence and subscribermember base in the yoga communitythis growing area of interest through our acquisition of My Yoga Online, the largest streaming yoga media service in Canada.Food Matters TV.
In 2016, we relaunched gaia.com with an entirely new technology stack at its core. The new site was built to optimize the speed and performance of streaming video playback, provide a unique and customized site experience for every subscriber and provide the foundation for our planned expansion into foreign languages.
In July 2017, we launched Spanish as our first non-English language offering with over 500 native language titles. German was launched in the fall of 2017, with French planned for early 2018.
These investments in our subscription business have been instrumental in our ability to grow by expanding our streaming video on demand capabilities and increasing our library of unique content of transformational media, intended to awaken and inspire viewers around the world.
4
Business Segments
We operate in a single reporting segment. Our revenues are primarily derived from subscription fees for services related to streaming content to our members. See Note 2, Summary ofSignificant Accounting Policies – Segment Information, and Note 16, Segment Information and Geographic Information, in the accompanying notes to our consolidated financial statements for further detail.
Regulatory Matters
A numberThe media landscape and the internet delivery of existingcontent have seen growing regulatory action. Historically, media has been highly regulated in many countries. We are seeing some of these legacy regulatory frameworks be updated and proposed laws restrict disclosureexpanded to address services like ours. In particular, we are seeing some countries update their cultural support legislation to include services like Gaia. This includes content quotas, levies and investment obligations. In certain countries, regulators are also looking at restrictions that could require formal reviews of consumers’ personal information, whichand/or adjustments to content that appears on our service in their country. In general these regulations impact all services and may make itoperating in certain jurisdictions more difficult for usexpensive or restrictive as to generate additional names for our direct marketing, and restrict our ability to send unsolicited electronic mail. Althoughthe content offering we believe we are generally in compliance with current laws and regulations and that these laws and regulations have not had a significant impact on our business to date, it is possible that existing or future regulatory requirements will impose a significant burden on us.may provide.
Competition
While our content offering is unique, the market for subscription basedsubscription-based content delivered over the internet is intensely competitive and subject to rapid change. Many consumers maintain simultaneous relationships with multiple providers and can easily shift spending from one provider to another. We are a focused provider within the streaming video market that is able to compete by providing exclusive content available on almost any device. Our principal competitors vary by world geographic region and include multichannel video programming distributors and internet-based movie and TV content providers, including those that provide legal and illegal (pirated) streaming video content.content and various communities. We believe that due to the exclusivity of our content, we are positioning ourselves as a complementary service to large general content providers such as television broadcasters, cable television channels, and an array of other entertainment based streaming services, such as Netflix, Amazon Prime, Hulu Plus and HBO Now. Based on internal surveys of our subscribers, a majority of our U.S. subscribers also subscribe to Netflix.including those that have recently launched.
Seasonality
Our member growth exhibits abase reflects seasonal pattern that reflects variations driven primarily by periods when consumers buy internet-connected devicestypically spend more time indoors and, as a result, tend to increase their viewing, similar to those of traditional TV and cable networks. OurWe have generally experienced the greatest member growth is generally greatest in the fourth and first quarters (October through March)February), and slowest in theduring May through August period.August. This drives quarterly variations in our spending on member acquisition efforts and the number of net new subscribers we add each quarter but does not result in a corresponding seasonality in net revenue. As we continue to expand internationally, we expect regional seasonality trends to demonstrate more predictable seasonal patterns as our service offering in each market becomes more established and we have a longer history to assess such patterns.
EmployeesHuman Capital
We view our employees and our culture as keys to our success. As of February 16, 2018, we29, 2024, Gaia had approximately 130109 full time employees, all of which are full-time employees.located in the United States. None of our employees are covered by a collective bargaining agreement. We supplement our full-time employees, with services provided by staffing organizations in other countries to support our customer service, content production and software engineering needs. We believe a critical component of our success is our company culture, which begins with focusing our hiring on our current member base. The majority of our current employees came to work at Gaia after discovering our content offering and have become passionate team members that continue to help expand the impact of our mission globally.
Intellectual Property and Other Proprietary Rights
We regard our trademarks, service marks, copyrights, domain names, trade secrets, proprietary technologies and similar intellectual property as important to our success. We use a combination of trademark, copyright and trade secret laws and confidentiality agreements to protect our proprietary intellectual property. Our ability to protect and
enforce our intellectual property rights is subject to certain risks, and from time to time we encounter disputes over rights and obligations concerning intellectual property. We cannot provide assurance that we will prevail in any intellectual property disputes.
Discontinued Operations5
During 2016, we sold our equity interest in Natural Habitat, Inc. (“Natural Habitat”), our eco-travel subsidiary, in exchange for $13 million in cash, and recognized a gain of $10 million as disclosed in our Current Report on Form 8-K filed May 10, 2016 with the Securities and Exchange Commission.
During 2016, we also sold the assets and liabilities of our Gaiam Brand business in exchange for a gross purchase price of $167 million, and recognized a gain of $115 million before taxes. Our Gaiam Brand business previously constituted the majority of our consolidated revenues and expenses, and consisted of Gaiam branded yoga, fitness and wellness consumer products, and content (excluding the streaming rights).
We report these businesses as discontinued operations, and, accordingly, we have reclassified their financial results for all periods presented to reflect them as such. Unless otherwise noted, discussions in this Form 10-K pertain to our continuing operations.
Website and Available Information
Our corporate website at www.gaia.com provides information about us, our history, goals and philosophy, as well as certain financial reports and corporate press releases. Our www.gaia.com website also features a library of information and articles on personal development and healthy lifestyles, along with an extensive offering of video content. We believe our website provides us with an opportunity to deepen our relationships with our customersmembers and investors, educate them on a variety of issues, and improve our service. As part of this commitment, we have a link on our corporate website to our Securities and Exchange Commission filings, including our reports on Forms 10-K, 10-Q and 8-K and amendments thereto. We make those reports available through our website, free of charge, as soon as reasonably practicable after these reports are filed or furnished with the Securities and Exchange Commission.
We have included our website address only as inactive textual reference, and the information contained on our website is not incorporated by reference into this Form 10-K.
Item 1A. Risk Factors
We caution you that there are risks and uncertainties that could cause our actual results to be materially different from those indicated by forward looking statements that we make from time to time in filings with the Securities and Exchange Commission, news releases, reports, communications to shareholders and other written and oral communications. These risks and uncertainties include those risks described below of which we are presently aware. Historical results are not necessarily an indication of future results. The risk factors below discuss important factors that could cause our business, financial condition, operating results and cash flows to be materially adversely affected.
Risks Related to our Business and Industry
If our efforts to attract and retain subscribersmembers are not successful, our business will be adversely affected.
We have experienced significant subscribermember growth since we began our digital subscription business in 2007.2013. Our ability to continue to attract subscribersmembers will depend in part on our ability to consistently provide our subscribersmembers with a valuable and quality streaming experience. Furthermore, the relative service levels, content offerings, pricing and related features of our competitors may adversely impact our ability to attract and retain subscribers.members. We compete for screen viewing time with multichannel video programming distributors providing free-on-demand content through authenticated internet applications, internet-based movie and TV content providers, including both those that provide legal and illegal (or pirated) streaming video content, and streaming video retail stores, video game providers, as well as user-generated content and, more broadly, other sources of entertainment among others. If consumers do not perceive our service offering to be of value, or if we introduce new or adjust existing features or change the mix of content in a manner that is not favorably received by them, we may not be able to attract and retain subscribers.members. Adverse macroeconomic conditions, including inflation, may also adversely impact our ability to attract and retain members.
In addition, many of our subscribersmembers originate from word-of-mouth advertising from existing subscribers.members. If our efforts to satisfy our existing subscribersmembers are not successful, we may not be able to attract new subscribers,members, and as a result, our ability to maintain and/or grow our business will be adversely affected. SubscribersMembers cancel our service for many reasons, including a perception that they do not use the service sufficiently, the need to cut household expenses, unsatisfactory availability of content, competitive services providing a better value or experience and customer service issues not satisfactorily resolved. We must continually add new subscribersmembers both to replace subscribersmembers who cancel and to grow our business beyond our current subscribermember base. If too many of our subscribersmembers cancel our service, or if we are unable to attract new subscribersmembers in numbers sufficient to sustain and grow our business, our operating results will be adversely affected. If we are unable to successfully compete with current and new competitors in both retaining our existing subscribersmembers and attracting new subscribers,members, our business will be adversely affected. Further, if excessive numbers of subscribersmembers cancel our service, we may be required to incur significantly higher marketing expenditures than we currently anticipate in order to replace these subscribersmembers with new subscribers.members.
6
If we are unable to compete effectively, our business will be adversely affected.
The market for streaming content is intensely competitive and subject to rapid change. New technologies and evolving business models for delivery of streaming content continue to develop at a fast pace. Through new and existing distribution channels, consumers are afforded various means for consuming streaming content. The various economic models underlying these differing means of streaming content delivery include subscription, transactional, ad-supported and piracy-based models. All of these have the potential to capture meaningful segments of the streaming content market. Several competitors have longer operating histories, larger customer bases, and stronger brand recognition than we do and have significant financial, marketing and other resources. They may secure better terms from suppliers, adopt more aggressive pricing and devote more resources to technology and marketing. New entrants may enter the market with unique service offerings or approaches to providing streaming content and other companies also may enter into business combinations or alliances that strengthen their competitive positions. In addition, new technological developments, including the development and use of generative artificial intelligence, are rapidly evolving. If we are unable to successfully compete with current and new competitors, programs and technologies, our business will be adversely affected, and we may not be able to increase market share and revenues, and achieve profitability.
We could be harmed by data loss or other security breaches.
As a result of our services being internet-based and the fact that we process, store, and transmit data, including personal information, for our customers, failure to prevent or mitigate data loss or other security breaches, including breaches of our suppliers’ technology and systems, could expose us or our customers to a risk of loss or misuse of such information, adversely affect our operating results, result in litigation or potential liability for us, and otherwise harm our business. We use third-party technology and systems for a variety of reasons, including, without limitation, encryption and authentication technology, employee email, content delivery to customers, back-office support, and other functions. Although we have implemented systems and processes that are designed to protect customer information and prevent data loss and other security breaches, including systems and processes designed to reduce the impact of a security breach at a third-party supplier, such measures cannot provide absolute security.
We have had operating losses, and we cannot assure future profitability.
We reported losses from continuing operationsnet loss of $23.7 million, $10.8 million and $9.0 million for fiscal years 2017, 2016 and 2015, respectively (excluding the results from operations we sold including a pre-tax gain of $124.8$5.6 million in 2016). We cannot assure you2023 compared to net loss of $3.6 million in 2022. Additionally, we reported net losses during several prior years as a result of continued investment in member acquisition efforts to drive revenue growth. No assurance can be made that we will operate profitably in future periods and, if we do not, we may not be able to meet any future debt service requirements, working capital requirements, capital expenditure plans, production slate, acquisition plans or other cash needs. Our inability to meet those needs could have a material adverse effect on our business, financial condition, operating results, liquidity and prospects.
If we are not able to manage change and growth, our business could be adversely affected.
We are expanding our operations internationally, scaling our streaming service to effectively and reliably handle anticipated growth in both subscribersmembers and features related to our service, as well as continuing to provide our Spiritual Cinema Circle monthly DVD subscription offerings for an additional fee.service. As we expand internationally, we are managing our business to address varied content offerings, consumer customs and practices, in particular those
dealing with e-commerce and internet video, as well as differing legal and regulatory environments. As we scale our streaming service, we are developing technology and utilizing third-party internet-based or “cloud” computing services. If we are not able to manage the growing complexity of our business, including improving, refining or revising our systems and operational practices related to our streaming operations, our business could be adversely affected.
If our efforts to build unique brand identity and improve subscribermember satisfaction and loyalty are not successful, we may not be able to attract or retain subscribers,members, and our operating results may be adversely affected.
We must continue to build and maintain a unique brand identity. We believe that a unique brand identity will be important in attracting and retaining subscribersmembers who have a number of choices from which to obtain streaming content. To build a unique brand identity, we believe we must continue to offer content and service features that our subscribersmembers value and enjoy. We also believe that these must be coupled with effective consumer communications, such as marketing, customer service and public relations. If our efforts to promote and maintain our brand identity are not successful, our ability to attract and retain subscribersmembers may be adversely affected. Such a result may adversely affect our operating results.
With respect to our expansion into international markets, we will also need to establish our brand identity in new markets and languages, and to the extent we are not successful, our business in new markets may be adversely impacted.
7
Changes in our subscribermember acquisition sources could adversely affect our marketing expenses and subscribermember levels may be adversely affected.
We utilize a broad mix of marketing and public relations programs, including social media websites such as Facebook and Twitter,YouTube, to promote our service to potential new subscribers.members. We may limit or discontinue use or support of certain marketing sources or activities if advertising rates increase or if we become concerned that subscribersmembers or potential subscribersmembers deem certain marketing practices intrusive or damaging to our brand. If available marketing channels are limited or curtailed, our ability to attract new subscribersmembers may be adversely affected.
Companies that currently promote our services may cease promoting our services, may determine to compete more directly with our business or enter a similar business, or may decide to exclusively support our competitors. If we no longer have access to such marketing channels, our marketing efforts may be adversely affected. If we are unable to maintain or replace our sources of subscribersmembers with similarly effective sources, or if the cost of our existing sources increases, our subscribermember levels and marketing expenses may be adversely affected.
We face risks, such as unforeseen costs and potential liabilities in connection with content we produce, license and/or distribute through our service.
As a producer and distributor of content, we face potential liability for defamation, negligence, copyright or trademark infringement, misinformation, personal injury torts or other claims based on the nature and content of materials that we produce, license and/or distribute. We also face potential liability for content used in promoting our service, including marketing materials and features on our websiteplatform such as subscribermember reviews. Allegations of impropriety, even if unfounded, could have a material adverse effect on our reputation and our business.
We are responsible for production costs and other expenses related to our original content. We also take on risks associated with this production, such as completion and key talent risk. To the extent we do not accurately anticipate costs or mitigate risks, or if we become liable for content we produce, license and/or distribute, our business may suffer. Litigation to defend these claims could be costly and the expenses and damages arising from any liability or unforeseen production risks could harm our results of operations. We may not be indemnified to cover claims or costs of these types and we may not have insurance coverage for these types of claims.
Problematic content accessed through our service, including content that violates our content guidelines or the content guidelines of our partners, could damage our reputation and hurt our ability to retain and expand our base of members and partners.
Our ability to maintain and protect our brand depends, in part, on our ability to maintain the quality and integrity of the content and other information accessed through our streaming service. While we undertake efforts to detect and prevent problematic content and to ensure our content complies with our content guidelines and the content guidelines of our third-party partners, no assurance can be given that such efforts will be error-free.
If we fail to either detect and prevent problematic content or effectively promote high-quality content, it could hurt our reputation and confidence in our brand, thereby negatively affecting the use of our service and our financial performance. In addition, our partners may refuse to carry the Gaia “app” on their platform if our content violates their content guidelines. Problematic content accessed through our service may also subject us to media, legal or regulatory scrutiny, which could adversely affect our reputation and brand.
If we fail to maintain a positive reputation concerning our service and the content we offer, we may not be able to attract or retain members, we may face regulatory scrutiny and our operating results may be adversely affected.
We believe that a positive reputation concerning our service is important in attracting and retaining members. To the extent our content, in particular, our original programming, is perceived as low quality, offensive or otherwise not compelling to consumers, our ability to establish and maintain a positive reputation may be adversely impacted. To the extent our content is deemed controversial or offensive by government regulators, we may face direct or indirect retaliatory action or behavior, including being required to remove such content from our service, our entire service
8
could be banned and/or become subject to heightened regulatory scrutiny across our business and operations. We could also face boycotts which could adversely affect our business. Furthermore, to the extent our response to government action or our marketing, customer service and public relations efforts are not effective or result in negative reaction, our ability to establish and maintain a positive reputation may likewise be adversely impacted. There is an increasing focus from regulators, investors, members and other stakeholders on environmental, social and governance (“ESG”) matters, both in the United States and internationally. To the extent the content we distribute and the manner in which we produce content creates ESG related concerns, our reputation may be harmed.
Increases in payment processing fees, changes to operating rules, the acceptance of new types of payment methods or payment fraud could increase our operating expenses and adversely affect our business and results of operations.
Our members pay for our services predominately using credit and debit cards. Our acceptance of these payment methods requires our payment of certain fees. From time to time, these fees may increase, either as a result of rate changes by the payment processing companies or as a result of a change in our business practices which increase the fees on a cost-per-transaction basis. Such increases may adversely affect our results of operations.
We are subject to rules, regulations and practices governing our accepted payment methods. These rules, regulations and practices could change or be reinterpreted to make it difficult or impossible for us to comply. If we fail to comply with these rules or requirements, we may be subject to fines and higher transaction fees and lose our ability to accept these payment methods, and our business and results of operations would be adversely affected.
We accept payment methods other than credit and debit cards. As our service continues to evolve and expand internationally, we will likely continue to explore accepting various forms of payment, which may have higher fees and costs than our currently accepted payment methods. If more consumers utilize higher cost payment methods our payment costs could increase and our results of operations could be adversely impacted.
In addition, we do not obtain signatures from members in connection with their use of payment methods. To the extent we do not obtain members’ signatures, we may be liable for fraudulent payment transactions, even when the associated financial institution approves payment of the orders. From time to time, fraudulent payment methods are used to obtain service. While we do have safeguards in place, we nonetheless experience some fraudulent transactions. We do not currently carry insurance against the risk of fraudulent payment transactions. A failure to adequately control fraudulent payment transactions would harm our business and results of operations.
We rely upon a number of partners to offer instant streaming of content to various devices.
We currently offer subscribersmembers the ability to receive streaming content through a host of internet-connected devices, including internet-enabled TVs, digital video players and mobile devices. We intend to continue to broaden our capability to instantly stream content to other platforms over time. If we are not successful in maintaining existing relationships and creating new relationships,ones, or if we encounter technological, content licensing or other impediments to our streaming content, our ability to grow our business could be adversely impacted.
We have entered into agreements with certain consumer electronicsthird party partners, pursuant to which each makes available an “app” for viewing our content on its hardware platform. Our agreements with our consumer electronics partners are typically between one and three years in duration and our business could be adversely affected if, upon expiration, our partners do not continue to provide access to our service or are unwilling to do so on terms acceptable to us, which terms may include the degree of accessibility and prominence of our service. We may be further harmed if these partners decide to remove our apps from their respective platforms for any other reason at any time.
Furthermore, the devices consumers use to access our content are manufactured and sold by entities other than Gaia and the devices’ performance and the connection between these devices and our service may result in consumer dissatisfaction that could result in claims against us or otherwise adversely impact our business. In addition, technology changes to our streaming functionality may require that partners update their devices. If partners do not update or otherwise modify their devices, our service and our subscribers’members’ use and enjoyment could be negatively impacted.
Any significant disruption in our network or information systems or those of third parties that we utilize in our operations could result in a loss or degradation of service and could adversely impact our business.
Our reputation and ability to attract, retain and serve our subscribers is dependent upon the reliable performance of our network and information systems and those of third parties that we utilize in our operations. We experience occasional system interruptions and delays that make our websites and services unavailable or slow to respond and prevent us from efficiently providing services to our customers, which may reduce the attractiveness of our services. If we are unable to effectively upgrade our systems and network infrastructure, and take other steps to improve the efficiency of our systems, it could cause system interruptions or delays and adversely affect our operating results.
Our systems may be subject to damage or interruption from adverse weather conditions, natural disasters, terrorist attacks, power loss, telecommunications failures, computer viruses, computer denial of service attacks, or other attempts to harm these systems. Interruptions in these systems, or to the internet in general, could make our service unavailable or degraded or otherwise hinder our ability to deliver content to our subscribers. Service interruptions, errors in our software or the unavailability of network or information systems used in our operations could diminish the overall attractiveness of our subscribership service to existing and potential subscribers.
We utilize third-party internet-based or “cloud” computing services in our business operations. We also utilize third-party content delivery networks to help us stream content in high volume to our subscribers over the internet. Problems with these systems faced by us or our service providers, including technological or business-related disruptions, could adversely impact the experience of our subscribers.
Any significant disruption in or unauthorized access to our network or information systems or those of third parties that we utilize in our operations arising from cyber-attacks could result in a loss or degradation of service, unauthorized disclosure of data (including subscriber and corporate information), or theft of intellectual property, including digital content assets, which could adversely impact our business.
Our network and information systems and those of third parties we use in our operations are vulnerable to cybersecurity risks, including cyber-attacks such as computer viruses, denial of service attacks, physical or electronic break-ins and similar disruptions. These systems may experience directed attacks intended to lead to interruptions and delays in our service and operations as well as loss, misuse or theft of data. Any successful attempt by hackers to obtain our data (including subscribers and corporate information) or intellectual property (including digital content assets), disrupt our service, or otherwise access our systems (or those of third parties we use), could harm our business, be expensive to remedy and damage our reputation. We have implemented certain systems and processes to thwart hackers and protect our data and systems. To date hackers have not had a material impact on our
9
service or systems, although a risk remains that hackers may be successful in the future. Our insurance does not cover expenses related to such disruptions or unauthorized access. Efforts to prevent hackers from disrupting our service or otherwise accessing our systems are expensive to implement and may limit the functionality of or otherwise negatively impact our service offering and systems. Any significant disruption to our service or access to our systems could result in a loss of subscribers and adversely affect our business and results of operations.
Our reputation and relationships with subscribers would be harmed if our subscriber data, particularly payment data, were to be accessed by unauthorized persons.
We maintain personal data regarding our subscribers, including names and payment data. This data is maintained on our own systems as well as that of third parties we use in our operations. With respect to payment data, such as credit and debit card numbers, we rely on licensed encryption and authentication technology to secure such information. We take measures to protect against unauthorized intrusion into our subscribers’ data. Despite these measures we, our payment processing services or other third-party services we use, could experience an unauthorized intrusion into our subscribers’ data. In the event of such a breach, current and potential subscribers may become unwilling to provide the information to us necessary for them to become subscribers. Additionally, we could face legal claims or regulatory fines or penalties for such a breach. The costs relating to any data breach could be material, and we currently do not carry insurance against the risk of a data breach. For these reasons, should an unauthorized intrusion into our subscribers’ data occur, our business could be adversely affected.
We rely on our proprietary technology to stream content and to manage other aspects of our operations, and the failure of this technology to operate effectively could adversely affect our business.
We continually enhance or modify the technology used for our operations. We cannot be sure that any enhancements or other modifications we make to our operations will achieve the intended results or otherwise be of value to our subscribers. Future enhancements and modifications to our technology could consume considerable resources. If we are unable to maintain and enhance our technology to manage the streaming of content to our subscribers in a timely and efficient manner, or if our technology or that of third parties we utilize in our operations fails or otherwise operates improperly, our ability to retain existing subscribers and to add new subscribers may be impaired. Also, any harm to our subscribers’ personal computers or other devices caused by software used in our operations could have an adverse effect on our business, results of operations and financial condition.
Changes in how network operators handle and charge for access to data that travel across their networks could adversely impact our business.
We rely upon the ability of consumers to access our service through the internet. To the extent that network operators implement usage-based pricing, including meaningful bandwidth caps, or otherwise try to monetize access to their networks by data providers, we could incur greater operating expenses and our subscriber acquisition and retention could be negatively impacted. Furthermore, to the extent network operators were to create tiers of internet access service and either charge us for, or prohibit us from, being available through these tiers, our business could be negatively impacted.
Increases in payment processing fees, changes to operating rules, the acceptance of new types of payment methods or payment fraud could increase our operating expenses and adversely affect our business and results of operations.
Our subscribers pay for our services predominately using credit and debit cards. Our acceptance of these payment methods requires our payment of certain fees. From time to time, these fees may increase, either as a result of rate changes by the payment processing companies or as a result of a change in our business practices which increase the fees on a cost-per-transaction basis. Such increases may adversely affect our results of operations.
We are subject to rules, regulations and practices governing our accepted payment methods. These rules, regulations and practices could change or be reinterpreted to make it difficult or impossible for us to comply. If we fail to comply with these rules or requirements, we may be subject to fines and higher transaction fees and lose our ability to accept these payment methods, and our business and results of operations would be adversely affected.
We accept payment methods other than credit and debit cards. As our service continues to evolve and expand internationally, we will likely continue to explore accepting various forms of payment, which may have higher fees and costs than our currently accepted payment methods. If more consumers utilize higher cost payment methods, our payment costs could increase and our results of operations could be adversely impacted.
In addition, we do not obtain signatures from subscribers in connection with their use of payment methods. To the extent we do not obtain subscribers’ signatures, we may be liable for fraudulent payment transactions, even when the associated financial institution approves payment of the orders. From time to time, fraudulent payment methods are used to obtain service. While we do have safeguards in place, we nonetheless experience some fraudulent transactions. We do not currently carry insurance against the risk of fraudulent payment transactions. A failure to adequately control fraudulent payment transactions would harm our business and results of operations.
If our trademarks and other proprietary rights are not adequately protected to prevent unauthorized use or appropriation, the value of our brand and other intangible assets may be diminished, and our business may be adversely affected.
We rely and expect to continue to rely on a combination of confidentiality and license agreements with our employees, consultants and third parties with whom we have relationships, as well as trademark, copyright and trade secret protection laws, to protect our proprietary rights. We may also seek to enforce our proprietary rights through court proceedings. We may file trademark applications from time to time. These applications may not be approved, third parties may challenge any trademarks issued to or held by us, third parties may knowingly or unknowingly infringe our trademarks and other proprietary rights, and we may not be able to prevent infringement or misappropriation without substantial expense to us.
We currently hold various domain names, including www.gaia.com and www.gaiamtv.com. Failure to protect our domain names could adversely affect our reputation and make it more difficult for users to find our website and our service. We may be unable, without significant cost or at all, to prevent third parties from acquiring domain names that are similar to, infringe upon or otherwise decrease the value of our trademarks and other proprietary rights.
Intellectual property claims against us could be costly and result in the loss of significant rights related to, among other things, our website, title selection processes and marketing activities.
Our intellectual property rights extend to our technology, business processes and the content on our website. We use the intellectual property of third parties in marketing and providing our services through contractual and other rights. From time to time, third parties may allege that we have violated their intellectual property rights. If we are unable to obtain sufficient rights, successfully defend our use, or develop non-infringing technology and content or otherwise alter our business practices on a timely basis in response to claims of infringement, misappropriation, misuse or other violation of third-party intellectual property rights, our business and competitive position may be adversely affected.
Many companies devote significant resources to developing patents that could potentially affect many aspects of our business. There are numerous patents that broadly claim means and methods of conducting business on the internet. We have not searched patents relative to our technology. Defending ourselves against intellectual property claims, whether they are with or without merit or are determined in our favor, will result in costly litigation and diversion of technical and management personnel. Infringement claims also may result in our inability to use our current website, streaming technology, our recommendation and personalization technology or inability to market our service. As a result of disputes, we may have to develop non-infringing technology, enter into royalty or licensing agreements, adjust our merchandising or marketing activities or take other actions to resolve the claims. These actions, if required, may be costly or unavailable on terms acceptable to us.
Piracy of video, including digital and internet piracy, could adversely affect our business.
Video piracy is extensive in many parts of the world and is made easier by technological advances and the conversion of video into digital formats. This trend facilitates the creation, transmission and sharing of high quality unauthorized copies of content on DVDs, Blu-ray discs, and the internet. We may have to implement elaborate and
costly security and anti-piracy measures, which could result in significant expenses and losses of revenue. We cannot assure you that security and anti-piracy measures will prevent the piracy of our content. The proliferation of unauthorized copies of these products could have an adverse effect on our business, because these products could reduce the revenues we receive from our subscription service.
Our online activities are subject to a variety of laws and regulations relating to privacy which, if violated, could subject us to an increased risk of litigation and regulatory actions.
In addition to our websites and applications, we use third-party applications, websites, and social media platforms to promote our service and engage consumers, as well as monitor and collect certain information about users of our service. There are a variety of laws and regulations governing individual privacy and the protection and use of information collected from such individuals, particularly in relation to an individual’s personally identifiable information (e.g., credit card numbers). Many foreign countries have adopted similar laws governing individual privacy, some of which are more restrictive than similar U.S. laws. If our online activities were to violate any applicable current or future laws and regulations, we could be subject to litigation and regulatory actions, including fines and other penalties.
We may be subject to litigation which, if adversely determined, could cause us to incur substantial losses.
From time to time during the normal course of operating our businesses, we are subject to various litigation claims and legal disputes. Some of the litigation claims may not be covered under our insurance policies, or our insurance carriers may seek to deny coverage. As a result, we might be required to incur significant legal fees, which may have a material adverse effect on our financial position. In addition, because we cannot accurately predict the outcome of any dispute, it is possible that, as a result of current and/or future litigation, we will be subject to adverse judgments or settlements that could significantly reduce our earnings or result in losses.
We may face legal liability for the content contained on our website.
We could face legal liability for defamation, negligence, copyright, patent or trademark infringement, personal injury or other claims based on the nature and content of materials that we publish or distribute on our website. If we are held liable for damages for the content on our website, our business may suffer. Allegations of impropriety, even if unfounded, could therefore have a material adverse effect on our reputation and our business.
If government regulations relating to the internet or other areas of our business change, we may need to alter the manner in which we conduct our business, or incur greater operating expenses.
The adoption or modification of laws or regulations relating to the internet or other areas of our business could limit or otherwise adversely affect the manner in which we currently conduct our business. In addition, the continued growth and development of the market for online commerce may lead to more stringent consumer protection laws, which may impose additional burdens on us. If we are required to comply with new regulations or legislation or new interpretations of existing regulations or legislation, this compliance could cause us to incur additional expenses or alter our business model.
The adoption of any laws or regulations that adversely affect the growth, popularity or use of the internet, including laws impacting internet neutrality, could decrease the demand for our service and increase our cost of doing business. If internet neutrality rules are rejected, broadband internet access providers may be able to charge web-based services such as ours for priority access to customers, which could result in increased costs and a loss of existing users, impairment of our ability to attract new users, and material adverse effects on our business and opportunities for growth. Additionally, as we expand internationally, government regulation concerning the internet, and in particular, network neutrality, may be nascent or non-existent. Within such a regulatory environment, coupled with potentially significant political and economic power of local network operators, we could experience discriminatory or anti-competitive practices that could impede our growth, cause us to incur additional expense or otherwise negatively affect our business.
We could be subject to economic, political, regulatory and other risks arising from international operations.
Operating in international markets requires significant resources and management attention and will subject us to regulatory, economic and political risks that may be different from and incremental to those in the United States. In addition to the risks that we face in the United States, our international operations may involve risks that could adversely affect our business, including the following: the need to adapt our content and user interfaces for specific cultural and language differences, including licensing a certain portion of our content library before we have developed a full appreciation for its performance within a given territory; difficulties and costs associated with staffing and managing foreign operations; management distraction; political or social unrest and economic instability; compliance with U.S. laws, such as the Foreign Corrupt Practices Act, export controls and economic sanctions, and local laws prohibiting corrupt payments to government officials; unexpected changes in regulatory requirements; less favorable foreign intellectual property laws; adverse tax consequences such as those related to repatriation of cash from foreign jurisdictions into the United States, non-income related taxes such as value-added tax or other indirect taxes, changes in tax laws or their interpretations, or the application of judgment in determining our global provision for income taxes and other tax liabilities given inter-company transactions and calculations where the ultimate tax determination is uncertain; fluctuations in currency exchange rates, which could impact revenues and expenses of our international operations and expose us to foreign currency exchange rate risk; profit repatriation and other restrictions on the transfer of funds; differing payment processing systems as well as consumer use and acceptance of electronic payment methods, such as credit and debit cards; new and different sources of competition; different and more stringent user protection, data protection, privacy and other laws; and availability of reliable broadband connectivity and wide area networks in targeted areas for expansion.
Our failure to manage any of these risks successfully could harm our international operations and our overall business, and results of our operations.
We may seek additional capital that may result in shareholder dilution or that may have rights senior to those of our common shareholders.
From time to time, we may seek to obtain additional capital, either through equity, equity-linked or debt securities. Our cash flows provided by our operating activities have been negative in each of the last two years, primarily as a result of our decision to increase the amount expended on marketing and expanding our subscriber base. To the extent our cash flows from operations continue to be negative, we anticipate seeking additional capital. The decision to obtain additional capital will depend on, among other things, our business plans, operating performance and condition of the capital markets. If we raise additional funds through the issuance of equity, equity-linked or debt securities, our shareholders may experience dilution, and such securities may have rights, preferences or privileges senior to the rights of our common stock. Any large equity or equity-linked offering could also negatively impact our stock price.
We may lose key employees or may be unable to hire qualified employees.
We rely on the continued service and performance of our senior management, including in particular Jirka Rysavy, our Chairman, CEO and founder. In our industry, there is substantial and continuous competition for highly skilled business, product development, technical and other personnel. Hiring qualified management is difficult due to the limited number of qualified professionals in the industry in which we operate. Failure to recruit, attract and retain personnel, particularly management personnel, could materially harm our business, financial condition, and results of operations.
We may face quarterly and seasonal fluctuations that could harm our business.
Our revenues and results of operations have fluctuated in the past, and will likely continue to fluctuate, on a quarterly basis. Such fluctuation is the result of a seasonal pattern that reflects variations when consumers buy internet-connected devicesare typically spending more time indoors and, as a result, tend to increase their viewing, similar to those of general video streaming services. Our subscriberWe have generally experienced the greatest member growth is generally greatest in the fourth and first quarters (October through March)February), and slowest in theduring May through August period.August. This drives quarterly variations in our spending on member acquisition efforts and the number of net new subscribers we add each quarter but does not result in a corresponding seasonality in net revenue. As we continue to expand internationally, we also expect regional seasonality trends to demonstrate more predictable seasonal patterns as our service offering in each market becomes more established and we have a longer history to assess such patterns.
Acquisitions and new initiatives may harm our financial results.
We have historically expanded our operations in part through strategic acquisitions and through new initiatives that we generate. We cannot accurately predict the timing, size and success of these efforts. Our acquisition and new initiative strategies involve significant risks that could inhibit our growth and negatively impact our operating results, including the following: our ability to identify suitable acquisition candidates or new initiatives at acceptable prices; our ability to complete the acquisitions of candidates that we identify or develop our new initiatives; our ability to compete effectively for available acquisition opportunities; increases in asking prices by acquisition candidates to levels beyond our financial capability or to levels that would not result in the returns required by our acquisition criteria; diversion of management’s attention to expansion efforts; unanticipated costs and contingent liabilities associated with acquisitions and new initiatives; failure of acquired businesses or new initiatives to achieve expected results; our failure to retain key customers or personnel of acquired businesses and difficulties entering markets in which we have no or limited experience. In addition, the size, timing and success of any future acquisitions and new initiatives may cause substantial fluctuations in our operating results from quarter to quarter. Consequently, our operating results for any quarter may not be indicative of the results that may be achieved for any subsequent quarter or for a full fiscal year. These fluctuations could adversely affect our results.
Risks Related to Information Technology and Privacy
We could be harmed by data loss or other security breaches.
As a result of our services being internet-based and the fact that we process, store, and transmit data, including personal information, for our members, failure to prevent or mitigate data loss or other security breaches, including breaches of our suppliers’ technology and systems, could expose us or our members to a risk of loss or misuse of such information, adversely affect our operating results, result in litigation or potential liability for us, and otherwise harm our business. We use third-party technology and systems for a variety of reasons, including, without limitation, encryption and authentication technology, employee email, content delivery to members, back-office support, and other functions. Although we have implemented systems and processes that are designed to protect member information and prevent data loss and other security breaches, including systems and processes designed to reduce the impact of a security breach at a third-party supplier, such measures cannot provide absolute security.
Any significant disruption in our network or information systems or those of third parties that we utilize in our operations could result in a loss or degradation of service and could adversely impact our business.
Our reputation and ability to attract, retain and serve our members is dependent upon the reliable performance of our network and information systems and those of third parties that we utilize in our operations. We experience occasional system interruptions and delays that make our websites and services unavailable or slow to respond and prevent us from efficiently providing services to our members, which may reduce the attractiveness of our services. If we are unable to effectively upgrade our systems and network infrastructure, and take other steps to improve the efficiency of our systems, we could face system interruptions or delays that may adversely affect our operating results.
10
Our systems may be subject to damage or interruption from adverse weather conditions, natural disasters, public health issues such as pandemics or epidemics, national or international conflicts, including war, civil disturbances and terrorist attacks, rogue employees, power loss, telecommunications failures, computer viruses, computer denial of service attacks, or other attempts to harm these systems. Interruptions in these systems, or to the internet in general, could make our service unavailable or degraded or otherwise hinder our ability to deliver content to our members. Service interruptions, errors in our software or the unavailability of network or information systems used in our operations could diminish the overall attractiveness of our membership service to existing and potential members.
We utilize third-party internet-based or “cloud” computing services in our business operations. We also utilize third-party content delivery networks to help us stream content in high volume to our members over the internet. Problems with these systems faced by us or our service providers, including technological or business-related disruptions, could adversely impact the experience of our members.
Any significant disruption in or unauthorized access to our network or information systems or those of third parties that we utilize in our operations arising from cyber-attacks could result in a loss or degradation of service, unauthorized disclosure of data (including member and corporate information), or theft of intellectual property, including digital content assets, which could adversely impact our business.
Our network and information systems and those of third parties we use in our operations are vulnerable to cybersecurity threats, including cyber-attacks such as computer viruses, denial of service attacks, physical or electronic break-ins and similar disruptions. These systems may experience directed attacks intended to lead to interruptions and delays in our service and operations as well as loss, misuse or theft of data or confidential information. Additionally, outside parties may attempt to fraudulently induce employees or users to disclose sensitive or confidential information in order to gain access to data. Any successful attempt by hackers to obtain our data (including members and corporate information) or intellectual property (including digital content assets), disrupt our service, or otherwise access our systems (or those of third parties we use), could harm our business, be expensive to remedy and damage our reputation. We have implemented certain systems and processes to thwart hackers and protect our data and systems, but techniques used to gain unauthorized access to data and software are constantly evolving, and we may be unable to anticipate or prevent unauthorized access. To date hackers have not had a material impact on our service or systems, although a risk remains that hackers may be successful in the future. Our insurance does not cover expenses related to such disruptions or unauthorized access. Efforts to prevent hackers from disrupting our service or otherwise accessing our systems are expensive to develop, implement and maintain. These efforts require ongoing monitoring and updating as technologies change and efforts to overcome security measures become more sophisticated and may limit the functionality of or otherwise negatively impact our service offering and systems. Any significant disruption to our service or access to our systems could result in a loss of members and adversely affect our business and results of operations. Further, a penetration of our systems or a third party’s systems or other misappropriation or misuse of personal information could subject us to business, regulatory, litigation and reputation risk, which could have a negative effect on our business, financial condition and results of operations.
Our reputation and relationships with members would be harmed if our member data, particularly payment data, were to be accessed by unauthorized persons.
We maintain personal data regarding our members, including names and payment data. This data is maintained on our own systems as well as that of third parties we use in our operations. With respect to payment data, such as credit and debit card numbers, we rely on licensed encryption and authentication technology to secure such information. We take measures to protect against unauthorized intrusion into our members’ data. Despite these measures, our payment processing services or other third-party services we use, could experience an unauthorized intrusion into our members’ data. In the event of such a breach, current and potential members may become unwilling to provide the information to us necessary for them to remain or become members. We may also be required to notify regulators about any actual or perceived data breach (including the EU Lead Data Protection Authority) as well as the individuals who are affected by the incident within strict time periods. Additionally, we could face legal claims or regulatory fines or penalties for such a breach. The costs relating to any data breach could be material, and we currently do not carry insurance against the risk of a data breach. For these reasons, should an unauthorized intrusion into our members’ data occur, our business could be adversely affected.
11
We rely on proprietary technology to stream content and to manage other aspects of our operations, and the failure of this technology to operate effectively could adversely affect our business.
We continually enhance or modify the technology used for our operations. We cannot be sure that any enhancements or other modifications we make to our operations will achieve the intended results or otherwise be of value to our members. Future enhancements and modifications to our technology could consume considerable resources. If we are unable to maintain and enhance our technology to manage the streaming of content to our members in a timely and efficient manner, or if our technology, or that of third parties we utilize in our operations, fails or otherwise operates improperly, our ability to retain existing members and to add new members may be impaired. Also, any harm to our members’ personal computers or other devices caused by software used in our operations could have an adverse effect on our business, results of operations and financial condition.
Changes in how network operators handle and charge for access to data that travel across their networks could adversely impact our business.
We rely upon the ability of consumers to access our service through the internet. To the extent that network operators implement usage-based pricing, including meaningful bandwidth caps, or otherwise try to monetize access to their networks by data providers, we could incur greater operating expenses and our member acquisition and retention could be negatively impacted. Furthermore, to the extent network operators were to create tiers of internet access service and either charge us for, or prohibit us from, being available through these tiers, our business could be negatively impacted.
Our online activities are subject to a variety of laws and regulations relating to privacy which, if violated, could subject us to an increased risk of litigation and regulatory actions.
In addition to our websites and applications, we use third-party applications, websites, and social media platforms to promote our service and engage consumers, as well as monitor and collect certain information about users of our service. There are a variety of laws and regulations governing individual privacy and the protection and use of information collected from such individuals, particularly in relation to an individual’s personally identifiable information (e.g., credit card numbers). Many foreign countries have adopted similar laws governing individual privacy, some of which are more restrictive than similar U.S. laws. If our online activities were to violate any applicable current or future laws and regulations, we could be subject to litigation and regulatory actions, including fines and other penalties.
Risks Related to Intellectual Property
If our trademarks and other proprietary rights are not adequately protected to prevent unauthorized use or appropriation, the value of our brand and other intangible assets may be diminished, and our business may be adversely affected.
We rely and expect to continue to rely on a combination of confidentiality and license agreements with our employees, consultants and third parties with whom we have relationships, as well as trademark, copyright and trade secret protection laws, to protect our proprietary rights. We may also seek to enforce our proprietary rights through court proceedings. We may file trademark applications from time to time. These applications may not be approved, third parties may challenge any trademarks issued to or held by us, third parties may knowingly or unknowingly infringe our trademarks and other proprietary rights, and we may not be able to prevent infringement or misappropriation without substantial expense to us.
We currently hold various domain names, including www.gaia.com and www.gaiamtv.com. Failure to protect our domain names could adversely affect our reputation and make it more difficult for users to find our website and our service. We may be unable, without significant cost or at all, to prevent third parties from acquiring domain names that are similar to, infringe upon or otherwise decrease the value of our trademarks and other proprietary rights.
12
Intellectual property claims against us could be costly and result in the loss of significant rights related to, among other things, our website, title selection processes, content and marketing activities.
Our intellectual property rights extend to our technology, business processes and the content on our website. We use the intellectual property of third parties in marketing and providing our services through contractual and other rights. From time to time, third parties may allege that we have violated their intellectual property rights. If we are unable to obtain sufficient rights, successfully defend our use, or develop non-infringing technology and content or otherwise alter our business practices on a timely basis in response to claims of infringement, misappropriation, misuse or other violation of third-party intellectual property rights, our business and competitive position may be adversely affected.
Many companies devote significant resources to developing patents that could potentially affect many aspects of our business. There are numerous patents that broadly claim means and methods of conducting business on the internet. We have not searched patents relative to our technology. Defending ourselves against intellectual property claims, whether they are with or without merit or are determined in our favor, will result in costly litigation and diversion of technical and management personnel. Infringement claims also may result in our inability to use our current website, streaming technology, our recommendation and personalization technology or inability to market our service. As a result of disputes, we may have to develop non-infringing technology, enter into royalty or licensing agreements, adjust our merchandising or marketing activities or take other actions to resolve the claims. These actions, if required, may be costly or unavailable on terms acceptable to us.
Piracy of video, including digital and internet piracy, could adversely affect our business.
Video piracy is extensive in many parts of the world and has been made easier by technological advances and the conversion of video into digital formats. These trends facilitate the creation, transmission and sharing of high-quality unauthorized copies of content on DVDs, Blu-ray discs, and the internet. We may have to implement elaborate and costly security and anti-piracy measures, which could result in significant expenses and losses of revenue. We cannot provide absolute assurance that security and anti-piracy measures will prevent the piracy of our content. The proliferation of unauthorized copies of our content could have an adverse effect on our business, by reducing the revenues we receive from our subscription service.
Risks Related to Litigation, Regulatory Proceedings and Government Regulation
We may be subject to litigation or regulatory proceedings that could cause us to incur substantial losses.
From time to time during the normal course of operating our businesses, we are subject to various litigation claims, regulatory proceedings and legal disputes. Some of these matters may not be covered under our insurance policies, or our insurance carriers may seek to deny coverage. As a result, we might be required to incur significant legal fees, which may have a material adverse effect on our financial position. In addition, because we cannot accurately predict the outcome of any dispute, it is possible that, as a result of current and/or future matters, we will be subject to adverse judgments or settlements that could significantly reduce our earnings or result in losses.
If government regulations relating to the internet or other areas of our business change, we may need to alter the manner in which we conduct our business or incur greater operating expenses.
The adoption or modification of laws or regulations relating to the internet or other areas of our business could limit or otherwise adversely affect the manner in which we currently conduct our business. In addition, the continued growth and development of the market for online commerce may lead to more stringent consumer protection laws, which may impose additional burdens on us. If we are required to comply with new regulations or legislation or new interpretations of existing regulations or legislation, this compliance could cause us to incur additional expenses or alter our business model.
The adoption or modification of any laws or regulations that adversely affect the growth, popularity or use of the internet, including laws impacting internet neutrality, could decrease the demand for our service and increase our cost of doing business. For example, as a result of the repeal of internet neutrality regulations in the United States,
13
broadband internet access providers may be able to charge web-based services such as ours for priority access to members, which could result in increased costs and a loss of existing users, impairment of our ability to attract new users, and material adverse effects on our business and opportunities for growth. Additionally, as we expand internationally, government regulation concerning the internet, and in particular, network neutrality, may be nascent or non-existent. Within such a regulatory environment, coupled with potentially significant political and economic power of local network operators, we could experience discriminatory or anti-competitive practices that could impede our growth, cause us to incur additional expense or otherwise negatively affect our business.
Risks Related to our Material Weakness and Restatements
We have identified material weaknesses in our internal control over financial reporting and those weaknesses have led to a conclusion that our internal control over financial reporting and disclosure controls and procedures were not effective as of December 31, 2023. Our inability to remediate the material weaknesses, our discovery of additional weaknesses, and our inability to achieve and maintain effective disclosure controls and procedures and internal control over financial reporting, could adversely affect our results of operations, our stock price and investor confidence in our company.
Section 404 of the Sarbanes-Oxley Act of 2002 requires that companies evaluate and report on the effectiveness of their internal control over financial reporting. As disclosed in more detail under Item 9A, “Controls and Procedures” below, we have identified material weaknesses as of December 31, 2023 in our internal control over financial reporting. Due to the material weaknesses in our internal control over financial reporting, we have also concluded our disclosure controls and procedures were not effective as of December 31, 2023.
Failure to have effective internal control over financial reporting and disclosure controls and procedures can impair our ability to produce accurate financial statements on a timely basis and has led and could again lead to a restatement of our financial statements. For example, the identified material weaknesses resulted in material adjustments to the consolidated financial statements for the year ending December 31, 2022, and each of the interim periods ended March 31, 2022 through September 30, 2023. If, as a result of the ineffectiveness of our internal control over financial reporting and disclosure controls and procedures, we cannot provide reliable financial statements, our business decision processes may be adversely affected, our business and results of operations could be harmed, investors could lose confidence in our reported financial information and our ability to obtain additional financing, or additional financing on favorable terms, could be adversely affected.
Our management has taken action to begin remediating the material weaknesses; however, certain remedial actions have not started or have only recently been undertaken, and while we expect to continue to implement our remediation plans throughout the fiscal year ending December 31, 2024, we cannot be certain as to when remediation will be fully completed. Additional details regarding the initial remediation efforts are disclosed in more detail in Part II, Item 9A, “Controls and Procedures” below. In addition, we could in the future identify additional internal control deficiencies that could rise to the level of a material weakness or uncover other errors in financial reporting. During the course of our evaluation, we may identify areas requiring improvement and may be required to design additional enhanced processes and controls to address issues identified through this review. In addition, there can be no assurance that such remediation efforts will be successful, that our internal control over financial reporting will be effective as a result of these efforts or that any such future deficiencies identified may not be material weaknesses that would be required to be reported in future periods.
If we fail to remediate these material weaknesses and maintain effective disclosure controls and procedures or internal control over financial reporting, we may not be able to rely on the integrity of our financial results, which could result in inaccurate or additional late reporting of our financial results, as well as delays or the inability to meet our future reporting obligations or to comply with SEC rules and regulations. This could result in claims or proceedings against us, including by shareholders or the SEC. The defense of any such claims could cause the diversion of the Company’s attention and resources and could cause us to incur significant legal and other expenses even if the matters are resolved in our favor.
We reached a determination to restate certain of our previously issued consolidated financial statements, which resulted in unanticipated costs and may affect investor confidence and raise reputational issues.
14
As discussed in Part II, Item 8 “Financial Statements and Supplementary Data - “Notes to Consolidated Financial Statements,” we reached a determination to restate our consolidated financial statements and related disclosures for the year ending December 31, 2022, and each of the interim periods ended March 31, 2022 through September 30, 2023. The restatement also included other immaterial adjustments to historical periods. As a result, we have incurred unanticipated costs for accounting and legal fees in connection with or related to the restatement, and have become subject to a number of additional risks and uncertainties, which may affect investor confidence in the accuracy of our financial disclosures and may raise reputational issues for our business.
Risks Related to International Operations
We could be subject to economic, political, regulatory and other risks arising from international operations.
Operating in international markets requires significant resources and management attention and will subject us to regulatory, economic and political risks that may be different from and incremental to those in the United States. In addition to the risks that we face in the United States, our international operations may involve risks that could adversely affect our business, including the following: the need to adapt our content and user interfaces for specific cultural and language differences, including licensing a certain portion of our content library before we have developed a full appreciation for its performance within a given territory; difficulties and costs associated with staffing and managing foreign operations; management distraction; international conflicts, including war, civil disturbances and terrorist attacks; political or social unrest and economic instability; public health issues such as pandemics or epidemics; compliance with U.S. laws, such as the Foreign Corrupt Practices Act, export controls and economic sanctions, and local laws prohibiting corrupt payments to government officials; unexpected changes in regulatory requirements; less favorable foreign intellectual property laws; adverse tax consequences such as those related to repatriation of cash from foreign jurisdictions into the United States, non-income related taxes, changes in tax laws or their interpretations, or the application of judgment in determining our global provision for income taxes and other tax liabilities given inter-company transactions and calculations where the ultimate tax determination is uncertain; fluctuations in currency exchange rates, which could impact revenues and expenses of our international operations and expose us to foreign currency exchange rate risk; profit repatriation and other restrictions on the transfer of funds; differing payment processing systems as well as consumer use and acceptance of electronic payment methods, such as credit and debit cards; new and different sources of competition; different and more stringent user protection, data protection, privacy and other laws; and availability of reliable broadband connectivity and wide area networks in targeted areas for expansion.
Our failure to manage any of these risks successfully could harm our international operations and our overall business, and results of our operations.
We must comply with indirect tax laws in multiple jurisdictions. Taxing authorities have in the past and may successfully in the future assert that we should have collected or in the future should collect non-income related taxes, and we could be subject to liability with respect to past or future sales, which could adversely affect our business. Our operations are routinely subject to audit by tax authorities in various countries. Many countries have indirect tax systems where the sale and purchase of goods and services are subject to tax based on the transaction value. Several taxing jurisdictions have presented or threatened us with assessments, alleging that we are required to collect and remit certain taxes there. While we believe we are in compliance with local laws, we cannot assure that tax and customs authorities will agree with our reporting positions and upon audit, such tax and customs authorities may assess additional taxes, duties, interest, and penalties against us. We also expect additional jurisdictions may make similar assessments or pass similar new laws in the future, and any of the jurisdictions where we have sales may apply more rigorous enforcement efforts or take more aggressive positions in the future that could result in greater tax liability allegations. Such tax assessments, penalties and interest or future requirements by any government agencies related to indirect tax laws could harm our international operations and our overall business, and results of our operations.
15
Risks Related to Liquidity
We may seek additional capital that may result in shareholder dilution or that may have rights senior to those of our common shareholders.
From time to time, we may seek to obtain additional capital, either through equity, equity-linked or debt securities. Our cash flows provided by our operating activities have been positive since 2020. To the extent we are unable to maintain positive cash flows from operations, we may seek additional capital. The decision to obtain additional capital will depend on, among other things, our business plans, operating performance and condition of the capital markets. If we raise additional funds through the issuance of equity, equity-linked or debt securities, our shareholders may experience dilution, and such securities may have rights, preferences or privileges senior to the rights of our common stock. Any large equity or equity-linked offering could also negatively impact our stock price.
Risks Related to Human Resources
We may lose key employees or may be unable to hire qualified employees.
We rely on the continued service and performance of our senior management. In our industry, there is substantial and continuous competition for highly skilled business, product development, technical and other personnel. Hiring qualified management is difficult due to the limited number of qualified professionals in our industry. Failure to recruit, attract and retain personnel, particularly management personnel, could materially harm our business, financial condition, and results of operations.
Risks Related to Ownership of Our Class A Common Stock
Our founder chairman and CEO,chairman, Jirka Rysavy, has voting control over our company.us.
Mr. Rysavy holds 100% of our 5,400,000 outstanding shares of Class B common stock and also owns 348,682575,061 shares of Class A common stock. The shares of Class B common stock are convertible into shares of Class A common stock at any time. Each share of Class B common stock has ten votes per share, and each share of Class A common stock has one vote per share. Consequently, Mr. Rysavy holds approximately 85%76% of our voting stock and is able to exert substantial influence over and to control matters requiring approval by shareholders, including the election of directors, increasing our authorized capital stock, or a merger or sale of substantially all of our assets. As a result of Mr. Rysavy’s control of us, no change of control can occur without Mr. Rysavy’s consent.
Our business is subject to reporting requirements that continue to evolve and change, which could continue to require significant compliance effort and resources.
Because our common stock is publicly traded, we are subject to certain rules and regulations of federal, state and financial market exchange entities charged with the protection of investors and the oversight of companies whose securities are publicly traded. These entities, including the Public Company Accounting Oversight Board, the SECSecurities and Exchange Commission and NASDAQ, periodically issue new requirements and regulations. Legislative bodies also review and revise applicable laws. As interpretation and implementation of these laws and rules and promulgation of new regulations continues, we will continue to be required to commit significant financial and managerial resources and incur additional expenses.
Risks Related to our Ownership of Real Property
Liability relating to environmental matters may impact the value of our real property.property.
We may be subject to environmental liabilities arising from our ownership of real property. Under various U.S. federal, state and local laws, an owner or operator of real property may become liable for the costs of removal of certain hazardous substances released on its property. These laws often impose liability without regard to whether the owner or operator knew of, or was responsible for, the release of such hazardous substances.substances.
16
The presence of hazardous substances on real property owned by us may adversely affect our ability to sell such real property and we may incur substantial remediation costs, thus harming our financial condition. The discovery of material environmental liabilities attached to such real property could adversely affect our results of operations and financial condition.
Any of these events, in combination or individually, could disrupt our business and adversely affect our business, financial condition, results of operations and cash flows.
None.Item 1B. Unresolved Staff Comments
Not applicable.
Item 1C. Cybersecurity
Gaia recognizes the critical importance of maintaining robust cybersecurity measures to protect our systems, data, and operations and to maintain the trust and confidence of our customers, clients, business partners and employees. Our board of directors is actively involved in oversight of our risk management program, including the management of risks arising from cybersecurity threats. It is our policy to provide regular updates to our shareholders regarding material cybersecurity incidents and the steps taken to address them. We believe that transparency in this area is crucial to maintaining trust and confidence in our operations.
We have implemented a comprehensive cybersecurity program designed to identify, assess, and mitigate potential threats and vulnerabilities, while also implementing controls and procedures that provide for the prompt escalation of certain cybersecurity incidents so that decisions regarding the public disclosure and reporting of such incidents can be made by management in a timely manner. Our cybersecurity program includes regular risk assessments, network monitoring, penetration testing and incident response protocols. We also provide regular, mandatory training to our personnel regarding cybersecurity threats to educate employees with effective tools and knowledge to address cybersecurity threats, and to communicate the Company’s evolving information security policies, standards, processes and practices. Our Senior Director of Operations/IT and his team work collaboratively across the Company and with our board of directors and management to maintain our cybersecurity program and to promptly respond to any cybersecurity incidents in accordance with our incident response and recovery plans. Our board of directors and management receive periodic cybersecurity updates from our Senior Director of Operations/IT, which may include recent material cybersecurity incidents and related responses, if any, changes to the risk landscape, and updates or changes to our cybersecurity program. The Company’s Senior Director of Operations/IT has served in various roles in information technology and information security at Gaia for over 17 years.
Our commitment to cybersecurity extends beyond our internal operations. We work closely with trusted third-party vendors and partners to ensure that they also meet our rigorous security standards. We utilize third-party cloud computing services as part of our global business operations. We also employ the use of third-party content delivery networks (CDN) to help us stream content in high volume to our members over the internet. Problems faced by Gaia or any of our third-party cloud computing or other network providers, involving technological or business-related disruptions, as well as cybersecurity threats, may have an adverse impact on the member experience.
Cybersecurity threats, including as a result of any previous cybersecurity incidents, have not materially affected or are reasonably likely to affect the Company to date, including our business strategy, results of operations or financial condition.
Item 2. Properties
Our principal executive office is located in Louisville, Colorado.
|
|
| ||||
|
|
|
|
We lease to third parties approximately 100,000 square feet of our building space located in Colorado.physical properties are set forth below. We believe our facility isthese facilities are adequate to meet our current needs and that suitable additional facilities will be available for lease or purchase when, and as, we need them.needs.
| Size | Use | Owned/Leased | |||
Louisville, CO | 138,502 sq. ft. | Headquarters | Partially Owned/Leased | |||
Louisville, CO | 11,760 sq. ft. | Production Studio | Owned |
17
From timeOn September 9, 2020, our wholly owned subsidiary Boulder Road sold a 50% undivided interest in a portion of our Colorado campus to time, we are involvedWestside Boulder, LLC. Boulder Road retained a 50% undivided interest in legal proceedings that we considerthe property as well as full ownership of our studio and production facilities. In connection with the transaction, Boulder Road leased the property pursuant to be ina master lease for a term extending through September 30, 2030, with two five-year extensions. Gaia guaranteed Boulder Road’s obligations under the master lease. Our Colorado facility is subject to a $13.0 million mortgage with First Interstate Bank as lender.
Item 3. Legal Proceedings
In the normal course of business.business, we are subject to various legal proceedings and claims, including employment disputes, disputes on agreements, other commercial disputes, and tax matters, including non-income tax matters. We record accruals that can be reasonably estimated for losses related to matters against us that we consider to be probable. In the opinion of management, based on available information, settlements, arbitration awards and final judgments, if any, that are considered probable of being rendered against us in litigation or arbitration in existence at December 31, 20172023 and that can be reasonably estimated are either reserved against or would not have a material adverse effect on our financial condition, results of operations or cash flows.
Item 4. Mine Safety Disclosures
Not applicable.
PART II
|
|
Item 5. Market for Registrant’s Common Equity, Related Stockholder Matters and Issuer Purchases of Equity Securities
Stock Price History
Our Class A common stock is listed on the NASDAQ Global Market under the symbol “GAIA”. On February 14, 2018,March 28, 2024, we had 3,4063,218 shareholders of record and 9,789,743 shares of $.0001 par value Class A common stock outstanding, and we had 5,400,000 shares of $.0001 par value Class B common stock outstanding, held by one shareholder.
The following table sets forth certain sales price data for our Class A common stock forand one shareholder of record (Mr. Rysavy) of our Class B common stock.
Stock Repurchases
During 2023, we entered into various treasury stock transactions to buy and hold shares of our Class A common stock. The following table provides information with respect to purchases we made of our ordinary shares during the period indicated:fourth quarter of 2023.
|
| High |
|
| Low |
| ||
2017 |
|
|
|
|
|
|
|
|
Fourth Quarter |
| $ | 13.40 |
|
| $ | 11.85 |
|
Third Quarter |
| $ | 13.50 |
|
| $ | 10.35 |
|
Second Quarter |
| $ | 12.40 |
|
| $ | 10.00 |
|
First Quarter |
| $ | 10.37 |
|
| $ | 7.88 |
|
2016 |
|
|
|
|
|
|
|
|
Fourth Quarter |
| $ | 10.07 |
|
| $ | 6.05 |
|
Third Quarter |
| $ | 8.26 |
|
| $ | 7.03 |
|
Second Quarter |
| $ | 8.00 |
|
| $ | 5.83 |
|
First Quarter |
| $ | 6.49 |
|
| $ | 4.35 |
|
Period |
| Total Number of Shares Purchased |
|
| Average Price Paid per Share |
|
| Total Number of Shares Purchased as Part of Publicly Announced Plans or Programs |
|
| Maximum Amount That May Yet Be Purchased Under the Plans or Programs |
| ||||
October 1, 2023 – October 31, 2023 |
|
| — |
|
| $ | — |
|
|
| — |
|
| $ | — |
|
November 1, 2023 – November 30, 2023 |
|
| 64,805 |
|
|
| 2.62 |
|
|
| — |
|
|
| — |
|
December 1, 2023 – December 31, 2023 |
|
| — |
|
|
| — |
|
|
| — |
|
|
| — |
|
Total |
|
| 64,805 |
|
| $ | 2.62 |
|
|
| — |
|
| $ | — |
|
Issuer Purchases of Registered Equity Securities
None.
18
NoWe have not paid any dividends were declared or paid duringsince the twelve months ended December 31, 2017start of the streaming business. The timing, declaration and 2016.payment of future dividends to holders of our common stock will depend upon many factors, including our cash balances and potential future capital requirements for strategic transactions, including acquisitions, results of operations, financial condition and other factors that our board of directors may deem relevant.
Sales of Unregistered Securities
None.
Equity Compensation Plan Information
The following table summarizes equity compensation plan information for our Class A common stock at December 31, 2017:2023:
|
| Number of securities |
|
| Weighted average |
|
| Number of securities |
| |||
Equity compensation plans approved by |
|
| 1,762,017 |
|
| $ | 8.19 |
|
|
| 517,115 |
|
Equity compensation plans not approved |
|
| — |
|
|
| — |
|
|
| — |
|
Total |
|
| 1,762,017 |
|
| $ | 8.19 |
|
|
| 517,115 |
|
Item 6. Reserved
|
| Number of securities to be issued upon exercise of outstanding options, warrants and rights |
|
| Weighted average exercise price of outstanding options, warrants and rights |
|
| Number of securities remaining available for future issuance under equity compensation plans |
| |||
Equity compensation plans approved by security holders |
|
| 1,436,348 |
|
| $ | 7.67 |
|
|
| 1,563,652 |
|
Equity compensation plans not approved by security holders |
|
| — |
|
|
| — |
|
|
| — |
|
Total |
|
| 1,436,348 |
|
| $ | 7.67 |
|
|
| 1,563,652 |
|
19
The graph below shows, for the five years ended December 31, 2017, the cumulative total return on an investment of $100 in our Class A common stock, assuming the investment was made on December 31, 2012. The graph compares such return with that of comparable investments assumed to have been made on the same date in (a) the NASDAQ Composite Index, (b) the Russell 2000 Index and (c) a media peer group, comprised of The Walt Disney Company; and Lions Gate Entertainment Corp. Our Class A common stock is traded on the NASDAQ Global Market under the trading symbol “GAIA”. Our Class A common stock is also included in the Russell 2000 Index.
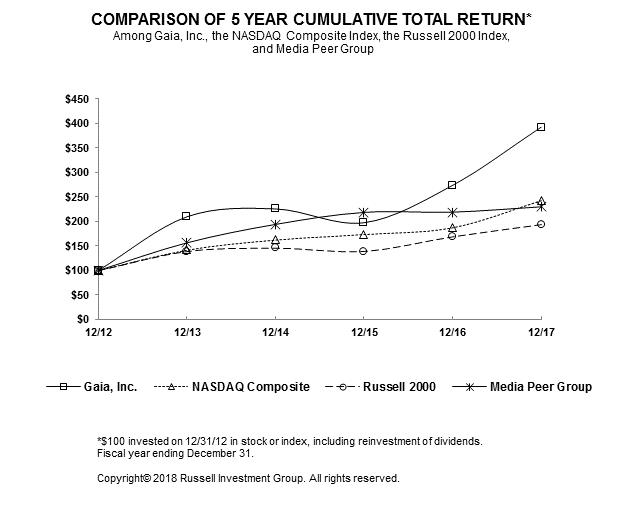
The stock price performance included in this graph is not necessarily indicative of future stock price performance.
We derived the selected consolidated statement of operations data and consolidated cash flow data for the years ended December 31, 2017, 2016 and 2015, and consolidated balance sheet data as of December 31, 2017 and 2016 set forth below from our audited consolidated financial statements, which are included elsewhere in this Form 10-K. We derived the selected consolidated statement of operations data and consolidated cash flow data for the years ended December 31, 2014 and 2013 and consolidated balance sheet data as of December 31, 2015, 2014 and 2013 set forth below from our audited consolidated financial statements which are not included in this Form 10-K. During 2016 we sold our Gaiam Brand and eco-travel business and during 2013, we sold our non-Gaia brand entertainment media distribution operations and discontinued our DRTV operations. These businesses are reported as discontinued operations for all periods presented below.
The historical operating results are not necessarily indicative of the results to be expected for any other period. You should read the data set forth below in conjunction with “Management’sItem 7. Management’s Discussion and Analysis of Financial Condition and Results of Operations” and our consolidated financial statements and related notes, included elsewhere in this Form 10-K.Operations
|
| Years ended December 31, |
| |||||||||||||||||
(in thousands, except per share data) |
| 2017 |
|
| 2016(a) |
|
| 2015(b) |
|
| 2014(b) |
|
| 2013(c) |
| |||||
Consolidated Statement of Operations Data: |
|
|
|
|
|
|
|
|
|
|
|
|
|
|
|
|
|
|
|
|
Streaming revenues |
| $ | 26,220 |
|
| $ | 14,736 |
|
| $ | 10,752 |
|
| $ | 8,040 |
|
| $ | 3,242 |
|
DVD subscription and other revenues |
|
| 2,070 |
|
|
| 2,511 |
|
|
| 2,707 |
|
|
| 2,714 |
|
|
| 2,974 |
|
Net revenues |
|
| 28,290 |
|
|
| 17,247 |
|
|
| 13,459 |
|
|
| 10,754 |
|
|
| 6,216 |
|
Loss from operations |
|
| (25,141 | ) |
|
| (16,575 | ) |
|
| (8,711 | ) |
|
| (10,726 | ) |
|
| (10,002 | ) |
Loss from continuing operations |
|
| (23,701 | ) |
|
| (10,782 | ) |
|
| (9,019 | ) |
|
| (9,846 | ) |
|
| (10,002 | ) |
Income (loss) from discontinued operations, net of tax |
|
| 429 |
|
|
| 97,848 |
|
|
| (2,687 | ) |
|
| (70 | ) |
|
| (12,750 | ) |
Net income (loss) |
| $ | (23,272 | ) |
| $ | 87,066 |
|
| $ | (11,706 | ) |
| $ | (9,916 | ) |
| $ | (22,752 | ) |
Income (loss) per share—basic and diluted: |
|
|
|
|
|
|
|
|
|
|
|
|
|
|
|
|
|
|
|
|
Continuing operations |
| $ | (1.57 | ) |
| $ | (0.54 | ) |
| $ | (0.37 | ) |
| $ | (0.41 | ) |
| $ | (0.44 | ) |
Discontinued operations |
|
| 0.03 |
|
|
| 4.93 |
|
|
| (0.11 | ) |
|
| — |
|
|
| (0.55 | ) |
Basic and diluted net income (loss) per share |
| $ | (1.54 | ) |
| $ | 4.39 |
|
| $ | (0.48 | ) |
| $ | (0.41 | ) |
| $ | (0.99 | ) |
Weighted-average shares outstanding: |
|
|
|
|
|
|
|
|
|
|
|
|
|
|
|
|
|
|
|
|
Basic and diluted |
|
| 15,160 |
|
|
| 19,850 |
|
|
| 24,510 |
|
|
| 24,228 |
|
|
| 22,972 |
|
|
| As of December 31, |
| |||||||||||||||||
(in thousands) |
| 2017 |
|
| 2016 |
|
| 2015 |
|
| 2014 |
|
| 2013(c) |
| |||||
Consolidated Balance Sheet Data: |
|
|
|
|
|
|
|
|
|
|
|
|
|
|
|
|
|
|
|
|
Cash |
| $ | 32,778 |
|
| $ | 54,027 |
|
| $ | 1,266 |
|
| $ | 3,821 |
|
| $ | 1,520 |
|
Working capital - continuing operations |
|
| 16,751 |
|
|
| 46,778 |
|
|
| (5,075 | ) |
|
| 3,111 |
|
|
| 90 |
|
Working capital - discontinued operations |
|
| — |
|
|
| — |
|
|
| 36,646 |
|
|
| 36,201 |
|
|
| 53,065 |
|
Total assets |
|
| 96,979 |
|
|
| 107,196 |
|
|
| 128,542 |
|
|
| 138,632 |
|
|
| 141,686 |
|
Total liabilities |
|
| 20,827 |
|
|
| 9,659 |
|
|
| 39,749 |
|
|
| 39,073 |
|
|
| 36,396 |
|
Total equity |
|
| 76,152 |
|
|
| 97,537 |
|
|
| 88,793 |
|
|
| 99,559 |
|
|
| 105,290 |
|
Consolidated Cash Flow Data: |
|
|
|
|
|
|
|
|
|
|
|
|
|
|
|
|
|
|
|
|
Net cash provided by (used in) operating activities |
| $ | (20,792 | ) |
| $ | (15,382 | ) |
| $ | 7,601 |
|
| $ | 9,788 |
|
| $ | (23,124 | ) |
|
|
|
|
|
|
Forward-Looking Statements
This report contains forward-looking statements within the meaning of the federal securities laws. All statements other than statements of historical fact are forward looking statements that involve risks and uncertainties. When used in this discussion, we intend the words “anticipate,” “believe,” “plan,“contemplate,” “continue,” “could,” “estimate,” “expect,” “future,” “hope,” “intend” “may,” “might,” “objective,” “ongoing,” “plan,” “potential,” “predict,” “project,” “should,” “strive,” “future,“target,” “intend”, “will”“will,” “would” and similar expressions as they relate to us to identify such forward-looking statements. Our actual results could differ materially from the results anticipated in these forward-looking statements as a result of certain factors set forth under “Risk Factors,” “Management’s Discussion and Analysis of Financial Condition and Results of Operations,” “Quantitative and Qualitative Disclosures About Market Risk”Factors” and elsewhere in this Form 10-K. Risks and uncertainties that could cause actual results to differ include, without limitation,limitation: our ability to attract new members and retain existing members; our ability to compete effectively, including for customer engagement with different modes of entertainment; maintenance and expansion of device platforms for streaming; fluctuation in customer usage of our service; fluctuations in quarterly operating results; service disruptions; production risks, general economic conditions, ongoing losses, competition,conditions; future losses; loss of key personnel, pricing,personnel; price changes; brand reputation, acquisitions,reputation; acquisitions; new initiatives we undertake,undertake; security and information systems,systems; legal liability for website content,content; failure of third parties to provide adequate service,service; future internet related taxes,internet-related taxes; our founder’s control of us, litigation, fluctuations in quarterly operating results,us; litigation; consumer trends,trends; the effect of government regulation and programsprograms; the impact of public health threats; our ability to remediate the material weaknesses in our internal control over financial reporting; and other risks and uncertainties included in our filings with the Securities and Exchange Commission.SEC. We caution you that no forward-looking statement is a guarantee of future performance, and you should not place undue reliance on these forward-looking statements which reflect our views only as of the date of this report. We undertake no obligation to update any forward-looking information.
You should read the following discussion and analysis of our financial condition and results of operations in conjunction with the consolidated financial statements and related notes included elsewhere in this document.report. This section is designed to provide information that will assist readers in understanding our consolidated financial statements, changes in certain items in those statements from year to year, the primary factors that caused those changes and how certain accounting principles, policies and estimates affect the consolidated financial statements.
Restatement of Previously Issued Consolidated Financial Statements:
We have restated our previously issued consolidated financial statements contained in this Annual Report on Form 10-K. Refer to the “Explanatory Note” preceding Item 1, Business, for background on the restatement, the fiscal periods impacted, control considerations, and other information.
In addition, we have restated certain previously reported consolidated financial information at December 31, 2022 and for the fiscal year ended December 31, 2022, and for each of the interim periods ended March 31, 2022 through September 30, 2023 in this Item 7, Management’s Discussion and Analysis of Financial Condition and Results of Operations, including but not limited to information within the Results of Operations, Quarterly and Seasonal Fluctuations, and Cash Flows sections.
See Note 3, Restatement of Previously Issued Consolidated Financial Statements, and Note 17 Quarterly Financial Data (Unaudited), in Item 8, Financial Statements and Supplementary Data, for additional information related to the restatement, including descriptions of the misstatements and the impacts on our consolidated financial statements.
Overview and Outlook
We operate a global digital video subscription service with a library of over 8,00010,000 titles and live events, with a growing selection of titles available in Spanish, German and French that caters to a unique, underserved subscribermember base. Our digital content is available to our subscribersmembers on most internet-connected devices anytime, anywhere, commercial-free. Through our online Gaia subscription service our subscribersmembers have unlimited access to a library of inspiring films, cutting edge documentaries, interviews, yoga classes, transformation related content, live events, and more – 90%88% of which is exclusively available to our subscribersmembers for digital streaming on most internet-connected devices. A subscription also allows our subscribers to download files from our library and view them without being actively connected to the internet.
Consumption of streaming video is expanding rapidly as more and more people augment their use of, or replace broadcast television and turn to, streaming video to watch their favorite content on services like Netflix, Amazon Prime, Hulu Plus, HBO Now and Gaia.20
Gaia’s position in the streaming video landscape is firmly supported by its wide variety of exclusive and unique content, which provides a complementary offering to other entertainment-based streaming video services. Our original content is developed and produced in-house in our production studioslifestyle campus near Boulder, Colorado. Over 90% of our content is available for streaming exclusively on Gaia. By offering exclusive and unique content through our streaming service, we believe we will be able to significantly expand our target subscribermember base.
Our available content is currently focused on yoga, transformation, alternative healing, seeking truth and conscious films. This content is specifically targeted to a unique customermember base that is interested in alternatives and supplements to the content provided by mainstream media. We have grown these content options both organically through our own productions and through strategic acquisitions. In addition, through our investments in our streaming video technology and our user interface, we have expanded the many ways our subscription customermember base can access our unique library of media titles.
Our core strategy is to grow our subscription business domestically and internationally by expanding our unique and exclusive content library, enhancing our user interface, extending our streaming service to new internet-connected devices as they are developed and creating a conscious community built onaround our content.
We are a Colorado corporation. Our principal and executive office is located at 833 West South Boulder Road, Suite G, Louisville, CO 80027-2452. Our telephone number at that address is (303) 222-3600. We maintain an internet website at www.gaia.com. The website address has been included only as a textual reference. Our website and the information contained on that website, or connected to that website, are not incorporated by reference into this Form 10-K.
Sale of Gaiam Brand Segment
In 2016, we sold our equity interest in Natural Habitat to Lindblad Expeditions Holdings, Inc. (NASDAQ: LIND) for $13 million and recognized a gain of $10 million.
Also in 2016, we completed the sale of our Gaiam Brand consumer products business to Sequential Brands Group, Inc. (NASDAQ: SQBG) and its operating partner Fit For Life LLC. Gross consideration was $167 million and we recognized a gain of $115 million before taxes.
We used the majority of the net proceeds to conduct a share repurchase tender offer and acquired approximately 9,637,000 shares of our Class A common stock and 840,000 vested stock options at a fixed price of $7.75 per share.
Results of Operations
The table below summarizes certain of our results for the periods indicated:
|
| Years ended December 31, |
| |||||
(in thousands, except per share data) |
| 2023 |
|
| 2022 (As restated) |
| ||
Revenues, net |
| $ | 80,423 |
|
| $ | 82,035 |
|
Cost of revenues |
|
| 11,629 |
|
|
| 10,915 |
|
Gross profit margin |
|
| 85.5 | % |
|
| 86.7 | % |
Selling and operating |
|
| 67,156 |
|
|
| 64,155 |
|
Corporate, general and administration |
|
| 6,205 |
|
|
| 7,181 |
|
Acquisition costs |
|
| — |
|
|
| 49 |
|
Loss from operations |
|
| (4,567 | ) |
|
| (265 | ) |
Equity method investment loss |
|
| (501 | ) |
|
| (511 | ) |
Interest and other expense, net |
|
| (467 | ) |
|
| (257 | ) |
SEC settlement |
|
| — |
|
|
| (2,000 | ) |
Loss before income taxes |
|
| (5,535 | ) |
|
| (3,033 | ) |
Provision for income taxes |
|
| 60 |
|
|
| 202 |
|
Loss from continuing operations |
|
| (5,595 | ) |
|
| (3,235 | ) |
Loss from discontinued operations |
|
| — |
|
|
| (360 | ) |
Net loss |
| $ | (5,595 | ) |
| $ | (3,595 | ) |
Net income attributable to noncontrolling interests |
|
| 207 |
|
|
| 296 |
|
Net loss attributable to common shareholders |
|
| (5,802 | ) |
|
| (3,891 | ) |
|
| Years ended December 31, |
| |||||||||
(in thousands, except per share data) |
| 2017 |
|
| 2016 |
|
| 2015 |
| |||
Streaming revenues |
| $ | 26,220 |
|
| $ | 14,736 |
|
| $ | 10,752 |
|
DVD subscription and other revenues |
|
| 2,070 |
|
|
| 2,511 |
|
|
| 2,707 |
|
Cost of streaming |
|
| 3,602 |
|
|
| 2,567 |
|
|
| 2,262 |
|
Cost of DVD subscription and other |
|
| 325 |
|
|
| 275 |
|
|
| 335 |
|
Selling and operating |
|
| 43,979 |
|
|
| 24,960 |
|
|
| 13,079 |
|
Corporate, general and administration |
|
| 5,525 |
|
|
| 6,020 |
|
|
| 6,494 |
|
Loss from operations |
|
| (25,141 | ) |
|
| (16,575 | ) |
|
| (8,711 | ) |
Interest and other income (expense) |
|
| 515 |
|
|
| (351 | ) |
|
| (311 | ) |
Loss before taxes |
|
| (24,626 | ) |
|
| (16,926 | ) |
|
| (9,022 | ) |
Income tax benefit |
|
| (925 | ) |
|
| (6,144 | ) |
|
| (3 | ) |
Net loss from continuing operations |
|
| (23,701 | ) |
|
| (10,782 | ) |
|
| (9,019 | ) |
Income (loss) from discontinued operations, net |
|
| 429 |
|
|
| 97,848 |
|
|
| (2,687 | ) |
Net income (loss) |
| $ | (23,272 | ) |
| $ | 87,066 |
|
| $ | (11,706 | ) |
21
The following table sets forth certain financial data as a percentage of revenues, net revenues for the periods indicated:
|
| Years ended December 31, |
| |||||
|
| 2023 |
|
| 2022 (As restated) |
| ||
Revenues, net |
|
| 100.0 | % |
|
| 100.0 | % |
Cost of revenues |
|
| 14.5 | % |
|
| 13.3 | % |
Gross profit margin |
|
| 85.5 | % |
|
| 86.7 | % |
Expenses: |
|
|
|
|
|
| ||
Selling and operating |
|
| 83.5 | % |
|
| 78.2 | % |
Corporate, general and administration |
|
| 7.7 | % |
|
| 8.8 | % |
Acquisition costs |
|
| 0.0 | % |
|
| 0.1 | % |
Total operating expenses |
|
| 91.2 | % |
|
| 87.0 | % |
Loss from operations |
|
| (5.7 | )% |
|
| (0.3 | )% |
Equity method investment loss |
|
| (0.6 | )% |
|
| (0.6 | )% |
Interest and other expense, net |
|
| (0.6 | )% |
|
| (0.3 | )% |
SEC settlement |
|
| 0.0 | % |
|
| (2.4 | )% |
Loss before income taxes |
|
| (6.9 | )% |
|
| (3.7 | )% |
Provision for (benefit from) income taxes |
|
| 0.1 | % |
|
| 0.2 | % |
Loss from continuing operations |
|
| (7.0 | )% |
|
| (3.9 | )% |
Loss from discontinued operations |
|
| 0.0 | % |
|
| (0.4 | )% |
Net loss |
|
| (7.0 | )% |
|
| (4.4 | )% |
Net income attributable to noncontrolling interests |
|
| 0.3 | % |
|
| 0.4 | % |
Net loss attributable to common shareholders |
|
| (7.2 | )% |
|
| (4.7 | )% |
|
| Years ended December 31, |
| |||||||||
|
| 2017 |
|
| 2016 |
|
| 2015 |
| |||
Net revenues |
|
|
|
|
|
|
|
|
|
|
|
|
Streaming |
|
| 92.7 | % |
|
| 85.4 | % |
|
| 79.9 | % |
DVD subscription and other |
|
| 7.3 | % |
|
| 14.6 | % |
|
| 20.1 | % |
Total net revenues |
|
| 100.0 | % |
|
| 100.0 | % |
|
| 100.0 | % |
Cost of revenues |
|
|
|
|
|
|
|
|
|
|
|
|
Cost of streaming |
|
| 12.8 | % |
|
| 14.9 | % |
|
| 16.8 | % |
Cost of DVD subscription and other |
|
| 1.1 | % |
|
| 1.6 | % |
|
| 2.5 | % |
Total cost of revenues |
|
| 13.9 | % |
|
| 16.5 | % |
|
| 19.3 | % |
Gross profit |
|
| 86.1 | % |
|
| 83.5 | % |
|
| 80.7 | % |
Expenses: |
|
|
|
|
|
|
|
|
|
|
|
|
Selling and operating |
|
| 155.5 | % |
|
| 144.7 | % |
|
| 97.2 | % |
Corporate, general and administration |
|
| 19.5 | % |
|
| 34.9 | % |
|
| 48.3 | % |
Total expenses |
|
| 175.0 | % |
|
| 179.6 | % |
|
| 145.4 | % |
Loss from operations |
|
| (88.9 | )% |
|
| (96.1 | )% |
|
| (64.7 | )% |
Interest and other income (expense) |
|
| 1.8 | % |
|
| (2.0 | )% |
|
| (2.3 | )% |
Loss before taxes |
|
| (87.0 | )% |
|
| (98.1 | )% |
|
| (67.0 | )% |
Income tax benefit |
|
| (3.3 | )% |
|
| (35.6 | )% |
|
| — | % |
Net loss from continuing operations |
|
| (83.8 | )% |
|
| (62.5 | )% |
|
| (67.0 | )% |
Income (loss) from discontinued operations |
|
| 1.5 | % |
|
| 567.3 | % |
|
| (20.0 | )% |
Net income (loss) |
|
| (82.3 | )% |
|
| 504.8 | % |
|
| (87.0 | )% |
Year Ended December 31, 20172023 Compared to Year Ended December 31, 20162022
Net revenueRevenues, net. Net revenue increased $11.1Revenues, net decreased $1.6 million, or 64.5%2.0%, to $28.3$80.4 million during 2017,2023, compared to $17.2$82.0 million during 2016. Net2022. The primary contributing factor to the decrease in revenue from streaming increased $11.5 million, or 78.2%,is a lower average-subscriber count for 2023 versus 2022. The reduced count is due to $26.2 million during 2017 from $14.7 million during 2016. The increase in streaming revenues was primarily driven by 80% growththe industry-wide post-COVID subscriber contraction in the numbersecond half of paying subscribers. Net revenues were not significantly impacted by either changing prices or inflation.2022 and subsequent recovery.
Cost of revenues. Cost of revenues increased $1.1$0.7 million, or 39.3%6.4%, to $3.9$11.6 million during 20172023 from $2.8$10.9 million during 2016. Cost2022, with gross profit margin of 85.5% in the current year compared to 86.7% in 2022. The increase in the cost of revenues for streamingis driven mainly by increased $1.0 million, or 38.5%,paid advertising costs. The gross profit margin decrease is due to $3.6 million during 2017 from $2.6 million during 2016 and, as a percentagethe combination of streaming revenue, decreased to 13.7% compared to 17.4% during 2016 due primarily to an increase in revenue and theincreased costs with lower cost of streaming associated with our higher volumes.revenues.
Selling and operating expenses. Selling and operating expenses increased $19.0$3.0 million, or 76.0%4.7%, to $44.0$67.2 million during 20172023 from $25.0$64.2 million during 20162022 and, as a percentage of net revenue,revenues, increased to 155.5%83.5% during 20172023 from 144.7%78.2% during 2016.2022. The increase was primarily due to increased marketing spendingdriven by tax accruals for subscriber acquisition to drive the increase in our annual subscriber growth rate from 52% in 2016 to 80% in 2017.2023.
Corporate, general and administration expenses. Corporate, general and administration expenses decreased $0.5$1.0 million, or 8.3%13.9%, to $5.5$6.2 million during 20172023 from $6.0$7.2 million during 20162022 and, as a percentage of net revenue, decreased to 19.5%7.7% during 20172023 from 34.9%8.8% during 2016.2022. The decrease was primarily driven by higher legal fees and stock compensation expense during 2022.
Interest and other income (expense), net. Interest and other income (expense), net decreased $(0.2) million to $(0.5) million during 2023 compared to $(0.3) million during 2022. The bulk of interest paid is attributed to the loan on our building and the line of credit discussed in Note 9 to the consolidated financial statements in Item 8 of this Form 10-K.
Provision for (benefit from) income taxes. Provision for income taxes reflects a current year provision of $0.1 million compared to the prior year provision of $0.2 million from income taxes due to the eliminationpartial valuation allowance release related to the recognition of duplicate costs upon the sale of the Gaiam Brand business in 2016.
Income (loss) from discontinued operations. The operations of the Gaiam Brand segment are included in income (loss) from discontinued operations. We completed the sale of the Gaiam Brand business and Natural Habitat during 2016.
Net income (loss). As a result of the above factors, net loss was $23.3 million, or $1.54 per share, for 2017 compared to net income of $87.1 million, or $4.39 per share, for 2016 which reflected the repurchase of approximately 40% of
our outstanding common stock. Net income (loss) was not significantly impacted by either changing prices or inflation.
Year Ended December 31, 2016 Compared to Year Ended December 31, 2015
Net revenue. Net revenue increased $3.7 million, or 27.4%, to $17.2 million during 2016, compared to $13.5 million during 2015. Net revenue from streaming increased $3.9 million, or 36.1%, to $14.7 million during 2016 from $10.8 million during 2015. The increase in streaming revenues was primarily driven by 52% growth in the number of paying subscribers. Net revenues were not significantly impacted by either changing prices or inflation.
Cost of revenues. Cost of revenues increased $0.2 million, or 7.7%, to $2.8 million during 2016 from $2.6 million during 2015. Cost of revenues for streaming increased $0.3 million, or 13.0%, to $2.6 million during 2016 from $2.3 million during 2015 and, as a percentage of streaming revenue, decreased to 17.4% compared to 21.0% during 2015 due primarily to an increase in revenue and the lower cost of streamingdeferred tax liabilities associated with our higher volumes.
Sellingthe acquisition of Yoga International, Food Matters, and operating expenses. Selling and operating expenses increased $11.9 million, or 90.8%, to $25.0 million during 2016 from $13.1 million during 2015 and, as a percentage of net revenue, increased to 144.7% during 2016 from 97.2% during 2015. The increase was primarily due to increased marketing spending for subscriber acquisition to drive growth.My Yoga Online.
Corporate, general and administration expenses. Corporate, general and administration expenses decreased $0.5 million, or 7.7%, to $6.0 million during 2016 from $6.5 million during 2015 and, as a percentage of net revenue, decreased to 34.9% during 2016 from 48.3% during 2015. The decrease was primarily due to the elimination of duplicate costs upon the sale of the Gaiam Brand business in 2016, offset by increased costs associated with legal and accounting fees.22
Income (loss) from discontinued operations. The operations of the Gaiam Brand segment are included in income (loss) from discontinued operations. We completed the sale of the Gaiam Brand business and Natural Habitat during 2016, recognizing a gain of $114.5 million, which was offset by transaction costs, taxes and losses from the operation of discontinued operations of $16.7 million, compared to losses from the operation of discontinued operations of $2.7 million in 2015.
Net income (loss). As a result of the above factors, net income was $87.1 million, or $4.39 per share, during 2016 compared to a net loss of $11.7 million, or $0.48 per share, during 2015. Net income (loss) was not significantly impacted by either changing prices or inflation.
Quarterly and Seasonal Fluctuations
The following tables set forth our unaudited results of operations for each of the quarters in 20172023 and 2016.2022. In our opinion, this unaudited financial information includes all adjustments, consisting solely of normal recurring accruals and adjustments, necessary for a fair presentation of the results of operations for the quarters presented. You should read this financial information in conjunction with our consolidated financial statements and related notes included elsewhere in this Form 10-K. The results of operations for any quarter are not necessarily indicative of future results of operations.
|
| Year 2023 Quarters Ended (Unaudited) (As restated) |
| |||||||||||||
(in thousands, except per share data) |
| March 31 |
|
| June 30 |
|
| September 30 |
|
| December 31 |
| ||||
Revenues, net |
| $ | 19,647 |
|
| $ | 19,839 |
|
| $ | 20,223 |
|
| $ | 20,714 |
|
Gross profit |
|
| 16,874 |
|
|
| 17,000 |
|
|
| 17,240 |
|
|
| 17,680 |
|
Gross profit margin |
|
| 85.9 | % |
|
| 85.7 | % |
|
| 85.2 | % |
|
| 85.4 | % |
Equity method investment loss |
|
| (125 | ) |
|
| (125 | ) |
|
| (125 | ) |
|
| (126 | ) |
Loss from continuing operations |
|
| (1,268 | ) |
|
| (1,843 | ) |
|
| (713 | ) |
|
| (1,771 | ) |
Net loss |
|
| (1,268 | ) |
|
| (1,843 | ) |
|
| (713 | ) |
|
| (1,771 | ) |
Net income attributable to noncontrolling interests |
|
| 38 |
|
|
| 45 |
|
|
| 59 |
|
|
| 65 |
|
Net loss attributable to common shareholders |
|
| (1,306 | ) |
|
| (1,888 | ) |
|
| (772 | ) |
|
| (1,836 | ) |
Loss per share |
|
|
|
|
|
|
|
|
|
|
|
| ||||
Basic |
|
|
|
|
|
|
|
|
|
|
|
| ||||
Continuing operations (attributable to common shareholders) |
| $ | (0.06 | ) |
| $ | (0.09 | ) |
| $ | (0.04 | ) |
| $ | (0.08 | ) |
Discontinued operations |
| $ | — |
|
| $ | — |
|
| $ | — |
|
| $ | — |
|
Basic loss per share |
| $ | (0.06 | ) |
| $ | (0.09 | ) |
| $ | (0.04 | ) |
| $ | (0.08 | ) |
Diluted |
|
|
|
|
|
|
|
|
|
|
|
| ||||
Continuing operations (attributable to common shareholders) |
| $ | (0.06 | ) |
| $ | (0.09 | ) |
| $ | (0.04 | ) |
| $ | (0.08 | ) |
Discontinued operations |
| $ | — |
|
| $ | — |
|
| $ | — |
|
| $ | — |
|
Diluted loss per share |
| $ | (0.06 | ) |
| $ | (0.09 | ) |
| $ | (0.04 | ) |
| $ | (0.08 | ) |
Weighted average shares outstanding |
|
|
|
|
|
|
|
|
|
|
|
| ||||
Basic |
|
| 20,826 |
|
|
| 20,874 |
|
|
| 21,154 |
|
|
| 23,148 |
|
Diluted |
|
| 20,826 |
|
|
| 20,874 |
|
|
| 21,154 |
|
|
| 23,148 |
|
|
| Year 2017 Quarters Ended |
| |||||||||||||
(in thousands, except per share data) |
| March 31 |
|
| June 30 |
|
| September 30 |
|
| December 31 |
| ||||
Net revenues |
| $ | 5,784 |
|
| $ | 6,558 |
|
| $ | 7,522 |
|
| $ | 8,426 |
|
Gross profit |
|
| 4,964 |
|
|
| 5,647 |
|
|
| 6,485 |
|
|
| 7,267 |
|
Loss from continuing operations |
|
| (6,180 | ) |
|
| (6,310 | ) |
|
| (5,634 | ) |
|
| (5,577 | ) |
Income from discontinued operations |
|
| — |
|
|
| — |
|
|
| 429 |
|
|
| — |
|
Net loss |
|
| (6,180 | ) |
|
| (6,310 | ) |
|
| (5,205 | ) |
|
| (5,577 | ) |
Basic and diluted net loss per share |
| $ | (0.41 | ) |
| $ | (0.42 | ) |
| $ | (0.34 | ) |
| $ | (0.37 | ) |
Weighted average shares outstanding - basic and diluted |
|
| 15,153 |
|
|
| 15,157 |
|
|
| 15,161 |
|
|
| 15,168 |
|
23
|
| Year 2016 Quarters Ended |
| |||||||||||||
(in thousands, except per share data) |
| March 31 |
|
| June 30 |
|
| September 30 |
|
| December 31 |
| ||||
Net revenues |
| $ | 3,830 |
|
| $ | 4,198 |
|
| $ | 4,462 |
|
| $ | 4,757 |
|
Gross profit |
|
| 3,117 |
|
|
| 3,451 |
|
|
| (3,761 | ) |
|
| 4,075 |
|
Loss from continuing operations |
|
| (4,126 | ) |
|
| (3,085 | ) |
|
| (151 | ) |
|
| (3,421 | ) |
Income (loss) from discontinued operations |
|
| (3,498 | ) |
|
| 646 |
|
|
| 100,595 |
|
|
| 106 |
|
Net income (loss) |
|
| (7,624 | ) |
|
| (2,439 | ) |
|
| 100,444 |
|
|
| (3,315 | ) |
Basic and diluted net income (loss) per share |
| $ | (0.31 | ) |
| $ | (0.10 | ) |
| $ | 6.64 |
|
| $ | (0.22 | ) |
Weighted average shares outstanding - basic and diluted |
|
| 24,531 |
|
|
| 24,580 |
|
|
| 15,138 |
|
|
| 15,148 |
|
|
| Year 2022 Quarters Ended (Unaudited) (As restated) |
| |||||||||||||
(in thousands, except per share data) |
| March 31 |
|
| June 30 |
|
| September 30 |
|
| December 31 |
| ||||
Revenues, net |
| $ | 21,831 |
|
| $ | 20,720 |
|
| $ | 19,907 |
|
| $ | 19,577 |
|
Gross profit |
|
| 18,926 |
|
|
| 17,961 |
|
|
| 17,259 |
|
|
| 16,974 |
|
Gross margin |
|
| 86.7 | % |
|
| 86.7 | % |
|
| 86.7 | % |
|
| 86.7 | % |
Equity method investment loss |
|
| (129 | ) |
|
| (135 | ) |
|
| (125 | ) |
|
| (122 | ) |
Income (loss) from continuing operations |
|
| 122 |
|
|
| 123 |
|
|
| (2,493 | ) |
|
| (987 | ) |
Loss from discontinued operations |
|
| (161 | ) |
|
| (132 | ) |
|
| (7 | ) |
|
| (60 | ) |
Net loss |
|
| (39 | ) |
|
| (9 | ) |
|
| (2,500 | ) |
|
| (1,047 | ) |
Net income attributable to noncontrolling interests |
|
| 65 |
|
|
| 65 |
|
|
| 34 |
|
|
| 132 |
|
Net loss attributable to common shareholders |
|
| (104 | ) |
|
| (74 | ) |
|
| (2,534 | ) |
|
| (1,179 | ) |
Loss per share |
|
|
|
|
|
|
|
|
|
|
|
| ||||
Basic |
|
|
|
|
|
|
|
|
|
|
|
| ||||
Continuing operations (attributable to common shareholders) |
| $ | — |
|
| $ | — |
|
| $ | (0.12 | ) |
| $ | (0.05 | ) |
Discontinued operations |
| $ | (0.01 | ) |
| $ | (0.01 | ) |
| $ | — |
|
| $ | — |
|
Basic loss per share |
| $ | (0.01 | ) |
| $ | (0.01 | ) |
| $ | (0.12 | ) |
| $ | (0.05 | ) |
Diluted |
|
|
|
|
|
|
|
|
|
|
|
| ||||
Continuing operations (attributable to common shareholders) |
| $ | — |
|
| $ | — |
|
| $ | (0.12 | ) |
| $ | (0.05 | ) |
Discontinued operations |
| $ | (0.01 | ) |
| $ | (0.01 | ) |
| $ | — |
|
| $ | — |
|
Diluted loss per share |
| $ | (0.01 | ) |
| $ | (0.01 | ) |
| $ | (0.12 | ) |
| $ | (0.05 | ) |
Weighted average shares outstanding |
|
|
|
|
|
|
|
|
|
|
|
| ||||
Basic |
|
| 20,465 |
|
|
| 20,788 |
|
|
| 20,806 |
|
|
| 20,806 |
|
Diluted |
|
| 20,816 |
|
|
| 20,795 |
|
|
| 20,806 |
|
|
| 20,806 |
|
Our subscribermember base growth reflects seasonal variations driven primarily by periods when consumers buy internet-connected devicestypically spend more time indoors and, as a result, tend to increase their viewing, similar to those of traditional TV and cable networks. Ourviewing. We have generally experienced the greatest member growth is generally greatest in the fourth and first quarters (October through March)February), and slowest in theduring May through August period.August. This drives quarterly variations in our spending on customermember acquisition efforts and the number of net new subscribers we add each quarter but does not driveresult in a corresponding seasonality in net revenue. As we continue to expand internationally, we also expect regional seasonality trends to demonstrate more predictable seasonal patterns as our service offering in each market becomes more established and we have a longer history to assess such patterns.
Critical Accounting PoliciesEstimates
We prepare our consolidated financial statements in conformity with accounting principles generally accepted in the United States, which require us to make judgments, estimates and assumptions that affect the amounts reported in the consolidated financial statements and accompanying notes. Note 2 to the consolidated financial statements in Item 8 of this Form 10-K summarizes the significant accounting policies and methods used in the preparation of our consolidated financial statements.
We believe the following to be critical accounting policies whose application has a material impact on our financial presentation, and involve a higher degree of complexity, as they require us to make judgments and estimates about matters that are inherently uncertain.
Media Librarylibrary
Media Librarylibrary represents the lower of unamortized cost or net realizable value of digital media content acquired through asset purchases, capitalized costs to produce our proprietary media content, and rights obtained through license arrangements and digital media content acquired through asset purchases or business combinations.
24
The value of our acquiredproduced media library consists of the fair valuecapitalized costs incurred to produce original media content, including salary and overhead costs of media assets obtained through asset acquisitionsour in-house production team and business combinations recorded at the estimated fair value of the titles acquired, which is based on a number of factors, including the number of titles, the total hours of content, the production quality and age of the acquired media assets.other third-party costs.
Our licensed media library is obtained through license arrangements. Generally, we pay an advance against a percentage royalty or an upfront license fee in exchange for the distribution rights for a specific license window, but we may also obtain a license for a fixed fee for perpetuity. These payments are capitalized at the time of payment. Certain agreements also include an ongoing royalty obligation, which entitles the licensor to a share of the revenues generated from the licensed works. These expenses are calculated and accrued on a monthly basis and included in costs of streaming.revenues. We pay these accrued royalties on a quarterly basis and therefore have included the related liability in accrued liabilities.
The value of our producedacquired media library consists of capitalized costs incurred to produce originalthe acquisition date fair value of media assets obtained through asset acquisitions and business combinations recorded at the estimated fair value of the titles acquired, which is based on a number of factors, including the number of titles, the total hours of content, including salarythe production quality and overhead costsage of our in-house production team and other third-party costs.the acquired media assets.
We amortize our media library in cost of streamingrevenues on a straight-line basis over the shorter of the license period or the estimated useful life of the titles, which typically ranges from 12 to 90 months. The amortization period begins with the first month of availability on our service.
Management reviews content viewership to determine whether viewing patterns correlate with initial estimates supporting the amortization period utilized. If current estimates indicate that viewing is significantly higher in earlier periods relative to the remaining amortization period, we will begin amortizing the respective titles on an accelerated basis over the amortization period. Based on this analysis,Due to our exclusive content and growing member base, our viewership trends have continued to support both the amortization period and the straight-line basis of amortization with no additional amortization was recorded during 2017, 2016 or 2015.recorded.
Our media library is reviewed for impairment at the film group level when an event or change in circumstances indicates that the carrying amount of the media libraryfilm group may not be recoverable. Recoverability of the media libraryfilm group is measured by a comparison of the carrying amount of the media libraryfilm group to estimated undiscounteddiscounted future cash flows expected to be generated by the media library.film group. If the carrying amount ofexceeds the media library exceeds its estimated future cash flows, an impairment charge is recognized by the amount by which the carrying value ofexceeds the media library exceeds its fair value. No impairment charges were recorded during 2023 or 2022.
Goodwill
Goodwill represents the excess of the purchase consideration over the estimated fair value of assets acquired less liabilities assumed in a business acquisition. We have only one reporting unit; therefore, goodwill is assessed at the enterprise level. We review goodwill for impairment annually as of December 31.October 1 or more frequently if indicators of impairment are identified. We have the option of first assessing qualitative factors to determine whether events and circumstances indicate that it is more likely than not that the estimated fair value of goodwill is less than its carrying amount. If it is determined that the fair value for goodwill is more likely than not greater than the carrying amount for goodwill, then the two-step impairment test is unnecessary. If it is determined that the two-step impairment test is necessary, then for step one, we compare the estimated fair value of goodwill with its carrying amount, including goodwill. If the estimated fair value of goodwill exceeds its carrying amount, we consider the goodwill to not be impaired. If the carrying amount of goodwill exceeds its estimated fair value, we perform the second step of the goodwill impairment test to measure the amount of impairment loss. We use eitherboth a comparable market approach or a traditional present value methodand an income approach to test for potential impairment. The market approach follows the guideline public company method to establish valuation multiples for comparison. The income approach follows a traditional discounted cash flow model. Primary assumptions for each approach include revenue projections, operating expenses, discount rate, control premium, and terminal growth rate. Projections are dependent on management assumptions, which are partly based on the Company’s historical experience. The results of these approaches are evaluated against the Company’s market capitalization for reasonableness. The process of evaluating the potential impairment of goodwill is highly subjective and requires significant judgment at many points during the analysis. Application of alternative assumptions and definitions could yield significantly different results. During 2017, 20162023 and 2015,2022, no impairment of goodwill was indicated.
25
Income Taxes and Deferred Tax Balances
ASC 740, Income Taxes, requires deferredDeferred income tax assets and liabilities are recorded with respect to be measured at the enacted tax rate expected to apply when the temporary differences are to be realized or settled.in the accounting treatment of items for financial reporting purposes and for income tax purposes. The tax expense or benefit related to ordinary income or loss shallmust be computed at an annual effective tax rate and the tax expense or benefit related to all other items shallmust be individually computed and recognized as a discrete item when it occurs. Our annual effective tax rate for 2017 was 35.5%, however due toWhere, based on the federal tax rate reduction effective after December 31, 2017, the netweight of available evidence, it is more likely than not that some amount of recorded deferred tax assets are remeasured at 22.5%,will not be realized, a decrease fromvaluation allowance is established for the amount that, in management’s judgment, is sufficient to reduce the deferred tax asset to an amount that is more likely than not to be realized. As we have historically had cumulative losses, we have not released the current year annual effective tax rate of 35.5%.valuation allowance. The difference in our effective tax rate is the resulttiming of the reductionrelease of the valuation allowance will be dependent on cumulative income for a period of 36 months and an expectation that we will not have cumulative losses in the federal corporatefuture.
A tax rate from 34% in 2017 to 21% beginning in 2018.position must meet a minimum probability threshold before a financial statement benefit is recognized. The effect of a change in tax lawminimum threshold is recorded discretelydefined as a componenttax position that is more likely than not to be sustained upon examination by the applicable taxing authority, including resolution of any related appeals or litigation processes, based on the technical merits of the incomeposition. The tax provisionbenefit to be recognized is measured as the largest amount of benefit that is greater than fifty percent likely of being realized upon ultimate settlement.
Non-Income Taxes
The Company accrues for non-income tax assessments from foreign jurisdictions related to continuing operations inprior periods and recognizes the period of enactment.
Revenues
Streaming revenues consist primarily of subscription fees paid by our streaming customers. DVD subscriptionexpense within selling and other revenues consist of subscription fees paid by our DVD customersoperating, when deemed probable and rental income from tenant leases. We recognize revenues whenestimable. Once the following four basic criteria are met: (i) persuasive evidence of an arrangement exists; (ii) deliveryrequirement to remit non-income taxes to foreign jurisdictions has occurred or services have been rendered; (iii) the seller’s price to the buyer is fixed or determinable; and (iv) collectability is reasonably assured. Weestablished, we present revenues net of the non-income taxes collected from customers. Streaming revenues are recognized ratably over the subscription term. Deferred revenues consist of subscription fees collected from customers that have not been earnedmembers and is recognized ratably over the remaining term of the subscription.remit such amounts to foreign tax authorities.
We recognize compensation cost for share-based awards based on the estimated fair value of the award on the date of grant. We measure compensation cost at the grant date based on the estimated fair value of the award and recognize compensation cost upon the probable attainment of a specified performance condition over the estimated performance period or for time basedtime-based awards over the service period. We useSince 2019, we have only granted restricted stock units, for which we utilize the Black-Scholes option or intrinsic valuation modelmarket price of our common stock on the date of grant to estimate the fair value of the award. In estimating this fair value, we use certain assumptions, as disclosed in Note 8. Share-Based Compensation, consisting of the expected life of the option, risk-free interest rate, dividend yield, and volatility. The use of a different estimate for any one of these assumptions could have a material impact on the amount of calculated compensation expense.value.
Liquidity and Capital Resources
Our capital needs arise from working capital required to fund operations, capital expenditures related to acquisition and development of media content, development and marketing of our digital platforms, acquisitions of new businesses and other investments, replacements, expansions and improvements to our infrastructure, and future growth. These capital requirements depend on numerous factors, including the rate of market acceptance of our offerings, our ability to expand our customer base, the cost of ongoing upgrades to our offerings, the level ofour expenditures for marketing, and other factors. Additionally, we will continue to pursue opportunities to expand our media libraries, evaluate possible investments in businesses and technologies, and increase our marketing programs as needed. At
On December 28, 2020, Boulder Road and Westside Boulder, LLC entered into a loan agreement with First Interstate Bank, as lender, providing for a mortgage loan in the principal amount of $13.0 million. The loan bears interest at a fixed rate of 3.75% per annum and matures on December 28, 2025. Westside and Boulder Road each received 50% of the proceeds and are each responsible for 50% of the monthly installments. The loan is secured by a deed of trust, assignment of rents, security agreement and fixture filing on our corporate campus and is guaranteed by Gaia.
On August 25, 2022, Gaia entered into a Credit and Security Agreement with KeyBank National Association. The Credit Agreement provides for a revolving credit facility in an aggregate amount of up to $10.0 million with a sublimit of $1.0 million available for issuances of letters of credit. Borrowings under the Credit Agreement are
26
available for working capital and general corporate purposes, but not to fund any permitted acquisitions or other investments.
We began to generate positive cash flows from operations since 2020 and have continued to generate cash flows from operations each subsequent quarter. We expect to continue generating positive cash flows from operations during 2024. We generated approximately $5.9 million in cash flows from operations during 2023, which helped fund the ongoing investment in our content library and the technology platform we use to deliver the content to our members.
We intend to invest approximately 10%-20% of our consolidated revenues each year to support continued investment in our content library and technology platform. This spending is entirely discretionary in nature with no contractual commitments and due to our in-house production capabilities, we can scale our content investment based on the cash flows generated from operations if necessary to ensure we have sufficient liquidity to operate our business into the future. As of December 31, 2017,2023, our cash balance was $32.8$7.8 million. We estimate that our capital expenditures, including produced content, will total approximately $13 million to $17 million for 2018, which will be funded through our available cash balance.
Since 2007, we have had an active shelf registration with the Securities and Exchange Commission for 5,000,000 shares of our Class A common stock and to date no shares have been issued under this shelf registration.
On December 28, 2017, our wholly-owned subsidiary Boulder Road LLC entered into a $13.5 million revolving credit facility with Great Western Bank, secured by its real estate and guaranteed by Gaia. The credit facility matures on December 28, 2020, and the maximum available under the credit facility reduces by $500,000 semi-annually each June 30 and December 31. Interest accrues at the prime rate plus 0.5% with a floor of 4.25%. The credit facility requires Boulder Road to maintain a debt service coverage ratio of 1.2 to 1.0 as of the end of each calendar year period, and contains various other affirmative and negative covenants, including among others, limitations on indebtedness, liens, investments and loans. At December 31, 2017, $12.5 million of borrowings were outstanding under the credit facility.
In the normal course of our business, we investigate, evaluate and discuss acquisition, joint venture, minority investment, strategic relationship and other business combination opportunities in our market. For any future investment, acquisition or joint venture opportunities, we may consider using then-available liquidity, issuing equity securities or incurring additional indebtedness.
While there can be no assurances, we believe our cash on hand, cash expected to be generated from future operations, and cash that could be raised by the sale of our stock or from new or revised credit facilities wouldpotential capital raising capabilities should be sufficient to fund our operations on both a short-term and long-term basis. However, our projected cash needs may change as a result of acquisitions, contentproduct development, unforeseen operational difficulties or other factors.
On October 2, 2023, we entered into an underwriting agreement with Lake Street Capital Markets, LLC (the Underwriter) relating to the offer and sale of 1,855,000 shares of our Class A common stock ($0.0001 par value) (the Shares). We sold the Shares to the Underwriter at the public offering price of $2.70 per share less underwriting discounts and commissions, resulting in net proceeds of $4.7 million. We provided a 30-day option to the Underwriter to purchase up to an additional 278,250 Shares to cover over-allotments. On November 3, 2023, the Underwriter purchased an additional 203,754 Shares generating additional net proceeds of $0.5 million pursuant to the partial exercise of the over-allotment option.
Cash Flows
The following table summarizes our primary sources (uses) of cash during the periods presented:
|
| Years ended December 31, |
| |||||
(in thousands) |
| 2023 |
|
| 2022 (As restated) |
| ||
Net cash provided by (used in): |
|
|
|
|
|
| ||
Operating activities - continuing operations |
| $ | 5,870 |
|
| $ | 2,040 |
|
Operating activities - discontinued operations |
| $ | — |
|
| $ | (360 | ) |
Operating activities |
| $ | 5,870 |
|
| $ | 1,680 |
|
Investing activities |
| $ | (5,282 | ) |
| $ | (9,264 | ) |
Financing activities |
| $ | (4,384 | ) |
| $ | 8,877 |
|
Net (decrease) increase in cash |
| $ | (3,796 | ) |
| $ | 1,293 |
|
|
| Years ended December 31, |
| |||||||||
(in thousands) |
| 2017 |
|
| 2016 |
|
| 2015 |
| |||
Net cash provided by (used in): |
|
|
|
|
|
|
|
|
|
|
|
|
Operating activities – continuing operations |
| $ | (20,792 | ) |
| $ | (6,056 | ) |
| $ | (3,787 | ) |
Operating activities – discontinued operations |
|
| — |
|
|
| (9,326 | ) |
|
| 11,388 |
|
Operating activities |
|
| (20,792 | ) |
|
| (15,382 | ) |
|
| 7,601 |
|
Investing activities – continuing operations |
|
| (13,011 | ) |
|
| 145,533 |
|
|
| (6,380 | ) |
Investing activities—discontinued operations |
|
| — |
|
|
| (319 | ) |
|
| (2,955 | ) |
Investing activities |
|
| (13,011 | ) |
|
| 145,214 |
|
|
| (9,335 | ) |
Financing activities |
|
| 12,554 |
|
|
| (77,071 | ) |
|
| (326 | ) |
Effects of exchange rates on cash |
|
| — |
|
|
| — |
|
|
| (495 | ) |
Net (decrease) increase in cash |
| $ | (21,249 | ) |
| $ | 52,761 |
|
| $ | (2,555 | ) |
20172023 Compared to 20162022
Continuing Operations
Operating activities. Cash flows from operations increased $4.2 million during 2023 compared to 2022. This increase was primarily driven by improvements in working capital driven by several factors including timing of payments to vendors and an increase in direct membership subscriptions.
27
Investing activities. Cash flow used in continuing operations increased $14.7investing activities decreased $4.0 million during 20172023 compared to the same period in 2016. The increase was primarily2022 due to increased investmentimpacts from investments and planned decrease in customer acquisition efforts to accelerate our annual subscriber growth rate from 52% in 2016 to 80% in 2017.capital expenditures.
Investing activities. Cash flow provided by investing activities – continuing operations decreased $158.5 million during 2017 compared to the same period in 2016. The decrease is due to the $162.1 million net proceeds from the sale of the Gaiam Brand business including Natural Habitat in 2016, offset by a $6.0 million increase in our investment in our media library.
Financing activities. Cash flows from financing activities increased $89.6decreased $13.3 million during 20172023 compared to the same period2022 primarily related to debt repayments in 2016, primarily due to the use of $77.4 million to repurchase 9,636,848 shares of Class A common stock and 842,114 stock options in the tender offer completed in July 20162023. Debt repayments were partially offset by $12.5 million of borrowings under a revolving line of credit secured by our real estate entered into in December 2017.
2016 Compared to 2015
Continuing Operations
Operating activities. Cash flow used by continuing operations increased $2.3 million during 2016 compared to the same period in 2015. The increase was primarily due to operating losses and growth in our deferred revenue balances in conjunction with our subscriber growth.
Investing activities. Cash flow used by investing activities – continuing operations increased $151.9 million during 2016 compared to the same period in 2015. The increase is due to the $162.1 million net proceeds from the saleissuance of the Gaiam Brand business including Natural Habitat, offset by investments in our media library and other investments.
Financing activities. Cash flow from financing activities decreased $76.7 million during 2016 compared to the same period in 2015, primarily due to the use of $77.4 million to repurchase 9,636,848 shares of Class A common stock and 842,114 stock options in the tender offer completed in July 2016.
Operating activities. Cash flow from discontinued operations decreased $20.7 million during 2016 compared to the same period in 2015. The decrease was primarily due to the Gaiam Brand business only operating the first 6 months of 2016, operating loses, and longer collection cycles on accounts receivable in 2016.
Investing activities. Cash used in investing activities – discontinued operations decreased $2.6 million during 2016 compared to the same period on 2015. The decrease was due to decreased investment activity prior to the Gaiam Brand business sale.
Contractual Obligations
Thestock. We had no outstanding balance of the revolving line of creditborrowings at December 31, 2017 was fully repaid in January 2018.2023.
Off-Balance Sheet ArrangementsItem 7A. Quantitative and Qualitative Disclosures About Market Risk
We doAs a smaller reporting company, we are not participate in transactions that generate relationships with unconsolidated entities or financial partnerships, such as special purpose entities or variable interest entities, which have been established forrequired to provide the purpose of facilitating off-balance sheet arrangements or other limited purposes.information required by this Item.
We have no material market risk exposure as of December 31, 2017.Item 8. Financial Statements and Supplementary Data
Index to Consolidated Financial Statements
Report of Independent Registered Public Accounting Firm (PCAOB ID: 1596) |
| |
Report of Independent Registered Public Accounting Firm ( PCAOB ID: 32) | 32 | |
Gaia, Inc. Consolidated Financial Statements: | ||
| ||
| ||
| ||
| ||
|
29
REPORT OF INDEPENDENT REGISTEREDREGISTERED PUBLIC ACCOUNTING FIRM
To the Shareholders and Board of Directors
of Gaia, Inc.
Louisville, Colorado
OPINIONS ON THE CONSOLIDATED FINANCIAL STATEMENTS AND INTERNAL CONTROL OVER FINANCIAL REPORTINGOpinion on the Consolidated Financial Statements
We have audited the accompanying consolidated balance sheetssheet of Gaia, Inc. (the "Company"“Company”) as of December 31, 2017 and 2016,2023, and the related consolidated statements of operations, comprehensive income (loss), changes in equity, and cash flows, for eachthe year in the three‑year periodthen ended, December 31, 2017, and the related notes (collectively referred to as the "financial statements"“consolidated financial statements”). In our opinion, the consolidated financial statements present fairly, in all material respects, the consolidated financial position of the Company as of December 31, 2023, and the results of its operations and its cash flows as of and for the year ended December 31, 2023, in conformity with accounting principles generally accepted in the United States of America.
Basis for Opinion
These consolidated financial statements are the responsibility of the Company’s management. Our responsibility is to express an opinion on the Company’s consolidated financial statements based on our audit. We are a public accounting firm registered with the Public Company Accounting Oversight Board (United States) (“PCAOB”) and are required to be independent with respect to the Company in accordance with the U.S. federal securities laws and the applicable rules and regulations of the U.S. Securities and Exchange Commission and the PCAOB.
We conducted our audit in accordance with the standards of the PCAOB. Those standards require that we plan and perform the audit to obtain reasonable assurance about whether the consolidated financial statements are free of material misstatement, whether due to error or fraud. The Company is not required to have, also audited the Company'snor were we engaged to perform, an audit of its internal control over financial reporting. As part of our audit, we are required to obtain an understanding of internal control over financial reporting, but not for the purpose of expressing an opinion on the effectiveness of the Company’s internal control over financial reporting. Accordingly, we express no such opinion.
Our audit included performing procedures to assess the risks of material misstatement of the consolidated financial statements, whether due to error or fraud, and performing procedures that respond to those risks. Such procedures included examining, on a test basis, evidence regarding the amounts and disclosures in the consolidated financial statements. Our audit also included evaluating the accounting principles used and significant estimates made by management, as well as evaluating the overall presentation of the consolidated financial statements. We believe that our audit provides a reasonable basis for our opinion.
Critical Audit Matter
The critical audit matter communicated below is a matter arising from the current period audit of the consolidated financial statements that were communicated or required to be communicated to the audit committee and that: (1) relate to accounts or disclosures that are material to the consolidated financial statements and (2) involved our especially challenging, subjective, or complex judgments. The communication of critical audit matters does not alter in any way our opinion on the consolidated financial statements, taken as a whole, and we are not, by communicating the critical audit matter below, providing separate opinions on the critical audit matter or on the accounts or disclosures to which they relate.
Restatement of Previously Issued Consolidated Financial Statements - Refer to Note 3 in the Consolidated Financial Statements
During the audit of the year ended December 31, 2023 consolidated financial statements, we identified material misstatements that impacted the prior year consolidated financial statements, which caused the need for them to be restated by the Company. These misstatements also impacted the current year consolidated financial statements to ensure that the consolidated financial statements were presented fairly in all material respects. The material
30
misstatements identified that were corrected through the restatement of the consolidated financial statements are discussed within Note 3 of the consolidated financial statements.
We identified the Restatement of Previously Issued Consolidated Financial Statements as a critical audit matter because of the complexity of the items that are being restated, as well as the judgment used in determining the misstatements are quantitatively and qualitatively material to the users of the consolidated financial statements.
How the Critical Audit Matter Was Addressedin the Audit
Our audit procedures related to the misstatements identified resulting in the restatement of the prior year consolidated financial statements, as well as the impact to account balances, class of transactions, and disclosures impacting the current year consolidated financial statements, which include the following, among others:
/s/ Frank, Rimerman + Co. LLP
We have served as the Company’s auditor since 2023.
San Francisco, California
March 29, 2024
31
REPORT OF INDEPENDENT REGISTERED PUBLIC ACCOUNTING FIRM
To the Board of Directors and Shareholders of Gaia, Inc.:
Opinion on the Financial Statements
We have audited the accompanying consolidated balance sheet of Gaia, Inc. (“the Company”) as of December 31, 2017, based on2022, and the criteria establishedrelated consolidated statements of operations, changes in Internal Control ‑ Integrated Framework: (2013) issued byequity, and cash flows for the Committee of Sponsoring Organizations ofyear then ended December 31, 2022, and the Treadway Commission ("COSO"related notes (collectively referred to as the “consolidated financial statements”).
In our opinion, the consolidated financial statements referred to above present fairly, in all material respects, the financial position of the Company as of December 31, 2017 and 2016,2022, and the results of itstheir operations and itstheir cash flows for eachthe year in the three‑year period ended December 31, 2017,2022, in conformity with accounting principles generally accepted in the United States of America. Also,
Restatement of Previously Issued Financial Statements
As discussed in our opinion,Note 3 to the consolidated financial statements, the Company maintained, in all material respects, effective internal control overhas restated its consolidated financial reportingstatements as of and for the year ended December 31, 2017, based on criteria established in Internal Control ‑ Integrated Framework: (2013) issued by COSO.2022 to correct certain misstatements.
BASIS FOR OPINIONS
The Company's management is responsibleBasis for theseOpinion
These consolidated financial statements for maintaining effective internal control over financial reporting, and for its assessmentare the responsibility of the effectiveness of internal control over financial reporting, included in the accompanying Management's Report on Internal Control over Financial Reporting.Company's management. Our responsibility is to express an opinion on the Company's consolidated financial statements and an opinion on the Company's internal control over financial reporting based on our audits.audit. We are a public accounting firm registered with the Public Company Accounting Oversight Board (United States) ("PCAOB"(“PCAOB”) and are required to be independent with respect to the Company in accordance with the U.S. federal securities laws and the applicable rules and regulations of the Securities and Exchange Commission and the PCAOB.
We conducted our auditsaudit in accordance with the standards of the PCAOB. Those standards require that we plan and perform the auditsaudit to obtain reasonable assurance about whether the consolidated financial statements are free of material misstatement, whether due to error or fraud, and whether effective internal control over financial reporting was maintained in all material respects.fraud.
Our auditsaudit of the consolidated financial statements included performing procedures to assess the risks of material misstatement of the consolidated financial statements, whether due to error or fraud, and performing procedures that respond to those risks. Such procedures included examining, on a test basis, evidence regarding the amounts and disclosures in the consolidated financial statements. Our auditsaudit also included evaluating the accounting principles used and significant estimates made by management, as well as evaluating the overall presentation of the consolidated financial statements. Our audit of internal control over financial reporting included obtaining an understanding of internal control over financial reporting, assessing the risk that a material weakness exists, and testing and evaluating the design and operating effectiveness of internal control based on the assessed risk. Our audits also included performing such other procedures as we considered necessary in the circumstances. We believe that our audits provideaudit provides a reasonable basis for our opinions.opinion.
DEFINITION AND LIMITATIONS OF INTERNAL CONTROL OVER FINANCIAL REPORTING
A company's internal control over financial reporting is a process designed
/s/ Armanino LLP
Dallas, Texas
March 6, 2023, except for the effects of the restatement discussed in Note 3 to provide reasonable assurance regarding the reliability of financial reporting and the preparation ofconsolidated financial statements, for external purposes in accordance with generally accepted accounting principles. A company's internal control over financial reporting includes those policies and procedures that (i) pertainas to which the maintenance of records that, in reasonable detail, accurately and fairly reflect the transactions and dispositions of the assets of the company; (ii) provide reasonable assurance that transactions are recorded as necessary to permit preparation of financial statements in accordance with generally accepted accounting principles, and that receipts and expenditures of the company are being made only in accordance with authorizations of management and directors of the company; and (iii) provide reasonable assurance regarding prevention or timely detection of unauthorized acquisition, use, or disposition of the company's assets that could have a material effect on the financial statements.date is March 29, 2024
Because of its inherent limitations, internal control over financial reporting may not prevent or detect misstatements. Also, projections of any evaluation of effectiveness to future periods are subject to the risk that controls may become inadequate because of changes in conditions, or that the degree of compliance with the policies or procedures may deteriorate.
EKS&H LLLP
February 26, 2018
Denver, Colorado
We have servedbegan serving as the Company's auditor since 2004.Company’s auditors in 2021. In 2023, we became the predecessor auditor.
32
|
| As of December 31, |
|
| As of December 31, |
| ||||||||||
(in thousands, except share and per share data) |
| 2017 |
|
| 2016 |
|
| 2023 |
|
| 2022 (As restated) |
| ||||
ASSETS |
|
|
|
|
|
|
|
|
|
|
|
|
|
| ||
Current assets: |
|
|
|
|
|
|
|
|
|
|
|
|
|
| ||
Cash |
| $ | 32,778 |
|
| $ | 54,027 |
| ||||||||
Cash and cash equivalents |
| $ | 7,766 |
|
| $ | 11,562 |
| ||||||||
Accounts receivable |
|
| 1,055 |
|
|
| 554 |
|
|
| 4,111 |
|
|
| 2,955 |
|
Other receivables |
|
| 2,191 |
|
|
| 148 |
| ||||||||
Prepaid expenses and other current assets |
|
| 3,082 |
|
|
| 1,303 |
|
|
| 2,015 |
|
|
| 2,508 |
|
Total current assets |
|
| 36,915 |
|
|
| 55,884 |
|
|
| 16,083 |
|
|
| 17,173 |
|
Building and land, net |
|
| 17,028 |
|
|
| 16,896 |
| ||||||||
Media library, software and equipment, net |
|
| 20,387 |
|
|
| 12,861 |
| ||||||||
Media library, net |
|
| 40,125 |
|
|
| 40,075 |
| ||||||||
Operating right-of-use asset, net |
|
| 6,288 |
|
|
| 7,093 |
| ||||||||
Property and equipment, net |
|
| 26,303 |
|
|
| 25,209 |
| ||||||||
Equity method investment |
|
| 6,374 |
|
|
| 6,875 |
| ||||||||
Investments and other assets, net |
|
| 3,157 |
|
|
| 6,810 |
| ||||||||
Goodwill |
|
| 10,609 |
|
|
| 10,609 |
|
|
| 31,943 |
|
|
| 31,943 |
|
Investments and other assets |
|
| 12,040 |
|
|
| 10,946 |
| ||||||||
Total assets |
| $ | 96,979 |
|
| $ | 107,196 |
|
| $ | 130,273 |
|
| $ | 135,178 |
|
LIABILITIES AND EQUITY |
|
|
|
|
|
|
|
|
|
|
|
|
|
| ||
Current liabilities: |
|
|
|
|
|
|
|
|
|
|
|
|
|
| ||
Accounts payable, accrued and other liabilities |
| $ | 16,848 |
|
| $ | 6,672 |
| ||||||||
Accounts payable |
| $ | 12,038 |
|
| $ | 7,382 |
| ||||||||
Accrued and other liabilities |
|
| 2,599 |
|
|
| 4,973 |
| ||||||||
Short-term debt |
|
| 155 |
|
|
| 149 |
| ||||||||
Operating lease liability, current portion |
|
| 780 |
|
|
| 745 |
| ||||||||
Deferred revenue |
|
| 3,316 |
|
|
| 2,434 |
|
|
| 15,861 |
|
|
| 14,124 |
|
Total current liabilities |
|
| 20,164 |
|
|
| 9,106 |
|
|
| 31,433 |
|
|
| 27,373 |
|
Deferred taxes |
|
| 663 |
|
|
| 553 |
| ||||||||
Long-term debt, net |
|
| 5,801 |
|
|
| 14,958 |
| ||||||||
Operating lease liability, net of current portion |
|
| 5,708 |
|
|
| 6,489 |
| ||||||||
Deferred taxes, net |
|
| 551 |
|
|
| 499 |
| ||||||||
Total liabilities |
|
| 43,493 |
|
|
| 49,319 |
| ||||||||
Commitments and contingencies (Note 10) |
|
|
|
|
|
| ||||||||||
Equity: |
|
|
|
|
|
|
|
|
|
|
|
|
|
| ||
Gaia, Inc. shareholders’ equity: |
|
|
|
|
|
|
|
|
|
|
|
|
|
| ||
Class A common stock, $.0001 par value, 150,000,000 shares authorized, 9,769,961 and 9,752,531 shares issued and outstanding at December 31, 2017 and 2016, respectively |
|
| 1 |
|
|
| 1 |
| ||||||||
Class B common stock, $.0001 par value, 50,000,000 shares authorized, 5,400,000 shares issued and outstanding at December 31, 2017 and 2016, respectively |
|
| 1 |
|
|
| 1 |
| ||||||||
Class A common stock, $0.0001 par value, 150,000,000 shares |
|
| 2 |
|
|
| 1 |
| ||||||||
Class B common stock, $0.0001 par value, 50,000,000 shares |
|
| 1 |
|
|
| 1 |
| ||||||||
Additional paid-in capital |
|
| 100,560 |
|
|
| 98,504 |
|
|
| 170,695 |
|
|
| 164,180 |
|
Accumulated deficit |
|
| (24,410 | ) |
|
| (969 | ) |
|
| (85,195 | ) |
|
| (79,393 | ) |
Total Gaia, Inc. shareholders' equity |
|
| 85,503 |
|
|
| 84,789 |
| ||||||||
Noncontrolling interests |
|
| 1,277 |
|
|
| 1,070 |
| ||||||||
Total equity |
|
| 76,152 |
|
|
| 97,537 |
|
|
| 86,780 |
|
|
| 85,859 |
|
Total liabilities and equity |
| $ | 96,979 |
|
| $ | 107,196 |
|
| $ | 130,273 |
|
| $ | 135,178 |
|
See accompanying Notes to Consolidated Financial Statements.
33
Consolidated Statements of Operations
|
| Years Ended December 31, |
| |||||||||
(in thousands, except per share data) |
| 2017 |
|
| 2016 |
|
| 2015 |
| |||
Net revenues |
|
|
|
|
|
|
|
|
|
|
|
|
Streaming |
| $ | 26,220 |
|
| $ | 14,736 |
|
| $ | 10,752 |
|
DVD subscription and other |
|
| 2,070 |
|
|
| 2,511 |
|
|
| 2,707 |
|
Total net revenues |
|
| 28,290 |
|
|
| 17,247 |
|
|
| 13,459 |
|
Cost of revenues |
|
|
|
|
|
|
|
|
|
|
|
|
Streaming |
|
| 3,602 |
|
|
| 2,567 |
|
|
| 2,262 |
|
DVD subscription and other |
|
| 325 |
|
|
| 275 |
|
|
| 335 |
|
Total cost of revenues |
|
| 3,927 |
|
|
| 2,842 |
|
|
| 2,597 |
|
Gross profit |
|
| 24,363 |
|
|
| 14,405 |
|
|
| 10,862 |
|
Expenses: |
|
|
|
|
|
|
|
|
|
|
|
|
Selling and operating |
|
| 43,979 |
|
|
| 24,960 |
|
|
| 13,079 |
|
Corporate, general and administration |
|
| 5,525 |
|
|
| 6,020 |
|
|
| 6,494 |
|
Total operating expenses |
|
| 49,504 |
|
|
| 30,980 |
|
|
| 19,573 |
|
Loss from operations |
|
| (25,141 | ) |
|
| (16,575 | ) |
|
| (8,711 | ) |
Interest and other income (expense), net |
|
| 515 |
|
|
| (351 | ) |
|
| (311 | ) |
Loss before income taxes |
|
| (24,626 | ) |
|
| (16,926 | ) |
|
| (9,022 | ) |
Income tax benefit |
|
| (925 | ) |
|
| (6,144 | ) |
|
| (3 | ) |
Loss from continuing operations |
|
| (23,701 | ) |
|
| (10,782 | ) |
|
| (9,019 | ) |
Income (loss) from discontinued operations, net of tax |
|
| 429 |
|
|
| 97,848 |
|
|
| (2,687 | ) |
Net income (loss) |
| $ | (23,272 | ) |
| $ | 87,066 |
|
| $ | (11,706 | ) |
Income (loss) per share—basic and diluted: |
|
|
|
|
|
|
|
|
|
|
|
|
Continuing operations |
| $ | (1.57 | ) |
| $ | (0.54 | ) |
| $ | (0.37 | ) |
Discontinued operations |
|
| 0.03 |
|
|
| 4.93 |
|
|
| (0.11 | ) |
Basic and diluted net income (loss) per share |
| $ | (1.54 | ) |
| $ | 4.39 |
|
| $ | (0.48 | ) |
Weighted-average shares outstanding: |
|
|
|
|
|
|
|
|
|
|
|
|
Basic and diluted |
|
| 15,160 |
|
|
| 19,850 |
|
|
| 24,510 |
|
|
| Years Ended December 31, |
| |||||
(in thousands, except per share data) |
| 2023 |
|
| 2022 (As restated) |
| ||
Revenues, net |
| $ | 80,423 |
|
| $ | 82,035 |
|
Cost of revenues |
|
| 11,629 |
|
|
| 10,915 |
|
Gross profit |
|
| 68,794 |
|
|
| 71,120 |
|
Operating Expenses: |
|
|
|
|
|
| ||
Selling and operating |
|
| 67,156 |
|
|
| 64,155 |
|
Corporate, general and administration |
|
| 6,205 |
|
|
| 7,181 |
|
Acquisition costs |
|
| — |
|
|
| 49 |
|
Total operating expenses |
|
| 73,361 |
|
|
| 71,385 |
|
Loss from operations |
|
| (4,567 | ) |
|
| (265 | ) |
Equity method investment loss |
|
| (501 | ) |
|
| (511 | ) |
Interest and other expense, net |
|
| (467 | ) |
|
| (257 | ) |
SEC settlement |
|
| — |
|
|
| (2,000 | ) |
Loss before income taxes |
|
| (5,535 | ) |
|
| (3,033 | ) |
Provision for income taxes |
|
| 60 |
|
|
| 202 |
|
Loss from continuing operations |
|
| (5,595 | ) |
|
| (3,235 | ) |
Loss from discontinued operations |
|
| — |
|
|
| (360 | ) |
Net loss |
| $ | (5,595 | ) |
| $ | (3,595 | ) |
Net income attributable to noncontrolling interests |
| $ | 207 |
|
| $ | 296 |
|
Net loss attributable to common shareholders |
| $ | (5,802 | ) |
| $ | (3,891 | ) |
Loss per share: |
|
|
|
|
|
| ||
Basic |
|
|
|
|
|
| ||
Continuing operations (attributable to common shareholders) |
| $ | (0.27 | ) |
| $ | (0.17 | ) |
Discontinued operations |
| $ | — |
|
| $ | (0.02 | ) |
Basic loss per share |
| $ | (0.27 | ) |
| $ | (0.19 | ) |
Diluted |
|
|
|
|
|
| ||
Continuing operations (attributable to common shareholders) |
| $ | (0.27 | ) |
| $ | (0.17 | ) |
Discontinued operations |
| $ | — |
|
| $ | (0.02 | ) |
Diluted loss per share |
| $ | (0.27 | ) |
| $ | (0.19 | ) |
|
|
|
|
|
|
| ||
Weighted-average shares outstanding: |
|
|
|
|
|
| ||
Basic |
|
| 21,501 |
|
|
| 20,716 |
|
Diluted |
|
| 21,501 |
|
|
| 20,716 |
|
See accompanying Notes to Consolidated Financial Statements.
34
Consolidated StatementStatements of Changes in Equity
|
|
|
|
|
| Gaia, Inc. Shareholders |
|
|
|
|
| |||||||||||||||||
(in thousands, except shares) |
| Total Equity |
|
| Accumulated Deficit |
|
| Accumulated Other Comprehensive Loss |
|
| Common Stock Amount |
|
| Additional Paid-in Capital |
|
| Common Stock Shares |
|
| Noncontrolling Interest |
| |||||||
Balance at December 31, 2014 |
| $ | 99,559 |
|
| $ | (76,329 | ) |
| $ | (200 | ) |
| $ | 3 |
|
| $ | 171,315 |
|
|
| 24,484,958 |
|
| $ | 4,770 |
|
Issuance of Gaia, Inc. common stock and share-based compensation |
|
| 1,056 |
|
|
| — |
|
|
| — |
|
|
| — |
|
|
| 1,056 |
|
|
| 45,723 |
|
|
| — |
|
Subsidiary’s dividend to noncontrolling interest |
|
| (486 | ) |
|
| — |
|
|
| — |
|
|
| — |
|
|
| — |
|
|
| — |
|
|
| (486 | ) |
Comprehensive loss |
|
| (11,336 | ) |
|
| (11,706 | ) |
|
| (199 | ) |
|
| — |
|
|
| — |
|
|
| — |
|
|
| 569 |
|
Balance at December 31, 2015 |
| $ | 88,793 |
|
| $ | (88,035 | ) |
| $ | (399 | ) |
| $ | 3 |
|
| $ | 172,371 |
|
|
| 24,530,681 |
|
| $ | 4,853 |
|
Issuance of Gaia, Inc. common stock for stock option exercises, share-based compensation and charitable contribution, net of tax |
|
| 2,300 |
|
|
| — |
|
|
| — |
|
|
| — |
|
|
| 2,300 |
|
|
| 258,698 |
|
|
| — |
|
Repurchase of shares |
|
| (76,168 | ) |
|
| — |
|
|
| — |
|
|
| (1 | ) |
|
| (76,167 | ) |
|
| (9,636,848 | ) |
|
| — |
|
Dividends paid to noncontrolling interest |
|
| (1,944 | ) |
|
| — |
|
|
| — |
|
|
| — |
|
|
| — |
|
|
| — |
|
|
| (1,944 | ) |
Elimination of noncontrolling interest and accumulated other comprehensive loss resulting from the sale of Gaiam Brand segment |
|
| (2,510 | ) |
|
| — |
|
|
| 399 |
|
|
| — |
|
|
| — |
|
|
| — |
|
|
| (2,909 | ) |
Net income |
|
| 87,066 |
|
|
| 87,066 |
|
|
| — |
|
|
| — |
|
|
| — |
|
|
| — |
|
|
| — |
|
Balance at December 31, 2016 |
| $ | 97,537 |
|
| $ | (969 | ) |
| $ | — |
|
| $ | 2 |
|
| $ | 98,504 |
|
|
| 15,152,531 |
|
| $ | — |
|
Cumulative effect adjustment of ASU 2016-09 |
|
| 77 |
|
|
| (169 | ) |
|
| — |
|
|
| — |
|
|
| 246 |
|
|
| — |
|
|
| — |
|
Issuance of Gaia, Inc. common stock for stock option exercises and share-based compensation, net of tax |
|
| 1,810 |
|
|
| — |
|
|
| — |
|
|
| — |
|
|
| 1,810 |
|
|
| 17,430 |
|
|
| — |
|
Net loss |
|
| (23,272 | ) |
|
| (23,272 | ) |
|
| — |
|
|
| — |
|
|
| — |
|
|
| — |
|
|
| — |
|
Balance at December 31, 2017 |
| $ | 76,152 |
|
| $ | (24,410 | ) |
| $ | — |
|
| $ | 2 |
|
| $ | 100,560 |
|
|
| 15,169,961 |
|
| $ | — |
|
(in thousands, except shares) |
| Common |
|
| Accumulated |
|
| Common |
|
| Additional |
|
| Non-controlling interests |
|
| Total |
| ||||||
Balance at December 31, 2021 (As restated) |
|
| 20,461,337 |
|
| $ | (75,502 | ) |
| $ | 2 |
|
| $ | 162,316 |
|
| $ | 774 |
|
| $ | 87,590 |
|
Issuance of Gaia, Inc. common stock for RSU releases |
|
| 332,889 |
|
|
| — |
|
|
| — |
|
|
| — |
|
|
| — |
|
|
| — |
|
Issuance of Gaia, Inc. common stock for employee stock purchase plan |
|
| 11,960 |
|
|
| — |
|
|
| — |
|
|
| 43 |
|
|
| — |
|
|
| 43 |
|
Share-based compensation |
|
| — |
|
|
| — |
|
|
| — |
|
|
| 1,821 |
|
|
| — |
|
|
| 1,821 |
|
Net income (loss) |
|
| — |
|
|
| (3,891 | ) |
|
| — |
|
|
| — |
|
|
| 296 |
|
|
| (3,595 | ) |
Balance at December 31, 2022 (As restated) |
|
| 20,806,186 |
|
| $ | (79,393 | ) |
| $ | 2 |
|
| $ | 164,180 |
|
| $ | 1,070 |
|
| $ | 85,859 |
|
|
|
|
|
|
|
|
|
|
|
|
|
|
|
|
|
|
|
| ||||||
Issuance of Gaia, Inc. common stock for employee stock purchase plan |
|
| 21,795 |
|
|
| — |
|
|
| — |
|
|
| 43 |
|
|
| — |
|
|
| 43 |
|
Issuance of Gaia, Inc. common stock for RSU releases |
|
| 53,464 |
|
|
| — |
|
|
| — |
|
|
| — |
|
|
| — |
|
|
| — |
|
Issuance of Gaia, Inc. common stock in public offering |
|
| 2,058,754 |
|
|
| — |
|
|
| 1 |
|
|
| 4,913 |
|
|
| — |
|
|
| 4,914 |
|
Issuance of Gaia, Inc. common stock for media library acquisition |
|
| 272,980 |
|
|
| — |
|
|
| — |
|
|
| 669 |
|
|
| — |
|
|
| 669 |
|
Purchase of treasury stock |
|
| (64,805 | ) |
|
| — |
|
|
| — |
|
|
| (169 | ) |
|
| — |
|
|
| (169 | ) |
Share-based compensation |
|
| — |
|
|
| — |
|
|
| — |
|
|
| 1,059 |
|
|
| — |
|
|
| 1,059 |
|
Net income (loss) |
|
| — |
|
|
| (5,802 | ) |
|
| — |
|
|
| — |
|
|
| 207 |
|
|
| (5,595 | ) |
Balance at December 31, 2023 |
|
| 23,148,374 |
|
| $ | (85,195 | ) |
| $ | 3 |
|
| $ | 170,695 |
|
| $ | 1,277 |
|
| $ | 86,780 |
|
See accompanying Notes to Consolidated Financial Statements.
35
Consolidated Statements of Cash Flows
|
| Years ended December 31, |
| |||||
(in thousands) |
| 2023 |
|
| 2022 (As restated) |
| ||
Cash flows from operating activities: |
|
|
|
|
|
| ||
Net loss |
| $ | (5,595 | ) |
| $ | (3,595 | ) |
Income from discontinued operations |
|
| — |
|
|
| 360 |
|
Loss from continuing operations |
|
| (5,595 | ) |
|
| (3,235 | ) |
Adjustments to reconcile net loss to net cash provided by operating activities: |
|
|
|
|
|
| ||
Additions to media library |
|
| (8,621 | ) |
|
| (9,840 | ) |
Media library amortization |
|
| 9,208 |
|
|
| 8,317 |
|
Depreciation and amortization |
|
| 7,833 |
|
|
| 7,621 |
|
Noncash operating lease expense |
|
| 1,069 |
|
|
| 1,072 |
|
Share-based compensation expense |
|
| 1,059 |
|
|
| 1,821 |
|
Equity method investment loss |
|
| 501 |
|
|
| 511 |
|
Provision for income taxes |
|
| 60 |
|
|
| 202 |
|
Changes in operating assets and liabilities: |
|
|
|
|
|
| ||
Accounts receivable |
|
| (1,156 | ) |
|
| (259 | ) |
Other receivables |
|
| (2,043 | ) |
|
| 32 |
|
Prepaid expenses and other current assets |
|
| 525 |
|
|
| (681 | ) |
Accounts payable |
|
| 4,656 |
|
|
| (1,697 | ) |
Accrued and other liabilities |
|
| (3,363 | ) |
|
| (1,101 | ) |
Deferred revenue |
|
| 1,737 |
|
|
| (723 | ) |
Net cash provided by operating activities - continuing operations |
|
| 5,870 |
|
|
| 2,040 |
|
Net cash used in operating activities - discontinued operations |
|
| — |
|
|
| (360 | ) |
Net cash provided by operating activities |
|
| 5,870 |
|
|
| 1,680 |
|
Cash flows from investing activities: |
|
|
|
|
|
| ||
Acquisitions, net of cash acquired, and purchase of intangible assets |
|
| (8 | ) |
|
| (847 | ) |
Additions to property and equipment |
|
| (5,274 | ) |
|
| (8,417 | ) |
Net cash used in investing activities |
|
| (5,282 | ) |
|
| (9,264 | ) |
Cash flows from financing activities: |
|
|
|
|
|
| ||
Proceeds from short-term borrowings |
|
| 28,900 |
|
|
| 16,500 |
|
Proceeds from the issuance of common stock |
|
| 4,957 |
|
|
| 43 |
|
Purchase of treasury stock |
|
| (169 | ) |
|
| — |
|
Repayment of debt |
|
| (38,072 | ) |
|
| (7,666 | ) |
Net cash (used in) provided by financing activities |
|
| (4,384 | ) |
|
| 8,877 |
|
Net change in cash |
|
| (3,796 | ) |
|
| 1,293 |
|
Cash and cash equivalents, beginning of year |
|
| 11,562 |
|
|
| 10,269 |
|
Cash and cash equivalents, end of year |
| $ | 7,766 |
|
| $ | 11,562 |
|
Supplemental disclosure of cash flow information |
|
|
|
|
|
| ||
Cash paid for interest |
| $ | 481 |
|
| $ | 301 |
|
Cash paid for income taxes |
| $ | — |
|
| $ | 12 |
|
|
|
|
|
|
|
| ||
Supplemental Disclosure of Non-Cash Investing and Financing Activities |
|
|
|
|
|
| ||
Value of shares issued for acquisition and business combination |
| $ | 669 |
|
| $ | - |
|
|
| Years ended December 31, |
| |||||||||
(in thousands) |
| 2017 |
|
| 2016 |
|
| 2015 |
| |||
Operating activities: |
|
|
|
|
|
|
|
|
|
|
|
|
Net income (loss) |
| $ | (23,272 | ) |
| $ | 87,066 |
|
| $ | (11,706 | ) |
(Income) loss from discontinued operations |
|
| (429 | ) |
|
| (97,848 | ) |
|
| 2,687 |
|
Net loss from continuing operations |
|
| (23,701 | ) |
|
| (10,782 | ) |
|
| (9,019 | ) |
Adjustments to reconcile net loss from continuing operations to net cash used in operating activities: |
|
|
|
|
|
|
|
|
|
|
|
|
Depreciation and amortization |
|
| 4,903 |
|
|
| 3,684 |
|
|
| 3,268 |
|
Loss on remeasurement of foreign currency |
|
| — |
|
|
| — |
|
|
| 408 |
|
Share-based compensation expense |
|
| 1,833 |
|
|
| 674 |
|
|
| 339 |
|
Changes in operating assets and liabilities: |
|
|
|
|
|
|
|
|
|
|
|
|
Accounts receivable, net |
|
| (501 | ) |
|
| (161 | ) |
|
| (236 | ) |
Prepaid expenses and other assets |
|
| (2,423 | ) |
|
| (279 | ) |
|
| 395 |
|
Accounts payable, accrued liabilities, and deferred taxes |
|
| (1,785 | ) |
|
| (172 | ) |
|
| 421 |
|
Deferred revenue |
|
| 882 |
|
|
| 980 |
|
|
| 637 |
|
Net cash used in operating activities – continuing operations |
|
| (20,792 | ) |
|
| (6,056 | ) |
|
| (3,787 | ) |
Net cash provided by (used in) operating activities – discontinued operations |
|
| — |
|
|
| (9,326 | ) |
|
| 11,388 |
|
Net cash provided by (used in) operating activities |
|
| (20,792 | ) |
|
| (15,382 | ) |
|
| 7,601 |
|
Investing activities: |
|
|
|
|
|
|
|
|
|
|
|
|
Additions to property, equipment and media library |
|
| (12,511 | ) |
|
| (6,594 | ) |
|
| (6,380 | ) |
Additions to intangible assets |
|
| (500 | ) |
|
| — |
|
|
| — |
|
Purchase of investment |
|
| — |
|
|
| (10,000 | ) |
|
| — |
|
Proceeds from the sale of Gaiam Brand business, net |
|
| — |
|
|
| 162,127 |
|
|
| — |
|
Net cash provided by (used in) investing activities—continuing operations |
|
| (13,011 | ) |
|
| 145,533 |
|
|
| (6,380 | ) |
Net cash used in investing activities—discontinued operations |
|
| — |
|
|
| (319 | ) |
|
| (2,955 | ) |
Net cash provided by (used in) investing activities |
|
| (13,011 | ) |
|
| 145,214 |
|
|
| (9,335 | ) |
Financing activities: |
|
|
|
|
|
|
|
|
|
|
|
|
Net proceeds from issuance of stock |
|
| 54 |
|
|
| 1,041 |
|
|
| 160 |
|
Repurchases of stock |
|
| — |
|
|
| (76,168 | ) |
|
| — |
|
Drawdowns on line of credit |
|
| 12,500 |
|
|
| 3,000 |
|
|
| — |
|
Repayments on line of credit |
|
| — |
|
|
| (3,000 | ) |
|
| — |
|
Dividends paid to noncontrolling interest |
|
| — |
|
|
| (1,944 | ) |
|
| (486 | ) |
Net cash (used in) provided by financing activities |
|
| 12,554 |
|
|
| (77,071 | ) |
|
| (326 | ) |
Effect of exchange rates on cash |
|
| — |
|
|
| — |
|
|
| (495 | ) |
Net increase (decrease) in cash |
|
| (21,249 | ) |
|
| 52,761 |
|
|
| (2,555 | ) |
Cash at beginning of year |
|
| 54,027 |
|
|
| 1,266 |
|
|
| 3,821 |
|
Cash at end of year |
| $ | 32,778 |
|
| $ | 54,027 |
|
| $ | 1,266 |
|
Supplemental cash flow information |
|
|
|
|
|
|
|
|
|
|
|
|
Interest paid |
| $ | — |
|
| $ | — |
|
| $ | 4 |
|
Income taxes paid |
| $ | 69 |
|
| $ | 2,430 |
|
| $ | 1,322 |
|
Deferred tax asset impact on APIC |
| $ | 77 |
|
| $ | 763 |
|
| $ | — |
|
See accompanying Notes to Consolidated Financial Statements.
36
Notes to Consolidated Financial Statements
References in this report to “we”, “us”, “our”, “Company” or “Gaia” refer to Gaia, Inc. and its subsidiaries, unless we indicate otherwise.
1. Organization and Nature of Operations and Principles of Consolidation
Gaia, Inc., operates a global digital video subscription service and on-line community that catersstrives to connect a unique and underserved subscribermember base. Our digital content is available to our subscribersmembers on most internet-connected devices anytime, anywhere commercial free. Through our online Gaia subscription service, our customersmembers have unlimited access to a vast library of inspiring films, cutting edge documentaries, interviews, yoga classes, transformation related content, and more – 90% of which is exclusively available to our subscribersmembers for digital streaming. A subscription also allows our subscribersmembers to download and view files from our library without being actively connected to the internet. We were incorporated under the laws of the State of Colorado on July 7, 1988.
2. Summary of Significant Accounting Policies
Basis of Presentation
We have prepared the accompanying consolidated financial statements in accordance with accounting principles generally accepted in the United States of America, or GAAP, and they include our accounts and those of our subsidiaries, over which we exercise control. IntercompanyAll intercompany transactions and balances have been eliminated.eliminated in consolidation.
Cash and Cash Equivalents
Discontinued Operations
During 2016, Gaia sold its 51.4% interest in Natural Habitat, Inc. (“Natural Habitat”) and completed the sale of the Gaiam Brand consumer product business.
Accordingly, the assets and liabilities, operating results, and cash flows for these businesses are presented as discontinued operations, separate from our continuing operations, for all periods presented in these consolidated financial statements and footnotes, unless indicated otherwise. See Note 11 Discontinued Operations.
Prior to the sale of our interest in Natural Habitat, our operations in foreign countries exposed us to market risk associated with foreign currency exchange rate fluctuations between the U.S. dollar and various foreign currencies. We used derivative instruments to manage a portion of our exposure to changes in currency exchange rates due to payments made by our eco-travel subsidiary to tour operators in other countries. Our primary objective for entering into currency derivatives was to reduce the volatility that changes in currency exchange rates had. We did not enter into derivative contracts for trading purposes. With the sale of our interests in Natural Habitat, we no longer use derivative instruments.
Prior to our sale of our interest in Natural Habitat and the Gaiam Brand consumer product business, certain of our subsidiaries were partly owned by others and we accounted for minority shareholders’ ownership through non-controlling interest in our consolidated financial statements. These non-controlling interests were assumed by the new owners of the respective entities. We therefore no longer have any minority shareholders that require non-controlling interests in our consolidated financial statements.
Repurchases
During 2016 we made a tender offer to purchase in cash up to an aggregate of 12.0 million (i) shares of our issued and outstanding Class A common stock at a price of $7.75 per share, or (ii) vested and exercisable options to purchase shares of our Class A common stock at a price equal to $7.75 per option (less the exercise price of the option). A total of 9,636,848 shares and 842,114 options were validly tendered and not withdrawn. We made payments of $74.7 million for the shares and $1.4 million for the options. All repurchased shares were retired and all repurchased options were cancelled.
2. Significant Accounting Policies
Cash
Cash represents on-demand accounts with financial institutions that are denominated in U.S. dollars. We consider investments in financial instruments purchased with an original maturity of 90 days or less to be cash equivalents. We also classify transactions that we expect to settle within several days as cash equivalents.
Concentration of Risk
During the years ended December 31, 2023 and 2022, one third-party platform partner ("Partner") accounted for 15% and 14% of the Company’s revenues, respectively. Additionally, two Partners accounted for 51% and 26% of accounts receivable as of December 31, 2023, respectively and 64% and 16% of accounts receivable as of December 31, 2022, respectively.
Accounts Receivable
Accounts receivable consists primarily of amounts due from Partners who have the billing relationship with the member and collect subscription fees on our behalf. We evaluate the need for an allowance for credit losses based on historical collection trends and changes in transit fromour customer payment processors for customer credit cardpatterns, current and debit card transactions as cash.expected conditions and market trends along with our operating forecasts, concentration, and creditworthiness and determined no allowance was needed at December 31, 2023 and 2022.
Property and Equipment, Net
We state property and equipment at cost less accumulated depreciation and amortization. We include in property and equipment the cost of internal-use software, including software used in connection with our websites. We expense all costs related to the development of internal-use software other than those incurred during the application development stage. We capitalize the costs we incur during the application development stage and amortize them over the estimated useful life of the software, which is typically three years.software. We compute depreciation of property and equipment on the straight-line method over estimated useful lives, generally 3 to 45 years.lives. We amortize leasehold and building improvements over the shorter of the estimated useful lives of the assets or the remaining term of the lease or remaining life of the building, respectively.building. See Note 5 for a description of estimated useful lives. Depreciation expense is included in Sellingselling and operating expense, and Corporate,corporate, general and administration expense in the accompanying consolidated statements of operations.
37
Media Library, Net
Media library represents the lower of unamortized cost or net realizable value of digital media content acquired through asset purchases, capitalized costs to produce our proprietary media content, including salary and overhead costs of our in-house production team, rights obtained through license arrangements and digital media content acquired through asset purchases or business combinations.
We amortize our media library in cost of streamingrevenues on a straight-line basis over the shorter of the license period or the estimated useful life of the titles, which typically ranges from 12 to 90 months. months. The amortization period begins with the first month of availability on our service.
Our media library is reviewed at the film group level for impairment when an event or change in circumstances indicates that the carrying amount of the media library may not be recoverable. Recoverability of the media library is measured by a comparison of the carrying amount of the media libraryfilm group to estimated undiscounteddiscounted future cash flows expected to be generated by the media library.film group. If the carrying amount ofexceeds the media library exceeds its estimated future cash flows, an impairment charge is recognized by the amount by which the carrying value ofexceeds the media library exceeds its fair value.
Goodwill
Goodwill
Goodwill represents the excess of the purchase consideration over the estimated fair value of assets acquired less liabilities assumed in a business acquisition. We have only one reporting unit; therefore, goodwill is assessed at the enterprise level. We review goodwill for impairment annually on December 31.October 1 or more frequently if indicators of impairment are identified. We have the option of first assessing qualitative factors to determine whether events and circumstances indicate that it is more likely than not that the fair value of a goodwill is less than its carrying amount. If it is determined that the estimated fair value of goodwill is more likely than not greater than the carrying amount of goodwill, then the two-stepan impairment test is unnecessary. If it is determined that the two-stepan impairment test is necessary, then for step one, we compare the estimated fair value of goodwill with its carrying amount, including goodwill.amount. If the estimated fair value of goodwill exceeds its carrying amount, we consider the goodwill not impaired. If the carrying amount of goodwill exceeds its estimated fair value, we performwill record an impairment loss for the second step of the goodwill impairment test to measure the amount of impairment loss.difference. We use eitherboth a comparable market approach or a traditional present value methodand an income approach to test for potential impairment. The market approach follows the guideline public company method to establish valuation multiples for comparison. The income approach follows a traditional discounted cash flow model. Primary assumptions for each approach include revenue projections, operating expenses, discount rate, control premium, and terminal growth rate. Projections are dependent on management assumptions, which are partly based on the Company’s historical experience. The results of these approaches are evaluated against the Company’s market capitalization for reasonableness. The process of evaluating the potential impairment of goodwill is highly subjective and requires significant judgment at many points during the analysis. Application of alternative assumptions and definitions could yield significantly different results. During 2017, 20162023 and 2015, 2022, no impairment of goodwill was indicated.
We evaluate the carrying value of long-lived assets held and used, other than goodwill, when events or changes in circumstances indicate the carrying value may not be recoverable. We consider the carrying value of a long-lived asset impaired when the total projected undiscounted cash flows from such asset are separately identifiable and are less than the carrying value. We recognize a loss based on the amount by which the carrying value exceeds the estimated fair value of the long-lived asset. We determine the estimated fair value primarily using the projected cash flows from the asset discounted at a rate commensurate with the risk involved. During 2017, 20162023 and 2015, 2022, no impairment of long-lived assets was recognized.
Income Taxes
We provide for income taxes pursuant to the asset and liability method. The asset and liability method requires recognition of deferred income taxes based on temporary differences between financial reporting and income tax bases of assets and liabilities, using current enacted income tax rates and regulations. These differences will result in taxable income or deductions in future years when the reported amount of the asset or liability is recovered or settled, respectively. Considerable judgment is required in determining when these events may occur and whether recovery of an asset, including the utilization of a net operating loss or other carryforward prior to its expiration, is more likely than not.
38
The Company does not recognize certain tax benefits from uncertain tax positions within the provision for income taxes. The Company may recognize a tax benefit only if it is more likely than not the tax position will be sustained on examination by the taxing authorities, based on the technical merits of the position. The tax benefits recognized in the financial statements from such positions are then measured based on the largest benefit that has a greater than 50% likelihood of being realized upon settlement. The Company recognizes interest and penalties related to uncertain tax positions in income tax expense. See Note 14 to the consolidated financial statements for further information regarding income taxes.
Non-Income Taxes
The Company accrues for non-income tax assessments from foreign jurisdictions related to prior periods and recognizes the expense within selling and operating, when deemed probable and estimable. Once the requirement to remit non-income taxes to foreign jurisdictions has been established, we present revenues net of the non-income taxes collected from members and remit such amounts to foreign tax authorities.
Revenue Recognition
Streaming revenuesRevenues consist primarily of subscription fees paid by our streaming customers. DVD subscription and other revenues consist of subscription fees paid by our DVD customers and rental income from tenant leases. We recognize revenues when the following four basic criteria are met: (i) persuasive evidence of an arrangement exists; (ii) delivery has occurred or services have been rendered; (iii) the seller’s price to the buyer is fixed or determinable; and (iv) collectability is reasonably assured.members. We present revenues net of the taxes that are collected from customers. Streamingmembers and remitted to governmental authorities. Members are billed in advance and revenues are recognized ratably over the subscription term. Deferred revenues consist of subscription fees collected from customersmembers that have not been earned and isare recognized ratably over the remaining term of the subscription. We recognize revenue on a net basis for relationships where our Partners have the primary relationship, including billing and service delivery, with the member. We recognize revenue on a gross basis for members whose primary relationship is with Gaia. Payments made to Partners to assist in promoting our service on their platforms are expensed to marketing expenses in the period incurred. We do not allow access to our service to be provided as part of a bundle by any of our Partners.
MarketingAs of December 31, 2023, total deferred revenue was $15.9 million and is expected to be recognized as revenue within the next 12 months.
We also earn revenue from advertisements presented on our streaming service. Revenues earned from sources other than monthly membership fees were $2.7 million for the year ended December 31, 2023 and $1.6 million for the year ended December 31, 2022.
Discontinued Operations
Yoga International historically had a line of business focused on transactional course sales. This content was rolled into the subscription offering at the end of 2021 and this line of business was discontinued in 2022 as the contractual commitments related to this line of business lapsed. There are no other assets or liabilities associated with this revenue stream. As this represents a strategic shift with a major effect on our operations and financial results, we have presented the results of operations related to winding up this line of business as discontinued operations on the accompanying consolidated statement of operations.
39
Business Combinations
Gaia recognizes identifiable assets acquired and liabilities assumed at their acquisition date fair values. Goodwill is measured as the excess of the consideration transferred over the fair value of assets acquired and liabilities assumed on the acquisition date. While we use our best estimates and assumptions as part of the purchase price allocation process to accurately value assets acquired and liabilities assumed, these estimates are inherently uncertain and subject to refinement. The authoritative guidance allows a measurement period of up to one year from the date of acquisition to make adjustments to the preliminary allocation of the purchase price. As a result, during the measurement period we may record adjustments to the fair values of assets acquired and liabilities assumed, with the corresponding offset to goodwill to the extent that it identifies adjustments to the preliminary purchase price allocation. Upon conclusion of the measurement period or final determination of the values of the assets acquired and liabilities assumed, whichever comes first, any subsequent adjustments will be recorded to the consolidated statement of operations.
Marketing
Marketing costs consist primarily of advertising expenses, which include promotional activities such as online advertising and public relations expenditures. Advertising costs are expensed as incurred.incurred and included in selling and operating expense in the accompanying consolidated statements of operations. During 2017, 20162023 and 20152022, we expensed $25.7 million, $13.2marketing and advertising costs of $33.1 million and $5.5$30.5 million, respectively.
Share-Based Compensation
We recognize compensation cost for share-based awards based on the estimated fair value of the award on date of grant. We measure compensation cost at the grant date based on the estimated fair value of the award and recognize compensation cost upon the probable attainment of a specified performance condition over the estimated performance period or for time basedtime-based awards over the service period. We useSince 2019, we have only granted restricted stock units, for which we utilize the Black-Scholes option and intrinsic valuation modelmarket price of our common stock on the date of grant to estimate fair value. We account for forfeitures as they occur.
Segment Information
Gaia’s Chief Executive Officer is the fair valuechief operating decision maker, who reviews Gaia’s financial information presented on a consolidated basis for purposes of allocating resources and evaluating our financial performance. Accordingly, we have determined that we operate in a single reporting segment.
Reclassifications
We reclassed amounts in our fiscal 2022 Consolidated Financial Statements to conform with current period presentation. As a result, we made the award. In estimating this fair value, we use certain assumptions, as disclosed in Note 8, consistingfollowing adjustments:
On the Consolidated Balance Sheets:
Amounts from Prepaid expense and other current assets have been reclassed into Other receivables;
Amounts from Media library, software and equipment, net and Real estate, investment and other assets, net have been reclassed into Media library, net; Property and equipment, net; Equity method investment and Investments and other assets, net;
Amounts from Accounts payable, accrued and other liabilities have been reclassed into Accounts Payable and Accrued and other liabilities;
Amounts from Short-term debtand lease liability have been reclassed into Short-term debt and Operating lease liability, current portion.
On the Consolidated Statements of Operations:
Amounts from Interest and other expense, net have been reclassed into Equity method investment losses and Interest and other expense, net.
On the expected lifeConsolidated Statements of Equity:
40
Amounts from Issuance of Gaia, Inc. common stock for RSU releases, employee stock purchase plan, and share-based compensation have been reclassedinto Issuance of Gaia, Inc. common stock for RSU releases; Issuance of Gaia, Inc. common stock for employee stock purchase plan and Share-based compensation.
On the option, risk-free interest rate, dividend yield,Consolidated Statements of Cash Flows:
Amounts from Depreciation and volatility. The use of a different estimate for any one of these assumptions couldamortization have a material impact on the amount of calculated compensation expense.been reclassed into Media library amortization and Depreciation and amortization;
Amounts from Accounts payable and accrued liabilities have been reclassed into Noncash operating lease expense; Accounts Payable; and Accrued and other liabilities;
Amounts from Accounts receivable have been reclassed into Other receivables;
Amounts from Additions to Media library, software and equipment and other assets have been reclassed into Additions to media library and Additions to property and equipment.
Defined Contribution Plan
We have adopted a defined contribution retirement plan under Section 401(k) of the Internal Revenue Code of 1986, as amended (“Internal Revenue Code”), which covers substantially all employees. Eligible employees may contribute amounts to the plan, via payroll withholding, subject to certain limitations. The 401(k) plan permits, but does not require, us to make additional matching contributions to the 401(k) plan on behalf of all participants in the 401(k) plan. WeThe plan allows us to determine the match 50% of an employee’s contribution up to an annual maximum matching contribution of $1,500.percentage, if any. We made matching contributions to the 401(k) plan of $100,000, $82,000,$0.2 million and $56,000 in each of$0.3 million for the years ended December 31, 2017, 20162023 and 2015,2022, respectively.
Fair value represents the price that would be received to sell an asset or paid to transfer a liability (an exit price) in the principal or most advantageous market for the asset or liability in an orderly transaction between market participants on the measurement date. Assets and liabilities are valued based upon observable and non-observable inputs. Valuations using Level 1 inputs are based on unadjusted quoted prices that are available in active markets for the identical assets or liabilities at the measurement date. Level 2 inputs utilize significant other observable inputs available at the measurement date, other than quoted prices included in Level 1, either directly or indirectly; and valuations using Level 3 inputs are based on significant unobservable inputs that cannot be corroborated by observable market data and reflect the use of significant management judgment. The carrying amounts of our cash and cash equivalents, accounts receivable, accounts payable and other current liabilities approximate their fair values.
Leases
Net Income (Loss)As discussed in Note 8, we entered into an operating lease in connection with the sale of a portion of our corporate campus. We record the ROU asset for the operating lease term as an asset and our obligation to make lease payments as a liability. Leases with an initial term of 12 months or less are not recognized on the consolidated balance sheet and the expense for these short-term leases are recognized on a straight-line basis over the lease term. Variable lease payments are not included in the lease payments used to measure the lease liability and are expensed as incurred.
Noncontrolling Interest
Gaia holds certain interests in entities where Gaia is the majority owner but not sole owner. These investments are included in our consolidated financial statements. The minority-owned portion of these investments is presented as Noncontrolling Interest (“NCI”) on the consolidated financial statements. Any changes of the ownership interest of NCI are accounted for as equity transactions and adjustments in the consolidated financial statements.
41
Loss Per Share
Basic net income (loss)loss per share excludes any dilutive effectsis computed using the weighted-average number of outstanding shares of common stock awards. We compute basic net income (loss)during the period. Diluted loss per share is computed using the weighted averageweighted-average number of outstanding shares of common stock and, when dilutive, potential shares of common stock outstanding during the period. We compute diluted net income (loss) per share using the weighted average number ofPotential shares of common stock consist of incremental shares issuable upon the assumed exercise of stock options and commonvesting of restricted stock equivalents outstanding duringunits utilizing the period. We excluded commontreasury stock equivalentsmethod.
Investments
The Company classifies investments at the acquisition date and re-evaluates the classification at each balance sheet date and when events or changes in circumstances indicate that there is a change in the Company’s ability to exercise significant influence. The ability to exercise significant influence over, but not control, the operating and financial policies of 57,000, 910,000,the investee is presumed to exist when the Company owns 20% or greater of the voting interests in the investee, but the Company also applies judgment regarding its level of influence over the investee by considering key factors such as representation on the board of directors, participation in policy-making decisions, and 954,000material intercompany transactions. The Company accounts for its investments in other entities over which the Company has the ability to exercise significant influence, but not control, using the equity method of accounting.
Under the equity method of accounting, the Company’s investment is initially recorded at cost within Investments in Equity Method Investees on the consolidated balance sheets. The Company adjusts its investment for contributions made, its proportionate share of net earnings, declared dividends, and distributions of the investee. To the extent there is a basis difference between the amount invested and the Company’s proportionate share of the underlying net assets of the investee, the Company allocates such differences amongst the recorded assets of the investee. The basis differences are amortized on a straight-line basis over the underlying assets’ estimated useful lives when calculating the attributable earnings or losses. The Company records in the statements of operations its share of income or loss of the investee, including any amortization of basis differences, within interest and other expense, net, which results in an increase or decrease to the carrying value of the investment. Any dividends received from the computationinvestee are recorded as a reduction of diluted net income (loss) per share for 2017, 2016, and 2015 respectively, because their effect was antidilutive.the carrying value of the investment.
Investments
Our cost method investments are carried at cost and adjusted for other-than-temporary declines in fair value.
We evaluate ourThe Company assesses investments for impairments annually and when factorsimpairment whenever events or changes in circumstances indicate that the carrying value of an investment may not be recoverable. If the investment is determined to have a significant decreasedecline in value has occurred. Variables considered in making such assessments may include near-term prospects of the investees and the investees’ capital structure, as well as other economic variables which reflect assumptions market participants may use in pricing these assets. If an investment is deemed to have experienced an other-than-temporary decline below its cost basis, we reduce the carrying amount of the investmentbe other than temporary, it is written down to its quoted or estimated fair value, as applicable, and establish a new cost basis for the investment. The Companyvalue. We did notnot record any impairment charges on our cost method investments during the years 2017, 2016,2023 or 2015.2022.
Use of Estimates and Reclassifications
The preparation of the consolidated financial statements in accordance with GAAP requires us to make estimates and assumptions that affect the amounts reported in the accompanying consolidated financial statements and disclosures. Although we base these estimates on our best knowledge of current events and actions that we may undertake in the future, actual results may be different from the estimates. We have made certain reclassifications to prior period amounts to conform to the current period presentations.
Recently Issued Accounting Pronouncements Not Yet Adopted in 2017
In March 2016,November 2023, the FASBFinancial Accounting Standards Board (“FASB”) issued ASU No. 2016-09, Accounting Standards Update (“ASU”) 2023-07, Segment Reporting (Topic 280): Improvements to Employee Share-Based Payment Accounting,Reportable Segment Disclosures, which amends Topic 718, Compensation – Stock Compensation.requires public entities to disclose information about their reportable segments’ significant expenses and other segment items on an interim and annual basis. Public entities with a single reportable segment are required to apply the disclosure requirements in ASU No. 2016-09 simplifies several aspects of the accounting for share-based payment transactions, including the income tax consequences, classification of awards2023-07, as either equity or liabilities,well as all existing segment disclosures and classificationreconciliation requirements in ASC 280 on the statement of cash flows.an interim and annual basis. ASU No. 2016-092023-07 is effective for fiscal years beginning after December 15, 2016,2023, and for interim periods within those fiscal years.years beginning after December 15, 2024, with early adoption permitted. We adoptedare currently evaluating the impact of adopting ASU No. 2016-09 in the first quarter of 2017, with no material impact.2023-07.
Recently Issued Accounting Pronouncements
In February 2016,December 2023, the FASB issued ASU No. 2016-02, Leases2023-09, Income Taxes (Topic 842). The new standard establishes a right-of-use (ROU) model that740): Improvements to Income Tax Disclosures, which requires a lesseepublic entities, on an annual basis, to record a ROU asset and a lease liability on the balance sheet for all leases with terms longer than 12 months. Leases will be classified as either finance or operating, with classification affecting the patternprovide disclosure of expense recognitionspecific categories in the rate reconciliation, as well as disclosure of income statement. The new standardtaxes paid disaggregated by jurisdiction. ASU 2023-09 is effective for
42
fiscal years
beginning after December 15, 2018, including interim periods within those fiscal years. A modified retrospective transition approach is required for lessees for capital and operating leases existing at, or entered into after,2024, with early adoption permitted. We are currently evaluating the beginningimpact of adopting ASU 2023-09
3. Restatement of Previously Issued Financial Statements
After the issuance of the earliest comparativeaudited consolidated financial statements as of and for the year ended December 31, 2022, the Company identified certain prior period presentedmisstatements in relation to the Company’s consolidated financial statements.
Description of Misstatement Adjustments
(a) Media Library, Consolidated Statement of Cash Flows Impact
As part of the Company’s operations, it spends a significant amount of resources on developing media library content that is made available to its subscribers. Historically, the Company has classified amounts spent to produce media content as investing cash outflows. However, the Company revisited the Financial Accounting Standards Board ("FASB") Accounting Standards Codification (“ASC”) Topic 920, Entertainment-Broadcasters (“ASC 920”) and ASC Topic 926, Entertainment-Films (“ASC 926”) and determined that the nature of the media library costs is consistent with the capitalizable costs described in ASC 920 and 926 and, therefore, applying this guidance to the Company’s media library costs is appropriate. This guidance requires these costs to be classified as operating cash outflows rather than investing cash outflows. Therefore, the Company determined the prior year presentation was incorrect resulting in a $9.8 million overstatement of net cash used in investing activities and corresponding understatement of net cash provided by operating activities for periods ended March 31, 2022 through September 30, 2023.
(b) Line of Credit, Consolidated Statement of Cash Flows Impact
In August 2022, the Company obtained a new line of credit for which the first draw occurred in September 2022 in the financial statements,amount of $7.5 million. In October 2022, the outstanding balance was paid off with no amount outstanding. Shortly thereafter, in November 2022 and December 2022, respectively, the Company drew down $2.7 million and an additional $6.3 million, resulting in an outstanding total balance of $9.0 million as of December 31, 2022. In the Company’s consolidated statement of cash flows for the year ended December 31, 2022, the Company presented the borrowings and payments on a net basis, resulting in $9.0 million presented as “Proceeds from borrowings under revolving line of credit". However, GAAP required companies to present the gross borrowings and payments for cash flow presentation purposes. Therefore, the Company should have presented proceeds from borrowings under revolving line of credit of $16.5 million and included $7.5 million in the Repayment of debt line item. The misstatement did not have any impact on the net cash provided by financing activities on the consolidated statement of cash flows, or any impact on the consolidated statement of operations, or consolidated balance sheet as of or for the year ended December 31, 2022.
(c) Equity Method Investment
In September 2016, the Company purchased a 10% equity ownership interest in an entity called Telomeron, Inc. (“Telomeron”), wherein the parent company of Telomeron, Exagon Industries Limited (“Exagon”) contributed intellectual property with an agreed upon value of $100.0 million and the Company paid Exagon $10.0 million in exchange for the 10% equity ownership interest. The Company’s historical accounting conclusion was that the ownership interest represented an investment in equity securities rather than an equity method investment. However, the Company revisited the original conclusion and concluded that the Company had the ability to exercise influence over Telomeron and therefore, should have been accounted for and disclosed as an equity method investment from inception. As Telomeron holds certain practical expedients available. Our preliminary assessment iscontributed technology from its parent that we dodoes not expect the new standard to have a material impact on our reported financial position or results of operations.
In May 2014,recognized carrying value, the FASB issued ASU No. 2014-09, Revenue from Contracts with Customers (Topic 606). The new standard supersedes most previous revenue recognition rules. The core principleCompany’s cost of the guidance isinvestment exceeds its proportionate share of the net assets by $10.0 million. Management of the Company determined that the excess basis allocated to amortizable assets should have been recognized on a straight-line basis over the estimated 20-year life of the contributed technology at a rate of $0.5 million per year. The accumulated impact of the misstatement as of December 31, 2021 was an overstatement of the equity method investment by $2.6 million and a corresponding understatement of the accumulated deficit.
43
During the year ended December 31, 2022, equity method investment losses should have been $0.5 million with a corresponding decrease to the equity method investment.
(d) BioWell Noncontrolling Interest
The Company holds a 51% controlling equity ownership in Bio-Well, LLC ("BioWell"), an entity should recognize revenue to depict the transfer of promisedthat sells certain goods orand services to customers and has had activity since 2015. The Company has historically consolidated the results of BioWell; however, the Company did not appropriately record, present or disclose a noncontrolling interest in an amount that reflects the consideration to which the entity expects in exchange for those goods or services. Our revenue transactions typically consist of one distinct, fixed-price performance obligation which is deliveredrelation to the customer at49% portion of BioWell not controlled by the Company within either the consolidated statement of operations or the consolidated balance sheet. The noncontrolling interest that should have been presented on the consolidated balance sheet as of December 31, 2021 and December 31, 2022 was $0.8 million and $1.1 million, respectively. The portion of the Company’s net income attributable to noncontrolling interest holders for the year ended December 31, 2022 was $0.3 million.
The following tables represent the restated consolidated balance sheet, consolidated statements of operations, changes in equity and cash flows for the year ended December 31, 2022. These tables also present a single pointreconciliation from the prior period as previously reported to the restated amounts.
44
GAIA, INC.
Consolidated Balance Sheet
|
| As of December 31, 2022 |
|
| |||||||||||
(in thousands) |
| As Previously Reported |
|
| Adjustment |
|
| Reference |
| As Restated |
|
| |||
ASSETS |
|
|
|
|
|
|
|
|
|
|
|
| |||
Real estate, investment and other assets, net |
|
| 30,979 |
|
|
| (3,125 | ) |
| (c) |
|
| 27,854 |
| (1) |
Total assets |
| $ | 138,303 |
|
| $ | (3,125 | ) |
|
|
| $ | 135,178 |
|
|
LIABILITIES AND EQUITY |
|
|
|
|
|
|
|
|
|
|
|
| |||
Accumulated deficit |
|
| (75,198 | ) |
|
| (4,195 | ) |
| (c) (d) |
|
| (79,393 | ) |
|
Total Gaia, Inc. shareholders’ equity |
|
| 88,984 |
|
|
| (4,195 | ) |
|
|
|
| 84,789 |
|
|
Noncontrolling interests |
|
| — |
|
|
| 1,070 |
|
| (d) |
|
| 1,070 |
|
|
Total equity |
|
| 88,984 |
|
|
| (3,125 | ) |
|
|
|
| 85,859 |
|
|
Total liabilities and equity |
| $ | 138,303 |
|
| $ | (3,125 | ) |
|
|
| $ | 135,178 |
|
|
(1) To conform with current period presentation in time, or overour consolidated balance sheets for the periods ended December 31, 2023 and 2022, we made certain reclassification adjustments as further described within Note 2, including adjusting the equity method investment portion of real estate, investment and other assets, net into a subscription period. We adopted this new standard on January 1, 2018 usingseparate line item, equity method investment.
GAIA, INC.
Consolidated Statement of Operations
|
| Year Ended December 31, 2022 |
|
| |||||||||||
(in thousands, except per share data) |
| As Previously Reported |
|
| Adjustment |
|
| Reference |
| As Restated |
|
| |||
|
|
|
|
|
|
|
|
|
|
|
|
| |||
Equity method investment loss |
| $ | - |
|
| $ | (500 | ) |
| (c) |
| $ | (500 | ) | (1) |
Net loss before income taxes |
|
| (2,533 | ) |
|
| (500 | ) |
|
|
|
| (3,033 | ) |
|
Net loss from continuing operations |
|
| (2,735 | ) |
|
| (500 | ) |
|
|
|
| (3,235 | ) |
|
Net loss |
| $ | (3,095 | ) |
| $ | (500 | ) |
|
|
| $ | (3,595 | ) |
|
Net income attributable to noncontrolling interests |
| $ | — |
|
| $ | 296 |
|
| (d) |
| $ | 296 |
|
|
Net loss attributable to common shareholders |
| $ | (3,095 | ) |
| $ | (796 | ) |
| (d) |
| $ | (3,891 | ) |
|
Loss per share: |
|
|
|
|
|
|
|
|
|
|
|
| |||
Basic |
|
|
|
|
|
|
|
|
|
|
|
| |||
Continuing operations (attributable to common shareholders) |
| $ | (0.13 | ) |
| $ | (0.04 | ) |
|
|
| $ | (0.17 | ) |
|
Basic loss per share |
| $ | (0.15 | ) |
| $ | (0.04 | ) |
|
|
| $ | (0.19 | ) |
|
Diluted |
|
|
|
|
|
|
|
|
|
|
|
| |||
Continuing operations (attributable to common shareholders) |
| $ | (0.13 | ) |
| $ | (0.04 | ) |
|
|
| $ | (0.17 | ) |
|
Diluted loss per share |
| $ | (0.15 | ) |
| $ | (0.04 | ) |
|
|
| $ | (0.19 | ) |
|
|
|
|
|
|
|
|
|
|
|
|
|
| |||
(1) To conform with current period presentation in our consolidated statement of operations for the modified retrospective approach, with no material impact.periods ended December 31, 2023 and 2022, we made certain reclassification adjustments as further described within Note 2, including adjusting the equity method investment loss portion of interest and other expense, net into a separate line item, equity method investment loss.
3. Property and Equipment
Building and Land,
45
GAIA, INC.
Consolidated Statement of Changes in Equity
|
|
|
|
|
|
|
|
|
|
|
|
|
|
|
|
|
|
|
|
| ||||||
(in thousands, except shares) |
| Common |
|
| Accumulated |
|
| Common |
|
| Additional |
|
| Non-controlling interests |
|
| Total |
|
| Reference | ||||||
As Previously Reported |
|
|
|
|
|
|
|
|
|
|
|
|
|
|
|
|
|
|
|
| ||||||
Balance at January 1, 2022 |
|
| 20,461,337 |
|
| $ | (72,103 | ) |
| $ | 2 |
|
| $ | 162,316 |
|
| $ | — |
|
| $ | 90,215 |
|
|
|
Net loss |
|
| — |
|
|
| (3,095 | ) |
|
| — |
|
|
| — |
|
|
| — |
|
|
| (3,095 | ) |
|
|
Balance at December 31, 2022 |
|
| 20,806,186 |
|
| $ | (75,198 | ) |
| $ | 2 |
|
| $ | 164,180 |
|
| $ | — |
|
| $ | 88,984 |
|
|
|
|
|
|
|
|
|
|
|
|
|
|
|
|
|
|
|
|
|
|
|
| ||||||
Adjustment |
|
|
|
|
|
|
|
|
|
|
|
|
|
|
|
|
|
|
|
| ||||||
Balance at January 1, 2022 |
|
| — |
|
| $ | (3,399 | ) |
| $ | — |
|
| $ | — |
|
| $ | 774 |
|
| $ | (2,625 | ) |
| (c) (d) |
Net (loss) income |
|
| — |
|
|
| (796 | ) |
|
| — |
|
|
| — |
|
|
| 296 |
|
|
| (500 | ) |
| (c) (d) |
Balance at December 31, 2022 |
|
| — |
|
| $ | (4,195 | ) |
| $ | — |
|
| $ | — |
|
| $ | 1,070 |
|
| $ | (3,125 | ) |
|
|
|
|
|
|
|
|
|
|
|
|
|
|
|
|
|
|
|
|
|
|
| ||||||
As Restated |
|
|
|
|
|
|
|
|
|
|
|
|
|
|
|
|
|
|
|
| ||||||
Balance at January 1, 2022 |
|
| 20,461,337 |
|
| $ | (75,502 | ) |
| $ | 2 |
|
| $ | 162,316 |
|
| $ | 774 |
|
| $ | 87,590 |
|
|
|
Net (loss) income |
|
| — |
|
|
| (3,891 | ) |
|
| — |
|
|
| — |
|
|
| 296 |
|
|
| (3,595 | ) |
|
|
Balance at December 31, 2022 |
|
| 20,806,186 |
|
| $ | (79,393 | ) |
| $ | 2 |
|
| $ | 164,180 |
|
| $ | 1,070 |
|
| $ | 85,859 |
|
|
|
GAIA, INC.
Consolidated Statement of Cash Flows
|
| Years ended December 31, 2022 |
| |||||||||||
(in thousands) |
| As Previously Reported |
|
| Adjustment |
|
| Reference |
| As Restated |
| |||
|
|
|
|
|
|
|
|
|
|
|
| |||
Cash flows from operating activities: |
|
|
|
|
|
|
|
|
|
|
| |||
Net loss |
| $ | (3,095 | ) |
| $ | (500 | ) |
| (c) |
| $ | (3,595 | ) |
Loss from continuing operations |
|
| (2,735 | ) |
|
| (500 | ) |
|
|
|
| (3,235 | ) |
Adjustments to reconcile net loss to net cash provided by operating activities: |
|
|
|
|
|
|
|
|
|
|
| |||
Equity method investment losses |
|
| — |
|
|
| 500 |
|
| (c) |
|
| 500 |
|
Additions to media library |
|
| — |
|
|
| (9,840 | ) |
| (a) |
|
| (9,840 | ) |
Net cash provided by operating activities - continuing operations |
|
| 11,880 |
|
|
| (9,840 | ) |
|
|
|
| 2,040 |
|
Net cash provided by operating activities |
|
| 11,520 |
|
|
| (9,840 | ) |
|
|
|
| 1,680 |
|
Cash flows from investing activities: |
|
|
|
|
|
|
|
|
|
|
| |||
Additions to property and equipment |
|
| (18,257 | ) |
|
| 9,840 |
|
| (a) |
|
| (8,417 | ) |
Net cash used in investing activities |
|
| (19,104 | ) |
|
| 9,840 |
|
|
|
|
| (9,264 | ) |
Cash flows from financing activities: |
|
|
|
|
|
|
|
|
|
|
| |||
Proceeds from short-term borrowings |
|
| 9,000 |
|
|
| 7,500 |
|
| (b) |
|
| 16,500 |
|
Repayment of debt |
|
| (166 | ) |
|
| (7,500 | ) |
| (b) |
|
| (7,666 | ) |
Net cash provided by financing activities |
|
| 8,877 |
|
|
| — |
|
|
|
|
| 8,877 |
|
46
4. Media Library, Net
Media library stated at lower of cost or estimated fairnet realizable value, consists of the following as of December 31:
(in thousands) |
| 2017 |
|
| 2016 |
| ||
Land |
| $ | 4,829 |
|
| $ | 4,829 |
|
Buildings |
|
| 17,664 |
|
|
| 16,874 |
|
|
|
| 22,493 |
|
|
| 21,703 |
|
Accumulated depreciation |
|
| (5,465 | ) |
|
| (4,807 | ) |
|
| $ | 17,028 |
|
| $ | 16,896 |
|
(in thousands) |
| 2023 |
|
| 2022 |
| ||
Media library, net: |
|
|
|
|
|
| ||
Acquired media, net |
| $ | 4,656 |
|
| $ | 5,694 |
|
Licensed media, net |
|
| 3,865 |
|
|
| 3,174 |
|
Produced media, net |
|
| 29,483 |
|
|
| 28,326 |
|
Produced media in progress |
|
| 2,121 |
|
|
| 2,881 |
|
Total media library, net |
| $ | 40,125 |
|
| $ | 40,075 |
|
Software, equipmentAs described in Note 2, amortization is over typically 12 to 90 months commencing with the month the content is available on our site and is included in cost of revenues on the accompanying consolidated statements of operations. Amortization expense for our media library stated at lower of cost or estimated fair value, consists of the following as of December 31:
(in thousands) |
| 2017 |
|
| 2016 |
| ||
Website development costs and other software |
| $ | 8,236 |
|
| $ | 4,421 |
|
Studio, computer and telephone equipment |
|
| 1,097 |
|
|
| 693 |
|
Media library |
|
| 18,807 |
|
|
| 11,486 |
|
|
|
| 28,140 |
|
|
| 16,600 |
|
Accumulated depreciation and amortization |
|
| (7,753 | ) |
|
| (3,739 | ) |
|
| $ | 20,387 |
|
| $ | 12,861 |
|
was $9.2 million and $8.3 million during 2023 and 2022, respectively. Future depreciation and amortization consistsis expected to be:
(in thousands) |
| Acquired |
|
| Licensed |
|
| Produced |
|
| Total |
| ||||
2024 |
| $ | 1,039 |
|
| $ | 1,216 |
|
| $ | 6,959 |
|
| $ | 9,214 |
|
2025 |
|
| 921 |
|
|
| 1,045 |
|
|
| 6,332 |
|
| $ | 8,298 |
|
2026 |
|
| 881 |
|
|
| 751 |
|
|
| 5,440 |
|
| $ | 7,072 |
|
|
| $ | 2,841 |
|
| $ | 3,012 |
|
| $ | 18,731 |
|
| $ | 24,584 |
|
The remaining $15.5 million of the following:$40.1 million balance for our media library at December 31, 2023 will be amortized over the 5 years thereafter.
(in thousands) |
|
|
|
|
2018 |
| $ | 6,100 |
|
2019 |
|
| 5,273 |
|
2020 |
|
| 3,831 |
|
2021 |
|
| 2,988 |
|
2022 |
|
| 2,376 |
|
Thereafter |
|
| 12,018 |
|
|
| $ | 32,586 |
|
5. Property and Equipment, Net
4. InvestmentsProperty and Other Assets
In 2016, we purchased 10% of the outstanding common stock and associated voting rights of a privately held Colorado corporation for $10.0 million. We are accounting for this investment using the cost method. As part of our initial investment, we have the right, but not the obligation, to purchase additional shares. If we elect not to utilize our right to purchase additional shares or transfer these rights to another party by certain deadlines, we may be required to surrender and forfeit our existing stock ownership.
Other assetsequipment, net consist of the following as of December 31:
(in thousands) |
| Estimated Useful Lives (in Years) |
| 2023 |
|
| 2022 |
| ||
Land |
|
|
| $ | 2,597 |
|
| $ | 2,597 |
|
Buildings and improvements |
| 3-45 years |
|
| 20,151 |
|
|
| 20,011 |
|
Website development and other software |
| 3 years |
|
| 18,230 |
|
|
| 18,805 |
|
Studio, computer, telephone and lab equipment |
| 3-5 years |
|
| 6,148 |
|
|
| 1,992 |
|
Property and equipment, gross |
|
|
|
| 47,126 |
|
|
| 43,405 |
|
Accumulated depreciation and amortization |
|
|
|
| (20,823 | ) |
|
| (18,196 | ) |
Total property and equipment, net |
|
|
| $ | 26,303 |
|
| $ | 25,209 |
|