

UNITED STATES
SECURITIES AND EXCHANGE COMMISSION
Washington, D.C. 20549
FORM 10-K
☒ | ANNUAL REPORT PURSUANT TO SECTION 13 OR 15(d) OF THE SECURITIES EXCHANGE ACT OF 1934 |
For the fiscal year ended December 31, 20172023
or
☐ | TRANSITION REPORT PURSUANT TO SECTION 13 OR 15(d) OF THE SECURITIES EXCHANGE ACT OF 1934 |
For the transition period from ____________ to ____________
Commission file number: 001-11015
Viad Corp
(Exact name of registrant as specified in its charter)
Delaware | 36-1169950 | |
(State or other jurisdiction of incorporation or | (I.R.S. Employer Identification No.) | |
|
| |
(Address of principal executive offices) | (Zip Code) |
(602) (602) 207-1000
(Registrant’s telephone number, including area code)
Securities registered pursuant to Section 12(b) of the Act:
Title of each class | Trading Symbol(s) | Name of each exchange on which registered | ||
Common Stock, $1.50 | VVI | New York Stock Exchange |
Securities registered pursuant to Section 12(g) of the Act: None
Indicate by check mark if the registrant is a well-known seasoned issuer, as defined by Rule 405 of the Securities Act. Yes☒ No ☐
Indicate by check mark if the registrant is not required to file reports pursuant to Section 13 or 15(d) of the Act. Yes ☐No☒
Indicate by check mark whether the registrant (1) has filed all reports required to be filed by Section 13 or 15(d) of the Securities Exchange Act of 1934 during the preceding 12 months (or for such shorter period that the registrant was required to file such reports), and (2) has been subject to such filing requirements for the past 90 days. Yes☒ No ☐
Indicate by check mark whether the registrant has submitted electronically and posted on its corporate Website, if any, every Interactive Data File required to be submitted and posted pursuant to Rule 405 of Regulation S-T (§ 232.405 of this chapter) during the preceding 12 months (or for such shorter period that the registrant was required to submit and post such files.) Yes☒ No ☐
Indicate by check mark if disclosure of delinquent filers pursuant to Item 405 of Regulation S-K (§ 229.405) is not contained herein, and will not be contained, to the best of registrant’s knowledge, in definitive proxy or information statements incorporated by reference in Part III of this Form 10-K or any amendment to this Form 10-K. ☒
Indicate by check mark whether registrant is a large accelerated filer, an accelerated filer, a non-accelerated filer, a smaller reporting company, or an emerging growth company. See the definitions of “large accelerated filer,” “accelerated filer,” “smaller reporting company,” and “emerging growth company” in Rule 12b-2 of the Exchange Act. (Check One):
Large accelerated filer |
| Accelerated filer |
| |||
Non-accelerated filer | ☐ | Smaller reporting company | ☐ | |||
Emerging growth company | ☐ |
If an emerging growth company, indicatedindicate by check mark if the registrant has elected not to use the extended transition period for complying with any new or revised financial accounting standards provided pursuant to Section 13(a) of the Exchange Act. ☐
Indicate by check mark whether the registrant has filed a report on and attestation to its management’s assessment of the effectiveness of its internal control over financial reporting under Section 404(b) of the Sarbanes-Oxley Act (15 U.S.C. 7262(b)) by the registered public accounting firm that prepared or issued its audit report. ☒
If securities are registered pursuant to Section 12(b) of the Act, indicate by check mark whether the financial statements of the registrant included in the filing reflect the correction of an error to previously issued financial statements. ☐
Indicate by check mark whether any of those error corrections are restatements that required a recovery analysis of incentive-based compensation received by any of the registrant’s executive officers during the relevant recovery period pursuant to §240.10D-1(b). ☐
Indicate by check mark whether the registrant is a shell company (as defined in Rule 12b-2 of the Act). Yes ☐ No ☒
The aggregate market value of the Common Stock (based on its closing price per share on such date) held by non-affiliates on the last business day of the registrant’s most recently completed second fiscal quarter (June 30, 2017)2023) was approximately $948$541.2 million.
Registrant had 20,422,76221,041,920 shares of Common Stock ($1.50 par value) outstanding as of January 31, 2018.February 26, 2024.
Documents Incorporated by Reference
A portionPortions of the Proxy Statement for the Viad Corp Annual Meeting of Shareholders of Viad Corp, which is scheduled to be held onfor May 17, 2018,15, 2024, is incorporated by reference into Part III of this Annual Report.
Auditor Firm Id: 34 | Auditor Name: Deloitte & Touche LLP | Auditor Location: Tempe, AZ USA |
INDEX
Page | ||
Item 1. |
| |
Item 1A. |
| |
Item 1B. |
| |
Item |
| |
Item |
| |
Item |
| |
|
| |
Other. | 16 | |
Item 5. |
| |
Item 6. |
| |
Item 7. | Management’s Discussion and Analysis of Financial Condition and Results of Operations |
|
Item 7A. |
| |
Item 8. |
| |
Item 9. | Changes in and Disagreements With Accountants on Accounting and Financial Disclosure |
|
Item 9A. |
| |
Item 9B. |
| |
Item 9C. | Disclosure Regarding Foreign Jurisdictions that Prevent Inspections | 81 |
Item 10. |
| |
Item 11. |
| |
Item 12. | Security Ownership of Certain Beneficial Owners and Management and Related Stockholder Matters |
|
Item 13. | Certain Relationships and Related Transactions, and Director Independence |
|
Item 14. |
| |
Item 15. |
82 | |
Item 16. |
|
In this report, for periods presented, “we,” “us,” “our,” “the Company,” and “Viad Corp” refer to Viad Corp and its subsidiaries and affiliates.subsidiaries.
Forward-Looking Statements
This Annual Report on Form 10-K (“2023 Form 10-K”) contains a number of forward-looking statements.statements within the meaning of the Private Securities Litigation Reform Act of 1995. Forward-looking statements may appear throughout this 2023 Form 10-K, including the following sections: “Business” (Part I, Item 1), “Risk Factors” (Part I, Item 1A), “Management’s Discussion and Analysis of Financial Condition and Results of Operations” (Part II, Item 7), and “Quantitative and Qualitative Disclosures About Market Risk” (Part II, Item 7A). Words, and variations of words, such as “will,“aim,” “anticipate,” “believe,” “could,” “deliver,” “estimate,” “expect,” “intend,” “may,” “expect,” “would,” “could,” “might,” “intend,“outlook,” “plan,” “believe,” “estimate,” “anticipate,” “deliver,“potential,” “seek,” “aim,” “potential,” “target,” “outlook,“will,” and similar expressions are intended to identify our forward-looking statements. Similarly, statements that describe our business strategy, outlook, objectives, plans, initiatives, intentions, or goals also are forward-looking statements. These forward-looking statements are not historical facts but reflect our current estimates, projections, expectations, or trends concerning future growth, operating cash flows, availability of short-term borrowings, consumer demand, new or renewal business, investment policies, productivity improvements, ongoing cost reduction efforts, efficiency, competitiveness, strategic actions, acquisitions, the timing of new and damaged attractions openings, the sufficiency of our legal services, projections of 2018 revenue, show rotation, same-show rotation, segment operating income, attraction start-up costs, the realization of deferred tax assets, contributionsare subject to pension and postretirement benefit plans, legal expenses, tax rates and other tax matters, and foreign exchange rates. Actual results could differ materially from those discussed in the forward-looking statements. Viad’s businesses can be affected by a host of risks and uncertainties, many of which are beyond our control. control, which could cause actual results to differ materially from those in the forward-looking statements.
Important factors that could cause actual results to differ materially from those described in our forward lookingforward-looking statements include, but are not limited to, the following:
For a more complete discussion of the risks discussed inand uncertainties that may affect our business or financial results, refer to “Risk Factors” (Part I, Item 1A “Risk Factors,” includedof this 2023 Form 10-K). The forward-looking statements in this Annual Report on2023 Form 10-K forare made as of the year ended December 31, 2017 (“2017 Form 10-K”).date hereof. We disclaim and do not undertake any obligation to update or revise any forward-looking statement in this 20172023 Form 10-K except as required by applicable law or regulation.
1
We are an internationala leading provider of extraordinary experiences, including hospitality and leisure activities, experiential services company with operations principally in the United States, Canada, the United Kingdom, continental Europe,marketing, and the United Arab Emirates. We are committedlive events. Our mission is to providing unforgettabledrive significant and sustainable growth by delivering extraordinary experiences tofor our teams, clients, and guests.
We operate through two mainthree reportable business groups:
segments: Pursuit, Spiro, and GES is a world-classExhibitions. Spiro and GES Exhibitions are both live event service providerbusinesses and are referred to some of the most visible and influential events and global brands.collectively as “GES.”
Pursuit is a collection of iconic naturalinspiring and cultural destinationunforgettable travel experiences that enjoy perennial demand.
|
|
GESExhibitions
GES’ clients include event organizers and corporate brand marketers. Event organizers schedule and run the event from start to finish. Corporate brand marketers include exhibitors and domestic and international corporations that want to promote their brands, services and innovations, feature new products, and build business relationships. GES serves corporate brand marketers when they exhibit at shows and when GES is engaged to manage their global exhibit program or produce their proprietary corporate events.
GES operates through two reportable business segments based on geography:
GES U.S. has a leading position in the U.S. with full-service operations in every major exhibition market, including Las Vegas, Nevada; Chicago, Illinois; Orlando, Florida; New York, New York; and Los Angeles, California.
GES International has operating facilities at many of the most active and popular international event destinations and venues, including seven cities in Canada, seven cities in the United Kingdom, two cities in Germany, two cities in the United Arab Emirates, two cities in the Netherlands, one city in Hong Kong, Switzerland, and Romania, and through these facilities offers full-service event operations across the United Kingdom, Europe, and the Middle East.
Markets Served
GES provides a full suite of services for event organizers and corporate brand marketers across four live event markets: Exhibitions, Conferences, Corporate Events, and Consumer Events (collectively, “Live Events”).
|
| |||||
|
|
| ||||
|
|
| ||||
|
|
| ||||
|
|
| ||||
GES offers a comprehensive range of services and innovative technology, including Core Services, Event Technology, and Audio-Visual, to event organizers and corporate brand marketers.

|
|
In general, GES provides the following exclusive and discretionary services and products to Live Event organizers and corporate brand marketers:
|
| |||
|
|
| ||
|
|
| ||
|
|
| ||
|
|
| ||
|
|
| ||
|
|
| ||
|
|
| ||
|
| |||
|
| |||
|
| |||
|
| |||
|
| |||
| ||||
|
| |||
|
| |||
|
| |||
|
| |||
| ||||
Under various agreements with Live Events organizers, GES is the official services contractor with the exclusive right to provide certain services to exhibitors participating in a Live Event. This gives exhibitors a single point of contact to facilitate a timely, safe, and efficient move-in/out of a Live Event and to facilitate an organized, professional, during-show experience. GES also competes with other service providers to sell discretionary services to exhibitors. Discretionary services include complete event program management, such as creative design, strategy, and planning to corporate brand marketers across all Live Events in which they participate.
|
|
|
|
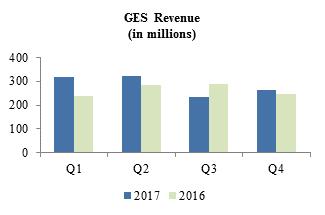
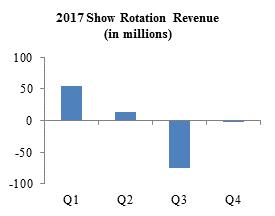
GES’ exhibition and event activity can vary significantly from quarter to quarter and year to year depending on the frequency and timing of shows: some shows are not held annually, and some shift between quarters. During 2017, GES U.S. reported its highest revenue during the first and second quarters. During 2016, GES U.S. reported its highest revenue during the second and third quarters. GES International generally reports its highest revenue during the second and fourth quarters. The following show rotation revenue metric refers to the net change in revenue from 2016 to 2017 due to show movement between quarters and years. Show rotation refers to shows that occur less frequently than annually, as well as annual shows that shift quarters from one year to the next.
Competition
In the Live Events industry, GES generally competes across all classes of services and all markets on the basis of discernible differences, value, quality, price, convenience, and service. GES has a competitive advantage through its worldwide network of resources, history of serving as an extension of clients’ teams, experienced and knowledgeable personnel, client-focus, creativity, reliable execution, proprietary technology platforms, and financial strength. All known U.S. competitors and most international competitors are privately held companies that provide limited public information regarding their operations. GES’ primary competitor within its Core Services is The Freeman Company (a privately-held, U.S.-headquartered company); however, there is substantial competition from a large number of service providers in GES’ other service offerings.
Growth Strategy
GES is committed to become the preferred global, full-service provider for Live Events. GES holds a leading market position in Exhibitions and is pursuing a focused and disciplined growth strategy with the goal of expanding its market share in the currently under-penetrated Conferences, Corporate Events, and Consumer Events markets. GES has uniquely combined the art of high-impact creativity, service, and expertise with the science of easy-to-use technology, strategy, and worldwide logistics to help clients gain a greater return from their events and enhance the exhibitor experience.
Global Reach. Leverage global capabilities and large customer base to drive continued growth in new services and other Live Events.
Full-Service Provider. Growth of adjacent services to create a unique and integrated offering to deepen client relationships, expand client base, and increase share of total event spend.
Live Events. Penetration into other live events to extend industry leadership and leverage capabilities.
With our recent acquisitions, GES made significant progress toward creating the most comprehensive suite of services for the Live Events industry, which enhanced overall competitiveness, facilitated growth in under-penetrated areas, and formed a basis for a data platform. We continue to pursue opportunities to acquire businesses with proven products and services that complement, enhance, or expand current businesses or offer growth opportunities.
Poken Acquisition. In March 2017, we completed the acquisition of the Poken event engagement technology,a leading cloud-based visitor engagement and measurement platform. The Poken platform offers a seamless ecosystem of tools that enable digital document collection (through its patented “Touch and Glow” technology), visitor-to-visitor engagement, gamification, and metrics reporting.
Cross-selling opportunities. GES is effectively positioned to cross-sell an increasingly comprehensive suite of service offerings with a convenient approach to service delivery that differentiates GES from its competition.
Registration and data analytic services entrance in the Asia markets. In early 2017, GES officially launched registration and data analytic services in the Asia market with a Hong Kong office.
Pursuit is a global attractions and hospitality company that owns and operates a collection of iconic naturalinspiring and cultural destinationunforgettable travel experiences in North America that showcase the best of Banff, Jasper, Waterton Lakes, Glacier, Denali,iconic destinations. Pursuit’s mission is to connect guests and Kenai Fjords National Parks, and Vancouver, Canada. Through Pursuit’s collection of unique hotels and lodges, world-class recreational attractions, and ground transportation services, it connects guestsstaff to iconic places through unforgettable inspiring experiences. From world-class attractions, distinctive hotels, and engaging tours in stunning national parks and renowned global travel locations, Pursuit’s elevated attraction and hospitality experiences enable visitors to discover and connect with these iconic destinations. With a strategic direction to build an expanding portfolio of extraordinary experiences, Pursuit remains focused on refreshing, improving, and growing its collection in outstanding places around the globe. Pursuit draws its guests from major markets, including Canada, the United States, Canada, China, the United Kingdom, Australia/New Zealand, Asia Pacific, and Europe. Pursuit markets directly to consumers, as well as through distribution channels that include tour operators, tour wholesalers, destination management companies, and retail travel agencies and organizations.agencies. Pursuit comprises the following collections:following:
Banff Jasper Collection |
portfolio. |
Alaska Collection | The Alaska Collection services. |
Glacier Park Collection |
guided river rafting attraction, lodging, culinary and retail experiences, all designed to enable guests to experience both Montana and Southern Alberta’s stunning outdoors. |
FlyOver Attractions | Pursuit’s FlyOver
|
Sky Lagoon | Pursuit’s Sky Lagoon is cold pool and sauna experiences. It also features an in-lagoon bar, dining experiences and retail offerings. |
2
Pursuit comprises fourPursuit’s collection of experiences focuses on three distinct lines of business: Hospitality, includingAttractions (including food and beverage services and retail operations; Attractions, includingoperations); Hospitality (including food and beverage services and retail operations; Transportation;operations); and Travel Planning. These four linesTransportation.
Attractions |


BANFF JASPER COLLECTION
Banff Gondola transports visitors to an elevation of business work together, driving economiesover 7,000 feet above sea level to the top of scopeSulphur Mountain in Banff, Alberta, Canada offering an unobstructed view of the Canadian Rockies and meaningful scaleoverlooking the town of Banff and the Bow Valley. The Banff Gondola and the Sky Bistro restaurant, which is located at the top of the Banff Gondola, were 2023 Trip Advisor Travelers Choice award winners.
Lake Minnewanka Cruise provides guests a unique sightseeing experience through interpretive boat cruises on Lake Minnewanka in the Canadian Rockies. The Lake Minnewanka Cruise operations are located adjacent to the town of Banff and aroundinclude boat tours, small boat rentals, and charter fishing expeditions. The Lake Minnewanka Cruise was a 2023 Trip Advisor Travelers Choice award winner.
Glacier Adventure is a tour of the Athabasca Glacier on the Columbia Icefield, which provides guests a view of one of the largest accumulations of ice and snow south of the Arctic Circle. Guests ride in a giant “Ice Explorer,” a unique vehicle specially designed for glacier travel. The Glacier Adventure was a 2023 Trip Advisor Travelers Choice award winner.
Columbia Icefield Skywalk is a 1,312-foot guided interpretive walkway with a 98-foot glass-floored observation area overlooking the Sunwapta Valley, near our Glacier Adventure attraction in Jasper National Park, Alberta, Canada.
Maligne Lake Cruise provides interpretive boat tours at Maligne Lake, the largest lake in Jasper National Park, Alberta, Canada. In addition to boat tours, Maligne Lake has a marina and day lodge that offers food and beverage and retail services, an historic chalet complex and boat house that offers canoes, kayaks, and rowboats for rental. The Maligne Lake Cruise was a 2023 Trip Advisor Travelers Choice award winner.
Golden Skybridge is in the mountain town of Golden, British Columbia, which is 90 minutes from Banff. It consists of two suspension bridges that are connected through forested trails. The upper skybridge is 426 feet above the canyon floor while the lower skybridge is 262 feet above the canyon floor. The attraction also includes a zip line, a canyon challenge course, and a mountain coaster. The Golden Skybridge was a 2023 Trip Advisor Travelers Choice award winner.
Open Top Touring is a guided sightseeing tour of Banff with a historic twist. Guests ride in a custom-made, open-topped automobile inspired by local tours from the 1930s. Open Top Touring was a 2023 Trip Advisor Travelers Choice award winner.
ALASKA COLLECTION
Kenai Fjords Tours is a wildlife, whale watching, and glacier cruise, offering guests unforgettable sights of towering glaciers, humpback and grey whales, orcas, arctic birdlife, sea lions, seals, and porpoises in Kenai Fjords National Park. Tours range from a few hours to full days, with some tours including a culinary experience and visit to Fox Island. Kenai Fjords Tours was a 2023 Trip Advisor Travelers Choice award winner.
SKY LAGOON
Sky Lagoon is a 230-foot premium oceanfront geothermal lagoon that is located in Kársnes Harbour, Kópavogur, just minutes from Reykjavik. Sky Lagoon showcases expansive ocean vistas punctuated by awe-inspiring sunsets, Northern Lights, and dark sky views. Sky Lagoon was a 2023 Trip Advisor Travelers Choice award winner.
3
FLYOVER ATTRACTIONS
FlyOver flight ride attractions provide guests with an exhilarating flying experience over iconic destinationsnatural wonders, hard to reach locations, and picturesque scenery. Utilizing state-of-the-art ride and audio-visual technology, each FlyOver experience features moving ride vehicles with six degrees of motion and multi-sensory special effects before a spherical screen.
GLACIER PARK COLLECTION
Glacier Raft Company provides guided river rafting trips in West Glacier, Montana.
Hospitality |

BANFF JASPER COLLECTION | GLACIER PARK COLLECTION | ALASKA COLLECTION | |||||
Elk + Avenue Hotel | 164 rooms | Glacier Park Lodge | 162 rooms | Seward Windsong Lodge | 216 rooms | ||
Forest Park Woodland | 152 rooms | Grouse Mountain Lodge | 145 rooms | Talkeetna Alaskan Lodge | 212 rooms | ||
Lobstick Lodge | 139 rooms | St. Mary Lodge | 116 rooms | Denali Cabins | 46 rooms | ||
Mount Royal Hotel | 133 rooms | Prince of Wales Hotel | 86 rooms | Denali Backcountry Lodge | 42 rooms | ||
Chateau Jasper Hotel | 119 rooms | Apgar Village Lodge & Cabins | 48 rooms | Kenai Fjords Wilderness Lodge | 8 rooms | ||
The Crimson Hotel | 99 rooms | West Glacier Village | 18 rooms | 524 rooms | |||
Forest Park Alpine | 88 rooms | Glacier Basecamp Lodge | 29 rooms | ||||
Marmot Lodge | 81 rooms | Belton Chalet | 27 rooms | ||||
Pyramid Lake Resort | 68 rooms | Motel Lake McDonald | 27 rooms | ||||
Miette Mountain Cabins | 56 rooms | Glacier Raft Co. Lodging | 23 rooms | ||||
Glacier View Lodge | 32 rooms | West Glacier RV Park & Cabins | 25 rooms | ||||
1,131 rooms | 706 rooms | ||||||
Transportation |
BANFF JASPER COLLECTION
Transportation operations include sightseeing tours, airport shuttle services, and seasonal charter motorcoach services. The sightseeing services include seasonal half- and full-day tours from Calgary, Banff, Lake Louise, and Jasper, Canada and bring guests to the most scenic areas of Banff, Jasper, and Waterton LakesYoho National ParksParks. The charter business operates a fleet of luxury motorcoaches, available for groups of any size, for travel throughout the Canadian provinces of Alberta and Vancouver in Canada, and Glacier,British Columbia during the winter months.
ALASKA COLLECTION
Transportation includes a Denali and Kenai FjordsBackcountry Adventure, which is a unique photo safari tour 92 miles deep into Denali National Parks in the United States.Park.
4 |
|
|
|
| ||||
|
|
|
|
| ||||
|
|
|
|
| ||||
|
| |||||||
|
|
|
|
|
|
|
|
|
|
| Pursuit
|
|
| |
|
| |
|
| |
|
|
|
|
Seasonality
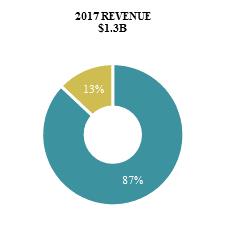
Pursuit experiencesPursuit’s peak activity occurs during the summer months. During 2017, 87%2023, 79% of Pursuit’s revenue was earned in the second and third quarters.

Competition
Pursuit generally competes based on the basis of location, uniqueness of facilities, service, quality, and price. Competition exists both locally and regionally across all fourthree lines of business. The hospitality businessindustry has a large number of competitors and competes for leisure travelers (both individual and tour groups) across the United States and Canada. Pursuit’s competitive advantage isadvantages are its distinctive attractions, iconic destinations, and iconic destinations.strong culture of hospitality and guest services.
Pursuit remains focused on delivering inspiring and unforgettable experiences in iconic locations while growing and enhancing its unique portfolio of integrated tourism assetsPursuit’s growth strategy is to become a leading attractions hospitality company through its Refresh-Build-Buy growth initiatives.Refresh, Build, Buy initiatives:
Refresh. RefreshRefreshing our existing assets and processes to optimize the guest and team member experience, market position, and maximize returns.
Build. BuildBuilding new assets thatto create new guest experiences and additional revenue streams with economies of scale and scope.
Buy. BuyBuying strategic assets that drive guest experience, economies of scale and scope, with strong returns.
We continue to search for opportunities to acquire or to build high return tourism assets in iconic natural and cultural destinations that enjoy perennial demand, bring meaningful scale and market share, and offer cross-selling advantages with a combination of attractions and hotels.
Recent Pursuit DevelopmentsDevelopment
Mount Royal Hotel. On December 29, 2016,FlyOver Chicago, located near the Mount Royal Hotel was damaged by fire and closed. In July 2017, we resolved our property and business interruption insurance claims related to the fire for $36.3 million. We allocated $2.2 million to an insurance receivable, $29.3 million was recorded as an impairment recovery (partially offset by impairment chargesfront entrance of $0.2 million) related to construction costs to re-open the hotel, $2.5 million was recorded as a business interruption gain for the recovery of lost profits, $1.3 million was recorded as contra-expense to offset non-capitalizable costs incurred, and the remaining $1.0 million was recorded as deferred revenue that will be recognized over the periods the business interruption losses are actually incurred. Restorations and improvements will provide an elevated guest experience to room finishes and furnishings, lobby and lounge areas, exterior appearance, heating/cooling, sound insulation, and building systems. We anticipate re-opening the hotel in mid-year 2018.
Expansion of FlyOver Concept. On November 3, 2017, we acquired the controlling interest (54.5% of the common stock) in Esja Attractions ehf. (“Esja”). Esja, a private Iceland corporationChicago’s Navy Pier, is developing and will operate Pursuit’s new FlyOver Iceland attraction. This attraction expands our virtual flight ride theater concept into Iceland’s capital city of Reykjavik. Modeled after our highly successful FlyOver Canada attraction, FlyOver Iceland will provide guests an exhilarating virtual flight experience over some of Iceland’s most spectacular scenery and natural wonders. The new attraction is expectedscheduled to open in 2019.March 2024.
5
Tiny Home Village. On July 15, 2017, we added ten tiny homes

GES is a global, full-service live events company offering a comprehensive range of services to the St. Mary Lodge property as partworld’s leading brands and event organizers from the design and production of compelling, immersive live and digital experiences that engage audiences and build brand awareness, through to logistics, including material handling, rigging, electrical, and other on-site event services. GES’ mission is to create the most meaningful and memorable experiences for marketers, organizers, and attendees.
GES has a leading position in the United States, serving every major exhibition market, including Las Vegas, Chicago, and Orlando. Additionally, GES produces events at many of the Glacier Park Collection. The tiny home’smost active and popular international event destinations and venues in the United Kingdom, Canada, the Middle East, the Netherlands, and Germany.


SPIRO
Spiro is an experiential marketing agency that partners with leading brands around the world to manage and elevate their global experiential marketing activities. Spiro builds immersive experiences with its clients starting with the strategic plan, creating the content and design, embracesand finishing with the delivery and execution. Spiro delivers a broad range of unique and impactful experiences for its clients, including meetings and events, exhibition and program management, environments and permanent installations, brand and product activations, and marketing and measurement.
Spiro Competition
Within brand experiences, Spiro generally competes on the basis of creative design, value, quality, and service offerings. Spiro maintains competitive advantages through its breadth of service offerings, worldwide network of resources, state-of-the-art creative solutions, advanced technology platforms, longstanding reputation for customer service and execution, and financial strength. Most known competitors are privately-held companies that provide limited public information regarding their operations. There is substantial competition from a large number of eco-forward elements, suchservice providers, however Spiro’s primary competitors are experiential marketing agencies and trade show design-and-build companies.
GES EXHIBITIONS
GES Exhibitions is a global exhibition services company with a legacy spanning over 90 years and teams throughout North America, Europe, and the Middle East. GES Exhibitions partners with leading exhibition and conference organizers as a fresh water/gray water systemfull-service provider of strategic and pint-sized, energy-efficient appliances. Elementslogistics solutions to manage the complexity of luxurytheir shows, including strategy, creative & design, registration & engagement, accommodations, logistics & management, material handling, overhead sign hanging, graphics and other rental and labor services. GES Exhibitions also serves as an in-house or preferred provider of electrical and other event services within event venues, including convention centers and conference hotels.
GES Exhibitions Competition
In the live events industry, GES Exhibitions generally competes across all classes of services and all markets on the basis of discernible differences, value, quality, price, convenience, and service. GES Exhibitions has a competitive advantage through its worldwide network of resources, history of serving as an extension of clients’ teams, experienced and knowledgeable personnel, client focus, creativity, reliable execution, proprietary technology platforms, and financial strength. All known United States competitors and most international
6
competitors are woven intoprivately held companies that provide limited public information regarding their operations. GES Exhibition’s primary competitor is a privately-held, United States-headquartered company; however, there is substantial competition from a large number of service providers in GES Exhibition’s other service offerings.
GES Seasonality and Show Rotation
GES’ live event activity can vary significantly from quarter to quarter and year to year depending on the design. Homes can accommodate upfrequency and timing of shows. Some shows are not held annually and some shift between quarters. Show rotation refers to four guests, withshows that occur less frequently than annually, as well as annual shows that shift quarters from one year to the next.
GES Strategic Transformation
Over the past few years, we accelerated our transformation and streamlining efforts at GES to significantly reduce costs and create a sliding barn-style door separating a compact sleeping area from the cozy living area.
RV and Cabin Park Development. In 2017, we began developing approximately 100 acres of undeveloped land adjacent to Glacier National Park that we acquired in connection with our 2014 purchase of the West Glacier properties. The new development will include a new RV and cabin park with 102 RV slips, 20 guest cabins, five employee housing cabins, guest registration, and a laundromat. Our site is ideally located at the Glacier Park entrance. We expect half of the new RV and Cabin Park to open during the 2019 season with the remainder opening for the 2020 season.
Financial information for our reportable segments and geographic areas is included in Note 22 – Segment Information of the Notes to Financial Statements (Part II, Item 8 of this 2017 Form 10-K).lower cost structure focused on servicing GES’ more profitable market segments.
Intellectual Property
Our intellectual property rights (including trademarks, patents, copyrights, registered designs, technology, and know-how) are material to our business.
We own or have the right to use numerous trademarks and patents in many countries. Depending on the country, trademarks remain valid for as long as we use them, or as long as we maintain their registration status. Trademark registrations are generally for renewable, fixed terms. We also have patents for current and potential products. Our patents cover inventions ranging from a modular structure having a load-bearing surface that we use in our event and exhibition services, to a surface-covering installation tool and method that reduces our labor costs and improves worker safety. Our U.S.United States issued utility patents extend for 20 years from the patent application filing date;date, and our U.S.United States issued design patents are currently granted for 14 years from the grant date. We also have an extensive design library. Many of the designs have copyright protection and we
have also registered many of the copyrights. In the U.S.,United States, copyright protection is for 95 years from the date of publication or 120 years from creation, whichever is shorter. While we believe that certain of our patents, trademarks, and copyrights have substantial value, we do not believe the loss of any one of them would not have a material adverse effect on our financial condition or results of operations.
Our Trademarks
Our U.S.United States registered trademarks and trademarks pending registration include Global Experience Specialists & design®, Spiro, GES®, Viad ®, GES Servicenter®, GES National Servicenter®, GES MarketWorks®Connect®, The Art and Science of Engagement®GES Exhibit Ready®, GES Measurement & Insight®, GES Project Central,Trade Show Rigging TSR®, TSE Trade Show Electrical & design®, Earth Explorers®, Compass Direct®, ethnoMetrics®, eXPRESSO®, FIT®, ON Services, ON Site Audio VisualFLYOVER® & design, FLYOVER®FLYOVER Canada & design®, eco-sense®FLYOVER Iceland & design®, FLYOVER LAS VEGAS®, ONPEAK®, Above Banff®, Alaska Denali Travel®, Alaska Denali Escapes®, Alaska Heritage Tours®, Kenai Fjords Tours & design®, Kenai Fjords Wilderness Lodge®, Seward Windsong Lodge & design®, Talkeetna Alaskan Lodge®,design, Explore Rockies®, Denali Backcountry Adventure®, Denali Backcountry Lodge®, and Denali Cabins®. Cabins & design®
We also own or have the right to use many registered trademarks and trademarks pending registration outside of the United States, including GES®, Spiro®, ShowTech®, Poken®Visit®, Visit Blitz,by GES®, Brewster Inc. & design®, Brewster Attractions Explore & design®, Brewster Hospitality Refresh & design®, Glacier Skywalk®, Above Banff®, Banff Gondola®, Explore Rockies®, FLYOVER®FLYOVER & design®, FLYOVER ICELAND & design, FLYOVER Canada & design, Forest Park Hotel®, Mount Royal, GES Event Intelligence AG®, Pursuit®, by Pursuit®, Kaffi Grandi, Ský Lagoon®, Soaring Over Canada®, Elk + Avenue Hotel®, Brewster Epic Summer Pass®, and escape.connect.refresh.explore®.
Government Regulation and Compliance
Compliance with legal requirements and government regulations represents a normal cost of doing business. The principal rules and regulations affecting our day-to-day business relate to transportation (such as regulations promulgated by the U.S. Department of Transportation and its state counterparts),our employees (such as regulations implemented by the Occupational Safety and Health Administration, equal employment opportunity laws, guidelines implemented pursuant to the Americans with Disabilities Act, and general federal and state employment laws), unionized labor (such as guidelines imposed by the National Labor Relations Act), and U.S.United States and Canadian regulations relating to national parks (such as regulations established by Parks Canada, the U.S.United States Department of the Interior, and the U.S.United States National Park Service)., United States and Canadian regulations relating to boating (such as regulations implemented by the United States Coast Guard and Canadian Coast Guard and state boating laws), transportation (such as regulations promulgated by the United States Department of Transportation and its state counterparts), and consumer and employee privacy regulations implemented by agencies in the jurisdictions where we operate.
Some of ourOur current and former businesses are subject to U.S. federal and state environmental regulations, including laws enacted under the Comprehensive Environmental Response, Compensation and Liability Act, or our state law counterparts.regulations. Compliance with federal, statethese provisions, and local environmental health and safetystewardship generally, is key to our ongoing operations. To date, these provisions including, but not limited to, those regulating the discharge of materials into the environment and other actions relating to the environment, have not had, and arewe do not expectedexpect them to have, a material effect on our capital expenditures, competitive position, financial condition or results of current and discontinued operations.
Employees
7
On July 18, 2020, an off-road Ice Explorer operated by our Pursuit business was involved in an accident while enroute to the Athabasca Glacier, resulting in three fatalities and multiple other serious injuries. We immediately reported the accident to our relevant insurance carriers, who have supported our investigation and subsequent claims relating to the accident. In May 2023, we resolved charges from the Canadian office of Occupational Health and Safety in relation to this accident, resulting in fines and related payments in an aggregate amount of $0.5 million Canadian dollars (approximately $0.3 million U.S. dollars). We continue to manage our legal defense of various claims from the victims and their families. In addition, we believe that our reserves and, subject to customary deductibles, our insurance coverage is sufficient to cover potential claims related to this accident.
Human Capital
Our people drive our success. We foster a culture that is equitable and inclusive, celebrates our talent, and prioritizes the safety and wellness of our teams, clients, and guests. We are committed to cultivating an environment where people of all different backgrounds feel a sense of belonging and contribute to our continued success.
We had the following number of employees as of December 31, 2017:2023:
Number of | ||||
GES | 2,765 | |||
Pursuit | 1,237 | |||
Viad Corporate | 33 | |||
Total | 4,035 | |||
|
| Number of Employees |
|
| Regular Full-Time Employees Covered by Collective Bargaining Agreements |
| ||
GES |
|
| 3,092 |
|
|
| 1,142 |
|
Pursuit |
|
| 365 |
|
|
| 41 |
|
Viad Corporate |
|
| 64 |
|
|
| — |
|
Total |
|
| 3,521 |
|
|
| 1,183 |
|
(1)
GES hires temporary employees on a show-by-show basis. The number of temporary employees fluctuates depending on the size and location of the exhibition or event. Pursuit hires approximately 2,000 seasonal employees during the peak summer months to help operate its attractions and hospitality properties.
We are governed by a Board of Directors comprised of sevencomprising eight non-employee directors and one employee director, and we have an executive management team consistingwith seven executive officers.
Diversity, equity, and inclusion
We take pride in our diverse community. We believe diversity and gender equality are critical to building a thriving workplace. We strive to create an environment where people of four executive officers.all different backgrounds feel a sense of belonging and contribute to our continued success. To make our workplace as inclusive and safe as possible, we have diversity and inclusion training integrated into our Always Honest Compliance and Ethics Program.
Financial Information about SegmentsWe do not discriminate against employees or applicants based on race, color, age, disability, ethnicity, citizenship, religion, sex, national origin, sexual orientation, genetics or genetic information, or any other categories protected by applicable law. We are committed to equal opportunity in all of our employment activities, including, but not limited to, recruitment, hiring, compensation, determination of benefits, training, promotion, and Geographic Areasdiscipline. We also provide reasonable accommodations to disabled persons, so all employees can achieve success in the workplace.
ReferAs a devoted steward to Note 22 – Segment Informationour communities, we are committed to increasing the diversity of our workforce to better reflect the communities in which we operate. We have undertaken initiatives, which go beyond legal compliance, to recruit from diverse audiences, such as minorities, women, and veterans. These efforts include leveraging inclusive job-posting sites and sharing job postings with community partners.
As part of our commitment to developing our employees and furthering their professional growth, we have programs in place including GES’ Business Development Mentor Program and newly launched training platforms for people leaders, including “Spiro.You” at Spiro, “Sales Leadership Program” at GES Exhibitions, and “Leaders’ Journey” at Pursuit. These programs connect employees with leaders within our organization and are designed to accelerate their career trajectory.
Our emphasis on a positive employee experience permeates throughout the organization and helps drive our success. For example, we conduct periodic employee engagement surveys to help us understand, recognize, and respect the diversity within our team. These
8
surveys help shape our training and development plans to ensure we are maintaining an inclusive culture by engaging, developing, and retaining our talented team members across the globe.
We believe that diversity, equity, and inclusion (“DEI”) is an ongoing journey, and we are proud of our DEI achievements so far, yet also cognizant of the Noteswork we still have ahead.
We take pride in the diverse and talented group of people that make up our Board of Directors, executive management, and employees. We understand the value that a diverse workforce of varying genders, ethnicity, background, and experience brings to Consolidated Financial Statements (Part II, Item 8the Company and we are focused on improving diversity at all levels.
An important part of our work and how we will ensure continual progress is by monitoring our diversity metrics. Out of a total of eight non-employee Board members, two are minorities of which one is a female for a total of three females on the Board. In 2023, almost 50% of our overall global workforce was female.
Workplace safety
The safety and well-being of team members, clients, and guests is a leading core value. We believe that maintaining strong standards of health and safety improves employee productivity and operational efficiency and enhances employee well-being.
We have a responsibility to maintain a safe and healthy work environment. We take prompt action to correct unsafe or hazardous conditions; we promptly report work-related accidents and injuries in accordance with established procedures and applicable laws; we strive to follow all established work rules related to safety; and we educate our workers to ensure they understand the risks, know how to handle hazardous products safely, and are familiar with available information for all hazardous materials used.
Both Pursuit and GES have implemented business-specific programs that support our commitment to the safety and well-being of our team members, clients, and guests.
Pursuit’s Safety Promise is our commitment to the safety and well-being of our guests and staff. Through this 2017 Form 10-K) program, we ensure that everyone feels safe when visiting or working at our experiences and that these places can continue to make a positive impact.
GES’ Always On Health and Safety Program was designed by our safety team to protect our employees, customers, partners, and event attendees. GES employees are committed to adhering to all local government and facility requirements and those established in conjunction with our partners and clients. Safe, reliable delivery of events is one of our most significant responsibilities.
In 2023, Viad had a global reportable incident rate of 1.2, which is below the U.S. industry standard average rateof 2.7. Global reportable incident rate is defined as employee incidents reportable in the operating jurisdiction. It is calculated as reportable incidents divided by payroll hours, multiplied by 200,000 to normalize the results. The overall industry average of incidence rates of non-fatal occupational injuries and illnesses for segment financial information.all industries including private, state, and local government, provided by U.S. Bureau of Labor Statistics 2022. Published data lags one calendar year. We continue to strive toward our goal of zero reportable incidents.
Always honest compliance and ethics program
We believe that maintaining a culture of high ethical standards gives us a distinct advantage in recruiting and retaining top talent, delivering the best experience for our customers, and attracting shareholders. Our Always Honest Compliance and Ethics Program, with the full support of our Board of Directors, has guided us since 1994 to translate integrity into our everyday behavior and actions. The Always Honest Compliance and Ethics Program guides our employees to act honestly, ethically, and always in compliance with the law.
Community involvement
Giving back to the community is very important to us. We are committed to making a positive impact within the communities we serve through educational programs such as GES’ Exhibition Sponsorships, volunteer services, and environmental/economic sustainable efforts in the community. Many of our locations pull together to volunteer and support local and national organizations. The Banff Jasper Collection was awarded the 2022 Corporate Citizen of the Year in Jasper, Alberta in recognition of its community building efforts. Pursuit also supported an exchange of learning and renewed its dedication to reconciliation with local Indigenous communities through a variety of initiatives and programs.
Rewards and performance management
Beyond a competitive salary, we offer a range of healthcare benefits to full-time employees, their spouses, and dependents. We encourage our employees to grow professionally with ongoing training and internal career opportunities. We utilize a performance review process, which aligns our core competencies to our core values, and a performance management cycle, which provides a framework designed to maximize performance and cultivate talent. Short- and long-term incentive compensation for senior managers and executives is based on the Company’s performance and/or stock performance.
9
We were incorporated in Delaware in 1991. Our common stock trades on the New York Stock Exchange under the symbol “VVI.”
Our website address is www.viad.com. All of our SECSecurities and Exchange Commission (“SEC”) filings, including our Annual Reportsannual report on Form 10-K, quarterly reports on Form 10-Q, current reports on Form 8-K, and amendments to those reports, are available free of charge on our website as soon as reasonably practicable after we electronically file that material with, or furnishedfurnish it to, the SEC. The information contained on our website is neither a part of, nor incorporated by reference into, this 20172023 Form 10-K.
Our investor relations website is www.viad.com/investors/investor-center/default.aspx and includes key information about our corporate governance initiatives, including our Corporate Governance Guidelines, our Board of Directors committee charters, our Code of Ethics, and information concerning our Board members and how to communicate with them.
Our operations and financial results are subject to known and unknown risks. As a result, past financial performance and historical trends may not be reliable indicators of our future performance.
Macroeconomic Risks
We are vulnerable to deterioration in general economic conditions. Our business is particularly sensitive to fluctuations in general economic conditions in the United States and other global markets in which we operate. A decline in global or regional economic conditions, or consumers’ fears that economic conditions will decline, whether due to inflation, elevated interest rates, or other economic, pandemic or geopolitical uncertainties could cause declining consumer or corporate spending, travel disruptions, unemployment, fluctuations in stock markets and interest rates, contraction of credit availability, or other dynamic factors generally affecting economic conditions. For example, high inflation and the resulting rise in interest rates have increased our interest expense on our variable rate debt. The additional impacts of these macroeconomic developments on our operations cannot be predicted with certainty. The success of our GES business largely depends on the number of exhibitions or other live events held, exhibitor presence and attendee volume at those events, the size of marketing expenditures at those events, and on the strength of particular industries that support those events. The number and size of live events and related marketing expenditures generally decrease when the economy weakens. We also could suffer from reduced spending for our services because many live event marketing budgets are partly discretionary and are frequently among the first expenditures reduced when economic conditions deteriorate. In addition, revenue from our Pursuit operations depends largely on the amount of disposable income that consumers have available for travel and vacations, which decreases during periods of weak general economic conditions. As a result, any deterioration in general economic conditions could materially and adversely affect our business, financial condition, and results of operations.
Travel industry disruptions, particularly those affecting the hotel and airline industries, could adversely affect our business. Our business depends largely on the ability and willingness of people, whether exhibitors, event attendees, tourists, or others, to travel. Factors adversely affecting the travel industry, and particularly the airline and hotel industries, generally also adversely affect our business and results of operations. Factors that could adversely affect the travel industry include high or rising fuel prices, levels of consumer discretionary or corporate marketing spendings, international political instability and hostilities, acts of terrorism, weather conditions, health epidemics, pandemics and endemics, and airline accidents. For example, our business, operations and financial results were negatively impacted by dramatically reduced travel, demand for travel-related services, and live event experiences resulting from lockdowns and other restrictions related to the COVID-19 pandemic. A decline in travel-related consumer discretionary or corporate marketing spend, or the occurrence of other pandemic or geopolitical events or hostilities that affect the availability and pricing of air travel and accommodations, could materially and adversely affect our business and results of operations.
Our overall level of indebtedness, as well as our financial covenants under our revolving credit facility, could limit our operational and financial flexibility and make us more vulnerable to adverse economic conditions.As of December 31, 2023, our debt totaled $462.1 million, including $378 million outstanding on our $500 million credit facility (the “2021 Credit Facility”), financing lease obligations of $63.9 million, and $20.2 million in other debt. The 2021 Credit Facility includes a term loan (“Term Loan B”) with an outstanding balance of $321 million as of December 31, 2023 and a $170 million revolving credit facility (“Revolving Credit Facility”). As of December 31, 2023, capacity remaining under the Revolving Credit Facility was $108.0 million. As a result of our indebtedness, we are required to make interest and principal payments on our borrowings, which are significant. These payments reduce our cash available, which could limit our ability to respond to market conditions or take advantage of potential acquisitions and strategic investments. To manage our exposure to interest rate movements, we entered into an interest rate cap agreement that provides an interest rate hedge on $300 million of borrowings for a two-year period, which commenced on January 31, 2023. We also we entered into an amendment to the 2021 Credit Facility on October 6, 2023, which among other things, increased the principal amount of the revolving credit facility by $70 million, bringing the total amount of revolving capacity to $170 million. In connection with the amendment, we prepaid $70 million of the outstanding balance on our existing Term Loan B.
In addition, our ability to draw on our revolving credit facility depends on our ability to meet certain financial covenants. This exposes us to various risks, uncertainties, and events beyond our control, including but not limited to the impact of adverse economic conditions (including inflation, rising interest rates, or a recession), public health crises, and other factors described herein. If we are unable to maintain compliance with these covenants, our lenders may exercise remedies against us, including the acceleration of any outstanding
10
indebtedness on our revolving credit facility. Under this circumstance, we might not have sufficient funds or other resources to satisfy all of our obligations, which could materially and adversely affect our business and results of operations.
Transportation disruptions and increases in transportation costs could adversely affect our business and results of operations. GES relies on independent transportation carriers to send materials and exhibits to and from exhibitions, warehouses, and customer facilities. If our customers and suppliers are unable to secure the services of those independent transportation carriers at favorable rates, it could materially and adversely affect our business and results of operations. In addition, disruption of transportation services, including import/export services due to weather-related problems; labor strikes; lockouts; or other events could adversely affect our ability to supply services to customers and could cause the cancellation or curtailment of exhibitions, which could materially and adversely affect our business and results of operations.
Natural disasters, weather conditions, accidents, and other catastrophic events could negatively affect our business. The occurrence of catastrophic events ranging from natural disasters (such as hurricanes, fires, floods, volcanoes, and earthquakes), acts of war or terrorism, accidents involving our travel offerings or experiences, the effects of climate change, including any impact of global warming, or the prospect of these events could disrupt our business. Changes in climates may increase the frequency and intensity of adverse weather patterns and make certain destinations less desirable.
Such catastrophic events have had, and could in the future have, an adverse impact on Pursuit, which is heavily dependent on the ability and willingness of its guests to travel and/or visit our attractions. Pursuit guests tend to delay or postpone vacations if natural conditions differ from those that typically prevail at competing lodges, resorts, and attractions, and catastrophic events and heightened travel security measures instituted in response to such events could impede the guests’ ability to travel, and interrupt our business operations, including damaging our properties. For example, the accident on July 18, 2020, at Pursuit’s Glacier Adventure attraction, which involved one of our off-road Ice Explorers and resulted in three fatalities and other serious injuries, may have a negative impact on our reputation and traveler willingness to visit that attraction in the future.
Such catastrophic events could also have a negative impact on GES, causing a cancellation or relocation of exhibitions and other events held in public venues or disrupt the services we provide to our customers at convention centers, exhibition halls, hotels, and other public venues. Such events could also have a negative impact on GES’ production facilities, preventing us from timely completing exhibit fabrication and other projects for customers. In addition, unfavorable media attention, or negative publicity, in the wake of any catastrophic event or accident could damage our reputation or reduce the demand for our services. If the conditions arising from such events persist or worsen, they could materially and adversely affect our results of operations and financial condition.
Strategic, Business, and Operational Risks
The seasonality of our business makes us particularly sensitive to adverse events during peak periods. The peak activity for our Pursuit business is during the summer months, as the vast majority of Pursuit’s revenue is earned in the second and third quarters. Our GES exhibition and event activity varies significantly because it is based on the frequency and timing of shows, many of which are not held each year, and which may shift between quarters. If adverse events or conditions occur during these peak periods, for example natural disasters such as hurricanes, volcanoes, forest fires and/or smoke resulting from those events or a similar event, our results of operations could be materially and adversely affected.
New capital projects may not be commercially successful. From time to time, we pursue capital projects in order to enhance and expand our business, such as FlyOver, which includes FlyOver Canada in Vancouver, FlyOver Iceland, FlyOver Las Vegas, and the current development of FlyOver Chicago and FlyOver Canada Toronto, as well as other efforts to upgrade and update some of our Pursuit offerings. Capital projects are subject to a number of risks, including the failure to achieve established financial and strategic goals. For example, our FlyOver attractions are all considered one reporting unit and goodwill is assigned to, and tested at, the reporting unit level. Significant reductions in FlyOver’s expected future revenue, operating income, or cash flow forecasts and projections, or changes in macroeconomic facts and circumstances, particularly high inflation and the resulting rise in interest rates, may result in impairment charges in the future. Capital projects are also subject to unanticipated delays and cost overruns as well as additional project-specific risks. For example, we had to postpone FlyOver Canada Toronto due to permitting and other related delays. A prolonged delay in a capital project, or our failure to accurately predict the revenue or profit that will be generated from a project, could prevent it from performing in accordance with our commercial expectations and could materially and adversely affect our business and results of operations.
We operate in a highly competitive and dynamic industry. Competition in the live events markets is driven by price and service quality, among other factors. To the extent competitors seek to gain or retain market presence through aggressive underpricing strategies, we may be required to lower our prices and rates to avoid the loss of related business. Moreover, customer consolidations and other actions within the industry have caused downward pricing pressure for our products and services and could affect our ability to negotiate favorable terms with our customers. If we are unable to anticipate and respond as effectively as our competitors to changing business conditions, including new technologies and business models, we could lose market share. Our inability to meet the challenges presented by the competitive and dynamic environment of our industry could materially and adversely affect our results of operations.
11
We depend on our large exhibition event clients to renew their service contracts and on our exclusive right to provide those services. GES has a number of large exhibition event organizers and large customer accounts. If any of these large clients do not renew their service contracts, our results of operations could be materially and adversely affected.
Moreover, when event organizers hire GES as the official services contractor, they usually also grant GES an exclusive right to perform material handling, electrical, rigging, and other services at the exhibition facility. However, some exhibition facilities have taken certain steps to in-source certain event services (either by performing the services themselves or by hiring a separate service provider) as a result of conditions generally affecting their industry, such as an increased supply of or reduced demand for exhibition space. If exhibition facilities choose to in-source certain event services, GES will lose the ability to provide certain event services, and our results of operations could be materially and adversely affected.
Show rotation affects our profitability and makes comparisons between periods difficult. GES results are largely dependent upon the frequency, timing, and location of exhibitions and events. Some large exhibitions are not held annually (they may be held once every two, three, or four years) or may be held at different times of the year from when they were previously held. In addition, the same exhibition may change locations from year to year resulting in lower margins if the exhibition shifts to a higher-cost location. Any of these factors could cause our results of operations to fluctuate significantly from quarter to quarter or from year to year, making periodic comparisons difficult.
Completed acquisitions may not perform as anticipated or be integrated as planned. We regularly evaluate and pursue opportunities to acquire businesses that complement, enhance, or expand our current business, or offer growth opportunities. Our acquired businesses might not meet our financial and non-financial expectations or yield anticipated benefits. Our success depends, in part, on our ability to conform controls, policies and procedures, and business cultures; consolidate and streamline operations and infrastructures; identify and eliminate redundant and underperforming operations and assets; manage inefficiencies associated with the integration of operations; and retain the acquired business’business’s key personnel and customers. Moreover, our acquisition activity potentially increases our debt, subjectsmay subject us to new regulatory requirements, distractsdistract our senior management and employees, and exposesexpose us to unknown liabilities or contingencies that we may fail to, or are unable to identify prior to closing. If our acquisitions cause uswe are forced to make changes to our business strategy or if external conditions adversely affect our business operations, such as unfavorable macroeconomic conditions (particularly high inflation and the resulting rise in interest rates), it may be difficult for us to accurately forecast revenue, operating income, or cash flow, and we may also be required to record an impairment chargecharges in the future. Additionally, we may borrow funds to goodwill or intangible assets.finance strategic acquisitions. Debt leverage resulting from future acquisitions would reduce our debt capacity, increase our interest expense, and limit our ability to capitalize on future business opportunities. Such borrowings may also be subject to fluctuations in interest rates. Any of these risks could materially and adversely affect our business, product and service sales, financial condition, and results of operations.
We depend on our large exhibition event clients to renew their service contracts and on our exclusive right to provide those services. During 2017, no single client accounted for more than 6% of our consolidated revenue. However, GES has a number of large exhibition event organizers and large customer accounts. If any of these large clients do not renew their service contracts, our results of operations could be materially adversely affected.
Moreover, when event organizers hire GES as the official services contractor, they also grant GES an exclusive right to perform electrical, plumbing services, and other services (the “Event Services”) at the exhibition facility. However, exhibition facilities are under increasing financial pressure to in-source Event Services (either by performing the services themselves or by hiring a separate service provider) as a result of conditions generally affecting their industry, such as an increased supply of exhibition space. If a large number of exhibition facilities choose to in-source Event Services, GES will lose the ability to provide Event Services despite being hired as the official services contractor, and our results of operations could be materially and adversely affected.
Our business is relationship driven. Our GES business is heavily focused on client relationships, and, specifically, on having close collaboration and interaction with our clients. To be successful, our account team must be able to understand a client’s desires and expectations in order to provide top-quality service. If we lose a key member of our account team, we could also lose customers and our results of operations could be materially and adversely affected.
We operate in highly competitive industries. We are engaged in a number of highly competitive industries. Competition in the Live Events industry and the exhibits and experiential environments industries is driven by price and service quality, among other factors. To the extent competitors seek to gain or retain their market presence through aggressive underpricing strategies, we may be required to lower our prices and rates to avoid the loss of related business, thereby adversely affecting our results of operations. In addition, if we are unable to anticipate and respond as effectively as competitors to changing business conditions, including new technologies and business models, we could lose market share to our competitors. Our inability to meet the challenges presented by the competitive environment could materially and adversely affect our results of operations.
Travel industry disruptions, particularly those affecting the hotel and airline industries, could adversely affect our business. Our business depends largely on the ability and willingness of people, whether exhibitors, exhibition attendees, or others, to travel. Factors adversely affecting the travel industry, and particularly the airline and hotel industries, generally also adversely affect our business and results of operations. Factors that could adversely affect the travel industry include high or rising fuel prices, increased security and passport requirements, weather conditions, airline accidents, and international political instability and hostilities. Any of these factors, or other unexpected events that affect the availability and pricing of air travel and accommodations, could materially and adversely affect our business and results of operations.
Transportation disruptions and increases in transportation costs could adversely affect our business and results of operations. GES relies on independent transportation carriers to send materials and exhibits to and from exhibition, warehouse, and customer facilities. If our customers and suppliers are unable to secure the services of those independent transportation carriers at favorable rates, it could materially and adversely affect our business and results of operations. In addition, disruption of transportation services due to weather-related problems, labor strikes, lockouts, or other events could adversely affect our ability to supply services to customers and could cause the cancellation of exhibitions, which could materially and adversely affect our business and results of operations.
The seasonality of our business makes us particularly sensitive to adverse events during peak periods. Our GES exhibition and event activity varies significantly because it is based on the frequency and timing of shows, many of which are not held each year and which may shift between quarters. The peak activity for our Pursuit business is during the summer months. Consequently, during 2017, 87% of Pursuit’s revenue was earned in the second and third quarters. If adverse events or conditions occur during these peak periods our results of operations could be materially and adversely affected.
Terrorist attacks, natural disasters, or other catastrophic events could negatively affect our business. The occurrence of catastrophic events ranging from natural disasters (such as hurricanes, fires, and floods), health epidemics or pandemics, acts of war or terrorism, accidents involving our travel offerings or experiences, or the prospect of these events could disrupt our business. Such catastrophic events could have a negative impact on GES’ production facilities, preventing us from timely completing exhibit fabrication and other projects for customers. They could also cause a cancellation of exhibitions and other events held in public venues or disrupt the services we provide to our customers at convention centers, exhibition halls, hotels, and other public venues. Such catastrophic events could also have an adverse impact on Pursuit, which is heavily dependent on the ability and willingness of its guests to travel. Pursuit guests tend to delay or postpone vacations if natural conditions differ from those that typically prevail at competing lodges, resorts and attractions, and catastrophic events could impede the guests’ ability to travel, interrupt our business operations, and/or cause damage to our properties. In addition, unfavorable media attention, or negative publicity, in the wake of a catastrophic event could damage our reputation or reduce the demand for our services. If the conditions arising from such events persist or worsen, they could materially and adversely affect our results of operations and financial condition.
We are vulnerable to deterioration in general economic conditions. Our business is sensitive to fluctuations in general economic conditions that affect the cost of materials and operating supplies. The success of our GES business largely depends on the number of exhibitions held, the size of exhibitors’ marketing expenditures, and on the strength of particular industries in which exhibitors operate. The number and size of exhibitions generally decrease when the economy weakens. We also suffer from reduced spending for our services because many exhibitors’ marketing budgets are partly discretionary, and are frequently among the first expenditures reduced when economic conditions deteriorate. Consequently, marketing expenditures often are not increased until economic conditions improve. Revenue from our Pursuit operation depends largely on the amount of disposable income that consumers have available for travel and vacations. This amount decreases during periods of weak general economic conditions. Any of these risks could materially and adversely affect our business, product sales, financial condition, and results of operations.
Recent U.S. tax legislation may materially and adversely affect our financial condition, results of operations, and cash flows. The Tax Cuts and Jobs Act (the “Tax Act”), enacted in late 2017, makes significant changes to U.S. tax laws and includes numerous provisions that could affect our business. For instance, as a result of lower corporate tax rates, the Tax Act tends to reduce both the value of deferred tax assets and the amount of deferred tax liabilities. It also limits interest rate deductions and the amount of net operating losses that can be used each year and alters the expensing of capital expenditures. Other provisions have tax consequences for our international operations. The Tax Act is unclear in certain respects and will require interpretations and implementing regulations by the Internal Revenue Service, as well as state tax authorities. The Tax Act could also be subject to amendments and technical corrections, any of which could lessen or increase the adverse impacts on our business operations. The accounting treatment of these tax law changes is complex, and some of the changes may affect both current and future periods. Others will primarily affect future periods. As we have discussed elsewhere in this Report on Form 10-K, we believe our analysis and computations of the tax effects of the Tax Act on financial results is substantially, but not entirely, complete. Consistent with guidance from the SEC, our financial statements reflect our estimates of the tax effects of the Tax Act on our business. Although we believe these estimates are reasonable, they are
provisional and may be adjusted prior to the end of 2018. Any such adjustments could affect our current or future financial statements, or both.We continue to examine the impact of this tax reform legislation, and as its overall impact is uncertain, we note that the Tax Act could adversely affect our business and financial condition.
We are subject to currency exchange rate fluctuations.We have operations outside of the U.S.United States primarily in Canada, the United Kingdom, Iceland, the Netherlands, Germany,the Middle East, and to a lesser extent, in certain other countries.Germany. During 2017, GES International and Pursuit’s2023, our international operations accounted for approximately 30%44% of our consolidated revenue and 58%89% of our segment operating income. Consequently, a significant portion of our business is exposed to currency exchange rate fluctuations. We do not currently hedge equity risk arising from the translation of non-United States denominated assets and liabilities. Our financial results and capital ratios are sensitive to movements in currency exchange rates because a large portion of our assets, liabilities, revenue, and expenses must be translated into U.S. dollars for reporting purposes. The unrealized gains or losses resulting from the currency translation are included as a component of accumulated other comprehensive income (loss) in our consolidated balance sheets.Consolidated Balance Sheets. We also have certain loans and leases in currencies other than the entity’s functional currency, which results in gains or losses as exchange rates fluctuate. As a result, significant fluctuations in currency exchange rates could result in material changes to our results of operations and the net equity position we report in our consolidated balance sheets. Consolidated Financial Statements.
Liabilities relating to prior and discontinued operations may adversely affect our results of operations. We and our predecessors have a corporate history spanning decades and involving diverse businesses. Some of those businesses owned properties and used raw materials that have been, and may continue to be, subject to litigation. Moreover, some of the raw materials used and the waste produced by those businesses have been and are the subject of United States federal and state environmental regulations, including laws enacted under the Comprehensive Environmental Response, Compensation and Liability Act, or its state law counterparts. In addition, we may incur other liabilities resulting from indemnification claims involving previously sold properties and subsidiaries, or obligations under defined benefit plans or other employee plans, as well as claims from past operations of predecessors or their subsidiaries. Although we believe we have adequate reserves and sufficient insurance coverage to cover those potential liabilities, future events or proceedings could render our reserves or insurance protections inadequate, any of which could materially and adversely affect our business and results of operations.
Our insurance coverage may not be adequate to cover all possible losses that we could suffer, and our insurance costs may increase. Although we carry liability insurance to cover possible incidents, there can be no assurance that our insurance coverage will be sufficient to cover the full extent of all losses or liabilities, that we will be able to obtain coverage at commercially reasonable rates, or that we will be able to obtain adequate coverage should a catastrophic incident occur at our attractions or hospitality properties. We may be sued
12
for substantial damages in the event of an actual or alleged incident. An incident occurring at our attractions or hospitality properties could reduce visitation, increase insurance premiums, and could materially and adversely affect our business and results of operations.
Labor and Employment Risks
Our business is relationship driven. Our GES business is heavily focused on client relationships, and, specifically, on having close collaboration and interaction with our clients. To be successful, our account teams must be able to understand clients’ desires and expectations in order to provide top-quality service. If we are unable to maintain our client relationships, including due to the loss of key members of our account teams, we could also lose customers and our results of operations could be materially and adversely affected.
If we lose any of our key personnel, our ability to manage our business and continue our growth could be negatively impacted. Our success, at least in part, depends on the continued contributions of our executive team and key personnel. If one or more of our key personnel were to resign or otherwise terminate employment with us, we could experience operational disruptions. In addition, we do not currently hedge equitymaintain key person insurance on any of our executive employees or key personnel.
Union-represented labor increases our risk arising fromof higher labor costs and work stoppages. Significant portions of our employees are unionized. We have approximately 100 collective bargaining agreements, and we are required to renegotiate approximately one-third of those each year. If we increase wages or benefits as a result of labor negotiations, either our operating margins will suffer, or we could increase the translationcost of non-U.S. denominated assetsour services to our customers, which could lead those customers to turn to other vendors with lower prices. Either event could materially and liabilities.adversely affect our business and results of operations.
Additionally, if we are unable to reach an agreement with a union during the collective bargaining process, the union may strike or carry out other types of work stoppages. If this were to occur, we might be unable to find substitute workers with the necessary skills to perform many of the services, or we may incur additional costs to do so, both of which could materially and adversely affect our business and results of operations.
Our participation in multi-employer pension plans could substantially increase our pension costs. We sponsor a number of defined benefit plans for our U.S.United States and Canada-based employees. WeIn addition, we are obligated to contribute to multi-employer pension plans under collective-bargainingcollective bargaining agreements covering our union-represented employees. We contributed $26.6$19.0 million in 2017 and $25.82023, $17.5 million in 20162022, and $7.1 million in 2021 to those multi-employer pension plans. These multi-employer plans are managed by third-partyThird-party boards of trustees.trustees manage these multi-employer plans. Based upon the information we receive from plan administrators, we believe that several of those multi-employer plans are underfunded. The Pension Protection Act of 2006 requires us to reduce the underfunded status over defined time periods. Moreover, we would be required to make additional payments of our proportionate share of a plan’s unfunded vested liabilities if a plan terminates, or other contributing employers withdraw, due to insolvency or other reasons, or if we voluntarily withdraw from a plan. At this time, we cannot determine withdo not anticipate triggering any certainty the amount of additional funding, ifsignificant withdrawal from any multi-employer pension plan to which we could be required to make to those plans.currently contribute. However, significant plan contribution increases could materially and adversely affect our consolidated financial condition, results of operations, and cash flows. Refer to Note 1719 – Pension and Postretirement Benefits of the Notes to Consolidated Financial Statements (Part II, Item 8 of this 2017our 2023 Form 10-K) for further information.
Union-represented labor increases our risk of higher labor costsCybersecurity and work stoppages. A significant portion of our employees are unionized. We have approximately 100 collective-bargaining agreements, and we are required to renegotiate approximately one-third of those each year. If we increase wages or benefits as a result of labor negotiations, either our operating margins will suffer, or we could increase the cost of our services to our customers, which could lead those customers to turn to other vendors with lower prices. Either event could materially and adversely affect our business and results of operations.Data Privacy Risks
Additionally, if we are unable to reach an agreement with a union during the collective-bargaining process, the union may strike or carry out other types of work stoppages. If that happens, we might be unable to find substitute workers with the necessary skills to perform many of the services, or we may incur additional costs to do so, both of which could materially and adversely affect our business and results of operations.
We are vulnerable to cybersecurity attacks and threats. We regularly collect and process credit, financial, and other personal, sensitive, and confidential information from individuals and entities who attend or participate in events and exhibitions that we produce, or who visit our attractions and other offerings. In addition, our Our devices, servers, cloud-based solutions, computer systems, and business systems are vulnerable to cybersecurity risk, including cyberattacks, or we may be the target of email scams that attempt to acquire personal information and company assets. Many of our employees work remotely, which magnifies the importance of integrity of our remote access security measures. Despite our efforts to protect ourselves with insurance, and create security barriers to such threats, including regularly reviewing our systems for vulnerabilities and continually updating our protections, and protect ourselves with insurance, we might not be able to entirely mitigate these risks. Our failure to effectively prevent, detect, and recover from the increasing number and sophistication of information security threats could lead to business interruptions, delays or loss of critical data, misuse, modification, or destruction of information, including trade secrets and confidential business information, reputational damage, and third-party claims, any of which could adverselymaterially and materiallyadversely affect our results of operations. Moreover, the cost of protecting against cybersecurity attacks and threats is expensive and expected to increase going forward.
Laws and regulations relating to the handling of personal data are evolving and could result in increased costs, legal claims, or fines. We store and process the personally identifiable information fromof our customers, employees, and third parties with whom we have business relationships. LegalThe legal requirements relating torestricting the collection, storage, handling,way we store, collect, handle, and transfer of personal datacontinue to evolve, and could lead to burdensome or inconsistent requirements affecting the locationthere are an increasing number of authorities issuing privacy laws and movement of our customerregulations. These data privacy laws and internal employee data as well as the management of the data. For example, in July 2016, the EU and the U.S. agreed on a mechanism for companies to transfer data from EU member states to the U.S. This framework, called the Privacy Shield, is intended to address shortcomingsidentified by the European Court of Justice in a predecessor mechanism.
The Privacy Shield and other mechanismsregulations are currently subject to challenges in European courts, which may lead todiffering interpretations, creating uncertainty about the legal basis for data transfersand inconsistency across the Atlantic. Also, in May 2018, the EU’s new General Data Protection Regulation (GDPR) will replace the existing EU Data Protection Directive, and it will have a significant impact on how businesses can collect and process the personal data of EU individuals. The GDPR includes a requirement for businesses to self-report personal data breaches to the relevant supervisory authority and, under certain circumstances, to the affected data subjects. It also gives additional rights to individuals whose data are processed, including the “right to erasure” (also commonly known as the right to be forgotten) by having their records erased and the right to data portability. Compliancejurisdictions. Our compliance with thethese myriad requirements could involve making changes in our services, business practices, or internal systems, thatany of which could likely increase our costs, lower revenue, or reduce efficiency, or make it more difficult to compete with Non-U.S.-based firms.efficiency. Our failure to comply with existing or new rules could result in significant penalties or orders to stop the alleged noncompliant activity, litigation, adverse publicity, or could cause our customers to lose trust in our services.services. In addition, if the third parties we work with violate applicable laws, contractual obligations to us, or suffer a security breach, those violations could also
13
put us in breach of our obligations under privacy laws and regulations. In addition, the costs of maintaining adequate protection, including insurance protection against such threats, as they develop in the future (or as legal requirements related to data security increase) are expected to increase and could be material. Any of these risks could materially and adversely affect our business and results of operations.
New capital projects may not be commercially successful. From time to time, we pursue capital projects, such as our current efforts to upgrade some of our Pursuit offerings in order to seize opportunities that complement, enhance, and expand our business. Capital projects are subject to a number of risks, including unanticipated delays, cost overruns, and the failure to achieve established financial and strategic goals, as well as additional risks specific to a project. The occurrence of any of these events could prevent a new capital project from performing in accordance with our commercial expectations and could materially and adversely affect our business and results of operations.
Show rotation affects our profitability and makes comparisons between periods difficult. GES results are largely dependent upon the frequency, timing, and location of exhibitions and events. Some large exhibitions are not held annually (they may be held once every two or three years or longer) or may be held at different times of year from when they were previously held. In addition, the same exhibition may change locations from year to year resulting in lower margins if the exhibition shifts to a higher-cost location. Any of these factors could cause our results of operations to fluctuate significantly from quarter to quarter or from year to year, making periodic comparisons difficult.
The United Kingdom’s exit from the European Union could adversely affect our business. We operate substantial parts of our EU businesses from U.K-based entities. The June 23, 2016 U.K. referendum resulted in a determination that the U.K. should exit the EU. In March 2017, the U.K. government initiated the exit process under Article 50 of the Treaty of the EU, commencing a period of up to two years for the United Kingdom and the other EU member states to negotiate the terms of the withdrawal. The uncertainty surrounding the timing, terms and consequences of the U.K.’s exit could adversely impact customer and investor confidence, result in additional market volatility and adversely affect our businesses and our results of operations and financial condition. Once the U.K. exits from the EU, the regulatory and legal environment that would then govern our U.K. operations will depend on, in certain respects, the nature of the arrangements agreed to between the U.K., the EU, and other trading partners. It is likely that changes to our legal entity structure and operations in Europe will be required as a result of these arrangements, which might result in a less efficient operating model across our European legal entities.
Liabilities relating to prior and discontinued operations may adversely affect our results of operations. We, and our predecessors, have a corporate history spanning over eight decades and involving approximately 2,400 previous subsidiaries in diverse businesses, such as the manufacturing of locomotives, buses, industrial chemicals, fertilizers, pharmaceuticals, leather, textiles, food, and fresh meats. Some of those businesses used raw materials that have been, and may continue to be, subject to litigation. Moreover, some of the raw materials used and the waste produced by those businesses have been and are the subject of U.S. federal and state environmental regulations, including laws enacted under the Comprehensive Environmental Response, Compensation and Liability Act, or its state law counterparts. In addition, we may incur other liabilities, resulting from indemnification claims involving previously sold subsidiaries, as well as from past operations of predecessors or their subsidiaries. Although we believe we have adequate reserves and sufficient insurance coverage to cover those future liabilities, future events or proceedings could contradict with current assumptions, which could cause reserves or insurance to become inadequate and, ultimately, materially and adversely affect our results of operations.
Item 1B. Unresolved Staff Comments
None.
Item 1C. CYBERSECURITY
Cybersecurity Risk Management and Strategy
We maintain a team, tools, policies, and processes for identifying, assessing, and managing material risks from cybersecurity threats. Threats like malware attacks, system vulnerabilities, and data breaches are actively identified, monitored, evaluated, and mitigated along with other Company risks. Our security team maintains centralized documentation regarding known security risks and mitigation. Consideration of material risks from cyber threats is integrated into our enterprise risk management processes and is a standing agenda item for discussion at our Audit Committee meetings. An Information Security Executive Committee representing multiple areas of the Company is responsible for assessing material risks from cybersecurity threats and represents multiple functions of the business including Finance, Human Resources, Legal, and the Information Technology (“IT”) departments. We have certain employee cybersecurity awareness campaigns and training designed to help promote a culture of cybersecurity awareness throughout the organization. Cybersecurity tools, processes, policies, and controls are periodically reviewed and updated in response to changes in the business environment and evolving threats, as well as to align with broader risk management objectives.
Our information security function, led by our Chief Information Officer (“CIO”), implements and maintains the processes and controls to help identify, assess, and manage material risks from cybersecurity threats. These controls include, but are not limited to, the following Center for Internet Security (“CIS”) controls:
Supporting these controls are specific security measures that include threat intelligence monitoring, vulnerability scanning, and policy enforcement.
We use third-party service providers to assist us in identifying, assessing, and managing material risks from cybersecurity threats, including professional service firms, legal counsel, threat intelligence service providers, cybersecurity consultants, cybersecurity software providers, and forensic investigators. We have a Cybersecurity Incident Response Plan (“IRP”) that includes procedures for responding to and, to the extent applicable, disclosing material cybersecurity incidents in a timely manner. We have third-party risk management processes designed to assess risks from key vendors and suppliers, including application providers and hosting companies. Key software service providers utilized by the Company undergo a review process for security, reliability, and effectiveness. We have processes in place to address access to our network by such third parties, to the extent applicable, including network access controls designed to provide access on a ‘least privilege’ basis.
For a discussion of risks from cybersecurity threats that may materially affect the Company, see “Risk Factors” under the heading “Cybersecurity and Data Privacy Risks.” (Part I, Item 1A of this 2023 Form 10-K).
Cybersecurity Governance
Cybersecurity risk management is a part of our risk management process and is subject to oversight by our Board of Directors and management. Our Board of Directors has delegated oversight and mitigation of risks from cybersecurity threats to our Audit Committee. Our Audit Committee receives quarterly reports from either our CIO or our General Counsel concerning any significant cybersecurity threats, risks, and the tools and processes we have implemented for mitigation. Our cybersecurity risk assessment and management processes are implemented and maintained by certain members of management including the following:
14
We operate servicelease our corporate headquarters in Scottsdale, Arizona. Our other principal properties are owned or productionleased by Pursuit and GES.
Pursuit primarily owns its properties, both domestically and internationally, other than its leases for properties related to the FlyOver attractions. Pursuit’s properties mainly include attractions, hotels and lodges, retail stores, and offices. Properties located in Canada are subject to multiple long-term ground leases with their respective governments. For further information on Pursuit’s attractions and hospitality assets, refer to “Business” (Part I, Item 1 of this 2023 Form 10-K), which information is incorporated by reference herein.
GES leases its properties, both domestically and internationally. GES properties consist of offices and multi-use facilities. Multi-use facilities and maintaininclude manufacturing, sales and service officesdesign, office, storage and/or warehouse, and truck marshaling yards. Multi-use facilities vary in size. Our largest multi-use facility in the United States Canada, the United Kingdom, Germany, the United Arab Emirates, the Netherlands, Switzerland, Romania, and Hong Kong. Our principal properties are operated by GES, Pursuit, and Viad Corporate.
GES
|
| Offices |
|
| Multi-use Facilities(1) |
| ||||||||||
|
| Owned |
|
| Leased |
|
| Owned |
|
| Leased |
| ||||
GES U.S. |
|
| — |
|
|
| 19 |
|
|
| 2 |
|
|
| 30 |
|
GES International: |
|
|
|
|
|
|
|
|
|
|
|
|
|
|
|
|
Canada |
|
| — |
|
|
| 4 |
|
|
| — |
|
|
| 7 |
|
United Kingdom |
|
| — |
|
|
| 3 |
|
|
| — |
|
|
| 6 |
|
Germany |
|
| — |
|
|
| 1 |
|
|
| — |
|
|
| 2 |
|
United Arab Emirates |
|
| — |
|
|
| 1 |
|
|
| — |
|
|
| 2 |
|
Netherlands |
|
| — |
|
|
| 1 |
|
|
| — |
|
|
| 2 |
|
Switzerland |
|
| — |
|
|
| 1 |
|
|
| — |
|
|
| — |
|
Romania |
|
| — |
|
|
| — |
|
|
| — |
|
|
| 1 |
|
Hong Kong |
|
| — |
|
|
| 1 |
|
|
| — |
|
|
| — |
|
Total GES International |
|
| — |
|
|
| 12 |
|
|
| — |
|
|
| 20 |
|
Total GES |
|
| — |
|
|
| 31 |
|
|
| 2 |
|
|
| 50 |
|
|
|
Pursuit
|
| Owned |
|
| Leased |
| ||
Offices(1) |
|
| 2 |
|
|
| 5 |
|
Retail stores |
|
| 23 |
|
|
| 1 |
|
Bus terminal |
|
| 1 |
|
|
| — |
|
Garages(1) |
|
| 4 |
|
|
| 2 |
|
Attractions(1) |
|
| 7 |
|
|
| — |
|
Hotels/Lodges(1)(2) |
|
| 15 |
|
|
| — |
|
Total Pursuit |
|
| 52 |
|
|
| 8 |
|
|
|
|
|
Viad Headquarters
Our headquarters is leased and approximates 19,900approximately 1,447,000 square feet and our largest foreign multi-use facility is locatedin Canada at 1850 North Central Avenue, Suite 1900 in Phoenix, Arizona 85004-4565.approximately 81,000 square feet.
We believe our facilitiesowned and leased properties are adequate and suitable for our business operations and that capacity is sufficient for current needs. For additional information related to our lease obligations, refer to Note 1112 – Debt and Capital LeaseFinance Obligations and Note 1921 – Leases and Other of the Notes to Consolidated Financial Statements (Part II, Item 8 of this 20172023 Form 10-K)., which information is incorporated by reference herein.
Refer to Note 2022 – Litigation, Claims, Contingencies, and Other of the Notes to Consolidated Financial Statements (Part II, Item 8 of this 20172023 Form 10-K) for information regarding legal proceedings forin which we are involved.involved, which information is incorporated by reference herein.
Item 4. Mine SafetySafety Disclosures
Not applicable.
15
Other.Information about our executive Officers
Other. Executive Officers of the Registrant
Our executive officers as of December 31, 2017the date of this 2023 Form 10-K were as follows:
Name | Age | Business Experience During the Past Five Years and Other Information | ||
Steven W. Moster |
| President and Chief Executive Officer of Viad since 2014; President of GES | ||
Ellen M. Ingersoll |
| Chief Financial Officer since July 2002; prior thereto, Vice President-Controller or similar position since 2002; prior thereto, Controller of CashX, Inc., a service provider of stored value internet cards, from June 2001 through October 2001; prior thereto, Operations Finance Director of LeapSource, Inc., a provider of business process outsourcing, | ||
David W. Barry |
| President of Pursuit since June 2015; prior thereto, Chief Executive Officer and President of Trust Company of America, | ||
Derek P. Linde | 48 | Chief Operating Officer since March 2022, and also served as General Counsel and Corporate Secretary from April 2018 to October 2023; prior thereto, senior legal leadership roles at Illinois Tool Works Inc. (NYSE: ITW), a global diversified industrial manufacturer, from 2011 to 2018; and prior thereto, a partner at the international law firm of Winston & Strawn LLP. | ||
Jeffrey A. Stelmach | 56 | President of GES Brand Experiences since August 2021; prior thereto, Group President of Stadium Red Group, a collective of specialist agencies, from 2020 to 2021; prior thereto, President of Opus Holding Group of Opus Agency, a global event design and experiential agency, from 2018 to 2020; and prior thereto, President of U.S. Experiential Marketing and Shopper Marketing of Mosaic, a sales and merchandising, experiential marketing and interactive firm, from 2009 to 2018. | ||
Leslie S. Striedel |
| Chief Accounting Officer since | ||
Jonathan A. Massimino | 45 | General Counsel and Corporate Secretary since October 2023; prior thereto, General Counsel of Moon Valley Nurseries, a national nursery business, from April 2023 to October 2023; prior thereto, Deputy General Counsel from November 2020 to April 2023 and Assistant General Counsel from July 2011 to November 2020 of Viad Corp; and prior thereto, associate at the law firms of Watt, Tieder, Hoffar & Fitzgerald from March 2007 to July 2011, and Fisher & Phillips from August 2004 to March 2007. |
Our executive officers’ term of office is until our next Board of Directors annual organization meeting scheduled to be held on May 17, 2018.
15, 2024.
16
Item 5. Market for Registrant’s Common Equity, Related Stockholder Matters and Issuer Purchases of Equity Securities
Market Information
Our common stock is traded on the New York Stock Exchange under the symbol VVI. The high and low common stock market prices per share were as follows:
|
| 2017 |
|
| 2016 |
| ||||||||||
|
| High |
|
| Low |
|
| High |
|
| Low |
| ||||
First Quarter |
| $ | 48.30 |
|
| $ | 42.40 |
|
| $ | 29.84 |
|
| $ | 25.90 |
|
Second Quarter |
| $ | 48.85 |
|
| $ | 42.05 |
|
| $ | 32.29 |
|
| $ | 27.96 |
|
Third Quarter |
| $ | 61.65 |
|
| $ | 46.05 |
|
| $ | 37.85 |
|
| $ | 30.21 |
|
Fourth Quarter |
| $ | 61.85 |
|
| $ | 53.65 |
|
| $ | 47.40 |
|
| $ | 34.40 |
|
Holders
As of January 31, 2018,February 26, 2024, there were 5,6004,161 shareholders of record of our common stock, including 293120 shareholders that had not converted their shares following a reverse stock split effective on July 1, 2004.
Dividends
For the year ended December 31, 2017, our Board of Directors declared the following dividends:
Declaration Date |
| Dividend Per Share |
|
| Record Date |
| Payable Date | |
November 29, 2017 |
| $ | 0.10 |
|
| December 15, 2017 |
| January 2, 2018 |
August 16, 2017 |
| $ | 0.10 |
|
| September 8, 2017 |
| October 2, 2017 |
May 18, 2017 |
| $ | 0.10 |
|
| June 2, 2017 |
| July 3, 2017 |
February 22, 2017 |
| $ | 0.10 |
|
| March 10, 2017 |
| April 3, 2017 |
For the year ended December 31, 2016, our Board of Directors declared the following dividends:
Declaration Date |
| Dividend Per Share |
|
| Record Date |
| Payable Date | |
December 1, 2016 |
| $ | 0.10 |
|
| December 16, 2016 |
| January 3, 2017 |
August 24, 2016 |
| $ | 0.10 |
|
| September 9, 2016 |
| October 3, 2016 |
May 19, 2016 |
| $ | 0.10 |
|
| June 3, 2016 |
| July 1, 2016 |
February 24, 2016 |
| $ | 0.10 |
|
| March 11, 2016 |
| April 1, 2016 |
Issuer Purchases of Equity Securities
During the fourth quarter of 2017, certainPursuant to previously owned shares of common stock were surrendered by employees, former employees, and non-employee directors for tax withholding requirements on vested share-based awards.
Period |
| Total Number of Shares Purchased |
|
| Average Price Paid Per Share |
|
| Total Number of Shares Purchased as Part of Publicly Announced Plans or Programs |
|
| Maximum Number of Shares That May Yet Be Purchased Under the Plans or Programs |
| ||||
October 1, 2017 - October 31, 2017 |
|
| 2,968 |
|
| $ | 59.83 |
|
|
| — |
|
|
| 440,540 |
|
November 1, 2017 - November 30, 2017 |
|
| 497 |
|
| $ | 55.55 |
|
|
| — |
|
|
| 440,540 |
|
December 1, 2017 - December 31, 2017 |
|
| 11,151 |
|
| $ | 57.60 |
|
|
| — |
|
|
| 440,540 |
|
Total |
|
| 14,616 |
|
| $ | 57.98 |
|
|
| — |
|
|
| 440,540 |
|
Ourannounced authorizations, our Board of Directors has authorized us to repurchase shares of our common stock from time to time at prevailing market prices. As of December 31, 2017, 440,5402023, 546,283 shares remainremained available for repurchase. The Board’s authorization has no expiration date.repurchase under all prior authorizations. In March 2020, our Board of Directors suspended future dividend payments and our share repurchase program for the foreseeable future. During the three months ended December 31, 2017, no shares were repurchased on the open market.2023, we did not repurchase any equity securities. The Board of Directors’ authorization does not have an expiration date.
17
The following graph compares the change in the cumulative total shareholder return, from December 31, 20122018 to December 31, 2017,2023, on our common stock, the Standard & Poor’s SmallCap 600 Hotels, Restaurants & Leisure, the Standard & Poor’s SmallCap 600 Media Index, the Standard & Poor’s SmallCap 600 Commercial Services & Supplies Index, the Standard & Poor’s SmallCap 600 Index, the Russell 2000 Index, and Standard & Poor’s 500 Index (assuming reinvestment of dividends, as applicable). The graph assumes $100 was invested on December 31, 2012.2018.


|
| Year Ended December 31, |
| |||||||||||||||||||||
|
| 2012 |
|
| 2013 |
|
| 2014 |
|
| 2015 |
|
| 2016 |
|
| 2017 |
| ||||||
Viad Corp |
| $ | 100.00 |
|
| $ | 114.17 |
|
| $ | 118.43 |
|
| $ | 127.22 |
|
| $ | 201.04 |
|
| $ | 254.60 |
|
S&P 500 |
| $ | 100.00 |
|
| $ | 132.38 |
|
| $ | 150.47 |
|
| $ | 152.53 |
|
| $ | 170.76 |
|
| $ | 208.02 |
|
Russell 2000 |
| $ | 100.00 |
|
| $ | 138.82 |
|
| $ | 145.64 |
|
| $ | 139.21 |
|
| $ | 168.84 |
|
| $ | 193.54 |
|
S&P SmallCap 600 |
| $ | 100.00 |
|
| $ | 141.31 |
|
| $ | 149.42 |
|
| $ | 146.42 |
|
| $ | 185.16 |
|
| $ | 209.51 |
|
S&P 600 Comm. Services & Supplies |
| $ | 100.00 |
|
| $ | 143.41 |
|
| $ | 142.43 |
|
| $ | 139.00 |
|
| $ | 177.43 |
|
| $ | 189.99 |
|
S&P 600 Media Index |
| $ | 100.00 |
|
| $ | 162.65 |
|
| $ | 190.80 |
|
| $ | 201.03 |
|
| $ | 180.37 |
|
| $ | 207.93 |
|
|
| Year Ended December 31, |
| |||||||||||||||||||||
|
| 2018 |
|
| 2019 |
|
| 2020 |
|
| 2021 |
|
| 2022 |
|
| 2023 |
| ||||||
Viad Corp |
| $ | 100.00 |
|
| $ | 135.62 |
|
| $ | 72.92 |
|
| $ | 86.27 |
|
| $ | 49.17 |
|
| $ | 72.98 |
|
S&P 500 |
| $ | 100.00 |
|
| $ | 131.47 |
|
| $ | 155.65 |
|
| $ | 200.29 |
|
| $ | 163.97 |
|
| $ | 207.03 |
|
Russell 2000 |
| $ | 100.00 |
|
| $ | 125.49 |
|
| $ | 150.50 |
|
| $ | 172.74 |
|
| $ | 137.40 |
|
| $ | 160.59 |
|
S&P SmallCap 600 |
| $ | 100.00 |
|
| $ | 122.74 |
|
| $ | 136.54 |
|
| $ | 173.05 |
|
| $ | 145.10 |
|
| $ | 168.23 |
|
S&P SmallCap 600 Comm. Services & Supplies |
| $ | 100.00 |
|
| $ | 123.48 |
|
| $ | 108.55 |
|
| $ | 116.24 |
|
| $ | 101.29 |
|
| $ | 119.66 |
|
S&P SmallCap 600 Media |
| $ | 100.00 |
|
| $ | 107.38 |
|
| $ | 101.65 |
|
| $ | 165.09 |
|
| $ | 88.56 |
|
| $ | 76.82 |
|
S&P SmallCap 600 Hotels, Restaurants & Leisure |
| $ | 100.00 |
|
| $ | 110.45 |
|
| $ | 140.08 |
|
| $ | 136.01 |
|
| $ | 108.30 |
|
| $ | 131.04 |
|
Item 6. Selected Financial DataRESERVED
|
| Year Ended December 31, |
| |||||||||||||||||
(in thousands, except per share data) |
| 2017 |
|
| 2016 |
|
| 2015 |
|
| 2014 |
|
| 2013 |
| |||||
Summary Statement of Operations Data |
|
|
|
|
|
|
|
|
|
|
|
|
|
|
|
|
|
|
|
|
Revenue (1) : |
|
|
|
|
|
|
|
|
|
|
|
|
|
|
|
|
|
|
|
|
Exhibition and event services |
| $ | 967,352 |
|
| $ | 881,137 |
|
| $ | 799,752 |
|
| $ | 772,770 |
|
| $ | 685,350 |
|
Exhibits and environments |
|
| 165,745 |
|
|
| 170,469 |
|
|
| 177,126 |
|
|
| 171,698 |
|
|
| 159,554 |
|
Pursuit services |
|
| 173,868 |
|
|
| 153,364 |
|
|
| 112,170 |
|
|
| 120,519 |
|
|
| 108,443 |
|
Total revenue |
| $ | 1,306,965 |
|
| $ | 1,204,970 |
|
| $ | 1,089,048 |
|
| $ | 1,064,987 |
|
| $ | 953,347 |
|
Income from continuing operations (2) |
| $ | 58,452 |
|
| $ | 43,479 |
|
| $ | 27,442 |
|
| $ | 41,178 |
|
| $ | 19,320 |
|
Income from continuing operations attributable to Viad common stockholders |
| $ | 57,975 |
|
| $ | 42,953 |
|
| $ | 27,000 |
|
| $ | 40,790 |
|
| $ | 19,437 |
|
Basic and diluted income from continuing operations attributable to Viad common stockholders per share (2) |
| $ | 2.84 |
|
| $ | 2.12 |
|
| $ | 1.34 |
|
| $ | 2.02 |
|
| $ | 0.96 |
|
Dividends declared per common share |
| $ | 0.40 |
|
| $ | 0.40 |
|
| $ | 0.40 |
|
| $ | 1.90 |
|
| $ | 2.90 |
|
Other Data |
|
|
|
|
|
|
|
|
|
|
|
|
|
|
|
|
|
|
|
|
Adjusted EBITDA (3) |
| $ | 137,550 |
|
| $ | 112,428 |
|
| $ | 76,801 |
|
| $ | 73,954 |
|
| $ | 59,157 |
|
|
|
|
|
|
|
|
|
|
|
|
|
|
|
|
|
|
|
|
|
|
|
| December 31, |
| |||||||||||||||||
(in thousands) |
| 2017 |
|
| 2016 |
|
| 2015 |
|
| 2014 |
|
| 2013 |
| |||||
Summary Balance Sheet Data |
|
|
|
|
|
|
|
|
|
|
|
|
|
|
|
|
|
|
|
|
Cash and cash equivalents |
| $ | 53,723 |
|
| $ | 20,900 |
|
| $ | 56,531 |
|
| $ | 56,990 |
|
| $ | 45,821 |
|
Total assets |
| $ | 919,899 |
|
| $ | 869,816 |
|
| $ | 690,723 |
|
| $ | 712,979 |
|
| $ | 561,424 |
|
Total debt and capital lease obligations |
| $ | 209,192 |
|
| $ | 249,211 |
|
| $ | 127,403 |
|
| $ | 139,056 |
|
| $ | 11,160 |
|
Redeemable noncontrolling interest (4) |
| $ | 6,648 |
|
| $ | — |
|
| $ | — |
|
| $ | — |
|
| $ | — |
|
Total stockholders’ equity |
| $ | 442,937 |
|
| $ | 370,638 |
|
| $ | 335,338 |
|
| $ | 347,702 |
|
| $ | 356,543 |
|
Non-redeemable noncontrolling interest |
| $ | 13,806 |
|
| $ | 13,283 |
|
| $ | 12,757 |
|
| $ | 12,315 |
|
| $ | 9,102 |
|
|
|
|
|
Restructuring charges, pre-tax, of $1.0 million in 2017, $5.2 million in 2016, $3.0 million in 2015, $1.6 million in 2014, and $3.8 million in 2013. Refer to Note 18 – Restructuring Charges of the Notes to Consolidated Financial Statements (Part II, Item 8 of this 2017 Form 10-K).
Impairment charges (recoveries), pre-tax, net, of $(29.1) million in 2017, $0.2 million in 2016, $0.1 million in 2015, $0.9 million in 2014, and $1.0 million in 2013. Refer to Note 6 – Property and Equipment of the Notes to Consolidated Financial Statements (Part II, Item 8 of this 2017 Form 10-K).
Income tax expense in 2017 included a $16.1 million charge related to the Tax Act. Income tax expense in 2015 included a $1.6 million non-cash tax benefit related to deferred taxes associated with certain foreign intangibles. Income tax expense in 2014 included the $11.7 million valuation allowance release related to our foreign tax credit and state net operating loss carryforwards. Refer to Note 16 – Income Taxes of the Notes to Consolidated Financial Statements (Part II, Item 8 of this 2017 Form 10-K).
|
|
|
|
Item 7. Management’sManagement’s Discussion and Analysis of Financial Condition and Results of Operations
The following Management’s Discussion and Analysis of Financial Condition and Results of Operations (“MD&A”) should be read in conjunction with the consolidated financial statements and related notes. The MD&A is intended to assist you in understanding our financial condition and results of operations. This discussion contains forward-looking statements that involve risks and uncertainties. Our actual results could differ materially from those anticipated due to various factors discussed under “Risk“Risk Factors,” “Forward-Looking“Forward-Looking Statements,” and elsewhere in this 20172023 Form 10-K.
Overview
We are an internationala leading provider of extraordinary experiences, including hospitality and leisure activities, experiential services company with operations in the United States, Canada, the United Kingdom, continental Europe,marketing, and the United Arab Emirates. We are committed to providing unforgettable experiences to our clients and guests.live events. We operate through three reportable business segments: Pursuit, Spiro, and GES U.S.,Exhibitions. Spiro and GES International, (collectively, “GES”), and Pursuit.
GES is a global, full-service provider for live events that produces exhibitions, conferences, corporate events, and consumer events. GES offers a comprehensive range ofExhibitions are both live event servicesbusinesses and a full suite of audio-visual services from creative and technologyare referred to content and design, along with online tools powered by next generation technologies that help clients easily manage the complexities of their events.
Pursuit is a collection of iconic natural and cultural destination travel experiences that enjoy perennial demand. Pursuit offers guests distinctive and world renowned experiences through its collection of unique hotels and lodges, world-class recreational attractions, and ground transportation services.
18
A discussion related to our results of operations for 2023 compared to 2022 is presented below. A discussion related to our results of operations for 2022 compared to 2021 can be found in Part II, Item 7 of our Annual Report on Form 10-K for the year ended December 31, 2022, filed with the SEC on February 28, 2023, and is incorporated herein by reference.
Financial Highlights
|
| Year Ended December 31, |
|
| ||||||||
(in thousands, except per share data) |
| 2023 |
|
| 2022 |
|
| % Change |
| |||
Total revenue |
| $ | 1,238,680 |
|
| $ | 1,127,311 |
|
|
| 9.9 | % |
Net income attributable to Viad |
| $ | 16,017 |
|
| $ | 23,220 |
|
|
| (31.0 | )% |
Segment operating income (1) |
| $ | 108,443 |
|
| $ | 68,944 |
|
|
| 57.3 | % |
Diluted income per common share from continuing operations attributable to Viad common stockholders |
| $ | 0.34 |
|
| $ | 0.52 |
|
|
| (34.6 | )% |
|
| Year Ended December 31, |
|
|
|
|
|
|
|
|
| |||||||||
(in thousands, except per share data) |
| 2017 |
|
| 2016 |
|
| 2015 |
|
| Percentage Change 2017 vs. 2016 |
|
| Percentage Change 2016 vs. 2015 |
| |||||
Revenue |
| $ | 1,306,965 |
|
| $ | 1,204,970 |
|
| $ | 1,089,048 |
|
|
| 8.5 | % |
|
| 10.6 | % |
Net income attributable to Viad |
| $ | 57,707 |
|
| $ | 42,269 |
|
| $ | 26,606 |
|
|
| 36.5 | % |
|
| 58.9 | % |
Segment operating income (1) |
| $ | 97,051 |
|
| $ | 85,928 |
|
| $ | 54,584 |
|
|
| 12.9 | % |
|
| 57.4 | % |
Diluted income per common share from continuing operations attributable to Viad common stockholders |
| $ | 2.84 |
|
| $ | 2.12 |
|
| $ | 1.34 |
|
|
| 34.0 | % |
|
| 58.2 | % |
2017 compared with 2016
Total revenue increased$102.0 $111.4 million, or 8.5%, mainlyprimarily due to the incrementalincreased revenue from the ON Services and FlyOver Canada acquisitions, and to a lesser degree, the Poken, and CATC acquisitions, of $52.6 million and underlying growth at GES of $60.4 million attributable to improved demand for exhibition management and Pursuit,experiential marketing services, offset in part by the sale of substantially all of the assets of GES’ United States audio-visual production business, ON Services, in December of 2022, which contributed revenue of $50.9 million during 2022, and negative show rotation of approximately $8$23 million. Pursuit revenue increased $51.0 million, and an unfavorable foreign exchange impact of $5.6 million.
Net income attributable to Viad increased $15.4decreased $7.2 million, or 36.5%, primarily due to impairment recoveriesa pre-tax gain on sale of $29.1ON Services of $19.6 million related to the Mount Royal Hotel fire,in 2022 as well as higher segment operatinginterest expense, net, of $13.1 million and higher income and a decrease in restructuring charges,tax expense of $8.8 million, offset in part by higher tax expense, including a $16.1 million charge as a result of the Tax Cuts and Jobs Act (the “Tax Act”) enacted on December 22, 2017, higher corporate activities expense due to an increase in performance-based compensation driven by our stock price appreciation, and higher interest expense.
|
|
2016 compared with 2015
Total revenue increased $115.9 million or 10.6%, mainly due to the incremental revenue from the 2016 acquisitions, primarily CATC, ON Services, and Maligne Lake Tours of $55.7 million, positive show rotation of approximately $52 million, and continued underlying growth in both GES and Pursuit, offset in part by an unfavorable foreign exchange impact of $24.0 million.
Net income attributable to Viad increased $15.7 million or 58.9%, primarily due to increased segment operating incomehigher revenue at GES and Pursuit, offset in part by higher income tax expense.
|
|
|
|
Foreign Exchange Rate Variances
We conduct our foreign operations primarily in Canada, the United Kingdom, the Netherlands, Germany, and to a lesser extent, in certain other countries.
2017 compared with 2016
The following table summarizes the foreign exchange rate variance effects (or “FX Impact”) on revenue and segment operating results from our significant international operations for the years ended December 31, 2017 and 2016, excluding the effect of acquisitions completed during 2017 and 2016:
|
| Revenue |
|
| Segment Operating Results |
| ||||||||||||||||||
|
| Weighted-Average Exchange Rates |
|
| FX Impact |
|
| Weighted-Average Exchange Rates |
|
| FX Impact |
| ||||||||||||
|
| 2017 |
|
| 2016 |
|
| (in thousands) |
|
| 2017 |
|
| 2016 |
|
| (in thousands) |
| ||||||
GES: |
|
|
|
|
|
|
|
|
|
|
|
|
|
|
|
|
|
|
|
|
|
|
|
|
Canada (CAD) |
| $ | 0.77 |
|
| $ | 0.76 |
|
| $ | 775 |
|
| $ | 0.77 |
|
| $ | 0.76 |
|
| $ | (114 | ) |
United Kingdom (GBP) |
| $ | 1.29 |
|
| $ | 1.35 |
|
|
| (9,001 | ) |
| $ | 1.30 |
|
| $ | 1.33 |
|
|
| (160 | ) |
Europe (EUR) |
| $ | 1.14 |
|
| $ | 1.11 |
|
|
| 970 |
|
| $ | 1.15 |
|
| $ | 1.10 |
|
|
| 131 |
|
|
|
|
|
|
|
|
|
|
|
| (7,256 | ) |
|
|
|
|
|
|
|
|
|
| (143 | ) |
Pursuit: |
|
|
|
|
|
|
|
|
|
|
|
|
|
|
|
|
|
|
|
|
|
|
|
|
Canada (CAD) |
| $ | 0.78 |
|
| $ | 0.77 |
|
|
| 1,676 |
|
| $ | 0.78 |
|
| $ | 0.76 |
|
|
| 710 |
|
|
|
|
|
|
|
|
|
|
| $ | (5,580 | ) |
|
|
|
|
|
|
|
|
| $ | 567 |
|
2016 compared with 2015
The following table summarizes the FX Impact on revenue and segment operating results from our significant international operations for the years ended December 31, 2016 and 2015, excluding the effect of acquisitions completed during 2016:
|
| Revenue |
|
| Segment Operating Results |
| ||||||||||||||||||
|
| Weighted-Average Exchange Rates |
|
| FX Impact |
|
| Weighted-Average Exchange Rates |
|
| FX Impact |
| ||||||||||||
|
| 2016 |
|
| 2015 |
|
| (in thousands) |
|
| 2016 |
|
| 2015 |
|
| (in thousands) |
| ||||||
GES: |
|
|
|
|
|
|
|
|
|
|
|
|
|
|
|
|
|
|
|
|
|
|
|
|
Canada (CAD) |
| $ | 0.76 |
|
| $ | 0.78 |
|
| $ | (1,852 | ) |
| $ | 0.76 |
|
| $ | 0.79 |
|
| $ | (77 | ) |
United Kingdom (GBP) |
| $ | 1.35 |
|
| $ | 1.53 |
|
|
| (20,946 | ) |
| $ | 1.34 |
|
| $ | 1.53 |
|
|
| (632 | ) |
Europe (EUR) |
| $ | 1.11 |
|
| $ | 1.10 |
|
|
| 150 |
|
| $ | 1.10 |
|
| $ | 1.11 |
|
|
| 36 |
|
|
|
|
|
|
|
|
|
|
|
| (22,648 | ) |
|
|
|
|
|
|
|
|
|
| (673 | ) |
Pursuit: |
|
|
|
|
|
|
|
|
|
|
|
|
|
|
|
|
|
|
|
|
|
|
|
|
Canada (CAD) |
| $ | 0.77 |
|
| $ | 0.78 |
|
|
| (1,307 | ) |
| $ | 0.76 |
|
| $ | 0.78 |
|
|
| 91 |
|
|
|
|
|
|
|
|
|
|
| $ | (23,955 | ) |
|
|
|
|
|
|
|
|
| $ | (582 | ) |
The 2017 and 2016 revenue and segment operating results were primarily impacted by the weakening of the British pound relative to the U.S. dollar. Future changes in the exchange rates may impact overall expected profitability and historical period-to-period comparisons when revenue and segment operating results are translated into U.S. dollars.
Analysis of Revenue and Operating Results by Reportable Segment
GESPursuit
2017 compared with 2016
The following table presents a comparison of GES’ reported revenue and segment operating results to organic revenue(3) and organic segment operating results(3) for the years ended December 31, 2017 and 2016.
|
| Year Ended December 31, 2017 |
|
| Year Ended December 31, 2016 |
|
| Change |
| |||||||||||||||||||||||||||
(in thousands) |
| As Reported |
|
| Acquisitions(1) |
|
| FX Impact |
|
| Organic(3) |
|
| As Reported |
|
| Acquisitions(2) |
|
| Organic(3) |
|
| As Reported |
|
| Organic(3) |
| |||||||||
Revenue: |
|
|
|
|
|
|
|
|
|
|
|
|
|
|
|
|
|
|
|
|
|
|
|
|
|
|
|
|
|
|
|
|
|
|
|
|
GES: |
|
|
|
|
|
|
|
|
|
|
|
|
|
|
|
|
|
|
|
|
|
|
|
|
|
|
|
|
|
|
|
|
|
|
|
|
U.S. |
| $ | 872,154 |
|
| $ | 72,441 |
|
| $ | — |
|
| $ | 799,713 |
|
| $ | 826,408 |
|
| $ | 30,737 |
|
| $ | 795,671 |
|
|
| 5.5 | % |
|
| 0.5 | % |
International |
|
| 282,712 |
|
|
| 917 |
|
|
| (7,256 | ) |
|
| 289,051 |
|
|
| 248,503 |
|
|
| — |
|
|
| 248,503 |
|
|
| 13.8 | % |
|
| 16.3 | % |
Intersegment eliminations |
|
| (21,769 | ) |
|
| — |
|
|
| — |
|
|
| (21,769 | ) |
|
| (20,172 | ) |
|
| — |
|
|
| (20,172 | ) |
|
| (7.9 | )% |
|
| (7.9 | )% |
Total GES |
| $ | 1,133,097 |
|
| $ | 73,358 |
|
| $ | (7,256 | ) |
| $ | 1,066,995 |
|
| $ | 1,054,739 |
|
| $ | 30,737 |
|
| $ | 1,024,002 |
|
|
| 7.4 | % |
|
| 4.2 | % |
Segment operating income (loss)(4): |
|
|
|
|
|
|
|
|
|
|
|
|
|
|
|
|
|
|
|
|
|
|
|
|
|
|
|
|
|
|
|
|
|
|
|
|
GES: |
|
|
|
|
|
|
|
|
|
|
|
|
|
|
|
|
|
|
|
|
|
|
|
|
|
|
|
|
|
|
|
|
|
|
|
|
U.S. |
| $ | 34,494 |
|
| $ | (5,043 | ) |
| $ | — |
|
| $ | 39,537 |
|
| $ | 40,524 |
|
| $ | (764 | ) |
| $ | 41,288 |
|
|
| (14.9 | )% |
|
| (4.2 | )% |
International |
|
| 15,475 |
|
|
| (930 | ) |
|
| (143 | ) |
|
| 16,548 |
|
|
| 9,699 |
|
|
| — |
|
|
| 9,699 |
|
|
| 59.6 | % |
|
| 70.6 | % |
Total GES |
| $ | 49,969 |
|
| $ | (5,973 | ) |
| $ | (143 | ) |
| $ | 56,085 |
|
| $ | 50,223 |
|
| $ | (764 | ) |
| $ | 50,987 |
|
|
| (0.5 | )% |
|
| 10.0 | % |
|
|
|
|
|
|
|
|
GES U.S.
GES U.S. revenue increased $45.7 million or 5.5%, primarily due to incremental revenue of $41.7 million mainly from the ON Services acquisition and, to a lesser degree, the Poken acquisition, base same-show revenue growth of 4.8%, and new business wins, offset in part by a low margin contract that expired in 2016 and was not renewed and negative show rotation of approximately $11 million. Base same-show revenue represented 35.4% of GES U.S. organic revenue*. Organic revenue* increased $4.0 million or 0.5%.
GES U.S. operating income decreased $6.0 million or 14.9%, primarily due to a less favorable mix of revenue, additional depreciation and amortization expense from the acquisition of ON Services and cost increases, offset in part by lower performance-based incentives and income of $2.8 million from a favorable contract settlement. Organic operating income* decreased $1.8 million or 4.2%.
GES International
GES International revenue increased $34.2 million or 13.8%, primarily due to new business wins, same-show growth, and positive show rotation of approximately $3 million, offset in part by an unfavorable FX Impact of $7.3 million. Organic revenue* increased $40.5 million or 16.3%.
GES International operating income increased $5.8 million or 59.6%, primarily due to higher revenue. Organic operating income* increased $6.8 million or 70.6%.
* Refer to footnote (3) in the above table for more information about the non-GAAP financial measures of organic revenue and organic segment operating results.
2018 Outlook
Although GES has a diversified revenue base and long-term contracts for future shows, its revenue is affected by general economic and industry-specific conditions. The prospects for individual shows tend to be driven by the success of the industry related to those shows. In general, the exhibition and event industry is experiencing modest growth.
For 2018, we expect GES’ revenue will be up slightly from 2017. Show rotation is expected to have a net negative impact on GES’ revenue of approximately $40 million compared to 2017. We expect GES U.S. base same-show revenue to increase at a mid-single digit rate. We anticipate a favorable FX Impact of approximately $18 million on GES’ 2018 full year revenue and approximately $0.5 million on GES’ segment operating income. The expected FX Impact assumes that the U.S. dollar to the British pound exchange rate will be $1.39 and the U.S. dollar to the Canadian dollar exchange rate will be $0.81 during 2018. For more information about segment operating income, see the “Non-GAAP Measures” section of this MD&A.
We are executing a strategic growth plan to position GES as the preferred global, full-service provider for Live Events, with further reach to corporate events, consumer events, conferences, and exhibitions. To support this strategy, since 2014, we have acquired two leading audio-visual production businesses and four leading event technology businesses that complement, enhance, and expand our current business and offer higher-margin growth opportunities. We continue to pursue additional opportunities to acquire businesses with proven products and services to create the most comprehensive suite of services for the Live Events industry. During 2018, we intend to make selective investments in additional resources to capitalize on continued growth opportunities in under-penetrated categories of Live Events, such as corporate events and consumer events, and in cross-selling new services.
Additionally, we remain focused on improving GES’ profitability through continued efforts to effectively manage labor costs by driving productivity gains through rigorous and strategic pre-show planning and on-site labor management that reduces the ratio of labor costs to revenue. Improving this metric is our top priority as we continue to develop and enhance tools to support and systematize show site labor planning, measurement, and benchmarking.
2016 compared with 2015
The following table provides a comparison of GES’ reported revenue and segment operating results to organic revenue(2) and organic segment operating results(2) for the years ended December 31, 2016 and 2015.
|
| Year Ended December 31, 2016 |
|
| Year Ended December 31, 2015 |
|
| Change |
| |||||||||||||||||||||||||||
(in thousands) |
| As Reported |
|
| Acquisitions(1) |
|
| FX Impact |
|
| Organic(2) |
|
| As Reported |
|
| Acquisitions |
|
| Organic(2) |
|
| As Reported |
|
| Organic(2) |
| |||||||||
Revenue: |
|
|
|
|
|
|
|
|
|
|
|
|
|
|
|
|
|
|
|
|
|
|
|
|
|
|
|
|
|
|
|
|
|
|
|
|
GES: |
|
|
|
|
|
|
|
|
|
|
|
|
|
|
|
|
|
|
|
|
|
|
|
|
|
|
|
|
|
|
|
|
|
|
|
|
U.S. |
| $ | 826,408 |
|
| $ | 21,306 |
|
| $ | — |
|
| $ | 805,102 |
|
| $ | 720,882 |
|
| $ | — |
|
| $ | 720,882 |
|
|
| 14.6 | % |
|
| 11.7 | % |
International |
|
| 248,503 |
|
|
| — |
|
|
| (22,648 | ) |
|
| 271,151 |
|
|
| 272,634 |
|
|
| — |
|
|
| 272,634 |
|
|
| (8.9 | )% |
|
| (0.5 | )% |
Intersegment eliminations |
|
| (20,172 | ) |
|
| — |
|
|
| — |
|
|
| (20,172 | ) |
|
| (16,638 | ) |
|
| — |
|
|
| (16,638 | ) |
|
| (21.2 | )% |
|
| (21.2 | )% |
Total GES |
| $ | 1,054,739 |
|
| $ | 21,306 |
|
| $ | (22,648 | ) |
| $ | 1,056,081 |
|
| $ | 976,878 |
|
| $ | — |
|
| $ | 976,878 |
|
|
| 8.0 | % |
|
| 8.1 | % |
Segment operating income (loss)(3): |
|
|
|
|
|
|
|
|
|
|
|
|
|
|
|
|
|
|
|
|
|
|
|
|
|
|
|
|
|
|
|
|
|
|
|
|
GES: |
|
|
|
|
|
|
|
|
|
|
|
|
|
|
|
|
|
|
|
|
|
|
|
|
|
|
|
|
|
|
|
|
|
|
|
|
U.S. |
| $ | 40,524 |
|
| $ | (804 | ) |
| $ | — |
|
| $ | 41,328 |
|
| $ | 14,563 |
|
| $ | — |
|
| $ | 14,563 |
|
| ** |
|
| ** |
| ||
International |
|
| 9,699 |
|
|
| — |
|
|
| (673 | ) |
|
| 10,372 |
|
|
| 12,211 |
|
|
| — |
|
|
| 12,211 |
|
|
| (20.6 | )% |
|
| (15.1 | )% |
Total GES |
| $ | 50,223 |
|
| $ | (804 | ) |
| $ | (673 | ) |
| $ | 51,700 |
|
| $ | 26,774 |
|
| $ | — |
|
| $ | 26,774 |
|
|
| 87.6 | % |
|
| 93.1 | % |
** Change is greater than +/- 100%.
|
|
|
|
GES U.S.
GES U.S. revenue increased $105.5 million or 14.6%, primarily due to positive show rotation of approximately $59 million, base same-show revenue growth of 4.1%, the incremental revenue from the acquisition of ON Services of $21.3 million, new business wins, and increased sales to corporate clients. Base same-show revenue represented 39.1% of GES U.S. 2016 organic revenue*. Organic revenue* increased $84.2 million or 11.7%.
GES U.S. operating income increased $26.0 million, primarily due to higher revenue and the strong operating leverage that exists within the GES business. ON Services generated a segment operating loss of $0.8 million during our partial year of ownership, which included depreciation and amortization expense of $4.0 million. Organic operating income* increased $26.8 million.
GES International
GES International revenue decreased $24.1 million or 8.9%, primarily due to an unfavorable FX Impact of $22.6 million and negative show rotation of approximately $7 million, offset in part by new business wins. Organic revenue* decreased $1.5 million or 0.5%.
GES International operating income decreased $2.5 million or 20.6%, primarily reflecting lower revenue and investments in personnel and assets to support continued growth of the business. Organic operating income* decreased $1.8 million or 15.1%.
* Refer to footnote (2) in the above table for more information about the non-GAAP financial measures of organic revenue and organic segment operating results.
Pursuit
2017 compared with 2016
The following table provides a comparison of Pursuit’s reported revenue and segment operating results to organic revenue(2) and organic segment operating results(2)income for the years ended December 31, 20172023 and 2016.2022.
|
| Year Ended December 31, |
|
| ||||||||
(in thousands) |
| 2023 |
|
| 2022 |
|
| % Change |
| |||
Revenue(1): |
|
|
|
|
|
|
|
|
| |||
Pursuit: |
|
|
|
|
|
|
|
|
| |||
Attractions |
| $ | 190,437 |
|
| $ | 153,575 |
|
|
| 24.0 | % |
Hospitality |
|
| 143,961 |
|
|
| 130,303 |
|
|
| 10.5 | % |
Transportation |
|
| 12,839 |
|
|
| 12,798 |
|
|
| 0.3 | % |
Other |
|
| 3,048 |
|
|
| 2,651 |
|
|
| 15.0 | % |
Total Pursuit |
| $ | 350,285 |
|
| $ | 299,327 |
|
|
| 17.0 | % |
|
|
|
|
|
|
|
|
|
| |||
Segment operating income (2): |
|
|
|
|
|
|
|
|
| |||
Total Pursuit |
| $ | 53,381 |
|
| $ | 24,031 |
|
| ** |
| |
** Change is greater than +/- 100%
|
| Year Ended December 31, 2017 |
|
| Year Ended December 31, 2016 |
|
| Change |
| |||||||||||||||||||||||||||
(in thousands) |
| As Reported |
|
| Acquisitions(1) |
|
| FX Impact |
|
| Organic(2) |
|
| As Reported |
|
| Acquisitions(1) |
|
| Organic(2) |
|
| As Reported |
|
| Organic(2) |
| |||||||||
Revenue: |
|
|
|
|
|
|
|
|
|
|
|
|
|
|
|
|
|
|
|
|
|
|
|
|
|
|
|
|
|
|
|
|
|
|
|
|
Pursuit: |
|
|
|
|
|
|
|
|
|
|
|
|
|
|
|
|
|
|
|
|
|
|
|
|
|
|
|
|
|
|
|
|
|
|
|
|
Hospitality |
| $ | 57,852 |
|
| $ | 13,279 |
|
| $ | 232 |
|
| $ | 44,341 |
|
| $ | 59,757 |
|
| $ | 12,834 |
|
| $ | 46,923 |
|
|
| (3.2 | )% |
|
| (5.5 | )% |
Attractions |
|
| 98,525 |
|
|
| 23,517 |
|
|
| 1,266 |
|
|
| 73,742 |
|
|
| 65,945 |
|
|
| 13,698 |
|
|
| 52,247 |
|
|
| 49.4 | % |
|
| 41.1 | % |
Transportation |
|
| 13,873 |
|
|
| — |
|
|
| 211 |
|
|
| 13,662 |
|
|
| 11,833 |
|
|
| — |
|
|
| 11,833 |
|
|
| 17.2 | % |
|
| 15.5 | % |
Travel Planning |
|
| 4,664 |
|
|
| 1,264 |
|
|
| 26 |
|
|
| 3,374 |
|
|
| 17,631 |
|
|
| 1,540 |
|
|
| 16,091 |
|
|
| (73.5 | )% |
|
| (79.0 | )% |
Intra-Segment Eliminations & Other |
|
| (1,046 | ) |
|
| — |
|
|
| (59 | ) |
|
| (987 | ) |
|
| (1,802 | ) |
|
| — |
|
|
| (1,802 | ) |
|
| 42.0 | % |
|
| 45.2 | % |
Total Pursuit |
| $ | 173,868 |
|
| $ | 38,060 |
|
| $ | 1,676 |
|
| $ | 134,132 |
|
| $ | 153,364 |
|
| $ | 28,072 |
|
| $ | 125,292 |
|
|
| 13.4 | % |
|
| 7.1 | % |
|
|
|
|
|
|
|
|
|
|
|
|
|
|
|
|
|
|
|
|
|
|
|
|
|
|
|
|
|
|
|
|
|
|
|
|
|
Segment operating income(3): |
|
|
|
|
|
|
|
|
|
|
|
|
|
|
|
|
|
|
|
|
|
|
|
|
|
|
|
|
|
|
|
|
|
|
|
|
Total Pursuit |
| $ | 47,082 |
|
| $ | 5,819 |
|
| $ | 710 |
|
| $ | 40,553 |
|
| $ | 35,705 |
|
| $ | 6,000 |
|
| $ | 29,705 |
|
|
| 31.9 | % |
|
| 36.5 | % |
|
|
|
|
19 Pursuit revenue increased $51.0 million primarily due to increases in attractions revenue of $36.9 million and hospitality revenue of $13.7 million. The growth in attractions revenue was driven primarily by stronger international tourism to Western Canada and Iceland, as well as higher revenue per attraction visitor of 2.7%. The growth in hospitality revenue was driven primarily by revenue management efforts to drive stronger Revenue per Available Room (“RevPAR”) and increased guest demand in Western Canada, as well as higher ancillary revenue and an increase in room nights available of 3.9% with the Pursuit segment operating income increased Pursuit revenue increased $20.5 million or 13.4%, due to strong growth in organic attractions revenue primarily drivenRevenue by the fully renovated Banff Gondola (which was closed for renovations from October 2015 through April 2016), incremental revenue of $10.0 million primarily from the FlyOver Canada acquisition and, to a lesser degree, the CATC acquisition, and a favorable FX Impact of $1.7 million, offset in part by a reduction in travel planning revenue as Pursuit completed the previously announced downsizing of the Banff Jasper Collection’s package tours line of business does not agree to Note 2 – Revenue and Related Contract Costs and Contract Liabilities of the Notes to Consolidated Financial Statements (Part II, Item 8 of this 2023 Form 10-K) as the amounts in the above table include product revenue from food and beverage and retail operations within each line of business.(2)Refer to Note 24 – Segment Information of the Notes to Consolidated Financial Statements (Part II, Item 8 of this 2023 Form 10-K) for a revenue declinereconciliation of $5.4the non-GAAP financial measure, segment operating income, to the most directly comparable GAAP measure.fire-related closureaddition of the Mount Royal Hotel. Organic revenue*Forest Park Alpine Hotel, which opened in August 2022.$8.8$29.4 million or 7.1%.
Pursuit operating income increased $11.4 million or 31.9%, primarily due to the increase in revenue, from high-margin attractions. Operating income included a $2.5 million business interruption gain for the recovery of lost profits from the Mount Royal Hotel in 2017. Organic operating income* increased $10.8 million or 36.5%.
2018 Outlook
For 2018, we expect Pursuit’s revenue to increase at a high-single to low-double digit rate. We expect a favorable impact to Pursuit’s revenue of approximately $5 million from the planned re-opening of the Mount Royal Hotel in mid-year 2018. As of December 31, 2017, we had a deferred business interruption recovery of $1 million relating to 2018 lost profits from the Mount Royal Hotel that will be recognized in Pursuit’s segment operating results during the first half of 2018. We expect to incur start-up costs of approximately $1 million related to the development of our FlyOver Iceland attraction, which is expected to open in 2019. We anticipate a favorable FX Impact of approximately $5 million on Pursuit’s 2018 revenue and approximately $1 million on segment operating income. In addition to these factors, we expect organic growth across the rest of Pursuit’s lines of business.
2016 compared with 2015
The following table provides a comparison of Pursuit’s reported revenue and segment operating results to organic revenue(2) and organic segment operating results(2) for the years ended December 31, 2016 and 2015.
|
| Year Ended December 31, 2016 |
|
| Year Ended December 31, 2015 |
|
| Change |
| |||||||||||||||||||||||||||
(in thousands) |
| As Reported |
|
| Acquisitions(1) |
|
| FX Impact |
|
| Organic(2) |
|
| As Reported |
|
| Acquisitions |
|
| Organic(2) |
|
| As Reported |
|
| Organic(2) |
| |||||||||
Revenue: |
|
|
|
|
|
|
|
|
|
|
|
|
|
|
|
|
|
|
|
|
|
|
|
|
|
|
|
|
|
|
|
|
|
|
|
|
Pursuit: |
|
|
|
|
|
|
|
|
|
|
|
|
|
|
|
|
|
|
|
|
|
|
|
|
|
|
|
|
|
|
|
|
|
|
|
|
Hospitality |
| $ | 59,757 |
|
| $ | 12,834 |
|
| $ | (328 | ) |
| $ | 47,251 |
|
| $ | 41,605 |
|
| $ | — |
|
| $ | 41,605 |
|
|
| 43.6 | % |
|
| 13.6 | % |
Attractions |
|
| 65,945 |
|
|
| 20,043 |
|
|
| (496 | ) |
|
| 46,398 |
|
|
| 42,405 |
|
|
| — |
|
|
| 42,405 |
|
|
| 55.5 | % |
|
| 9.4 | % |
Transportation |
|
| 11,833 |
|
|
| — |
|
|
| (275 | ) |
|
| 12,108 |
|
|
| 13,999 |
|
|
| — |
|
|
| 13,999 |
|
|
| (15.5 | )% |
|
| (13.5 | )% |
Travel Planning |
|
| 17,631 |
|
|
| 1,540 |
|
|
| (233 | ) |
|
| 16,324 |
|
|
| 15,863 |
|
|
| — |
|
|
| 15,863 |
|
|
| 11.1 | % |
|
| 2.9 | % |
Intra-Segment Eliminations & Other |
|
| (1,802 | ) |
|
| — |
|
|
| 25 |
|
|
| (1,827 | ) |
|
| (1,702 | ) |
|
| — |
|
|
| (1,702 | ) |
|
| (5.9 | )% |
|
| (7.3 | )% |
Total Pursuit |
| $ | 153,364 |
|
| $ | 34,417 |
|
| $ | (1,307 | ) |
| $ | 120,254 |
|
| $ | 112,170 |
|
| $ | — |
|
| $ | 112,170 |
|
|
| 36.7 | % |
|
| 7.2 | % |
|
|
|
|
|
|
|
|
|
|
|
|
|
|
|
|
|
|
|
|
|
|
|
|
|
|
|
|
|
|
|
|
|
|
|
|
|
Segment operating income(3): |
|
|
|
|
|
|
|
|
|
|
|
|
|
|
|
|
|
|
|
|
|
|
|
|
|
|
|
|
|
|
|
|
|
|
|
|
Total Pursuit |
| $ | 35,705 |
|
| $ | 7,917 |
|
| $ | 91 |
|
| $ | 27,697 |
|
| $ | 27,810 |
|
| $ | — |
|
| $ | 27,810 |
|
|
| 28.4 | % |
|
| (0.4 | )% |
|
|
|
|
|
|
Pursuit revenue increased $41.2 million or 36.7%, primarily due to incremental revenue of $34.4 million from the 2016 acquisitions of CATC and Maligne Lake Tours, increases across all hospitality assets and attractions, offset in part by the strategic downsizingincrease in operating costs to support higher business volume during 2023.
Performance Measures
We use the following key business metrics to evaluate the performance of Pursuit’s attractions business:
* Refer to footnote (2) invisitors at all comparable Pursuit attractions during the above table for more information about the non-GAAP financial measures of organic revenue and organic segment operating results.
Pursuit operating income increased $7.9 million or 28.4%, primarily due to higher revenue, offset in part by higher accruals for performance-based incentives, acquisition transaction-related costs, and investments to support continued growth of the business. Organic operating income* decreased $0.1 million or 0.4%.
* Refer to footnote (2) in the above table for more information about the non-GAAP financial measures of organic revenue and organic segment operating results.
Performance Measures
We use the following key business metrics, common in the hospitality industry, to evaluate Pursuit’s hospitality business:
Revenue per Available Room. RevPAR is calculated as total rooms revenue divided by the total number of room nights available for all comparable Pursuit hospitality properties during the period. Total rooms revenue does not include non-rooms revenue, which consists of ancillary revenue generated by hospitality properties, such as food and beverage and retail revenue. RevPAR measures the period-over-period change in rooms revenue per available room for comparable hospitality properties. RevPAR is affected by average daily rate and occupancy, which have different implications on profitability.
Average Daily Rate.Rate (“ADR”). ADR is calculated as total rooms revenue divided by the total number of room nights sold for all comparable Pursuit hospitality properties during the period. ADR is used to assess the pricing levels that the hospitality properties are able to generate.realize. Increases in ADR at hospitality properties lead to increases in rooms revenue with no substantial effect on variable costs, therefore having a greater impact on margins than increases in occupancy.
Occupancy. Occupancy is calculated as the total number of room nights sold divided by the total number of room nights available for all comparable Pursuit hospitality properties during the period. Occupancy measures the utilization of the available capacity at the hospitality properties. Increases in occupancy result in increases in rooms revenue and additional variable operating costs (including housekeeping services, utilities, and room amenity costs), as well as increasedincreases in ancillary non-rooms revenue (including food and beverage and retail revenue).
We evaluate the performance of Pursuit’s attractions business utilizing the number of passengers and total attractions revenue per passenger. The number of passengers allows us to assess the volume of visitor activity at each attraction during the period. Total attractions revenue per passenger is calculated as total attractions revenue divided by the total number of passengers at all Pursuit attractions during the period. Total attractions revenue includes ticket sales and ancillary revenue generated by attractions, such as food and beverage and retail revenue. Total attractions revenue per passenger measures the total spend per visitor that attraction properties are able to capture, which is important to the profitability of the attractions business.
The following table provides Pursuit’s same-store key performance indicators forindicators:
|
| Year Ended December 31, 2023 |
|
| Year Ended December 31, 2022 |
|
| % Change |
| |||||||||||||||||||||||||||
|
| As |
|
| New Experiences(1) |
|
| Same-Store(2) |
|
| As |
|
| New Experiences(1) |
|
| FX Impact(3) |
|
| Same-Store(2) |
|
| As |
|
| Same-Store(2) |
| |||||||||
Attractions Key Performance Indicators: |
|
|
|
|
|
|
|
|
|
|
|
|
|
|
|
|
|
|
|
|
|
|
|
|
|
|
| |||||||||
Number of visitors |
|
| 3,540,646 |
|
|
| 36,951 |
|
|
| 3,503,695 |
|
|
| 2,931,266 |
|
|
| 37,329 |
|
|
| — |
|
|
| 2,893,937 |
|
|
| 20.8 | % |
|
| 21.1 | % |
Ticket revenue (in thousands) |
| $ | 143,362 |
|
| $ | 2,748 |
|
| $ | 140,614 |
|
| $ | 114,936 |
|
| $ | 2,943 |
|
| $ | 2,263 |
|
| $ | 109,730 |
|
|
| 24.7 | % |
|
| 28.1 | % |
Effective ticket price |
| $ | 40.49 |
|
| $ | 74.36 |
|
| $ | 40.13 |
|
| $ | 39.21 |
|
| $ | 78.85 |
|
| $ | — |
|
| $ | 37.92 |
|
|
| 3.3 | % |
|
| 5.8 | % |
Attractions revenue (in thousands) |
| $ | 190,437 |
|
| $ | 5,501 |
|
| $ | 184,936 |
|
| $ | 153,575 |
|
| $ | 5,428 |
|
| $ | 3,137 |
|
| $ | 145,010 |
|
|
| 24.0 | % |
|
| 27.5 | % |
Revenue per attraction visitor |
| $ | 53.79 |
|
| $ | 148.86 |
|
| $ | 52.78 |
|
| $ | 52.39 |
|
| $ | 145.41 |
|
| $ | — |
|
| $ | 50.11 |
|
|
| 2.7 | % |
|
| 5.3 | % |
Hospitality Key Performance Indicators: |
|
|
|
|
|
|
|
|
|
|
|
|
|
|
|
|
|
|
|
|
|
|
|
|
|
|
| |||||||||
Room nights available |
|
| 595,783 |
|
|
| 38,672 |
|
|
| 557,111 |
|
|
| 573,165 |
|
|
| 14,978 |
|
|
| — |
|
|
| 558,187 |
|
|
| 3.9 | % |
|
| (0.2 | )% |
Rooms revenue (in thousands) |
| $ | 85,942 |
|
| $ | 5,932 |
|
| $ | 80,010 |
|
| $ | 77,019 |
|
| $ | 2,069 |
|
| $ | 1,485 |
|
| $ | 73,465 |
|
|
| 11.6 | % |
|
| 8.9 | % |
RevPAR |
| $ | 144.25 |
|
| $ | 153.38 |
|
| $ | 143.62 |
|
| $ | 134.37 |
|
| $ | 138.11 |
|
| $ | — |
|
| $ | 131.61 |
|
|
| 7.3 | % |
|
| 9.1 | % |
Occupancy |
|
| 70.3 | % |
|
| 63.2 | % |
|
| 70.8 | % |
|
| 68.1 | % |
|
| 53.3 | % |
|
| — |
|
|
| 68.5 | % |
|
| 3.2 | % |
|
| 2.3 | % |
ADR |
| $ | 205.26 |
|
| $ | 242.69 |
|
| $ | 202.94 |
|
| $ | 197.21 |
|
| $ | 259.19 |
|
| $ | — |
|
| $ | 192.03 |
|
|
| 4.1 | % |
|
| 5.7 | % |
Hospitality revenue (in thousands) |
| $ | 143,961 |
|
| $ | 6,270 |
|
| $ | 137,691 |
|
| $ | 130,303 |
|
| $ | 2,528 |
|
| $ | 1,915 |
|
| $ | 125,860 |
|
|
| 10.5 | % |
|
| 9.4 | % |
20
|
| Year Ended December 31, |
| |||||||||
|
| 2017 |
|
| 2016 |
|
| % Change |
| |||
Same-Store Key Performance Indicators (1) |
|
|
|
|
|
|
|
|
|
|
|
|
Hospitality: |
|
|
|
|
|
|
|
|
|
|
|
|
Room nights available |
|
| 181,242 |
|
|
| 179,420 |
|
|
| 1.0 | % |
RevPAR |
| $ | 126 |
|
| $ | 118 |
|
|
| 6.8 | % |
ADR |
| $ | 180 |
|
| $ | 171 |
|
|
| 5.3 | % |
Occupancy |
|
| 70.2 | % |
|
| 69.2 | % |
|
| 1.0 | % |
Attractions: |
|
|
|
|
|
|
|
|
|
|
|
|
Passengers |
|
| 1,793,779 |
|
|
| 1,594,508 |
|
|
| 12.5 | % |
Revenue per passenger |
| $ | 42 |
|
| $ | 33 |
|
|
| 27.3 | % |
|
|
Hospitality. Room nights available increased during 2017 primarily due to changes in exchange rates for same-store Pursuit experiences located outside of the opening dates of certain seasonal properties. RevPAR, ADR, and Occupancy increased during 2017 primarily due to our focus on revenue management and refreshing key assets to enhance the guest experience, as well as strong park visitation during 2017.
Attractions. The increase in the number of passengersattractions visitors during 20172023 was primarily due to increased visitation at our Banff Gondola, which was closed for renovations during the first four months of 2016. Excluding the Banff Gondola, total same-store attraction passengers increased 53,225 in 2017 primarily driven by our effortsstrengthening international tourism to enhanceWestern Canada and Iceland. The increase in same-store effective ticket price during 2023 was driven by revenue management efforts.
Attractions ticket revenue on a same-store basis increased $30.9 million on a 21.1% increase in visitors and a 5.8% increase in effective ticket price during 2023.
Hospitality. The increase in room nights available during 2023 was primarily driven by the guest experience and strong park visitationaddition of the Forest Park Hotel, which opened in Canada.
Revenue per passenger increasedAugust 2022. The increase in RevPAR during 2017 primarily2023 was due to higher effective ticket pricesincreases in ADR and occupancy primarily driven by our focus on revenue management efforts and refreshing key assets to enhance theincreased guest experience,demand in Western Canada.
During 2023, rooms revenue on a same-store basis increased $6.5 million on a 9.1% increase in RevPAR and higher ancillary revenue primarily resulting from our recent renovations of the food and beverage and retail operations at the Banff Gondola and the food and beverage operations at the Columbia Icefield Glacier Discovery Center.a 0.2% decrease in room nights available.
During 2017, Pursuit derived approximately 64% of its revenue and 86% of its segment operating income from its Canadian operations, which are largely dependent on foreign customer visitation. Accordingly, the strengthening or weakening of the Canadian dollar, relative to other currencies, could affect customer volumes and the results of operations. Additionally, Pursuit is affected by consumer discretionary spending on tourism activities.
The following table provides Pursuit’s same-store key performance indicatorspresents a comparison of GES’ reported revenue and segment operating income for the years ended December 31, 20162023 and 2015. The same-store metrics indicate2022:
|
| Year Ended December 31, |
|
| ||||||||
(in thousands) |
| 2023 |
|
| 2022 |
|
| % Change |
| |||
Revenue: |
|
|
|
|
|
|
|
|
| |||
GES: |
|
|
|
|
|
|
|
|
| |||
Spiro |
| $ | 283,171 |
|
| $ | 277,641 |
|
|
| 2.0 | % |
GES Exhibitions |
|
| 614,418 |
|
|
| 557,880 |
|
|
| 10.1 | % |
Intersegment eliminations |
|
| (9,194 | ) |
|
| (7,537 | ) |
|
| (22.0 | )% |
Total GES |
| $ | 888,395 |
|
| $ | 827,984 |
|
|
| 7.3 | % |
Segment operating income (1) |
|
|
|
|
|
|
|
|
| |||
Spiro |
| $ | 23,723 |
|
| $ | 23,133 |
|
|
| 2.6 | % |
GES Exhibitions |
|
| 31,339 |
|
|
| 21,780 |
|
|
| 43.9 | % |
Total GES |
| $ | 55,062 |
|
| $ | 44,913 |
|
|
| 22.6 | % |
|
| Year Ended December 31, |
| |||||||||
|
| 2016 |
|
| 2015 |
|
| % Change |
| |||
Same-Store Key Performance Indicators (1) |
|
|
|
|
|
|
|
|
|
|
|
|
Hospitality: |
|
|
|
|
|
|
|
|
|
|
|
|
Room nights available |
|
| 228,290 |
|
|
| 228,739 |
|
|
| (0.2 | )% |
RevPAR |
| $ | 108 |
|
| $ | 97 |
|
|
| 11.3 | % |
ADR |
| $ | 153 |
|
| $ | 143 |
|
|
| 7.0 | % |
Occupancy |
|
| 71.1 | % |
|
| 67.4 | % |
|
| 3.7 | % |
Attractions: |
|
|
|
|
|
|
|
|
|
|
|
|
Passengers |
|
| 1,478,172 |
|
|
| 1,340,175 |
|
|
| 10.3 | % |
Revenue per passenger |
| $ | 31 |
|
| $ | 31 |
|
|
| 0.0 | % |
|
|
Hospitality. Room nights available decreased during 2016Spiro revenue increased $5.5 million primarily due to changes in the opening dates of certain seasonal Glacier Park, Inc. properties as a result of management’s review of a variety of factors, including weather conditions, opening dates of other properties in the area,increased spending by existing clients and availability of seasonal employees.
RevPAR increased during the year ended December 31, 2016 due to increases in both ADR and occupancy across all geographies resulting from our focus on revenue management and strong park visitation in 2016 due in part to favorable weather conditions in contrast to forest fires during the third quarter of 2015.
Attractions. The increase in the number of passengers for the year ended December 31, 2016 was primarily due to revenue management initiatives combined with strong park visitation. During the year ended December 31, 2016, the number of passengers increased across all attractions. Growth in passengers was especially strong at the Glacier Skywalk attraction as a result of management’s decision to introduce a combination ticket that included both the Glacier Skywalk and the adjacent Columbia Icefield Glacier Adventure. Additionally, despite the Banff Gondola being partially closed for renovations during most of 2016, it showed strong demand with a 3.8% increase in the number of passengers during 2016 as compared to 2015. Excluding the Banff Gondola passengers, total attraction passengers would have increased 15.1% in 2016.
Revenue per passenger remained flat during 2016 primarily due to lower revenue from ancillary foodnew clients and beverage and retail services at the Banff Gondola due to its partial closure and the greater proportionpositive show rotation of total passengers coming from the lower-priced Glacier Skywalk.
|
| Year Ended December 31, |
|
|
|
|
|
|
|
|
| |||||||||
(in thousands) |
| 2017 |
|
| 2016 |
|
| 2015 |
|
| Percentage Change 2017 vs. 2016 |
|
| Percentage Change 2016 vs. 2015 |
| |||||
Corporate activities |
| $ | 12,877 |
|
| $ | 10,322 |
|
| $ | 9,720 |
|
|
| 24.8 | % |
|
| 6.2 | % |
The increase in corporate activities during 2017, as compared to 2016, was primarily due to an increase in performance-based compensation expense driven by our common stock price appreciation relative to December 31, 2016. The increase in corporate activities during 2016, as compared to 2015, was primarily due to an increase in performance-based compensation expense,approximately $7 million, offset in part by costs related to a shareholder nomination and settlement agreementthe sale of substantially all of the assets of ON Services in December of 2022, which contributed revenue of $27.6 million during 2015 and lower acquisition transaction-related costs in 2016.2022.
Interest Expense
|
| Year Ended December 31, |
|
|
|
|
|
|
|
|
| |||||||||
(in thousands) |
| 2017 |
|
| 2016 |
|
| 2015 |
|
| Percentage Change 2017 vs. 2016 |
|
| Percentage Change 2016 vs. 2015 |
| |||||
Interest expense |
| $ | 8,304 |
|
| $ | 5,898 |
|
| $ | 4,535 |
|
|
| 40.8 | % |
|
| 30.1 | % |
The increase in interest expense during 2017, as compared to 2016, and during 2016, as compared to 2015, wasGES Exhibitions revenue increased $56.5 million, primarily due to higher debt balances resulting from acquisitions completedsame-show revenue growth of 18.6% and new event wins, offset in part by negative show rotation of approximately $30 million and the sale of substantially all of the assets of ON Services in December of 2022, which contributed revenue of $23.2 million during 2016 and 2017.2022.
Restructuring Charges
|
| Year Ended December 31, |
|
|
|
|
|
|
|
|
| |||||||||
(in thousands) |
| 2017 |
|
| 2016 |
|
| 2015 |
|
| Percentage Change 2017 vs. 2016 |
|
| Percentage Change 2016 vs. 2015 |
| |||||
Restructuring charges |
| $ | 1,004 |
|
| $ | 5,183 |
|
| $ | 2,956 |
|
|
| (80.6 | )% |
|
| 75.3 | % |
Restructuring charges during 2017, 2016 and 2015 wereSpiro segment operating income increased $0.6 million primarily relateddue to the eliminationincrease in revenue, offset in part by the ongoing investment in staff to support growth.
GES Exhibitions segment operating income increased $9.6 million, primarily due to the increase in revenue, offset in part by the restaffing of certain positions and facility consolidations in GES, as well as the elimination of certain positions at our corporate office and at Pursuit.
Impairment Charges (Recoveries)
workforce from pandemic levels.
|
| Year Ended December 31, |
|
|
|
|
| |||||||||
(in thousands) |
| 2017 |
|
| 2016 |
|
| 2015 |
|
| Percentage Change 2017 vs. 2016 |
| Percentage Change 2016 vs. 2015 | |||
Impairment charges (recoveries), net |
| $ | (29,098 | ) |
| $ | 218 |
|
| $ | 96 |
|
| ** |
| ** |
21
Other Expenses
|
| Year Ended December 31, |
|
| ||||||||
(in thousands) |
| 2023 |
|
| 2022 |
|
| % Change |
| |||
Corporate activities |
| $ | 14,040 |
|
| $ | 13,418 |
|
|
| 4.6 | % |
Gain on sale of ON Services |
| $ | 204 |
|
| $ | (19,637 | ) |
| ** |
| |
Interest expense, net |
| $ | 47,978 |
|
| $ | 34,891 |
|
|
| 37.5 | % |
Other expense, net |
| $ | 2,033 |
|
| $ | 2,077 |
|
|
| (2.1 | )% |
Restructuring charges |
| $ | 1,174 |
|
| $ | 3,059 |
|
|
| (61.6 | )% |
Impairment charges |
| $ | — |
|
| $ | 583 |
|
|
| (100.0 | )% |
Income tax expense |
| $ | 18,799 |
|
| $ | 9,973 |
|
|
| 88.5 | % |
Income (loss) from discontinued operations |
| $ | (822 | ) |
| $ | 148 |
|
| ** |
| |
** Change is greater than +/- 100%.
Gain on sale of ON Services – On December 29, 2016,15, 2022, we completed the Mount Royal Hotelsale of substantially all of the assets of ON Services. We recognized a gain on sale of approximately $19.6 million in 2022, which was damagedadjusted downward by a fire and closed. During July 2017, we resolved our property and business interruption insurance claims related to the fire for a total of $36.3 million. We allocated $2.2$0.2 million to an insurance receivable, $29.3 million was recorded as an impairment recovery (partially offset by impairment charges of $0.2 million) related to construction costs to re-open the hotel, $2.5 million was recorded as a business interruption gain for the recovery of lost profits, $1.3 million was recorded as contra-expense to offset non-capitalizable costs we incurred, and the remaining $1.0 million was recorded as deferred income that will be recognized over the periods the business interruption losses are actually incurred.in 2023.
Income Taxes
Excluding the impact of a $16.1 millionInterest Expense, net charge related to the Tax Act, income taxes went from an effective tax rate of 33% for the year ended December 31, 2016 to an effective rate of 28% for the year ended December 31, 2017. – The decreaseincrease in interest expense was primarily due to higher foreigninterest rates in 2023.
Restructuring Charges – Restructuring charges during 2023 and 2022 were primarily related to our 2022 transformation and streamlining efforts at GES to significantly reduce costs and create a lower and more flexible cost structure focused on servicing our more profitable market segments.
Income Tax Expense – The effective income taxed at lowertax rates the release ofwere 43.6% for 2023 and 28.8% for 2022. We generated higher income in 2023 than 2022 in our tax jurisdictions without a valuation allowance relatedand were not able to foreign net operating losses, and the adoption of new accounting guidance, effective in the first quarter of 2017, which requires the excess taxrecognize a benefit on share-based compensation to be recorded to income tax expense rather than equity.losses in our jurisdictions with a valuation allowance.
Income (Loss) from Discontinued Operations – The 2016 effective tax rate of 33% increasedloss from 28% in 2015discontinued operations during 2023 was primarily due to a non-cash tax benefit of $1.6 million recorded in 2015legal matters related to deferred taxes associated with certain foreign intangible assets.previously sold operations.
Liquidity and Capital Resources
Cash and cash equivalents were $53.7 million as of December 31, 2017, as compared to $20.9 million as of December 31, 2016. During the year ended December 31, 2017, we generated net cash flow from operating activities of $112.2 million. We believe that our existing sources of liquidity will be sufficient to fund operations and projected capital commitmentsoutlays for at least the next 12 months.months and the longer term.
When assessing our current sources of liquidity, we include the following:
|
| December 31, |
| |||||
|
| 2023 |
|
| 2022 |
| ||
Unrestricted cash and cash equivalents(1) |
| $ | 52,704 |
|
| $ | 59,719 |
|
Available capacity on Revolving Credit Facility(2) |
|
| 108,040 |
|
|
| 86,670 |
|
Total available liquidity |
| $ | 160,744 |
|
| $ | 146,389 |
|
Cash provided by operating activities, supplemented by our existing cash balances were repatriated toand cash equivalents, is our primary source of liquidity for funding our business requirements. During the United States, would be zero.
Cash Flows
Operating Activities
|
| Year Ended December 31, |
| |||||||||
(in thousands) |
| 2017 |
|
| 2016 |
|
| 2015 |
| |||
Net income |
| $ | 58,184 |
|
| $ | 42,795 |
|
| $ | 27,048 |
|
Depreciation and amortization |
|
| 55,114 |
|
|
| 42,743 |
|
|
| 35,231 |
|
Deferred income taxes |
|
| 26,049 |
|
|
| 7,672 |
|
|
| 469 |
|
Loss from discontinued operations |
|
| 268 |
|
|
| 684 |
|
|
| 394 |
|
Impairment charges (recoveries) |
|
| (29,098 | ) |
|
| 218 |
|
|
| 96 |
|
Other non-cash items |
|
| 18,422 |
|
|
| 19,239 |
|
|
| 11,090 |
|
Changes in assets and liabilities |
|
| (16,716 | ) |
|
| (13,033 | ) |
|
| (14,051 | ) |
Net cash provided by operating activities |
| $ | 112,223 |
|
| $ | 100,318 |
|
| $ | 60,277 |
|
2017 compared with 2016
Netyear ended December 31, 2023, net cash provided by operating activities increased $11.9was $104.7 million.
Our short-term and long-term funding requirements include debt obligations, maintenance capital expenditures, working capital requirements, and potential acquisitions and strategic investments as we focus on scaling Pursuit with investments in high-return unforgettable, inspiring experiences through its Refresh, Build, Buy growth strategy. Our projected capital outlays can be adjusted for changes in the operating environment.
22
Debt Obligations
Effective July 30, 2021, we entered into the 2021 Credit Facility. The 2021 Credit Facility provided for a $400 million primarily from resultsTerm Loan B, with a maturity date of operations.
2016 comparedJuly 30, 2028, and a $100 million Revolving Credit Facility, with 2015
Net cash provided by operating activities increased $40.0 million, primarily from resultsa maturity date of operations.
|
| Year Ended December 31, |
| |||||||||
(in thousands) |
| 2017 |
|
| 2016 |
|
| 2015 |
| |||
Capital expenditures |
| $ | (56,621 | ) |
| $ | (49,815 | ) |
| $ | (29,839 | ) |
Proceeds from insurance |
|
| 31,570 |
|
|
| — |
|
|
| — |
|
Cash paid for acquired businesses, net |
|
| (1,501 | ) |
|
| (195,989 | ) |
|
| (430 | ) |
Proceeds from dispositions of property and other assets |
|
| 947 |
|
|
| 1,166 |
|
|
| 1,542 |
|
Net cash used in investing activities |
| $ | (25,605 | ) |
| $ | (244,638 | ) |
| $ | (28,727 | ) |
2017 compared with 2016
Net cash used in investing activities decreased $219.0 million, primarily due to cash payments,July 30, 2026. The proceeds of the Term Loan B, net of cash acquired,$14.8 million in 2016 of $196.0related fees, were used to repay the $327 million outstanding balance under our prior $450 million revolving credit facility and to provide for the ON Services, FlyOver Canada, CATC, and Maligne Lake Toursfinancial flexibility to fund future acquisitions and growth initiatives and for general corporate purposes. On January 4, 2023, we entered into an interest rate cap agreement with an effective date of January 31, 2023. The interest rate cap manages our exposure to interest rate increases on $300 million in borrowings under the Mount Royal Hotel fire-related insurance proceeds received in 2017, offset in part by an increase in capital expenditures.
2016 compared with 2015
Net cash used in investing activities increased $215.9 million, primarily due to cash payments, net of cash acquired, of $196.0 million for the 2016 acquisitions of ON Services, FlyOver Canada, CATC, and Maligne Lake Tours, and an increase in capital expenditures, primarily due to the Banff Gondola renovations.
2021 Credit Facility or other Secured Overnight Financing Activities
|
| Year Ended December 31, |
| |||||||||
(in thousands) |
| 2017 |
|
| 2016 |
|
| 2015 |
| |||
Proceeds from borrowings |
| $ | 90,004 |
|
| $ | 229,701 |
|
| $ | 50,000 |
|
Payments on debt and capital lease obligations |
|
| (135,801 | ) |
|
| (108,915 | ) |
|
| (62,969 | ) |
Dividends paid on common stock |
|
| (8,160 | ) |
|
| (8,111 | ) |
|
| (8,036 | ) |
Debt issuance costs |
|
| (5 | ) |
|
| (336 | ) |
|
| — |
|
Common stock purchased for treasury |
|
| (2,119 | ) |
|
| (722 | ) |
|
| (4,816 | ) |
Acquisition of business - deferred consideration |
|
| — |
|
|
| (130 | ) |
|
| (896 | ) |
Other |
|
| — |
|
|
| 95 |
|
|
| 1,459 |
|
Net cash provided by (used in) financing activities |
| $ | (56,081 | ) |
| $ | 111,582 |
|
| $ | (25,258 | ) |
2017 compared with 2016
The change in net cash provided by (used in) financing activities was primarily due to net debt payments of $45.8 million during 2017 compared to net debt proceeds of $120.8 million during 2016 related to the ON Services, CATC, and FlyOver Canada acquisitions completed in 2016 and an increase in cash used for common stock repurchases of $1.4 million.
2016 compared with 2015
The change in net cash provided by (used in) financing activities was primarily due to net debt proceeds of $120.8 million during 2016 related to the ON Services, CATC, and FlyOver Canada acquisitions and a decrease in cash used for common stock repurchases of $4.1 million.
Debt and Capital Lease Obligations
Rate (“SOFR”) based borrowings. Refer to Note 1113 – Debt and Capital Lease ObligationsDerivative of the Notes to Consolidated Financial Statements (Part II, Item 8 of this 20172023 Form 10-K) for further discussion.additional information.
Guarantees
The Revolving Credit Facility carries financial covenants. On March 28, 2023, we entered into the Second Amendment to the 2021 Credit Facility, which modified the interest coverage financial covenant. On October 6, 2023, we entered into the Third Amendment to the 2021 Credit Facility, which among other things, increased the principal amount of the Revolving Credit Facility by $70 million, bringing the total amount of revolving capacity to $170 million. In connection with the Third Amendment, we prepaid $70 million of the outstanding balance on our existing Term Loan B using $60 million from the Revolving Credit Facility and $10 million of cash from the Company’s balance sheet. The current credit spread on our Revolving Credit Facility is 200 basis points lower than the credit spread on the Term Loan B, which is 5.00% for SOFR borrowings. As of December 31, 2023, we were in compliance with all covenants under the Revolving Credit Facility. Refer to Note 1112 – Debt and Capital LeaseFinance Obligations of the Notes to Consolidated Financial Statements (Part II, Item 8 of this 20172023 Form 10-K) for additional information.
Capital Expenditures
As of December 31, 2023, we have planned capital expenditures of approximately $65 million to $70 million for 2024, including approximately $20 million on select growth projects, such as the completion of FlyOver Chicago. We intend to continue making selective investments to advance Pursuit’s Refresh, Build, Buy growth strategy while maintaining a solid liquidity position.
Other Obligations
We have additional obligations as part of our ordinary course of business, beyond those committed for debt obligations and capital expenditures. Refer to Note 21 – Leases and Other and Note 19 – Pension and Postretirement Benefits of the Notes to Consolidated Financial Statements (Part II, Item 8 of this 2023 Form 10-K) for further discussion.information. The expected timing of payments of our obligations is estimated based on current information. Timing of payments and actual amounts paid may be different, depending on changes to agreed-upon amounts for certain obligations.
Cash Flows
Operating Activities
|
| Year Ended December 31, |
| |||||
(in thousands) |
| 2023 |
|
| 2022 |
| ||
Net income |
| $ | 23,452 |
|
| $ | 24,795 |
|
Depreciation and amortization |
|
| 51,043 |
|
|
| 52,483 |
|
Deferred income taxes |
|
| (1,609 | ) |
|
| 1,820 |
|
(Income) loss from discontinued operations |
|
| 822 |
|
|
| (148 | ) |
Restructuring charges |
|
| 1,174 |
|
|
| 3,059 |
|
Impairment charges |
|
| — |
|
|
| 583 |
|
Gains on dispositions of property and other assets |
|
| (98 | ) |
|
| (272 | ) |
Gain on sale of ON Services |
|
| 204 |
|
|
| (19,637 | ) |
Share-based compensation expense |
|
| 11,452 |
|
|
| 10,241 |
|
Other non-cash items, net |
|
| 6,605 |
|
|
| 12,843 |
|
Changes in assets and liabilities |
|
| 11,633 |
|
|
| (12,336 | ) |
Net cash provided by operating activities |
| $ | 104,678 |
|
| $ | 73,431 |
|
Net cash provided by operating activities increased $31.2 million primarily due to improved segment operating results at Pursuit and GES and improved working capital.
23
|
| Year Ended December 31, |
| |||||
(in thousands) |
| 2023 |
|
| 2022 |
| ||
Capital expenditures |
| $ | (76,089 | ) |
| $ | (67,170 | ) |
Cash paid for acquisitions, net |
|
| (41 | ) |
|
| (25,494 | ) |
Proceeds from sale of ON Services |
|
| 1,168 |
|
|
| 28,926 |
|
Proceeds from dispositions of property and other assets |
|
| 107 |
|
|
| 470 |
|
Net cash used in investing activities |
| $ | (74,855 | ) |
| $ | (63,268 | ) |
Net cash used in investing activities increased $11.6 million primarily due to proceeds from the sale of ON Services of $28.9 million in 2022 and an increase in capital expenditures in 2023, offset in part by cash paid for the Glacier Raft Company acquisition in April of 2022 of $25.5 million.
Financing Activities
|
| Year Ended December 31, |
| |||||
(in thousands) |
| 2023 |
|
| 2022 |
| ||
Proceeds from borrowings |
| $ | 162,049 |
|
| $ | 107,580 |
|
Payments on debt and finance obligations |
|
| (184,537 | ) |
|
| (103,491 | ) |
Dividends paid on preferred stock |
|
| (7,801 | ) |
|
| (7,801 | ) |
Distributions to noncontrolling interest, net of contributions from noncontrolling interest |
|
| (2,726 | ) |
|
| (570 | ) |
Payments of debt issuance costs |
|
| (1,667 | ) |
|
| (418 | ) |
Payment of payroll taxes on stock-based compensation through shares withheld or repurchased |
|
| (1,482 | ) |
|
| (1,428 | ) |
Net cash used in financing activities |
| $ | (36,164 | ) |
| $ | (6,128 | ) |
Net cash used in financing activities increased $30.0 million primarily due to net debt payments of $22.5 million during 2023 compared to net debt proceeds from borrowings of $4.1 million during 2022.
Debt and Finance Obligations
Refer to Note 12 – Debt and Finance Obligations of the Notes to Consolidated Financial Statements (Part II, Item 8 of this 2023 Form 10-K) for further discussion all of which is incorporated by reference herein.
Guarantees
Refer to Note 22 – Litigation, Claims, Contingencies, and Other of the Notes to Consolidated Financial Statements (Part II, Item 8 of this 2023 Form 10-K) for further discussion all of which is incorporated by reference herein.
Share Repurchases
Our Board of Directors haspreviously authorized us to repurchase shares of our common stock from time to time at prevailing market prices. No shares were repurchased on the open market during 2017 or 2016. During 2015, we repurchased 141,462 shares on the open market for $3.8 million. As of December 31, 2017, 440,5402023, 546,283 shares remained available for repurchase.repurchase under all prior authorizations. In March 2020, our Board of Directors suspended our share repurchase program. The Board of Director’sDirectors’ authorization does not have an expiration date. We
Additionally, we repurchased 41,532 shares for $2.1 million in 2017, 25,432 shares for $0.7 million during 2016, and 35,649 shares for $1.0 million in 2015 related to tax withholding requirements on vested restricted share-based awards.
Contractual Obligations
The following table presents our contractual obligations as of December 31, 2017.
|
|
|
|
|
| Payments due by period |
| |||||||||||||
(in thousands) |
| Total |
|
| 2018 |
|
| 2019-2020 |
|
| 2021-2022 |
|
| Thereafter |
| |||||
Revolver and term loan borrowings |
| $ | 207,322 |
|
| $ | 151,072 |
|
| $ | 56,250 |
|
| $ | — |
|
| $ | — |
|
Operating leases |
|
| 156,569 |
|
|
| 23,503 |
|
|
| 37,564 |
|
|
| 14,367 |
|
|
| 81,135 |
|
Pension and postretirement benefits (1) |
|
| 33,666 |
|
|
| 3,945 |
|
|
| 6,763 |
|
|
| 6,721 |
|
|
| 16,237 |
|
Purchase obligations (2) |
|
| 38,128 |
|
|
| 23,660 |
|
|
| 8,813 |
|
|
| 5,655 |
|
|
| — |
|
Capital lease obligations |
|
| 2,854 |
|
|
| 1,527 |
|
|
| 1,311 |
|
|
| 16 |
|
|
| — |
|
Total contractual obligations (3) |
| $ | 438,539 |
|
| $ | 203,707 |
|
| $ | 110,701 |
|
| $ | 26,759 |
|
| $ | 97,372 |
|
|
|
|
|
|
|
We are plaintiffs or defendants to various actions, proceedings, and pending claims, some of which involve, or may involve, compensatory, punitive, or other damages. Additionally, our business contributes to various multi-employer pension plans based on obligations arising under collective-bargaining agreements covering our union-represented employees. Refer to Note 20 – Litigation, Claims, Contingencies, and Other of the Notes to Consolidated Financial Statements (Part II, Item 8 of this 2017 Form 10-K) for further information.
Off-Balance Sheet Arrangements
We have not entered into any off-balance sheet arrangements with unconsolidated special-purpose or other entities that would materially affect our financial position, results of operations, liquidity, or capital resources. Furthermore, we do not have any relationships with special-purpose or other entities that provide off-balance sheet financing; liquidity, market risk, or credit risk support; or engage in leasing or other services that may expose us to liability or risks of loss that are not reflected in the consolidated financial statements and related notes. Refer to Note 11 – Debt and Capital Lease Obligations, Note 19 – Leases and Other, and Note 20 – Litigation, Claims, Contingencies, and Other of the Notes to Consolidated Financial Statements (Part II, Item 8 of this 2017 Form 10-K) for further information.
Critical Accounting Policies and Estimates
The consolidated financial statements are prepared in accordance with U.S. GAAP.United States generally accepted accounting principles (“GAAP”). We are required to make estimates and assumptions that affect our reported amounts of assets, liabilities, revenue, and expenses. Critical accounting policiesestimates are those policiesestimates that are most important to the portrayal of our financial position and results of operations, and that require us to make the most difficult and subjective judgments, often as a result of the need to make estimates of matters that are inherently uncertain. We identified and discussed with our audit committeeAudit Committee the following critical accounting policies and estimates and the methodology and disclosures related to those estimates:
Goodwill and Other Intangible Assets— Goodwill and other intangible assets with indefinite useful lives are not amortized, but instead are tested for impairment at least annually. Intangible assets with finite lives are amortized over their respective estimated useful lives and are reviewed for impairment if an event occurs or circumstances change that would indicate the intangible asset’s carrying value may not be recoverable.
24
Goodwill is tested for impairment at the reporting unit level on an annual basis as of October 31, and between annual tests if an event occurs or circumstances change that would more-likely-than-not reduce the fair value of a reporting unit below its carrying value. Our reporting units are defined, and goodwill is tested, at either an operating segment level or at the component level of an operating segment, depending on various factors including the internal reporting structure of the operating segment, the level of integration among components, the sharing of assets and other resources among components, and the benefits and likely recoverability of goodwill by the component’s operations.
GES U.S. goodwill is assigned to, and tested at, the operating segment level (all GES domestic operations). GES International goodwill is assigned to and tested based on the segment’s geographical operations (GES Europe, Middle East, and Asia (“GES EMEA”) and GES Canada). Pursuit impairment testing is performed at the reporting unit level (Banff Jasper Collection, the Alaska Collection, the Glacier Park Collection, and FlyOver).
For purposes of goodwill impairment testing, we use a discounted expected future cash flow methodology (income approach) to estimate the fair value of our reporting units. The estimates and assumptions regarding expected future cash flows (the most significant being revenue and EBITDA margins), discount rates, and terminal values require considerable judgment and are based on market conditions, financial forecasts, industry trends, and historical experience.
The most critical assumptions and estimates in determining the estimated fair value of our reporting units relate to the amounts and timing of expected future cash flows for each reporting unit and the reporting unit cost of capital (discount rate) applied to those cash flows. We estimate the assumed reporting unit cost of capital rates (discount rates) using a build-up method based on the perceived risk associated with the cash flows pertaining to the specific reporting unit. In order to assess the reasonableness of our fair value estimates, we perform a reconciliation of the aggregate fair values of our reporting units to our market capitalization.
As noted above, the estimates and assumptions regarding expected future cash flows, discount rates, and terminal values require considerable judgment and are based on market conditions, financial forecasts, industry trends, and historical experience. These estimates have inherent uncertainties, and different assumptions could lead to materially different results. AsOur goodwill balance was $123.9 million as of December 31, 2017,2023 and $121.4 million as of December 31, 2022 and pertained to our aggregatePursuit business. The discount rates used in our most recent impairment analysis ranged from 12% to 16%.
Pursuit’s goodwill was $270.6 million. As a resultassigned to, and tested at, the reporting unit level. The results of our most recent impairment analysis performed as of October 31, 2017, the2023, indicated that no impairment existed for Pursuit’s reporting units with reported goodwill. The excess of the estimated fair value over the carrying value for eachthe Banff Jasper Collection and the Alaska Collection was significant, Glacier Park Collection was 3%, and FlyOver was 5%. We will continue to closely monitor actual results versus expectations as well as whether and to what extent any significant changes in current events or conditions result in corresponding changes to our expectations about future estimated cash flows and discount rates. If our adjusted expectations of the operating results of our reporting units (expressed as a percentagedo not materialize, or the discount rate increases (based on increases in interest rates, market rates of the carrying amounts) under step one of the impairment test for GES U.S. was 134%return or market volatility), GES EMEA was 214%, GES Canada was 164%, Banff Jasper Collection was 147%, the Alaska Collection was 99%, the Glacier Park Collection was 16%, and FlyOver was 29%. Significant reductions in our expected future revenue, operating income, or cash flow forecasts and projections, or an increase in a reporting unit’s cost of capital, could trigger additionalit is possible that we may be required to record goodwill impairment testing,charges in the future, which may result in impairment charges.be material.
If an impairment indicator related to intangible assets is identified, or if other circumstances indicate an impairment may exist, we perform an assessment to determine if an impairment loss should be recognized. This assessment includes a recoverability test to identify if the expected future undiscounted cash flows are less than the carrying value of the related assets. If the results of the recoverability test indicate that expected future undiscounted cash flows are less than the carrying value of the related assets, we perform a measurement of impairment and we recognize any carrying amount in excess of fair value as an impairment. We periodically evaluate the continued recoverability of intangible assets which were previously evaluated due to an impairment indicator to determine if remeasurement is necessary.
Income taxes — We are required to estimate and record provisions for income taxes in each of the jurisdictions in which we operate. Accordingly, we must estimate our actual current income tax liability, and assess temporary differences arising from the treatment of items for tax purposes, as compared to the treatment for accounting purposes. These differences result in deferred tax assets and liabilities, which are included in the Consolidated Balance Sheets. We use significant judgment in forming conclusions regarding the recoverability of our deferred tax assets and evaluate all available positive and negative evidence to determine if it is more-likely-than-not that the deferred tax assets will be realized. To the extent recovery does not appear likely, a valuation allowance must be recorded. We had gross deferred tax assets of $38.1$119.9 million as of December 31, 20172023 and $58.3$110.8 million as of December 31, 2016, which includes the remeasurement due to the reduction in the U.S. tax rate from 35% to 21% resulting in an $8.0 million reduction in the 20172022. We had a valuation allowance against gross deferred tax assets. These deferred tax assets reflect the expected future tax benefits to be realized upon reversal of deductible temporary differences,$105.4 million as of December 31, 2023 and the utilization$101.6 million as of net operating loss and tax credit carryforwards.December 31, 2022.
While we believe that the deferred tax assets, net of existing valuation allowances, will be utilized in future periods, there are inherent uncertainties regarding the ultimate realization of these assets. It is possible that the relative weight of positive and negative evidence regarding the realization of deferred tax assets may change, which could result in a material increase or decrease in our valuation allowance. Such a change could result in a material increase or decrease to income tax expenseexpense/benefit in the period the assessment was made.
Due to the enactment of the Tax Act and the transition to a territorial tax system, we recognized $6.9 million of current federal tax expense and $1.2 million of current state tax expense for the mandatory deemed repatriation of our estimated unremitted earnings as of December 31, 2017. With the transition to a territorial tax system, future dividends will be fully deductible for federal tax purposes, however they may be taxable at the state level. We have not recorded deferred taxes on the incremental additional state taxes or withholding taxes on dividends from our foreign subsidiaries as we intend to reinvest those earnings in our foreign operations.
We record uncertain tax positions on the basis of a two-step process: first we determine whether it is more-likely-than-not that the tax positions will be sustained on the basis of the technical merits of the position; and, if so, we recognize the largest amount of tax benefit that is more than 50% likely to be realized upon ultimate settlement with the related tax authority.
25
Pension and postretirement benefits — Our pension plans use traditional defined benefit formulas based on years of service and final average compensation. Funding policies provide that payments to defined benefit pension trusts shall be at least equal to the minimum funding required by applicable regulations. We presently anticipate contributing $1.1$0.8 million to our funded pension plans and $1.0$0.8 million to our unfunded pension plans in 2018.2024.
We have defined benefit postretirement plans that provide medical and life insurance for certain eligible employees, retirees, and dependents. The related postretirement benefit liabilities are recognized over the employees’ service period. In addition, we retain the obligations for these benefits for retirees of certain sold businesses. While the plans have no funding requirements, we expect to contribute $1.1$0.7 million to the plans in 2018.2024.
The discount rates used in determining future pension and postretirement benefit obligations are based on rates determined by actuarial analysis and management review and reflect the estimated rates of return on a high-quality, hypothetical bond portfolio whose cash flows match the timing and amounts of expected benefit payments. Refer to Note 1719 – Pension and Postretirement Benefits of the Notes to Consolidated Financial Statements (Part II, Item 8 of this 20172023 Form 10-K) for further information.
Share-based compensation — We grant share-based compensation awards to our officers, directors, and certain key employees pursuant to the 2017 Viad Corp Omnibus Incentive Plan, which has a 10-year lifeterm and provides for the following types of awards: (a) incentive and non-qualified stock options; (b) restricted stock awards and restricted stock units; (c) performance units or performance shares; (d) stock appreciation rights; (e) cash-based awards; and (f) certain other stock-based awards.
Share-based compensation expense recognized in the consolidated financial statements was $11.0$11.5 million in 2017, $8.02023, $10.2 million in 2016,2022, and $3.8$7.7 million in 2015, and the2021. We recorded total tax benefits related to such costs were $4.1of $0.2 million in 2017, $3.02023 and $0.1 million in 2016,2022 and $1.5 million in 2016.2021. No share-based compensation costs were capitalized during 2017, 2016,2023, 2022, or 2015.2021.
TheWe account for share-based awards that will be settled in shares of our common stock as equity-based awards. We measure share-based compensation expense of equity-based awards at fair value of restricted stock awards is based on our stock price on the grant date on a straight-line basis over the vesting period. The estimated number of grant. Liability-based awards are recorded at estimated fair value,to be achieved related to a performance condition is updated each reporting period based on the number of units expected to vest and the levelvest. The fair value of achievement of predefinedshare-based awards that contain a performance goals, where applicable, and are remeasured on each balance sheet dategoal based on our stock price, and thea market condition such as total shareholder return is estimated using a Monte Carlo simulation model, until the time of settlement. Thesimulation. A Monte Carlo simulation requires the use of a number ofseveral assumptions, including historical volatility and correlation of the price ofbetween our stock price and the price of the common shares of a comparator group, a risk-free rate of return, and an expected term. Equity-based
We account for share-based payment awards (including performance units) are recordedthat will be settled in cash as liability-based awards. We measure share-based compensation expense of liability-based awards at estimated fair value at each reporting date until the date of settlement based on the number of units expected to vest and, where applicable, the level of achievement of predefined performance goals, until the time of settlement. We use the Black-Scholes option pricing model and key assumptions to determine thegoals. These awards are remeasured on each reporting date based on our stock price. The fair value of each stock option grant. Theseshare-based awards that contain a performance goal based on a market condition such as total shareholder return is estimated using the Monte Carlo simulation. A Monte Carlo simulation requires the use of several assumptions, includeincluding historical volatility and correlation between our expected stock price volatility, the expected period of time the stock option will remain outstanding of which stock options have a ten-year life, the expected dividend yield on our common stock, and the risk-free interest rate. While we have not granted stock options since 2010, changes in the assumptions of any future grants could result in different estimatesprice of the common shares of a comparator group, a risk-free rate of return, and an expected term.
The fair value of stock option grants is estimated on the date of grant using the Black-Scholes stock option pricing model. The Black-Scholes model requires the use of several assumptions, including expected volatility, a risk-free interest rate, a forfeiture rate, and consequently impact ourexpected life. We measure share-based compensation for performance-based options on a straight-line basis over the performance period and the underlying shares expected to be settled are adjusted each reporting period based on estimated future resultsachievement of operations. the respective performance metrics. Service-based options are recognized on a straight-line basis over the requisite service period on a graded-vesting schedule.
Refer to Note 23 – Share-Based Compensation of the Notes to Consolidated Financial Statements (Part II, Item 8 of this 20172023 Form 10-K) for further information.
Self-Insurance Liabilities — We are self-insured up to certain limits for workers’ compensation and general liabilities, which includes automobile, product general liability, and client property loss claims. We have also retained and provided for certain workers’ compensation insurance liabilities in conjunction with previously sold businesses. We are also self-insured for certain employee health benefits. Provisions for losses for claims incurred, including actuarially derived estimated claims incurred but not yet reported, are made based on historical experience, claims frequency, and other factors. We have purchased insurance for amounts in excess of the self-insured levels.
Impact of Recent Accounting Pronouncements
Refer to Note 1 – Overview and Summary of Significant Accounting Policies of the Notes to Consolidated Financial Statements (Part II, Item 8 of this 20172023 Form 10-K) for further information.
26
In addition to disclosing financial results that are determined in accordance with U.S. generally accepted accounting principles (“GAAP”),GAAP, we also disclose non-GAAP financial measures of Adjusted EBITDA, Segment operating income, organic revenue, and organic segment operating income (collectively, the “Non-GAAP Measures”). The presentation(loss) as a non-GAAP financial measure. Our use of the Non-GAAP Measuressegment operating income (loss) is supplemental to, but not as a substitute for, other measures of financial performance reported in accordance with GAAP. As not all companies use identical calculations, the Non-GAAP Measuressegment operating income (loss) may not be comparable to similarly titled measures used by other companies. We believe the presentationthat our use of the Non-GAAP Measuressegment operating income (loss) provides useful information to investors regarding our results of operations for trending, analyzing, and benchmarking theour performance and the value of our business.
“Adjusted EBITDA”Segment operating income (loss)” is net“net income (loss) attributable to Viad before our portion of interest expense, income taxes, depreciation and amortization, impairment charges and recoveries, changes in accounting principles, and the effects of discontinued operations. Adjusted EBITDA is used to measure the profit and performance of our operations and to facilitate period-to-period comparisons. Refer to the table below for a reconciliation of Adjusted EBITDA to the most directly comparable GAAP measure.
“Segment operating income” is net income attributable to ViadViad” before income (loss) from discontinued operations, corporate activities, net interest expense, and interest income, income taxes, gains or losses from sales of businesses, restructuring charges, impairment lossescharges, and recoveries,certain other corporate expenses and charges that are not allocated to the reportable segments, and the reduction for income (loss) attributable to noncontrolling interest.interests. Segment operating income (loss) is used to measure the profit and performance of our operating segments to facilitate period-to-period comparisons.
“Organic revenue” and “organic segment operating income” are revenue and Refer to Note 24 – Segment Information of the Notes to Consolidated Financial Statements (Part II, Item 8 of this 2023 Form 10-K) for a reconciliation of segment operating income (as defined above), respectively, without the impact of exchange rate variances and acquisitions, if any, until such acquisitions are included in the entirety of both comparable periods. The impact of exchange rate variances is calculated as the difference between current period activity translated at the current period’s exchange rates and the comparable prior period’s exchange rates. (loss) to income (loss) from continuing operations before income taxes.
We believe that the presentation of “organic” results permits investors to better understand our performance without the effects of exchange rate variances or acquisitions and to facilitate period-to-period comparisons and analysis of our operating performance. Refer to the “Results of Operations” section of this MD&A for reconciliations of organic revenue and organic segment operating income to the most directly comparable GAAP measures.
The Non-GAAP Measures are considered(loss) is a useful operating metricsmetric as it eliminates potential variations arising from taxes, depreciation and amortization, debt service costs, impairment charges, and recoveries, changes in accounting principles,restructuring charges, strategic dispositions, the reduction of income (loss) attributable to non-controlling interests, and the effects of discontinued operations, are eliminated, thus resulting in an additional measuresmeasure considered to be indicative of our ongoing operations and segment performance. Although the Non-GAAP Measures are used as financial measureswe use segment operating income (loss) to assess the performance of theour business, the use of these measuresthis measure is limited because these measures dothis measure does not consider material costs, expenses, and other items necessary to operate, or resulting from, our business. These items include debt service costs, non-cash depreciation and amortization expense associated with long-lived assets, expenses related to U.S. federal, state, local and foreignAs segment operating income taxes, impairment charges or recoveries, and the effects of accounting changes and discontinued operations. Since the Non-GAAP Measures do(loss) does not consider the abovethese items, a user of our financial information should consider net income (loss) attributable to Viad should be considered as an important measure of financial performance because it provides a more complete measure of our performance.
A reconciliation of net income attributable to Viad to Adjusted EBITDA is as follows:
|
| Year Ended December 31, |
| |||||||||
(in thousands) |
| 2017 |
|
| 2016 |
|
| 2015 |
| |||
Net income attributable to Viad |
| $ | 57,707 |
|
| $ | 42,269 |
|
| $ | 26,606 |
|
Depreciation and amortization |
|
| 55,114 |
|
|
| 42,743 |
|
|
| 35,231 |
|
Interest expense |
|
| 8,304 |
|
|
| 5,898 |
|
|
| 4,535 |
|
Income tax expense |
|
| 45,898 |
|
|
| 21,250 |
|
|
| 10,493 |
|
Impairment charges (recoveries) |
|
| (29,098 | ) |
|
| 218 |
|
|
| 96 |
|
Loss from discontinued operations |
|
| 268 |
|
|
| 684 |
|
|
| 394 |
|
Other noncontrolling interest |
|
| (643 | ) |
|
| (634 | ) |
|
| (554 | ) |
Adjusted EBITDA |
| $ | 137,550 |
|
| $ | 112,428 |
|
| $ | 76,801 |
|
The increase in Adjusted EBITDA during 2017 was primarily due to higher segment operating income at Pursuit and a decrease in restructuring charges. The increase in Adjusted EBITDA in 2016 was primarily due to higher segment operating income at GES and Pursuit. Refer to the “Results of Operations” section of this MD&A for a discussion of fluctuations.
Forward-Looking Non-GAAP Financial Measure
We also provide segment operating income as a forward-looking Non-GAAP Measure within the “Results of Operations” section of this MD&A. We do not provide a reconciliation of this forward-looking Non-GAAP Measure to the most directly comparable GAAP financial measure because, due to variability and difficulty in making accurate forecasts and projections and/or certain information not being ascertainable or accessible, not all of the information necessary for a quantitative reconciliation of this forward-looking Non-GAAP Measure to the most directly comparable GAAP financial measure is available without unreasonable efforts. Consequently, any attempt to disclose such reconciliation would imply a degree of precision that investors could find confusing or misleading. It is probable that this forward-looking Non-GAAP Measure may be materially different from the corresponding GAAP Measure.
Item 7A. Quantitative and Qualitative Disclosures About Market Risk
Our market risk exposure relates to fluctuations in foreign exchange rates and interest rates, and certain commodity prices.rates. Foreign exchange risk is the risk that fluctuating exchange rates will adversely affect our financial condition or results of operations. The foreign exchange risk is composed of both potential losses from the translation of foreign currency financial information and the remeasurement of foreign currency transactions. Interest rate risk is the risk that changing interest rates will adversely affect our earningsfinancial position or financial position. Commodity risk is the risk that changing prices will adversely affect our results of operations.
Our foreign operations are primarily in Canada, the United Kingdom, Iceland, the Netherlands, Germany,the Middle East, and to a lesser extent, in certain other countries.Germany. The functional currency of our foreign subsidiaries is their local currency. Accordingly, for purposes of consolidation, we translate the assets and liabilities of our foreign subsidiaries into U.S. dollars at the foreign exchange rates in effect at the balance sheet date. The unrealized gains or losses resulting from the translation of these foreign denominated assets and liabilities are included as a component of accumulated other comprehensive income (loss) in the Consolidated Balance Sheets. As a result, significant fluctuations in foreign exchange rates relative to the U.S. dollar may result in material changes to our net equity position reported in the Consolidated Balance Sheets. We do not currently hedge our equity risk arising from the translation of foreign denominated assets and liabilities. We recorded cumulative unrealized foreign currency translation losses in stockholders’ equity of $12.0$35.3 million as of December 31, 20172023 and $29.1$43.0 million as of December 31, 2016.2022. We recorded an unrealized foreign currency translation gainsgain in other comprehensive income (loss) of $17.1 million during of the year ended December 31, 2017 and foreign currency translation losses of $5.8$7.6 million during the year ended December 31, 2016.2023 and a loss of $26.8 million during the year ended December 31, 2022.
For purposes of consolidation, revenue, expenses, gains, and losses related to our foreign operations are translated into U.S. dollars at the average foreign exchange rates for the period. As a result, our consolidated results of operations are exposed to fluctuations in foreign exchange rates as revenue and segment operating resultsincome (loss) of our foreign operations, when translated, may vary from period to period, even when the functional currency amounts have not changed. Such fluctuations may adversely impact overall expected profitability and historical period-to-period comparisons. We do not currently hedge our net earnings exposure arising from the translation of our foreign revenue and segment operating results. Refer to “Management’s Discussion and Analysis of Financial Condition and Results of Operations” (Part II, Item 7 of this 2017 Form 10-K) for a discussion on the “Foreign Exchange Rate Variances”income (loss).
A hypothetical change of 10% in the Canadian dollar exchange rate would result in a change to 20172023 operating income of approximately $4.6$5.7 million. A hypothetical change of 10% in the British pound exchange rate would result in a change to 20172023 operating income of approximately $0.4$0.9 million. A hypothetical change of 10% in the Euro exchange rate would result in a change to 20172023 operating income of approximately $0.5$0.7 million. A hypothetical change of 10% in the Icelandic Krona exchange rate would result in a change to 2023 operating income of approximately $1.3 million.
We are exposed to foreign exchange transaction risk, as our foreign subsidiaries have certain revenue transactionsloans and leases denominated in currencies other than the functional currency of the respective subsidiary. From time to time, we utilize forward contracts to mitigate the impact on earnings related to these transactions due to fluctuations in foreign exchange rates. As of December 31, 20172023, we had long-term contractual liabilities that were denominated in nonfunctional currencies of $46.9 million. As foreign exchange rates fluctuate, these liabilities are remeasured, and 2016,the corresponding adjustment is recorded in the Consolidated Statements of Operations. A hypothetical change of 10% in foreign
27
currency rates could result in an adjustment to the Consolidated Statements of Operations of approximately $4.7 million. As of December 31, 2023 and 2022, we did not have any outstanding foreign currency forward contracts outstanding.contracts.
On January 4, 2023, we entered into an interest rate cap agreement with an effective date of January 31, 2023 to hedge cash flows on $300 million of our SOFR-based borrowings under the 2021 Credit Facility. Refer to Note 13 - Derivative of the Notes to Consolidated Financial Statements (Part II, Item 8 of this 2023 Form 10-K) for further information.
We are exposed to short-term and long-term interest rate risk on certain of our debt obligations. We do not currently use derivative financial instrumentsA hypothetical change of 10% in interest rates would result in a change to hedge cash flows for such obligations.2023 interest expense of approximately $5 million.
28
Item 8. Financial Statements and Supplementary Data
INDEX TO FINANCIAL STATEMENTS
Page | |
| |
| |
| |
Consolidated Statements of Stockholders’ Equity and Mezzanine Equity |
|
| |
| |
| |
|
29
|
| December 31, |
|
| December 31, |
| ||||||||||
(in thousands, except share data) |
| 2017 |
|
| 2016 |
|
| 2023 |
|
| 2022 |
| ||||
Assets |
|
|
|
|
|
|
|
|
|
|
|
|
| |||
Current assets |
|
|
|
|
|
|
|
|
|
|
|
|
|
| ||
Cash and cash equivalents |
| $ | 53,723 |
|
| $ | 20,900 |
|
| $ | 52,704 |
|
| $ | 59,719 |
|
Accounts receivable, net of allowances for doubtful accounts of $2,023 and $1,342, respectively |
|
| 104,811 |
|
|
| 104,648 |
| ||||||||
Accounts receivable, net of allowances of $2,901 and $2,174, |
|
| 128,019 |
|
|
| 122,373 |
| ||||||||
Inventories |
|
| 30,372 |
|
|
| 31,420 |
|
|
| 10,153 |
|
|
| 10,785 |
|
Current contract costs |
|
| 20,202 |
|
|
| 14,331 |
| ||||||||
Prepaid insurance |
|
| 2,925 |
|
|
| 13,370 |
| ||||||||
Other current assets |
|
| 21,030 |
|
|
| 18,449 |
|
|
| 21,774 |
|
|
| 18,977 |
|
Total current assets |
|
| 209,936 |
|
|
| 175,417 |
|
|
| 235,777 |
|
|
| 239,555 |
|
Property and equipment, net |
|
| 305,571 |
|
|
| 279,858 |
|
|
| 592,891 |
|
|
| 549,578 |
|
Other investments and assets |
|
| 47,512 |
|
|
| 44,297 |
|
|
| 17,047 |
|
|
| 17,457 |
|
Operating lease right-of-use assets |
|
| 109,774 |
|
|
| 102,777 |
| ||||||||
Deferred income taxes |
|
| 23,548 |
|
|
| 42,549 |
|
|
| 1,930 |
|
|
| 565 |
|
Goodwill |
|
| 270,551 |
|
|
| 254,022 |
|
|
| 123,906 |
|
|
| 121,429 |
|
Other intangible assets, net |
|
| 62,781 |
|
|
| 73,673 |
|
|
| 55,997 |
|
|
| 58,985 |
|
Total Assets |
| $ | 919,899 |
|
| $ | 869,816 |
|
| $ | 1,137,322 |
|
| $ | 1,090,346 |
|
Liabilities and Stockholders’ Equity |
|
|
|
|
|
|
|
| ||||||||
Liabilities, Mezzanine Equity, and Stockholders’ Equity |
|
|
|
|
| |||||||||||
Current liabilities |
|
|
|
|
|
|
|
|
|
|
|
|
|
| ||
Accounts payable |
| $ | 77,380 |
|
| $ | 67,596 |
|
| $ | 77,405 |
|
| $ | 73,020 |
|
Customer deposits |
|
| 33,415 |
|
|
| 42,723 |
| ||||||||
Contract liabilities |
|
| 52,980 |
|
|
| 43,950 |
| ||||||||
Accrued compensation |
|
| 30,614 |
|
|
| 29,913 |
|
|
| 31,309 |
|
|
| 25,839 |
|
Operating lease obligations |
|
| 17,334 |
|
|
| 13,463 |
| ||||||||
Other current liabilities |
|
| 38,720 |
|
|
| 30,390 |
|
|
| 42,397 |
|
|
| 41,653 |
|
Current portion of debt and capital lease obligations |
|
| 152,599 |
|
|
| 174,968 |
| ||||||||
Current portion of debt and finance obligations |
|
| 8,371 |
|
|
| 13,192 |
| ||||||||
Total current liabilities |
|
| 332,728 |
|
|
| 345,590 |
|
|
| 229,796 |
|
|
| 211,117 |
|
Long-term debt and capital lease obligations |
|
| 56,593 |
|
|
| 74,243 |
| ||||||||
Long-term debt and finance obligations |
|
| 444,304 |
|
|
| 456,752 |
| ||||||||
Pension and postretirement benefits |
|
| 28,135 |
|
|
| 28,611 |
|
|
| 16,457 |
|
|
| 16,769 |
|
Long-term operating lease obligations |
|
| 106,109 |
|
|
| 101,297 |
| ||||||||
Other deferred items and liabilities |
|
| 52,858 |
|
|
| 50,734 |
|
|
| 70,711 |
|
|
| 70,024 |
|
Total liabilities |
|
| 470,314 |
|
|
| 499,178 |
|
|
| 867,377 |
|
|
| 855,959 |
|
Commitments and contingencies |
|
|
|
|
|
|
|
|
|
|
|
|
|
| ||
Convertible Series A Preferred Stock, $0.01 par value, 180,000 shares authorized, |
|
| 132,591 |
|
|
| 132,591 |
| ||||||||
Redeemable noncontrolling interest |
|
| 6,648 |
|
|
| — |
|
|
| 4,733 |
|
|
| 4,956 |
|
Stockholders’ equity |
|
|
|
|
|
|
|
|
|
|
|
|
|
| ||
Viad Corp stockholders’ equity: |
|
|
|
|
|
|
|
|
|
|
|
|
|
| ||
Common stock, $1.50 par value, 200,000,000 shares authorized, 24,934,981 shares issued and outstanding |
|
| 37,402 |
|
|
| 37,402 |
| ||||||||
Common stock, $1.50 par value, 200,000,000 shares authorized, 24,934,981 shares |
|
| 37,402 |
|
|
| 37,402 |
| ||||||||
Additional capital |
|
| 574,458 |
|
|
| 573,841 |
|
|
| 568,230 |
|
|
| 570,271 |
|
Retained earnings |
|
| 65,836 |
|
|
| 16,291 |
| ||||||||
Unearned employee benefits and other |
|
| 218 |
|
|
| 172 |
| ||||||||
Accumulated deficit |
|
| (326,084 | ) |
|
| (334,301 | ) | ||||||||
Accumulated other comprehensive loss |
|
| (22,568 | ) |
|
| (39,391 | ) |
|
| (40,394 | ) |
|
| (47,185 | ) |
Common stock in treasury, at cost, 4,518,099 and 4,613,520 shares, respectively |
|
| (226,215 | ) |
|
| (230,960 | ) | ||||||||
Common stock in treasury, at cost, 3,948,316 and 4,216,044 shares, respectively |
|
| (195,721 | ) |
|
| (211,657 | ) | ||||||||
Total Viad stockholders’ equity |
|
| 429,131 |
|
|
| 357,355 |
|
|
| 43,433 |
|
|
| 14,530 |
|
Non-redeemable noncontrolling interest |
|
| 13,806 |
|
|
| 13,283 |
|
|
| 89,188 |
|
|
| 82,310 |
|
Total stockholders’ equity |
|
| 442,937 |
|
|
| 370,638 |
|
|
| 132,621 |
|
|
| 96,840 |
|
Total Liabilities and Stockholders’ Equity |
| $ | 919,899 |
|
| $ | 869,816 |
| ||||||||
Total Liabilities, Mezzanine Equity, and Stockholders’ Equity |
| $ | 1,137,322 |
|
| $ | 1,090,346 |
| ||||||||
Refer to Notes to Consolidated Financial Statements.
30
CONSOLIDATED STATEMENTS OF OPERATIONS
|
| Year Ended December 31, |
| |||||||||
(in thousands, except per share data) |
| 2017 |
|
| 2016 |
|
| 2015 |
| |||
Revenue: |
|
|
|
|
|
|
|
|
|
|
|
|
Exhibition and event services |
| $ | 967,352 |
|
| $ | 881,137 |
|
| $ | 799,752 |
|
Exhibits and environments |
|
| 165,745 |
|
|
| 170,469 |
|
|
| 177,126 |
|
Pursuit services |
|
| 173,868 |
|
|
| 153,364 |
|
|
| 112,170 |
|
Total revenue |
|
| 1,306,965 |
|
|
| 1,204,970 |
|
|
| 1,089,048 |
|
Costs and expenses: |
|
|
|
|
|
|
|
|
|
|
|
|
Costs of services |
|
| 1,050,547 |
|
|
| 954,667 |
|
|
| 868,369 |
|
Costs of products sold |
|
| 161,992 |
|
|
| 165,118 |
|
|
| 166,095 |
|
Business interruption gain |
|
| (2,692 | ) |
|
| — |
|
|
| — |
|
Corporate activities |
|
| 12,877 |
|
|
| 10,322 |
|
|
| 9,720 |
|
Interest income |
|
| (319 | ) |
|
| (1,165 | ) |
|
| (658 | ) |
Interest expense |
|
| 8,304 |
|
|
| 5,898 |
|
|
| 4,535 |
|
Restructuring charges |
|
| 1,004 |
|
|
| 5,183 |
|
|
| 2,956 |
|
Impairment charges (recoveries), net |
|
| (29,098 | ) |
|
| 218 |
|
|
| 96 |
|
Total costs and expenses |
|
| 1,202,615 |
|
|
| 1,140,241 |
|
|
| 1,051,113 |
|
Income from continuing operations before income taxes |
|
| 104,350 |
|
|
| 64,729 |
|
|
| 37,935 |
|
Income tax expense |
|
| 45,898 |
|
|
| 21,250 |
|
|
| 10,493 |
|
Income from continuing operations |
|
| 58,452 |
|
|
| 43,479 |
|
|
| 27,442 |
|
Loss from discontinued operations |
|
| (268 | ) |
|
| (684 | ) |
|
| (394 | ) |
Net income |
|
| 58,184 |
|
|
| 42,795 |
|
|
| 27,048 |
|
Net income attributable to non-redeemable noncontrolling interest |
|
| (523 | ) |
|
| (526 | ) |
|
| (442 | ) |
Net loss attributable to redeemable noncontrolling interest |
|
| 46 |
|
|
| — |
|
|
| — |
|
Net income attributable to Viad |
| $ | 57,707 |
|
| $ | 42,269 |
|
| $ | 26,606 |
|
Diluted income (loss) per common share: |
|
|
|
|
|
|
|
|
|
|
|
|
Continuing operations attributable to Viad common stockholders |
| $ | 2.84 |
|
| $ | 2.12 |
|
| $ | 1.34 |
|
Discontinued operations attributable to Viad common stockholders |
|
| (0.01 | ) |
|
| (0.03 | ) |
|
| (0.02 | ) |
Net income attributable to Viad common stockholders |
| $ | 2.83 |
|
| $ | 2.09 |
|
| $ | 1.32 |
|
Weighted-average outstanding and potentially dilutive common shares |
|
| 20,405 |
|
|
| 20,177 |
|
|
| 19,981 |
|
Basic income (loss) per common share: |
|
|
|
|
|
|
|
|
|
|
|
|
Continuing operations attributable to Viad common stockholders |
| $ | 2.84 |
|
| $ | 2.12 |
|
| $ | 1.34 |
|
Discontinued operations attributable to Viad common stockholders |
|
| (0.01 | ) |
|
| (0.03 | ) |
|
| (0.02 | ) |
Net income attributable to Viad common stockholders |
| $ | 2.83 |
|
| $ | 2.09 |
|
| $ | 1.32 |
|
Weighted-average outstanding common shares |
|
| 20,146 |
|
|
| 19,990 |
|
|
| 19,797 |
|
Dividends declared per common share |
| $ | 0.40 |
|
| $ | 0.40 |
|
| $ | 0.40 |
|
Amounts attributable to Viad common stockholders |
|
|
|
|
|
|
|
|
|
|
|
|
Income from continuing operations |
| $ | 57,975 |
|
| $ | 42,953 |
|
| $ | 27,000 |
|
Loss from discontinued operations |
|
| (268 | ) |
|
| (684 | ) |
|
| (394 | ) |
Net income |
| $ | 57,707 |
|
| $ | 42,269 |
|
| $ | 26,606 |
|
|
| Year Ended December 31, |
| |||||||||
(in thousands, except per share data) |
| 2023 |
|
| 2022 |
|
| 2021 |
| |||
Revenue: |
|
|
|
|
|
|
|
|
| |||
Services |
| $ | 1,006,226 |
|
| $ | 912,040 |
|
| $ | 401,142 |
|
Products |
|
| 232,454 |
|
|
| 215,271 |
|
|
| 106,198 |
|
Total revenue |
|
| 1,238,680 |
|
|
| 1,127,311 |
|
|
| 507,340 |
|
Costs and expenses: |
|
|
|
|
|
|
|
|
| |||
Costs of services |
|
| 919,966 |
|
|
| 857,760 |
|
|
| 440,383 |
|
Costs of products |
|
| 210,212 |
|
|
| 200,540 |
|
|
| 113,889 |
|
Corporate activities |
|
| 14,040 |
|
|
| 13,418 |
|
|
| 11,689 |
|
Gain on sale of ON Services |
|
| 204 |
|
|
| (19,637 | ) |
|
| — |
|
Interest expense, net |
|
| 47,978 |
|
|
| 34,891 |
|
|
| 28,324 |
|
Other expense, net |
|
| 2,033 |
|
|
| 2,077 |
|
|
| 2,070 |
|
Restructuring charges |
|
| 1,174 |
|
|
| 3,059 |
|
|
| 6,066 |
|
Impairment charges |
|
| — |
|
|
| 583 |
|
|
| — |
|
Total costs and expenses |
|
| 1,195,607 |
|
|
| 1,092,691 |
|
|
| 602,421 |
|
Income (loss) from continuing operations before income taxes |
|
| 43,073 |
|
|
| 34,620 |
|
|
| (95,081 | ) |
Income tax expense (benefit) |
|
| 18,799 |
|
|
| 9,973 |
|
|
| (1,788 | ) |
Income (loss) from continuing operations |
|
| 24,274 |
|
|
| 24,647 |
|
|
| (93,293 | ) |
Income (loss) from discontinued operations |
|
| (822 | ) |
|
| 148 |
|
|
| 558 |
|
Net income (loss) |
|
| 23,452 |
|
|
| 24,795 |
|
|
| (92,735 | ) |
Net income attributable to non-redeemable noncontrolling interest |
|
| (7,836 | ) |
|
| (2,323 | ) |
|
| (1,686 | ) |
Net loss attributable to redeemable noncontrolling interest |
|
| 401 |
|
|
| 748 |
|
|
| 1,766 |
|
Net income (loss) attributable to Viad |
| $ | 16,017 |
|
| $ | 23,220 |
|
| $ | (92,655 | ) |
Diluted income (loss) per common share: |
|
|
|
|
|
|
|
|
| |||
Continuing operations attributable to Viad common stockholders |
| $ | 0.34 |
|
| $ | 0.52 |
|
| $ | (5.04 | ) |
Discontinued operations attributable to Viad common stockholders |
|
| (0.04 | ) |
|
| 0.01 |
|
|
| 0.03 |
|
Net income (loss) attributable to Viad common stockholders |
| $ | 0.30 |
|
| $ | 0.53 |
|
| $ | (5.01 | ) |
Weighted-average outstanding and potentially dilutive common |
|
| 21,097 |
|
|
| 20,812 |
|
|
| 20,411 |
|
Basic income (loss) per common share: |
|
|
|
|
|
|
|
|
| |||
Continuing operations attributable to Viad common stockholders |
| $ | 0.34 |
|
| $ | 0.53 |
|
| $ | (5.04 | ) |
Discontinued operations attributable to Viad common stockholders |
|
| (0.04 | ) |
|
| 0.01 |
|
|
| 0.03 |
|
Net income (loss) attributable to Viad common stockholders |
| $ | 0.30 |
|
| $ | 0.54 |
|
| $ | (5.01 | ) |
Weighted-average outstanding common shares |
|
| 20,855 |
|
|
| 20,589 |
|
|
| 20,411 |
|
Amounts attributable to Viad |
|
|
|
|
|
|
|
|
| |||
Income (loss) from continuing operations |
| $ | 16,839 |
|
| $ | 23,072 |
|
| $ | (93,213 | ) |
Income (loss) from discontinued operations |
|
| (822 | ) |
|
| 148 |
|
|
| 558 |
|
Net income (loss) attributable to Viad |
| $ | 16,017 |
|
| $ | 23,220 |
|
| $ | (92,655 | ) |
Refer to Notes to Consolidated Financial Statements.
31
CONSOLIDATED STATEMENTS OF COMPREHENSIVE INCOME (LOSS)
|
| Year Ended December 31, |
|
| Year Ended December 31, |
| ||||||||||||||||||
(in thousands) |
| 2017 |
|
| 2016 |
|
| 2015 |
|
| 2023 |
|
| 2022 |
|
| 2021 |
| ||||||
Net income |
| $ | 58,184 |
|
| $ | 42,795 |
|
| $ | 27,048 |
| ||||||||||||
Net income (loss) |
| $ | 23,452 |
|
| $ | 24,795 |
|
| $ | (92,735 | ) | ||||||||||||
Other comprehensive income (loss): |
|
|
|
|
|
|
|
|
|
|
|
|
|
|
|
|
|
|
|
| ||||
Unrealized gains (losses) on investments, net of tax effects of $121, $47, and $(78) |
|
| 195 |
|
|
| 75 |
|
|
| (125 | ) | ||||||||||||
Unrealized foreign currency translation adjustments, net of tax |
|
| 17,058 |
|
|
| (5,827 | ) |
|
| (35,673 | ) | ||||||||||||
Change in net actuarial gain (loss), net of tax effects of $163, $617, and $653 |
|
| 344 |
|
|
| 894 |
|
|
| 2,556 |
| ||||||||||||
Change in prior service cost, net of tax effects of $(473), $(219), and $(210) |
|
| (774 | ) |
|
| (357 | ) |
|
| (345 | ) | ||||||||||||
Unrealized foreign currency translation adjustments |
|
| 7,643 |
|
|
| (26,821 | ) |
|
| 524 |
| ||||||||||||
Change in fair value of interest rate cap |
|
| (651 | ) |
|
| — |
|
|
| — |
| ||||||||||||
Change in net actuarial loss, net of tax effects of $21, $192, and $210 |
|
| (277 | ) |
|
| 6,967 |
|
|
| 2,712 |
| ||||||||||||
Change in prior service cost |
|
| 76 |
|
|
| 98 |
|
|
| (24 | ) | ||||||||||||
Comprehensive income (loss) |
|
| 75,007 |
|
|
| 37,580 |
|
|
| (6,539 | ) |
|
| 30,243 |
|
|
| 5,039 |
|
|
| (89,523 | ) |
Non-redeemable noncontrolling interest: |
|
|
|
|
|
|
|
| ||||||||||||||||
Comprehensive income attributable to non-redeemable noncontrolling interest |
|
| (523 | ) |
|
| (526 | ) |
|
| (442 | ) |
|
| (7,836 | ) |
|
| (2,323 | ) |
|
| (1,686 | ) |
Unrealized foreign currency translation adjustments |
|
| 1,768 |
|
|
| (4,999 | ) |
|
| 127 |
| ||||||||||||
Redeemable noncontrolling interest: |
|
|
|
|
|
|
|
| ||||||||||||||||
Comprehensive loss attributable to redeemable noncontrolling interest |
|
| 46 |
|
|
| — |
|
|
| — |
|
|
| 401 |
|
|
| 748 |
|
|
| 1,766 |
|
Comprehensive income (loss) attributable to Viad |
| $ | 74,530 |
|
| $ | 37,054 |
|
| $ | (6,981 | ) |
| $ | 24,576 |
|
| $ | (1,535 | ) |
| $ | (89,316 | ) |
Refer to Notes to Consolidated Financial Statements.
32
CONSOLIDATED STATEMENTS OF STOCKHOLDERS’ EQUITY AND MEZZANINE EQUITY
|
|
|
|
|
|
|
|
|
|
|
|
|
|
|
|
|
|
|
|
|
|
|
|
|
|
| Mezzanine Equity |
| |||||||||||||
(in thousands) |
| Common |
|
| Additional |
|
| Accumulated |
|
| Accumulated |
|
| Common |
|
| Total |
|
| Non-Redeemable |
|
| Total |
|
|
| Redeemable |
|
| Convertible |
| ||||||||||
Balance, December 31, 2020 |
| $ | 37,402 |
|
| $ | 568,100 |
|
| $ | (253,164 | ) |
| $ | (30,641 | ) |
| $ | (225,742 | ) |
| $ | 95,955 |
|
| $ | 78,144 |
|
| $ | 174,099 |
|
|
| $ | 5,225 |
|
| $ | 128,769 |
|
Net income (loss) |
|
| — |
|
|
| — |
|
|
| (92,655 | ) |
|
| — |
|
|
| — |
|
|
| (92,655 | ) |
|
| 1,686 |
|
|
| (90,969 | ) |
|
|
| (1,766 | ) |
|
| — |
|
Dividends on convertible preferred stock |
|
| — |
|
|
| (3,821 | ) |
|
| (3,900 | ) |
|
| — |
|
|
| — |
|
|
| (7,721 | ) |
|
| — |
|
|
| (7,721 | ) |
|
|
| — |
|
|
| 3,821 |
|
Capital contributions (distributions) from (to) noncontrolling interest |
|
| — |
|
|
| — |
|
|
| — |
|
|
| — |
|
|
| — |
|
|
| — |
|
|
| (1,160 | ) |
|
| (1,160 | ) |
|
|
| 341 |
|
|
| — |
|
Payment of payroll taxes on stock-based compensation through shares withheld |
|
| — |
|
|
| — |
|
|
| — |
|
|
| — |
|
|
| (652 | ) |
|
| (652 | ) |
|
| — |
|
|
| (652 | ) |
|
|
| — |
|
|
| — |
|
Employee benefit plans |
|
| — |
|
|
| (4,456 | ) |
|
| — |
|
|
| — |
|
|
| 5,682 |
|
|
| 1,226 |
|
|
| — |
|
|
| 1,226 |
|
|
|
| — |
|
|
| — |
|
Share-based compensation - equity awards |
|
| — |
|
|
| 7,562 |
|
|
| — |
|
|
| — |
|
|
| — |
|
|
| 7,562 |
|
|
| — |
|
|
| 7,562 |
|
|
|
| — |
|
|
| — |
|
Unrealized foreign currency translation adjustment |
|
| — |
|
|
| — |
|
|
| — |
|
|
| 524 |
|
|
| — |
|
|
| 524 |
|
|
| 127 |
|
|
| 651 |
|
|
|
| (153 | ) |
|
| — |
|
Amortization of net actuarial loss, net of tax |
|
| — |
|
|
| — |
|
|
| — |
|
|
| 2,712 |
|
|
| — |
|
|
| 2,712 |
|
|
| — |
|
|
| 2,712 |
|
|
|
|
|
|
|
| ||
Amortization of prior service cost, net of tax |
|
| — |
|
|
| — |
|
|
| — |
|
|
| (24 | ) |
|
| — |
|
|
| (24 | ) |
|
| — |
|
|
| (24 | ) |
|
|
| — |
|
|
| — |
|
Acquisitions |
|
| — |
|
|
| — |
|
|
| — |
|
|
| — |
|
|
| — |
|
|
| — |
|
|
| 6,759 |
|
|
| 6,759 |
|
|
|
| — |
|
|
| — |
|
Other, net |
|
| — |
|
|
| (644 | ) |
|
| (1 | ) |
|
| — |
|
|
| — |
|
|
| (645 | ) |
|
| — |
|
|
| (645 | ) |
|
|
| 1,797 |
|
|
| 1 |
|
Balance, December 31, 2021 |
| $ | 37,402 |
|
| $ | 566,741 |
|
| $ | (349,720 | ) |
| $ | (27,429 | ) |
| $ | (220,712 | ) |
| $ | 6,282 |
|
| $ | 85,556 |
|
| $ | 91,838 |
|
|
| $ | 5,444 |
|
| $ | 132,591 |
|
Net income (loss) |
|
| — |
|
|
| — |
|
|
| 23,220 |
|
|
| — |
|
|
| — |
|
|
| 23,220 |
|
|
| 2,323 |
|
|
| 25,543 |
|
|
|
| (748 | ) |
|
| — |
|
Dividends on convertible preferred stock |
|
| — |
|
|
| — |
|
|
| (7,801 | ) |
|
| — |
|
|
| — |
|
|
| (7,801 | ) |
|
| — |
|
|
| (7,801 | ) |
|
|
| — |
|
|
| — |
|
Capital distributions to noncontrolling interest |
|
| — |
|
|
| — |
|
|
| — |
|
|
| — |
|
|
| — |
|
|
| — |
|
|
| (570 | ) |
|
| (570 | ) |
|
|
| — |
|
|
| — |
|
Payment of payroll taxes on stock-based compensation through shares withheld |
|
| — |
|
|
| — |
|
|
| — |
|
|
| — |
|
|
| (355 | ) |
|
| (355 | ) |
|
| — |
|
|
| (355 | ) |
|
|
| — |
|
|
| — |
|
Employee benefit plans |
|
| — |
|
|
| (6,967 | ) |
|
| — |
|
|
| — |
|
|
| 9,411 |
|
|
| 2,444 |
|
|
| — |
|
|
| 2,444 |
|
|
|
| — |
|
|
| — |
|
Share-based compensation - equity awards |
|
| — |
|
|
| 10,544 |
|
|
| — |
|
|
| — |
|
|
| — |
|
|
| 10,544 |
|
|
| — |
|
|
| 10,544 |
|
|
|
| — |
|
|
| — |
|
Unrealized foreign currency translation adjustment |
|
| — |
|
|
| — |
|
|
| — |
|
|
| (26,821 | ) |
|
| — |
|
|
| (26,821 | ) |
|
| (4,999 | ) |
|
| (31,820 | ) |
|
|
| (503 | ) |
|
| — |
|
Amortization of net actuarial loss, net of tax |
|
| — |
|
|
| — |
|
|
| — |
|
|
| 6,967 |
|
|
| — |
|
|
| 6,967 |
|
|
| — |
|
|
| 6,967 |
|
|
|
| — |
|
|
| — |
|
Amortization of prior service cost, net of tax |
|
| — |
|
|
| — |
|
|
| — |
|
|
| 98 |
|
|
| — |
|
|
| 98 |
|
|
| — |
|
|
| 98 |
|
|
|
| — |
|
|
| — |
|
Other, net |
|
| — |
|
|
| (47 | ) |
|
| — |
|
|
| — |
|
|
| (1 | ) |
|
| (48 | ) |
|
| — |
|
|
| (48 | ) |
|
|
| 763 |
|
|
| — |
|
Balance, December 31, 2022 |
| $ | 37,402 |
|
| $ | 570,271 |
|
| $ | (334,301 | ) |
| $ | (47,185 | ) |
| $ | (211,657 | ) |
| $ | 14,530 |
|
| $ | 82,310 |
|
| $ | 96,840 |
|
|
| $ | 4,956 |
|
| $ | 132,591 |
|
Net income |
|
| — |
|
|
| — |
|
|
| 16,017 |
|
|
| — |
|
|
| — |
|
|
| 16,017 |
|
|
| 7,836 |
|
|
| 23,853 |
|
|
|
| (401 | ) |
|
| — |
|
Dividends on convertible preferred stock |
|
| — |
|
|
| — |
|
|
| (7,801 | ) |
|
| — |
|
|
| — |
|
|
| (7,801 | ) |
|
| — |
|
|
| (7,801 | ) |
|
|
| — |
|
|
| — |
|
Capital distributions to noncontrolling interest |
|
| — |
|
|
| — |
|
|
| — |
|
|
| — |
|
|
| — |
|
|
| — |
|
|
| (2,726 | ) |
|
| (2,726 | ) |
|
|
| — |
|
|
| — |
|
Change in fair value of interest rate cap |
|
| — |
|
|
| — |
|
|
| — |
|
|
| (651 | ) |
|
| — |
|
|
| (651 | ) |
|
| — |
|
|
| (651 | ) |
|
|
| — |
|
|
| — |
|
Payment of payroll taxes on stock-based compensation through shares withheld |
|
| — |
|
|
| — |
|
|
| — |
|
|
| — |
|
|
| (208 | ) |
|
| (208 | ) |
|
| — |
|
|
| (208 | ) |
|
|
| — |
|
|
| — |
|
Employee benefit plans |
|
| — |
|
|
| (13,465 | ) |
|
| — |
|
|
| — |
|
|
| 16,143 |
|
|
| 2,678 |
|
|
| — |
|
|
| 2,678 |
|
|
|
| — |
|
|
| — |
|
Share-based compensation - equity awards |
|
| — |
|
|
| 11,424 |
|
|
| — |
|
|
| — |
|
|
| — |
|
|
| 11,424 |
|
|
| — |
|
|
| 11,424 |
|
|
|
| — |
|
|
| — |
|
Unrealized foreign currency translation adjustment |
|
| — |
|
|
| — |
|
|
| — |
|
|
| 7,643 |
|
|
| — |
|
|
| 7,643 |
|
|
| 1,768 |
|
|
| 9,411 |
|
|
|
| 178 |
|
|
| — |
|
Amortization of net actuarial loss, net of tax |
|
| — |
|
|
| — |
|
|
| — |
|
|
| (277 | ) |
|
| — |
|
|
| (277 | ) |
|
| — |
|
|
| (277 | ) |
|
|
| — |
|
|
| — |
|
Amortization of prior service cost, net of tax |
|
| — |
|
|
| — |
|
|
| — |
|
|
| 76 |
|
|
| — |
|
|
| 76 |
|
|
| — |
|
|
| 76 |
|
|
|
| — |
|
|
| — |
|
Other, net |
|
| — |
|
|
| — |
|
|
| 1 |
|
|
| — |
|
|
| 1 |
|
|
| 2 |
|
|
| — |
|
|
| 2 |
|
|
|
| — |
|
|
| — |
|
Balance, December 31, 2023 |
| $ | 37,402 |
|
| $ | 568,230 |
|
| $ | (326,084 | ) |
| $ | (40,394 | ) |
| $ | (195,721 | ) |
| $ | 43,433 |
|
| $ | 89,188 |
|
| $ | 132,621 |
|
|
| $ | 4,733 |
|
| $ | 132,591 |
|
(in thousands) |
| Common Stock |
|
| Additional Capital |
|
| Retained Earnings (Deficit) |
|
| Unearned Employee Benefits and Other |
|
| Accumulated Other Comprehensive Income (Loss) |
|
| Common Stock in Treasury |
|
| Total Viad Equity |
|
| Non-Redeemable Non-Controlling Interest |
|
| Total Stockholders’ Equity |
| |||||||||
Balance, December 31, 2014 |
| $ | 37,402 |
|
| $ | 582,066 |
|
| $ | (36,427 | ) |
| $ | 23 |
|
| $ | (589 | ) |
| $ | (247,088 | ) |
| $ | 335,387 |
|
| $ | 12,315 |
|
| $ | 347,702 |
|
Net income |
|
| — |
|
|
| — |
|
|
| 26,606 |
|
|
| — |
|
|
| — |
|
|
| — |
|
|
| 26,606 |
|
|
| 442 |
|
|
| 27,048 |
|
Dividends on common stock ($0.40 per share) |
|
| — |
|
|
| — |
|
|
| (8,036 | ) |
|
| — |
|
|
| — |
|
|
| — |
|
|
| (8,036 | ) |
|
| — |
|
|
| (8,036 | ) |
Common stock purchased for treasury |
|
| — |
|
|
| — |
|
|
| — |
|
|
| — |
|
|
| — |
|
|
| (4,816 | ) |
|
| (4,816 | ) |
|
| — |
|
|
| (4,816 | ) |
Employee benefit plans |
|
| — |
|
|
| (7,957 | ) |
|
| — |
|
|
| — |
|
|
| — |
|
|
| 12,493 |
|
|
| 4,536 |
|
|
| — |
|
|
| 4,536 |
|
Share-based compensation—equity awards |
|
| — |
|
|
| 2,156 |
|
|
| — |
|
|
| — |
|
|
| — |
|
|
| — |
|
|
| 2,156 |
|
|
| — |
|
|
| 2,156 |
|
Tax expense from share-based compensation |
|
| — |
|
|
| 360 |
|
|
| — |
|
|
| — |
|
|
| — |
|
|
| — |
|
|
| 360 |
|
|
| — |
|
|
| 360 |
|
Unrealized foreign currency translation adjustment |
|
| — |
|
|
| — |
|
|
| — |
|
|
| — |
|
|
| (35,673 | ) |
|
| — |
|
|
| (35,673 | ) |
|
| — |
|
|
| (35,673 | ) |
Unrealized loss on investments |
|
| — |
|
|
| — |
|
|
| — |
|
|
| — |
|
|
| (125 | ) |
|
| — |
|
|
| (125 | ) |
|
| — |
|
|
| (125 | ) |
Amortization of net actuarial gain |
|
| — |
|
|
| — |
|
|
| — |
|
|
| — |
|
|
| 2,556 |
|
|
| — |
|
|
| 2,556 |
|
|
| — |
|
|
| 2,556 |
|
Amortization of prior service cost |
|
| — |
|
|
| — |
|
|
| — |
|
|
| — |
|
|
| (345 | ) |
|
| — |
|
|
| (345 | ) |
|
| — |
|
|
| (345 | ) |
Other, net |
|
| — |
|
|
| (102 | ) |
|
| (9 | ) |
|
| 86 |
|
|
| — |
|
|
| — |
|
|
| (25 | ) |
|
| — |
|
|
| (25 | ) |
Balance, December 31, 2015 |
|
| 37,402 |
|
|
| 576,523 |
|
|
| (17,866 | ) |
|
| 109 |
|
|
| (34,176 | ) |
|
| (239,411 | ) |
|
| 322,581 |
|
|
| 12,757 |
|
|
| 335,338 |
|
Net income |
|
| — |
|
|
| — |
|
|
| 42,269 |
|
|
| — |
|
|
| — |
|
|
| — |
|
|
| 42,269 |
|
|
| 526 |
|
|
| 42,795 |
|
Dividends on common stock ($0.40 per share) |
|
| — |
|
|
| — |
|
|
| (8,111 | ) |
|
| — |
|
|
| — |
|
|
| — |
|
|
| (8,111 | ) |
|
| — |
|
|
| (8,111 | ) |
Common stock purchased for treasury |
|
| — |
|
|
| — |
|
|
| — |
|
|
| — |
|
|
| — |
|
|
| (722 | ) |
|
| (722 | ) |
|
| — |
|
|
| (722 | ) |
Employee benefit plans |
|
| — |
|
|
| (5,251 | ) |
|
| — |
|
|
| — |
|
|
| — |
|
|
| 9,172 |
|
|
| 3,921 |
|
|
| — |
|
|
| 3,921 |
|
Share-based compensation—equity awards |
|
| — |
|
|
| 2,525 |
|
|
| — |
|
|
| — |
|
|
| — |
|
|
| — |
|
|
| 2,525 |
|
|
| — |
|
|
| 2,525 |
|
Tax expense from share-based compensation |
|
| — |
|
|
| 95 |
|
|
| — |
|
|
| — |
|
|
| — |
|
|
| — |
|
|
| 95 |
|
|
| — |
|
|
| 95 |
|
Unrealized foreign currency translation adjustment |
|
| — |
|
|
| — |
|
|
| — |
|
|
| — |
|
|
| (5,827 | ) |
|
| — |
|
|
| (5,827 | ) |
|
| — |
|
|
| (5,827 | ) |
Unrealized gain on investments |
|
| — |
|
|
| — |
|
|
| — |
|
|
| — |
|
|
| 75 |
|
|
| — |
|
|
| 75 |
|
|
| — |
|
|
| 75 |
|
Amortization of net actuarial gain |
|
| — |
|
|
| — |
|
|
| — |
|
|
| — |
|
|
| 894 |
|
|
| — |
|
|
| 894 |
|
|
| — |
|
|
| 894 |
|
Amortization of prior service cost |
|
| — |
|
|
| — |
|
|
| — |
|
|
| — |
|
|
| (357 | ) |
|
| — |
|
|
| (357 | ) |
|
| — |
|
|
| (357 | ) |
Other, net |
|
| — |
|
|
| (51 | ) |
|
| (1 | ) |
|
| 63 |
|
|
| — |
|
|
| 1 |
|
|
| 12 |
|
|
| — |
|
|
| 12 |
|
Balance, December 31, 2016 |
| $ | 37,402 |
|
| $ | 573,841 |
|
| $ | 16,291 |
|
| $ | 172 |
|
| $ | (39,391 | ) |
| $ | (230,960 | ) |
| $ | 357,355 |
|
| $ | 13,283 |
|
| $ | 370,638 |
|
Net income |
|
| — |
|
|
| — |
|
|
| 57,707 |
|
|
| — |
|
|
| — |
|
|
| — |
|
|
| 57,707 |
|
|
| 523 |
|
|
| 58,230 |
|
Dividends on common stock ($0.40 per share) |
|
| — |
|
|
| — |
|
|
| (8,160 | ) |
|
| — |
|
|
| — |
|
|
| — |
|
|
| (8,160 | ) |
|
| — |
|
|
| (8,160 | ) |
Common stock purchased for treasury |
|
| — |
|
|
| — |
|
|
| — |
|
|
| — |
|
|
| — |
|
|
| (2,119 | ) |
|
| (2,119 | ) |
|
| — |
|
|
| (2,119 | ) |
Employee benefit plans |
|
| — |
|
|
| (2,687 | ) |
|
| — |
|
|
| — |
|
|
| — |
|
|
| 6,864 |
|
|
| 4,177 |
|
|
| — |
|
|
| 4,177 |
|
Share-based compensation—equity awards |
|
| — |
|
|
| 3,623 |
|
|
| — |
|
|
| — |
|
|
| — |
|
|
| — |
|
|
| 3,623 |
|
|
| — |
|
|
| 3,623 |
|
Unrealized foreign currency translation adjustment |
|
| — |
|
|
| — |
|
|
| — |
|
|
| — |
|
|
| 17,058 |
|
|
| — |
|
|
| 17,058 |
|
|
| — |
|
|
| 17,058 |
|
Unrealized gain on investments |
|
| — |
|
|
| — |
|
|
| — |
|
|
| — |
|
|
| 195 |
|
|
| — |
|
|
| 195 |
|
|
| — |
|
|
| 195 |
|
Amortization of net actuarial loss |
|
| — |
|
|
| — |
|
|
| — |
|
|
| — |
|
|
| 344 |
|
|
| — |
|
|
| 344 |
|
|
| — |
|
|
| 344 |
|
Amortization of prior service cost |
|
| — |
|
|
| — |
|
|
| — |
|
|
| — |
|
|
| (774 | ) |
|
| — |
|
|
| (774 | ) |
|
| — |
|
|
| (774 | ) |
Other, net |
|
| — |
|
|
| (319 | ) |
|
| (2 | ) |
|
| 46 |
|
|
| — |
|
|
| — |
|
|
| (275 | ) |
|
| — |
|
|
| (275 | ) |
Balance, December 31, 2017 |
| $ | 37,402 |
|
| $ | 574,458 |
|
| $ | 65,836 |
|
| $ | 218 |
|
| $ | (22,568 | ) |
| $ | (226,215 | ) |
| $ | 429,131 |
|
| $ | 13,806 |
|
| $ | 442,937 |
|
Refer to Notes to Consolidated Financial Statements.
33
CONSOLIDATED STATEMENTS OF CASH FLOWS
|
|
|
|
|
|
|
| |||||
|
| Year Ended December 31, |
| |||||||||
(in thousands) |
| 2017 |
|
| 2016 |
|
| 2015 |
| |||
Cash flows from operating activities |
|
|
|
|
|
|
|
|
|
|
|
|
Net income |
| $ | 58,184 |
|
| $ | 42,795 |
|
| $ | 27,048 |
|
Adjustments to reconcile net income to net cash provided by operating activities: |
|
|
|
|
|
|
|
|
|
|
|
|
Depreciation and amortization |
|
| 55,114 |
|
|
| 42,743 |
|
|
| 35,231 |
|
Deferred income taxes |
|
| 26,049 |
|
|
| 7,672 |
|
|
| 469 |
|
Loss from discontinued operations |
|
| 268 |
|
|
| 684 |
|
|
| 394 |
|
Restructuring charges |
|
| 1,004 |
|
|
| 5,183 |
|
|
| 2,956 |
|
Impairment charges (recoveries) |
|
| (29,098 | ) |
|
| 218 |
|
|
| 96 |
|
(Gains) losses on dispositions of property and other assets |
|
| 1,420 |
|
|
| (54 | ) |
|
| (690 | ) |
Share-based compensation expense |
|
| 10,969 |
|
|
| 8,038 |
|
|
| 3,848 |
|
Excess tax benefit from share-based compensation arrangements |
|
| — |
|
|
| (95 | ) |
|
| (418 | ) |
Other non-cash items, net |
|
| 5,029 |
|
|
| 6,167 |
|
|
| 5,394 |
|
Change in operating assets and liabilities (excluding the impact of acquisitions): |
|
|
|
|
|
|
|
|
|
|
|
|
Receivables |
|
| (2,338 | ) |
|
| (9,358 | ) |
|
| (16,665 | ) |
Inventories |
|
| 2,505 |
|
|
| (2,646 | ) |
|
| 4,872 |
|
Accounts payable |
|
| 7,546 |
|
|
| 1,770 |
|
|
| (2,619 | ) |
Restructuring liabilities |
|
| (1,954 | ) |
|
| (3,866 | ) |
|
| (2,572 | ) |
Accrued compensation |
|
| (5,152 | ) |
|
| (353 | ) |
|
| 1,469 |
|
Customer deposits |
|
| (10,572 | ) |
|
| 8,429 |
|
|
| 408 |
|
Income taxes payable |
|
| 5,820 |
|
|
| (4,630 | ) |
|
| 67 |
|
Other assets and liabilities, net |
|
| (12,571 | ) | �� |
| (2,379 | ) |
|
| 989 |
|
Net cash provided by operating activities |
|
| 112,223 |
|
|
| 100,318 |
|
|
| 60,277 |
|
Cash flows from investing activities |
|
|
|
|
|
|
|
|
|
|
|
|
Capital expenditures |
|
| (56,621 | ) |
|
| (49,815 | ) |
|
| (29,839 | ) |
Proceeds from insurance |
|
| 31,570 |
|
|
| — |
|
|
| — |
|
Cash paid for acquired businesses, net |
|
| (1,501 | ) |
|
| (195,989 | ) |
|
| (430 | ) |
Proceeds from dispositions of property and other assets |
|
| 947 |
|
|
| 1,166 |
|
|
| 1,542 |
|
Net cash used in investing activities |
|
| (25,605 | ) |
|
| (244,638 | ) |
|
| (28,727 | ) |
Cash flows from financing activities |
|
|
|
|
|
|
|
|
|
|
|
|
Proceeds from borrowings |
|
| 90,004 |
|
|
| 229,701 |
|
|
| 50,000 |
|
Payments on debt and capital lease obligations |
|
| (135,801 | ) |
|
| (108,915 | ) |
|
| (62,969 | ) |
Dividends paid on common stock |
|
| (8,160 | ) |
|
| (8,111 | ) |
|
| (8,036 | ) |
Debt issuance costs |
|
| (5 | ) |
|
| (336 | ) |
|
| — |
|
Common stock purchased for treasury |
|
| (2,119 | ) |
|
| (722 | ) |
|
| (4,816 | ) |
Excess tax benefit from share-based compensation arrangements |
|
| — |
|
|
| 95 |
|
|
| 418 |
|
Acquisition of business - deferred consideration |
|
| — |
|
|
| (130 | ) |
|
| (896 | ) |
Proceeds from exercise of stock options |
|
| — |
|
|
| — |
|
|
| 1,041 |
|
Net cash provided by (used in) financing activities |
|
| (56,081 | ) |
|
| 111,582 |
|
|
| (25,258 | ) |
Effect of exchange rate changes on cash and cash equivalents |
|
| 2,286 |
|
|
| (2,893 | ) |
|
| (6,751 | ) |
Net change in cash and cash equivalents |
|
| 32,823 |
|
|
| (35,631 | ) |
|
| (459 | ) |
Cash and cash equivalents, beginning of year |
|
| 20,900 |
|
|
| 56,531 |
|
|
| 56,990 |
|
Cash and cash equivalents, end of period |
| $ | 53,723 |
|
| $ | 20,900 |
|
| $ | 56,531 |
|
|
|
|
|
|
|
| ||||||
|
| Year Ended December 31, |
| |||||||||
(in thousands) |
| 2023 |
|
| 2022 |
|
| 2021 |
| |||
Cash flows from operating activities |
|
|
|
|
|
|
|
|
| |||
Net income (loss) |
| $ | 23,452 |
|
| $ | 24,795 |
|
| $ | (92,735 | ) |
Adjustments to reconcile net income (loss) to net cash provided by (used in) operating activities: |
|
|
|
|
|
|
|
|
| |||
Depreciation and amortization |
|
| 51,043 |
|
|
| 52,483 |
|
|
| 53,750 |
|
Deferred income taxes |
|
| (1,609 | ) |
|
| 1,820 |
|
|
| 6,012 |
|
(Income) loss from discontinued operations |
|
| 822 |
|
|
| (148 | ) |
|
| (558 | ) |
Restructuring charges |
|
| 1,174 |
|
|
| 3,059 |
|
|
| 6,066 |
|
Impairment charges |
|
| — |
|
|
| 583 |
|
|
| — |
|
Gains on dispositions of property and other assets |
|
| (98 | ) |
|
| (272 | ) |
|
| (9,374 | ) |
Gain on sale of ON Services |
|
| 204 |
|
|
| (19,637 | ) |
|
| — |
|
Share-based compensation expense |
|
| 11,452 |
|
|
| 10,241 |
|
|
| 7,727 |
|
Multi-employer pension plan withdrawal |
|
| — |
|
|
| — |
|
|
| 57 |
|
Other non-cash items, net |
|
| 6,605 |
|
|
| 12,843 |
|
|
| 5,318 |
|
Change in operating assets and liabilities (excluding the impact of acquisitions and disposition): |
|
|
|
|
|
|
|
|
| |||
Receivables |
|
| (5,520 | ) |
|
| (39,402 | ) |
|
| (75,450 | ) |
Inventories |
|
| 781 |
|
|
| (2,587 | ) |
|
| 129 |
|
Current contract costs |
|
| (5,676 | ) |
|
| (4,651 | ) |
|
| (3,284 | ) |
Accounts payable |
|
| 556 |
|
|
| 7,756 |
|
|
| 46,694 |
|
Restructuring liabilities |
|
| (1,450 | ) |
|
| (2,735 | ) |
|
| (5,923 | ) |
Accrued compensation |
|
| 3,347 |
|
|
| 11,321 |
|
|
| 4,221 |
|
Contract liabilities |
|
| 8,406 |
|
|
| 5,607 |
|
|
| 20,881 |
|
Income taxes payable |
|
| 461 |
|
|
| 7,147 |
|
|
| 1,003 |
|
Other assets and liabilities, net |
|
| 10,728 |
|
|
| 5,208 |
|
|
| (2,386 | ) |
Net cash provided by (used in) operating activities |
|
| 104,678 |
|
|
| 73,431 |
|
|
| (37,852 | ) |
Cash flows from investing activities |
|
|
|
|
|
|
|
|
| |||
Capital expenditures |
|
| (76,089 | ) |
|
| (67,170 | ) |
|
| (57,936 | ) |
Cash paid for acquisitions, net |
|
| (41 | ) |
|
| (25,494 | ) |
|
| (8,227 | ) |
Proceeds from sale of ON Services |
|
| 1,168 |
|
|
| 28,926 |
|
|
| — |
|
Proceeds from dispositions of property and other assets |
|
| 107 |
|
|
| 470 |
|
|
| 14,360 |
|
Net cash used in investing activities |
|
| (74,855 | ) |
|
| (63,268 | ) |
|
| (51,803 | ) |
Cash flows from financing activities |
|
|
|
|
|
|
|
|
| |||
Proceeds from borrowings |
|
| 162,049 |
|
|
| 107,580 |
|
|
| 461,322 |
|
Payments on debt and finance obligations |
|
| (184,537 | ) |
|
| (103,491 | ) |
|
| (345,297 | ) |
Dividends paid on preferred stock |
|
| (7,801 | ) |
|
| (7,801 | ) |
|
| (3,900 | ) |
Distributions to noncontrolling interest, net of contributions from noncontrolling interest |
|
| (2,726 | ) |
|
| (570 | ) |
|
| (843 | ) |
Payments of debt issuance costs |
|
| (1,667 | ) |
|
| (418 | ) |
|
| (1,767 | ) |
Payment of payroll taxes on stock-based compensation through shares withheld or repurchased |
|
| (1,482 | ) |
|
| (1,428 | ) |
|
| (1,626 | ) |
Net cash (used in) provided by financing activities |
|
| (36,164 | ) |
|
| (6,128 | ) |
|
| 107,889 |
|
Effect of exchange rate changes on cash, cash equivalents, and restricted cash |
|
| 806 |
|
|
| (3,774 | ) |
|
| 4,098 |
|
Net change in cash, cash equivalents, and restricted cash |
|
| (5,535 | ) |
|
| 261 |
|
|
| 22,332 |
|
Cash, cash equivalents, and restricted cash, beginning of year |
|
| 64,564 |
|
|
| 64,303 |
|
|
| 41,971 |
|
Cash, cash equivalents, and restricted cash, end of year |
| $ | 59,029 |
|
| $ | 64,564 |
|
| $ | 64,303 |
|
Refer to Notes to Consolidated Financial Statements.
34
Note 1. Overview and Summary of Significant Accounting Policies
Basis of Presentation and Principles of Consolidation
The accompanying consolidated financial statements of Viad have beenwere prepared in accordance with accounting principles generally accepted in the United States of America (“GAAP”) and include the accounts of Viad and its subsidiaries. AllWe have eliminated all significant intercompany account balances and transactions have been eliminated in consolidation.
Nature of Business
We are an internationala leading provider of extraordinary experiences, including hospitality and leisure activities, experiential services company with operations principally in the United States, Canada, the United Kingdom, continental Europe, the United Arab Emirates,marketing, and Hong Kong. We are committed to providing unforgettable experiences to our clients and guests. live events.
We operate through three reportable business segments: Pursuit, Spiro, and GES U.S.,Exhibitions. Spiro and GES International, (collectively, “GES”), and Pursuit.
GES
GES is a global, full-service provider for live events that produces exhibitions, conferences, corporate events, and consumer events. GES offers a comprehensive range ofExhibitions are both live event servicesbusinesses and a full suite of audio-visual services from creative and technologyare referred to content and design, along with online tools powered by next generation technologies that help clients easily manage the complexities of their events.collectively as “GES.”
GES’ clients include event organizers and corporate brand marketers. Event organizers schedule and run the event from start to finish. Corporate brand marketers include exhibitors and domestic and international corporations that want to promote their brands, services and innovations, feature new products, and build business relationships. GES serves corporate brand marketers when they exhibit at shows and when GES is engaged to manage their global exhibit program or produce their proprietary corporate events.Pursuit
Pursuit
Pursuit is a collection of iconic naturalinspiring and cultural destinationunforgettable travel experiences that enjoy perennial demand.includes recreational attractions, hotels and lodges, food and beverage, retail, sightseeing, and ground transportation services. Pursuit is comprised of four lines of business: Hospitality, Attractions, Transportation, and Travel Planning. These four lines of business work together, driving economies of scope and meaningful scale in and around the iconic destinations of Banff, Jasper, and Waterton Lakes National Parks and Vancouver in Canada, and Glacier, Denali, and Kenai Fjords National Parks in the United States. Pursuit is comprised of Brewster Travel Canada, which is marketed ascomprises the Banff Jasper Collection;Collection, the Alaska Collection; Glacier Park, Inc., which is marketed asCollection, the Glacier Park Collection, FlyOver, and FlyOver.Sky Lagoon.
Spiro
Spiro is an experiential marketing agency that partners with leading brands around the world to manage and elevate their global experiential marketing activities.
GES Exhibitions
GES Exhibitions is a global exhibition services company that partners with leading exhibition and conference organizers as a full-service provider of strategic and logistics solutions to manage the complexity of their shows.
Significant Accounting Policies
Use of Estimates
The preparation of financial statements in conformity with United States GAAP requires management to make estimates and assumptions that affect the reported amounts of assets and liabilities at the date of the financial statements and the reported amounts of revenue and expenses during the reported period. Estimates and assumptions are used in accounting for, among other things, the fair value of our reporting units used to perform annualthings: impairment testing of recorded goodwill; allowancesgoodwill and intangible assets and long-lived assets; allowance for uncollectible accounts receivable; sales reserve allowances; provisions for income taxes, including uncertain tax positions; valuation allowances related to deferred tax assets; liabilities for losses related to self-insured liability claims; liabilities for losses related to environmental remediation obligations; sublease income associated with restructuring liabilities; assumptions used to measure pension and postretirement benefit costs and obligations; assumptionsshare-based compensation costs; the discount rates used to determine share-based compensation costs under the fair value method; assumptions inlease obligations; the redemption value of redeemable noncontrolling interests; and the allocation of purchase price of acquired businesses. These estimates and assumptions may change as a result of the impact of global economic conditions, global inflationary pressures, and volatility in foreign exchange rates. Actual results could differ from these and other estimates.
Cash, and Cash Equivalents, and Restricted Cash
Cash equivalents are highly-liquid investments with remaining maturities when purchased of three months or less.less. Cash and cash equivalents consist of cash and bank demand depositsdeposits. Restricted cash represents collateral required for surety bonds, bank guarantees, letters of credit, and money market mutual funds. Investmentscorporate credit cards.
Cash, cash equivalents, and restricted cash balances presented in money market mutual funds are classified as available-for-sale and carried at fair value.the Consolidated Statements of Cash Flows consist of the following:
|
| December 31, |
| |||||
(in thousands) |
| 2023 |
|
| 2022 |
| ||
Cash and cash equivalents |
| $ | 52,704 |
|
| $ | 59,719 |
|
Restricted cash included in other current assets |
|
| 6,325 |
|
|
| 4,845 |
|
Cash, cash equivalents, and restricted cash shown in the statement of cash flows |
| $ | 59,029 |
|
| $ | 64,564 |
|
VIAD CORP
NOTES TO CONSOLIDATED FINANCIAL STATEMENTS (CONTINUED)
Allowances for Doubtful Accounts
Allowances for doubtful accounts reflect the best estimate of probableexpected losses inherent in the accounts receivable balance. The allowances for doubtful accounts, including a sales allowance for discounts at the time of sale, are based upon an evaluation of the aging of receivables, historical trends, and the current economic environment.
Inventories
Inventories
Inventories,We state inventories, which consist primarily of exhibit design and construction materials and supplies, as well as deferred show costs, including labor, show purchases, and commissions used in providing convention show services, are statedretail inventory, at the lower of cost (first-in, first-out and specific identification methods) or net realizable value.
Property and Equipment
Property and equipment are stated at cost, net of accumulated depreciation. Property and equipment are depreciated using the straight-line method over the estimated useful lives of the assets: buildings, 15 to 40 years; equipment, 3 to 12 years; and leasehold improvements, over the shorter of the lease term or useful life. Property and equipment are tested for potential impairment whenever events or changes in circumstances indicate that the carrying amount of the long-lived asset may not be recoverable through undiscounted cash flows.
Leases
Capitalized Software
Certain internalWe recognize a right-of-use (“ROU”) asset and external costs incurred in developing or obtaining internal use software are capitalized. Capitalized costs principally relate to costs incurred to purchase software from third parties, external direct costs of materials and services, and certain payroll-related costs for employees directly associated with software projects once application development begins. Costs associated with preliminary project activities, training, and other post-implementation activities are expensed as incurred. Capitalized software costs are amortized using the straight-line method over the estimated useful lives of the software, ranging from three to ten years. These costs are included inlease liability on the Consolidated Balance Sheets underand classify leases as either finance or operating leases. The classification of the caption “Propertylease determines whether we recognize the lease expense on an effective interest method basis (finance lease) or on a straight-line basis (operating lease) over the lease term. In determining whether an agreement contains a lease, we consider if we have a right to control the use of the underlying asset during the lease term in exchange for an obligation to make lease payments arising from the lease. We recognize ROU assets and lease liabilities at commencement date, which is when the underlying asset is available for use to a lessee, based on the present value of lease payments over the lease term.
Our operating and finance leases are primarily facility, equipment, net.”and land leases. Our facility leases comprise mainly manufacturing facilities, sales and design facilities, offices, storage and/or warehouses, and truck marshaling yards for our GES business. These facility leases have lease terms ranging up to 34 years. Our equipment leases comprise mainly vehicles, hardware, and office equipment, each with various lease terms. Our land leases comprise mainly leases in Canada and Iceland on which our Pursuit hotels or attractions are located and have lease terms ranging up to 46 years.
GoodwillIf a lease contains a renewal option that is reasonably certain to be exercised, then the lease term includes the optional periods in measuring a ROU asset and lease liability. We evaluate the reasonably certain threshold at lease commencement, and it is typically met if we identify substantial economic incentives or termination penalties. We do not include variable leases and variable non-lease components in the calculation of the ROU asset and corresponding lease liability. For facility leases, variable lease costs include the costs of common area maintenance, taxes, and insurance for which we pay our lessors an estimate that is adjusted to actual expense on a quarterly or annual basis depending on the underlying contract terms. We expense these variable lease payments as incurred. Our lease agreements do not contain any significant residual value guarantees or restrictive covenants.
Substantially all of our lease agreements do not specify an implicit borrowing rate, and as such, we utilize an incremental borrowing rate based on lease term and country in order to calculate the present value of our future lease payments. The incremental borrowing rate represents a risk-adjusted rate on a collateralized basis and is the expected rate at which we would borrow funds to satisfy the scheduled lease liability payment streams commensurate with the lease term and the country.
We are also a lessor to third party tenants who either lease certain portions of facilities that we own or sublease certain portions of facilities that we lease. We record lease income from owned facilities as rental income and we record sublease income from leased facilities as an offset to lease expense in the Consolidated Statements of Operations. We classify all of our leases for which we are the lessor as operating leases.
Goodwill
Goodwill is tested for impairment at the reporting unit level on an annual basis as of October 31, and between annual tests if an event occurs or circumstances change that would more-likely-than-not reduce the fair value of a reporting unit below its carrying value. We use a discounted expected future cash flow methodology (income approach) in order to estimate the fair value of our reporting units for purposes of goodwill impairment testing. The estimates and assumptions regarding expected future cash flows, discount rates, and terminal values require considerable judgment and are based on market conditions, financial forecasts, industry trends, and historical experience. These estimates, however, have inherent uncertainties and different assumptions could lead to materially different results.
36
VIAD CORP
Cash Surrender Value of Life InsuranceNOTES TO CONSOLIDATED FINANCIAL STATEMENTS (CONTINUED)
We have Company-owned life insurance contracts which are intended to fund the cost of certain employee compensation and benefit programs. These contracts are carried at cash surrender value, net of outstanding policy loans. The cash surrender value represents the amount of cash we could receive if the policies were discontinued before maturity. The changes in the cash surrender value of the policies, net of insurance premiums, are included as a component of “Costs of Services” in the Consolidated Statements of Operations.
Self-Insurance Liabilities
We are self-insured up to certain limits for workers’ compensation and general liabilities, which includes automobile, product and general liability, and client property loss and medical claims. We have also retained and provided for certain liabilities related to workers’ compensation and general liability insurance claimsliabilities in conjunction with previously sold operations. We are also self-insured for certain employee health benefits. Provisions for losses for claims incurred, including actuarially derived estimated claims incurred but not yet reported, are made based on historical experience, claims frequency, insurance coverage, and other factors. We have purchased insurance for amounts in excess of the self-insured levels.
Environmental Remediation Liabilities
Environmental remediation liabilities represent the estimated cost of environmental remediation obligations primarily associated with previously sold operations. The amounts accrued primarily consist of the estimated direct incremental costs, on an undiscounted basis, for contractor and other services related to remedial actions and post-remediation site monitoring. Environmental remediation liabilities are recorded when the specific obligation is considered probable and the costs are reasonably estimable. Subsequent recoveries from third parties, if any, are recorded through discontinued operations when realized. Environmental insurance is maintained that provides coverage for new and undiscovered pre-existing conditions at both our continuing and discontinued operations.
Fair Value of Financial Instruments
The carrying value of cash and cash equivalents, receivables,accounts receivable, and accounts payable approximate fair value due to the short-term maturities of these instruments. Refer to Note 1112 – Debt and Capital LeaseFinance Obligations for the estimated fair value of debt obligations.
Convertible Preferred Stock
Non-redeemable We record shares of convertible preferred stock based on proceeds received net of costs on the date of issuance. Dividends paid-in-kind increase the redemption value of the preferred stock. Redeemable preferred stock (including preferred stock that features redemption rights that are either within the control of the holder or subject to redemption upon the occurrence of uncertain events not solely within our control) is classified as mezzanine equity and is reported between liabilities and stockholders’ equity in the Consolidated Balance Sheets.
Noncontrolling InterestInterests – Non-redeemable and Redeemable Noncontrolling Interest
Non-redeemable noncontrolling interest represents the portion of equity in a subsidiary that is not attributable, directly or indirectly, to us. Our non-redeemable noncontrolling interest relates to the equity ownership that we do not own in Glacier Park, Inc. of 20%. We report non-redeemable noncontrolling interest within stockholders’ equity in the Consolidated Balance Sheets. The amount of consolidated net income or loss attributable to Viad and the non-redeemable noncontrolling interest is presented in the Consolidated Statements of Operations.
NoncontrollingWe consider noncontrolling interests with redemption features that are not solely within our control are consideredto be redeemable noncontrolling interests. Our redeemable noncontrolling interest relates to our 56.4% equity ownership interest in Esja Attractions ehf. (“Esja”), which owns the FlyOver Iceland attraction. The Esja purchaseshareholders agreement contains a put option that gives the minority Esja shareholders the right to sell (or “put”) their Esja shares to us based on a calculated formula within a predefined term. This redeemable noncontrolling interest is considered temporarymezzanine equity and we report it between liabilities and stockholders’ equity in the Consolidated Balance Sheets. The amount of the net income or loss attributable to redeemable noncontrolling interests is recorded in the Consolidated Statements of Operations and the accretion of the redemption value is recorded as an adjustment to retained earningsaccumulated deficit and is included in our earningsincome (loss) per share. Refer to Note 2123 – Noncontrolling Interests – Redeemable Noncontrolling Interestand Non-redeemable for additional information.
Foreign Currency Translation
Our foreign operations are primarily in Canada, the United Kingdom, Iceland, the Netherlands, the Middle East, Germany, and to a lesser extent, in certain other countries. The functional currency of our foreign subsidiaries is their local currency. Accordingly, for purposes of consolidation, we translate the assets and liabilities of our foreign subsidiaries into U.S. dollars at the foreign exchange rates in effect at the balance sheet date. The unrealized gains or losses resulting from the translation of these foreign denominated assets and liabilities are included as a component of accumulated other comprehensive income (loss) (“AOCI”) in the Consolidated Balance Sheets. For purposes of consolidation, revenue, expenses, gains, and losses related to our foreign operations are translated into U.S. dollars at
37
VIAD CORP
NOTES TO CONSOLIDATED FINANCIAL STATEMENTS (CONTINUED)
the average foreign exchange rates for the period. We also have certain loans and leases in currencies other than the entity’s functional currency, which results in gains or losses as exchange rates fluctuate and are recorded in the Consolidated Statements of Operations.
Revenue Recognition
Revenue is recognizedmeasured based on a specified amount of consideration in a contract with a customer, net of commissions paid to customers and amounts collected on behalf of third parties. We recognize revenue when persuasive evidencea performance obligation is satisfied by transferring control of an arrangement exists, delivery has occurreda product or services have been rendered,delivering the sales price is fixed or determinable, and collectability is reasonably assured. GES derives revenue primarily by providing core services, event technology services, and audio-visual servicesservice to event organizers and exhibitors participating in live events. GES derives revenue from consumer events by charging visitors to view the touring exhibitions. Exhibition and event service’sa customer.
Pursuit’s service revenue is recognized when services are completed, net of commissions. Exhibitsderived through its admissions, accommodations, and environmentstransportation services. Product revenue is accounted for using the completed-contract method. Pursuit generates revenuederived through its hospitality, attractions, transportation,food and travel planning services. Pursuit’s revenuebeverage and retail sales. Revenue is recognized at the time services are performed.
Insurance Recoveries
Receipts from insurance up to the amountperformed or upon delivery of the product. Pursuit’s service revenue is recognized losses are considered recoveriesover time as the customer simultaneously receives and are accounted for when they are probableconsumes the benefits, and product revenue is recognized at a point in time.
GES’ service revenue is primarily derived through its comprehensive range of receipt. Anticipated proceeds in excessmarketing, event production, and other related services to event organizers and corporate brand marketers. GES’ service revenue is earned over time over the duration of the live event, which generally lasts one to three days. Revenue for goods and services provided for which we do not have control of the goods or services before that good or service is transferred to a customer is recorded on a net basis to reflect only the fees received for arranging these services. GES’ product revenue is derived from the build of exhibits, environments, and graphics and is recognized loss are consideredat a gain contingency. A contingency gain for anticipated insurance proceedspoint in excesstime upon delivery of losses already recognized is not recognized until all contingencies relating to the insurance claim have been resolved.product.
Insurance proceeds allocated to business interruption gains are reported as cash flows from operating activities, and proceeds allocated to impairment recoveries are reported as cash flows from investing activities. Insurance proceeds used for capitalizable costs are classified as cash flows from investing activities, and proceeds used for non-capitalizable costs are classified as operating activities.
On December 29, 2016, the Mount Royal Hotel was damaged by a fire and closed. During the fourth quarter of 2016, we recorded an asset impairment loss of $2.2 million and an offsetting impairment recovery (and related insurance receivable) as the losses related to the fire were covered by our property and business interruption insurance. During July 2017, we resolved our property and business interruption insurance claims for a total of $36.3 million. We allocated $2.2 million to an insurance receivable, $29.3 million was recorded as an impairment recovery (partially offset by impairment charges of $0.2 million) related to construction costs to re-open the hotel, $2.5 million was recorded as a business interruption gain for the recovery of lost profits, $1.3 million was recorded as contra-expense to offset non-capitalizable costs incurred, and the remaining $1.0 million was recorded as deferred revenue, which will be recognized over the periods when the business interruption losses are actually incurred.
Share-Based Compensation
Share-based compensation costs related to all share-based payment awards are recognized and measured using the fair value method of accounting. These awards generally include restricted stock liability-based awards, (including performance units and restricted stock units)units, performance-based restricted stock units (“PRSUs”), and stock options, and contain forfeiture and non-compete provisions.
The fair value of restricted stock awards is based on our closing stock price on the date of grant. We issue restricted stockshare-based payment awards from shares held in treasury. Future vesting of restricted stock is generally subject to continued employment. Holders of restricted stockshare-based awards have the right to receive dividends and vote the shares, but may not sell, assign, transfer, pledge, or otherwise encumber the stock, except to the extent restrictions have lapsed and in accordance with our stock trading policy.
RestrictedWe account for share-based awards that will be settled in shares of our common stock as equity-based awards. We measure share-based compensation expense of equity-based awards vest between three and five years fromat fair value on the grant date on a straight-line basis over the vesting period. The estimated number of grant.awards to be achieved related to a performance condition is updated each reporting period based on the number of units expected to vest. The fair value of share-based awards that contain a performance goal based on a market condition such as total shareholder return is estimated using a Monte Carlo simulation. Share-based compensation expense related to restricted stockequity-based awards is recognized using the straight-line methodratably over the requisite service period of approximatelyranging from one to three years. For
We account for share-based payment awards with a five-year vesting period, expense is recognized based on an accelerated multiple-award approach over a five-year period. For thesethat will be settled in cash as liability-based awards, 40% of the shares vest on the third anniversary of the grant and the remaining shares vest in 30% increments over the subsequent two anniversary dates.
Liability-based awards (including performance unitswhich include PRSUs and restricted stock units) are recordedunits. We measure share-based compensation expense of liability-based awards at estimated fair value at each reporting date until the date of settlement based on the number of units expected to vest and, where applicable, the level of achievement of predefined performance goals. TheseThe fair value of awards are remeasured on each balance sheet date based on our stock price, and thecontaining a performance goal with a market condition is determined using a Monte Carlo simulation model, until the time of settlement. A Monte Carlo simulation requires the use of a number of assumptions, including historical volatility and correlation of our stock price and the price of the common shares of a comparator group, a risk-free rate of return, and an expected term. To the extent earned, liability-based awards are settled in cash based on our stock price. Compensationmodel. Share-based compensation expense related to liability-based awards is recognized ratably over the requisite service period of approximately three years.
Equity-based awards (including performance units) are recorded at estimated fair value, based on the number of units expected to vest and the level of achievement of predefined performance goals, until the time of settlement. To the extent earned, equity-based awards are settled in our common stock. Compensation expense related to equity-based awards is recognized ratably over the requisite service period of approximately three years.
The fair value of stock option grants is estimated on the date of grant using the Black-Scholes stock option pricing model. Share-basedWe measure share-based compensation expense relatedfor performance-based options on a straight-line basis over the performance period and the underlying shares expected to stock option awards isbe settled are adjusted each reporting period based on estimated future achievement of the respective performance metrics. Service-based options are recognized using theon a straight-line methodbasis over the requisite service period of approximately five years. The exercise price of stock options is based on the market value of our common stock at the date of grant. We have not granted stock options since 2010.a graded-vesting schedule.
Common Stock in Treasury
Common stock purchased for treasury is recorded at historical cost. Subsequent share reissuances are primarily related to share-based compensation programs and recorded at weighted-average cost.
Income (Loss) Per Common Share
Diluted income (loss) per common share is calculated using the more dilutive of the two-class method or if-converted method. The two-class method uses net income (loss) available to common stockholders and assumes conversion of all potential shares other than the participating securities. The if-converted method uses net income (loss) available to common shareholders and assumes conversion of all potential shares including the participating securities. Dilutive potential common shares include outstanding stock options, unvested
38
VIAD CORP
NOTES TO CONSOLIDATED FINANCIAL STATEMENTS (CONTINUED)
restricted share units and convertible preferred stock. We apply the two-class method in calculating income (loss) per common share as unvested share-based payment awards that contain nonforfeitable rights to dividends and preferred stock are considered participating securities. Accordingly, such securities are included in the earnings allocation in calculating income (loss) per share. The adjustment to the carrying value of the redeemable noncontrolling interest is reflected in income (loss) per common share.
Government Assistance
We received government assistance of approximately $2.7 million in 2022, and $21.6 million in 2021. We did not receive any government assistance in 2023. Benefits received were primarily from the Canadian Emergency Wage Subsidy (“CEWS”) program, the United Kingdom’s COVID Job Retention Scheme (“CJRS”), and two Netherlands programs referred to as NOW and TVL.
The CEWS program was implemented by the Canadian government in response to the COVID-19 pandemic for businesses operating in Canada. Our Canadian subsidiaries within Pursuit and GES qualified for and applied for these CEWS cash benefits to partially offset the impacts of revenue reductions and on-going staffing costs. During 2022, GES received approximately $1.4 million in CEWS benefits. During 2021, Pursuit received approximately $11.6 million and GES received approximately $1.9 million. The CEWS benefits were recorded as a reduction to “Costs of services” in the Consolidated Statements of Operations.
The CJRS program was implemented by the United Kingdom government in response to the COVID-19 pandemic to allow employers to retain and continue to pay their furloughed employees. Furloughed employees were paid 80% of their salary up to a maximum of GBP 2,500 per month. During July 2021, employers were required to contribute 10% of the furloughed employees salary, which increased to 20% before the program closed on September 30, 2021. Payments were handled by Her Majesty's Revenue and Customs, or HMRC. GES received approximately $0.9 million in 2021, which was recorded as a reduction to “Costs of services” in the Consolidated Statements of Operations.
The NOW and TVL programs were implemented by the Dutch government in response to the COVID-19 pandemic. The NOW program was a temporary emergency bridging measure to reimburse up to 85% of employees’ salaries, and payments were handled by the Employee Insurance Agency, or UWV. The TVL program was a business support program focused on non-labor business expenses. The amounts claimed were based on lost income of more than 30%. Payments were handled by the Netherlands Enterprise Agency, or RVO. GES received approximately $0.6 million in 2022 and $3.0 million in 2021 for both NOW and TVL programs, which were recorded as a reduction to “Costs of services” in the Consolidated Statements of Operations.
The remaining benefits received were from various other programs totaling $0.7 million in 2022, and $4.2 million in 2021.
Impact of Recent Accounting Pronouncements
The following table provides a brief description of recent accounting pronouncements:
Standard | Description | Date of adoption | Effect on the financial statements | |||
Standards Not Yet Adopted | ||||||
Accounting Standards Update (“ASU”) 2023-07, Segment Reporting (Topic 280): Improvements to Reportable Segment Disclosures | Amendment expands annual and interim disclosure requirements for reportable segments, primarily through enhanced disclosures about significant segment expenses. | 1/1/2024 | This new guidance will expand our footnote disclosures within the scope of this new standard with no impacts to our consolidated financial statements. The required annual disclosures for interim periods is effective in the first quarter of 2025. | |||
ASU | Amendment expands the disclosure requirements for income taxes, specifically related to the rate reconciliation and income taxes paid. | 1/1/2025 | This new guidance will expand our footnote disclosures within the scope of this new standard with no impacts to our consolidated financial statements. | |||
39
VIAD CORP
NOTES TO CONSOLIDATED FINANCIAL STATEMENTS (CONTINUED)
Standard | Description | Date of adoption | Effect on the financial statements | |||
Standards Recently Adopted | ||||||
ASU 2021-08, Business Combinations (Topic 805): Accounting for Contract Assets and Contract Liabilities |
|
|
| |||
ASU 2022-04, Liabilities - Supplier Finance Programs (Subtopic 405-50): Disclosure of Supplier Finance Program Obligations | Amendment requires that a buyer in a supplier finance program disclose key terms about the | 1/1/2023 | We provide disclosure about supplier finance programs in Note 12 - Debt and Finance Obligations under the | |||
|
|
|
| |||
|
|
|
| |||
Note 2. Revenue and Related Contract Costs and Contract Liabilities Pursuit’s performance obligations are short-term in nature. They include the provision of a hotel room, an attraction admission, a chartered or ticketed bus or van ride, and/or the sale of food, beverage, or retail products. We recognize revenue when the service has been provided or the product has been delivered. When we extend credit, payment terms are generally within 30 days and contain no significant financing components. GES’ performance obligations consist of services or product(s) outlined in a contract. While we often sign multi-year contracts for recurring events, the obligations for each occurrence are well defined and conclude upon the occurrence of each event. The obligations are typically the provision of services and/or sale of a product in connection with a live event. Revenue for goods and services provided for which we do not have control of the goods or services before that good or service is transferred to a customer is recorded on a net basis to reflect only the fees received for arranging these services. We recognize revenue for services generally at the close of the live event. We recognize revenue for products either upon delivery to the customer’s location, upon delivery to an event that we are serving, or when we have the right to invoice. In circumstances where a customer cancels a contract, we generally have the right to bill the customer for costs incurred to date. Payment terms are generally within 30-60 days and contain no significant financing components. Contract Liabilities Pursuit and GES typically receive customer deposits prior to transferring the related product or service to the customer. We record these deposits as a contract liability, which are recognized as revenue upon satisfaction of the related contract performance obligation(s). GES also provides customer rebates and volume discounts to certain event organizers that we recognize as a reduction of revenue. We include customer deposits in “Contract liabilities” and “Other deferred items and liabilities” in the Consolidated Balance Sheets. Changes to contract liabilities are as follows:
40 |
|
|
| ||||||||||||||||||||||||||||||||||||||||||||||||||||||||||
| |||||||||||||||||||||||||||||||||||||||||||||||||||||||||||||
|
|
|
| ||||||||||||||||||||||||||||||||||||||||||||||||||||||||||
VIAD CORP
NOTES TO CONSOLIDATED FINANCIAL STATEMENTS (CONTINUED)
Contract Costs
GES capitalizes certain incremental costs incurred in obtaining and fulfilling contracts. Capitalized costs principally relate to direct costs of materials and services incurred in fulfilling services of future live events, and also include up-front incentives and commissions incurred upon contract signing. We expense costs associated with preliminary contract activities (i.e. proposal activities) as incurred. Capitalized contract costs are expensed upon the transfer of the related goods or services and are included in “Costs of services” or “Costs of products” as applicable. We include the deferred incremental costs of obtaining and fulfilling contracts in “Current contract costs” and “Other investments and assets” in the Consolidated Balance Sheets.
Changes to contract costs are as follows:
(in thousands) |
|
|
| |
Balance at December 31, 2021 |
| $ | 13,790 |
|
Additions |
|
| 62,038 |
|
Expenses |
|
| (58,561 | ) |
Foreign exchange translation adjustment |
|
| (699 | ) |
Balance at December 31, 2022 |
|
| 16,568 |
|
Additions |
|
| 72,990 |
|
Expenses |
|
| (67,866 | ) |
Foreign exchange translation adjustment |
|
| 282 |
|
Balance at December 31, 2023 |
| $ | 21,974 |
|
As of December 31, 2023, capitalized contract costs consisted of $2.2 million to obtain contracts and $19.8 million to fulfill contracts. We did not recognize an impairment loss with respect to capitalized contract costs during the years ended December 31, 2023 or 2022.
41
VIAD CORP
NOTES TO CONSOLIDATED FINANCIAL STATEMENTS (CONTINUED)
Disaggregation of Revenue
The following tables disaggregate Pursuit and GES revenue by major service and product lines, timing of revenue recognition, and markets served:
Pursuit
|
| Year Ended December 31, |
| |||||||||
(in thousands) |
| 2023 |
|
| 2022 |
|
| 2021 |
| |||
Services: |
|
|
|
|
|
|
|
|
| |||
Ticket revenue |
| $ | 143,362 |
|
| $ | 114,936 |
|
| $ | 61,166 |
|
Rooms revenue |
|
| 85,942 |
|
|
| 77,019 |
|
|
| 57,603 |
|
Transportation |
|
| 13,440 |
|
|
| 12,460 |
|
|
| 5,591 |
|
Other |
|
| 15,920 |
|
|
| 14,143 |
|
|
| 8,564 |
|
Total services revenue |
|
| 258,664 |
|
|
| 218,558 |
|
|
| 132,924 |
|
Products: |
|
|
|
|
|
|
|
|
| |||
Food and beverage |
|
| 55,044 |
|
|
| 47,275 |
|
|
| 28,953 |
|
Retail operations |
|
| 36,577 |
|
|
| 33,494 |
|
|
| 25,171 |
|
Total products revenue |
|
| 91,621 |
|
|
| 80,769 |
|
|
| 54,124 |
|
Total revenue |
| $ | 350,285 |
|
| $ | 299,327 |
|
| $ | 187,048 |
|
|
|
|
|
|
|
|
|
|
| |||
Timing of revenue recognition: |
|
|
|
|
|
|
|
|
| |||
Services transferred over time |
| $ | 258,664 |
|
| $ | 218,558 |
|
| $ | 132,924 |
|
Products transferred at a point in time |
|
| 91,621 |
|
|
| 80,769 |
|
|
| 54,124 |
|
Total revenue |
| $ | 350,285 |
|
| $ | 299,327 |
|
| $ | 187,048 |
|
|
|
|
|
|
|
|
|
|
| |||
Markets: |
|
|
|
|
|
|
|
|
| |||
Banff Jasper Collection |
| $ | 183,709 |
|
| $ | 152,863 |
|
| $ | 82,728 |
|
Alaska Collection |
|
| 40,014 |
|
|
| 39,434 |
|
|
| 37,344 |
|
Glacier Park Collection |
|
| 60,104 |
|
|
| 57,760 |
|
|
| 45,276 |
|
FlyOver |
|
| 29,626 |
|
|
| 24,445 |
|
|
| 10,693 |
|
Sky Lagoon |
|
| 36,832 |
|
|
| 24,825 |
|
|
| 11,007 |
|
Total revenue |
| $ | 350,285 |
|
| $ | 299,327 |
|
| $ | 187,048 |
|
42
VIAD CORP
NOTES TO CONSOLIDATED FINANCIAL STATEMENTS (CONTINUED)
GES
|
| Year Ended December 31, |
| |||||||||
(in thousands) |
| 2023 |
|
| 2022 |
|
| 2021 |
| |||
Service lines: |
|
|
|
|
|
|
|
|
| |||
Spiro |
| $ | 283,171 |
|
| $ | 277,641 |
|
| $ | 116,587 |
|
GES Exhibitions |
|
| 614,418 |
|
|
| 557,880 |
|
|
| 209,529 |
|
Intersegment eliminations |
|
| (9,194 | ) |
|
| (7,537 | ) |
|
| (5,824 | ) |
Total revenue |
| $ | 888,395 |
|
| $ | 827,984 |
|
| $ | 320,292 |
|
|
|
|
|
|
|
|
|
| ||||
Timing of revenue recognition: |
|
|
|
|
|
|
|
|
| |||
Services transferred over time |
| $ | 747,562 |
|
| $ | 693,482 |
|
| $ | 268,218 |
|
Products transferred over time(1) |
|
| 58,511 |
|
|
| 51,134 |
|
|
| 18,551 |
|
Products transferred at a point in time |
|
| 82,322 |
|
|
| 83,368 |
|
|
| 33,523 |
|
Total revenue |
| $ | 888,395 |
|
| $ | 827,984 |
|
| $ | 320,292 |
|
|
|
|
|
|
|
|
|
| ||||
Geographical markets: |
|
|
|
|
|
|
|
|
| |||
North America |
| $ | 687,324 |
|
| $ | 675,628 |
|
| $ | 243,983 |
|
EMEA |
|
| 235,211 |
|
|
| 176,086 |
|
|
| 82,242 |
|
Intersegment eliminations |
|
| (34,140 | ) |
|
| (23,730 | ) |
|
| (5,933 | ) |
Total revenue |
| $ | 888,395 |
|
| $ | 827,984 |
|
| $ | 320,292 |
|
Note 2. 3. Share-Based Compensation
The following table summarizes share-based compensation expense:
|
| Year Ended December 31, |
| |||||||||
(in thousands) |
| 2017 |
|
| 2016 |
|
| 2015 |
| |||
Performance unit incentive plan (“PUP”) |
| $ | 8,088 |
|
| $ | 5,703 |
|
| $ | 1,692 |
|
Restricted stock |
|
| 2,594 |
|
|
| 2,073 |
|
|
| 2,111 |
|
Restricted stock units |
|
| 287 |
|
|
| 262 |
|
|
| 45 |
|
Share-based compensation before income tax benefit |
|
| 10,969 |
|
|
| 8,038 |
|
|
| 3,848 |
|
Income tax benefit |
|
| (4,079 | ) |
|
| (2,988 | ) |
|
| (1,454 | ) |
Share-based compensation, net of income tax benefit |
| $ | 6,890 |
|
| $ | 5,050 |
|
| $ | 2,394 |
|
We recorded share-based compensation expense through restructuring expense of $0.1 million during 2017, $0.2 million in 2016, and $45,000 in 2015. The 2017 and 2016 amounts relate to PUP and restricted stock units. The 2015 amount related to restricted stock units. No share-based compensation costs were capitalized during 2017, 2016, or 2015.
The following table summarizes the activity of the outstanding share-based compensation awards:
|
| PUP Awards |
|
| Restricted Stock |
|
| Restricted Stock Units |
| |||||||||||||||
|
| Shares |
|
| Weighted-Average Grant Date Fair Value |
|
| Shares |
|
| Weighted-Average Grant Date Fair Value |
|
| Shares |
|
| Weighted-Average Grant Date Fair Value |
| ||||||
Balance at December 31, 2016 |
|
| 255,505 |
|
| $ | 26.11 |
|
|
| 267,051 |
|
| $ | 25.96 |
|
|
| 15,982 |
|
| $ | 25.58 |
|
Granted |
|
| 73,557 |
|
| $ | 47.44 |
|
|
| 67,029 |
|
| $ | 46.99 |
|
|
| 2,950 |
|
| $ | 47.45 |
|
Vested |
|
| (76,082 | ) |
| $ | 24.07 |
|
|
| (112,548 | ) |
| $ | 24.04 |
|
|
| (6,182 | ) |
| $ | 24.97 |
|
Forfeited |
|
| (13,642 | ) |
| $ | 34.99 |
|
|
| (14,633 | ) |
| $ | 35.31 |
|
|
| — |
|
| $ | — |
|
Balance at December 31, 2017 |
|
| 239,338 |
|
| $ | 32.80 |
|
|
| 206,899 |
|
| $ | 33.16 |
|
|
| 12,750 |
|
| $ | 30.94 |
|
Viad Corp Omnibus Incentive Plan
We grant share-based compensation awards to our officers, directors, and certain key employees pursuant to the 2017 Viad Corp Omnibus Incentive Plan, as amended (the “2017 Plan”). The 2017 Plan was approved by our stockholders and was effective May 18, 2017. The 2017 Plan replaced the 2007 Viad Corp Omnibus Stock Plan (the “2007 Plan”). No further awards may be made under the 2007 Plan, although awards previously granted under the 2007 Plan will remain outstanding in accordance with their respective terms. The 2017 Plan has a 10-year life term and provides for the following types of awards: (a) incentive and non-qualified stock options; (b) restricted stock awards and restricted stock units; (c) performance units or performance shares; (d) stock appreciation rights; (e) cash-based awards; and (f) certain other stock-based awards. In June 2017, we registered reserved 1,750,000 shares of common stock issuablefor issuance under the 2017 Plan. On May 24, 2022, we amended and restated the 2017 Plan, which among other things, increased the number of shares reserved for issuance under the 2017 Plan by 840,000 shares, bringing the total number of reserved shares to 2,590,000. As of December 31, 2017,2023, there were 1,744,546798,446 shares available for future grant under the 2017 Plan.
The following table summarizes share-based compensation expense:
|
| Year Ended December 31, |
| |||||||||
(in thousands) |
| 2023 |
|
| 2022 |
|
| 2021 |
| |||
Performance-based restricted stock units |
| $ | 3,282 |
|
| $ | 541 |
|
| $ | 549 |
|
Restricted stock awards and restricted stock units |
|
| 6,523 |
|
|
| 6,703 |
|
|
| 5,451 |
|
Stock options |
|
| 1,647 |
|
|
| 2,997 |
|
|
| 1,727 |
|
Share-based compensation expense before income tax |
|
| 11,452 |
|
|
| 10,241 |
|
|
| 7,727 |
|
Income tax benefit(1) |
|
| (151 | ) |
|
| (117 | ) |
|
| (82 | ) |
Share-based compensation expense, net of income tax |
| $ | 11,301 |
|
| $ | 10,124 |
|
| $ | 7,645 |
|
We recorded no share-based compensation expense through restructuring charges in 2023, 2022 or 2021. No share-based compensation costs were capitalized during 2023, 2022, or 2021.
PUP AwardsPerformance-based Restricted Stock Units
In February 2016,PRSUs are tied to our stock price and the PUP Plan was amendedexpected achievement of certain performance-based criteria. The vesting of PRSUs is based upon the achievement of the performance-based criteria over a three to providefour-year period. We account for PRSUs that PUP awards earned under the 2007 Plan maywill be payable in the form of cash orsettled in shares of our common stock (oras equity-based awards. We measure share-based compensation expense of equity-based awards at fair
43
VIAD CORP
NOTES TO CONSOLIDATED FINANCIAL STATEMENTS (CONTINUED)
value on the grant date on a combinationstraight-line basis over the vesting period. The estimated number of both). Previously, payouts could onlyunits to be madeachieved is updated each reporting period.
We account for PRSUs that will be settled in cash. The vestingcash as liability-based awards. We measure share-based compensation expense of shares is based upon achievementliability-based awards at fair value at each reporting date until the date of certain performance-based criteria. The performance period of the shares is three years.settlement. Forfeitures are recorded when they occur.
During the year ended December 31, 2017,2023, we granted $3.5 million PUP awardsPRSUs all of which $1.4 million are payable in shares. Liabilities related to PUP
In 2023, PRSUs granted in 2020 vested; however, as performance metrics were not achieved, no awards were $11.0 million as of December 31, 2017 and $7.6 million as of December 31, 2016.paid in cash or in shares. In March 2017, PUP awards2022, PRSUs granted in 20142019 vested and we distributed cash payouts of $3.7 million.paid $0.4 million in cash. No PRSUs were paid in shares in 2022. In March 2016, PUP awards2021, PRSUs granted in 2013 vested and we distributed2018 vested; however, as performance metrics were not achieved, no awards were paid in cash payouts of $0.2 million. In March 2015, PUP awards grantedor in 2012 vested and we distributed cash payouts of $2.4 million.shares.
Restricted Stock
The grant date fair value of vested restricted stock was $2.7 million in 2017, $2.0 million in 2016, and $2.2 million in 2015. As of December 31, 2017,2023, the unamortized cost of outstanding restricted stock awardsequity-based PRSUs was $2.5$5.0 million, which we expect to recognize over a weighted-average period of approximately 1.7 years. Liabilities related to liability-based PRSUs were zero as of December 31, 2023 and December 31, 2022.
The following table summarizes the activity of the outstanding PRSU awards:
|
| Equity-Based |
|
| Liability-Based |
| ||||||||||
|
| Shares |
|
| Weighted-Average |
|
| Shares |
|
| Weighted-Average |
| ||||
Balance at December 31, 2022 |
|
| 101,785 |
|
| $ | 31.28 |
|
|
| 40,075 |
|
| $ | 56.06 |
|
Granted(1) |
|
| 191,883 |
|
| $ | 36.48 |
|
|
| — |
|
| $ | — |
|
Vested |
|
| — |
|
| $ | — |
|
|
| (40,075 | ) |
| $ | 56.06 |
|
Forfeited(1) |
|
| (9,475 | ) |
| $ | 36.46 |
|
|
| — |
|
| $ | — |
|
Balance at December 31, 2023 |
|
| 284,193 |
|
| $ | 34.62 |
|
|
| — |
|
| $ | — |
|
Service-based Restricted Stock Awards and Restricted Stock Units
Restricted stock awards and restricted stock units are service-based awards. We account for restricted stock awards and restricted stock units that will be settled in shares of our common stock as equity-based awards. We measure share-based compensation expense of equity-based awards at fair value on the grant date on a straight-line basis over the vesting period.
We account for restricted stock units that will be settled in cash as liability-based awards. We measure share-based compensation expense of liability-based awards at fair value at each reporting date until the date of settlement. Forfeitures are recorded when they occur.
As of December 31, 2023, the unamortized cost of outstanding equity-based restricted stock awards and restricted stock units was $7.2 million, which we expect to recognize over a weighted-average period of approximately 1.2 years. We repurchased 41,532withheld 48,039 shares for $2.1$1.5 million in 2017 and 25,432during 2023, 43,887 shares for $0.7$1.4 million in 2016during 2022, and 37,686 shares for $1.6 million during 2021 related to tax withholding requirements on vested share-based awards. During 2015, we repurchased 141,462 shares on the open market for $3.8 million and 35,649 shares for $1.0 million related to tax withholding requirements on vested share-based awards.
Restricted Stock Units
Aggregate liabilities related to liability-based restricted stock units was $0.5were zero as of December 31, 2023 and $0.1 million as of December 31, 2017 and $0.4 million as of December 31, 2016.2022. In February 2017, portions of the 2012 and 20142023, 2,260 restricted stock units vested, and we distributed cash payouts of $0.3 million.paid $0.1 million in cash. In February 2016, portions of the 2011, 2012, and 20132022, 3,709 restricted stock units vested, and we distributed cash payouts of $0.2 million.paid $0.1 million in cash. In February 2015, portions of the 2010, 2011, and 20122021, 3,174 restricted stock units vested, and we distributed cash payoutspaid $0.1 million in cash.
44
VIAD CORP
NOTES TO CONSOLIDATED FINANCIAL STATEMENTS (CONTINUED)
The following table summarizes the activity of $0.3 million.the outstanding restricted stock awards and restricted stock units:
|
| Equity-Based |
|
| Equity-Based |
|
| Liability-Based |
| |||||||||||||||
|
| Shares |
|
| Weighted-Average |
|
| Shares |
|
| Weighted-Average |
|
| Shares |
|
| Weighted-Average |
| ||||||
Balance at December 31, 2022 |
|
| 23,292 |
|
| $ | 54.03 |
|
|
| 412,019 |
|
| $ | 33.43 |
|
|
| 2,260 |
|
| $ | 54.75 |
|
Granted |
|
| — |
|
| $ | — |
|
|
| 227,891 |
|
| $ | 28.96 |
|
|
| — |
|
| $ | — |
|
Vested |
|
| (23,011 | ) |
| $ | 54.20 |
|
|
| (160,578 | ) |
| $ | 33.49 |
|
|
| (2,260 | ) |
| $ | 54.75 |
|
Forfeited |
|
| (11 | ) |
| $ | 56.23 |
|
|
| (30,339 | ) |
| $ | 32.92 |
|
|
| — |
|
| $ | — |
|
Balance at December 31, 2023 |
|
| 270 |
|
| $ | 39.28 |
|
|
| 448,993 |
|
| $ | 31.18 |
|
|
| — |
|
| $ | — |
|
Stock Options
DuringWe grant non-qualified stock options that are performance-based, as well as non-qualified stock options that are service-based. The performance-based awards are recognized on a straight-line basis over the year ended December 31, 2017, there was norespective performance period, and the underlying shares expected to be settled are adjusted each reporting period based on estimated future achievement of the respective performance metrics. The service-based awards are recognized on a straight-line basis over the requisite service period on a graded-vesting schedule ranging from one to three years. We did not grant any stock option activity. As of both December 31, 2017 and 2016, there were 63,773options during 2023.
The following table summarizes stock options outstanding and exercisable with a weighted-averageas of December 31, 2023:
|
| Options Outstanding |
|
| Options Exercisable |
| ||||||||||||||
Range of exercise prices |
| Shares |
|
| Weighted-Average |
|
| Weighted-Average |
|
| Shares |
|
| Weighted-Average |
| |||||
$21.85 |
|
| 54,150 |
|
|
| 3.65 |
|
| $ | 21.85 |
|
|
| 54,150 |
|
| $ | 21.85 |
|
$33.96 |
|
| 233,970 |
|
|
| 5.15 |
|
| $ | 33.96 |
|
|
| 77,991 |
|
| $ | 33.96 |
|
$44.80 |
|
| 137,858 |
|
|
| 4.15 |
|
| $ | 44.80 |
|
|
| 91,906 |
|
| $ | 44.80 |
|
$21.85 - $44.80 |
|
| 425,978 |
|
|
| 4.64 |
|
| $ | 35.93 |
|
|
| 224,047 |
|
| $ | 35.48 |
|
The aggregate intrinsic value of stock options outstanding at December 31, 2023 was $1.3 million, which represents the difference between our closing stock price at the end of the reporting period and the exercise price, multiplied by the number of $16.62 and a weighted-average remaining contractual lifein-the-money stock options. The aggregate intrinsic value of 2 years. options exercisable at December 31, 2023 was $1.0 million
As of December 31, 2017, there were no2023 and 2022, the total unrecognized costscompensation cost related to non-vested stock option awards.awards was $0.6 million and $2.3 million, respectively. We expect to recognize such costs over a weighted-average period of approximately 0.5 years.
Note 4. Acquisitions and Disposition
The following table provides additional stock option information:
|
| December 31, |
| |||||||||
(in thousands) |
| 2017 |
|
| 2016 |
|
| 2015 |
| |||
Total intrinsic value of stock options outstanding(1) |
| $ | 2,473 |
|
| $ | 1,753 |
|
| $ | 740 |
|
Total intrinsic value of stock options exercised |
| $ | — |
|
| $ | — |
|
| $ | 1,474 |
|
Cash received from the exercise of stock options |
| $ | — |
|
| $ | — |
|
| $ | 898 |
|
Tax benefits realized for tax deductions related to stock option exercises |
| $ | — |
|
| $ | — |
|
| $ | 104 |
|
|
|
Note 3. 2022 Acquisition of Businesses
2017 AcquisitionsGlacier Raft Company
Poken
In March 2017, we acquired Poken event engagement technology for total cash consideration of $1.7 million. Transaction costs associated with the acquisition of Poken were $0.3 million in 2017, which are included in cost of services in the Consolidated Statements of Operations. These assets have been included in the consolidated financial statements from the date of acquisition.
Esja
On November 3, 2017,April 6, 2022, we acquired the controlling interest (54.5% of the common stock) in Esja, a private corporation in Reykjavik, Iceland. Esja is developing and will operate a new FlyOver Iceland attraction, which is expected to open in 2019. The purchase price was €8.2 million (approximately $9.5 million) in cash, which included a put option that gives the minority Esja shareholders the right to sell (or “put”) their Esja shares to us based on a calculated formula within a predefined term. The noncontrolling interest’s carrying value is determined by the fair value of the noncontrolling interest as of the acquisition date, the noncontrolling interests’ share of the subsequent net income or loss, and the accretion of the redemption value of the put option. As of the transaction date, the fair value of the noncontrolling interest was estimated to be $6.7 million. Due to the recent timing of the acquisition, the fair value of the noncontrolling interest is not yet finalized and is subject to change within the measurement period (up to one year from the acquisition date). Refer to Note 21 – Redeemable Noncontrolling Interest for additional information.
Under the acquisition method of accounting, the purchase price is allocated to the assets acquired and liabilities assumed based on their estimated fair values. The excess purchase price over fair value of net assets acquired is recorded as goodwill. Goodwill is included in the Pursuit business group and the primary factor that contributed to the purchase price resulting in the recognition of goodwill relates to future income from operations after opening in 2019. Transaction costs associated with the acquisition of Esja were $0.1 million in 2017, which are included in cost of services in the Consolidated Statements of Operations.
The results of operations of Esja have been included in the consolidated financial statements from the date of acquisition. During 2017, Esja had an operating loss of $0.1 million.
2016 Acquisitions
Maligne Lake Tours
On January 4, 2016, we acquired the assets and operations of Maligne Tours Ltd. (“Maligne Lake Tours”),Glacier Raft Company, which provides interpretive boat toursguided river rafting trips operating in Pursuit’s West Glacier, Montana operations. The Glacier Raft Company also owns 13 log cabins, a lodge, and related services at Maligne Lake, the largest lake in Jaspera wedding venue located on 50 acres with views into Glacier National Park. The purchase price was $20.9 million Canadian dollars (approximately $15.0 million U.S. dollars) in cash.
Transaction costs associated with the Maligne Lake Tours acquisition were $0.1$26.5 million in 2017cash. This acquisition was funded via cash on hand of approximately $11.5 million and $0.1 million in 2016, which are included in costborrowings under our revolving credit facility of services in the Consolidated Statements of Operations and $0.2 million in 2015, which are included in corporate activities in the Consolidated Statements of Operations. The results of operations of Maligne Lake Tours have been included in the consolidated financial statements from the date of acquisition.
CATC
On March 11, 2016, we acquired 100% of the equity interests in CATC Alaska Tourism Corporation (“CATC”), the operator of an Alaskan tourism business that includes a marine sightseeing tour business, three lodges, and a package tour business. The purchase price was $45.0 million in cash.
Transaction costs associated with the CATC acquisition were $0.1 million in 2017, $0.1 million in 2016, and $0.6 million in 2015, which are included in corporate activities in the Consolidated Statements of Operations. The results of operations of CATC have been included in the consolidated financial statements from the date of acquisition.$15.0 million.
On August 11, 2016, we acquired the assets and operations of ON Event Services, LLC (“ON Services”), a leading provider of audio-visual production services for live events in the United States. The aggregate purchase price was up to $92.5 million in cash, which included an earnout payment (the “Earnout”) of up to $5.5 million. The fair value of the Earnout was valued on the date of acquisition and was remeasured based on the financial performance of ON Services for 2016. As of the transaction date, the fair value of the Earnout was estimated to be $540,000.
Transaction costs associated with the ON Services acquisition were $0.1 million in 2017 and $0.9 million in 2016, which are included in corporate activities in the Consolidated Statement of Operations. The results of operations of ON Services have been included in the consolidated financial statements from the date of acquisition.
FlyOver Canada
On December 29, 2016, we acquired the assets and operations of FlyOver Canada, a recreational attraction that provides a virtual flight ride experience with a combination of motion seating, spectacular media, and visual effects including wind, scents, and mist. The purchase price was $68.8 million Canadian dollars (approximately $50.9 million U.S. dollars) in cash.
Transaction costs associated with the FlyOver Canada acquisition were $0.1 million in 2017 and $0.5 million in 2016, which are included in cost of services in the Consolidated Statements of Operations. The results of operations of FlyOver Canada have been included in the consolidated financial statements from the date of acquisition.
The following table summarizes the final allocation of the aggregate purchase price paid and amounts of assets acquired and liabilities assumed based upon the estimated fair value at the date of acquisitions. The balancesacquisition. During the first quarter of 2023, we made a purchase accounting measurement period adjustment of $41,000 to working capital based on refinements to assumptions used in the table below remain unchanged from the balances reflected in the Consolidated Balance Sheets in our Annual Report on Form 10-K for the year ended December 31, 2016.preliminary valuation.
45
VIAD CORP
NOTES TO CONSOLIDATED FINANCIAL STATEMENTS (CONTINUED)
|
| Maligne Lake Tours |
|
| CATC |
|
| ON Services |
|
| FlyOver Canada |
| ||||||||
(in thousands) |
|
|
|
|
|
|
|
|
|
|
|
|
|
|
|
|
|
|
| |
Purchase price paid as: |
|
|
|
|
|
|
|
|
|
|
|
|
|
|
|
|
|
|
| |
Cash |
| $ | 14,962 |
|
| $ | 45,000 |
|
| $ | 87,000 |
|
| $ | 50,920 |
|
| $ | 26,507 |
|
Working capital adjustment |
|
| — |
|
|
| (35 | ) |
|
| 344 |
|
|
| — |
|
|
| (920 | ) |
Contingent consideration |
|
| — |
|
|
| — |
|
|
| 540 |
|
|
| — |
| ||||
Purchase price adjustment |
|
| 125 |
| ||||||||||||||||
Cash acquired |
|
| — |
|
|
| (2,196 | ) |
|
| — |
|
|
| (6 | ) |
|
| (177 | ) |
Total purchase price, net of cash acquired |
|
| 14,962 |
|
|
| 42,769 |
|
|
| 87,884 |
|
|
| 50,914 |
| ||||
Purchase price, net of cash acquired |
|
| 25,535 |
| ||||||||||||||||
|
|
|
|
|
|
|
|
|
|
|
|
|
|
|
|
|
|
|
| |
Fair value of net assets acquired: |
|
|
|
|
|
|
|
|
|
|
|
|
|
|
|
|
|
|
| |
Accounts receivable |
|
| — |
|
|
| 8 |
|
|
| 4,643 |
|
|
| — |
| ||||
Inventories |
|
| 246 |
|
|
| 921 |
|
|
| 256 |
|
|
| 11 |
| ||||
Prepaid expenses |
|
| 2 |
|
|
| 82 |
|
|
| 872 |
|
|
| 37 |
| ||||
Inventory |
|
| 370 |
| ||||||||||||||||
Prepaid expenses and other |
|
| 57 |
| ||||||||||||||||
Property and equipment |
|
| 4,133 |
|
|
| 43,470 |
|
|
| 14,827 |
|
|
| 10,867 |
|
|
| 6,487 |
|
Intangible assets |
|
| 9,244 |
|
|
| 980 |
|
|
| 33,990 |
|
|
| 6,028 |
|
|
| 3,400 |
|
Total assets acquired |
|
| 13,625 |
|
|
| 45,461 |
|
|
| 54,588 |
|
|
| 16,943 |
|
|
| 10,314 |
|
Accounts payable |
|
| — |
|
|
| 306 |
|
|
| 992 |
|
|
| — |
| ||||
Accrued liabilities |
|
| — |
|
|
| 434 |
|
|
| 564 |
|
|
| 118 |
| ||||
Customer deposits |
|
| 15 |
|
|
| 1,952 |
|
|
| 851 |
|
|
| — |
|
|
| 1,575 |
|
Other liabilities |
|
| 240 |
|
|
| — |
|
|
| 274 |
|
|
| — |
| ||||
Total liabilities acquired |
|
| 255 |
|
|
| 2,692 |
|
|
| 2,681 |
|
|
| 118 |
| ||||
Other current liabilities |
|
| 32 |
| ||||||||||||||||
Total liabilities assumed |
|
| 1,607 |
| ||||||||||||||||
Total fair value of net assets acquired |
|
| 13,370 |
|
|
| 42,769 |
|
|
| 51,907 |
|
|
| 16,825 |
|
|
| 8,707 |
|
Excess purchase price over fair value of net assets acquired (“goodwill”) |
| $ | 1,592 |
|
| $ | — |
|
| $ | 35,977 |
|
| $ | 34,089 |
|
| $ | 16,828 |
|
Under the acquisition method of accounting, the purchase pricesprice as shown in the table above areis allocated to the tangible and identifiable intangible assets acquired and liabilities assumed based on their estimated fair values. The excess purchase price over the fair value of net assets acquired iswas recorded as goodwill.“Goodwill.” Goodwill relating to the Glacier Raft Company acquisition is included in the Pursuit business group for Maligne Lake Tours and FlyOver Canada and in the GES business group for ON Services.reportable segment. The primary factor that contributed to the purchase price resulting in the recognition of goodwill relatesrelated to future growth opportunities and the expansion of the FlyOver concept for FlyOver Canada, when combined with our other businesses. All goodwillGoodwill is deductible for tax purposes
pursuant to Canadian tax regulations for Maligne Lake Tours and FlyOver Canada and over a period of 15 years for ON Services. The estimated values of currentpurposes. We included these assets and liabilities were based upon their historical costs onin the Consolidated Balance Sheets from the date of acquisition due to their short-term nature.acquisition.
Following are the details of the purchase price allocated to the intangible assets acquired for the 2016 Acquisitions:Glacier Raft Company:
(in thousands, except weighted average life) |
| Maligne Lake Tours |
|
| CATC |
|
| ON Services |
|
| FlyOver Canada |
| ||||
Customer relationships |
| $ | 788 |
|
| $ | 780 |
|
| $ | 27,620 |
|
| $ | 1,592 |
|
Operating licenses |
|
| 8,313 |
|
|
| — |
|
|
| — |
|
|
| — |
|
Trade name |
|
| 143 |
|
|
| 200 |
|
|
| 3,190 |
|
|
| 3,710 |
|
Non-compete agreements |
|
| — |
|
|
| — |
|
|
| 3,180 |
|
|
| 726 |
|
Fair value of intangible assets acquired |
| $ | 9,244 |
|
| $ | 980 |
|
| $ | 33,990 |
|
| $ | 6,028 |
|
Weighted average life |
| 26.7 years(1) |
|
| 5.8 years |
|
| 10.5 years |
|
| 9.4 years |
| ||||
|
|
(in thousands) |
| Amount |
|
| Weighted Average Life | |
Customer relationships |
| $ | 1,800 |
|
| 12 years |
Operating licenses |
|
| 1,300 |
|
| 17 years |
Trade name |
|
| 300 |
|
| 8 years |
Total |
| $ | 3,400 |
|
| 14 years |
Supplementary pro forma financial information
Transaction costs associated with the acquisition were $0.2 million in 2022, which are included in “Costs of services” in the Consolidated Statements of Operations. The following table summarizes our unaudited pro forma results of operations assumingof Glacier Raft Company have been included in the 2016 Acquisitions had each been completedconsolidated financial statements from the date of acquisition. Pro forma information is not presented as revenue and the operating results of Glacier Raft Company, as if the acquisition occurred on January 1, 2015:2022, is not material to our consolidated financial statements for the year ended December 31, 2022.
2022 Disposition
ON Services
On December 15, 2022, we completed the sale of substantially all of the assets of GES’ United States audio-visual production business, ON Services – AV Specialists, Inc. (“ON Services”), for approximately $30.0 million, subject to customary working capital adjustments. We recognized a gain on sale of $19.6 million. During 2023, we made a sale purchase price adjustment of approximately $0.2 million. ON Services had a net carrying value of $10.4 million, which included $4.9 million of net working capital and net non-current assets of $5.5 million. Working capital consisted primarily of accounts receivable of $8.2 million and other current assets of $0.7 million, offset in part by current liabilities of $4.0 million. Net non-current assets consisted primarily of property and equipment of $6.0 million, offset in part by other liabilities of $0.5 million. The staging business of ON Services was included in the Spiro reportable segment and the venue services business in the United States was included in the GES Exhibitions reportable segment. The ON Services sale did not represent a strategic shift that has or will have a major effect on our operations and financial results, and therefore was not classified as a discontinued operation for any of the periods presented.
|
| Year Ended December 31, |
| |||||
(in thousands, except per share data) |
| 2016 |
|
| 2015 |
| ||
Revenue |
| $ | 1,250,290 |
|
| $ | 1,183,656 |
|
Depreciation and amortization |
| $ | 52,074 |
|
| $ | 52,631 |
|
Income from continuing operations |
| $ | 43,727 |
|
| $ | 27,881 |
|
Net income attributable to Viad |
| $ | 42,517 |
|
| $ | 27,045 |
|
Diluted income per share |
| $ | 2.10 |
|
| $ | 1.35 |
|
Basic income per share |
| $ | 2.10 |
|
| $ | 1.35 |
|
46
VIAD CORP
NOTES TO CONSOLIDATED FINANCIAL STATEMENTS (CONTINUED)
2021 Acquisition
Golden Skybridge
On March 18, 2021, we acquired a 60% controlling interest in the Golden Skybridge attraction for total cash consideration of $15 million Canadian dollars (approximately $12 million U.S. dollars), of which $6 million Canadian dollars (approximately $4.8 million U.S. dollars) were primarily used to fund additional experiences. The Golden Skybridge opened in June 2021.
The fair value of net assets acquired as of the acquisition date included $2.2 million U.S. dollars in property and equipment and $6.8 million U.S. dollars in noncontrolling interest. Under the acquisition method of accounting, the purchase price is allocated to the tangible and identifiable intangible assets acquired and liabilities assumed based on their estimated fair values. The excess purchase price over the fair value of net assets acquired of $11.8 million U.S. dollars was recorded as “Goodwill.” Goodwill relating to the Golden Skybridge acquisition is included in the Pursuit reportable segment. The primary factor that contributed to the purchase price resulting in the recognition of goodwill related to future growth opportunities when combined with our other businesses. Goodwill is not deductible for tax purposes. We included these assets in the Consolidated Balance Sheets from the date of acquisition.
Transaction costs associated with the acquisition were $0.4 million U.S. dollars during 2021, which are included in “Costs of services” in the Consolidated Statements of Operations.
Note 4. 5. Inventories
The components of inventories consisted of the following:
|
| December 31, |
| |||||
(in thousands) |
| 2023 |
|
| 2022 |
| ||
Raw materials |
| $ | 681 |
|
| $ | 1,403 |
|
Finished goods |
|
| 9,472 |
|
|
| 9,382 |
|
Inventories |
| $ | 10,153 |
|
| $ | 10,785 |
|
|
| December 31, |
| |||||
(in thousands) |
| 2017 |
|
| 2016 |
| ||
Raw materials |
| $ | 17,550 |
|
| $ | 16,846 |
|
Work in process |
|
| 12,822 |
|
|
| 14,574 |
|
Inventories |
| $ | 30,372 |
|
| $ | 31,420 |
|
Note 5. 6. Other Current Assets
Other current assets consisted of the following:
|
| December 31, |
| |||||
(in thousands) |
| 2023 |
|
| 2022 |
| ||
Restricted cash |
| $ | 6,325 |
|
| $ | 4,845 |
|
Prepaid software maintenance |
|
| 4,905 |
|
|
| 4,650 |
|
Prepaid project deposit |
|
| 3,699 |
|
|
| 3,615 |
|
Prepaid vendor payments |
|
| 2,403 |
|
|
| 2,084 |
|
Prepaid taxes |
|
| 881 |
|
|
| 142 |
|
Income tax receivable |
|
| 670 |
|
|
| 322 |
|
Prepaid other |
|
| 1,567 |
|
|
| 1,836 |
|
Other |
|
| 1,324 |
|
|
| 1,483 |
|
Other current assets |
| $ | 21,774 |
|
| $ | 18,977 |
|
|
| December 31, |
| |||||
(in thousands) |
| 2017 |
|
| 2016 |
| ||
Prepaid vendor payments |
| $ | 5,048 |
|
| $ | 3,633 |
|
Income tax receivable |
|
| 4,237 |
|
|
| 3,614 |
|
Prepaid software maintenance |
|
| 3,386 |
|
|
| 2,804 |
|
Prepaid insurance |
|
| 2,610 |
|
|
| 2,479 |
|
Prepaid taxes |
|
| 912 |
|
|
| 850 |
|
Prepaid rent |
|
| 730 |
|
|
| 327 |
|
Prepaid other |
|
| 2,172 |
|
|
| 731 |
|
Other |
|
| 1,935 |
|
|
| 4,011 |
|
Other current assets |
| $ | 21,030 |
|
| $ | 18,449 |
|
47
VIAD CORP
NOTES TO CONSOLIDATED FINANCIAL STATEMENTS (CONTINUED)
Note 6. 7. Property and Equipment, Net
Property and equipment consisted of the following:
|
| December 31, |
| |||||
(in thousands) |
| 2023 |
|
| 2022 |
| ||
Land and land interests(1) |
| $ | 31,184 |
|
| $ | 30,902 |
|
Buildings and leasehold improvements |
|
| 445,074 |
|
|
| 409,852 |
|
Equipment and other |
|
| 455,070 |
|
|
| 413,485 |
|
Gross property and equipment |
|
| 931,328 |
|
|
| 854,239 |
|
Accumulated depreciation |
|
| (395,557 | ) |
|
| (362,195 | ) |
Property and equipment, net (excluding finance leases) |
|
| 535,771 |
|
|
| 492,044 |
|
Finance lease ROU assets, net |
|
| 57,120 |
|
|
| 57,534 |
|
Property and equipment, net |
| $ | 592,891 |
|
| $ | 549,578 |
|
|
| December 31, |
| |||||
(in thousands) |
| 2017 |
|
| 2016 |
| ||
Land and land interests(1) |
| $ | 32,544 |
|
| $ | 31,670 |
|
Buildings and leasehold improvements |
|
| 222,118 |
|
|
| 185,987 |
|
Equipment and other(2) |
|
| 351,676 |
|
|
| 326,868 |
|
Gross property and equipment |
|
| 606,338 |
|
|
| 544,525 |
|
Accumulated depreciation |
|
| (300,767 | ) |
|
| (264,667 | ) |
Property and equipment, net |
| $ | 305,571 |
|
| $ | 279,858 |
|
|
|
|
|
Depreciation expense was $42.7$42.2 million for 2017, $33.6during 2023, $43.0 million for 2016,during 2022, and $28.1$43.7 million for 2015.during 2021.
Non-cash increases to property and equipment related to assets acquired under capital leases were $2.5 million for 2017, $1.2 million for 2016, and $1.0 million for 2015. Non-cash increases to property and equipment purchases in accountsAccounts payable and accrued liabilities were $2.3 million for 2017, $0.9 million for 2016, and $2.3 million for 2015.
On December 29, 2016, the Mount Royal Hotel in Banff, Canada was damaged by a fire and closed. As a result of the fire, we recorded an impairment loss of $2.2 million against the net book value of the hotel assets. During 2017, we resolved our property and business interruption insurance claims related to the fire for a totaladdition of $36.3property and equipment was $5.9 million as of December 31, 2023 and $3.1 million as of December 31, 2022. Capitalized interest was $2.1 million during 2023 and $3.0 million during 2022, which $29.3 million was recorded as an impairment recovery (partially offset by impairment charges of $0.2 million) related to construction costs to re-open the hotel.
During 2016, we recorded impairment charges of $0.2 millionprimarily related to the write-downdevelopment of certain software and buses in Pursuit. During 2015, we recorded impairment charges of $0.1 million related to the write-off of certain software in Pursuit. Impairment charges (recoveries) are included in the Consolidated Statements of Operations.Pursuit’s FlyOver attractions.
Note 7. 8. Other Investments and Assets
Other investments and assets consisted of the following:
|
| December 31, |
| |||||
(in thousands) |
| 2023 |
|
| 2022 |
| ||
Self-insured liability receivable |
| $ | 7,776 |
|
| $ | 8,211 |
|
Other mutual funds |
|
| 4,271 |
|
|
| 3,490 |
|
Contract costs |
|
| 1,772 |
|
|
| 2,237 |
|
Other |
|
| 3,228 |
|
|
| 3,519 |
|
Other investments and assets |
| $ | 17,047 |
|
| $ | 17,457 |
|
|
| December 31, |
| |||||
(in thousands) |
| 2017 |
|
| 2016 |
| ||
Cash surrender value of life insurance |
| $ | 23,947 |
|
| $ | 23,197 |
|
Self-insured liability receivable |
|
| 10,442 |
|
|
| 10,463 |
|
Workers’ compensation insurance security deposits |
|
| 3,550 |
|
|
| 4,050 |
|
Other mutual funds |
|
| 2,637 |
|
|
| 2,062 |
|
Other |
|
| 6,936 |
|
|
| 4,525 |
|
Other investments and assets |
| $ | 47,512 |
|
| $ | 44,297 |
|
Note 8. 9. Goodwill and Other Intangible Assets, Net
The changes in the carrying amount of goodwill are as follows:
(in thousands) |
|
|
| |
Balance at December 31, 2021 |
| $ | 112,078 |
|
Business acquisition |
|
| 16,787 |
|
Foreign currency translation adjustments |
|
| (7,436 | ) |
Balance at December 31, 2022 |
|
| 121,429 |
|
Foreign currency translation adjustments |
|
| 2,436 |
|
Other(1) |
|
| 41 |
|
Balance at December 31, 2023 |
| $ | 123,906 |
|
(in thousands) |
| GES U.S. |
|
| GES International |
|
| Pursuit |
|
| Total |
| ||||
Balance at December 31, 2015 |
| $ | 112,300 |
|
| $ | 38,635 |
|
| $ | 34,288 |
|
| $ | 185,223 |
|
Business acquisitions |
|
| 35,977 |
|
|
| — |
|
|
| 35,681 |
|
|
| 71,658 |
|
Foreign currency translation adjustments |
|
| — |
|
|
| (4,175 | ) |
|
| 1,316 |
|
|
| (2,859 | ) |
Balance at December 31, 2016 |
|
| 148,277 |
|
|
| 34,460 |
|
|
| 71,285 |
|
|
| 254,022 |
|
Business acquisitions |
|
| — |
|
|
| 1,060 |
|
|
| 7,094 |
|
|
| 8,154 |
|
Foreign currency translation adjustments |
|
| — |
|
|
| 3,320 |
|
|
| 5,055 |
|
|
| 8,375 |
|
Balance at December 31, 2017 |
| $ | 148,277 |
|
| $ | 38,840 |
|
| $ | 83,434 |
|
| $ | 270,551 |
|
48
VIAD CORP
NOTES TO CONSOLIDATED FINANCIAL STATEMENTS (CONTINUED)
The following table summarizes the remaining goodwill by reporting unit and segment:unit:
|
| December 31, |
|
| December 31, |
| ||||||||||
(in thousands) |
| 2017 |
|
| 2016 |
|
| 2023 |
|
| 2022 |
| ||||
GES: |
|
|
|
|
|
|
|
| ||||||||
U.S. |
| $ | 148,277 |
|
| $ | 148,277 |
| ||||||||
International: |
|
|
|
|
|
|
|
| ||||||||
GES EMEA |
|
| 31,612 |
|
|
| 27,694 |
| ||||||||
GES Canada |
|
| 7,228 |
|
|
| 6,766 |
| ||||||||
Total GES |
|
| 187,117 |
|
|
| 182,737 |
| ||||||||
Pursuit: |
|
|
|
|
|
|
|
|
|
|
|
|
|
| ||
Banff Jasper Collection |
|
| 35,305 |
|
|
| 32,587 |
|
| $ | 63,829 |
|
| $ | 62,383 |
|
Alaska Collection |
|
| 3,184 |
|
|
| 3,184 |
|
|
| 3,184 |
|
|
| 3,184 |
|
Glacier Park Collection |
|
| 1,268 |
|
|
| 1,268 |
|
|
| 16,828 |
|
|
| 16,787 |
|
FlyOver |
|
| 43,677 |
|
|
| 34,246 |
|
|
| 40,065 |
|
|
| 39,075 |
|
Total Pursuit |
|
| 83,434 |
|
|
| 71,285 |
| ||||||||
Total Goodwill |
| $ | 270,551 |
|
| $ | 254,022 |
|
| $ | 123,906 |
|
| $ | 121,429 |
|
Goodwill is tested for impairment at the reporting unit level on an annual basis as of October 31, and between annual tests if an event occurs or circumstances change that would more-likely-than-not reduce the fair value of a reporting unit below its carrying value. We use a discounted expected future cash flow methodology (income approach) to estimate the fair value of our reporting units for purposes of goodwill impairment testing.
GES U.S. goodwill is assigned to, and tested at, the operating segment level. GES International goodwill is assigned to and tested based on the segment’s geographical operations (GES Europe, Middle East, and Asia (“GES EMEA”) and GES Canada). Pursuit’s impairment testing is performed at the reporting unit level (Banff Jasper Collection, the Alaska Collection, Glacier Park Collection, and FlyOver).
As a resultThe results of our most recent impairment analysis performed as of October 31, 2017, the2023, indicated that no impairment existed for Pursuit’s reporting units with reported goodwill. The excess of the estimated fair value over the carrying value for each of our reporting units with reported goodwill (expressed as a percentage of the carrying amounts) under step one of the impairment test for GES U.S. was 134%, GES EMEA was 214%, GES Canada was 164%, the Banff Jasper Collection was 147%,and the Alaska Collection was 99%, thesignificant, Glacier Park Collection was 16%3%, and FlyOver was 29%5%.
We will continue to closely monitor actual results versus expectations as well as whether and to what extent any significant changes in current events or conditions result in corresponding changes to our expectations about future estimated cash flows and discount rates. If our adjusted expectations of the operating results of our reporting units do not materialize, or the discount rate increases (based on increases in interest rates, market rates of return or market volatility), it is possible that we may be required to record goodwill impairment charges in the future, which may be material.
Our accumulated goodwill impairment was $415.5 million as of both December 31, 20172023 and 2016 was $229.7 million.2022.
Other intangible assets consisted of the following:
|
| December 31, 2017 |
|
| December 31, 2016 |
|
|
| December 31, 2023 |
|
| December 31, 2022 |
| |||||||||||||||||||||||||||||||||||||
(in thousands) |
| Gross Carrying Value |
|
| Accumulated Amortization |
|
| Net Carrying Value |
|
| Gross Carrying Value |
|
| Accumulated Amortization |
|
| Net Carrying Value |
|
| Remaining Useful Life |
| Gross Carrying |
|
| Accumulated |
|
| Net Carrying Value |
|
| Gross Carrying |
|
| Accumulated |
|
| Net Carrying Value |
| ||||||||||||
Amortized intangible assets: |
|
|
|
|
|
|
|
|
|
|
|
|
|
|
|
|
|
|
|
|
|
|
|
| ||||||||||||||||||||||||||
Intangible assets subject to amortization: |
|
|
|
|
|
|
|
|
|
|
|
|
|
|
| |||||||||||||||||||||||||||||||||||
Customer contracts and relationships |
| $ | 68,798 |
|
| $ | (23,696 | ) |
| $ | 45,102 |
|
| $ | 67,762 |
|
| $ | (14,345 | ) |
| $ | 53,417 |
|
| 8.2 |
| $ | 34,701 |
|
| $ | (29,950 | ) |
| $ | 4,751 |
|
| $ | 37,194 |
|
| $ | (30,109 | ) |
| $ | 7,085 |
|
Operating contracts and licenses |
|
| 9,951 |
|
|
| (1,094 | ) |
|
| 8,857 |
|
|
| 9,315 |
|
|
| (652 | ) |
|
| 8,663 |
|
| 33.3 |
|
| 40,324 |
|
|
| (4,692 | ) |
|
| 35,632 |
|
|
| 38,993 |
|
|
| (3,504 | ) |
|
| 35,489 |
|
In-place lease |
| 32.8 |
|
| 14,754 |
|
|
| (1,842 | ) |
|
| 12,912 |
|
|
| 14,420 |
|
|
| (1,404 | ) |
|
| 13,016 |
| ||||||||||||||||||||||||
Tradenames |
|
| 8,633 |
|
|
| (2,873 | ) |
|
| 5,760 |
|
|
| 8,324 |
|
|
| (1,440 | ) |
|
| 6,884 |
|
| 3.3 |
|
| 5,667 |
|
|
| (4,121 | ) |
|
| 1,546 |
|
|
| 5,546 |
|
|
| (3,324 | ) |
|
| 2,222 |
|
Non-compete agreements |
|
| 5,363 |
|
|
| (3,007 | ) |
|
| 2,356 |
|
|
| 5,190 |
|
|
| (1,369 | ) |
|
| 3,821 |
| ||||||||||||||||||||||||||
Other |
|
| 896 |
|
|
| (650 | ) |
|
| 246 |
|
|
| 886 |
|
|
| (458 | ) |
|
| 428 |
|
| 4.2 |
|
| 787 |
|
|
| (200 | ) |
|
| 587 |
|
|
| 770 |
|
|
| (163 | ) |
|
| 607 |
|
Total amortized intangible assets |
|
| 93,641 |
|
|
| (31,320 | ) |
|
| 62,321 |
|
|
| 91,477 |
|
|
| (18,264 | ) |
|
| 73,213 |
|
|
|
|
| 96,233 |
|
|
| (40,805 | ) |
|
| 55,428 |
|
|
| 96,923 |
|
|
| (38,504 | ) |
|
| 58,419 |
|
Unamortized intangible assets: |
|
|
|
|
|
|
|
|
|
|
|
|
|
|
|
|
|
|
|
|
|
|
|
| ||||||||||||||||||||||||||
Indefinite-lived intangible assets: |
|
|
|
|
|
|
|
|
|
|
|
|
|
|
|
| ||||||||||||||||||||||||||||||||||
Business licenses |
|
| 460 |
|
|
| — |
|
|
| 460 |
|
|
| 460 |
|
|
| — |
|
|
| 460 |
|
|
|
|
| 569 |
|
|
| — |
|
|
| 569 |
|
|
| 566 |
|
|
| — |
|
|
| 566 |
|
Other intangible assets |
| $ | 94,101 |
|
| $ | (31,320 | ) |
| $ | 62,781 |
|
| $ | 91,937 |
|
| $ | (18,264 | ) |
| $ | 73,673 |
|
|
|
| $ | 96,802 |
|
| $ | (40,805 | ) |
| $ | 55,997 |
|
| $ | 97,489 |
|
| $ | (38,504 | ) |
| $ | 58,985 |
|
Intangible asset amortization expense (excluding amortization expense of ROU assets) was $12.4$4.6 million during 2017, $9.22023, $5.2 million during 2016,2022, and $7.2$5.8 million during 2015. The weighted-average amortization period of customer contracts and relationships is approximately 8.5 years, operating contracts and licenses is approximately 26.3 years, tradenames is approximately 7.0 years, non-compete agreements is approximately 2.2 years, and other amortizable intangible assets is approximately 2.2 years. The2021.
At December 31, 2023, the estimated future amortization expense related to amortized intangible assets held at December 31, 2017subject to amortization is as follows:
(in thousands) |
|
|
| |
Year ending December 31, |
|
|
| |
2024 |
| $ | 3,680 |
|
2025 |
|
| 2,378 |
|
2026 |
|
| 2,344 |
|
2027 |
|
| 1,939 |
|
2028 |
|
| 1,907 |
|
Thereafter |
|
| 43,180 |
|
Total |
| $ | 55,428 |
|
(in thousands) |
|
|
|
|
Year ending December 31, |
|
|
|
|
2018 |
| $ | 11,013 |
|
2019 |
|
| 9,945 |
|
2020 |
|
| 8,444 |
|
2021 |
|
| 7,447 |
|
2022 |
|
| 5,895 |
|
Thereafter |
|
| 19,577 |
|
Total |
| $ | 62,321 |
|
49
VIAD CORP
NOTES TO CONSOLIDATED FINANCIAL STATEMENTS (CONTINUED)
Note 9. 10. Other Current Liabilities
Other current liabilities consisted of the following:
|
| December 31, |
| |||||
(in thousands) |
| 2023 |
|
| 2022 |
| ||
Continuing operations: |
|
|
|
|
|
| ||
Foreign income taxes payable |
| $ | 8,558 |
|
| $ | 8,354 |
|
Accrued concession fees |
|
| 3,970 |
|
|
| 4,297 |
|
Accrued employee benefit costs |
|
| 4,835 |
|
|
| 4,920 |
|
Self-insured liability |
|
| 4,531 |
|
|
| 4,909 |
|
Accrued sales and use taxes |
|
| 3,958 |
|
|
| 4,082 |
|
Commissions payable |
|
| 3,799 |
|
|
| 5,059 |
|
Accommodation services deposits |
|
| 2,681 |
|
|
| 2,208 |
|
Accrued professional fees |
|
| 1,208 |
|
|
| 898 |
|
Current portion of pension and postretirement liabilities |
|
| 1,396 |
|
|
| 1,426 |
|
Other |
|
| 6,315 |
|
|
| 4,958 |
|
Total continuing operations |
|
| 41,251 |
|
|
| 41,111 |
|
Discontinued operations: |
|
|
|
|
|
| ||
Self-insured liability |
|
| 121 |
|
|
| 458 |
|
Environmental remediation liabilities |
|
| 25 |
|
|
| 46 |
|
Other |
|
| 1,000 |
|
|
| 38 |
|
Total discontinued operations |
|
| 1,146 |
|
|
| 542 |
|
Total other current liabilities |
| $ | 42,397 |
|
| $ | 41,653 |
|
|
| December 31, |
| |||||
(in thousands) |
| 2017 |
|
| 2016 |
| ||
Continuing operations: |
|
|
|
|
|
|
|
|
Accrued income tax payable |
| $ | 7,518 |
|
| $ | 758 |
|
Self-insured liability accrual |
|
| 6,208 |
|
|
| 5,941 |
|
Commissions payable |
|
| 3,235 |
|
|
| 639 |
|
Accrued employee benefit costs |
|
| 2,915 |
|
|
| 2,624 |
|
Accrued sales and use taxes |
|
| 2,431 |
|
|
| 4,279 |
|
Accrued dividends |
|
| 2,094 |
|
|
| 2,119 |
|
Current portion of pension and postretirement liabilities |
|
| 2,109 |
|
|
| 1,963 |
|
Deferred rent |
|
| 1,679 |
|
|
| 1,535 |
|
Accrued rebates |
|
| 1,106 |
|
|
| 1,078 |
|
Accrued professional fees |
|
| 1,020 |
|
|
| 794 |
|
Accrued restructuring |
|
| 722 |
|
|
| 1,924 |
|
Other taxes |
|
| 2,750 |
|
|
| 4,210 |
|
Other |
|
| 3,852 |
|
|
| 1,774 |
|
Total continuing operations |
|
| 37,639 |
|
|
| 29,638 |
|
Discontinued operations: |
|
|
|
|
|
|
|
|
Environmental remediation liabilities |
|
| 648 |
|
|
| 492 |
|
Self-insured liability accrual |
|
| 337 |
|
|
| 162 |
|
Other |
|
| 96 |
|
|
| 98 |
|
Total discontinued operations |
|
| 1,081 |
|
|
| 752 |
|
Total other current liabilities |
| $ | 38,720 |
|
| $ | 30,390 |
|
Note 10. 11. Other Deferred Items and Liabilities
Other deferred items and liabilities consisted of the following:
|
| December 31, |
| |||||
(in thousands) |
| 2023 |
|
| 2022 |
| ||
Continuing operations: |
|
|
|
|
|
| ||
Foreign deferred tax liability |
| $ | 28,234 |
|
| $ | 27,564 |
|
Multi-employer pension plan withdrawal liability |
|
| 13,341 |
|
|
| 13,815 |
|
Self-insured excess liability |
|
| 7,776 |
|
|
| 8,211 |
|
Self-insured liability |
|
| 7,407 |
|
|
| 5,028 |
|
Accrued compensation |
|
| 5,627 |
|
|
| 4,977 |
|
Accrued restructuring |
|
| 2,666 |
|
|
| 3,245 |
|
Other |
|
| 1,958 |
|
|
| 3,071 |
|
Total continuing operations |
|
| 67,009 |
|
|
| 65,911 |
|
Discontinued operations: |
|
|
|
|
|
| ||
Environmental remediation liabilities |
|
| 2,140 |
|
|
| 2,177 |
|
Self-insured liability |
|
| 1,562 |
|
|
| 1,631 |
|
Other |
|
| — |
|
|
| 305 |
|
Total discontinued operations |
|
| 3,702 |
|
|
| 4,113 |
|
Total other deferred items and liabilities |
| $ | 70,711 |
|
| $ | 70,024 |
|
|
| December 31, |
| |||||
(in thousands) |
| 2017 |
|
| 2016 |
| ||
Continuing operations: |
|
|
|
|
|
|
|
|
Self-insured liability |
| $ | 12,918 |
|
| $ | 12,981 |
|
Self-insured excess liability |
|
| 10,442 |
|
|
| 10,463 |
|
Accrued compensation |
|
| 9,740 |
|
|
| 8,514 |
|
Foreign deferred tax liability |
|
| 8,267 |
|
|
| 2,264 |
|
Deferred rent |
|
| 3,855 |
|
|
| 5,271 |
|
Accrued restructuring |
|
| 1,827 |
|
|
| 1,858 |
|
Other |
|
| 1,305 |
|
|
| 1,300 |
|
Total continuing operations |
|
| 48,354 |
|
|
| 42,651 |
|
Discontinued operations: |
|
|
|
|
|
|
|
|
Self-insured liability |
|
| 2,557 |
|
|
| 3,748 |
|
Environmental remediation liabilities |
|
| 1,728 |
|
|
| 3,091 |
|
Accrued income taxes |
|
| — |
|
|
| 1,045 |
|
Other |
|
| 219 |
|
|
| 199 |
|
Total discontinued operations |
|
| 4,504 |
|
|
| 8,083 |
|
Total other deferred items and liabilities |
| $ | 52,858 |
|
| $ | 50,734 |
|
50
VIAD CORP
NOTES TO CONSOLIDATED FINANCIAL STATEMENTS (CONTINUED)
Note 11. 12. Debt and Capital LeaseFinance Obligations
The components of long-term debt and capital leasefinance obligations consisted of the following:
|
| December 31, |
| |||||
(in thousands, except interest rates) |
| 2023 |
|
| 2022 |
| ||
2021 Credit Facility - Term Loan B, 10.5% interest rate at December 31, 2023 and 9.4% at December 31, 2022, due through 2028(1) |
| $ | 321,000 |
|
| $ | 395,000 |
|
2021 Credit Facility - Revolving Credit Facility, 8.5% interest rate at December 31, 2023, due through 2026(1) |
|
| 57,000 |
|
|
| — |
|
Jasper Term Loan, 6.5% interest rate at December 31, 2023, due through 2028(1) |
|
| 12,655 |
|
|
| — |
|
Jasper Revolving Credit Facility, 9.5% weighted-average interest rate at December 31, 2023, due through 2028(1) |
|
| 3,020 |
|
|
| — |
|
Forest Park Hotel Construction Loan Facility, 8.8% interest rate at December 31, 2022(1) |
|
| — |
|
|
| 11,491 |
|
FlyOver Iceland Credit Facility, 8.9% interest rate at December 31, 2023 and 6.9% at December 31, 2022, due through 2027(1) |
|
| 4,049 |
|
|
| 4,965 |
|
FlyOver Iceland Term Loans, 13.8% weighted-average interest rate at December 31, 2023 and 10.1% at December 31, 2022, due through 2024(1) |
|
| 475 |
|
|
| 594 |
|
Less unamortized debt issuance costs |
|
| (9,453 | ) |
|
| (11,848 | ) |
Total debt |
|
| 388,746 |
|
|
| 400,202 |
|
Finance lease obligations, 9.2% weighted-average interest rate at December 31, 2023 and 9.1% at December 31, 2022, due through 2067 |
|
| 63,929 |
|
|
| 64,729 |
|
Financing arrangements |
|
| — |
|
|
| 5,013 |
|
Total debt and finance obligations(2)(3) |
|
| 452,675 |
|
|
| 469,944 |
|
Current portion |
|
| (8,371 | ) |
|
| (13,192 | ) |
Long-term debt and finance obligations |
| $ | 444,304 |
|
| $ | 456,752 |
|
|
| December 31, |
| |||||
(in thousands, except interest rates) |
| 2017 |
|
| 2016 |
| ||
Revolving credit facility and term loan, 3.1% weighted-average interest rate at December 31, 2017 and 2.6% at December 31, 2016, due through 2019 (1) |
| $ | 207,322 |
|
| $ | 212,750 |
|
Brewster Inc. revolving credit facility, 2.7% weighted-average interest rate at December 31, 2016 (1) |
|
| — |
|
|
| 36,456 |
|
Less unamortized debt issuance costs |
|
| (984 | ) |
|
| (1,464 | ) |
Total debt |
|
| 206,338 |
|
|
| 247,742 |
|
Capital lease obligations, 3.8% weighted-average interest rate at December 31, 2017 and 4.9% at December 31, 2016, due through 2021 |
|
| 2,854 |
|
|
| 1,469 |
|
Total debt and capital lease obligations |
|
| 209,192 |
|
|
| 249,211 |
|
Current portion (2) |
|
| (152,599 | ) |
|
| (174,968 | ) |
Long-term debt and capital lease obligations |
| $ | 56,593 |
|
| $ | 74,243 |
|
|
|
|
|
Effective December 22, 2014, we entered into a $300 million Amended and Restated Credit Agreement (the “Credit Agreement”). The Credit Agreement provides for a senior credit facility in the aggregate amount of $300 million, which consists of a $175 million revolving credit facility (the “Revolving Credit Facility”) and a $125 million term loan (the “Term Loan”). The Credit Agreement has a maturity date of December 22, 2019. Proceeds from the loans made under the Credit Agreement were used to refinance certain of our outstanding debt and will be used for general corporate purposes in the ordinary course of business. Under the Credit Agreement, either or both of the Revolving Credit Facility and the Term Loan may be increased up to an additional $100 million under certain circumstances. If such circumstances are met, we may obtain the additional borrowings under the Revolving Credit Facility, the Term Loan, or a combination of the two. The Revolving Credit Facility has a $40 million sublimit for letters of credit. Borrowings and letters of credit can be denominated in U.S. dollars, Euros, Canadian dollars, or British pounds. Our lenders under the Credit Agreement have a first perfected security interest in all of our personal property including GES, GES Event Intelligence Services, Inc., CATC, and ON Services, and 65% of the capital stock of our top-tier foreign subsidiaries.
Effective February 24, 2016, we executed an amendment (“Amendment No. 1”) to the Credit Agreement. Amendment No. 1 modified the terms of the financial covenants and the negative covenants related to acquisitions, restricted payments, and indebtedness. The overall maximum leverage ratio and minimum fixed charge coverage ratio are 3.50 to 1.00 and 1.75 to 1.00, respectively, and will remain at those levels for the entire remaining term of the Credit Agreement. Acquisitions in substantially the same or related lines of business are permitted under Amendment No. 1, as long as the pro forma leverage ratio is less than or equal to 3.00 to 1.00. We can make dividends, distributions, and repurchases of our common stock up to $20 million per calendar year. Stock dividends, distributions, and repurchases above the $20 million limit are not subject to a liquidity covenant, and are permitted as long as our pro forma leverage ratio is less than or equal to 2.50 to 1.00 and no default or unmatured default, as defined in the Credit Agreement, exists. Unsecured debt is allowed as long as our pro forma leverage ratio is less than or equal to 3.00 to 1.00. Significant other covenants under the Credit Agreement that were not affected by Amendment No. 1 include limitations on investments, sales/leases of assets, consolidations or mergers, and liens on property. As of December 31, 2017, the fixed charge coverage ratio was 3.10 to 1.00, the leverage ratio was 1.45 to 1.00, and we were in compliance with all covenants under the Credit Agreement.
Effective December 28, 2016, Brewster Inc., part of Pursuit, entered into a credit agreement (the “Brewster Credit Agreement”) with a $38 million revolving credit facility (the “Brewster Revolver”). The Brewster Credit Agreement was used in connection with the FlyOver Canada acquisition. Effective December 6, 2017, we amended the Brewster Revolver to reduce the amount to $20 million and extend the maturity date to December 28, 2018. Additional loan proceeds will be used for potential future acquisitions in Canada and other general corporate purposes of Brewster Inc. The lender under the Brewster Revolver has a first perfected security interest in all of Brewster Inc.’s personal property and a guaranty from Brewster Inc.’s immediate parent, Brewster Travel Canada Inc. (secured by its present and future personal property), Viad, and all of its current or future subsidiaries that are required to be guarantors under Viad’s Credit Agreement. The fees on the unused portion of the Brewster Revolver are currently 0.2% annually.
As of December 31, 2017, our total debt and capital lease obligations were $209.2 million, consisting of outstanding borrowings under the Term Loan of $75.0 million, the Revolving Credit Facility of $132.3 million, and capital lease obligations of $2.9 million, offset in part by unamortized debt issuance costs, of $1.0 million. As of December 31, 2017, capacity remaining under the Revolving Credit Facility was $41.4 million, reflecting borrowings of $132.3 million and $1.3 million in outstanding letters of credit. As of December 31, 2017, Brewster Inc. had $20 million of capacity remaining under the Brewster Revolver.
Borrowings under the Revolving Credit Facility (of which GES, GES Event Intelligence Services, Inc., CATC, and ON Services are guarantors) are indexedcommitment fees, or any expense or income related to the prime rate or the London Interbank OfferedInterest Rate plus appropriate spreads tied to our leverage ratio. Commitment fees and letters of credit fees are also tied to our leverage ratio. The fees on the unused portion of the Revolving Credit Facility are currently 0.3% annually.
As of December 31, 2017, on behalf of our subsidiaries, we had certain obligations under guarantees to third parties. These guarantees are not subject to liability recognitionCap as discussed in the consolidated financial statements and relate to leased facilities entered into by our subsidiary operations. We would generally be required to make payments to the respective third parties under these guarantees in the event that the related subsidiary could not meet its own payment obligations. The maximum potential amount of future payments that we would be required to make under all guarantees existing as of December 31, 2017 would be $19.3 million. These guarantees relate to facilities leased through October 2027. There are no recourse provisions that would enable us to recover from third parties any payments made under the guarantees. Furthermore, there are no collateral or similar arrangements whereby we could recover payments.
Aggregate annual maturities of long-term debt and capital lease obligations as of December 31, 2017 are as follows:
(in thousands) |
| Revolving Credit Agreement |
|
| Capital Lease Obligations |
| ||
Year ending December 31, |
|
|
|
|
|
|
|
|
2018 |
| $ | 151,072 |
|
| $ | 1,601 |
|
2019 |
|
| 56,250 |
|
|
| 899 |
|
2020 |
|
| — |
|
|
| 454 |
|
2021 |
|
| — |
|
|
| 17 |
|
2022 |
|
| — |
|
|
| — |
|
Total |
| $ | 207,322 |
|
| $ | 2,971 |
|
Less: Amount representing interest |
|
|
|
|
|
| (117 | ) |
Present value of minimum lease payments |
|
|
|
|
| $ | 2,854 |
|
As of December 31, 2017, the gross amount of assets recorded under capital leases was $4.8 million and accumulated amortization was $2.0 million. As of December 31, 2016, the gross amount of assets recorded under capital leases was $3.3 million and accumulated amortization was $1.7 million. The amortization charges related to assets recorded under capital leases are included in depreciation expense. Refer to Note 6 – Property and Equipment.
13 - Derivative.
maturity, which is a Level 2 measurement. Refer to Note 14 –
Fair Value Measurements for additional information.2021 Credit Facility
Effective July 30, 2021, we entered into a $500 million credit facility (the “2021 Credit Facility”). The 2021 Credit Facility provided for 2017, $5.5a $400 million term loan (“Term Loan B”) and a $100 million revolving credit facility (“Revolving Credit Facility”). The proceeds of the Term Loan B, net of $14.8 million in related fees, were used to repay the $327 million outstanding balance under our prior $450 million revolving credit facility and to provide for 2016,financial flexibility to fund future acquisitions and $4.2growth initiatives and for general corporate purposes.
On October 6, 2023, we entered into the Third Amendment to the 2021 Credit Facility, which among other things: increased the principal amount of the Revolving Credit Facility by $70 million, bringing the total amount of revolving capacity to $170 million, and added Brewster Inc., an Alberta corporation and a wholly-owned subsidiary of the Company, as a co-borrower. In connection with the amendment, we prepaid $70 million of the outstanding balance on our existing Term Loan B using $60 million from the Revolving Credit Facility and $10 million of cash from the Company’s balance sheet. The credit spread on the Term Loan B is 5.00% for 2015.Secured Overnight Financing Rate (“SOFR”) borrowings, which is 200 basis points higher than the current credit spread on our Revolving Credit Facility.
LIBOR Transition Amendment
On February 6, 2023, we entered into the LIBOR Transition Amendment to the 2021 Credit Facility to replace the London Interbank Offered Rate (“LIBOR”) with the SOFR. In accordance with the LIBOR replacement provisions outlined in the 2021 Credit Facility, additional credit spread adjustments apply to SOFR ranging from 0.11448% (for a one-month duration) up to 0.71513% (for a 12-month duration).
51
VIAD CORP
NOTES TO CONSOLIDATED FINANCIAL STATEMENTS (CONTINUED)
Term Loan B
The Term Loan B has a maturity date of July 30, 2028 and is subject to quarterly amortization of principal of $1.0 million. Interest rates are based on SOFR (plus additional credit spread adjustments as detailed above under “LIBOR Transition Amendment”) plus a 5.00% credit spread, with a SOFR floor of 0.50%. The Term Loan B carries no financial covenants.
As discussed in Note 13 – Derivative, we entered into an interest rate cap agreement that manages our exposure to interest rate increases on $300 million of borrowings under the 2021 Credit Facility or other SOFR-based borrowings and provides us with the right to receive payment if the one-month SOFR exceeds 5.0% (“Strike Rate”).
Revolving Credit Facility
The Revolving Credit Facility has a maturity date of July 30, 2026. In addition to borrowing based on one, three, six, or twelve month SOFR tenors (plus additional credit spread adjustments as detailed above under “LIBOR Transition Amendment”), we also have the option to borrow based on the “Base Rate”, which for any day is a fluctuating rate equal to the highest of the Fed Funds Rate plus 0.50%, Bank of America’s publicly announced “prime rate”, and SOFR plus 1.00%. Credit spreads for SOFR and Base Rate borrowings are based on Viad’s total net leverage ratio and range from 2.50% to 3.50% for SOFR borrowings and from 1.50% to 3.50% for Base Rate borrowings. Additionally, a 1.00% floor applies to the Base Rate.
The Revolving Credit Facility includes an undrawn fee ranging from 0.30% to 0.50% that is based on Viad’s total net leverage ratio.
The Revolving Credit Facility carries financial covenants. On March 23, 2022, we entered into the First Amendment to the 2021 Credit Facility and on March 28, 2023, we entered into the Second Amendment to the 2021 Credit Facility. The amendments modified the financial covenants to the following:
As of December 31, 2023, our total net leverage ratio was 2.55 to 1.00, the interest coverage ratio was 3.24 to 1.00, and we were in compliance with all covenants under the Revolving Credit Facility.
In addition to U.S. dollar borrowings, we may borrow funds on the Revolving Credit Facility in Canadian Dollars based on the Canadian Dollar Offered Rate, Pound Sterling based on the Sterling Overnight Index Average, and Euros based on the Euro Interbank Offered Rate, plus applicable credit spreads. No such borrowings had been made as of December 31, 2023.
As of December 31, 2023, capacity remaining under the Revolving Credit Facility was $108.0 million, reflecting $170 million total facility size, less $57.0 million outstanding balance and $5.0 million in outstanding letters of credit.
Forest Park Hotel Construction Loan Facility
Effective May 17, 2022, Pursuit, through a 60% owned subsidiary, entered into a construction loan facility for borrowings up to $17.0 million Canadian dollars (approximately $13.3 million U.S. dollars) for the development and construction of the Forest Park Hotel in Jasper National Park. Construction of the hotel was completed in August 2022. During January 2023, we completed our final borrowing under the construction loan facility bringing the total amount borrowed to $16.8 million Canadian dollars.
The construction loan facility required interest only payments at Canada Prime plus 2.35% through January 31, 2023, at which time it was converted to a 6.5% fixed rate term loan. On May 16, 2023, Pursuit entered into an amendment to the Forest Park Hotel Construction Loan Facility wherein the loan was converted into a $27.0 million Canadian dollar (approximately $20.0 million U.S. dollars) credit facility (the “Jasper Credit Facility”). See below for additional details.
Jasper Credit Facility
The Jasper Credit Facility provides for a $17.0 million Canadian dollar term loan (“Jasper Term Loan”) and a $10.0 million Canadian dollar revolving credit facility (“Jasper Revolving Credit Facility”). The Jasper Credit Facility matures on January 31, 2028.
The Jasper Revolving Credit Facility carries financial covenants as follows:
52
VIAD CORP
NOTES TO CONSOLIDATED FINANCIAL STATEMENTS (CONTINUED)
As of December 31, 2023, the pre-compensation and post-compensation fixed-charge coverage ratios were 4.01 to 1.00, and Pursuit was in compliance with all covenants under the Jasper Credit Facility.
Jasper Term Loan
The proceeds of the Jasper Term Loan reflect the outstanding balance of the Forest Park Construction Loan Facility at the time it was converted to the Jasper Term Loan of $16.8 million Canadian dollars. The Jasper Term Loan bears interest at a 6.5% fixed rate.
Jasper Revolving Credit Facility
The proceeds of the Jasper Revolving Credit Facility are used to fund capital improvements. As of December 31, 2023, capacity remaining under the Jasper Revolving Credit Facility was $6.0 million Canadian dollars (approximately $4.5 million U.S. dollars). The Jasper Revolving Credit Facility bears interest at the Canadian Prime Rate plus 2.25%.
FlyOver Iceland Credit Facility
Effective February 15, 2019, FlyOver Iceland ehf., (“FlyOver Iceland”) a wholly-owned subsidiary of Esja, entered into a credit agreement with a €5.0 million (approximately $5.6 million U.S. dollars) credit facility (the “FlyOver Iceland Credit Facility”) with an original maturity date of March 1, 2022. The loan proceeds were used to complete the development of the FlyOver Iceland attraction. The loan bears interest at the three month Euro Interbank Offered Rate (“EURIBOR”) plus 4.9%.
FlyOver Iceland entered into an addendum effective December 1, 2021 wherein the principal payments were deferred for twelve months beginning December 1, 2021, with the first payment due December 1, 2022 and the maturity date was extended to September 1, 2027. The addendum provided for a semi-annual waiver of certain covenants through June 30, 2022 with the first testing date as of December 31, 2022. Effective November 2, 2022, FlyOver Iceland received a financial covenant waiver for the 2022 through 2023 testing periods.
On February 27, 2024, FlyOver Iceland reached an agreement to amend and extend the FlyOver Iceland Credit Facility, wherein the principal payments are deferred for six months beginning March 1, 2024, with equal quarterly principal payments due beginning September 1, 2024 and a maturity date of September 1, 2029. Refer to Note 25 – Subsequent Events for additional information.
FlyOver Iceland Term Loans
During 2020, FlyOver Iceland entered into three term loans totaling ISK 90.0 million (approximately $0.7 million U.S. dollars) (the “FlyOver Iceland Term Loans”). The first term loan for ISK 10.0 million was entered into effective October 15, 2020 and matured on April 1, 2023. It bore interest on a seven-day term deposit rate at the Central Bank of Iceland. The second term loan for ISK 30.0 million was entered into effective October 15, 2020 with a maturity date of October 1, 2024 and bears interest on a seven-day term deposit at the Central Bank of Iceland plus 3.07%. The third term loan for ISK 50.0 million was entered into effective December 29, 2020 with an original maturity date of February 1, 2023, which was extended to February 1, 2024 by way of a subsequent amendment, and bears interest at one-month Reykjavik InterBank Offered Rate (“REIBOR”) plus 4.99%. On February 27, 2024, FlyOver Iceland reached an agreement with its lender to refinance the ISK 50.0 million loan with a new ISK 50.0 million term loan that matures on August 1, 2024. Refer to Note 25 – Subsequent Events for additional information.
The Icelandic State Treasury guarantees supplemental loans provided by credit institutions to companies impacted by the COVID-19 pandemic. Accordingly, the Icelandic State Treasury guaranteed the repayment of up to 85% of the principal and interest on the ISK 10.0 million and ISK 30.0 million term loans and 70% of the principal amount on the ISK 50.0 million term loan. Loan proceeds were used to fund FlyOver Iceland operations.
53
VIAD CORP
NOTES TO CONSOLIDATED FINANCIAL STATEMENTS (CONTINUED)
Future maturities
Aggregate annual maturities of debt (excluding finance obligations) as of December 31, 2023 are as follows:
(in thousands) |
| Credit Facilities |
| |
Year ending December 31, |
|
|
| |
2024 |
| $ | 5,630 |
|
2025 |
|
| 5,323 |
|
2026 |
|
| 62,340 |
|
2027 |
|
| 5,086 |
|
2028 |
|
| 319,820 |
|
Total |
| $ | 398,199 |
|
The aggregate annual maturities and the related amounts representing interest on finance lease obligations are included in Note 21 – Leases and Other.
Note 13. Derivative
Interest Rate Cap
On January 4, 2023, we entered into an interest rate cap agreement with an effective date of January 31, 2023. The interest rate cap manages our exposure to interest rate increases on $300 million in SOFR-based borrowings under our 2021 Credit Facility and provides us with the right to receive payment if the one-month SOFR exceeds the Strike Rate. Beginning on February 28, 2023, we pay a fixed monthly deferred premium based on an annual rate of 0.3335% for the interest rate cap, which matures on January 31, 2025. During 2023, we received gross proceeds from the interest rate cap of $0.5 million as one-month SOFR exceeded the Strike Rate.
We designated the interest rate cap as a cash flow hedge designed to hedge the variability of the SOFR-based interest payments on our 2021 Credit Facility. The interest rate cap is recorded in the Consolidated Balance Sheets at fair value. The fair value is determined using widely accepted valuation techniques and reflects the contractual terms of the interest rate cap including the price of the cap and the period to maturity. While there are no quoted prices in active markets, our calculation uses observable market-based inputs, including interest rate curves. The interest rate cap is classified as Level 2 within the fair value hierarchy. Refer to Note 14 – Fair Value Measurements for the related fair value disclosures.
The fair value of the interest rate cap is as follows:
|
|
|
| December 31, |
|
| December 31, |
| ||
(in thousands) |
| Classification |
| 2023 |
|
| 2022 |
| ||
Derivatives designated as hedging instruments |
|
|
|
|
|
|
|
| ||
Interest rate cap - short-term |
| Other current liabilities |
| $ | 443 |
|
| $ | — |
|
Interest rate cap - long-term |
| Other deferred items and liabilities |
|
| 45 |
|
|
| — |
|
Total derivatives designated as hedging instruments |
|
|
| $ | 488 |
|
| $ | — |
|
Changes in the fair value of the interest rate cap are recorded in AOCI. Amounts accumulated in AOCI are reclassified to “Interest expense, net” in the Consolidated Statements of Operations when the hedged item affects earnings. During 2023, approximately $0.8 million was reclassified to interest expense, net, and $0.7 million remained in unrealized losses in AOCI as of December 31, 2023. We estimate that $0.2 million will be reclassified to earnings within the next 12 months.
Note 12. 14. Fair Value Measurements
The fair value of an asset or liability is defined as the price that would be received to sellby selling an asset or paidpaying to transfer a liability in an orderly transaction between market participants at the measurement date. The fair value guidance requires an entity to maximize the use of quoted prices and other observable inputs and minimize the use of unobservable inputs when measuring fair value, and also establishes a fair value hierarchy, which prioritizes the inputs to valuation techniques used to measure fair value as follows:
Level 1 - Quoted prices in active markets for identical assets or liabilities.
Level 2 - Observable inputs other than quoted prices included within Level 1 that are observable for the asset or liability, either directly or indirectly.
Level 3 - Unobservable inputs to the valuation methodology that are significant to the measurement of fair value.
54
VIAD CORP
Money market mutual fundsNOTES TO CONSOLIDATED FINANCIAL STATEMENTS (CONTINUED)
The fair value of assets and certain other mutual fund investments areliabilities measured at fair value on a recurring basis using Level 1 inputs. The fair value information related to these assets is summarizedare as follows:
|
|
|
|
| Fair Value Measurements at Reporting Date Using |
| ||||||||||
(in thousands) |
| December 31, 2023 |
|
| Quoted Prices in |
|
| Significant |
|
| Significant |
| ||||
Assets: |
|
|
|
|
|
|
|
|
|
|
|
| ||||
Other mutual funds(1) |
| $ | 4,271 |
|
| $ | 4,271 |
|
| $ | — |
|
| $ | — |
|
Total assets at fair value on a recurring basis |
| $ | 4,271 |
|
| $ | 4,271 |
|
| $ | — |
|
| $ | — |
|
Liabilities: |
|
|
|
|
|
|
|
|
|
|
|
| ||||
Interest rate cap (2) |
| $ | 488 |
|
| $ | — |
|
| $ | 488 |
|
| $ | — |
|
Total liabilities at fair value on a recurring basis |
| $ | 488 |
|
| $ | — |
|
| $ | 488 |
|
| $ | — |
|
|
|
|
|
| Fair Value Measurements at Reporting Date Using |
| ||||||||||
(in thousands) |
| December 31, 2022 |
|
| Quoted Prices |
|
| Significant |
|
| Significant |
| ||||
Assets: |
|
|
|
|
|
|
|
|
|
|
|
| ||||
Other mutual funds(1) |
|
| 3,490 |
|
|
| 3,490 |
|
|
| — |
|
|
| — |
|
Total assets at fair value on a recurring basis |
| $ | 3,490 |
|
| $ | 3,490 |
|
| $ | — |
|
| $ | — |
|
|
|
|
|
|
| Fair Value Measurements at Reporting Date Using |
| |||||||||
(in thousands) |
| December 31, 2017 |
|
| Quoted Prices in Active Markets (Level 1) |
|
| Significant Other Observable Inputs (Level 2) |
|
| Significant Unobservable Inputs (Level 3) |
| ||||
Assets: |
|
|
|
|
|
|
|
|
|
|
|
|
|
|
|
|
Money market funds(1) |
| $ | 119 |
|
| $ | 119 |
|
| $ | — |
|
| $ | — |
|
Other mutual funds(2) |
|
| 2,637 |
|
|
| 2,637 |
|
|
| — |
|
|
| — |
|
Total assets at fair value on a recurring basis |
| $ | 2,756 |
|
| $ | 2,756 |
|
| $ | — |
|
| $ | — |
|
|
|
|
|
|
| Fair Value Measurements at Reporting Date Using |
| |||||||||
(in thousands) |
| December 31, 2016 |
|
| Quoted Prices in Active Markets (Level 1) |
|
| Significant Other Observable Inputs (Level 2) |
|
| Significant Unobservable Inputs (Level 3) |
| ||||
Assets: |
|
|
|
|
|
|
|
|
|
|
|
|
|
|
|
|
Money market funds(1) |
| $ | 118 |
|
| $ | 118 |
|
| $ | — |
|
| $ | — |
|
Other mutual funds(2) |
|
| 2,062 |
|
|
| 2,062 |
|
|
| — |
|
|
| — |
|
Total assets at fair value on a recurring basis |
| $ | 2,180 |
|
| $ | 2,180 |
|
| $ | — |
|
| $ | — |
|
|
|
|
|
The carrying values of cash and cash equivalents, receivables,accounts receivable, and accounts payable approximate fair value due to the short-term maturitiesnature of these instruments. Refer to Note 1112 – Debt and Capital LeaseFinance Obligations for the estimated fair value of debt obligations.
Note 13. 15. Income (Loss) Per Share
The components of basic and diluted income (loss) per share are as follows:
|
|
|
| |||||||||
|
| Year Ended December 31, |
| |||||||||
(in thousands, except per share data) |
| 2023 |
|
| 2022 |
|
| 2021 |
| |||
Net income (loss) attributable to Viad |
| $ | 16,017 |
|
| $ | 23,220 |
|
| $ | (92,655 | ) |
Less: Allocation to participating securities |
|
| (1,993 | ) |
|
| (3,600 | ) |
|
| — |
|
Convertible preferred stock dividends paid in cash |
|
| (7,801 | ) |
|
| (7,801 | ) |
|
| (3,900 | ) |
Convertible preferred stock dividends paid in kind |
|
| — |
|
|
| — |
|
|
| (3,821 | ) |
Adjustment to the redemption value of redeemable noncontrolling interest |
|
| — |
|
|
| (763 | ) |
|
| (1,797 | ) |
Net income (loss) allocated to Viad common stockholders (basic) |
| $ | 6,223 |
|
| $ | 11,056 |
|
| $ | (102,173 | ) |
Add: Allocation to participating securities |
|
| 18 |
|
|
| 30 |
|
|
| — |
|
Net income (loss) allocated to Viad common stockholders (diluted) |
| $ | 6,241 |
|
| $ | 11,086 |
|
| $ | (102,173 | ) |
|
|
|
|
|
|
|
|
|
| |||
Basic weighted-average outstanding common shares |
|
| 20,855 |
|
|
| 20,589 |
|
|
| 20,411 |
|
Additional dilutive shares related to share-based compensation |
|
| 242 |
|
|
| 223 |
|
|
| — |
|
Diluted weighted-average outstanding shares |
|
| 21,097 |
|
|
| 20,812 |
|
|
| 20,411 |
|
Income (loss) per share: |
|
|
|
|
|
|
|
|
| |||
Basic income (loss) attributable to Viad common stockholders |
| $ | 0.30 |
|
| $ | 0.54 |
|
| $ | (5.01 | ) |
Diluted income (loss) attributable to Viad common stockholders(1) |
| $ | 0.30 |
|
| $ | 0.53 |
|
| $ | (5.01 | ) |
|
|
|
| |||||||||
|
| Year Ended December 31, |
| |||||||||
(in thousands, except per share data) |
| 2017 |
|
| 2016 |
|
| 2015 |
| |||
Net income attributable to Viad (diluted) |
| $ | 57,707 |
|
| $ | 42,269 |
|
| $ | 26,606 |
|
Less: Allocation to non-vested shares |
|
| (700 | ) |
|
| (571 | ) |
|
| (385 | ) |
Adjustment to carrying value of redeemable noncontrolling interest |
|
| — |
|
|
| — |
|
|
| — |
|
Net income allocated to Viad common stockholders (basic) |
| $ | 57,007 |
|
| $ | 41,698 |
|
| $ | 26,221 |
|
Basic weighted-average outstanding common shares |
|
| 20,146 |
|
|
| 19,990 |
|
|
| 19,797 |
|
Additional dilutive shares related to share-based compensation |
|
| 259 |
|
|
| 187 |
|
|
| 184 |
|
Diluted weighted-average outstanding shares |
|
| 20,405 |
|
|
| 20,177 |
|
|
| 19,981 |
|
Income per share: |
|
|
|
|
|
|
|
|
|
|
|
|
Basic income attributable to Viad common stockholders |
| $ | 2.83 |
|
| $ | 2.09 |
|
| $ | 1.32 |
|
Diluted income attributable to Viad common stockholders |
| $ | 2.83 |
|
| $ | 2.09 |
|
| $ | 1.32 |
|
55
VIAD CORP
NOTES TO CONSOLIDATED FINANCIAL STATEMENTS (CONTINUED)
We excluded the following weighted-average potential common shares from the calculations of diluted net income (loss) per common share during the applicable periods because their inclusion would have been anti-dilutive:
|
| Year Ended December 31, |
| |||||||||
(in thousands) |
| 2023 |
|
| 2022 |
|
| 2021 |
| |||
Convertible preferred stock |
|
| — |
|
|
| — |
|
|
| 6,674 |
|
Unvested restricted share-based awards |
|
| 40 |
|
|
| 23 |
|
|
| 176 |
|
Unvested performance share-based awards |
|
| 93 |
|
|
| 8 |
|
|
| 32 |
|
Stock options |
|
| 372 |
|
|
| 255 |
|
|
| 194 |
|
Options to purchase 8,000 shares during 2017, 500 shares during 2016,Note 16. Common and 4,000 shares during 2015 of common stock were outstanding, but were not included in the computation of dilutive shares outstanding because the effect would be anti-dilutive.
Note 14. Preferred Stock Purchase Rights
Preferred Stock
We authorized five million shares of Preferred Stock and two million shares of Junior Participating Preferred Stock, nonenone of which was outstanding on December 31, 2017.2023 and five million shares of Preferred Stock of which 141,827 shares are outstanding.
Convertible Series A Preferred Stock
On August 5, 2020, we entered into an investment agreement with funds managed by private equity firm Crestview Partners (the “Investment Agreement”), relating to the issuance of 135,000 shares of newly issued Convertible Series A Preferred Stock, par value $0.01 per share (the “Convertible Preferred Stock”), for an aggregate purchase price of $135 million or $1,000 per share. The $135 million issuance was offset in part by $9.2 million of expenses related to the capital raise. We have classified the Convertible Preferred Stock as mezzanine equity in the Consolidated Balance Sheet due to the existence of certain change in control provisions that are not solely within our control.
The Convertible Series A Preferred Stock carries a 5.5% cumulative quarterly dividend, which is payable in cash or in-kind at Viad’s option and is convertible at the option of the holders into shares of our common stock at a conversion price of $21.25 per share. Dividends paid-in-kind increase the redemption value of the preferred stock. The redemption value of the preferred stock was $141.8 million as of December 31, 2023 and 2022. Upon the occurrence of a change in control event, the holders have a right to require Viad to repurchase such preferred stock. During the year ended December 31, 2023, $7.8 million of dividends were declared, all of which were paid in cash. We intend to pay preferred stock dividends in cash for the foreseeable future.
Holders of the Convertible Series A Preferred Stock are entitled to vote with holders of Viad’s common stock on an as-converted basis.
Common Stock Repurchases
Our Board of Directors previously authorized us to repurchase shares of our common stock from time to time at prevailing market prices. In March 2020, our Board of Directors suspended our share repurchase program. As of December 31, 2023, 546,283 shares remain available for repurchase under all prior authorizations. Additionally, we repurchase shares related to tax withholding requirements on vested restricted stock awards. Refer to Note 15. 3 – Share-Based Compensation.
56
VIAD CORP
NOTES TO CONSOLIDATED FINANCIAL STATEMENTS (CONTINUED)
Note 17. Accumulated Other Comprehensive Income (Loss)
Changes in AOCI by component are as follows:
(in thousands) |
| Unrealized Gains on Investments |
|
| Cumulative Foreign Currency Translation Adjustments |
|
| Unrecognized Net Actuarial Loss and Prior Service Credit, Net |
|
| Accumulated Other Comprehensive Income (Loss) |
|
| Cumulative |
|
| Unrecognized Net Actuarial Loss and Prior Service Credit, Net |
|
| Unrealized Loss on Interest Rate Cap |
|
| Accumulated |
| ||||||||
Balance at December 31, 2015 |
| $ | 346 |
|
| $ | (23,257 | ) |
| $ | (11,265 | ) |
| $ | (34,176 | ) | ||||||||||||||||
Balance at December 31, 2021 |
| $ | (16,162 | ) |
| $ | (11,267 | ) |
| $ | — |
|
| $ | (27,429 | ) | ||||||||||||||||
Other comprehensive income (loss) before reclassifications |
|
| 135 |
|
|
| (5,827 | ) |
|
| — |
|
|
| (5,692 | ) |
|
| (26,821 | ) |
|
| 117 |
|
|
| — |
|
|
| (26,704 | ) |
Amounts reclassified from AOCI, net of tax |
|
| (60 | ) |
|
| — |
|
|
| 537 |
|
|
| 477 |
|
|
| — |
|
|
| 6,948 |
|
|
| — |
|
|
| 6,948 |
|
Net other comprehensive income (loss) |
|
| 75 |
|
|
| (5,827 | ) |
|
| 537 |
|
|
| (5,215 | ) |
|
| (26,821 | ) |
|
| 7,065 |
|
|
| — |
|
|
| (19,756 | ) |
Balance at December 31, 2016 |
| $ | 421 |
|
| $ | (29,084 | ) |
| $ | (10,728 | ) |
| $ | (39,391 | ) | ||||||||||||||||
Other comprehensive income before reclassifications |
|
| 257 |
|
|
| 17,058 |
|
|
| — |
|
|
| 17,315 |
| ||||||||||||||||
Balance at December 31, 2022 |
| $ | (42,983 | ) |
| $ | (4,202 | ) |
| $ | — |
|
| $ | (47,185 | ) | ||||||||||||||||
Other comprehensive income (loss) before reclassifications |
|
| 7,643 |
|
|
| (119 | ) |
|
| (489 | ) |
|
| 7,035 |
| ||||||||||||||||
Amounts reclassified from AOCI, net of tax |
|
| (62 | ) |
|
| — |
|
|
| (430 | ) |
|
| (492 | ) |
|
| — |
|
|
| (82 | ) |
|
| (162 | ) |
|
| (244 | ) |
Net other comprehensive income (loss) |
|
| 195 |
|
|
| 17,058 |
|
|
| (430 | ) |
|
| 16,823 |
|
|
| 7,643 |
|
|
| (201 | ) |
|
| (651 | ) |
|
| 6,791 |
|
Balance at December 31, 2017 |
| $ | 616 |
|
| $ | (12,026 | ) |
| $ | (11,158 | ) |
| $ | (22,568 | ) | ||||||||||||||||
Balance at December 31, 2023 |
| $ | (35,340 | ) |
| $ | (4,403 | ) |
| $ | (651 | ) |
| $ | (40,394 | ) | ||||||||||||||||
Amounts reclassified from AOCI that relate to our defined benefit pension and postretirement plans include the amortization of prior service costs and actuarial net losses recognized during each period presented. We recorded these costs as components of net periodic cost for each period presented. Refer to Note 19 – Pension and Postretirement Benefits for additional information.
The following table presents information about reclassification adjustments out of AOCI:
|
| Year Ended December 31, |
|
| Affected Line Item in the Statement Where Net Income is Presented | |||||
(in thousands) |
| 2017 |
|
| 2016 |
|
|
| ||
Unrealized gains on investments |
| $ | (100 | ) |
| $ | (97 | ) |
| Interest income |
Tax effect |
|
| 38 |
|
|
| 37 |
|
| Income taxes |
|
| $ | (62 | ) |
| $ | (60 | ) |
|
|
|
|
|
|
|
|
|
|
|
|
|
Recognized net actuarial loss (gains)(1) |
| $ | 507 |
|
| $ | 1,440 |
|
|
|
Amortization of prior service credit(1) |
|
| (1,247 | ) |
|
| (575 | ) |
|
|
Tax effect |
|
| 310 |
|
|
| (328 | ) |
| Income taxes |
|
| $ | (430 | ) |
| $ | 537 |
|
|
|
|
|
We record current income tax expense for the amounts that we expect to report and pay on our income tax returns and deferred income tax expense for the change in the deferred tax assets and liabilities. On December 22, 2017, the President of the United States signed into lawenacted the Tax Cuts and Jobs Act (the “Tax Act”) that significantly changed the U.S.United States tax codelaw. One part of this Tax Act required us to pay a deemed repatriation tax of $5.2 million on our cumulative foreign earnings and reduced the U.S. federal corporateprofit. After application of tax rate from 35% to 21%. Deferred tax assetspayments and liabilities are recorded for the difference between the financial statement and tax basis of assets and liabilities, measured at the enacted tax rate applicable when the differences reverse. We recognized deferred tax expense of $8.0credits, $1.0 million for the remeasurement of the net deferredliability remains outstanding as of December 31, 2023 and 2022 and is due in 2025.
We cannot provide any assurance that changes in tax assetslaws or regulations, both within the United States and other jurisdictions in which we operate, such as the fourth quarterproposed 15% global minimum tax under the Organization for Economic Co-operation and Development (the “OECD”) Pillar Two, Global Anti-Base Erosion Rules (the “Pillar Two Rules”), will not materially and adversely affect our effective tax rates, tax payments financial condition and results of 2017.
The Tax Act included the transition from a worldwide system of taxation to a territorial system and required a one-time deemed mandatory repatriation of post-1986 undistributed foreign subsidiary earnings and profits (“E&P”).operations. As of December 31, 2017, we had2023, among the jurisdictions where a country has already enacted legislation adopting Pillar Two rules, only the United Kingdom’s adoption may have an estimated $174.0 million of undistributed foreign E&P subject to the deemed mandatory repatriationimmaterial impact on our future effective tax rates and recognized current income tax expense of $8.1 million in the fourth quarter of 2017. future cash payments.
In addition to the impact recorded as of December 31, 2017, the Tax Act changed existing tax laws, effective January 1, 2018, including the repeal of the corporate alternative minimum tax and the increasing alternative minimum tax credit carryforward utilization, as well as establishing two new taxes, the base erosion anti-abuse tax (“BEAT”) and the global intangible low-taxed income (“GILTI”) tax after the foreign intangible deduction (“FDII”).
Under the new BEAT regime, certain payments made to related foreign companies are treated as base-eroding and limits the deductibility of these payments and imposes a minimum tax in excess of regular tax liability. We have reviewed the applicability of the BEAT provisions to our transactions and we do not expect to be subject to BEAT and have not recorded any provision for BEAT in the year ended December 31, 2017.
Under the new GILTI regime, earnings of foreign subsidiaries in excess of an allowable return on the subsidiary’s tangible assets are required to be included in our U.S. taxable income. Because of the complexity of the new GILTI tax rules, we are continuing to assess the impact and have not recorded a provision for the GILTI tax in the year ended December 31, 2017.
On December 22, 2017, the SEC issued Staff Accounting Bulletin No. 118 (“SAB 118”), which provides guidance on accounting for the tax effects of the Tax Act under U.S. GAAP for SEC registrants who do not have the necessary information available, prepared or analyzed in reasonable detail to complete the accounting for certain income tax effects of the Tax Act. In accordance with SAB 118, to the extent that a company’s accounting is incomplete but it is able to determine a reasonable estimate, it must record a provisional estimate in the financial statements.
We have not completed the detailed accounting for all of the income tax effects of the Tax Act, specifically the BEAT and GILTI taxes, since the computations are complex and we need additional time to complete a full analysis. Under SAB 118, we recorded a provisional estimate for the mandatory repatriation of post-1986 undistributed foreign subsidiary E&P of $8.1 million and the remeasurement of the net deferred tax assets of $8.0 million for the year ended December 31, 2017. The ultimate impact may differ from these provisional amounts, possibly materially, due to additional analysis, changes in interpretations and assumptions we have made, additional regulatory guidance that may be issued and actions we may take as a result of the Tax Act. SAB 118 provides a measurement period that should not extend beyond one year from the enactment date and we expect to complete the detailed accounting and include any adjustments within this period.
Income (loss) from continuing operations before income taxes consisted of the following:
|
| Year Ended December 31, |
| |||||||||
(in thousands) |
| 2023 |
|
| 2022 |
|
| 2021 |
| |||
Foreign |
| $ | 90,325 |
|
| $ | 40,178 |
|
| $ | (17,750 | ) |
United States |
|
| (47,252 | ) |
|
| (5,558 | ) |
|
| (77,331 | ) |
Income (loss) from continuing operations before income taxes |
| $ | 43,073 |
|
| $ | 34,620 |
|
| $ | (95,081 | ) |
|
| Year Ended December 31, |
| |||||||||
(in thousands) |
| 2017 |
|
| 2016 |
|
| 2015 |
| |||
Foreign |
| $ | 82,919 |
|
| $ | 33,611 |
|
| $ | 35,571 |
|
United States |
|
| 21,431 |
|
|
| 31,118 |
|
|
| 2,364 |
|
Income from continuing operations before income taxes |
| $ | 104,350 |
|
| $ | 64,729 |
|
| $ | 37,935 |
|
57
VIAD CORP
NOTES TO CONSOLIDATED FINANCIAL STATEMENTS (CONTINUED)
Significant components of the income tax provision from continuing operations are as follows:
|
| Year Ended December 31, |
|
| Year Ended December 31, |
| ||||||||||||||||||
(in thousands) |
| 2017 |
|
| 2016 |
|
| 2015 |
|
| 2023 |
|
| 2022 |
|
| 2021 |
| ||||||
Current: |
|
|
|
|
|
|
|
|
|
|
|
|
|
|
|
|
|
|
|
|
| |||
United States: |
|
|
|
|
|
|
|
|
|
|
|
|
|
|
|
|
|
|
|
|
| |||
Federal |
| $ | 1,693 |
|
| $ | 3,685 |
|
| $ | (876 | ) |
| $ | 101 |
|
| $ | 78 |
|
| $ | 49 |
|
State |
|
| 2,573 |
|
|
| 1,716 |
|
|
| 1,558 |
|
|
| 593 |
|
|
| 302 |
|
|
| (581 | ) |
Foreign |
|
| 15,583 |
|
|
| 8,177 |
|
|
| 9,342 |
|
|
| 19,714 |
|
|
| 7,773 |
|
|
| (7,268 | ) |
Total current |
|
| 19,849 |
|
|
| 13,578 |
|
|
| 10,024 |
|
|
| 20,408 |
|
|
| 8,153 |
|
|
| (7,800 | ) |
Deferred: |
|
|
|
|
|
|
|
|
|
|
|
|
|
|
|
|
|
|
|
|
| |||
United States: |
|
|
|
|
|
|
|
|
|
|
|
|
|
|
|
|
|
|
|
|
| |||
Federal |
|
| 19,893 |
|
|
| 8,427 |
|
|
| 1,854 |
|
|
| — |
|
|
| 45 |
|
|
| — |
|
State |
|
| 1,761 |
|
|
| (598 | ) |
|
| (164 | ) |
|
| (1,588 | ) |
|
| — |
|
|
| — |
|
Foreign |
|
| 4,395 |
|
|
| (157 | ) |
|
| (1,221 | ) |
|
| (21 | ) |
|
| 1,775 |
|
|
| 6,012 |
|
Total deferred |
|
| 26,049 |
|
|
| 7,672 |
|
|
| 469 |
|
|
| (1,609 | ) |
|
| 1,820 |
|
|
| 6,012 |
|
Income tax expense |
| $ | 45,898 |
|
| $ | 21,250 |
|
| $ | 10,493 |
| ||||||||||||
Income tax (benefit) expense |
| $ | 18,799 |
|
| $ | 9,973 |
|
| $ | (1,788 | ) | ||||||||||||
We are subject to income tax in the jurisdictions in which we operate. A reconciliation of the statutory federal income tax rate to the effective tax rate is as follows:
|
| Year Ended December 31, |
| |||||||||||||||||||||
(in thousands) |
| 2017 |
|
| 2016 |
|
| 2015 |
| |||||||||||||||
Computed income tax expense at statutory federal income tax rate of 35% |
| $ | 36,522 |
|
|
| 35.0 | % |
| $ | 22,655 |
|
|
| 35.0 | % |
| $ | 13,277 |
|
|
| 35.0 | % |
State income taxes, net of federal benefit |
|
| 1,160 |
|
|
| 1.1 | % |
|
| 292 |
|
|
| 0.5 | % |
|
| 1,713 |
|
|
| 4.5 | % |
Deemed mandatory repatriation state tax |
|
| 1,206 |
|
|
| 1.2 | % |
|
| — |
|
|
| — |
|
|
| — |
|
|
| — |
|
Deemed mandatory repatriation federal tax, net of foreign tax credit |
|
| 6,936 |
|
|
| 6.6 | % |
|
| — |
|
|
| — |
|
|
| — |
|
|
| — |
|
Remeasurement of deferred taxes due to reduction in U.S. tax rate * |
|
| 8,000 |
|
|
| 7.7 | % |
|
| — |
|
|
| — |
|
|
| — |
|
|
| — |
|
Foreign tax rate differential |
|
| (5,031 | ) |
|
| (4.8 | )% |
|
| (882 | ) |
|
| (1.4 | )% |
|
| (1,181 | ) |
|
| (3.1 | )% |
U.S. tax on current year foreign earnings, net of foreign tax credits |
|
| (2,726 | ) |
|
| (2.6 | )% |
|
| (373 | ) |
|
| (0.6 | )% |
|
| (948 | ) |
|
| (2.5 | )% |
Change in valuation allowance |
|
| (796 | ) |
|
| (0.8 | )% |
|
| 1,230 |
|
|
| 1.9 | % |
|
| (944 | ) |
|
| (2.5 | )% |
Other adjustments, net |
|
| 627 |
|
|
| 0.6 | % |
|
| (1,672 | ) |
|
| (2.6 | )% |
|
| (1,424 | ) |
|
| (3.7 | )% |
Income tax expense |
| $ | 45,898 |
|
|
| 44.0 | % |
| $ | 21,250 |
|
|
| 32.8 | % |
| $ | 10,493 |
|
|
| 27.7 | % |
|
| Year Ended December 31, |
| |||||||||||||||||||||
(in thousands) |
| 2023 |
|
| 2022 |
|
| 2021 |
| |||||||||||||||
Computed income tax expense (benefit) at statutory federal income tax rate |
| $ | 9,046 |
|
|
| 21.0 | % |
| $ | 7,270 |
|
|
| 21.0 | % |
| $ | (19,967 | ) |
|
| 21.0 | % |
State income tax expense (benefit), net of federal benefit |
|
| (995 | ) |
|
| (2.3 | )% |
|
| 1,264 |
|
|
| 3.6 | % |
|
| (7,959 | ) |
|
| 8.4 | % |
Remeasurement of deferred taxes due to change in tax rates |
|
| (735 | ) |
|
| (1.7 | )% |
|
| (499 | ) |
|
| (1.4 | )% |
|
| — |
|
|
| — |
|
Foreign tax rate differential |
|
| 792 |
|
|
| 1.8 | % |
|
| 733 |
|
|
| 2.1 | % |
|
| (672 | ) |
|
| 0.7 | % |
U.S. tax expense on current year foreign earnings, net of foreign tax credits and deductions |
|
| 1,730 |
|
|
| 4.0 | % |
|
| 401 |
|
|
| 1.2 | % |
|
| — |
|
|
| — |
|
Change in valuation allowance not included in other line items |
|
| 2,974 |
|
|
| 6.9 | % |
|
| (702 | ) |
|
| (2.0 | )% |
|
| 21,859 |
|
|
| (23.0 | )% |
Write-off of tax attributes |
|
| 3,365 |
|
|
| 7.8 | % |
|
| — |
|
|
| — |
|
|
| — |
|
|
| — |
|
Restructuring |
|
| — |
|
|
| — |
|
|
| — |
|
|
| — |
|
|
| 4,676 |
|
|
| (4.9 | )% |
Other adjustments, net |
|
| 2,622 |
|
|
| 6.1 | % |
|
| 1,506 |
|
|
| 4.3 | % |
|
| 275 |
|
|
| (0.3 | )% |
Income tax (benefit) expense |
| $ | 18,799 |
|
|
| 43.6 | % |
| $ | 9,973 |
|
|
| 28.8 | % |
| $ | (1,788 | ) |
|
| 1.9 | % |
* Includes $0.6 million increase to the valuation allowance related to the remeasurement of deferred taxes due to the reduction in U.S. tax rate.
58
VIAD CORP
NOTES TO CONSOLIDATED FINANCIAL STATEMENTS (CONTINUED)
The components of deferred income tax assets and liabilities included in the Consolidated Balance Sheets are as follows:
|
| December 31, |
|
| December 31, |
| ||||||||||
(in thousands) |
| 2017 |
|
| 2016 |
|
| 2023 |
|
| 2022 |
| ||||
Deferred tax assets: |
|
|
|
|
|
|
|
|
|
|
|
|
|
| ||
Tax credit carryforwards |
| $ | 6,654 |
|
| $ | 11,380 |
|
| $ | 5,679 |
|
| $ | 7,461 |
|
Pension, compensation, and other employee benefits |
|
| 15,173 |
|
|
| 22,868 |
|
|
| 16,369 |
|
|
| 16,287 |
|
Provisions for losses |
|
| 5,826 |
|
|
| 10,235 |
| ||||||||
Net operating loss carryforward |
|
| 5,195 |
|
|
| 5,023 |
| ||||||||
State income taxes |
|
| 2,502 |
|
|
| 3,790 |
| ||||||||
Accrued liabilities and reserves |
|
| 4,714 |
|
|
| 4,000 |
| ||||||||
Net operating loss carryforwards |
|
| 50,470 |
|
|
| 52,422 |
| ||||||||
Leases |
|
| 5,398 |
|
|
| 2,897 |
| ||||||||
Goodwill and other intangible assets |
|
| 3,990 |
|
|
| 5,100 |
| ||||||||
Deferral of United States interest deductions |
|
| 23,048 |
|
|
| 13,048 |
| ||||||||
Other deferred income tax assets |
|
| 2,796 |
|
|
| 5,020 |
|
|
| 10,245 |
|
|
| 9,601 |
|
Total deferred tax assets |
|
| 38,146 |
|
|
| 58,316 |
|
|
| 119,913 |
|
|
| 110,816 |
|
Valuation allowance |
|
| (4,010 | ) |
|
| (3,998 | ) |
|
| (105,353 | ) |
|
| (101,639 | ) |
Foreign deferred tax assets included above |
|
| (2,396 | ) |
|
| (1,972 | ) |
|
| (4,522 | ) |
|
| (2,166 | ) |
Net deferred tax assets |
|
| 31,740 |
|
|
| 52,346 |
| ||||||||
United States net deferred tax assets |
|
| 10,038 |
|
|
| 7,011 |
| ||||||||
Deferred tax liabilities: |
|
|
|
|
|
|
|
|
|
|
|
|
|
| ||
Property and equipment |
|
| (10,530 | ) |
|
| (3,299 | ) |
|
| (24,336 | ) |
|
| (21,090 | ) |
Deferred tax related to life insurance |
|
| (3,556 | ) |
|
| (5,642 | ) | ||||||||
Goodwill and other intangible assets |
|
| (4,299 | ) |
|
| (4,535 | ) |
|
| (12,576 | ) |
|
| (10,857 | ) |
Leases |
|
| — |
|
|
| (295 | ) | ||||||||
Other deferred income tax liabilities |
|
| (463 | ) |
|
| (557 | ) |
|
| (4,020 | ) |
|
| (4,023 | ) |
Total deferred tax liabilities |
|
| (18,848 | ) |
|
| (14,033 | ) |
|
| (40,932 | ) |
|
| (36,265 | ) |
Foreign deferred tax liabilities included above |
|
| 7,869 |
|
|
| 2,852 |
|
|
| (32,410 | ) |
|
| (29,170 | ) |
United States net deferred tax assets |
| $ | 20,761 |
|
| $ | 41,165 |
| ||||||||
United States net deferred tax liabilities included above |
|
| (8,522 | ) |
|
| (7,095 | ) | ||||||||
United States net deferred tax assets (liabilities) |
| $ | 1,516 |
|
| $ | (84 | ) | ||||||||
In 2023, due to our income generated in GES Middle East and Europe, we incurred a global intangible low-taxed income (“GILTI”) tax of $1.7 million. The increase in our valuation allowance of $2.9 million was primarily the result of the disallowance of the interest deduction in the United States. The $3.4 million write-off of tax attributes was primarily due to expiring foreign tax credits and net operating losses on liquidated companies.
We use significant judgment in forming conclusions regarding the recoverability of our deferred tax assets and evaluate all available positive and negative evidence to determine if it is more-likely-than-not that the deferred tax assets will be realized. To the extent recovery does not appear likely, a valuation allowance must be recorded. In determining the recoverability of our deferred assets, we considered our cumulative loss incurred over the four-year period ended December 31, 2023 in each tax jurisdiction. Given the weight of objectively verifiable historical losses from our operations, we have recorded a valuation allowance on most of the deferred tax assets in the U.S., United Kingdom, Germany, and our FlyOver operations in Iceland and Toronto.
The valuation allowance was $105.4 million as of December 31, 2023 and $101.6 million at December 31, 2022. Due to our loss in the U.S. in 2023, our valuation allowance increased $8.7 million primarily as a result of the federal and states’ disallowance of the interest deduction. This was offset by a decrease of $5.0 million primarily due to the write-off of deferred assets and the related valuation allowance for expiring foreign tax credits and net operating losses on liquidated companies, the removal of the valuation allowance for onPeak LLC’s separate state deferred assets due to their cumulative income, and the utilization of deferred tax assets in Europe.
We had gross deferred tax assets of $38.1$119.9 million as of December 31, 20172023 and $58.3$110.8 million as of December 31, 2016. These deferred tax assets reflect the expected future tax benefits to be realized upon reversal of deductible temporary differences and the utilization of net operating loss and tax credit carryforwards.2022.
As of December 31, 2017,2023, we had foreign tax credit carryforwards were $0.4of $4.9 million, of which $0.1including $2.1 million are U.S. foreignagainst United States income tax that will begin to expire in 2027. Foreign tax credits and $0.3 million arecreditable against United Kingdom foreign tax credits. The U.S. foreign tax credits are subject to a 10-year carryforward period and will expire in 2021.taxes were $2.8 million, which can be carried forward indefinitely. As of December 31, 2017,2023, we had alternative minimum$0.6 million of United States research and development credit carryforwards and $0.3 million of other general U.S. federal business credits that will begin to expire in 2038. We have recorded a valuation allowance on all tax credit carryforwards of $6.2 million that will be fully utilized against future tax liabilities before becoming refundable as allowed under the Tax Act.carryforwards.
We had gross federal, state, and foreign net operating loss carryforwards of $68.4$355.3 million as of December 31, 20172023 and $63.0$373.3 million as of December 31, 2016, for which we had deferred tax assets of $5.2 million as of December 31, 2017 and $5.0 million as of December 31, 2016.2022. The state and foreign net operating loss carryforwards expire on various dates from 2018 through 2038.
As of December 31, 2017for 2023 that relate to the United States federal, United Kingdom, Germany, and 2016, the valuation allowance was $4.0 million. During 2017, we had a $1.6 million decrease on German foreignPoland may be carried forward indefinitely. Certain state net operating loss carryforwards of $160.5 million expire from 2024 through 2042, although many states now have unlimited carryforwards. We recorded a valuation allowance on all net operating
59
VIAD CORP
NOTES TO CONSOLIDATED FINANCIAL STATEMENTS (CONTINUED)
losses, except certain losses generated by GES operations in certain U.S. states, and Canada (excluding FlyOver Canada Toronto). The remaining $4.4 million of Canadian net operating losses may be carried forward to offset bytaxable income in the next 20 years, of which we recorded a $0.3valuation allowance of $3.3 million increase for the United Kingdom foreign tax credits (although subject to an indefinite carryforward period, do not meet the more likely-than-not threshold for recognition), a $0.5 million increase for the stateFlyOver Canada Toronto. The gross net operating loss return to provision true up, a $0.6carryforwards of Iceland of $11.7 million increase due to the remeasurement for the reduction in U.S. tax rate,will expire between 2027 and a $0.2 million increase in foreign exchange.
While2033. During 2023, we believe that the deferred tax assets,wrote off all remaining net of existingoperating losses and related valuation allowances will be utilizedassociated with our prior operations in future periods, there are inherent uncertainties regardingSwitzerland and Hong Kong as the ultimate realization of these assets. It is possible thatlegal liquidations were materially completed during the relative weight of positive and negative evidence regarding the realization of deferred tax assets may change, which could result in a material increase or decrease in our valuation allowance. Such a change could result in a material increase or decrease to income tax expense in the period the assessment was made.year.
We have not recorded deferred taxes for certain states or foreign withholding taxes on certain historicalcurrent unremitted earnings of our subsidiaries located in Canada, the United Kingdom, and the Netherlands, and certain subsidiaries in Canada as we intend to reinvestthere are no withholding taxes applied on the distributions of those current earnings in operations outside of the United States.
We exercise judgment in determining the income tax provision for positions taken on prior returns when the ultimate tax determination is uncertain. We classify liabilities associated with uncertain tax positions as non-current liabilities“Other deferred items and liabilities” in the Consolidated Balance Sheets unless expected to be paid or released within one year. We had liabilities associated with uncertain tax positions including interest and penalties, of $1.7$0.7 million as of December 31, 20172023 and $2.7$0.9 million as of December 31, 2016. Uncertain2022. As of December 31, 2023, these amounts do not include any accrual of interest nor penalties as none would be owed on these amounts. We elected that all uncertain tax positions, including interest and penalties, are classified as a component of income tax expense.
During 2017, we decreased the liability for continuing operations uncertain tax positions by $0.1 million due to lapse of statute and we increased accrued interest and penalties for continuing operations positions by $0.1 million. We expect $1.3 million of the continuing operations uncertain tax positions to be resolved or settled within the next twelve months and have classified this amount as a current liability.
During 2017, we released the liability for discontinued operations uncertain tax positions of $1.0 million, including $0.4 million in accrued interest and penalties, due to a statute expiration, which was recorded through discontinued operations. We had liabilities associated with discontinued operations uncertain tax positions of zero as of December 31, 2017 and $1.0 million as of December 31, 2016.
A reconciliation of the liabilities associated with uncertain tax positions (excluding interest and penalties) is as follows:
(in thousands) |
| Continuing Operations |
|
| Discontinued Operations |
|
| Total |
|
|
|
| ||||
Balance at December 31, 2014 |
| $ | 1,283 |
|
| $ | 636 |
|
| $ | 1,919 |
| ||||
Balance at December 31, 2020 |
| $ | 250 |
| ||||||||||||
Additions for tax positions taken in prior years |
|
| 43 |
|
|
| — |
|
|
| 43 |
|
|
| 285 |
|
Reductions for tax positions taken in prior years |
|
| (666 | ) |
|
| — |
|
|
| (666 | ) | ||||
Balance at December 31, 2021 |
|
| 535 |
| ||||||||||||
Reductions for lapse of applicable statutes |
|
| (353 | ) |
|
| — |
|
|
| (353 | ) |
|
| (23 | ) |
Balance at December 31, 2015 |
|
| 307 |
|
|
| 636 |
|
|
| 943 |
| ||||
Additions for tax positions taken in prior years |
|
| 1,295 |
|
|
| — |
|
|
| 1,295 |
|
|
| 378 |
|
Balance at December 31, 2022 |
|
| 890 |
| ||||||||||||
Reductions for lapse of applicable statutes |
|
| (43 | ) |
|
| — |
|
|
| (43 | ) |
|
| (217 | ) |
Balance at December 31, 2016 |
|
| 1,559 |
|
|
| 636 |
|
|
| 2,195 |
| ||||
Additions for tax positions taken in prior years |
|
| 43 |
|
|
| — |
|
|
| 43 |
|
|
| 66 |
|
Reductions for lapse of applicable statutes |
|
| (177 | ) |
|
| (636 | ) |
|
| (813 | ) | ||||
Balance at December 31, 2017 |
| $ | 1,425 |
|
| $ | — |
|
| $ | 1,425 |
| ||||
Balance at December 31, 2023 |
| $ | 739 |
| ||||||||||||
Our 2019 through 2021 Canadian tax years for some of our Canadian subsidiaries are currently being audited by the local taxing authorities. We are subject to regular and recurring audits by taxing authorities in jurisdictions in which we operate or have operated in the past, including various foreign countries in addition to thedo not anticipate any material adjustments for those years. United States Canada, and the United Kingdom.
Our 2014 through 2017 U.S. federal tax years and various state tax years from 20132020 through 20172022 remain subject to income tax examinations by tax authorities. TaxThe tax years 20122019 through 20172021 remain subject to examination by various other foreign taxing jurisdictions.
Cash paid forWe made $20.3 million of net cash payments during 2023 and received net cash refunds from income taxes was $14.6of $0.8 million during 2017, $14.12022, and net cash refunds of $7.1 million during 2016,2021. Of the net cash payments made in 2023, $16.6 million of the payments were made in Canada, $1.8 million in the Netherlands, $1.4 million were made in Iceland, Saudi Arabia, and $10.1to various domestic U.S. states, and the remaining $1.0 million during 2015.were withholding taxes incurred due to cross border operational payments.
60
VIAD CORP
NOTES TO CONSOLIDATED FINANCIAL STATEMENTS (CONTINUED)
Note 17. 19. Pension and Postretirement Benefits
Domestic Plans
We have frozen defined benefit pension plans held in trust for certain employees which we funded. We also maintain certain unfunded defined benefit pension plans, which provide supplemental benefits to select management employees. These plans use traditional defined benefit formulas based on years of service and final average compensation. Funding policies provide that payments to defined benefit pension trusts shall be at least equal to the minimum funding required by applicable regulations.
We also have certain defined benefit postretirement plans that provide medical and life insurance for certain eligible employees, retirees, and dependents. The related postretirement benefit liabilities are recognized over the period that services are provided by employees. In addition, we retained the obligations for these benefits for retirees of certain sold businesses. While the plans have no funding requirements, we maytypically fund the plans.
The components of net periodic benefit cost and other amounts of our pension plans recognized in other comprehensive income (loss) of our pension plans consist of the following:
|
| December 31, |
| |||||||||
(in thousands) |
| 2023 |
|
| 2022 |
|
| 2021 |
| |||
Net periodic benefit cost: |
|
|
|
|
|
|
|
|
| |||
Interest cost |
| $ | 845 |
|
| $ | 478 |
|
| $ | 419 |
|
Expected return on plan assets |
|
| (126 | ) |
|
| 93 |
|
|
| (47 | ) |
Amortization of prior service credit |
|
| (38 | ) |
|
| — |
|
|
| — |
|
Recognized net actuarial loss |
|
| 291 |
|
|
| 444 |
|
|
| 623 |
|
Net periodic benefit cost |
|
| 972 |
|
|
| 1,015 |
|
|
| 995 |
|
Other changes in plan assets and benefit obligations recognized in other |
|
|
|
|
|
|
|
|
| |||
Net actuarial (gain) loss |
|
| 198 |
|
|
| (3,409 | ) |
|
| (883 | ) |
Reversal of amortization item: |
|
|
|
|
|
|
|
|
| |||
Prior service credit (cost) |
|
| 38 |
|
|
| (518 | ) |
|
| — |
|
Net actuarial loss |
|
| (291 | ) |
|
| (444 | ) |
|
| (623 | ) |
Total recognized in other comprehensive income |
|
| (55 | ) |
|
| (4,371 | ) |
|
| (1,506 | ) |
Total recognized in net periodic benefit cost and other |
| $ | 917 |
|
| $ | (3,356 | ) |
| $ | (511 | ) |
|
| December 31, |
| |||||||||
(in thousands) |
| 2017 |
|
| 2016 |
|
| 2015 |
| |||
Net periodic benefit cost: |
|
|
|
|
|
|
|
|
|
|
|
|
Service cost |
| $ | 64 |
|
| $ | 98 |
|
| $ | 101 |
|
Interest cost |
|
| 803 |
|
|
| 1,032 |
|
|
| 1,018 |
|
Expected return on plan assets |
|
| (176 | ) |
|
| (256 | ) |
|
| (380 | ) |
Recognized net actuarial loss |
|
| 433 |
|
|
| 423 |
|
|
| 492 |
|
Net periodic benefit cost |
|
| 1,124 |
|
|
| 1,297 |
|
|
| 1,231 |
|
Other changes in plan assets and benefit obligations recognized in other comprehensive income (loss): |
|
|
|
|
|
|
|
|
|
|
|
|
Net actuarial loss (gain) |
|
| 114 |
|
|
| 1 |
|
|
| (963 | ) |
Reversal of amortization item: |
|
|
|
|
|
|
|
|
|
|
|
|
Net actuarial loss |
|
| (433 | ) |
|
| (423 | ) |
|
| (492 | ) |
Total recognized in other comprehensive income (loss) |
|
| (319 | ) |
|
| (422 | ) |
|
| (1,455 | ) |
Total recognized in net periodic benefit cost and other comprehensive income (loss) |
| $ | 805 |
|
| $ | 875 |
|
| $ | (224 | ) |
61
VIAD CORP
NOTES TO CONSOLIDATED FINANCIAL STATEMENTS (CONTINUED)
The components of net periodic benefit cost and other amounts of our postretirement benefit plans recognized in other comprehensive income (loss) of our postretirement benefit plans consist of the following:
|
| December 31, |
|
| December 31, |
| ||||||||||||||||||
(in thousands) |
| 2017 |
|
| 2016 |
|
| 2015 |
|
| 2023 |
|
| 2022 |
|
| 2021 |
| ||||||
Net periodic benefit cost: |
|
|
|
|
|
|
|
|
|
|
|
|
|
|
|
|
|
|
|
|
| |||
Service cost |
| $ | 92 |
|
| $ | 99 |
|
| $ | 152 |
|
| $ | 21 |
|
| $ | 34 |
|
| $ | 70 |
|
Interest cost |
|
| 413 |
|
|
| 573 |
|
|
| 619 |
|
|
| 347 |
|
|
| 179 |
|
|
| 181 |
|
Amortization of prior service credit |
|
| (431 | ) |
|
| (503 | ) |
|
| (552 | ) | ||||||||||||
Recognized net actuarial loss |
|
| 164 |
|
|
| 295 |
|
|
| 528 |
| ||||||||||||
Amortization of prior service cost (credit) |
|
| 114 |
|
|
| 89 |
|
|
| (6 | ) | ||||||||||||
Recognized net actuarial (gain) loss |
|
| (200 | ) |
|
| (152 | ) |
|
| 115 |
| ||||||||||||
Net periodic benefit cost |
|
| 238 |
|
|
| 464 |
|
|
| 747 |
|
|
| 282 |
|
|
| 150 |
|
|
| 360 |
|
Settlement income |
|
| — |
|
|
| — |
|
|
| (65 | ) | ||||||||||||
Total expenses, net |
|
| 282 |
|
|
| 150 |
|
|
| 295 |
| ||||||||||||
Other changes in plan assets and benefit obligations recognized in other comprehensive income (loss): |
|
|
|
|
|
|
|
|
|
|
|
|
|
|
|
|
|
|
|
|
| |||
Net actuarial loss (gain) |
|
| 237 |
|
|
| (790 | ) |
|
| (1,248 | ) | ||||||||||||
Net actuarial (gain) loss |
|
| 125 |
|
|
| (2,540 | ) |
|
| (642 | ) | ||||||||||||
Prior service credit |
|
| 816 |
|
|
| 73 |
|
|
| 3 |
|
|
| — |
|
|
| 509 |
|
|
| — |
|
Reversal of amortization item: |
|
|
|
|
|
|
|
|
|
|
|
| ||||||||||||
Net actuarial loss |
|
| (164 | ) |
|
| (295 | ) |
|
| (528 | ) | ||||||||||||
Prior service credit |
|
| 431 |
|
|
| 503 |
|
|
| 552 |
| ||||||||||||
Total recognized in other comprehensive income (loss) |
|
| 1,320 |
|
|
| (509 | ) |
|
| (1,221 | ) | ||||||||||||
Total recognized in net periodic benefit cost and other comprehensive income (loss) |
| $ | 1,558 |
|
| $ | (45 | ) |
| $ | (474 | ) | ||||||||||||
Reversal of amortization items: |
|
|
|
|
|
|
|
|
| |||||||||||||||
Net actuarial gain (loss) |
|
| 200 |
|
|
| 152 |
|
|
| (115 | ) | ||||||||||||
Prior service (cost) credit |
|
| (114 | ) |
|
| (89 | ) |
|
| 6 |
| ||||||||||||
Settlement income |
|
| — |
|
|
| — |
|
|
| 65 |
| ||||||||||||
Total recognized in other comprehensive income |
|
| 211 |
|
|
| (1,968 | ) |
|
| (686 | ) | ||||||||||||
Total recognized in net periodic benefit cost and other |
| $ | 493 |
|
| $ | (1,818 | ) |
| $ | (391 | ) | ||||||||||||
The following table indicates the funded status of the plans as of December 31:
|
|
|
|
|
|
|
|
|
|
|
|
|
| Postretirement |
| |||||||||
|
| Funded Plans |
|
| Unfunded Plans |
|
| Benefit Plans |
| |||||||||||||||
(in thousands) |
| 2023 |
|
| 2022 |
|
| 2023 |
|
| 2022 |
|
| 2023 |
|
| 2022 |
| ||||||
Change in benefit obligation: |
|
|
|
|
|
|
|
|
|
|
|
|
|
|
|
|
|
| ||||||
Benefit obligation at beginning of year |
| $ | 11,454 |
|
| $ | 15,191 |
|
| $ | 5,966 |
|
| $ | 9,170 |
|
| $ | 7,723 |
|
| $ | 10,134 |
|
Service cost |
|
| — |
|
|
| — |
|
|
| — |
|
|
| — |
|
|
| 21 |
|
|
| 34 |
|
Interest cost |
|
| 555 |
|
|
| 321 |
|
|
| 290 |
|
|
| 157 |
|
|
| 347 |
|
|
| 179 |
|
Plan amendments |
|
| — |
|
|
| (518 | ) |
|
| — |
|
|
| — |
|
|
| — |
|
|
| 509 |
|
Actuarial adjustments |
|
| 232 |
|
|
| (2,621 | ) |
|
| 163 |
|
|
| (2,815 | ) |
|
| 125 |
|
|
| (2,540 | ) |
Benefits paid |
|
| (821 | ) |
|
| (919 | ) |
|
| (585 | ) |
|
| (546 | ) |
|
| (517 | ) |
|
| (593 | ) |
Benefit obligation at end of year |
|
| 11,420 |
|
|
| 11,454 |
|
|
| 5,834 |
|
|
| 5,966 |
|
|
| 7,699 |
|
|
| 7,723 |
|
Change in plan assets: |
|
|
|
|
|
|
|
|
|
|
|
|
|
|
|
|
|
| ||||||
Fair value of plan assets at beginning of year |
|
| 9,110 |
|
|
| 11,647 |
|
|
| — |
|
|
| — |
|
|
| — |
|
|
| — |
|
Actual return on plan assets |
|
| 323 |
|
|
| (2,120 | ) |
|
| — |
|
|
| — |
|
|
| — |
|
|
| — |
|
Company contributions |
|
| 510 |
|
|
| 502 |
|
|
| 585 |
|
|
| 546 |
|
|
| 517 |
|
|
| 593 |
|
Benefits paid |
|
| (821 | ) |
|
| (919 | ) |
|
| (585 | ) |
|
| (546 | ) |
|
| (517 | ) |
|
| (593 | ) |
Fair value of plan assets at end of year |
|
| 9,122 |
|
|
| 9,110 |
|
|
| — |
|
|
| — |
|
|
| — |
|
|
| — |
|
Funded status at end of year |
| $ | (2,298 | ) |
| $ | (2,344 | ) |
| $ | (5,834 | ) |
| $ | (5,966 | ) |
| $ | (7,699 | ) |
| $ | (7,723 | ) |
|
|
|
|
|
|
|
|
|
|
|
|
|
|
|
|
|
| Postretirement |
| |||||
|
| Funded Plans |
|
| Unfunded Plans |
|
| Benefit Plans |
| |||||||||||||||
(in thousands) |
| 2017 |
|
| 2016 |
|
| 2017 |
|
| 2016 |
|
| 2017 |
|
| 2016 |
| ||||||
Change in benefit obligation: |
|
|
|
|
|
|
|
|
|
|
|
|
|
|
|
|
|
|
|
|
|
|
|
|
Benefit obligation at beginning of year |
| $ | 15,027 |
|
| $ | 14,906 |
|
| $ | 9,825 |
|
| $ | 10,049 |
|
| $ | 13,619 |
|
| $ | 14,573 |
|
Service cost |
|
| — |
|
|
| — |
|
|
| 64 |
|
|
| 97 |
|
|
| 92 |
|
|
| 99 |
|
Interest cost |
|
| 492 |
|
|
| 629 |
|
|
| 311 |
|
|
| 403 |
|
|
| 413 |
|
|
| 573 |
|
Actuarial adjustments |
|
| 618 |
|
|
| 240 |
|
|
| 175 |
|
|
| (221 | ) |
|
| 237 |
|
|
| (790 | ) |
Plan amendments |
|
| — |
|
|
| — |
|
|
| — |
|
|
| — |
|
|
| 816 |
|
|
| 73 |
|
Benefits paid |
|
| (697 | ) |
|
| (748 | ) |
|
| (518 | ) |
|
| (503 | ) |
|
| (1,370 | ) |
|
| (909 | ) |
Benefit obligation at end of year |
|
| 15,440 |
|
|
| 15,027 |
|
|
| 9,857 |
|
|
| 9,825 |
|
|
| 13,807 |
|
|
| 13,619 |
|
Change in plan assets: |
|
|
|
|
|
|
|
|
|
|
|
|
|
|
|
|
|
|
|
|
|
|
|
|
Fair value of plan assets at beginning of year |
|
| 10,416 |
|
|
| 10,479 |
|
|
| — |
|
|
| — |
|
|
| — |
|
|
| — |
|
Actual return on plan assets |
|
| 855 |
|
|
| 273 |
|
|
| — |
|
|
| — |
|
|
| — |
|
|
| — |
|
Company contributions |
|
| 1,016 |
|
|
| 412 |
|
|
| 518 |
|
|
| 503 |
|
|
| 1,370 |
|
|
| 909 |
|
Benefits paid |
|
| (697 | ) |
|
| (748 | ) |
|
| (518 | ) |
|
| (503 | ) |
|
| (1,370 | ) |
|
| (909 | ) |
Fair value of plan assets at end of year |
|
| 11,590 |
|
|
| 10,416 |
|
|
| — |
|
|
| — |
|
|
| — |
|
|
| — |
|
Funded status at end of year |
| $ | (3,850 | ) |
| $ | (4,611 | ) |
| $ | (9,857 | ) |
| $ | (9,825 | ) |
| $ | (13,807 | ) |
| $ | (13,619 | ) |
The net amounts recognized in the Consolidated Balance Sheets under the captioncaptions “Pension and postretirement benefits” and “Other Current Liabilities” as of December 31 are as follows:
|
|
|
|
|
|
|
|
|
|
|
|
|
| Postretirement |
| |||||||||
|
| Funded Plans |
|
| Unfunded Plans |
|
| Benefit Plans |
| |||||||||||||||
(in thousands) |
| 2023 |
|
| 2022 |
|
| 2023 |
|
| 2022 |
|
| 2023 |
|
| 2022 |
| ||||||
Non-current assets |
| $ | — |
|
| $ | (205 | ) |
| $ | — |
|
| $ | — |
|
| $ | — |
|
| $ | — |
|
Other current liabilities |
|
| — |
|
|
| — |
|
|
| 566 |
|
|
| 570 |
|
|
| 659 |
|
|
| 687 |
|
Non-current liabilities |
|
| 2,298 |
|
|
| 2,549 |
|
|
| 5,268 |
|
|
| 5,396 |
|
|
| 7,040 |
|
|
| 7,036 |
|
Net amount recognized |
| $ | 2,298 |
|
| $ | 2,344 |
|
| $ | 5,834 |
|
| $ | 5,966 |
|
| $ | 7,699 |
|
| $ | 7,723 |
|
|
|
|
|
|
|
|
|
|
|
|
|
|
|
|
|
|
| Postretirement |
| |||||
|
| Funded Plans |
|
| Unfunded Plans |
|
| Benefit Plans |
| |||||||||||||||
(in thousands) |
| 2017 |
|
| 2016 |
|
| 2017 |
|
| 2016 |
|
| 2017 |
|
| 2016 |
| ||||||
Other current liabilities |
| $ | — |
|
| $ | — |
|
| $ | 809 |
|
| $ | 699 |
|
| $ | 1,112 |
|
| $ | 1,094 |
|
Non-current liabilities |
|
| 3,850 |
|
|
| 4,611 |
|
|
| 9,048 |
|
|
| 9,126 |
|
|
| 12,695 |
|
|
| 12,525 |
|
Net amount recognized |
| $ | 3,850 |
|
| $ | 4,611 |
|
| $ | 9,857 |
|
| $ | 9,825 |
|
| $ | 13,807 |
|
| $ | 13,619 |
|
62
VIAD CORP
NOTES TO CONSOLIDATED FINANCIAL STATEMENTS (CONTINUED)
Amounts recognized in AOCI as of December 31 are as follows:
|
|
|
|
|
|
|
|
|
|
|
|
|
| Postretirement |
|
|
|
|
|
|
| |||||||||||
|
| Funded Plans |
|
| Unfunded Plans |
|
| Benefit Plans |
|
| Total |
|
| Total |
| |||||||||||||||||
(in thousands) |
| 2023 |
|
| 2022 |
|
| 2023 |
|
| 2022 |
|
| 2023 |
|
| 2022 |
|
| 2023 |
|
| 2022 |
| ||||||||
Net actuarial loss (gain) |
| $ | 6,695 |
|
| $ | 6,926 |
|
| $ | 400 |
|
| $ | 261 |
|
| $ | (764 | ) |
| $ | (1,088 | ) |
| $ | 6,331 |
|
| $ | 6,099 |
|
Prior service (credit) cost |
|
| (480 | ) |
|
| (518 | ) |
|
| — |
|
|
| — |
|
|
| 500 |
|
|
| 613 |
|
|
| 20 |
|
|
| 95 |
|
Subtotal |
|
| 6,215 |
|
|
| 6,408 |
|
|
| 400 |
|
|
| 261 |
|
|
| (264 | ) |
|
| (475 | ) |
|
| 6,351 |
|
|
| 6,194 |
|
Less tax effect |
|
| — |
|
|
| — |
|
|
| — |
|
|
| — |
|
|
| — |
|
|
| — |
|
|
| — |
|
|
| — |
|
Total |
| $ | 6,215 |
|
| $ | 6,408 |
|
| $ | 400 |
|
| $ | 261 |
|
| $ | (264 | ) |
| $ | (475 | ) |
| $ | 6,351 |
|
| $ | 6,194 |
|
|
|
|
|
|
|
|
|
|
|
|
|
|
|
|
|
|
| Postretirement |
|
|
|
|
|
|
|
|
| |||||
|
| Funded Plans |
|
| Unfunded Plans |
|
| Benefit Plans |
|
| Total |
|
| Total |
| |||||||||||||||||
(in thousands) |
| 2017 |
|
| 2016 |
|
| 2017 |
|
| 2016 |
|
| 2017 |
|
| 2016 |
|
| 2017 |
|
| 2016 |
| ||||||||
Net actuarial loss |
| $ | 8,681 |
|
| $ | 9,090 |
|
| $ | 2,587 |
|
| $ | 2,496 |
|
| $ | 2,784 |
|
| $ | 2,710 |
|
| $ | 14,052 |
|
| $ | 14,296 |
|
Prior service credit |
|
| — |
|
|
| — |
|
|
| — |
|
|
| — |
|
|
| (351 | ) |
|
| (1,598 | ) |
|
| (351 | ) |
|
| (1,598 | ) |
Subtotal |
|
| 8,681 |
|
|
| 9,090 |
|
|
| 2,587 |
|
|
| 2,496 |
|
|
| 2,433 |
|
|
| 1,112 |
|
|
| 13,701 |
|
|
| 12,698 |
|
Less tax effect |
|
| (3,292 | ) |
|
| (3,447 | ) |
|
| (981 | ) |
|
| (947 | ) |
|
| (923 | ) |
|
| (422 | ) |
|
| (5,196 | ) |
|
| (4,816 | ) |
Total |
| $ | 5,389 |
|
| $ | 5,643 |
|
| $ | 1,606 |
|
| $ | 1,549 |
|
| $ | 1,510 |
|
| $ | 690 |
|
| $ | 8,505 |
|
| $ | 7,882 |
|
The estimated net actuarial loss for the postretirement benefit plans that is expected to be amortized from AOCI into net periodic benefit cost in 2018 is approximately $0.2 million. The estimated prior service credit for the postretirement benefit plans that is expected to be amortized from AOCI into net periodic benefit credit in 2018 is approximately $0.2 million.
The estimated net actuarial loss that is expected to be amortized from AOCI into net periodic benefit cost in 2018 is approximately $0.1 million for the unfunded benefit plans and $0.4 million for the funded benefit plans.
The fair value of the domestic plans’ assets by asset class are as follows:
|
|
|
|
|
| Fair Value Measurements at December 31, 2017 |
|
|
|
|
| Fair Value Measurements at December 31, 2023 |
| |||||||||||||||||||
|
|
|
|
|
| Quoted Prices in Active Markets |
|
| Significant Other Observable Inputs |
|
| Significant Unobservable Inputs |
|
|
|
|
| Quoted Prices |
|
| Significant |
|
| Significant |
| |||||||
(in thousands) |
| Total |
|
| (Level 1) |
|
| (Level 2) |
|
| (Level 3) |
|
| Total |
|
| (Level 1) |
|
| (Level 2) |
|
| (Level 3) |
| ||||||||
Domestic pension plans: |
|
|
|
|
|
|
|
|
|
|
|
|
|
|
|
|
|
|
|
|
|
|
|
|
| |||||||
Fixed income securities |
| $ | 5,787 |
|
| $ | 5,787 |
|
| $ | — |
|
| $ | — |
|
| $ | 5,205 |
|
| $ | 5,205 |
|
| $ | — |
|
| $ | — |
|
Equity securities |
|
| 5,390 |
|
|
| 5,390 |
|
|
| — |
|
|
| — |
|
|
| 3,094 |
|
|
| 3,094 |
|
|
| — |
|
|
| — |
|
Cash |
|
| 214 |
|
|
| 214 |
|
|
| — |
|
|
| — |
|
|
| 823 |
|
|
| 823 |
|
|
| — |
|
|
| — |
|
Other |
|
| 199 |
|
|
| — |
|
|
| 199 |
|
|
| — |
| ||||||||||||||||
Total |
| $ | 11,590 |
|
| $ | 11,391 |
|
| $ | 199 |
|
| $ | — |
|
| $ | 9,122 |
|
| $ | 9,122 |
|
| $ | — |
|
| $ | — |
|
|
|
|
|
| Fair Value Measurements at December 31, 2022 |
| ||||||||||
|
|
|
|
| Quoted Prices |
|
| Significant |
|
| Significant |
| ||||
(in thousands) |
| Total |
|
| (Level 1) |
|
| (Level 2) |
|
| (Level 3) |
| ||||
Domestic pension plans: |
|
|
|
|
|
|
|
|
|
|
|
| ||||
Fixed income securities |
| $ | 5,452 |
|
| $ | 5,452 |
|
| $ | — |
|
| $ | — |
|
Equity securities |
|
| 3,473 |
|
|
| 3,473 |
|
|
| — |
|
|
| — |
|
Cash |
|
| 185 |
|
|
| 185 |
|
|
| — |
|
|
| — |
|
Total |
| $ | 9,110 |
|
| $ | 9,110 |
|
| $ | — |
|
| $ | — |
|
|
|
|
|
|
| Fair Value Measurements at December 31, 2016 |
| |||||||||
|
|
|
|
|
| Quoted Prices in Active Markets |
|
| Significant Other Observable Inputs |
|
| Significant Unobservable Inputs |
| |||
(in thousands) |
| Total |
|
| (Level 1) |
|
| (Level 2) |
|
| (Level 3) |
| ||||
Domestic pension plans: |
|
|
|
|
|
|
|
|
|
|
|
|
|
|
|
|
Fixed income securities |
| $ | 5,352 |
|
| $ | 5,352 |
|
| $ | — |
|
| $ | — |
|
Equity securities |
|
| 4,580 |
|
|
| 4,580 |
|
|
| — |
|
|
| — |
|
Cash |
|
| 280 |
|
|
| 280 |
|
|
| — |
|
|
| — |
|
Other |
|
| 204 |
|
|
| — |
|
|
| 204 |
|
|
| — |
|
Total |
| $ | 10,416 |
|
| $ | 10,212 |
|
| $ | 204 |
|
| $ | — |
|
We employ a total return investment approach whereby a mix of equities and fixed income securities is used to maximize the long-term return of plan assets for a prudent level of risk. Risk tolerance is established through careful consideration of plan liabilities, plan funded status, and corporate financial condition. The investment portfolio contains a diversified blend of equity and fixed income securities. Furthermore, equity securities are diversified across U.S.United States and non-U.S.non-United States stocks, as well as growth and value. Investment risk is measured and monitored on an ongoing basis through quarterly investment portfolio reviews and annual liability measurements.
We utilize a building-block approach in determining the long-term expected rate of return on plan assets. Historical markets are studied and long-term historical relationships between equity securities and fixed income securities are preserved consistent with the widely accepted capital market principle that assets with higher volatility generate a greater return over the long run. Current market factors such as inflation and interest rates are evaluated before long-term capital market assumptions are determined. The long-term portfolio return also considers diversification and rebalancing. Peer data and historical returns are reviewed relative to our assumed rates for reasonableness and appropriateness.
63
VIAD CORP
NOTES TO CONSOLIDATED FINANCIAL STATEMENTS (CONTINUED)
The following pension and postretirement benefit payments, which reflect expected future service, as appropriate, are expected to be paid:
(in thousands) |
| Funded Plans |
|
| Unfunded Plans |
|
| Postretirement Benefit Plans |
| |||
2018 |
| $ | 1,434 |
|
| $ | 823 |
|
| $ | 1,132 |
|
2019 |
| $ | 927 |
|
| $ | 738 |
|
| $ | 1,127 |
|
2020 |
| $ | 997 |
|
| $ | 740 |
|
| $ | 1,100 |
|
2021 |
| $ | 921 |
|
| $ | 725 |
|
| $ | 1,066 |
|
2022 |
| $ | 990 |
|
| $ | 709 |
|
| $ | 1,039 |
|
2023-2027 |
| $ | 4,859 |
|
| $ | 3,259 |
|
| $ | 4,685 |
|
(in thousands) |
| Funded |
|
| Unfunded |
|
| Postretirement |
| |||
2024 |
| $ | 985 |
|
| $ | 580 |
|
| $ | 675 |
|
2025 |
| $ | 1,035 |
|
| $ | 563 |
|
| $ | 688 |
|
2026 |
| $ | 1,013 |
|
| $ | 547 |
|
| $ | 694 |
|
2027 |
| $ | 957 |
|
| $ | 528 |
|
| $ | 675 |
|
2028 |
| $ | 948 |
|
| $ | 509 |
|
| $ | 654 |
|
2029-2033 |
| $ | 4,290 |
|
| $ | 2,213 |
|
| $ | 2,760 |
|
Foreign Pension Plans
Certain of our foreign operations also maintain defined benefit pension plans held in trust for certain employees which are funded by the companies, and unfunded defined benefit pension plans providing supplemental benefits to select management employees. These plans use traditional defined benefit formulas based on years of service and final average compensation.
Funding policies provide that payments to defined benefit pension trusts shall be at least equal to the minimum funding required by applicable regulations. The components of net periodic benefit cost and other amounts recognized in other comprehensive income (loss) included the following:
|
| December 31, |
|
| December 31, |
| ||||||||||||||||||
(in thousands) |
| 2017 |
|
| 2016 |
|
| 2015 |
|
| 2023 |
|
| 2022 |
|
| 2021 |
| ||||||
Net periodic benefit cost: |
|
|
|
|
|
|
|
|
|
|
|
|
|
|
|
|
|
|
|
| ||||
Service cost |
| $ | 530 |
|
| $ | 488 |
|
| $ | 503 |
|
| $ | 176 |
|
| $ | 280 |
|
| $ | 457 |
|
Interest cost |
|
| 492 |
|
|
| 488 |
|
|
| 505 |
|
|
| 391 |
|
|
| 361 |
|
|
| 339 |
|
Expected return on plan assets |
|
| (602 | ) |
|
| (558 | ) |
|
| (583 | ) |
|
| (345 | ) |
|
| (393 | ) |
|
| (508 | ) |
Recognized net actuarial loss |
|
| 155 |
|
|
| 162 |
|
|
| 160 |
|
|
| 105 |
|
|
| 105 |
|
|
| 171 |
|
Settlement |
|
| 777 |
|
|
| — |
|
|
| — |
|
|
| — |
|
|
| 593 |
|
|
| — |
|
Net periodic benefit cost |
|
| 1,352 |
|
|
| 580 |
|
|
| 585 |
|
|
| 327 |
|
|
| 946 |
|
|
| 459 |
|
Other changes in plan assets and benefit obligations recognized in other comprehensive income (loss): |
|
|
|
|
|
|
|
|
|
|
|
|
|
|
|
|
|
|
|
|
| |||
Net actuarial loss |
|
| (106 | ) |
|
| 158 |
|
|
| 182 |
| ||||||||||||
Net actuarial (income) loss |
|
| 11 |
|
|
| (724 | ) |
|
| (375 | ) | ||||||||||||
Reversal of amortization of net actuarial loss |
|
| (155 | ) |
|
| (162 | ) |
|
| (160 | ) |
|
| (105 | ) |
|
| (105 | ) |
|
| (171 | ) |
Total recognized in other comprehensive income (loss) |
|
| (261 | ) |
|
| (4 | ) |
|
| 22 |
| ||||||||||||
Total recognized in net periodic benefit cost and other comprehensive income |
| $ | 1,091 |
|
| $ | 576 |
|
| $ | 607 |
| ||||||||||||
Total recognized in other comprehensive income |
|
| (94 | ) |
|
| (829 | ) |
|
| (546 | ) | ||||||||||||
Total recognized in net periodic benefit cost and other |
| $ | 233 |
|
| $ | 117 |
|
| $ | (87 | ) | ||||||||||||
64
VIAD CORP
NOTES TO CONSOLIDATED FINANCIAL STATEMENTS (CONTINUED)
The following table represents the funded status of the plans as of December 31:
|
| Funded Plans |
|
| Unfunded Plans |
| ||||||||||
(in thousands) |
| 2023 |
|
| 2022 |
|
| 2023 |
|
| 2022 |
| ||||
Change in benefit obligation: |
|
|
|
|
|
|
|
|
|
|
|
| ||||
Benefit obligation at beginning of year |
| $ | 6,085 |
|
| $ | 10,790 |
|
| $ | 1,957 |
|
| $ | 2,470 |
|
Service cost |
|
| 176 |
|
|
| 280 |
|
|
| — |
|
|
| — |
|
Interest cost |
|
| 303 |
|
|
| 283 |
|
|
| 88 |
|
|
| 78 |
|
Actuarial adjustments |
|
| 382 |
|
|
| (1,682 | ) |
|
| (98 | ) |
|
| (268 | ) |
Benefits paid |
|
| (525 | ) |
|
| (392 | ) |
|
| (174 | ) |
|
| (176 | ) |
Settlements |
|
| — |
|
|
| (2,616 | ) |
|
| — |
|
|
| — |
|
Translation adjustment |
|
| 66 |
|
|
| (578 | ) |
|
| 28 |
|
|
| (147 | ) |
Benefit obligation at end of year |
|
| 6,487 |
|
|
| 6,085 |
|
|
| 1,801 |
|
|
| 1,957 |
|
Change in plan assets: |
|
|
|
|
|
|
|
|
|
|
|
| ||||
Fair value of plan assets at beginning of year |
|
| 6,200 |
|
|
| 11,171 |
|
|
| — |
|
|
| — |
|
Actual return on plan assets |
|
| 643 |
|
|
| (1,597 | ) |
|
| — |
|
|
| — |
|
Company contributions |
|
| (17 | ) |
|
| 222 |
|
|
| 174 |
|
|
| 176 |
|
Benefits paid |
|
| (525 | ) |
|
| (392 | ) |
|
| (174 | ) |
|
| (176 | ) |
Settlements |
|
| — |
|
|
| (2,616 | ) |
|
| — |
|
|
| — |
|
Translation adjustment |
|
| 66 |
|
|
| (588 | ) |
|
| — |
|
|
| — |
|
Fair value of plan assets at end of year |
|
| 6,367 |
|
|
| 6,200 |
|
|
| — |
|
|
| — |
|
Funded status at end of year |
| $ | (120 | ) |
| $ | 115 |
|
| $ | (1,801 | ) |
| $ | (1,957 | ) |
|
| Funded Plans |
|
| Unfunded Plans |
| ||||||||||
(in thousands) |
| 2017 |
|
| 2016 |
|
| 2017 |
|
| 2016 |
| ||||
Change in benefit obligation: |
|
|
|
|
|
|
|
|
|
|
|
|
|
|
|
|
Benefit obligation at beginning of year |
| $ | 10,488 |
|
| $ | 9,744 |
|
| $ | 2,486 |
|
| $ | 2,470 |
|
Service cost |
|
| 530 |
|
|
| 488 |
|
|
| — |
|
|
| — |
|
Interest cost |
|
| 406 |
|
|
| 400 |
|
|
| 87 |
|
|
| 87 |
|
Actuarial adjustments |
|
| 658 |
|
|
| 395 |
|
|
| (54 | ) |
|
| 105 |
|
Benefits paid |
|
| (3,231 | ) |
|
| (818 | ) |
|
| (182 | ) |
|
| (177 | ) |
Translation adjustment |
|
| 670 |
|
|
| 279 |
|
|
| 245 |
|
|
| 1 |
|
Benefit obligation at end of year |
|
| 9,521 |
|
|
| 10,488 |
|
|
| 2,582 |
|
|
| 2,486 |
|
Change in plan assets: |
|
|
|
|
|
|
|
|
|
|
|
|
|
|
|
|
Fair value of plan assets at beginning of year |
|
| 10,576 |
|
|
| 9,705 |
|
|
| — |
|
|
| — |
|
Actual return on plan assets |
|
| 764 |
|
|
| 617 |
|
|
| — |
|
|
| — |
|
Company contributions |
|
| 710 |
|
|
| 795 |
|
|
| 182 |
|
|
| 177 |
|
Benefits paid |
|
| (3,231 | ) |
|
| (818 | ) |
|
| (182 | ) |
|
| (177 | ) |
Translation adjustment |
|
| 674 |
|
|
| 277 |
|
|
| — |
|
|
| — |
|
Fair value of plan assets at end of year |
|
| 9,493 |
|
|
| 10,576 |
|
|
| — |
|
|
| — |
|
Funded status at end of year |
| $ | (28 | ) |
| $ | 88 |
|
| $ | (2,582 | ) |
| $ | (2,486 | ) |
The net amounts recognized in the Consolidated Balance Sheets under the captioncaptions “Pension and postretirement benefits” and “Other Current Liabilities” as of December 31 were as follows:
|
| Funded Plans |
|
| Unfunded Plans |
|
| Funded Plans |
|
| Unfunded Plans |
| ||||||||||||||||||||
(in thousands) |
| 2017 |
|
| 2016 |
|
| 2017 |
|
| 2016 |
|
| 2023 |
|
| 2022 |
|
| 2023 |
|
| 2022 |
| ||||||||
Non-current assets |
| $ | (15 | ) |
| $ | (88 | ) |
| $ | — |
|
| $ | — |
|
| $ | (101 | ) |
| $ | (115 | ) |
| $ | — |
|
| $ | — |
|
Other current liabilities |
|
| — |
|
|
| — |
|
|
| 188 |
|
|
| 170 |
|
|
| — |
|
|
| — |
|
|
| 171 |
|
|
| 169 |
|
Non-current liabilities |
|
| 43 |
|
|
| — |
|
|
| 2,394 |
|
|
| 2,316 |
|
|
| 221 |
|
|
| — |
|
|
| 1,630 |
|
|
| 1,788 |
|
Net amount recognized |
| $ | 28 |
|
| $ | (88 | ) |
| $ | 2,582 |
|
| $ | 2,486 |
|
| $ | 120 |
|
| $ | (115 | ) |
| $ | 1,801 |
|
| $ | 1,957 |
|
Net actuarial losses for the foreign funded plans recognized in AOCI were $2.5$1.5 million ($1.81.2 million after-tax) as of December 31, 20172023 and $3.3$1.5 million ($2.51.2 million after-tax) as of December 31, 2016.2022. Net actuarial losses for the foreign unfunded plans recognized in AOCI were $0.7$0.5 million ($0.5 million after-tax) as of December 31, 20172023 and $0.4$0.6 million ($0.30.5 million after-tax) as of December 31, 2016.2022.
The fair value information related to the foreign pension plans’ assets is summarized in the following tables:
|
|
|
|
| Fair Value Measurements at Reporting Date Using |
| ||||||||||
(in thousands) |
| December 31, 2023 |
|
| Quoted Prices |
|
| Significant |
|
| Significant |
| ||||
Assets: |
|
|
|
|
|
|
|
|
|
|
|
| ||||
Fixed income securities |
| $ | 5,051 |
|
| $ | 5,051 |
|
| $ | — |
|
| $ | — |
|
Equity securities |
|
| 1,268 |
|
|
| 1,268 |
|
|
| — |
|
|
| — |
|
Cash |
|
| 48 |
|
|
| 48 |
|
|
| — |
|
|
| — |
|
Total |
| $ | 6,367 |
|
| $ | 6,367 |
|
| $ | — |
|
| $ | — |
|
|
|
|
|
|
| Fair Value Measurements at Reporting Date Using |
| |||||||||
(in thousands) |
| December 31, 2017 |
|
| Quoted Prices in Active Markets (Level 1) |
|
| Significant Other Observable Inputs (Level 2) |
|
| Significant Unobserved Inputs (Level 3) |
| ||||
Assets: |
|
|
|
|
|
|
|
|
|
|
|
|
|
|
|
|
Fixed income securities |
| $ | 4,414 |
|
| $ | 4,414 |
|
| $ | — |
|
| $ | — |
|
Equity securities |
|
| 4,889 |
|
|
| 4,466 |
|
|
| 423 |
|
|
| — |
|
Other |
|
| 190 |
|
|
| 190 |
|
|
| — |
|
|
| — |
|
Total |
| $ | 9,493 |
|
| $ | 9,070 |
|
| $ | 423 |
|
| $ | — |
|
65
VIAD CORP
NOTES TO CONSOLIDATED FINANCIAL STATEMENTS (CONTINUED)
|
|
|
|
| Fair Value Measurements at Reporting Date Using |
| ||||||||||
(in thousands) |
| December 31, 2022 |
|
| Quoted Prices |
|
| Significant |
|
| Significant |
| ||||
Assets: |
|
|
|
|
|
|
|
|
|
|
|
| ||||
Fixed income securities |
| $ | 3,965 |
|
| $ | 3,965 |
|
| $ | — |
|
| $ | — |
|
Equity securities |
|
| 2,036 |
|
|
| 2,036 |
|
|
| — |
|
|
| — |
|
Other |
|
| 199 |
|
|
| 199 |
|
|
| — |
|
|
| — |
|
Total |
| $ | 6,200 |
|
| $ | 6,200 |
|
| $ | — |
|
| $ | — |
|
|
|
|
|
|
| Fair Value Measurements at Reporting Date Using |
| |||||||||
(in thousands) |
| December 31, 2016 |
|
| Quoted Prices in Active Markets (Level 1) |
|
| Significant Other Observable Inputs (Level 2) |
|
| Significant Unobserved Inputs (Level 3) |
| ||||
Assets: |
|
|
|
|
|
|
|
|
|
|
|
|
|
|
|
|
Fixed income securities |
| $ | 4,082 |
|
| $ | 4,082 |
|
| $ | — |
|
| $ | — |
|
Equity securities |
|
| 4,518 |
|
|
| 4,130 |
|
|
| 388 |
|
|
| — |
|
Other |
|
| 1,976 |
|
|
| 1,976 |
|
|
| — |
|
|
| — |
|
Total |
| $ | 10,576 |
|
| $ | 10,188 |
|
| $ | 388 |
|
| $ | — |
|
The following payments, which reflect expected future service, as appropriate, are expected to be paid:
(in thousands) |
| Funded Plans |
|
| Unfunded Plans |
| ||
2018 |
| $ | 365 |
|
| $ | 191 |
|
2019 |
| $ | 376 |
|
| $ | 190 |
|
2020 |
| $ | 378 |
|
| $ | 190 |
|
2021 |
| $ | 396 |
|
| $ | 190 |
|
2022 |
| $ | 496 |
|
| $ | 189 |
|
2023-2027 |
| $ | 2,499 |
|
| $ | 935 |
|
(in thousands) |
| Funded |
|
| Unfunded |
| ||
2024 |
| $ | 375 |
|
| $ | 173 |
|
2025 |
| $ | 374 |
|
| $ | 172 |
|
2026 |
| $ | 370 |
|
| $ | 170 |
|
2027 |
| $ | 370 |
|
| $ | 168 |
|
2028 |
| $ | 365 |
|
| $ | 166 |
|
2029-2033 |
| $ | 2,012 |
|
| $ | 791 |
|
Information for Pension Plans with an Accumulated Benefit Obligation in Excess of Plan Assets
The accumulated benefit obligations in excess of plan assets as of December 31 were as follows:
|
| Domestic Plans |
|
| Domestic Plans |
| ||||||||||||||||||||||||||
|
| Funded Plans |
|
| Unfunded Plans |
|
| Funded Plans |
|
| Unfunded Plans |
| ||||||||||||||||||||
(in thousands) |
| 2017 |
|
| 2016 |
|
| 2017 |
|
| 2016 |
|
| 2023 |
|
| 2022 |
|
| 2023 |
|
| 2022 |
| ||||||||
Projected benefit obligation |
| $ | 15,440 |
|
| $ | 15,027 |
|
| $ | 9,857 |
|
| $ | 9,825 |
|
| $ | 11,420 |
|
| $ | 11,454 |
|
| $ | 5,834 |
|
| $ | 5,966 |
|
Accumulated benefit obligation |
| $ | 15,440 |
|
| $ | 15,027 |
|
| $ | 9,826 |
|
| $ | 9,737 |
|
| $ | 11,420 |
|
| $ | 11,454 |
|
| $ | 5,834 |
|
| $ | 5,966 |
|
Fair value of plan assets |
| $ | 11,590 |
|
| $ | 10,416 |
|
| $ | — |
|
| $ | — |
|
| $ | 9,122 |
|
| $ | 9,110 |
|
| $ | — |
|
| $ | — |
|
|
| Foreign Plans |
| |||||||||||||
|
| Funded Plans |
|
| Unfunded Plans |
| ||||||||||
(in thousands) |
| 2023 |
|
| 2022 |
|
| 2023 |
|
| 2022 |
| ||||
Projected benefit obligation |
| $ | 6,487 |
|
| $ | 6,085 |
|
| $ | 1,801 |
|
| $ | 1,957 |
|
Accumulated benefit obligation |
| $ | 6,079 |
|
| $ | 5,727 |
|
| $ | 1,801 |
|
| $ | 1,957 |
|
Fair value of plan assets |
| $ | 6,367 |
|
| $ | 6,200 |
|
| $ | — |
|
| $ | — |
|
|
| Foreign Plans |
| |||||||||||||
|
| Funded Plans |
|
| Unfunded Plans |
| ||||||||||
(in thousands) |
| 2017 |
|
| 2016 |
|
| 2017 |
|
| 2016 |
| ||||
Projected benefit obligation |
| $ | 9,521 |
|
| $ | 10,488 |
|
| $ | 2,582 |
|
| $ | 2,486 |
|
Accumulated benefit obligation |
| $ | 8,819 |
|
| $ | 9,906 |
|
| $ | 2,582 |
|
| $ | 2,486 |
|
Fair value of plan assets |
| $ | 9,493 |
|
| $ | 10,576 |
|
| $ | — |
|
| $ | — |
|
Contributions
In aggregate for both the domestic and foreign plans, we anticipate contributing $1.1$0.8 million to the funded pension plans, $1.0$0.8 million to the unfunded pension plans, and $1.1$0.7 million to the postretirement benefit plans in 2018.2024.
Weighted-average assumptions used to determine benefit obligations as of December 31 were as follows:
|
| Domestic Plans |
|
|
|
|
|
|
| |||||||||||||||||||||||
|
| Funded Plans |
|
| Unfunded Plans |
|
| Postretirement |
|
| Foreign Plans |
| ||||||||||||||||||||
|
| 2023 |
|
| 2022 |
|
| 2023 |
|
| 2022 |
|
| 2023 |
|
| 2022 |
|
| 2023 |
|
| 2022 |
| ||||||||
Discount rate |
|
| 4.94 | % |
|
| 5.13 | % |
|
| 4.94 | % |
|
| 5.13 | % |
|
| 4.98 | % |
|
| 5.17 | % |
|
| 4.28 | % |
|
| 4.68 | % |
Rate of compensation increase |
| N/A |
|
| N/A |
|
| N/A |
|
| N/A |
|
| N/A |
|
| N/A |
|
|
| 2.24 | % |
|
| 2.16 | % | ||||||
|
| Domestic Plans |
|
|
|
|
|
|
|
|
| |||||||||||||||||||||
|
| Funded Plans |
|
| Unfunded Plans |
|
| Postretirement Benefit Plans |
|
| Foreign Plans |
| ||||||||||||||||||||
|
| 2017 |
|
| 2016 |
|
| 2017 |
|
| 2016 |
|
| 2017 |
|
| 2016 |
|
| 2017 |
|
| 2016 |
| ||||||||
Discount rate |
|
| 3.63 | % |
|
| 4.12 | % |
|
| 3.55 | % |
|
| 3.99 | % |
|
| 3.59 | % |
|
| 4.08 | % |
|
| 3.15 | % |
|
| 3.52 | % |
Rate of compensation increase |
| N/A |
|
| N/A |
|
|
| 3.00 | % |
|
| 3.00 | % |
| N/A |
|
| N/A |
|
|
| 2.26 | % |
|
| 2.34 | % | ||||
66
VIAD CORP
NOTES TO CONSOLIDATED FINANCIAL STATEMENTS (CONTINUED)
Weighted-average assumptions used to determine net periodic benefit costs as of December 31 were as follows:
|
| Domestic Plans |
|
|
|
|
|
|
|
|
|
| Domestic Plans |
|
|
|
|
|
|
| ||||||||||||||||||||||||||||||||||||||||||||
|
| Funded Plans |
|
| Unfunded Plans |
|
| Postretirement Benefit Plans |
|
| Foreign Plans |
|
| Funded Plans |
|
| Unfunded Plans |
|
| Postretirement |
|
| Foreign Plans |
| ||||||||||||||||||||||||||||||||||||||||
|
| 2017 |
|
| 2016 |
|
| 2017 |
|
| 2016 |
|
| 2017 |
|
| 2016 |
|
| 2017 |
|
| 2016 |
|
| 2023 |
|
| 2022 |
|
| 2023 |
|
| 2022 |
|
| 2023 |
|
| 2022 |
|
| 2023 |
|
| 2022 |
| ||||||||||||||||
Discount rate |
|
| 4.07 | % |
|
| 4.33 | % |
|
| 3.99 | % |
|
| 4.25 | % |
|
| 4.08 | % |
|
| 4.30 | % |
|
| 3.71 | % |
|
| 3.77 | % |
|
| 5.13 | % |
|
| 2.73 | % |
|
| 5.13 | % |
|
| 2.73 | % |
|
| 5.17 | % |
|
| 2.85 | % |
|
| 4.67 | % |
|
| 4.71 | % |
Expected return on plan assets |
|
| 5.50 | % |
|
| 2.25 | % |
| N/A |
|
| N/A |
|
|
| 0.00 | % |
|
| 0.00 | % |
|
| 5.09 | % |
|
| 4.53 | % |
|
| 5.55 | % |
|
| 3.75 | % |
| N/A |
|
| N/A |
|
| N/A |
|
| N/A |
|
|
| 4.01 | % |
|
| 4.47 | % | ||||||
Rate of compensation increase |
| N/A |
|
| N/A |
|
|
| 3.00 | % |
|
| 3.00 | % |
| N/A |
|
| N/A |
|
|
| 2.26 | % |
|
| 2.34 | % |
| N/A |
|
| N/A |
|
| N/A |
|
| N/A |
|
| N/A |
|
| N/A |
|
|
| 2.24 | % |
|
| 2.16 | % | ||||||||||
The assumed health care cost trend rate used in measuring the December 31, 2017 accumulated postretirement benefit obligation was 7.5%, declining one-third percent each year to the ultimate rate of 4.5% by the year 2026 and remaining at that level thereafter. The assumed health care cost trend rate used in measuring the December 31, 2016 accumulated postretirement benefit obligation was 7.0%, declining one-quarter percent each year to the ultimate rate of 4.5% by the year 2026 and remaining at that level thereafter.
A one-percentage-point increase in the assumed health care cost trend rate for each year would increase the accumulated postretirement benefit obligation as of December 31, 2017 by approximately $1.4 million and the total of service and interest cost components by approximately $0.1 million. A one-percentage-point decrease in the assumed health care cost trend rate for each year would decrease the accumulated postretirement benefit obligation as of December 31, 2017 by approximately $1.1 million and the total of service and interest cost components by approximately $0.1 million.
Multi-employer Plans
We contribute to various defined benefit pension plans under the terms of collective-bargainingcollective bargaining agreements that cover our union-represented employees. The financial risks of participating in these multi-employer pension plans generally include the fact that assets contributed to the plan by one employer may be used to provide benefits to employees of other participating employers. Furthermore, if a participating employer ceases to contribute to the plan, the unfunded obligations of the plan may be borne by the remainingsolvent participating employers. In addition, if we were to discontinue participating in some of our multi-employer pension plans, we maycould be required to pay those plans a withdrawal liability amount based on the underfunded status of the plan. Currently, we do not anticipate triggering any withdrawal from any multi-employer pension plan to which we currently contribute. We also contribute to defined contribution plans pursuant to collective-bargainingcollective bargaining agreements, which are generally not subject to the funding risks inherent in defined benefit pension plans. The overall level of contributions to our multi-employer plans may significantly vary from year to year based on the demand for union-represented labor to support our operations. We do not have any minimum contribution requirements for future periods pursuant to our collective-bargainingcollective bargaining agreements for individually significant multi-employer plans.
Our participation in multi-employer pension plans for 20172023 is outlined in the following table. Unless otherwise noted, the most recent Pension Protection Act zone status available in 20172023 and 20162022 relates to the plan’s year end as of December 31, 20162022 and 2015,2021, respectively, and is based on information received from the plan. Among other factors, plans in the red zone are generally less than 65%65% funded, plans in the yellow zone are less than 80%80% funded, and plans in the green zone are at least 80%80% funded. The “FIP/RP Status Pending/Implemented” column indicates plans for which a financial improvement plan or a rehabilitation plan is either pending or has been implemented.
|
|
|
| Plan |
|
| Pension |
| FIP/RP |
| Viad Contributions |
|
| Surcharge Paid |
| Expiration | ||||||||||||
(in thousands) |
| EIN |
| No. |
|
| 2023 |
| 2022 |
|
|
| 2023 |
|
| 2022 |
|
| 2021 |
|
|
|
|
| ||||
Pension Fund: |
|
|
|
|
|
|
|
|
|
|
|
|
|
|
|
|
|
|
|
|
|
|
|
| ||||
Western Conference of Teamsters Pension Plan |
| 91-6145047 |
|
| 1 |
|
| Green |
| Green |
| No |
| $ | 5,113 |
|
| $ | 4,466 |
|
| $ | 2,571 |
|
| No |
| Continuous |
Chicago Regional Council of Carpenters Pension Fund |
| 36-6130207 |
|
| 1 |
|
| Green |
| Green |
| No |
|
| 2,257 |
|
|
| 2,255 |
|
|
| 658 |
|
| No |
| 5/31/2027 |
Southern California Local 831—Employer Pension Fund(1) |
| 95-6376874 |
|
| 1 |
|
| Green |
| Green |
| No |
|
| 1,964 |
|
|
| 1,181 |
|
|
| 302 |
|
| No |
| Continuous |
IBEW Local Union No 357 Pension Plan A |
| 88-6023284 |
|
| 1 |
|
| Green |
| Green |
| No |
|
| 1,061 |
|
|
| 912 |
|
|
| 628 |
|
| No |
| Continuous |
New England Teamsters & Trucking Industry Pension |
| 04-6372430 |
|
| 1 |
|
| Red |
| Red |
| Yes |
|
| 966 |
|
|
| 477 |
|
|
| 109 |
|
| No |
| 3/31/2027 |
Electrical Contractors Assoc. Chicago Local Union 134, IBEW Joint Pension Trust of Chicago Plan #2 |
| 51-6030753 |
|
| 2 |
|
| Green |
| Green |
| No |
|
| 902 |
|
|
| 384 |
|
|
| 306 |
|
| No |
| Continuous |
Southwest Carpenters Pension Trust |
| 95-6042875 |
|
| 1 |
|
| Green |
| Green |
| No |
|
| 599 |
|
|
| 573 |
|
|
| 352 |
|
| No |
| 7/31/2028 |
Machinery Movers Riggers & Mach Erect Local 136 Supplemental Retirement Plan(1) |
| 36-1416355 |
|
| 11 |
|
| Yellow |
| Yellow |
| Yes |
|
| 462 |
|
|
| 900 |
|
|
| 176 |
|
| Yes |
| 6/30/2024 |
All other funds(2) |
|
|
|
|
|
|
|
|
|
|
|
|
| 3,270 |
|
|
| 3,134 |
|
|
| 1,024 |
|
|
|
|
| |
Total contributions to defined benefit plans |
|
|
|
|
|
|
|
|
|
|
|
|
| 16,594 |
|
|
| 14,282 |
|
|
| 6,126 |
|
|
|
|
| |
Total contributions to other plans |
|
|
|
|
|
|
|
|
|
|
|
|
| 2,387 |
|
|
| 3,236 |
|
|
| 931 |
|
|
|
|
| |
Total contributions to multi-employer plans |
|
|
|
|
|
|
|
|
|
|
|
| $ | 18,981 |
|
| $ | 17,518 |
|
| $ | 7,057 |
|
|
|
|
| |
67
VIAD CORP
NOTES TO CONSOLIDATED FINANCIAL STATEMENTS (CONTINUED)
|
|
|
| Plan |
|
| Pension Protection Act Zone Status |
| FIP/RP Status Pending/ Implemented |
| Viad Contributions |
|
| Surcharge Paid |
| Expiration Date of Collective- Bargaining Agreement(s) | ||||||||||||
(in thousands) |
| EIN |
| No. |
|
| 2017 |
| 2016 |
|
|
| 2017 |
|
| 2016 |
|
| 2015 |
|
|
|
|
| ||||
Pension Fund: |
|
|
|
|
|
|
|
|
|
|
|
|
|
|
|
|
|
|
|
|
|
|
|
|
|
|
|
|
Western Conference of Teamsters Pension Plan |
| 91-6145047 |
|
| 1 |
|
| Green |
| Green |
| No |
| $ | 7,809 |
|
| $ | 6,684 |
|
| $ | 5,632 |
|
| No |
| 3/31/2020 |
Southern California Local 831—Employer Pension Fund(1) |
| 95-6376874 |
|
| 1 |
|
| Green |
| Green |
| No |
|
| 3,087 |
|
|
| 2,805 |
|
|
| 2,485 |
|
| No |
| 8/31/2019 |
Chicago Regional Council of Carpenters Pension Fund |
| 36-6130207 |
|
| 1 |
|
| Green |
| Yellow |
| Yes |
|
| 2,390 |
|
|
| 2,532 |
|
|
| 1,887 |
|
| No |
| 5/31/2019 |
IBEW Local Union No 357 Pension Plan A |
| 88-6023284 |
|
| 1 |
|
| Green |
| Green |
| No |
|
| 1,682 |
|
|
| 1,402 |
|
|
| 1,150 |
|
| No |
| 6/16/2018 |
Electrical Contractors Assoc. Chicago Local Union 134, IBEW Joint Pension Trust of Chicago Plan #2 |
| 51-6030753 |
|
| 2 |
|
| Green |
| Green |
| No |
|
| 1,099 |
|
|
| 845 |
|
|
| 1,190 |
|
| No |
| 6/6/2021 |
Central States, Southeast and Southwest Areas Pension Plan |
| 36-6044243 |
|
| 1 |
|
| Red |
| Red |
| Yes |
|
| 1,060 |
|
|
| 1,151 |
|
|
| 948 |
|
| No |
| 12/31/2018 |
Southern California IBEW-NECA Pension Fund |
| 95-6392774 |
|
| 1 |
|
| Yellow |
| Yellow |
| Yes |
|
| 905 |
|
|
| 701 |
|
|
| 835 |
|
| Yes |
| continuous |
Southwest Carpenters Pension Trust |
| 95-6042875 |
|
| 1 |
|
| Green |
| Green |
| No |
|
| 883 |
|
|
| 791 |
|
|
| 750 |
|
| No |
| 6/30/2018 |
New England Teamsters & Trucking Industry Pension |
| 04-6372430 |
|
| 1 |
|
| Red |
| Red |
| Yes |
|
| 772 |
|
|
| 552 |
|
|
| 381 |
|
| No |
| 3/31/2022 |
Machinery Movers Riggers & Mach Erect Local 136 Supplemental Retirement Plan(1) |
| 36-1416355 |
|
| 11 |
|
| Red |
| Red |
| Yes |
|
| 719 |
|
|
| 1,203 |
|
|
| 502 |
|
| Yes |
| 6/30/2019 |
Sign Pictorial & Display Industry Pension Plan(1) |
| 94-6278490 |
|
| 1 |
|
| Green |
| Green |
| No |
|
| 654 |
|
|
| 526 |
|
|
| 541 |
|
| No |
| 3/31/2018 |
All other funds(2) |
|
|
|
|
|
|
|
|
|
|
|
|
|
| 2,900 |
|
|
| 3,585 |
|
|
| 4,259 |
|
|
|
|
|
Total contributions to defined benefit plans |
|
|
|
|
|
|
|
|
|
|
|
|
|
| 23,960 |
|
|
| 22,777 |
|
|
| 20,560 |
|
|
|
|
|
Total contributions to other plans |
|
|
|
|
|
|
|
|
|
|
|
|
|
| 2,613 |
|
|
| 2,995 |
|
|
| 1,428 |
|
|
|
|
|
Total contributions to multi-employer plans |
|
|
|
|
|
|
|
|
|
|
|
|
| $ | 26,573 |
|
| $ | 25,772 |
|
| $ | 21,988 |
|
|
|
|
|
|
|
|
|
We match U.S.United States employee contributions to the 401(k) planPlan with shares of our common stock held in treasury up to 100%100% of the first 3%3% of a participant’s salary plus 50%50% of the next 2%2%. The expense associated with our match was $4.2$4.0 million for 2017, $3.92023, $3.5 million for 2016,2022, and $3.7$2.2 million for 2015. 2021.
Note 18. 20. Restructuring Charges
GES Consolidation
We have takenAs part of our efforts to drive efficiencies and simplify our business operations, we took certain restructuring actions designed to reduce our cost structure primarily withinsimplify and transform GES as well asfor greater profitability. These initiatives resulted in restructuring charges related to the elimination of certain positions and continuing to reduce our facility footprint at the corporate office. We implemented a strategic reorganization plan in order to consolidate the separate business units within GES U.S. We also consolidated facilities and streamlined our operations in the U.S., the United Kingdom, and Germany. As a result, we recorded restructuring charges in 2017, 2016, and 2015, primarily consisting of severance and related benefits as a result of workforce reductions and charges related to the consolidation and downsizing of facilities representing the remaining operating lease obligations (net of estimated sublease income) and related costs.GES.
Other Restructurings
We recorded restructuring charges in connection with the consolidation of certain support functions at our corporate headquarters and certain reorganization activities within Pursuit. These charges primarily consist of severance and related benefits due to headcount reductions and charges related to the downsizing of facilities.reductions.
Changes to the restructuring liability by major restructuring activity are as follows:
|
| GES |
|
| Other Restructurings |
|
|
|
| |||||||
(in thousands) |
| Severance & |
|
| Facilities |
|
| Severance & |
|
| Total |
| ||||
Balance at December 31, 2020 |
| $ | 2,440 |
|
| $ | 2,766 |
|
| $ | 24 |
|
| $ | 5,230 |
|
Restructuring charges |
|
| 1,829 |
|
|
| 4,107 |
|
|
| 130 |
|
|
| 6,066 |
|
Cash payments |
|
| (2,302 | ) |
|
| (3,506 | ) |
|
| (91 | ) |
|
| (5,899 | ) |
Non-cash items(1) |
|
| — |
|
|
| (1,906 | ) |
|
| — |
|
|
| (1,906 | ) |
Adjustment to liability |
|
| 9 |
|
|
| (28 | ) |
|
| (37 | ) |
|
| (56 | ) |
Balance at December 31, 2021 |
|
| 1,976 |
|
|
| 1,433 |
|
|
| 26 |
|
|
| 3,435 |
|
Restructuring charges |
|
| 624 |
|
|
| 2,351 |
|
|
| 84 |
|
|
| 3,059 |
|
Cash payments |
|
| (988 | ) |
|
| (863 | ) |
|
| (83 | ) |
|
| (1,934 | ) |
Non-cash items(1) |
|
| — |
|
|
| (1,167 | ) |
|
| — |
|
|
| (1,167 | ) |
Adjustment to liability |
|
| (3 | ) |
|
| 64 |
|
|
| (15 | ) |
|
| 46 |
|
Balance at December 31, 2022 |
|
| 1,609 |
|
|
| 1,818 |
|
|
| 12 |
|
|
| 3,439 |
|
Restructuring charges |
|
| 648 |
|
|
| 327 |
|
|
| 199 |
|
|
| 1,174 |
|
Cash payments |
|
| (623 | ) |
|
| (807 | ) |
|
| (213 | ) |
|
| (1,643 | ) |
Adjustment to liability |
|
| — |
|
|
| 40 |
|
|
| 2 |
|
|
| 42 |
|
Balance at December 31, 2023 |
| $ | 1,634 |
|
| $ | 1,378 |
|
| $ | — |
|
| $ | 3,012 |
|
|
| GES Consolidation |
|
| Other Restructurings |
|
|
|
|
| ||||||
(in thousands) |
| Severance & Employee Benefits |
|
| Facilities |
|
| Severance & Employee Benefits |
|
| Total |
| ||||
Balance at December 31, 2014 |
| $ | 543 |
|
| $ | 1,161 |
|
| $ | 240 |
|
| $ | 1,944 |
|
Restructuring charges |
|
| 1,767 |
|
|
| 587 |
|
|
| 602 |
|
|
| 2,956 |
|
Cash payments |
|
| (1,514 | ) |
|
| (457 | ) |
|
| (601 | ) |
|
| (2,572 | ) |
Adjustment to liability |
|
| (45 | ) |
|
| — |
|
|
| (7 | ) |
|
| (52 | ) |
Balance at December 31, 2015 |
|
| 751 |
|
|
| 1,291 |
|
|
| 234 |
|
|
| 2,276 |
|
Restructuring charges |
|
| 3,693 |
|
|
| 759 |
|
|
| 731 |
|
|
| 5,183 |
|
Cash payments |
|
| (2,170 | ) |
|
| (1,150 | ) |
|
| (546 | ) |
|
| (3,866 | ) |
Adjustment to liability |
|
| — |
|
|
| 192 |
|
|
| (3 | ) |
|
| 189 |
|
Balance at December 31, 2016 |
|
| 2,274 |
|
|
| 1,092 |
|
|
| 416 |
|
|
| 3,782 |
|
Restructuring charges |
|
| 442 |
|
|
| 265 |
|
|
| 297 |
|
|
| 1,004 |
|
Cash payments |
|
| (1,165 | ) |
|
| (550 | ) |
|
| (538 | ) |
|
| (2,253 | ) |
Adjustment to liability |
|
| — |
|
|
| — |
|
|
| 16 |
|
|
| 16 |
|
Balance at December 31, 2017 |
| $ | 1,551 |
|
| $ | 807 |
|
| $ | 191 |
|
| $ | 2,549 |
|
As of December 31, 2017,2023, $1.5 million of the liabilities related to severance and& employee benefits are expectedand $1.1 million of liabilities related to be paidfacilities will remain unpaid by the end of 2018. Additionally, the liability2024. The liabilities related to future lease paymentsfacilities primarily include dilapidations and non-lease expenses that will be paid over the remaining lease terms for GES.terms. Refer to Note 2224 – Segment Information for information regarding restructuring charges by segment.
68
VIAD CORP
NOTES TO CONSOLIDATED FINANCIAL STATEMENTS (CONTINUED)
We entered into operating leases for the use of certainThe balance sheet presentation of our offices,operating and finance leases is as follows:
|
|
|
| December 31, |
| |||||
(in thousands) |
| Classification on the Consolidated Balance Sheet |
| 2023 |
|
| 2022 |
| ||
Assets: |
|
|
|
|
|
|
|
| ||
Operating lease assets |
| Operating lease ROU assets |
| $ | 109,774 |
|
| $ | 102,777 |
|
Finance lease assets |
| Property and equipment, net |
|
| 57,120 |
|
|
| 57,534 |
|
Total lease assets |
|
|
| $ | 166,894 |
|
| $ | 160,311 |
|
|
|
|
|
|
|
|
|
| ||
Liabilities: |
|
|
|
|
|
|
|
| ||
Current: |
|
|
|
|
|
|
|
| ||
Operating lease obligations |
| Operating lease obligations |
| $ | 17,334 |
|
| $ | 13,463 |
|
Finance lease obligations |
| Current portion of debt and finance obligations |
|
| 2,742 |
|
|
| 2,978 |
|
Noncurrent: |
|
|
|
|
|
|
|
| ||
Operating lease obligations |
| Long-term operating lease obligations |
|
| 106,109 |
|
|
| 101,297 |
|
Finance lease obligations |
| Long-term debt and finance obligations |
|
| 61,187 |
|
|
| 61,751 |
|
Total lease liabilities |
|
|
| $ | 187,372 |
|
| $ | 179,489 |
|
The components of lease expense consisted of the following:
|
| Year Ended December 31, |
| |||||
(in thousands) |
| 2023 |
|
| 2022 |
| ||
Finance lease cost: |
|
|
|
|
|
| ||
Amortization of ROU assets |
| $ | 4,250 |
|
| $ | 4,264 |
|
Interest on lease liabilities |
|
| 5,677 |
|
|
| 5,817 |
|
Operating lease cost |
|
| 26,235 |
|
|
| 24,850 |
|
Short-term lease cost |
|
| 3,564 |
|
|
| 2,545 |
|
Variable lease cost |
|
| 5,291 |
|
|
| 5,566 |
|
Total lease cost, net |
| $ | 45,017 |
|
| $ | 43,042 |
|
Other information related to operating and finance leases are as follows:
|
| Year Ended December 31, |
| |||||
(in thousands) |
| 2023 |
|
| 2022 |
| ||
Cash paid for amounts included in the measurement of lease liabilities: |
|
|
|
|
|
| ||
Operating cash flows from operating leases |
| $ | 25,775 |
|
| $ | 23,024 |
|
Operating cash flows from finance leases |
| $ | 6,192 |
|
| $ | 6,089 |
|
Financing cash flows from finance leases |
| $ | 3,185 |
|
| $ | 3,845 |
|
ROU assets obtained in exchange for lease obligations: |
|
|
|
|
|
| ||
Operating leases |
| $ | 24,226 |
|
| $ | 24,050 |
|
Finance leases (1) |
| $ | 1,807 |
|
| $ | 5,139 |
|
|
| December 31, |
| |||||
|
| 2023 |
|
| 2022 |
| ||
Weighted-average remaining lease term (years): |
|
|
|
|
|
| ||
Operating leases |
|
| 7.64 |
|
|
| 8.51 |
|
Finance leases |
|
| 33.47 |
|
|
| 34.07 |
|
Weighted-average discount rate: |
|
|
|
|
|
| ||
Operating leases |
|
| 7.88 | % |
|
| 7.25 | % |
Finance leases |
|
| 9.17 | % |
|
| 9.12 | % |
69
VIAD CORP
NOTES TO CONSOLIDATED FINANCIAL STATEMENTS (CONTINUED)
As of December 31, 2017, our2023, the estimated future minimum rentallease payments under non-cancellable leases, excluding variable leases and related sublease rentals receivable with respect to non-cancelable operating leases with terms in excess of one year werevariable non-lease components, are as follows:
(in thousands) |
| Operating Leases |
|
| Finance Leases |
|
| Total |
| |||
2024 |
| $ | 26,110 |
|
| $ | 8,370 |
|
| $ | 34,480 |
|
2025 |
|
| 25,432 |
|
|
| 7,537 |
|
|
| 32,969 |
|
2026 |
|
| 24,461 |
|
|
| 6,839 |
|
|
| 31,300 |
|
2027 |
|
| 20,874 |
|
|
| 6,429 |
|
|
| 27,303 |
|
2028 |
|
| 15,017 |
|
|
| 6,094 |
|
|
| 21,111 |
|
Thereafter |
|
| 56,181 |
|
|
| 175,047 |
|
|
| 231,228 |
|
Total future lease payments |
|
| 168,075 |
|
|
| 210,316 |
|
|
| 378,391 |
|
Less: Amount representing interest |
|
| (44,632 | ) |
|
| (146,387 | ) |
|
| (191,019 | ) |
Present value of minimum lease payments |
|
| 123,443 |
|
|
| 63,929 |
|
|
| 187,372 |
|
Current portion |
|
| 17,334 |
|
|
| 2,742 |
|
|
| 20,076 |
|
Long-term portion |
| $ | 106,109 |
|
| $ | 61,187 |
|
| $ | 167,296 |
|
(in thousands) |
| Rental Payments |
|
| Receivable Under Subleases |
| ||
2018 |
| $ | 23,503 |
|
| $ | 2,627 |
|
2019 |
|
| 20,299 |
|
|
| 2,384 |
|
2020 |
|
| 17,265 |
|
|
| 2,209 |
|
2021 |
|
| 8,812 |
|
|
| 2,267 |
|
2022 |
|
| 5,555 |
|
|
| 2,195 |
|
Thereafter |
|
| 81,135 |
|
|
| 3,657 |
|
Total |
| $ | 156,569 |
|
| $ | 15,339 |
|
Net rent expense under operating leases consisted of the following:
|
| December 31, |
| |||||||||
(in thousands) |
| 2017 |
|
| 2016 |
|
| 2015 |
| |||
Minimum rentals |
| $ | 56,575 |
|
| $ | 48,465 |
|
| $ | 41,564 |
|
Sublease rentals |
|
| (1,525 | ) |
|
| (2,831 | ) |
|
| (3,457 | ) |
Total rentals, net |
| $ | 55,050 |
|
| $ | 45,634 |
|
| $ | 38,107 |
|
The aggregate annual maturities and the related amounts representing interest on capital lease obligations are included in Note 11 – Debt and Capital Lease Obligations.
As of December 31, 2017, 2023, the estimated future minimum rental income under non-cancellable leases, which includes rental income from facilities that we own, are as follows:
(in thousands) |
|
|
| |
2024 |
| $ | 2,842 |
|
2025 |
|
| 1,856 |
|
2026 |
|
| 1,605 |
|
2027 |
|
| 948 |
|
2028 |
|
| 771 |
|
Thereafter |
|
| 2,081 |
|
Total minimum rents |
| $ | 10,103 |
|
Lease Not Yet Commenced
As of December 31, 2023, we had aggregate purchase obligationsexecuted a facility lease for which we did not have control of $38.1 million relatedthe underlying assets. Accordingly, we did not record the lease liability and ROU asset on our Consolidated Balance Sheets. This lease is for a new FlyOver attraction, FlyOver Canada Toronto. The lease commencement date was originally planned for 2023, however, it has been postponed due to various licensing agreements, consultingpermitting and other contracted services.related delays. Upon commencement date, it will have a lease term of 20 years.
Note 20. 22. Litigation, Claims, Contingencies, and Other
We are plaintiffs or defendants toin various actions, proceedings, and pending claims, some of which involve, or may involve, compensatory, punitive, or other damages. Litigation is subject to many uncertainties and it is possible that some of the legal actions, proceedings, or claims could be decided against us. Although the amount of liability as of December 31, 20172023 with respect to theseunresolved legal matters is not ascertainable, we believe that any resulting liability, after taking into consideration amounts already provided for and insurance coverage, will not have a material effect on our business, financial position, or results of operations.
On July 18, 2020, an off-road Ice Explorer operated by our Pursuit business was involved in an accident while enroute to the Athabasca Glacier, resulting in three fatalities and multiple other serious injuries. We immediately reported the accident to our relevant insurance carriers, who have supported our investigation and subsequent claims relating to the accident. In May 2023, we resolved charges from the Canadian office of Occupational Health and Safety in relation to this accident, resulting in fines and related payments in an aggregate amount of $0.5 million Canadian dollars (approximately $0.3 million U.S. dollars). We continue to manage our legal defense of various claims from the victims and their families. In addition, we believe that our reserves and, subject to customary deductibles, our insurance coverage is sufficient to cover potential claims related to this accident.
We are subject to various U.S.United States federal, state, and foreign laws and regulations governing the prevention of pollution and the protection of the environment in the jurisdictions in which we have or had operations. If we fail to comply with these environmental laws and regulations, civil and criminal penalties could be imposed, and we could become subject to regulatory enforcement actions in the form of injunctions and cease and desist orders. As is the case with many companies, we also face exposure to actual or potential claims and lawsuits involving environmental matters relating to our past operations. As of December 31, 2017,2023, we had recorded environmental remediation liabilities of $2.4$2.2 million related to previously sold operations. Although we are a party to certain environmental disputes, we believe that any resulting liabilities, after taking into consideration amounts already provided for and insurance coverage, will not have a material effect on our financial position or results of operations.
70
VIAD CORP
NOTES TO CONSOLIDATED FINANCIAL STATEMENTS (CONTINUED)
As of December 31, 2017,2023, on behalf of our subsidiaries, we had certain obligations under guarantees to third parties. These guarantees are not subject to liability recognition in the consolidated financial statements and relate to leased facilities and equipment leases entered into by our subsidiary operations. We would generally be required to make payments to the respective third parties under these guarantees in the event that the related subsidiary could not meet its own payment obligations. The maximum potential amount of future payments that we would be required to make under all guarantees existing as of December 31, 20172023 would be $19.3approximately $85.2 million. These guarantees relate to our leased equipment and facilities through October 2027.January 2044. There are no recourse provisions that would enable us to recover from third parties any payments made under the guarantees. Furthermore, there are no collateral or similar arrangements wherebypursuant to which we could recover payments.
A significant number of our employees are unionized and we are a party to approximately 100 collective-bargaining collective bargaining agreements, with approximately one-third requiring renegotiation each year. If we are unable to reach an agreement with a union during the collective-bargainingcollective bargaining process, the union may call for a strike or work stoppage, which may, under certain circumstances, adversely impact our business and results of operations. We believe that relations with our employees are satisfactory and that collective-bargainingcollective bargaining agreements expiring in 20182024 will be renegotiated in the ordinary course of business without having a material adverse effect on our operations. We entered into showsite and warehouse agreements with the Chicago Teamsters Local 727, effective January 1, 2014, and those agreements contain provisions that allow the parties to re-open negotiation of the agreements on pension-related issues. We are in informal discussions regarding those issues with all relevant parties to resolve those issues in a manner that will be reasonable and equitable to employees, customers, and shareholders.business. Although our labor relations are currently stable, disruptions pending the outcome of the Chicago Teamsters Local 727 negotiations could occur, as they could with any collective-bargaining agreement negotiation, with the possibility of an adverse impact on the operating results of GES. Refer to Note 19 – Pension and Postretirement Benefits for additional information on specific union-related pension matters.
Our business contributes to various multi-employer pension plans based on obligations arising under collective-bargaining agreements covering our union-represented employees. Based upon the information available from plan administrators, we believe that several of these multi-employer plans are underfunded. The Pension Protection Act of 2006 requires pension plans underfunded at certain levels to reduce, over defined time periods, the underfunded status. In addition, under current laws, the termination of a plan, or a voluntary withdrawal from a plan by us, or a shrinking contribution base to a plan as a result of the insolvency or withdrawal of other contributing employers to such plan, would require us to make payments to such plan for our proportionate share of the plan’s unfunded vested liabilities. As of December 31, 2017, the amount of additional funding, if any, that we would be required to make related to multi-employer pension plans is not ascertainable.
We are self-insured up to certain limits for workers’ compensation employee health benefits,and general liabilities, which includes automobile, product and general liability, and client property loss claims. The aggregate amount of insurance liabilities (up to our retention limit) related to our continuing operations was $19.1$11.9 million as of December 31, 20172023, which includes $13.8$7.4 million related to workers’ compensation liabilities, and $5.3$4.5 million related to general/autogeneral liability claims. We have also retained and provided for certain workers’ compensation insurance liabilities in conjunction with previously sold businesses of $2.9$1.7 million as of December 31, 2017, related to workers’ compensation liabilities.2023. We are also self-insured for certain employee health benefits and the estimated employee health benefit claims incurred but not yet reported was $1.4 million as of December 31, 2023. Provisions for losses for claims incurred, including actuarially derived estimated claims incurred but not yet reported, are made based on our historical experience, claims frequency, and other factors. A change in the assumptions used could result in an adjustment to recorded liabilities. We have purchased insurance for amounts in excess of the self-insured levels, which generally range from $0.2$0.2 million to $0.5$0.5 million on a per claim basis. We do not maintain a self-insured retention pool fund as claims are paid from current cash resources at the time of settlement. Our net cash payments in connection with these insurance liabilities were $5.5$4.6 million for 2017, $5.02023, $5.3 million for 2016,2022, and $5.6$2.8 million for 2015.2021.
In addition, as of December 31, 2017,2023, we have recorded insurance liabilities of $10.4$7.8 million related to continuing operations, which represents the amount for which we remain the primary obligor after self-insured insurance limits, without taking into consideration the above-referenced insurance coverage. Of this total, $6.9$6.6 million is related to workers’ compensation liabilities and $3.5$1.2 million is related to general/auto liability claims, which areis recorded in other“Other deferred items and liabilitiesliabilities” in the Consolidated Balance Sheets with a corresponding receivable in other investments.“Other investments and assets.”
Note 23. Noncontrolling Interests – Redeemable and Non-redeemable
Note 21. Redeemable Noncontrolling Interestnoncontrolling interest
On November 3, 2017, we acquired the controlling interest (54.5%(54.5% of the common stock) in Esja, a private corporation in Reykjavik, Iceland, which is developingIceland. Subsequent to additional capital contributions, our equity ownership increased to 56.4% as of December 31, 2023. Through Esja and will operate a newits wholly-owned subsidiary, we are operating the FlyOver Iceland attraction.
The Esja acquisition contains a put option that gives the minority Esja shareholders have the right to sell (or “put”) their Esja shares to us based on a multiple of 5.0x EBITDA as calculated on the trailing 12 months from the most recently completed quarter before the put option exercise. The put option is only exercisable after 36 months of business operationAugust 2022 (the “Reference Date”), and ifin the event the FlyOver Iceland attraction has earned a minimum of €3.25 million in unadjusted EBITDA during the most recent fiscal year and during the trailing 12-month period prior to exercise (the “Put Option Condition”). The put option is exercisable during a period of 12 months following the Reference Date (the “Option Period”) and if the Put Option Condition has been met. If the Put Option Condition has not been met during the first Option Period, the Reference Date will be extended for an additional 12 months up to three times. If after 72 months, the FlyOver Iceland attraction has not achieved the Put Option Condition, the put option expires. If the Put Option Condition is met during any of the Option Periods, yet the shares are not exercised prior to the end of the 12-month Option Period, the put option will expire. If the FlyOver Iceland attraction has not achieved the Put Option Condition by December 31, 2024, the put option expires. As of December 31, 2023, the FlyOver Iceland attraction has not achieved the Put Option Condition and we do not anticipate the Put Option Condition to be achieved prior to expiration.
The noncontrolling interests’interest’s carrying value is determined by the fair market value atof the noncontrolling interest as of the acquisition date and the subsequent noncontrolling interests’interest’s share of the subsequent net income or loss. This value is benchmarked against the redemption value of the sellers’ put option. The carrying value is adjusted to the latter,redemption value, provided that it does not fall below the initial carrying values, value,
71
VIAD CORP
NOTES TO CONSOLIDATED FINANCIAL STATEMENTS (CONTINUED)
as determined by the purchase price allocation. We have made a policy election to reflect any changes caused by such an adjustment into retained earnings (accumulated deficit), rather than into current earnings.
earnings (loss).
Changes in the redeemable noncontrolling interestsinterest are as follows:
(in thousands) |
|
|
| |
Balance at December 31, 2021 |
| $ | 5,444 |
|
Net loss attributable to redeemable noncontrolling interest |
|
| (748 | ) |
Adjustment to the redemption value |
|
| 763 |
|
Foreign currency translation adjustment |
|
| (503 | ) |
Balance at December 31, 2022 |
|
| 4,956 |
|
Net loss attributable to redeemable noncontrolling interest |
|
| (401 | ) |
Foreign currency translation adjustment |
|
| 178 |
|
Balance at December 31, 2023 |
| $ | 4,733 |
|
Non-redeemable noncontrolling interest
Non-redeemable noncontrolling interest represents the portion of equity in a subsidiary that is not attributable, directly or indirectly, to us. Our non-redeemable noncontrolling interest relates to the equity ownership interest that we do not own.
Changes in the non-redeemable noncontrolling interest are as follows:
(in thousands) | Glacier Park Inc. |
|
| Brewster (1) |
|
| Sky Lagoon |
|
| Total |
| ||||
Balance at December 31, 2021 | $ | 15,315 |
|
| $ | 58,601 |
|
| $ | 11,640 |
|
| $ | 85,556 |
|
Net loss attributable to non-redeemable noncontrolling interest |
| 1,394 |
|
|
| 1,675 |
|
|
| (746 | ) |
|
| 2,323 |
|
Distributions to non-controlling interests |
| — |
|
|
| (570 | ) |
|
| — |
|
|
| (570 | ) |
Foreign currency translation adjustments |
| (19 | ) |
|
| (4,004 | ) |
|
| (976 | ) |
|
| (4,999 | ) |
Balance at December 31, 2022 | $ | 16,690 |
|
| $ | 55,702 |
|
| $ | 9,918 |
|
| $ | 82,310 |
|
Net income (loss) attributable to non-redeemable noncontrolling interest |
| 1,464 |
|
|
| 2,858 |
|
|
| 3,514 |
|
|
| 7,836 |
|
Distributions to non-controlling interests |
| — |
|
|
| (721 | ) |
|
| (2,005 | ) |
|
| (2,726 | ) |
Foreign currency translation adjustments |
| 5 |
|
|
| 1,269 |
|
|
| 494 |
|
|
| 1,768 |
|
Balance at December 31, 2023 | $ | 18,159 |
|
| $ | 59,108 |
|
| $ | 11,921 |
|
| $ | 89,188 |
|
Equity ownership interest that we do not own |
| 20 | % |
|
| 40 | % |
|
| 49 | % |
|
|
| |
(in thousands) |
|
|
|
|
Balance at December 31, 2016 |
| $ | — |
|
Redeemable noncontrolling interest related to 2017 acquisition |
|
| 6,735 |
|
Adjustment to the redemption value |
|
| (30 | ) |
Foreign currency translation adjustment |
|
| (57 | ) |
Balance at December 31, 2017 |
| $ | 6,648 |
|
Note 22. 24. Segment Information
An operating segment is defined as a component of an enterprise that engages in business activities for which discrete financial information is available and regularly reviewed by the chief operating decision maker (“CODM”) in deciding how to allocate resources and assess performance. Our CODM is our Chief Executive Officer.
We measure the profit and performance of our operations on the basis of segment operating income (loss) which excludes restructuring charges, and impairment charges, gain (loss) from disposition of strategic assets, and recoveries.certain other corporate expenses that are not allocated to the reportable segments. Intersegment sales are eliminated in consolidation and intersegment transfers are not significant. Corporate activities include expenses not allocated to operations. Depreciation and amortization and share-based compensation expense are the only significant non-cash items for the reportable segments.
72
VIAD CORP
NOTES TO CONSOLIDATED FINANCIAL STATEMENTS (CONTINUED)
Our reportable segments, with reconciliations to consolidated totals, are as follows:
|
| Year Ended December 31, |
| |||||||||
(in thousands) |
| 2023 |
|
| 2022 |
|
| 2021 |
| |||
Revenue: |
|
|
|
|
|
|
|
|
| |||
Pursuit |
| $ | 350,285 |
|
| $ | 299,327 |
|
| $ | 187,048 |
|
GES: |
|
|
|
|
|
|
|
|
| |||
Spiro |
|
| 283,171 |
|
|
| 277,641 |
|
|
| 116,587 |
|
GES Exhibitions |
|
| 614,418 |
|
|
| 557,880 |
|
|
| 209,529 |
|
GES intersegment eliminations |
|
| (9,194 | ) |
|
| (7,537 | ) |
|
| (5,824 | ) |
Total GES |
|
| 888,395 |
|
|
| 827,984 |
|
|
| 320,292 |
|
Total revenue |
| $ | 1,238,680 |
|
| $ | 1,127,311 |
|
| $ | 507,340 |
|
|
|
|
|
|
|
|
|
|
| |||
Segment operating income (loss): |
|
|
|
|
|
|
|
|
| |||
Pursuit |
| $ | 53,381 |
|
| $ | 24,031 |
|
| $ | 4,609 |
|
GES: |
|
|
|
|
|
|
|
|
| |||
Spiro |
|
| 23,723 |
|
|
| 23,133 |
|
|
| (9,556 | ) |
GES Exhibitions |
|
| 31,339 |
|
|
| 21,780 |
|
|
| (42,055 | ) |
Total GES |
|
| 55,062 |
|
|
| 44,913 |
|
|
| (51,611 | ) |
Segment operating income (loss) |
|
| 108,443 |
|
|
| 68,944 |
|
|
| (47,002 | ) |
Corporate eliminations (1) |
|
| 59 |
|
|
| 67 |
|
|
| 70 |
|
Corporate activities |
|
| (14,040 | ) |
|
| (13,418 | ) |
|
| (11,689 | ) |
Gain on sale of ON Services |
|
| (204 | ) |
|
| 19,637 |
|
|
| — |
|
Interest expense, net |
|
| (47,978 | ) |
|
| (34,891 | ) |
|
| (28,324 | ) |
Other expense, net |
|
| (2,033 | ) |
|
| (2,077 | ) |
|
| (2,070 | ) |
Restructuring charges: |
|
|
|
|
|
|
|
|
| |||
Pursuit |
|
| (199 | ) |
|
| (55 | ) |
|
| (85 | ) |
Spiro |
|
| (329 | ) |
|
| (1,015 | ) |
|
| (575 | ) |
GES Exhibitions |
|
| (646 | ) |
|
| (1,960 | ) |
|
| (5,361 | ) |
Corporate |
|
| — |
|
|
| (29 | ) |
|
| (45 | ) |
Impairment charges: |
|
|
|
|
|
|
|
|
| |||
GES Exhibitions |
|
| — |
|
|
| (583 | ) |
|
| — |
|
Income (loss) from continuing operations before income taxes |
| $ | 43,073 |
|
| $ | 34,620 |
|
| $ | (95,081 | ) |
|
|
|
| |||||||||
|
| Year Ended December 31, |
| |||||||||
(in thousands) |
| 2017 |
|
| 2016 |
|
| 2015 |
| |||
Revenue: |
|
|
|
|
|
|
|
|
|
|
|
|
GES: |
|
|
|
|
|
|
|
|
|
|
|
|
U.S. |
| $ | 872,154 |
|
| $ | 826,408 |
|
| $ | 720,882 |
|
International |
|
| 282,712 |
|
|
| 248,503 |
|
|
| 272,634 |
|
Intersegment eliminations |
|
| (21,769 | ) |
|
| (20,172 | ) |
|
| (16,638 | ) |
Total GES |
|
| 1,133,097 |
|
|
| 1,054,739 |
|
|
| 976,878 |
|
Pursuit |
|
| 173,868 |
|
|
| 153,364 |
|
|
| 112,170 |
|
Corporate eliminations (1) |
|
| — |
|
|
| (3,133 | ) |
|
| — |
|
Total revenue |
| $ | 1,306,965 |
|
| $ | 1,204,970 |
|
| $ | 1,089,048 |
|
Segment operating income: |
|
|
|
|
|
|
|
|
|
|
|
|
GES: |
|
|
|
|
|
|
|
|
|
|
|
|
U.S. |
| $ | 34,494 |
|
| $ | 40,524 |
|
| $ | 14,563 |
|
International |
|
| 15,475 |
|
|
| 9,699 |
|
|
| 12,211 |
|
Total GES |
|
| 49,969 |
|
|
| 50,223 |
|
|
| 26,774 |
|
Pursuit |
|
| 47,082 |
|
|
| 35,705 |
|
|
| 27,810 |
|
Segment operating income |
|
| 97,051 |
|
|
| 85,928 |
|
|
| 54,584 |
|
Corporate eliminations (1) |
|
| 67 |
|
|
| (743 | ) |
|
| — |
|
Corporate activities |
|
| (12,877 | ) |
|
| (10,322 | ) |
|
| (9,720 | ) |
Operating income |
|
| 84,241 |
|
|
| 74,863 |
|
|
| 44,864 |
|
Interest income |
|
| 319 |
|
|
| 1,165 |
|
|
| 658 |
|
Interest expense |
|
| (8,304 | ) |
|
| (5,898 | ) |
|
| (4,535 | ) |
Restructuring recoveries (charges): |
|
|
|
|
|
|
|
|
|
|
|
|
GES U.S. |
|
| 354 |
|
|
| (2,893 | ) |
|
| (541 | ) |
GES International |
|
| (1,061 | ) |
|
| (1,559 | ) |
|
| (1,813 | ) |
Pursuit |
|
| (86 | ) |
|
| (171 | ) |
|
| (200 | ) |
Corporate |
|
| (211 | ) |
|
| (560 | ) |
|
| (402 | ) |
Impairment recoveries (charges): |
|
|
|
|
|
|
|
|
|
|
|
|
Pursuit |
|
| 29,098 |
|
|
| (218 | ) |
|
| (96 | ) |
Income from continuing operations before income taxes |
| $ | 104,350 |
|
| $ | 64,729 |
|
| $ | 37,935 |
|
73
VIAD CORP
NOTES TO CONSOLIDATED FINANCIAL STATEMENTS (CONTINUED)
|
|
Additional information of our reportable segments is as follows:
|
| December 31, |
| |||||||||
(in thousands) |
| 2023 |
|
| 2022 |
|
| 2021 |
| |||
Depreciation: |
|
|
|
|
|
|
|
|
| |||
Pursuit |
| $ | 32,937 |
|
| $ | 31,075 |
|
| $ | 27,360 |
|
Spiro |
|
| 1,922 |
|
|
| 3,599 |
|
|
| 4,769 |
|
GES Exhibitions |
|
| 7,280 |
|
|
| 8,315 |
|
|
| 11,550 |
|
Corporate |
|
| 85 |
|
|
| 43 |
|
|
| 34 |
|
|
| $ | 42,224 |
|
| $ | 43,032 |
|
| $ | 43,713 |
|
Amortization: |
|
|
|
|
|
|
|
|
| |||
Pursuit |
| $ | 4,907 |
|
| $ | 5,021 |
|
| $ | 5,108 |
|
Spiro |
|
| 258 |
|
|
| 242 |
|
|
| 509 |
|
GES Exhibitions |
|
| 3,654 |
|
|
| 4,188 |
|
|
| 4,420 |
|
|
| $ | 8,819 |
|
| $ | 9,451 |
|
| $ | 10,037 |
|
Capital expenditures: |
|
|
|
|
|
|
|
|
| |||
Pursuit |
| $ | 62,339 |
|
| $ | 56,775 |
|
| $ | 54,325 |
|
Spiro |
|
| 3,309 |
|
|
| 2,923 |
|
|
| 578 |
|
GES Exhibitions |
|
| 10,337 |
|
|
| 7,342 |
|
|
| 2,557 |
|
Corporate and other |
|
| 104 |
|
|
| 130 |
|
|
| 476 |
|
|
| $ | 76,089 |
|
| $ | 67,170 |
|
| $ | 57,936 |
|
|
| December 31, |
| |||||||||
(in thousands) |
| 2017 |
|
| 2016 |
|
| 2015 |
| |||
Assets: |
|
|
|
|
|
|
|
|
|
|
|
|
GES: |
|
|
|
|
|
|
|
|
|
|
|
|
U.S. |
| $ | 380,909 |
|
| $ | 380,951 |
|
| $ | 294,618 |
|
International |
|
| 135,917 |
|
|
| 109,705 |
|
|
| 115,494 |
|
Pursuit |
|
| 350,256 |
|
|
| 301,941 |
|
|
| 195,527 |
|
Corporate and other |
|
| 52,817 |
|
|
| 77,219 |
|
|
| 85,084 |
|
|
| $ | 919,899 |
|
| $ | 869,816 |
|
| $ | 690,723 |
|
Depreciation and amortization: |
|
|
|
|
|
|
|
|
|
|
|
|
GES: |
|
|
|
|
|
|
|
|
|
|
|
|
U.S. |
| $ | 29,088 |
|
| $ | 21,473 |
|
| $ | 18,658 |
|
International |
|
| 8,176 |
|
|
| 8,092 |
|
|
| 8,435 |
|
Pursuit |
|
| 17,653 |
|
|
| 12,967 |
|
|
| 7,974 |
|
Corporate and other |
|
| 197 |
|
|
| 211 |
|
|
| 164 |
|
|
| $ | 55,114 |
|
| $ | 42,743 |
|
| $ | 35,231 |
|
Capital expenditures: |
|
|
|
|
|
|
|
|
|
|
|
|
GES: |
|
|
|
|
|
|
|
|
|
|
|
|
U.S. |
| $ | 17,337 |
|
| $ | 14,291 |
|
| $ | 8,066 |
|
International |
|
| 8,084 |
|
|
| 5,033 |
|
|
| 8,366 |
|
Pursuit |
|
| 30,786 |
|
|
| 31,861 |
|
|
| 13,107 |
|
Corporate and other(1) |
|
| 414 |
|
|
| (1,370 | ) |
|
| 300 |
|
|
| $ | 56,621 |
|
| $ | 49,815 |
|
| $ | 29,839 |
|
|
|
We do not report total assets by segment because this is not a metric used to allocate resources or evaluate segment performance by our CODM.
Geographic Areas
Our foreign operations are located principallyprimarily in Canada, the United Kingdom, Iceland, the Netherlands, Germany, the United Arab Emirates and the Netherlands.to a lesser extent, in certain other countries. GES revenue is designated as domestic or foreign based on the originating location of the product or service. Long-lived assets are attributed to domestic or foreign based principally on the physical location of the assets. Long-lived assets consist of “Property and equipment, net” and “Other investments and assets.” The table below presents the financial information by major geographic area:
|
| December 31, |
| |||||||||
(in thousands) |
| 2023 |
|
| 2022 |
|
| 2021 |
| |||
Revenue: |
|
|
|
|
|
|
|
|
| |||
United States |
| $ | 693,097 |
|
| $ | 703,379 |
|
| $ | 312,265 |
|
EMEA |
|
| 279,892 |
|
|
| 207,339 |
|
|
| 96,603 |
|
Canada |
|
| 265,691 |
|
|
| 216,593 |
|
|
| 98,472 |
|
Total revenue |
| $ | 1,238,680 |
|
| $ | 1,127,311 |
|
| $ | 507,340 |
|
Long-lived assets: |
|
|
|
|
|
|
|
|
| |||
United States |
| $ | 235,421 |
|
| $ | 190,917 |
|
| $ | 179,756 |
|
EMEA |
|
| 72,651 |
|
|
| 85,680 |
|
|
| 91,877 |
|
Canada |
|
| 301,866 |
|
|
| 290,438 |
|
|
| 294,193 |
|
Total long-lived assets |
| $ | 609,938 |
|
| $ | 567,035 |
|
| $ | 565,826 |
|
Note 25. Subsequent Events
FlyOver Iceland Credit Facility Amendment
On February 27, 2024, FlyOver Iceland reached an agreement to amend and extend the FlyOver Iceland Credit Facility, wherein the principal payments are deferred for six months beginning March 1, 2024, with equal quarterly principal payments due beginning September 1, 2024 and a maturity date of September 1, 2029. The amended terms also include a modification of the financial covenants and an adjustment of the interest rate to three-month EURIBOR plus 5.5%, decreasing to 4.9% once FlyOver Iceland’s leverage ratio is below 4.00 to 1.00.
|
| December 31, |
| |||||||||
(in thousands) |
| 2017 |
|
| 2016 |
|
| 2015 |
| |||
Revenue: |
|
|
|
|
|
|
|
|
|
|
|
|
United States |
| $ | 913,210 |
|
| $ | 855,304 |
|
| $ | 726,436 |
|
EMEA |
|
| 209,824 |
|
|
| 205,028 |
|
|
| 220,046 |
|
Canada |
|
| 183,931 |
|
|
| 144,638 |
|
|
| 142,566 |
|
Total revenue |
| $ | 1,306,965 |
|
| $ | 1,204,970 |
|
| $ | 1,089,048 |
|
Long-lived assets: |
|
|
|
|
|
|
|
|
|
|
|
|
United States |
| $ | 180,345 |
|
| $ | 182,611 |
|
| $ | 139,479 |
|
EMEA |
|
| 43,630 |
|
|
| 37,083 |
|
|
| 15,714 |
|
Canada |
|
| 129,108 |
|
|
| 104,461 |
|
|
| 71,677 |
|
Total long-lived assets |
| $ | 353,083 |
|
| $ | 324,155 |
|
| $ | 226,870 |
|
74
VIAD CORP
NOTES TO CONSOLIDATED FINANCIAL STATEMENTS (CONTINUED)
FlyOver Iceland Term Loan Refinance
Note 23. Common Stock Repurchases
We previously announced our Board of Directors’ authorizationOn February 27, 2024, FlyOver Iceland reached an agreement with its lender to repurchase shares of our common stock from time to timerefinance the ISK 50.0 million loan that was due February 1, 2024 with a new ISK 50.0 million term loan that matures on August 1, 2024 and bears interest at prevailing market prices. No open market repurchases were made during 2017 or 2016. During 2015, we repurchased 141,462 shares on the open market for $3.8 million. As of December 31, 2017, 440,540 shares remain available for repurchase. We repurchased 41,532 shares for $2.1 million in 2017, 25,432 shares for $0.7 million in 2016, and 35,649 shares for $1.0 million in 2015 related to tax withholding requirements on vested share-based awards.one-month REIBOR plus 4.7%.
75
Note 24. Selected Quarterly Financial Information (Unaudited)
The following table sets forth selected unaudited consolidated quarterly financial information:
|
| 2017 |
|
| 2016 |
| ||||||||||||||||||||||||||
(in thousands, except per share data) |
| First Quarter |
|
| Second Quarter |
|
| Third Quarter |
|
| Fourth Quarter |
|
| First Quarter |
|
| Second Quarter |
|
| Third Quarter |
|
| Fourth Quarter |
| ||||||||
Revenue: |
| $ | 325,807 |
|
| $ | 364,774 |
|
| $ | 339,099 |
|
| $ | 277,285 |
|
| $ | 241,362 |
|
| $ | 324,747 |
|
| $ | 382,465 |
|
| $ | 256,396 |
|
Operating income (loss): |
|
|
|
|
|
|
|
|
|
|
|
|
|
|
|
|
|
|
|
|
|
|
|
|
|
|
|
|
|
|
|
|
Ongoing operations (1) |
| $ | 12,684 |
|
| $ | 39,402 |
|
| $ | 47,066 |
|
| $ | (4,726 | ) |
| $ | (6,280 | ) |
| $ | 34,014 |
|
| $ | 58,917 |
|
| $ | (1,466 | ) |
Corporate activities |
|
| (2,610 | ) |
|
| (3,008 | ) |
|
| (4,474 | ) |
|
| (2,785 | ) |
|
| (1,911 | ) |
|
| (2,707 | ) |
|
| (2,772 | ) |
|
| (2,932 | ) |
Restructuring charges |
|
| (394 | ) |
|
| (168 | ) |
|
| (255 | ) |
|
| (187 | ) |
|
| (992 | ) |
|
| (975 | ) |
|
| (1,697 | ) |
|
| (1,519 | ) |
Impairment recoveries (charges) |
|
| 2,384 |
|
|
| 2,247 |
|
|
| 24,467 |
|
|
| — |
|
|
| — |
|
|
| — |
|
|
| (120 | ) |
|
| (98 | ) |
Operating income (loss) |
| $ | 12,064 |
|
| $ | 38,473 |
|
| $ | 66,804 |
|
| $ | (7,698 | ) |
| $ | (9,183 | ) |
| $ | 30,332 |
|
| $ | 54,328 |
|
| $ | (6,015 | ) |
Income (loss) from continuing operations attributable to Viad |
| $ | 7,593 |
|
| $ | 27,438 |
|
| $ | 44,758 |
|
| $ | (21,814 | ) |
| $ | (6,797 | ) |
| $ | 19,873 |
|
| $ | 34,013 |
|
| $ | (4,136 | ) |
Net income (loss) attributable to Viad |
| $ | 6,777 |
|
| $ | 27,947 |
|
| $ | 44,657 |
|
| $ | (21,674 | ) |
| $ | (6,983 | ) |
| $ | 19,509 |
|
| $ | 33,792 |
|
| $ | (4,049 | ) |
Basic and Diluted income (loss) per common share: (2) |
|
|
|
|
|
|
|
|
|
|
|
|
|
|
|
|
|
|
|
|
|
|
|
|
|
|
|
|
|
|
|
|
Continuing operations attributable to Viad |
| $ | 0.37 |
|
| $ | 1.35 |
|
| $ | 2.19 |
|
| $ | (1.08 | ) |
| $ | (0.34 | ) |
| $ | 0.98 |
|
| $ | 1.68 |
|
| $ | (0.21 | ) |
Net income (loss) attributable to Viad common stockholders |
| $ | 0.33 |
|
| $ | 1.37 |
|
| $ | 2.19 |
|
| $ | (1.07 | ) |
| $ | (0.35 | ) |
| $ | 0.96 |
|
| $ | 1.67 |
|
| $ | (0.20 | ) |
|
|
|
|
REPORT OF INDEPENDENT REGISTEREDREGISTERED PUBLIC ACCOUNTING FIRM
To the shareholders and the Board of Directors and Stockholders of Viad Corp
Opinion on the Financial Statements
We have audited the accompanying consolidated balance sheets of Viad Corp and subsidiaries (the “Company”) as of December 31, 20172023 and 2016,2022, the related consolidated statements of operations, comprehensive income (loss), stockholders’ equity and mezzanine equity, and cash flows, for each of the three years in the period ended December 31, 2017,2023, and the related notes and the financial statement schedule listed in the Index at Item 15 (collectively referred to as the “financial statements”). In our opinion, the consolidated financial statements present fairly, in all material respects, the financial position of the Company as of December 31, 20172023 and 2016,2022, and the results of its operations and its cash flows for each of the three years in the period ended December 31, 2017,2023, in conformity with accounting principles generally accepted in the United States of America.
We have also audited, in accordance with the standards of the Public Company Accounting Oversight Board (United States) (PCAOB)(“PCAOB”), the Company’s internal control over financial reporting as of December 31, 2017,2023, based on criteria established in Internal Control — Integrated Framework (2013) issued by the Committee of Sponsoring Organizations of the Treadway Commission and our report dated February 28, 2018,March 1, 2024, expressed an unqualifieda qualified opinion on the Company’s internal control over financial reporting.
Basis for Opinion
These consolidated financial statements are the responsibility of the Company’s management. Our responsibility is to express an opinion on the Company’s consolidated financial statements based on our audits. We are a public accounting firm registered with the PCAOB and are required to be independent with respect to the Company in accordance with the U.S. federal securities laws and the applicable rules and regulations of the Securities and Exchange Commission and the PCAOB.
We conducted our audits in accordance with the standards of the PCAOB. Those standards require that we plan and perform the audit to obtain reasonable assurance about whether the consolidated financial statements are free of material misstatement, whether due to error or fraud. Our audits included performing procedures to assess the risks of material misstatement of the consolidated financial statements, whether due to error or fraud, and performing procedures that respond to those risks. Such procedures included examining, on a test basis, evidence regarding the amounts and disclosures in the consolidated financial statements. Our audits also included evaluating the accounting principles used and significant estimates made by management, as well as evaluating the overall presentation of the consolidated financial statements. We believe that our audits provide a reasonable basis for our opinion.
Critical Audit Matters
The critical audit matters communicated below are matters arising from the current-period audit of the financial statements that were communicated or required to be communicated to the audit committee and that (1) relate to accounts or disclosures that are material to the financial statements and (2) involved our especially challenging, subjective, or complex judgments. The communication of critical audit matters does not alter in any way our opinion on the financial statements, taken as a whole, and we are not, by communicating the critical audit matters below, providing separate opinions on the critical audit matters or on the accounts or disclosures to which they relate.
Litigation, Claims, Contingencies, and Other—Self Insurance Liabilities—Refer to Notes 1, 8, 10, 11 and 22 to the financial statements
Critical Audit Matter Description
The Company is self-insured up to certain limits for workers’ compensation, automobile, product and general liability claims. Provisions for losses for claims incurred, including actuarially derived estimated claims incurred but not reported, are made by the Company based on historical experience, claims frequency, insurance coverage, and other factors. The Company purchases insurance for amounts in excess of self-insured levels. The aggregate amount of these insurance liabilities related to continuing operations was $19.7 million as of December 31, 2023.
Given the subjectivity of estimating the projected settlement value of reported and unreported claims, auditing the self-insurance liabilities involved especially subjective auditor judgment and an increased extent of effort, including the need to involve our actuarial specialists when auditing the self-insurance liabilities, and therefore, we have identified this as a critical audit matter.
How the Critical Audit Matter Was Addressed in the Audit
Our audit procedures related to the self-insurance liabilities included the following, among others:
Goodwill — FlyOver and Glacier Park Collection – Refer to Notes 1 and 9 to the financial statements
Critical Audit Matter Description
The Company’s evaluation of goodwill for impairment involves the comparison of the fair value of each reporting unit to its carrying value. The Company used a discounted expected future cash flow methodology to estimate the fair value of its reporting units, which requires management to make significant assumptions and estimates related to the discount rate and expected forecasts of future cash flows, including revenues and earnings before interest, taxes, depreciation, and amortization (“EBITDA”) margins. Changes in these assumptions and estimates could have a significant impact on either the fair value, the amount of goodwill impairment charge, or both.
Given the significant judgments made by management to estimate the fair value of the FlyOver and Glacier Park Collection reporting units, performing audit procedures to evaluate the reasonableness of management’s assumptions and estimates related to selection of the discount rates and forecasts of future revenue and EBITDA margins required a high degree of auditor judgment and an increased extent of effort, including the need to involve our fair value specialists.
How the Critical Audit Matter Was Addressed in the Audit
Our audit procedures related to the selection of the discount rates and forecasts of future revenue and EBITDA margins (“forecasts”) used by management to estimate the fair value of the FlyOver and Glacier Park Collection reporting units included the following procedures:
/s/ Deloitte & Touche LLP
Phoenix,Tempe, Arizona
February 28, 2018March 1, 2024
We have served as the Company’s auditor since at least 1929,1929; however, the specifican earlier year hascould not beenbe reliably determined.
77
Item 9. Changes in and Disagreements With AccountantsAccountants on Accounting and Financial Disclosure
None.
Item 9A. Controls and Procedures
We have established disclosure controls and procedures that are designed to ensure that information required to be disclosed in our reports filed or submitted under the Securities Exchange Act of 1934, as amended (the “Exchange Act”), is recorded, processed, summarized, and reported within the time periods specified in SECthe SEC’s rules and forms, and such information is accumulated and communicated to our management, including our Chief Executive Officer (“CEO”) and Chief Financial Officer (“CFO”), as appropriate to allow timely decisions regarding required disclosure. Management, together with our CEO and CFO, evaluated the effectiveness of our disclosure controls and procedures as of December 31, 2017.2023. Based on this evaluation, the CEO and CFO concluded that our disclosure controls and procedures were effective as of December 31, 2017.2023.
There were no changes in our internal control over financial reporting during the fourth quarter of 2017 that have materially affected, or are reasonably likely to materially affect, our internal control over financial reporting.reporting during the fourth quarter of 2023.
78
MANAGEMENT’S REPORT ON INTERNAL CONTROL OVER FINANCIAL REPORTING
Our managementManagement is responsible for establishing and maintaining adequate internal control over financial reporting. Internal control over financial reporting is defined in Rule 13a-15(f) or 15d-15(f) of the Exchange Act as a process designed by, or under the supervision of, our principal executive and principal financial officers and effected by our boardBoard of directors,Directors, our management and other personnel, to provide reasonable assurance regarding the reliability of financial reporting and the preparation of financial statements for external purposes in accordance with U.S GAAP and includes those policies and procedures that:
Pertain to the maintenance of records that in reasonable detail accurately and fairly reflect the transactions and dispositions of our assets;
Provide reasonable assurance that transactions are recorded as necessary to permit preparation of financial statements in accordance with U.S. GAAP, and that our receipts and expenditures are being made only in accordance with authorizations of our management and directors; and
Provide reasonable assurance regarding prevention or timely detection of unauthorized acquisition, use or disposition of our assets that could have a material effect on our financial statements.
Because of inherent limitations, internal control over financial reporting may not prevent or detect misstatements. Projections of any evaluation of effectiveness to future periods are subject to the risk that controls may become inadequate because of changes in conditions, or that the degree of compliance with the policies or procedures may deteriorate. All internal control systems, no matter how well designed, have inherent limitations. Therefore, even those systems determined to be effective can provide only reasonable assurance with respect to financial statement preparation and presentation. Because of the inherent limitations of internal control, there is a risk that material misstatements may not be prevented or detected on a timely basis by internal control over financial reporting. However, these inherent limitations are known features of the financial reporting process. Therefore, it is possible to design into the process safeguards to reduce, though not eliminate, this risk.
Our managementManagement performed an assessment of the effectiveness of our internal control over financial reporting using the criteria described in the “Internal Control - Integrated Framework (2013),” issued by the Committee of Sponsoring Organizations of the Treadway Commission. The objective of this assessment was to determine whether our internal control over financial reporting was effective as of December 31, 2017.2023.
Based on our assessment, we concluded that, as of December 31, 2017,2023, our internal control over financial reporting is effective based on those criteria.
Our independent registered public accounting firm, Deloitte & Touche LLP, has issued a report relating to our audit of the effectiveness of our internal control over financial reporting, which appears on the following page of this 20172023 Form 10-K.
79
REPORT OF INDEPENDENT REGISTERED PUBLIC ACCOUNTING FIRM
To the shareholders and the Board of Directors and Stockholders of Viad Corp
Opinion on Internal Control over Financial Reporting
We have audited the internal control over financial reporting of Viad Corp and subsidiaries (the “Company”) as of December 31, 2017,2023, based on criteria established in Internal Control — Integrated Framework (2013) issued by the Committee of Sponsoring Organizations of the Treadway Commission (COSO)(“COSO”). In our opinion, the Company maintained, in all material respects, effective internal control over financial reporting as of December 31, 2017,2023, based on criteria established in Internal Control — Integrated Framework (2013) issued by COSO.
We have also audited, in accordance with the standards of the Public Company Accounting Oversight Board (United States) (PCAOB)(“PCAOB”), the consolidated financial statements and financial statement schedule as of and for the year ended December 31, 2017,2023, of the Company and our report dated February 28, 2018,March 1, 2024, expressed an unqualified opinion on those consolidated financial statements and financial statement schedule.statements.
Basis for Opinion
The Company’s management is responsible for maintaining effective internal control over financial reporting and for its assessment of the effectiveness of internal control over financial reporting, included in the accompanying Management’s Report on Internal Control over Financial Reporting. Our responsibility is to express an opinion on the Company’s internal control over financial reporting based on our audit. We are a public accounting firm registered with the PCAOB and are required to be independent with respect to the Company in accordance with the U.S. federal securities laws and the applicable rules and regulations of the Securities and Exchange Commission and the PCAOB.
We conducted our audit in accordance with the standards of the PCAOB. Those standards require that we plan and perform the audit to obtain reasonable assurance about whether effective internal control over financial reporting was maintained in all material respects. Our audit included obtaining an understanding of internal control over financial reporting, assessing the risk that a material weakness exists, testing and evaluating the design and operating effectiveness of internal control based on the assessed risk, and performing such other procedures as we considered necessary in the circumstances. We believe that our audit provides a reasonable basis for our opinion.
Definition and Limitations of Internal Control over Financial Reporting
A company’s internal control over financial reporting is a process designed to provide reasonable assurance regarding the reliability of financial reporting and the preparation of financial statements for external purposes in accordance with generally accepted accounting principles. A company’s internal control over financial reporting includes those policies and procedures that (1) pertain to the maintenance of records that, in reasonable detail, accurately and fairly reflect the transactions and dispositions of the assets of the company; (2) provide reasonable assurance that transactions are recorded as necessary to permit preparation of financial statements in accordance with generally accepted accounting principles, and that receipts and expenditures of the company are being made only in accordance with authorizations of management and directors of the company; and (3) provide reasonable assurance regarding prevention or timely detection of unauthorized acquisition, use, or disposition of the company’s assets that could have a material effect on the financial statements.
Because of its inherent limitations, internal control over financial reporting may not prevent or detect misstatements. Also, projections of any evaluation of effectiveness to future periods are subject to the risk that controls may become inadequate because of changes in conditions, or that the degree of compliance with the policies or procedures may deteriorate.
/s/ Deloitte & Touche LLP
Phoenix,Tempe, Arizona
February 28, 2018March 1, 2024
80
Securities Trading Plans of Directors and Executive Officers
During the three months ended December 31, 2023, no director or officer of the Company adopted or terminated a “Rule 10b5-1 trading arrangement” or “non-Rule 10b5-1 trading arrangement,” as each term is defined in Item 408(a) of Regulation S-K.
Item 9C. DISCLOSURE REGARDING FOREIGN JURISDICTIONS THAT PREVENT INSPECTIONS
Not applicable.
81
Item 10. Directors, Executive Officers and Corporate Governance
Information regarding our directors, director nomination procedures, and the Audit Committee of our Board of Directors and compliance with Section 16(a) of the Exchange Act, areis included in our Proxy Statement for the Annual Meeting of Shareholders scheduled to be held on May 17, 201815, 2024 (the “Proxy Statement”), under the captions “Election of Directors,” “Board of Directors and Corporate Governance,” and “Information on Stock Ownership,”“Delinquent Section 16(a) Reports” (if applicable), and are incorporated herein by reference. Information regarding our executive officers is located in Part I, “Other – Information about our Executive Officers of the Registrant”Officers” of this 20172023 Form 10-K.
We adopted a CodeOur written code of Ethics forethics (the “Code of Ethics”), applies to all of our directors,employees, officers and employees. A copy ofdirectors, including our principal executive officer, principal financial officer, principal accounting officer or controller or persons performing similar functions. The Code of Ethics is available on our corporate website atwww.viad.com/about-us/corporate-governance/documents-and-charters/default.aspx. We intend to promptly disclose on our website at www.viad.com/about-us/corporate-governance/documents-and-charters/default.aspxor in a Current Report on Form 8-K in the future (i) the date and is also available without chargenature of any amendment (other than technical, administrative or other non-substantive amendments) to the Code of Ethics that applies to our principal executive officer, principal financial officer, principal accounting officer or controller or persons performing similar functions and relates to any shareholder upon written request to: Viad Corp, 1850 North Central Avenue, Suite 1900, Phoenix, Arizona 85004-4565, Attention: Corporate Secretary.element of the code of ethics definition enumerated in Item 406(b) of Regulation S-K and (ii) the nature of any waiver, including an implicit waiver, from a provision of the Code of Ethics that is granted to one of these specified individuals that relates to one or more of the elements of the code of ethics definition enumerated in Item 406(b) of Regulation S-K, the name of such person who is granted the waiver and the date of the waiver.
Item 11. Executive Compensation
Information in the Proxy Statement under the captions “Compensation Discussion and Analysis,” “Board of Directors and Corporate Governance,” and “Executive Compensation” is incorporated herein by reference. The information in the section entitled “Executive Compensation – Pay versus Performance” will not be deemed to be incorporated herein by reference.
Item 12. Security Ownership of Certain Beneficial Owners and Management and Related Stockholder Matters
Information in the Proxy Statement under the captions “Executive Compensation”Compensation – Securities Authorized for Issuance Under Equity Compensation Plans” and “Information on Stock Ownership”“Stock Ownership Information” is incorporated herein by reference.
Information in the Proxy Statement under the caption “Board of Directors and Corporate Governance” is incorporated herein by reference.
Item 14. Principal AccountingAccountANT Fees and Services
Information regarding principal accountingaccountant fees and services and the pre-approval policies and procedures for such fees and services, as adopted by the Audit Committee of the Board of Directors, is contained in the Proxy Statement under the caption “Ratification of the AppointmentSelection of Deloitte & Touche LLP as Viad’sOur Independent Registered Public AccountantsAccounting Firm for 2018”2024” and is incorporated herein by reference.
Item 15.Exhibits AND Financial Statement Schedules
|
|
See Index to Financial Statements and Financial Statement Schedule at Item 8 of this 20172023 Form 10-K.
82
|
|
Incorporated by Reference | ||||||||||||||||||
Exhibit Number | Exhibit Description | Form | Period Ending | Exhibit | Filing Date | |||||||||||||
| ||||||||||||||||||
3.A | 10-Q | 6/30/2004 | 3.A | 8/9/2004 | ||||||||||||||
3.B | 8-K | 3 | 12/9/2013 | |||||||||||||||
| 8-K | 3.1 | 8/5/2020 | |||||||||||||||
4.A | 8-K |
|
| |||||||||||||||
| * |
|
|
| ||||||||||||||
| + |
|
|
| ||||||||||||||
|
|
|
|
| ||||||||||||||
|
|
|
|
| ||||||||||||||
|
|
|
|
|
| |||||||||||||
|
|
|
| |||||||||||||||
|
|
|
|
|
| |||||||||||||
|
|
|
|
| ||||||||||||||
|
|
|
| |||||||||
|
|
|
|
|
| |||||||
|
|
|
|
|
| |||||||
|
|
|
|
| ||||||||
|
|
|
|
| ||||||||
|
| Form of Incentive Stock Option Agreement, effective as of |
|
|
| |||||||
|
|
|
|
| ||||||||
|
|
|
|
| ||||||||
|
|
|
|
| ||||||||
|
|
|
|
| ||||||||
|
|
|
|
| ||||||||
|
|
|
|
|
| |||||||
|
|
| 9/30/2020 |
|
| |||||||
| + |
| 8-K |
| 5/ |
26/2022 | ||||||||||||
|
| |||||||||||
10.B2 | + | 10-K | 12/31/2017 | 10.B4 | 2/28/2018 | |||||||
| +
| 10-K | 12/31/2017 | 10.B5 | 2/28/2018 | |||||||
| +
| 8-K | 10.1 | 2/17/2021 | ||||||||
10.B5 | + | 10-Q | 3/31/2022 | 10.2 | 5/6/2022 | |||||||
10.B6 | + | 10-Q | 3/31/2022 | 10.3 | 5/6/2022 | |||||||
10.B7 | + | 10-Q | 3/31/2022 | 10.4 | 5/6/2022 | |||||||
| +
| 10-K | 12/31/2022 | 10.B9 | 2/28/2023 | |||||||
83
Incorporated by Reference | ||||||||||||
Exhibit Number | Exhibit Description | Form | Period Ending | Exhibit | Filing Date | |||||||
10.B9 | + | 10-K | 12/31/2022 | 10.B10 | 2/28/2023 | |||||||
| +
| |||||||||||
|
|
| 12/31/2022 |
|
| |||||||
| +
| |||||||||||
|
| 8-K | 10.B | 8/29/2007 | ||||||||
10.C2 | + | Form of Viad Corp Executive Severance Plan (Tier I-2013) effective as February 27, 2013. | 8-K | 10.B | 3/5/2013 | |||||||
10.C3 | + | 8-K | 10 | 3/4/2014 | ||||||||
10.C4 | + | 8-K | 10.B | 12/5/2014 | ||||||||
10.C5 | + | 10-K | 12/31/2015 |
| 3/11/2016 | |||||||
| + |
|
|
|
| |||||||
|
|
|
|
| ||||||||
|
|
|
|
| ||||||||
|
| Viad Corp Supplemental Pension Plan, amended and restated as of January 1, 2005 for Code Section 409A. | 8-K | 10.A | 8/29/2007 | |||||||
| + | 8-K | 10.E | 3/5/2013 | ||||||||
| + | Executive Officer Pay Continuation Policy adopted February 7, 2007. | 8-K | 10.A | 2/13/2007 | |||||||
| +
| 10-K | 12/31/2018 | 10.H1 | 2/27/2019 | |||||||
| + | 10-K | 12/31/2008 | 10.1 | 2/27/2009 | |||||||
| + | 10-K | 12/31/ |
| 3/ | |||||||
|
| 8-K | 10.1 | 8/5/2020 | ||||||||
10.J2 | 8-K | 10.2 | 8/5/2020 | |||||||||
84
Incorporated by Reference | ||||||||||||
Exhibit Number | Exhibit Description | Form | Period Ending | Exhibit | Filing Date | |||||||
10.J3 | + | 8-K | 10.4 | 8/5/2020 | ||||||||
10.J4 | 8-K | 10.5 | 8/5/2020 | |||||||||
10.K1 | 8-K | 10.1 | 8/2/2021 | |||||||||
10.K2 | 8-K | 10.1 | 3/24/2022 | |||||||||
10.K3 | 8-K | 10.1 | 3/31/2023 | |||||||||
10.K4 | 8-K | 10.1 | 10/11/2023 | |||||||||
21 | * | |||||||||||
23 | * | |||||||||||
24 | * | |||||||||||
31.1 |
| |||||||||||
31.2 |
| |||||||||||
|
| |||||||||||
85
Incorporated by Reference | ||||||||||||
Exhibit Number | Exhibit Description | Form | Period Ending | Exhibit | Filing Date | |||||||
32.1 | ** | |||||||||||
| + * |
| ||||||||||
| *** | Inline XBRL Instance Document. | ||||||||||
101.SCH | **** | Inline XBRL Taxonomy Extension Schema Document. | ||||||||||
101.CAL | **** | Inline XBRL Taxonomy Extension Calculation Linkbase Document. | ||||||||||
| **** | Inline XBRL Taxonomy Extension Label Linkbase Document. | ||||||||||
101.PRE | **** | Inline XBRL Taxonomy Extension Presentation Linkbase Document. | ||||||||||
101.DEF | **** | Inline XBRL Taxonomy Extension Definition Linkbase Document. | ||||||||||
| *** |
| ||||||||||
|
|
| ||||||||||
* Filed herewith. ** Furnished herewith. *** The Inline XBRL Instance Document and Cover Page Interactive Data File do not appear in the Interactive Data File because their XBRL tags are embedded within the Inline XBRL document. **** Submitted electronically herewith + Management contract or compensation plan or arrangement. |
|
|
|
|
|
|
|
None.
86
VIAD CORP
SCHEDULE II – VALUATION AND QUALIFYING ACCOUNTS
|
|
|
|
| Additions |
|
| Deductions |
|
|
|
|
|
|
| |||||||||
(in thousands) |
| Balance at Beginning of Year |
|
| Charged to |
|
| Charged to |
|
| Write-Offs(2) |
|
| Other(3) |
|
| Balance at End of Year |
| ||||||
Allowances for doubtful accounts: |
|
|
|
|
|
|
|
|
|
|
|
|
|
|
|
|
|
| ||||||
December 31, 2021 |
|
| 5,310 |
|
|
| (2,700 | ) |
|
| 1 |
|
|
| (680 | ) |
|
| (123 | ) |
|
| 1,808 |
|
December 31, 2022 |
|
| 1,808 |
|
|
| 1,580 |
|
|
| — |
|
|
| (1,064 | ) |
|
| (150 | ) |
|
| 2,174 |
|
December 31, 2023 |
|
| 2,174 |
|
|
| 1,624 |
|
|
| — |
|
|
| (1,108 | ) |
|
| 211 |
|
|
| 2,901 |
|
Deferred tax valuation allowance: |
|
|
|
|
|
|
|
|
|
|
|
|
|
|
|
|
|
| ||||||
December 31, 2021 |
|
| 81,795 |
|
|
| 21,859 |
|
|
| — |
|
|
| — |
|
|
| (144 | ) |
|
| 103,510 |
|
December 31, 2022 |
|
| 103,510 |
|
|
| (702 | ) |
|
| — |
|
|
| — |
|
|
| (1,169 | ) |
|
| 101,639 |
|
December 31, 2023 |
|
| 101,639 |
|
|
| 8,047 |
|
|
| — |
|
|
| (3,365 | ) |
|
| (968 | ) |
|
| 105,353 |
|
|
|
|
|
|
| Additions |
|
| Deductions |
|
|
|
|
|
|
|
|
| ||||||
(in thousands) |
| Balance at Beginning of Year |
|
| Charged to Expense |
|
| Charged to Other Accounts |
|
| Write-Offs |
|
| Other(1) |
|
| Balance at End of Year |
| ||||||
Allowances for doubtful accounts: |
|
|
|
|
|
|
|
|
|
|
|
|
|
|
|
|
|
|
|
|
|
|
|
|
December 31, 2015 |
|
| 1,258 |
|
|
| 955 |
|
|
| 574 |
|
|
| (1,162 | ) |
|
| (32 | ) |
|
| 1,593 |
|
December 31, 2016 |
|
| 1,593 |
|
|
| 1,355 |
|
|
| 41 |
|
|
| (1,602 | ) |
|
| (45 | ) |
|
| 1,342 |
|
December 31, 2017 |
|
| 1,342 |
|
|
| 2,470 |
|
| 49 |
|
|
| (1,529 | ) |
|
| (309 | ) |
|
| 2,023 |
| |
Deferred tax valuation allowance: |
|
|
|
|
|
|
|
|
|
|
|
|
|
|
|
|
|
|
|
|
|
|
|
|
December 31, 2015 |
|
| 3,295 |
|
|
| — |
|
|
| 402 |
|
|
| (860 | ) |
|
| — |
|
|
| 2,837 |
|
December 31, 2016 |
|
| 2,837 |
|
|
| 1,406 |
|
|
| — |
|
|
| (176 | ) |
|
| (69 | ) |
|
| 3,998 |
|
December 31, 2017 |
|
| 3,998 |
|
|
| 1,385 |
|
|
| — |
|
|
| (1,595 | ) |
|
| 222 |
|
|
| 4,010 |
|
87
|
|
Pursuant to the requirements of Section 13 or 15(d) of the Securities Exchange Act of 1934, the registrant has duly caused this report to be signed on its behalf by the undersigned, thereunto duly authorized, in Phoenix, Arizona, on February 28, 2018.March 1, 2024.
VIAD CORP | ||
By: | /s/ Steven W. Moster | |
Steven W. Moster | ||
President and Chief Executive Officer | ||
Pursuant to the requirements of the Securities Exchange Act of 1934, this report has been signed below by the following persons on behalf of Viad Corpthe registrant and in the capacities and on the dates indicated:
Principal Executive Officer | |||||||
Date: |
| By: | /s/ Steven W. Moster | ||||
Steven W. Moster | |||||||
President and Chief Executive Officer, Director | |||||||
Principal Financial Officer | |||||||
Date: |
| By: | /s/ Ellen M. Ingersoll | ||||
Ellen M. Ingersoll | |||||||
Chief Financial Officer | |||||||
Principal Accounting Officer | |||||||
Date: |
| By: | /s/ Leslie S. Striedel | ||||
Leslie S. Striedel | |||||||
Chief Accounting Officer | |||||||
Directors | |||||||
| |||||||
| |||||||
| |||||||
| |||||||
| |||||||
| |||||||
| |||||||
Joshua E. Schechter* | |||||||
|
|
| |||||
Date: | March 1, 2024 | By: | /s/ Ellen M. Ingersoll | ||||
Ellen M. Ingersoll | |||||||
Attorney-in-Fact | |||||||
* Pursuant to power of attorney filed as Exhibit 24 to this 2023 Form 10-K
88
|
|
96