In this filing, we refer to: (i) our audited consolidated financial statements and notes thereto as our “Financial Statements,” (ii) our audited Consolidated Statements of
LossIncome (Loss) and Comprehensive
LossIncome (Loss) as our “Statements of
Loss,Income (Loss),” (iii) our audited Consolidated Balance Sheets as our “Balance Sheets,” and (iv) Item 7.
Managements’Management’ s Discussion and Analysis of Financial Condition and Results of Operations as our “Results of Operations.”
CAUTIONARY INFORMATION REGARDING
FORWARD-LOOKING STATEMENTS
Everi Holdings Inc. (“Everi Holdings,”
“Holdings”“Holdings,” or “Everi”) is a holding company, the assets of which are the issued and outstanding shares of capital stock of each of Everi Games Holding Inc. (“Everi Games Holding”), which owns all of the issued and outstanding shares of capital stock of Everi Games Inc. (“Everi Games” or “Games”), and Everi Payments Inc. (“Everi Payments”
or “Payments”). Unless otherwise indicated, the terms the “Company,” “we,”
“us”“us,” and “our” refer to Everi Holdings together with its consolidated subsidiaries.
Our disclosure and analysis in this Annual Report on Form 10-K contain “forward-looking” statements within the meaning of Section 27A of the Securities Act of 1933, as amended (the “Securities Act”), Section 21E of the Securities Exchange Act of 1934, as amended (the “Exchange Act”), and the Private Securities Litigation Reform Act of 1995. From time to time, we also provide forward-looking statements in other materials we release to the public, as well as oral forward-looking statements. We have tried, wherever possible, to identify such statements by using words such as
“goal,” “target,” “future,” “estimate,” “expect,” “anticipate,
” “intend,” “plan,” “believe,”
“expect,” “intend,” “estimate,“seek,” “project,” “may,” “should,” “will,” “likely,” “will likely result,” “will continue,”
“future,” “plan,” “target,” “forecast,
” “goal,” “observe,”
“seek,“strategy,”
“strategy” and other words and terms of similar meaning. The forward-looking statements in this Annual Report on Form 10-K reflect the Company’s current views with respect to future events and financial performance.
Forward-looking statements include, but are not limited to, statements regarding the following matters: trends in gaming establishment and patron usage of our products; benefits realized by using our products and services; product development, including the release of new game features and additional game and system releases in the future; regulatory approvals; gaming regulatory, card association, and statutory compliance; the implementation of new or amended card association and payment network rules; consumer collection activities; future competition; future tax liabilities; future goodwill impairment charges; international expansion; resolution of litigation; dividend policy; new customer contracts and contract renewals; future results of operations (including revenue, expenses, margins, earnings, cash flow and capital expenditures); future interest rates and interest expense; future borrowings; and future equity incentive activity and compensation expense.
Forward-looking statements are neither historical facts nor assurances of future performance. Instead, they are based only on our current beliefs, expectations, and assumptions regarding the future of our business, future plans and strategies, projections, anticipated events and trends, the economy, and other future conditions. Because forward-looking statements relate to the future, they are subject to inherent risks, uncertainties and changes in circumstances that are often difficult to predict and many of which are beyond our control. Our actual results and financial condition may differ materially from those indicated in forward-looking statements. Important factors that could cause our actual results and financial condition to differ materially from those indicated in the forward-looking statements include, without limitation:
our history of net losses and our ability to generate profits in the future;
our substantial leverage, restrictions under our indebtedness, and our ability to raise additional capitalcash to fund operations;
our ability to generate sufficient cashoperations, working capital, and capital expenditures, and to service all of our indebtedness and fund working capital and capital expenditures;
restrictions under our indebtedness;
our ability to compete in the gaming industry;
our ability to protect our intellectual property rights;
the impact of changes in FederalU.S. federal corporate tax laws;
our ability to maintain our current customers;
our ability to prevent, mitigate, or timely recover from cybersecurity breaches, attacks, and compromises;
3
| •
| our ability to execute on mergers, acquisitions or strategic alliances, including our ability to integrate and operate such acquisitions consistent with our forecasts;
|
our ability to execute on mergers, acquisitions, or strategic alliances, including our ability to integrate and operate such acquisitions consistent with our forecasts;
expectations regarding our existing and future installed base and win per day;
expectations regardingday, our product portfolio, and development and placement fee arrangements;
inaccuracies in underlying operating assumptions;
expectations regarding customers’, gaming establishments’, and patrons’ preferences and demands for future gaming offerings;
expectations regarding our product portfolio;
national and international economic conditions, including the overall growth of the gaming industry, if any;
our ability to replace revenue associated with terminated contracts; margin degradation from contract renewals;
our ability to comply with the Europay, MasterCard, and Visa global standard for cards equipped with security chip technology (“EMV”);
technological obsolescence, expenditures, and product development, and our ability to introduce new products and services, including third-party licensed content;
gaming establishment and patron preferences;
expenditures and product development;
anticipated sales performance;
national and international economic conditions;
changes in gaming regulatory, card association, and statutory requirements;
requirements, as well as regulatory and licensing difficulties;
gaming market contraction;
uncertainty of litigation outcomes;
interest rate fluctuations;
unanticipated expenses or capital needs;
technological obsolescence; and
those other risks and uncertainties discussed in “Item 7. Management'sManagement’s Discussion and Analysis of Financial Condition and Results of Operations” and “Item 1A. Risk Factors” of this Annual Report on Form 10-K.
In light of these risks and uncertainties, there can be no assurance that the forward-looking information contained in this Annual Report on Form 10-K will in fact transpire or prove to be accurate. Readers are cautioned to consider the specific risk factors described herein and in “Item 1A. Risk Factors” of this Annual Report on Form 10-K and not to place undue reliance on the forward-looking statements contained herein, which are based only on information currently available to us and speak only as of the date hereof.
We undertake no obligation to update or publicly revise any forward-looking statement, whether written or oral, that may be made from time to time, whether as a result of new information, future developments or otherwise. All subsequent written or oral forward-looking statements attributable to us or persons acting on our behalf are expressly qualified in their entirety by this paragraph. You are advised, however, to consult any further disclosures we make on related subjects in our reports and other filings with the Securities and Exchange Commission (the “SEC”).
4
PART I
Everi is a leading supplier of technology solutions for the casino gaming industry. The Company providesWe provide casino operators with a diverse portfolio of products including innovative gaming machines that power the casino floor, and casino operational and management systems that include comprehensive end-to-end payments solutions, critical intelligence offerings, and gaming operations efficiency technology. Everi’s mission istechnologies.
Everi Holdings reports its results of operations based on two operating segments: Games and FinTech. Effective April 1, 2018, we changed the name of the operating segment previously referred to
be a transformative force foras “Payments” to “Financial Technology Solutions” (“Everi FinTech” or “FinTech”). We believe this reference more accurately reflects the focus of the business segment on delivering innovative and integrated solutions to enhance the efficiency of the casino
operationsoperator, support the comprehensive regulatory and tax requirements of their gaming customers, and improve players’ gaming experience by
facilitating memorable player experiences, delivering reliable protectionproviding easy access to their funds and
security, and striving for customer satisfaction and operational excellence. We are divided into two primary business segments: “Everi Games” or “Games” and “Everi Payments” or “Payments.”payment of winnings.
Everi Games provides a number ofgaming operators products and services, for casinos, including: (a) gaming machines primarily comprised primarily of Class II and Class III slot machines placed under participation or fixed fee lease arrangements or sold to casino customers, including the award-winning TournEvent®; and that allows operators to switch from in-revenue gaming to out-of-revenue tournaments; (b) system software, licenses, ancillary equipment, and maintenance to its casino customers.maintenance; and (c) business-to-consumer and business-to-business interactive activities. In addition, Everi Games also develops and manages the central determinant system for the video lottery terminals (“VLTs”) installed in the State of New York.York and it also provides similar technology in certain tribal jurisdictions.
Everi
PaymentsFinTech provides
its casino customersgaming operators cash access and related products and services, including: (a) access to cash at gaming facilities via Automated Teller Machine (“ATM”) cash withdrawals, credit card cash access transactions, point of sale (“POS”) debit card
cash access transactions, and check verification and warranty services; (b)
fully integrated gaming industry kiosksequipment that
provideprovides cash access and
relatedefficiency-related services; (c) products and services that improve credit decision making, automate cashier operations, and enhance patron marketing activities for gaming establishments; (d) compliance, audit, and data solutions; and (e) online payment processing solutions for gaming operators in states that offer intrastate,
internet-basedInternet-based gaming, and lottery activities.
Everi Holdings was formed as a Delaware limited liability company on February 4, 2004 and was converted to a Delaware corporation on May 14, 2004. Our principal executive offices are located at 7250 South Tenaya Way, Suite 100, Las Vegas, Nevada 89113. Our telephone number is (800) 833-7110. Our website address is www.everi.com. The information on our website is not part of this Annual Report on Form 10-K or our other filings with the SEC.
We report our financial performance, and organize and manage our operations, across the following two business segments: (a) Games; and (b)
Payments.FinTech. For additional information on our segments
and the revenues generated by our products and services see “Item 7. Management’s Discussion and Analysis of Financial Condition and Results of Operations —
Operating Segments” and “Item 7. Management’s Discussion and Analysis of Financial Condition and Results of
Operations — Critical Accounting PoliciesOperations” and “Note 18 — Segment
Reporting”Information” included elsewhere in this Annual Report on Form 10-K.
A summary of our segment financial information is contained in “Note 17. Segment Information” within our Financial Statements included elsewhere in this Annual Report on Form 10-K.
Our Products and Services
Our Games products and services include commercial products,devices, such as Native American Class II products,offerings and other bingo products, Class III products,offerings, video lottery terminals, accounting and central determinant systems, and other back office systems. InWe conduct our Games segment business based on results generated from the following major revenue streams: (a) Gaming Operations; (b) Gaming Equipment and Systems; and (c) Gaming Other.
Gaming Operations
With respect to our Gaming Operations revenue stream, we primarily offer: (a) leased gaming equipment on a participation or a fixed daily fee basis; (b) local-area progressive machines; (c) wide-area progressive machines (“WAP”); (d) TournEvent® machines; (e) accounting and central determinant systems; and (f) interactive gaming activities.
In connection with our leased gaming equipment, we generally retain ownership of the
leased gaming equipmentmachines installed at customer
facilities andfacilities. We receive recurring revenue based on a percentage of the net win per day generated by the leased gaming equipment or a fixed daily
fee based on the number of player terminals installed at the facility.fee. We
also make direct sales of player terminals, licenses, back office systems and other related equipmentcontinue to
customers. The majority of these direct sales contracts are for some combination of gaming equipment, player terminals, content, system software, license fees, ancillary equipment and maintenance.5
With respect toexpand our Games business, we have expanded our licensinggame placements into new jurisdictions, increasedincrease investment in research and development, and introducedintroduce premium game products (which typically include high definition (“HD”) dual-screens, liquid crystal display (“LCD”) panels,hardware and red green blue (“RGB”) top box lighting).theme content. From our historical focus on placement of games into the Oklahoma and Washington tribal markets, Everi Games has diversified its installed base in recent years with entry into new commercial and tribal markets as well as the development and placement of premium products.markets. Everi Games has grown premium game installations with approximately 2,5322,859 units installed (representing approximately 19.0%20.4% of our installed base as of December 31, 2017)2018) since entering the category approximately fivesix years ago. Development
In connection with our WAP offering, machines placed under such arrangements fall into the leased gaming equipment category and we retain ownership of generally higher-earningsuch machines. We debuted our first WAP in Class II markets in 2017 and are now operating in Class III tribal markets as well. Spanning three product lines, our WAP is offered to customers onthe Player Classic, Core HDX, and Empire MPX cabinets. The original Class II offering, Jackpot Lockdown®, debuted with two themes — Jackpot Lockdown Mega Meltdown™ and Jackpot Lockdown High Voltage™. With the release of Diamond Blaze™ along with multiple other product offerings active on the link, the original Class II offering has expanded to Everi’s new premium games has supported Everi Games’ abilitysign package offering, Renegade 3600™.
Gaming operations also include revenues generated under our arrangement to
enter new markets, expand its footprint, and provide
broad and new content across its installed base.Everi Games provides the New York State Gaming Commission with an accounting and central determinant system for the VLTs in operation at licensed State of New York gaming facilities. In January 2018, an amendment to the agreement between Everi Games and the New York State Gaming Commission was approved and became effective. Under this amendment, Everi Games will continue to provide and maintain the central determinant system for the New York Lottery through December of 2019. As of December 31, 2017,2018, this system is connected to approximately 19,10018,500 VLTs and has the ability to interface with, provide outcomes to, and manage the VLTs. Pursuant to itsour agreement with the New York State Gaming Commission, Everi Games receiveswe receive a portion of the network-wide net win (generally, cash-in less prizes paid) per day in exchange for provision and maintenance of the central determinant system. Everi GamesWe also providesprovide central determinant system technology to Native American tribes in the State of Washingtonother licensed jurisdictions for which it receiveswe receive a portion of the revenue generated from the VLTs connected to the system.
In connection with our interactive activities, Everi operates in the following two areas: (a) business-to-consumer (“B2C”); and (b) business-to-business (“B2B”). B2C relates to games offered directly to consumers through our social, mobile application, which can be played using virtual currency. The Company earns revenues by providing the virtual currency to the consumers, or the players, whenever the consumers purchase additional virtual currency. This offering is limited to the area of free-to-play also referred to as social casinos, and is offered through connectivity with Facebook as well as mobile platforms such as the Apple App Store for Apple devices and the Google Play Store for Android devices. B2B relates to games offered to the online business partners who then offer the games to consumers. Everi has developed its own remote gaming server (“RGS”) leveraging our extensive library of land-based content that is delivered through the RGS. This library contains casino-themed social and mobile games, and games available for real money gaming (“RMG”) offered to the online business partners that operate in play-for-fun, or social casinos, and the regulated online casinos that operate in the RMG regulated markets. We enter into revenue share agreements with online business partners offering Everi's virtual games.
Gaming Equipment and Systems
With respect to our Gaming Equipment and Systems revenue stream, we enter into direct sales contracts generally for some combination of: (a) gaming equipment and player terminals, including TournEvent® machines; (b) game content; (c) license fees; (d) ancillary equipment; and (e) maintenance.
Gaming Other
With respect to our Gaming Other revenue stream, we offer our TournEvent of Champions® that allows winners of local and regional tournaments throughout the year to participate in a national tournament that results in the determination of a final champion.
Our Games products include:
Classic Mechanical Reel Games. Our full range of classic mechanical reel games provides players with a traditional, high denomination slot gaming experience. These games leverage our long-standing experience in building enduring brands, such asBlack Diamond®and and Wild Wild Gems
®, and feature a unique take on traditional slot games with eye-catching features.Super Jackpot Series™ offers large linked progressives on the Player Classic®cabinet packaged with the Foundation Signoverhead signage to display rolling progressive meters and exciting win celebrations from across the casino floor. The premiumSkyline mechanical reel seriesSkyline™ top box is a vintage-inspired bezel for the Player Classic cabinet showcasing RGBred green blue lighting and a 24-inch LCDliquid crystal display (“LCD”) panel, with successful titles includingDouble Jackpot Gems®, Kingmaker and ®, Blazin’ Gems. GemsOur ®,andlicensed brand strategy spans into brands, such asSkyline with DreamWorks Animation® themes, Smokin’ Hot Stuff
® andCasper®.
Video Reel Games. We offer a growing range of dual-screen and portrait single screen video reel games that provide a uniquely entertaining slot gaming experience. These gamesThe most recent released titles leverage the well-established Player HD and recently introduced, high-performing Core HDX®and Empire MPX™ cabinets to(E43 and E5527) that deliver eye-catching graphics and full, rich sound.Everi Way Pays games have been introduced to the market, in partnership with Lightning Box Games, for titles including More Fire, Silver Pride, and Great Tiger. A range of progressive features round out our game library in games on the E43, such asMust-Hit Jackpots™ in Lighting Zap JackpotsDream Catcher™, Diamond Rain®, Diamond Rain Jackpot Wheel™, Cash Money Frog®,and Diamond Money™. The E5527 cabinet includes titles, such as Smokin’ Hot Stuff Wicked Wheel®, and Egypt Twins; and the recently introduced Jackpot Jump™ feature in Shark WeekJackpot Inferno, Payday Jackpots, Golden Riches, Fire Jewels, Hearts of Egypt and Fiesta. Additional specialized game mechanics include Lightning Multipliers™ in with the new Nitro™ technology enabling display features across multiple devices.High Voltage Blackout; Sticky Stacks™
in Butterfly Kingdom, Pixie Power, and Tiger Queen; Real Match™ feature on Start Magic and El Dorado The Lost City; and Wild Match™ in Fortuna Goddess of Luck and Carnival in Rio Wild Match.Core HDX. TheCore HDXcabinetenhances the player gaming experience with its dual widescreen 23”23-inch monitors with 1080p HDhigh definition (“HD”) capability, integrated touchscreens, and premium 3-way sound system. ItsThe eye-catching cabinet commands a presence on the casino floor with game-controlled lighting and a custom premium LCD topper.topper, Apex N™. SelectCore HDXgames feature Everi Bet™, the bet configuration system that gives casino operators the power to optimize the casino floor for maximum returns. The vast majority of our standard video library on our MForce® software platform is designed to be playable on theCore HDX.
Empire MPX and The Texan HDX(E43). The new Empire MPX represents both adebuted in April 2017with the launch of the Company’s first premium participation cabinet on its WAP, and then launched its for-sale category Empire MPX products in December 2017.The new cabinet features a single-screen for sale cabinet that offers a 43-inch monitor, full 1080p HD graphics capabilities, and a fully-customizable touchscreen button panel, and a smaller footprint thatpanel. Its efficient design allows for tighter bank configuration. Empire MPX licensed video content includes Casablanca™, Penn & Teller®, Buffy the Vampire Slayer™, Singin’ in the Rain™, and Willie Nelson™.
Empire MPX (E5527). The E5527 is also uniquely designed to occupy less space on the casino floor, allowing for easy game bank and pod banking configurations.6
The all-new premium lease cabinet features a portrait oriented 55-inch upper display and landscape oriented 27-inch lower display that are sure to dazzle players. The cabinet leverages proven technology from Everi’s Empire MPX debuted in April 2017to deliver an exciting new player experience with visuals never before seen on an Everi gaming device. With its leading-edge cabinet design and innovative technology features, that both players and casino operators will appreciate, E5527 commands attention on the launch of the Company’s first video title on its WAP. casino floor.
The Texan HDX™. The Texan HDX is an 8-foot tall cabinet with twindual 42-inch HD video screens featuringand features a two-person bench seat.seat, integrated touch screens, and a premium three-way sound system. The cabinet is designed to showcase the Everi Standard Video Librarystandard video library in an oversized format, allowing the games to be prominently displayed on the casino floor.Wide Area Progressive.
We debuted our first WAP in Class II markets in 2017. Spanning two product lines, our WAP is offered to customers on TournEventPlayer Classic and ®Empire MPX. The mechanical offering, Jackpot Lockdown, debuted with two themes: Jackpot Lockdown Mega Meltdown and Jackpot Lockdown High Voltage, and will have additional branded themes including Willie Nelson and Singing in the Rain available in 2018. Empire MPX features branded video content with Casablanca and Penn & Teller, all hitting the casino floor in 2017, and new titles, including Buffy the Vampire Slayer and South Park, expected to be delivered in 2018.TournEvent®. Our award-winning slot tournament system is a proven solution that allows gaming operators to switch from in-revenue gaming to out-of-revenue tournaments with the simple click of a mouse. TournEvent®’s expansive tournament game library helps operators customize their tournaments, including providing unique bonus opportunities that improve scores or automatically move a playerand to first place. Casino operators can easily design and build a variety of flexible tournament formats, such as solo or team tournament play, session or round winner advancement, and cumulative or maximum scoring.scoring, including providing bonus opportunities that improve scores or automatically move a player to first place. The latestTournEvent® 5.0 game version includes new system enhancements that improve operator efficiencies and hardware and offers engaging tournament games that attractsattract players. New TournEvent® 5.0 features include:
Automated Wild Card drawing and feature for potential round advancement that automates current tournament procedure and facilitates a smooth player selection process, utilizing overhead signage to quickly identify players who were randomly selected to advance.
Find Your Seat Helper that allows operators to preset a color for tournamentbanks/electronic gaming machines (“EGMs”), auto assign colors to players, and display player names on EGM screens, allowing players to quickly locate their assigned seats.
Automated VIP Filter that allows operators to filter a player database so that only select players will be automatically registered into tournaments when a player card is swiped.
On Deck Display feature that consists of three session panes, which continuously display player registrations in real-time and allow players to see who is in the current and future sessions.
New Skill Tournament Games with interactive bonuses:
| o
| Fruit Ninja® is an interactive game, much like the popular mobile app game that brings skill into slot tournaments.
|
| o
| Electric Diamonds features two new interactive bonuses, Pop Frenzy and Reel Frenzy.
|
With the wireless tablet option, casino operators will be able to sign up players for tournaments remotely, allowing for a more efficient tournament registration and an overall better tournament experience for the casinos and players alike. TournEvent® also is available with multiple sign options, consisting of a 65-inch television, lighted accent dividers, and the ability to be featured on new bank configurations.
Our
PaymentsFinTech products and services include solutions that we provide directly to gaming establishments to offer their patrons cash
access relatedaccess-related services and products including: access to cash at gaming facilities via ATM cash withdrawals, credit card cash access transactions, and POS debit card cash access transactions; check-related services; fully integrated kiosks and maintenance services; compliance, audit, and data software; casino credit data and reporting
servicesservices; and other ancillary offerings.
The markets we address We conduct our FinTech segment business based on results generated from the following major revenue streams: (a) Cash Access; (b) Equipment; and (c) Information Services and Other.
Cash Access
In connection with our
principal Payments products andCash Access services,
are:we offer the following:
ATM Cash Withdrawals. ATM cash withdrawal transactions represent the largest category of electronic payment transactions that we process, as measured by dollar and transaction volume. In an ATM cash withdrawal transaction,7
a patron directly accesses funds from a device enabled with our ATM service by either using an ATM card or a debit card to withdraw funds from the patron’s demand deposit account, or using a credit card to access the patron’s line of credit. In either event, the patron must use the personal identification number (“PIN”) associated with such card. Our processor then routes the transaction request through an electronic funds transfer (“EFT”) network to the patron’s bank or issuer, as applicable.
Depending upon a number of factors, including the patron’s account balance or credit limit and daily withdrawal limit (which limits are set by the bank or issuer, as applicable), the bank or issuer will either authorize or decline the transaction. If the transaction is authorized, then the ATM-enabled device dispenses the cash to the patron. For a transaction using an ATM card or a debit card, the patron’s demand deposit account is debited by the amount of cash disbursed plus a service fee that we assess the patron for the use of the ATM service. For a transaction using a credit card with a PIN, the patron’s credit card account is charged by the amount of the cash disbursed plus a service fee that we assess the patron for the use of the ATM service. In both cases, the service fee is currently a fixed dollar amount and not a percentage of the transaction size. We also receive a fee, which we refer to as a reverse interchange fee, from the patron’s card-issuing bank for accommodating the card issuer’s customer. In most circumstances, we pay a percentage of the service feethat we receive from the patron and, in some circumstances, a portion of the reverse interchange fees we receive, as a commission to our gaming establishment customers for the right to operate on their premises. Credit Card Cash Access Transactions and POS Debit Card Cash Access Transactions. Patrons can perform credit card cash access transactions and POS debit card cash access transactions using many of our enabled devices. A patron’s credit card cash access limit is usually a sub-limit of the total credit line and is set by the card-issuing bank, not Everi Payments.FinTech. These limits vary significantly and can be larger or smaller than the POS debit cash access limit. A credit card cash access transaction obligates the patron to repay the issuing bank over time on terms that are preset by the cardholder agreement. A patron’s POS debit card allows the patron to make cash withdrawals at the POS in an amount equal to the lesser of the amount of funds in the account, or a daily limit that is generally five to ten times as large as the patron’s daily ATM limit. When a patron requests a credit card cash access or POS debit card
cash access transaction, our processor routes the transaction request through one of the card associations, or EFT networks, to the issuing bank. Depending upon several factors, such as the available credit or bank account balance, the transaction is either authorized or declined by the issuing bank. If authorized, the patron’s bank account is debited or the patron’s credit card balance is increased, in both cases, by an amount equal to the funds requested plus our service fee. The service fee is a fixed dollar amount, a percentage of the transaction size, or a combination of a fixed dollar amount and percentage of the transaction size. If the transaction is authorized, the device informs the patron that the transaction has been approved. The device then further instructs the patron to proceed to the gaming establishment’s cashier, or Company-operated satellite cage (“financial services center”), to complete the transaction because credit card cash access and POS debit card cash access transactions must, in most circumstances, be completed in face-to-face environments and a unique signature must be received in order to comply with rules of the card associations.
Once at the gaming establishment’s cashier or at our financial services center, the patron acknowledges acceptance of the fee. We reimburse the gaming establishment for the amount of cash that it provided to the patron by paying the gaming establishment via wire transfer or other similar form of electronic payment. In addition, we
generally pay the gaming establishment a portion of the service fee as a commission for the right to operate on its
premises, although this payment as a percentage of the fee is generally smaller for credit card cash access and POS debit card cash access transactions than for ATM withdrawals. In addition, wepremises. We are
also obligated to pay interchange fees to the issuing bank and processing costs related to the electronic payment transaction to card associations.
Check-Related Services. Patrons are able to cash checks at certain gaming establishments. When a patron presents a check to the cashier, the gaming establishment can accept or deny the transaction based on its own customer information and at its own risk, obtain third-party verification information about the check writer, the bank account number, and other information relating to the check to manage its risk, or obtain a warranty on payment of the check, which entitles the gaming establishment to reimbursement of the full amount of the check if it is dishonored.
If a gaming establishment chooses to have a check warranted, it sends a request to a check warranty service provider, inquiring whether it would be willing to accept the risk of cashing the check. If the check warranty provider accepts the risk and warrants the check, the gaming establishment negotiates the patron’s check by providing cash for the face amount of the check. If the check is dishonored by the patron’s bank upon presentment,
8
the gaming establishment invokes the warranty, and the check warranty service provider purchases the check from the gaming establishment for the full check amount and then pursues collection activities on its own.
For those gaming establishments that seek to manage their own risk, we provide a subscription check verification service via a database operated by our subsidiary, Central Credit, LLC (“Central Credit”), which is used by gaming establishments to make credit issuing decisions. Central Credit maintains information on the check cashing and credit history of many gaming establishment patrons. For those gaming establishments that prefer to obtain a warranty, we
currently provide check warranty services through a third-party check warranty service provider. We pay this third-party provider to assist with the warranty decision, check processing, billing, and collection activities. On our behalf, this third-party provider charges our gaming establishment customers a fee for the check warranty services, which is typically a percentage of the face amount of the check being warranted. In such circumstances, we receive all of the check warranty revenue. We are exposed to risk for the losses associated with any warranted items that cannot be collected from patrons issuing the items. Warranty expenses are defined as any amounts paid by the third-party provider to gaming establishments to purchase dishonored checks that will not be collectible from patrons and any expenses related to the collection on these amounts. We also pay certain fees and operating expenses to our third-party provider related to the provision of these services.
Our principal Payments products and services consist of the following:
Casino Cash Plus 3-in-1 ATMsare unmanned, cash-dispensing machines that enable ATM cash withdrawals, POS debit card cash access transactions, and credit card cash access transactions directly or using our 3-in-1 Rollover functionality. Most financial institutions that issue debit cards impose daily ATM withdrawal limits, and, in some instances, aggregate and count Friday, Saturday, and Sunday as a single day in calculating such limits. If a patron has reached his or her daily ATM limit, our 3-in-1 Rollover functionality automatically enables the patron to obtain funds via a POS debit card cash access transaction or a credit card cash access transaction instead.Check Verification and Warranty Services
allow gaming establishments to manage and reduce risk on patron checks that they cash. A gaming establishment can query our Central Credit database to review the check cashing history ofCashClub®is a gaming establishment patron before deciding whether to cash the patron’s check. If the gaming establishment desires additional protection against loss, it can seek a warranty on payment of the check. We have a relationship with a third-party check warranty service provider to market check warranty services to gaming establishments.CashClub®software payments platform that provides gaming establishments with a single dashboardpersonal computer workstation software user interface and point-of-sale terminal that streamlines credit and debit card cash access transaction processing and check warranty transactions.transactions for casino patrons. It allows for electronic signature capture and dynamic currency conversion. It also interfaces with our Everi Compliance solutions (defined below) to assist casino operations with meeting regulatory requirements under Title 31 of the Bank Secrecy Act.
Equipment
In connection with our Equipment, we offer the following:
Fully Integrated Kiosks are a complete line of products that provide multiple functions to the casino floor. This includes cash access functionality, such as our 3-in-1 Rollover, which provides casino patrons access to perform cash advance, POS debit, and ATM transactions. The kiosks also provide functionality to perform check cashing transactions, slot machine ticket redemption, bill breaking, and loyalty program access as well as integration with mobile and wallet technology. The availability of our cash access platform on these slot ticket redemption devices provides us with additional points of contact with gaming patrons at locations that are usually closer to gaming devices than traditional cash access devices that are typically located on the periphery of the gaming area within the casino floor and also provides gaming patrons with more opportunities to access their cash with less cashier involvement. Other Integrated Kiosk Solutions provide casinos with more efficient and streamlined methods for cash handling and transaction processing. They allow casino personnel to immediately process and dispense taxable jackpots in the form of cash, tickets or a combination of both. They also help to improve cage security and accuracy while reducing count and balancing times. These products are designed to be integrated with our suite ofcash access products and cage compliance software to ensureensuring compliance with anti-money laundering regulations, and provide an automated way to process common tax forms, such as the Internal Revenue Service Form W-2G or Form 1042-S. In addition, we offer equipment in the form of standalone, non-ATM terminals that perform authorizations for credit card cash access and POS debit card cash access transactions. Our kiosk solutions include the following products:
JackpotXchange family of kiosks, JXC 4.0,and JXC-L, enable casino personnel to efficiently access funds to pay out jackpots for their guests. These kiosks are integrated with all major slot systems to offer jackpot processing and pay-out in a combination of cash or slot tickets. These kiosks offer gaming operators the ability to reduce workload at the cage and for slot personnel.
JackpotXpress is a full-featured jackpot and tax form management platform that allows casino personnel to work through the complex jackpot process using a mobile tablet or kiosk. JackpotXpress allows gaming operators to reduce jackpot wait times, eliminate cumbersome paper documents, and perform “know your customer” checks. It is fully integrated with our Everi Compliance (defined below), CageXchange, and JackpotXchange products.
CageXchange is a cash dispensing device that helps streamline casino cage operations. With CageXchange, cash is securely vaulted, creating increased security while also reducing cash shrinkage and helping to improve cashier accuracy. Additional efficiencies are achieved from accelerating the process of cage cashiers obtaining money from the vault. CageXchange is integrated with CashClub® to create an efficient transaction for casino guests.
Our Cash Recycling Solutions allow casinos to fully automate the check in and check out process of money, saving time and expense. As gaming establishments vary in size and complexity, these Cash Recycling Solutions support a number of diverse resort operations such as retail, food and beverage, entertainment, and gaming operations.
Information Services and Other
In connection with our Information Services and Other solutions, we offer the following:
Maintenance provides for various forms of support to maintain our fully integrated kiosks. Our support operations, field service, and customer engagement teams provide quarterly and annual maintenance on these products and software systems to help maximize the efficiency of our products.
Everi Compliance is our suite of compliance software offerings for gaming operators that help gaming establishments comply with financial services and gaming regulations, which include software to assist with anti-money laundering regulations, such as filing currency transaction reports (“CTRs”), and suspicious activity reports (“SARs”). In addition, these compliance solutions assist with “know your customer” checks to ensure transactions are appropriately conducted.
Central Creditis our gaming patron credit bureau service which, on a subscription basis, allows gaming establishments to improve their credit-granting decisions by obtaining access to a database containing credit information and transaction data on millions of gaming patrons. Our gaming credit reports are comprised of9
information recorded from patron credit histories at hundreds of gaming establishments. We provide such information to gaming establishments that subscribe to the service. These establishments then use that data, among other things, to determine how much credit, if any, they will grant to a gaming patron. We typically charge our customers for access to gaming patron credit reports on a monthly basis and our fees are generally comprised of a fixed minimum fee plus per-transaction charges for certain requests.
Everi Compliance is our suite of compliance software offerings for gaming operators. These compliance solutions help our gaming establishment customers comply with financial services and gaming regulations. These compliance
Other solutions include
software to assist with anti-money laundering regulations, such as filing currency transaction reports (“CTRs”) and suspicious activity reports (“SARs”). Additionally, these compliance solutions also assist casinos in filing required tax forms in connection with the payout of jackpot winnings to patrons and assist casinos with auditing cash on the floor and in casino cages.We also offer:
Stand alone, non-ATM terminals that perform authorizations for credit card cash access and POS debit card cash access transactions.
Databasedatabase services that allow gaming establishments access to information from our proprietary patron transaction database for purposes of player acquisition, direct marketing, market share analysis, and a variety of other patron promotional uses. Our proprietary patron transaction database includes information that is captured from transactions we process. Patrons may “opt out” of having their names included in marketing mailing lists.
An We also offer an online payment processing solution for gaming operators in states that offer intra-state, internet-basedInternet-based gaming, and lottery activities.
Manufacturing
Manufacturing
We utilize contract manufacturers to produce the cabinets that make up our
EGMs and ourelectronic gaming machines (“EGMs”), kiosk products,
as well asand other sub-assemblies. We have assembly facilities in Austin, Texas and Las Vegas, Nevada, where we assemble the EGMs and our kiosk products, which include the cabinets, computer assemblies, LCD screens, printers, bill validators and acceptors, and other wiring and harnesses. We believe that our sources of supply of component parts and raw materials for our products are generally adequate and we have few sole-sourced parts.
We conduct research and development activities primarily to develop gaming systems,
gaminggame engines, casino data management systems,
casino central monitoringbingo outcome determination systems, video lottery outcome determination systems, gaming platforms, and gaming content,
as well asand to
add enhancements toenhance our existing product lines. We believe our ability to deliver differentiated, appealing products and services to the marketplace is based on our research and development investments, and we expect to continue to make such investments in the future. Research and development costs consist primarily of salaries and benefits, consulting fees, and game lab testing fees. Once the technological feasibility of a project has been established, it is
transferred from research to development and capitalization of development costs beginscapitalized until
the product isit becomes available for general release.
Research and development costs were $18.9 million, $19.4 million and $19.1 million for the years ended December 31, 2017, 2016 and 2015, respectively.As of December 31,
2017,2018, we served
over 1,000approximately 1,450 casinos and other gaming properties in the United States, Europe, Canada, the Caribbean, Central America, and Asia. In certain limited circumstances, we provide our products and services to non-gaming establishments, such as gas stations and other retail businesses associated with gaming establishment customers. However, the revenue generated from these operations is not material to our operations and we do not actively market or target non-gaming establishment customers.
10
In our Games business, we sell and market our products and services to gaming establishments primarily through the use of a direct sales force, which targets gaming establishments in the United States and in
certain international markets. With respect to our gaming products, we participate in the Class
IIIII and Class
IIIII gaming machine markets,
as well asand the central determinant system market in North America, through participation, or revenue share, and fixed fee arrangements, and the sale of proprietary EGMs and systems.
Revenues from our operations outside the United States were 4.7%, 3.7% and 2.9% for the years ended December 31, 2017, 2016 and 2015, respectively. All of our long-lived assets outside of the United States were immaterial for each of fiscal 2017 and 2016.In our PaymentsFinTech business, we sell and market Cash Access (Cash(i.e., Cash Advance, ATM, and Check Services), Equipment (i.e., Kiosks SalesSales), Information Services and Other (i.e., Kiosk Services, Compliance Sales and Services, and Central Credit Services. ForServices, and Ancillary Services) through the year ended December 31, 2017, approximately 95%use of a direct sales force, which targets gaming establishments in the United States and in certain international markets.
With respect to both our
revenues were earned from North American sources, while the remaining 5% were derived internationally.OurGames and FinTech businesses, our sales and marketing efforts are directed by a team of customer service executives, each of whom has business development responsibility for gaming establishments in specified geographic regions.
These customer service executives direct their efforts at
allvarious levels of gaming establishment personnel,
includingincluding: senior executives, finance professionals, marketing staff, slot directors, and cashiers, and seek to educate them on the benefits of our products and services. In some cases, our customer service executives are supported by field service and
account managers,customer engagement teams, who provide on-site customer service to most of our customers. In other cases, our sales executives directly maintain the customer relationships. These customer service executives and field service and
account managerscustomer engagement teams generally reside in the vicinity of the specific gaming establishments
that they support to ensure
that they responda prompt response to the
customer service needs of those gaming establishments. We also have joint sales efforts with a number of strategic partners, including independent sales organizations, which allow us to market our products and services to gaming establishments through channels other than our direct sales force.
With respect to our Games business, we compete across different gaming markets with a variety of gaming equipment suppliers. Competition is generally based upon the: (a) amount of revenue our products generate for our customers relative to the amount of revenue generated by our competitors’ products; (b) prices and fees we and our competitors charge for products and services offered; and (c) appeal of our competitors’ products to gaming patrons, which has a direct effect on the volume of play generated by a product and, accordingly, the revenues generated for our customers. To drive customer demand and improve product attractiveness,
to end users, we continually work to develop new game themes,
gaminggame engines, hardware platforms, and systems that appeal to gaming patrons, all while working to release these new products to the marketplace in a timely manner.
In
With respect to our
PaymentsFinTech business, we compete with other providers of cash access services to the gaming industry as well as with financial institutions and other regional and local banks that operate ATMs on the premises of gaming establishments. Some of these other providers and financial institutions have established cooperative relationships with each other to expand their service offerings. We also face increased competition from: (a) independent sales organizations, which provide basic services and aggressive pricing; (b) other manufacturers that provide similar
goodgoods and services; and (c) traditional transaction processors that have entered the gaming patron cash access services market. This increased competition amongst these various providers of cash access services has resulted in pricing pressure and margin erosion with respect to our core cash access products and services.
Proprietary Rights
In addition to competing with various providers of cash access services, FinTech has experienced competition from either those same providers or stand-alone providers of anti-money laundering compliance products and self-service kiosks for ticket redemption and jackpot redemption.
Intellectual Property
We believe the ability to introduce and respond to technological innovation in the gaming industry will be an increasingly important qualification for the future success of any provider of cash access and gaming-related products and services. Our continued competitiveness will depend on: (a) the pace of our new product development; (b) our patent, copyright, trademark, and trade secret protection; and (c) our relationships with customers. Our business development personnel work with gaming establishments, our technology and other strategic partners, and the suppliers of the financial services upon which our cash access services rely, to design and develop innovative products and services that appeal to gaming patrons.
11
We rely on a combination of patents, trademarks, copyrights, trade secrets, and contractual restrictions to protect our intellectual property.
In our business, we have over 250 patents issued related to games and systems and processes, and have more than 50 patent applications pending world-wide. The expiration dates of these patents vary and are based on their filing and issuances dates. We intend to continue to actively file for patent protection, when such filings are commercially reasonable, within and outside the United States. We also seek trademark protection for our names and products and have registered hundreds of trademarks in the United States and various foreign countries. Under permission or license agreements with third parties, we also sell gaming products covered by independently filed copyrights, trademarks, or patents. Typically, these contracts require us to pay royalties to the licensing party. Royalty expenses are included in the cost of gaming and systems in our Financial Statements included elsewhere in this Annual Report on Form 10-K. In addition to our patents, trademarks, and copyrights, we also rely on a broader scope of intellectual property including trade secrets, in-house know-how, and innovation.
Seasonality
Our revenues and cash flows may fluctuate throughout the year driven by seasonality in player demand and activity. We generally experience higher operating results during the first half of a year and lower operating results during the second half of a year, however, such fluctuations do not have a material impact on our revenues and cash flows.
As of December 31,
2017,2018, we had approximately
1,1001,250 employees. We believe that our relations with our employees are good. We have never experienced a work stoppage and none of our employees are subject to a collective bargaining agreement.
Our website address is www.everi.com. We make available free of charge on our website our Annual Reports on Form 10-K, Quarterly Reports on Form 10-Q, Current Reports on Form 8-K, and all amendments to those reports filed or furnished pursuant to Section 13(a) or 15(d) of the Exchange Act, as soon as reasonably practicable after such reports are electronically filed with, or furnished to, the SEC. In addition, our earnings conference calls are web cast live via our website. In addition to visiting our website, you may read
and copy any document we file with the SEC at
the SEC’s Public Reference Room at 100 F. Street NE, Washington, D.C. 20549 or at www.sec.gov.
Please call the SEC at 1-800-SEC-0330 for information on the Public Reference Room.REGULATION
Gaming Regulation
The gaming industry is highly regulated under legal systems that frequently evolve and change based on governmental public policies. Various aspects of our business are subject to comprehensive laws, regulations and ordinances applicable to the ownership, management and operation of gambling establishments as well as certain financial services conducted at such establishments. These gaming laws, regulations and ordinances require us to be licensed, registered, found suitable, qualified or otherwise approved by various city, county, state, provincial, federal, tribal and foreign government agencies (collectively, “Gaming Authorities”) in the jurisdictions where we conduct business. We must maintain those licenses, registrations, or other approvals in good standing to continue our business, all of which generally impose certain: (i) financial and operational reporting, and oversight requirements; and (ii) character and fitness suitability requirements, in each case administered by the Gaming Authorities, upon us and our affiliated or subsidiary organizations, as well as the officers, directors, key personnel and, in certain instances, holders of our debt or equity securities in each of those organizations, and our material business associates. Gaming Authorities have broad discretion in determining whether to grant a license, registration or other approval. Subject to complying with certain procedural requirements, Gaming Authorities may deny any application, or limit, condition, restrict, revoke or suspend any license, registration, finding of suitability, qualification or other approval for any cause deemed reasonable to them.
In general, the licensure, qualification and approval requirements and the regulations imposed on non-gaming suppliers and vendors are less stringent than those requirements and regulations imposed on gaming operators, gaming-related manufacturers and suppliers. However, some jurisdictions do not distinguish between non-gaming and gaming suppliers and vendors while other jurisdictions classify all of our products and services as gaming-related. In those jurisdictions which classify our products and services as gaming-related, we are subject to the more stringent licensing and regulatory framework. The stated policies and other purposes behind such laws, regulations, and ordinances are generally to: (i) ensure the public’s trust and confidence in legalized gambling through a system of mandated regulation, internal controls, accounting practices, and operating procedures; and (ii) promote economic activity for the state, county and local governments through revenue opportunities emanating from taxes, licensing fees, and other economic benefits arising out of gambling and related activities.
12
Moreover, our gaming devices and certain other products and technologies must be certified or approved by Gaming Authorities in many jurisdictions where we conduct business. These Gaming Authorities test the gaming devices, systems, and related equipment directly or through an independent testing laboratory and may also require a field trial under the regulator’s technical standards before allowing us to sell the product. Although we collaborate closely with the Gaming Authorities and independent testing laboratories, we cannot control whether our products will be approved or the length of time taken to review our products for sale to third parties.REGULATION
General
We believe that we are in substantial compliance with all material gaming and financial institution laws applicable to our business.
We have a diligent internal compliance program to ensure compliance with our business activities, as well as legal requirements generally applicable to all publicly traded companies. The compliance program is directed on a day-to-day basis by our Chief Compliance Officer. Legal advice is provided by attorneys from the Company’s legal department and outside experts. The compliance program is overseen by the Corporate Compliance Committee, which includes a gaming law expert as an independent member. We can give no assurance, however, that our business activities or the activities of our customers in the gaming industry will not be subject to any regulatory or legal enforcement proceedings in the future and a violation of applicable
gaming laws by us or any of our subsidiaries could have a material adverse effect on our financial condition, prospects, and results of operations. Depending on the nature of any noncompliance, our failure to comply with such laws, regulations, and ordinances may result in the suspension or revocation of any license, registration, or other approval, a partial or complete cessation of our business, seizure of our assets, as well as the imposition of civil fines and criminal penalties.
Gaming Regulation
The gaming industry is highly regulated under legal systems that frequently evolve and change based on governmental public policies. Various aspects of our business are subject to comprehensive laws, regulations, and ordinances applicable to the ownership, management, and operation of gambling establishments as well as certain financial services conducted at such establishments. The stated policies and other purposes behind such laws, regulations, and ordinances are generally to: (i) ensure the public’s trust and confidence in legalized gambling through a system of mandated regulation, internal controls, accounting practices, and operating procedures; and (ii) promote economic activity for the state, county, and local governments through revenue opportunities emanating from taxes, licensing fees, and other economic benefits arising out of gambling and related activities.
A description of the material regulations to which we are subject is set forth below.
Federal Regulation
. At the federal level, we are subject to two key pieces of legislation. Our Native American customers are regulated by the National Indian Gaming Commission (“NIGC”), which was established by the Indian Gaming Regulatory Act of 1988 (the “IGRA”). The NIGC has regulatory authority over certain aspects of Native American gaming and defines the boundaries of our dealings with the Native American marketplace and the level of regulatory authority to which these games are subject. IGRA establishes three classes of gaming, each with a different regulatory framework:AuthoritiesClass
| | Type of Games
| | Regulatory Oversight
|
I
| | Social gaming for minimal prizes and traditional Indian gaming.
| | Exclusive regulation and oversight by tribal governments.
|
II
| | Bingo (both in traditional and electronic form).
| | Regulation by tribal governments with NIGC oversight.
|
III
| | Casino style games (including slot machines, blackjack, craps and roulette).
| | Must be permitted by the state in which the tribe is located. The state and the tribe must have negotiated a compact approved by NIGC, and the tribe must have adopted a gaming ordinance approved by the NIGC.
|
We sell our gaming devices and systems in both Class II and Class III markets.
The Johnson Act, as amended by the Federal Gambling Devices Act of 1962 (the “Johnson Act”), requires that we register annually with the Criminal Division of the United States Department of Justice and requires a wide variety of record keeping and equipment identification efforts on our part. Registration is required in order for us to sell, distribute, manufacture, transport, or receive gaming equipment, machines or components across state lines. If we fail to comply with the requirements set forth under the Johnson Act, we could become subject to a variety of penalties, including, but not limited to, the seizure and forfeiture of equipment.
State and Tribal Gaming Commissions. We are regulated by gaming commissions or similar authorities atvarious city, county, state, provincial, federal, tribal, and foreign government agencies (collectively, “Gaming Authorities”) in the state or tribal leveljurisdictions where we conduct business as either a: (i) manufacturer of gaming devices, in those jurisdictions where we manufacture gaming devices and systems; (ii) supplier of “associated equipment,” in those jurisdictions where we sell and service fully integrated kiosks and other integrated kiosk solutions; and (iii) non-gaming supplier or vendor, in those jurisdictions where we provide cash access and Central Credit services only. Such commissionsWe must maintain those licenses, registrations, or similar authoritiesother approvals in good standing to continue our business. Gaming Authorities have broad discretion in determining whether to grant a license, registration, or other approval. Subject to complying with certain procedural requirements, Gaming Authorities may include: Nevada Gaming Commissiondeny any application, or limit, condition, restrict, revoke or suspend any license, registration, finding of suitability, qualification, or other approval for any cause deemed reasonable to them.
Approvals, Licensing and
Gaming Control Board, Mississippi Gaming Commission, Indiana Gaming Commission, Illinois Gaming Board, New Jersey Casino Control Commission, New Jersey Division of Gaming Enforcement, Iowa Racing and Gaming Commission, the Kansas Lottery Commission, the Kansas Racing and Gaming Commission, the Louisiana State Gaming Control Board, the Louisiana State Racing Commission, as well as other various federal, state and local government entities and agencies.13
Suitability
The process of obtaining necessary licenses, registrations, or other approvals often involves substantial disclosure of confidential or proprietary information about us and our officers, directors, key personnel and, in certain instances, beneficial owners of our debt or equity securities, and requires a determination by the regulators as to our suitability as a manufacturer, supplier, or vendor to gaming establishments.
Such suitability examinations may also generally include the following:requiring the licensure or finding of suitability of any of our officers, directors, key employees, or beneficial owners of our debt or equity securities as well as our key third-party vendors, suppliers, customers, and other companies with whom we conduct business;
the termination or disassociation with such officer, director, key employee, or beneficial owner of our securities that fails to file an application or to obtain a license or finding of suitability and prohibiting unapproved payments and distributions to such persons;
the submission of detailed financial and operating reports;
the submission of reports of material loans, leases, sales of securities, and financings; and
the regulatory approval of certain material transactions, such as the merger with or acquisition of other companies, the transfer or pledge of our stock or other equity interests or restrictions on transfer of such interests, or similar financing transactions.
These regulatory obligations are imposed upon gaming-related manufacturers, suppliers, or vendors on an ongoing basis, and there are no guaranties that we will be successful in obtaining and maintaining all necessary licenses, permits, and approvals and to continue to hold other necessary gaming licenses, permits, and approvals to conduct our businesses as currently being conducted by us. The expansion of our businesses, the introduction of new games, systems, products or services, or changes to applicable rules and regulations may result in additional regulatory or licensing requirements being imposed upon us. Many Gaming Authorities will require us to submit software and other key technology components of our gaming devices and systems, as well as our fully integrated kiosks and other integrated kiosk solutions, to government or third-party gaming laboratories for testing and certification prior to deploying such games, systems, and devices in a particular gaming jurisdiction.
Gaming regulatory authorities have broad discretion and may require any beneficial holder of our securities, regardless of the number of shares of common stock or amount of debt securities owned, to file an application, make personal or confidential disclosures, be investigated, and be subject to a determination of suitability. Many jurisdictions require any person who acquires beneficial ownership of more than a certain percentage of voting securities of a gaming company and, in some jurisdictions, non-voting securities, typically 5%, to report the acquisition to Gaming Authorities, and Gaming Authorities may require such holders to apply for qualification or a finding of suitability, subject to limited exceptions for “institutional investors” that hold a company’s voting securities for investment purposes only. If a beneficial holder of our securities is a corporation, partnership,
Product Approvals
Our gaming devices and certain other products and technologies must be certified or trust, such entity must submit detailed businessapproved by Gaming Authorities in many jurisdictions where we conduct business. These Gaming Authorities test the gaming devices, systems, and financial information, which may include information regarding its officers, directors, partners, key personnel,related equipment directly or through an independent testing laboratory and beneficial owners. Further disclosure by those officers, directors, partners, key personnel, and beneficial owners may also require a field trial under the regulator’s technical standards before allowing us to sell the product. Although we collaborate closely with the Gaming Authorities and independent testing laboratories, we cannot control whether our products will be required. Under some circumstancesapproved or the length of time taken to review our products for sale to third parties. Moreover, there are no guarantees that we will be successful in obtaining and in some jurisdictions, an institutional investor,maintaining all necessary licenses, permits, and approvals and to continue to hold other necessary gaming licenses, permits, and approvals to conduct our businesses either as defined incurrently being conducted by us or to expand our businesses.
Our Native American customers are regulated by the
applicable gaming regulations, that acquires and holds a specified amountNational Indian Gaming Commission (“NIGC”), which was established by the Indian Gaming Regulatory Act of
our securities in the ordinary course of its business may apply to the1988 (“IGRA”). The NIGC has regulatory authority
for a waiverover certain aspects of
these licensure, qualification, or finding of suitability requirements, provided that the institutional investor holds the voting securities for investment purposes only, meets certain thresholds relating to the number of securities held, and certifies as to its intentions not to directly or indirectly exert control or influence over the management, policies, and operations of the licensed entity or to change its corporate governance documents.Tribal-State Compacts and Tribal Regulation. Native American gaming is subject to certain federal and tribal laws, rules, and regulations, including, for purposesdefines the boundaries of illustration and without limitation, IGRA. IGRA is the federal enactment that created the NIGC, which is vestedour dealings with the Native American marketplace and the level of regulatory authority to regulatewhich these games are subject. IGRA establishes three classes of gaming, activities conducted by federally-recognized Native American tribes on Indian lands. Tribal legislation regarding gambling operations on Indian lands must be approved by theeach with a different regulatory framework:
|
| | | | |
| Class | | Type of Games | | Regulatory Oversight |
| I | | Social gaming for minimal prizes and traditional Indian gaming. | | Exclusive regulation and oversight by tribal governments. |
| II | | Bingo (both in traditional and electronic form). | | Regulation by tribal governments with NIGC oversight. |
| III | | Casino style games (including slot machines, blackjack, craps, and roulette). | | Must be permitted by the state in which the tribe is located. The state and the tribe must have negotiated a compact approved by NIGC, and the tribe must have adopted a gaming ordinance approved by the NIGC. |
We sell our gaming devices and
systems in
certain instances, compacts are required to be executed between Native American tribesboth Class II and
the state governments proximate to such Indian lands. Native American tribes must adopt and submit for NIGC approval the ordinances that regulate their gaming activities. Pursuant to the requirements of IGRA, our tribal customers require the tribe to have the sole proprietary interest in their gaming14
activities, and management contracts and collateral agreements in which tribes transfer authority to a third party for purposes of controlling all or part of the gaming operations are subject to the express review and approval of the NIGC. Because federally recognized Native American tribes are considered “domestic dependent nations” with certain sovereign rights, Native American tribes can enact their own laws and regulate gaming operations and contracts, and, with some exceptions, generally enjoy a degree of sovereign immunity, which, among other things, recognizes a tribe’s inherent authority of self-determination and self-governance, immunizes the tribe from certain lawsuits outside of tribal jurisdiction, and generally authorizes a tribe’s powers of taxation and spending over its federally-recognized nation.
Class III markets.
Class III gaming on Native American tribal lands is usually subject to the negotiation of a compact between the tribe and the proximate state attendant to where the tribe intends to operate a gaming facility. These tribal-state compacts typically include provisions entitling the state to receive significant sums of money in exchange for the tribe’s operation of Class III gaming. While tribal-state compacts are intended to document the agreement between the state and a tribe, these tribal-state compacts can be subject to disputes relative to permitted Class III gaming operations.
Charity Regulation
The Johnson Act. We have historically supplied bingo gamesThe Johnson Act, as amended by the federal Gambling Devices Act of 1962 (the “Johnson Act”), requires that we register annually with the Criminal Division of the United States Department of Justice and systemsrequires a wide variety of record keeping and equipment identification efforts on our part. Registration is required in order for us to nonprofit organizations that operate these games for charitable, educational and other lawful purposes. Bingo for charity is notsell, distribute, manufacture, transport, or receive gaming equipment, machines, or components across state lines. If we fail to comply with the requirements set forth under the Johnson Act, we could become subject to a nationwide regulatory system, such asvariety of penalties, including, but not limited to, the system created by IGRA to regulate Native American gaming,seizure and as a result, regulation for this market is generally on a state-by-state basis, although in some cases it is regulated by county commissions or other local government authorities.Lottery Commissions. Most states and the Districtforfeiture of Columbia have lotteries. The operation of lotteries is subject to extensive regulation. Many aspects of lottery operations are determined by state or local legislation, but lottery regulatory authorities exercise significant discretion to ensure the integrity of contract awards and lottery operations, including in the process of selecting suppliers of equipment, technology and services and retailers of lottery products. Lottery regulatory commissions typically require detailed background disclosure by and investigations of vendors and their subsidiaries, affiliates, principal stockholders, officers, directors, and employees who will be directly responsible for the operation of lottery systems. These regulators may have authority to order removal of employees who they deem to be unsuitable or whose presence they believe may adversely affect the operational security or integrity of the lottery. Some lottery commissions mandate extensive personal and financial disclosure and background checks from persons and entities beneficially owning a specified percentage (typically 5% or more) of a vendor’s securities. The failure of such beneficial owners of our securities to cooperate with the regulators could result in penalties, jeopardize the award of a lottery contract to us, or provide grounds for termination of an existing lottery contract.equipment.
Internet and Online Gaming Regulation. Several states have passed implementing legislation and regulations to allow certain intra-state, wager-based, online casino, or lottery games, such as online poker, online lottery, lottery ticket purchases, or lottery ticket subscriptions. This is due, in part, to: (a) a rule of construction contained within the Unlawful Internet Gaming Enforcement Act (“UIGEA”) that limits and prevents UIGEA application from altering, limiting or extending any federal, state or tribal laws regulating gambling; (b) a definition within UIGEA that excludes certain intra-state, intra-tribal and interstate horseracing transactions from the phrase “unlawful Internet gambling,” provided certain threshold requirements are met; (c) a memorandum dated September 20, 2011 and published by the United States Department of Justice, Criminal Division, in which the Department concludes, among other things, that the Federal Wire Act of 1961 (the “Wire Act”) does not apply to interstate transmissions of wire communications that do not relate to a sporting event or contest; and (d) traditional constitutional jurisprudence originating from the Commerce Clause of and Tenth (10th) Amendment to the United States Constitution and preemption jurisprudence, among others. To date, several states such as Delaware, Georgia, Illinois, Michigan, Nevada, New Jersey, New York, North Carolina, North Dakota and Pennsylvania have authorized some form of internetInternet or online gaming or lottery activities.However, the legislative and regulatory environment surrounding online, wager-based games in the United States remains uncertain and complex, and it is unclear how the legislative and regulatory framework governing these activities willmay continue to evolve in the future. Many states have yet to introduce or finalize regulations regarding the licensing and operational requirements regarding online, wager-based activity, including the licensing and technological requirements relating to the funding and processing of payments relating to online, wager-based casino and lottery games. In addition, the funding of online casino gaming activity is subject to the requirement of the UIGEA, which
15
may prohibit or significantly impede the funding of online, wager-based gaming activity. There is also a possibility that the Wire Act may be amended in the future to prevent or prohibit the use of Internet or mobile-based platforms regardless of the involvement of a sporting event or contest or that the United States Department of Justice may amend, modify, rescind, or otherwise alter its previous memoranda and that such action may result in a materially different interpretation of the Wire Act, which may result in civil or criminal enforcement actions.
Financial Services Regulation
Our
PaymentsFinTech business is also subject to a number of financial services regulations:
Durbin Amendment. Rules promulgated by the Board of Governors of the Federal Reserve System, required as part of the Dodd-Frank Wall Street Reform and Consumer Protection Act of 2010 (the “Dodd-Frank Act”), including the so-called Durbin Amendment (the “Durbin Amendment”), establish, among other things, standards for assessing whether debit card interchange fees received by certain debit card issuers are reasonable and proportional to the costs incurred by issuers for electronic debit transactions. Debit card interchange fees are established by payment card networks and ultimately paid by merchants to debit card issuers for each debit transaction.
Anti-Money Laundering. The USA PATRIOT Act of 2001, other federal statutes, generally referred to as the Bank Secrecy Act, and implementing federal regulations require us to establish and maintain an anti-money laundering program. Our anti-money laundering program includes: internal policies, procedures, and controls designed to identify and report money laundering, a designated compliance officer, an ongoing employee training program, and an independent audit function to test the program. In addition, the cash access services that we provide are subject to record keeping and reporting obligations under the Bank Secrecy Act. Our gaming establishment customers are required to file a SAR with the U.S. Treasury Department’s Financial Crimes Enforcement Network to report any suspicious transactions relevant to a possible violation of law or regulation. We are also required to file a SAR where we provide our cash access services directly to patrons through financial services centers that we staff and operate. To be reportable, such a transaction must meet criteria that are designed to identify the hiding or disguising of funds derived from illegal activities. Our gaming establishment customers, in situations where our cash access services are provided through gaming establishment cashier personnel, and we, in situations where we provide our cash access services through a financial services center, are required to file a CTR of each deposit, withdrawal, exchange of currency, or other payment or transfer by, through, or to us which involves a transaction in currency of more than $10,000 in a single day. Our CashClub® product can assist in identifying transactions that give rise to reporting obligations. When we issue or sell drafts for currency in amounts between $3,000 and $10,000, we maintain a record of information about the purchaser, such as the purchaser’s address and date of birth. Fund Transfers. Our POS debit card cash access transactions, credit card cash access transactions, and ATM services are subject to the Electronic Fund Transfer Act, which provides cardholders with rights with respect to electronic fund transfers, including the right to dispute unauthorized charges, charges that list the wrong date or amount, charges for goods and services that are not accepted or delivered as agreed, math errors, and charges for which a cardholder asks for an explanation or written proof of transaction along with a claimed error or request for clarification. We believe the necessary policies and procedures have been implemented throughout our organization in order to comply with the regulatory requirements for fund transfers.
State Money Transmission Laws. Many states where we complete credit card cash access and POS debit card cash access transactions or offer our online payment processing solution require us to have a money transmitter license. Credit Reporting. Our Central Credit gaming patron credit bureau services and check verification and warranty services are subject to the Fair Credit Reporting Act (the “FCRA”) and the Fair and Accurate Credit Transactions Act of 2003 (the “FACTA”) and their implementing rules, which require consumer credit bureaus, such as Central Credit, to provide credit report information to businesses only for certain purposes and to otherwise safeguard credit report information, to disclose to consumers their credit report on request, and to permit consumers to dispute and correct inaccurate or incomplete information in their credit report. These laws and rules also govern the information that may be contained in a consumer credit report. We continue to implement policies and procedures as well as adapt our business practices in order to comply with these laws and regulations. In addition to federal regulations, our Central Credit gaming patron credit bureau services are subject to the state credit reporting regulations that impose similar requirements to the Fair Credit Reporting ActFCRA and the Fair and Accurate Credit Transactions Act of 2003.FACTA.16
Debt Collection. We currently outsource most of our debt collection efforts to third parties. However, we do engage in debt collection to collect on chargebacks on our cash access products and unpaid balancesfor services performed for our check services, Central Credit services, compliance services, receivables relating to the sale and service of our fully integrated kiosks and other integrated kiosk solutions, and other amounts owing to us in connection withperforming various services for our customers. All such collection practices may be subject to the Fair Debt Collection Practices Act (the “FDCPA”), which prohibits unfair, deceptive, or abusive debt collection practices, as well as consumer-debt-collection laws and regulations adopted by the various states. Privacy Regulations. Our collection of information from patrons who use our financial products and services, such as our cash access services, are subject to the financial information privacy protection provisions of the Gramm-Leach-Bliley Act of 1999 (the “GLBA”) and its implementing federal regulations. We gather, as permitted by law, non-public, personally-identifiable financial information from patrons who use our cash access services, such as names, addresses, telephone numbers, bank and credit card account numbers, and transaction information. The Gramm-Leach-Bliley ActGLBA requires us to safeguard and protect the privacy of such non-public personal information and also requires us to make disclosures to patrons regarding our privacy and information sharing policies and give patrons the opportunity to direct us not to disclose information about them to unaffiliated third parties in certain situations. We are also subject to state privacy regulations which, in some cases, may be even stricter than federal law. We continue to implement policies and programs as well as adapt our business practices in order to comply with federal and state privacy laws and regulations. In addition, we are also subject to foreign data protection and privacy laws including, but not limited to, the European Union General Data Protection Regulation, which became effective in May 2018 and requires companies to meet new requirements regarding data privacy and security. ATM Operations. The Electronic Fund Transfer Act requires us to disclose certain notices regarding the fees that we charge for performing an ATM transaction as well as to incorporate such notices on the ATM screens to notify patrons of such fees prior to completing an ATM transaction. Our ATM services are also subject to applicable state banking regulations in each jurisdiction in which we operate ATMs which require, among other things, that we register with the state banking regulators as an operator of
ATMs, that we provide gaming patrons with notices of the transaction fees assessed upon use of our ATMs, that our transaction fees do not exceed designated maximums, that we offer gaming patrons a means of resolving disputes with us, and that we comply with prescribed safety and security requirements. In addition, the ATMs that we operate are subject to requirements of the Americans with Disabilities Act, which in general require that ATMs be accessible to individuals with disabilities, such as visually-impaired persons.
Check Cashing. In jurisdictions in which we serve as a check casher, we are required to be licensed by the applicable state banking regulator to operate as a check casher. Some states also impose restrictions on this activity, such as limits on the amounts of service fees that may be imposed on the cashing of certain types of checks, requirements as to records that must be kept with respect to dishonored checks and requirements as to the contents of receipts that must be delivered to gaming patrons at the time a check is cashed. Network and Card Association Regulations. In addition to the governmental regulation described above, some of our services are also subject to rules promulgated by various payment networks, EFT networks, and card associations. For example, we must comply with the Payment Card Industry (“PCI”) Data Security Standard. We have been designated as a compliant service provider under the PCI Data Security Standard. We must be certified to maintain our status as a compliant service provider on an annual basis. EMV, designed to deter fraudulent card transactions related to identity theft, counterfeit cards, and the misuse of lost or stolen cards via enhanced card authentication, transaction authorization, and cardholder verification using chip-based smart-cards. EMV has been adopted in many regions of the world as the global standard for fraud deterrence in chip-based smart-card payments. In October 2015, the network and card associations began shifting liability for fraudulent POS and ATM transactions generated through EMV-capable cards onto merchants whose devices are not capable of processing chip-based smart-card EMV transactions. This shifts the responsibility for chargebacks due to fraudulent transactions on such cards from the card issuer onto the merchant.
As a merchant of cash access transactions processed through MasterCard, Visa, Discover, and American Express, all who have adopted the EMV standard, and as an operator of ATMs, our POS, fully integrated kiosk, and ATM devices are subject to the EMV standard. This requires us to maintain our fleet of U.S.-based POS, fully integrated kiosk, and ATM devices to support the EMV standard.
17
We are also subject to a variety of gaming and financial services regulations and other laws, including the Foreign Corrupt Practices Act, in the international markets in which we operate. We expect to become subject to additional gaming and financial services regulations and other laws in the jurisdictions into which we expand our operations. Our expansion into new markets is dependent upon our ability to comply with the regulatory regimes adopted by such jurisdictions. Difficulties in obtaining approvals, licenses or waivers from the gaming
In addition, refer to “Item 1A. Risk Factors — Risks Related to Regulation of Our Industry” for additional industry, state, and monetary authorities, in addition to other potential regulatory and quasi-regulatory issues that we have not yet ascertained, may arise in other international jurisdictions into which we wish to enter.federal regulations impacting our business.
The following section describes material risks and uncertainties that we believe may adversely affect our business, financial condition, results of operations, or the market price of our stock. This section should be read in conjunction with our Financial Statements and Results of Operations included elsewhere in this Annual Report on Form 10-K.
Risks Related to Our Business
We have recorded net losses in each of the
last threetwo fiscal years
prior to fiscal year 2018 and we may not generate profits in the future.
We had net income of $12.4 million and net losses of $51.9 million $249.5 million and $105.0$249.5 million for the years ended December 31, 2018, 2017, 2016 and 2015,2016, respectively. As a result of the interest payments on the indebtedness incurred in connection with Everi Holdings’ purchase of Everi Games Holding in December 2014 (the “Merger”), amortization of intangible assets associated with the Merger and other acquisitions, other related acquisition and financing costs, asset impairment charges, and depreciation, and other amortization, we may not be able to generate profits in the future. We expectOur ability to continue to incur charges in the future in connection with the Merger and future acquisitions and we cannot assure you that we will generate net profits from operations in 2018 or subsequent years. Our ability to generate net profits in the future will depend, in part, on our ability to:
establish strategic business relationships with new and existing customers;
sell our products and services into new marketsand to new customers in existing markets and retain our existing customers;
develop new games or license third partythird-party content in our Games business and develop new products and services in our PaymentsFinTech business;
effectively manage a larger and more diversified workforce and business;
react to changes, including technological and regulatory changes, in the markets we target or operate in;
respond to competitive developments and challenges;
continue to comply with the EMV global standard for cards equipped with security chip technology; and
attract and retain experienced and talented personnel.
We may not be able to do any of these successfully, and our failure to do so could have a material adverse effect on our business, financial condition, operations, or cash flows, which could, among other things, affect our ability to make payments under our New Credit Facilities (defined herein) or the 2017 Unsecured Notes (as defined herein).
18
Our substantial leverage could adversely affect our ability to raise additional capital to fund our operations, limit our ability to react to changes in our industry or the economy, expose us to interest rate risk to the extent of our variable rate debt, and prevent us from meeting our obligations with respect to our indebtedness.
As of December 31, 2017,2018, our total indebtedness was approximately $1.2 billion, which included the New Credit Facilities and the 2017 Unsecured Notes, each of which contain restrictive covenants. Our high degree of leverage could have significant adverse effects on our business, including:
requiring a substantial portion of cash flow from operations to be dedicated to the payment of principal and interest on our indebtedness, therefore, reducing our ability to use our cash flow to fund our operations, capital expenditures, and future business opportunities;
making it more difficult for us to satisfy our obligations with respect to our indebtedness and any failure to comply with the obligations of any of our debt instruments, including restrictive covenants and borrowing conditions, could result in an event of default under the New Credit Facilities and the indentures governing the 2017 Unsecured Notes;
increasing our vulnerability to adverse economic, industry, or competitive developments;
restricting us from making strategic acquisitions or causing us to make non-strategic divestitures;
limiting our ability to obtain additional financing for working capital, capital expenditures, product development, debt service requirements, acquisitions, and general corporate or other purposes; and
limiting our flexibility in planning for, or reacting to, changes in our business or market conditions and placing us at a competitive disadvantage compared to our competitors who are less highly leveraged or may have more resources than us and who therefore may be able to take advantage of opportunities that our leverage prevents us from exploiting.
exploiting, including pursuit and execution of potential future acquisitions.
We may not be able to generate sufficient cash to service all of our indebtedness, including the New Credit Facilities and the 2017 Unsecured Notes, and fund our working capital and capital expenditures, and we may be forced to take other actions to satisfy our obligations under our indebtedness, which may not be successful.
Our ability to make scheduled payments on our indebtedness, including the New Credit Facilities and the 2017 Unsecured Notes, will depend upon our future operating performance and on our ability to generate cash flow in the future, which is subject to general economic, financial, business, competitive, legislative, regulatory, and other factors that are beyond our control. We cannot assure you that our business will generate sufficient cash flow from operations, or that future borrowings, including those under the New Credit Facilities, will be available to us in an amount sufficient to pay our indebtedness or to fund other liquidity needs.
If our cash flows and capital resources are insufficient to fund our debt service obligations, we could face substantial liquidity problems and could be forced to reduce or delay investment and capital expenditures or to dispose of material assets or operations, seek additional equity capital, or restructure or refinance our indebtedness. We may not be able to affect any such alternative
measures, if necessary, on commercially reasonable terms or at all and, even if successful, such alternative actions may not allow us to meet our scheduled debt service obligations. The New Credit Facilities and the indenture governing the 2017 Unsecured Notes restrict our ability to dispose of assets and use the proceeds from any such disposition.
If we cannot make scheduled payments on our debt, we will be in
default and, asdefault. As a result, the holders of the 2017 Unsecured Notes could declare all outstanding principal and interest to be due and
payable,payable; the lenders under the New Credit Facilities could declare all outstanding amounts under such facilities due and payable and terminate their commitments to loan
money,money; and, in each case,
could foreclose against the assets securing the borrowings under the New Credit
Facilities, and weFacilities. Such actions could
be forcedforce us into bankruptcy or liquidation.
If our indebtedness is accelerated, we may need to refinance all or a portion of our indebtedness before maturity. We may not be able to refinance any of our indebtedness on commercially reasonable terms or at all. There can be no assurance that we will be able to obtain sufficient funds to enable us to repay or refinance our debt obligations on commercially reasonable terms, or at all.
19
The agreements and instruments governing our debt impose restrictions that may limit our operating and financial flexibility.
The New Credit Facilities and the indenture governing the 2017 Unsecured Notes contain a number of significant restrictions and covenants that limit our ability to:
incur additional indebtedness;
sell assets or consolidate or merge with or into other companies;
pay dividends or repurchase or redeem capital stock;
make certain investments;
issue capital stock of our subsidiaries;
prepay, redeem, or repurchase subordinated debt; and
enter into certain types of transactions with our affiliates.
These covenants could have the effect of limiting our flexibility in planning for or reacting to changes in our business and the markets in which we compete. In addition, the New Credit Facilities require us to comply with a financial maintenance covenant under certain circumstances. Operating results below current levels or other adverse factors, including a significant increase in interest rates, could result in our being unable to comply with the financial covenants contained in the New Credit Facilities, if applicable. If we violate this covenant and are unable to obtain a waiver from our lenders, our debt under the New Credit Facilities would be in default and could be accelerated by our lenders. Based on cross-default provisions in the agreements and instruments governing our indebtedness, a default under one agreement or instrument could result in a default under, and the acceleration of, our other indebtedness. In addition, the lenders under the New Credit Facilities could proceed against the collateral securing that indebtedness.
If our indebtedness is accelerated, we may not be able to repay our debt or borrow sufficient funds to refinance it. Even if we are able to obtain new financing, it may not be on commercially reasonable terms, on terms that are acceptable to us, or at all. If our debt is in default for any reason, our business, financial condition, and results of operations could be materially and adversely affected. In addition, complying with these covenants may make it more difficult for us to successfully execute our business strategy and compete against companies that are not subject to such restrictions.
Our net operating losses and other tax credit
carry forwardscarry-forwards are subject to limitations that could potentially reduce these tax assets.
As of December 31,
2017,2018, we had tax effected federal and state net operating loss (“NOL”)
carry forwardscarry-forwards of approximately
$74.1$83.0 million and
$13.1$14.1 million, respectively, federal research and development credit
carry forwardscarry-forwards of approximately
$6.0$8.5 million, and foreign tax credit
carry forwardscarry-forwards of approximately $0.5 million. The federal net operating losses can be carried forward and applied to offset taxable income for 20 years and will expire starting in
2022.2022 (for losses incurred before 2018). An estimated federal loss incurred in 2018 of approximately $8.2 million, tax effected, can be carried forward indefinitely to offset taxable income. The state net operating loss
carry forwardscarry-forwards will expire between
20182019 and
2038.2039. The federal research and development credits are limited to a 20 year
carry forwardcarry-forward period and will begin to expire in varying amounts in 2029, if not utilized. The foreign tax credits,
which have a full valuation allowance, can be carried forward 10 years and will expire in 2020, if not utilized.
Based on the weight of available evidence, including both positive and negative indicators, if it is more likely than not that a portion, or all, of the deferred tax assets will not be realized, we must consider recording a valuation allowance. Greater weight is given to evidence that is objectively verifiable, most notably historical results.
As weWe are in a cumulative loss position
and we
increasedhave decreased our valuation allowance for deferred tax assets
by $2.3 million (net of a reduction for the decrease in the US federal corporate tax rate) during 2017, related to these NOL and other tax credit
carry-forwards.carry-forwards, excluding the 2018 federal NOL, by $10.1 million during 2018. Our ability to utilize the remaining NOL and other tax credit
carry forwardscarry-forwards to reduce taxable income in future years may be further limited, including the possibility that projected future taxable income is insufficient to realize the benefit of these NOL
carry forwardscarry-forwards prior to their expiration. To the extent our results of operations do not improve, we may not have the ability to overcome the more likely than not accounting standard that would allow us to reverse the valuation allowance and may be subject to record an additional valuation allowance in the future.
20
Our ability to use these tax assets could be adversely affected by the limitations of Sections 382, 383, and 384 of the Internal Revenue Code. In addition, a portion of our NOL’s include amortization of goodwill for tax purposes associated with a restructuring that occurred in 2004, which could be subject to audit by the IRS and thus may have an adverse effect on our NOL
carry forwards.carry-forwards.
The
recently passed Tax Cuts and Jobs Act of 2017 (“2017 Tax Act”) could adversely affect our business and financial condition.
The
Due to the 2017 Tax Act, among other changes, makes a US federal net operating loss less valuable as an asset due to a new flat US federal corporate income tax rate of 21%, replacing a graduated rate with a maximum income tax rate of 35%, effective January 1, 2018. Net operating losses arising in taxable years beginning after December 31, 2017 are limited in use to offset eighty percent80% of taxable income without the ability to carryback such net operating losses, buthowever, with an indefinite carryforwardcarry-forward of such net operating losses (instead of the former 2 year2-year carryback and 20 year carryforward20-year carry-forward for net operating losses arising in taxable years beginning before December 31, 2017). The amount of the net USU.S. federal interest expense deduction is generally limited to (a) 30% of adjusted taxable income, calculated without regard to depreciation, amortization, depletion or interest, effective for tax years beginning after December 31, 2017 and before January 1, 2022 and (b) 30% of adjusted taxable income, calculated without regard to interest (reduced by depreciation, amortization and depletion), effective for tax years beginning after December 31, 2021. Disallowed amounts may be carried forward indefinitely, subject to ownership change limitations. We continueU.S. corporations are also subject to examinecurrent tax on global intangible low-taxed income (“GILTI”) earned by certain foreign subsidiaries and a base erosion anti-avoidance tax. The 2017 Tax Act changes are complex and subject to additional guidance to be issued by the impact thisU.S. Treasury and the Internal Revenue Service. In addition, the individual states’ reactions to the federal tax reform legislation may have on our deferred tax assets and our business. Notwithstandingchanges are evolving. As a result, the reduction in the corporate income tax rate, the overall long-term impact of the 2017 Tax Act is uncertainuncertain. It is possible that the application of any new rules may have a material and adverse impact on our businessoperating results, cash flows, and financial condition could be adversely affected.condition.
We may experience network or system failures, or service interruptions, including cybersecurity attacks, or other technology risks. Our inability to protect our systems and data against such risks could harm our business and reputation.
In
Our ability to provide uninterrupted and high levels of services depends upon the
courseperformance of
providing our
cash access services, we engage third-party processors, data center providers, telecommunication networksinternal network, systems and
other third-party technology vendors. In addition, we gather, as permitted by law, non-public, personally-identifiable financial information from patrons who use our cash access services, such as names, addresses, telephone numbers, bankrelated infrastructure, and
credit card account numbers and transaction information, which may be routed throughthose of our third-party vendors.
We are required by law to safeguardAny significant interruptions in, or degradation of, the quality of the services, including infrastructure storage and
protect the privacy of such non-public personal information and we take such responsibilities seriously, which we demonstrate by carefully vetting thesupport, that these third parties
we chooseprovide to
provide technology services to us.In the course of providingus could severely harm our gaming related products and services, we engage third-party processors, data center providers, telecommunication networks and other third-party technology vendors. In the event our EGMs are compromised, gaming establishments may require us to remediate any abnormality or suspicious activity or require us to indemnify casino operators for lost business and potentially, their patrons. This may have cascading implications across our network security platformreputation and information technology infrastructure that could require greater managementlead to the loss of customers and employee focus on these issues, resulting in lost productivity and increased costs. We also could be subject to liability claims or regulatory compliance implications.
revenue. Our internal network, systems, and related infrastructure, in addition to the networks, systems, and related infrastructure of our third-party technology vendors, may be vulnerable to computer viruses and other malware that infiltrate such systems and networks, as well as physical or electronic security breaches, natural disasters, and similar disruptions. They have been and may alsocontinue to be the target of attempts to identify and exploit network and system vulnerabilities, penetrate or bypass security measures in order to interrupt or degrade the quality of the services we receive, or provide or otherwise gain unauthorized access to our networks and systems or those of our third-party vendors. These vulnerabilities or other attempts at access may result from, or be caused by, human error or technology failures, buthowever, they may also be the product of malicious actions by third parties intending to harm our business. The methods that may be used by these third parties to cause service interruptions or failures or to obtain unauthorized access to information change frequently, are difficult to detect, evolve rapidly, and are increasingly sophisticated and hard to defend against. OurAlthough we have not incurred material losses or liabilities as a result of security breaches or attempted security breaches, we cannot be certain that our defensive measures, and those employed by our third-party vendors, may notwill be sufficient to defend against all such methods,current and any such failurefuture methods.
Our careful vetting of third parties to defend couldprovide technology services and the contractual requirements related to the security that we impose on our third-party vendors who have access to this data may not be sufficient to protect us from network or system failures or service interruptions.
Any security breach, whether experienced by us or a third-party vendor, may be material and lead to
harm to our financial condition, business reputation, and prospects of future business due to, among other factors: loss of customer confidence arising from interruptions or outages of our services, delays,
failure to meet contractual obligations, and loss of data or public release of confidential
data. In some instances, such failures could causedata; increase regulatory scrutiny on us; compromise our trade secret and intellectual property; expose us to
failcostly uninsured liabilities such as material fines, penalties, liquidated damages, and overall margin compression due to
meet contractual deadlines or21
specifications and force us to renegotiaterenegotiation of contracts on less favorable terms pay penalties or liquidated damages or suffer major losses if the customer exercises its right to terminate. We are parties to certain agreements that could require us to pay damages resulting from loss of revenues if our systems are not properly functioning or as a result of a system malfunction. For example, our agreement with the New York State Gaming Commission permits termination of the contract at any time for failure by us or our system to perform properly,business; and any such unforeseen downtime could subject us to liquidated damages. In addition, if we fail to meet the terms specified in our contracts, we may not realize their full benefits. Failure to perform under any contract could result in substantial monetary damages, as well as contract termination. We also could be subject to liability for claims relating to misuse of personal information in violation of contractual obligations or data privacy laws. The occurrence of any such failure may also subject us to costly lawsuits,
claims for contractual indemnities, and negatively impact the status of our gaming regulatory licenses up to and including revocation, as well as divert valuable management, engineering, information technology, and marketing resources toward addressing these issues, delaying our ability to achieve our strategic initiatives. In the event our EGMs or cash access products, systems, or networks are compromised, gaming establishments may require us to remediate any abnormality, downtime, loss of use, or suspicious activity or require us to indemnify casino operators for lost business and, potentially, their patrons. In addition, we
cannot provide assurance thatgather, as permitted by law, non-public, personally-identifiable financial information from patrons who use our cash access services, such as names, addresses, telephone numbers, bank and credit card account numbers, and transaction information, the
contractual requirements related to the security and privacy that we impose on our third-party vendors who have access to thiscompromise of such data,
will be followed or will be adequate to prevent the misuse of this data.Any of the issues described above, whether experienced by us or a third-party vendor, could harm our reputation, deter existing and prospective customers from using our services, increase our operating expenses in order to contain and remediate the incident, exposewhich may subject us to unanticipated or uninsured liabilities, disrupt our operations (including potential service interruptions), distract our management, increase our riskfines and other related costs of litigation or regulatory scrutiny, result in the imposition of penalties and fines under applicable laws, or lead to the loss of customers and revenue. Weremediation.
The insurance we maintain
insurance against cybersecurity and related risks
but it may not cover all losses that we could suffer.
The gaming industry is intensely competitive, and if we are unable to compete effectively, our business could be negatively impacted.
The market for gaming devices, cash access products, and related services is highly competitive, and we expect competition to increase and intensify in the future. In both our Games and
PaymentsFinTech businesses, some of our competitors and potential competitors have significant advantages over us, including greater name
recognition,recognition; longer operating
histories,histories; pre-existing relationships with current or potential customers with respect to other financial
services,services; greater financial, research, design, development, marketing, technological, and other
resources,resources; and more ready access to capital resources, which allow them to respond more quickly to new or changing opportunities, be in a better position to compete
as well as,and, in respect of our cash access business, to pay higher commissions or other incentives to gaming establishments in order to gain new customers. In our
PaymentsFinTech business, we compete with other established providers of cash access products and services, including third-party transaction processors, financial institutions, and other regional and local banks that operate ATMs on the premises of gaming establishments. To the extent that we lose customers to these competitors, or competitive pressures force us to offer incentives or less favorable pricing terms to us to establish or maintain relationships with gaming establishments, our business, financial condition, operations, or cash flows could be materially and adversely affected.
Consolidation among our customers or competitors could have a material adverse effect on our revenues and profitability.
We often execute contracts with customers pursuant to which we provide products and services at multiple gaming establishments. Accordingly, the expiration or termination of a single key contract can mean the loss of multiple gaming facilities at which many of our products and services are used. Consolidation among operators of gaming establishments may also result in the loss of customers, if one of our customers is acquired by a business that utilizes one of our competitors, or significant margin compression, if rates vary between acquiring and acquired customers. Consolidation among our competitors in either the Games or FinTech sectors will only increase advantages these competitors may have over us as we compete for these customers, including even greater financial, research, design, development, marketing, technological, and other resources, the ability to offer customers more favorable rates and prices due to lower operating costs resulting from efficiencies of scale and varying margins of a larger product portfolio, among other factors.
Our business depends on our ability to introduce new, commercially viable games, products, and services in a timely manner.
Our success is dependent on our ability to develop and sell new games, products, and services that are attractive not only to our customers, but also to their customers, the gaming patrons. If our games, products, and services do not appeal to gaming operators and patrons, or do not meet or sustain revenue and profitability of contractual obligations and expectations, we may lose business to our competitors. Additionally, we may be unable to enhance existing games, products, and services in a timely manner in response to changing regulatory, legal, or market conditions, customer requirements, or new games, products, and services may not achieve market acceptance in new or existing markets. Delay in regulatory approvals of new gaming devices and equipment may adversely impact new product deployment. If we are unable to keep pace with rapid innovations in new technologies or product design and deployment or if we are unable to quickly adapt our development, manufacturing, or sales processes to compete, our business, financial condition, operations, or cash flows could suffer a material adverse effect.
Our business is dependent upon consumer demand for gaming and overall economic trends specific to the gaming industry. Economic downturns or a decline in the popularity of gaming could reduce the number of patrons that use our products and services or the amounts of cash that they access using our services.
We provide our gaming-related and cash access products and services almost exclusively to gaming establishments. As a result, our business depends on consumer demand for gaming. Gaming is a discretionary leisure activity, participation in which has in the past and may in the future decline during periods of (i) economic growth, due to changes in consumers’ spending habits,habits; (ii) economic downturns, due to decreases in our customers’ disposable income or general tourism activities,activities; and (iii) declining consumer confidence, due to general economic conditions, geopoliticaldomestic- and geo-political concerns, or other factors. Gaming competes with other leisure activities as a form of consumer entertainment and may lose popularity as new leisure activities arise or as other
leisure activities become more popular. In addition, gaming in traditional gaming establishments (to which we sell our products and services) competes with
internet-basedInternet-based gaming. The popularity and acceptance of gaming is also influenced by the prevailing social mores and changes in social mores, including changes driven by social responsibility organizations that are dedicated to addressing problem gaming, which could result in reduced acceptance of gaming as a leisure activity or litigation or lobbying efforts focused on limiting gaming activities. To the extent that the popularity or availability of gaming in traditional gaming establishments declines as a result of any of these factors, the demand for our cash access and gaming-related products and services, or the willingness of our customers to spend new capital on acquiring gaming equipment or utilize revenue share agreements, may decline and our business may be harmed.
22
Most
We may not successfully enter new markets and potential new markets may not develop quickly, or at all.
If and as new and developing domestic markets develop, competition among providers of gaming-related and cash access products and services will intensify. We will face a number of hurdles in our attempts to enter these markets, including the need to expand our sales and marketing presence, compete against pre-existing relationships that our target customers may have with our competitors, the uncertainty of compliance with new or developing regulatory regimes (including regulatory regimes relating to Internet gaming) with which we are not currently familiar, and oversight by regulators that are not familiar with us or our businesses. Each of these risks could materially impair our ability to successfully expand our operations into these new and developing domestic markets.
In addition, as we attempt to sell our gaming-related and cash access products and services into international markets in which we have not previously operated, we may become exposed to political, economic, tax, legal, and regulatory risks not faced by businesses that operate only in the United States. The legal and regulatory regimes of foreign markets and their ramifications on our business may be less certain. Our international operations may be subject to a variety of risks, including different regulatory requirements and interpretations, trade barriers, difficulties in staffing and managing foreign operations, higher rates of fraud, compliance with anti-corruption and export control laws, fluctuations in currency exchange rates, difficulty in enforcing or interpreting contracts or legislation, political and economic instability, and potentially adverse tax consequences. Difficulties in obtaining approvals, licenses, or waivers from the monetary and Gaming Authorities of other jurisdictions, in addition to other potential regulatory and quasi-regulatory issues that we have not yet ascertained, may arise in international jurisdictions into which we attempt to enter. In these new markets, our operations will rely on an infrastructure of, among other things, financial services and telecommunications facilities that may not be sufficient to support our business needs. In these new markets, we may additionally provide services based upon interpretations of applicable law, which interpretation may be subject to regulatory or judicial review. These risks, among others, could materially and adversely affect our business, financial condition, and operations. In connection with our expansion into new international markets, we may forge strategic relationships with business partners to assist us. The success of our leasedexpansion into these markets therefore may depend in part upon the success of the business partners with whom we forge these strategic relationships. If we do not successfully form strategic relationships with the right business partners or if we are not able to overcome cultural or business practice differences, our ability to penetrate these new international markets could suffer.
We are subject to the risk that the domestic or international markets we attempt to enter or expand into may not develop as quickly as anticipated, or at all. The development of new gaming device contracts withmarkets is subject to political, social, regulatory, and economic forces beyond our customerscontrol. The expansion of gaming activities in new markets can be very controversial and may depend heavily on the support and sponsorship of local government, and may be based upon interpretations of newly enacted laws, the interpretation of which may be subject to regulatory or judicial review. Changes in government leadership, failure to obtain requisite voter support in referendums, failure of legislators to enact enabling legislation, and limitations on the volume of gaming activity that is permitted in particular markets may inhibit the development of new markets. Further, our estimates of the potential future opportunities in new markets are based on a month-to-month basis,variety of assumptions that may prove to be inaccurate. To the extent that we overestimate the potential of a new market, incorrectly gauge the timing of the development of a new market, or fail to anticipate the differences between a new market and our existing markets, we may fail in our strategy of growing our business by expanding into new markets. Moreover, if we are unable to meet the needs of our existing customers as they enter markets that we do not currently serve, our relationships with these customers could be harmed.
We may not realize satisfactory returns on money loaned or otherwise funded to new and existing customers to develop or expand gaming facilities.
In our gaming business, we enter into placement fee agreements typically to secure a long-term revenue share percentage and a fixed number of player terminal placements in the gaming facility. These placement fee arrangements may provide for the removal of our player terminal placements in the event of poor game performance with no further obligation of the gaming customer. Additionally, we have historically entered into development fee arrangements and may continue to do so in the future. Under the development fee arrangements, we provide financing for construction, expansion, or remodeling of gaming facilities in exchange for a long-term revenue share percentage and a fixed number of player terminal placements in the gaming
facility until the development fee is repaid to us. The success of these ventures is dependent upon the timely completion of the gaming facility, the placement and performance of our player terminals, and a favorable regulatory environment. Our development and placement efforts and financing activities may result in operating difficulties, financial and regulatory risks, or required expenditures that could materially and adversely affect our liquidity. In connection with one or more of these transactions, and to obtain the necessary development and placement fee funds, we may need to extend secured and unsecured credit to potential or existing customers that may not be repaid, incur debt on terms unfavorable to us, incur difficulties in perfecting security interests in collateral on Indian lands, or that we are unable to repay, or incur other contingent liabilities. The failure to maintain controls and processes related to our collection efforts or the deterioration of regulatory or financial condition of our customers could negatively impact our business.
If we are unable to develop and protect our intellectual property adequately or obtain intellectual property rights and agreements, we may lose valuable competitive advantages, be forced to incur costly litigation to protect our rights, or be restricted in our ability to provide various products in our markets.
Our success depends, in part, on developing and protecting our intellectual property. We rely on a combination of patents, trademarks, copyrights, trade secrets, and contractual restrictions to protect our intellectual property. We also rely on other confidentiality and contractual agreements and arrangements with our employees, affiliates, business partners, and customers to establish and protect our intellectual property and similar proprietary rights. We cannot assure you that we will be successful in protecting these rights and, despite our efforts, our trade secrets and proprietary know-how could become known to, or independently developed by, competitors. Any litigation relating to the defense of our intellectual property, whether successful or unsuccessful, could result in substantial costs to us and potentially cause a diversion of our resources.
In addition, we may face claims of infringement that could interfere with our ability to use technology or other intellectual property rights that are material to our business operations. In the event a claim of infringement against us is successful, we may be required to pay royalties to use technology or other intellectual property rights that we had been using, or we may be required to enter into a license agreement and pay license fees, or we may be required to stop using the technology or other intellectual property rights that we had been using. We may be unable to obtain necessary licenses from third parties at a reasonable cost or within a reasonable amount of time. Any litigation of this type, whether successful or unsuccessful, could result in substantial costs to us and potentially cause a diversion of our resources.
We rely on technology provided by third-party vendors, the loss of which could materially and adversely affect our business, increase our costs, and delay deployment or suspend development of our financial services products, gaming systems, and player terminals.
We have entered into license agreements with third parties for the exclusive use of their technology and intellectual property rights in the gaming industry, such as our license to use portions of the software infrastructure upon which our cash access systems operate, and we also rely on third-party manufacturers to manufacture our gaming devices, fully integrated kiosks, and other integrated kiosk solutions. We rely on these other parties to maintain and protect this technology and the related intellectual property rights. If our licensors fail to protect their intellectual property rights in material that we license and we are unable to protect such intellectual property rights, the value of our licenses may diminish significantly and our business could be significantly harmed. In addition, if these agreements expire and we are unable to renew them, or if the manufacturers of this software or hardware, or functional equivalents of this software or hardware, were either no longer available to us or no longer offered to us on commercially reasonable terms, we may lose a valuable competitive advantage and our business could be harmed.
Acts of God, adverse weather and shipping difficulties, particularly with respect to international third-party suppliers of our components, could cause significant production delays. If we are unable to obtain these components from our established third-party vendors, we could be required to either redesign our product to function with alternate third-party products or to develop or manufacture these components ourselves, which would result in increased costs and could result in delays in the deployment of our gaming systems and player terminals. Furthermore, we might be forced to limit the features available in our current customersor future offerings.
We rely on
terms thatintellectual property licenses from one or more third-party competitors, the loss of which could materially and adversely affect our business and the sale or placement of our products. Various third-party gaming manufacturers with which we compete are
favorable tomuch larger than us
and have substantially larger intellectual property assets. The gaming manufacturer industry is very competitive and litigious, and a lawsuit brought by one of our larger competitors, whether or not well-founded, may have a material adverse effect on our business, financial condition, operations, or cash flows
may suffer a material adverse effect.Mostand our ability to sell or place our products.
Our inability to identify business opportunities and future acquisitions, or successfully execute any of our leased gaming device contractsidentified business opportunities or future acquisitions could limit our future growth.
From time to time, we pursue strategic acquisitions in support of our strategic goals. In connection with any such acquisitions, we could face significant challenges in timely securing required approvals of Gaming Authorities, or managing and integrating our expanded or combined operations, including acquired assets, operations, and personnel. There can be no assurance that acquisition opportunities will be available on acceptable terms or at all or that we will be able to obtain necessary financing or regulatory approvals to complete potential acquisitions.
We may not achieve the intended benefits of our acquisitions, if any, nor may we be able to integrate those businesses successfully, and any such acquisitions may disrupt our current plans and operations.
Our ability to succeed in implementing our strategy will depend to some degree upon the ability of our management to successfully integrate commercially viable acquisitions. Acquisition transactions may disrupt our ongoing business and distract management from other responsibilities. The expected cost synergies associated with such acquisitions may not be fully realized in the anticipated amounts or within the contemplated timeframes or cost expectations, which could result in increased costs and have an adverse effect on our prospects, results of operations, cash flows, and financial condition. Our businesses may be negatively impacted if we are unable to effectively manage our expanded operations. The integration of these acquisitions will require significant time and focus from management and may divert attention from the day‑to‑day operations of the combined business or delay the achievement of our strategic objectives. We expect to incur incremental costs and capital expenditures related to our contemplated integration activities.
The risks we commonly encounter in acquisitions include:
if, in addition to our current indebtedness, we incur significant debt to finance a future acquisition and our combined business does not perform as expected, we may have difficulty complying with debt covenants;
we may be unable to make a future acquisition which is in our best interest due to our current level of indebtedness;
if we use our stock to make a future acquisition, it will dilute existing stockholders;
we may have difficulty assimilating the operations and personnel of any acquired company;
the challenge and additional investment involved with integrating new products and technologies into our sales and marketing process;
we may have difficulty effectively integrating any acquired technologies or products with our current products and technologies, particularly where such products reside on different technology platforms or overlap with our products;
our ongoing business may be disrupted by transition and integration issues;
the costs and complexity of integrating the internal information technology infrastructure of each acquired business with ours may be greater than expected and may require additional capital investments;
we may not be able to retain key technical and managerial personnel from an acquired business;
we may be unable to achieve the financial and strategic goals for any acquired and combined businesses;
we may have difficulty in maintaining controls, procedures, and policies during the transition and integration period following a future acquisition;
our relationships with partner companies or third-party providers of technology or products could be adversely affected;
our relationships with employees and customers are generally on a month-to-month basis, except for customerscould be impaired;
our due diligence process may fail to identify significant issues with whomproduct quality, product architecture, legal, or tax contingencies, customer obligations, and product development, among other things;
as successor we have entered into development and placement fee agreements. We do not rely upon the stated termmay be subject to certain liabilities of our gaming device contractsacquisition targets;
we may face new intellectual property challenges; and
we may be required to retainsustain significant exit or impairment charges if products acquired in business combinations are unsuccessful.
Our failure to effectively integrate any future acquisition would adversely affect the benefit of such transaction, including potential synergies or sales growth opportunities, in the time frame anticipated.
We operate our business of our customers. We rely instead upon providing competitive player terminals, games and systems to give our customers the incentive to continue doing business with us. At any point in time, a significant portion of our gaming device business isregions subject to nonrenewal,natural disasters. Any interruption to our business resulting from a natural disaster will adversely affect our revenues and results of operations.
In the event of a natural disaster, the operations of gaming establishments could be negatively impacted or consumer demand for gaming could decline, or both, and as a result, our business could be interrupted, which
maycould materially and adversely affect our
earnings, financial conditionrevenues and
cash flows. To renewresults of operations. Adverse weather conditions, particularly flooding, hurricanes, tornadoes, heavy snowfall, and other extreme weather conditions often deter our customer’s end users from traveling or
extendmake it difficult for them to frequent the sites where our games and FinTech equipment are installed. If any of
our customer contracts generally, we may be required to accept financial and other terms that are less favorable to us thanthose sites experienced prolonged adverse weather conditions, or if the
terms of the expired contracts. In addition, we may not succeed in renewing customer contracts when they expire. If we are required to agree to other less favorable terms to retain our customers or we are not able to renew our relationships with our customers upon the expiration of our contracts, our business, financial condition, operations or cash flows could suffer a material adverse effect.Tribal gaming customers who have historically operated large quantities of Class II gaming units may negotiate into arrangements with state governments or renegotiate existing gaming compacts that could impact the amount of Class II gaming devices currently supplied by the Company. If we are unable maintain our existing placement of units, then our business, financial condition, operations or cash flows may suffer an adverse effect.
As of December 31, 2017, we operated 8,875 Class II gaming units under lease or daily fixed fee arrangements to our customers. Customers who enter into compacts with state governments may desire to change from Class II gaming units to Class III gaming units, as Class III units generally perform better than Class II units. This may result in the loss of placements under lease or daily fixed fee arrangements as customers purchase or lease Class III units from other equipment suppliers to replace our existing Class II units. If we are unable to replace these lost units with our proprietary Class III units, then our business, financial condition, operations or cash flows may suffer an adverse effect.
If we are unable to renew our contract with the New York State Gaming Commission, our revenues, financial condition, operations or cash flows may suffer a material adverse effect.
Our contract to provide an accounting and central determinant system for the VLTssites in the State of New York has provided Games segment revenuesOklahoma, where a significant number of approximately $18.1 million for the years ended December 31, 2017our games and 2016. In January 2018, an amendment to the agreement between Everi Games and the New York State Gaming Commission was approved and became effective. Under this amendment, Everi Games will continue to provide and maintain the central determinant system for the New York Lottery through DecemberFinTech equipment are installed, simultaneously experienced adverse weather conditions, our results of 2019. Upon its expiration, if we are unsuccessful in renewing the contract, our business, financial condition, and operations or cash flows may suffer a material adverse effect.
Consolidation among our customers could have a material adverse effect on our revenuesbe materially and profitability.
We often execute contracts with customers pursuant to which we provide products and servicesadversely affected. During 2018, the impact of weather-related natural disasters resulted in business disruption at multiple gaming establishments. Accordingly, the expiration or termination of a single key contract can mean the loss of multiple gaming facilities at which our products and services are used. In addition, consolidation among operators of gaming establishments may also result in the loss of customers if onecertain of our customers is acquired by a business that utilizes one of our competitors.
customers’ facilities.
We derive a significant portion of our revenue from Native American tribal customers, and our ability to effectively operate in Native American gaming markets is vulnerable to legal and regulatory uncertainties, including the ability to enforce contractual rights on Native American land.
We derive a significant percentage of our revenue from the provision of cash access and gaming-related products and services to gaming facilities operated on Native American lands.
Native American tribes that are federally recognized are considered “domestic dependent nations” with certain sovereign rights and, in the absence of a specific grant of authority by Congress to a state or a specific compact or
23
agreement between a tribal entity and a state that would allow the state to regulate activities taking place on Native American lands, such tribes can enact their own laws and regulate gaming operations and contracts. In this capacity, Native American tribes generally enjoy a degree of sovereign immunity, which, among other things, recognizes a tribe’s inherent authority of self-determination and self-governance, immunizes the tribe from certain lawsuits outside of tribal jurisdiction, and generally authorizes a tribe’s powers of taxation and spending over its federally-recognized nation. Accordingly, before we can seek to enforce contract rights with a Native American tribe, or an agency or instrumentality of a Native American tribe, we must obtain from the Native American tribe a general or limited waiver of its sovereign immunity with respect to the matter in dispute, which we are not always able to do. Without a general or limited waiver of sovereign immunity, or if such waiver is held to be ineffective, we could be precluded from judicially enforcing any rights or remedies against a Native American tribe, including the right to enter Native American lands to retrieve our property in the event of a breach of contract by the tribal party to that contract. Even if the waiver of sovereign immunity by a Native American tribe is deemed effective, there could be an issue as to the forum in which a lawsuit may be brought against the Native American tribe. Federal courts are courts of limited jurisdiction and generally do not have jurisdiction to hear civil cases relating to Native American tribes, and we may be unable to enforce any arbitration decision effectively. Although we attempt to agree upon governingGoverning law and venue provisions in our contracts with Native American tribal customers these provisions vary widely and may not be enforceable.
Certain of our agreements with
Further, certain Native American tribes
require us to contract or subcontract to provide all or some portion of our services with entities that are
subjectowned, controlled, or managed by tribal members or related parties. Our ability to
review by regulatory authorities. For example,provide our
development agreements are subjectservices is dependent upon our relationship with these third parties and their ability to
review by the NIGC, and any such review could require substantial modifications to our agreements or resultprovide services in
the determination that we have a proprietary interest in a Native American tribe’s gaming activity, which could materially and adversely affectaccordance with the terms
on which we conduct our business. The NIGC has previously expressed the view that some of our
development agreements could becontractual arrangement with these third parties and, in
violation ofsome instances, the
requirements ofthird parties’ relationship or contractual arrangement with the
IGRA and Native Americanapplicable tribal gaming
regulations, which state that the Native American tribes must hold “sole proprietary interest” in the Native American tribes’ gaming operations, which presents additional risk for our business. The NIGC may also reinterpret applicable laws and regulations, which could affect our agreements with Native American tribes. We could also be affected by alternative interpretations of the Johnson Act as the Native American tribes, who are the customers for our Class II games, could be subject to significant fines and penalties if it is ultimately determined they are offering an illegal game, and an adverse regulatorycasino or
judicial determination regarding the legal status of our products could have material adverse consequences for our business, financial condition, operations, cash flows or prospects.tribe.
Government enforcement, regulatory action, judicial decisions, and proposed legislative action have in the past, and will likely continue to affect our business, financial condition, operations, cash flows, and prospects in Native American tribal lands. The legal and regulatory uncertainties surrounding our Native American tribal agreements could result in a significant and immediate material adverse effect on our business, financial condition, operations, or cash flows.
For example, certain of our agreements with Native American tribes are subject to review by regulatory authorities. Additionally, such uncertainties could increase our cost of doing business and could take management’s attention away from operations. Regulatory action against our customers or equipment in these or other markets could result in machine seizures and significant revenue disruptions, among other adverse consequences. Moreover, Native American tribal policies and procedures, as well as tribal selection of gaming vendors, are subject to the political and governance environment within each Native American tribe. Changes in tribal leadership or tribal political pressure can affect our business relationships within Native American markets.
Certain Native American tribes require us to contract with entities that are owned, controlled or managed by tribal members to provide a portion
Most of our
services. In some instances, these entities are subcontractors of ours in connectionleased gaming device contracts with
providing our services, while in other instances we are a subcontractor to these entities who contract with the applicable tribal gaming casino or tribe directly to provide cash access services. Our ability to provide our services is dependent upon our relationship with these third parties and their ability to provide services in accordance with the terms of our contractual arrangement with these third parties and, in some instances, the third parties’ relationship or contractual arrangement with the applicable tribal gaming casino or tribe.Our business depends on our ability to introduce new, commercially viable games, products and services in a timely manner.
Our success is dependent on our ability to develop and sell new games, products and services that are attractive not only to our customers but also to their customers, the gaming patrons. If our games, products,are short-term, and services do not appeal to gaming operators and patrons, or do not meet or sustain revenue and profitability of contractual
24
obligations and expectations, we may lose business to our competitors. Additionally, we may be unable to enhance existing games, products and services in a timely manner in response to changing regulatory, legal or market conditions or customer requirements, or new games, products and services may not achieve market acceptance in new or existing markets. Delay in regulatory approvals of new gaming devices and equipment may adversely impact new product deployment. Furthermore, as we attempt to generate new streams of revenue by selling our games, products and services to new customers in new jurisdictions, we will face licensing and approval requirements of Gaming Authorities influencing the timing of our market entry and we may have difficulty implementing an effective sales strategy for these new jurisdictions. If we are unable to keep pace with rapid innovations in new technologies or product design and deployment or if we are unable to quickly adaptmaintain our current customers on terms that are favorable to us, our business, financial condition, operations, or cash flows may suffer a material adverse effect.
Most of our leased gaming device contracts with our customers are generally short-term, except for customers with whom we have entered into development manufacturingand placement fee agreements. We do not rely upon the stated term of our gaming device contracts to retain the business of our customers. We rely instead upon providing competitive player terminals, games, and systems to give
our customers the incentive to continue doing business with us. At any point in time, a significant portion of our gaming device business is subject to nonrenewal, which may materially and adversely affect our earnings, financial condition, and cash flows. To renew or
sales processesextend any of our customer contracts, generally, we may be required to
compete,accept financial and other terms that are less favorable to us than the terms of the expired contracts. In addition, we may not succeed in renewing customer contracts when they expire. If we are required to agree to other less favorable terms to retain our customers or we are not able to renew our relationships with our customers upon the expiration of our contracts, our business, financial condition, operations, or cash flows could suffer a material adverse effect.
We
Tribal gaming customers who have historically operated large quantities of Class II gaming units may
not successfully enter new markets and potential new markets may not develop quicklynegotiate into arrangements with state governments or
at all.If and as new and developing domestic markets develop, competition among providersrenegotiate existing gaming compacts that could impact the amount of gaming-related and cash access products and services will intensify. We will face a number of hurdles in our attempts to enter these markets, includingClass II gaming devices currently supplied by the need to expand our sales and marketing presence, compete against pre-existing relationships that our target customers may have with our competitors, the uncertainty of compliance with new or developing regulatory regimes (including regulatory regimes relating to Internet gaming) with which we are not currently familiar, and oversight by regulators that are not familiar with us or our businesses. Each of these risks could materially impair our ability to successfully expand our operations into these new and developing domestic markets.
In addition, as we attempt to sell our gaming-related and cash access products and services into international markets in which we have not previously operated, we may become exposed to political, economic, tax, legal and regulatory risks not faced by businesses that operate only in the United States. The legal and regulatory regimes of foreign markets and their ramifications on our business are less certain. Our international operations are subject to a variety of risks, including different regulatory requirements and interpretations, trade barriers, difficulties in staffing and managing foreign operations, higher rates of fraud, compliance with anti-corruption and export control laws, fluctuations in currency exchange rates, difficulty in enforcing or interpreting contracts or legislation, political and economic instability and potentially adverse tax consequences. Difficulties in obtaining approvals, licenses or waivers from the monetary and Gaming Authorities of other jurisdictions, in addition to other potential regulatory and quasi-regulatory issues that we have not yet ascertained, may arise in international jurisdictions into which we attempt to enter. In these new markets, our operations will rely on an infrastructure of, among other things, financial services and telecommunications facilities that may not be sufficient to support our business needs, such as the authorization and settlement services that are required to implement electronic payment transactions and the telecommunications facilities that would enable us to reliably connect our networks to our products at gaming establishments in these new markets. In these new markets, we may additionally provide services based upon interpretations of applicable law, which interpretation may be subject to regulatory or judicial review. These risks, among others, could materially and adversely affect our business, financial condition and operations. In connection with our expansion into new international markets, we may forge strategic relationships with business partners to assist us. The success of our expansion into these markets therefore may depend in part upon the success of the business partners with whom we forge these strategic relationships.Company. If we do not successfully form strategic relationships with the right business partners or if we are not able to overcome cultural or business practice differences, our ability to penetrate these new international markets could suffer.
We are subject to the risk that the domestic or international markets we attempt to enter or expand into may not develop as quickly as anticipated, or at all. The development of new gaming markets is subject to political, social, regulatory and economic forces beyond our control. The expansion of gaming activities in new markets can be very controversial and may depend heavily on the support and sponsorship of local government. Changes in government leadership, failure to obtain requisite voter support in referendums, failure of legislators to enact enabling legislation and limitations on the volume of gaming activity that is permitted in particular markets may inhibit the development of new markets. Further, our estimates of the potential future opportunities in new markets are based on a variety of assumptions that may prove to be inaccurate. To the extent that we overestimate the potential of a new market, incorrectly gauge the timing of the development of a new market or fail to anticipate the differences between a new market and our existing markets, we may fail in our strategy of growing our business by expanding into new markets. Moreover, if we are unable to meet the needs ofmaintain our existing customers as they enter markets that we do not currently serve, our relationships with these customers could be harmed.
25
We may not realize satisfactory returns on money loaned or otherwise funded to new and existing customers to develop or expand gaming facilities.
In our gaming business, we enter into placement fee agreements typically to secure a long-term revenue share percentage and a fixed number of player terminal placements in the gaming facility. These placement fee arrangements may provide for the removal of our player terminal placements in the event of poor game performance with no further obligation of the gaming customer. Additionally, we have historically entered into development fee arrangements and may continue to do so in the future. Under the development fee arrangements, we provide financing for construction, expansion or remodeling of gaming facilities in exchange for a long-term revenue share percentage and a fixed number of player terminal placements in the gaming facility until the development fee is repaid to us. The success of these ventures is dependent upon the timely completion of the gaming facility, the placement of our player terminals and a favorable regulatory environment. Our development and placement efforts and financing activities may result in operating difficulties, financial and regulatory risks, or required expenditures that could materially and adversely affect our liquidity. In connection with one or more of these transactions, and to obtain the necessary development and placement fee funds, we may need to extend secured and unsecured credit to potential or existing customers that may not be repaid, incur debt on terms unfavorable to us, incur difficulties in perfecting security interests in collateral on Indian lands, or that we are unable to repay, or incur other contingent liabilities. The failure to maintain controls and processes related to our collection efforts or the deterioration of regulatory or financial condition of our customers could negatively impact our business.
We depend on third-party transaction processors, third-party data center providers, telecommunication networks and other third-party technology vendors to provide our cash access and related services; and if we, or any of these third parties, experience system or service failures, the products and services we provide could be delayed or interrupted, which could harm our business and reputation.
Our ability to provide uninterrupted and high levels of services depends upon the performance of the third-party processors, data center providers, telecommunication networks and other third-party technology vendors that we use. Any significant interruptions in, or degradation of, the quality of the services, including infrastructure storage and support, that these third parties provide to us could severely harm our business and reputation and lead to the loss of customers and revenue. Our internal network, systems and related infrastructure as well as third-party providers and their networks, systems and related infrastructure are potentially vulnerable to computer viruses, physical or electronic security breaches, natural disasters and similar disruptions, which could lead to interruptions or outages of our services, delays, loss of data or public release of confidential data, all of which could have a material adverse effect onunits, then our business, financial condition, operations, or cash flows. In some instances, such failures could cause usflows may suffer an adverse effect.
As of December 31, 2018, we operated 9,370 Class II gaming units under lease or daily fixed fee arrangements to failour customers. Customers who enter into compacts with state governments may desire to meet contractual deadlines or specifications and force uschange from Class II gaming units to renegotiate contracts on less favorable terms, pay penalties or liquidated damages or suffer major losses ifClass III gaming units, as Class III units generally perform better than Class II units. This may result in the customer exercises its right to terminate. We are parties to certain agreements that could require us to pay damages resulting from loss of revenues ifplacements under lease or daily fixed fee arrangements as customers purchase or lease Class III units from other equipment suppliers to replace our systemsexisting Class II units. If we are not properly functioningunable to replace these lost units with our proprietary Class III units, then our business, financial condition, operations, or as a result of a system malfunction. For example,cash flows may suffer an adverse effect.
If we are unable to renew our agreementcontract with the New York State Gaming Commission, permits terminationour revenues, financial condition, operations, or cash flows may suffer an adverse effect.
Our contract to provide an accounting and central determinant system for the VLTs in the State of
New York has provided Games segment revenues of approximately $18.5 million for the
contract at any timeyear ended December 31, 2018 and $18.1 million for
failure by us or ourthe years ended December 31, 2017 and 2016. In January 2018, an amendment to the agreement between Everi Games and the New York State Gaming Commission was approved and became effective. Under this amendment, Everi Games will continue to provide and maintain the central determinant system
to perform properly, and any such unforeseen downtime could subject us to liquidated damages. In addition,for the New York Lottery through December of 2019. Upon its expiration, if we
fail to meetare unsuccessful in renewing the
terms specified in our contracts, we may not realize their full benefits. Failure to perform under any contract,
could result in substantial monetary damages, as well as contract termination. Our results of operations are dependent on our ability to maximize our earnings from our contracts.We typically rely on a single third-party processor to process substantially all of our cash access transactions that are processed through various card associations and EFT payment networks, and the failure of our third-party processor to adequately provide such processing services could have a material adverse effect on our business, financial condition, operations, or cash flows.
We typically rely on a single third party to provide processing services for the majority of our cash access transactions by obtaining authorizations for ATM cash withdrawal, POS debit card and credit card cash access transactions and to provide settlement transaction files to card associations and EFT payment networks for some of these transactions. If our third-party processor fails to adequately provide these services, it could result in our systems being unable to process our cash access transactions intermittently or for extended periods of time, which could have a materialflows may suffer an adverse effect on our business, financial condition, operations or cash flows.
26
effect.
An unexpectedly high level of chargebacks, as the result of fraud or otherwise, including in connection with new technology standards being implemented in the United States regarding chip-based cards, could materially and adversely affect our cash access business.
In 1994, Europay, MasterCard, and Visa jointly developed EMV, designed to deter fraudulent card transactions related to identity theft, counterfeit cards, and the misuse of lost or stolen cards via enhanced card authentication, transaction authorization, and cardholder verification using chip-based smart-cards. EMV has been adopted in many regions of the world as the global standard for fraud deterrence in chip based smart-card payments.
Historically,To encourage adoption in the U.S.
payments industry has relied on magnetic stripe cards instead of EMV compliant chip-based cards. Recently, however, U.S. card issuers have begun to offer EMV-capable chip-based smart-cards, and as of, effective October 1, 2015, the U.S. payment card industry
implemented new rules which shifted the liability for fraudulent transactions
generated through EMV-enabled cards onto merchants
whose devices are not capable of processingif they elect to process transactions using the magnetic stripe when presented with a EMV chip-based
smart-card EMV transactions.smart-card. This shifted the responsibility for chargebacks due to fraudulent transactions on such cards from the card issuer onto the merchant.
We currently do not incur such costs as we are compliant with the EMV regulations. However, ifIf we are unable to maintain
suchcompliant status
with the EMV regulations, our cash access business may be adversely affected.
When patrons use our cash access services, we either dispense cash or produce a negotiable instrument that can be exchanged for cash. If a completed cash access transaction is subsequently disputed, and if we are unsuccessful in establishing the validity of the transaction, we may not be able to collect payment for such transaction and such transaction becomes a chargeback. In the event that we incur chargebacks in excess of specified levels, we could lose our sponsorship into the card associations or be censured by the card associations by way of fines or otherwise. Our failure to adequately manage our chargebacks could have a material adverse effect on our business, financial condition, operations, or cash flows.
Changes in consumer willingness to pay a
convenience fee to access their funds could reduce the demand for our cash access products and services.
Our cash access business depends upon the willingness of patrons to pay a serviceconvenience fee to access their own funds on the premises of a gaming establishment. In most retail environments, consumers typically do not pay an additional fee for using non-cash payment methods such as credit cards, POS debit cards, or checks. Gaming patrons could bring more cash with them to gaming establishments or access cash outside of gaming establishments without paying a fee for the convenience of not having
to leave the gaming establishment. To the extent that gaming patrons become unwilling to pay these
convenience fees
for convenience or lower cost cash access alternatives become available, the demand for cash access services within gaming establishments will decline and our business could suffer.
If we are unable to protect our intellectual property adequately or obtain intellectual property rights and agreements, we may lose valuable competitive advantages, be forced to incur costly litigation to protect our rights, or be restricted in our ability to provide various products in our markets.
Our success depends, in part, on developing and protecting our intellectual property. We rely on copyright, patent, trademark and trade secret laws to protect our intellectual property. We also rely on other confidentiality and contractual agreements and arrangements with our employees, affiliates, business partners and customers to establish and protect our intellectual property and similar proprietary rights. While we expect these agreements and arrangements to be honored, we cannot assure you that they will be and, despite our efforts, our trade secrets and proprietary know-how could become known to, or independently developed by, competitors. Any litigation relating to the defense of our intellectual property, whether successful or unsuccessful, could result in substantial costs to us and potentially cause a diversion of our resources.
In addition, we may face claims of infringement that could interfere with our ability to use technology or other intellectual property rights that are material to our business operations. In the event a claim of infringement against us is successful, we may be required to pay royalties to use technology or other intellectual property rights that we had been using, or we may be required to enter into a license agreement and pay license fees, or we may be required to stop using the technology or other intellectual property rights that we had been using. We may be unable to obtain necessary licenses from third parties at a reasonable cost or within a reasonable amount of time. Any litigation of this type, whether successful or unsuccessful, could result in substantial costs to us and potentially cause a diversion of our resources.
27
Our 3-in-1 Rollover patent expired in early 2018 and our business, financial condition, operations, or cash flows may suffer an adverse effect from our competitors’ use of this technology.
We no longer have the ability to extend our existing 3-in-1 Rollover patent, which allows a patron that has reached his or her daily ATM limit to obtain funds via a POS debit card cash access transaction or a credit card cash access transaction instead. As a result of the patent expiration, our competitors will have the ability to emulate this technology; and our business, financial condition, operations, or cash flows may suffer an adverse effect.
We rely on hardware, software and games licensed from third parties, and on technology provided by third-party vendors, the loss of which could materially and adversely affect our business, increase our costs and delay deployment or suspend development of our gaming systems and player terminals.
We have entered into license agreements with third parties for the exclusive use of their technology and intellectual property rights in the gaming industry, such as our license to use portions of the software infrastructure upon which our cash access systems operate, and we also rely on third-party manufacturers to manufacture our gaming devices, fully integrated kiosks and other integrated kiosk solutions. We rely on these other parties to maintain and protect this technology and the related intellectual property rights. If our licensors fail to protect their intellectual property rights in material that we license and we are unable to protect such intellectual property rights, the value of our licenses may diminish significantly and our business could be significantly harmed. In addition, if these agreements expire and we are unable to renew them, or if the manufacturers of this software or hardware, or functional equivalents of this software or hardware, were either no longer available to us or no longer offered to us on commercially reasonable terms, we may lose a valuable competitive advantage and our business could be harmed.
Acts of God, adverse weather and shipping difficulties, particularly with respect to international third-party suppliers of our components, could cause significant production delays. If we are unable to obtain these components from our established third-party vendors, we could be required to either redesign our product to function with alternate third-party products or to develop or manufacture these components ourselves, which would result in increased costs and could result in delays in the deployment of our gaming systems and player terminals. Furthermore, we might be forced to limit the features available in our current or future offerings.
We rely on intellectual property licenses from one or more third-party competitors, the loss of which could materially and adversely affect our business and the sale or placement of our products. Various third-party gaming manufacturers with which we compete are much larger than us and have substantially larger intellectual property assets. The gaming manufacturer industry is very competitive and litigious, and a lawsuit brought by one of our larger competitors, whether or not well-founded, may have a material adverse effect on our business, financial condition, operations or cash flows and our ability to sell or place our products.
Our inability to identify business opportunities and future acquisitions, or successfully execute any of our identified business opportunities or future acquisitions could limit our future growth.
From time to time, we pursue strategic acquisitions in support of our strategic goals. In connection with any such acquisitions, we could face significant challenges in timely securing required approvals of Gaming Authorities, or managing and integrating our expanded or combined operations, including acquired assets, operations and personnel. There can be no assurance that acquisition opportunities will be available on acceptable terms or at all or that we will be able to obtain necessary financing or regulatory approvals to complete potential acquisitions.
We may not achieve the intended benefits of our acquisitions, if any, nor may we be able to integrate those businesses successfully, and any such acquisitions may disrupt our current plans and operations.
Our ability to succeed in implementing our strategy will depend to some degree upon the ability of our management to successfully integrate commercially viable acquisitions. Acquisition transactions may disrupt our ongoing business and distract management from other responsibilities. The expected cost synergies associated with such acquisitions may not be fully realized in the anticipated amounts or within the contemplated timeframes or cost expectations, which could result in increased costs and have an adverse effect on our prospects, results of operations, cash flows and financial condition. Our businesses may be negatively impacted if we are unable to effectively manage our expanded operations. The integration of these acquisitions will require significant time and focus from management and may divert attention from the day‑to‑day operations of the combined business or delay the achievement of our strategic objectives. We expect to incur incremental costs and capital expenditures related to our contemplated integration activities.
28
The risks we commonly encounter in acquisitions include:
if, in addition to our current indebtedness, we incur significant debt to finance a future acquisition and our combined business does not perform as expected, we may have difficulty complying with debt covenants;
we may be unable to make a future acquisition which is in our best interest due to our current level of indebtedness;
if we use our stock to make a future acquisition, it will dilute existing stockholders;
we may have difficulty assimilating the operations and personnel of any acquired company;
the challenge and additional investment involved with integrating new products and technologies into our sales and marketing process;
we may have difficulty effectively integrating any acquired technologies or products with our current products and technologies, particularly where such products reside on different technology platforms or overlap with our products;
our ongoing business may be disrupted by transition and integration issues;
the costs and complexity of integrating the internal information technology infrastructure of each acquired business with ours may be greater than expected and may require additional capital investments;
we may not be able to retain key technical and managerial personnel from an acquired business;
we may be unable to achieve the financial and strategic goals for any acquired and combined businesses;
we may have difficulty in maintaining controls, procedures and policies during the transition and integration period following a future acquisition;
our relationships with partner companies or third-party providers of technology or products could be adversely affected;
our relationships with employees and customers could be impaired;
our due diligence process may fail to identify significant issues with product quality, product architecture, legal or tax contingencies, customer obligations and product development, among other things;
as successor we may be subject to certain liabilities of our acquisition targets;
we may face new intellectual property challenges; and
we may be required to sustain significant exit or impairment charges if products acquired in business combinations are unsuccessful.
Our failure to effectively integrate any future acquisition would adversely affect the benefit of such transaction, including potential synergies or sales growth opportunities, in the time frame anticipated.
We operate our business in regions subject to natural disasters. Any interruption to our business resulting from a natural disaster will adversely affect our revenues and results of operations.
In the event of a natural disaster, the operations of gaming establishments could be negatively impacted or consumer demand for gaming could decline, or both, and as a result, our business could be interrupted, which could materially and adversely affect our revenues and results of operations. Adverse weather conditions, particularly flooding, hurricanes, tornadoes, heavy snowfall and other extreme weather conditions often deter our customer’s end users from traveling or make it difficult for them to frequent the sites where our games are installed. If any of those sites experienced prolonged adverse weather conditions, or if the sites in the State of Oklahoma, where a significant number of our games are installed, simultaneously experienced adverse weather conditions, our results of business,
29
financial condition and operations could be materially and adversely affected. During 2017, the impact of weather-related natural disasters resulted in business disruption at certain of our customers’ facilities.
Risks Related to Regulation of Our Industry
We may be subject to fines, penalties, liabilities and legal claims resulting from unauthorized
Unauthorized disclosure of cardholder and patron data
or similar violations of applicable data privacy laws, whether through a security breach of our computer systems, our third-party processor’s computer systems or otherwise, or through our unauthorized use or transmission of such
data.data could subject us to costly fines, penalties, and legal claims.
We collect and store personally identifiable information about cardholders and patrons that perform certain cash access and Central Credit transactions, including names, addresses, social security numbers, driver’s license numbers, and account numbers, and we maintain a database of cardholder and patron data, including account numbers, in order to process our cash access and Central Credit transactions. We also rely on our third-party processor and certain other technology partners to process and store cardholder and patron data relating to our cash access and Central Credit transactions. As a result, we, as well as our third-party processor, certain of our other technology providers, and some of our gaming establishment customers, are required to comply with various
foreign, federal, and state privacy statutes and regulations, and the PCI Data Security Standard. Compliance with these regulations and requirements, which are subject to change at any time, is often difficult and costly, and our failure, or the failure of these other third parties, to comply may result in significant fines or civil penalties, regulatory enforcement action, liability to our sponsor bank, and termination of our agreements with our gaming establishment customers, each of which could have a material adverse effect on our business, financial condition, operations, or cash flows. If our computer systems or those of our third-party processor or other technology providers suffer a security breach, we may be subject to liability, including claims for unauthorized transactions with misappropriated bank card information, impersonation, or similar fraud claims, as well as for any failure to comply with laws governing required notifications of such a breach, and these claims could result in protracted and costly litigation, penalties, or sanctions from the card associations and EFT payment networks, and damage to our reputation, which could reduce and limit our ability to provide cash access and related services to our gaming establishment customers.
The personally identifiable information we collect also includes our patrons’ transaction behavioral data and credit history data, which we may use to provide marketing and data intelligence services to gaming establishments. This information is increasingly subject to federal, state, and card association laws and regulations, as well as laws and regulations in numerous jurisdictions around the world. Governmental regulations are typically intended to protect the privacy and security of such data and information as well as to regulate the collection, storage, transmission, transfer, use, and distribution of such data and information. We could be materially and adversely affected if domestic or international laws or regulations are expanded to require changes in our business practices or if governing jurisdictions interpret or implement their laws or regulations in ways that negatively affect our business or even prohibit us from offering certain marketing and data intelligence or other services. Similarly, if we are required to allocate significant resources to modify our internal operating systems and procedures to enable enhanced protection of patron data that we transmit, store and use, our business results could be adversely affected. In addition, we may face requirements that pose compliance challenges in new international markets that we seek to enter as various foreign jurisdictions have different laws and regulations concerning the storage, transmission and use of gaming patron data. Such variation could subject us to costs, liabilities, or negative publicity that could impair our ability to expand our operations into some
countries andcountries; therefore,
it could limit our future growth.
We are subject to extensive governmental gaming regulation, which may harm our business.
Our operation of gaming activities, including the sale and manufacturing of gaming devices, fully integrated kiosks, the provision of cash access services at gaming establishments and the operation of central determinant systems, is subject to extensive regulation by the jurisdictions where we operate. The gaming laws, regulations and ordinances vary from jurisdiction to jurisdiction, but generally concern the antecedents, acumen, financial stability and character of our owners, officers and directors, as well as those persons financially interested or involved in our companies. Our violation of these gaming laws, regulations and ordinances could result in the imposition of substantial fines, or in the conditioning, limitation, suspension or revocation of a required license, registration or other approval, either of which could have a material adverse impact on our business depending on the specific circumstances. In addition, we are subject to the possible increase at any time by various state and federal
30
legislatures and officials of gaming taxes or fees, which could adversely affect our results. For a summary of gaming regulations that could affect our business, see “Item 1. Business—Regulation.”
Our ability to conduct both our gaming and cash access businesses, expand operations, develop and distribute new games, products and systems, and expand into new gaming markets is also subject to significant federal, state, local, Native American and foreign
regulations.regulations which vary from jurisdiction to jurisdiction. In the United States and many other countries, gaming must be expressly authorized by law. Once authorized, such activities are subject to extensive and evolving governmental regulation.
While we seek to comply withThe gaming laws, regulations and ordinances generally concern the
antecedents, acumen, financial stability and character of our owners, officers and directors, as well as those persons financially interested or involved in our companies; dictate the technical standards and regulations
set forth by each jurisdiction, a governmental agency or court could disagree with our interpretation of these standards and regulations or determine that the manufacturing and use of certain of our electronic player terminals,
and perhaps other key components of our gaming systems
that rely to some extent upon electronic equipment to run a game, is impermissible under applicable law. An adverse regulatory or judicial determination regardingand certain other products; set forth the
legal status of our products could have material adverse consequences for us in other jurisdictions, including with gaming regulators,process and
our business, operating results and prospects could suffer and we and our officers and directors could be subject to significant fines and penalties. Furthermore,manner by which the
failure to become licensed, or the loss or conditioning of a license, in one market may have the adverse effect of preventing licensing in other markets or the revocation of licenses we already maintain.As we expand into new markets, we expect to encounter business, legal, operational and regulatory uncertainties as well as additional responsibilities. As we enter new jurisdictions, we are subject to increasing legal, regulatory and reporting requirements that will require substantial additional resources,Gaming Authorities issue such as new licenses, permits and approvals, including third-party certifications that our games comply with a particular jurisdiction’s stated regulations, in order to meet our expectations for new market entry, and such licenses, permits or approvals may not be timely granted to us, or granted to us at all, which could have a material effect on our business in general and new market entry specifically. Obtaining and maintaining all required licenses, findings of suitability registrations, permits or approvals is time consuming, expensive and potentially distracting to management. As we enter new jurisdictions, our reporting systems will need to be developed or updated, and we may fail to provide timely or adequate notifications or reporting requirements within these new jurisdictions, which could have adverse regulatory consequences for us in that, or in other, jurisdictions, which could affect our business. In addition, entry into new markets may require us to make changes to our gaming systems to ensure that they comply with applicable regulatory requirements. We may also encounter additional legal and regulatory challenges that are difficult or impossible to foresee and which could result in an unforeseen adverse impact on planned revenues or costs associated with the new market opportunity. If we are unable to effectively develop and operate within these new markets, then our business, operating results and financial condition would be impaired.
Generally, our placement of systems, games and technology into new market segments involves a number of business uncertainties, including whether:
the technical platform on which our gaming units, systems and products are based will comply, or can be modified to comply, with the minimum technical requirements for each of the identified new gaming markets;
we are able to successfully pass required field trials and comply with the initial game/system installation requirements for each new jurisdiction;
our resources and expertise will enable us to effectively operate and grow in such new markets, including meeting regulatory requirements;
our internal processes and controls will continue to function effectively within these new segments;
we have enough experience to accurately predict revenues and expenses in these new markets;
the diversion of management attention and resources from our traditional business, caused by entering into new market segments, will have harmful effects on our traditional business;
we will be able to successfully compete against larger companies who dominate the markets that we are trying to enter; and
we can timely perform under our agreements in these new markets because of other unforeseen obstacles.
31
product approvals. In addition, the suspension, revocation, nonrenewal or limitation of any of our licenses or product approvals, or the inability to obtain or maintain requisite
license or product approvals could have a material adverse effect on our business operations, financial condition, and results of operations and our ability to maintain key employees. The Gaming Authorities may deny, limit, condition, suspend or revoke a gaming license or related approval for violations of applicable gaming laws and regulations and may impose substantial fines and take other actions, any one of which could have a significant adverse effect on our business, financial condition and results of operations.
Further, changes in existing gaming laws or regulations or new interpretations of existing gaming laws may hinder or prevent us from continuing to operate in those jurisdictions where we currently do business, which could harm our operating results. In particular, the enactment of unfavorable legislation or government efforts affecting or directed at manufacturers or gaming operators, such as referendums to increase gaming taxes or requirements to use local distributors, or uncertainty as to the means and manner in which existing gaming laws may be interpreted and applied, either singly or together, could have a negative impact on our operations.
In May 2018, the United States Supreme Court struck down the Professional and Amateur Sports Protection Act (“PASPA”) as unconstitutional, which led many states to quickly propose and, in some instances, pass legislation authorizing sports betting. Consequently, gaming regulators, many of our operator customers, and many of our competitors dedicated resources to service this new market, as did we. However, in January 2019, the Office of Legal Counsel of the Department of Justice (“OLC”) published an opinion reversing its prior 2011 opinion interpreting the Federal Wire Act. The 2019 opinion now indicates that the Wire Act is applicable to any wire communication across state lines and specifically indicating that the Unlawful Internet Gambling Enforcement Act (“UIGEA”) does not modify the Wire Act, violations of which may be subject to criminal prosecution. The specific comment regarding UIGEA implicates UIGEA’s carve out for “unlawful Internet gambling” and “intermediate routing” (i.e., the ancillary crossing of state lines of transmissions between intra-state communications points). In reliance on the 2011 Wire Act opinion, several states legalized online gaming, and the proposed legislation in many jurisdictions in response to the May 2018 PASPA decision included online sports betting. The impact of the 2019 Wire Act opinion is currently unclear, and may implicate lottery, land-based, and online gaming as well as banks and payment processors that services these market segments. The Deputy Attorney General of the United States delayed implementation of the 2019 opinion through June 14, 2019, and several states’ attorney general have, or are contemplating, action in response to the 2019 opinion, including litigation. Interpretations and resultant enforcement of the Wire Act as may relate to intermediate routing transactions could negatively impact our WAP games business as well as our FinTech cash access business and our interactive real money gaming business.
Moreover, in addition to the risk of enforcement action, we are also at risk of loss of business reputation in the event of any potential legal or regulatory investigation, whether or not we are ultimately accused of or found to have committed any violation.
For a summary of gaming regulations that could affect our business, see “Item 1. Business — Regulation.”
Many of the financial services that we provide are subject to extensive rules and regulations, which may harm our business.
Our Central Credit gaming patron credit bureau and check verification and warranty services are subject to the
Fair Credit Reporting Act,FCRA, the
Fair and Accurate Credit Transactions Act of 2003FACTA, and similar state laws. The collection practices that are used by our third-party providers and us may be subject to the
Fair Debt Collection Practices ActFDCPA and applicable state laws relating to debt collection. All of our cash access services and patron marketing services are subject to the privacy provisions of state and federal law, including the Gramm-Leach-Bliley Act. Our POS debit card cash access transactions and ATM withdrawal services are subject to the Electronic Fund Transfer Act. Our ATM services are subject to the applicable state banking regulations in each jurisdiction in which we operate ATMs. Our ATM services may also be subject to state and local regulations relating to the imposition of daily limits on the amounts that may be withdrawn from ATMs, the location of ATMs, our ability to surcharge cardholders who use our ATMs, and the form and type of notices that must be disclosed regarding the provision of our ATM services. The cash access services we provide are subject to record keeping and reporting obligations under the Bank Secrecy Act and the USA PATRIOT Act of 2001. We are required to file SARs with respect to transactions completed at all gaming establishments where we provide our cash access services through a gaming establishment’s cashier or financial services center. If we are found to be noncompliant in any way with these laws, we could be subject to substantial civil and criminal penalties. In jurisdictions in which we serve as a check casher, we are subject to the applicable state licensing requirements and regulations governing check cashing activities. We are also subject to various state licensing requirements and regulations governing money transmitters.
We are subject to formal or informal audits, inquiries, or reviews from time to time by the regulatory authorities that enforce these financial services rules and regulations. In the event that any regulatory authority determines that the manner in which we provide cash access, patron marketing, or gaming patron credit bureau services is not in compliance with existing rules and regulations, or the regulatory authorities adopt new rules or regulations that prohibit or restrict the manner in which we provide cash access, patron marketing, or gaming patron credit bureau services, then these regulatory authorities may force us to modify the manner in which we operate or force us to stop processing certain types of cash access transactions or providing patron marketing or gaming patron credit bureau services altogether. We may also be required to pay substantial penalties and fines if we fail to comply with applicable rules and regulations. For example, if we fail to file CTRs or SARs on a timely basis or if we are found to be
noncompliant in any way with either the Bank Secrecy Act or the USA PATRIOT Act of 2001, we could be subject to substantial civil and criminal penalties. In addition, our failure to comply with applicable rules and regulations could subject us to private litigation.
We are subject to extensive rules and regulations of card associations, including VISA, MasterCard, and EFT networks that are always subject to change, which may harm our business.
Our cash access business is subject to the extensive rules and regulations of the leading card associations, VISA and MasterCard. The rules and regulations do not expressly address some of the contexts and settings in which we process cash access transactions or do so in a manner subject to varying interpretations. As an example, we and certain of our providers must comply with the PCI Data Security Standard. The failure by any of such providers to comply with such standards could result in our being fined or being prohibited from processing transactions through VISA, MasterCard, and other card and payment networks. We also process transactions involving the use of the proprietary credit cards such as those offered by Discover Card and American Express, as well as other regional cards issued in certain international markets. The rules and regulations of the proprietary credit card networks that
32
service these cards present risks to us that are similar to those posed by the rules and regulations of VISA, MasterCard, and other payment networks.
The card associations’ and payment networks’ rules and regulations are always subject to change, and the card associations or payment networks may modify their rules and regulations from time to time. Our inability to anticipate changes in rules and regulations, or the interpretation or application thereof, may result in substantial disruption to our business. In the event that the card associations, payment networks or our sponsoring banks determine that the manner in which we process certain types of card transactions is not in compliance with existing rules and regulations, or if the card associations or payment networks adopt new rules or regulations that prohibit or restrict the manner in which we process certain types of card transactions, we may be forced to pay a fine, modify the manner in which we operate our business, or stop processing certain types of cash access transactions altogether, any of which could have a material adverse effect on our business, financial condition, operations, or cash flows.
Card associations and EFT networks may change interchange reimbursement rates or network operating fees or assess new fees associated with the processing and settlement of our cash access transactions or otherwise change their operating rules and regulations without our consent and such changes may affect our revenues, cost of revenues (exclusive of depreciation and amortization), net income, and our business generally.
We receive income from issuers of ATM, credit, and debit cards for certain transactions performed on our ATMs related to cash dispensing or certain other non-financial transactions such as balance inquiries. The EFT networks may also charge certain fees related to the performance of these transactions. We refer to the net of this income and fees as reverse interchange. The amount of this reverse interchange income is determined by the card associations and EFT networks, and this income is subject to decrease at their discretion.
We pay interchange and other network fees for services to the credit card associations and EFT networks that they provide in settling transactions routed through their networks. Collectively we call these charges interchange fees. Subject to the limitations imposed by federal regulations such as the Durbin Amendment or other regulations that may be enacted, the amounts of these interchange fees are determined based upon the sole discretion of the card associations and EFT networks and are subject to increase at any time.
Although certain of our contracts enable us to pass through increases in interchange or other network processing fees to our customers, competitiveCompetitive pressures might prevent us from passing all or some of these fees through to our customers in the future. To the extent that we are unable to pass through to our customers all or any portion of any increase in interchange or other network processing fees, our cost of revenues (exclusive of depreciation and amortization) would increase and our net income would decrease, assuming no change in transaction volumes. Any such decrease in net income could have a material adverse effect on our business, financial condition, operations, or cash flows. In addition, proposed changes to the Dodd-Frank Act, such as the repeal of the Durbin Amendment, if adopted, or other regulation that could be implemented to limit the amount of surcharge or service fees charged for our cash access transactions could have a negative impact on revenue and gross margins (exclusive of depreciation and amortization) as a result of reduced service fee revenue and potential increases in interchange rates merchants pay for debit card transactions.
The card associations and EFT networks may also elect to impose new membership or other fees, or implement new rules and regulations with respect to processing transactions through their networks, and any such new fees, rules, or regulations could have a material adverse effect on our business, financial condition, operations, or cash flows.
The provision of our credit card access, POS debit, and ATM services are dependent upon our continued sponsorship into the VISA and MasterCard card associations, and the suspension or termination of our sponsorship would result in a material adverse effect on our business, financial condition, operations, or cash flows.
We process virtually all of our credit card cash access, POS debit, and ATM service transactions through the VISA and MasterCard card associations, both domestically and internationally, and virtually all of the revenue that we derive from our credit card cash
access, POS debit, and ATM services is dependent upon our continued sponsorship into the VISA and MasterCard associations. We cannot provide these services without sponsorship into the VISA and MasterCard associations by a member financial institution. Our failure to maintain our current sponsorship arrangements or secure alternative sponsorship arrangements into the VISA and MasterCard associations could have a material adverse effect on our business, financial condition, operations, or cash flows.
33
Our ATM service business is subject to extensive rules and regulations, which may harm our business.
Our ATM services are subject to the applicable federal, state, and local banking regulations in each jurisdiction in which we operate ATMs, which regulations relate to the imposition of daily limits on the amounts that may be withdrawn from ATMs, the location of ATMs, our ability to surcharge cardholders who use our ATMs, and the form and type of notices that must be disclosed with respect to the fees we charge to patrons in connection with our ATM services. ATMs are also subject to requirements of the Americans with Disabilities Act, which in general require that ATMs be accessible to individuals with disabilities, such as visually-impaired persons. These laws and regulations may impose significant burdens on our ability to operate ATMs profitably in some locations, or at all, and our business, financial condition, operations, or cash flows could be materially adversely affected. Moreover, because these regulations are subject to change, we may be forced to modify our ATM operations in a manner inconsistent with the assumptions upon which we relied when entering into contracts to provide ATM services at gaming establishments. If federal, state, local, or foreign authorities adopt new laws or regulations, or raise enforcement levels on existing laws and regulations that make it more difficult for us to operate our ATM business, then our revenues and earnings may be negatively affected. If legislation or regulations are enacted in the future that adversely impact our ATM business, we may be forced to modify our operations in a manner inconsistent with the assumptions upon which we relied when entering into contracts to provide ATMs at gaming establishments and our business, financial condition, operations, or cash flows could suffer a material adverse effect.
Consumer privacy laws may change, requiring us to change our business practices or expend significant amounts on compliance with such laws.
Our patron marketing and database services depend on our ability to collect and use non-public personal information relating to patrons who use our products and services and the transactions they consummate using our services. We are required by federal and state privacy laws and rules to safeguard and protect the privacy of such information, to make disclosures to patrons regarding our privacy and information sharing policies and, in some cases, to provide patrons an opportunity to “opt out” of the use of their information for certain purposes. The failure or circumvention of the means by which we safeguard and protect the privacy of information we gather may result in the dissemination of non-public personal information, which may harm our reputation and may expose us to liability to the affected individuals and regulatory enforcement proceedings or fines. Regulators reviewing our policies and practices may require us to modify our practices in a material or immaterial manner or impose fines or other penalties if they believe that our policies and practices do not meet the necessary standard. To the extent that our patron marketing and database services have failed, are now failing, or in the future fail to comply with applicable law, our privacy policies or the notices that we provide to patrons, we may become subject to actions by a regulatory authority or patrons which cause us to pay monetary penalties or require us to modify the manner in which we provide patron marketing and database services. To the extent that patrons exercise their right to “opt out,” our ability to leverage existing and future databases of information would be curtailed. Consumer and data privacy laws are evolving, and due to recent high profile thefts and losses of sensitive consumer information from protected databases, such laws may be broadened in their scope and application, impose additional requirements and restrictions on gathering, encrypting and using patron information or narrow the types of information that may be collected or used for marketing or other purposes or require patrons to “opt-in” to the use of their information for specific purposes, or impose additional fines or potentially costly compliance requirements which will hamper the value of our patron marketing and database services.
Risks Related to Our Stock
Our common stock has been publicly traded since September 2005, and we expect that the price of our common stock will fluctuate substantially.
There has been a public market for our common stock since September 2005. The market price of our common stock may fluctuate significantly in response to a number of factors, some of which are beyond our control, including those described above under “—Risks Related to Our Business,” “—Risks Related to Regulation of Our Industry”, and the following:
our failure to maintain our current customers, including because of consolidation in the gaming industry;
increases in commissions paid to gaming establishments as a result of competition;
increases in interchange rates, processing fees, or other fees paid by us;
34
| •
| decreases in reverse interchange rates paid to us;
|
decreases in reverse interchange rates paid to us;
actual or anticipated fluctuations in our or our competitors’ revenue, operating results, or growth rate;
our inability to adequately protect or enforce our intellectual property rights;
any adverse results in litigation initiated by us or by others against us;
our inability to make payments on our outstanding indebtedness as they become due or our inability to undertake actions that might otherwise benefit us based on the financial and other restrictive covenants contained in the New Credit Facilities and the indenture governing the 2017 Unsecured Notes;
the loss, or failure, of a significant supplier or strategic partner to provide the goods or services that we require from them;
our inability to introduce successful, new products and services in a timely manner or the introduction of new products or services by our competitors that reduce the demand for our products and services;
our failure to successfully enter new markets or the failure of new markets to develop in the time and manner that we anticipate;
announcements by our competitors of significant new contracts or contract renewals or of new products or services;
changes in general economic conditions, financial markets, the gaming industry, or the payments processing industry;
the trading volume of our common stock;
sales of common stock or other actions by our current officers, directors, and stockholders;
acquisitions, strategic alliances, or joint ventures involving us or our competitors;
future sales of our common stock or other securities;
the failure of securities analysts to cover our common stock or changes in financial estimates or recommendations by analysts;
our failure to meet the revenue, net income, or earnings per share estimates of securities analysts or investors;
departures of key personnel or our inability to attract or retain key personnel;
our ability to prevent, mitigate, or timely recover from cybersecurity breaches, attacks, and compromises with respect to our infrastructure, systems, and information technology environment;
terrorist acts, theft, vandalism, fires, floods, or other natural disasters; and
rumors or speculation as to any of the above which we may be unable to confirm or deny due to disclosure restrictions imposed on us by law or which we otherwise deem imprudent to comment upon.
Some provisions of our amended and restated certificate of incorporation and amended and restated bylaws may delay or prevent transactions that many stockholders may favor.
Some provisions of our amended and restated certificate of incorporation and amended and restated bylaws may have the effect of delaying, discouraging, or preventing a merger or acquisition that our stockholders may consider favorable or a change in our management or our Board of Directors. These provisions:
divide our Board of Directors into three separate classes serving staggered three-year terms, which will have the effect of requiring at least two annual stockholder meetings instead of one, to replace a majority of our directors, which could have the effect of delaying or preventing a change in our control or management;
provide that special meetings of stockholders can only be called by our Board of Directors, Chairman of the Board, or Chief Executive Officer. In addition, the business permitted to be conducted at any special meeting of stockholders is limited to the business specified in the notice of such meeting to the stockholders;
35
| •
| provide for an advance notice procedure with regard to business to be brought before a meeting of stockholders which may delay or preclude stockholders from bringing matters before a meeting of stockholders or from making nominations for directors at a meeting of stockholders, which could delay or deter takeover attempts or changes in management;
|
provide for an advance notice procedure with regard to business to be brought before a meeting of stockholders which may delay or preclude stockholders from bringing matters before a meeting of stockholders or from making nominations for directors at a meeting of stockholders, which could delay or deter takeover attempts or changes in management;
eliminate the right of stockholders to act by written consent so that all stockholder actions must be effected at a duly called meeting;
provide that directors may only be removed for cause with the approval of stockholders holding a majority of our outstanding voting stock;
provide that vacancies on our Board of Directors may be filled by a majority, although less than a quorum, of directors in office and that our Board of Directors may fix the number of directors by resolution;
allow our Board of Directors to issue shares of preferred stock with rights senior to those of the common stock and that otherwise could adversely affect the rights and powers, including voting rights and the right to approve or not to approve an acquisition or other change in control, of the holders of common stock, without any further vote or action by the stockholders; and
do not provide for cumulative voting for our directors, which may make it more difficult for stockholders owning less than a majority of our stock to elect any directors to our Board of Directors. In addition, we are also subject to Section 203 of the Delaware General Corporation Law, which provides, subject to enumerated exceptions, that if a person acquires 15% or more of our voting stock, the person is an “interested stockholder” and may not engage in “business combinations” with us for a period of three years from the time the person acquired 15% or more of our voting stock.
These provisions may have the effect of entrenching our management team and may deprive our stockholders of the opportunity to sell shares to potential acquirers at a premium over prevailing prices. This potential inability to obtain a premium could reduce the price of our common stock.
Item 1B. Unresolved Staff Comments.
None.
Item 2. Properties.
Our headquarters are located
We occupy real estate properties mostly in
the United States and, to a
facility in Las Vegas, Nevada, consisting of approximately 62,000 square feet of office space under a lease through April 2023. In addition, we have approximately 103,000 square feet of office space in Austin, Texas under a lease through June 2021. We also lease facilities with approximately 17,000 square feet in Chicago, Illinois and Reno, Nevada, which support the design, production and expansion of our gaming content. These design studioslesser degree, internationally that are under
a lease
through June 2023 and May 2021 for the Chicago and Reno offices, respectively. We also lease several other properties that are used to support all our products and services.agreements. We believe that these facilities are adequate for our business needs as presently conducted.
We primarily occupy the following leased real estate properties:
|
| | | |
| Location | Sq. Ft | Purpose | Segment |
| Austin, Texas | 204,256 | Games Headquarters and Operations | Games |
| Las Vegas, Nevada | 106,873 | Corporate Headquarters; FinTech Headquarters and Operations | FinTech; Games |
| Reno, Nevada | 17,138 | Game Design Studio | Games |
| Chicago, Illinois | 17,124 | Game Design Studio | Games |
In addition, we lease several other less significant real estate properties that are used to support our products and services.
Item 3. Legal Proceedings.
We are involved in various investigations, claims, and lawsuits in the ordinary course of our business. Although the outcome of our legal proceedings cannot be predicted with certainty and no assurances can be provided, based upon current information, we
do not believe the liabilities, if any, which may ultimately result from the outcome of such matters, individually or in the aggregate, will have a material adverse impact on our financial position, liquidity, or results of operations.
Item 4. Mine Safety Disclosures.
PART II
PART IIIn this filing, we refer to: (i) our audited consolidated financial statements and notes thereto as our “Financial Statements,” (ii) our Consolidated Statements of Loss and Comprehensive Loss as our “Statements of Loss,” (iii) our Consolidated Balance Sheets as our “Balance Sheets,” and (iv) Item 7. Managements’ Discussion and Analysis of Financial Condition and Results of Operations as our “Results of Operations.”
Item 5. Market for Registrant’s Common Equity, Related Stockholder Matters and Issuer Purchases of Equity Securities.
Our common stock is listed for trading on the New York Stock Exchange under the symbol “EVRI.” On March 1,
2018,2019, there were
fiveeight holders of record of our common stock. Because many of our shares of common stock are held by brokers and other institutions on behalf of stockholders, we are unable to estimate the total number of beneficial stockholders represented by these record holders.
The following table sets forth for the indicated periods, the high and low sale prices per share of our common stock:
| | Price Range | |
| | High | | | Low | |
2017 | | | | | | | | |
First Quarter | | $ | 5.06 | | | $ | 2.16 | |
Second Quarter | | | 7.50 | | | | 4.66 | |
Third Quarter | | | 8.99 | | | | 6.81 | |
Fourth Quarter | | | 8.99 | | | | 7.16 | |
2016 | | | | | | | | |
First Quarter | | $ | 4.50 | | | $ | 1.73 | |
Second Quarter | | | 2.29 | | | | 1.13 | |
Third Quarter | | | 2.64 | | | | 1.16 | |
Fourth Quarter | | | 2.60 | | | | 1.21 | |
On March 1, 2018, the closing sale price of our common stock on the New York Stock Exchange was $7.32.
Dividend Policy
We have never declared or paid any cash dividends on our capital stock. We currently intend to retain all earnings for the repayment of our outstanding debt and to finance the growth and development of our business. Any future change in our dividend policy will be made at the discretion of our Board of Directors and will depend on contractual restrictions, our results of operations, earnings, capital requirements and other factors considered relevant by our Board of Directors. In addition, the New Credit Facilities and the indenture governing the 2017 Unsecured Notes limit our ability to declare and pay cash dividends.
Common Stock Repurchases
We did not have a share repurchase program in effect for the years ended December 31,
2018, 2017,
2016 and
2015.37
2016.
Issuer Purchases and Withholding of Equity Securities
We repurchased or withheld from restricted stock awards
17,552, 15,457,
18,717, and
32,61718,717 shares of our common stock at an aggregate purchase price of $0.1 million
$41,528,for the years ended December 31, 2018, 2017, and
$0.2 million,2016, respectively, to satisfy the minimum applicable tax withholding obligations incident to the vesting of such restricted stock
awards for the years ended December 31, 2017, 2016 and 2015, respectively.awards. The following table includes the monthly repurchases or withholdings of our common stock during the fourth quarter ended December 31,
2017:2018: | | Total Number of Shares Purchased (1) | | | Average Price per Share (2) | |
| | (in thousands) | | | | | |
Tax Withholdings | | | | | | | | |
10/1/17 - 10/31/17 | | | 10.2 | | | $ | 8.14 | |
11/1/17 - 11/30/17 | | | 0.4 | | | $ | 8.38 | |
12/1/17 - 12/31/17 | | | 0.5 | | | $ | 7.70 | |
Total | | | 11.1 | | | $ | 8.13 | |
|
| | | | | | | |
| | | Total Number of Shares Purchased (1) (in thousands)
| | Average Price per Share (2) |
| | | | | |
| Tax Withholdings | | |
| | |
|
| 10/1/18 - 10/31/18 | | 6.4 |
| | $ | 7.04 |
|
| 11/1/18 - 11/30/18 | | 0.6 |
| | $ | 7.41 |
|
| 12/1/18 - 12/31/18 | | 3.1 |
| | $ | 5.26 |
|
| Total | | 10.1 |
| | $ | 6.52 |
|
| |
| (1) | Represents the shares of common stock that were withheld from restricted stock awards to satisfy the minimum applicable tax withholding obligations incident to the vesting of such restricted stock awards. There are no limitations on the number of shares of common stock that may be withheld from restricted stock awards to satisfy the minimum tax withholding obligations incident to the vesting of restricted stock awards. |
(2)
| |
| (2) | Represents the average price per share of common stock withheld from restricted stock awards on the date of withholding. |
38
The line graph below compares the cumulative total stockholder return on our common stock with the cumulative total return of the Standard & Poor’s (“S&P”) 500 Index and the S&P Information Technology Index during the
five yearfive-year period ended December 31,
2017.2018.
The graph assumes that $100 was invested on December 31,
20122013 in our common stock, in the S&P 500 Index and the S&P Information Technology Index, and that all dividends were reinvested. Research Data Group, Inc. furnished this data and the cumulative total stockholder returns for our common stock, the S&P 500 Index and the S&P Information Technology Index are based on the calendar month end closing prices. The comparisons in the graph are required by the SEC and are not intended to forecast or be indicative of possible future performance of our common stock.
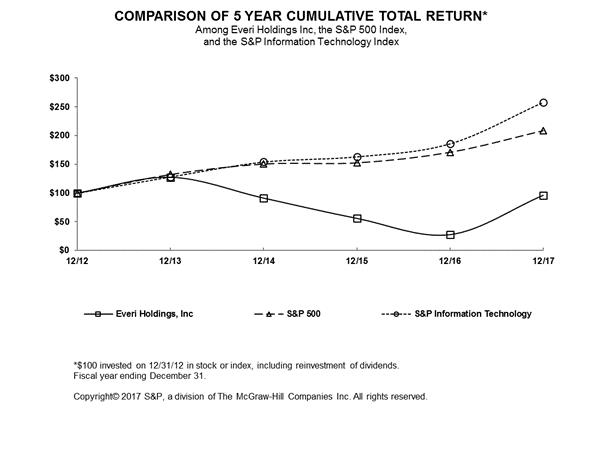
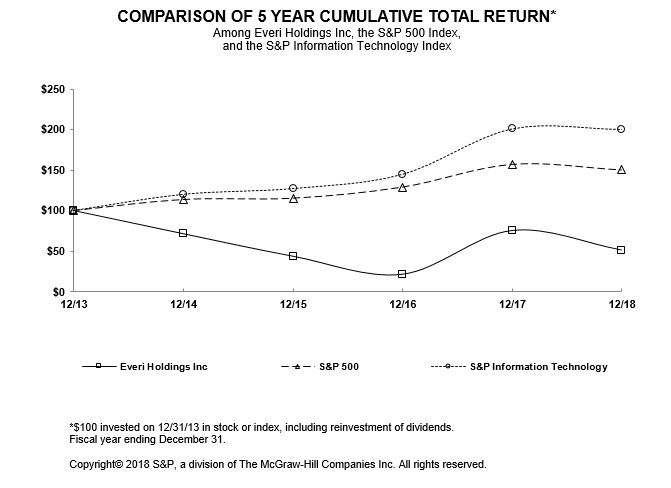
The performance graph and the related chart and text are being furnished solely to accompany this Annual Report on Form 10-K pursuant to Item 201(e) of Regulation S-K, and are not being filed for purposes of Section 18 of the Exchange Act and are not to be incorporated by reference in any filing by us under the Securities Act or the Exchange Act, whether made before or after the date hereof and irrespective of any general incorporation language in any such filing.
39
Item 6. Selected
Financial Data.The following selected historical financial data has been derived from, and should be read in conjunction with, our Financial Statements and Results of Operations included elsewhere in this Annual Report on Form 10-K. Our selected consolidated financial data may not be indicative of our future financial condition or results of operations (in thousands, except per share amounts).
| | Year Ended December 31, | |
| | 2017(1) | | | 2016(2) | | | 2015(3) | | | 2014(5) | | | 2013 | |
Income Statement Data | | | | | | | | | | | | | | | | | | | | |
Revenues | | $ | 974,948 | | | $ | 859,456 | | | $ | 826,999 | | | $ | 593,053 | | | $ | 582,444 | |
Operating income (loss) | | | 81,819 | | | | (118,555 | ) | | | (9,730 | ) | | | 33,782 | | | | 49,150 | |
Net (loss) income | | | (51,903 | ) | | | (249,479 | ) | | | (104,972 | ) | | | 12,140 | | | | 24,398 | |
Basic (loss) earnings per share | | | (0.78 | ) | | | (3.78 | ) | | | (1.59 | ) | | | 0.18 | | | | 0.37 | |
Diluted (loss) earnings per share | | | (0.78 | ) | | | (3.78 | ) | | | (1.59 | ) | | | 0.18 | | | | 0.36 | |
Weighted average common shares outstanding | | | | | | | | | | | | | | | | | | | | |
Basic | | | 66,816 | | | | 66,050 | | | | 65,854 | | | | 65,780 | | | | 66,014 | |
Diluted | | | 66,816 | | | | 66,050 | | | | 65,854 | | | | 66,863 | | | | 67,205 | |
| | At and For the Year Ended December 31, | |
| | 2017(1) | | | 2016(2) | | | 2015(3)(4) | | | 2014(5) | | | 2013 | |
Balance sheet data | | | | | | | | | | | | | | | | | | | | |
Cash and cash equivalents | | $ | 128,586 | | | $ | 119,051 | | | $ | 102,030 | | | $ | 89,095 | | | $ | 114,254 | |
Working capital(6) | | | (12,040 | ) | | | (1,875 | ) | | | 2,452 | | | | 12,550 | | | | (1,682 | ) |
Total assets | | | 1,537,074 | | | | 1,408,163 | | | | 1,550,385 | | | | 1,707,285 | | | | 527,327 | |
Total borrowings | | | 1,167,843 | | | | 1,121,880 | | | | 1,139,899 | | | | 1,188,787 | | | | 103,000 | |
Stockholders’ (deficit) equity | | | (140,633 | ) | | | (107,793 | ) | | | 137,420 | | | | 231,473 | | | | 218,604 | |
Cash flow data | | | | | | | | | | | | | | | | | | | | |
Net cash provided by operating activities | | $ | 95,828 | | | $ | 131,711 | | | $ | 124,587 | | | $ | 24,531 | | | $ | 4,334 | |
Net cash used in investing activities | | | (109,979 | ) | | | (88,054 | ) | | | (85,549 | ) | | | (1,085,847 | ) | | | (13,990 | ) |
Net cash provided by (used in) financing activities | | | 22,394 | | | | (24,922 | ) | | | (24,551 | ) | | | 1,037,423 | | | | (29,183 | ) |
|
| | | | | | | | | | | | | | | | | | | | |
| | | Year Ended December 31, |
| | | 2018(1) | | 2017(2) | | 2016(3) | | 2015(4)(5) | | 2014(6) |
| Income Statement Data | | |
| | |
| | |
| | |
| | |
|
| Revenues | | $ | 469,515 |
| | $ | 974,948 |
| | $ | 859,456 |
| | $ | 826,999 |
| | $ | 593,053 |
|
| Operating income (loss) | | 85,813 |
| | 81,819 |
| | (118,555 | ) | | (9,730 | ) | | 33,782 |
|
| Net income (loss) | | 12,356 |
| | (51,903 | ) | | (249,479 | ) | | (104,972 | ) | | 12,140 |
|
| Basic earnings (loss) per share | | 0.18 |
| | (0.78 | ) | | (3.78 | ) | | (1.59 | ) | | 0.18 |
|
| Diluted earnings (loss) per share | | 0.17 |
| | (0.78 | ) | | (3.78 | ) | | (1.59 | ) | | 0.18 |
|
| Weighted average common shares outstanding | | | | | | | | | | |
| Basic | | 69,464 |
| | 66,816 |
| | 66,050 |
| | 65,854 |
| | 65,780 |
|
| Diluted | | 73,796 |
| | 66,816 |
| | 66,050 |
| | 65,854 |
| | 66,863 |
|
|
| | | | | | | | | | | | | | | | | | | | |
| | | At and For the Year Ended December 31, |
| | | 2018(1) | | 2017(2) | | 2016(3) | | 2015(4)(5)(6) | | 2014(7) |
| Balance sheet data | | |
| | |
| | |
| | |
| | |
|
| Cash and cash equivalents | | $ | 297,532 |
| | $ | 128,586 |
| | $ | 119,051 |
| | $ | 102,030 |
| | $ | 89,095 |
|
| Working capital | | 17,304 |
| | (12,040 | ) | | (1,875 | ) | | 2,452 |
| | 12,550 |
|
| Total assets | | 1,548,261 |
| | 1,537,074 |
| | 1,408,163 |
| | 1,550,385 |
| | 1,707,285 |
|
| Total borrowings | | 1,163,216 |
| | 1,167,843 |
| | 1,121,880 |
| | 1,139,899 |
| | 1,188,787 |
|
| Stockholders’ (deficit) equity | | (108,895 | ) | | (140,633 | ) | | (107,793 | ) | | 137,420 |
| | 231,473 |
|
| Cash flow data | | | | | | | | | | |
| Net cash provided by operating activities | | $ | 294,286 |
| | $ | 95,828 |
| | $ | 131,711 |
| | $ | 124,587 |
| | $ | 24,531 |
|
| Net cash used in investing activities | | (123,350 | ) | | (109,979 | ) | | (88,054 | ) | | (85,549 | ) | | (1,085,847 | ) |
Net cash provided by (used in) financing activities | | 11 |
| | 22,394 |
| | (24,922 | ) | | (24,551 | ) | | 1,037,423 |
|
|
|
| (1) | On January 1, 2018, we adopted ASC 606 using the modified retrospective method, which resulted in the recording of an immaterial cumulative adjustment in the amount of approximately $4.4 million to accumulated deficit as of the adoption date. Our prior period results were not recast to reflect the new revenue recognition standard under the modified retrospective method. |
| |
| (2) | During 2017, we refinanced our senior secured term loan, senior secured notes and senior unsecured notes, which resulted in approximately $51.8 million of loss on extinguishment of debt. |
(2)
| |
| (3) | During 2016, the Games reporting unit had a goodwill impairment of $146.3 million. |
(3)
| |
| (4) | 2015 amounts include a full year of financial results for Everi Games. |
| |
| (5) | During 2015, the Games reporting unit had a goodwill impairment of $75.0 million. |
(4)
| |
| (6) | We reclassified $23.7 million of debt issuance costs related to our outstanding debt from the non-current portion of other assets to contra-liabilities included in long-term debt as of December 31, 2015 in connection with our retrospective adoption of Accounting Standards Update (“ASU”) No. 2015-03 in 2016. This reclassification decreased the December 31, 2015 balance of both total assets and total borrowings. |
(5)
| |
| (7) | 2014 amounts affected by the Merger for which total merger consideration of $1.1 billion on December 19, 2014 was paid and results of operations were recorded from the date of acquisition through December 31, 2014. |
(6)
| As a result of the Merger on December 19, 2014, we provide a classified balance sheet, for which a calculation of working capital has been included.
|
40
Item 7. Management’s Discussion and Analysis of Financial Condition and Results of Operations.
In this filing, we refer to: (i) our audited consolidated financial statements and notes thereto as our “Financial Statements;” (ii) our audited Consolidated Statements of Loss and Comprehensive Loss as our “Statements of Loss;” (iii) our audited Consolidated Balance Sheets as our “Balance Sheets;” and (iv) our consolidated results of operations as our “Results of Operations.”
The following discussion and analysis of financial condition and results of operations should be read in conjunction with “Item 1. Business,” “Item 6. Selected Financial
Data”Data,” and our Financial Statements included elsewhere in this Annual Report on Form 10-K and the information included in our other filings with the SEC.
This discussion includes forward-looking statements within the meaning of Section 27A of the Securities Act, Section 21E of the Exchange Act and
the Private Securities Litigation Reform Act of 1995 and should be read in conjunction with the disclosure and information contained and referenced in “Cautionary Note Regarding Forward-Looking Statements” and “Item 1A. Risk Factors” included elsewhere in this Annual Report on Form 10-K.
Everi is a leading supplier of technology solutions for the casino gaming industry.
The Company providesWe provide casino operators with a diverse portfolio of products including innovative gaming machines that power the casino floor, and casino operational and management systems that include comprehensive end-to-end payments solutions, critical intelligence offerings, and gaming operations efficiency
technology.technologies. Everi’s mission is to be a transformative force for casino operations by facilitating memorable player experiences, delivering reliable protection and security, and striving for customer satisfaction and operational excellence.
Everi Games provides a number of products We are divided into two primary business segments: “Everi Games” or “Games” and services for casinos, including (a) gaming machines comprised primarily of Class II and Class III slot machines placed under participation“Everi FinTech” or fixed fee lease arrangements or sold to casino customers, including the award-winning TournEvent®; and (b) system software, licenses, ancillary equipment and maintenance to its casino customers. Everi Games also develops and manages the central determinant system for the VLTs installed in the State of New York.
Everi Payments provides its casino customers cash access and related products and services including: (a) access to cash at gaming facilities via ATM cash withdrawals, credit card cash access transactions, POS debit card cash access transaction and check verification and warranty services; (b) fully integrated gaming industry kiosks that provide cash access and related services; (c) products and services that improve credit decision making, automate cashier operations and enhance patron marketing activities for gaming establishments; (d) compliance, audit and data solutions; and (e) online payment processing solutions for gaming operators in states that offer intrastate, internet-based gaming and lottery activities.
“FinTech”.
Items Impacting Comparability of Results of Operations
Our Financial Statements included in this report that present our financial condition and results of operations reflect the following transactions and events:
| •
| During the fourth quarter of 2017, we recorded a $37.2 million loss on extinguishment of debt consisting of a $26.3 million make-whole premium related to the satisfaction and redemption of the 2014 Unsecured Notes (defined herein) and approximately $10.9 million for the write-off of related unamortized debt issuance costs and fees. An additional $14.6 million loss on extinguishment of debt was incurred in the second quarter of 2017 for the unamortized deferred financing fees and discounts related to the extinguished term loan under the Prior Credit Facility and the redeemed Refinanced Secured Notes (both defined herein). In April 2015, we redeemed, in full, the 7.75% Secured Notes due 2021 and issued the Refinanced Secured Notes resulting in $13.0 million of debt issuance costs and fees being expensed to loss on extinguishment of debt.
|
On January 1, 2018, we adopted ASC 606 using the modified retrospective method, which requires us to evaluate whether any cumulative adjustment is required to be recorded to retained earnings (or accumulated deficit) as a result of applying the provisions set forth under ASC 606 for any existing arrangements not yet completed as of the adoption date of January 1, 2018. As a result, we recorded an immaterial cumulative adjustment in the amount of approximately $4.4 million to accumulated deficit as of the adoption date. Revenues and costs related to certain contracts are recognized at a point in time under ASC 606 as the performance obligations related to certain types of sales are satisfied; whereas, previously these revenues and costs were recognized over a period of time under ASC 605.
Further, we previously reported costs and expenses related to our cash access services - which include commission expenses payable to casino operators, interchange fees payable to the network associations, and processing and related costs payable to other third party partners - as a cost of revenues. Under ASC 606, such costs are reflected as reductions to cash access services revenues on a net basis of presentation, since we do not control the cash advance and ATM services provided to a customer and, therefore, are acting as an agent whose performance obligation is to arrange for the provision of these services. In addition, we previously reported certain costs incurred in connection with our WAP platform, consisting primarily of the jackpot expenses, as cost of revenues. Under ASC 606, such costs are reflected as reductions to gaming operations revenues on a net basis of presentation. Our prior period results were not recast to reflect the new revenue recognition standard under the modified retrospective method.
During the fourth quarter of 2017, we recorded a $37.2 million loss on extinguishment of debt consisting of a $26.3 million make-whole premium related to the satisfaction and redemption of the 2014 Unsecured Notes (defined herein) and approximately $10.9 million for the write-off of related unamortized debt issuance costs and fees. An additional $14.6 million loss on extinguishment of debt was incurred in the second quarter of 2017 for the unamortized deferred financing fees and discounts related to the extinguished term loan under the Prior Credit Facility and the redeemed Refinanced Secured Notes (both defined herein). Repricing of the New Term Loan Facility (defined herein) during the second quarter of 2018 did not result in a material loss on extinguishment of debt.
In October of each year, we conduct our annual impairment test for our reporting units. Based on the results of our testing, there was no goodwill impairment for 20172018 and there were2017. We recorded goodwill impairmentsimpairment of approximately $146.3 million and $75.0related to our Games segment in 2016.
The income tax benefit was $9.7 million for 2016 and 2015, respectively.
41
| •
| The income tax benefit was $20.2 million for the year ended December 31, 2017, as compared to an income tax provision of $31.7 million in the prior year period. The income tax benefit for the year ended December 31, 2017 reflected an effective income tax rate of 28.0%, which was less than the statutory federal rate of 35.0% primarily due to a decrease in the carrying value of our deferred tax liabilities as a result of the enactment of the 2017 Tax Act, offset by an increase in the valuation allowance for deferred tax assets. The income tax provision for the year ended December 31, 2016 reflected a negative effective income tax rate of 14.6%, which was less than the statutory federal rate of 35.0%, primarily due to an increase in our valuation allowance for deferred tax assets and the impairment of goodwill for which no tax benefit was provided for book purposes.
|
In January 2015, we entered into a settlement agreement in connection with a lawsuit we participated in as plaintiffs, pursuant to which we received and recorded the settlement proceeds of $14.4 million in the first quarter of 2015. This settlement is included as a reduction of operating expenses in our Statements of Loss for the year ended December 31, 2015. The Company utilized the proceeds along with cash on hand2018, as compared to make a $15.0an income tax benefit of $20.2 million principal reduction payment on the Secured Notes due 2021 in the first quarterprior year period. The income tax benefit for the year ended December 31, 2018 reflected an effective income tax rate of 2015.
negative 367.0%, which was less than the statutory federal rate of 21.0% primarily due to a decrease in the valuation allowance for deferred tax assets and an increase in a federal research credit. The income tax benefit for the year ended December 31, 2017 reflected an effective income tax rate of 28.0%, which was less than the statutory federal rate of 35.0%, primarily due to a decrease in the carrying value of our deferred tax liabilities as a result of the enactment of the 2017 Tax Act, offset by an increase in our valuation allowance for deferred tax assets.As a result of the above transactions and events, the results of operations and earnings per share in the periods covered by our Financial Statements may not be directly comparable.
Trends and Developments Impacting our Business
Our strategic planning and forecasting processes include the consideration of economic and industry wide trends that may impact our Games and PaymentsFinTech businesses. WeBelow we have identified thea number of trends that could have a material positive and negative trends affectingimpact on our business as the following:business:
Casino gaming is dependent upon discretionary consumer spending, which is typically the first type of spending that is restrained by consumers when they are uncertain about their jobs and income. Global economic uncertainty in the marketplace may have an impact on casino gaming and ultimately the demand for new gaming equipment.
The total North American installed slot base was slightly higher in 2018 when compared to 2017 remained relatively flat to 2016 and 2015.2016. We expect flat to moderate growth in the forward replacement cycle for EGMs.
The volume of sales and installations to new casino openings and new market expansions along with replacements to the existing gaming operators in North America is expected to becontinue to trend slightly higherupward in 2018 as compared to the prior year.2019. This could
positively impact the overall demand for slot machines in North America during 2018.
2019, which in turn may contribute to improved operations of our Games segment.We face continued competition from smaller competitors in the gaming cash access market and face additional competition from larger gaming equipment manufacturers and systems providers. This increased competition has resulted in pricing pressure for both our Games and PaymentsFinTech businesses.
Governmental oversight related to the cost of transaction processing and related fees to the consumer has increased in recent years. We expect the financial services and payments industry to respond to these legislative acts by changing other fees and costs, which may negatively impact our PaymentsFinTech business in the future.
Casino operators continue to try to broaden their appeal by focusing on investments in the addition of non-gaming amenities to their facilities, which could impact casino operator’s capital allocation for games and payment solution products.
products and impact both of our operating segments.
Impact of ASC Topic
606842 on the Comparability of Our Results of Operations in Future Periods
As discussed in “Note 2 — Basis of Presentation and Summary of Significant Accounting Policies – Recent Accounting Guidance – Recent Accounting Guidance Not Yet Adopted,” in Item 8: Financial Statements and Supplementary Data, onon January 1, 2018,2019, the Company implemented the new revenue recognitionlease accounting standard promulgated by the FASB. The Company adopted ASC 606842 using the modified retrospective method that requires companies to record a cumulative adjustment to retained earnings (or deficit) presented in the unaudited condensed,42
consolidated balance sheets for interim periods and presented in the audited consolidated balance sheets for annual periods for any contract modifications made to those arrangements not yet completed as of the adoption date of January 1, 2018. The Company determined that there was no such cumulative adjustment required to be made to its interim, condensed, consolidated balance sheets as ofmethod. While we are finalizing the adoption date. In addition, under the modified retrospective method, the Company’s prior period results will not be recast to reflect the new revenue recognition standard.
The Company determinedprocedures, we expect that the adoption of ASC 606standard will have a material impact on our Balance Sheets, however, we do not expect that the presentation of its financial information primarily due to the reporting on a net revenues basis, rather than a gross presentation, of certain costs of revenues (exclusive of depreciation and amortization) related to the cash access activities of the Company’s Payments segment (with additional immaterial changes due to the net reporting of certain of the gaming operations activities of the Company’s Games segment). The net revenues reporting requirement under ASC 606 will have an effect on both the Payments and Games segment revenues and related cost of revenues (exclusive of depreciation and amortization); however, this net presentation will not have an effect on operating income (loss), net loss, cash flows or the timing of revenues recognized and costs incurred.
To provide a greater understanding of the impact of this new revenue recognition standard the Company determined that under the provisions set forth in ASC 606, the effect on certain Payments and Games revenues and costs of revenues would have collectively decreased by approximately $564.2 million, $476.4 million and $438.3 million for the years ended December 31, 2017, 2016 and 2015, respectively.
With respect to its Payments segment, the Company will have a material impact on our Statements of Income (Loss). The most significant impact will be the presentationrecognition of its financial information relatedright-of-use (“ROU”) assets and lease liabilities of operating leases, which are expected to be within a range of approximately 1% to 2% of total assets. We elected the reclassification of certain cost of revenues (exclusive of depreciation and amortization) includedpractical expedients offered in the cash advance, automated teller machine and check services revenue streams to be netted against those related revenue streams. The Company will report these items, which include commission expenses paid to casino operators, interchange costs paid toguidance, including the network associations and processing and related costs paid to other third party partners as amounts that will be reported “net of transaction price” as reductions to its Payments segment revenues, rather than the current gross revenues presentation with these costs and expenses historically reported as Payments segment cost of revenue (exclusive of depreciation and amortization).
With respect to its Games segment, the Company will not have a material impact on the presentation of its financial information related to the reclassification of certain cost of revenues included in the gaming operations revenue stream to be netted against this revenue stream in connection with the Company’s Wide Area Progressive (the “WAP”) offering, which was initiated in 2017. The Company will report these items, which include WAP jackpot expenses as amounts that will be reported “net of the transaction price” as reductions to its Games segment revenues, rather than the current gross revenues presentation with these expenses historically reported as Games segment cost of revenue (exclusive of depreciation and amortization).
Furthermore, for presentation purposes, given the fact that the Company’s total revenues, on a consolidated basis, will be significantly reduced in connection with the adoption of the new revenue recognition standard, the Company’s revenue streams will be evaluated on a recurring basis to ensure compliance with Rule 5-03(b) of Regulation S-X to present those revenues that exceed the quantitative threshold on the Company’s Statements of Loss. For a preview of revenues on a disaggregated basis, we refer to the tabular illustration presented in this section Item 7. Management’s Discussion and Analysis of Financial Condition and Results of Operations under the sub-caption, “Results of Operations.” In addition, the Company determined that there was no cumulative adjustment to be recorded to Stockholders’ Deficit in its Consolidated Balance Sheets.
transition package.
Operating Segments
Operating segments are components of an enterprise about which separate financial information is available that is evaluated regularly by the chief operating decision-making group in deciding how to allocate resources and in assessing performance. Our chief operating decision-making group consists of the Chief Executive Officer and the Chief Financial Officer. This group manages the business, allocates resources and measures profitability based on our operating segments. The operating segments are managed and reviewed separately as each represents products that can be sold separately to our customers.
43
Our chief operating decision-making group has determined the following to be the operating segments for which we conduct business: (a) Games and (b) Payments.
We
have reportedreport our financial performance based on
two operating segments: (a) Games; and (b) FinTech. For additional information on our segments
see “Item 1. Business” and “Note 18 — Segment Information” included elsewhere in
both the current and prior periods. Each of these segments is monitored by our management for performance against its internal forecast and is consistent with our internal management reporting. The Games segment provides a number of products and services for casinos, including (a) gaming machines comprised primarily of Class II and Class III slot machines placed under participation or fixed fee lease arrangements or sold to casino customers, including the award-winning TournEvent®; and (b) system software, licenses, ancillary equipment and maintenance to its casino customers. It also develops and manages the central determinant system for the VLTs installed in the State of New York.
The Payments segment provides its casino customers cash access and related products and services including: (a) access to cash at gaming facilities via ATM cash withdrawals, credit card cash access transactions, POS debit card cash access transactions, and check verification and warranty services; (b) fully integrated gaming industry kiosks that provide cash access and related services; (c) products and services that improve credit decision making, automate cashier operations and enhance patron marketing activities for gaming establishments; (d) compliance, audit and data solutions; and (e) online payment processing solutions for gaming operators in states that offer intrastate, internet-based gaming and lottery activities.
Corporate overhead expenses have been allocated to the segments either through specific identification or based on a reasonable methodology. In addition, we record depreciation and amortization expenses to the appropriate operating segment.
Our business is predominantly domestic, with no specific regional concentrations and no significant assets in foreign locations.
44
Results of Operations
Year ended December 31, 2018 compared to the year ended December 31, 2017 The following table presents our Results of Operations as reported for the year ended December 31, 2018 compared to the year ended December 31, 2017 as reported and as adjusted for the retrospective impact of ASC 606 to reflect the prior period results on a net basis of presentation (amounts in thousands)*:
|
| | | | | | | | | | | | | | | | | | | | | | | | | | | | | | | | |
| | | Year Ended | | 2018 As Reported vs |
| | | December 31, 2018 | | December 31, 2017 | | 2017 As Adjusted |
| | | $ | | % | | $ | | % | | $ | | $ | | % | | $ | | % |
| | | As Reported | | As Reported | Adjustments | As Adjusted | | | | |
| Revenues | | |
| | |
| | |
| | |
| | | | | | | | |
| | |
|
| Games revenues | |
|
| | | | | | | | | | | | | |
|
| |
|
|
| Gaming operations | | $ | 168,146 |
| | 36 | % | | $ | 148,654 |
| | 15 | % | | $ | (565 | ) | | $ | 148,089 |
| | 36 | % | | $ | 20,057 |
| | 14 | % |
| Gaming equipment and systems | | 87,038 |
| | 18 | % | | 70,118 |
| | 7 | % | | — |
| | 70,118 |
| | 17 | % | | 16,920 |
| | 24 | % |
| Gaming other | | 3,794 |
| | 1 | % | | 4,005 |
| | 1 | % | | — |
| | 4,005 |
| | 1 | % | | (211 | ) | | (5 | )% |
| Games total revenues | | 258,978 |
| | 55 | % | | 222,777 |
| | 23 | % | | (565 | ) | | 222,212 |
| | 54 | % | | 36,766 |
| | 17 | % |
| | | | | | | | | | | | | | | | | | | |
| FinTech revenues | | | | | | | | | | | | | | | | | | |
| Cash access services | | 156,806 |
| | 34 | % | | 707,222 |
| | 73 | % | | (563,637 | ) | | 143,585 |
| | 35 | % | | 13,221 |
| | 9 | % |
| Equipment | | 20,977 |
| | 4 | % | | 13,258 |
| | 1 | % | | — |
| | 13,258 |
| | 3 | % | | 7,719 |
| | 58 | % |
| Information services and other | | 32,754 |
| | 7 | % | | 31,691 |
| | 3 | % | | — |
| | 31,691 |
| | 8 | % | | 1,063 |
| | 3 | % |
| FinTech total revenues | | 210,537 |
| | 45 | % | | 752,171 |
| | 77 | % | | (563,637 | ) | | 188,534 |
| | 46 | % | | 22,003 |
| | 12 | % |
| | |
| | | |
| | | | | | | | | | | | |
| Total revenues | | 469,515 |
| | 100 | % | | 974,948 |
| | 100 | % | | (564,202 | ) | | 410,746 |
| | 100 | % | | 58,769 |
| | 14 | % |
| | | |
| | |
| | |
| | |
| | | | | | | | |
| | |
|
| Costs and expenses | |
|
| | | | | | | | | | | | | |
|
| |
|
|
Games cost of revenues(1) | | | | | | | | | | | | | | | | | | |
| Gaming operations | | 17,603 |
| | 4 | % | | 15,741 |
| | 2 | % | | (565 | ) | | 15,176 |
| | 4 | % | | 2,427 |
| | 16 | % |
| Gaming equipment and systems | | 47,121 |
| | 9 | % | | 35,707 |
| | 3 | % | | — |
| | 35,707 |
| | 8 | % | | 11,414 |
| | 32 | % |
| Gaming other | | 3,285 |
| | 1 | % | | 3,247 |
| | 1 | % | | — |
| | 3,247 |
| | 1 | % | | 38 |
| | 1 | % |
| Games total cost of revenues | | 68,009 |
| | 14 | % | | 54,695 |
| | 6 | % | | (565 | ) | | 54,130 |
| | 13 | % | | 13,879 |
| | 26 | % |
| | | | | | | | | | | | | | | | | | | |
FinTech cost of revenues(1) | | | | | | | | | | | | | | | | | | |
| Cash access services | | 9,717 |
| | 2 | % | | 572,880 |
| | 59 | % | | (563,637 | ) | | 9,243 |
| | 2 | % | | 474 |
| | 5 | % |
| Equipment | | 12,601 |
| | 3 | % | | 7,717 |
| | 1 | % | | — |
| | 7,717 |
| | 2 | % | | 4,884 |
| | 63 | % |
| Information services and other | | 4,110 |
| | 1 | % | | 3,253 |
| | — | % | | — |
| | 3,253 |
| | 1 | % | | 857 |
| | 26 | % |
| FinTech total cost of revenues | | 26,428 |
| | 6 | % | | 583,850 |
| | 60 | % | | (563,637 | ) | | 20,213 |
| | 5 | % | | 6,215 |
| | 31 | % |
| | | | | | | | | | | | | | | | | | | |
| Operating expenses | | 142,298 |
| | 30 | % | | 118,935 |
| | 12 | % | | — |
| | 118,935 |
| | 29 | % | | 23,363 |
| | 20 | % |
| Research and development | | 20,497 |
| | 4 | % | | 18,862 |
| | 2 | % | | — |
| | 18,862 |
| | 5 | % | | 1,635 |
| | 9 | % |
| Depreciation | | 61,225 |
| | 14 | % | | 47,282 |
| | 5 | % | | — |
| | 47,282 |
| | 11 | % | | 13,943 |
| | 29 | % |
| Amortization | | 65,245 |
| | 14 | % | | 69,505 |
| | 7 | % | | — |
| | 69,505 |
| | 17 | % | | (4,260 | ) | | (6 | )% |
| Total costs and expenses | | 383,702 |
| | 82 | % | | 893,129 |
| | 92 | % | | (564,202 | ) | | 328,927 |
| | 80 | % | | 54,775 |
| | 17 | % |
| Operating income | | 85,813 |
| | 18 | % | | 81,819 |
| | 8 | % | | — |
| | 81,819 |
| | 20 | % | | 3,994 |
| | 5 | % |
* Rounding may cause variances.
(1) Exclusive of depreciation and amortization.
|
| | | | | | | | | | | | | | | | | | | | | | | | | | | | | | | |
| | | Year Ended | | 2018 As Reported vs |
| | | December 31, 2018 | | December 31, 2017 | | 2017 As Adjusted |
| | | $ | | % | | $ | | % | | $ | | $ | | % | | $ | | % |
| | | As Reported | | As Reported | Adjustments | As Adjusted | | | | |
| Other expenses | | | | | | | | | | | | | | | | | | |
| Interest expense, net of interest income | | 83,001 |
| | 18 | % | | 102,136 |
| | 11 | % | | — |
| | 102,136 |
| | 24 | % | | (19,135 | ) | | (19 | )% |
| Loss on extinguishment of debt | | 166 |
| | — | % | | 51,750 |
| | 5 | % | | — |
| | 51,750 |
| | 13 | % | | (51,584 | ) | | (100 | )% |
| Total other expenses | | 83,167 |
| | 18 | % | | 153,886 |
| | 16 | % | | — |
| | 153,886 |
| | 37 | % | | (70,719 | ) | | (46 | )% |
| | | | | | | | | | | | | | | | | | | |
| Income (loss) before income tax | | 2,646 |
| | 1 | % | | (72,067 | ) | | (7 | )% | | — |
| | (72,067 | ) | | (18 | )% | | 74,713 |
| | (104 | )% |
| | | | | | | | | | | | | | | | | | | |
| Income tax (benefit) provision | | (9,710 | ) | | (2 | )% | | (20,164 | ) | | (2 | )% | | — |
| | (20,164 | ) | | (5 | )% | | 10,454 |
| | (52 | )% |
| Net income (loss) | | $ | 12,356 |
| | 3 | % | | $ | (51,903 | ) | | (5 | )% | | — |
| | $ | (51,903 | ) | | (13 | )% | | $ | 64,259 |
| | 124 | % |
* Rounding may cause variances.
(1) Exclusive of depreciation and amortization.
Total Revenues
Total revenues increased by $58.8 million, or 14%, to $469.5 million for the year ended December 31, 2018, as compared to the prior year period as adjusted for the net versus gross retrospective impact of ASC 606. This was primarily due to higher Games and FinTech revenues.
Games revenues increased by $36.8 million, or 17%, to $259.0 million for the year ended December 31, 2018, as compared to the prior year period as adjusted for the net versus gross retrospective impact of ASC 606. This was primarily due to an increase in both unit sales and average selling prices and an increase in the average daily win per unit on a higher installed base of leased machines.
FinTech revenues increased by $22.0 million, or 12%, to $210.5 million for the year ended December 31, 2018, as compared to the prior year period as adjusted for the net versus gross retrospective impact of ASC 606. This was primarily due to higher transaction volumes from cash access services and increased equipment sales.
Costs and Expenses
Games cost of revenues increased by $13.9 million, or 26%, to $68.0 million for the year ended December 31, 2018, as compared to the prior year period as adjusted for the net versus gross retrospective impact of ASC 606. This was primarily due to the costs associated with the additional unit sales and an increase in costs related to our leased machines as a result of the increase in revenue.
FinTech cost of revenues increased by $6.2 million, or 31%, to $26.4 million for the year ended December 31, 2018, as compared to the prior year period as adjusted for the net versus gross retrospective impact of ASC 606. This was primarily due to the costs associated with the additional equipment sales.
Operating expenses increased by $23.4 million, or 20%, to $142.3 million for the year ended December 31, 2018, as compared to the same period in the prior year. This was primarily due to higher payroll and related expenses, consulting fees, advertising, promotion and trade show costs and software license fees for both our Games and FinTech segments. Our Games segment also incurred an increase in costs related to inventory disposals and leased assets impairment charges.
Research and development increased by $1.6 million, or 9%, to $20.5 million for the year ended December 31, 2018, as compared to the same period in the prior year. This was primarily due to higher payroll and related expenses for our Games segment.
Depreciation increased by $13.9 million, or 29%, to $61.2 million for the year ended December 31, 2018, as compared to the prior year period. This was primarily driven by the increase in the installed base of leased gaming machines and adjustments to the remaining useful lives of certain of the gaming fixed assets related to our Games segment.
Amortization decreased by $4.3 million, or 6%, to $65.2 million for the year ended December 31, 2018, as compared to the prior year period. This was primarily due to assets being fully amortized related to both our Games and FinTech segments.
Primarily as a result of the factors described above, operating income increased by $4.0 million, or 5%, to $85.8 million for the year ended December 31, 2018, as compared to the prior year as adjusted for the net versus gross retrospective impact of ASC 606. The operating income margin decreased from 20% to 18% for the year ended December 31, 2018, as adjusted for the net versus gross retrospective impact of ASC 606.
Interest expense, net of interest income, decreased by $19.1 million, or 19%, to $83.0 million for the year ended December 31, 2018, as compared to the prior year period. This was primarily due to lower interest expense as a result of our debt refinancing transactions in 2017 and an additional repricing of our New Term Loan Facilities in 2018, partially offset by an increase in our cash usage fees in connection with our commercial cash arrangements and the impact of the London Interbank Offered Rate (“LIBOR”) increases during the past year.
Loss on extinguishment of debt was $0.2 million for the year ended December 31, 2018 in connection with the repricing transaction completed in May 2018 as compared to $51.8 million for the year ended December 31, 2017, which consisted of $26.3 million make-whole premium related to the satisfaction and redemption of the 2014 Unsecured Notes, approximately $10.9 million for the write-off of related unamortized debt issuance costs and fees in the fourth quarter of 2017 and approximately $14.6 million for the unamortized deferred financing fees and discounts related to our extinguished term loan under the Prior Credit Facility and the redeemed Refinanced Secured Notes in the second quarter of 2017.
Income tax benefit was $9.7 million for the year ended December 31, 2018, as compared to an income tax benefit of $20.2 million in the prior year period. The income tax benefit for the year ended December 31, 2018 reflected an effective income tax rate of negative 367.0%, which was less than the statutory federal rate of 21.0%, primarily due to a decrease in our valuation allowance for deferred tax assets and a research credit. The decrease in our valuation allowance is primarily due to the net operating loss during the year and the interest deduction limitation (deferred tax assets) which can be offset against our indefinite lived deferred tax liabilities. The tax benefit for the year ended December 31, 2017 reflected an effective income tax rate of 28.0%, which was less than the statutory federal rate of 35.0%, primarily due to a decrease in the carrying value of our deferred tax liabilities as a result of the enactment of the 2017 Tax Act, offset by an increase in the valuation allowance for deferred tax assets.
Primarily as a result of the foregoing, our net loss decreased by $64.3 million, or 124%, to a net income of $12.4 million for the year ended December 31, 2018, as compared to the prior year period.
Year ended December 31, 2017 compared to year ended December 31, 2016:
The following table presents our Results of Operations for the year ended December 31, 2017 compared to the year ended December 31, 2016
The following table presents our Results as reported and as adjusted for the retrospective impact of Operations (inASC 606 to reflect the prior period results on a net basis of presentation (amounts in thousands)*:
| | Year Ended | | | | | | | | | |
| | December 31, 2017 | | | | December 31, 2016 | | | | 2017 vs 2016 | | |
| | $ | | | % | | | | $ | | | % | | | | $ Variance | | | % Variance | | |
Revenues | | | | | | | | | | | | | | | | | | | | | | | | | | | |
Games | | $ | 222,777 | | | | 23 | | % | | $ | 213,253 | | | | 25 | | % | | $ | 9,524 | | | | 4 | | % |
Payments | | | 752,171 | | | | 77 | | % | | | 646,203 | | | | 75 | | % | | | 105,968 | | | | 16 | | % |
Total revenues | | | 974,948 | | | | 100 | | % | | | 859,456 | | | | 100 | | % | | | 115,492 | | | | 13 | | % |
Costs and expenses | | | | | | | | | | | | | | | | | | | | | | | | | | | |
Games cost of revenue (exclusive of depreciation and amortization) | | | 54,695 | | | | 6 | | % | | | 50,308 | | | | 6 | | % | | | 4,387 | | | | 9 | | % |
Payments cost of revenue (exclusive of depreciation and amortization) | | | 583,850 | | | | 60 | | % | | | 498,706 | | | | 58 | | % | | | 85,144 | | | | 17 | | % |
Operating expenses | | | 118,935 | | | | 12 | | % | | | 118,709 | | | | 14 | | % | | | 226 | | | | — | | % |
Research and development | | | 18,862 | | | | 2 | | % | | | 19,356 | | | | 2 | | % | | | (494 | ) | | | (3 | ) | % |
Goodwill impairment | | | — | | | | — | | % | | | 146,299 | | | | 17 | | % | | | (146,299 | ) | | | (100 | ) | % |
Depreciation | | | 47,282 | | | | 5 | | % | | | 49,995 | | | | 6 | | % | | | (2,713 | ) | | | (5 | ) | % |
Amortization | | | 69,505 | | | | 7 | | % | | | 94,638 | | | | 11 | | % | | | (25,133 | ) | | | (27 | ) | % |
Total costs and expenses | | | 893,129 | | | | 92 | | % | | | 978,011 | | | | 114 | | % | | | (84,882 | ) | | | (9 | ) | % |
Operating income (loss) | | | 81,819 | | | | 8 | | % | | | (118,555 | ) | | | (14 | ) | % | | | 200,374 | | | | 169 | | % |
Other expenses | | | | | | | | | | | | | | | | | | | | | | | | | | | |
Interest expense, net of interest income | | | 102,136 | | | | 10 | | % | | | 99,228 | | | | 12 | | % | | | 2,908 | | | | 3 | | % |
Loss on extinguishment of debt | | | 51,750 | | | | 5 | | % | | | — | | | | — | | % | | | 51,750 | | | | — | | % |
Total other expenses | | | 153,886 | | | | 15 | | % | | | 99,228 | | | | 12 | | % | | | 54,658 | | | | 55 | | % |
Loss before income tax | | | (72,067 | ) | | | (7 | ) | % | | | (217,783 | ) | | | (25 | ) | % | | | 145,716 | | | | 67 | | % |
Income tax (benefit) provision | | | (20,164 | ) | | | (2 | ) | % | | | 31,696 | | | | 4 | | % | | | (51,860 | ) | | | (164 | ) | % |
Net loss | | $ | (51,903 | ) | | | (5 | ) | % | | $ | (249,479 | ) | | | (29 | ) | % | | $ | 197,576 | | | | 79 | | % |
*
| Rounding may cause variances.
|
|
| | | | | | | | | | | | | | | | | | | | | | | | | | | | | | | | | | | | | | | | | | |
| | | Year Ended | | 2017 As Adjusted vs |
| | | December 31, 2017 | | December 31, 2016 | | 2016 As Adjusted |
| | | $ | | % | | $ | | $ | | % | | $ | | % | | $ | | $ | | % | | $ | | % |
| | | As Reported | Adjustments | As Adjusted | | As Reported | Adjustments | As Adjusted | | | | |
| Revenues | | | | | | | | | | | | | | | | | | | | | | | | |
| Games revenues | | | | | | | | | | | | | | | | | | | | | | | | |
| Gaming operations | | $ | 148,654 |
| | 15 | % | | $ | (565 | ) | | $ | 148,089 |
| | 36 | % | | $ | 152,514 |
| | 18 | % | | — |
| | $ | 152,514 |
| | 40 | % | | $ | (4,425 | ) | | (3 | )% |
Gaming equipment and
systems | | 70,118 |
| | 7 | % | | — |
| | 70,118 |
| | 17 | % | | 56,277 |
| | 6 | % | | — |
| | 56,277 |
| | 15 | % | | 13,841 |
| | 25 | % |
| Gaming other | | 4,005 |
| | 1 | % | | — |
| | 4,005 |
| | 1 | % | | 4,462 |
| | 1 | % | | — |
| | 4,462 |
| | 1 | % | | (457 | ) | | (10 | )% |
| Games total revenues | | 222,777 |
| | 23 | % | | (565 | ) | | 222,212 |
| | 54 | % | | 213,253 |
| | 25 | % | | — |
| | 213,253 |
| | 56 | % | | 8,959 |
| | 4 | % |
| | | | | | | | | | | | | | | | | | | | | | | | | |
| FinTech revenues | | | | | | | | | | | | | | | | | | | | | | | | |
| Cash access services | | 707,222 |
| | 73 | % | | (563,637 | ) | | 143,585 |
| | 35 | % | | 601,874 |
| | 70 | % | | (476,380 | ) | | 125,494 |
| | 32 | % | | 18,091 |
| | 14 | % |
| Equipment | | 13,258 |
| | 1 | % | | — |
| | 13,258 |
| | 3 | % | | 14,995 |
| | 2 | % | | — |
| | 14,995 |
| | 4 | % | | (1,737 | ) | | (12 | )% |
| Information services and other | | 31,691 |
| | 3 | % | | — |
| | 31,691 |
| | 8 | % | | 29,334 |
| | 3 | % | | — |
| | 29,334 |
| | 8 | % | | 2,357 |
| | 8 | % |
| FinTech total revenues | | 752,171 |
| | 77 | % | | (563,637 | ) | | 188,534 |
| | 46 | % | | 646,203 |
| | 75 | % | | (476,380 | ) | | 169,823 |
| | 44 | % | | 18,711 |
| | 11 | % |
| | |
| | | |
| | | | | | | | | | | | | | | |
| | |
| Total revenues | | 974,948 |
| | 100 | % | | (564,202 | ) | | 410,746 |
| | 100 | % | | 859,456 |
| | 100 | % | | (476,380 | ) | | 383,076 |
| | 100 | % | | 27,670 |
| | 7 | % |
| | | | | | | | | | | | | | | | | | | | | | | | | |
| Costs and expenses | | | | | | | | | | | | | | | | | | | | | | | | |
Games cost of revenues(1) | | | | | | | | | | | | | | | | | | | | | | | | |
| Gaming operations | | 15,741 |
| | 2 | % | | (565 | ) | | 15,176 |
| | 4 | % | | 15,265 |
| | 2 | % | | — |
| | 15,265 |
| | 4 | % | | (89 | ) | | (1 | )% |
| Gaming equipment and systems | | 35,707 |
| | 4 | % | | — |
| | 35,707 |
| | 8 | % | | 31,602 |
| | 4 | % | | — |
| | 31,602 |
| | 8 | % | | 4,105 |
| | 13 | % |
| Gaming other | | 3,247 |
| | — | % | | — |
| | 3,247 |
| | 1 | % | | 3,441 |
| | — | % | | — |
| | 3,441 |
| | 1 | % | | (194 | ) | | (6 | )% |
| Games total cost of revenues | | 54,695 |
| | 6 | % | | (565 | ) | | 54,130 |
| | 13 | % | | 50,308 |
| | 6 | % | | — |
| | 50,308 |
| | 13 | % | | 3,822 |
| | 8 | % |
| | | | | | | | | | | | | | | | | | | | | | | | | |
FinTech cost of revenues(1) | | | | | | | | | | | | | | | | | | | | | | | | |
| Cash access services | | 572,880 |
| | 59 | % | | (563,637 | ) | | 9,243 |
| | 2 | % | | 485,061 |
| | 57 | % | | (476,380 | ) | | 8,681 |
| | 2 | % | | 562 |
| | 6 | % |
| Equipment | | 7,717 |
| | 1 | % | | — |
| | 7,717 |
| | 2 | % | | 9,889 |
| | 1 | % | | — |
| | 9,889 |
| | 3 | % | | (2,172 | ) | | (22 | )% |
| Information services and other | | 3,253 |
| | — | % | | — |
| | 3,253 |
| | 1 | % | | 3,756 |
| | — | % | | — |
| | 3,756 |
| | 1 | % | | (503 | ) | | (13 | )% |
| FinTech total cost of revenues | | 583,850 |
| | 60 | % | | (563,637 | ) | | 20,213 |
| | 5 | % | | 498,706 |
| | 58 | % | | (476,380 | ) | | 22,326 |
| | 6 | % | | (2,113 | ) | | (9 | )% |
| | | | | | | | | | | | | | | | | | | | | | | | | |
| Operating expenses | | 118,935 |
| | 12 | % | | — |
| | 118,935 |
| | 28 | % | | 118,709 |
| | 14 | % | | — |
| | 118,709 |
| | 31 | % | | 226 |
| | — | % |
| Research and development | | 18,862 |
| | 2 | % | | — |
| | 18,862 |
| | 5 | % | | 19,356 |
| | 2 | % | | — |
| | 19,356 |
| | 5 | % | | (494 | ) | | (3 | )% |
| Goodwill impairment | | — |
| | — | % | | — |
| | — |
| | — | % | | 146,299 |
| | 17 | % | | — |
| | 146,299 |
| | 38 | % | | (146,299 | ) | | (100 | )% |
| Depreciation | | 47,282 |
| | 5 | % | | — |
| | 47,282 |
| | 12 | % | | 49,995 |
| | 6 | % | | — |
| | 49,995 |
| | 13 | % | | (2,713 | ) | | (5 | )% |
| Amortization | | 69,505 |
| | 7 | % | | — |
| | 69,505 |
| | 17 | % | | 94,638 |
| | 11 | % | | — |
| | 94,638 |
| | 25 | % | | (25,133 | ) | | (27 | )% |
| Total costs and expenses | | 893,129 |
| | 92 | % | | (564,202 | ) | | 328,927 |
| | 80 | % | | 978,011 |
| | 114 | % | | (476,380 | ) | | 501,631 |
| | 131 | % | | (172,704 | ) | | (34 | )% |
| Operating income | | 81,819 |
| | 8 | % | | — |
| | 81,819 |
| | 20 | % | | (118,555 | ) | | (14 | )% | | — |
| | (118,555 | ) | | (31 | )% | | 200,374 |
| | (169 | )% |
* Rounding may cause variances.
(1) Exclusive of depreciation and amortization.
|
| | | | | | | | | | | | | | | | | | | | | | | | | | | | | | | | | | | | | | | | | |
| | | Year Ended | | 2017 As Adjusted vs |
| | | December 31, 2017 | | December 31, 2016 | | 2016 As Adjusted |
| | | $ | | % | | $ | | $ | | % | | $ | | % | | $ | | $ | | % | | $ | | % |
| | | As Reported | Adjustments | As Adjusted | | As Reported | Adjustments | As Adjusted | | | | |
| Other expenses | | | | | | | | | | | | | | | | | | | | | | | | |
| Interest expense, net of interest income | | 102,136 |
| | 10 | % | | — |
| | 102,136 |
| | 25 | % | | 99,228 |
| | 12 | % | | — |
| | 99,228 |
| | 26 | % | | 2,908 |
| | 3 | % |
| Loss on extinguishment of debt | | 51,750 |
| | 6 | % | | — |
| | 51,750 |
| | 12 | % | | — |
| | — | % | | — |
| | — |
| | — | % | | 51,750 |
| | — | % |
| Total other expenses | | 153,886 |
| | 16 | % | | — |
| | 153,886 |
| | 37 | % | | 99,228 |
| | 12 | % | | — |
| | 99,228 |
| | 26 | % | | 54,658 |
| | 55 | % |
| | | | | | | | | | | | | | | | | | | | | | | | | |
| Income (loss) before income tax | | (72,067 | ) | | (7 | )% | | — |
| | (72,067 | ) | | (18 | )% | | (217,783 | ) | | (25 | )% | | — |
| | (217,783 | ) | | (57 | )% | | 145,716 |
| | (67 | )% |
| | | | | | | | | | | | | | | | | | | | | | | | | |
| Income tax (benefit) provision | | (20,164 | ) | | (2 | )% | | — |
| | (20,164 | ) | | (5 | )% | | 31,696 |
| | 4 | % | | — |
| | 31,696 |
| | 8 | % | | (51,860 | ) | | (164 | )% |
| Net income (loss) | | $ | (51,903 | ) | | (5 | )% | | — |
| | $ | (51,903 | ) | | (13 | )% | | $ | (249,479 | ) | | (29 | )% | | — |
| | $ | (249,479 | ) | | (65 | )% | | $ | 197,576 |
| | (79 | )% |
* Rounding may cause variances.
(1) Exclusive of depreciation and amortization.
Total revenues increased by
$115.5$27.7 million, or
13%7%, to
$974.9$410.7 million for the year ended December 31, 2017, as compared to the prior year
period.period as adjusted for the net versus gross retrospective impact of ASC 606. This was due to increased
PaymentsFinTech and Games revenues.
Games revenues increased by
$9.5$9.0 million, or 4%, to
$222.8$222.2 million for the year ended December 31, 2017, as compared to the prior year
period.period as adjusted for the net versus gross retrospective impact of ASC 606. This was primarily due to an increase in units sold, partially offset by lower daily win per unit on leased games.
Payments
FinTech revenues increased by
$106.0$18.7 million, or
16%11%, to
$752.2$188.5 million for the year ended December 31, 2017, as compared to the prior year
period.period as adjusted for the net versus gross retrospective impact of ASC 606. This was primarily due to higher dollar and transaction volume and fees earned from cash access services, new customer openings, the expansion of our ATM services in Canada, as well as overall growth in the segment.
Games cost of revenues
(exclusive of depreciation and amortization) increased by
$4.4$3.8 million, or
9%8%, to
$54.7$54.1 million for the year ended December 31, 2017, as compared to the prior year
period.period as adjusted for the net versus gross retrospective impact of ASC 606. This was primarily due to higher variable costs associated with increased unit sales.
45
Payments
FinTech cost of revenues
(exclusive of depreciation and amortization) increaseddecreased by
$85.1$2.1 million, or
17%9%, to
$583.9$20.2 million for the year ended December 31, 2017, as compared to the prior year
period.period as adjusted for the net versus gross retrospective impact of ASC 606. This was primarily due to higher costs associated with
the increasehigher equipment sales in
cash access services.2016 as compared to 2017.
Operating expenses remained relatively consistent to the prior year. This was primarily due to an increase in payroll and benefit-related expenses offset by the decrease in expenses related to the 2016 Bee Cave
Games, Inc. (“Bee Cave”) loan impairment
of approximately $4.3 million that did not impact our 2017 results for our Games segment; and an increase in payroll and benefits-related expenses and professional services expenses offset by the decrease in expenses related to the 2016 separation costs for our former CEO that did not impact our 2017 results for our
PaymentsFinTech segment.
There was no goodwill impairment for the year ended December 31, 2017, as compared to $146.3 million in the prior year period as a result of our October 1, 2016 annual goodwill assessment attributable to our Games reporting unit.
Research and development costs remained relatively consistent with prior year.
Depreciation decreased by $2.7 million, or 5%, to $47.3 million for the year ended December 31, 2017, as compared to the prior year period. This was primarily due to a decrease in depreciation from certain assets being fully depreciated in both our Games and
PaymentsFinTech segments.
Amortization decreased by $25.1 million, or 27%, to $69.5 million for the year ended December 31, 2017, as compared to the prior year period. This was primarily due to certain acquired intangible assets being fully amortized in the fourth quarter of 2016 for both our Games and
PaymentsFinTech segments.
Primarily as a result of the factors described above, operating income increased by $200.4 million, or 169%, to
an operating income of $81.8 million for the year ended December 31, 2017, as compared to the prior year
period.as adjusted for the net versus gross retrospective impact of ASC 606. The operating income margin
as adjusted for the net versus gross retrospective impact of ASC 606 increased from negative
14%31% to a positive
8%20% for the year ended December 31, 2017.
Interest expense, net of interest income, increased by $2.9 million, or 3%, to $102.1 million for the year ended December 31, 2017, as compared to the prior year period. This was primarily attributable to higher interest recognized as a result of our debt restructuring activities in the fourth quarter of 2017 as well as higher cash usage fees, partially offset by lower interest expense as a result of our debt refinancing in May 2017.
Loss on extinguishment of debt for the year ended December 31, 2017 was $51.8 million, which consisted of
a $26.3 million make-whole premium related to the satisfaction and redemption of the 2014 Unsecured Notes, (defined herein), approximately $10.9 million for the write-off of related unamortized debt issuance costs and fees in the fourth quarter of 2017 and approximately $14.6 million for the unamortized deferred financing fees and discounts related to our extinguished term loan under the Prior Credit Facility and the redeemed Refinanced Secured Notes
(both defined herein) in the second quarter of 2017. There was no loss on extinguishment of debt in the prior year period.
Income tax benefit was $20.2 million for the year ended December 31, 2017, as compared to an income tax provision of $31.7 million in the prior year period. The income tax benefit for the year ended December 31, 2017 reflected an effective income tax rate of 28.0%, which was less than the statutory federal rate of 35.0% primarily due to a decrease in the carrying value of our deferred tax liabilities as a result of the enactment of the 2017 Tax Act, offset by an increase in the valuation allowance for deferred tax assets. The income tax provision for the year ended December 31, 2016 reflected a negative effective income tax rate of 14.6%, which was less than the statutory federal rate of 35.0%, primarily due to an increase in our valuation allowance for deferred tax assets and the impairment of goodwill for which no tax benefit was provided for book purposes.
Primarily as a result of the foregoing,
our net loss decreased by $197.6 million, or 79%, to $51.9 million for the year ended December 31, 2017, as compared to the prior year period.
46
Year ended December 31, 2016 compared to year ended December 31, 2015:The following table presents our Results of Operations (in thousands)*:
| | Year Ended | | | | | | | | | | |
| | December 31, 2016 | | | December 31, 2015 | | | December 31, 2016 vs 2015 | | |
| | $ | | | % | | | $ | | | % | | | $ Variance | | | % Variance | | |
Revenues | | | | | | | | | | | | | | | | | | | | | | | | | |
Games | | $ | 213,253 | | | | 25 | | % | $ | 214,424 | | | | 26 | | % | $ | (1,171 | ) | | | (1 | ) | % |
Payments | | | 646,203 | | | | 75 | | % | | 612,575 | | | | 74 | | % | | 33,628 | | | | 5 | | % |
Total revenues | | | 859,456 | | | | 100 | | % | | 826,999 | | | | 100 | | % | | 32,457 | | | | 4 | | % |
Costs and expenses | | | | | | | | | | | | | | | | | | | | | | | | | |
Games cost of revenue (exclusive of depreciation and amortization) | | | 50,308 | | | | 6 | | % | | 47,017 | | | | 6 | | % | | 3,291 | | | | 7 | | % |
Payments cost of revenue (exclusive of depreciation and amortization) | | | 498,706 | | | | 58 | | % | | 463,380 | | | | 56 | | % | | 35,326 | | | | 8 | | % |
Operating expenses | | | 118,709 | | | | 14 | | % | | 101,202 | | | | 12 | | % | | 17,507 | | | | 17 | | % |
Research and development | | | 19,356 | | | | 2 | | % | | 19,098 | | | | 2 | | % | | 258 | | | | 1 | | % |
Goodwill impairment | | | 146,299 | | | | 17 | | % | | 75,008 | | | | 9 | | % | | 71,291 | | | | 95 | | % |
Depreciation | | | 49,995 | | | | 6 | | % | | 45,551 | | | | 6 | | % | | 4,444 | | | | 10 | | % |
Amortization | | | 94,638 | | | | 11 | | % | | 85,473 | | | | 10 | | % | | 9,165 | | | | 11 | | % |
Total costs and expenses | | | 978,011 | | | | 114 | | % | | 836,729 | | | | 101 | | % | | 141,282 | | | | 17 | | % |
Operating loss | | | (118,555 | ) | | | (14 | ) | % | | (9,730 | ) | | | (1 | ) | % | | (108,825 | ) | | | 1,118 | | % |
Other expenses | | | | | | | | | | | | | | | | | | | | | | | | | |
Interest expense, net of interest income | | | 99,228 | | | | 12 | | % | | 100,290 | | | | 12 | | % | | (1,062 | ) | | | (1 | ) | % |
Loss on extinguishment of debt | | | — | | | | — | | % | | 13,063 | | | | 2 | | % | | (13,063 | ) | | | (100 | ) | % |
Total other expenses | | | 99,228 | | | | 12 | | % | | 113,353 | | | | 14 | | % | | (14,125 | ) | | | (12 | ) | % |
Loss before income tax | | | (217,783 | ) | | | (25 | ) | % | | (123,083 | ) | | | (15 | ) | % | | (94,700 | ) | | | 77 | | % |
Income tax provision (benefit) | | | 31,696 | | | | 4 | | % | | (18,111 | ) | | | (2 | ) | % | | 49,807 | | | | (275 | ) | % |
Net loss | | $ | (249,479 | ) | | | (29 | ) | % | $ | (104,972 | ) | | | (13 | ) | % | $ | (144,507 | ) | | | 138 | | % |
*
| Rounding may cause variances.
|
Total Revenues
Total revenues increased by $32.5 million, or 4%, to $859.5 million for the year ended December 31, 2016, as compared to the prior year period. This was due to increased Payments revenues, slightly offset by lower Games revenues.
Games revenues decreased by $1.2 million, or 1%, to $213.3 million for the year ended December 31, 2016, as compared to the prior year period. This was primarily due to a lower daily win per unit on leased games, partially offset by an increase in unit sales and average sales price per unit.
Payments revenues increased by $33.6 million, or 5%, to $646.2 million for the year ended December 31, 2016, as compared to the prior year period. This was primarily due to higher ATM transaction volume and fees, including an increase in transaction volume from ATM portfolios acquired in late 2015.
Costs and Expenses
Games cost of revenues (exclusive of depreciation and amortization) increased by $3.3 million, or 7%, to $50.3 million for the year ended December 31, 2016, as compared to the prior year period. This was primarily due to higher costs associated with the increased unit sales volume.
47
Payments cost of revenues (exclusive of depreciation and amortization) increased by $35.3 million, or 8%, to $498.7 million for the year ended December 31, 2016, as compared to the prior year period. This was primarily due to the ATM portfolio acquisitions and higher commission expense on ATM revenues.
Operating expenses increased by $17.5 million, or 17%, to $118.7 million for the year ended December 31, 2016, as compared to the prior year period. This was primarily due to the impact of a $14.4 million gain contingency settlement during the prior year and a $4.3 million write-down of a note receivable and warrant associated with Bee Cave Games, Inc.
Goodwill impairment increased by $71.3 million, or 95%, to $146.3 million for the year ended December 31, 2016, as compared to the prior year period. This non-cash charge was a result of our October 1, 2016 annual goodwill assessment and attributable to our Games reporting unit.
Depreciation increased by $4.4 million, or 10%, to $50.0 million for the year ended December 31, 2016, as compared to the prior year period. This was primarily related to increased fixed assets being placed in service.
Amortization increased by $9.2 million, or 11%, to $94.6 million for the year ended December 31, 2016, as compared to the prior year period. This was primarily related to an increase in intangible assets being placed in service related to developed technology and software.
Primarily, as a result of the factors described above, operating loss increased by $108.8 million, or 1,118%, to an operating loss of $118.6 million for the year ended December 31, 2016, as compared to the prior year period. The operating loss margin increased to 14% for the year ended December 31, 2016, as compared to 1% for the prior year period. Excluding the goodwill impairment charge in 2016 and 2015, the operating margin would have been approximately 3% and 8%, respectively.
Interest expense, net of interest income, decreased by $1.1 million, or 1%, to $99.2 million for the year ended December 31, 2016, as compared to the prior year period. This was primarily related to lower outstanding debt balances, the write-off of debt issuance costs related to our Refinanced Secured Notes, partially offset by a higher interest rate under the Contract Cash Solutions Agreement with Wells Fargo.
There was no loss on extinguishment of debt for the year ended December 31, 2016, as compared to a loss on extinguishment of debt of $13.1 million in the prior year period.
Income tax provision was $31.7 million for the year ended December 31, 2016, as compared to an income tax benefit in the prior year period. This was primarily due to an increase in our valuation allowance for deferred tax assets. The income tax provision reflected a negative effective income tax rate of 14.6% for the year ended December 31, 2016, which was less than the statutory federal rate of 35.0% primarily due to an increase in our valuation allowance for deferred tax assets and the impairment of goodwill, for which no tax benefit is provided for book purposes. The income tax benefit reflected an effective income tax rate of 14.7% for the prior year, which was greater than the statutory federal rate of 35.0%, primarily due to the impairment of goodwill for which no tax benefit was provided for book purposes.
Primarily, as a result of the foregoing, net loss increased by $144.5 million, or 138%, to $249.5 million for the year ended December 31, 2016, as compared to the prior year period.
48
Games Revenues
The following table includes the revenues from our Games segment (amounts in thousands):
| | Year Ended |
| | December 31, 2017 | | December 31, 2016 |
| | | | | | % of Games | | | | | | % of Games |
| | Revenues | | | Revenues | | Revenues | | | Revenues |
Games revenues | | | | | | | | | | | | | | | | | | |
Gaming operations | | $ | 148,636 | | | | 67 | | % | | $ | 152,455 | | | | 71 | | % |
Gaming sales | | | 70,117 | | | | 31 | | % | | | 56,277 | | | | 26 | | % |
Other | | | 4,024 | | | | 2 | | % | | | 4,521 | | | | 3 | | % |
Total | | $ | 222,777 | | | | 100 | | % | | $ | 213,253 | | | | 100 | | % |
Payments Revenues
The following table includes the revenues from our Payments segment (amounts in thousands):
| | Year Ended |
| | December 31, 2017 | | December 31, 2016 |
| | | | | | % of Payments | | | | | | % of Payments |
| | Revenues | | | Revenues | | Revenues | | | Revenues |
Payments revenues | | | | | | | | | | | | | | | | | | |
Cash access services | | $ | 707,222 | | | | 94 | | % | | $ | 601,873 | | | | 93 | | % |
Kiosk sales and services | | | 25,000 | | | | 3 | | % | | | 25,330 | | | | 4 | | % |
Compliance and other | | | 19,949 | | | | 3 | | % | | | 19,000 | | | | 3 | | % |
Total | | $ | 752,171 | | | | 100 | | % | | $ | 646,203 | | | | 100 | | % |
Critical Accounting Policies
The preparation of our financial statements in conformity with U.S. generally accepted accounting principles (“GAAP”) requires us to make estimates and assumptions that affect our reported amounts of assets and liabilities, revenues and expenses, and related disclosures of contingent assets and liabilities in our Financial Statements. The SEC has defined critical accounting policies as the ones that are most important to the portrayal of the financial condition and results of operations, and which require management to make its most difficult and subjective judgments, often as a result of the need to make estimates about matters that are inherently uncertain. Based on this definition, we have identified our critical accounting policies as those addressed below. We also have other key accounting policies that involve the use of estimates, judgments, and assumptions.
You should reviewRefer to “Note
2.2 — Basis of Presentation and Summary of Significant Accounting Policies” within our Financial Statements included elsewhere in this Annual Report on Form 10-K for a summary of these policies. We believe that our estimates and assumptions are reasonable, based upon information presently available; however, actual results may differ from these estimates under different assumptions or conditions.
Segment Reporting.
We apply the provisions of the Financial Accounting Standards Board (the “FASB”) Accounting Standards Codification (“ASC”) 280, “Segment Reporting”, in accounting for our business segments. This defines operating segments as components of an enterprise for which separate financial information is available that is evaluated regularly by the chief operating decision maker in deciding how to allocate resources and in assessing performance. In addition, ASC 280-10-50-34, as well as Rule 3-03(e) of Regulation S-X, requires us to recast financial information from prior years for segments if we change our internal organization in a way that effects the compositions of our reportable segments. Our operating segments were previously organized and managed under five business segments: (a) Cash Advance, (b) ATM, (c) Check Services, (d) Games, and (e) Other. During the first quarter of 2015, we changed our organizational structure as part of our transformation to a Games and Payments company providing solutions to the gaming industry. Accordingly, since the first quarter of 2015, we have reported our financial performance, and organized and managed our operations, across the following two business segments: (a) Games, and (b) Payments. Each of these segments is monitored by our management for performance against its internal forecast and is consistent with our internal management reporting.49
Business Combinations.Goodwill. We apply the provisions of the FASB ASC 805, “Business Combinations”, in the accounting for acquisitions. It requires us to recognize separately from goodwill the assets acquired and the liabilities assumed, at their acquisition date fair values. Goodwill as of the acquisition date is measured as the excess of consideration transferred over the net of the acquisition date fair values of the assets acquired and the liabilities assumed. Significant estimates and assumptions are required to value assets acquired and liabilities assumed at the acquisition date as well as contingent consideration, where applicable. These estimates are preliminary and typically include the calculation of an appropriate discount rate and projection of the cash flows associated with each acquired asset over its estimated useful life. As a result, during the measurement period, which may be up to one year from the acquisition date, the Company may record adjustments to the assets acquired and liabilities assumed with the corresponding offset to goodwill. In addition, deferred tax assets, deferred tax liabilities, uncertain tax positions and tax related valuation allowances assumed in connection with a business combination are initially estimated as of the acquisition date. We reevaluate these items quarterly based upon facts and circumstances that existed as of the acquisition date and any adjustments to its preliminary estimates are recorded to goodwill, in the period of identification, if identified within the measurement period. Upon the conclusion of the measurement period or final determination of the values of assets acquired or liabilities assumed, whichever comes first, any subsequent adjustments are recorded to the Statements of Loss.
Acquisition‑related Costs. We recognize a liability for acquisition‑related costs when the expense is incurred. Acquisition‑related costs include, but are not limited to: financial advisory, legal and debt fees; accounting, consulting, and professional fees associated with due diligence, valuation and integration; severance; and other related costs and adjustments.
Property, Equipment and Leased Assets. We have approximately $113.5 million in net property, equipment and leased assets on our Balance Sheets at December 31, 2017. Property, equipment and leased assets are stated at cost, less accumulated depreciation, computed using the straight-line method over the lesser of the estimated life of the related assets, generally two to five years, or the related lease term. Player terminals and related components and equipment are included in our rental pool. The rental pool can be further delineated as “rental pool – deployed,” which consists of assets deployed at customer sites under participation arrangements, and “rental pool – undeployed,” which consists of assets held by us that are available for customer use. Rental pool – undeployed consists of both new units awaiting deployment to a customer site and previously deployed units currently back with us to be refurbished awaiting re-deployment. Routine maintenance of property, equipment and leased gaming equipment is expensed in the period incurred, while major component upgrades are capitalized and depreciated over the estimated remaining useful life of the component. Sales and retirements of depreciable property are recorded by removing the related cost and accumulated depreciation from the accounts. Gains or losses on sales and retirements of property are reflected in our Statements of Loss. Property, equipment and leased assets are reviewed for impairment whenever events or circumstances indicate that their carrying amounts may not be recoverable. Impairment is indicated when undiscounted future cash flows do not exceed the asset’s carrying value.
Goodwill.We had approximately $640.6$640.5 million of goodwill on our Balance Sheets at December 31, 20172018 resulting from acquisitions of other businesses. All of our goodwill was subject to our annual goodwill impairment testing. We test for impairment annually on a reporting unit basis, at the beginning of our fourth fiscal quarter, or more often under certain circumstances. Our reporting units are identified as operating segments or one level below and we evaluate our reporting units at least annually.
The annual
evaluation of goodwill requires the use of different assumptions, estimates, or judgments in the goodwill impairment
test is completed using either: a qualitative “Step 0” assessment based on reviewing relevant events and circumstances; or a quantitative “Step 1” assessment, which determinestesting process, such as: the
fair value ofmethodology, the
reporting unit, using an income approach that discountsestimated future cash flows
based on the estimated future results of our reporting units,
the discount rate used to discount such cash flows, and
a market approach that comparesthe market multiples of comparable
companies to determine whether or not any impairment exists. If the fair value of a reporting unit is less than its carrying amount, an impairment charge equal to the amount by which the carrying amount of goodwill for the reporting unit exceeds the implied fair value of that goodwill is recorded. In connection with our annual goodwill impairment testing process for 2017, we determined that no impairment adjustment was necessary as the fair value exceeded the carrying amount for each of the Games (limited excess fair value), Cash Access Services, Kiosk Sales and Services, Central Credit Services and Compliance Sales and Services reporting units.companies. Management performs its annual forecasting process, which, among other factors, includes reviewing recent historical results, company-specific variables, and industry trends. This process is generally completed in the fourth quarter and considered in conjunction with the annual goodwill impairment evaluation.
50
The annual evaluation of goodwill and other non‑amortizing intangible assets requires the use of estimates about future operating results of each reporting unit to determine its estimated fair value. ChangesChanges in forecasted operations can materially affect these estimates, which could materially affect our results of operations. The estimateOur estimates of fair value requiresrequire significant judgment and we base our fair value estimatesare based on assumptions that we believedetermined to be reasonable; but thathowever, they are unpredictable and inherently uncertain, including: estimates of future growth rates, operating margins, and assumptions about the overall economic climate as well as the competitive environment for our reporting units.
There can be no assurance that our estimates and assumptions made for purposes of our goodwill testing as of the time of testing will prove to be accurate predictions of the future. If our assumptions regarding business plans, competitive environments, or anticipated growth rates are not correct, we may be required to record goodwill impairment charges in future periods, whether in connection with our next annual impairment testing, or earlier, if an indicator of an impairment is present prior to our next annual evaluation.
Our reporting units are identified as operating segments or one level below. Reporting units must: (a) engage in business activities from which they earn revenues
Property, Equipment, Leased Assets, and incur expenses; (b) have operating results that are regularly reviewed by our segment management to ascertain the resources to be allocated to the segment and assess its performance; and (c) have discrete financial information available. As of December 31, 2017, our reporting units included: Games, Cash Access Services, Kiosk Sales and Services, Central Credit Services, and Compliance Sales and Services. During the year ended December 31, 2016, the Company combined its Cash Advance, ATM and Check Services reporting units into a single Cash Access reporting unit to be consistent with the current corporate structure and segment management. The use of different assumptions, estimates or judgments in the goodwill impairment testing process, such as the estimated future cash flows of our reporting units, the discount rate used to discount such cash flows, or the estimated fair value of the reporting units’ tangible and intangible assets and liabilities, could significantly increase or decrease the estimated fair value of a reporting unit or its net assets, and therefore, impact the related impairment charge, if any.Other Intangible Assets.Assets
. We have approximately $324.3$116.3 million in net property, equipment, and leased assets and approximately $287.4 million in net unamortized other intangible assets on our Balance Sheets at December 31, 2017. Other intangible2018. Such assets are stated at cost, less accumulated depreciation or amortization, and computed primarily using the straight-line method. Other intangible assets consist primarily of: (i) customer contracts (rights to provide Games and Payments services to gaming establishment customers), developed technology, trade names and trademarks and contract rights acquired through business combinations; (ii) capitalized software development costs; and (iii) the acquisition cost of our patent related to the 3-in-1 rollover technology acquired in 2005. Customer contracts require us to make renewal assumptions, which impactmethod over the estimated useful lives of such assets. Capitalized software development costs require us to make certain judgments as toWe apply judgment in the stagesdetermination of development and costs eligible for capitalization. Capitalized software costs placed in service are amortized over theirthe useful lives, which are generally not to exceed five years. The acquisition costbased on the nature of the 3-in-1 Rollover patent is being amortized overassets and the term of the patent, which expired in January 2018. We reviewunderlying contractual obligations for certain assets. Property, equipment, leased assets, and other intangible assets
are reviewed for impairment whenever events or
changes in circumstances indicate that the carrying amount of an asset may not be recoverable. Such events or circumstances include, but are not limited to, a significant decrease in the fair value of the underlying business or market price of the asset, a significant adverse change in legal factors or business climate that could affect the value of an asset, or a current period operating or cash flow loss combined with a history of operating or cash flow losses.
We group intangible assets for impairment analysis at the lowest level for which identifiableImpairment is indicated when undiscounted future cash flows
are largely independentdo not exceed the carrying value of the
cash flows of other assets and liabilities. Recoverability of intangible assets is measured by a comparison of the carrying amount of the asset to future, net cash flows expected to be generated by the asset, undiscounted and without interest or taxes.asset. Any impairment to be recognized is measured by the amount by which the carrying amount of the assets exceeds the fair value of the assets.
Determination of the amount and timing of future cash flows requires significant estimates and assumptions. If actual results differ from such estimates and assumptions, this may have a material impact on our conclusions.
Income Taxes.We are subject to income taxes in the United States as well as various states and foreign jurisdictions in which we operate. In accordance with accounting guidance,Due to the 2017 Tax Act, there is no U.S. federal tax on cash repatriation from foreign subsidiaries; however, we could be subject to foreign withholding tax and U.S. state income taxes. The 2017 Tax Act also subjects our income taxes include amounts from domestic and international jurisdictions, plusforeign subsidiary earnings to the provision for U.S. taxes on undistributed earnings of international subsidiaries as of December 31, 2017. With respect to newGILTI tax reform, we account for such provisions in the year of enactment in accordance with GAAP.provisions. Some items of income and expense are not reported in tax returns and our Financial Statements in the same year. The tax effect of such temporary differences is reported as deferred income taxes.
Our
deferredincome tax
assetsreturns are subject to examination by various tax authorities and
liabilitieswhile we believe that the positions taken in our tax returns are
recognized forin accordance with the
expected futureapplicable laws, they may be challenged by the tax
consequences of events thatauthorities, which may occur several years after such tax returns have been
includedfiled. We account for uncertainty in income tax positions by evaluating whether it is more likely than not that the position will be sustained upon examination by taxing authorities based on the technical merits of the issue. The amount recognized in our Financial Statements
oris the largest benefit that we believe has greater than a 50% likelihood of being realized upon settlement. Actual income taxes paid may vary from estimates depending upon changes in income tax
returns. Deferredlaws, actual results of operations, and the final audit of tax
assets and liabilities are determined based upon differences between financial statement carrying amounts of existing assets and their respective tax bases using enacted tax rates expected to apply to taxable income in years in which those temporary differences are51
expected to be recovered or settled. The effect on the income tax provision or benefit andreturns by taxing authorities.
We recognize deferred tax assets,
which generally represent tax benefits related to tax deductions or credits available in future tax returns, and
liabilities forapply a
change in rates is recognized in the Statements of Loss in the period that includes the enactment date.When measuringvaluation allowance to reduce our deferred tax assets certain estimates and assumptionsto the amounts that are requiredmore likely than not to assess whether a valuation allowance should be established by evaluating both positive and negative factors in accordance with accounting guidance. This evaluation requires that we exercise judgment in determining the relative significance of each factor.realized. The assessment of the valuation allowance involves significant estimates regarding future taxable income and when it is recognized, the amount and timing of taxable differences, the reversal of temporary differences and the implementation of tax-planning strategies. A valuation allowance is established based on the weight of available evidence, including both positive and negative indicators, if it is more likely than not that a portion, or all, of the deferred tax assets will not be realized. Greater weight is given to evidence that is objectively verifiable, most notably historical results. If we report a cumulative loss from continuing operations before income taxes for a reasonable period of time, this form of negative evidence is difficult to overcome. Therefore, we include certain aspects of our historical results in our forecasts of future taxable income, as we do not have the ability to solely rely on forecasted improvements in earnings to recover deferred tax assets. If we no longer report a cumulative loss position, to the extent our results of operations improve, such that we have the ability to overcome the more likely than not accounting standard, we expect to be able to reverse the valuation allowance in the applicable period of determination. In addition, we rely on deferred tax liabilities in our assessment of the realizability of deferred tax assets if the temporary timing difference isdifferences are anticipated to reverse in the same period and jurisdiction and the deferred tax liabilities are of the same character as the temporary differences giving rise to the deferred tax assets.
Revenue Recognition. We also accountrecognize revenue upon transferring control of goods or services to our customers in an amount that reflects the consideration we expect to receive in exchange for uncertainty in income taxes as recognized in our Financial Statements. The accounting standard creates a single model to address uncertainty in income tax positionsthose goods or services. We enter into contracts with customers that include various performance obligations consisting of goods, services, or combinations of goods and prescribesservices. Timing of the minimum recognition threshold a tax position is required to meet before being recognized in our Financial Statements. The standard also provides guidance on derecognition, measurement, classification, interest and penalties, accounting in interim periods, disclosure and transition.Under this standard, we may recognize tax benefits from an uncertain position only if it is more likely than not that the position will be sustained upon examination by taxing authoritiestransfer of control varies based on the technical meritsnature of the issue. contract.
The
amount recognized is the largest benefitguidance in ASC 606 requires that we
believe has greater than a 50% likelihooddisclose significant judgments and estimates used in determination of
being realized upon settlement. Actual income taxes paid may vary from estimates depending upon changesour revenue recognition policy disclosed in
income tax laws, actual results“Note 2 — Basis of
operations,Presentation and Summary of Significant Accounting Policies – Recent Accounting Guidance – Recent Accounting Guidance Not Yet Adopted,” including those related to determination of performance obligations, the timing of satisfaction of such performance obligations, and the
final auditstand-alone selling price of
tax returns by taxing authorities. Tax assessmentseach identified performance obligation. The critical judgments that we are required to make in our assessment of contracts with customers and which may
arise several years after tax returns have
been filed.Revenue Recognition
Overview
We recognize revenue when evidence of an arrangement exists, services have been rendered,a material impact on the price is fixedamount or determinable and collectability is reasonably assured. We evaluate our revenue streams for proper timing of revenue recognition. Revenuerecognized include:
Determination of stand-alone selling price (“SSP”) - We are required to make a significant judgment as to whether there is recognizeda sufficient quantity of items sold or renewed on a stand-alone basis and those prices demonstrate an appropriate level of concentration to conclude that a SSP exists. The SSP of our goods and services are generally determined based on observable prices, an adjusted market assessment approach, or an expected cost plus margin approach. We utilize a residual approach only when the SSP for performance obligations with observable prices have been established and the remaining performance obligation in the contract with a customer does not have an observable price as products are deliveredit is uncertain or highly variable and, therefore, is not discernible.
Contract combinations with multiple promised goods or services
are performed.- Our contracts may include various performance obligations for promises to transfer multiple goods and services to a customer, especially since our Games and FinTech businesses may enter into multiple agreements with the same customer that meet the criteria to be combined for accounting purposes under ASC 606. For salessuch arrangements, with multiple deliverables, we applyuse our judgment to analyze the guidance from ASC 605-25, “Revenue Recognition - Multiple-Element Arrangements.” In addition, we applynature of the guidance from ASC 985-605, “Software – Revenue Recognition” which affects vendors that sellpromises made and determine whether each is distinct or lease tangible products in an arrangement that contains software that is more than incidental to the tangible product as a whole and clarifies what guidance should be used in allocating and measuring revenue. In allocating the arrangement fees to separate deliverables, we evaluate whether we have vendor-specific objective evidence (“VSOE”) of selling price, third party evidence (“TPE”) or estimate of selling price (“ESP”) for gaming devices, maintenance and product support fees andcombined with other revenue sources. We generally use ESP to determine the selling price usedpromises in the allocation of separate deliverables, as VSOE and TPE are generally not available. We determine the ESP on separate deliverables by estimating a margin typically received on such items and applying that margin to the product cost incurred.
Sales taxes and other taxes collected from customers on behalf of governmental authorities are accounted for on a net basis and are not included in revenues or operating expenses.
52
Games Revenues
Games revenues are primarily generated by our gaming operations under development, placement, and participation arrangements in which we provide our customers with player terminals, player terminal-content licenses, central determinate systems for devices placed in service in licensed jurisdictions and back-office equipment, collectively referred to herein as leased gaming equipment. Generally, under these arrangements, we retain ownership of the leased gaming equipment installed at customer facilities and we receive revenue based on a percentage of the net win per day generated by the leased gaming equipment or a fixed daily feecontract based on the numberlevel of player terminals installed atintegration and interdependency between the facility. Revenue from lease participation or daily fee arrangements are considered both realizable and earned at the end of each gaming day. Gaming operations revenues generated by leased gaming equipment deployed at sites under development or placement fee agreements are reduced by the accretion of contract rights acquired in connection with those agreements. Contract rights are amounts allocated to intangible assets for dedicated floor space resulting from such agreements, described under “Development and Placement Fee Agreements.” The related amortization expense, or accretion of contract rights, is recorded net against the respective revenue category in the Statements of Loss.
In addition, we sell gaming equipment directly to our customers under sales contracts on standard credit terms, or may grant extended credit terms under sales contracts secured by the related equipment.
Other Games revenues primarily consist of our TournEvent of Champions® national tournament offering.
Generally, player terminal sales include ancillary equipment, such as networking gear, bases, chairs, and occasionally signage, some of which may be necessary for the full functionality of the player terminals in a casino. This ancillary equipment comprises an install kit that is shipped simultaneously with the player terminals. Although our products are analyzed as multiple deliverable arrangements, revenue for the player terminal and ancillary equipment is not recognized until all elements essential for the functionality of the product have been shipped or delivered. This includes game theme software and essential ancillary equipment. If elements that are not essential to the functionality of the player terminals are shipped after the unit, such as signage, chairs, or bases, these items would be classified as deferred revenue until shipped or delivered.
Revenue related to systems arrangements that contain both software and non-software deliverables requires allocation of the arrangement fee to the separate deliverables using the relative selling price method. Revenue for software deliverables is recognized under software revenue recognition guidance. Revenue resulting from the sale of non-software deliverables, such as gaming devices and other hardware, are accounted for based on other applicable revenue recognition guidance as the devices are tangible products containing both software and non-software components that function together to deliver the product's essential functionality.
The majority of our multiple element sales contracts are for some combination of gaming equipment, player terminals, content, system software, license fees, ancillary equipment and maintenance.
Payments Revenues
Cash advance revenues are comprised of transaction fees assessed to gaming patrons in connection with credit card cash access and POS debit card cash access transactions and are recognized at the time the transactions are authorized. Such fees are based on a combination of a fixed amount plus a percentage of the face amount of the credit card cash access or POS debit card cash access transaction amount.
ATM revenues are comprised of transaction fees in the form of cardholder surcharges assessed to gaming patrons in connection with ATM cash withdrawals at the time the transactions are authorized and reverse interchange fees paid to us by the patrons’ issuing banks. Cardholder surcharges and reverse interchange are recognized as revenue when a transaction is initiated. The cardholder surcharges assessed to gaming patrons in connection with ATM cash withdrawals are currently a fixed dollar amount and not a percentage of the transaction amount.
individual deliverables.
Check services revenues are principally comprised of check warranty revenues and are generally based upon a percentage of the face amount of checks warranted. These fees are paid to us by gaming establishments. We sell53
fully integrated kiosks directly to our customers under sales contracts on standard credit terms, or may grant extended credit terms under sales contracts secured by the related equipment.
Kiosk Sales and Services revenues are derived from the sale of cash access equipment and certain other ancillary fees associated with the sale, installation and maintenance of those offerings directly to our customers under sales contracts on standard credit terms, or may grant extended credit terms under sales contracts secured by the related equipment.
Compliance and other revenues include amounts derived from: (i) the sale of software licensing, software subscriptions professional services and certain other ancillary fees; (ii) Central Credit revenues that are based upon either a flat monthly unlimited usage fee or a variable fee structure driven by the volume of patron credit histories generated; and (iii) fees generated from ancillary marketing, database and internet-based gaming activities.
The majority of our multiple element sales contracts are for some combination of cash access services, fully integrated kiosks and related equipment, ancillary services and maintenance.
Stock‑Based Compensation. Stock‑based compensation expense for all awards is based on the grant date fair value estimated. We estimate the weighted‑average fair value of options granted for our time‑based and cliff vesting time‑based options using the Black‑Scholes Option Pricing Model. We estimate the weighted‑average fair value of options granted for our market‑based options using a lattice‑based option valuation model. Each model is based on assumptions regarding expected volatility, dividend yield, risk‑free interest rates, the expected term of the option and the expected forfeiture rate. Each of these assumptions, while reasonable, requires a certain degree of judgment and the fair value estimates could vary if the actual results are materially different than those initially applied.
Recent Accounting Guidance
For a description of our recently adopted accounting guidance and recent accounting guidance not yet adopted, see “Note 2
— Basis of Presentation and Summary of Significant Accounting Policies — Recent Accounting Guidance” within our Financial Statements included elsewhere in this Annual Report on Form 10-K.
Liquidity and Capital Resources
The following table presents selected information about our financial position (in thousands):
| | | | At December 31, | | | At December 31, |
| | 2017 | | | 2016 | | | 2018 | | 2017 |
Balance sheet data | | | | | | | | | | |
| | |
|
Total assets | | $ | 1,537,074 | | | $ | 1,408,163 | | | $ | 1,548,261 |
| | $ | 1,537,074 |
|
Total borrowings | | | 1,167,843 | | | | 1,121,880 | | | 1,163,216 |
| | 1,167,843 |
|
Total stockholders’ deficit | | | (140,633 | ) | | | (107,793 | ) | | (108,895 | ) | | (140,633 | ) |
Cash available | | | | | | | | | | |
| | |
|
Cash and cash equivalents | | $ | 128,586 | | | $ | 119,051 | | | $ | 297,532 |
| | $ | 128,586 |
|
Settlement receivables | | | 227,403 | | | | 128,821 | | | 82,359 |
| | 227,403 |
|
Settlement liabilities | | | (317,744 | ) | | | (239,123 | ) | | (334,198 | ) | | (317,744 | ) |
Net cash position(1) | | | 38,245 | | | | 8,749 | | | 45,693 |
|
| 38,245 |
|
Undrawn revolving credit facility | | | 35,000 | | | | 50,000 | | | 35,000 |
| | 35,000 |
|
Net cash available(1) | | $ | 73,245 | | | $ | 58,749 | | | $ | 80,693 |
|
| $ | 73,245 |
|
| |
| (1) | Non‑GAAP measure. In order to enhance investor understanding of our cash balance, we are providing in this Annual Report on Form 10-K net cash position and net cash available, which are not measures of our financial performance or position under GAAP. Accordingly, these measures should not be considered in isolation or as a substitute for, and should be read in conjunction with, our cash and cash equivalents prepared in accordance with GAAP. We define (i) net cash position as cash and cash equivalents plus settlement receivables less settlement liabilities and (ii) net cash available as net cash position plus undrawn amounts available under our |
54
| | New Revolving Credit Facility (defined herein). We present net cash position because our cash position, as measured by cash and cash equivalents, depends upon changes in settlement receivables and the timing of payments related to settlement liabilities. As such, our cash and cash equivalents can change substantially based upon the timing of our receipt of payments for settlement receivables and payments we make to customers for our settlement liabilities. We present net cash available as management monitors this amount in connection with its forecasting of cash flows and future cash requirements. requirements, both on short term and long term basis. |
Our cash balance, cash flows and line of credit are expected to be sufficient to meet our recurring operating commitments and to fund our planned capital expenditures for the foreseeable future. Cash and cash equivalents at December 31,
20172018 included cash in non‑U.S. jurisdictions of approximately
$18.6$21.8 million. Generally, these funds are available for operating and investment purposes within the jurisdiction in which they reside,
but mayand as a result of the 2017 Tax Act, enacted on December 22, 2017, we will not be subject to
additional taxation if we repatriate foreign funds to the United States, except for potential withholding
tax in the foreign jurisdiction upon repatriation.tax.
We expect that
our cash provided by operating activities will be sufficient for our operating and debt servicing needs during the
next 12 months.foreseeable future. If not, we have sufficient borrowings available under our New Credit Facilities to meet additional funding requirements. We monitor the financial strength of our lenders on an ongoing basis using publicly-available information. Based upon that information, we believe there is not a likelihood that any of our lenders might not be able to honor their commitments under the Credit Agreement.
We provide cash settlement services to
our customersgaming establishments related to our cash access
products. These services,
which involve the movement of funds between
the various parties
associated with cash accessinvolved in these types of transactions.
We receive reimbursement from the patron’s credit or debit card issuing financial institution for the amount owed to the gaming establishment plus the fee charged to the patron. These activities result in
a balanceamounts due to us at the end of each business day
for the face amount provided to patrons plus the service fee charged to those patrons that we
recoupgenerally recover over the next few business days,
and classifywhich are classified as settlement
receivables on our Balance Sheets. As of December 31, 2018, we had $82.4 million in settlement receivables.
These activities alsoIn addition, cash settlement services result in
a balanceamounts due to
our customers atgaming establishments for the
endcash disbursed to patrons through the issuance of
each business daya negotiable instrument or through electronic settlement for the face amount provided to patrons that we
generally remit over the next few business days,
and classifywhich are classified as settlement
liabilities.liabilities on our Balance Sheets. As of December 31,
2017,2018, we had
$227.4$334.2 million in settlement
receivables for which we generally receive payment within one week. As of December 31, 2017, we had $317.7 million in settlement liabilities due to our customers for these settlement services that are generally paid within the next month.liabilities. As the timing of cash received from
cash settlement
receivables and payment of settlement liabilitiesservices may differ, the total amount of cash held by us will fluctuate throughout the year.
Our cash and cash equivalents were
$128.6$297.5 million and
$119.1$128.6 million as of December 31,
20172018 and December 31,
2016,2017, respectively. Our net cash position after considering the impact of settlement receivables and settlement liabilities was
$38.2$45.7 million and
$8.7$38.2 million as of December 31,
20172018 and December 31,
2016,2017, respectively. Our net cash available after considering the net cash position and undrawn amounts available under our
New Revolving Credit Facility was approximately
$73.2$80.7 million and
$58.7$73.2 million as of December 31,
20172018 and December 31,
2016,2017, respectively.
55
The following table summarizes our cash flows for the years ended December 31,
2018, 2017
2016 and
20152016 (in thousands):
| | Year Ended December 31, | | | Increase/(Decrease) | |
| | 2017 | | | 2016 | | | 2015 | | | 2017 Vs 2016 | | | 2016 Vs 2015 | |
Cash flow activities | | | | | | | | | | | | | | | | | | | | |
Net cash provided by operating activities | | $ | 95,828 | | | $ | 131,711 | | | $ | 124,587 | | | $ | (35,883 | ) | | $ | 7,124 | |
Net cash used in investing activities | | | (109,979 | ) | | | (88,054 | ) | | | (85,549 | ) | | | (21,925 | ) | | | (2,505 | ) |
Net cash provided by (used in) financing activities | | | 22,394 | | | | (24,922 | ) | | | (24,551 | ) | | | 47,316 | | | | (371 | ) |
Effect of exchange rates on cash | | | 1,292 | | | | (1,714 | ) | | | (1,552 | ) | | | 3,006 | | | | (162 | ) |
Cash and cash equivalents | | | | | | | | | | | | | | | | | | | | |
Net increase for the period | | | 9,535 | | | | 17,021 | | | | 12,935 | | | | (7,486 | ) | | | 4,086 | |
Balance, beginning of the period | | | 119,051 | | | | 102,030 | | | | 89,095 | | | | 17,021 | | | | 12,935 | |
Balance, end of the period | | $ | 128,586 | | | $ | 119,051 | | | $ | 102,030 | | | $ | 9,535 | | | $ | 17,021 | |
|
| | | | | | | | | | | | | | | | | | | | |
| | | Year Ended December 31, | | Increase/(Decrease) |
| | | 2018 | | 2017 | | 2016 | | 2018 vs 2017 | | 2017 vs 2016 |
| Cash flow activities | | | | | | | | | | |
| Net cash provided by operating activities | | $ | 294,286 |
| | $ | 96,259 |
| | $ | 131,899 |
| | $ | 198,027 |
| | $ | (35,640 | ) |
| Net cash used in investing activities | | (123,350 | ) | | (109,780 | ) | | (88,148 | ) | | (13,570 | ) | | (21,632 | ) |
| Net cash provided by (used in) financing activities | | 11 |
| | 22,394 |
| | (24,922 | ) | | (22,383 | ) | | 47,316 |
|
| Effect of exchange rates on cash | | (1,370 | ) | | 1,292 |
| | (1,714 | ) | | (2,662 | ) | | 3,006 |
|
| Cash and cash equivalents | | | | | | | | | | |
| Net increase for the period | | 169,577 |
| | 10,165 |
| | 17,115 |
| | 159,412 |
| | (6,950 | ) |
| Balance, beginning of the period | | 129,604 |
| | 119,439 |
| | 102,324 |
| | 10,165 |
| | 17,115 |
|
| Balance, end of the period | | $ | 299,181 |
|
| $ | 129,604 |
|
| $ | 119,439 |
|
| $ | 169,577 |
|
| $ | 10,165 |
|
Cash flows provided by operating activities were
$95.8$294.3 million,
$131.7$96.3 million, and
$124.6$131.9 million for the years ended December 31,
2018, 2017,
and 2016,
respectively. Cash flows provided by operating activities increased by $198.0 million for the year ended December 31, 2018, as compared to the prior year period, primarily attributable to the changes in working capital associated with cash settlement services from our FinTech segment, and
2015, respectively.the reduction in cash paid for interest. Cash flows provided by operating activities decreased by
$35.9$35.6 million for the year ended December 31, 2017, as compared to the prior year period. This was primarily attributable to the
impact of the changechanges in
working capital associated with settlement receivables and settlement
liabilities. Cash flows provided by operating activities increased by $7.1 million for the year ended December 31, 2016, as compared to the prior year period. This was also primarily attributable to the impact of the change in settlement receivables and settlement liabilities.liabilities from our FinTech segment.
Cash flows used in investing activities were $110.0$123.4 million, $88.1$109.8 million, and $85.5$88.1 million for the years ended December 31, 2018, 2017, 2016 and 2015,2016, respectively. Cash flows used in investing activities increased by $21.9$13.6 million for the year ended December
31, 2018, as compared to the prior year period, primarily attributable to an increase in capital expenditures, and higher placement fee arrangements in our Games segment. Cash flows used in investing activities increased by $21.6 million for the year ended December 31, 2017, as compared to the prior year period. This was primarily attributable to an increase in capital expenditures, higher placement fee arrangements in our Games segment, and decreased sales of fixed assets.
Cash flows used in investing activities increased by $2.5 million for the year ended December 31, 2016, as compared to the prior year period. This was primarily attributable to an increase in capital expenditures and placement fee arrangements in our Games segment, partially offset by a reduction in capital expenditures in our Payments segment.
Cash flows provided by financing activities were $11,000 and $22.4 million for the year ended December 31, 2018 and 2017, respectively, compared to $24.9 million and $24.6 million of cash flows used in financing activities for the yearsyear ended December 31, 2016 and 2015, respectively. The increase in cash2016. Cash flows fromprovided by financing activities ofdecreased by $22.4 million in the year ended December 31, 2018, as compared to the prior year period, primarily attributable to less debt restructuring activities completed in 2018. Cash flows provided by financing activities increased by $47.3 million in the year ended December 31, 2017, as compared to the prior year periodperiod. This was primarily attributable to our debt restructuring activities completed in 2017 and an increase in proceeds from the exercise of stock options.
We have not declared or paid any cash dividends on our capital stock as we intend to retain our earnings and utilize them for the
stock options, partially offsetrepayment of outstanding debt and to finance the growth and development of our business. Any future change in our dividend policy will be made at the discretion of our Board of Directors, and will depend on our contractual restrictions, results of operations, earnings, capital requirements, and other factors considered relevant by
an increase in debt issuance costs. The cash flows used in 2016 and 2015 were relatively consistent and were primarily associated with the repaymentsour Board of
debt.56
Long‑Term Debt
The following table summarizes our indebtedness (in thousands):
Refinancing
| | December 31, | |
| | 2017 | | | 2016 | |
Long-term debt | | | | | | | | |
Senior secured term loan | | $ | 815,900 | | | $ | 465,600 | |
Senior secured notes | | | — | | | | 335,000 | |
Senior unsecured notes | | | 375,000 | | | | 350,000 | |
Total debt | | | 1,190,900 | | | | 1,150,600 | |
Less: debt issuance costs and discount | | | (23,057 | ) | | | (28,720 | ) |
Total debt after debt issuance costs and discount | | | 1,167,843 | | | | 1,121,880 | |
Less: current portion of long-term debt | | | (8,200 | ) | | | (10,000 | ) |
Long-term debt, less current portion | | $ | 1,159,643 | | | $ | 1,111,880 | |
On May 9, 2017 (the “Closing Date”), Everi Payments, as borrower, and Holdings entered into a credit agreement with the lenders party thereto and Jefferies Finance LLC, as administrative agent, collateral agent, swing line lender, letter of credit issuer, sole lead arranger and sole book manager (amended as described below, the “New Credit Agreement”). The New Credit Agreement provides for: (i) a $35.0 million, five-year senior secured revolving credit facility (the “New Revolving Credit Facility”); and (ii) an $820.0 million, seven-year senior secured term loan facility (the “New Term Loan Facility,” and together with the New Revolving Credit Facility, the “New Credit Facilities”). The fees associated withDirectors. In addition, the New Credit Facilities included discounts of approximately $4.1 million and debt issuance costs of approximately $15.5 million. All borrowings under the New Revolving Credit Facility are subject to the satisfaction of customary conditions, including the absence of defaults and the accuracy of representations and warranties.
The proceeds from the New Term Loan Facility incurred on the Closing Date were used to: (i) refinance: (a) Everi Payments’ existing credit facility with an outstanding balance of approximately $462.3 million with Bank of America, N.A., as administrative agent, collateral agent, swing line lender and letter of credit issuer, Deutsche Bank Securities Inc., as syndication agent, and Merrill Lynch, Pierce, Fenner & Smith Incorporated and Deutsche Bank Securities Inc., as joint lead arrangers and joint book managers (the “Prior Credit Facility”); and (b) Everi Payments’ 7.25% Senior Secured Notes due 2021 in the aggregate original principal amount of $335.0 million (the “Refinanced Secured Notes”); and (ii) pay related transaction fees and expenses.
In connection with the refinancing, we recorded a non-cash charge of approximately $14.6 million during the second quarter of 2017 related to the unamortized deferred financing fees and discounts related to the extinguished term loan under the Prior Credit Facility and the redeemed Refinanced Secured Notes. No prepayment penalties were incurred.
On November 13, 2017 (the “Repricing Closing Date”), we entered into an amendment to the New Credit Agreement (the “First Amendment”) which, among other things, reduced the interest rate on the approximately $818.0 million then outstanding balance of the New Term Loan Facility. The maturity date for the New Term Loan Facility remains May 9, 2024, the maturity date for the New Revolving Credit Facility remains May 9, 2022, and no changes were made to the financial covenants or other debt repayments terms set forth in the New Credit Agreement. We incurred approximately $3.0 million of debt issuance costs and fees associated with the repricing of the New Term Loan Facility.
New Credit Facilities
The New Term Loan Facility matures seven years after the Closing Date and the New Revolving Credit Facility matures five years after the Closing Date. The New Revolving Credit Facility is available for general corporate purposes, including permitted acquisitions, working capital and the issuance of letters of credit.
57
The interest rate per annum applicable to loans under the New Revolving Credit Facility is, at Everi Payments’ option, the base rate or the Eurodollar Rate (defined to be the London Interbank Offered Rate or a comparable or successor rate) (the “Eurodollar Rate”) plus, in each case, an applicable margin. The interest rate per annum applicable to the New Term Loan Facility also is, at Everi Payments’ option, the base rate or the Eurodollar Rate plus, in each case, an applicable margin. The Eurodollar Rate is reset at the beginning of each selected interest period based on the Eurodollar Rate then in effect; provided that, if the Eurodollar Rate is below zero, then such rate will be equal to zero plus the applicable margin. The base rate is a fluctuating interest rate equal to the highest of: (i) the prime lending rate announced by the administrative agent; (ii) the federal funds effective rate from time to time plus 0.50%; and (iii) the Eurodollar Rate (after taking account of any applicable floor) applicable for an interest period of one month plus 1.00%. Prior to the effectiveness of the First Amendment on the Repricing Closing Date, the applicable margins for both the New Revolving Credit Facility and the New Term Loan Facility were: (i) 4.50% in respect of Eurodollar Rate loans and (ii) 3.50% in respect of base rate loans. The applicable margins for the New Term Loan Facility from and after the effectiveness of the First Amendment on the Repricing Closing Date are: (i) 3.50% in respect of Eurodollar Rate loans and (ii) 2.50% in respect of base rate loans.
Voluntary prepayments of the term loan and the revolving loans and voluntary reductions in the unused commitments are permitted in whole or in part, in minimum amounts as set forth in the New Credit Agreementindenture governing the New Credit Facilities, with prior notice but without premium or penalty, except that certain refinancings of the term loans within six months after the Repricing Closing Date will be subject to a prepayment premium of 1.00% of the principal amount repaid.
Subject to certain exceptions, the obligations under the New Credit Facilities are secured by substantially all of the present and subsequently acquired assets of each of Everi Payments, Holdings and the subsidiary guarantors party thereto including: (i) a perfected first priority pledge of all the capital stock of Everi Payments and each domestic direct, wholly owned material restricted subsidiary held by Holdings, Everi Payments or any such subsidiary guarantor; and (ii) a perfected first priority security interest in substantially all other tangible and intangible assets of Holdings, Everi Payments, and such subsidiary guarantors (including, but not limited to, accounts receivable, inventory, equipment, general intangibles, investment property, real property, intellectual property and the proceeds of the foregoing). Subject to certain exceptions, the New Credit Facilities are unconditionally guaranteed by Holdings and such subsidiary guarantors.
The New Credit Agreement governing the New Credit Facilities contains certain covenants that, among other things, limit Holdings’ ability, and the ability of certain of its subsidiaries, to incur additional indebtedness, sell assets or consolidate or merge with or into other companies, pay dividends or repurchase or redeem capital stock, make certain investments, issue capital stock of subsidiaries, incur liens, prepay, redeem or repurchase subordinated debt, and enter into certain types of transactions with its affiliates. The New Credit Agreement governing the New Credit Facilities also requires Holdings, together with its subsidiaries, to comply with a consolidated secured leverage ratio. At December 31, 2017, our consolidated secured leverage ratio was 3.59 to 1.00, with a maximum allowable ratio of 5.00 to 1.00. Our maximum consolidated secured leverage ratio will be 4.75 to 1.00 as of December 31, 2018, 4.50 to 1.00 as of December 31, 2019, 4.25 to 1.00 as of December 31, 2020, and 4.00 to 1.00 as of December 31, 2021 and each December 31 thereafter.
We were in compliance with the covenants and terms of the New Credit Facilities as of December 31, 2017.
Events of default under the New Credit Agreement governing the New Credit Facilities include customary events such as a cross-default provision with respect to other material debt. In addition, an event of default will occur if Holdings undergoes a change of control. This is defined to include the case where Holdings ceases to own 100% of the equity interests of Everi Payments, or where any person or group acquires a percentage of the economic or voting interests of Holdings’ capital stock of 35% or more (determined on a fully diluted basis).
We are required to repay the New Term Loan Facility in an amount equal to 0.25% per quarter of the initial aggregate principal, with the final principal repayment installment on the maturity date. Interest is due in arrears on each interest payment date applicable thereto and at such other times as may be specified in the New Credit Agreement. As to any loan other than a base rate loan, the interest payment dates shall be the last day of each interest period applicable to such loan and the maturity date (provided, however, that if any interest period for a Eurodollar Rate loan exceeds three months, the respective dates that fall every three months after the beginning of such interest period shall also be interest payment dates). As to any base rate loan, the interest payment dates shall be last business day of each March, June, September and December and the maturity date.
58
For the period from January 1, 2017 to the Closing Date, the Prior Credit Facility had an applicable weighted average interest rate of 6.43%. For the period from the Closing Date to December 31, 2017, the New Term Loan Facility had an applicable weighted average interest rate of 5.55%. Together, for the year ended December 31, 2017, the two facilities had a blended weighted average interest rate of 5.73%.
At December 31, 2017, we had approximately $815.9 million of borrowings outstanding under the New Term Loan Facility and no borrowings outstanding under the New Revolving Credit Facility. We had $35.0 million of additional borrowing availability under the New Revolving Credit Facility as of December 31, 2017.
Refinanced Senior Secured Notes
In connection with entering into the New Credit Agreement, on May 9, 2017, Everi Payments redeemed in full all outstanding Refinanced Secured Notes in the aggregate principal amount of $335.0 million plus accrued and unpaid interest. As a result of the redemption, the Company recorded non-cash charges of approximately $1.7 million, which consisted of unamortized deferred financing fees of $0.2 million and discounts of $1.5 million, which were included in the total $14.6 million non-cash charge.
Senior Unsecured Notes
In December 2014, we issued $350.0 million in aggregate principal amount of 10.0% Senior Unsecured Notes due 2022 (the “2014 Unsecured Notes”) under an indenture (as supplemented, the “2014 Notes Indenture”), dated December 19, 2014, between Everi Payments (as successor issuer), and Deutsche Bank Trust Company Americas, as trustee. The fees associated with the 2014 Unsecured Notes included original issue discounts of approximately $3.8 million and debt issuance costs of approximately $14.0 million. In December 2015, we completed an exchange offer in which all of the unregistered 2014 Unsecured Notes were exchanged for a like amount of 2014 Unsecured Notes that had been registered under the Securities Act.
In December 2017, we issued $375.0 million in aggregate principal amount of 7.50% Senior Unsecured Notes due 2025 (the “2017 Unsecured Notes”) under an indenture (the “2017 Notes Indenture”), dated December 5, 2017, among Everi Payments (as issuer), Holdings and certain of its direct and indirect domestic subsidiaries as guarantors, and Deutsche Bank Trust Company Americas, as trustee. Interest on the 2017 Unsecured Notes accrues at alimit our ability to declare and pay cash dividends.
Long‑Term Debt
For additional information regarding our credit agreement and other debt as well as interest rate
of 7.50% per annumrisk see “Contractual Obligations” in this Item 7 below, Part II, Item 7A “Quantitative and
is payable semi-annually in arrears on each June 15Qualitative Disclosures About Market Risk,” and
December 15, commencing on June 15, 2018. The 2017 Unsecured Notes will mature on December 15, 2025. We incurred approximately $6.1 million of debt issuance costsItem 8. Financial Statements and fees associated with the refinancing of our 2017 Unsecured Notes.On December 5, 2017, together with the issuance of the 2017 Unsecured Notes, Everi Payments satisfied and discharged the 2014 Notes Indenture relating to the 2014 Unsecured Notes. To effect the satisfaction and discharge, Everi Payments issued an unconditional notice of redemption to Deutsche Bank Trust Company Americas, as trustee, of the redemption in full on January 15, 2018 (the “Redemption Date”) of all outstanding 2014 Unsecured Notes under the terms of the 2014 Notes Indenture. In addition, using the proceeds from the sale of the 2017 Unsecured Notes and cash on hand, Everi Payments irrevocably deposited with the trustee funds sufficient to pay the redemption price of the 2014 Unsecured Notes of 107.5% of the principal amount thereof, plus accrued and unpaid interest to, but not including, the Redemption Date (the “Redemption Price”), and irrevocably instructed the trustee to apply the deposited money toward payment of the Redemption Price for the 2014 Unsecured Notes on the Redemption Date. Upon the trustee’s receipt of such funds and instructions, along with an officer’s certificate of Everi Payments and an opinion of counsel certifying and opining that all conditions under the 2014 Notes Indenture to the satisfaction and discharge of the 2014 Notes Indenture had been satisfied, the 2014 Notes Indenture was satisfied and discharged, and all of the obligations of Everi Payments and the guarantors under the 2014 Notes Indenture ceased to be of further effect, as of December 5, 2017 (subject to certain exceptions). The 2014 Unsecured Notes were thereafter redeemed on the Redemption Date.
59
In connection with the issuance of the 2017 Unsecured Notes and the redemption of the 2014 Unsecured Notes, we incurred a $37.2 million loss on extinguishment of debt consisting of a $26.3 million make-whole premium related to the satisfaction and redemption of the 2014 Unsecured Notes and approximately $10.9 million for the write-off of related unamortized debt issuance costs and fees.
We were in compliance with the terms of the 2017 Unsecured Notes as of December 31, 2017.
Supplementary Data “Note 12 — Long-Term Debt.”
The following summarizes our contractual cash obligations (in thousands):
| | | | At December 31, 2017 | | | At December 31, |
| | Total | | | 2018 | | | 2019 | | | 2020 | | | 2021 | | | 2022 | | | Thereafter | | | Total | | 2019 | | 2020 | | 2021 | | 2022 | | 2023 | | Thereafter |
Contractual obligations | | | | | | | | | | | | | | | | | | | | | | | | | | | | | | | | | | | | | | | | | | |
Debt obligations(1) | | $ | 1,190,900 | | | $ | 8,200 | | | $ | 8,200 | | | $ | 8,200 | | | $ | 8,200 | | | $ | 8,200 | | | $ | 1,149,900 | | | $ | 1,182,700 |
| | $ | 8,200 |
| | $ | 8,200 |
| | $ | 8,200 |
| | $ | 8,200 |
| | $ | 8,200 |
| | $ | 1,141,700 |
|
Estimated interest obligations(2) | | | 476,236 | | | | 69,264 | | | | 68,079 | | | | 67,755 | | | | 67,379 | | | | 66,870 | | | | 136,889 | | | 435,709 |
| | 73,566 |
| | 73,186 |
| | 72,769 |
| | 72,189 |
| | 71,730 |
| | 72,269 |
|
Operating lease obligations | | | 22,107 | | | | 4,943 | | | | 5,050 | | | | 5,046 | | | | 4,007 | | | | 2,193 | | | | 868 | | |
Purchase obligations(3) | | | 98,094 | | | | 68,089 | | | | 25,646 | | | | 1,994 | | | | 1,820 | | | | 508 | | | | 37 | | |
Operating lease obligations(3) | | | 19,721 |
| | 5,570 |
| | 5,680 |
| | 4,598 |
| | 2,799 |
| | 1,074 |
| | — |
|
Purchase obligations(4) | | | 66,463 |
| | 56,233 |
| | 7,887 |
| | 1,835 |
| | 508 |
| | — |
| | — |
|
Total contractual obligations | | $ | 1,787,337 | | | $ | 150,496 | | | $ | 106,975 | | | $ | 82,995 | | | $ | 81,406 | | | $ | 77,771 | | | $ | 1,287,694 | | | $ | 1,704,593 |
|
| $ | 143,569 |
|
| $ | 94,953 |
| | $ | 87,402 |
| | $ | 83,696 |
| | $ | 81,004 |
| | $ | 1,213,969 |
|
|
|
| (1) | We are required to make principal payments of 1% annually under0.25% per quarter of the New Term Loan Facilityinitial aggregate principal, with the final principal repayment installment on the maturity date and may also be required to make an excess cash flow payment that is based on full year end earnings and our consolidated secured leverage ratio in effect at that time. The above table does not reflect any future payments related to excess cash flow payments. |
(2)
| |
| (2) | Estimated interest payments were computed using the interest rate in effect at December 31, 20172018 multiplied by the principal balance outstanding after scheduled principal amortization payments. For our debt obligations, the weighted average rate assumed was approximately 5.70%6.16% until 2025,2024, when the weighted average rate would increase to approximately 7.50%. until the remaining debt is fully satisfied in 2025. |
(3)
| Included in
|
| (3) | Our operating lease obligations primarily consist of real estate arrangements we enter into with third parties. See Note 13 for additional information regarding our operating leases. |
| |
| (4) | Our purchase obligations areprimarily consist of open purchase orders and placement fee agreements related to our Games business as well as minimum transaction processing services from various third‑party processors used by us as well as open purchase orders and placement fee agreements related to our GamesFinTech business. |
Other Liquidity Needs and Resources
We need cash to support our foreign operations. As a result of the 2017 Tax Act, enacted December 22, 2017, we will not be subject to additional taxation if we decide to repatriate foreign funds to the United States, except for potential withholding tax. Depending on the
jurisdiction and the treaty between different foreign jurisdictions our withholding tax rates can vary significantly. If we expand our business into new foreign jurisdictions, we
mustwill rely on treaty‑favored cross‑border transfers of funds, the cash generated by our operations in those foreign jurisdictions, or alternate sources of working capital.
Off‑Balance Sheet Arrangements
Our Contract Cash Solutions Agreement
We have commercial arrangements with Wells Fargo Bank, N.A. (“Wells Fargo”) allows us to use funds owned by Wells Fargothird party vendors to provide the currency neededcash for normal operating requirements forcertain of our ATMs. For the use of these funds, we pay Wells Fargo a cash usage fee on either the average daily balance of funds utilized multiplied by a contractually defined cash usage rate or the amounts supplied multiplied by a contractually defined cash usage rate. These cash usage fees, reflected as interest expense within the Statements of Loss,Income (Loss), were $7.0 million, $4.9 million, $3.1 million and $2.3$3.1 million for the years ended December 31, 2018, 2017, 2016 and 2015,2016, respectively. We are exposed to interest rate risk to the extent that the applicable LIBOR (defined to befederal funds rate increases.
Under these agreements, the
Interbank Offered Rate or a comparable or successor rate) increases.60
Under this agreement, all currency supplied by Wells Fargo remains thethird party vendors remain their sole property of Wells Fargo at all times until it is dispensed, at which time Wells Fargo obtains an interest in the corresponding settlement receivable which is recorded on a net basis.funds are dispensed. As these funds are not our assets, supplied cash is not reflected on theour Balance Sheets. The outstanding balances of ATM cash utilized by us from Wells Fargothe third party vendors were $289.8$224.7 million and $285.4$289.8 million as of December 31, 2018 and 2017, and 2016, respectively.
The
primary commercial arrangement, the Contract Cash Solutions Agreement, as amended,
with Wells Fargo Bank, N.A. (“Wells Fargo”) provides us with cash in the maximum amount of $300.0 million with the ability to increase the amount by $75 million over a 5-day period for special occasions, such as
the period around New
Years.Year’s Day. The
term of the agreement
currently expires on June 30,
2020.2021 and will auto renew for additional one-year periods unless either party provides a 90-day written notice of its intent not to renew.
We are responsible for any losses of cash in the ATMs under this agreement and we self-insure for this risk. We incurred no material losses related to this self-insurance for the years ended December 31,
20172018 and
2016.2017.
Our monetary assets consistingthat primarily consist of cash, receivables, inventory andas well as our non‑monetarynon-monetary assets consisting primarilythat are mostly comprised of the deferred tax asset, goodwill and other intangible assets, are not significantly affected by inflation. We believe that replacement costs of equipment, furniture, and leasehold improvements will not materially affect our operations. However, the rate of inflation affects our operating expenses, such as those for salaries and benefits, armored carrier expenses, telecommunications expenses, and equipment repair and maintenance services, which may not be readily recoverable in the financial terms under which we provide our Games and PaymentsFinTech products and services to gaming establishments and their patrons.establishments.
Item 7A. Quantitative and Qualitative Disclosures about Market Risk.
In the normal course of business, we are exposed to foreign currency exchange risk. We operate and conduct business in foreign countries and, as a result, are exposed to movements in foreign currency exchange rates. Our exposure to foreign currency exchange risk related to our foreign operations is not material to our results of operations, cash flows, or financial
position.condition. At present, we do not hedge this
risk, butrisk; however, we continue to evaluate such foreign currency translation
risk exposure.
Wells Fargo supplies us
In the normal course of business, we have commercial arrangements with
currency neededthird party vendors to provide cash for
normal operating requirementscertain of our
domestic ATMs pursuant to the Contract Cash Solutions Agreement.ATMs. Under the terms of
this agreement,these agreements, we pay a monthly cash usage fee based upon the
product of the average daily dollars outstanding in all such ATMs multiplied by a margin that is tied to LIBOR.target federal funds rate. We are, therefore, exposed to interest rate risk to the extent that the applicable
LIBORfederal funds rate increases. The
currency suppliedoutstanding balance of ATM cash utilized by
Wells Fargous from third party vendors was
$289.8$224.7 million as of December 31,
2017. Based upon this outstanding amount of currency supplied by Wells Fargo,2018; therefore, each 1% increase in the applicable
LIBORfederal funds rate would have
approximately a
$2.9$2.2 million impact on income before
taxestax over a 12‑month period.
Foreign gaming establishments or third-party vendors supply the currency needs for the ATMs located on their premises. The
New Credit Facilities bear interest at rates that can vary over time. We have the option of having interest on the outstanding amounts under the New Credit Facilities paid
basedusing on a base rate or
based on the Eurodollar Rate.LIBOR. We have historically elected to pay interest based on
the Eurodollar Rate,LIBOR, and we expect to continue to
pay interest based on the Eurodollar Rate ofdo so for various maturities. The weighted average interest rate
on credit facilitiesthe New Credit Facilities was approximately
5.73%5.17% for the year ended December 31,
2017.2018. Based upon the outstanding balance on the New Credit Facilities of
$815.9$807.7 million as of December 31,
2017,2018, each 1% increase in the applicable Eurodollar Rate would have an
$8.2$8.1 million impact on interest expense over a 12‑month period. The interest rate
onfor the
2017 Unsecured Notes
are fixed andis fixed; therefore, an increase in
interestLIBOR rates does not impact the
related interest
expense associated withexpense. At present, we do not hedge the
notes.61
risk related to the changes in the interest rate; however, we continue to evaluate such interest rate exposure.
Item 8. Financial Statements and Supplementary
Data.Data.
Index to Consolidated Financial Statements
62
REPORT OF INDEPENDENT
REGISTEREDREGISTERED PUBLIC ACCOUNTING FIRM
Shareholders and Board of Directors
Everi Holdings Inc. and subsidiaries
Opinion on the Consolidated Financial Statements
We have audited the accompanying consolidated balance sheets of Everi Holdings Inc. (the “Company”) and subsidiaries as of December 31, 20172018 and 2016,2017, the related consolidated statements of lossincome (loss) and comprehensive loss,income (loss), stockholders’ (deficit) equity,deficit, and cash flows for each of the three years in the period ended December 31, 2017,2018, and the related notes (collectively referred to as the “consolidated financial statements”). In our opinion, the consolidated financial statements present fairly, in all material respects, the financial position of the Company and subsidiaries at December 31, 20172018 and 2016,2017, and the results of their operations and their cash flows for each of the three years in the period ended December 31, 20172018, in conformity with accounting principles generally accepted in the United States of America. We also have audited, in accordance with the standards of the Public Company Accounting Oversight Board (United States) (“PCAOB”), the Company'sCompany’s internal control over financial reporting as of December 31, 2017,2018, based on criteria established in Internal Control –- Integrated Framework (2013)(2013) issued by the Committee of Sponsoring Organizations of the Treadway Commission (“COSO”) and our report dated March
15, 201812, 2019 expressed an unqualified opinion thereon.
Adoption of ASU No. 2014-09
As discussed in Note 3 to the consolidated financial statements, the Company has changed its method of accounting for revenue from contracts with customers in 2018 due to the adoption of Accounting Standards Update (ASU) No. 2014-09, “Revenue from Contracts with Customers (Topic 606),” and the related amendments.
These consolidated financial statements are the responsibility of the Company’s management. Our responsibility is to express an opinion on the Company’s consolidated financial statements based on our audits. We are a public accounting firm registered with the PCAOB and are required to be independent with respect to the Company in accordance with the U.S. federal securities laws and the applicable rules and regulations of the Securities and Exchange Commission and the PCAOB.
We conducted our audits in accordance with the standards of the PCAOB. Those standards require that we plan and perform the audit to obtain reasonable assurance about whether the consolidated financial statements are free of material misstatement, whether due to error or fraud.
Our audits included performing procedures to assess the risks of material misstatement of the consolidated financial statements, whether due to error or fraud, and performing procedures that respond to those risks. Such procedures included examining, on a test basis, evidence regarding the amounts and disclosures in the consolidated financial statements. Our audits also included evaluating the accounting principles used and significant estimates made by management, as well as evaluating the overall presentation of the consolidated financial statements. We believe that our audits provide a reasonable basis for our opinion.
We have served as the Company’s auditor since 2015.
March
15, 2018 63
12, 2019
EVERI HOLDINGS INC. AND SUBSIDIARIES
CONSOLIDATED STATEMENTS OF
LOSSINCOME (LOSS) AND COMPREHENSIVE
LOSSINCOME (LOSS)
(In thousands, except per share amounts)
| | Year Ended December 31, | |
| | 2017 | | | 2016 | | | 2015 | |
Revenues | | | | | | | | | | | | |
Games | | $ | 222,777 | | | $ | 213,253 | | | $ | 214,424 | |
Payments | | | 752,171 | | | | 646,203 | | | | 612,575 | |
Total revenues | | | 974,948 | | | | 859,456 | | | | 826,999 | |
Costs and expenses | | | | | | | | | | | | |
Games cost of revenue (exclusive of depreciation and amortization) | | | 54,695 | | | | 50,308 | | | | 47,017 | |
Payments cost of revenue (exclusive of depreciation and amortization) | | | 583,850 | | | | 498,706 | | | | 463,380 | |
Operating expenses | | | 118,935 | | | | 118,709 | | | | 101,202 | |
Research and development | | | 18,862 | | | | 19,356 | | | | 19,098 | |
Goodwill impairment | | | — | | | | 146,299 | | | | 75,008 | |
Depreciation | | | 47,282 | | | | 49,995 | | | | 45,551 | |
Amortization | | | 69,505 | | | | 94,638 | | | | 85,473 | |
Total costs and expenses | | | 893,129 | | | | 978,011 | | | | 836,729 | |
Operating income (loss) | | | 81,819 | | | | (118,555 | ) | | | (9,730 | ) |
Other expenses | | | | | | | | | | | | |
Interest expense, net of interest income | | | 102,136 | | | | 99,228 | | | | 100,290 | |
Loss on extinguishment of debt | | | 51,750 | | | | — | | | | 13,063 | |
Total other expenses | | | 153,886 | | | | 99,228 | | | | 113,353 | |
Loss before income tax | | | (72,067 | ) | | | (217,783 | ) | | | (123,083 | ) |
Income tax (benefit) provision | | | (20,164 | ) | | | 31,696 | | | | (18,111 | ) |
Net loss | | | (51,903 | ) | | | (249,479 | ) | | | (104,972 | ) |
Foreign currency translation | | | 1,856 | | | | (2,427 | ) | | | (1,251 | ) |
Comprehensive loss | | $ | (50,047 | ) | | $ | (251,906 | ) | | $ | (106,223 | ) |
Loss per share | | | | | | | | | | | | |
Basic | | $ | (0.78 | ) | | $ | (3.78 | ) | | $ | (1.59 | ) |
Diluted | | $ | (0.78 | ) | | $ | (3.78 | ) | | $ | (1.59 | ) |
Weighted average common shares outstanding | | | | | | | | | | | | |
Basic | | | 66,816 | | | | 66,050 | | | | 65,854 | |
Diluted | | | 66,816 | | | | 66,050 | | | | 65,854 | |
|
| | | | | | | | | | | | |
| | | Year Ended December 31, |
| | | 2018 | | 2017 | | 2016 |
| Revenues | | | | | | |
|
| Games revenues | | | | | | |
| Gaming operations | | $ | 168,146 |
| | $ | 148,654 |
| | $ | 152,514 |
|
| Gaming equipment and systems | | 87,038 |
| | 70,118 |
| | 56,277 |
|
| Gaming other | | 3,794 |
| | 4,005 |
| | 4,462 |
|
| Games total revenues | | 258,978 |
| | 222,777 |
| | 213,253 |
|
| | | | | | | |
| FinTech revenues | | | | | | |
| Cash access services | | 156,806 |
| | 707,222 |
| | 601,874 |
|
| Equipment | | 20,977 |
| | 13,258 |
| | 14,995 |
|
| Information services and other | | 32,754 |
| | 31,691 |
| | 29,334 |
|
| FinTech total revenues | | 210,537 |
| | 752,171 |
| | 646,203 |
|
| | | | | | | |
| Total revenues | | 469,515 |
| | 974,948 |
| | 859,456 |
|
| | | | | | | |
| Costs and expenses | | | | | | |
Games cost of revenues(1) | | | | | | |
| Gaming operations | | 17,603 |
| | 15,741 |
| | 15,265 |
|
| Gaming equipment and systems | | 47,121 |
| | 35,707 |
| | 31,602 |
|
| Gaming other | | 3,285 |
| | 3,247 |
| | 3,441 |
|
| Games total cost of revenues | | 68,009 |
| | 54,695 |
| | 50,308 |
|
| | | | | | | |
FinTech cost of revenues(1) | | | | | | |
| Cash access services | | 9,717 |
| | 572,880 |
| | 485,061 |
|
| Equipment | | 12,601 |
| | 7,717 |
| | 9,889 |
|
| Information services and other | | 4,110 |
| | 3,253 |
| | 3,756 |
|
| FinTech total cost of revenues | | 26,428 |
| | 583,850 |
| | 498,706 |
|
| | | | | | | |
| Operating expenses | | 142,298 |
| | 118,935 |
| | 118,709 |
|
| Research and development | | 20,497 |
| | 18,862 |
| | 19,356 |
|
| Goodwill impairment | | — |
| | — |
| | 146,299 |
|
| Depreciation | | 61,225 |
| | 47,282 |
| | 49,995 |
|
| Amortization | | 65,245 |
| | 69,505 |
| | 94,638 |
|
| Total costs and expenses | | 383,702 |
| | 893,129 |
| | 978,011 |
|
| | | | | | | |
| Operating income (expense) | | 85,813 |
| | 81,819 |
| | (118,555 | ) |
|
| | | | | | | | | | | | |
| | | Year Ended December 31, |
| | | 2018 | | 2017 | | 2016 |
| Other expenses | | | | | | |
| Interest expense, net of interest income | | 83,001 | | 102,136 |
| | 99,228 |
|
| Loss on extinguishment of debt | | 166 |
| | 51,750 |
| | — |
|
| Total other expenses | | 83,167 |
| | 153,886 |
| | 99,228 |
|
| | | | | | | |
| Income (loss) before income tax | | 2,646 |
| | (72,067 | ) | | (217,783 | ) |
| | | | | | | |
| Income tax (benefit) provision | | (9,710 | ) | | (20,164 | ) | | 31,696 |
|
| Net income (loss) | | 12,356 |
| | (51,903 | ) | | (249,479 | ) |
| Foreign currency translation | | (1,745 | ) | | 1,856 |
| | (2,427 | ) |
| Comprehensive income (loss) | | $ | 10,611 |
| | $ | (50,047 | ) | | $ | (251,906 | ) |
| Earnings (loss) per share | | | | | | |
| Basic | | $ | 0.18 |
| | $ | (0.78 | ) | | $ | (3.78 | ) |
| Diluted | | $ | 0.17 |
| | $ | (0.78 | ) | | $ | (3.78 | ) |
| Weighted average common shares outstanding | | | | | | |
| Basic | | 69,464 |
| | 66,816 |
| | 66,050 |
|
| Diluted | | 73,796 |
| | 66,816 |
| | 66,050 |
|
(1) Exclusive of depreciation and amortization.
The 2018 results include the impact of adopting the Financial Accounting Standards Board (the “FASB”) Accounting Standards Codification Topic 606Revenues from Contracts with Customers(“ASC 606”). Refer to “Note 2 — Basis of Presentation and Summary of Significant Accounting Policies” and “Note 3 — Adoption of ASC 606, Revenue from Contracts with Customers” to our consolidated financial statements included in Part II, Item 8 of this Form 10-K for more information.
See notes to consolidated financial statements.
64
EVERI HOLDINGS INC. AND SUBSIDIARIES
CONSOLIDATED BALANCE SHEETS
(In thousands, except par value amounts)
| | At December 31, | |
| | 2017 | | | 2016 | |
ASSETS | | | | | | | | |
Current assets | | | | | | | | |
Cash and cash equivalents | | $ | 128,586 | | | $ | 119,051 | |
Settlement receivables | | | 227,403 | | | | 128,821 | |
Trade and other receivables, net of allowances for doubtful accounts of $4,706 and $4,701 at December 31, 2017 and December 31, 2016, respectively | | | 47,782 | | | | 56,651 | |
Inventory | | | 23,967 | | | | 19,068 | |
Prepaid expenses and other assets | | | 20,670 | | | | 18,048 | |
Total current assets | | | 448,408 | | | | 341,639 | |
Non-current assets | | | | | | | | |
Property, equipment and leased assets, net | | | 113,519 | | | | 98,439 | |
Goodwill | | | 640,589 | | | | 640,546 | |
Other intangible assets, net | | | 324,311 | | | | 317,997 | |
Other receivables | | | 2,638 | | | | 2,020 | |
Other assets | | | 7,609 | | | | 7,522 | |
Total non-current assets | | | 1,088,666 | | | | 1,066,524 | |
Total assets | | $ | 1,537,074 | | | $ | 1,408,163 | |
LIABILITIES AND STOCKHOLDERS’ DEFICIT | | | | | | | | |
Current liabilities | | | | | | | | |
Settlement liabilities | | $ | 317,744 | | | $ | 239,123 | |
Accounts payable and accrued expenses | | | 134,504 | | | | 94,391 | |
Current portion of long-term debt | | | 8,200 | | | | 10,000 | |
Total current liabilities | | | 460,448 | | | | 343,514 | |
Non-current liabilities | | | | | | | | |
Deferred tax liability | | | 38,207 | | | | 57,611 | |
Long-term debt, less current portion | | | 1,159,643 | | | | 1,111,880 | |
Other accrued expenses and liabilities | | | 19,409 | | | | 2,951 | |
Total non-current liabilities | | | 1,217,259 | | | | 1,172,442 | |
Total liabilities | | | 1,677,707 | | | | 1,515,956 | |
Commitments and contingencies (Note 12) | | | | | | | | |
Stockholders’ deficit | | | | | | | | |
Common stock, $0.001 par value, 500,000 shares authorized and 93,120 and 90,952 shares issued at December 31, 2017 and December 31, 2016, respectively | | | 93 | | | | 91 | |
Convertible preferred stock, $0.001 par value, 50,000 shares authorized and no shares outstanding at December 31, 2017 and December 31, 2016, respectively | | | — | | | | — | |
Additional paid-in capital | | | 282,070 | | | | 264,755 | |
Accumulated deficit | | | (246,202 | ) | | | (194,299 | ) |
Accumulated other comprehensive loss | | | (253 | ) | | | (2,109 | ) |
Treasury stock, at cost, 24,883 and 24,867 shares at December 31, 2017 and December 31, 2016, respectively | | | (176,341 | ) | | | (176,231 | ) |
Total stockholders’ deficit | | | (140,633 | ) | | | (107,793 | ) |
Total liabilities and stockholders’ deficit | | $ | 1,537,074 | | | $ | 1,408,163 | |
|
| | | | | | | | |
| | | At December 31, |
| | | 2018 | | 2017 |
| ASSETS | | |
| | |
|
| Current assets | | |
| | |
|
| Cash and cash equivalents | | $ | 297,532 |
| | $ | 128,586 |
|
| Settlement receivables | | 82,359 |
| | 227,403 |
|
Trade and other receivables, net of allowances for doubtful accounts of $6,425 and $4,706 at December 31, 2018 and December 31, 2017, respectively | | 64,387 |
| | 47,782 |
|
| Inventory | | 24,403 |
| | 23,967 |
|
| Prepaid expenses and other assets | | 20,259 |
| | 20,670 |
|
| Total current assets | | 488,940 |
|
| 448,408 |
|
| Non-current assets | | |
| | |
|
| Property, equipment and leased assets, net | | 116,288 |
| | 113,519 |
|
| Goodwill | | 640,537 |
| | 640,589 |
|
| Other intangible assets, net | | 287,397 |
| | 324,311 |
|
| Other receivables | | 8,847 |
| | 2,638 |
|
| Other assets | | 6,252 |
| | 7,609 |
|
| Total non-current assets | | 1,059,321 |
|
| 1,088,666 |
|
| Total assets | | $ | 1,548,261 |
|
| $ | 1,537,074 |
|
| LIABILITIES AND STOCKHOLDERS’ DEFICIT | | |
| | |
|
| Current liabilities | | |
| | |
|
| Settlement liabilities | | $ | 334,198 |
| | $ | 317,744 |
|
| Accounts payable and accrued expenses | | 129,238 |
| | 134,504 |
|
| Current portion of long-term debt | | 8,200 |
| | 8,200 |
|
| Total current liabilities | | 471,636 |
|
| 460,448 |
|
| Non-current liabilities | | |
| | |
|
| Deferred tax liability | | 27,867 |
| | 38,207 |
|
| Long-term debt, less current portion | | 1,155,016 |
| | 1,159,643 |
|
| Other accrued expenses and liabilities | | 2,637 |
| | 19,409 |
|
| Total non-current liabilities | | 1,185,520 |
|
| 1,217,259 |
|
| Total liabilities | | 1,657,156 |
|
| 1,677,707 |
|
| Commitments and contingencies (Note 13) | |
|
| |
|
|
| Stockholders’ deficit | | |
| | |
|
| Common stock, $0.001 par value, 500,000 shares authorized and 95,100 and 93,120 shares issued at December 31, 2018 and December 31, 2017, respectively | | 95 |
| | 93 |
|
| Convertible preferred stock, $0.001 par value, 50,000 shares authorized and no shares outstanding at December 31, 2018 and December 31, 2017, respectively | | — |
| | — |
|
| Additional paid-in capital | | 298,929 |
| | 282,070 |
|
| Accumulated deficit | | (229,457 | ) | | (246,202 | ) |
| Accumulated other comprehensive loss | | (1,998 | ) | | (253 | ) |
| Treasury stock, at cost, 24,900 and 24,883 shares at December 31, 2018 and December 31, 2017, respectively | | (176,464 | ) | | (176,341 | ) |
| Total stockholders’ deficit | | (108,895 | ) |
| (140,633 | ) |
| Total liabilities and stockholders’ deficit | | $ | 1,548,261 |
|
| $ | 1,537,074 |
|
See notes to consolidated financial statements.
65
EVERI HOLDINGS INC. AND SUBSIDIARIES
CONSOLIDATED STATEMENTS OF CASH FLOWS
(In thousands) | | Year Ended December 31, | |
| | 2017 | | | 2016 | | | 2015 | |
Cash flows from operating activities | | | | | | | | | | | | |
Net loss | | $ | (51,903 | ) | | $ | (249,479 | ) | | $ | (104,972 | ) |
Adjustments to reconcile net loss to cash provided by operating activities: | | | | | | | | | | | | |
Depreciation and amortization | | | 116,787 | | | | 144,633 | | | | 131,024 | |
Amortization of financing costs and discounts | | | 8,706 | | | | 6,695 | | | | 7,109 | |
Loss (gain) on sale or disposal of assets | | | 2,513 | | | | 2,563 | | | | (2,789 | ) |
Accretion of contract rights | | | 7,819 | | | | 8,692 | | | | 7,614 | |
Provision for bad debts | | | 9,737 | | | | 9,908 | | | | 10,135 | |
Deferred income taxes | | | (20,015 | ) | | | 29,940 | | | | (19,878 | ) |
Write-down of assets | | | — | | | | 4,289 | | | | — | |
Reserve for obsolescence | | | 397 | | | | 3,581 | | | | 1,243 | |
Goodwill impairment | | | — | | | | 146,299 | | | | 75,008 | |
Loss on extinguishment of debt | | | 51,750 | | | | — | | | | 13,063 | |
Stock-based compensation | | | 6,411 | | | | 6,735 | | | | 8,284 | |
Changes in operating assets and liabilities: | | | | | | | | | | | | |
Settlement receivables | | | (98,390 | ) | | | (83,998 | ) | | | (1,830 | ) |
Trade and other receivables | | | (884 | ) | | | (8,207 | ) | | | (5,219 | ) |
Inventory | | | (5,753 | ) | | | 5,600 | | | | (1,075 | ) |
Prepaid and other assets | | | (1,536 | ) | | | 4,480 | | | | (5,553 | ) |
Settlement liabilities | | | 78,465 | | | | 99,245 | | | | 21,229 | |
Accounts payable and accrued expenses | | | (8,276 | ) | | | 735 | | | | (8,806 | ) |
Net cash provided by operating activities | | | 95,828 | | | | 131,711 | | | | 124,587 | |
Cash flows from investing activities | | | | | | | | | | | | |
Capital expenditures | | | (96,490 | ) | | | (80,741 | ) | | | (76,988 | ) |
Acquisitions, net of cash acquired | | | — | | | | (694 | ) | | | (10,857 | ) |
Proceeds from sale of fixed assets | | | 10 | | | | 4,599 | | | | 2,102 | |
Placement fee agreements | | | (13,300 | ) | | | (11,312 | ) | | | (2,813 | ) |
Repayments under development agreements | | | — | | | | — | | | | 3,104 | |
Changes in restricted cash | | | (199 | ) | | | 94 | | | | (97 | ) |
Net cash used in investing activities | | | (109,979 | ) | | | (88,054 | ) | | | (85,549 | ) |
Cash flows from financing activities | | | | | | | | | | | | |
Proceeds from new credit facility | | | 820,000 | | | | — | | | | — | |
Proceeds from unsecured notes | | | 375,000 | | | | — | | | | — | |
Repayments of prior credit facility | | | (465,600 | ) | | | (24,400 | ) | | | (10,000 | ) |
Repayments of secured notes | | | (335,000 | ) | | | — | | | | (350,000 | ) |
Repayments of unsecured notes | | | (350,000 | ) | | | — | | | | — | |
Repayments of new credit facility | | | (4,100 | ) | | | — | | | | — | |
Proceeds from issuance of secured notes | | | — | | | | — | | | | 335,000 | |
Debt issuance costs | | | (28,702 | ) | | | (480 | ) | | | (1,221 | ) |
Proceeds from exercise of stock options | | | 10,906 | | | | — | | | | 1,839 | |
Purchase of treasury stock | | | (110 | ) | | | (42 | ) | | | (169 | ) |
Net cash provided by (used in) financing activities | | | 22,394 | | | | (24,922 | ) | | | (24,551 | ) |
Effect of exchange rates on cash | | | 1,292 | | | | (1,714 | ) | | | (1,552 | ) |
Cash and cash equivalents | | | | | | | | | | | | |
Net increase for the period | | | 9,535 | | | | 17,021 | | | | 12,935 | |
Balance, beginning of the period | | | 119,051 | | | | 102,030 | | | | 89,095 | |
Balance, end of the period | | $ | 128,586 | | | $ | 119,051 | | | $ | 102,030 | |
|
| | | | | | | | | | | | |
| | | Year Ended December 31, |
| | | 2018 | | 2017 | | 2016 |
| Cash flows from operating activities | | | | | | |
| Net income (loss) | | $ | 12,356 |
| | $ | (51,903 | ) | | $ | (249,479 | ) |
| Adjustments to reconcile net income (loss) to cash provided by operating activities: | | | | | | |
| Depreciation | | 61,225 |
| | 47,282 |
| | 49,995 |
|
| Amortization | | 65,245 |
| | 69,505 |
| | 94,638 |
|
| Amortization of financing costs and discounts | | 4,877 |
| | 8,706 |
| | 6,695 |
|
| Loss on sale or disposal of assets | | 869 |
| | 2,513 |
| | 2,563 |
|
| Accretion of contract rights | | 8,421 |
| | 7,819 |
| | 8,692 |
|
| Provision for bad debts | | 11,459 |
| | 9,737 |
| | 9,908 |
|
| Deferred income taxes | | (10,343 | ) | | (20,015 | ) | | 29,940 |
|
| Write-down of assets | | 2,575 |
| | — |
| | 4,289 |
|
| Reserve for obsolescence | | 1,919 |
| | 397 |
| | 3,581 |
|
| Goodwill impairment | | — |
| | — |
| | 146,299 |
|
| Loss on extinguishment of debt | | 166 |
| | 51,750 |
| | — |
|
| Stock-based compensation | | 7,251 |
| | 6,411 |
| | 6,735 |
|
| Changes in operating assets and liabilities: | | | | | | |
| Settlement receivables | | 143,705 |
| | (98,390 | ) | | (83,998 | ) |
| Trade and other receivables | | (29,320 | ) | | (884 | ) | | (8,207 | ) |
| Inventory | | (3,848 | ) | | (5,753 | ) | | 5,600 |
|
| Prepaid and other assets | | 1,672 |
| | (1,105 | ) | | 4,668 |
|
| Settlement liabilities | | 17,159 |
| | 78,465 |
| | 99,245 |
|
| Accounts payable and accrued expenses | | (1,102 | ) | | (8,276 | ) | | 735 |
|
| Net cash provided by operating activities | | 294,286 |
|
| 96,259 |
|
| 131,899 |
|
| Cash flows from investing activities | | | | | | |
| Capital expenditures | | (103,031 | ) | | (96,490 | ) | | (80,741 | ) |
| Acquisitions, net of cash acquired | | — |
| | — |
| | (694 | ) |
| Proceeds from sale of fixed assets | | 237 |
| | 10 |
| | 4,599 |
|
| Placement fee agreements | | (20,556 | ) | | (13,300 | ) | | (11,312 | ) |
| Net cash used in investing activities | | (123,350 | ) |
| (109,780 | ) |
| (88,148 | ) |
| Cash flows from financing activities | | | | | | |
| Proceeds from new credit facility | | — |
| | 820,000 |
| | — |
|
| Proceeds from unsecured notes | | — |
| | 375,000 |
| | — |
|
| Repayments of prior credit facility | | — |
| | (465,600 | ) | | (24,400 | ) |
| Repayments of secured notes | | — |
| | (335,000 | ) | | — |
|
| Repayments of unsecured notes | | — |
| | (350,000 | ) | | — |
|
| Repayments of new credit facility | | (8,200 | ) | | (4,100 | ) | | — |
|
| Debt issuance costs and discounts | | (1,276 | ) | | (28,702 | ) | | (480 | ) |
| Proceeds from exercise of stock options | | 9,610 |
| | 10,906 |
| | — |
|
| Purchase of treasury stock | | (123 | ) | | (110 | ) | | (42 | ) |
| Net cash provided by (used in) financing activities | | 11 |
| | 22,394 |
| | (24,922 | ) |
| Effect of exchange rates on cash | | (1,370 | ) | | 1,292 |
| | (1,714 | ) |
| Cash, cash equivalents and restricted cash | | | | | | |
| Net increase for the period | | 169,577 |
| | 10,165 |
| | 17,115 |
|
| Balance, beginning of the period | | 129,604 |
| | 119,439 |
| | 102,324 |
|
| Balance, end of the period | | $ | 299,181 |
|
| $ | 129,604 |
|
| $ | 119,439 |
|
See notes to consolidated financial statements.
66
|
| | | | | | | | | | | | |
| | | Year Ended December 31, |
| | | 2018 | | 2017 | | 2016 |
| Supplemental cash disclosures | | | | | | |
| Cash paid for interest | | $ | 81,609 |
| | $ | 89,008 |
| | $ | 93,420 |
|
| Cash paid for income tax | | 406 |
| | 1,009 |
| | 1,703 |
|
| Cash refunded for income tax | | 4 |
| | 829 |
| | 171 |
|
| Supplemental non-cash disclosures | | |
| | |
| | |
|
| Accrued and unpaid capital expenditures | | $ | 3,657 |
| | $ | 1,386 |
| | $ | 2,104 |
|
| Accrued and unpaid placement fees added during the year | | — |
| | 39,074 |
| | — |
|
| Accrued and unpaid contingent liability for acquisitions | | (550 | ) | | — |
| | (3,169 | ) |
| Transfer of leased gaming equipment to inventory | | 10,028 |
| | 7,820 |
| | 9,042 |
|
| | Year Ended December 31, |
| | 2017 | | | 2016 | | | 2015 | | |
Supplemental cash disclosures | | | | | | | | | | | | | |
Cash paid for interest | | $ | 89,008 | | | $ | 93,420 | | | $ | 98,361 | | |
Cash paid for income tax | | | 1,009 | | | | 1,703 | | | | 2,098 | | |
Cash refunded for income tax | | | 829 | | | | 171 | | | | 14,477 | | |
Supplemental non-cash disclosures | | | | | | | | | | | | | |
Accrued and unpaid capital expenditures | | $ | 1,386 | | | $ | 2,104 | | | $ | 5,578 | | |
Accrued and unpaid placement fees | | | 39,074 | | | | — | | | | — | | |
Accrued and unpaid contingent liability for acquisitions | | | — | | | | (3,169 | ) | | | 4,681 | | |
Transfer of leased gaming equipment to inventory | | | 7,820 | | | | 9,042 | | | | 4,698 | | |
Issuance of warrant | | | — | | | | — | | | | 2,246 | | |
67
EVERI HOLDINGS INC. AND SUBSIDIARIES
CONSOLIDATED STATEMENTS OF STOCKHOLDERS’
(DEFICIT) EQUITY
(DEFICIT)
| | Common Stock— | | | | | | | | | | | Accumulated | | | | | | | | | |
| | Series A | | | Additional | | | Retained | | | Other | | | | | | | Total | |
| | Number of | | | | | | | Paid-in | | | Earnings | | | Comprehensive | | | Treasury | | | (Deficit) | |
| | Shares | | | Amount | | | Capital | | | (Deficit) | | | Income (Loss) | | | Stock | | | Equity | |
Balance, December 31, 2014 | | | 90,405 | | | $ | 90 | | | $ | 245,682 | | | $ | 160,152 | | | $ | 1,569 | | | $ | (176,020 | ) | | $ | 231,473 | |
Net loss | | | — | | | | — | | | | — | | | | (104,972 | ) | | | — | | | | — | | | | (104,972 | ) |
Foreign currency translation | | | — | | | | — | | | | — | | | | — | | | | (1,251 | ) | | | — | | | | (1,251 | ) |
Stock-based compensation expense | | | — | | | | — | | | | 8,258 | | | | — | | | | — | | | | — | | | | 8,258 | |
Exercise of options | | | 343 | | | | 1 | | | | 1,834 | | | | — | | | | — | | | | — | | | | 1,835 | |
Restricted share vesting withholdings | | | — | | | | — | | | | — | | | | — | | | | — | | | | (169 | ) | | | (169 | ) |
Restricted shares | | | 129 | | | | — | | | | — | | | | — | | | | — | | | | — | | | | — | |
Issuance of warrants | | | — | | | | — | | | | 2,246 | | | | — | | | | — | | | | — | | | | 2,246 | |
Balance, December 31, 2015 | | | 90,877 | | | $ | 91 | | | $ | 258,020 | | | $ | 55,180 | | | $ | 318 | | | $ | (176,189 | ) | | $ | 137,420 | |
Net loss | | | — | | | | — | | | | — | | | | (249,479 | ) | | | — | | | | — | | | | (249,479 | ) |
Foreign currency translation | | | — | | | | — | | | | — | | | | — | | | | (2,427 | ) | | | — | | | | (2,427 | ) |
Stock-based compensation expense | | | — | | | | — | | | | 6,735 | | | | — | | | | — | | | | — | | | | 6,735 | |
Restricted share vesting withholdings | | | — | | | | — | | | | — | | | | — | | | | — | | | | (42 | ) | | | (42 | ) |
Restricted shares | | | 75 | | | | — | | | | — | | | | — | | | | — | | | | — | | | | — | |
Balance, December 31, 2016 | | | 90,952 | | | $ | 91 | | | $ | 264,755 | | | $ | (194,299 | ) | | $ | (2,109 | ) | | $ | (176,231 | ) | | $ | (107,793 | ) |
Net loss | | | — | | | | — | | | | — | | | | (51,903 | ) | | | — | | | | — | | | | (51,903 | ) |
Foreign currency translation | | | — | | | | — | | | | — | | | | — | | | | 1,856 | | | | — | | | | 1,856 | |
Stock-based compensation expense | | | — | | | | — | | | | 6,411 | | | | — | | | | — | | | | — | | | | 6,411 | |
Exercise of options | | | 2,037 | | | | 2 | | | | 10,904 | | | | — | | | | — | | | | — | | | | 10,906 | |
Restricted share vesting withholdings | | | — | | | | — | | | | — | | | | — | | | | — | | | | (110 | ) | | | (110 | ) |
Restricted shares | | | 131 | | | | — | | | | — | | | | — | | | | — | | | | — | | | | — | |
Balance, December 31, 2017 | | | 93,120 | | | $ | 93 | | | $ | 282,070 | | | $ | (246,202 | ) | | $ | (253 | ) | | $ | (176,341 | ) | | $ | (140,633 | ) |
|
| | | | | | | | | | | | | | | | | | | | | | | | | | | |
| | | Common Stock— Series A | | Additional | | Retained Earnings | | Accumulated Other | | | | Total |
| | | Number of Shares | | Amount | | Paid-in Capital | | (Accumulated Deficit) | | Comprehensive Income (Loss) | | Treasury Stock | | Equity (Deficit)
|
| Balance, January 1, 2016 | | 90,877 |
| | $ | 91 |
| | $ | 258,020 |
| | $ | 55,180 |
| | $ | 318 |
| | $ | (176,189 | ) | | $ | 137,420 |
|
| Net loss | | — |
| | — |
| | — |
| | (249,479 | ) | | — |
| | — |
| | (249,479 | ) |
| Foreign currency translation | | — |
| | — |
| | — |
| | — |
| | (2,427 | ) | | — |
| | (2,427 | ) |
| Stock-based compensation expense | | — |
| | — |
| | 6,735 |
| | — |
| | — |
| | — |
| | 6,735 |
|
| Restricted share vesting withholdings | | — |
| | — |
| | — |
| | — |
| | — |
| | (42 | ) | | (42 | ) |
| Restricted shares | | 75 |
| | — |
| | — |
| | — |
| | — |
| | — |
| | — |
|
| Balance, December 31, 2016 | | 90,952 |
|
| $ | 91 |
|
| $ | 264,755 |
|
| $ | (194,299 | ) |
| $ | (2,109 | ) |
| $ | (176,231 | ) | | $ | (107,793 | ) |
| Net loss | | — |
| | — |
| | — |
| | (51,903 | ) | | — |
| | — |
| | (51,903 | ) |
| Foreign currency translation | | — |
| | — |
| | — |
| | — |
| | 1,856 |
| | — |
| | 1,856 |
|
| Stock-based compensation expense | | — |
| | — |
| | 6,411 |
| | — |
| | — |
| | — |
| | 6,411 |
|
| Exercise of options | | 2,037 |
| | 2 |
| | 10,904 |
| | — |
| | — |
| | — |
| | 10,906 |
|
| Restricted share vesting withholdings | | — |
| | — |
| | — |
| | — |
| | — |
| | (110 | ) | | (110 | ) |
| Restricted shares | | 131 |
| | — |
| | — |
| | — |
| | — |
| | — |
| | — |
|
| Balance, December 31, 2017 | | 93,120 |
|
| $ | 93 |
|
| $ | 282,070 |
|
| $ | (246,202 | ) |
| $ | (253 | ) |
| $ | (176,341 | ) | | $ | (140,633 | ) |
| Net income | | — |
| | — |
| | — |
| | 12,356 |
| | — |
| | — |
| | 12,356 |
|
| Cumulative adjustment related to adoption of ASC 606 | | — |
| | — |
| | — |
| | 4,389 |
| | — |
| | — |
| | 4,389 |
|
| Foreign currency translation | | — |
| | — |
| | — |
| | — |
| | (1,745 | ) | | — |
| | (1,745 | ) |
| Stock-based compensation expense | | — |
| | — |
| | 7,251 |
| | — |
| | — |
| | — |
| | 7,251 |
|
| Exercise of options | | 1,980 |
| | 2 |
| | 9,608 |
| | — |
| | — |
| | — |
| | 9,610 |
|
| Restricted share vesting withholdings | | — |
| | — |
| | — |
| | — |
| | — |
| | (123 | ) | | (123 | ) |
| Balance, December 31, 2018 | | 95,100 |
|
| $ | 95 |
|
| $ | 298,929 |
|
| $ | (229,457 | ) |
| $ | (1,998 | ) |
| $ | (176,464 | ) | | $ | (108,895 | ) |
See notes to consolidated financial statements.
68
EVERI HOLDINGS INC. AND SUBSIDIARIES
NOTES TO CONSOLIDATED FINANCIAL STATEMENTS
In this filing, we refer to: (i) our audited consolidated financial statements and notes thereto as our “Financial Statements;” (ii) our audited Consolidated Statements of
LossIncome (Loss) and Comprehensive
LossIncome (Loss) as our “Statements of
Loss;Income (Loss);” and (iii) our audited Consolidated Balance Sheets as our “Balance Sheets.”
Everi Holdings Inc. (“Everi Holdings,”
“Holdings”“Holdings,” or “Everi”) is a holding company, the assets of which are the issued and outstanding shares of capital stock of each of Everi Games Holding Inc. (“Everi Games Holding”), which owns all of the issued and outstanding shares of capital stock of Everi Games Inc. (“Everi Games” or “Games”)
, and Everi Payments Inc. (“Everi Payments”
or “Payments”). Unless otherwise indicated, the terms the “Company,” “we,”
“us”“us,” and “our” refer to
Everi Holdings together with its consolidated subsidiaries.
Everi is a leading supplier of technology solutions for the casino gaming industry.
The Company providesWe provide casino operators with a diverse portfolio of products including innovative gaming machines that power the casino floor, and casino operational and management systems that include comprehensive end-to-end payments solutions, critical intelligence offerings, and gaming operations efficiency
technology.technologies.
Everi Holdings reports its results of operations based on two operating segments: Games and FinTech. Effective April 1, 2018, we changed the name of the operating segment previously referred to as “Payments” to “Financial Technology Solutions” (“Everi FinTech” or “FinTech”). We believe this reference more accurately reflects the focus of the business segment on delivering innovative and integrated solutions to enhance the efficiency of the casino operator, support the comprehensive regulatory and tax requirements of their gaming customers, and improve players’ gaming experience by providing easy access to their funds and payment of winnings.
Everi Games provides a number ofgaming operators products and services, for casinos, includingincluding: (a) gaming machines primarily comprised primarily of Class II and Class III slot machines placed under participation or fixed fee lease arrangements or sold to casino customers, including the award-winning TournEvent®; andTournEvent® that allows operators to switch from in-revenue gaming to out-of-revenue tournaments; (b) system software, licenses, ancillary equipment, and maintenance to its casino customers.maintenance; and (c) business-to-consumer and business-to-business interactive activities. In addition, Everi Games also develops and manages the central determinant system for the VLTsvideo lottery terminals (“VLTs”) installed in the State of New York.York and it also provides similar technology in certain tribal jurisdictions.
Everi
PaymentsFinTech provides
its casino customersgaming operators cash access and related products and services, including: (a) access to cash at gaming facilities via Automated Teller Machine (“ATM”) cash withdrawals, credit card cash access transactions, point of sale (“POS”) debit card
cash access transactions, and check verification and warranty services; (b)
fully integrated gaming industry kiosksequipment that
provideprovides cash access and
relatedefficiency-related services; (c) products and services that improve credit decision making, automate cashier operations, and enhance patron marketing activities for gaming establishments; (d) compliance, audit, and data solutions; and (e) online payment processing solutions for gaming operators in states that offer intrastate,
internet-basedInternet-based gaming, and lottery activities.
2. BASIS OF PRESENTATION AND SUMMARY OF SIGNIFICANT ACCOUNTING POLICIES
Principles of Consolidation
All intercompany transactions and balances have been eliminated in consolidation.
We apply the provisions of the Financial Accounting Standards Board (the “FASB”) Accounting Standards Codification (“ASC”) 805, “Business
Combinations”,Combinations,” in the accounting for acquisitions. It requires us to recognize separately from goodwill the assets acquired and the liabilities assumed, at their acquisition date fair values. Goodwill as of the acquisition date is measured as the excess of consideration transferred over the net of the acquisition date fair values of the assets acquired and the liabilities assumed. Significant estimates and assumptions are required to value assets acquired and liabilities assumed at the acquisition date as well as contingent consideration, where applicable. These estimates are preliminary and typically include the calculation of an appropriate discount rate and projection of the cash flows associated with each acquired asset over its estimated useful life. As a result, during the measurement period, which may be up to one year from the acquisition date, the Company may record adjustments to the assets acquired and liabilities assumed with the corresponding offset to goodwill. In addition, deferred tax assets, deferred tax liabilities, uncertain tax positions, and tax related valuation allowances assumed in connection with a business combination are initially estimated as of the acquisition date. We reevaluate these items quarterly based upon facts and circumstances that existed as of the acquisition date and any
69
adjustments to its preliminary estimates are recorded to goodwill, in the period of
identification, if identified within the measurement period. Upon the conclusion of the measurement period or final determination of the values of assets acquired or liabilities assumed, whichever comes first, any subsequent adjustments are recorded to the Statements of
Loss.Acquisition-related Costs
We recognize a liability for acquisition-related costs when the expense is incurred. Acquisition-related costs include, but are not limited to: financial advisory, legal and debt fees; accounting, consulting, and professional fees associated with due diligence, valuation and integration; severance; and other related costs and adjustments.
Income (Loss).
Cash and Cash Equivalents
Cash and cash equivalents include cash and
all balances on deposit in banks and financial institutions. We consider
all highly liquid investments with maturities of three months or less at the time of purchase to be cash and cash equivalents. Such balances generally exceed the federal insurance
limits. However,limits, however, we periodically evaluate the creditworthiness of these institutions to minimize risk.
We obtain all of the cash required to operate our ATMs through various ATM Funding Agreements. Some gaming establishments provide the cash utilized within the ATM (“Site‑Funded”). The Site‑Funded receivables generated for the amount of cash dispensed from transactions performed at our ATMs are owned by us and we are liable to the gaming establishment for the face amount of the cash dispensed. In
theour Balance Sheets, the amount of the receivable for transactions processed on these ATM transactions is included within settlement receivables and the amount due to the gaming establishment for the face amount of dispensing transactions is included within settlement liabilities.
For the
Non‑non‑Site‑Funded locations,
our Contract Cash Solutions Agreementwe enter into commercial arrangements with
Wells Fargo allows us to use funds owned by Wells Fargothird party vendors to provide
us the currency needed for normal operating requirements for our ATMs. For the use of these funds, we pay
Wells Fargo a cash usage fee
onbased upon the
average daily balance oftarget federal funds
utilized multiplied by a contractually defined cash usage rate. Under
this agreement, allthese agreements, the currency supplied by
Wells Fargothe third party vendors remains the sole property of
Wells Fargo at all timesthese suppliers until
itcash is dispensed, at which time
Wells Fargo obtainsthe third party vendors obtain an interest in the corresponding settlement receivable. As the cash is
never an asset of
ours, supplied cashthese suppliers, it is
therefore not reflected on our
balance sheet. We are charged a cashBalance Sheets. The usage fee for the cash
usedsupplied in these ATMs
which is included as interest expense in the Statements of
Loss. We recognize theIncome (Loss). Our rationale to record cash usage fees as interest expense
is primarily due to the similar operational characteristics to a revolving line of credit, the fact that the fees are calculated on a financial index, and the fees are paid for access to a capital resource.
Allowance for Doubtful Accounts
We maintain an allowance for doubtful accounts related to our trade and other receivables and notes receivable that have been deemed to have a high risk of
uncollectibility.uncollectibility or for which uncertainty exists as to whether the account balance has become uncollectible. Management reviews its accounts and notes receivable on a quarterly basis to determine if any receivables will potentially be uncollectible. Management analyzes historical collection trends and changes in our customer payment patterns,
customer concentration, and creditworthiness when evaluating the adequacy of our allowance for doubtful accounts.
In our overall allowance for doubtful accounts we include any receivable balances for which uncertainty exists as to whether the account balance has become uncollectible. Based on the information available, management believes the allowance for doubtful accounts is adequate; however, actual write-offs may exceed the recorded allowance.
Settlement Receivables and Settlement Liabilities
In the credit card
We provide cash settlement services to gaming establishments related to our cash access
and POS debit card cash access transactions provided by us,services, which involve the
gaming establishment is reimbursed for the cash disbursed to gaming patrons through the issuancemovement of
a negotiable instrument or through electronic settlement.funds between various parties involved in these types of transactions. We receive reimbursement from the patron’s credit or debit card
issuerissuing financial institution for
the transaction in an amount equal to the amount owed to the gaming establishment plus the fee charged to the patron.
This70
reimbursement is included withinThese activities result in amounts due to us at the end of each business day that we generally recover over the next few business days, which are classified as settlement receivables on theour Balance Sheets. TheIn addition, cash settlement services result in amounts oweddue to gaming establishments for the cash disbursed to patrons through the issuance of a negotiable instrument or through electronic settlement for the face amount provided to patrons that we generally remit over the next few business days, which are included withinclassified as settlement liabilities on theour Balance Sheets.
If a gaming establishment chooses to have a check warranted, it sends a request to our
third partythird-party check warranty service provider, asking whether it would be willing to accept the risk of cashing the check. If the check warranty provider accepts the risk and warrants the check, the gaming establishment negotiates the patron’s check by providing cash for the face amount of the check. If the check is dishonored by the patron’s bank upon presentment, the gaming establishment invokes the warranty, and the check warranty service provider purchases the check from the gaming establishment for the full check amount and then pursues collection activities on its own. In our Central Credit Check Warranty product under our agreement with the
third partythird-party service provider, we receive all of the check warranty revenue. We are exposed to risk for the losses associated with any warranted items that cannot be collected from patrons issuing the items. Warranty receivables are defined as any amounts paid by the
third partythird-party check warranty service provider to gaming establishments to purchase dishonored checks. Additionally, we pay a fee to the
third partythird-party check warranty service provider for its services.
The warranty receivables amount is recorded in trade
and other receivables, net on our Balance Sheets. On a monthly basis, the Company evaluates the collectability of the outstanding balances and establishes a reserve for the face amount of the expected losses on these receivables. The warranty expense associated with this reserve is included within cost of revenues (exclusive of depreciation and amortization) on our Statements of
Loss.Income (Loss).
Our inventory primarily consists of component parts as well as finished goods and work-in-progress. The cost of inventory includes cost of materials, labor, overhead and freight. The inventory is stated at the lower of cost or net realizable value and accounted for using the first in, first out method (“FIFO”).
Restricted Cash
Our restricted cash primarily consists of: (i) deposits held in connection with a sponsorship agreement; (ii) WAP-related restricted funds; and (iii) Internet-related cash access activities. The current portion of restricted cash, which is included in prepaid expenses and other assets, was approximately $1.5 million, $0.9 million, and $0.3 million as of December 31, 2018, 2017, and 2016, respectively. The non-current portion of restricted cash, which is included in other assets, was approximately $0.1 million as of December 31, 2018, 2017, and 2016.
Property, Equipment and Leased Assets
Property, equipment and leased assets are stated at cost, less accumulated depreciation, and are computed using the straight-line method over the lesser of the estimated life of the related assets, generally two to five years, or the related lease term. Player terminals and related components and equipment are included in our rental pool. The rental pool can be further delineated as “rental pool – deployed,” which consists of assets deployed at customer sites under participation arrangements, and “rental pool – undeployed,” which consists of assets held by us that are available for customer use. Rental pool – undeployed consists of both new units awaiting deployment to a customer site and previously deployed units currently back with us to be refurbished awaiting re-deployment. Routine maintenance of property, equipment and leased gaming equipment is expensed in the period incurred, while major component upgrades are capitalized and depreciated over the estimated remaining useful life of the component. Sales and retirements of depreciable property are recorded by removing the related cost and accumulated depreciation from the accounts. Gains or losses on sales and retirements of property are reflected in our Statements of
Loss.Income (Loss). Property, equipment and leased assets are reviewed for impairment whenever events or circumstances indicate that their carrying amounts may not be recoverable. Impairment is indicated when
undiscounted future cash flows,
on an undiscounted basis, do not exceed the
asset’s carrying
value.Development and value of the asset.
Placement Fee
and Development Agreements
We enter into
developmentplacement fee and,
placement feeto a certain extent, development agreements to provide financing for
new gaming facilities or for the expansion of existing
facilities, or for new gaming facilities.
All or a portion of theFunds provided under placement fee agreements are not reimbursed, while funds provided under development agreements are reimbursed to us,
while funds provided under placement fee agreements are not reimbursed.in whole, or in part. In return, the facility dedicates a percentage of its floor space to placement of our player terminals, and we receive a fixed percentage of those player
terminals'terminals’ hold
amounts per day over the term of the agreement, which is generally
forfrom 12 to 83 months. Certain of the agreements contain player terminal performance standards that could allow the facility to reduce a portion of our guaranteed floor space. In addition, certain development agreements allow the facilities to buy out floor space after advances that are subject to repayment have been repaid. The agreements typically provide for a portion of the
71
amounts retained by the gaming facility for their share of the operating profits of the facility to be used to repay some or all of the advances recorded as notes receivable.
Goodwill represents the excess of the purchase price over the identifiable tangible and intangible assets acquired plus liabilities assumed arising from business combinations. We test for impairment annually on a reporting unit basis, at the beginning of our fourth fiscal quarter, or more often under certain circumstances. The annual impairment test is completed using either: a qualitative “Step 0” assessment based on reviewing relevant events and circumstances; or a quantitative “Step 1” assessment, which determines the fair value of the reporting unit, using
both an income approach that discounts future cash flows based on the estimated future results of our reporting units and a market approach that compares market multiples of comparable companies to determine whether or not any impairment exists. If the fair value of a reporting unit is less than its carrying amount, we will use the “Step 1” assessment to determine the impairment, in accordance with
the adoption of ASU No 2017-04.ASC 350, Intangibles - Goodwill and Other.
Our reporting units are identified as operating segments or one level below. Reporting units must: (a) engage in business activities from which they earn revenues and incur expenses; (b) have operating results that are regularly reviewed by our segment management to ascertain the resources to be allocated to the segment and assess its performance; and (c) have discrete financial
information available. As of December 31, 2017,2018, our reporting units included: Games, Cash Access Services, Kiosk Sales and Service, Central Credit Services, and Compliance Sales and Services. During the year ended December 31, 2016, the Company combined its Cash Advance, ATM and Check Services reporting units into a Cash Access reporting unit to be consistent with the current corporate structure and segment management. Other intangible assets are stated at cost, less accumulated amortization, and are computed primarily using the straight-line method. Other intangible assets consist primarily of: (i) customer contracts (rights to provide Games and
PaymentsFinTech services to gaming establishment customers), developed technology, trade names and trademarks, and contract rights acquired through business combinations;
and (ii) capitalized software development
costs; and (iii) the acquisition cost of our patent related to the 3-in-1 rollover technology acquired in 2005.costs. Customer contracts require us to make renewal assumptions, which impact the estimated useful lives of such assets. Capitalized software development costs require us to make certain judgments as to the stages of development and costs eligible for capitalization. Capitalized software costs placed in service are amortized over their useful lives, generally not to exceed five years.
The acquisition cost of the 3-in-1 Rollover patent is being amortized over the term of the patent, which expires in 2018. We review intangible assets whenever events or changes in circumstances indicate that the carrying amount of an asset may not be recoverable. Such events or circumstances include, but are not limited to, a significant decrease in the fair value of the underlying business or market price of the asset, a significant adverse change in legal factors or business climate that could affect the value of an asset, or a current period operating or cash flow loss combined with a history of operating or cash flow losses. We group intangible assets for impairment analysis at the lowest level for which identifiable cash flows are largely independent of the cash flows of other assets and liabilities. Recoverability of
definite lived intangible assets is measured by a comparison of the carrying amount of the asset to future net cash flows expected to be generated by the asset,
on an undiscounted
basis and without interest or taxes. Any impairment to be recognized is measured by the amount by which the carrying amount of the assets exceeds the fair value of the assets.
Debt issuance costs incurred in connection with long-term borrowings are capitalized and amortized to interest expense based upon the related debt agreements using the straight-line method, which approximates the effective interest method. Debt issuance costs related to line-of-credit arrangements are included in other assets, non-current, on
theour Balance Sheets. All other debt issuance costs are included as contra-liabilities in long-term debt.
72
Original issue discounts incurred in connection with long-term borrowings are capitalized and amortized to interest expense based upon the related debt agreements using the straight-line method, which approximates the effective interest method. These amounts are recorded as contra-liabilities and included in long-term debt on
theour Balance Sheets.
Deferred
Revenue
Deferred Recognition
Overview
We evaluate the recognition of revenue
represents amounts frombased on the
sale of fully integrated kioskscriteria set forth in ASC 606 and
related service contracts, anti-money laundering and tax compliance software, and gaming equipment and systems that have been billed, or for which notes receivable have been executed, but which transaction has not met our revenue recognition criteria. The cost of the fully integrated kiosks and related service contracts, anti-money laundering and tax compliance software, and gaming equipment and systems is deferred and recorded at the time revenue is recognized. Amounts are classified between current and long-term liabilities, based upon the expected period in which the revenue will be recognized.Revenue Recognition
Overall
ASC 840, as appropriate. We recognize revenue when evidenceupon transferring control of an arrangement exists, services have been rendered, the price is fixed or determinable and collectability is reasonably assured. We evaluate our revenue streams for proper timing of revenue recognition. Revenue is recognized as products are delivered andgoods or services are performed.
For sales arrangements with multiple deliverables, we apply the guidance from ASC 605-25, “Revenue Recognition - Multiple-Element Arrangements.” In addition, we apply the guidance from ASC 985-605, “Software – Revenue Recognition” which affects vendors that sell or lease tangible productsto our customers in an arrangementamount that contains softwarereflects the consideration we expect to receive in exchange for those goods or services. We enter into contracts with customers that is more than incidental toinclude various performance obligations consisting of goods, services, or combinations of goods and services. Timing of the tangible product as a whole and clarifies what guidance should be used in allocating and measuring revenue. In allocatingtransfer of control varies based on the arrangement fees to separate deliverables, we evaluate whether we have vendor-specific objective evidence (“VSOE”)nature of selling price, third party evidence (“TPE”) or estimatethe contract. We recognize revenue net of selling price (“ESP”) for gaming devices, maintenance and product support fees and other revenue sources. We generally use ESP to determine the selling price used in the allocation of separate deliverables, as VSOE and TPE are generally not available. We determine the ESP on separate deliverables by estimating a margin typically received on such items and applying that margin to the product cost incurred.
Sales taxesany sales and other taxes collected from customers, on behalf ofwhich are subsequently remitted to governmental authorities are accounted for on a net basis and are not included in revenues or operating expenses.
We measure revenue based on the consideration specified in a contract with a customer and adjusted, as necessary.
We evaluate the composition of our revenues to ensure compliance with SEC Regulation S-X Section 210.5-3, which requires us to separately present certain categories of revenues that exceed the quantitative threshold on our Statements of Income (Loss).
Significant Judgments
We apply judgments or estimates to determine the performance obligations and the Stand-Alone Selling Price (“SSP”) of each identified performance obligation. The establishment of SSP requires judgment as to whether there is a sufficient quantity of items sold or renewed on a stand-alone basis and those prices demonstrate an appropriate level of concentration to conclude that a SSP exists. The SSP of our goods and services are generally determined based on observable prices, an adjusted market assessment approach or an expected cost plus margin approach. We utilize a residual approach only when the SSP for performance obligations with observable prices have been established and the remaining performance obligation in the contract with a customer does not have an observable price as it is uncertain or highly variable and, therefore, is not discernible.
Collectability
To assess collectability, we determine whether it is probable that we will collect substantially all of the consideration to which we are entitled in exchange for the goods and services transferred to the customer in accordance with the terms and conditions of the contract. In connection with these procedures, we evaluate the customer using internal and external information available, including, but not limited to, research and analysis of the credit history with the customer. Based on the nature of our transactions and historical trends, we determine whether our customers have the ability and intention to pay the amounts of consideration when they become due to identify potentially significant credit risk exposure.
Contract Combinations - Multiple Promised Goods and Services
Our contracts may include various performance obligations for promises to transfer multiple goods and services to a customer, especially since our Games and FinTech businesses may enter into multiple agreements with the same customer that meet the criteria to be combined for accounting purposes under ASC 606. When this occurs, a SSP will be determined for each performance obligation in the combined arrangement and the consideration allocated between the respective performance obligations. We use our judgment to analyze the nature of the promises made and determine whether each is distinct or should be combined with other promises in the contract based on the level of integration and interdependency between the individual deliverables.
Disaggregation of Revenues
We disaggregate revenues based on the nature and timing of the cash flows generated by such revenues as presented in “Note 18 - Segment Information.”
Outbound Freight Costs
Upon transferring control of a good to a customer, the shipping and handling costs in connection with sale transactions are accounted for as fulfillment costs and included in cost of revenues.
Costs to Acquire a Contract with a Customer
We typically incur incremental costs to acquire customer contracts in the form of sales commission expenses. We evaluate those acquisition costs for groups of contracts with similar characteristics, based on the nature of the transactions. The incremental costs to acquire customer contracts identified would be amortized within one year and, as a result, we elected to utilize the practical expedient set forth in ASC 340-40, Contract Costs - Incremental Costs of Obtaining a Contract to expense these amounts as incurred.
Contract Balances
Since our contracts may include multiple performance obligations, there is often a timing difference between the cash collections and the satisfaction of such performance obligations and revenue recognition. Such arrangements are evaluated to determine whether contract assets and liabilities exist. We generally record contract assets when the timing of cash collections differs from when revenue is recognized due to contracts containing specific performance obligations that are required to be met prior to a customer being billed. We generally record contract liabilities when cash is collected in advance of us satisfying performance obligations, including those that are satisfied over a period of time.
The following table summarizes our contract assets and contract liabilities arising from contracts with customers: |
| | | | |
| | | For the Year Ended |
| | | December 31, 2018 |
| | | |
Contract assets(1) | | |
| Balance at January 1 | | $ | 8,433 |
|
| Balance at December 31 | | 11,310 |
|
| Increase (decrease) | | 2,877 |
|
| | | |
Contract liabilities(2) | | |
| Balance at January 1 | | 12,397 |
|
| Balance at December 31 | | 15,470 |
|
| Increase (decrease) | | $ | 3,073 |
|
(1) Current portion of contract assets is included within Trade and other receivables, net and non-current portion is included within Other receivables in our Balance Sheets.
(2) Current portion of contract liabilities is included within Accounts payable and accrued expenses and non-current portion is included within Other accrued expenses and liabilities in our Balance Sheets.
We recognized approximately $11.4 million in revenue that was included in the beginning contract liability balance during 2018.
Our Games products and services include commercial products, such as Native American Class II products and other bingo products, Class III products, video lottery terminals, accounting and central determinant systems, and other back office systems. We conduct our Games segment business based on results generated from the following major revenue streams: (i) Gaming Operations; (ii) Gaming Equipment and Systems; and (iii) Gaming Other.
Gaming Operations
Games revenues are primarily generated by our gaming operations under development, placement, participation, and participationdevelopment arrangements, in which we provide our customers with player terminals, including TournEvent® that allows operators to switch from in-revenue gaming to out-of-revenue tournaments, player terminal-content licenses, central determinate systems for devices placed in service in licensed jurisdictionslocal-area progressive machines, and back-office equipment, collectively referred to herein as leased gaming equipment. We evaluate the recognition of lease revenues based on criteria set forth in ASC 840. Generally, under these arrangements, we retain ownership of the leased gaming equipmentmachines installed at customer facilities and wefacilities. We receive recurring revenue based on a percentage of the net win per day generated by the leased gaming equipment or a fixed daily fee based on the number of player terminals installed at the facility. Revenuefee. Revenues from lease participation or daily fee arrangements are considered both realizable and earned at the end of each gaming day. Gaming operations revenues generated by leased gaming equipment deployed at sites under development or placement fee agreements are reduced by the accretion ofgive rise to contract rights, acquired in connection with those agreements. Contract rightswhich are amounts allocatedrecorded to intangible assets for dedicated floor space resulting from such agreements, described under “Development and Placement Fee Agreements.”agreements. The related amortization expense, orgaming operations revenues generated by these arrangements are reduced by the accretion of contract rights, iswhich represents the related amortization of the contract rights recorded in connection with those agreements. Gaming operations lease revenues accounted for under ASC 840 are generally short-term in nature with payment terms ranging from 30 to 90 days. We recognized $136.6 million, $126.1 million, and $134.0 million in lease revenues for the years ended December 31, 2018, 2017, and 2016, respectively.
Gaming operations revenues include amounts generated by Wide Area Progressive (“WAP”) systems, which are recognized under ASC 606. WAP consists of linked slot machines located in multiple casino properties that are connected to a central system. WAP-based gaming machines have a progressive jackpot we administer that increases with every wager until a player wins the top award combination. Casino operators pay us a percentage of the coin-in (the total amount wagered), a percentage of net
againstwin, or a combination of both for services related to the
respective revenue categorydesign, assembly, installation, operation, maintenance, administration, and marketing of the WAP systems. The gaming operations revenues with respect to WAP machines comprise a separate performance obligation and are recognized over time based on the amount expected to be received with any variability being resolved in the reporting period. These arrangements are generally short-term in nature with a majority of invoices payable within 30 to 45 days. Such revenues are presented in the Statements of
Loss.73
In addition,Income (Loss) net of the jackpot expense, which is comprised of incremental amounts funded by a portion of the coin-in from players. At the time a jackpot is won by a player, an additional jackpot expense is recorded
with respect to the base seed amount required to fund the minimum level required by the respective WAP arrangement with the casino operator.
Gaming operations revenues also include amounts received in connection with our relationship with the New York State Gaming Commission to provide an accounting and central determinant system for the VLTs in operation at licensed State of New York gaming facilities. Pursuant to our agreement with the New York State Gaming Commission, we sell gaming equipmentreceive a portion of the network-wide net win (generally, cash-in less prizes paid) per day in exchange for provision and maintenance of the central determinant system and records it in accordance with ASC 606. We also provide central determinant system technology to Native American tribes in other licensed jurisdictions for which we receive a portion of the revenue generated from the VLTs connected to the system. These arrangements are generally short-term in nature with payments due monthly.
Gaming operations revenues also include amounts generated by our Interactive offering comprised of business-to-consumer (“B2C”) and business-to-business (“B2B”) activities. B2C relates to games offered directly to
consumers to play with virtual currency which can be purchased through our
customers under sales contractssocial, mobile application. Control transfers and we recognize revenues in accordance with ASC 606 from player purchases of virtual currency as it is consumed for game play, which is based on
standard credit terms,a historical data analysis. B2B relates to games offered to the online business partners, or
may grant extended credit terms under sales contracts secured bysocial casinos, who then offer the
related equipment.Other Games revenuesgames to consumers. Our B2B arrangements primarily consist ofprovide access to our TournEvent of Champions® national tournament offering.
Generally, player terminal sales include ancillary equipment,game content and revenue is recognized in accordance with ASC 606 as the control transfers upon the online business partners’ daily access to such as networking gear, bases, chairs, and occasionally signage, some of which may be necessary for the full functionality of the player terminals incontent based on either a casino. This ancillary equipment comprises an install kit that is shipped simultaneouslyflat fee or revenue share arrangements with the player terminals. Although our productssocial casinos.
Gaming Equipment and Systems
Gaming equipment and systems revenues are analyzed as multiple deliverable arrangements, revenueaccounted for the player terminalunder ASC 606 and ancillary equipment is not recognized until all elements essential for the functionality of the product have been shipped or delivered. This includes game theme software and essential ancillary equipment. If elements that are not essential to the functionality of the player terminals are shipped after the unit, such as signage, chairs, or bases, these items would be classified as deferred revenue until shipped or delivered.Revenue related to systems arrangements that contain both software and non-software deliverables requires allocation of the arrangement fee to the separate deliverables using the relative selling price method. Revenue for software deliverables is recognized under software revenue recognition guidance. Revenue resultingderived from the sale of non-software deliverables, such assome combination of: (a) gaming devicesequipment and other hardware,player terminals, including
TournEvent® that allows operators to switch from in-revenue gaming to out-of-revenue tournaments; (b) game content; (c) license fees; (d) ancillary equipment; and (e) maintenance. Such arrangements are accountedpredominately short-term in nature with payment terms ranging from 30 to 180 days with certain agreements providing for based on other applicable revenue recognition guidance as the devices are tangible products containing both software and non-softwareextended payment terms, ranging from 12 to 24 months. Our contracts with customers do not contain any financing components that function togetherhave been determined to deliverbe significant to the product's essential functionality.The majority of our multiple element sales contracts arecontract. Performance obligations for some combination ofgaming equipment and systems arrangements include gaming equipment, player terminals, content, system software, license fees, ancillary equipment, maintenance, or various combinations thereof. Gaming equipment and maintenance.
Paymentssystems are recognized at a point in time when control of the promised goods and services transfers to the customer generally upon shipment or delivery pursuant to the terms of the contract. The performance obligations are generally satisfied at the same time or within a short period of time.
Gaming Other
Gaming other revenues consist of amounts generated by our TournEvent of Champions® national tournament that allows winners of local and regional tournaments throughout the year to participate in a national tournament that results in the determination of a final champion. Such revenues are accounted for under ASC 606.As the customer simultaneously receives and consumes the benefits of our performance as it occurs, revenues are recognized as earned over a period of time using an output method depicting the transfer of control to the customer. These arrangements are generally short-term in nature with payment terms ranging from 30 to 90 days.
Cash Access Services
Cash access services revenues are accounted for under ASC 606 and are generally comprised of the following distinct performance obligations: cash advance, ATM, and check services. We do not control the cash advance and ATM services provided to a customer and, therefore, we are acting as an agent whose performance obligation is to arrange for the provision of these services. Our cash access services involve the movement of funds between the various parties associated with cash access transactions and give rise to settlement receivables and settlement liabilities, both of which are settled in days following the transaction.
Cash advance revenues are comprised of transaction fees assessed to gaming patrons in connection with credit card cash access and POS debit card cash access
transactions and are recognized at the time the transactions are authorized.transactions. Such fees are
primarily based on a combination of a fixed amount plus a percentage of the face amount of the credit card cash access or POS debit card cash access transaction amount.
In connection with these types of transactions, we report certain direct costs incurred as reductions to revenues on a net basis, which generally include: (i) commission expenses payable to casino operators; (ii) interchange fees payable to the network associations; and (iii) processing and related costs payable to other third party partners.
ATM revenues are primarily comprised of transaction fees in the form of cardholder surcharges assessed to gaming patrons in connection with ATM cash withdrawals at the time the transactions are authorized and reverse interchange fees paid to us by the
patrons’ issuing banks.
Cardholder surcharges and reverse interchange are recognized as revenue when a transaction is initiated. The cardholder surcharges assessed to gaming patrons in connection with ATM cash withdrawals are currently a fixed dollar amount and not a percentage of the transaction amount.
In connection with these types of transactions, we report certain direct costs incurred as reductions to revenues on a net basis, which generally include: (i) commission expenses payable to casino operators; (ii) interchange fees payable to the network associations; and (iii) processing and related costs payable to other third party partners.
Check services revenues are principally comprised of check warranty revenues and are generally based upon a percentage of the face amount of checks warranted. These fees are paid to us by gaming establishments.
Kiosk Sales
For cash access services arrangements, since the customer simultaneously receives and Servicesconsumes the benefits as the performance obligations occur, we recognize revenues as earned over a period of time using an output method depicting the transfer of control to the customer based on variable consideration, such as volume of transactions processed with variability generally resolved in the reporting period.
Equipment
Equipment revenues are derived from the sale of
cash access equipment and
certain other ancillary fees associated withare accounted for under ASC 606. Revenues are recognized at a point in time when control of the
sale, installationpromised goods and
maintenanceservices transfers to the customer generally upon shipment or delivery pursuant to the terms of
those offerings directly to our customers underthe contract. These sales contracts
on standard creditare generally short-term in nature with payment terms
or may grant extended credit terms under sales contracts secured by the related equipment.Complianceranging from 30 to 90 days.
Information Services and Other
Information services and other revenues
are accounted for under ASC 606 and include amounts derived
from: (i)from the sale
ofof: (i) software
licensing,licenses, software subscriptions, professional services and certain other ancillary fees; (ii)
Central Credit revenuesservice related fees associated with the sale, installation, and maintenance of equipment directly to our customers under contracts, which are generally short-term in nature with payment terms ranging from 30 to 90 days, secured by the related equipment; (iii) credit worthiness-related software subscription services that are based upon either a flat monthly unlimited usage fee or a variable fee structure driven by the volume of patron credit histories generated; and
(iii) fees generated from(iv) ancillary marketing, database, and
internet-basedInternet-based gaming
related activities.
The majority
Our software represents a functional right-to-use license and the revenues are recognized as earned at a point in time. Subscription services are recognized over a period of
our multiple element sales contractstime using an input method based on time elapsed as we transfer the control ratably by providing a stand-ready service. Professional and other services revenues are
for some combinationrecognized over a period of
cash accesstime using an input method based on time elapsed as services
fully integrated kiosks and related equipment, ancillary services and maintenance.74
are provided, thereby reflecting the transfer of control to the customer.
Cost of Revenues
(exclusive(Exclusive of
depreciationDepreciation and
amortization)Amortization)
The cost of revenues (exclusive of depreciation and amortization) represents the direct costs required to perform revenue generating transactions. The
principal costs included within cost of revenues (exclusive of depreciation and amortization) are
commissions paid to gaming establishments, interchange fees paid to credit and debit card networks, transaction processing fees to our transaction processor, inventory and related costs associated with the sale of our fully integrated kiosks, electronic gaming machines and system
sales,sale, check cashing warranties, field service, and network operations personnel.
Advertising, Marketing, and Promotional Costs
We expense advertising, marketing, and promotional costs as incurred. Total advertising, marketing, and promotional costs, included in operating expenses in the Statements of
Loss,Income (Loss), were
$3.4 million, $1.1 million,
$1.2 million and
$0.9$1.2 million for the years ended December 31,
2018, 2017,
and 2016,
and 2015, respectively.
Research and Development Costs
We conduct research and development activities primarily to develop gaming systems,
gaminggame engines, casino data management systems, casino central monitoring systems, video lottery outcome determination systems, gaming platforms and gaming content,
as well asand to
add enhancements toenhance our existing product lines. We believe our ability to deliver differentiated, appealing products and services to the marketplace is based on our research and development investments, and we expect to continue to make such investments in the future. Research and development costs consist primarily of salaries and benefits, consulting fees, and game lab testing fees. Once the technological feasibility of a project has been established, it is
transferred from research to development and capitalization of development costs beginscapitalized until
the product isit becomes available for general release.
Research and development costs were
$20.5 million, $18.9 million,
$19.4 million and
$19.1$19.4 million for the years ended December 31,
2018, 2017,
and 2016,
and 2015, respectively.
We are subject to income taxes in the United States as well as various states and foreign jurisdictions in which we operate. In accordance with accounting guidance, our income taxes include amounts from domestic and international
jurisdictions, plusjurisdictions. Due to the
provision for2017 Tax Act, there is no U.S.
taxesfederal tax on
undistributedcash repatriation from foreign subsidiaries; however, we could be subject to foreign withholding tax and U.S. state income taxes. The 2017 Tax Act also subjects our foreign subsidiary earnings
of international subsidiaries as of December 31, 2017. With respect to
newthe Global Intangible Low-Taxed Income (“GILTI”) tax
reform, we account for such provisions in the year of enactment in accordance with GAAP.provisions. Some items of income and expense are not reported in tax returns and our Financial Statements in the same year. The tax effect of such temporary differences is reported as deferred income taxes.
Our deferred tax assets and liabilities are recognized for the expected future tax consequences of events that have been included in our Financial Statements or income tax returns. Deferred tax assets and liabilities are determined based upon differences between financial statement carrying amounts of existing assets and their respective tax bases using enacted tax rates expected to apply to taxable income in years in which those temporary differences are expected to be recovered or settled. The effect on the income tax provision or benefit and deferred tax assets and liabilities for a change in rates is recognized in the Statements of
LossIncome (Loss) in the period that includes the enactment date.
When measuring deferred tax assets, certain estimates and assumptions are required to assess whether a valuation allowance should be established by evaluating both positive and negative factors in accordance with accounting guidance. This evaluation requires that we exercise judgment in determining the relative significance of each factor. The assessment of
the valuation allowance involves significant estimates regarding future taxable income and when it is recognized, the amount and timing of taxable differences, the reversal of temporary differences and the implementation of tax-planning strategies. A valuation allowance is established based on the weight of available evidence, including both positive and negative indicators, if it is more likely than not that a portion, or all, of the deferred tax assets will not be realized. Greater weight is given to evidence that is objectively verifiable, most notably historical results. If we report a cumulative loss from continuing operations before income taxes for a reasonable period of time, this form of negative evidence is difficult to overcome. Therefore, we include certain aspects of our historical results in our forecasts of future taxable income, as we do not have the ability to solely rely on forecasted improvements in earnings to recover deferred tax assets. When we report a cumulative loss position,
75
to the extent our results of operations improve, such that we have the ability to overcome the more likely than not accounting standard, we expect tomay be able to reverse the valuation allowance in the applicable period of determination. In addition, we rely on deferred tax liabilities in our assessment of the realizability of deferred tax assets if the temporary timing difference is anticipated to reverse in the same period and jurisdiction and the deferred tax liabilities are of the same character as the temporary differences giving rise to the deferred tax assets.
We also follow accounting guidance to account for uncertainty in income taxes as recognized in our Financial Statements. The accounting standard creates a single model to address uncertainty in income tax positions and prescribes the minimum recognition threshold a tax position is required to meet before being recognized in our Financial Statements. The standard also provides guidance on derecognition, measurement, classification, interest and penalties, accounting in interim periods, disclosure, and transition.
Under this standard, we may recognize tax benefits from an uncertain position only if it is more likely than not that the position will be sustained upon examination by taxing authorities based on the technical merits of the issue. The amount recognized is the largest benefit that we believe has greater than a 50% likelihood of being realized upon settlement. Actual income taxes paid may vary from estimates depending upon changes in income tax laws, actual results of operations, and the final audit of tax returns by taxing authorities. Tax assessments may arise several years after tax returns have been filed.
The Company provides a 401(k) Plan that allows employees to defer up to the lesser of the Internal Revenue Code prescribed maximum amount or 100% of their income on a pre-tax basis through contributions to the plan. As a benefit to employees, the Company matches a percentage of these employee contributions (as defined in the plan document). Expenses related to the matching portion of the contributions to the
Surviving 401(k) Plan were
$2.2 million, $2.3 million,
$1.9 million and
$1.3$1.9 million for the years ended December 31,
2018, 2017,
and 2016,
and 2015, respectively.
Fair Values of Financial Instruments
The fair value of a financial instrument represents the amount at which the instrument could be exchanged in a current transaction between willing parties, other than in a forced or liquidation sale. Fair value estimates are made at a specific point in time, based upon relevant market information about the financial instrument.
The carrying amount of cash and cash equivalents, settlement receivables, short-term trade receivables,and other receivables, settlement liabilities, accounts payable and accrued expenses approximatesapproximate fair value due to the short-term maturities of these instruments. The fair value of the long-term trade and loans receivable is estimated by discounting expected future cash flows using current
interest rates at which similar loans would be made to borrowers with similar credit ratings and remaining maturities. As of December 31, 2018 and December 31, 2017, the fair value of notes receivable, net, approximated the carrying value due to contractual terms of trade and loans receivable generally being under 24 months. The fair value of our borrowings
areis estimated based on various inputs to determine a market price, such as: market demand and supply, size of tranche, maturity, and similar instruments trading in more active markets. The estimated fair value and outstanding balances of our borrowings are as follows (in thousands)
.: | | Level of Hierarchy | | Fair Value | | | Outstanding Balance | |
December 31, 2017 | | | | | | | | | | |
Term loan | | 2 | | $ | 826,099 | | | $ | 815,900 | |
Senior unsecured notes | | 1 | | $ | 372,656 | | | $ | 375,000 | |
| | | | | | | | | | |
December 31, 2016 | | | | | | | | | | |
Term loan | | 1 | | $ | 451,632 | | | $ | 465,600 | |
Senior secured notes | | 3 | | $ | 324,950 | | | $ | 335,000 | |
Senior unsecured notes | | 1 | | $ | 350,000 | | | $ | 350,000 | |
76
|
| | | | | | | | | |
| | Level of Hierarchy | | Fair Value | | Outstanding Balance |
| December 31, 2018 | | | |
| | |
|
| Term loan | 2 | | $ | 784,479 |
| | $ | 807,700 |
|
| Senior unsecured notes | 1 | | $ | 354,863 |
| | $ | 375,000 |
|
| December 31, 2017 | | | |
| | |
|
| Term loan | 2 | | $ | 826,099 |
| | $ | 815,900 |
|
| Senior unsecured notes | 1 | | $ | 372,656 |
| | $ | 375,000 |
|
The term loan facility was reported at fair value using a Level 2 input as there were quoted prices in markets that were not considered active as of
December 31, 2017.2018 and December 31, 2017. The senior unsecured notes were reported at fair value using a Level 1 input as there were quoted prices in markets that were considered active as of December 31, 2017.The term loan was reported at fair value using a Level 1 input as there were quoted prices in markets that were considered active as of 2018 and December 31, 2016. The senior secured notes were reported at fair value using a Level 3 input as there was no market activity or observable inputs as of December 31, 2016. The senior unsecured notes were reported at fair value using a Level 1 input as there were quoted prices in markets that were considered active as of December 31, 2016.
2017.
Foreign Currency Translation
Foreign currency denominated assets and liabilities for those foreign entities for which the local currency is the functional currency are translated into U.S. dollars based on exchange rates prevailing at the end of each year. Revenues and expenses are translated at average exchange rates during the year. The effects of foreign exchange gains and losses arising from these translations are included as a component of other comprehensive income on the Statements of
Loss.Income (Loss). Translation adjustments on intercompany balances of a long-term investment nature are recorded as a component of accumulated other comprehensive loss on our Balance Sheets.
We have made estimates and judgments affecting the amounts reported in these financial statements and the accompanying
notes.notes in conformity with accounting principles generally accepted in the United States. The actual results may differ from these estimates.
These accounting estimates incorporated into our Financial Statements include, but are not limited to:the estimated reserve for warranty expense associated with our check warranty receivables;
the estimated reserve for bad debt expense associated with our trade receivables;
the estimated reserve for inventory obsolescence;
the valuation and recognition of share based compensation;
the valuation allowance on our deferred income tax assets;
the estimated cash flows in assessing the recoverability of long lived assets;
the estimates of future operating performance, weighted average cost of capital (“WACC”) and growth rates as well as other factors used in our annual goodwill and assets impairment evaluations;
the renewal assumptions used for customer contracts to estimate the useful lives of such assets;
the judgments used to determine the stages of development and costs eligible for capitalization as internally developed software; and
the estimated liability for health care claims under our self-insured health care program.
Earnings Applicable to Common Stock
Basic earnings per share is calculated by dividing net income by the weighted average number of common shares outstanding for the period. Diluted earnings per share reflect the effect of potential common stock resulting from assumed stock option exercises and vesting of restricted stock unless it is
antidilutive.anti-dilutive. To the extent we report a net loss from continuing operations in a particular period, no potential dilution from the application of the treasury stock method would be applicable in accordance with ASC 260, Earnings per Share.
Share-based
payment awards resultcompensation is considered an equity award and results in a cost that is measured at fair value on the
award’s grant
date.date of an award.
Our time-based stock options were measured at fair value on the grant date using the Black Scholes model. Our restricted stock awards
and restricted stock units, including the restricted stock units bound by certain performance-based metrics issued in 2018, were measured at fair value based on the stock price on the grant date. The compensation expense is recognized on a straight-line basis over the vesting period of the awards.
77
Our market-based options granted in 2017 and 2016 under our 2014 Equity Incentive Plan (the “2014 Plan”) and 2012 Equity Incentive Plan (as amended, the “2012 Plan”) vest at a rate of 25% per year on each of the first four anniversaries of the grant date, provided that as of the vesting date for each vesting tranche, the closing price of the Company’s shares on the New York Stock Exchange is at least a specified price hurdle, defined as a 25% and 50% premium for 2017 and 2016, respectively, to the closing stock price on the grant date. If the price hurdle is not met as of the vesting date for a vesting tranche, then the vested tranche shall vest and become vested shares on the last day of a period of 30 consecutive trading days during which the closing price is at least the price hurdle.
Our market-based stock options granted in 2015 under the 2014 Plan will vest if our average stock price in any period of 30 consecutive trading days meets certain target prices during a four-year period that commenced on the grant date of these options. If these target prices are not met during the four year period, the unvested shares underlying the options will terminate except if there is a Change in Control (as defined in the 2014 Plan) of the Company, in which case, the unvested shares underlying such options shall become fully vested on the effective date of such change in control transaction.
The market-based options were measured at fair value on the grant date using a lattice-based valuation model based on the median time horizon from the date of grant for these options to the vesting date for those paths that achieved the target threshold(s). The compensation expense is recognized on a straight-line basis over the median vesting periods calculated under such valuation model.
Forfeitures are estimated at the grant date for our time-based,
market-based and
market-basedperformance-based awards, with such estimates updated periodically; and with actual forfeitures recognized currently to the extent they differ from the estimates.
Unless otherwise provided by the administrator of our equity incentive plans, stock options granted under our plans generally expire ten
years from the date of grant. In connection with our annual grant in 2015, certain market-based stock option awards were issued that expire seven years from the date of grant. The exercise price of stock options is generally the closing market price of our common stock on the date of the stock option grant.
Acquisition-Related Costs
We recognize a liability for acquisition-related costs when the expense is incurred. Acquisition-related costs include, but are not limited to: financial advisory, legal and debt fees; accounting, consulting, and professional fees associated with due diligence, valuation, and integration; severance; and other related costs and adjustments.
Reclassification of Prior Year Balances
Reclassifications were made to the prior-period
financial statementsFinancial Statements to conform to the current period
presentation.presentation, except for the adoption impact of the application of ASC 606 utilizing the modified retrospective transition method.
Recent Accounting Guidance
Recently Adopted Accounting Guidance
In January 2017,March 2018, the Financial Accounting Standards Board (“FASB”)FASB issued Accounting Standards Update (“ASU”)ASU No. 2017-04,2018-05, which provides updated guidance on accounting for the goodwill impairment test and the method by which an entity recognizes an impairment charge. These amendments eliminate “Step 2” from the current goodwill impairment process and require that an entity recognize an impairment charge equal to the amount by which the carrying amount exceeds the reporting unit’s fair value, not to exceed the total amount of goodwill allocated to that reporting unit. Additionally, a company should also take into consideration income tax effects from tax deductible goodwill onof the carrying amount of a reporting unit when recording an impairment loss.2017 Tax Act (pursuant to SEC Staff Accounting Bulletin No. 118). The new standard is effective for fiscal years beginning after December 15, 2019, including interim periods within those fiscal years. This guidance will be applied using a prospective approach. Early adoption is permitted for interim or annual goodwill impairment tests performed on testing dates after January 1, 2017.March 13, 2018. We have adopted this guidance in the current period.quarter ended March 31, 2018. In accordance with this guidance, some of the income tax effects recorded in 2017 were provisional and insignificant adjustments were made during 2018. As of December 22, 2018, we completed our analysis and our updated assessment is that the 2017 Tax Act has no further impact on our previously reported income tax provisions or our deferred tax assets or liabilities; therefore, these amounts are no longer considered provisional in nature.
In May 2014, the FASB issued ASU No. 2014-09, which creates ASC 606 and supersedes ASC Topic 605, “Revenue Recognition.” The
adoptionguidance replaces industry-specific guidance and establishes a single five-step model to identify and recognize revenue. The core principle of
thisthe guidance is that an entity should recognize revenue upon transfer of control of promised goods or services to customers in an amount that reflects the consideration to which an entity expects to be entitled in exchange for those goods or services. Additionally, the guidance requires the entity to disclose further quantitative and qualitative information regarding the nature and amount of revenues arising from contracts with customers, as well as other information about the significant judgments and estimates used in recognizing revenues from contracts with customers. The guidance in ASU
did not impact our Financial Statements.2014-9 was further updated by ASU 2016-08 in March 2016, which provided clarification on the implementation of the principal versus agent considerations in ASU 2014-09. In MarchApril 2016, the FASB issued ASU No. 2016-09,2016-10, which simplifies several aspects of the accounting for share-based payment transactions, including the accounting for income taxes, statutory tax withholding requirements and classificationprovides clarification on the statementimplementation of cash flows. The new standard is effective for fiscal years beginning afterperformance obligations and licensing in ASU 2014-9. In May 2016, the FASB issued ASU 2016-11, which amended guidance provided in two SEC Staff Announcements at the March 3, 2016 Emerging Issues Task Force meeting over various topics relating to ASU 606. In May 2016, the FASB issued ASU 2016-12, which clarified various topics in ASC 606. In December 15, 2016, including interim periods within those fiscal years.the FASB issued ASU 2016-20, which clarified additional topics in ASC 606. This guidance willmay be applied either prospectively,adopted retrospectively or usingunder a modified retrospective transition method depending onwhere the area covered in this update. Early adoptioncumulative effect is permitted.recognized at the date of initial application. We adopted this guidance in the current period on a prospective basis. As of December 31, 2017, the adoption of ASU No. 2016-09 has not materially impacted our Financial Statements. Witheffective January 1, 2018 and have provided additional information with respect to forfeitures, the Company will continue to estimate the numbernew revenue recognition topic elsewhere in this Note 2 disclosure and also in “Note 3 — Adoption of awards expected to be forfeited in
78
accordanceASC 606, Revenue from Contracts with our existing accounting policy. In addition, our Cash Flows present excess tax benefits as operating activities in the current period, as the prior period was not adjusted.
In July 2015, the FASB issued ASU No. 2015-11, which provides guidance on the measurement of inventory value. The amendments require an entity to measure in scope inventory at the lower of cost and net realizable value. Net realizable value is the estimated selling prices in the ordinary course of business, less reasonably predictable costs of completion, disposal and transportation. Subsequent measurement is unchanged for inventory measured using last-in, first-out (“LIFO”) or the retail inventory method. The amendments do not apply to inventory that is measured using LIFO or the retail inventory method. The amendments apply to all other inventory, which includes inventory that is measured using FIFO or average cost. The pronouncement is effective for annual periods beginning after December 15, 2016, and interim periods within those fiscal years, and early adoption is permitted. We adopted this guidance in the current period. This ASU did not have a material impact on our Financial Statements.
Recent Accounting Guidance Not Yet Adopted
Customers.”
In May 2017, the FASB issued ASU No. 2017-09 to clarify which changes to the terms and conditions of share-based payment awards require an entity to apply modification accounting under Topic 718. An entity is required to account for the effects of a modification unless all of the following conditions are met: (i) the fair value (or calculated value or intrinsic value, if such an alternative measurement method is used) of the modified award is the same as the fair value (or value using an alternative measurement method) of the original award immediately before the original award is modified. If the modification does not affect any of the inputs to the valuation technique that the entity uses to value the award, the entity is not required to estimate the value immediately before and after the modification; (ii) the vesting conditions of the modified award are the same as the vesting conditions of the original award immediately before the original award is modified; and (iii) the classification of the modified award as an equity instrument or a liability instrument is the same as the classification of the original award immediately before
the original award is modified.
The new standard is effective for fiscal years beginning after December 15, 2017, including interim periods within those fiscal years. Early adoption is permittedWe adopted this guidance in the
first period of the year this guidance is adopted. We do not expect thequarter ended March 31, 2018. The adoption of this
guidance toASU did not have a material impact on our Financial Statements.
In January 2017, the FASB issued ASU No. 2017-01, which clarifies the definition of a business. The amendments affect all companies and other reporting organizations that must determine whether they have acquired or sold a business. The amendments are intended to help companies and other organizations evaluate whether transactions should be accounted for as acquisitions (or disposals) of assets or businesses. The new standard is effective for fiscal years beginning after December 15, 2017, including interim periods within those fiscal years. This guidance
willis to be applied using a prospective approach as of the beginning of the first period of adoption.
Early adoption is permitted for acquisitions, or disposals that occur beforeWe adopted this guidance in the
issuance date or effectiveness date of the amendments when the transaction has not been reported in financial statements that have been issued or made available for issuance. We do not expect thequarter ended March 31, 2018. The adoption of this
guidance toASU did not have a material impact on our Financial Statements.
In October 2016, the FASB issued ASU No. 2016-18, which requires that a statement of cash flows explain the change during the period in the total of cash, cash equivalents and amounts generally described as restricted cash or restricted cash equivalents. As a result, amounts generally described as restricted cash and restricted cash equivalents should be included with cash and cash equivalents when reconciling the beginning-of-period and end-of-period total amounts shown on the statement of cash flows. The amendments do not provide a definition of restricted cash or restricted cash equivalents.
The new standard is effective for fiscal years beginning after December 15, 2017, including interim periods within those fiscal years. ThisWe adopted this guidance
will be appliedin the quarter ended March 31, 2018 using a retrospective approach to each period presented.
Early adoption is permitted and adoption in an interim period should reflect adjustments as of the beginning of the fiscal year that includes that interim period. We do not expect theThe adoption of this
guidance toASU did not have a material impact on our Financial Statements.
In October 2016, the FASB issued ASU No. 2016-16, which provides updated guidance on the recognition of the income tax consequences of intra-entity transfers of assets other than inventory when the transfer occurs, and this eliminates the exception for an intra-entity transfer of such assets.
The new standard is effective for fiscal years beginning after December 15, 2017, including interim periods within those fiscal years. This guidance will be applied using a modified retrospective approach through a cumulative-effective adjustment directly to retained earnings as of the beginning of the period of adoption.
Early adoption is permitted during the first interim period of79
the yearWe adopted this guidance is adopted. We do not expectin the quarter ended March 31, 2018. The adoption of this guidance toASU did not have a material impact on our Financial Statements.
In August 2016, the FASB issued ASU No. 2016-15, which provides updated guidance on the classification of certain cash receipts and cash payments in the statement of cash flows.
The new standard is effective for fiscal years beginning after December 15, 2017, including interim periods within those fiscal years. This guidance
willis to be applied using a retrospective approach. If it is impracticable to apply the amendments retrospectively for some of the issues within this ASU, the amendments for those issues would be applied prospectively as of the earliest date practicable.
Early adoption is permitted including adoptionWe adopted this guidance in
an interim period. We do not expect the
quarter ended March 31, 2018. The adoption of this
guidance toASU did not have a material impact on our Financial Statements.
In JuneJanuary 2016, the FASB issued ASU No. 2016-13,2016-01, which, provides updated guidance on credit lossesamong other things, requires equity investments (except those accounted for financial assetsunder the equity method of accounting, or those that result in consolidation of the investee) to be measured at amortized cost basis and available-for sale debt securities.fair value with changes in fair value recognized in net income. We adopted this guidance in the quarter ended March 31, 2018. The adoption of this ASU did not have a material impact on our Financial Statements.
Recent Accounting Guidance Not Yet Adopted
In August 2018, the FASB issued ASU No. 2018-15, which aligns the requirements for capitalizing implementation costs incurred in a hosting arrangement that is a service contract with the requirements for capitalizing implementation costs incurred to develop or obtain internal-use software (and hosting arrangements that include an internal use software license). The new standard is effective for fiscal years beginning after December 15, 2019, including interim periods within those fiscal years. Early adoption is permitted, including adoption in any interim period. We are currently evaluating the impact of adopting this guidance on our Financial Statements; however, we do not expect the impact to be material.
In June 2018, the FASB issued ASU No. 2018-07, which expands the scope of Topic 718, Compensation-Stock Compensation (which currently only includes share-based payments to employees) to include share-based payments issued to nonemployees for goods or services. Consequently, the accounting for share-based payments to nonemployees and employees will be substantially aligned. The new standard is effective for fiscal years beginning after December 15, 2018, including interim periods within those fiscal years. Early adoption is permitted. We do not expect the adoption of this ASU to have a material impact on our Financial Statements.
In February 2018, the FASB issued ASU No. 2018-02, which provides financial statement preparers with an option to reclassify stranded tax effects within AOCI to retained earnings in each period in which the effect of the change in the U.S. federal corporate income tax rate in the Tax Cuts and Jobs Act (or portion thereof) is recorded. The new standard is effective for fiscal years beginning after December 15, 2018, including interim periods within those fiscal years. We do not expect the adoption of this ASU to have a material impact on our Financial Statements.
In June 2016, the FASB issued ASU No. 2016-13, which provides updated guidance on how an entity should measure credit losses on financial instruments. The new guidance replaces the current incurred loss measurement methodology with a lifetime expected loss measurement methodology, and is effective for fiscal years beginning after December 15, 2019, including interim periods
within those fiscal years. This guidance will be applied using a modified retrospective approach for the cumulative-effect adjustment to retained earnings as of the beginning of the first reporting period in which the guidance is effective and using a prospective approach for debt securities for which any other-than-temporary impairment had been recognized before the effective date.
Early adoption is permittedIn November 2018, the FASB issued ASU No. 2018-19 to mitigate transition complexity by requiring entities other than public business entities to implement ASU No. 2016-13 for fiscal years beginning after December 15,
2018.2021, including interim periods within those fiscal years. This aligns the implementation date for their annual financial statements with the implementation date for their interim financial statements. The guidance also clarified that receivables arising from operating leases are not within the scope of the credit losses standard, but rather, should be accounted for in accordance with the leases standard. We are currently
assessingevaluating the
effect the adoptionimpact of
adopting this guidance
will have on our Financial
Statements, butStatements; however, we do not expect the
effectimpact to be material.
In February 2016, the FASB issued ASU No. 2016-02,
which provides guidanceto increase transparency and comparability among organizations by recognizing lease assets and lease liabilities on the
accounting treatment of leases.balance sheet and disclosing key information about leasing transactions. The
ASUguidance establishes a right-of-use (“ROU”) model that requires a lessee to record a ROU asset and a lease liability on the balance sheet for all leases with terms longer than 12 months.
LeasesWe made an accounting policy election whereby leases that are 12 months or less that do not include an option to purchase the underlying assets will be accounted for similarly to our current operating leases; therefore, these arrangements will not be recorded on the balance sheet. For lessees, leases will be classified as either financing or operating with classification affecting the pattern of expense recognition in the income statement.
The new standard is effective for fiscal years beginning after December 15, 2018, including interim periods within those fiscal yearsFor lessors, leases will be classified as operating, sales-type or direct financing with classification affecting the pattern of revenue and
early adoption is permitted. A modified retrospective transition approach is required for lessees for capital and operating leases existing at, or entered into after, the beginning of the earliest comparative period presentedprofit recognition in the
financial statements, with certain practical expedients available. While we are currently assessing the impact of this ASU on our Financial Statements, we expect the primary impact to our consolidated financial position upon adoption will be the recognition, on a discounted basis, of our minimum commitments under noncancelable operating leases on our Balance Sheets, which will result in the recording of right of use assets and lease obligations and are currently discussed in “Note 12 — Commitments and Contingencies.”income statement. In May 2014, the FASB issued ASC 606, “Revenue from Contracts with Customers,” which outlines a new, single comprehensive model for entities to use in accounting for revenue arising from contracts with customers and supersedes the existing revenue recognition guidance, including industry-specific guidance. The guidance replaces industry-specific guidance and establishes a single five-step model to identify and recognize revenue. The core principle of the guidance is that an entity should recognize revenue upon transfer of control of promised goods or services to customers in an amount that reflects the consideration to which an entity expects to be entitled in exchange for those goods or services. Additionally, the guidance requires the entity to disclose further quantitative and qualitative information regarding the nature and amount of revenues arising from contracts with customers, as well as other information about the significant judgments and estimates used in recognizing revenues from contracts with customers. This guidance was originally effective for interim and annual reporting periods beginning after December 15, 2016. However, in August 2015,July 2018, the FASB issued ASU No. 2015-14,2018-10 - Codification Improvements to Topic 842, Leases and ASU No. 2018-11 - Leases (Topic 842): Targeted Improvements. ASU No. 2018-10 affects narrow aspects of the guidance previously issued and ASU No. 2018-11 provides a practical expedient for lessors on separating components of a contract and also includes an additional optional transition relief methodology for adopting the new standard. In December 2018, the FASB issued ASU No. 2018-20 - Leases (Topic 842): Narrow-Scope Improvements for Lessors, which extendedaddresses the effective datefollowing issues facing lessors when applying the standard: sales taxes and other similar taxes collected from lessees, certain lessor costs paid directly by lessees, and recognition of variable payments for contracts with lease and non-lease components. The guidance requires an entity to interim and annual periods beginning after December 15, 2017. This guidance may be adopted under a full retrospective application oradopt the new standard, as amended, under a modified retrospective method wherebyapplication. With the cumulative effect is recognizedoptional transition relief methodology available, entities have an opportunity to adopt the new lease standard prospectively at the beginning of the period of adoption through a cumulative-effect adjustment, with certain practical expedients available.
On January 1, 2019, the Company adopted the new leasing standard promulgated by the FASB using the adoption date
method. While we are finalizing the adoption procedures, we expect that the standard will have a material impact on our Balance Sheets, however, we do not expect that the standard will have a material impact on our Statements of
Income (Loss). Upon adoption, we will record a ROU asset and lease liability, representing our obligation to make lease payments for operating leases, measured on a discounted basis. We expect the ROU assets and lease liabilities of operating leases recorded to be within the range of approximately 1%-2% of total assets. We elected the practical expedients offered in the aforementioned guidance, including the transition practical expedient that states that the Company need not reassess: (a) whether expired or existing contracts contain leases; (b) the lease classification of expired or existing leases; or (c) initial
application.direct costs for any existing leases. Other expedients adopted include practical expedient that allows a Company, as an accounting policy election by class of underlying assets, choose not to separate non-lease components from lease components; and a short-term lease recognition exemption to not record short-term leases with an initial term of 12 months or less on the balance sheet.
As we are finalizing the adoption procedures, we expect the following impact to our financial statements as summarized within the table below:
|
| |
| Lessor Perspective | Expected Impact Upon Adoption |
| Games and FinTech Segments | The adoption of ASC 842 will not have a material impact on the Company from the lessor perspective as our lessor accounting for leases will be consistent with current practices. |
| |
| Lessee Perspective | Expected Impact Upon Adoption |
| Games and FinTech Segments | We will recognize operating lease ROU assets and liabilities primarily associated with real estate leases on our Balance Sheets for lease contracts with terms that are longer than 12 months with no material impact to the Statements of Income (Loss). The operating lease ROU assets and liabilities are expected to be recognized at the commencement date based on the present value of lease payments over the lease terms. |
We do not anticipate that any other recently issued accounting guidance will have a significant effect on our consolidated financial statements.
3. ADOPTION OF ASC 606, “REVENUE FROM CONTRACTS WITH CUSTOMERS”
Change in accounting policies
On January 1, 2018,
the Company implemented the new revenue recognition standard promulgated by the FASB. The Companywe adopted ASC 606 using the modified retrospective method,
that requires companieswhich required us to
record aevaluate whether any cumulative adjustment
was required to be recorded to retained earnings
(or(accumulated deficit)
presented inas a result of applying the
unaudited condensed, consolidated balance sheets for interim periods and presented in the audited consolidated balance sheets for annual periodsprovisions set forth under ASC 606 for any
contract modifications made to thoseexisting arrangements not yet completed as of the adoption date of January 1, 2018.
The CompanyWe determined that there was
no suchan immaterial cumulative adjustment
requiredin the amount of approximately $4.4 million, which we recorded to
be made to its interim, condensed, consolidated balance sheetsaccumulated deficit as of the adoption
date.date as a result of applying the modified retrospective transition method. Revenues and costs related to certain contracts are recognized at a point in time under ASC 606 as the performance obligations related to certain types of sales are satisfied; whereas, previously these revenues and costs were recognized over a period of time under ASC 605. In addition, under the modified retrospective method,
the Company’sour prior period results
willwere not
be recast to reflect the new revenue recognition standard.
80
Except for the changes discussed with respect to revenue recognition, the impact of which is summarized in the tables below, we have consistently applied our accounting policies to the periods presented in our Financial Statements.
Balance Sheets and Statements of Cash Flows
The Company determined that the adoption of ASC 606 willutilizing the modified retrospective transition method did not have a material impact onto our Balance Sheets and Statements of Cash Flows as of and for the presentationyear ended December 31, 2018.
Games revenues
We previously reported certain costs incurred in connection with our WAP platform, consisting primarily of its financial information primarily duethe jackpot expenses, as cost of revenues. Under ASC 606, such costs are reflected as reductions to the reportinggaming operations revenues on a net revenues basis rather than a gross presentation, of certainpresentation.
FinTech revenues
We previously reported costs
of revenues (exclusive of depreciation and
amortization)expenses related to
theour cash access
activities of the Company’s Payments segment (with additional immaterial changes due to the net reporting of certain of the gaming operations activities of the Company’s Games segment). The net revenues reporting requirement under ASC 606 will have an effect on both the Payments and Games segment revenues and related cost of revenues (exclusive of depreciation and amortization); however, this net presentation will not have an effect on operating income (loss), net loss, cash flows or the timing of revenues recognized and costs incurred.To provide a greater understanding of the impact of this new revenue recognition standard, the Company determined that under the provisions set forth in ASC 606, the effect on certain Payments and Games revenues and costs of revenues would have collectively decreased by approximately $564.2 million, $476.4 million and $438.3 million for the years ended December 31, 2017, 2016 and 2015, respectively.
With respect to its Payments segment, the Company will have a material impact on the presentation of its financial information related to the reclassification of certain cost of revenues (exclusive of depreciation and amortization) included in the cash advance, automated teller machine and check services, revenue streams to be netted against those related revenue streams. The Company will report these items, which include commission expenses paidpayable to casino operators, interchange costs paidfees payable to the network associations and processing, and related costs paidpayable to other third party partners, as amountscosts of revenues. As the result of our evaluation of the factors contained in ASC 605, we previously determined that will be reported “netthe indicators requiring the gross reporting outweighed those for net reporting primarily due to the risk of transaction price”loss. Under ASC 606, such costs are reflected as reductions to its Payments segment revenues rather thanon a net basis of presentation, since we determined that we do not control certain cash access services provided to a customer and, therefore, we are acting as an agent whose performance obligation is to arrange for the current gross revenues presentation withprovision of these costs andtypes of services. In addition, commission expenses historically reported as Payments segment costpayable to the gaming operators are determined to be consideration paid to customers under ASC 606.
The following table presents the impact of revenue (exclusivethe application of ASC 606 utilizing the modified retrospective transition method to certain line items on our Statements of Income (Loss) for the year ended December 31, 2018 (in thousands):
|
| | | | | | | | | | | |
| | Year Ended December 31, 2018 |
| | As Reported | | Adjustments | | Without Adoption of ASC 606 |
| Revenues | | | | | |
| Games revenues | | | | | |
| Gaming operations | $ | 168,146 |
| | $ | 2,364 |
| | $ | 170,510 |
|
| Games total revenues | 258,978 |
| | 2,364 |
| | 261,342 |
|
| | | | | | |
| FinTech revenues | |
| | |
| | |
|
| Cash access services | 156,806 |
| | 629,641 |
| | 786,447 |
|
| Equipment | 20,977 |
| | (1,622 | ) | | 19,355 |
|
| FinTech total revenues | 210,537 |
| | 628,019 |
| | 838,556 |
|
| | | | | | |
| Total revenues | 469,515 |
| | 630,383 |
| | 1,099,898 |
|
| | | | | | |
| Costs and expenses | |
| | |
| | |
|
Games cost of revenues(1) | |
| | |
| | |
|
| Gaming operations | 17,603 |
| | 2,364 |
| | 19,967 |
|
| Games total cost of revenues | 68,009 |
| | 2,364 |
| | 70,373 |
|
| | | | | | |
FinTech cost of revenues(1) | |
| | |
| | |
|
| Cash access services | 9,717 |
| | 629,092 |
| | 638,809 |
|
| Equipment | 12,601 |
| | (825 | ) | | 11,776 |
|
| FinTech total cost of revenues | 26,428 |
| | 628,267 |
| | 654,695 |
|
| | | | | | |
| Total costs and expenses | 383,702 |
| | 630,631 |
| | 1,014,333 |
|
| | | | | | |
| Operating income | 85,813 |
| | (248 | ) | | 85,565 |
|
| | | | | | |
| Income before income tax | 2,646 |
| | (248 | ) | | 2,398 |
|
| | | | | | |
| Income tax benefit | (9,710 | ) | | — |
| | (9,710 | ) |
| Net income | 12,356 |
| | (248 | ) | | 12,108 |
|
| | | | | | |
| Comprehensive income | 10,611 |
| | (248 | ) | | 10,363 |
|
amortization).With respect to its Games segment, the Company will not have a material impact on the presentation of its financial information related to the reclassification of certain cost of revenues included in the gaming operations revenue stream to be netted against this revenue stream in connection with the Company’s Wide Area Progressive (the “WAP”) offering, which was initiated in 2017. The Company will report these items, which include WAP jackpot expenses as amounts that will be reported “net of the transaction price” as reductions to its Games segment revenues, rather than the current gross revenues presentation with these expenses historically reported as Games segment cost of revenue (exclusive of depreciation and amortization).
Furthermore, for presentation purposes, given the fact that the Company’s total revenues, on a consolidated basis, will be significantly reduced in connection with the adoption of the new revenue recognition standard, the Company’s revenue streams will be evaluated on a recurring basis to ensure compliance with Rule 5-03(b) of Regulation S-X to present those revenues that exceed the quantitative threshold on the Company’s Statements of Loss. In addition, the Company determined that there was no cumulative adjustment to be recorded to Stockholders’ Deficit in its Consolidated Balance Sheets.
81
amortization.
We have completed our review of the requirements of the new revenue recognition standard by major revenue stream and present the impact to our operating segments as follows:Major Revenue Stream
| | Impact Upon Adoption
|
| | |
Games Segment:
| | |
| | |
Game Sales
| | The adoption of ASC 606 will not have a material impact on this revenue stream; however, for presentation purposes, there will be a change to show this line item on our Consolidated Statements of Loss as we expect it to exceed the quantitative threshold set forth in Rule 5-03(b) of Regulation S-X.
|
| | |
Gaming Operations
| | The adoption of ASC 606 will not have a material impact on this revenue stream; however, with respect to our Wide Area Progressive (“WAP”) offering, which was initiated in 2017, there will be a change as the jackpot expense is required to be netted against the corresponding WAP revenue as opposed to the existing accounting practice of recording these amounts on a gross basis to Games cost of revenue. In addition, for presentation purposes, there will be a change to show this line item on our Statements of Loss as we expect it to exceed the quantitative threshold set forth in Rule 5-03(b) of Regulation S-X.
|
Games Segment Impact
| | The Games segment impact, on a pro forma basis giving effect to the implementation of ASC 606 for revenue and cost of revenue (exclusive of depreciation and amortization), would have been a decrease of approximately $0.6 million for the year ended December 31, 2017. There was no effect to the Statements of Loss with respect to the Games segment for the years ended December 31, 2016 and 2015.
|
Payments Segment:
| | |
| | |
Cash Advance, ATM and Check Services
| | There will be significant changes to the presentation of our financial information related to the Cash Advance, ATM and Check Services revenue streams. Certain costs of revenue, which include: (i) commission expenses paid to casino operators; (ii) interchange costs paid to the network associations; and (iii) processing and related costs paid to other third party partners, will be netted against the corresponding Payments segment revenue as opposed to the existing accounting practice of recording these amounts on a gross basis to Payments cost of revenue. In addition, for presentation purposes, there will be a change to show certain of these line items on our Statements of Loss as we expect it to exceed the quantitative threshold set forth in Rule 5-03(b) of Regulation S-X.
|
| | |
Central Credit
| | The adoption of ASC 606 will not have a material impact and there is no change expected from our current practices.
|
| | |
Kiosk Sales and Services
| | The adoption of ASC 606 will not have a material impact and there is no change expected from our current practices.
|
| | |
Compliance Sales and Services
| | The adoption of ASC 606 will not have a material impact and there is no change expected from our current practices.
|
82
Payments Segment Impact
| | The Payments segment impact on a pro forma basis giving effect to the implementation of ASC 606 for revenue and cost of revenue (exclusive of depreciation and amortization) would have been a decrease of approximately $563.6 million, $476.4 million and $438.3 million for the years ended December 31, 2017, 2016 and 2015, respectively.
|
3.4. BUSINESS COMBINATIONS
We account for business combinations in accordance with ASC 805, which requires that the identifiable assets acquired and liabilities assumed be recorded at their estimated fair values on the acquisition date separately from goodwill, which is the excess of the fair value of the purchase price over the fair values of these identifiable assets and liabilities. We include the results of operations of an acquired business as of the acquisition date. We had no material acquisitions for the years ended December 31,
2018, 2017,
2016 and
2015.4.2016.
In August 2015, we acquired certain assets of Resort Advantage, LLC (“Resort Advantage”), a supplier of comprehensive and integrated solutions for complete Financial Crimes Enforcement Network (“FinCEN”) and Internal Revenue Service regulatory compliance to the gaming industry, for an aggregate purchase price of approximately $13.3 million, of which we estimated that approximately $4.7 million (the “earn out liability”) would be paid under the provisions of the agreement over a period of 40 months (the “payout period”) based upon an evaluation over a period of 36 months (the “earn out period”) following the closing of the transaction. Upon expiration of the earn out period in August 2018, we analyzed the remaining earn out liability of approximately $0.8 million and determined that approximately $0.6 million would not be realized; therefore, we reversed that amount into income. We continued to record approximately $0.2 million in remaining earn out liability to potentially be paid under the provisions of the agreement during the first quarter of 2019. The Resort Advantage acquisition did not have a material impact on our results of operations or financial condition.
5. FUNDING AGREEMENTS
Contract
Commercial Cash
Solutions AgreementOur Contract Cash Solutions AgreementArrangements
We have commercial arrangements with Wells Fargo Bank, N.A. (“Wells Fargo”) allows us to use funds owned by Wells Fargothird party vendors to provide the currency neededcash for normal operating requirements forcertain of our ATMs. For the use of these funds, we pay Wells Fargo a cash usage fee on either the average daily balance of funds utilized multiplied by a contractually defined cash usage rate or the amounts supplied multiplied by a contractually defined cash usage rate. These cash usage fees, reflected as interest expense within the Statements of Loss,Income (Loss), were $7.0 million, $4.9 million, $3.1 million and $2.3$3.1 million for the years ended December 31, 2018, 2017, 2016 and 2015,2016, respectively. We are exposed to interest rate risk to the extent that the applicable LIBOR (defined to berates increase.
Under these agreements, the
Interbank Offered Rate or a comparable or successor rate) increases.Under this agreement, all currency supplied by Wells Fargo remains thethird party vendors remain their sole property of Wells Fargo at all times until it is dispensed, at which time Wells Fargo obtains an interest in the corresponding settlement receivable which is recorded on a net basis.funds are dispensed. As these funds are not our assets, supplied cash is not reflected on thein our Balance Sheets. The outstanding balances of ATM cash utilized by us from Wells Fargothe third parties were $289.8approximately $224.7 million and $285.4$289.8 million as of December 31, 2018 and 2017, and 2016, respectively.
The
Our primary commercial arrangement, the Contract Cash Solutions Agreement, as amended,
with Wells Fargo provides us with cash in the maximum amount of
$300.0$300 million with the ability to increase the amount by $75 million over a 5-day period for
special occasions,holidays, such as
the period around New
Years.Year’s Day. The term of the agreement expires on June 30,
2020.2021 and will auto renew for additional one-year periods unless either party provides a 90-day written notice of its intent not to renew.
We are responsible for any losses of cash in the ATMs under this agreement and we self-insure for this risk. We incurred no material losses related to this self-insurance for the years ended December 31,
2018, 2017, and 2016.
We operate ATMs at certain customer gaming establishments where the gaming establishment provides the cash required for the ATM operational needs. We are required to reimburse the customer for the amount of cash dispensed from these Site-Fundedsite-funded ATMs. The Site-Fundedsite-funded ATM liability is included within settlement liabilities in the accompanying Balance Sheets and was $210.8$249.6 million and $151.0$210.8 million as of December 31, 2018 and 2017, respectively.
Everi-Funded ATMs
We enter into agreements with customers for certain of our Canadian ATMs whereby we provide the cash required to operate the ATMs. We supplied approximately $4.8 million and
2016, respectively.$6.9 million of our cash for these ATMs at December 31, 2018 and 2017, respectively, which represents an outstanding balance under such agreements at the end of the period. Such amounts are reported within settlement receivables line of our Balance Sheets.
Prefunded Cash Access Agreements
Due to certain regulatory requirements, some international gaming establishments require prefunding of cash to cover all outstanding settlement amounts in order for us to provide cash access services to their properties. We enter into agreements with these operators for which we supply our cash access services for their properties. Under these agreements, we maintain sole discretion to either continue or cease operations as well as discretion over the amounts prefunded to the properties and may request amounts to be refunded to us, with appropriate notice to the operator, at
83
any time. The initial prefunded amounts and subsequent amounts from the settlement of transactions are deposited into a bank account that is to be used exclusively for cash access services, and we maintain the right to monitor all transaction activity in that account. The total amount of prefunded cash outstanding was approximately $8.4$6.1 million and $8.5$8.4 million at December 31, 20172018 and 2016,2017, respectively, and is included in prepaid expenses and other assets onin our Balance Sheets.
5.
6. TRADE AND OTHER RECEIVABLES
Trade
and loans receivables represent short-term credit granted to customers as well as long-term loans receivable on our games,
fully integrated kiosksequipment, and compliance products. Trade and loans receivables generally do not require collateral. The balance of trade and loans receivables consists of outstanding balances owed to us by gaming
establishments and casino patrons.establishments. Other receivables include income
taxestax receivables and other miscellaneous receivables.
In addition, we had a note receivable with Bee Cave Games, Inc. (“Bee Cave”), which was established in December 2014 pursuant to a secured promissory note in the amount of $4.5 million. In connection with the promissory note, the Company received a warrant to purchase the common stock of Bee Cave and recorded a discount to the note for the fair value of the warrant received. In May 2016, Bee Cave failed to pay its scheduled interest-only. At such time, we recorded a write-down of approximately $4.3 million related to the Bee Cave note receivable and warrant in operating expenses on the Statements of Loss. During the third quarter of 2016, we foreclosed on the Bee Cave assets, evaluated its platform, and began to utilize these assets in connection with our social gaming strategy to deliver content from our existing game library. Consequently, we extinguished the note receivable and recorded $0.5 million of developed technology and software within other intangible assets, net on the Balance Sheets.
The balance of trade and other receivables consisted of the following (in thousands):
| | At December 31, | |
| | 2017 | | | 2016 | |
Trade and other receivables, net | | | | | | | | |
Games trade and loans receivables | | $ | 38,070 | | | $ | 44,410 | |
Payments trade and loans receivables | | | 10,780 | | | | 12,337 | |
Other receivables | | | 1,570 | | | | 1,924 | |
Total trade and other receivables, net | | $ | 50,420 | | | $ | 58,671 | |
Less: non-current portion of receivables | | | 2,638 | | | | 2,020 | |
Total trade and other receivables, current portion | | $ | 47,782 | | | $ | 56,651 | |
|
| | | | | | | | |
| | | At December 31, |
| | | 2018 | | 2017 |
| Trade and other receivables, net | | |
| | |
|
| Games trade and loans receivables | | $ | 53,011 |
| | $ | 38,070 |
|
| FinTech trade and loans receivables | | 18,890 |
| | 10,780 |
|
| Other receivables | | 1,333 |
| | 1,570 |
|
| Total trade and other receivables, net | | $ | 73,234 |
|
| $ | 50,420 |
|
| Non-current portion of receivables | | | | |
| Games trade and loans receivables | | (2,922 | ) | | (1,267 | ) |
FinTech trade and loans receivables(1) | | (5,925 | ) | | (1,371 | ) |
| Total non-current portion of receivables | | $ | (8,847 | ) | | $ | (2,638 | ) |
| Total trade and other receivables, current portion | | $ | 64,387 |
|
| $ | 47,782 |
|
(1) In connection with the adoption of ASC 606 utilizing the modified retrospective transition method, we recorded an immaterial cumulative adjustment with respect to certain amounts that had been previously deferred under the then existing revenue recognition guidance as of December 31, 2017 that required recognition under ASC 606 as of the effective date of adoption in accumulated deficit.
At least quarterly, we evaluate the collectability of the outstanding balances and establish a reserve for the
face amount of the expected losses on our receivables. The allowance for doubtful accounts for trade receivables
includeswas approximately $6.4 million and $4.7 million as of December 31, 2018 and 2017, respectively, and included approximately $3.2 million and $2.7 million of check warranty reserves,
for both Games and Payments receivables.respectively. The provision for doubtful
customer accounts
receivable is generally included within operating expenses in the Statements of
Loss. We also have a provision for doubtful accounts specifically associated with our outstanding check warranty receivables, which is included within Payments cost of revenues (exclusive of depreciation and amortization) in the Statements of Loss. The outstanding balances of the check warranty and general reserves were $2.7 million and $2.0 million, respectively, as of December 31, 2017 and $2.7 million and $2.0 million, respectively, as of December 31, 2016.84
Income (Loss).
A summary activity of the reserve for check warranty losses is as follows (in thousands):
| | Amount | |
Balance, December 31, 2014 | | $ | 2,784 | |
Warranty expense provision | | | 9,263 | |
Charge-offs against reserve | | | (9,074 | ) |
Balance, December 31, 2015 | | | 2,973 | |
Warranty expense provision | | | 8,694 | |
Charge-offs against reserve | | | (8,972 | ) |
Balance, December 31, 2016 | | | 2,695 | |
Warranty expense provision | | | 9,418 | |
Charge-offs against reserve | | | (9,404 | ) |
Balance, December 31, 2017 | | $ | 2,709 | |
6.
|
| | | |
| | Amount |
| Balance, December 31, 2015 | $ | 2,973 |
|
| Warranty expense provision | 8,694 |
|
| Charge-offs against reserve | (8,972 | ) |
| Balance, December 31, 2016 | 2,695 |
|
| Warranty expense provision | 9,418 |
|
| Charge-offs against reserve | (9,404 | ) |
| Balance, December 31, 2017 | 2,709 |
|
| Warranty expense provision | 9,819 |
|
| Charge-offs against reserve | (9,366 | ) |
| Balance, December 31, 2018 | $ | 3,162 |
|
Our inventory primarily consists of component parts as well as work-in-progress and finished goods. The cost of inventory includes cost of materials, labor, overhead and freight. The inventory is stated at the lower of cost or net realizable value and accounted for using the FIFO method.
There was no material impairment of our inventory for the years ended December 31, 2018 and 2017.
We recorded an immaterial impairment charge of approximately $1.8 million in our Games segment for the year ended December 31, 2018 to reduce the carrying value of certain component parts to their fair values. The adjustment was included in operating expenses in our Statements of Income (Loss).
Inventory consisted of the following (in thousands):
| | At December 31, | |
| | 2017 | | | 2016 | |
Inventory | | | | | | | | |
Raw materials and component parts, net of reserves of $1,327 and $2,155 at December 31, 2017 and 2016, respectively | | $ | 18,782 | | | $ | 12,570 | |
Work-in-progress | | | 985 | | | | 1,502 | |
Finished goods | | | 4,200 | | | | 4,996 | |
Total inventory | | $ | 23,967 | | | $ | 19,068 | |
7.
|
| | | | | | | | |
| | | At December 31, |
| | | 2018 | | 2017 |
| Inventory | | |
| | |
|
| Component parts, net of reserves of $1,468 and $1,327 at December 31, 2018 and December 31, 2017, respectively | | $ | 23,197 |
| | $ | 18,782 |
|
| Work-in-progress | | 280 |
| | 985 |
|
| Finished goods | | 926 |
| | 4,200 |
|
| Total inventory | | $ | 24,403 |
|
| $ | 23,967 |
|
8. PREPAID AND OTHER ASSETS
Prepaid and other assets include the balance of prepaid expenses, deposits, debt issuance costs on our
New Revolving Credit Facility (defined herein), restricted cash and other assets. The current portion of these assets is included in prepaid and other assets and the non-current portion is included in other assets, both of which are contained within
theour Balance Sheets.
The balance
of the current portion of prepaid and other assets
current consisted of the following (in thousands):
| | At December 31, | |
| | 2017 | | | 2016 | |
Prepaid expenses and other assets | | | | | | | | |
Deposits | | $ | 9,003 | | | $ | 8,622 | |
Prepaid expenses | | | 6,426 | | | | 5,937 | |
Other | | | 5,241 | | | | 3,489 | |
Total prepaid expenses and other assets | | $ | 20,670 | | | $ | 18,048 | |
85
|
| | | | | | | | |
| | | At December 31, |
| | | 2018 | | 2017 |
| Prepaid expenses and other assets | | |
| | |
|
| Deposits | | $ | 8,241 |
| | $ | 9,003 |
|
| Prepaid expenses | | 8,351 |
| | 6,426 |
|
| Other | | 3,667 |
| | 5,241 |
|
| Total prepaid expenses and other assets | | $ | 20,259 |
|
| $ | 20,670 |
|
The balance of
the non-current portion of other assets
non-current consisted of the following (in thousands):
| | At December 31, | |
| | 2017 | | | 2016 | |
Other assets | | | | | | | | |
Prepaid expenses and deposits | | $ | 4,103 | | | $ | 3,399 | |
Debt issuance costs of revolving credit facility | | | 849 | | | | 689 | |
Other | | | 2,657 | | | | 3,434 | |
Total other assets | | $ | 7,609 | | | $ | 7,522 | |
8.
|
| | | | | | | | |
| | | At December 31, |
| | | 2018 | | 2017 |
| Other assets | | |
| | |
|
| Prepaid expenses and deposits | | $ | 5,289 |
| | $ | 4,103 |
|
| Debt issuance costs of revolving credit facility | | 654 |
| | 849 |
|
| Other | | 309 |
| | 2,657 |
|
| Total other assets | | $ | 6,252 |
|
| $ | 7,609 |
|
9. PROPERTY, EQUIPMENT AND LEASED ASSETS
Property, equipment and leased assets consist of the following
(amounts in(in thousands):
| | | | At December 31, 2017 | | | At December 31, 2016 | |
| | Useful Life | | | | | | Accumulated | | | Net Book | | | | | | | Accumulated | | | Net Book | |
| | (Years) | | Cost | | | Depreciation | | | Value | | | Cost | | | Depreciation | | | Value | |
Property, equipment and leased assets | | | | | | | | | | | | | | | | | | | | | | | | | | |
Rental pool - deployed | | 2-4 | | $ | 162,319 | | | $ | 80,895 | | | $ | 81,424 | | | $ | 123,812 | | | $ | 59,188 | | | $ | 64,624 | |
Rental pool - undeployed | | 2-4 | | | 17,366 | | | | 9,374 | | | | 7,992 | | | | 13,456 | | | | 5,721 | | | | 7,735 | |
Cash access equipment | | 3-5 | | | 25,907 | | | | 18,654 | | | | 7,253 | | | | 25,127 | | | | 15,688 | | | | 9,439 | |
Leasehold and building improvements | | Lease Term | | | 10,981 | | | | 5,211 | | | | 5,770 | | | | 10,023 | | | | 3,698 | | | | 6,325 | |
Machinery, office and other equipment | | 2-5 | | | 35,167 | | | | 24,087 | | | | 11,080 | | | | 30,424 | | | | 20,108 | | | | 10,316 | |
Total | | | | $ | 251,740 | | | $ | 138,221 | | | $ | 113,519 | | | $ | 202,842 | | | $ | 104,403 | | | $ | 98,439 | |
In the second quarter of 2016, our corporate aircraft was classified as held for sale and sold for $4.8 million during the period. We recognized a $0.9 million loss on the sale of the aircraft, which was included in operating expenses in the Statements of Loss for the year ended December 31, 2016. The aircraft was included in machinery, office and other equipment.
In connection with the sale of certain assets related to our PokerTek products during the year ended December 31, 2015 for a purchase price of $5.4 million, we recorded a gain of approximately $3.9 million, which was included in operating expenses in our Statements of Loss for such period.
|
| | | | | | | | | | | | | | | | | | | | | | | | | | |
| | | | | At December 31, 2018 | | At December 31, 2017 |
| | | Useful Life
(Years) | | Cost | | Accumulated Depreciation | | Net Book Value | | Cost | | Accumulated Depreciation | | Net Book Value |
Property, equipment and
leased assets | | | | | | | | | | | | | | |
| Rental pool - deployed | | 2-4 | | $ | 183,309 |
| | $ | 105,038 |
| | $ | 78,271 |
| | $ | 162,319 |
| | $ | 80,895 |
| | $ | 81,424 |
|
| Rental pool - undeployed | | 2-4 | | 23,825 |
| | 14,680 |
| | 9,145 |
| | 17,366 |
| | 9,374 |
| | 7,992 |
|
| FinTech equipment | | 3-5 | | 27,285 |
| | 21,000 |
| | 6,285 |
| | 25,907 |
| | 18,654 |
| | 7,253 |
|
Leasehold and building
improvements | | Lease
Term | | 11,857 |
| | 6,938 |
| | 4,919 |
| | 10,981 |
| | 5,211 |
| | 5,770 |
|
Machinery, office and other
equipment | | 2-5 | | 46,322 |
| | 28,654 |
| | 17,668 |
| | 35,167 |
| | 24,087 |
| | 11,080 |
|
| Total | | | | $ | 292,598 |
|
| $ | 176,310 |
|
| $ | 116,288 |
|
| $ | 251,740 |
|
| $ | 138,221 |
|
| $ | 113,519 |
|
Depreciation expense related to
other property, equipment and leased assets totaled approximately
$61.2 million, $47.3 million,
$50.0 million and
$45.6$50.0 million for the years ended December 31,
2018, 2017,
and 2016,
and 2015, respectively.
There was no material impairment of our property, equipment and leased assets for the years ended December 31, 20172018 and 2016. In connection with our fourth quarter 2015 annual financial statement review, we determined that certain of our Games fixed assets either: (a) had economic lives that were no longer supportable and shortened given approximately one year of experience with the Games segment that resulted in2017.
We recorded an
accelerated depreciationimmaterial impairment charge of approximately
$2.6 million; or (b) were fully impaired as there$0.8 million in our Games segment for the year ended December 31, 2018 to reduce the carrying value of certain leased assets to their fair values. The adjustment was
little to no movementincluded in
the portfolio with recent shipments having been returned and no future deployment anticipated that resultedoperating expenses in
an accelerated depreciation chargeour Statements of
approximately $1.0 million.Income (Loss).
10. GOODWILL AND OTHER INTANGIBLE ASSETS
Goodwill represents the excess of the purchase price over the identifiable tangible and intangible assets acquired plus liabilities assumed arising from business combinations.
86
In accordance with ASC 350, we test goodwill at the reporting unit level, which are identified as operating segments or one level below, for impairment on an annual basis and between annual tests if events and circumstances indicate it is more likely than not that the fair value of a reporting unit is less than its carrying amount.
We test for impairment annually on a reporting unit basis, at the beginning of our fourth fiscal quarter, or more often under certain circumstances. The annual impairment test is completed using either: a qualitative “Step 0” assessment based on reviewing relevant events and circumstances; or a quantitative “Step 1” assessment, which determines the fair value of the reporting unit, using
both an income approach that discounts future cash flows based on the estimated future results of our reporting units and a market approach that compares market multiples of comparable companies to determine whether or not any impairment exists.
In performing our annual goodwill impairment tests, we utilize the approach prescribed under ASC 350. The “Step 1” required a comparison of the carrying amount of each reporting unit to its estimated fair value. To estimate the fair value of our reporting units for “Step 1”, we used a combination of an income valuation approach and a market valuation approach. The income approach is based on a discounted cash flow (“DCF”) analysis. This method involves estimating the after-tax cash flows attributable to a reporting unit and then discounting the after-tax cash flows to a present value, using a risk-adjusted discount rate. Assumptions used in the DCF require the exercise of significant judgment, including, but not limited to: appropriate discount rates and terminal values, growth rates and the amount and timing of expected future cash flows. The
forecastedprojected cash flows are based on our most recent annual budget and projected years beyond. Our budgets and
forecastedprojected cash flows are based on estimated future growth rates. We believe our assumptions are consistent with the plans and estimates used to manage the underlying businesses. The discount rates, which are intended to reflect the risks inherent in future cash flow projections, used in the DCF are based on estimates of the WACC of market participants relative to each respective reporting unit. The market approach considers comparable market data based on multiples of revenue or earnings before interest, taxes, depreciation and amortization (“EBITDA”). If the fair value of a reporting unit is less than its carrying amount, an impairment charge equal to the amount by which the carrying amount of goodwill for the reporting unit exceeds the fair value of that goodwill is recorded in accordance with
the adoption of ASU No 2017-04.ASC 350.
We had approximately
$640.6$640.5 million and
$640.5$640.6 million of goodwill on our Balance Sheets as of December 31,
20172018 and
2016,2017, respectively, resulting from acquisitions of other businesses.
In connection with our annual goodwill impairment testing process for
2018 and 2017, we determined that no impairment
adjustment wasadjustments were necessary. The fair value exceeded the carrying amount for each of the Games, Cash Access Services, Kiosk Sales and Services, Central Credit Services and Compliance Sales and Services reporting
units. units for 2018 and 2017.
In connection with our annual goodwill impairment testing process
for 2016,
and 2015, we determined that impairment adjustments were necessary. The fair value exceeded the carrying amount for each of the Cash Access Services, Kiosk Sales and Services, Central Credit Services and Compliance Sales and Services reporting units, while Games reporting unit had a goodwill impairment of $146.3 million
and $75.0 million for
2016 and 2015, respectively.2016. The
impairmentsimpairment recorded in 2016
and 2015 werewas primarily based upon limited growth and capital expenditure constraints in the gaming industry, consolidation and increased competition in the gaming manufacturing space, stock market volatility, global and domestic economic uncertainty, and lower than forecasted operating profits and cash flows. Based on these indicators, we revised our estimates and assumptions for the Games reporting unit.
Management performs its annual forecasting process, which, among other factors, includes reviewing recent historical results, company-specific variables and industry trends. This process is generally completed in the fourth quarter and considered in conjunction with the annual goodwill impairment evaluation.
The annual evaluation of goodwill
and other non‑amortizing intangible assets requires the use of estimates about future operating results of each reporting unit to determine its estimated fair value. Changes in forecasted operations can materially affect these estimates, which could materially affect our results of operations. The
estimateestimates of fair value
requiresrequire significant judgment and
we base our fair value estimatesare based on assumptions
that we
believedetermined to be reasonable;
buthowever, that are unpredictable and inherently uncertain,
including:including, estimates of future growth rates,
87
operating margins, and assumptions about the overall economic climate as well as the competitive environment for our reporting units. There can be no assurance that our estimates and assumptions made for purposes of our goodwill testing as of the time of testing will prove to be accurate predictions of the future. If our assumptions regarding business plans, competitive environments or anticipated growth rates are not correct, we may be required to record goodwill impairment charges in future periods, whether in connection with our next annual impairment testing, or earlier, if an indicator of an impairment is present prior to our next annual evaluation.
Our reporting units are identified as operating segments or one level below. Reporting units must: (a) engage in business activities from which they earn revenues and incur expenses; (b) have operating results that are regularly reviewed by our segment management to ascertain the resources to be allocated to the segment and assess its performance; and (c) have discrete financial information available.
In 2017, ourOur reporting units included: Games, Cash Access Services, Kiosk Sales and Services, Central Credit Services, and Compliance Sales and Services.
During the year ended December 31, 2016, the Company combined its Cash Advance, ATM and Check Services reporting units into a single Cash Access Services reporting unit to be consistent with the current corporate structure and segment management. The use of different assumptions, estimates or judgments in the goodwill impairment testing process, such as the estimated future cash flows of our reporting units, the discount rate used to discount such cash flows, or the estimated fair value of the reporting units’ tangible and intangible assets and liabilities, could significantly increase or decrease the estimated fair value of a reporting unit or its net assets, and therefore, impact the related impairment charge, if any.Key assumptions used in estimating fair value of the Games reporting unit under the income approach included a discount rate of 9.5% and 10% and a terminal value growth rate of approximately 3% for the years ended December 31, 2017 and 2016. Projected compound average revenue growth rates of approximately 11% and 5.2% were used for the years ended December 31, 2017 and 2016, respectively. The discounted cash flow analyses included estimated future cash inflows from operations and estimated future cash outflows for capital expenditures.
Key assumptions used in estimating fair value of the Games reporting unit under the market approach were based on observed market multiples of enterprise value to revenue and EBITDA for both comparable publicly traded companies and recent merger and acquisition transactions involving similar companies to estimate appropriate controlling basis multiples to apply to each of the reporting units. Based on the multiples implied by this market data, we selected multiples of revenue of approximately 1.4 to 1.6 times and multiples of EBITDA of 6.8 to 7.7 times for the year ended December 31, 2017. We selected multiples of revenue of approximately 3.1 to 3.4 times and multiples of EBITDA of 6.5 to 8.3 times for the year ended December 31, 2016.
The changes in the carrying amount of goodwill are as follows (in thousands):
| | Games | | | Cash Access Services | | | Kiosk Sales and Services | | | Central Credit Services | | | Compliance Sales and Services | | | Total | |
Goodwill | | | | | | | | | | | | | | | | | | | | | | | | |
Balance, December 31, 2015 | | $ | 595,340 | | | $ | 157,035 | | | $ | 5,745 | | | $ | 17,127 | | | $ | 14,556 | | | $ | 789,803 | |
Goodwill impairment | | | (146,299 | ) | | — | | | — | | | — | | | — | | | | (146,299 | ) |
Foreign translation adjustment | | — | | | 20 | | | — | | | — | | | — | | | | 20 | |
Other(1) | | — | | | — | | | — | | | — | | | | (2,978 | ) | | | (2,978 | ) |
Balance, December 31, 2016 | | $ | 449,041 | | | $ | 157,055 | | | $ | 5,745 | | | $ | 17,127 | | | $ | 11,578 | | | $ | 640,546 | |
Foreign translation adjustment | | — | | | | 43 | | | — | | | — | | | — | | | | 43 | |
Balance, December 31, 2017 | | $ | 449,041 | | | $ | 157,098 | | | $ | 5,745 | | | $ | 17,127 | | | $ | 11,578 | | | $ | 640,589 | |
|
| | | | | | | | | | | | | | | | | | | | | | | | |
| | | Games | | Cash Access Services | | Kiosk Sales and Services | | Central Credit Services | | Compliance Sales and Services | | Total |
| Goodwill | | |
| | |
| | |
| | |
| | |
| | |
|
| Balance, December 31, 2016 | | $ | 449,041 |
| | $ | 157,055 |
| | $ | 5,745 |
| | $ | 17,127 |
| | $ | 11,578 |
| | $ | 640,546 |
|
| Foreign translation adjustment | | — |
| | 43 |
| | — |
| | — |
| | — |
| | 43 |
|
| Balance, December 31, 2017 | | $ | 449,041 |
|
| $ | 157,098 |
|
| $ | 5,745 |
|
| $ | 17,127 |
|
| $ | 11,578 |
|
| $ | 640,589 |
|
| Foreign translation adjustment | | — |
| | (52 | ) | | — |
| | — |
| | — |
| | (52 | ) |
| Balance, December 31, 2018 | | $ | 449,041 |
|
| $ | 157,046 |
|
| $ | 5,745 |
|
| $ | 17,127 |
|
| $ | 11,578 |
|
| $ | 640,537 |
|
| (1)
| Includes the final 2016 measurement period adjustments associated with the acquisition of certain assets of Resort Advantage in late 2015.
|
The Company’s cumulative goodwill impairment as of December 31, 2017 was $221.3 million and was comprised of $146.3 million and $75.0 million recognized in 2016 and 2015, respectively, related to our Games segment.
88
Other Intangible Assets
Other intangible assets consist of the following (in thousands):
| | | At December 31, 2017 | | | At December 31, 2016 | |
| | Weighted Average | | | | | | | | | | | | | | | | | | | | | | | | |
| | Remaining Life | | | | | | Accumulated | | | Net Book | | | | | | | Accumulated | | | Net Book | |
| | (years) | | Cost | | | Amortization | | | Value | | | Cost | | | Amortization | | | Value | |
Other intangible assets | | | | | | | | | | | | | | | | | | | | | | | | | | |
Contract rights under placement fee agreements | | 4 | | $ | 57,231 | | | $ | 3,910 | | | $ | 53,321 | | | $ | 17,742 | | | $ | 6,281 | | | $ | 11,461 | |
Customer contracts | | 6 | | | 51,175 | | | | 43,638 | | | | 7,537 | | | | 50,975 | | | | 40,419 | | | | 10,556 | |
Customer relationships | | 8 | | | 231,100 | | | | 63,653 | | | | 167,447 | | | | 231,100 | | | | 42,688 | | | | 188,412 | |
Developed technology and software | | 2 | | | 249,064 | | | | 158,919 | | | | 90,145 | | | | 224,265 | | | | 126,721 | | | | 97,544 | |
Patents, trademarks and other | | 4 | | | 29,046 | | | | 23,185 | | | | 5,861 | | | | 27,771 | | | | 17,747 | | | | 10,024 | |
Total | | | | $ | 617,616 | | | $ | 293,305 | | | $ | 324,311 | | | $ | 551,853 | | | $ | 233,856 | | | $ | 317,997 | |
|
| | | | | | | | | | | | | | | | | | | | | | | | | | |
| | | | | At December 31, 2018 | | At December 31, 2017 |
| | | Weighted Average Remaining Life (Years) | | Cost | | Accumulated Amortization | | Net Book Value | | Cost | | Accumulated Amortization | | Net Book Value |
| Other intangible assets | | | | | | | | | | | | | | |
Contract rights under placement fee agreements | | 4 | | $ | 57,440 |
| | $ | 12,178 |
| | $ | 45,262 |
| | $ | 57,231 |
| | $ | 3,910 |
| | $ | 53,321 |
|
| Customer contracts | | 6 | | 51,175 |
| | 46,162 |
| | 5,013 |
| | 51,175 |
| | 43,638 |
| | 7,537 |
|
| Customer relationships | | 8 | | 231,100 |
| | 84,619 |
| | 146,481 |
| | 231,100 |
| | 63,653 |
| | 167,447 |
|
Developed technology and software | | 2 | | 277,243 |
| | 190,886 |
| | 86,357 |
| | 249,064 |
| | 158,919 |
| | 90,145 |
|
| Patents, trademarks and other | | 4 | | 29,168 |
| | 24,884 |
| | 4,284 |
| | 29,046 |
| | 23,185 |
| | 5,861 |
|
| Total | | | | $ | 646,126 |
|
| $ | 358,729 |
|
| $ | 287,397 |
|
| $ | 617,616 |
|
| $ | 293,305 |
|
| $ | 324,311 |
|
Amortization expense related to other intangible assets totaled approximately
$65.2 million, $69.5 million,
$94.6 million and
$85.5$94.6 million for the years ended December 31,
2018, 2017,
2016 and
2015,2016, respectively. We capitalized
$33.3 million, $29.4 million, and $24.2 million of internal software development costs for the years ended December 31,
2018, 2017, and 2016, respectively.
On a quarterly basis, we evaluate our other intangible assets for potential impairment as part of our quarterly review process. There was no material impairment identified for any of our other intangible assets for the years ended December 31,
2018, 2017,
2016 and
2015.2016.
The anticipated amortization expense related to other intangible assets, assuming no subsequent impairment of the underlying assets, is as follows (in thousands):
| | Anticipated amortization expense | | Amount | | Amount |
2018 | | $ | 66,650 | | |
2019 | | | 53,922 | | $ | 64,380 |
|
2020 | | | 46,283 | | 52,168 |
|
2021 | | | 32,485 | | 41,440 |
|
2022 | | | 30,004 | | 33,473 |
|
| 2023 | | 20,241 |
|
Thereafter | | | 77,694 | | 50,316 |
|
Total(1) | | $ | 307,038 | | $ | 262,018 |
|
| |
| (1) | For the year ended December 31, 2017,2018, the CompanyCompany had $17.3$25.4 million in other intangible assets which had not yet been placed into service.service. |
We enter into placement fee agreements to secure a long-term revenue share percentage and a fixed number of player terminal placements in a gaming facility. The funding under placement fee agreements is not reimbursed. In return for the fees under these agreements, each facility dedicates a percentage of its floor space, or an agreed upon unit count, for the placement of our electronic gaming machines (“EGMs”) over the term of the agreement, generally
from 12 to 83 months, and we receive a fixed percentage or flat fee of those machines’ hold per day. Certain of the agreements contain EGM performance standards that could allow the respective facility to reduce a portion of our guaranteed floor space.
Placement fees and amounts advanced in excess of those to be reimbursed by the customer for real property and land improvements are allocated to intangible assets and are generally amortized over the term of the contract, which is recorded as a reduction of revenue generated from the facility. In the past we have, and in the future, we may, by mutual agreement, amend these agreements to reduce our floor space at the facilities. Any proceeds
89
received for the reduction of floor space are first applied against the intangible asset for that particular placement fee agreement, if any, and the remaining net book value of the intangible asset is prospectively amortized on a straight-line method over the remaining estimated useful life.
In July 2017, we entered into a placement fee agreement with a customer for certain of its locations for approximately $49.1 million, net of $10.1 million of unamortized fees related to superseded contracts. We paid approximately
$22.7 million and $13.3 million in placement fees to this customer for the
year ended December 31, 2017. We paid approximately $11.3 million and $2.8 million to extend the term of placement fee agreements with a customer for certain of its locations for the years ended December 31, 20162018 and 2015,2017, respectively.
During the year ended December 31, 2016, we foreclosed on the Bee Cave assets, evaluated its platform, and began to utilize these assets The payments made in connection with our social gaming strategy to deliver content from our existing game library. Consequently, we extinguished the note receivable and recorded $0.52018 included approximately $2.1 million of developed technology and software within other intangible assets, net on the Balance Sheets during the period.
10.imputed interest.
11. ACCOUNTS PAYABLE AND ACCRUED EXPENSES
The following table presents our accounts payable and accrued expenses (amounts in thousands):
| | At December 31, | |
| | 2017 | | | 2016 | |
Accounts payable and accrued expenses | | | | | | | | |
Trade accounts payable | | $ | 59,435 | | | $ | 55,352 | |
Placement fees(1) | | | 22,328 | | | | — | |
Payroll and related expenses | | | 14,178 | | | | 12,305 | |
Deferred and unearned revenues | | | 10,450 | | | | 9,222 | |
Cash access processing and related expenses | | | 8,932 | | | | 7,001 | |
Accrued interest | | | 5,766 | | | | 82 | |
Accrued taxes | | | 2,112 | | | | 2,587 | |
Other | | | 11,303 | | | | 7,842 | |
Total accounts payable and accrued expenses | | $ | 134,504 | | | $ | 94,391 | |
|
| | | | | | | | |
| | | At December 31, |
| | | 2018 | | 2017 |
| Accounts payable and accrued expenses | | | | |
| Trade accounts payable | | $ | 70,796 |
| | $ | 59,435 |
|
Placement fees(1) | | 16,746 |
| | 22,328 |
|
| Payroll and related expenses | | 15,055 |
| | 14,178 |
|
| Deferred and unearned revenues | | 12,887 |
| | 10,450 |
|
| Other | | 6,303 |
| | 11,303 |
|
| Cash access processing and related expenses | | 4,160 |
| | 8,932 |
|
| Accrued taxes | | 1,917 |
| | 2,112 |
|
| Accrued interest | | 1,374 |
| | 5,766 |
|
| Total accounts payable and accrued expenses | | $ | 129,238 |
|
| $ | 134,504 |
|
| |
| (1) | TotalThe total outstanding balance of the placement feesfee liability was approximately $16.7 million and $39.1 million as of December 31, 2017.2018 and 2017, respectively. The placement fee liability was considered current portion due to the remaining $16.8 millionobligation being due within twelve months of December 31, 2018. The remaining non-current placement fees wasof approximately $16.8 million as of December 31, 2017 were included in other accrued expenses and liabilities in our Balance Sheet.
Sheets. |
11.
The following table summarizes our indebtedness (in thousands):
| | At December 31, | |
| | 2017 | | | 2016 | |
Long-term debt | | | | | | | | |
Senior secured term loan | | $ | 815,900 | | | $ | 465,600 | |
Senior secured notes | | | — | | | | 335,000 | |
Senior unsecured notes | | | 375,000 | | | | 350,000 | |
Total debt | | | 1,190,900 | | | | 1,150,600 | |
Less: debt issuance costs and discount | | | (23,057 | ) | | | (28,720 | ) |
Total debt after debt issuance costs and discount | | | 1,167,843 | | | | 1,121,880 | |
Less: current portion of long-term debt | | | (8,200 | ) | | | (10,000 | ) |
Long-term debt, less current portion | | $ | 1,159,643 | | | $ | 1,111,880 | |
90
Refinancing
|
| | | | | | | | |
| | | At December 31, |
| | | 2018 | | 2017 |
| Long-term debt | | | | |
| Senior secured term loan | | $ | 807,700 |
| | $ | 815,900 |
|
| Senior unsecured notes | | 375,000 |
| | 375,000 |
|
| Total debt | | 1,182,700 |
|
| 1,190,900 |
|
| Debt issuance costs and discount | | (19,484 | ) | | (23,057 | ) |
| Total debt after debt issuance costs and discount | | 1,163,216 |
|
| 1,167,843 |
|
| Current portion of long-term debt | | (8,200 | ) | | (8,200 | ) |
| Long-term debt, less current portion | | $ | 1,155,016 |
|
| $ | 1,159,643 |
|
Refinancings
On May 9, 2017 (the “Closing Date”), Everi Payments, as borrower, and Holdings entered into a credit agreement with the lenders party thereto and Jefferies Finance LLC, as administrative agent, collateral agent, swing line lender, letter of credit issuer, sole lead arranger and sole book manager (amended as described below, the “New Credit Agreement”). The New Credit Agreement provides for: (i) a $35.0 million, five-year senior secured revolving credit facility (the “New Revolving Credit Facility”); and (ii) an $820.0 million, seven-year senior secured term loan facility (the “New Term Loan Facility,” and together with the New Revolving Credit Facility, the “New Credit Facilities”). The fees associated with the New Credit Facilities included discounts of approximately $4.1 million and debt issuance costs of approximately $15.5 million. All borrowings under the New Revolving Credit Facility are subject to the satisfaction of customary conditions, including the absence of defaults and the accuracy of representations and warranties.
The proceeds from the New Term Loan Facility incurred on the Closing Date were used to: (i) refinance: (a) Everi Payments’ existing credit facility with an outstanding balance of approximately $462.3 million with Bank of America, N.A., as administrative agent, collateral agent, swing line lender and letter of credit issuer, Deutsche Bank Securities Inc., as syndication agent, and Merrill Lynch, Pierce, Fenner & Smith Incorporated and Deutsche Bank Securities Inc., as joint lead arrangers and joint book managers (the “Prior Credit Facility”); and (b) Everi Payments’ 7.25% Senior Secured Notes due 2021 in the aggregate original principal amount of $335.0 million (the “Refinanced Secured Notes”); and (ii) pay related transaction fees and expenses.
In connection with the refinancing, we recorded a non-cash charge of approximately $14.6 million during the second quarter of 2017 related to the unamortized deferred financing fees and discounts related to the extinguished term loan under the Prior Credit Facility and the redeemed Refinanced Secured Notes. No prepayment penalties were incurred.
On November 13, 2017 (the “Repricing Closing Date”), we entered into an amendment to the New Credit Agreement (the “First Amendment”) which, among other things, reduced the interest rate on the approximately $818.0 million
then outstandingthen-outstanding balance of the New Term Loan
Facility. TheFacility; however, it did not change the maturity
datedates for the New Term Loan Facility
remains May 9, 2024, the maturity date foror the New Revolving Credit Facility
remains May 9, 2022, and no changes were made toor the financial covenants or other debt repayments terms set forth in the New Credit Agreement. We incurred approximately
$3.0$3.0 million of debt issuance costs and fees associated with the repricing of the New Term Loan Facility.On May 17, 2018, we entered into a Second Amendment (the “Second Amendment”) to the New Credit Agreement, which reduced the interest rate on the $813.9 million outstanding balance of the senior secured term loan under the Credit Agreement by 50 basis points to LIBOR + 3.00% from LIBOR + 3.50% with the LIBOR floor unchanged at 1.00%. The senior secured term loan under the Credit Agreement will be subject to a prepayment premium of 1.00% of the principal amount repaid for any voluntary prepayment or mandatory prepayment with proceeds of debt that has a lower effective yield than the repriced term loan or any amendment to the repriced term loan that reduces the interest rate thereon, in each case, to the extent occurring within six months of the effective date of the Second Amendment. The maturity date for the Credit Agreement remains May 9, 2024, and no changes were made to the financial covenants or other debt repayment terms. We incurred approximately $1.3 million of debt issuance costs and fees associated with the repricing of the New Term Loan Facility.
The New Term Loan Facility matures seven years after the Closing Date and the New Revolving Credit Facility matures five years after the Closing Date. The New Revolving Credit Facility is available for general corporate purposes, including permitted acquisitions, working capital and the issuance of letters of credit.
The interest rate per annum applicable to loans under the New Revolving Credit Facility is, at Everi Payments’ option, the base rate or the Eurodollar Rate (defined to be the London Interbank Offered Rate or a comparable or successor rate) (the “Eurodollar Rate”) plus, in each case, an applicable margin. The interest rate per annum applicable to the New Term Loan Facility also is, at Everi Payments’ option, the base rate or the Eurodollar Rate plus, in each case, an applicable margin. The Eurodollar Rate is reset at the beginning of each selected interest period based on the Eurodollar Rate then in effect; provided that, if the Eurodollar Rate is below zero, then such rate will be equal to zero plus the applicable margin. The base rate is a fluctuating interest rate equal to the highest of: (i) the prime lending rate announced by the administrative agent; (ii) the federal funds effective rate from time to time plus 0.50%; and (iii) the Eurodollar Rate (after taking account of any applicable floor) applicable for an interest period of one month plus 1.00%. Prior to the effectiveness of the First Amendment on the Repricing Closing Date, the applicable margins for both the New Revolving Credit Facility and the New Term Loan Facility were: (i) 4.50% in respect of Eurodollar Rate loans and (ii) 3.50% in respect of base rate loans. The applicable margins for the New Term Loan Facility from and after the effectiveness of the First Amendment on the Repricing Closing Date
are:through the effectiveness of the Second Amendment were: (i) 3.50% in respect of Eurodollar Rate loans and (ii) 2.50% in respect of base rate loans.
91
The applicable margins for the New Term Loan Facility from and after the effectiveness of the Second Amendment are: (i) 3.00% in respect of Eurodollar Rate loans and (ii) 2.00% in respect of base rate loans.
Voluntary prepayments of the term loan and the revolving loans and voluntary reductions in the unused commitments are permitted in whole, or in part, in minimum amounts as set forth in the New Credit Agreement governing the New Credit Facilities, with prior notice,
buthowever, without premium or penalty, except that certain refinancings of the term loans within six months after the Repricing Closing Date will be subject to a prepayment premium of 1.00% of the principal amount repaid.
Subject to certain exceptions, the obligations under the New Credit Facilities are secured by substantially all of the present and subsequently acquired assets of each of Everi Payments, Holdings and the subsidiary guarantors party thereto including: (i) a perfected first priority pledge of all the capital stock of Everi Payments and each domestic direct, wholly owned material restricted subsidiary held by Holdings, Everi Payments or any such subsidiary guarantor; and (ii) a perfected first priority security interest in substantially all other tangible and intangible assets of Holdings, Everi Payments, and such subsidiary guarantors (including, but not limited to, accounts receivable, inventory, equipment, general intangibles, investment property, real property, intellectual property and the proceeds of the foregoing). Subject to certain exceptions, the New Credit Facilities are unconditionally guaranteed by Holdings and such subsidiary guarantors.
The New Credit Agreement governing the New Credit Facilities contains certain covenants that, among other things, limit Holdings’ ability, and the ability of certain of its subsidiaries, to incur additional indebtedness, sell assets or consolidate or merge with or into other companies, pay dividends or repurchase or redeem capital stock, make certain investments, issue capital stock of subsidiaries, incur liens, prepay, redeem or repurchase subordinated debt, and enter into certain types of transactions with its affiliates. The New Credit Agreement governing the New Credit Facilities also requires Holdings, together with its subsidiaries, to comply with a consolidated secured leverage ratio. At December 31,
2017,2018, our consolidated secured leverage ratio was
3.593.28 to 1.00, with a maximum allowable ratio of
5.004.75 to 1.00. Our maximum consolidated secured leverage
ratio will be
4.75reduced to
1.00 as of December 31, 2018, 4.50 to 1.00 as of December 31, 2019, 4.25 to 1.00 as of December 31, 2020, and 4.00 to 1.00 as of December 31, 2021 and each December 31 thereafter.
We were in compliance with the covenants and terms of the New Credit Facilities as of December 31,
2017.2018.
Events of default under the New Credit Agreement governing the New Credit Facilities include customary events such as a cross-default provision with respect to other material debt. In addition, an event of default will occur if Holdings undergoes a change of control. This is defined to include the case where Holdings ceases to own 100% of the equity interests of Everi Payments, or where any person or group acquires a percentage of the economic or voting interests of Holdings’ capital stock of 35% or more (determined on a fully diluted basis).
We are required to repay the New Term Loan Facility in an amount equal to 0.25% per quarter of the initial aggregate principal, with the final principal repayment installment on the maturity date. Interest is due in arrears on each interest payment date applicable thereto and at such other times as may be specified in the New Credit Agreement. As to any loan other than a base rate loan, the interest payment dates shall be the last day of each interest period applicable to such loan and the maturity date (provided, however, that if any interest period for a Eurodollar Rate loan exceeds three months, the respective dates that fall every three months after the beginning of such interest period shall also be interest payment dates). As to any base rate loan, the interest payment dates shall be last business day of each March, June, September and December and the maturity date.
For the
period from January 1, 2017 to the Closing Date, the Prior Credit Facility had an applicable weighted average interest rate of 6.43%. For the period from the Closing Date toyear ended December 31,
2017,2018, the New Term Loan Facility had an applicable weighted average interest rate of
5.55%5.17%.
Together, for the year ended December 31, 2017, the two facilities had a blended weighted average interest rate of 5.73%.
At December 31,
2017,2018, we had approximately
$815.9$807.7 million of borrowings outstanding under the New Term Loan Facility and no borrowings outstanding under the New Revolving Credit Facility. We had $35.0 million of additional borrowing availability under the New Revolving Credit Facility as of December 31,
2017.92
2018.
Refinanced Senior Secured Notes
In connection with entering into the New Credit Agreement, on May 9, 2017, Everi Payments redeemed in full all outstanding Refinanced Secured Notes in the aggregate principal amount of $335.0 million plus accrued and unpaid interest. As a result of the redemption, the Company recorded non-cash charges in the amount of approximately $1.7 million, which consisted of unamortized deferred financing fees of $0.2 million and discounts of $1.5 million, which were included in the total $14.6 million non-cash charge.
In December 2014, we issued $350.0 million in aggregate principal amount of 10.0% Senior Unsecured Notes due 2022 (the “2014 Unsecured Notes”) under an indenture (as supplemented, the “2014 Notes Indenture”), dated December 19, 2014, between Everi Payments (as successor issuer), and Deutsche Bank Trust Company Americas, as trustee. The fees associated with the 2014 Unsecured Notes included original issue discounts of approximately $3.8 million and debt issuance costs of approximately $14.0 million. In December 2015, we completed an exchange offer in which all of the unregistered 2014 Unsecured Notes were exchanged for a like amount of 2014 Unsecured Notes that had been registered under the Securities Act.
In December 2017, we issued $375.0 million in aggregate principal amount of 7.50% Senior Unsecured Notes due 2025 (the “2017 Unsecured Notes”) under an indenture (the “2017 Notes Indenture”), dated December 5, 2017, among Everi Payments (as issuer), Holdings and certain of its direct and indirect domestic subsidiaries as guarantors, and Deutsche Bank Trust Company Americas, as trustee. Interest on the 2017 Unsecured Notes accrues at a rate of 7.50% per annum and is payable semi-annually in arrears on each June 15 and December 15, commencing on June 15, 2018. The 2017 Unsecured Notes will mature on December 15, 2025. We incurred approximately
$6.1$6.1 million of debt issuance costs and fees associated with the refinancing of our 2017 Unsecured Notes.On December 5, 2017, together with the issuance of the 2017 Unsecured Notes, Everi Payments satisfied and discharged the 2014 Notes Indenture relating to the 2014 Unsecured Notes. To effect the satisfaction and discharge, Everi Payments issued an unconditional notice of redemption to Deutsche Bank Trust Company Americas, as trustee, of the redemption in full on January 15, 2018 (the “Redemption Date”) of all outstanding 2014 Unsecured Notes under the terms of the 2014 Notes Indenture. In addition, using the proceeds from the sale of the 2017 Unsecured Notes and cash on hand, Everi Payments irrevocably deposited with the trustee funds sufficient to pay the redemption price of the 2014 Unsecured Notes of 107.5% of the principal amount thereof, plus accrued and unpaid interest to, but not including, the Redemption Date (the “Redemption Price”), and irrevocably instructed the trustee to apply the deposited money toward payment of the Redemption Price for the 2014 Unsecured Notes on the Redemption Date. Upon the trustee’s receipt of such funds and instructions, along with an officer’s certificate of Everi Payments and an opinion of counsel certifying and opining that all conditions under the 2014 Notes Indenture to the satisfaction and discharge of the 2014 Notes Indenture had been satisfied, the 2014 Notes Indenture was satisfied and discharged, and all of the obligations of Everi Payments and the guarantors under the 2014 Notes Indenture ceased to be of further effect, as of December 5, 2017 (subject to certain exceptions). The 2014 Unsecured Notes were thereafter redeemed on the Redemption Date.
In connection with the issuance of the 2017 Unsecured Notes and the redemption of the 2014 Unsecured Notes, we incurred
a $37.2 million loss on extinguishment of debt consisting of a $26.3 million make-whole premium related to the satisfaction and redemption of the 2014 Unsecured Notes and approximately $10.9 million for the write-off of related unamortized debt issuance costs and fees.We were in compliance with the terms of the 2017 Unsecured Notes as of December 31,
2017.93
2018.
The maturities of our borrowings at December 31,
20172018 are as follows (in thousands):
| | Amount | |
Maturities of borrowings | | | | |
2018 | | $ | 8,200 | |
2019 | | | 8,200 | |
2020 | | | 8,200 | |
2021 | | | 8,200 | |
2022 | | | 8,200 | |
Thereafter | | | 1,149,900 | |
Total | | $ | 1,190,900 | |
12.
|
| | | |
| | Amount |
| Maturities of borrowings | |
| 2019 | $ | 8,200 |
|
| 2020 | 8,200 |
|
| 2021 | 8,200 |
|
| 2022 | 8,200 |
|
| 2023 | 8,200 |
|
| Thereafter | 1,141,700 |
|
| Total | $ | 1,182,700 |
|
13. COMMITMENTS AND CONTINGENCIES
Placement Fee Arrangements
In July 2017, we extended the term of our
then existingthen-existing placement fee agreement to 6 years and 11 months with our largest customer in Oklahoma. Under the terms of the agreement, we will pay approximately $5.6 million per quarter in placement fees, inclusive of imputed interest, beginning in January 2018 and ending in July 2019. We paid approximately
$22.7 million and $13.3 million in placement fees to this customer for the
yearyears ended December 31,
2017. 2018 and 2017, respectively. The payments made in 2018 included approximately $2.1 million of imputed interest.
We lease office facilities and operating equipment under cancelable and non-cancelable agreements. Total rent expense was approximately
$6.8$7.8 million, $6.8 million, and
$5.9$6.8 million for the years ended December 31,
2018, 2017,
and 2016,
and 2015, respectively.
We have a long‑term lease agreement related to office space for our corporate headquarters located in Las Vegas, Nevada that expires in April 2023.
In September 2014, the long-term lease agreement for office space in Austin, Texas was extended through June 2021.
We also have leased facilities in Chicago, Illinois and Reno, Nevada, which support the design, production and expansion of our gaming content. The long-term lease agreement for our Chicago facilities commenced in November 2015 and expires in June 2023. The long-term lease agreement for our Reno facilities commenced in February 2016 and expires in May 2021.
As of December 31,
2017,2018, the minimum aggregate rental commitment under all non‑cancelable operating leases were as follows (in thousands):
| | Amount | |
Minimum aggregate rental commitments | | | | |
2018 | | $ | 4,943 | |
2019 | | | 5,050 | |
2020 | | | 5,046 | |
2021 | | | 4,007 | |
2022 | | | 2,193 | |
Thereafter | | | 868 | |
Total | | $ | 22,107 | |
94
|
| | | |
| | Amount |
| Minimum aggregate rental commitments | |
| 2019 | $ | 5,570 |
|
| 2020 | 5,680 |
|
| 2021 | 4,598 |
|
| 2022 | 2,799 |
|
| 2023 | 1,074 |
|
| Thereafter | — |
|
| Total | $ | 19,721 |
|
Litigation Claims and Assessments
We are subject to claims and suits that arise from time to time in the ordinary course of business. We do not believe the liabilities, if any, which may ultimately result from the outcome of such matters, individually or in the aggregate, will have a material adverse impact on our financial position, liquidity, or results of operations.
Gain Contingency Settlement
In January 2015, we entered into a settlement agreement in connection with a lawsuit we participated in as plaintiffs, pursuant to which we received and recorded the settlement proceeds of $14.4 million in the first quarter of 2015. This settlement is included as a reduction of operating expenses in our Statements of Loss for the year ended December 31, 2015.
13.
Preferred Stock.Our amended and restated certificate of incorporation, as amended, allows our Board of Directors, without further action by stockholders, to issue up to 50,000,000 shares of preferred stock in one or more series and to fix the designations, powers, preferences, privileges and relative participating, optional, or special rights as well as the qualifications, limitations or restrictions of the preferred stock, including dividend rights, conversion rights, voting rights, terms of redemption and liquidation preferences. As of December 31, 20172018 and 2016,2017, we had no shares of preferred stock outstanding. Common Stock.Subject to the preferences that may apply to shares of preferred stock that may be outstanding at the time, the holders of outstanding shares of common stock are entitled to receive dividends out of assets legally available at the times and in the amounts as our Board of Directors may from time to time determine. All dividends are non-cumulative. In the event of the liquidation, dissolution or winding up of Everi, the holders of common stock are entitled to share ratably in all assets remaining after the payment of liabilities, subject to the prior distribution rights of preferred stock, if any, then outstanding. Each stockholder is entitled to one vote for each share of common stock held on all matters submitted to a vote of stockholders. Cumulative voting for the election of directors is not provided for. The common stock is not entitled to preemptive rights and is not subject to conversion or redemption. There are no sinking fund provisions applicable to the common stock. Each outstanding share of common stock is fully paid and non-assessable. As of December 31, 20172018 and 2016,2017, we had 93,119,98895,099,532 and 90,952,18593,119,988 shares of common stock issued, respectively. Treasury Stock. Employees may direct us to withhold vested shares of restricted stock to satisfy the minimum statutory withholding requirements applicable to their restricted stock vesting. We repurchased or withheld from restricted stock awards 15,45717,552 and 18,71715,457 shares of common stock at an aggregate purchase price of $0.1 million and $41,528 for the years ended December 31, 20172018 and 2016, respectively,2017 to satisfy the minimum applicable tax withholding obligations related to the vesting of such restricted stock awards.14.
15. WEIGHTED AVERAGE SHARES OF COMMON STOCK
The weighted average number of common stock outstanding used in the computation of basic and diluted earnings per share is as follows (in thousands):
| | | | At December 31, | | | At December 31, |
| | 2017 | | | 2016 | | | 2015 | | | 2018 | | 2017 | | 2016 |
Weighted average shares | | | | | | | | | | | | | | | | | | |
Weighted average number of common shares outstanding - basic | | | 66,816 | | | | 66,050 | | | | 65,854 | | | 69,464 |
| | 66,816 |
| | 66,050 |
|
Potential dilution from equity awards(1)
| | | 4,332 |
| | — |
| | — |
|
Weighted average number of common shares outstanding - diluted(1) | | | 66,816 | | | | 66,050 | | | | 65,854 | | | 73,796 |
| | 66,816 |
| | 66,050 |
|
| |
| (1) | The potential dilution excludes the weighted average effect of equity awards to purchase approximately 7.5 million shares of common stock for the year ended December 31, 2018, as the application of the treasury stock method, as required, makes them anti-dilutive. The Company was in a net loss position for the years ended December 31, 2017 2016 and 2015;2016; therefore, no potential dilution from the application of the treasury stock method was applicable. Equity awards to purchase approximately 16.0 million 15.7 million and 14.215.7 million shares of common stock for the years ended December 31, 2017 2016 and 2015,2016, respectively, were excluded from the computation of diluted net loss per share, as their effect would have been anti-dilutive. |
95
15.
16. SHARE‑BASED COMPENSATION
Our 2014 Equity Incentive Plan
(the “2014(as amended and restated effective May 23, 2017, the “Amended and Restated 2014 Plan”) and our 2012 Equity Incentive Plan (as amended, the “2012 Plan”) are used to attract and retain the best available personnel, to provide additional incentives to employees, directors and consultants and to promote the success of our business.
The 2014 Plan superseded the then current 2005 Stock Incentive Plan (the “2005 Plan”). The 2012 Plan was assumed in connection with our acquisition of Everi Games Holding and conformed to include similar provisions to those as set forth in the 2014 Plan. Our equity incentive plans are administered by the Compensation Committee of our Board of Directors, which has the authority to select individuals who are to receive equity incentive awards and to specify the terms and conditions of grants of such awards, including, but not limited
to:to the vesting provisions and exercise prices.
Generally, we grant the following award types: (a) time-based options,options; (b) market-based optionsoptions; (c) time-based restricted stock; and (c)(d) restricted stock. Thesestock units (“RSUs”) with either time- or performance-based criteria.
A summary of award activity is as follows (in thousands):
|
| | | | | | | | | |
| | | Stock Options Granted | | Restricted Stock Awards Granted | | Restricted Stock Units Granted |
| Outstanding, December 31, 2017 | | 19,131 |
| | 74 |
| | — |
|
| Granted | | 20 |
| | — |
| | 1,877 |
|
| Exercised options or vested shares | | (1,980 | ) | | (66 | ) | | — |
|
| Cancelled or forfeited | | (1,497 | ) | | — |
| | (80 | ) |
| Outstanding, December 31, 2018 | | 15,674 |
|
| 8 |
| | 1,797 |
|
There were approximately 3.6 million awards
have varying vesting provisionsof our common stock available for future equity grants, both under the Amended and
expiration periods. ForRestated 2014 Plan and the
year ended2012 Plan as of December 31,
2017, we granted time- and market-based options.2018.
Stock Options
Our time-based stock options
granted under our equity plans generally vest at a rate of 25% per year on each of the first four anniversaries of the
option grant dates and
the options expire after a ten-year period.
We estimate forfeiture amounts based on historical patterns.
Our market-based options granted in 2017 and 2016 under our 2014 Plan and 2012 Plan vest at a rate of 25% per year on each of the first four anniversaries of the grant date, provided that as of the vesting date for each vesting tranche, the closing price of the Company’s shares on the New York Stock Exchange is at least a specified price hurdle, defined as a 25% and 50% premium for 2017 and 2016, respectively, to the closing stock price on the grant date. If the price hurdle is not met as of the vesting date for a vesting tranche, then the vested tranche shall vest and become vested shares on the last day of a period of 30 consecutive trading days during which the closing price is at least the price hurdle. These options expire after a ten-year period.
Our
There were no market-based
stock optionsoption awards granted
in 2015 vest if our average stock price in any period of 30 consecutive trading days meets certain target prices during
a four-year period that commenced on the
date of grant for these options. These options expire after a seven-year period.A summary of award activity is as follows (in thousands):
| | Stock Options | | | Restricted Stock | |
| | Granted | | | Granted | |
Outstanding, December 31, 2016 | | | 18,233 | | | | 80 | |
Granted | | | 4,338 | | | | 50 | |
Exercised options or vested shares | | | (2,037 | ) | | | (56 | ) |
Cancelled or forfeited | | | (1,403 | ) | | | — | |
Outstanding, December 31, 2017 | | | 19,131 | | | | 74 | |
As ofyear ended December 31, 2017, the maximum number of shares available for future equity awards under the 2012 Plan and the 2014 Plan is approximately 4.4 million shares of our common stock. There are no shares available for future equity awards under the 2005 Plan.
96
Stock Options
2018.
The fair
valuevalues of our standard time-based options
waswere determined as of the date of grant using the Black-Scholes option pricing model with the following assumptions:
| | Year ended |
| | December 31, |
| | 2017 | | | 2016 | | | 2015 | |
Risk-free interest rate | | 2 | % | | 1 | % | | 1 | % |
Expected life of options (in years) | | 6 | | | 5 | | | 4 | |
Expected volatility | | 54 | % | | 51 | % | | 43 | % |
Expected dividend yield | | — | % | | — | % | | — | % |
During 2016, certain executive and director grants were valued under the Black-Scholes option pricing model that utilized different assumptions from those used for our standard time-based options. For the time-based options granted on February 13, 2016, the assumptions were: (a) risk-free interest rate of 1%; (b) expected term of six years; (c) expected volatility of 49%; and (d) no expected dividend yield. For the time-based options granted on February 25, 2016, the assumptions were: (a) risk-free interest rate of 1%; (b) expected term of five years; (c) expected volatility of 49%; and (d) no expected dividend yield.
|
| | | | | | | | | |
| | | Year Ended December 31, |
| | | 2018 | | 2017 | | 2016 |
| Risk-free interest rate | | 3 | % | | 2 | % | | 1 | % |
| Expected life of options (in years) | | 6 |
| | 6 |
| | 5 |
|
| Expected volatility | | 53 | % | | 54 | % | | 51 | % |
| Expected dividend yield | | — |
| | — |
| | — |
|
The fair values of
our market-based options
granted in connection with the annual grants that occurred during the first quarter of 2017 and the second quarters of 2016 and 2015 were determined as of the date of grant using a lattice-based option valuation model with the following assumptions:
| | Year ended |
| | December 31, |
| | 2017 | | | 2016 | | | 2015 | |
Risk-free interest rate | | 3 | % | | 2 | % | | 1 | % |
Measurement period (in years) | | 10 | | | 10 | | | 4 | |
Expected volatility | | 70 | % | | 68 | % | | 47 | % |
Expected dividend yield | | — | % | | — | % | | — | % |
For the market-based options granted during the third quarter of 2016, the assumptions were: (a) risk-free interest rate of 2%; (b) expected term of ten years; (c) expected volatility of 69%; and (d) no expected dividend yield. For the market-based options granted during the fourth quarter of 2016, the assumptions were: (a) risk-free interest rate of 2%; (b) expected term of ten years; (c) expected volatility of 70%; and (d) no expected dividend yield.
|
| | | | | | |
| | | Year Ended December 31, |
| | | 2017 | | 2016 |
| Risk-free interest rate | | 3 | % | | 2 | % |
| Measurement period (in years) | | 10 |
| | 10 |
|
| Expected volatility | | 70 | % | | 68 | % |
| Expected dividend yield | | — |
| | — |
|
The following
tables presenttable presents the
optionoptions activity:
| | | | | | | | | | Weighted | | | | | |
| | Number of | | | Weighted Average | | | Average Life | | | Aggregate | |
| | Options | | | Exercise Price | | | Remaining | | | Intrinsic Value | |
| | (in thousands) | | | (per share) | | | (years) | | | (in thousands) | |
Outstanding, December 31, 2016 | | | 18,233 | | | $ | 6.02 | | | | 6.4 | | | $ | 2,387 | |
Granted | | | 4,338 | | | | 3.62 | | | | | | | | | |
Exercised | | | (2,037 | ) | | | 5.35 | | | | | | | | | |
Canceled or forfeited | | | (1,403 | ) | | | 8.79 | | | | | | | | | |
Outstanding, December 31, 2017 | | | 19,131 | | | $ | 5.34 | | | | 6.4 | | | $ | 45,887 | |
Vested and expected to vest, December 31, 2017 | | | 16,991 | | | $ | 5.36 | | | | 6.5 | | | $ | 40,636 | |
Exercisable, December 31, 2017 | | | 8,719 | | | $ | 6.51 | | | | 5.4 | | | $ | 12,200 | |
97
|
| | | | | | | | | | | | | |
| | | Number of Options (in thousands) | | Weighted Average Exercise Price (per Share) | | Weighted Average Life Remaining (Years) | | Aggregate Intrinsic Value (in thousands) |
| Outstanding, December 31, 2017 | | 19,131 |
| | $ | 5.34 |
| | 6.4 | | $ | 45,887 |
|
| Granted | | 20 |
| | 7.88 |
| | | | |
| Exercised | | (1,980 | ) | | 4.84 |
| | | | |
| Canceled or forfeited | | (1,497 | ) | | 5.51 |
| | | | |
| Outstanding, December 31, 2018 | | 15,674 |
| | $ | 5.39 |
| | 6.0 | | $ | 17,733 |
|
| Vested and expected to vest, December 31, 2018 | | 14,947 |
| | $ | 5.44 |
| | 5.9 | | $ | 16,559 |
|
| Exercisable, December 31, 2018 | | 9,728 |
| | $ | 6.15 |
| | 5.3 | | $ | 7,284 |
|
The following table presents the options outstanding and exercisable by price range:
| | | | | | | | Options Outstanding | | | Options Exercisable | |
| | | | | | | | | | | | Weighted | | | | | | | | | | | | | |
| | | | | | | | | | | | Average | | | Weighted | | | | | | | Weighted | |
| | | | | | | | Number | | | Remaining | | | Average | | | Number | | | Average | |
| | | | | | | | Outstanding | | | Contract | | | Exercise | | | Exercisable | | | Exercise | |
Range of Exercise Prices | | | (in thousands) | | | Life (Years) | | | Prices | | | (in thousands) | | | Price | |
$ | 1.46 | | | $ | 1.72 | | | | 3,177 | | | | 7.7 | | | $ | 1.48 | | | | 665 | | | $ | 1.48 | |
| 2.01 | | | | 2.78 | | | | 821 | | | | 7.2 | | | | 2.62 | | | | 606 | | | | 2.64 | |
| 3.29 | | | | 3.29 | | | | 3,886 | | | | 8.6 | | | | 3.29 | | | | 6 | | | | 3.29 | |
| 3.41 | | | | 6.59 | | | | 3,222 | | | | 5.0 | | | | 5.87 | | | | 2,384 | | | | 5.63 | |
| 6.72 | | | | 7.61 | | | | 1,749 | | | | 4.7 | | | | 7.15 | | | | 1,407 | | | | 7.10 | |
| 7.74 | | | | 9.74 | | | | 6,276 | | | | 5.5 | | | | 8.15 | | | | 3,651 | | | | 8.42 | |
| | | | | | | | | 19,131 | | | | | | | | | | | | 8,719 | | | | | |
|
| | | | | | | | | | | | | | | | | | | | | | |
| | | | | Options Outstanding | | Options Exercisable |
| | | | | Number Outstanding | | Weighted Average Remaining Contract | | Weighted Average Exercise | | Number Exercisable | | Weighted Average Exercise |
| Range of Exercise Prices | | (in thousands) | | Life (Years) | | Prices | | (in thousands) | | Price |
| $ | 1.46 |
| | $ | 2.40 |
| | 2,630 |
| | 7.3 | | $ | 1.54 |
| | 1,110 |
| | $ | 1.55 |
|
| 2.70 |
| | 2.78 |
| | 565 |
| | 7.1 | | 2.77 |
| | 515 |
| | 2.77 |
|
| 3.29 |
| | 3.29 |
| | 3,326 |
| | 8.2 | | 3.29 |
| | 741 |
| | 3.29 |
|
| 3.41 |
| | 7.05 |
| | 2,611 |
| | 4.1 | | 5.81 |
| | 2,545 |
| | 5.79 |
|
| 7.09 |
| | 7.61 |
| | 929 |
| | 5.5 | | 7.34 |
| | 810 |
| | 7.32 |
|
| 7.74 |
| | 9.74 |
| | 5,613 |
| | 4.9 | | 8.19 |
| | 4,007 |
| | 8.36 |
|
| | | | | 15,674 |
| | | | | | 9,728 |
| | |
There were
20,000, 4.3 million,
4.4 million and
6.54.4 million options granted for the years ended December 31,
2018, 2017,
2016 and
2015,2016, respectively. The weighted average grant date fair value per share of the options granted was
$4.15, $1.98,
$0.83 and
$2.48$0.83 for the years ended December 31,
2018, 2017,
2016 and
2015,2016, respectively. The total intrinsic value of options exercised was
$6.5 million and $5.3 million for the
yearyears ended December 31,
2018 and 2017. There were no options exercised in
2016, and the intrinsic value of options exercised for the year ended December 31, 2015 was $0.8 million.2016.
There was
$7.9approximately $3.4 million in unrecognized compensation expense related to options expected to vest as of December 31,
2017.2018. This cost was expected to be recognized on a straight‑line basis over a weighted average period of
3.52.8 years. We recorded
$6.0 million in non‑cash compensation expense related to options granted that were expected to vest for the year ended and as of December 31, 2017. We received $10.9 million in cash proceeds from the exercise of options during 2017.There was $11.7 million in unrecognized compensation expense related to options expected to vest as of December 31, 2016. This cost was expected to be recognized on a straight-line basis over a weighted average period of 2.1 years. We recorded $6.3 million and $7.4approximately $5.1 million in non‑cash compensation expense related to options granted that were expected to vest as of December 31, 2016 and 2015, respectively. There were no2018. We received approximately $9.6 million in cash proceeds received from the exercise of options during 2018.
There was approximately $7.9 million and $11.7 million in unrecognized compensation expense related to options expected to vest as of December 31, 2017 and 2016, respectively. This cost was expected to be recognized on a straight-line basis over a weighted average period of 3.5 years and 2.1 years for the years ended December 31, 2017 and 2016, respectively. We recorded approximately $6.0 million and $6.3 million in non‑cash compensation expense related to options granted that were expected to vest as of December 31, 2017 and 2016, respectively. We received approximately $10.9 million in cash proceeds from the exercise of options during 2017 and there was no exercise of options during 2016, as no exercises occurred during the
period, and we received $1.8 million in cash proceeds from the exercise of options for the year ended December 31, 2015.period.
The following is a summary of non‑vested share awards for our time‑based restricted shares:
| | | | | | Weighted | |
| | Shares | | | Average Grant | |
| | Outstanding | | | Date Fair Value | |
| | (in thousands) | | | (per share) | |
Outstanding, December 31, 2016 | | | 80 | | | $ | 7.12 | |
Granted | | | 50 | | | | 6.84 | |
Vested | | | (56 | ) | | | 7.02 | |
Forfeited | | | — | | | | — | |
Outstanding, December 31, 2017 | | | 74 | | | $ | 7.00 | |
|
| | | | | | | |
| | | Shares Outstanding (in thousands) | | Weighted Average Grant Date Fair Value (per Share) |
| Outstanding, December 31, 2017 | | 74 |
| | $ | 7.00 |
|
| Granted | | — |
| | — |
|
| Vested | | (66 | ) | | 7.04 |
| Forfeited | | — |
| | — |
|
| Outstanding, December 31, 2018 | | 8 |
| | $ | 6.66 |
|
There were no shares of restricted stock granted for the year ended December 31, 2018. The total fair value of restricted stock vested was approximately $0.5 million for the year ended December 31, 2018. There was $31,952 in unrecognized compensation expense related to shares of restricted stock expected to vest as of December 31, 2018, which was expected to be recognized on a straight‑line basis over a weighted average period of 0.3 years. There were 65,501 shares of restricted stock that vested during 2018, and we recorded approximately $0.4 million in non-cash compensation expense related to the restricted stock granted that was expected to vest during 2018.
There were 50,000 shares of restricted stock granted for the year ended December 31,
2017.2017 and no shares of restricted stock granted for the year ended December 31, 2016. The total fair value of restricted stock vested was
approximately $0.4
million and approximately $0.2 million for the
yearyears ended December 31,
2017.2017 and 2016, respectively. There was
approximately $0.5
million and approximately $1.0 million in unrecognized compensation expense related to shares of time‑based restricted
sharesawards expected to vest as of December 31, 2017
and 2016, respectively, and is expected to be recognized on a straight‑line basis over a weighted average period of 1.1
years.years and 1.7 years, respectively. There were 56,578
shares and 74,919 shares of restricted stock that vested during 2017 and
we recorded $0.4 million in non-cash compensation expense related to the restricted stock granted that was expected to vest during 2017.98
There were no shares of restricted stock granted for the years ended December 31, 2016, and 2015, respectively. The total fair value of restricted stock vested was $0.2 million and $0.6 million for the years ended December 31, 2016 and 2015, respectively. There was $1.0 million and $2.0 million in unrecognized compensation expense related to shares of time‑based restricted shares expected to vest as of December 31, 2016 and 2015, respectively, and is expected to be recognized on a straight‑line basis over a weighted average period of 1.7 years and 2.4 years, respectively. There were 0.1 million shares and 0.2 million shares of restricted stock that vested during 2016 and 2015, respectively, and we recorded $0.5approximately $0.4 million and $0.9approximately $0.5 million in non‑cash compensation expense related to the restricted stock granted that was expected to vest during 2017 and 2016, respectively.
Restricted Stock Units
The following is a summary of non-vested RSU awards:
|
| | | | | | | | | | | | | |
| | | Shares Outstanding (in thousands) | | Weighted Average Grant Date Fair Value (per Share) | | Weighted Average Life Remaining (Years) | | Aggregate Intrinsic Value (in thousands) |
| Outstanding, December 31, 2017 | | — |
| | $ | — |
| |
| |
|
| Granted | | 1,877 |
| | 7.49 |
| |
| |
|
| Exercised | | — |
| | — |
| |
| |
|
| Canceled or forfeited | | (80 | ) | | 7.46 |
| |
| |
|
| Outstanding, December 31, 2018 | | 1,797 |
| | $ | 7.49 |
| | 2.0 | | $ | 9,254 |
|
| Vested and expected to vest, December 31, 2018 | | 1,219 |
| | $ | 7.49 |
| | 1.8 | | $ | 6,278 |
|
The time-based RSUs granted during 2018 vest at a rate of 25% per year on each of the first four anniversaries of the grant dates.
The performance-based RSUs granted during 2018 will be evaluated by our Compensation Committee of our Board of Directors after a performanceperiod, beginning on the date of grant through December 31, 2020, based on certain revenue and 2015, respectively.Adjusted EBITDA growth rate metrics, with achievement of each measure to be determined independently of one another. If the performance criteria of the metrics are approved, the eligible awards will become vested on the third anniversary of the grant dates.16.
The time-based RSUs granted during the first quarter of 2018 to independent members of our Board of Directors vest in equal installments on each of the first three anniversary dates of the grant date and settle on the earliest of the following events: (i) March 7, 2028; (ii) death; (iii) the occurrence of a Change in Control (as defined in the Amended and Restated 2014 Plan), subject to qualifying conditions; or (iv) the date that is six months following the separation from service, subject to qualifying conditions.
There were approximately 1.9 million shares of RSU awards granted for the year ended December 31, 2018 and no RSUs granted for the years ended December 31, 2017 and 2016. There were zero RSUs that vested during the years ended December 31, 2018, 2017 and 2016.
There was approximately $6.7 million in unrecognized compensation expense related to RSU awards expected to vest as of December 31, 2018. This cost is expected to be recognized on a straight-line basis over a weighted average period of 3.0 years. We recorded approximately $1.8 million in non-cash compensation expense related to RSU awards for the year ended December 31, 2018.
The following presents consolidated loss before tax for domestic and foreign operations (in thousands):
| | Year Ended December 31, | |
| | 2017 | | | 2016 | | | 2015 | |
Consolidated loss before tax | | | | | | | | | | | | |
Domestic | | $ | (73,445 | ) | | $ | (225,538 | ) | | $ | (129,602 | ) |
Foreign | | | 1,378 | | | | 7,755 | | | | 6,519 | |
Total | | $ | (72,067 | ) | | $ | (217,783 | ) | | $ | (123,083 | ) |
|
| | | | | | | | | | | | |
| | | Year Ended December 31, |
| | | 2018 | | 2017 | | 2016 |
| Consolidated income (loss) before tax | | | | | | |
| Domestic | | $ | 1,227 |
| | $ | (73,445 | ) | | $ | (225,538 | ) |
| Foreign | | 1,419 |
| | 1,378 |
| | 7,755 |
|
| Total | | $ | 2,646 |
| | $ | (72,067 | ) | | $ | (217,783 | ) |
The income tax (benefit) provision attributable to loss from operations before tax consists of the following components (in thousands):
| | Year Ended December 31, | |
| | 2017 | | | 2016 | | | 2015 | |
Income tax (benefit) provision | | | | | | | | | | | | |
Domestic | | $ | (20,507 | ) | | $ | 30,400 | | | $ | (19,746 | ) |
Foreign | | | 343 | | | | 1,296 | | | | 1,635 | |
Total income tax (benefit) provision | | $ | (20,164 | ) | | $ | 31,696 | | | $ | (18,111 | ) |
Income tax (benefit) provision | | | | | | | | | | | | |
Current | | $ | 461 | | | $ | 1,756 | | | $ | 1,767 | |
Deferred | | | (20,625 | ) | | | 29,940 | | | | (19,878 | ) |
Total income tax (benefit) provision | | $ | (20,164 | ) | | $ | 31,696 | | | $ | (18,111 | ) |
|
| | | | | | | | | | | | |
| | | Year Ended December 31, |
| | | 2018 | | 2017 | | 2016 |
| Income tax (benefit) provision | | | | | | |
| Domestic | | $ | (10,166 | ) | | $ | (20,507 | ) | | $ | 30,400 |
|
| Foreign | | 456 |
| | 343 |
| | 1,296 |
|
| Total income tax (benefit) provision | | $ | (9,710 | ) |
| $ | (20,164 | ) | | $ | 31,696 |
|
| Income tax (benefit) provision | | | | | | |
| Current | | $ | 633 |
| | $ | 461 |
| | $ | 1,756 |
|
| Deferred | | (10,343 | ) | | (20,625 | ) | | 29,940 |
|
| Total income tax (benefit) provision | | $ | (9,710 | ) |
| $ | (20,164 | ) | | $ | 31,696 |
|
A reconciliation of the federal statutory rate and the effective income tax rate is as follows:
| | | | Year Ended December 31, | | | | Year Ended December 31, |
| | 2017 | | | 2016 | | | 2015 | | | | 2018 | | 2017 | | 2016 |
Income tax reconciliation | | | | | | | | | | | | | | | | | | | |
Federal statutory rate | | | 35.0 | | % | | 35.0 | | % | | 35.0 | | % | | 21.0 | % | | 35.0 | % | | 35.0 | % |
Foreign provision | | | 0.3 | | % | | 0.5 | | % | | 0.6 | | % | | 6.8 | % | | 0.3 | % | | 0.5 | % |
State/province income tax | | | 2.4 | | % | | 0.8 | | % | | 1.1 | | % | | 12.4 | % | | 2.4 | % | | 0.8 | % |
Non-deductible compensation cost | | | (2.0 | ) | % | | (0.5 | ) | % | | (1.1 | ) | % | | (7.7 | )% | | (2.0 | )% | | (0.5 | )% |
Adjustment to carrying value(1) | | | 31.2 | | % | | 0.2 | | % | | 0.6 | | % | | 6.2 | % | | 31.2 | % | | 0.2 | % |
Research credit | | | 1.9 | | % | | 0.2 | | % | | 0.6 | | % | | (76.3 | )% | | 1.9 | % | | 0.2 | % |
Valuation allowance | | | (39.6 | ) | % | | (27.4 | ) | % | | 0.0 | | % | | (344.9 | )% | | (39.6 | )% | | (27.4 | )% |
Goodwill impairment | | | — | | % | | (23.5 | ) | % | | (21.3 | ) | % | | — | % | | — | % | | (23.5 | )% |
| Global intangible low-taxed income | | | 9.1 | % | | — | % | | — | % |
| Non-deductible expenses - other | | | 7.2 | % | | (0.5 | )% | | (0.1 | )% |
Other | | | (1.2 | ) | % | | 0.1 | | % | | (0.8 | ) | % | | (0.8 | )% | | (0.7 | )% | | 0.2 | % |
Effective tax rate | | | 28.0 | | % | | (14.6 | ) | % | | 14.7 | | % | | (367.0 | )% | | 28.0 | % | | (14.6 | )% |
| |
| (1) | The adjustment to carrying value in 2017 is due primarily to the federal tax rate change in the Tax Cuts and Jobs Act of 2017 (“2017 Tax Act”). |
99
The major tax‑effected components of the deferred tax assets and liabilities are as follows (in thousands):
| | Year Ended December 31, | |
| | 2017 | | | 2016 | | | 2015 | |
Deferred income tax assets related to: | | | | | | | | | | | | |
Net operating losses | | $ | 87,250 | | | $ | 98,664 | | | $ | 81,531 | |
Stock compensation expense | | | 6,601 | | | | 11,559 | | | | 10,212 | |
Accounts receivable allowances | | | 1,117 | | | | 1,745 | | | | 1,444 | |
Accrued and prepaid expenses | | | 3,953 | | | | 6,276 | | | | 3,958 | |
Long-term debt | | | — | | | | 493 | | | | 300 | |
Other | | | 479 | | | | 1,399 | | | | 658 | |
Tax credits | | | 6,822 | | | | 6,394 | | | | 5,896 | |
Valuation allowance | | | (63,303 | ) | | | (61,012 | ) | | | (1,442 | ) |
Total deferred income tax assets | | $ | 42,919 | | | $ | 65,518 | | | $ | 102,557 | |
Deferred income tax liabilities related to: | | | | | | | | | | | | |
Property, equipment and leased assets | | $ | 3,129 | | | $ | 13,216 | | | $ | 18,274 | |
Intangibles | | | 73,597 | | | | 106,307 | | | | 108,727 | |
Long-term debt | | | 3,292 | | | | — | | | | — | |
Other | | | 1,108 | | | | 3,606 | | | | 3,200 | |
Total deferred income tax liabilities | | $ | 81,126 | | | $ | 123,129 | | | $ | 130,201 | |
Deferred income taxes, net | | $ | (38,207 | ) | | $ | (57,611 | ) | | $ | (27,644 | ) |
We adopted FASB ASU No. 2016-09, regarding several aspects of the accounting for share-based payment transactions, including the accounting for income taxes, in the current period on a prospective basis. As a result of the Company’s application of ASU No. 2016-09, certain excess tax benefits at the time of exercise (for an option) or upon vesting (for restricted stock) are recognized as income tax benefits in the Statements of Loss. As of December 31, 2017, the adoption of ASU No. 2016-09 has not materially impacted our Financial Statements. However, it has increased the gross deferred tax assets in our Financial Statements by $4.6 million for excess tax benefits in previous years before it was offset by a corresponding valuation allowance. As a result of certain realization requirements under the prior years’ accounting guidance on share based payments, the table of deferred tax assets and liabilities shown above does not include certain deferred tax assets that arose directly from tax deductions related to equity compensation in excess of compensation recognized for financial reporting at December 31, 2016 and 2015, respectively.
|
| | | | | | | | | | | | |
| | | Year Ended December 31, |
| | | 2018 | | 2017 | | 2016 |
| Deferred income tax assets related to: | | | | | | |
| Net operating losses | | $ | 97,190 |
| | $ | 87,250 |
| | $ | 98,664 |
|
| Stock compensation expense | | 7,264 |
| | 6,601 |
| | 11,559 |
|
| Accounts receivable allowances | | 1,582 |
| | 1,117 |
| | 1,745 |
|
| Accrued and prepaid expenses | | 3,639 |
| | 3,953 |
| | 6,276 |
|
| Long-term debt | | — |
| | — |
| | 493 |
|
| Other | | 1,319 |
| | 479 |
| | 1,399 |
|
| Tax credits | | 9,244 |
| | 6,822 |
| | 6,394 |
|
| Interest Limitation | | 2,738 |
| | — |
| | — |
|
| Valuation allowance | | (53,156 | ) | | (63,303 | ) | | (61,012 | ) |
| Total deferred income tax assets | | $ | 69,820 |
|
| $ | 42,919 |
|
| $ | 65,518 |
|
| Deferred income tax liabilities related to: | | | | | | |
| Property, equipment and leased assets | | $ | 3,855 |
| | $ | 3,129 |
| | $ | 13,216 |
|
| Intangibles | | 89,865 |
| | 73,597 |
| | 106,307 |
|
| Long-term debt | | 3,614 |
| | 3,292 |
| | — |
|
| Other | | 353 |
| | 1,108 |
| | 3,606 |
|
| Total deferred income tax liabilities | | $ | 97,687 |
|
| $ | 81,126 |
|
| $ | 123,129 |
|
| Deferred income taxes, net | | $ | (27,867 | ) |
| $ | (38,207 | ) |
| $ | (57,611 | ) |
The 2017 Tax Act was enacted on December 22, 2017. The 2017 Tax Act made significant changes to
the federal tax law, including a reduction in the federal income tax rate from 35% to 21% effective January 1, 2018, stricter limits on deduction of interest, an 80% taxable income limitation on the use of post-2017
NOLs,net operating loss (“NOL”), and a one-time transition tax on previously deferred earnings of certain foreign subsidiaries. As a result of our initial analysis of the 2017 Tax Act and existing implementation guidance, we remeasured our deferred tax assets and liabilities, which resulted in a $22.5 million reduction in our income tax expense in 2017. We computed our transition tax liability of $1.3 million due to the
2017 Tax Act, net of associated foreign tax credits, which was completely offset by additional foreign tax credits carried forward.
The foreign tax credits used to offset the transition tax relate to deemed foreign taxes paid on a 2010 Canadian dividend which we are now claiming as a foreign tax credit rather than a foreign tax deduction. Any remaining foreign tax credits not utilized by the transition tax
has beenwere fully offset by a valuation allowance.
On December 22, 2017, the SEC staff issued Staff Accounting Bulletin 118 (“SAB 118”), which
providesprovided guidance on accounting for the tax effects of the 2017 Tax Act.
SAB 118 provides a measurement period that should not extend beyond one year from the enactment date for companies to complete the accounting under Accounting Standards Codification (ASC) 740. In accordance with SAB 118, a company must reflect the income tax effects of those aspects of the 2017 Tax Act for which the accounting under ASC 740 is complete. To the extent that a company’s accounting for certain income tax effects of the 2017 Tax Act is incomplete but for which they are able to determine a reasonable estimate, it must record a provisional amount in the financial statements. Provisional treatment is proper in light of anticipated additional guidance from various taxing authorities, the SEC, the FASB, and even the Joint Committee on Taxation. Provisional treatment is also necessary if the company is waiting for final financial information from domestic and foreign equity investments. If a company cannot determine a100
provisional amount to be included in the financial statements, it should continue to apply ASC 740 on the basis of the provisions of the tax laws that were in effect immediately before the enactment of the 2017 Tax Act.
In accordance with the SAB 118 guidance, some of the income tax effects recorded in 2017 areand through December 22, 2018 were provisional, including the one-time transition tax, the effect on our valuation allowance including the stricter limits on interest deductions, the GILTI provisions of the 2017 Tax Act, and the remeasurement of our deferred tax assets and liabilities. In addition,During 2018, we are still evaluatingrecognized insignificant adjustments to the GILTI provisions of the 2017 Tax Act and its impact, if any, on our Consolidated Financial Statements as ofprovisional amounts recorded at December 31, 2017. The accounting for2017 and included these adjustments as a component of income tax effects may be adjusted during 2018 as a result ofexpense from continuing analysis of the 2017 Tax Act; additional implementation guidance from the IRS, state tax authorities, the SEC, the FASB, or the Joint Committee on Taxation; and new information from domestic or foreign equity affiliates.
For all of our investments in foreign subsidiaries, a one-time tax has been provided on the mandatory deemed repatriation of post 1986 untaxed earnings and profits, in accordance with the 2017 Tax Act. operations.
Unrepatriated earnings were approximately $19.7 million as of December 31,
2017.2018. Almost all of these earnings are considered permanently reinvested, as it is management’s intention to reinvest foreign earnings in foreign operations. We project sufficient cash flow, or
sufficient borrowings available under our
New Credit Facilities in the U.S.
and; therefore,
we do not need to repatriate
theseour foreign earnings to finance U.S. operations at this time.
Due to the 2017 Tax Act, there is no U.S. federal tax on cash repatriation from foreign subsidiaries, however, it could be subject to foreign withholding tax and U.S. state income taxes.
The 2017 Tax Act subjects a U.S. corporation to current tax on the GILTI earned by certain foreign subsidiaries and a base erosion anti-avoidance tax (“BEAT”). Our foreign subsidiaries’ earnings for the year-ended December 31, 2018 have been subject to U.S. federal income tax via the newly enacted GILTI provision. We have elected to recognize the taxes on GILTI and BEAT as a period expense in the period the taxes are incurred.
Deferred tax assets arise primarily because expenses have been recorded in historical financial statement periods that will not become deductible for income taxes until future tax years. We record valuation allowances to reduce the book value of our deferred tax assets to amounts that are estimated on a more likely than not basis to be realized. This assessment requires judgment and is performed on the basis of the weight of all available evidence, both positive and negative, with greater weight placed on information that is objectively verifiable such as historical performance.
During 2016 and 2017, we
We evaluated negative evidence noting that
we reported cumulative net losses for the three-year periods
then ended
we reported cumulative net losses.as of December 31, 2016, 2017, and 2018. Pursuant to accounting guidance, a cumulative loss in recent years is a significant piece of negative evidence that must be considered and is difficult to overcome without sufficient objectively verifiable, positive evidence. As such, certain aspects of our historical results were included in our forecasted taxable income. Although our forecast of future taxable income was a positive indicator, since this form of evidence was not objectively verifiable, its weight was not sufficient to overcome the negative evidence.
As a result of this evaluation, However, based on our current year activity and the changes in the 2017 Tax Act, we increaseddecreased our valuation allowance for deferred tax assets by $2.3$10.1 million (net of a reduction for theduring 2018. The decrease in our valuation allowance is primarily due to the US federal corporatenet operating loss during the year and the interest deduction limitation (deferred tax rate) during 2017.assets) which can be offset against our indefinite lived deferred tax liabilities. The ultimate realization of deferred tax assets depends on having sufficient taxable income in the future years when the tax deductions associated with the deferred tax assets become deductible. The establishment of a valuation allowance does not impact cash, nor does it preclude us from using our tax credits, loss carryforwardscarry-forwards and other deferred tax assets in the future.
The following is a tabular reconciliation of the total amounts of deferred tax asset valuation allowance (in thousands):
| | | | Year Ended December 31, | | | Year Ended December 31, |
| | 2017 | | | 2016 | | | 2015 | | | 2018 | | 2017 | | 2016 |
Balance at beginning of period | | $ | 61,012 | | | $ | 1,442 | | | $ | 2,319 | | | $ | 63,303 |
| | $ | 61,012 |
| | $ | 1,442 |
|
Charged to provision for income taxes | | | (2,263 | ) | | | 59,570 | | | | (877 | ) | | (9,125 | ) | | (2,263 | ) | | 59,570 |
|
Other(1) | | | 4,554 | | | | — | | | | — | | | (1,022 | ) | | 4,554 |
| | — |
|
Balance at end of period | | $ | 63,303 | | | $ | 61,012 | | | $ | 1,442 | | | $ | 53,156 |
| | $ | 63,303 |
| | $ | 61,012 |
|
|
(1)
|
This amount has been recorded in retained deficit as a result of our adoption of ASU No. 2016-09.
|
(1) For 2017, the amount was recorded as a result of our adoption of ASU No. 2016-09 effective January 1, 2017. For 2018, the amount was recorded as a result of our adoption of ASC 606 effective January 1, 2018.
We had
$352.8$395.2 million, or
$74.1$83.0 million, tax effected, of accumulated federal net operating losses as of December 31,
2017.2018. The net operating losses can be carried forward and applied to offset taxable income for 20 years and will expire starting in
2022.2022 (for losses incurred before 2018). Losses incurred in 2018 of approximately $38.9 million, or $8.2 million, tax effected, can be carried forward indefinitely to offset taxable income. We had
$6.0$8.5 million, tax effected, of federal research and development credit
carrycarry- forwards and $0.5 million, tax effected, of foreign tax credit
carry forwardscarry-forwards as of December 31,
2017.2018. The research and development credits are limited to a 20
year carry forwardyears carry-forward period and will expire starting in 2029. The foreign tax
101
credits can be carried forward 10 years and will expire in 2020, if not utilized. Almost allOur $0.3 million balance of the $1.6 million of federal alternative minimum tax credit carry forwards in ourcredits at December 31, 2016 financial statements have or will be refunded within the next 12 months, net of the IRS sequestration fee, and have been reclassified as a receivable. Any remaining alternative minimum tax credits2018 will be refunded over the next fivefour years in accordance with the 2017 Tax Act. We also have a receivable for $0.6 million related to alternative minimum tax credits for which a refund was requested on our December 31, 2017 federal tax return. As of December 31, 2017, $53.92018, $46.6 million of our valuation allowance relates to federal net operating loss carry forwardscarry-forwards and credits that we estimate are not more likely than not to be realized.
We had tax effected state net operating loss
carry forwardscarry-forwards of approximately
$13.1$14.1 million as of December 31,
2017.2018. The state net operating loss
carry forwardscarry-forwards will expire between
20182019 and
2038.2039. The determination and utilization of these state net operating loss
carry forwardscarry-forwards are dependent upon apportionment percentages and other respective state laws, which can change from year to year. As of December 31,
2017, $9.32018, $6.5 million of our valuation allowance relates to certain state net operating loss
carry forwardscarry-forwards that we estimate are not more likely than not to be realized. The remaining valuation allowance of $0.1 million relates to foreign net operating losses.
The following is a tabular reconciliation of the total amounts of unrecognized tax benefits (in thousands):
| | Year Ended December 31, | |
| | 2017 | | | 2016 | | | 2015 | |
Unrecognized tax benefit | | | | | | | | | | | | |
Unrecognized tax benefit at the beginning of the period | | $ | 834 | | | $ | 729 | | | $ | 729 | |
Gross increases - tax positions in prior period | | | 103 | | | | 105 | | | | — | |
Gross decreases - tax positions in prior period | | | — | | | | — | | | | — | |
Gross increases - tax positions in current period | | | — | | | | — | | | | — | |
Settlements | | | — | | | | — | | | | — | |
Unrecognized tax benefit at the end of the period | | $ | 937 | | | $ | 834 | | | $ | 729 | |
|
| | | | | | | | | | | | |
| | | Year Ended December 31, |
| | | 2018 | | 2017 | | 2016 |
| Unrecognized tax benefit | | | | | | |
| Unrecognized tax benefit at the beginning of the period | | $ | 937 |
| | $ | 834 |
| | $ | 729 |
|
| Gross increases - tax positions in prior period | | 125 |
| | 103 |
| | 105 |
|
| Unrecognized tax benefit at the end of the period | | $ | 1,062 |
| | $ | 937 |
| | $ | 834 |
|
We have analyzed filing positions in all of the federal, state, and foreign jurisdictions where we are required to file income tax returns, as well as all open tax years in these jurisdictions. As of December 31,
2017,2018, the Company recorded
$0.9$1.1 million of unrecognized tax benefits, all of which would impact our effective tax rate, if recognized. We do not anticipate that our unrecognized tax benefits will materially change within the next 12 months. The Company has not accrued any penalties and interest for its unrecognized tax benefits. Other than the unrecognized tax benefit recorded, we believe that our income tax filing positions and deductions will be sustained upon audit, and we do not anticipate any other adjustments that will result in a material change to our financial position. We may, from time to time, be assessed interest or penalties by tax jurisdictions, although any such assessments historically have been minimal and immaterial to our financial results. Our policy for recording interest and penalties associated with audits and unrecognized tax benefits is to record such items as a component of income tax in our Statements of
Loss.Income (Loss).
We are subject to taxation in the U.S. and various states and foreign jurisdictions. We have a number of federal and state income tax years still open for examination as a result of our net operating loss
carry forwards.carry-forwards. Accordingly, we are subject to examination for both U.S. federal and some of the state tax returns for the years 2004 to present. For the remaining state, local and foreign jurisdictions, with some exceptions, we are no longer subject to examination by tax authorities for years before
2014.17.2015.
Operating segments are components of an enterprise about which separate financial information is available that is evaluated regularly by the chief operating decision-making group
in deciding how to allocate resources and in assessing performance.(the “CODM”). Our
chief operating decision-making groupCODM consists of the Chief Executive Officer and the Chief Financial Officer.
This group manages the business,Our CODM allocates resources and measures profitability based on our operating
segments. The operating segments,
which are managed and reviewed separately, as each
representsrepresent products
and services that can be sold separately to our customers.
102
Our chief operating decision-making group has determined the following to be the operating segments are monitored by management for which we conduct business: (a) Games and (b) Payments. performance against our internal forecasts.
We have reported our financial performance based on our segments in both the current and prior periods. Each of theseOur CODM determined that our operating segments is monitored by our management for performance against its internal forecastconducting business are: (a) Games; and is consistent with our internal management reporting. (b) FinTech:
The Games segment provides solutions directly to gaming establishments to offer their patrons gaming entertainmententertainment- related experiences including: leased gaming equipment; sales and maintenance relatedmaintenance-related services of gaming equipment; gaming systems; interactive solutions; and ancillary products and services.
The PaymentsFinTech segment provides solutions directly to gaming establishments to offer their patrons cash access relatedaccess-related services and products, including: access to cash at gaming facilities via ATM cash withdrawals,withdrawals; credit card cash access transactions and POS debit card cash access transactions; check-related services; fully integrated kiosksequipment and maintenance services; compliance, audit and data software; casino credit data and reporting services and other ancillary offerings.
Corporate overhead expenses have been allocated to the segments either through specific identification or based on a reasonable methodology. In addition, we record depreciation and amortization expenses to the
appropriate operating segment.business segments.
Our business is predominantly domestic with no specific regional concentrations and no significant assets in foreign locations.
The accounting policies of the operating segments are generally the same as those described in the summary of significant accounting policies. Since we adopted ASC 606 utilizing the modified retrospective method, the prior year comparative amounts shown in the tables below have not been restated. Refer to
“Note 2 — Basis of Presentation and Summary of Significant Accounting Policies” and “Note 3 — Adoption of ASC 606, Revenue from Contracts with Customers” for more information.
The following tables present segment information (in thousands):
| | | | For the Year Ended December 31, | | | For the Year Ended December 31, |
| | 2017 | | | 2016 | | | 2015 | | | 2018 | | 2017 | | 2016 |
Games | | | | | | | | | | | | | | |
| | |
| | |
|
| Revenue | | | | | | | |
| Gaming operations | | | $ | 168,146 |
| | $ | 148,654 |
| | $ | 152,514 |
|
| Gaming equipment and systems | | | 87,038 |
| | 70,118 |
| | 56,277 |
|
| Gaming other | | | 3,794 |
| | 4,005 |
| | 4,462 |
|
Total revenues | | $ | 222,777 | | | $ | 213,253 | | | $ | 214,424 | | | $ | 258,978 |
| | $ | 222,777 |
| | $ | 213,253 |
|
| | | | | | | | |
Costs and expenses | | | | | | | | | | | | | | | | | | |
Cost of revenues | | | 54,695 | | | | 50,308 | | | | 47,017 | | |
Cost of revenues(1) | | | | | | | |
| Gaming operations | | | 17,603 |
| | 15,741 |
| | 15,265 |
|
| Gaming equipment and systems | | | 47,121 |
| | 35,707 |
| | 31,602 |
|
| Gaming other | | | 3,285 |
| | 3,247 |
| | 3,441 |
|
| Total cost of revenues | | | 68,009 |
| | 54,695 |
| | 50,308 |
|
| | | | | | | | |
Operating expenses | | | 42,780 | | | | 42,561 | | | | 36,154 | | | 57,244 |
| | 42,780 |
| | 42,561 |
|
Research and development | | | 18,862 | | | | 19,356 | | | | 19,098 | | | 20,497 |
| | 18,862 |
| | 19,356 |
|
Goodwill impairment | | | — | | | | 146,299 | | | | 75,008 | | | — |
| | — |
| | 146,299 |
|
Depreciation | | | 40,428 | | | | 41,582 | | | | 37,716 | | | 55,058 |
| | 40,428 |
| | 41,582 |
|
Amortization | | | 57,060 | | | | 79,390 | | | | 72,934 | | | 55,099 |
| | 57,060 |
| | 79,390 |
|
Total costs and expenses | | | 213,825 | | | | 379,496 | | | | 287,927 | | | 255,907 |
| | 213,825 |
| | 379,496 |
|
Operating income (loss) | | $ | 8,952 | | | $ | (166,243 | ) | | $ | (73,503 | ) | | $ | 3,071 |
| | $ | 8,952 |
| | $ | (166,243 | ) |
| | For the Year Ended December 31, | |
| | 2017 | | | 2016 | | | 2015 | |
Payments | | | | | | | | | | | | |
Total revenues | | $ | 752,171 | | | $ | 646,203 | | | $ | 612,575 | |
Costs and expenses | | | | | | | | | | | | |
Cost of revenues | | | 583,850 | | | | 498,706 | | | | 463,380 | |
Operating expenses | | | 76,155 | | | | 76,148 | | | | 65,048 | |
Depreciation | | | 6,854 | | | | 8,413 | | | | 7,835 | |
Amortization | | | 12,445 | | | | 15,248 | | | | 12,539 | |
Total costs and expenses | | | 679,304 | | | | 598,515 | | | | 548,802 | |
Operating income | | $ | 72,867 | | | $ | 47,688 | | | $ | 63,773 | |
103
| | For the Year Ended December 31, | |
| | 2017 | | | 2016 | | | 2015 | |
Total Games and Payments | | | | | | | | | �� | | | |
Total revenues | | $ | 974,948 | | | $ | 859,456 | | | $ | 826,999 | |
Costs and expenses | | | | | | | | | | | | |
Cost of revenues | | | 638,545 | | | | 549,014 | | | | 510,397 | |
Operating expenses | | | 118,935 | | | | 118,709 | | | | 101,202 | |
Research and development | | | 18,862 | | | | 19,356 | | | | 19,098 | |
Goodwill impairment | | | — | | | | 146,299 | | | | 75,008 | |
Depreciation | | | 47,282 | | | | 49,995 | | | | 45,551 | |
Amortization | | | 69,505 | | | | 94,638 | | | | 85,473 | |
Total costs and expenses | | | 893,129 | | | | 978,011 | | | | 836,729 | |
Operating income (loss) | | $ | 81,819 | | | $ | (118,555 | ) | | $ | (9,730 | ) |
| | At December 31, | |
| | 2017 | | | 2016 | |
Total assets | | | | | | | | |
Games | | $ | 925,186 | | | $ | 894,213 | |
Payments | | | 611,888 | | | | 513,950 | |
Total assets | | $ | 1,537,074 | | | $ | 1,408,163 | |
|
| | | | | | | | | | | | |
| | | For the Year Ended December 31, |
| | | 2018 | | 2017 | | 2016 |
| FinTech | | | | | | |
| Revenues | | | | | | |
| Cash access services | | $ | 156,806 |
| | $ | 707,222 |
| | $ | 601,874 |
|
| Equipment | | 20,977 |
| | 13,258 |
| | 14,995 |
|
| Information services and other | | 32,754 |
| | 31,691 |
| | 29,334 |
|
| Total revenues | | $ | 210,537 |
| | $ | 752,171 |
| | $ | 646,203 |
|
| | | | | | |
| Costs and expenses | | | | | | |
Cost of revenues(1) | | | | | | |
| Cash access services | | 9,717 |
| | 572,880 |
| | 485,061 |
|
| Equipment | | 12,601 |
| | 7,717 |
| | 9,889 |
|
| Information services and other | | 4,110 |
| | 3,253 |
| | 3,756 |
|
| Cost of revenues | | 26,428 |
| | 583,850 |
| | 498,706 |
|
| | | | | | |
| Operating expenses | | 85,054 |
| | 76,155 |
| | 76,148 |
|
| Depreciation | | 6,167 |
| | 6,854 |
| | 8,413 |
|
| Amortization | | 10,146 |
| | 12,445 |
| | 15,248 |
|
| Total costs and expenses | | 127,795 |
| | 679,304 |
| | 598,515 |
|
| Operating income | | $ | 82,742 |
| | $ | 72,867 |
| | $ | 47,688 |
|
(1) Exclusive of depreciation and amortization.
|
| | | | | | | | | | | | |
| | | For the Year Ended December 31, |
| | | 2018 | | 2017 | | 2016 |
| Total Games and FinTech | | |
| | |
| | |
|
| Total revenues | | $ | 469,515 |
| | $ | 974,948 |
| | $ | 859,456 |
|
| Costs and expenses | | |
| | |
| | |
|
Cost of revenues(1) | | 94,437 |
| | 638,545 |
| | 549,014 |
|
| Operating expenses | | 142,298 |
| | 118,935 |
| | 118,709 |
|
| Research and development | | 20,497 |
| | 18,862 |
| | 19,356 |
|
| Goodwill impairment | | — |
| | — |
| | 146,299 |
|
| Depreciation | | 61,225 |
| | 47,282 |
| | 49,995 |
|
| Amortization | | 65,245 |
| | 69,505 |
| | 94,638 |
|
| Total costs and expenses | | 383,702 |
| | 893,129 |
| | 978,011 |
|
| Operating income (loss) | | $ | 85,813 |
| | $ | 81,819 |
| | $ | (118,555 | ) |
(1) Exclusive of depreciation and amortization.
|
| | | | | | | | |
| | | At December 31, |
| | | 2018 | | 2017 |
| Total assets | | |
| | |
| Games | | $ | 912,849 |
| | $ | 925,186 |
|
| FinTech | | 635,412 |
| | 611,888 |
|
| Total assets | | $ | 1,548,261 |
|
| $ | 1,537,074 |
|
Major customers.For the years ended December 31, 2018, 2017, 2016 and 2015,2016, no single customer accounted for more than 10% of our revenues. Our five largest customers accounted for approximately 22%, 31%, 31% and 30%31% of our total revenue in 2018, 2017, and 2016, and 2015, respectively.104
18.
19. SELECTED QUARTERLY RESULTS OF OPERATIONS (UNAUDITED)
The unaudited selected quarterly results of operations are as follows (in thousands, except for per share amounts)*
:. Since we adopted ASC 606 utilizing the modified retrospective method, the prior year comparative amounts shown in the table below have not been restated. | | Quarter | | | | | |
| | First | | | Second | | | Third | | | Fourth | | | Year | |
2017 | | | | | | | | | | | | | | | | | | | | |
Revenues | | $ | 237,537 | | | $ | 242,230 | | | $ | 247,322 | | | $ | 247,859 | | | $ | 974,948 | |
Operating income | | | 22,603 | | | | 21,292 | | | | 19,795 | | | | 18,129 | | | | 81,819 | |
Net loss | | | (3,508 | ) | | | (19,057 | ) | | | (4,289 | ) | | | (25,049 | ) | | | (51,903 | ) |
Basic loss per share | | $ | (0.05 | ) | | $ | (0.29 | ) | | $ | (0.06 | ) | | $ | (0.38 | ) | | $ | (0.78 | ) |
Diluted loss per share | | $ | (0.05 | ) | | $ | (0.29 | ) | | $ | (0.06 | ) | | $ | (0.38 | ) | | $ | (0.78 | ) |
Weighted average common shares outstanding | | | | | | | | | | | | | | | | | | | | |
Basic | | | 66,090 | | | | 66,350 | | | | 66,897 | | | | 67,755 | | | | 66,816 | |
Diluted | | | 66,090 | | | | 66,350 | | | | 66,897 | | | | 67,755 | | | | 66,816 | |
2016 | | | | | | | | | | | | | | | | | | | | |
Revenues | | $ | 205,769 | | | $ | 214,000 | | | $ | 222,177 | | | $ | 217,510 | | | $ | 859,456 | |
Operating income (loss) | | | 3,785 | | | | 6,060 | | | | 11,572 | | | | (139,972 | ) | | | (118,555 | ) |
Net loss | | | (13,151 | ) | | | (10,796 | ) | | | (8,254 | ) | | | (217,278 | ) | | | (249,479 | ) |
Basic loss per share | | $ | (0.20 | ) | | $ | (0.16 | ) | | $ | (0.12 | ) | | $ | (3.29 | ) | | $ | (3.78 | ) |
Diluted loss per share | | $ | (0.20 | ) | | $ | (0.16 | ) | | $ | (0.12 | ) | | $ | (3.29 | ) | | $ | (3.78 | ) |
Weighted average common shares outstanding | | | | | | | | | | | | | | | | | | | | |
Basic | | | 66,034 | | | | 66,041 | | | | 66,049 | | | | 66,074 | | | | 66,050 | |
Diluted | | | 66,034 | | | | 66,041 | | | | 66,049 | | | | 66,074 | | | | 66,050 | |
|
| | | | | | | | | | | | | | | | | | | | |
| | | Quarter | | |
| | | First | | Second | | Third | | Fourth | | Year |
| 2018 | | | | | | | | | | |
| Revenues | | $ | 111,001 |
| | $ | 118,682 |
| | $ | 120,330 |
| | $ | 119,502 |
| | $ | 469,515 |
|
Operating income
| | 24,491 |
| | 22,597 |
| | 21,510 |
| | 17,215 |
| | 85,813 |
|
| Net income | | 4,609 |
| | 1,475 |
| | 2,069 |
| | 4,203 |
| | 12,356 |
|
| Basic earnings per share | | $ | 0.07 |
| | $ | 0.02 |
| | $ | 0.03 |
| | $ | 0.06 |
| | $ | 0.18 |
|
| Diluted earnings per share | | $ | 0.06 |
| | $ | 0.02 |
| | $ | 0.03 |
| | $ | 0.06 |
| | $ | 0.17 |
|
| Weighted average common shares outstanding | | | | | | | | | | |
| Basic | | 68,686 |
| | 69,203 |
| | 69,750 |
| | 70,196 |
| | 69,464 |
|
| Diluted | | 73,285 |
| | 73,440 |
| | 74,594 |
| | 74,024 |
| | 73,796 |
|
| 2017 | | | | | | | | | | |
| Revenues | | $ | 237,537 |
| | $ | 242,230 |
| | $ | 247,322 |
| | $ | 247,859 |
| | $ | 974,948 |
|
| Operating income (loss) | | 22,603 |
| | 21,292 |
| | 19,795 |
| | 18,129 |
| | 81,819 |
|
Net loss
| | (3,508 | ) | | (19,057 | ) | | (4,289 | ) | | (25,049 | ) | | (51,903 | ) |
| Basic loss per share | | $ | (0.05 | ) | | $ | (0.29 | ) | | $ | (0.06 | ) | | $ | (0.37 | ) | | $ | (0.78 | ) |
| Diluted loss per share | | $ | (0.05 | ) | | $ | (0.29 | ) | | $ | (0.06 | ) | | $ | (0.37 | ) | | $ | (0.78 | ) |
| Weighted average common shares outstanding | | | | | | | | | | |
| Basic | | 66,090 |
| | 66,350 |
| | 66,897 |
| | 67,755 |
| | 66,816 |
|
| Diluted | | 66,090 |
| | 66,350 |
| | 66,897 |
| | 67,755 |
| | 66,816 |
|
*
|
| |
| * | Rounding may cause variances. |
19.
20. SUBSEQUENT EVENTS
In January 2018,
On March 8, 2019, we entered into an
amendmentagreement to
the agreement between Everi Gamesacquire certain assets from a privately held company that develops and
the New York State Gaming Commission was approveddistributes hardware and
became effective. Under this amendment, Everi Games will continuesoftware applications to gaming operators to enhance gaming patron loyalty. This acquisition includes existing contracts with gaming operators, technology and intellectual property that allow us to provide
gaming operators a self-service enrollment and
maintainloyalty card printing kiosk, a mobile application to offer a gaming operator's patrons additional flexibility in accessing casino promotions, and a marketing platform that manages and delivers a gaming operator’s marketing programs through these patron interfaces. This acquisition will expand our financial technology solutions offerings within our FinTech segment. Under the
central determinant systemterms of the asset purchase agreement, we paid the seller $20 million at the closing of the transaction and will pay an additional $10 million one year following after closing and another $10 million two years following after the date of closing. In addition, we expect that an additional $10 million in contingent consideration will be earned by the seller based upon the achievement of certain revenue targets over the first two years post-closing. We expect the total purchase price for
this acquisition, inclusive of the
New York Lottery through Decembercontingent consideration, to be approximately $50 million. We have not completed the purchase price accounting analysis, however, we do not expect that the acquisition will have a material impact on our results of
2019.105
operations or financial condition.
Item 9. Changes in and Disagreements with
AccountantsAccountants on Accounting and Financial Disclosure.None.
Item 9A. Controls and Procedures.
Evaluation of Disclosure Controls and Procedures
The Company’s management, including its Chief Executive Officer and Chief Financial Officer, have evaluated the effectiveness of the Company’s disclosure controls and procedures (as such term is defined in Rules 13a-15(e) and 15d-15(e) under the Exchange Act) as of the end of the reporting period covered by this Form 10-K.
Based on such evaluation, the Chief Executive Officer and Chief Financial Officer have concluded that, as of the end of the period covered by this report on Form 10-K, the Company’s disclosure controls and procedures are effective such that material information required to be disclosed by the Company in the reports that it files or submits under the Exchange Act is (i) recorded, processed, summarized and reported within the time periods specified in the SEC’s rules and forms, and (ii) accumulated and communicated to the Company’s management, including its Chief Executive Officer and Chief Financial Officer, as appropriate to allow timely decisions regarding required disclosures.
Management’s Report of Internal Control over Financial Reporting
The Company’s management, including its Chief Executive Officer and Chief Financial Officer, is responsible for establishing and maintaining adequate internal control over financial reporting as defined in Rules 13a-15(f) and
15(d)-15(f)15d-15(f) under the Exchange Act. The Company’s internal control over financial reporting is designed to provide reasonable assurance regarding the reliability of financial reporting and the preparation of financial statements for external purposes in accordance with GAAP. Because of inherent limitations, internal control over financial reporting may not prevent or detect misstatements. Also, controls may become inadequate because of changes in conditions, or the degree of compliance with policies or procedures may deteriorate.
Management assessed the effectiveness of internal control over financial reporting as of December 31, 2017,2018, utilizing the criteria described in the “Internal Control - Integrated Framework (2013)” issued by the Committee of Sponsoring Organizations of the Treadway Commission. Management’s assessment included evaluation of elements such as the design and operating effectiveness of key financial reporting controls, process documentation, accounting policies, and our overall control environment. Based on this assessment, management has concluded that our internal control over financial reporting was effective at a reasonable assurance level as of December 31, 2017.2018.
Our independent registered public accounting firm,
BDO USA, LLP,, independently assessed the effectiveness of the Company’s internal control over financial reporting, as stated in the firm’s attestation report, which is included within Part II, Item 8 of this Form 10-K.
Changes in Internal Control over Financial Reporting
during the Quarter Ended December 31, 2017There werewas no changeschange to our internal control over financial reporting (as defined in Rules 13a‑15(f) and 15d‑15(f) under the Exchange Act) that occurred during the fourth quarter ended December 31, 20172018 that has materially affected, or is reasonably likely to materially affect, our internal control over financial reporting.
Item 9B. Other Information.
The information set forth below is included herein for the purpose of providing the disclosure required under “Item 1.01 - Entry into a Material Definitive Agreement” of Form 8-K that was not filed within four business days of the reportable event.
None.
Entry into a Material Definitive Agreement.
On December 29, 2017, Everi Payments entered into a Sixth Amendment (the “Sixth Amendment”) to Contract Cash Solutions Agreement with Wells Fargo Bank, N.A. The Sixth Amendment, among other things, reduces the maximum amount of cash available under the Contract Cash Solutions Agreement from $425.0 million to $300.0 million and extends the term by one year from June 30, 2019 to June 30, 2020. For a summary of the Contract Cash
106
Solutions Agreement, as amended by the Sixth Amendment, see “Note 4. Funding Agreements” within our Financial Statements included elsewhere in this Annual Report on Form 10-K.
The foregoing description and referenced summary do not purport to be complete and are qualified in their entirety by the text of the Sixth Amendment, a copy of which is filed as Exhibit 10.44 to this Annual Report on Form 10-K.
107
REPORT OF INDEPENDENT REGISTERED PUBLIC ACCOUNTING FIRM
Shareholders and Board of Directors
Everi Holdings Inc. and subsidiaries
Opinion on Internal Control over Financial Reporting
We have audited Everi Holdings Inc. and subsidiaries’ (the “Company’s”) internal control over financial reporting as of December 31, 2017,2018, based on criteria established in Internal Control –- Integrated Framework (2013) issued by the Committee of Sponsoring Organizations of the Treadway Commission (the “COSO criteria”). In our opinion, the Company maintained, in all material respects, effective internal control over financial reporting as of December 31, 2017,2018, based on the COSO criteria. We also have audited, in accordance with the standards of the Public Company Accounting Oversight Board (United States) (“PCAOB”), the consolidated balance sheets of the Company and subsidiaries as of December 31,
20172018 and
2016,2017, the related consolidated statements of
lossincome (loss) and comprehensive
loss,income (loss), stockholders’
(deficit) equity,deficit, and cash flows for each of the three years in the period ended December 31,
2017,2018, and the related notes and our report dated March
15, 201812, 2019 expressed an unqualified opinion thereon.
The Company’s management is responsible for maintaining effective internal control over financial reporting and for its assessment of the effectiveness of internal control over financial reporting, included in the accompanying Item 9A, Management’s Report on Internal Control over Financial Reporting. Our responsibility is to express an opinion on the Company’s internal control over financial reporting based on our audit. We are a public accounting firm registered with the PCAOB and are required to be independent with respect to the Company in accordance with U.S. federal securities laws and the applicable rules and regulations of the Securities and Exchange Commission and the PCAOB.
We conducted our audit of internal control over financial reporting in accordance with the standards of the PCAOB. Those standards require that we plan and perform the audit to obtain reasonable assurance about whether effective internal control over financial reporting was maintained in all material respects. Our audit included obtaining an understanding of internal control over financial reporting, assessing the risk that a material weakness exists, and testing and evaluating the design and operating effectiveness of internal control based on the assessed risk. Our audit also included performing such other procedures as we considered necessary in the circumstances. We believe that our audit provides a reasonable basis for our opinion.
Definition and Limitations of Internal Control over Financial Reporting
A company’s internal control over financial reporting is a process designed to provide reasonable assurance regarding the reliability of financial reporting and the preparation of financial statements for external purposes in accordance with generally accepted accounting principles. A company’s internal control over financial reporting includes those policies and procedures that (1) pertain to the maintenance of records that, in reasonable detail, accurately and fairly reflect the transactions and dispositions of the assets of the company; (2) provide reasonable assurance that transactions are recorded as necessary to permit preparation of financial statements in accordance with generally accepted accounting principles, and that receipts and expenditures of the company are being made only in accordance with authorizations of management and directors of the company; and (3) provide reasonable assurance regarding prevention or timely detection of unauthorized acquisition, use, or disposition of the company’s assets that could have a material effect on the financial statements.
Because of its inherent limitations, internal control over financial reporting may not prevent or detect misstatements. Also, projections of any evaluation of effectiveness to future periods are subject to the risk that controls may become inadequate because of changes in conditions, or that the degree of compliance with the policies or procedures may deteriorate.
March
15, 2018108
12, 2019
PART III
Item 10. Directors, Executive Officers and Corporate Governance.
The information regarding our directors, executive officers, and certain corporate governance related matters contained under the headings “Election of Class I Directors,” “Executive Officers,” “Section 16(a) Beneficial Ownership Reporting Compliance”Compliance,” and “Board and Corporate Governance Matters” in the Company’s definitive proxy statement to be filed with the SEC in connection with our 20182019 annual meeting of stockholders (the “2018“2019 Proxy Statement”) is incorporated herein by reference.
Item 11. Executive Compensation.
The information regarding director compensation and executive officer compensation contained under the headings “Board and Corporate Governance Matters – 20172018 Director Compensation” and “Executive Compensation,” respectively, in the 20182019 Proxy Statement is incorporated herein by reference.
Item 12. Security Ownership of Certain Beneficial Owners and Management and Related Stockholder Matters.
The information regarding share ownership contained under the heading “Security Ownership of Certain Beneficial Owners and Management” in the 20182019 Proxy Statement is incorporated herein by reference.
Item 13. Certain Relationships and Related Transactions, and Director Independence.
The information regarding director independence and related party transactions under the headings “Board and Corporate Governance Matters – Director Independence” and “Transactions with Related Persons,” respectively,” in the 20182019 Proxy Statement is incorporated herein by reference.
Item 14. Principal
AccountingAccountant Fees and Services.
The information regarding audit fees, audit-related fees, tax fees, all other fees, and the Audit Committee’s policies and procedures on pre-approval of audit and permissible non-audit services of independent auditors contained under the heading “Ratification of the Appointment of Independent Registered Public Accounting Firm” in the
20182019 Proxy Statement is incorporated herein by reference.
109
PART IV
Item 15. Exhibits and Financial Statement Schedules.
(a)
| |
| (a) | The following documents are filed as part of this Annual Report on Form 10‑K: |
1. Financial Statements
1.Financial Statements
2.Financial
2. Financial Statement Schedules
All schedules have been omitted as they are either not required or not applicable or the required information is included in the Consolidated Financial Statements or notes thereto.
3.See
3. See Item 15(b)
(b) Exhibits:
Exhibit
Number
| | Exhibit Description
|
| | |
3.1
Exhibit Number | | Exhibit Description |
| | |
| 3.1 | | |
| | |
3.2 | | |
| | |
3.3 | | |
| | |
3.4 | | |
| | |
4.1 | | Indenture (and formForm of 7.50% Senior Note due 2025 attached as Exhibit A thereto), dated as of December 5, 2017, by and among Everi Payments, Inc., Everi Holdings, Inc., certain of its wholly owned subsidiaries, as guarantors, and Deutsche Bank Trust Company Americas, as trustee.trustee (incorporated by reference to Exhibit 4.1 of Holdings’ Current Report on Form 8-K filed with the SEC on December 5, 2017). |
| | |
10.1 | | Credit Agreement, dated as of May 9, 2017, among Everi Payments, Holdings, the lenders party thereto and Jefferies Finance LLC, as administrative agent, collateral agent, swing line lender, letter of credit issuer, sole lead arranger and sole book manager (incorporated by reference to Exhibit 10.1 of Holdings’ Current Report on Form 8-K filed with the SEC on May 9, 2017). |
| | |
10.2 | | Security Agreement, dated as of May 9, 2017, among Everi Payments, Holdings, as a guarantor, the subsidiary guarantors party thereto, and Jefferies Finance LLC, as collateral agent, related to the Credit Agreement (incorporated by reference to Exhibit 10.2 of Holdings’ Current Report on Form 8-K filed with the SEC on May 9, 2017). |
110
Exhibit
Number
| | Exhibit Description
|
| | |
10.3 | | |
| | |
|
10.4
| | |
Exhibit Number | | Exhibit Description |
| 10.4 | | |
| | |
+10.5
| | |
| | |
10.6 | | Contract Cash Solutions Agreement, dated as of November 12, 2010, between Everi Payments and Wells Fargo Bank, N.A. (incorporated by reference to Exhibit 10.11 of Holdings’ Annual Report on Form 10-K filed with the SEC on March 15, 2016).
|
| | |
10.7
| | Second Amendment to Contract Cash Solutions Agreement, dated as of June 4, 2012, between Everi Payments and Wells Fargo Bank, N.A. (incorporated by reference to Exhibit 10.1 of Holdings’ Current Report on Form 8-K filed with the SEC on June 7, 2012).
|
| | |
10.8
| | Third Amendment to Contract Cash Solutions Agreement, dated as of November 4, 2013, between Everi Payments and Wells Fargo Bank, N.A. (incorporated by reference to Exhibit 10.1 of Holdings’ Quarterly Report on Form 10-Q filed with the SEC on November 5, 2013).
|
| | |
10.9
| | Fourth Amendment to Contract Cash Solutions Agreement, dated as of January 29, 2015, between Everi Payments and Wells Fargo Bank, N.A. (incorporated by reference to Exhibit 10.1 of Holdings’ Current Report on Form 8-K filed with the SEC on July 1, 2015).
|
| | |
10.10
| | Fifth Amendment to Contract Cash Solutions Agreement, dated as of December 21, 2016, between Everi Payments and Wells Fargo Bank, N.A. (incorporated by reference to Exhibit 10.1 of Holdings’ Current Report on Form 8-K filed with the SEC on December 28, 2016).
|
| | |
+10.11
| | |
| | |
†10.12 10.7 | | |
| | |
†10.13 10.8 | | |
| | |
†10.14 10.9 | | |
| | |
†10.15 10.10 | | |
111
Exhibit
Number
| | Exhibit Description
|
| | |
†10.16 10.11 | | |
| | |
†10.17 10.12 | | |
| | |
†10.18 10.13 | | |
| | |
†10.19 10.14 | | |
| | |
†10.20 10.15 | | |
| | |
†10.21 10.16 | | |
| | |
†10.22 10.17 | | |
| | |
†10.23 10.18 | | |
| | |
†10.24 10.19 | | |
| | |
†10.25 10.20 | | |
| | |
†10.26 10.21 | | |
| | |
†10.27 10.22 | | |
| | |
|
†10.28
| | |
Exhibit Number | | Exhibit Description |
| †10.23 | | |
| | |
†10.29 10.24 | | |
112
Exhibit
Number
| | Exhibit Description
|
| | |
†10.30 10.25 | | |
| | |
†10.31 10.26 | | |
| | |
†10.32 10.27 | | |
| | |
10.33
†10.28 | | |
| | |
10.34
†10.29 | | |
| | |
10.35
†10.30 | | |
| | |
10.36
†10.31 | | |
| | |
10.37
†10.32 | | |
| | |
†10.38 10.33 | | |
| | |
10.39
†10.34 | | |
| | |
10.40
†10.35 | | |
| | |
†10.41 10.36 | | |
| | |
†10.42 10.37 | | |
| | |
10.43
10.38 | | |
| | |
| 10.39 | | |
| | |
| †*10.40 | |
|
| | |
†*10.41
| | |
113
|
| | |
| * | Filed herewith. | |
| ** | Furnished herewith. |
† | Management contracts or compensatory plans or arrangements. |
+ | Confidential treatment has been granted for certain portions of this exhibit pursuant to Rule 24b-2 of the Securities Exchange Act of 1934, as amended. The confidential information has been omitted and filed separately with the SEC. |
Item 16. Form 10-K Summary.
SIGNATURES
SIGNATURES
Pursuant to the requirements of Section 13 or 15(d) of the Securities Exchange Act of 1934, the registrant has duly caused this report to be signed on its behalf by the undersigned, thereunto duly authorized.
|
| | | |
Dated: March 16, 201812, 2019 | | EVERI HOLDINGS INC. |
| | | |
| | By: | /s/ TODD A. VALLI |
| | | Todd A. Valli
Chief Accounting Officer (Principal Accounting Officer) |
KNOW ALL PERSONS BY THESE PRESENTS, that each person whose signature appears below constitutes and appoints Michael D. Rumbolz, Randy L. Taylor, and Todd A. Valli and each of them, his attorneys‑in‑fact, each with the power of substitution, for him in any and all capacities, to sign any amendments to this Annual Report on Form 10‑K and to file the same, with exhibits thereto and other documents in connection therewith, with the Securities and Exchange Commission, hereby ratifying and confirming all that each of said attorneys‑in‑fact, or his substitute or substitutes, may do or cause to be done by virtue hereof.
Pursuant to the requirements of the Securities Exchange Act of 1934, this report has been signed below by the following persons on behalf of the registrant and in the capacities and on the date indicated.
Signature
| | Title
| | Date
|
| | | | |
Signature | | Title | | Date |
| | | | |
| /s/ MICHAEL D. RUMBOLZ | | President and Chief Executive Officer | | March 16, 2018 12, 2019 |
Michael D. Rumbolz | | (Principal Executive Officer) and Director | | |
| | | | |
/s/ RANDY L. TAYLOR | | Chief Financial Officer | | March 16, 2018 12, 2019 |
Randy L. Taylor | | (Principal Financial Officer) | | |
| | | | |
/s/ TODD A. VALLI | | Chief Accounting Officer | | March 16, 2018 12, 2019 |
Todd A. Valli | | (Principal Accounting Officer) | | |
| | | | |
/s/ E. MILES KILBURN | | Chairman of the Board and Director | | March 16, 2018 12, 2019 |
E. Miles Kilburn | | | | |
| | | | |
/s/ GEOFFREY P. JUDGE | | Director | | March 16, 2018 12, 2019 |
Geoffrey P. Judge | | | | |
| | | | |
/s/ RONALD V. CONGEMI | | Director | | March 16, 2018 12, 2019 |
Ronald V. Congemi | | | | |
| | | | |
/s/ EILEEN F. RANEY | | Director | | March 16, 2018 12, 2019 |
Eileen F. Raney | | | | |
| | | | |
/s/ LINSTER W. FOX | | Director | | March 16, 2018 12, 2019 |
Linster W. Fox | | | | |
| | Director
| | March 16, 2018
|
| | | | |
| /s/ MAUREEN T. MULLARKEY | | Director | | March 12, 2019 |
| Maureen T. Mullarkey | | | | |
115