
UNITED STATES
SECURITIES AND EXCHANGE COMMISSION
Washington, D.C. 20549
FORM 10-K
ANNUAL REPORT PURSUANT TO SECTION 13 OR-
☒ | ANNUAL REPORT PURSUANT TO SECTION 13 OR 15(d) OF THE SECURITIES EXCHANGE ACT OF 1934 |
For the fiscal year ended December 31, 20172022
OR
☐ | TRANSITION REPORT PURSUANT TO SECTION 13 OR 15(d) OF THE SECURITIES EXCHANGE ACT OF 1934 |
For the transition period from to
Commission File Number 1-898
AMPCO-PITTSBURGH CORPORATION
Pennsylvania | 25-1117717 | ||
(State of Incorporation) | (I.R.S. Employer | ||
726 Bell Avenue, Suite 301 | Carnegie, Pennsylvania15106 | ||
|
| ||
(Address of principal executive offices) | (412) 456-4400 | (Registrant’s telephone number) |
Securities registered pursuant to Section 12(b) of the Act:
Title of each class | Trading Symbol(s) | Name of each exchange on which registered |
Common | AP | New York Stock Exchange |
Series A Warrants to purchase shares of Common Stock | AP WS | NYSE American Exchange |
Securities registered pursuant to Section 12(g) of the Act: None
Indicate by check mark if the registrant is a well-known seasoned issuer, as defined in Rule 405 of the Securities Act.Yes ☐No✓☒
Indicate by check mark if the registrant is not required to file reports pursuant to Section 13 or Section 15(d) of the Act.Yes☐No✓☒
Indicate by check mark whether the Registrant (1) has filed all reports required to be filed by Section 13 or 15(d) of the Securities Exchange Act of 1934 during the preceding 12 months (or for such shorter period that the Registrant was required to file such reports), and (2) has been subject to such filing requirements for the past 90 days.Yes✓☒ No ☐
Indicate by check mark whether the Registrant has submitted electronically and posted on its corporate website, if any, every Interactive Data File required to be submitted and posted pursuant to Rule 405 of Regulation S-T(§S-T (§ 232.405 of this chapter) during the preceding 12 months (or such shorter period that the registrant was required to submit and post such files).Yes✓☒ No☐
Indicate by check mark if disclosure of delinquent filers pursuant to Item 405 of Regulation S-K is not contained herein, and will not be contained, to the best of Registrant’s knowledge, in definitive proxy or information statements incorporated by reference in Part III of this Form 10-K or any amendment to this Form 10-K. [✓]
Indicate by check mark whether the registrant is a large accelerated filer, an accelerated filer, a non-accelerated filer, a smaller reporting company, or an emerging growth company. See the definitions of “large accelerated filer,” “accelerated filer,” “smaller reporting company,” and “emerging growth company” in Rule 12b-2 of the Exchange Act.
Large accelerated filer |
| Accelerated filer |
| |||||||
Non-accelerated filer |
| Smaller reporting company |
| |||||||
Emerging growth company |
| ☐ | ||||||||
If an emerging growth company, indicate by check mark if the registrant has elected not to use the extended transition period for complying with any new or revised financial accounting standards provided pursuant to Section 13(a) of the Exchange Act.☐
Indicate by check mark whether the registrant has filed a report on and attestation to its management’s assessment of the effectiveness of its internal control over financial reporting under Section 404(b) of the Sarbanes-Oxley Act (15 U.S.C. 7262(b)) by the registered public accounting firm that prepared or issued its audit report.☐
If securities are registered pursuant to Section 12(b) of the Act, indicate by check mark whether the financial statements of the registrant included in the filing reflect the correction of an error to previously issued financial statements.☐
Indicate by check mark whether any of those error corrections are restatements that required a recovery analysis of incentive-based compensation received by any of the registrant’s executive officers during the relevant recovery period pursuant to §240.10D-1(b).☐
Indicate by check mark whether the registrant is a shell company (as defined in Rule 12b-2 of the Exchange Act).Yes☐No ✓☒
The aggregate market value of the voting stock of Ampco-Pittsburgh Corporation held by non-affiliates on June 30, 20172022 (based upon the closing price of the Registrant’s Common Stock on the New York Stock Exchange on that date) was approximately $89$47 million.
As of March 12, 2018, 12,362,19815, 2023, 19,403,519 common shares were outstanding.
Documents Incorporated by Reference: Part III of this report incorporates by reference certain information from the Proxy Statement for the 20182023 Annual Meeting of Shareholders.
i
The Private Securities Litigation Reform Act of 1995 (the “Act”) provides a safe harbor for forward-looking statements made by us or on our behalf. Management’s Discussion and Analysis of Financial Condition and Results of OperationOperations and other sections of thethis Annual Report on Form 10-K, as well as the consolidated financial statements and notes theretohereto, may contain forward-lookinginclude, but are not limited to, statements about operating performance, trends and events that reflect our current views with respect towe expect or anticipate will occur in the future, eventsstatements about sales and financial performance.
production levels, restructurings, the impact from global pandemics, profitability and anticipated expenses, inflation, the global supply chain, future proceeds from the exercise of outstanding warrants, and cash outflows. All statements in this document other than statements of historical fact are statements that are, or could be, deemed “forward-looking statements” within the meaning of the Act. In this document, statements regarding future financial position, sales, costs, earnings, cash flows, other measures of results of operations, capital expenditures or debt levelsAct and plans, objectives, outlook, targets, guidance or goals are forward-looking statements. Wordswords such as “may,” “will,” “intend,” “believe,” “expect,” “anticipate,” “estimate,” “project,” “forecast” and other terms of similar meaning that indicate future events and trends are also generally intended to identify forward-looking statements. Forward-looking statements speak only as of the date on which such statements are made, are not guarantees of future performance or expectations, and involve risks and uncertainties. For us, these risks and uncertainties include, but are not limited to:
We cannot guarantee any future results, levels of activity, performance or achievements. In addition, there may be events in the future that we are not able to predict accurately or control which may cause actual results to differ materially from expectations expressed or implied by forward-looking statements. Except as required by applicable law, we assume no obligation, and disclaim any obligation, to update forward-looking statements whether as a result of new information, events or otherwise.
1
– PART I –
GENERAL DEVELOPMENT OF BUSINESS
Ampco-Pittsburgh Corporation (the “Corporation”) was incorporated in Pennsylvania in 1929. The Corporation, individually or together with its consolidated subsidiaries, is also referred to herein as the “Registrant.” The Corporation classifies its businessesmanufactures and sells highly engineered, high-performance specialty metal products and customized equipment utilized by industry throughout the world. It operates in two segments: business segments – the Forged and Cast Engineered Products (“FCEP”) segment and the Air and Liquid Processing.
FINANCIAL INFORMATION ABOUT SEGMENTS
The sales and operating results ofProcessing (“ALP”) segment. This segment presentation is consistent with how the Corporation’s two segmentschief operating decision-maker evaluates financial performance and makes resource allocation and strategic decisions about the business.
While the Corporation operated at normal levels in 2022, it continues to be challenged by lingering global economic effects of a post-pandemic environment and repercussions from the Russia-Ukraine conflict, including:
The Corporation is actively monitoring, and will continue to actively monitor, the geopolitical and economic consequence of these events and the identifiable assets attributable to both segments for the three years ended December 31, 2017, are set forth in Note 21 (Business Segments) of this Annual Reportpotential impact on Form 10-K. its operations, financial condition, liquidity, suppliers, industry, and workforce.
NARRATIVE DESCRIPTION OF BUSINESS
Forged and Cast Engineered Products Segment
Union Electric Steel CorporationThe FCEP segment produces ingot and forged products that service a wide variety of industries globally. It specializes in the production of forged hardened steel rolls, cast rolls and forged engineered products (“FEP”). Forged hardened steel rolls are used primarily in hot and cold rolling mills by producers of steel, aluminum and other metals throughout the world. In addition, it produces ingot and open-die forged productsmetals. Cast rolls, which are produced in a variety of iron and steel qualities, are used mainly in hot strip mills, medium/heavy section mills, roughing mills, and plate mills. FEP principally are sold to customers in the steel distribution market, oil and gas industry and the aluminum and plastic extrusion industries. Union Electric Steel Corporation is headquartered in Carnegie, Pennsylvania, with three manufacturing facilities in Pennsylvania, one in Indiana and one in Ohio. It is one of the largest producers of forged hardened steel rolls in the world. In addition to a few domestic competitors, several major European, South American and Asian manufacturers also compete in both the domestic and foreign markets. In 2007, a subsidiary of Union Electric Steel Corporation became a 49% partner in a joint venture in China to manufacture large forged backup rolls, principally in weights and sizes larger than those which can be made in the subsidiary’s facilitiesThe segment has operations in the United States. In 2016, the ownershipStates, England, Sweden, Slovenia, and an equity interest in thethree joint venture was reduced to 33%.
The following entities are indirect subsidiaries of Union Electric Steel Corporation:
Union Electric Steel UK Limited produces cast rolls for hot and cold strip mills, medium/heavy section mills and plate millscompanies in a variety of iron and steel qualities. It is located in Gateshead, England, and is a major supplier of cast rolls toChina. Collectively, the metalworking industry worldwide. Itsegment primarily competes with European, Asian and North and South American companies in both domestic and foreign markets. markets and distributes a significant portion of its products through sales offices located throughout the world.
Union Electric Steel Corporation (“UES”) produces forged hardened steel rolls and FEP. It is headquartered in Carnegie, Pennsylvania, with three manufacturing facilities in Pennsylvania and one in Indiana. The following entities are direct or indirect operating subsidiaries of UES:
Union Electric Steel UK Limited is a 24% partner in a Chinese joint venture which produces cast rolls.
Åkers Sweden AB produces cast rolls for hot strip finishing, roughing mills and plate mills and medium/heavy section mills in a variety of iron and steel qualities.qualities for hot strip mills, medium/heavy section mills and plate mills. It is located in Gateshead, England.
Åkers Sweden AB produces cast rolls in a variety of iron and steel qualities for hot strip mills, medium/heavy section mills, roughing mills, and plate mills. It is located in Åkers Styckebruk, Sweden.
Åkers Valji Ravne d.o.o. produces forged rolls for cluster mills and Z-Hi mills, work rolls for narrow and wide strip and aluminum mills, back-up rolls for narrow strip mills, as well asand leveling rolls and shafts. It is located in Ravne, Slovenia.
Alloys Unlimited Processing, LLC is a distributor of tool steels and alloys and carbon round bar. It is located in Austintown, Ohio.
The segment’s three joint venture companies in China include:
Shanxi Åkers TISCO Roll Co., Ltd., is a joint venture between Taiyuan Iron and Steel CoCo. Ltd. and Åkers AB, a non-operating subsidiary of Union Electric Steel Corporation,UES, that produces cast rolls for hot strip mill work rolls.mills, steckel mills and medium plate mills. It is located in Taiyuan, Shanxi Province, China. Åkers AB holds a 60%59.88% interest in the joint venture.
NationalAnhui Baochang Roll Company Co., Ltd., previously known as Magong Gongchang United Rollers Co., Ltd., is a division of Akers Nationaljoint venture among UES, Magang (Group) Holding Co., Ltd. and Jiangsu Gong-Chang Roll Company, a subsidiary ofCo., Ltd. that produces large forged backup rolls for hot and cold strip mills. It is located in Maanshan, Anhui Province, China. Union Electric Steel Corporation,(Hong Kong) Limited, a non-operating subsidiary of UES, holds a 33% interest in the joint venture.
2
Jiangsu Gong-Chang Roll Co., Ltd. is a joint venture that produces cast rolls for hot and cold strip mills, as well asmedium/heavy section mills and plate mills. It is located in Avonmore, Pennsylvania.Xinjian Town Yixing City, Jiangsu Province, China. Union Electric Steel UK Limited holds a 24.03% interest in the joint venture.
Vertical Seal Company is a division of Akers National Roll Company that manufactures bearings, bushings, key and keyless bearing sleeves, as well as provides a number of services, including rebuild of mill spare parts, chock inspection and repair, and onsite inspections and installations. It is located in Pleasantville, Pennsylvania.
ASW Steel Inc. is a premier specialty steel producer located in Welland, Ontario, Canada.
Alloys Unlimited Processing, LLC is a distributor of tool steels, alloys and carbon round bar, located in Austintown, Ohio.
Air and Liquid Processing Segment
The ALP segment includes Aerofin, Buffalo Air Handling and Buffalo Pumps, all divisions of Air & Liquid Systems Corporation (“Air & Liquid”), a wholly owned subsidiary of the Corporation. The segment has operations in Virginia and New York with headquarters in Carnegie, Pennsylvania. The segment distributes a significant portion of its products through a common independent group of sales offices located throughout the United States and has several major competitors.
Aerofin Division of Air & Liquid Systems Corporation produces custom-engineered finned tube heat exchange coils and related heat transfer products for a variety of industries including OEM/commercial, nuclear power generation automotive,and industrial process and HVAC, andmanufacturing. It is located in Lynchburg, Virginia.
Buffalo Air Handling Division of Air & Liquid Systems Corporation produces large customcustom-designed air handling systems used in commercial,for institutional (e.g., hospital, university), pharmaceutical and general industrial buildings andbuilding markets. It is located in Amherst, Virginia.
Buffalo Pumps Division of Air & Liquid Systems Corporation manufactures a line of centrifugal pumps for the refrigeration,fossil fueled power generation, and marine defense industries and industrial refrigeration industries. It is located in North Tonawanda, New York.
All three of the divisions in this segment are principally represented by a common independent sales organization and have several major competitors.Products
In both segments, the products are dependent on engineering, principally custom designed, and are sold to sophisticated commercial and industrial users located throughout the world.
Products are delivered directly to the customer via third-party carriers or customer-arranged transportation. For the FCEP segment, one customer accounted for 10% of its net sales in 2022, the loss of which could have a material adverse effect on the segment, and no customers exceeded 10% of its net sales in 2021. For the ALP segment, no customers exceeded 10% of its net sales in 2022 or 2021. For additional information on the products produced and financial information about each segment, see Note 21 (Business Segments) of this Annual Report on Form 10-K.17, Revenue, and Note 24, Business Segments, to the Consolidated Financial Statements.
Raw Materials
Raw materials used in both segments are generally available from many sources, and neither segment is dependent upon any single supplier for any raw material. Substantial volumes of raw materials used by each segment are subject to significant variations in price. The Corporation’s subsidiaries generally do not purchase or commit for the purchase of a major portion of raw materials significantly in advance of the time they require such materials but doperiodically make forward commitments for the supply of natural gas, electricity and certain commodities (copper and aluminum). See Note 13 (Derivative Instruments) of this Annual Report on Form 10-K.15, Derivative Instruments, to the Consolidated Financial Statements.
Patents and Trademarks
While the Corporation and its subsidiaries hold somecertain patents, trademarks and licenses, in the opinion of managementthe Corporation, they are not material to either segment.
Backlog
The backlog of orders at December 31, 2017,2022 was approximately $326$369.0 million compared to a backlog of $234$292.6 million at year-end 2016.2021. Both segments contributed to the improvement in backlog. Backlog for the FCEP segment increased by approximately $28.8 million year over year due to the net of improved demand and sale price increases for mill rolls offset by lower FEP backlog and foreign exchange rates used to translate the backlog of the Corporation’s foreign subsidiaries into the U.S. dollar. Backlog for the ALP segment increased by approximately $47.6 million and benefited from improved order intake for each of its product lines. Approximately 6% of the backlog is expected to be released after 2018.2023.
Competition
The Corporation faces considerable competition from a large number of companies in both segments. The Corporation believes, however, that its subsidiaries are significant participants in each of the niche markets whichthat they serve. Competition in both segments is based on quality, service, price, and delivery. For additional information, see Part I, Item 1 “General Development of Business” of this Annual Report on Form 10-K.
As part of an overall strategy to develop new markets and maintain a leadership position in each of the industry niches served, the Corporation’s subsidiaries in both segments incur expenditures for research and development. The activities that are undertaken are designed to develop new products, improve existing products and processes, enhance product quality, adapt products to meet customer specifications and reduce manufacturing costs. In the aggregate, these expenditures approximated $3.39 million in 2017, $2.72 million in 2016 and $1.14 million in 2015.
Environmental Protection Compliance Costs
Expenditures for environmental control matters were not material to either segment in 20172022 and are not expected to be material in 2018.2023.
Employees3
Employees and Human Capital Management
Employees
On December 31, 2017,2022, the Corporation and its subsidiaries had 1,9431,565 active employees.
FINANCIAL INFORMATION ABOUT GEOGRAPHIC AREAS
The Forged and Cast Engineered Products segment has manufacturing operationsemployees worldwide (substantially all full-time), of which approximately 54% were employed in the United States, England, Sweden, Slovenia, ChinaStates. Approximately 34% of the Corporation’s employees are covered by collective bargaining agreements or agreements with works councils.
Oversight
The Compensation Committee of the Board of Directors maintains oversight of the Corporation’s human capital management strategies that it may deem important to the long-term sustainability of the Corporation.
Key Areas of Focus for the Corporation
Health and Canada;Safety – The Corporation’s health and sales officessafety program is designed around the regulations associated with the specific hazards and unique working environments of the Corporation’s manufacturing and headquarter operations. The Corporation requires all of its locations to perform regular safety audits to ensure compliance with the safety program. Leading indicators, such as reporting and training of all near-miss events, are used to identify risks for potential future incidents. Lagging indicators, such as OSHA recordable rates and lost-time incidence rates, are used to measure achievement of safety metrics.
Diversity and Inclusion – The Corporation tracks various metrics such as turnover, absenteeism and diversity. The Corporation has developed strategies to ensure that employees of diverse backgrounds andperspectives enjoy a culture of mutual respect, inclusiveness and teamwork in Brazil, China, Canada, Egypt, France, Germany, Singapore, Slovenia, Sweden, Taiwan and Turkey. For financial information relating to foreign and domestic operations see Note 21 (Business Segments) of this Annual Report on Form 10-K.an environment which values diversity.
AVAILABLE INFORMATION
The Corporation files annual, quarterly and current reports,reports; amendments to those reports,reports; proxy statementsstatements; and other information with the Securities and Exchange Commission (“SEC”). You may access and read the Corporation’s filings without charge through the SEC’s website at www.sec.gov. You may also read and copy any document the Corporation files at the SEC’s Public Reference Room located at 100 F. Street, N.E., Room 1580, Washington, DC 20549. Please call the SEC at 1-800-SEC-0330 for further information on the Public Reference Room.
www.sec.gov. The Corporation’s internet address is www.ampcopittsburgh.com.www.ampcopittsburgh.com. The Corporation makes available, free of charge on its internet website, access to these reports as soon as reasonably practicable after such material is filed with, or furnished to, the SEC. The information on the Corporation’s website is not part of this Annual Report on Form 10-K.
EXECUTIVE OFFICERS
The name, age, position with the Corporation,(1) and business experience for at least the past five years of the Executive Officers(1) of the Corporation are as follows:
John S. StanikJ. Brett McBrayer (age 64)57). Mr. StanikMcBrayer has served as the Corporation’s Chief Executive Officer since January 2015.July 2018. He previously worked at Calgon Carbon Corporation, an international company specializing in purification products, technologies and services, from 1991 through 2012, when he retired for personal reasons. Mr. Stanik served as President and Chief Executive Officer at Airtex Products and ASC Industries, a global manufacturer and distributor of Calgon Carbonautomotive after-market and OEM fuel and water pumps from 20032012 to 20122017. Airtex Products and becameASC Industries, together with its Chairmanparent company, UCI International LLC, and affiliated companies, filed for bankruptcy protection in June 2016, and successfully emerged in December 2016. Mr. McBrayer also served as Vice President and General Manager of the Board in 2007. On October 3, 2017, the Corporation announced that Mr. Stanik had notified the Board of DirectorsAlcan Cable business at Rio Tinto Alcan, as Vice President and General Manager of the Specialty Metals Division at Precision Cast Parts Corporation, and held positions of various responsibility and leadership during his intention to retire as Chief Executive Officer sometime20 years with Alcoa, Inc. Mr. McBrayer received a Bachelor of Science in Industrial Engineering from the middleUniversity of 2018 or at such time asTennessee and a suitable successor is identified and appointed.Master of Arts in Applied Behavioral Science from Bastyr University.
Rose Hoover (age 62). Ms. Hoover has been employed by the Corporation for more than thirty-five years. She has served as President and Chief Administrative Officer of the Corporation since August 2015 and Executive Vice President from 2011 to August 2015.
Michael G. McAuley (age 54)59). Mr. McAuley has served as Senior Vice President, Chief Financial Officer and Treasurer of the Corporation since April 2016. Mr. McAuley was named SeniorMarch 2018 and as Vice President, in March 2018.Chief Financial Officer and Treasurer since April 2016. Previously, he served as Senior Vice President and Chief Financial Officer of RTI International Metals, Inc., a producer of titanium mill products and fabricated metal components from July 2014 to October 2015; Chief Financial Officer of ECI Development, Ltd., a private real estate developer, from January 2013 until June 2014, and Vice President and Treasurer of Goodrich Corporation, a manufacturer of aerospace and defense components and systems, from December 2007 until July 2012.
Maria Trainor (age 43). Ms. Trainor has served as Vice President, General Counsel and Secretary of the Corporation since June 2015. Prior to joining the Corporation, Ms. Trainor was a partner at K&L Gates, LLP, an international law firm, where she had practiced for nearly fourteen years.
Rodney L. ScaglineSamuel C. Lyon (age 51)54). Mr. ScaglineLyon has served as President of Union Electric Steel Corporation since November 2015; ExecutiveFebruary 2019. He previously served as Vice President of Union Electric Steel Corporation from April 2014 to November 2015, Viceand Group President of ManufacturingPerformance Engineered Products at Carpenter Technology Corporation, a developer, manufacturer and distributor of Union Electric Steel Corporation from June 2013 to April 2014stainless steels and Director of Technology of Union Electric Steel Corporationcorrosion-resistant alloys from July 20112017 to May 2013. He previously worked at Akers National Roll Company, a cast engineered product manufacturerJanuary 2019. Prior to that, was acquired by the Corporation in 2016 as part of the Åkers group acquisition, where he served as its Vice President and General Manager of Metallurgical Services for three yearsDynamet Incorporated, the titanium business unit of Carpenter Technology Corporation from October 2016 to June 2017, and Vice Presidentas Chief Operating Officer of SalesUCI-Pumps business of UCI-Fram, an OEM and Marketing for one year.after-market automotive parts supplier from March 2013 to September 2016.
Terrence W. Kenny
4
David G. Anderson (age 58)55). Mr. KennyAnderson has been employed by the Corporation for more than thirty years. Hesince 2010 and has served as President of the Air & Liquid Systems Corporation for more than five years.
Timothy R. Clutterbuck (age 59). Mr. Clutterbuck hassince January 2022. He previously served as Vice President of ASWFinance for Union Electric Steel Inc. since November 2011.Corporation from October 2018 to December 2021, and as Vice President of Air & Liquid Systems Corporation from May 2016 to October 2018.
|
|
From time to time, important factors may cause actualOur business, financial condition, results to differ materially from future expected results based on performance expressed or implied byof operations, liquidity, and the value of any forward-looking statements made by us, including known and unknown risks, uncertainties and other factors, many of which are not possible to predict or control. Several of these factors are described from time to timeinvestment in our filings with the Securitiessecurities are subject to a number of risks. The risks and Exchange Commission,uncertainties described below are those that we have identified as material, but the factors described in filings are not the only risks and uncertainties we face. Additional risks and uncertainties not currently known to us or that we currently believe are not material also may impair our business, financial condition, results of operations, liquidity, and the Corporation faces.value of any investment in our securities.
RISKS RELATED TO OUR BUSINESS AND INDUSTRY
Cyclical demand for products and economic downturns maycould reduce the demand for, and sales of, our products, which could adversely affect our margins and profitability.
A significant portion of the Forged and Cast Engineered ProductsFCEP segment’s sales consists of mill rolls to customers in the global steel and aluminum industry whichthat can be periodically impacted by economic or cyclical downturns. Such downturns, the timing and length of which are difficult to predict, may reduce the demand for, and sales of, our forged and cast steel rolls both in the United States and the rest of the world. Lower demand for rolls may also adversely impact profitability as other competing roll producers lower selling prices in the marketplace in order to fill their manufacturing capacity. Cancellation of orders or deferral of delivery of rolls may occur and produce an adverse impact on our financial results. In addition, sales of non-roll product, consisting ofFEP, specifically open-die forged product primarilyproducts for the oil and gas industries,industry and steel distribution markets, are impacted by fluctuations in global energy prices.prices, which also could adversely affect our margins and profitability.
Excess global capacity in the steel industry could lower prices for our products, which wouldcould adversely affect our sales, margins and profitability, as well as the collectability of our receivables and the salability of our in-process inventory.
The global steel manufacturing capacity continues to exceed global consumption of steel products. Such excess capacity often results in manufacturers in certain countries exporting steel at prices significantly below their home market prices (often due to local government assistance or subsidies), which leads to global market destabilization and reduced sales and profitability of some of our and our subsidiaries’ customers which, in turn, affects our sales and profit margins, as well as the collectability of our receivables and the salability of our in-process inventory.
Steel Excess capacity in the global roll industry consolidation resultedand cyclicality in certain customers having increased buying power,end-market demand also pose risks of potential impairment of our long-lived assets, which could put pressure on pricesbe material to our results of operations and the carrying value of our products and result in lower profit margins.assets.
As a result of reduced demand for steel products, the steel industry has undergone structural change by way of consolidation and mergers. In certain markets, the resultant reduction in the number of steel plants and the increased buying power of the enlarged steel producing companies may put pressure on the selling prices and profit margins of mill rolls.
A reduction in the level of our export sales, as well as other economic factors in foreign countries, maycould have an adverse impact on our financial results.
Exports are a significant proportionportion of our subsidiaries’ sales. Historically, changes in foreign exchange rates, particularly in respect of the U.S. dollar, British pound, Swedish krona, and the euro, have impacted the export of our products and may do so again in the future. Other factors that may adversely impact our export sales and our operating results include political and economic instability, export controls, changes in tax laws and tariffs, and new indigenous producers in overseas markets. A reduction in the level of our export sales may have an adverse impact on our financial results. In addition, changes in foreign currency exchange rate changesrates may allowprovide foreign roll suppliers with advantages based on those lower foreign currency exchange rates and, therefore, permit them to compete in our home markets.
Fluctuation ofin the value of the U.S. dollar relative to other currencies maycould adversely affect our business, results of operations and financial condition.
Certain of our subsidiaries operate in foreign jurisdictions and, accordingly, earn revenues, pay expenses, own assets, and incur liabilities in countries using currencies other than the U.S. dollar. Since our consolidated financial statements are presented in U.S. dollars, we must translate revenues and expenses into U.S. dollars at the average exchange rate during each reporting period and assets and liabilities into U.S. dollars at the exchange rate in effect at the end of each reporting period. Therefore, increases or decreases in the value of the U.S. dollar against other major currencies will affect the translated value for revenue, expenses and balance sheet items denominated in foreign currencies and could materially affect our financial results expressed in U.S. dollars.
A downturn
5
Increases in capital spending in the United Statesenergy and other jurisdictions may reduce demand for and sales of certain of our products, which would result in reduced profit margins.
Each of our businesses is susceptible to the general level of economic activity, particularly as it impacts industrial and construction capital spending. A downturn in capital spending in the United States and elsewhere may reduce demand for and sales of our subsidiaries’ air handling, power generation and refrigeration equipment, forged engineered products and mill rolls. Lower demand may also reduce profit margins due to our competitors and us striving to maximize manufacturing capacity by lowering prices.
Commodity price increases, as well as anycommodity prices, reductions in electricity and natural gas supply or shortage of key production materials could adversely impact our production, which wouldcould result in lower profitability.profitability or higher losses.
Our subsidiaries use certain commodities in the manufacture of their products. These include steel scrap, ferroalloys energy and graphite electrodes.energy. Any unexpected, sudden or prolonged price increase may cause a reduction in our profit margins or losses where beneficial fixed-priced contracts have been accepteddo not exist, unfavorable fixed-price contracts cannot be modified or increases cannot be obtained in futureour selling prices. In addition, there could be a time lag between when we incur such price increases and when we are able to recover such increases in our selling prices. Global increases in transportation costs and more limited availability of freight carriers may impact timely delivery of supplies to our subsidiaries and product to our customers, which may be accentuated during pandemics, and may negatively impact our sales, production and profitability. There also may be curtailment in electricity or natural gas supply or availability of key production materials, which wouldmay be accentuated during global conflict: all of which could adversely impact our production. Increases in energy and commodity prices, and/or reductions in electricity and natural gas supply could adversely impact our production or result in lower profitability or higher losses or impairment of our long-lived assets. Shortage of criticalkey production materials, while driving up costs, may be of such severity as to disrupt our production, all of which may impact our sales and profitability. Geopolitical factors or wars could exacerbate these risks. In particular, the Russia-Ukraine conflict may intensify the inflationary effect for the cost of natural gas, electricity, raw materials and other production components which are difficult to predict given the fluidity of the military conflict, the novelty of Western sanctions against Russia and possibility of yet harsher ones.
We could face limitations in availability of capital to fund our strategic plans. Additionally, deterioration in our credit profile or increases in interest rates could increase our costs of borrowing and further limit our access to capital markets and commercial credit.
We are parties to a senior secured asset-based revolving credit facility with a consortium of banks. The current global supply shortage of graphite electrodes used for electric arc furnace meltingcredit facility is collateralized by a first priority perfected security interest in substantially all of our steels could materially impactassets. The credit facility provides for borrowings not to exceed $100 million and an allowance of $20 million for new capital equipment financing (which was accessed in September 2022) but otherwise restricts us from incurring additional indebtedness outside of the agreement, unless approved by the banks. The credit facility is subject to various affirmative and negative covenants and contains various sub-limits, including those based on the type of collateral and borrowings by geographic region. If the financial covenants become difficult to meet or if our borrowing needs increase beyond the prescribed limits, our financial position, results of operations and liquidity may be materially adversely affected. In addition, changes in our credit profile could cause less favorable commercial terms for the procurement of materials required to manufacture our products, which also could have a negative impact on our financial position, results of operations and liquidity. Further, our access to public and private debt markets is limited based on our size, credit profile and not being a well-known seasoned issuer, which may result in limitations in availability of capital to fund our strategic plans.
We have entered into sale-leaseback transactions, which create the risk of loss if we default.
UES and Air & Liquid have entered into sale and leaseback financing transactions with Store Capital Acquisitions, LLC (“STORE”) relating to certain properties utilized by segments of the Corporation. Pursuant to such sale and leaseback, UES has entered into a lease with STORE, through which it will sublease properties to Air & Liquid. Such lease entered into by UES contains certain representations, warranties, covenants, obligations, conditions, indemnification provisions and termination provisions customary for that type of agreement. If the Corporation defaults on the terms of such transaction, the Corporation could lose the properties.
We need to maintain adequate liquidity to meet our operating cash flow requirements, debt service costs and other financial obligations. If we fail to comply with the covenants contained in our revolving credit facility or our equipment financing facilities, it may adversely affect our liquidity, results of operations and financial condition.
Our liquidity is a function of our cash on-hand, our ability to successfully generate cash flows from a combination of efficient operations and continuing operating improvements, availability from our revolving credit facility, access to capital markets, and funding from other third parties. We believe our liquidity (including operating and other cash flows that we expect to generate and revolving credit availability) should be sufficient to meet our operating requirements as they occur; however, our ability to maintain sufficient liquidity going forward is subject to the general liquidity of and ongoing changes in the credit markets as well as general economic, financial, competitive, legislative, regulatory, and other market factors that are beyond our control. If we be unableare not able to secure sufficient supply for our production requirements.
Wemaintain adequate liquidity, we may not be able to realizemeet our operating cash flow requirements; debt service costs; future required contributions to our employee benefit plans (which are expected to increase in 2024/2025 primarily due to lower than expected pension asset performance in 2022); and other financial obligations.
6
Our revolving credit facility is subject to various affirmative and negative covenants and our equipment financing facilities include various affirmative covenants. Failure to comply with material provisions or covenants in these facilities could have a material adverse effect on our liquidity, results of operations and financial condition. We may seek to renegotiate or replace a facility, or may determine not to replace a facility at all and may instead pursue other forms of liquidity. Any new credit agreement or these other forms of liquidity may result in higher borrowing costs and contain non-investment grade covenants that are less advantageous to us than our existing revolving credit and equipment financing facilities.
Our growth strategy has required substantial capital expenditures, which have been funded by the expected benefits from the acquisitions thatincurrence of additional debt. If we make, andare unable to repay debt service costs, we may experience difficulties in integrating the acquired businesses.be unable to obtain alternative financing on satisfactory terms and our liquidity, results of operations and financial conditions may be adversely affected.
WeTo support our growth strategy, we have made in the past, and mayexpect to continue to make certain acquisitions and enter into joint ventures, which are intendedsubstantial capital expenditures. We expect to complement or expand our businesses. These acquisitions involve a variety of challenges and risks. We may encounter difficulties integrating acquired businessescontinue to fund these capital expenditures with our equipment financing facilities. The incurrence of additional indebtedness would require that a portion of our cash flows from operations or applyingbe used for the payment of interest and principal, thereby reducing our internal control processesability to theseuse our cash flows from operations to fund working capital, other capital expenditures and acquisitions. Other risks associated with acquisitions are the diversion of management’s attention from other business concerns, the potential loss of key employees and customers of the acquired companies, the possible assumption of unknown liabilities, and potential disputes with the sellers. WeFurthermore, raising equity capital generally would dilute existing shareholders. If additional capital is needed, we may not be able to complete certain acquisitions dueobtain debt or equity financing on terms acceptable to antitrust laws and regulations in various jurisdictions. Additionally, we may not realize the degree of timing of benefits we anticipate when we first enter into a transaction. Any of the foregoing could adversely affect our business and results of operations.us, if at all.
A work stoppage or another industrial action on the part of any of our unions may be disruptive to our operations.
Our subsidiaries have several key operations which are subject to multi-year collective bargaining agreements with their hourly work forces. While we believe we have good relations with our unions, there is the risk of industrial action or work stoppage at the expiration of an agreement if contract negotiations break down, which may disrupt manufacturing and impact results of operations.
Dependence on certain equipment may cause an interruption in our production if such equipment is out of operation for an extended period of time, which wouldcould result in lower sales and profitability.
Our subsidiaries’ principal business relies on certain unique equipment such as an electric arc furnace and a spin cast work roll machine. Although a comprehensive critical spare inventory of key components for this equipment is maintained, if any such unique equipment is out of operation for an extended period of time, it may result in a significant reduction in our sales and earnings.
The ultimate liability of our subsidiaries for claims alleging personal injury from exposure to asbestos-containing components historically used in certain products of our subsidiaries could have a material adverse effect on our consolidated financial condition, results of operations or liquidity in the future.
OurCertain of our subsidiaries and, in some cases, we, are defendants in numerous claims alleging personal injury from exposure to asbestos-containing components historically used in certain products of ourthese subsidiaries. Through year-end 2017,the current year end, our insurance has covered a substantial majority of our settlement and defense costs. We believe that the estimated costs, net of anticipated insurance recoveries, of our pending and future asbestos legal proceedings for the next ten years should not have a material adverse effect on our consolidated financial condition or liquidity. However, there can be no assurance that our subsidiaries or we will not be subject to significant additional claims in the future or that our subsidiaries’ ultimate liability with respect to asbestos claims will not present significantly greater and longer lasting financial exposure than provided in our consolidated financial statements. The ultimate net liability with respect to such pending and any unasserted claims is subject to various uncertainties, including the following:
the number and nature of claims that are brought in the future;
the costs of defending and settling these claims;
insolvencies among our insurance carriers and the risk of future insolvencies;
the possibility that adverse jury verdicts could require damage payments in amounts greater than the amounts for which we have historically settled claims;
possible changes in the litigation environment or federal and state law governing the compensation of asbestos claimants; and
the risk that the bankruptcies of other asbestos defendants may increase our costs.
Because of the uncertainties related to such claims, it is possible that theour ultimate liability could have a material adverse effect on our consolidated financial condition, results of operations or liquidity in the future.
A change in the existing regulatory environment could negatively affect our operations and financial performance.
We are subject to a wide variety of complex domestic and foreign laws, rules and regulations, including trade policies and tax regimes. We are affected by new laws and regulations and changes to existing laws and regulations, including interpretations by the courts and regulators, whether prompted by changes in government administrations or otherwise. These laws, regulations and policies, and changes thereto, may result in restrictions or limitations to our current operational practices and processes and product/service offerings which could negatively impact our current cost structure, revenue streams, future tax obligations, the value of our deferred income tax assets, cash flows, and overall financial position.
7
In addition, our tax filings are subject to audits by tax authorities in the various jurisdictions in which we do business. These audits may result in assessments of additional taxes that are subsequently resolved with the taxing authorities or through the courts. Currently, we believe there are no outstanding assessments whose resolution would result in a material adverse financial result. However, we cannot offer assurances that unasserted or potential future assessments would not have a material adverse effect on our financial condition or results of operations.
In 2018, the United States imposed tariffs of 25% on primary steel imports and 10% on primary aluminum imports into the United States. As consumers of steel and aluminum in some of our products, our cost base is exposed to the impact of this action, or similar actions, which could reduce our margins, and we could potentially lose market share to foreign competitors not subject to similar tariff increases. Our financial condition, results of operations and liquidity may be affected by these tariffs, or similar actions. Moreover, these new tariffs, or other changes in U.S. trade policy, have resulted in, and may continue to trigger, retaliatory actions by affected countries which could adversely impact demand for our products, as well as impact our costs, customers, suppliers, and/or the U.S. economy or certain sectors thereof and, thus, may adversely impact our business, operations and financial performance.
Pandemics may cause disruptions to our business and the industries in which we operate.
Pandemics may increase economic and demand uncertainty and could cause a sustained global recession. We may experience episodic disruptions to our operations or to the operations of our customers and suppliers; global supply chain issues causing global inflationary pressures; customer-requested delays of deliveries or cancellation of orders; lower order intake resulting from customers postponing projects; the inability to obtain raw materials and supplies critical to the manufacturing process; delays in receiving and shipping product due to the lack of transportation; higher cost of production and transportation; long-term disruptions to our operations resulting from changes in government policy or guidance; quarantines of employees, customers and suppliers in areas affected by a pandemic; closures of businesses or manufacturing facilities that are critical to our business or our supply chains; and higher write-offs of accounts receivables and impairment charges on our asset values, including property, plant and equipment and intangible assets, which, individually or in the aggregate, may impact, our financial condition, results of operations and liquidity. Further, local governmental measures may be implemented to control the spread of the virus, including restrictions on manufacturing and the movement of employees in many regions and countries, and may be significant.
A pandemic may adversely affect our liquidity and our ability to access the capital markets. Additionally, government stimulus programs available to us, our customers or our suppliers, if any, may prove to be insufficient or ineffective. Furthermore, in the event that the impact from a pandemic causes us to be unable to maintain a certain level of excess availability under our revolving credit facility, our availability of funds may become limited, or we may be required to renegotiate the facility on less favorable terms. If we are unable to access additional credit at the levels we require, or the cost of credit is greater than expected, it could materially adversely affect our financial condition, results of operations and liquidity.
We have significant international operations. A pandemic could negatively affect our workforce, both domestically and abroad, requiring some or all of our employees to work from home on a longer-term or permanent basis, thereby requiring new processes, procedures and controls to respond to changes in our business environment. We may be susceptible to increased litigation related to, among other things, the financial impacts of the pandemic on our business, our ability to meet contractual obligations due to the pandemic, employment practices or policies adopted during the health crisis, or litigation related to individuals contracting any disease as a result of alleged exposures on our premises.
The lossimpact of a pandemic also may have the effect of exacerbating many of the other risks described herein.
8
Uncertainty related to environmental regulation and industry standards, as well as the physical risks of climate change, could impact our results of operations and financial position.
Increased public awareness and concern regarding environmental risks, including global climate change, may result in more international, regional and/or federal requirements or industry standards to reduce or mitigate global warming and other environmental risks. New climate change laws and regulations could require us to change our manufacturing processes or obtain substitute materials that may cost more or be less available for our manufacturing operations. Various jurisdictions in which we do business have implemented, or in the future could implement or amend, restrictions on emissions of carbon dioxide or other greenhouse gases, limitations or restrictions on water use, changes from traditional fossil fuel sources to renewables, regulations on energy management and waste management, and other climate change-based rules and regulations, which may increase our costs and adversely affect our operating results. In addition, the physical risks of climate change may impact the availability and cost of materials, sources and supply of energy, product demand and manufacturing and could increase our insurance and other operating costs. The expected future increased worldwide regulatory activity relating to climate change could expand the nature, scope and complexity of matters that we are required to control, assess and report. If environmental laws or regulations or industry standards are either changed or adopted and impose significant operational restrictions and compliance requirements upon us, our suppliers, our customers, or our products, or if our operations are disrupted due to the physical impacts of climate change on us, our suppliers, our customers or our business, our results of operations and financial condition could be adversely impacted.
A work stoppage or another industrial action on the part of any of our unions could be disruptive to our operations.
Our subsidiaries have several key operations which are subject to multi-year collective bargaining agreements or agreements with works councils with their hourly work forces. While we believe we have good relations with our unions, there is the risk of industrial action or work stoppage at the expiration of an agreement if contract negotiations fail, which may disrupt our manufacturing processes and impact our results of operations.
The Corporation may not realize the expected benefits from any restructuring and improvement efforts that we have taken or may take in the future.
We periodically evaluate our segments and we have and continue to undertake restructuring and realignment initiatives to reduce our overall cost basis and improve efficiency. There can be no assurance that we will fully realize the benefits of such efforts as anticipated, and we may incur additional and/or unexpected costs to realize them. These actions could yield other unintended consequences, such as distraction of management or ourand employees, business disruption, reduced employee morale and productivity, and unexpected employee attrition, including the inability to attract or retain qualified personnel may prevent us from our implementingkey personnel. If we fail to achieve the expected benefits of any restructuring or realignment initiatives and improvement efforts, or if other unforeseen events occur in conjunction with such efforts, our business, strategy.results of operations and financial condition could be negatively impacted.
Our success is dependent onRISKS RELATED TO OWNERSHIP OF OUR SECURITIES
If we fail to maintain an effective system of internal control, we may not be able to accurately determine our financial results or prevent fraud. As a result, our shareholders could lose confidence in our financial results, which could harm the management, experiencebusiness and leadership skillsthe value of our senior management teamsecurities.
Effective internal control is necessary to provide reliable financial reports and key employees. The losseffectively prevent fraud. Section 404 of anythe Sarbanes-Oxley Act of these individuals2002 requires us to evaluate and report on our internal control over financial reporting. Our internal control over financial reporting is not subject to attestation by our independent registered public accounting firm pursuant to the exemption provided to issuers that are not “large accelerated filers” or an inability to attract, retain and maintain additional personnel with similar industry experience could prevent us from implementing our business strategy.“accelerated filers” under the Dodd-Frank Act of 2010. We cannot assure yoube certain that we will be successful in maintaining adequate internal control over our financial reporting and financial processes in the future. We may in the future discover areas of our internal control that need improvement. Furthermore, to the extent our business grows, our internal control may become more complex, and we would require significantly more resources to ensure our internal control remains effective.
We assessed the effectiveness of internal control over financial reporting as of December 31, 2022. In making this assessment, we used the criteria set forth in Internal Control – Integrated Framework (2013) issued by the Committee of Sponsoring Organizations of the Treadway Commission. Based on those criteria and our assessment, we concluded that our internal control over financial reporting was not effective as of December 31, 2022, because of the material weaknesses as described below. A material weakness is a deficiency, or a combination of deficiencies, in internal control over financial reporting such that there is a reasonable possibility that a material misstatement of the annual or interim financial statements, including footnotes to the annual or interim financial statements, will not be prevented or detected on a timely basis.
9
As of December 31, 2022, we had material weaknesses related to (i) the accounting for claims asserted alleging personal injury from exposure to asbestos-containing components historically used in some products manufactured by predecessors of Air & Liquid (“Asbestos Liability”) and (ii) management review control activities related to the tax accounting of a non-routine transaction. The material weakness related to the Asbestos Liability is a result of the aggregation of the following control deficiencies: insufficient design and business process controls surrounding a new asbestos claims management database, insufficient testing of data migration from the previous asbestos claims management database to the new asbestos claims management database, and inadequate information technology (“IT”) general controls which ensure the integrity of the data and processes that the new asbestos claims management system supports. The material weakness related to management review control activities of the non-routine transaction is a result of management review control activities not operating at a sufficient level of precision to detect errors related to the income tax footnote disclosures of the non-routine transaction. See Part II, Item 9A, Controls and Procedures, for further discussion.
Our remediation efforts have and will continue to require significant resources and attention. If we are unable to remediate these material weaknesses or other identified deficiencies in our internal control over financial reporting, or if we identify additional material weaknesses in our internal control over financial reporting, we will be unable to assert in future reports that our disclosure controls and procedures and our internal control over financial reporting are effective. This could cause investors, counterparties and customers to lose confidence in the accuracy and completeness of our financial statements and reports and have a material adverse effect on our liquidity, access to capital markets and perceptions of our creditworthiness, and/or a decline in the market price of our common stock. Additionally, the existence of any material weakness could require us to devote significant time and incur significant expense to identify and remediate any such material weaknesses, and we may not be able to retainremediate any such material weaknesses in a timely manner. We also may become subject to investigations by the New York Stock Exchange, the SEC or other regulatory authorities, which could require additional financial and management resources. These events could have a material adverse effect on our existingbusiness, financial condition and results of operations.
Actions of activist shareholders with respect to us or our securities could be disruptive and potentially costly and the possibility that activist shareholders may contest, or seek changes that conflict with, our strategic direction could cause uncertainty about the strategic direction of our business.
Activist shareholders may from time-to-time attempt to effect changes in our strategic direction and, in furtherance thereof, may seek changes in how we are governed. While our Board of Directors and management team strive to maintain constructive, ongoing communications with all of our shareholders, including activist shareholders, and welcome their views and opinions with the goal of working together constructively to enhance value for all shareholders, activist campaigns that contest, or conflict with, our strategic direction could have an adverse effect on us because: (i) responding to actions by activist shareholders can disrupt our operations, be costly and time-consuming and divert the attention of our Board of Directors and senior management from the pursuit of business strategies, which could adversely affect our results of operations and key personnelfinancial condition; (ii) perceived uncertainties as to our future direction may lead to the perception of a change in the direction of the business, instability or lack of continuity which may be exploited by our competitors, cause concern to our current or potential customers, result in the loss of potential business opportunities and make it more difficult to attract additionaland retain qualified personnel when needed.and business partners; and (iii) these types of actions could cause significant fluctuations in our stock price due to factors that do not necessarily reflect the underlying fundamentals and prospects of our business.
We may not be able to satisfy the continued listing requirements of the New York Stock Exchange and the NYSE American Exchange for our common stock and Series A warrants, respectively.
Our common stock is currently listed on the New York Stock Exchange, and our Series A warrants are listed on the NYSE American Exchange, with each imposing objective and subjective requirements for continued listing.
Continued listing criteria of the New York Stock Exchange include maintaining prescribed levels of financial condition, market capitalization and shareholders’ equity. Specifically, the New York Stock Exchange requires a company with common equity listed on its exchange to maintain average global market capitalization over a consecutive 30 trading-day period of at least $50 million or maintain shareholders’ equity of at least $50 million and maintain a share price of at least $1.00. Our common stock’s average-global market capitalization over the 30 trading-day period ended December 31, 2022 was $54.6 million, and our total Ampco-Pittsburgh shareholders’ equity was $104.3 million as of December 31, 2022. Should we receive a notice of non-compliance, the New York Stock Exchange may allow up to an 18-month cure period if we present a plan to become compliant with adequate strategic actions and progress reporting satisfactory to the New York Stock Exchange. If the New York Stock Exchange determines that our common stock fails to satisfy the requirements for continued listing, or we continue to fail to meet listing criteria, our common stock could be de-listed from the New York Stock Exchange, which could impact potential liquidity for our shareholders.
10
Continued listing criteria of the NYSE American Exchange include maintaining prescribed levels of financial condition, market capitalization and shareholders’ equity. Among other requirements, there must be an aggregate of at least 50,000 Series A warrants. Satisfaction of the NYSE American Exchange’s listing requirements therefore depends upon the extent to which warrant holders elect to exercise their Series A warrants. We cannot provide assurance that we will continue to meet these, or other, listing standards of the NYSE American Exchange with respect to the Series A warrants. If we fail to meet the listing criteria, our warrants could be de-listed from the NYSE American Exchange, which could impact potential liquidity for our shareholders.
Holders of Series A warrants will have no rights as holders of our common stock until they exercise their Series A warrants and acquire our common stock.
Until holders of our Series A warrants acquire shares of our common stock upon exercise of such Series A warrants, they will have no rights with respect to the shares of our common stock underlying such Series A warrants. Upon exercise of the Series A warrants, the holders thereof will be entitled to exercise the rights of holders of our common stock only as to matters for which the record date occurs after the warrant exercise date.
The market price of our common stock may not exceed the exercise price of the Series A warrants at such time as the holder desires to exercise such Series A warrants and, accordingly, the Series A warrants may have no value.
The Series A warrants are exercisable through August 1, 2025. The market price of our common stock may not exceed the exercise price of the Series A warrants at such times prior to their date of expiration that the holder desires to exercise such warrants. Any Series A warrants not exercised by their date of expiration will expire without residual value to the holders. Additionally, the price of the Series A warrants may fluctuate, and liquidity may be limited. Holders of Series A warrants may be unable to resell their Series A warrants at a favorable price, or at all.
Because the Series A warrants are executory contracts, they may have no value in a bankruptcy or reorganization proceeding.
In the event a bankruptcy or reorganization proceeding is commenced by or against us, a bankruptcy court may hold that any unexercised Series A warrants are executory contracts subject to rejection by us with the approval of a bankruptcy court. As a result, even if we have sufficient funds, holders may not be entitled to receive any consideration for their Series A warrants or may receive an amount less than they would be entitled to if they had exercised their Series A warrants prior to the commencement of any such bankruptcy or reorganization proceeding.
GENERAL RISK FACTORS
Potential attacks on information technology infrastructure and other cyber-based business disruptions could have a material adverse effect on our financial condition, and results of operations.operations and liquidity.
We depend on integrated information technology (“IT”)IT systems to conduct our business. IT systems failures, including risks associated with upgrading our systems or in successfully integrating IT and other systems in connection with the integration of businesses we acquire,to common platforms, network disruptions and breaches of data security could disrupt our operations by impeding our processing of transactions, our ability to protect customer or company information and our financial reporting. Our computer systems, including our back-up systems, could be damaged or interrupted by power outages,outages; computer and telecommunications failures,failures; computer viruses,viruses; internal or external security breaches,breaches; events such as fires, earthquakes, floods, tornadoes, and hurricanes, and/orhurricanes; and errors by our employees. Cyber-based risks, in particular, are evolving and include bothpotential attacks to our IT infrastructure and attacks to the IT infrastructure of third parties in attempts to gain unauthorized access to our confidential or other proprietary information or information relating to our employees, customers and other third parties.parties or to seek ransom. Although we have taken steps to address these concerns, there can be no assurance that a system failure or data security breach will not have a material adverse effect on our financial condition, and results of operations.
We could be exposed to substantial liabilities resulting from non-compliance with domestic and international environmental laws and regulations.
We and our subsidiaries are subject to various domestic and international environmental laws and regulations that govern the discharge of pollutants and disposal of wastes and which may require that we and our subsidiaries investigate and remediate the effects of the release or disposal of materials at sites associated with past and present operations. We and our subsidiaries could incur substantial cleanup costs, fines and civil or criminal sanctions, third party property damage or personal injury claims as a result of violations or liabilities under these laws or non-compliance with environmental permits required at our facilities.
A change in the existing regulatory environment could negatively affect our operations and financial performance.
We are subject to a wide variety of complex domestic and foreign laws, rules and regulations, and legal compliance risks, including, without limitation, securities laws, employment and pension-related laws, competition laws, export controls and sanctions laws, data privacy and security laws, and laws governing improper business practices. We are affected by new laws and regulations, and changes to existing laws and regulations, including interpretations by courts and regulators. These laws, regulations and policies, and changes thereto, may result in restrictions or limitations to our current operational practices and processes and product/service offerings which could negatively impact our current cost structure, revenue streams, cash flows, and overall financial position.
Additionally, we are subject to tax laws and regulations in the United States and multiple foreign jurisdictions. We are affected by changes in tax laws and regulations, as well as changes in related interpretations and other tax guidance. In the ordinary course of our business, we are subject to examinations and investigations by various tax authorities. In addition to existing examinations and investigations, there could be further examinations and investigations in the future, and existing examinations and investigations could be expanded.
On December 22, 2017, the U.S. federal government enacted the Tax Cuts and Jobs Act (the “Tax Reform”), to become effective as of January 1, 2018, which, among other things, lowered the U.S. corporate statutory income tax rate from 35% to 21%, implemented a modified territorial tax system and imposed a one-time tax on deemed repatriated earnings of foreign subsidiaries. The Tax Reform contains numerous complex provisions impacting U.S. multinational companies, and we continue to review and assess the legislative language and its potential impact on us. The full extent of the impact remains uncertain at this time, and our current interpretations of, and assumptions regarding, the Tax Reform are subject to additional regulatory or administrative developments, including any regulations or other guidance promulgated by the U.S. Internal Revenue Service. As a result, the Tax Reform, including any regulations or other guidance promulgated by the U.S. Internal Revenue Service, and other tax laws could have significant effects on us, some of which may be adverse and could materially and adversely impact our financial condition, results of operations and cash flows.liquidity.
In 2018, President Trump announced he would impose tariffs
11
Our By-laws designate the state and federal courts sitting in the judicial district of 25%the Commonwealth of Pennsylvania as the sole and exclusive forum for certain types of actions and proceedings that may be initiated by our shareholders and the federal courts as the sole and exclusive forum for claims arising under the Securities Act of 1933, as amended, which could discourage lawsuits against us and our directors and officers but may be found to be inapplicable or unenforceable.
Our By-laws provide, unless we otherwise consent in writing, the state and federal courts sitting in the judicial district of the Commonwealth of Pennsylvania embracing the county in which our principal executive office is located will be the sole and exclusive forum for (a) any derivative action or proceeding brought on steel imports and 10% on aluminum imports. As consumersbehalf of steel and aluminum in someus, (b) any action asserting a claim of breach of a fiduciary duty owed to us or our shareholders by any director, officer or other employee of ours, (c) any action asserting a claim against us or against any of our Air & Liquid Processing segment products,directors, officers or other employees arising pursuant to any provision of the Pennsylvania Business Corporation Law of 1988 or our costs could be significantly impacted ifArticles of Incorporation or By-laws, (d) any action seeking to interpret, apply, enforce, or determine the tariffs are imposed, potentially reducing our margins and risking loss of market share to foreign competitors not subject to similar tariffs. In addition, in the ordinary course of business, onevalidity of our U.S. subsidiaries purchases intercompany steel producedArticle of Incorporation or By-laws, or (e) any action asserting a claim against us or any director or officer or other employee of ours governed by another subsidiary located in Canada, which also exports steelthe internal affairs doctrine (collectively, “Internal Governance Claims”). This exclusive forum provision does not apply to customers insuits brought to enforce a duty or liability created by the U.S. Canada is temporarily exempted fromSecurities Exchange Act of 1934, as amended (the “Exchange Act”) or the proposed tariffs. If this exemption is not made permanent, we could lose margin and/or market shareSecurities Act of 1933, as amended (the “Securities Act”). However, the federal courts are the sole and exclusive forum for any complaint asserting a cause of action arising under the related business. Uncertainties regardingSecurities Act, pursuant to our By-laws, and any complaint asserting a cause of action arising under the scopeExchange Act, pursuant to Section 27 of the proposed tariffsExchange Act. This exclusive forum provision may limit the ability of our shareholders to bring a claim in a judicial forum that such shareholders find favorable for disputes with us or our directors or officers, which may discourage such lawsuits against us and our directors and officers. Alternatively, if a court outside of Pennsylvania with respect to Internal Governance Claims or any other state court with respect to a cause of action under the Securities Act were to find this exclusive forum provision inapplicable to, or unenforceable in respect of, one or more of the specified types of actions or proceedings described above, we may incur additional costs associated with resolving such matters in other jurisdictions, which could also pose potential risk to the cost of certain intercompany value-added intermediary product transfers. Accordingly,adversely affect our business, financial condition and results of operations and cash flows could be significantly affected.operations.
New trade restrictions and regulatory burdens associated with “Brexit” could adversely impact our operations and financial performance.
On June 23, 2016, voters in the United Kingdom approved a referendum to exit from the European Union (“E.U.”), commonly known as “Brexit.” As the United Kingdom and the E.U. continue negotiations to determine their new relationship, greater restrictions and regulatory burdens may be put upon trade between the United Kingdom and the E.U. This may have an adverse effect on our operations and financial performance.12
We may face limitations in availability of capital to fund our growth strategy.
We are parties to a Revolving Credit and Security Agreement (the “Credit Agreement”), a senior secured asset-based revolving credit facility collateralized by a first priority perfected security interest in substantially all of our assets. The Credit Agreement provides for initial borrowings not to exceed $100 million, with an option to increase the credit facility by an additional $50 million at our request and with the approval of the banks, but restricts us from incurring additional indebtedness outside of the Credit Agreement. The Credit Agreement is subject to various affirmative and negative covenants and contains various sub-limits, including those based on type of collateral and borrowings by geographic region. If the financial covenants become difficult to meet or if our borrowing needs increase
beyond the prescribed limits, our results of operations and liquidity may be materially adversely affected. In addition, our access to public debt markets may be limited based on our size, credit profile and not being a well-known seasoned issuer.
ITEM 1B. UNRESOLVED STAFF COMMENTS
The Corporation has no unresolved staff comments.
The location and general character of the principal locations in each segment all of whichare included in the below summary. All domestic locations are leased and foreign locations are owned, unless otherwise noted, are listed below.noted. In addition, we havethe Corporation has sales offices located in the following countries: Brazil, China, Egypt, France, Germany, Singapore, Slovenia, Sweden, Turkey and Taiwan.several foreign countries. See Note 5 (Property,4, Property, Plant and Equipment)Equipment, and Note 8 (Borrowing Arrangements) of this Annual Report on Form 10-K9, Debt, to the Consolidated Financial Statements for disclosure of properties held as collateral.
Company and Location | Principal Use | Approximate Square Footage | Type of Construction | |||
FORGED AND CAST ENGINEERED PRODUCTS SEGMENT | ||||||
Union Electric Steel Corporation | ||||||
Route 18 Burgettstown, PA | Manufacturing facilities | 296,800 on 55 acres | Metal and steel | |||
726 Bell Avenue Carnegie, PA | Manufacturing facilities and offices | 165,900 on 8.7 acres | Metal and steel | |||
U.S. Highway 30 Valparaiso, IN | Manufacturing facilities | 88,000 on 20 acres | Metal and steel | |||
1712 Greengarden Road Erie, PA | Manufacturing facilities |
| Metal and steel | |||
Union Electric Steel UK Limited | ||||||
Coulthards Lane Gateshead, England | Manufacturing facilities and offices | 274,000 on 10 acres | Steel framed, metal and brick | |||
Åkers Sweden AB | ||||||
Bruksallén 12SE-647 51 Åkers Styckebruk, Sweden | Manufacturing facilities and offices | 394,000 on 162 acres | Steel framed, metal and brick | |||
Åkers Valji Ravne d.o.o. | ||||||
Koroška c. 14 SI-2390 Ravne na Koroškem, Slovenia | Manufacturing facilities and offices | 106,000 on 2.1 acres | Brick | |||
| ||||||
|
|
|
| |||
| ||||||
|
|
|
| |||
Shanxi Åkers TISCO Roll Co., Ltd. | ||||||
|
|
|
| |||
Taiyuan, Shanxi, China | Manufacturing facilities and offices | 338,000 on 14.6 acres | Metal, steel and brick | |||
Alloys Unlimited and Processing, LLC | ||||||
3760 Oakwood Avenue Austintown, | Manufacturing facilities and offices |
| Steel framed and cement block |
13
Company and Location | Principal Use | Approximate Square Footage | Type of Construction | |||||||||
| ||||||||||||
|
|
|
| |||||||||
AIR AND LIQUID PROCESSING SEGMENT | ||||||||||||
Air & Liquid Systems Corporation | ||||||||||||
Aerofin Division 4621 Murray Place Lynchburg, VA | Manufacturing facilities and offices | 146,000 on 15.3 acres | Brick, concrete and steel | |||||||||
Buffalo Air Handling Division | ||||||||||||
Zane Snead Drive Amherst, VA | Manufacturing facilities and offices | 89,000 on 19.5 acres | Metal and steel | |||||||||
Buffalo Pumps Division | ||||||||||||
| ||||||||||||
874 Oliver Street N. Tonawanda, NY | Manufacturing facilities and offices | 94,000 on 9 acres | Metal, brick and cement block | |||||||||
* Facility is leased.
|
|
The Corporation leasesDuring 2022, Air & Liquid completed sale and leaseback financing transactions with STORE for its real property, including its manufacturing facilities, located in Lynchburg, Virginia; Amherst, Virginia and North Tonawanda, New York (collectively, the “ALP Properties”). Previously, in 2018, UES completed a sale and leaseback financing transaction with STORE for certain of its real property, including its manufacturing facilities in Valparaiso, Indiana and Burgettstown, Pennsylvania, and its manufacturing facility and corporate headquarters located in Carnegie, Pennsylvania (the “UES Properties”), and simultaneously entered into a lease agreement with STORE whereby UES would lease the properties from STORE. In connection with the sale and leaseback financing transactions in 2022, UES and STORE amended their existing lease whereby UES will lease the UES Properties and the ALP Properties with UES subleasing the ALP Properties to Air & Liquid.
UES subleases office space from Union Electric Steelto the Corporation. The Corporation further subleases a portion of its office space to Air & Liquid Systems Corporation for use as its headquarters.
All of the owned facilities are adequate and suitable for their respective purposes.
The Forged and Cast Engineered Products segment’s facilities of the FCEP segment operated within 65%85% to 75%90% of their normal capacity during 2017.2022. The facilities of the Air and Liquid ProcessingALP segment operated within 60% to 70% of their normal capacity. Normal capacity is defined as capacity under approximately normal conditions with allowances made for unavoidable interruptions, such as lost time for repairs, maintenance, breakdowns, set-up, failure, supply delays, labor shortages and absences, Sundays, holidays, vacation, and inventory taking. The number of work shifts is also taken into consideration.
14
ITEM 3. LEGAL PROCEEDINGS
LITIGATION
The Corporation and its subsidiaries aremay become involved in various claims and lawsuits incidental to their businesses and are also subject to asbestos litigation as described below.businesses. In February 2017, the Corporation, its indirect subsidiary Akers National Roll Company, as well as the Akers National Roll Company Health & Welfare Benefits Plan were named as defendants in a class action complaint filed in the United States District Court for the Western District of Pennsylvania, where the plaintiffs (currently retired former employees of Akers National Roll Company and the United Steel, Paper and Forestry, Rubber, Manufacturing, Energy, Allied Industrial, and Service Workers International Union, AFL-CIO) alleged that the defendants breached collective bargaining agreements and violated the benefit plan by modifying medical benefits of the plaintiffs and similarly situated retirees. The defendants moved to dismiss the case, and plaintiffs petitioned the court to compel arbitration. On June 13, 2017, the District Court compelled arbitration and denied the defendants’ motion to dismiss as moot. Defendants appealed this decision to the Third Circuit Court of Appeals on June 21, 2017. Defendants also filed a motion to stay arbitration pending the resolution of the appeal, and that motion was granted on September 5, 2017. The Third Circuit Court of Appeals will next consider whether the District Court erred in compelling arbitration. While no assurance can be given as to the ultimate outcome of this matter, we believe that the final resolution of this action will not have a material adverse effect on our results of operations, financial position, liquidity or capital resources.
Claims haveaddition, claims been asserted alleging personal injury from exposure to asbestos-containing components historically used in some products manufactured by predecessors of Air & Liquid Systems Corporation (“Asbestos Liability”).Liquid. Air & Liquid Systems Corporation (“Air & Liquid”), and, in some cases, the Corporation, are defendants (among a number of defendants, often in excess of 50) in cases filed in various state and federal courts. See Note 20, Litigation, to the Consolidated Financial Statements.
Asbestos ClaimsENVIRONMENTAL
The following table reflects approximate informationCorporation is currently performing certain remedial actions in connection with the sale of real estate previously owned and periodically incurs costs to maintain compliance with environmental laws and regulations. Environmental exposures are difficult to assess and estimate for numerous reasons, including lack of reliable data, the multiplicity of possible solutions, the years of remedial and monitoring activity required, and identification of new sites. The Corporation believes appropriate reserves have been established. See Note 22, Environmental Matters, to the Consolidated Financial Statements.
ITEM 4. MINE SAFETY DISCLOSURES
Not applicable.
15
– PART II –
ITEM 5. MARKET FOR REGISTRANT’S COMMON EQUITY, RELATED STOCKHOLDER MATTERS AND ISSUER PURCHASES OF EQUITY SECURITIES
The shares of common stock of Ampco-Pittsburgh Corporation are traded on the New York Stock Exchange (symbol AP). The Corporation paid cash dividends on common shares in every year since 1965 through mid-2017. In June 2017, the Corporation announced that it would suspend quarterly cash dividends, beginning with the second quarter of 2017.
The Series A warrantsare traded on the NYSE American Exchange (symbol AP WS). Each warrant entitles the holder with the right to purchase 0.4464 shares of common stock of Ampco-Pittsburgh Corporation.
The number of registered shareholders at December 31, 2022 and 2021 equaled 356 and 364, respectively.
The number of registered warrant holders equaled 21 at December 31, 2022 and 2021, respectively.
ITEM 6. RESERVED
ITEM 7. MANAGEMENT’S DISCUSSION AND ANALYSIS OF FINANCIAL CONDITION AND RESULTS OF OPERATIONS
(in thousands, except per share amounts)
THE BUSINESS
Ampco-Pittsburgh Corporation and its subsidiaries (collectively, the “Corporation”) manufacture and sell highly engineered, high-performance specialty metal products and customized equipment utilized by industry throughout the world. It operates in two business segments – the Forged and Cast Engineered Products (“FCEP”) segment and the Air and Liquid Processing (“ALP”) segment. This segment presentation is consistent with how the Corporation’s chief operating decision-maker evaluates financial performance and makes resource allocation and strategic decisions about the claims for Asbestos Liability againstbusiness.
The FCEP segment produces forged hardened steel rolls, cast rolls and forged engineered products (“FEP”). Forged hardened steel rolls are used primarily in hot and cold rolling mills by producers of steel, aluminum and other metals. Cast rolls, which are produced in a variety of iron and steel qualities, are used mainly in hot strip mills, medium/heavy section mills and plate mills. FEP principally are sold to customers in the steel distribution market, oil and gas industry and the aluminum and plastic extrusion industries. The segment has operations in the United States, England, Sweden, Slovenia, and an equity interest in three joint venture companies in China. Collectively, the segment primarily competes with European, Asian and North and South American companies in both domestic and foreign markets and operates several sales offices located throughout the world.
The ALP segment includes Aerofin, Buffalo Air Handling and Buffalo Pumps, all divisions of Air & Liquid Systems Corporation (“Air & Liquid”), a wholly owned subsidiary of the Corporation. Aerofin produces custom-engineered finned tube heat exchange coils and related heat transfer products for a variety of industries including OEM/commercial, nuclear power generation and industrial manufacturing. Buffalo Air Handling produces large custom-designed air handling systems for institutional (e.g., hospital, university), pharmaceutical and general industrial building markets. Buffalo Pumps manufactures centrifugal pumps for the fossil-fueled power generation, marine defense and industrial refrigeration industries. The segment has operations in Virginia and New York with headquarters in Carnegie, Pennsylvania. The segment utilizes a common independent group of sales offices located throughout the United States and Canada.
EXECUTIVE OVERVIEW
While the Corporation operated at normal levels in 2022, it continues to be challenged by lingering global economic effects of a post-pandemic environment and repercussions from the Russia-Ukraine conflict, including:
The Corporation is actively monitoring, and will continue to actively monitor, the geopolitical and economic consequence of these events and the potential impact on its operations, financial condition, liquidity, suppliers, industry, and workforce.
16
For the FCEP segment, the forged roll market in North America has stabilized while the cast roll market has softened due to economic uncertainty in the European markets, primarily linked to the Russia-Ukraine conflict and resulting European energy crisis. The FEP market was strong in the first part of the year, as distributors began inventory re-stocking programs and as the oil and gas market demands increased on rising oil prices, but stabilized in the latter part of the year. The FCEP segment experienced higher costs for direct and indirect materials, energy and transportation in 2022. Although the segment continues to be adversely impacted by escalating costs, particularly for raw and ancillary materials, energy and transportation, price increases and changes to surcharge policies announced in the fourth quarter of 2021 are absorbing a significant portion of these costs. In addition, in February 2023, UES announced a price increase on all new quotations and new orders for forged and cast roll products. Approximately 80% of customer orders include a commodity surcharge. The primary focus for this segment is to maintain a strong position in the roll market; continue diversification and development of FEP for use in other industries; improve operational efficiency at its facilities; and complete its capital equipment investment to upgrade existing equipment with a goal of reducing operating costs, improving reliability and increasing FEP capacity and capabilities.
The ALP businesses are benefiting from steady demand, but are facing increasing production and transportation costs and supply chain issues. The segment has been implementing price increases for certain of its products to help mitigate these inflationary effects. The focus for this segment is to grow revenues, strengthen engineering and manufacturing capabilities, and continue to improve its sales distribution network.
CONSOLIDATED RESULTS OF OPERATIONS OVERVIEW
Change in Accounting Principle
During the fourth quarter of 2022, the Corporation changed its method of accounting for valuing domestic inventories from the last-in, first-out (“LIFO”) basis to the first-in, first-out (“FIFO”) basis. Foreign inventories have historically been maintained on the FIFO basis. The Corporation believes changing to the FIFO method of inventory valuation is preferable as it provides a better matching of costs with the physical flow of goods, standardizes the Corporation’s inventory valuation methodology, and improves comparability with industry peers. The Corporation has retrospectively applied this change to its prior year consolidated financial statements, footnotes and other financial information. (See Note 2, Change in Method of Accounting for Inventory Valuation, to the Consolidated Financial Statements for further information.)
The Corporation
|
|
|
|
|
| 2022 |
|
| 2021 - as adjusted (1) |
| ||||||||||
Net Sales: |
|
|
|
|
|
|
|
|
|
|
|
|
|
|
|
| ||||
Forged and Cast Engineered Products |
|
|
|
|
| $ | 299,484 |
|
|
| 77 | % |
| $ | 260,204 |
|
|
| 75 | % |
Air and Liquid Processing |
|
|
|
|
|
| 90,705 |
|
|
| 23 | % |
|
| 84,716 |
|
|
| 25 | % |
Consolidated |
|
|
|
|
| $ | 390,189 |
|
|
| 100 | % |
| $ | 344,920 |
|
|
| 100 | % |
Income (Loss) from Operations: (1) |
|
|
|
|
|
|
|
|
|
|
|
|
|
|
|
| ||||
Forged and Cast Engineered Products |
|
|
|
|
| $ | 444 |
|
|
|
|
| $ | 5,073 |
|
|
|
| ||
Air and Liquid Processing (2) |
|
|
|
|
|
| 13,686 |
|
|
|
|
|
| 2,601 |
|
|
|
| ||
Corporate costs |
|
|
|
|
|
| (11,352 | ) |
|
|
|
|
| (12,456 | ) |
|
|
| ||
Consolidated |
|
|
|
|
| $ | 2,778 |
|
|
|
|
| $ | (4,782 | ) |
|
|
| ||
Backlog: |
|
|
|
|
|
|
|
|
|
|
|
|
|
|
|
| ||||
Forged and Cast Engineered Products |
|
|
|
|
| $ | 252,165 |
|
|
| 68 | % |
| $ | 223,321 |
|
|
| 76 | % |
Air and Liquid Processing |
|
|
|
|
|
| 116,853 |
|
|
| 32 | % |
|
| 69,233 |
|
|
| 24 | % |
Consolidated |
|
|
|
|
| $ | 369,018 |
|
|
| 100 | % |
| $ | 292,554 |
|
|
| 100 | % |
(dollars in thousands) |
| 2017 |
|
| 2016 |
| ||
Total claims pending at the beginning of the period |
|
| 6,618 |
|
|
| 6,212 |
|
New claims served |
|
| 1,365 |
|
|
| 1,452 |
|
Claims dismissed |
|
| (718 | ) |
|
| (782 | ) |
Claims settled |
|
| (358 | ) |
|
| (264 | ) |
Total claims pending at the end of the period (1) |
|
| 6,907 |
|
|
| 6,618 |
|
Gross settlement and defense costs (in 000’s) |
| $ | 21,431 |
|
| $ | 17,960 |
|
Average gross settlement and defense costs per claim resolved (in 000’s) |
| $ | 19.92 |
|
| $ | 17.17 |
|
|
|
A substantial majority of the settlementincrease is attributable to the FCEP segment which benefited from improved pricing, including a higher variable-index surcharge, and increasing demand. A discussion of sales by segment is included below.
Operating income (loss) equaled $2,778 and $(4,782) for 2022 and 2021, respectively, an improvement of $7,560. Included in income from operations for 2022, is a:
17
By comparison, included in loss from operations for 2021 is a:
A discussion of income (loss) from operations for the Corporation’s two segments is included below. Corporate costs decreased in 2022, when compared to 2021, by $1,104 due to lower employee-related costs including lower incentive compensation and a portion of the benefit from the Change in Employee Benefit Policy being attributable to Corporate employees, offset by higher professional fees.
Backlog equaled $369,018 at December 31, 2022, versus $292,554 as of December 31, 2021. Backlog represents the accumulation of firm orders on hand which: (i) are supported by evidence of a contractual arrangement, (ii) include a fixed and determinable sales price, (iii) have collectability that is reasonably assured, and (iv) generally are expected to ship within two years from the backlog reporting date. Backlog at a certain date may not be a direct measure of future revenue for a particular order because price increases, negotiated subsequently to the original order, are not included in backlog until the updated contract is received from the customer and certain surcharges are not determinable until the order is completed and ready for shipment to the customer. Approximately 6% of the backlog is expected to be released after 2023. A discussion of backlog by segment is included below.
Gross margin, excluding depreciation and amortization, as a percentage of net sales was 15.9% and 19.2% for 2022 and 2021, respectively. The decrease from the prior year is primarily attributable to the FCEP segment which experienced higher costs, particularly for direct and indirect materials, energy and transportation, when compared to the prior year. Although a portion of these costs are recovered via the variable-index surcharge, the variable-index surcharge does not cover all elements of all costs. In addition, in 2022, gross margin, excluding depreciation and amortization, includes a benefit from the Change in Employee Benefit Policy of $331 and, for the FCEP segment, expense associated with the Refund of Excess COVID-19 Subsidies. For the ALP segment, gross margin, excluding depreciation and amortization, as a percentage of net sales improved slightly as a result of a higher volume of sales, changes in product mix and savings generated from process improvements offset, in part, by higher costs.
Selling and administrative expenses were comparable, totaling $43,527 (11.2% of net sales) and $45,998 (13.3% of net sales) for 2022 and 2021, respectively. The decrease of $2,471 is principally due to:
In addition, the prior year included the Reorganization-Related Costs of $1,600.
Depreciation and amortization expense was comparable, equaling $17,408 and $17,877 for 2022 and 2021, respectively.
(Credit) charge for asbestos-related costs equaled $(2,226) and $6,661 in 2022 and 2021, respectively. The credit in 2022 represents a change in the estimated defense-to-indemnity cost ratio from 70% to 65% based on ongoing experience and improvements in defense costs which are expected to continue. The charge in 2021 represents changes in the estimated costs of pending and future asbestos claims, net of additional insurance recoveries through the estimated final date by which the Corporation expects to have settled all asbestos-related claims. See Note 20, Litigation, to the Consolidated Financial Statements.
Investment-related income equaled $519 and $1,084 for 2022 and 2021, respectively, and represents primarily dividends received from one of the Corporation’s Chinese joint ventures.
18
Interest expense equaled $5,434 and $3,599 for 2022 and 2021, respectively. The increase of $1,835 is principally due to:
Other income – net is comprised of the following:
|
| 2022 |
|
| 2021 |
|
| Change |
| |||
Net pension and other postretirement income |
| $ | 6,552 |
|
| $ | 6,694 |
|
| $ | (142 | ) |
Unrealized (loss) gain on Rabbi trust investments |
|
| (1,144 | ) |
|
| 661 |
|
|
| (1,805 | ) |
Gain (loss) on foreign exchange transactions |
|
| 2,293 |
|
|
| (1,134 | ) |
|
| 3,427 |
|
Other |
|
| (8 | ) |
|
| 81 |
|
|
| (89 | ) |
|
| $ | 7,693 |
|
| $ | 6,302 |
|
| $ | 1,391 |
|
Other income – net fluctuated primarily due to changes in foreign exchange gains and losses and, as a result of volatility in the financial markets during 2022, unrealized losses in the market value of the Rabbi trust investments.
Income tax provision equaled $(1,576) and $(2,305) for 2022 and 2021, respectively, and includes income taxes associated with the Corporation’s profitable operations. An income tax benefit is not able to be recognized on losses of certain of the Corporation’s entities since it is “more likely than not” the asset will not be realized. Accordingly, changes in the income tax provision for each period includes the effects of changes in the pre-tax income of the Corporation’s profitable operations. In addition, the income tax provision for 2022 includes $165 of expense resulting from the revaluation of the deferred income tax assets of the ALP segment following new legislation enacted in 2022, which will decrease the Pennsylvania state income tax rate from 9.99% to 4.99% in 2031. By comparison, the income tax provision for 2021 includes $452 of expense associated with the (i) restructuring of a foreign sales office and (ii) revaluation of the deferred income tax liabilities of the Corporation’s U.K. entity following new legislation enacted in 2021, which will increase the U.K. corporate tax rate from 19% to 25% in 2023.
Net income (loss) attributable to Ampco-Pittsburgh was approximately $3,416 or $0.18 per common share for 2022 and $(3,861) or $(0.20) per common share for 2021.
Net income attributable to Ampco-Pittsburgh and income per common share attributable to Ampco-Pittsburgh for 2022, include a net benefit of $2,727 or $0.14 per common share associated with the net benefit from the Asbestos-Related Credit, the Change in Employee Benefit Policy, the Refund of Excess COVID-19 Subsidies and the additional tax of $165 resulting from the revaluation of the deferred income tax assets of the ALP segment following new legislation enacted in 2022, which will reduce the Pennsylvania state income tax rate from 9.99% to 4.99% in 2031.
Net (loss) attributable to Ampco-Pittsburgh and (loss) per common share attributable to Ampco-Pittsburgh for 2021, include net expense of $8,444 or $0.45 per common share for the Asbestos-Related Charge, the Reorganization-Related Costs and additional income tax expense of $452 associated with the (i) restructuring of a foreign sales office and (ii) resulting from the revaluation of the deferred income taxes of the Corporation’s U.K. entity following new legislation enacted in 2021, which will increase the U.K. corporate tax rate from 19% to 25% in 2023.
Non-GAAP Financial Measures
The Corporation presents non-GAAP adjusted (loss) income from operations, which is calculated as income (loss) from operations excluding the Asbestos-Related (Credit) Charge, the Change in Employee Benefit Policy, the Refund of Excess COVID-19 Subsidies, and the Reorganization-Related Costs for each of the years, as applicable. This non-GAAP financial measure is not based on any standardized methodology prescribed by accounting principles generally accepted in the United States of America (“GAAP”) and may not be comparable to similarly-titled measures presented by other companies.
The Corporation has presented non-GAAP adjusted (loss) income from operations because it is a key measure used by the Corporation’s management and Board of Directors to understand and evaluate the Corporation’s operating performance and to develop operational goals for managing its business. This non-GAAP financial measure excludes significant charges or credits that are one-time charges or credits, or unrelated to the Corporation’s ongoing results of operations, or beyond its control. Additionally, a portion of the incentive and compensation arrangements for certain employees is based on the Corporation’s business performance. The Corporation believes this non-GAAP financial measure helps identify underlying trends in its business that otherwise could be masked by the effect of the items that it excludes from adjusted (loss) income from operations. In particular, the Corporation believes that the exclusion of the Asbestos-Related (Credit) Charge, the Change in Employee Benefit Policy, the Refund of Excess COVID-19 Subsidies, and the Reorganization-Related Costs can provide a useful measure for period-to-period comparisons of the Corporation’s
19
core business performance. The Corporation also believes this non-GAAP financial measure provides useful information to management, shareholders and investors, and others in understanding and evaluating its operating results, enhancing the overall understanding of its past performance and future prospects and allowing for greater transparency with respect to key financial metrics used by the Corporation’s management in its financial and operational decision-making.
Adjusted (loss) income from operations is not prepared in accordance with GAAP and should not be considered in isolation of, or as an alternative to, measures prepared in accordance with GAAP. There are limitations related to the use of adjusted (loss) income from operations rather than income (loss) from operations, which is the nearest GAAP equivalent. Among other things, there can be no assurance that additional benefits similar to the Asbestos-Related (Credit) and the Change in Employee Benefit Policy or additional expenses similar to the Asbestos-Related Charge, the Refund of Excess COVID-19 Subsidies, and the Reorganization-Related Costs will not occur in future periods.
The adjustments reflected in adjusted (loss) income from operations are pre-tax. The tax impact associated with these adjustments would be additional income tax expense of $101 for 2022 and an income tax benefit of $132 for 2021.
The following is a reconciliation of income (loss) from operations to non-GAAP adjusted (loss) income from operations for 2022 and 2021, respectively:
|
| 2022 |
|
| 2021 - as adjusted(1) |
| ||
Income (loss) from operations, as reported (GAAP) |
| $ | 2,778 |
|
| $ | (4,782 | ) |
Asbestos-Related (Credit) Charge (2) |
|
| (2,226 | ) |
|
| 6,661 |
|
Change in Employee Benefit Policy (3) |
|
| (1,431 | ) |
|
| — |
|
Refund of Excess COVID-19 Subsidies (4) |
|
| 664 |
|
|
| — |
|
Reorganization-Related Costs (5) |
|
| — |
|
|
| 1,600 |
|
(Loss) income from operations, as adjusted (Non-GAAP) |
| $ | (215 | ) |
| $ | 3,479 |
|
Forged and Cast Engineered Products
|
| 2022 |
|
| 2021 |
|
| Change |
| |||
Net sales: |
|
|
|
|
|
|
|
|
| |||
Forged and cast mill rolls |
| $ | 256,559 |
|
| $ | 234,926 |
|
| $ | 21,633 |
|
FEP |
|
| 42,925 |
|
|
| 25,278 |
|
|
| 17,647 |
|
|
| $ | 299,484 |
|
| $ | 260,204 |
|
| $ | 39,280 |
|
|
|
|
|
|
|
|
|
|
| |||
Operating income (1) |
| $ | 444 |
|
| $ | 5,073 |
|
| $ | (4,629 | ) |
|
|
|
|
|
|
|
|
|
| |||
Backlog: |
|
|
|
|
|
|
|
|
| |||
Forged and cast mill rolls |
| $ | 243,648 |
|
| $ | 197,476 |
|
| $ | 46,172 |
|
FEP |
|
| 8,517 |
|
|
| 25,845 |
|
|
| (17,328 | ) |
|
| $ | 252,165 |
|
| $ | 223,321 |
|
| $ | 28,844 |
|
Net sales increased by $39,280 in 2022 from 2021 principally due to the net of:
20
Operating results decreased by $4,629 in 2022 when compared to 2021 primarily as a result of:
Backlog equaled $252,165 at December 31, 2022, compared to $223,321 at December 31, 2021, with the improvement in current year-end backlog of $28,844 principally due to:
At December 31, 2022, approximately 3% of the backlog is expected to ship after 2023.
Air and Liquid Processing
|
| 2022 |
|
| 2021 |
|
| Change |
| |||
Net sales |
|
|
|
|
|
|
|
|
| |||
Heat exchange coils |
| $ | 31,395 |
|
| $ | 24,372 |
|
| $ | 7,023 |
|
Air handling systems |
|
| 29,436 |
|
|
| 26,477 |
|
|
| 2,959 |
|
Centrifugal pumps |
|
| 29,874 |
|
|
| 33,867 |
|
|
| (3,993 | ) |
|
| $ | 90,705 |
|
| $ | 84,716 |
|
| $ | 5,989 |
|
|
|
|
|
|
|
|
|
|
| |||
Operating income (1), (2) |
| $ | 13,686 |
|
| $ | 2,601 |
|
| $ | 11,085 |
|
|
|
|
|
|
|
|
|
|
| |||
Backlog |
| $ | 116,853 |
|
| $ | 69,233 |
|
| $ | 47,620 |
|
Net sales for 2022 increased from the prior year by $5,989. Sales of heat exchange coils and air handling units increased when compared to the prior year as a result of the expansion and strengthening of the segment's sales distribution network. Sales of air handling units improved further due to additional demand, particularly in the hospital/healthcare market. Sales of centrifugal pumps declined when compared to the prior year as a result of project delays associated with ongoing supply chain issues at U.S. Navy shipbuilders.
21
Operating income improved by $11,085 in 2022 when compared to 2021 primarily as a result of:
Backlog at December 31, 2022 increased $47,620 from December 31, 2021, with backlog for each product line improving as a result of record-level order intake. At December 31, 2022, approximately 12% of the backlog is expected to ship after 2023.
LIQUIDITY AND CAPITAL RESOURCES
|
| 2022 |
|
| 2021 |
|
| Change |
| |||
Net cash flows used in operating activities |
| $ | (27,208 | ) |
| $ | (15,866 | ) |
| $ | (11,342 | ) |
Net cash flows used in investing activities |
|
| (16,308 | ) |
|
| (14,734 | ) |
|
| (1,574 | ) |
Net cash flows provided by financing activities |
|
| 42,587 |
|
|
| 24,402 |
|
|
| 18,185 |
|
Effect of exchange rate changes on cash and cash equivalents |
|
| (673 | ) |
|
| (307 | ) |
|
| (366 | ) |
Net decrease in cash and cash equivalents |
|
| (1,602 | ) |
|
| (6,505 | ) |
|
| 4,903 |
|
Cash and cash equivalents at beginning of period |
|
| 10,337 |
|
|
| 16,842 |
|
|
| (6,505 | ) |
Cash and cash equivalents at end of period |
| $ | 8,735 |
|
| $ | 10,337 |
|
| $ | (1,602 | ) |
Net cash flows used in operating activities equaled $27,208 and $15,866 for 2022 and 2021, respectively. The change between the years is primarily attributable to the ongoing investment in trade working capital due to a higher level of business activity resulting from increased demand and, for inventories, higher costs associated with inflation and supply chain disruptions. Although the Corporation recorded the Asbestos-Related (Credit) Charge in 2022 and 2021, these were non-cash (credits) charges and, accordingly, did not impact net cash flows used in operating activities. Instead, net asbestos-related payments equaled $9,126 and $9,903 in 2022 and 2021, respectively, and are expected to approximate $8,000 in 2023.
Contributions to the defined benefit pension and other postretirement benefits plans equaled $2,199 and $1,658 in 2022 and 2021, respectively, and are expected to approximate $2,484 in 2023. Contributions beyond 2023 are expected to increase primarily as a result of lower than expected pension asset performance in 2022.
Net cash flows used in investing activities primarily represented expenditures for the FCEP segment. The Corporation has undertaken a significant capital program approximating $27,000 to upgrade existing equipment at certain of its FCEP locations, which is anticipated to be substantially completed by December 31, 2023. At December 31, 2022, commitments for future capital expenditures, including those associated with the FCEP capital program, approximated $16,400.
Net cash flows provided by financing activities increased by $18,185 in 2022 when compared to 2021 primarily due to:
The effect of exchange rate changes on cash and cash equivalents is primarily attributable to the fluctuation of the British pound and Swedish krona against the U.S. dollar.
As a result of the above, table was reportedcash and paidcash equivalents decreased by insurers. Because claims$1,602 during 2022 and ended the period at $8,735 in comparison to $10,337 at December 31, 2021. The majority of the Corporation’s cash and cash equivalents is held by its foreign operations. Domestic customer remittances are often filedused to pay down borrowings under the Corporation’s revolving credit facility daily, resulting in minimal cash maintained by the Corporation’s domestic operations. Cash held by the Corporation’s foreign operations is considered to be permanently re-invested; accordingly, a provision for estimated local and canwithholding tax has not been made. If the Corporation were to remit any foreign earnings to it or any of its U.S. entities, the estimated tax impact would be settled or dismissed in large groups,insignificant.
22
Funds on hand, funds generated from future operations and availability under the amountCorporation’s revolving credit facility are expected to be sufficient to finance the Corporation’s operational requirements and timing of settlements, as well asdebt service costs. The maturity date for the number of open claims, can fluctuate significantly from period to period.
Asbestos Insurance
The Corporationrevolving credit facility is June 29, 2026 and, Air & Liquid are parties to a series of settlement agreements (“Settlement Agreements”) with insurers that have coverage obligations for Asbestos Liability (the “Settling Insurers”). Under the Settlement Agreements, the Settling Insurers accept financial responsibility, subject to the other terms and conditions of the respectiverevolving credit agreement, will become due on that date. As of December 31, 2022, remaining availability under the revolving credit facility approximated $28,420, net of standard availability reserves.
Availability under the Corporation’s equipment financing facility and disbursement agreement is expected to be sufficient to finance the capital program for the FCEP segment in the time frame currently anticipated. At December 31, 2022, availability under the equipment financing facility and disbursement agreements including overall coverage limits,approximated $16,112. Each borrowing on the equipment financing facility will constitute a secured loan transaction (each, a “Term Loan”). Each Term Loan will convert to a Term Note on the earlier of (i) the date in which the associated equipment is placed in service or (ii) December 29, 2023. Each Term Note will have a term of 84 months in arrears fully amortizing and will commence on the date of the Term Note. Borrowings under the disbursement agreement will be repaid over an initial term of 20 years – through August 2042. For a more thorough description of the Corporation's debt and credit documents see Note 9, Debt, to the Consolidated Financial Statements.
With respect to litigation, see Note 20, Litigation, to the Consolidated Financial Statements. With respect to environmental matters, see Note 22, Environmental Matters, to the Consolidated Financial Statements.
OFF-BALANCE SHEET ARRANGEMENTS
The Corporation’s off-balance sheet arrangements include the previously mentioned expected future capital expenditures and letters of credit unrelated to the Industrial Revenue Bonds. See Note 12, Commitments and Contingent Liabilities, to the Consolidated Financial Statements. These arrangements are not considered significant to the liquidity, capital resources, market risk, or credit risk of the Corporation.
EFFECTS OF INFLATION
Inflationary and market pressures on costs are likely to continue to be experienced. Product pricing is reflective of current costs. For the FCEP segment, approximately 80% of customer orders include a commodity surcharge; the ability to pass on future increases in the price of commodities for pendingthe balance of the customer orders will be negotiated on a contract-by-contract basis. To minimize the effect of future increases, the Corporation has entered into pricing for a portion of the electricity and natural gas for certain of its FCEP operating entities and has long-term labor agreements at each of the key locations. Certain of these agreements will expire in 2023. As is consistent with past practice, the Corporation will negotiate with the intent to secure mutually beneficial arrangements covering multiple years. See Note 12, Commitments and Contingent Liabilities, and Note 15, Derivative Instruments, to the Consolidated Financial Statements.
APPLICATION OF CRITICAL ACCOUNTING ESTIMATES
The Corporation has identified critical accounting estimates that are important to the presentation of its financial condition, changes in financial condition and results of operations and involve the most complex or subjective assessments. Critical accounting estimates relate to assessing recoverability of property, plant and equipment and accounting for pension and other postretirement benefits, litigation and loss contingencies, and income taxes.
Property, plant and equipment is reviewed for recoverability whenever events or circumstances indicate the carrying amount of the long-lived assets may not be recoverable. If the undiscounted cash flows generated from the use and eventual disposition of the assets are less than their carrying value, then the asset value may not be fully recoverable, resulting in a write-down of the asset value. Estimates of future claimscash flows are based on expected market conditions over the remaining useful life of the primary asset(s). Accordingly, assumptions are made about pricing, volume and asset-resale values. The potential significant change brought about by the Russia-Ukraine conflict resulting in the European energy crisis was deemed to be a triggering event under ASC 360, Property, Plant and Equipment, causing the Corporation to evaluate whether the property, plant and equipment of an asset group within the FCEP segment was deemed to be impaired. Accordingly, in connection with preparation of its 2023 business plan in the fourth quarter of 2022, the Corporation completed a quantitative analysis of the long-lived assets for Asbestos Liability.the asset group and determined the assets were not impaired. The Settlement Agreements encompassCorporation continues to evaluate the substantialuncertainty associated with the Russia-Ukraine conflict and, at December 31, 2022, there were no additional triggering events identified. Additionally, there have been no triggering events for the asset groups within the ALP segment. The Corporation believes the amounts recorded in the accompanying consolidated financial statements for property, plant and equipment are recoverable and are not impaired as of December 31, 2022.
23
Accounting for pension and other postretirement benefits involves estimating the cost of benefits to be provided well into the future and attributing that cost over the time period each employee works. To accomplish this, input from the Corporation’s actuaries is evaluated and extensive use is made of assumptions about inflation, long-term rate of return on plan assets, longevity, employee turnover and discount rates. The curtailment of the majority of insurance policies that provide coverage for claims for Asbestos Liability.the Corporation’s defined benefit pension plans and the amendment of various other postretirement benefit plans has helped to mitigate the volatility in net periodic pension and other postretirement benefit costs resulting from changes in these assumptions.
The Settlement Agreements include acknowledgements that Howden North America, Inc. (“Howden”)expected long-term rate of return on plan assets is entitled to coverage under policies covering Asbestos Liability for claims arising outan estimate of the historical products manufacturedaverage rates of earnings expected to be earned on funds invested, or distributedto be invested, to provide for the benefits included in the projected benefit obligation. Since these benefits will be paid over many years, the expected long-term rate of return is reflective of current investment returns and investment returns over a longer period. Consideration is also given to target and actual asset allocations, inflation and real risk-free return. The Corporation believes the expected long-term rate of return of 6.94% for its domestic plans and 3.00% for its foreign plans to be reasonable. Although, as a result of volatility in the financial markets during the year, actual returns on plan assets approximated -20.81% for the domestic plans and -38.93% for the foreign plans for 2022; however, approximated 8.70% for the domestic plans and 10.76% for the foreign plans for 2021 and averaged 9.30% for the domestic plans and 8.76% for the foreign plans for 2017 - 2021. A percentage point decrease in the expected long-term rate of return would increase annual pension expense by Buffalo Forge,approximately $2,600. Conversely, a former subsidiarypercentage point increase in the expected long-term rate of return would decrease annual pension expense by approximately $2,600.
The discount rates used in determining future pension obligations and other postretirement benefits for each of the plans are based on rates of return for high-quality fixed-income investments currently available and expected to be available during the period to maturity of the pension and other postretirement benefits. High-quality fixed-income investments are defined as those investments which have received one of the two highest ratings given by a recognized rating agency with maturities of 10+ years. With the increase in interest rates during 2022 and the resulting impact on bond yields, the discount rate rose significantly at December 31, 2022 when compared to December 31, 2021. Assumed discount rates range between 5.48% and 5.49% for the Corporation's domestic plans, 5.49% for its other postretirement benefits plans, and 4.85% for its foreign plans at December 31, 2022. A 1/4 percentage point increase in the discount rate would decrease projected and accumulated benefit obligations by approximately $5,800. Conversely, a 1/4 percentage point decrease in the discount rate would increase projected and accumulated benefit obligations by approximately $5,800.
The Corporation (the “Products”). The Settlement Agreements do not provide for any prioritizationbelieves that the amounts recorded in the accompanying consolidated financial statements related to pension and other postretirement benefits are based on access toassumptions that are appropriate at December 31, 2022, although actual outcomes could differ.
Litigation and loss contingency accruals are made when it is determined that it is probable that a liability has been incurred and the applicable policies or any sublimits of liability as to Howden oramount can be reasonably estimated. Specifically, the Corporation and certain of its subsidiaries are involved in various claims and lawsuits incidental to its businesses. In addition, claims have been asserted alleging personal injury from exposure to asbestos-containing components historically used in some products manufactured by predecessors of Air & Liquid and, accordingly, Howden may access the coverage afforded by the Settling Insurers for any covered claim arising out of a Product. In general, access by Howden to the coverage afforded by the Settling Insurers for the Products will erode coverage under the Settlement Agreements available to the Corporation and Air & Liquid for Asbestos Liability.
Asbestos Valuations
In 2006, the Corporation retained Hamilton, Rabinovitz & Associates, Inc. (“HR&A”(the “Asbestos Liability”), a nationally recognized expert in the valuation of asbestos liabilities, to. To assist the Corporation in estimatingdetermining whether an estimate could be made of the potential liability for pending and unasserted future claims for the Asbestos Liability. Based on this analysis,Liability along with applicable insurance coverage, and the amounts of any estimates, the Corporation recorded a reserve for Asbestos Liability claims pending or projected to be asserted through 2013 as of December 31, 2006. HR&A’s analysis has been periodically updated since that time. Most recently, the HR&A analysis was updated in 2016, and additional reserves were established by the Corporation as of December 31, 2016, for Asbestos Liability claims pending or projected to be asserted through 2026. The methodology used by HR&A in its projection in 2016 of the operating subsidiaries’ liability for pending and unasserted potential future claims for Asbestos Liability, which is substantially the same as the methodology employed by HR&A in prior estimates, relied upon and included the following factors:
HR&A’s interpretation of a widely accepted forecast of the population likely to have been exposed to asbestos;
epidemiological studies estimating the number of people likely to develop asbestos-related diseases;
an analysis of pending cases, by type of injury claimed and jurisdiction where the claim is filed;
an analysis of claims resolution history from January 1, 2014, to September 9, 2016, to determine the average settlement value of claims, by type of injury claimed and jurisdiction of filing; and
an adjustment for inflation in the future average settlement value of claims, at an annual inflation rate based on the Congressional Budget Office’s ten year forecast of inflation.
Using this information, HR&A estimated in 2016 the number of future claims for Asbestos Liability that would be filed through the year 2026, as well as the settlement or indemnity costs that would be incurred to resolve both pending and future unasserted claims through 2026. This methodology has been accepted by numerous courts.
In conjunction with developing the aggregate liability estimate referenced above, the Corporation also developed an estimate of probable insurance recoveries for its Asbestos Liabilities. In developing the estimate, the Corporation considered HR&A’s projection for settlement or indemnity costs for Asbestos Liability and management’s projection of associated defense costs (based on the current defense to indemnity cost ratio), as well as a number of additional factors. These additional factors included the Settlement Agreements then in effect, policy exclusions, policy limits, policy provisions regarding coverage for defense costs, attachment points, prior impairment of policies and gaps in the coverage, policy exhaustions, insolvencies among certain of the insurance carriers, and the nature of the underlying claims for Asbestos Liability asserted against the subsidiaries and the Corporation as reflected in the Corporation’s asbestos claims database, as well as estimated erosion of insurance limits on account of claims against Howden arising out of the Products. In addition to consulting with the Corporation’s outside legal counsel on these insurance matters, the Corporation consulted withhires a nationally recognized asbestos-liability expert and an insurance consulting firm it retained to assistconsultant. Based on their analyses, reserves for probable and reasonably estimable costs for the Corporation with certain policy allocation matters that also are among the several factors considered by the Corporation when analyzing potential recoveries from relevant historical insurance for Asbestos Liabilities. Based upon all of the factors considered by the Corporation, and taking into account the Corporation’s analysis of publicly available information regarding the credit-worthiness of various insurers, the Corporation estimated the probable insurance recoveries for Asbestos Liability, and defense costs through 2026. Although the Corporation believes that the assumptions employed in the insurance valuation were reasonable and previously consulted with its outside legal counsel and insurance consultant regarding those assumptions, there are other assumptions that could have been employed that would have resulted in materially lower insurance recovery projections.
Based on the analyses described above, the Corporation’s reserve at December 31, 2016, for the total costs, including defense costs, for Asbestos Liability claims pending or projected to be asserted through 2026, was $171 million of which approximately 70% was attributable to settlement costs for unasserted claims projected to be filed through 2026 and future defense costs. The reserve at December 31, 2017, was $150 million. While it is reasonably possible that the Corporation will incur additional chargesreceivables for Asbestos Liability and defense costs in excess of the amounts currently reserved, the Corporation believes that there is too much uncertainty to provide for reasonable estimation of the number of future claims, the nature of such claims and the cost to resolve them beyond 2026. Accordingly, no reserve has been recorded for any costs that may be incurred after 2026.
The Corporation’s receivable at December 31, 2016, for insurance recoveries attributable to the claims for which the Corporation’s Asbestos Liability reserve has been established, including the portion of incurred defense costs covered by the Settlement Agreements in effect through December 31, 2016, and the probable payments and reimbursements relating to the estimated indemnity and defense costs for pending and unasserted future Asbestos Liability claims, was $116 million ($100 million at December 31, 2017).
The following table summarizes activity relating to insurance recoveries for each of the years ended December 31, 2017, and 2016.
(dollars in thousands) |
| 2017 |
|
| 2016 |
| ||
Insurance receivable – asbestos, beginning of the year |
| $ | 115,945 |
|
| $ | 125,423 |
|
Settlement and defense costs paid by insurance carriers (1) |
|
| (15,603 | ) |
|
| (23,138 | ) |
Changes in estimated coverage |
|
| 0 |
|
|
| 13,660 |
|
Insurance receivable – asbestos, end of the year |
| $ | 100,342 |
|
| $ | 115,945 |
|
|
|
The insurance receivable recorded by the Corporation does not assume any recovery from insolvent carriers and a substantial majority of the insurance recoveries that are deemed probable is from insurance companies rated A – (excellent) or better by A.M. Best Corporation. There can be no assurance, however, that there will not be further insolvencies among the relevant insurance carriers, or that the assumed percentage recoveries for certain carriers will prove correct. The difference between insurance recoveries and projected costs is not due to exhaustion of all insurance coverage for Asbestos Liability. The Corporation and the subsidiaries have substantial additional insurance coverage which the Corporation expects to be available for Asbestos Liability claims and defense costs that the subsidiaries and it may incur after 2026. However, this insurance coverage also can be expected to have gaps creating significant shortfalls of insurance recoveries against claims expense, which could be material in future years.
Theare established. These amounts recorded by the Corporation for Asbestos Liabilities and insurance receivables rely on assumptions thatwhich are based on currently known facts and strategy.
The Corporation’s actual expenses orpolicy is to evaluate the Asbestos Liability and related insurance recoveries could be significantly higher or lower than those recorded ifreceivables as well as the underlying assumptions used in the Corporation’s or HR&A’s calculations vary significantly from actual results.on a regular basis. Key variables in these assumptions, including the ability to reasonably estimate the Asbestos Liability through the expected final date by which the Corporation expects to have settled all asbestos-related claims, are identified above andsummarized in Note 20, Litigation, to the Consolidated Financial Statements. Key assumptions include the number and typenature of new claims to be filed each year, the average cost of disposing of each such new claim, average annual defense costs, compliance by relevant parties with the terms of the Settlement Agreements, the resolution of remaining coverage issues with insurance carriers, and the solvency risk with respect to the relevant insurance carriers. Other factors that may affect the Corporation’s Asbestos Liability and the Corporation’s ability to recover under its insurance policies include uncertainties surrounding the litigation process from jurisdiction to jurisdiction and from case to case, reforms that may be made by state and federal courts and the passage of state or federal tort reform legislation. Actual expenses or insurance recoveries could be significantly higher or lower than those recorded if assumptions used in the calculations vary significantly from actual results.
The Corporation intends to continue to evaluate its estimatedthe Asbestos Liability and related insurance receivables as well as the underlying assumptions on a regular basis to determine whether anyfurther adjustments to the estimates are required. Due to the uncertainties surrounding asbestos litigation and insurance, these regular reviews may result in the Corporation incurringincurrence of future charges;charges or credits; however, the Corporation is currently unable to estimate such future charges.changes. Adjustments, if any, to the Corporation’s estimate of its recordedthe Asbestos Liability and/or insurance receivables could be material to its operating results for the periods in which the adjustments to the liability or receivable are recorded, and to the Corporation’sits liquidity and consolidated financial position.position when such liabilities are paid.
ENVIRONMENTAL24
The CorporationAccounting for income taxes includes the Corporation's evaluation of the underlying accounts, permanent and temporary differences, its tax filing positions and interpretations of existing tax law. A valuation allowance is currently performing certain remedial actions in connection withrecorded against deferred income tax assets to reduce them to the sale of real estate previously owned and periodically incurs costsamount that is “more likely than not” to maintain compliance with environmental laws and regulations. Appropriate reserves have been established.
ITEM 4. MINE SAFETY DISCLOSURES
Not applicable.
ITEM 5. MARKET FOR REGISTRANT’S COMMON EQUITY, RELATED STOCKHOLDER MATTERS AND ISSUER PURCHASES OF EQUITY SECURITIES
The shares of common stock of Ampco-Pittsburgh Corporationbe realized. In doing so, assumptions are traded onmade about the New York Stock Exchange (symbol AP). The Corporation paid cash dividends on common shares in every year since 1965. In June 2017, the Corporation announced that it would suspend quarterly cash dividends, beginning with the second quarter of 2017.
|
| 2017 Per Share |
|
| 2016 Per Share |
| ||||||||||||||||||
|
| Common Stock Price |
|
|
|
|
|
| Common Stock Price |
|
|
|
|
| ||||||||||
Quarter |
| High |
|
| Low |
|
| Dividends Declared |
|
| High |
|
| Low |
|
| Dividends Declared |
| ||||||
First |
| $ | 16.80 |
|
| $ | 13.20 |
|
| $ | 0.09 |
|
| $ | 14.68 |
|
| $ | 8.88 |
|
| $ | 0.09 |
|
Second |
|
| 17.05 |
|
|
| 12.40 |
|
|
| 0.00 |
|
|
| 19.22 |
|
|
| 10.38 |
|
|
| 0.00 |
|
Third |
|
| 18.15 |
|
|
| 12.70 |
|
|
| 0.00 |
|
|
| 13.65 |
|
|
| 9.34 |
|
|
| 0.18 |
|
Fourth |
|
| 18.40 |
|
|
| 12.20 |
|
|
| 0.00 |
|
|
| 18.25 |
|
|
| 10.22 |
|
|
| 0.09 |
|
Year |
|
| 18.40 |
|
|
| 12.20 |
|
|
| 0.09 |
|
|
| 19.22 |
|
|
| 8.88 |
|
|
| 0.36 |
|
The number of registered shareholders at December 31, 2017, and 2016, equaled 385 and 392, respectively.
STOCK PERFORMANCE GRAPH
Comparison of Five Year Cumulative Total Return*
Standard & Poors 500 Index, NYSE Composite and Morningstar’s Steel Industry
Performance Results through December 2017
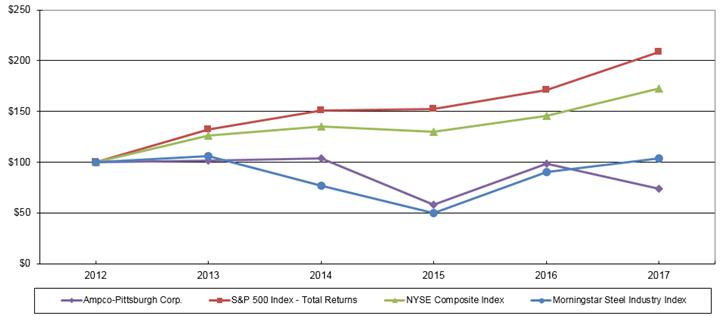
Assumes $100 invested at the close of trading on the last trading day preceding January 1, 2012 in Ampco-Pittsburgh Corporation common stock, Standard & Poors 500 Index, NYSE Composite Index and Morningstar’s Steel Industry group.
*Cumulative total return assumes reinvestment of dividends.
In the above graph, the Corporation has used Morningstar’s Steel Industry group for its peer comparison. The diversity of products produced by subsidiariesfuture profitability of the Corporation makesand the nature of that profitability. Actual results may differ from these assumptions. If the Corporation determined it difficultwould not be able to match to any one product-based peer group. Although not totally comparable, the Steel Industry group was chosen because the largest percentagerealize all or part of the Corporation’s sales isdeferred income tax assets in the future, an adjustment to the global steel industry. Historical stock price performance shownvaluation allowance would be established resulting in a charge to net income (loss). Likewise, if the Corporation determined it would be able to realize deferred income tax assets in excess of the net amount recorded, a portion of the existing valuation allowance would be released resulting in a credit to net income (loss). As of December 31, 2022, the valuation allowance approximates $31,981, reducing deferred income tax assets to $2,141, an amount the Corporation believes is “more likely than not” to be realized.
The Corporation does not recognize a tax benefit in the consolidated financial statements related to a tax position taken or expected to be taken in a tax return unless it is “more likely than not” that the tax authorities will sustain the tax position solely on the above graphbasis of the position’s technical merits. Consideration is primarily given to legislation and statutes, legislative intent, regulations, rulings and case law as well as their applicability to the facts and circumstances of the tax position when assessing the sustainability of the tax position. In the event a tax position no longer meets the “more likely than not” criteria, the Corporation would reverse the tax benefit by recognizing a liability and recording a charge to earnings. Conversely, if the Corporation subsequently determined that a tax position met the “more likely than not” criteria, it would recognize the tax benefit by reducing the liability and recording a credit to earnings. As of December 31, 2022, based on information known to date, the Corporation believes the amount of unrecognized tax benefits for tax positions taken or expected to be taken in a tax return, which may be challenged by the tax authorities, not necessarily indicativeto be significant.
The Corporation's tax filings are subject to audits by tax authorities in the various jurisdictions in which it does business. These audits may result in assessments of future price performance. additional taxes. At December 31, 2022, based on information known to date, the Corporation believes there are no pending or outstanding assessments whose resolution would require recognition in its consolidated financial statements.
See Note 21, Income Taxes, to the Consolidated Financial Statements.
RECENTLY IMPLEMENTED AND ISSUED ACCOUNTING PRONOUNCEMENTS
See Note 1, Summary of Significant Accounting Policies, to the Consolidated Financial Statements.
ITEM 7A. QUANTITATIVE AND QUALITATIVE DISCLOSURES ABOUT MARKET RISK
Not applicable.
25
ITEM 8. FINANCIAL STATEMENTS AND SUPPLEMENTARY DATA
CONSOLIDATED BALANCE SHEETS
|
| December 31, |
| |||||
(in thousands, except par value) |
| 2022 |
|
| 2021 - as adjusted(1) |
| ||
Assets |
|
|
|
|
|
| ||
Current assets: |
|
|
|
|
|
| ||
Cash and cash equivalents |
| $ | 8,735 |
|
| $ | 10,337 |
|
Receivables, less allowance for doubtful accounts of $763 in 2022 and $1,240 in 2021 |
|
| 77,426 |
|
|
| 68,829 |
|
Receivables from related parties |
|
| 1,066 |
|
|
| — |
|
Inventories |
|
| 121,739 |
|
|
| 108,717 |
|
Insurance receivable – asbestos |
|
| 15,000 |
|
|
| 16,000 |
|
Other current assets |
|
| 7,442 |
|
|
| 4,933 |
|
Total current assets |
|
| 231,408 |
|
|
| 208,816 |
|
Property, plant and equipment, net |
|
| 154,998 |
|
|
| 158,563 |
|
Operating lease right-of-use assets, net |
|
| 3,522 |
|
|
| 4,056 |
|
Insurance receivable – asbestos |
|
| 90,910 |
|
|
| 105,297 |
|
Deferred income tax assets |
|
| 2,141 |
|
|
| 1,985 |
|
Intangible assets, net |
|
| 5,194 |
|
|
| 6,204 |
|
Investments in joint ventures |
|
| 2,175 |
|
|
| 2,175 |
|
Prepaid pensions |
|
| 7,242 |
|
|
| 11,963 |
|
Other noncurrent assets |
|
| 5,184 |
|
|
| 6,901 |
|
Total assets |
| $ | 502,774 |
|
| $ | 505,960 |
|
|
|
|
|
|
|
| ||
Liabilities and Shareholders’ Equity |
|
|
|
|
|
| ||
Current liabilities: |
|
|
|
|
|
| ||
Accounts payable |
| $ | 43,209 |
|
| $ | 43,105 |
|
Accounts payable to related parties |
|
| 412 |
|
|
| 1,125 |
|
Accrued payrolls and employee benefits |
|
| 11,796 |
|
|
| 15,954 |
|
Debt – current portion |
|
| 12,410 |
|
|
| 20,007 |
|
Operating lease liabilities – current portion |
|
| 635 |
|
|
| 641 |
|
Asbestos liability – current portion |
|
| 23,000 |
|
|
| 23,000 |
|
Other current liabilities |
|
| 24,763 |
|
|
| 21,210 |
|
Total current liabilities |
|
| 116,225 |
|
|
| 125,042 |
|
Employee benefit obligations |
|
| 43,431 |
|
|
| 62,114 |
|
Asbestos liability |
|
| 130,575 |
|
|
| 157,314 |
|
Long-term debt |
|
| 93,061 |
|
|
| 40,912 |
|
Noncurrent operating lease liabilities |
|
| 2,886 |
|
|
| 3,415 |
|
Deferred income tax liabilities |
|
| 2,518 |
|
|
| 3,858 |
|
Other noncurrent liabilities |
|
| 682 |
|
|
| 1,171 |
|
Total liabilities |
|
| 389,378 |
|
|
| 393,826 |
|
Commitments and contingent liabilities (Note 12) |
|
|
|
|
|
| ||
Shareholders’ equity: |
|
|
|
|
|
| ||
Common stock – par value $1; authorized 40,000 shares; issued and |
|
| 19,404 |
|
|
| 19,184 |
|
Additional paid-in capital |
|
| 175,656 |
|
|
| 174,561 |
|
Retained deficit |
|
| (32,322 | ) |
|
| (35,738 | ) |
Accumulated other comprehensive loss |
|
| (58,412 | ) |
|
| (55,106 | ) |
Total Ampco-Pittsburgh shareholders’ equity |
|
| 104,326 |
|
|
| 102,901 |
|
Noncontrolling interest |
|
| 9,070 |
|
|
| 9,233 |
|
Total shareholders’ equity |
|
| 113,396 |
|
|
| 112,134 |
|
Total liabilities and shareholders’ equity |
| $ | 502,774 |
|
| $ | 505,960 |
|
ITEM 6. SELECTED FINANCIAL DATA
Our selected financial data includesSee Notes to Consolidated Financial Statements.
26
CONSOLIDATED STATEMENTS OF OPERATIONS
|
| For The Years Ended December 31, |
| |||||
(in thousands, except per share amounts) |
| 2022 |
|
| 2021 - as adjusted(1) |
| ||
Net sales: |
|
|
|
|
|
| ||
Net sales |
| $ | 380,255 |
|
| $ | 335,078 |
|
Net sales to related parties |
|
| 9,934 |
|
|
| 9,842 |
|
Total net sales |
|
| 390,189 |
|
|
| 344,920 |
|
Operating costs and expenses: |
|
|
|
|
|
| ||
Costs of products sold (excluding depreciation and amortization) |
|
| 327,996 |
|
|
| 278,805 |
|
Selling and administrative |
|
| 43,527 |
|
|
| 45,998 |
|
Depreciation and amortization |
|
| 17,408 |
|
|
| 17,877 |
|
(Credit) charge for asbestos-related costs |
|
| (2,226 | ) |
|
| 6,661 |
|
Loss on disposal of assets |
|
| 706 |
|
|
| 361 |
|
Total operating costs and expenses |
|
| 387,411 |
|
|
| 349,702 |
|
Income (loss) from operations |
|
| 2,778 |
|
|
| (4,782 | ) |
Other income (expense): |
|
|
|
|
|
| ||
Investment-related income |
|
| 519 |
|
|
| 1,084 |
|
Interest expense |
|
| (5,434 | ) |
|
| (3,599 | ) |
Other – net |
|
| 7,693 |
|
|
| 6,302 |
|
|
|
| 2,778 |
|
|
| 3,787 |
|
Income (loss) before income taxes |
|
| 5,556 |
|
|
| (995 | ) |
Income tax provision |
|
| (1,576 | ) |
|
| (2,305 | ) |
Net income (loss) |
|
| 3,980 |
|
|
| (3,300 | ) |
Less: Net income attributable to noncontrolling interest |
|
| 564 |
|
|
| 561 |
|
Net income (loss) attributable to Ampco-Pittsburgh |
| $ | 3,416 |
|
| $ | (3,861 | ) |
|
|
|
|
|
|
| ||
Net income (loss) per share attributable to Ampco-Pittsburgh common shareholders: |
|
|
|
|
|
| ||
Basic |
| $ | 0.18 |
|
| $ | (0.20 | ) |
Diluted |
| $ | 0.18 |
|
| $ | (0.20 | ) |
|
|
|
|
|
|
| ||
Weighted-average number of common shares outstanding: |
|
|
|
|
|
| ||
Basic |
|
| 19,319 |
|
|
| 18,953 |
|
Diluted |
|
| 19,444 |
|
|
| 18,953 |
|
See Notes to Consolidated Financial Statements.
27
CONSOLIDATED STATEMENTS OF COMPREHENSIVE INCOME
|
| For The Years Ended December 31, |
| ||||||
(in thousands) |
| 2022 |
|
|
| 2021 - as adjusted(1) |
| ||
Net income (loss) |
| $ | 3,980 |
|
|
| $ | (3,300 | ) |
Other comprehensive (loss) income, net of income tax where applicable: |
|
|
|
|
|
|
| ||
Adjustments for changes in: |
|
|
|
|
|
|
| ||
Foreign currency translation |
|
| (11,848 | ) |
|
|
| (2,951 | ) |
Unrecognized employee benefit costs (including effects of foreign currency translation) |
|
| 6,825 |
|
|
|
| 15,263 |
|
Fair value of cash flow hedges |
|
| (512 | ) |
|
|
| 774 |
|
Reclassification adjustments for items included in net income (loss): |
|
|
|
|
|
|
| ||
Amortization of unrecognized employee benefit costs |
|
| 1,115 |
|
|
|
| 1,826 |
|
Settlement of cash flow hedges |
|
| 387 |
|
|
|
| (1,086 | ) |
Other comprehensive (loss) income |
|
| (4,033 | ) |
|
|
| 13,826 |
|
Comprehensive (loss) income |
|
| (53 | ) |
|
|
| 10,526 |
|
Less: Comprehensive (loss) income attributable to noncontrolling interest |
|
| (163 | ) |
|
|
| 798 |
|
Comprehensive income attributable to Ampco-Pittsburgh |
| $ | 110 |
|
|
| $ | 9,728 |
|
See Notes to Consolidated Financial Statements.
28
(in thousands) |
| Common |
|
| Additional |
|
| Retained |
|
| Accumulated |
|
| Noncontrolling |
|
| Total(1) |
| ||||||
Balance January 1, 2021 |
| $ | 18,312 |
|
| $ | 170,318 |
|
| $ | (43,371 | ) |
| $ | (68,695 | ) |
| $ | 8,435 |
|
| $ | 84,999 |
|
Impact from change in accounting principle (Note 2) |
|
|
|
|
|
|
|
| 11,494 |
|
|
|
|
|
|
|
|
| 11,494 |
| ||||
Adjusted balance at January 1, 2021 |
|
| 18,312 |
|
|
| 170,318 |
|
|
| (31,877 | ) |
|
| (68,695 | ) |
|
| 8,435 |
|
|
| 96,493 |
|
Stock-based compensation |
|
|
|
|
| 2,438 |
|
|
|
|
|
|
|
|
|
|
|
| 2,438 |
| ||||
Comprehensive income: |
|
|
|
|
|
|
|
|
|
|
|
|
|
|
|
|
|
| ||||||
Net (loss) income(1) |
|
|
|
|
|
|
|
| (3,861 | ) |
|
|
|
|
| 561 |
|
|
| (3,300 | ) | |||
Other comprehensive income |
|
|
|
|
|
|
|
|
|
|
| 13,589 |
|
|
| 237 |
|
|
| 13,826 |
| |||
Comprehensive income |
|
|
|
|
|
|
|
|
|
|
|
|
|
| 798 |
|
|
| 10,526 |
| ||||
Shareholder exercise of warrants (Note 13) |
|
| 575 |
|
|
| 2,733 |
|
|
|
|
|
|
|
|
|
|
|
| 3,308 |
| |||
Issuance of common stock including excess tax benefits of $0 |
|
| 297 |
|
|
| (928 | ) |
|
|
|
|
|
|
|
|
|
|
| (631 | ) | |||
Balance December 31, 2021 |
|
| 19,184 |
|
|
| 174,561 |
|
|
| (35,738 | ) |
|
| (55,106 | ) |
|
| 9,233 |
|
|
| 112,134 |
|
Stock-based compensation |
|
|
|
|
| 1,665 |
|
|
|
|
|
|
|
|
|
|
|
| 1,665 |
| ||||
Comprehensive loss: |
|
|
|
|
|
|
|
|
|
|
|
|
|
|
|
|
|
| ||||||
Net income |
|
|
|
|
|
|
|
| 3,416 |
|
|
|
|
|
| 564 |
|
|
| 3,980 |
| |||
Other comprehensive loss |
|
|
|
|
|
|
|
|
|
|
| (3,306 | ) |
|
| (727 | ) |
|
| (4,033 | ) | |||
Comprehensive loss: |
|
|
|
|
|
|
|
|
|
|
|
|
|
| (163 | ) |
|
| (53 | ) | ||||
Shareholder exercise of warrants (Note 13) |
|
| 48 |
|
|
| (48 | ) |
|
|
|
|
|
|
|
|
|
|
| - |
| |||
Issuance of common stock including excess tax benefits of $0 |
|
| 172 |
|
|
| (522 | ) |
|
|
|
|
|
|
|
|
|
|
| (350 | ) | |||
Balance December 31, 2022 |
| $ | 19,404 |
|
| $ | 175,656 |
|
| $ | (32,322 | ) |
| $ | (58,412 | ) |
| $ | 9,070 |
|
| $ | 113,396 |
|
|
| Year Ended December 31, |
| |||||||||||||||||
(dollars, except per share amounts, and shares outstanding in thousands) |
| 2017 |
|
| 2016 |
|
| 2015 |
|
| 2014 |
|
| 2013 |
| |||||
Net sales |
| $ | 432,401 |
|
| $ | 331,866 |
|
| $ | 238,480 |
|
| $ | 272,858 |
|
| $ | 281,050 |
|
Net (loss) income attributable to Ampco-Pittsburgh(1) |
|
| (12,089 | ) |
|
| (79,820 | ) |
|
| 1,373 |
|
|
| (1,187 | ) |
|
| 12,437 |
|
Total assets |
|
| 565,599 |
|
|
| 565,889 |
|
|
| 506,156 |
|
|
| 536,409 |
|
|
| 502,673 |
|
Long-term obligations |
|
| 46,818 |
|
|
| 25,389 |
|
|
| 0 |
|
|
| 0 |
|
|
| 0 |
|
Ampco-Pittsburgh shareholders’ equity |
|
| 158,941 |
|
|
| 147,918 |
|
|
| 211,423 |
|
|
| 205,148 |
|
|
| 234,995 |
|
Net (loss) income per common share attributable to Ampco-Pittsburgh: |
|
|
|
|
|
|
|
|
|
|
|
|
|
|
|
|
|
|
|
|
Basic(1) |
|
| (0.98 | ) |
|
| (6.68 | ) |
|
| 0.13 |
|
|
| (0.11 | ) |
|
| 1.20 |
|
Diluted |
|
| (0.98 | ) |
|
| (6.68 | ) |
|
| 0.13 |
|
|
| (0.11 | ) |
|
| 1.20 |
|
Per common share: |
|
|
|
|
|
|
|
|
|
|
|
|
|
|
|
|
|
|
|
|
Cash dividends declared |
|
| 0.09 |
|
|
| 0.36 |
|
|
| 0.72 |
|
|
| 0.72 |
|
|
| 0.72 |
|
Ampco-Pittsburgh shareholders’ equity |
|
| 12.86 |
|
|
| 12.05 |
|
|
| 20.25 |
|
|
| 19.68 |
|
|
| 22.65 |
|
Market price at year end |
|
| 12.40 |
|
|
| 16.75 |
|
|
| 10.26 |
|
|
| 19.25 |
|
|
| 19.45 |
|
Weighted average common shares outstanding |
|
| 12,330 |
|
|
| 11,951 |
|
|
| 10,435 |
|
|
| 10,405 |
|
|
| 10,358 |
|
Number of registered shareholders |
|
| 385 |
|
|
| 392 |
|
|
| 373 |
|
|
| 400 |
|
|
| 423 |
|
Number of employees |
|
| 1,943 |
|
|
| 1,915 |
|
|
| 1,027 |
|
|
| 1,076 |
|
|
| 1,109 |
|
|
|
2016 – After-tax charges of $26,676 or $2.23 per common share principally for the write-off of goodwill in the Forged and Cast Engineered Products reporting unit deemed to be impaired (see costing. See
See Notes to Consolidated Financial Statements), $30,405 or $2.54 per common shareStatements.
29
CONSOLIDATED STATEMENTS OF CASH FLOWS
|
| For The Years Ended December 31, |
| |||||
(in thousands) |
| 2022 |
|
| 2021 - as adjusted(1) |
| ||
Cash flows from operating activities: |
|
|
|
|
|
| ||
Net income (loss) |
| $ | 3,980 |
|
| $ | (3,300 | ) |
Adjustments to reconcile net income (loss) from operations to net cash flows used in operating activities: |
|
|
|
|
|
| ||
Depreciation and amortization |
|
| 17,408 |
|
|
| 17,877 |
|
(Credit) charge for asbestos-related costs |
|
| (2,226 | ) |
|
| 6,661 |
|
Deferred income tax expense |
|
| 468 |
|
|
| 1,304 |
|
Difference between net periodic pension and other postretirement costs and contributions |
|
| (9,295 | ) |
|
| (7,489 | ) |
Stock-based compensation |
|
| 1,665 |
|
|
| 2,438 |
|
Non-cash provisions – net |
|
| (2,215 | ) |
|
| 2,193 |
|
Other – net |
|
| (729 | ) |
|
| 658 |
|
Changes in assets/liabilities: |
|
|
|
|
|
| ||
Receivables |
|
| (11,626 | ) |
|
| (8,268 | ) |
Inventories |
|
| (17,903 | ) |
|
| (27,618 | ) |
Other assets |
|
| (3,943 | ) |
|
| (5,918 | ) |
Insurance receivable – asbestos |
|
| 10,708 |
|
|
| 13,312 |
|
Asbestos liability |
|
| (19,834 | ) |
|
| (23,215 | ) |
Accounts payable |
|
| 1,557 |
|
|
| 17,601 |
|
Accrued payrolls and employee benefits |
|
| 3,892 |
|
|
| 2,048 |
|
Other liabilities |
|
| 885 |
|
|
| (4,150 | ) |
Net cash flows used in operating activities |
|
| (27,208 | ) |
|
| (15,866 | ) |
Cash flows from investing activities: |
|
|
|
|
|
| ||
Purchases of property, plant and equipment |
|
| (16,688 | ) |
|
| (15,236 | ) |
Proceeds from sale of property, plant and equipment |
|
| 17 |
|
|
| 229 |
|
Purchases of long-term marketable securities |
|
| (724 | ) |
|
| (32 | ) |
Proceeds from sale of long-term marketable securities |
|
| 1,088 |
|
|
| 304 |
|
Other – net |
|
| (1 | ) |
|
| 1 |
|
Net cash flows used in investing activities |
|
| (16,308 | ) |
|
| (14,734 | ) |
Cash flows from financing activities: |
|
|
|
|
|
| ||
Proceeds from revolving credit facility |
|
| 44,000 |
|
|
| 32,244 |
|
Payments on revolving credit facility |
|
| (26,666 | ) |
|
| (8,500 | ) |
Proceeds from sale and leaseback financing arrangements |
|
| 20,000 |
|
|
| — |
|
Payments on sale and leaseback financing arrangements |
|
| (346 | ) |
|
| (245 | ) |
Proceeds from equipment financing facility |
|
| 6,388 |
|
|
| — |
|
Proceeds from related party debt |
|
| 5,776 |
|
|
| — |
|
Repayment of related party debt |
|
| (5,776 | ) |
|
| (1,056 | ) |
Repayment of debt |
|
| (645 | ) |
|
| (864 | ) |
Proceeds from shareholder exercise of warrants |
|
| 193 |
|
|
| 3,308 |
|
Debt and equity issuance costs |
|
| (337 | ) |
|
| (485 | ) |
Net cash flows provided by financing activities |
|
| 42,587 |
|
|
| 24,402 |
|
Effect of exchange rate changes on cash and cash equivalents |
|
| (673 | ) |
|
| (307 | ) |
Net decrease in cash and cash equivalents |
|
| (1,602 | ) |
|
| (6,505 | ) |
Cash and cash equivalents at beginning of year |
|
| 10,337 |
|
|
| 16,842 |
|
Cash and cash equivalents at end of year |
| $ | 8,735 |
|
| $ | 10,337 |
|
|
|
|
|
|
|
| ||
Supplemental disclosures of cash flow information: |
|
|
|
|
|
| ||
Income tax payments (net of refunds) |
| $ | 896 |
|
| $ | 1,633 |
|
Interest payments (net of amounts capitalized) |
|
| 5,923 |
|
|
| 2,895 |
|
Non-cash investing and financing activities: |
|
|
|
|
|
| ||
Purchases of property, plant and equipment in accounts payable |
| $ | 994 |
|
| $ | 1,676 |
|
Finance lease right-of-use assets exchanged for lease liabilities |
|
| 1,105 |
|
|
| 1,258 |
|
Operating lease right-of-use assets exchanged for lease liabilities |
|
| 194 |
|
|
| 199 |
|
See Notes to Consolidated Financial Statements), and $4,565 or $0.38 per common share for estimated costs of asbestos-related litigation through 2026, net of estimated insurance recoveries (see Note 19 to Consolidated Financial Statements), and a settlement with an insurance carrier for an amount in excess of the receivable estimated.Statements.
2015 – After-tax asbestos-related proceeds of $9,316 or $0.89 per common share received from two insurance carriers in rehabilitation.30
2014 – An after-tax charge of $2,916 or $0.28 per common share for estimated costs of asbestos-related litigation through 2024, net of estimated insurance recoveries.NOTES TO CONSOLIDATED FINANCIAL STATEMENTS
2013 – An after-tax credit of $10,621 or $1.03 per common share for estimated additional insurance recoveries expected to be available to satisfy the Asbestos Liability through 2022, resulting from settlement agreements reached with various insurance carriers, offset by an after-tax charge of $4,165 or $0.40 per common share to recognize an other-than-temporary impairment of our investment in a forged roll joint venture company for a net increase to net income of $6,456 or $0.63 per common share.
ITEM 7. MANAGEMENT’S DISCUSSION AND ANALYSIS OF FINANCIAL CONDITION AND RESULTS OF OPERATION
(dollars in thousands, except per share amounts)
Description of Business
EXECUTIVE OVERVIEW
Ampco-Pittsburgh Corporation and its subsidiaries (the(collectively, the “Corporation”) manufacture and sell highly engineered, high-performance specialty metal products and customized equipment utilized by industry throughout the world. We operateIt operates in two business segments, – the Forged and Cast Engineered Products (“FCEP”) segment and the Air and Liquid Processing (“ALP”) segment. This segment presentation is consistent with how the Corporation’s chief operating decision-maker evaluates financial performance and makes resource allocation and strategic decisions about the business.
Forged and Cast Engineered ProductsThe Segments
The Forged and Cast Engineered Products segment historically consisted of Union Electric Steel Corporation (“Union Electric Steel” or “UES”) and Union Electric Steel UK Limited (“UES-UK”). In March 2016, UES acquired the stock of Åkers AB and certain of its affiliated companies, including Åkers AB’s 60% equity interest in a Chinese joint venture company (collectively, “Åkers”). Åkers has been a leader in the production of forged and cast rolls since 1806. Collectively doing business as Union Electric Åkers, this portion of theFCEP segment produces forged hardened steel rolls, cast rolls and forged engineered products (“FEP”). Forged hardened steel rolls are used mainly forprimarily in hot and cold rolling mills by producers of steel, aluminum and other metalsmetals. Cast rolls, which are produced in a variety of iron and cast rolls forsteel qualities, are used mainly in hot and cold strip mills, medium/heavy section mills and plate millsmills. FEP principally are sold to customers in a variety of iron andthe steel qualities.
The segment also produces ingot and open-die forged products (“forged engineered products”) which are used in thedistribution market, oil and gas industry and the aluminum and plastic extrusion industries. In July 2015, UES acquired the assets of Alloys Unlimited & Processing, Inc. (“AUP”) and, in November 2016, the stock of ASW Steel Inc. (“ASW”). AUP is a supplier of specialty tool, alloy, and carbon steel round bar and is located in the United States. ASW is a specialty steel producer based in Canada. Both acquisitions support our diversification efforts in the open-die forging market.
The segment has operations in the United States, England, Sweden, and Slovenia Canada and an equity interestinterests in three joint venture companies in China. Collectively, the segment primarily competes with European, Asian and North American and South American companies in both domestic and foreign markets and distributes a significant portion of its products through sales offices located throughout the world.
The consolidated financial statements of the Corporation include the results of operations of the acquired companies from their respective dates of acquisition.
The Forged and Cast Engineered Products segment had been operating at levels significantly below capacity and, in April 2017, we temporarily idled a portion of one of our cast rolls plants. While it is anticipated that market conditions in the United States, Europe and other world regions will remain difficult, protectionist acts (tariffs) and reduced output from China appear to be benefitting our two largest markets – North America and Europe. Additionally, many of our customers have announced improved financial results which should lead to additional demand and better pricing. Backlog for mill rolls has increased roughly 39% from year end 2016 to year end 2017. With respect to the oil and gas market, activity remains strong as oil and gas prices remain elevated. Backlog for forged engineered products at December 31, 2017, has nearly tripled from the prior year.
Air and Liquid Processing
The Air and Liquid ProcessingALP segment includes Aerofin, Buffalo Air Handling and Buffalo Pumps, all divisions of Air & Liquid Systems Corporation (“Air & Liquid”), a wholly owned subsidiary of the Corporation. Aerofin produces custom-engineered finned tube heat exchange coils and related heat transfer products for a variety of industries including OEM/commercial, nuclear power generation and industrial manufacturing. Buffalo Air Handling produces large custom-designed air handling systems for institutional (e.g., hospital, university), pharmaceutical and general industrial building markets. Buffalo Pumps manufactures centrifugal pumps for the fossil-fuelfossil fueled power generation, marine defense and industrial refrigeration industries. The segment has operations in Virginia and New York with headquarters in Carnegie, Pennsylvania. The segment distributes a significant portion of its products through a common independent group of sales offices located throughout the United States and Canada.
ForWhile the Air and Liquid Processing segment, business activityCorporation operated at normal levels in the specialty centrifugal pump industry has been negatively impacted by a decline in activity in the fossil-fueled power generation market, partially offset by increased activity in the marine defense market. For the heat exchanger business, there are early signs of growth in the OEM/commercial, nuclear power generation and industrial markets. Additionally, demand for custom air handling systems2022, it continues to improve although competitive pricingbe challenged by lingering global economic effects of a post-pandemic environment and repercussions from the Russia-Ukraine conflict, including:
CONSOLIDATED RESULTS OF OPERATIONS OVERVIEW
The Corporation
|
| 2017 |
|
|
|
|
|
| 2016 |
|
|
|
|
|
| 2015 |
|
|
|
|
| |||
Net Sales: |
|
|
|
|
|
|
|
|
|
|
|
|
|
|
|
|
|
|
|
|
|
|
|
|
Forged and Cast Engineered Products |
| $ | 344,529 |
|
|
| 80 | % |
| $ | 247,652 |
|
|
| 75 | % |
| $ | 152,267 |
|
|
| 64 | % |
Air and Liquid Processing |
|
| 87,872 |
|
|
| 20 | % |
|
| 84,214 |
|
|
| 25 | % |
|
| 86,213 |
|
|
| 36 | % |
Consolidated |
| $ | 432,401 |
|
|
| 100 | % |
| $ | 331,866 |
|
|
| 100 | % |
| $ | 238,480 |
|
|
| 100 | % |
(Loss) Income from Operations: |
|
|
|
|
|
|
|
|
|
|
|
|
|
|
|
|
|
|
|
|
|
|
|
|
Forged and Cast Engineered Products(1) |
| $ | (1,826 | ) |
|
|
|
|
| $ | (42,878 | ) |
|
|
|
|
| $ | (3,444 | ) |
|
|
|
|
Air and Liquid Processing(2) |
|
| 10,427 |
|
|
|
|
|
|
| 5,123 |
|
|
|
|
|
|
| 23,166 |
|
|
|
|
|
Corporate costs |
|
| (17,970 | ) |
|
|
|
|
|
| (16,775 | ) |
|
|
|
|
|
| (14,675 | ) |
|
|
|
|
Consolidated |
| $ | (9,369 | ) |
|
|
|
|
| $ | (54,530 | ) |
|
|
|
|
| $ | 5,047 |
|
|
|
|
|
Backlog: |
|
|
|
|
|
|
|
|
|
|
|
|
|
|
|
|
|
|
|
|
|
|
|
|
Forged and Cast Engineered Products |
| $ | 285,941 |
|
|
| 88 | % |
| $ | 196,512 |
|
|
| 84 | % |
| $ | 106,582 |
|
|
| 75 | % |
Air and Liquid Processing |
|
| 40,438 |
|
|
| 12 | % |
|
| 37,078 |
|
|
| 16 | % |
|
| 35,243 |
|
|
| 25 | % |
Consolidated |
| $ | 326,379 |
|
|
| 100 | % |
| $ | 233,590 |
|
|
| 100 | % |
| $ | 141,825 |
|
|
| 100 | % |
|
|
|
|
Consolidated net sales for 2017 increased from 2016 principallyshipping product due to higher sales for the Forgedlack of transportation.
The Corporation is actively monitoring, and Cast Engineered Products segment. Specifically, sales of forged engineered products for the oil and gas industry improved by approximately $73,000, of which approximately $38,000 represents the estimated full year effect of the ASW acquisition, which took place in November 2016. Sales of mill rolls to the steel industry increased by approximately $24,000. Sales for the Air and Liquid Processing segment also improved when compared to a year ago. The increase in net sales in 2016, when compared to 2015, is primarily the result of the acquisition of Åkers and ASW, which had net sales, from their respective dates of acquisition, of $128,602.
Consolidated (loss) income from operations for 2016 includes a pre-tax charge of $26,676 for the write-off of goodwill in the Forged and Cast Engineered Products reporting unit deemed to be impaired and, for our Air and Liquid Processing segment, a net pre-tax charge of $4,565 for the estimated costs of asbestos-related litigation through 2026, net of estimated insurance recoveries, and a settlement with an insurance carrier in excess of the receivable amount estimated. By comparison, consolidated (loss) income from operations for 2015 includes pre-tax asbestos-related proceeds of $14,333 received from two insurance carriers in rehabilitation. Higher operating losses for Åkers, including integration-related restructuring costs and unfavorable effects from purchase accounting, further impacted 2016 operating results. Corporate expenses increased in the current year due to higher employee-related costs and professional fees, offset by lower acquisition-related costs. The increase in corporate expenses in 2016, when compared to 2015, is attributable to including a full year effect of centralizing the back office functions, which transferred approximately $800 of additional costs from the operating entities to Corporate, and higher professional fees, resulting primarily from the acquisition of Åkers and ASW. Acquisition-related costs approximated $3,056 and $3,383 in 2016 and 2015, respectively.
A discussion of sales, (loss) income from operations and backlog for the Corporation’s two segments is included below.
Gross margin, excluding depreciation and amortization, as a percentage of net sales, was 17.3%, 16.7% and 17.8% for 2017, 2016 and 2015, respectively. The decrease in 2016, when compared to 2017 and 2015, is principally due to the acquisition of Åkers and unfavorable effects from purchase accounting.
Selling and administrative expenses totaled $61,310 (14.2% of net sales), $58,175 (17.5% of net sales) and $39,510 (16.6% of net sales) for 2017, 2016 and 2015, respectively. The net increase in 2017, as compared to 2016, is principally due to higher commission charges of $1,680, associated with the increase in the volume of shipments, and higher corporate expenses of $1,195, offset by subsequent proceeds of $1,322 received in the current year related to a customer who had filed for bankruptcy in 2016. While the current year includes a full-year effect of the acquisitions, the prior year includes acquisition-related costs of $3,056 and a reserve of $1,513 against the receivable from the customer who filed for bankruptcy protection. The increase for 2016, versus 2015, is primarily due selling and administrative expenses of Åkers and ASW, which approximated $17,145, including the reserve of $1,513 related to the receivable from a customer who had filed for Chapter 11 bankruptcy protection, and higher corporate expenses. Acquisition-related costs for 2016 and 2015 were comparable.
The charge for asbestos litigation in 2016 represents an extension of the estimated costs of pending and future asbestos claims, net of additional insurance recoveries, from 2024 to the end of 2026, partly offset by asbestos-related proceeds received from a settlement with an insurance carrier in excess of the amount estimated and included as an insurance receivable. The credit for asbestos litigation in 2015 represents asbestos-related proceeds received from two insurance carriers in rehabilitation which, because of their potential insolvency, were not included in the insurance receivable previously recorded. See Note 19 to Consolidated Financial Statements.
The charges for impairment in 2016 represent primarily the write-off of goodwill in the Forged and Cast Engineered Products reporting unit deemed to be impaired. Goodwill is not amortized but is tested for impairment at the reporting unit level at least annually, as of October 1, or whenever events and circumstances indicate the carrying amount may not be recoverable. In connection with our strategic planning process and goodwill impairment testing completed in the fourth quarter of 2016, we determined that goodwill in the Forged and Cast Engineered Products reporting unit was fully impaired, primarily as a result of depressed market conditions.
Interest expense for the current year continued to increase, when compared to the prior years, principally as a result of a full year effect of interest and related costs on the: (i) notes issued in 2016 in connection with the purchase of Åkers; (ii) loan payable to the non-controlling shareholder of the Åkers Chinese joint venture; and (iii) revolving credit facility, which was entered into in May 2016. Additionally, in 2017, we incurred interest, fees and early termination costs associated with extinguishing ASW’s outstanding credit facility and term loan.
On December 22, 2017, the U.S. federal government enacted the Tax Cuts and Jobs Act (the “Tax Reform”), to become effective as of January 1, 2018, which, among other things, lowered the U.S. corporate statutory income tax rate from 35% to 21%, implemented a modified territorial tax system and imposed a one-time tax on deemed repatriated earnings of foreign subsidiaries. The Tax Reform negatively impacted our income tax provision by approximately $1,565, principally related to the one-time repatriation transition tax offset by income tax benefits resulting from 100% bonus depreciation. There was no cash outlay due to the Tax Reform, however, it reduced the amount of our carryback refund that we would have been able to receive. Additionally, there was no significant impact from remeasuring our U.S. deferred income tax assets and liabilities at the new enacted statutory income tax rate since these net deferred income tax assets are fully valued. We will continue to analyzeactively monitor, the Tax Reformgeopolitical and refine our provisional amounts, which could potentially impact the measurementeconomic consequence of our tax balances.
In response to the enacted Tax Reform, Staff Accounting Bulletin No. 118 (SAB 118) was issued to address the application of U.S. Generally Accepted Accounting Principles in situations when a registrant does not have the necessary information available, prepared, or analyzed (including computations) in reasonable detail to complete the accounting for certain income tax effects of the Tax Reform. As of December 31, 2017, in accordance with SAB 118, we made a reasonable estimate of the: (i) one-time repatriation transition tax; (ii) increased bonus depreciation for assets placed in service on or after September 27, 2017; and (iii) effects on our existing deferred tax balances, but have not completed our full accounting for the tax effects of enactment of the Tax Reform. We anticipate U.S. regulatory agencies will issue further regulations during 2018, which may alter this estimate. We are continuing to analyze our earnings and profits in foreign jurisdictions and our deferred tax balances.
In January 2018, the Financial Accounting Standards Board (“FASB”) released guidance on the accounting for tax on the global intangible low-taxed income (“GILTI”) provisions of the Tax Reform. The GILTI provisions impose a tax on foreign income in excess of a deemed return on tangible assets of foreign corporations. The guidance indicates that either accounting for deferred taxes related to GILTI inclusions or to treating any taxes on GILTI inclusions as period cost are both acceptable methods, subject to an accounting policy election. We are still evaluating the GILTI provisions and have not yet elected an accounting policy for GILTI. The final determination of the tax effects of enactment of the Tax Reform will be completed within the measurement period of up to one year from the enactment date as permitted by SAB 118, and any adjustments to provisional amounts that are identified during the measurement period will be recorded in the reporting period in which the adjustment is determined.
For 2016, our income tax provision includes valuation allowances against certain of our deferred income tax assets. To determine whether a valuation allowance was needed, we assessed available positive and negative evidence and estimated whether sufficient future taxable income would be generated to permit use of the existing deferred income tax assets. However, during 2016, we incurred three years of cumulative losses, inclusive of the acquired Åkers businesses as if the businesses were held during the entire three-year period. Such objective evidence limits our ability to consider other subjective evidence, such as projections for future growth and profitability. On the basis of this evaluation, we established valuation allowances of $30,405 to reduce the estimated portion of deferred income tax assets to an amount that is “more likely than not” to be realized. The valuation allowance is a non-cash chargethese events and the deferred income tax assets remain available to offset future income tax payments. Additionally, if and when we return to a level of sustained profitability sufficient to conclude that it is more likely than not that deferred income tax assets will be realized, we will reduce the valuation allowance accordingly.
Prior to the Tax Reform, our U.S. corporate statutory income tax rate equaled 35%. The effective income tax rate for 2016 is higher than our corporate statutory income tax rate principally due to the recognition of valuation allowances against certain of our deferred income tax assets and the write-off of goodwill, which is non-deductible for tax purposes until the associated entities are sold. The effective income tax rate for 2015 is higher than our corporate statutory income tax rate due to the non-deductibility of acquisition-related costs, state income taxes and a lower statutory income tax rate in jurisdictions where foreign operations incurred a net loss (thereby generating less of a tax benefit).
In 2016, Union Electric Steel sold a portion of its interest in Union Electric Steel MG Roll Co., Ltd., and, as part of that transaction, the joint venture company was renamed Masteel Gongchang Roll Co., Ltd. (“MG”). Certain proceeds are being recognized when received since, at the time of the sale, collectability was not assured. Additionally, as a result of the sale, we re-evaluated our ability to exercise significant influence over the joint venture and determined that we no longer were able to exercise such influence. Accordingly, equity gains (losses) in joint venture for 2017 represent principally proceeds received from the sale of the equity interest. For 2016, equity gains (losses) in joint venture represent the gain on the sale of the equity interest in MG and Union Electric Steel’s share of earnings of MG and, for 2015, its share of losses. See Note 3 to Consolidated Financial Statements.
As a result of the above, for 2017, we incurred a net loss of $12,089, or $0.98 per common share. For 2016, we incurred a net loss of $79,820, or $6.68 per common share, which includes after-tax charges of $26,676, or $2.23 per common share, principally for the write-off of goodwill in the Forged and Cast Engineered Products reporting unit deemed to be impaired; $30,405, or $2.54 per common share, for valuation allowances established against certain of our deferred income tax assets; and $4,565, or $0.38 per common share, for estimated costs of asbestos-related litigation through 2026, net of estimated insurance recoveries estimated and a settlement with an insurance carrier for an amount in excess of the receivable estimated. For 2015, we earned $1,373, or $0.13 per common share, which includes an after-tax credit of $9,316, or $0.89 per common share, for the net benefit of proceeds received from insurance carriers in rehabilitation.
Forged and Cast Engineered Products
|
| 2017 |
|
| 2016 |
|
| 2015 |
| |||
Net sales |
| $ | 344,529 |
|
| $ | 247,652 |
|
| $ | 152,267 |
|
Operating loss |
| $ | (1,826 | ) |
| $ | (42,878 | ) |
| $ | (3,444 | ) |
Backlog |
| $ | 285,941 |
|
| $ | 196,512 |
|
| $ | 106,582 |
|
Net sales for 2017 increased from the prior year as a result of higher shipments for each of the segment’s product lines. Net sales of forged engineered products contributed $73,000 of additional sales of which approximately $38,000 represents the estimated full year effect of the ASW acquisition in November 2016, with the balance due to improved demand as a result of elevated pricing in the oil and gas market. Sales of forged and cast mill rolls improved by $11,000 and $13,000, respectively, principally on a higher volume of shipments, both domestically and abroad. Changes in exchange rates used to translate sales and operating results of our foreign operations to the U.S. dollar did not have a significant effect on comparability between 2017 and 2016.
Net sales for 2016 include the net sales of Åkers and ASW from their respective dates of acquisition, or $128,602. Net sales of legacy businesses decreased from 2015 primarily as a result of a decline in traditional roll shipments of $15,015 and forged engineered products of $13,170. Additionally, the exchange rate used to translate sales of our U.K. operations from the British pound to the U.S. dollar reduced 2016 net sales by approximately $5,032 when compared to 2015; thepotential impact on operating results, however, was not significant.
Operating results for 2017 improved from a year ago, which includes the write-off of goodwill in the Forged and Cast Engineered Products reporting unit deemed to be impaired of approximately $26,676 and integration-related restructuring expenses. Operating results for the current year principally benefited from the higher volume of shipments (approximately $11,000) and a full-year of contribution from ASW including proceeds received for a customer who filed for bankruptcy protection in 2016 (combined, approximately $5,400). While margins improved from better pricing, unfavorable absorption associated with the temporary idling of one of our cast roll facilities and higher operating and raw material costs minimized the contribution to operating results. Additionally, freight and commissions exceeded the prior year (approximately $3,400) on the higher volume of shipments.
Operating results for 2016 includes the operating results of Åkers and ASW of approximately $(37,207), including the write-off of goodwill, and the incurrence of integration-related expenses and unfavorable effects from purchase accounting. In addition, when compared to 2015, operating results for 2016 were also affected by weaker margins on shipments of our forged and cast mill rolls and forged engineered products by our legacy businesses of $3,003. While our operating results for 2016 were further impacted by a lower volume of shipments of cast rolls and forged engineered products, the effect on operating results was offset by a higher volume of forged roll shipments.
Backlog at December 31, 2017, increased from the prior year due to improved demand for mill rolls, both forged and cast, and forged engineered products. Of the increase in backlog, approximately 80% is attributable to mill rolls and 20% to forged engineered products. The majority of the increase in backlog at December 31, 2016, from 2015, is due to the inclusion of backlog for Åkers and ASW, or $88,590. As of December 31, 2017, approximately $20,318 of the backlog is expected to be released after 2018.
Air and Liquid Processing
|
| 2017 |
|
| 2016 |
|
| 2015 |
| |||
Net sales |
| $ | 87,872 |
|
| $ | 84,214 |
|
| $ | 86,213 |
|
Operating income |
| $ | 10,427 |
|
| $ | 5,123 |
|
| $ | 23,166 |
|
Backlog |
| $ | 40,438 |
|
| $ | 37,078 |
|
| $ | 35,243 |
|
Net sales for the segment were higher in 2017, when compared to the prior two years. Specifically, sales of air handling systems continued to improve, 14% over the two-year period, as a result our market share growth, principally in the hospital and pharmaceutical industries. While sales of centrifugal pumps fell slightly in the current year, sales over the two-year period grew by a net 8%, principally due to an increase in shipments to U.S. Navy shipbuilders offset by a decrease in commercial pump shipments. Sales of heat exchange coils rose slightly in the current year on additional sales to the nuclear industry; however, sales are approximately 11% less than 2015 due to a reduced level of shipments to the fossil-fueled utility, industrial and OEM/commercial markets resulting from lower demand and increased competition.
Operating income for 2016 and 2015 includes asbestos-related items. For 2016, operating income includes a pre-tax charge of $5,632 for estimated costs of asbestos-related litigation through 2026, net of estimated insurance recoveries, offset by proceeds received of $1,067 from an asbestos-related insurance carrier greater than the receivable estimated. For 2015, operating income includes $14,333 of proceeds received from two insurance carriers in rehabilitation which, because of their potential insolvency, were not included in the insurance receivable previously recorded. Otherwise, operating income for 2017 and 2016 benefited principally from a better product mix and cost containment efforts.
Backlog at the end of 2017 improved from 2016 and 2015 as a result of a higher level of orders for U.S. Navy shipbuilders. Year-end backlog for air handling units was comparable to a year ago and better than 2015 due to improved market demand. Backlog for heat exchange coils continued to decrease from the previous two years primarily due to a decline in orders for the fossil-fueled utility, industrial and OEM/commercial markets. The majority of the year-end backlog is scheduled to ship in 2018.
LIQUIDITY AND CAPITAL RESOURCES
Net cash flows (used in) provided by operating activities for 2017 equaled $(15,839) compared to $(5,634) and $20,505 for 2016 and 2015, respectively. The increase in cash used for operating activities in 2017, when compared to 2016, is primarily due to our investment in trade working capital as a result of the growth in the mill roll and forged engineered product businesses during the year and anticipated in 2018. Cash flows for the current year benefitted from U.S. federal and state income tax refunds of $6,540. The increase in cash used for operating activities in 2016, when compared to 2015, is principally due to a net loss being incurred in 2016 whereas 2015 was profitable.
In 2016, we recognized non-cash charges for: (i) the write-off of goodwill in the Forged and Cast Engineered Products reporting unit deemed to be impaired; (ii) valuation allowances to reduce our deferred income tax assets to an amount that is “more likely than not” to be realized; and (iii) the revaluation of our Asbestos Liability and insurance receivables. While these non-cash charges impacted earnings, they did not affect cash flows by the same amount. Instead, since goodwill represents the excess of the purchase price of a business over the fair value of net tangible and intangible assets acquired and liabilities assumed, cash flow is affected at the time the consideration is paid. Additionally, the deferred income tax assets remain available to offset future income tax payments. Finally, the Asbestos Liability, net of insurance recoveries, will be paid over a number of years and will generate tax benefits. Net asbestos-related payments equaled $5,828, $4,630 and $3,971 in 2017, 2016 and 2015, respectively, and are expected to approximate $5,000 in 2018. In 2016, we received proceeds of $1,067 from a settlement with an insurance carrier for asbestos liabilities in excess of the receivable amount estimated and, in 2015, proceeds of $14,333 from two insurance carriers in rehabilitation.
Net cash flows used in investing activities were $13,181, $40,878 and $14,299 in 2017, 2016 and 2015, respectively. The cash portion of the purchase price, net of cash acquired, approximated $27,031 and $3,265 for Åkers and ASW, respectively. The purchase of AUP in 2015 approximated $5,000. During 2017, Union Electric Steel received proceeds of $1,500 from the sale of a portion of its interest in MG; certain proceeds are being recognized when received since, at the time of the sale, collectability was not assured. The majority of the capital expenditures are for our Forged and Cast Engineered Products segment and, as of December 31, 2017, expected future capital expenditures approximated $4,000, which are anticipated to be spent over the next 12-18 months.
Net cash outflows provided by (used in) financing activities improved in 2017, when compared to 2016 and 2015. During the current year, we borrowed $20,349, net, under our revolving credit facility, which exceeded the cash requirements to pay off the net borrowings (term debt and credit facility) assumed as part of the ASW acquisition. In June 2017, we announced that we would suspend quarterly cash dividends, beginning with the second quarter of 2017. Accordingly, dividends paid in 2017 equaled $0.18 per common share (including $0.09 per common share for dividends declared in 2016 but paid in 2017) versus $0.36 per common share in 2016 and $0.72 per common share in 2015.
The effect of exchange rate changes on cash and cash equivalents is primarily attributable to the fluctuation of the British pound and Swedish krona against the U.S. dollar.
As a result of the above, cash and cash equivalents decreased by $17,879 in 2017 and ended the year at $20,700, in comparison to $38,579 and $95,122 at December 31, 2016, and 2015, respectively. Cash held by our foreign operations, equaled $15,809, $12,539 and $10,785 at December 31, 2017, 2016 and 2015, respectively. Under the Tax Reform, future distributions of non-U.S. assets to the U.S. will no longer be subject to U.S. taxation; however, local and withholding taxes may continue to apply. The cash held by our foreign operations is considered to be permanently reinvested; accordingly, a provision for estimated local and withholding tax has not been made. If we were to remit any foreign earnings to the U.S., the estimated tax impact would be insignificant.
We have sufficient net operating loss carryforwards available to offset any cash payments that would otherwise be required under the Tax Reform; accordingly, the repatriation transition tax is not currently expected to have a significant impact on our cash resources. Funds on hand, funds generated from future operations and availability under our revolving credit facility (approximately $56,000 at December 31, 2017, which remained undrawn) are expected to be sufficient to finance our operational and capital expenditure requirements. While the revolving credit facility limits the amount of distributions upstream, we have not historically relied on or have been dependent on distributions from our subsidiaries and are not expected to be in the future. Additionally, we had approximately $800 (£250 in the United Kingdom and €400 in Belgium) available under short-term lines of credit at December 31, 2017.
We had the following contractual obligations outstanding as of December 31, 2017:
|
| Payments Due by Period |
| |||||||||||||||||||||
|
| Total |
|
| <1 year |
|
| 1–3 years |
|
| 3–5 years |
|
| >5 years |
|
| Other |
| ||||||
Debt(1) |
| $ | 61,604 |
|
| $ | 5,325 |
|
| $ | 26,739 |
|
| $ | 20,349 |
|
| $ | 9,191 |
|
| $ | 0 |
|
Fixed Rate Interest(2) |
|
| 4,763 |
|
|
| 34 |
|
|
| 4,727 |
|
|
| 2 |
|
|
| 0 |
|
|
| 0 |
|
Capital Lease Obligations |
|
| 1,773 |
|
|
| 699 |
|
|
| 793 |
|
|
| 281 |
|
|
| 0 |
|
|
| 0 |
|
Operating Lease Obligations |
|
| 3,718 |
|
|
| 702 |
|
|
| 1,152 |
|
|
| 962 |
|
|
| 902 |
|
|
| 0 |
|
Capital Expenditures |
|
| 3,944 |
|
|
| 0 |
|
|
| 3,944 |
|
|
| 0 |
|
|
| 0 |
|
|
| 0 |
|
Pension and Other Postretirement Benefit Obligations(3) |
|
| 53,829 |
|
|
| 4,206 |
|
|
| 15,560 |
|
|
| 16,222 |
|
|
| 17,841 |
|
|
| 0 |
|
Purchase Obligations(4) |
|
| 3,110 |
|
|
| 2,200 |
|
|
| 905 |
|
|
| 5 |
|
|
| 0 |
|
|
| 0 |
|
Unrecognized Tax Benefits(5) |
|
| 117 |
|
|
| 117 |
|
|
| 0 |
|
|
| 0 |
|
|
| 0 |
|
|
| 0 |
|
Total |
| $ | 132,858 |
|
| $ | 13,283 |
|
| $ | 53,820 |
|
| $ | 37,821 |
|
| $ | 27,934 |
|
| $ | 0 |
|
|
|
|
|
|
|
|
|
|
|
With respect to environmental matters, we are currently performing certain remedial actions in connection with the sale of real estate previously owned and periodically incur costs to maintain compliance with environmental laws and regulations. Environmental exposures are difficult to assess and estimate for numerous reasons, including lack of reliable data, the multiplicity of possible solutions, the years of remedial and monitoring activity required, and the identification of new sites. However, we believe the potential liability for remedial actions and environmental compliance measures of approximately $440 accrued at December 31, 2017, is considered adequate based on information known to date (see Note 20 to Consolidated Financial Statements).
The nature and scope of our business brings us into regular contact with a variety of persons, businesses and government agencies in the ordinary course of business. Consequently, we and certain of our subsidiaries from time to time are named in various legal actions. Generally, we do not anticipate that our financial condition, or liquidity, will be materially affected by the costs of known, pending or threatened litigation (see Note 19 to Consolidated Financial Statements). However, claims have been asserted, principally against Air & Liquid, alleging personal injury from exposure to asbestos-containing components historically used in some products and there can be no assurance that future claims will not present significantly greater and longer lasting financial exposure than presently contemplated.
OFF-BALANCE SHEET ARRANGEMENTS
Our off-balance sheet arrangements include operating leases, capital expenditures and purchase obligations disclosed in the contractual obligations table, and letters of credit unrelated to the Industrial Revenue Bonds, as discussed in Note 10 to the Consolidated Financial Statements. These arrangements are not considered significant to our liquidity, capital resources, market risk or credit risk.
EFFECTS OF INFLATION
While inflationary and market pressures on costs are likely to be experienced, it is anticipated that ongoing improvements in manufacturing efficiencies and cost savings efforts will mitigate the effects of inflation on 2018 operating results. The ability to pass on increases in the price of commodities to the customer is contingent upon current market conditions, with us potentially having to absorb some portion to all of the increase. Product pricing for the Forged and Cast Engineered Products segment is reflective of current costs, with a portion of orders subject to a variable-index surcharge program which helps to protect the segment and its customers against the volatility in the cost of certain raw materials. Additionally, long-term labor agreements exist at each of the key locations. Although one of these agreements expired in 2017, employees continue to work under the expired agreement while negotiations proceed. Additionally, other agreements expire in 2018. As is consistent with past practice, we will negotiate with the intent to secure mutually beneficial arrangements covering multiple years (see Note 10 to Consolidated Financial Statements). Finally, commitments have been executed for natural gas usage and certain commodities (copper and aluminum) to cover a portion of orders in the backlog (see Note 13 to Consolidated Financial Statements).
APPLICATION OF CRITICAL ACCOUNTING POLICIES
We have identified critical accounting policies that are important to the presentation of our financial condition, changes in financial condition and results of operations and involve the most complex or subjective assessments. Critical accounting policies relate to assessing recoverability of property, plant and equipment and accounting for business combinations (including intangibles and goodwill and the recoverability thereof), pension and other postretirement benefits, litigation and loss contingencies, and income taxes.
Property, plant and equipment is reviewed for recoverability whenever events or circumstances indicate the carrying amount of the long-lived assets may not be recoverable. If the undiscounted cash flows generated from the use and eventual disposition of the assets are less than their carrying value, then the asset value may not be fully recoverable potentially resulting in a write-down of the asset value. Estimates of future cash flows are based on expected market conditions over the remaining useful life of the primary asset(s). Accordingly, assumptions are made about pricing, volume and asset-resale values. Actual results may differ from these assumptions. We believe the amounts recorded in the accompanying consolidated financial statements for property, plant and equipment are recoverable and are not impaired as of December 31, 2017.
Business combinations are accounted for under the purchase method of accounting. Accordingly, the amount paid for an acquisition is initially allocated to the tangible assets acquired and liabilities assumed based on their estimated fair values as of the date of acquisition. The purchase price in excess of net tangible assets acquire is then allocated to identifiable intangible assets based on detailed valuations. Any excess purchase price over the fair value of the net tangible and intangible assets acquired and liabilities assumed is allocated to goodwill.
Significant judgments and assumptions are required in determining the estimated fair value of assets acquired and liabilities assumed. We utilize third-party valuation specialists and actuaries to assist in determining the fair value of assets acquired and liabilities assumed based on information and assumptions provided by us. The valuation of purchased intangible assets is based upon estimates of future performance and cash flows of the acquired business. Each asset is measured at fair value from the perspective of a market participant. The valuation of employee benefit obligations is consistent with the critical accounting policy outlined below. Significant business and valuation assumptions used in the purchase price allocation include, but are not limited to, the valuation methodology, projected revenues and expenses and related growth rates, and discount rates. If different assumptions are used, it could materially impact the estimated fair values of assets acquired and liabilities assumed. Additionally, initial estimates of the fair value of assets acquired and liabilities assumed are provisional and could change as additional information is received. We finalize our valuations as soon as practicable, but not later than one year from the date of acquisition.
Intangible assets with definite lives are amortized using the straight-line method over their estimated useful life, which is determined by identifying the period over which most of the cash flows are expected to be generated. Additionally, intangible assets, both definite and indefinite lived, are assessed for impairment at least annually, as of October 1, or whenever events or circumstances indicate the carrying amount may not be recoverable. If the undiscounted cash flows attributable to the assets are less than their carrying value, then the asset value may not be fully recoverable potentially resulting in a write-down of the asset value. In assessing recoverability, we make assumptions regarding estimated future cash flows and discount rates. If these estimates or related assumptions change in the future, we may be required to record an impairment charge. Also, if the estimate of an intangible asset’s remaining useful life changes, we will amortize the remaining carrying value of the intangible asset prospectively over the revised remaining useful life. We believe the amounts recorded in the accompanying consolidated financial statements for intangible assets are recoverable and are not impaired as of December 31, 2017.
See Note 2 to the Consolidated Financial Statements.
Accounting for pension and other postretirement benefits involves estimating the cost of benefits to be provided well into the future and attributing that cost over the time period each employee works. To accomplish this, input from our actuaries is evaluated and extensive use is made of assumptions about inflation, long-term rate of return on plan assets, longevity, rates of increases in compensation, employee turnover and discount rates. The curtailment of various U.S. defined benefit plans and amendment of various other postretirement benefit plans in 2016 will help to mitigate the volatility in net periodic pension and other postretirement benefit costs resulting from changes in these assumptions.
The expected long-term rate of return on plan assets is an estimate of average rates of earnings expected to be earned on funds invested or to be invested to provide for the benefits included in the projected benefit obligation. Since these benefits will be paid over many years, the expected long-term rate of return is reflective of current investment returns and investment returns over a longer period. Also, consideration is given to target and actual asset allocations, inflation and real risk-free return. We believe the expected long-term rate of return ranging between 6.95% and 7.50% for our domestic plans and 4.45% for our UES-UK plan to be reasonable. Actual returns on plan assets for 2017 approximated 14.38% for our domestic plans and 7.68% for our UES-UK plan. The remaining foreign plans are not funded and the obligations are not significant.
The discount rates used in determining future pension obligations and other postretirement benefits for each of our plans are based on rates of return for high-quality fixed-income investments currently available and expected to be available during the period to maturity of pension and other postretirement benefits. High-quality fixed-income investments are defined as those investments which have received one of the two highest ratings given by a recognized rating agency with maturities of 10+ years. We believe the assumed discount rates ranging between 3.63% and 3.72% for our domestic plans, 3.46% and 3.69% for our other postretirement benefits plans and 2.45% for our foreign plans as of December 31, 2017, to be reasonable.
We believe that the amounts recorded in the accompanying consolidated financial statements related to pension and other postretirement benefits are based on appropriate assumptions although actual outcomes could differ. A percentage point decrease in the expected long-term rate of return would increase annual pension expense by approximately $2,400. A 1/4 percentage point decrease in the discount rate would increase projected and accumulated benefit obligations by approximately $11,000. Conversely, an increase in the expected long-term rate of return would decrease annual pension expense by approximately $2,400 and an increase in the discount rate would decrease projected and accumulated benefit obligations by approximately $11,000.
Litigation and loss contingency accruals are made when it is determined that it is probable that a liability has been incurred and the amount can be reasonably estimated. Specifically, we and certain of our subsidiaries are involved in various claims and lawsuits incidental to their businesses. In addition, claims have been asserted, principally against Air & Liquid, alleging personal injury from exposure to asbestos-containing components historically used in some products manufactured by certain companies which now operate as divisions of Air & Liquid. To assist us in determining whether an estimate could be made of the potential liability for pending and unasserted future claims for Asbestos Liability along with applicable insurance coverage, and the amounts of any
estimates, we hire a nationally recognized asbestos-liability expert and insurance consultant. Based on their analyses, reserves for probable and reasonably estimable costs for the Asbestos Liability including defense costs and receivables for the insurance recoveries that are deemed probable are established. These amounts rely on assumptions which are based on currently known facts and strategy.
In 2016, we undertook a review of Asbestos Liability claims, defense costs and the likelihood for insurance recoveries. Key variables in these assumptions are summarized in Note 19 to the Consolidated Financial Statements and include the number and type of new claims to be filed each year, the average cost of disposing of each new claim, average annual defense costs, the resolution of coverage issues with insurance carriers, and the solvency risk with respect to the relevant insurance carriers. Other factors that may affect the Asbestos Liability and our ability to recover under our insurance policies include uncertainties surrounding the litigation process from jurisdiction to jurisdiction and from case to case, reforms that may be made by state and federal courts, and the passage of state or federal tort reform legislation. Actual expenses or insurance recoveries could be significantly higher or lower than those recorded if assumptions used in the calculations vary significantly from actual results.
We intend to evaluate the estimated Asbestos Liability and related insurance receivables as well as the underlying assumptions on a regular basis to determine whether any adjustments to the estimates are required. Due to the uncertainties surrounding asbestos litigation and insurance, these regular reviews may result in the incurrence of future charges; however, we are currently unable to estimate such future charges. Adjustments, if any, to our estimate of recorded Asbestos Liability and/or insurance receivables could be material to our operating results for the periods in which the adjustments to the liability or receivable are recorded, and to our liquidity and consolidated financial position when such liabilities are paid.
Accounting for income taxes includes our evaluation of the underlying accounts, permanent and temporary differences, our tax filing positions and interpretations of existing tax law. A valuation allowance is recorded against deferred income tax assets to reduce them to the amount that is “more likely than not” to be realized. In doing so, assumptions are made about the future profitability of our operations and the nature of that profitability. Actual results may differ from these assumptions. If we determined we would not be able to realize all or part of the deferred income tax assets in the future, an adjustment to the valuation allowance would be established resulting in a charge to net income (loss). Likewise, if we determined we would be able to realize deferred income tax assets in excess of the net amount recorded, we would release a portion of the existing valuation allowance resulting in a credit to net income (loss). As of December 31, 2017, the valuation allowance approximates $38,112 reducing our deferred income tax assets, net of deferred income tax liabilities, to $1,157, an amount we believe is “more likely than not” to be realized.
We do not recognize a tax benefit in the financial statements related to a tax position taken or expected to be taken in a tax return unless it is “more likely than not” that the tax authorities will sustain the tax position solely on the basis of the position’s technical merits. Consideration is given primarily to legislation and statutes, legislative intent, regulations, rulings and case law as well as their applicability to the facts and circumstances of the tax position when assessing the sustainability of the tax position. In the event a tax position no longer meets the “more likely than not” criteria, we would reverse the tax benefit by recognizing a liability and recording a charge to earnings. Conversely, if we subsequently determined that a tax position meets the “more likely than not” criteria, we would recognize the tax benefit by reducing the liability and recording a credit to earnings. As of December 31, 2017, based on information known to date, we believe the amount of unrecognized tax benefits of $117 for tax positions taken or expected to be taken in a tax return which may be challenged by the tax authorities is adequate.
We have recorded provisional estimates associated with the December 2017 enactment of the Tax Reform. The SEC has provided accounting and reporting guidance that allows us to report provisional amounts within a measurement period up to one year due to the complexities inherent in adopting the changes. We consider both the recognition of the repatriation transition tax and the remeasurement of our deferred income tax assets and liabilities as incomplete. New guidance from regulators, interpretation of the law, and refinement of our estimates from ongoing analysis of data and tax positions may change the provisional amounts. The repatriation transition tax is based on our total post-1986 foreign earnings and profits that were previously deferred from U.S. taxation. We have not yet completed our substantiation of the underlying data and therefore our taxable base estimates may change. Our estimates of foreign tax credits may also change as we substantiate tax credits claimed. Further, the repatriation transition tax is based in part on the amount of foreign earnings held in cash and other liquid assets. The repatriation transition tax may change as we more precisely calculate amounts held in liquid and illiquid assets at the various measurement dates. If the final tax outcome of these matters is different than provisional amounts, it will impact the provision for income taxes and the effective tax rate in the period recorded.
In 2017, we recognized the tax impact of including certain foreign earnings in U.S. taxable income. Additional taxes, local and withholding, may result when earnings are repatriated to the U.S. We have not recognized any additional charge for local and withholding taxes that could be incurred on any distributions of non-U.S. earnings, because such non-U.S. earnings are deemed to be permanently invested. Remittances of non-U.S. earnings are based on estimates and judgments of projected cash flow needs, as well as the working capital and investment requirements of our non-U.S. and U.S. operations. Material changes in our estimates of cash,
working capital, and investment needs in various jurisdictions could require repatriation of indefinitely reinvested non-U.S. earnings, which could be subject to applicable non-U.S. income and withholding taxes, however, the amount is not expected to be significant.
See Note 15 to the Consolidated Financial Statements.
RECENTLY IMPLEMENTED ACCOUNTING PRONOUNCEMENTS
In January 2018, the FASB issued ASU 2018-02, Income Statement – Reporting Comprehensive Income, which allows for a reclassification from accumulated other comprehensive income (loss) to retained earnings for the stranded tax effects resulting from the Tax Reform. A stranded tax effect is defined as the difference in the tax effect of amounts recognized as other comprehensive income (loss) items, using the income tax rate in effect at the time of recognition and the newly enacted income tax rate. ASU 2018-02 is relevant only to the reclassification of the income tax effects of the Tax Reform; accordingly, the underlying guidance that requires that the effect of a change in tax laws or rates be included in income from continuing operations is not affected. The guidance becomes effective for interim and annual periods beginning after December 15, 2018; however, early adoption is permitted. We adopted the new guidance in our 2017 accounts and, as a result, $6,088 was reclassified between accumulated other comprehensive loss and retained earnings.
In March 2016, the FASB issued ASU 2016-09, Improvements to Employee Share-Based Payment Accounting, which requires all income tax effects of awards to be recognized in the income statement when the awards vest or are settled. The guidance also requires presentation of excess tax benefits as an operating activity on the statement of cash flows rather than as a financing activity. The amended guidance became effective for us January 1, 2017, and did not have a significant impact on our financial position, operating results or liquidity.
In July 2015, the FASB issued ASU 2015-11, Simplifying the Measurement of Inventory, which revises the measurement of inventory at the lower of cost or market. In accordance with ASU 2015-11, an entity will measure inventory at the lower of cost and net realizable value, which is defined as the estimated selling price in the ordinary course of business less reasonably predictable costs of completion, disposal and transportation. The amendment does not apply to inventory that is measured using the last-in, first out (LIFO) method. The guidance became effective for us January 1, 2017, and did not have a significant impact on our financial position, operating results or liquidity.
RECENTLY ISSUED ACCOUNTING PRONOUNCEMENTS
In August 2017, the FASB issued ASU 2017-12, Derivatives and Hedging, which amends and simplifies existing guidance to allow companies to more accurately present the economic effects of risk management activities in the financial statements. The amended guidance will be effective for interim and annual periods beginning after December 15, 2018; however, early adoption is permitted. We are currently evaluating the impact the guidance will have on our financial position and operating results. It will not, however, affect our liquidity.
In May 2017, the FASB issued ASU 2017-09, Scope of Modification Accounting, which provides guidance about which changes to the terms and conditions of a share-based payment award require an entity to apply modification accounting. The amendment will be applied prospectively to an award modified on or after the adoption date. The amended guidance will be effective for interim and annual periods beginning after December 15, 2017. The guidance will not affect our financial position, operating results and liquidity as of the date of adoption.
In March 2017, the FASB issued ASU 2017-07, Improving the Presentation of Net Periodic Pension Cost and Net Periodic Postretirement Benefit Cost, which requires an employer who offers defined benefit and postretirement benefit plans to report the service cost component of net periodic benefit cost in the same line item or items as other compensation costs arising from services rendered by employees during the period. The other components of net periodic benefit cost are required to be presented in the income statement separately from the service cost component and outside the subtotal of income from operations. The amendment also allows only for the service cost component of net periodic benefit cost to be eligible for capitalization when applicable. The amended guidance does not change the amount of net periodic benefit cost to be recognized, only where it is to be recognized in the income statement. The amended guidance becomes effective for interim and annual periods beginning after December 15, 2017, and must be applied retrospectively for the presentation of the service cost component and the other components of net periodic pension and other postretirement costs in the income statement and prospectively for capitalization of the service cost component of net periodic benefit cost in inventory. A practical expedient is available permitting employers to use the amounts disclosed in its pension and other postretirement benefit plan footnote (Note 9 to the Consolidated Financial Statements) as the estimate to apply retrospectively. The guidance will not affect our financial position or liquidity.
In August 2016, the FASB issued ASU 2016-15, Classification of Certain Cash Receipts and Cash Payments, which clarifies guidance on the classification of certain cash receipts and payments in the statement of cash flows. The amended guidance will be effective for interim and annual periods beginning after December 15, 2017. The guidance will not have a significant impact on the presentation of our cash flow statement, and it will not affect our financial position, operating results or liquidity.
In May 2016, April 2016, March 2016 and May 2014, the FASB issued ASUs 2016-12, 2016-10, 2016-08 and 2014-09, respectively, Revenue from Contracts with Customers (Topic 606), which provides a common revenue standard for U.S. GAAP and IFRS. The guidance establishes principles for reporting information about the nature, amount, timing and uncertainty of revenue and cash flows arising from a company’s contracts with customers. It requires companies to apply a five-step model when recognizing revenue relating to the transfer of goods or services to customers in an amount that reflects the consideration that the company expects to be entitled to receive for those goods and services. It also requires comprehensive disclosures regarding revenue recognition. The guidance becomes effective for interim and annual periods beginning after December 15, 2017, and can be implemented on either a full or modified retrospective basis. We will use the modified retrospective method (a cumulative adjustment to our January 1, 2018 retained earnings). Based on the evaluation of our current contracts and revenue streams, we determined they will be recorded consistently under both existing generally accepted accounting principles and the new standard. Accordingly, the new guidance will not have a material effect on our financial position, operating results or liquidity. Our disclosures, however, will change significantly in response to the requirements of the new guidance.
In February 2016, the FASB issued ASU 2016-02, Leases (Topic 842), which requires lessees to recognize assets and liabilities on the balance sheet for the rights and obligations created by all leases with a term of more than one year. Accounting by lessors will remain similar to existing generally accepted accounting principles. The guidance becomes effective for us January 1, 2019. We are currently evaluating the impact the guidance will have on our financial position, operating results and liquidity.
In January 2016, the FASB issued ASU 2016-01, Recognition and Measurement of Financial Assets and Liabilities, which simplifies the accounting and disclosures related to equity investments. ASU 2016-01 will require entities to carry certain investments in equity securities at fair value with changes in fair value recorded through net income (loss) versus other comprehensive income (loss). ASU 2016-01 does not apply to investments that qualify for the equity method of accounting or to those that result in consolidation of the investee. The guidance becomes effective for interim and annual periods beginning after December 15, 2017, and must be adopted by means of a cumulative-effect adjustment to retained earnings as of the beginning of the fiscal year of adoption. At December 31, 2017, unrealized holding gains on securities approximated $600 which will be recorded as the cumulative-effect adjustment to retained earnings. Prospectively, the guidance is not expected to have a significant effect on our financial position, operating results and liquidity.
ITEM 7A. QUANTITATIVE AND QUALITATIVE DISCLOSURES ABOUT MARKET RISK
Of our primary market risk exposures, we view changes in foreign currency rates and commodity prices to be significant enough to mitigate through derivative instruments and forward purchase agreements. To manage certain foreign currency exchange exposures, our policy is to hedge a portion of our foreign currency denominated sales and receivables, primarily U.S. sales denominated in euros and U.K. sales denominated in U.S. dollars and euros. Although strengthening of the U.S. dollar could result in a lower volume of exports from the United States and at reduced margins, exports of our foreign operations may increase and gross margins might improve. Additionally, strengthening of the British pound could result in a lower volume of exports from the United Kingdom and at reduced margins; however, exports for our domestic operations may increase and gross margins might improve. A weakening of the euro, as compared to the U.S. dollar and British pound, could result in a lower volume of exports and at reduced margins.
To reduce the effect of price changes for certain of our raw materials and energy, we enter into contracts for particular commodities (copper and aluminum) and purchase a portion of our energy usage in advance. Based on estimated annual purchases, a 10% fluctuation in commodity prices (including electricity, natural gas, steel scrap and ferroalloys) would have impacted 2017 and 2016 by approximately $14,000 and $8,000 (or approximately $11,000 if the Åkers and ASW acquisitions were completed as of the beginning of the year), respectively. There is no guarantee that fluctuations in commodity prices will be limited to 10%. The ability to pass on increases in the price of commodities to the customer is contingent upon current market conditions with us potentially having to absorb a portion to all of such increase. However, a sales price surcharge mechanism is in place with a portion of the customers of our Forged and Cast Engineered Products segment which helps to protect against the volatility in the cost of certain raw materials.
See also Note 13 to the Consolidated Financial Statements.
ITEM 8. FINANCIAL STATEMENTS AND SUPPLEMENTARY DATA
|
| December 31, |
| |||||
(in thousands, except par value) |
| 2017 |
|
| 2016 |
| ||
Assets |
|
|
|
|
|
|
|
|
Current assets: |
|
|
|
|
|
|
|
|
Cash and cash equivalents |
| $ | 20,700 |
|
| $ | 38,579 |
|
Receivables, less allowance for doubtful accounts of $962 in 2017 and $2,228 in 2016 |
|
| 86,623 |
|
|
| 72,233 |
|
Inventories |
|
| 107,561 |
|
|
| 83,579 |
|
Insurance receivable – asbestos |
|
| 13,000 |
|
|
| 13,000 |
|
Other current assets |
|
| 12,363 |
|
|
| 14,073 |
|
Total current assets |
|
| 240,247 |
|
|
| 221,464 |
|
Property, plant and equipment, net |
|
| 214,980 |
|
|
| 214,408 |
|
Insurance receivable – asbestos |
|
| 87,342 |
|
|
| 102,945 |
|
Deferred income tax assets |
|
| 1,590 |
|
|
| 4,824 |
|
Investments in joint ventures |
|
| 2,175 |
|
|
| 2,019 |
|
Intangible assets, net |
|
| 11,021 |
|
|
| 11,601 |
|
Other noncurrent assets |
|
| 8,244 |
|
|
| 8,628 |
|
Total assets |
| $ | 565,599 |
|
| $ | 565,889 |
|
Liabilities and Shareholders’ Equity |
|
|
|
|
|
|
|
|
Current liabilities: |
|
|
|
|
|
|
|
|
Accounts payable |
| $ | 47,479 |
|
| $ | 37,104 |
|
Accrued payrolls and employee benefits |
|
| 22,768 |
|
|
| 20,166 |
|
Debt – current portion |
|
| 19,335 |
|
|
| 26,825 |
|
Asbestos liability – current portion |
|
| 18,000 |
|
|
| 18,000 |
|
Other current liabilities |
|
| 37,089 |
|
|
| 42,197 |
|
Total current liabilities |
|
| 144,671 |
|
|
| 144,292 |
|
Employee benefit obligations |
|
| 79,750 |
|
|
| 91,947 |
|
Asbestos liability |
|
| 131,750 |
|
|
| 153,181 |
|
Deferred income tax liabilities |
|
| 433 |
|
|
| 591 |
|
Long-term debt |
|
| 46,818 |
|
|
| 25,389 |
|
Other noncurrent liabilities |
|
| 416 |
|
|
| 655 |
|
Total liabilities |
|
| 403,838 |
|
|
| 416,055 |
|
Commitments and contingent liabilities (Note 10) |
|
|
|
|
|
|
|
|
Shareholders’ equity: |
|
|
|
|
|
|
|
|
Common stock – par value $1; authorized 20,000 shares; issued and outstanding 12,361 shares in 2017 and 12,271 shares in 2016 |
|
| 12,361 |
|
|
| 12,271 |
|
Additional paid-in capital |
|
| 152,992 |
|
|
| 151,089 |
|
Retained earnings |
|
| 38,348 |
|
|
| 45,443 |
|
Accumulated other comprehensive loss |
|
| (44,760 | ) |
|
| (60,885 | ) |
Total Ampco-Pittsburgh shareholders’ equity |
|
| 158,941 |
|
|
| 147,918 |
|
Noncontrolling interest |
|
| 2,820 |
|
|
| 1,916 |
|
Total shareholders’ equity |
|
| 161,761 |
|
|
| 149,834 |
|
Total liabilities and shareholders’ equity |
| $ | 565,599 |
|
| $ | 565,889 |
|
See Notes to Consolidated Financial Statements.
CONSOLIDATED STATEMENTS OF OPERATIONS
|
| For The Year Ended December 31, |
| |||||||||
(in thousands, except per share amounts) |
| 2017 |
|
| 2016 |
|
| 2015 |
| |||
Net sales |
| $ | 432,401 |
|
| $ | 331,866 |
|
| $ | 238,480 |
|
Operating costs and expenses: |
|
|
|
|
|
|
|
|
|
|
|
|
Costs of products sold (excluding depreciation and amortization) |
|
| 357,672 |
|
|
| 276,496 |
|
|
| 196,091 |
|
Selling and administrative |
|
| 61,310 |
|
|
| 58,175 |
|
|
| 39,510 |
|
Depreciation and amortization |
|
| 22,387 |
|
|
| 20,463 |
|
|
| 11,787 |
|
Charge (credit) for asbestos litigation |
|
| 0 |
|
|
| 4,565 |
|
|
| (14,333 | ) |
Charges for impairment |
|
| 0 |
|
|
| 26,676 |
|
|
| 0 |
|
Loss on disposition of assets |
|
| 401 |
|
|
| 21 |
|
|
| 378 |
|
|
|
| 441,770 |
|
|
| 386,396 |
|
|
| 233,433 |
|
(Loss) income from operations |
|
| (9,369 | ) |
|
| (54,530 | ) |
|
| 5,047 |
|
Other income (expense): |
|
|
|
|
|
|
|
|
|
|
|
|
Investment-related income |
|
| 133 |
|
|
| 481 |
|
|
| 174 |
|
Interest expense |
|
| (3,525 | ) |
|
| (2,397 | ) |
|
| (226 | ) |
Other – net |
|
| (932 | ) |
|
| (1,074 | ) |
|
| (475 | ) |
|
|
| (4,324 | ) |
|
| (2,990 | ) |
|
| (527 | ) |
(Loss) income before income taxes and equity gains (losses) in joint venture |
|
| (13,693 | ) |
|
| (57,520 | ) |
|
| 4,520 |
|
Income tax benefit (provision) |
|
| 1,355 |
|
|
| (22,712 | ) |
|
| (2,633 | ) |
Equity gains (losses) in joint venture, including gain on sale (Note 3) |
|
| 1,036 |
|
|
| 423 |
|
|
| (514 | ) |
Net (loss) income |
|
| (11,302 | ) |
|
| (79,809 | ) |
|
| 1,373 |
|
Less: Net income attributable to noncontrolling interest |
|
| 787 |
|
|
| 11 |
|
|
| 0 |
|
Net (loss) income attributable to Ampco-Pittsburgh |
| $ | (12,089 | ) |
| $ | (79,820 | ) |
| $ | 1,373 |
|
Net (loss) income per common share attributable to Ampco-Pittsburgh: |
|
|
|
|
|
|
|
|
|
|
|
|
Basic |
| $ | (0.98 | ) |
| $ | (6.68 | ) |
| $ | 0.13 |
|
Diluted |
| $ | (0.98 | ) |
| $ | (6.68 | ) |
| $ | 0.13 |
|
Weighted average number of common shares outstanding: |
|
|
|
|
|
|
|
|
|
|
|
|
Basic |
|
| 12,330 |
|
|
| 11,951 |
|
|
| 10,435 |
|
Diluted |
|
| 12,330 |
|
|
| 11,951 |
|
|
| 10,447 |
|
See Notes to Consolidated Financial Statements.
CONSOLIDATED STATEMENTS OF COMPREHENSIVE INCOME (LOSS)
|
| For The Year Ended December 31, |
| |||||||||
(in thousands) |
| 2017 |
|
| 2016 |
|
| 2015 |
| |||
Net (loss) income |
| $ | (11,302 | ) |
| $ | (79,809 | ) |
| $ | 1,373 |
|
Other comprehensive income (loss), net of income tax where applicable: |
|
|
|
|
|
|
|
|
|
|
|
|
Adjustments for changes in: |
|
|
|
|
|
|
|
|
|
|
|
|
Foreign exchange translation |
|
| 11,041 |
|
|
| (14,580 | ) |
|
| (3,967 | ) |
Unrecognized employee benefit costs (including effects of foreign currency translation) |
|
| 7,299 |
|
|
| 9,397 |
|
|
| 10,713 |
|
Unrealized holding gains (losses) on marketable securities |
|
| 602 |
|
|
| 405 |
|
|
| (239 | ) |
Fair value of cash flow hedges |
|
| 804 |
|
|
| 398 |
|
|
| (475 | ) |
Reclassification adjustments for items included in net (loss) income: |
|
|
|
|
|
|
|
|
|
|
|
|
Amortization of unrecognized employee benefit costs |
|
| 3,283 |
|
|
| 1,910 |
|
|
| 4,740 |
|
Realized gains from sale of marketable securities |
|
| (29 | ) |
|
| (1,038 | ) |
|
| (53 | ) |
Realized (gains) losses from settlement of cash flow hedges |
|
| (670 | ) |
|
| 108 |
|
|
| 435 |
|
Other comprehensive income (loss) |
|
| 22,330 |
|
|
| (3,400 | ) |
|
| 11,154 |
|
Comprehensive income (loss) |
|
| 11,028 |
|
|
| (83,209 | ) |
|
| 12,527 |
|
Less: Comprehensive income (loss) attributable to noncontrolling interest |
|
| 904 |
|
|
| (103 | ) |
|
| 0 |
|
Comprehensive income (loss) income attributable to Ampco-Pittsburgh |
| $ | 10,124 |
|
| $ | (83,106 | ) |
| $ | 12,527 |
|
See Notes to Consolidated Financial Statements.
CONSOLIDATED STATEMENTS OF SHAREHOLDERS’ EQUITY
(in thousands, except per share amounts) |
| Common Stock |
|
| Additional Paid-in Capital |
|
| Retained Earnings |
|
| Accumulated Other Comprehensive Loss |
|
| Noncontrolling Interest |
|
| Total |
| ||||||
Balance January 1, 2015 |
| $ | 10,426 |
|
| $ | 127,526 |
|
| $ | 135,949 |
|
| $ | (68,753 | ) |
| $ | 0 |
|
| $ | 205,148 |
|
Stock-based compensation |
|
|
|
|
|
| 1,103 |
|
|
|
|
|
|
|
|
|
|
|
|
|
|
| 1,103 |
|
Comprehensive income: |
|
|
|
|
|
|
|
|
|
|
|
|
|
|
|
|
|
|
|
|
|
|
|
|
Net income |
|
|
|
|
|
|
|
|
|
| 1,373 |
|
|
|
|
|
|
|
|
|
|
| 1,373 |
|
Other comprehensive income |
|
|
|
|
|
|
|
|
|
|
|
|
|
| 11,154 |
|
|
|
|
|
|
| 11,154 |
|
Comprehensive income |
|
|
|
|
|
|
|
|
|
|
|
|
|
|
|
|
|
|
|
|
|
| 12,527 |
|
Issuance of common stock including excess tax benefits of $0 |
|
| 14 |
|
|
| 211 |
|
|
|
|
|
|
|
|
|
|
|
|
|
|
| 225 |
|
Cash dividends ($0.72 per share) |
|
|
|
|
|
|
|
|
|
| (7,580 | ) |
|
|
|
|
|
|
|
|
|
| (7,580 | ) |
Balance, December 31, 2015 |
|
| 10,440 |
|
|
| 128,840 |
|
|
| 129,742 |
|
|
| (57,599 | ) |
|
| 0 |
|
|
| 211,423 |
|
Noncontrolling interest associated with Åkers acquisition (Note 2) |
|
|
|
|
|
|
|
|
|
|
|
|
|
|
|
|
|
| 2,019 |
|
|
| 2,019 |
|
Stock-based compensation |
|
|
|
|
|
| 1,482 |
|
|
|
|
|
|
|
|
|
|
|
|
|
|
| 1,482 |
|
Comprehensive loss: |
|
|
|
|
|
|
|
|
|
|
|
|
|
|
|
|
|
|
|
|
|
|
|
|
Net (loss) income |
|
|
|
|
|
|
|
|
|
| (79,820 | ) |
|
|
|
|
|
| 11 |
|
|
| (79,809 | ) |
Other comprehensive loss |
|
|
|
|
|
|
|
|
|
|
|
|
|
| (3,286 | ) |
|
| (114 | ) |
|
| (3,400 | ) |
Comprehensive loss |
|
|
|
|
|
|
|
|
|
|
|
|
|
|
|
|
|
| (103 | ) |
|
| (83,209 | ) |
Issuance of common stock including excess tax benefits of $0 |
|
| 1,831 |
|
|
| 20,767 |
|
|
|
|
|
|
|
|
|
|
|
|
|
|
| 22,598 |
|
Cash dividends ($0.36 per share) |
|
|
|
|
|
|
|
|
|
| (4,479 | ) |
|
|
|
|
|
|
|
|
|
| (4,479 | ) |
Balance December 31, 2016 |
|
| 12,271 |
|
|
| 151,089 |
|
|
| 45,443 |
|
|
| (60,885 | ) |
|
| 1,916 |
|
|
| 149,834 |
|
Stock-based compensation |
|
|
|
|
|
| 1,555 |
|
|
|
|
|
|
|
|
|
|
|
|
|
|
| 1,555 |
|
Comprehensive income: |
|
|
|
|
|
|
|
|
|
|
|
|
|
|
|
|
|
|
|
|
|
|
|
|
Net (loss) income |
|
|
|
|
|
|
|
|
|
| (12,089 | ) |
|
|
|
|
|
| 787 |
|
|
| (11,302 | ) |
Other comprehensive income |
|
|
|
|
|
|
|
|
|
|
|
|
|
| 22,213 |
|
|
| 117 |
|
|
| 22,330 |
|
Comprehensive income |
|
|
|
|
|
|
|
|
|
|
|
|
|
|
|
|
|
| 904 |
|
|
| 11,028 |
|
Impact from adoption of ASU 2018-02 (Note 15) |
|
|
|
|
|
|
|
|
|
| 6,088 |
|
|
| (6,088 | ) |
|
|
|
|
|
| 0 |
|
Issuance of common stock including excess tax benefits of $0 |
|
| 90 |
|
|
| 348 |
|
|
|
|
|
|
|
|
|
|
|
|
|
|
| 438 |
|
Cash dividends ($0.09 per share) |
|
|
|
|
|
|
|
|
|
| (1,094 | ) |
|
|
|
|
|
|
|
|
|
| (1,094 | ) |
Balance December 31, 2017 |
| $ | 12,361 |
|
| $ | 152,992 |
|
| $ | 38,348 |
|
| $ | (44,760 | ) |
| $ | 2,820 |
|
| $ | 161,761 |
|
See Notes to Consolidated Financial Statements.
CONSOLIDATED STATEMENTS OF CASH FLOWS
|
| For The Year Ended December 31, |
| |||||||||
(in thousands) |
| 2017 |
|
| 2016 |
|
| 2015 |
| |||
Cash flows from operating activities: |
|
|
|
|
|
|
|
|
|
|
|
|
Net (loss) income |
| $ | (11,302 | ) |
| $ | (79,809 | ) |
| $ | 1,373 |
|
Adjustments to reconcile net (loss) income to net cash flows from operating activities: |
|
|
|
|
|
|
|
|
|
|
|
|
Depreciation and amortization |
|
| 22,387 |
|
|
| 20,463 |
|
|
| 11,787 |
|
Charges for impairment |
|
| 0 |
|
|
| 26,676 |
|
|
| 0 |
|
Charge for asbestos litigation |
|
| 0 |
|
|
| 5,631 |
|
|
| 0 |
|
Deferred income tax provision (benefit), including valuation allowance |
|
| 3,177 |
|
|
| 23,407 |
|
|
| (2,302 | ) |
Difference between pension and other postretirement expense and contributions |
|
| (1,857 | ) |
|
| (1,948 | ) |
|
| 4,972 |
|
Stock-based compensation |
|
| 2,400 |
|
|
| 2,332 |
|
|
| 1,328 |
|
Equity (gains) losses in joint venture, including gain on sale (Note 3) |
|
| (1,036 | ) |
|
| (423 | ) |
|
| 514 |
|
Provisions for bad debts and inventories |
|
| 305 |
|
|
| 2,348 |
|
|
| 862 |
|
Provision for warranties net of settlements |
|
| (413 | ) |
|
| (1,015 | ) |
|
| (159 | ) |
Loss on disposition of assets |
|
| 401 |
|
|
| 21 |
|
|
| 378 |
|
Gain on sale of long-term marketable securities |
|
| 0 |
|
|
| (1,404 | ) |
|
| 0 |
|
Other – net |
|
| 1,569 |
|
|
| (279 | ) |
|
| 577 |
|
Changes in assets/liabilities: |
|
|
|
|
|
|
|
|
|
|
|
|
Receivables |
|
| (12,916 | ) |
|
| 5,697 |
|
|
| 9,391 |
|
Inventories |
|
| (20,359 | ) |
|
| 8,308 |
|
|
| (4,527 | ) |
Other assets, including insurance receivable – asbestos |
|
| 19,351 |
|
|
| 20,466 |
|
|
| 15,300 |
|
Accounts payable |
|
| 7,818 |
|
|
| (8,819 | ) |
|
| (3,003 | ) |
Accrued payrolls and employee benefits |
|
| 1,101 |
|
|
| 1,051 |
|
|
| 452 |
|
Other liabilities, including asbestos liability |
|
| (26,465 | ) |
|
| (28,337 | ) |
|
| (16,438 | ) |
Net cash flows (used in) provided by operating activities |
|
| (15,839 | ) |
|
| (5,634 | ) |
|
| 20,505 |
|
Cash flows from investing activities: |
|
|
|
|
|
|
|
|
|
|
|
|
Purchases of property, plant and equipment |
|
| (14,899 | ) |
|
| (10,566 | ) |
|
| (9,407 | ) |
Purchase of Åkers AB, net of cash acquired (Note 2) |
|
| 0 |
|
|
| (27,031 | ) |
|
| 0 |
|
Purchase of ASW Steel Inc., net of cash acquired (Note 2) |
|
| 0 |
|
|
| (3,265 | ) |
|
| 0 |
|
Purchase of Alloys Unlimited & Processing, Inc. (Note 2) |
|
| 0 |
|
|
| 0 |
|
|
| (5,000 | ) |
Proceeds from sale of investment in joint venture (Note 3) |
|
| 1,500 |
|
|
| 0 |
|
|
| 0 |
|
Purchases of long-term marketable securities |
|
| (109 | ) |
|
| (4,662 | ) |
|
| (631 | ) |
Proceeds from sale of long-term marketable securities |
|
| 327 |
|
|
| 4,646 |
|
|
| 728 |
|
Other |
|
| 0 |
|
|
| 0 |
|
|
| 11 |
|
Net cash flows used in investing activities |
|
| (13,181 | ) |
|
| (40,878 | ) |
|
| (14,299 | ) |
Cash flows from financing activities: |
|
|
|
|
|
|
|
|
|
|
|
|
Dividends paid |
|
| (2,236 | ) |
|
| (5,206 | ) |
|
| (7,512 | ) |
Debt issuance costs (Note 8) |
|
| 0 |
|
|
| (1,247 | ) |
|
| 0 |
|
Repayment of debt |
|
| (1,318 | ) |
|
| (962 | ) |
|
| 0 |
|
Proceeds from Revolving Credit and Security Agreement (Note 8) |
|
| 25,349 |
|
|
| 0 |
|
|
| 0 |
|
Payments on Revolving Credit and Security Agreement (Note 8) |
|
| (5,000 | ) |
|
| 0 |
|
|
| 0 |
|
Proceeds from ASW credit facility (Note 8) |
|
| 8,795 |
|
|
| 9,756 |
|
|
| 0 |
|
Payments on ASW credit facility (Note 8) |
|
| (15,941 | ) |
|
| (11,217 | ) |
|
| 0 |
|
Net cash flows provided by (used in) financing activities |
|
| 9,649 |
|
|
| (8,876 | ) |
|
| (7,512 | ) |
Effect of exchange rate changes on cash and cash equivalents |
|
| 1,492 |
|
|
| (1,155 | ) |
|
| (670 | ) |
Net decrease in cash and cash equivalents |
|
| (17,879 | ) |
|
| (56,543 | ) |
|
| (1,976 | ) |
Cash and cash equivalents at beginning of year |
|
| 38,579 |
|
|
| 95,122 |
|
|
| 97,098 |
|
Cash and cash equivalents at end of year |
| $ | 20,700 |
|
| $ | 38,579 |
|
| $ | 95,122 |
|
Supplemental disclosures of cash flow information: |
|
|
|
|
|
|
|
|
|
|
|
|
Income tax payments |
| $ | 844 |
|
| $ | 4,404 |
|
| $ | 3,247 |
|
Interest payments |
|
| 1,283 |
|
|
| 957 |
|
|
| 225 |
|
Non-cash investing activities: |
|
|
|
|
|
|
|
|
|
|
|
|
Purchases of property, plant and equipment in accounts payable |
| $ | 1,068 |
|
| $ | 996 |
|
| $ | 329 |
|
Non-cash financing activities: |
|
|
|
|
|
|
|
|
|
|
|
|
Issuance of common stock to acquire net assets of Åkers (Note 2) |
| $ | 0 |
|
| $ | 22,137 |
|
| $ | 0 |
|
Issuance of debt to acquire net assets of Åkers (Note 2) |
|
| 0 |
|
|
| 22,619 |
|
|
| 0 |
|
See Notes to Consolidated Financial Statements.
NOTES TO CONSOLIDATED FINANCIAL STATEMENTS
(in thousands, except share and per share amounts)
Description of Business
Ampco-Pittsburgh Corporation and its subsidiaries (the “Corporation”) manufacture and sell highly engineered, high-performance specialty metal products and customized equipment utilized by industry throughout the world. It operates in two business segments, the Forged and Cast Engineered Products segment and the Air and Liquid Processing segment.
The Forged and Cast Engineered Products segment historically consisted of Union Electric Steel Corporation (“Union Electric Steel” or “UES”) and Union Electric Steel UK Limited (“UES-UK”). UES is a forged hardened steel roll producer headquartered in Carnegie, Pennsylvania, with three manufacturing facilities in Pennsylvania and one in Indiana. UES-UK is a cast roll producer located in Gateshead, England. In March 2016, UES acquired the stock of Åkers AB and certain of its affiliated companies, including Åkers AB’s 60% equity interest in a Chinese joint venture company (collectively, “Åkers”). Headquartered in Styckebruk, Sweden, Åkers has been a leader in the production of forged and cast rolls since 1806. Collectively doing business as Union Electric Åkers, this portion of the segment produces ingot and forged products and cast products that service a wide variety of industries globally. They specialize in the production of forged hardened steel rolls used mainly for cold rolling by manufacturers of steel, aluminum and other metals and cast rolls for hot and cold strip mills, medium/heavy section mills and plate mills in a variety of iron and steel qualities.
In addition, Union Electric Steel produces ingot and open-die forged products (“forged engineered products”) which are used in the oil and gassuppliers, industry, and the aluminum and plastic extrusion industries. In July 2015, UES acquired the assets of Alloys Unlimited & Processing, Inc. (“AUP”) and, in November 2016, the stock of ASW Steel Inc. (“ASW”). AUP is a supplier of specialty tool, alloy, and carbon steel round bar located in Ohio. ASW is a specialty steel producer based in Ontario, Canada. Both acquisitions support the Corporation’s diversification efforts in the open-die forging market.workforce.
The segment primarily competes with European, Asian and North and South American companies in both domestic and foreign markets and distributes a significant portion of its products through sales offices located throughout the world. The consolidated financial statements of the Corporation include the financial position and results of operations of the acquired companies from their respective dates of acquisition.
The Air and Liquid Processing segment includes Aerofin, Buffalo Air Handling and Buffalo Pumps, all divisions of Air & Liquid Systems Corporation (“Air & Liquid”), a wholly owned subsidiary of the Corporation. Aerofin produces custom-engineered finned tube heat exchange coils and related heat transfer products for a variety of industries including OEM/commercial, nuclear power generation and industrial process. Buffalo Air Handling produces large custom-designed air handling systems for institutional (e.g., hospital, university), pharmaceutical and general industrial building markets. Buffalo Pumps manufactures centrifugal pumps for the fossil fuel power generation, marine defense and industrial refrigeration industries. The segment has operations in Virginia and New York with headquarters in Carnegie, Pennsylvania. The segment distributes a significant portion of its products through a common independent group of sales offices located throughout the United States and Canada.
NOTE 1 – SUMMARY OF SIGNIFICANT ACCOUNTING POLICIES:
The Corporation’s accounting policies conform to accounting principles generally accepted in the United States of America. The preparation of financial statements in conformity with accounting principles generally accepted in the United States of America requires management to make estimates and assumptions that affect the reported amounts of assets and liabilities and disclosure of contingent assets and liabilities as of the date of the financial statements and the reported amounts of revenues and expenses during the reporting period. Significant items subject to estimates and assumptions include assessing the carrying value of long-lived assets, determining the fair value of assets acquired and liabilities assumed in a business combination (including intangibles and goodwill and the recoverability thereof), valuing the assets and obligations related to employee benefit plans, accounting for loss contingencies associated with claims and lawsuits, and accounting for income taxes. Actual results could differ from those estimates. A summary of the significant accounting policies followed by the Corporation is presented below.
Basis of Presentation
The financial information included herein reflects the consolidated financial position of the Corporation as of December 31, 2022 and 2021, and the consolidated results of its operations and cash flows for the years then ended.
31
Consolidation
The accompanying consolidated financial statements include the assets, liabilities, revenues, and expenses of all majority ownedmajority-owned subsidiaries and joint ventures over which the Corporation exercises control and, when applicable, entities for which the Corporation has a controlling financial interest or is the primary beneficiary. Investments in joint ventures where the Corporation owns 20%20% to 50%50% of the voting stock and has the ability to exercise significant influence over the operating and financial policies of the joint venture are accounted for using the equity method of accounting. Investments in joint ventures wherebywhere the Corporation does not have the ability to exercise significant influence over the operating and financial policies of the joint venture are accounted for using the
cost method of accounting. Investments in joint ventures are reviewed for impairment whenever events or circumstances indicate the carrying amount of the investment may not be recoverable. If the estimated fair value of the investment is less than the carrying amount and such decline is determined to be “other than temporary,” then the investment may not be fully recoverable, potentially resulting in a write-down of the investment value. Intercompany accounts and transactions are eliminated.
Cash and Cash Equivalents
Securities with purchased original maturities of three months or less are considered to be cash equivalents. The Corporation maintains cash and cash equivalents at various financial institutions which may exceed federally insuredfederally-insured amounts.
Inventories
Inventories
Inventories are valued at the lower of cost and net realizable value, which is defined as the estimated selling price in the ordinary course of business less reasonably predictable costs of completion, disposal and transportation. Cost includes the cost of raw materials, direct labor and overhead for those items manufactured but not yet sold or for which titlecontrol has not yet transferred.transferred to the customer. Fixed production overhead is allocated to inventories based on normal capacity of the production facilities. In periods of abnormally high production, the amount of fixed overhead allocated to each unit of production is decreased so that inventories are not measured above cost. The amount of fixed overhead allocated to inventories is not increased as a consequence of abnormally low production or plant idling. Costs for abnormal amounts of spoilage, handling costs and freight costs are charged to expense when incurred. Cost of domestic raw materials, work-in-process and finished goods inventories isare primarily determined by the first-in, first-out (“FIFO”) method. Prior to the fourth quarter of 2022, the last-in, first-out (LIFO) method. Cost(“LIFO”) method was used to determine the cost of significantly all the Corporation’s domestic suppliesinventories. Effective December 31, 2022, the Corporation elected to change its method of accounting for domestic inventories costed on the LIFO basis to the FIFO basis. Foreign inventories have historically been maintained on the FIFO basis. Prior period financial statements and foreign inventories is determined primarily byaffected financial information have been adjusted to reflect results and information, as if the first-in, first-out (FIFO) method.Corporation had always used the FIFO method of inventory valuation for domestic inventories.
Property, Plant and Equipment
Property, plant and equipment purchased new is recorded at cost with depreciation computed using the straight-line method over the following estimated useful lives: land improvements – 15 to 20 years, years; buildings – 25 to 50 years and years; machinery and equipment – 3 to 25 years; and other (e.g., furniture and fixtures and vehicles) – 5 to 10 years. Assets under finance leases are depreciated on a straight-line basis over the shorter of the estimated useful life of the asset or the lease term. Property, plant and equipment acquired as part of a business combination is recorded at its estimated fair value with depreciation computed using the straight-line method over the estimated remaining useful lives based in part on third-party valuations.lives. Expenditures that extend economic useful lives are capitalized. Routine maintenance is charged to expense. Gains or losses are recognized on retirements or disposals. Proceeds from government grants are recorded as a reduction in the purchase price of the underlying assets and amortized against depreciation over the lives of the related assets.
Property, plant and equipment areis reviewed for impairment at least annually, or whenever events or changes in circumstances indicate that the carrying amount of the asset may not be recoverable. If the undiscounted cash flows generated from the use and eventual disposition of the assets are less than their carrying value, then the asset value may not be fully recoverable, potentially resulting in a write-down of the asset value. Estimates of future cash flows are based on expected market conditions over the remaining useful life of the primary asset(s). In addition, the remaining depreciation period for the impaired asset would be reassessedre-assessed and, if necessary, revised. Proceeds
32
Right-of-Use Assets
A right-of-use (“ROU”) asset represents the right to use an underlying asset for the term of the lease, and the corresponding liability represents an obligation to make periodic payments arising from government grantsthe lease. A determination of whether an arrangement includes a lease is made at the inception of the arrangement. ROU assets and liabilities are recognized on the consolidated balance sheet, at the commencement date of the lease, in an amount equal to the present value of the lease payments over the term of the lease calculated using the interest rate implicit in the lease arrangement or, if not known, the Corporation’s incremental borrowing rate. The present value of a ROU asset also includes any lease payments made prior to commencement of the lease and excludes any lease incentives received or to be received under the arrangement. The lease term includes options to extend or terminate the lease when it is reasonably certain that such options will be exercised. Operating leases that have original terms of less than 12 months, inclusive of options to extend that are reasonably certain to be exercised, are classified as short-term leases and are not recognized on the consolidated balance sheet.
ROU assets are recorded as a reduction innoncurrent asset on the purchase price ofconsolidated balance sheet. The corresponding liabilities are recorded as an operating lease liability, either current or noncurrent, as applicable, on the underlying assets and amortized against depreciationconsolidated balance sheet. Operating lease costs are recognized on a straight-line basis over the liveslease term within costs of products sold (excluding depreciation and amortization) or selling and administrative expenses based on the use of the related assets.ROU asset.
Intangible Assets
Intangible assets primarily consist of developed technology, customer relationships and trade name. Intangible assets with definitefinite lives are amortized using the straight-line method over their estimated useful life, which is determined by identifying the period over which most of the cash flows are expected to be generated. Additionally, intangibleIntangible assets both definite andwith indefinite lived,lives are not amortized but reviewed for impairment at least annually, as of October 1, or1. Additionally, intangible assets, both finite- and indefinite-lived, are reviewed for impairment whenever events or changes in circumstances indicate the carrying amount of the asset may not be recoverable. IfFor finite-lived intangible assets, if the undiscounted cash flows attributable to the assets are less than their carrying value, then the asset value may not be fully recoverable, potentiallyresulting in a write-down of the asset value. For indefinite-lived intangible assets, if the discounted cash flows attributable to the assets are less than their carrying value, then the asset value may not be fully recoverable, resulting in a write-down of the asset value. Also, if the estimate of an intangible asset’s remaining useful life changes, the remaining carrying value of the intangible asset will be amortized prospectively over the revised remaining useful life.
Goodwill
Goodwill represents the consideration paid in a business combination in excess of the values assigned to the net assets of the acquired entity. Goodwill is not amortized but is tested for impairment at the reporting unit level annually, as of October 1, or whenever events or changes in circumstances indicate the carrying amount may not be recoverable. Goodwill is evaluated for impairment either qualitatively or quantitatively using a two-step approach. Under step one, the fair value of the reporting unit is determined using both a market and income approach. If the fair value of the reporting unit is less than the carrying value of the reporting unit, then goodwill may be impaired causing the second step of the analysis to be completed. Under step two, the fair value of the reporting is allocated to the assets and liabilities of the reporting unit. The unallocated fair value (“implied goodwill”), if any, is compared to the recorded value of goodwill. If the implied goodwill exceeds the recorded value of goodwill, then goodwill is deemed not to be impaired. If the
implied goodwill is less than the recorded value of goodwill, then goodwill is deemed to be impaired by the amount that goodwill exceeds implied goodwill. Estimating the fair value of a reporting unit requires the use of significant unobservable inputs, representative of a Level 3 fair value measurement, including market growth and market share, sales volumes and prices, costs to produce, discount rate and estimated capital needs. Management considers historical experience and all available information at the time the fair value of the reporting unit is estimated. Assumptions used to estimate future cash flows are subject to a high degree of judgment and complexity.
Debt Issuance Costs
Debt issuance costs are amortized as interest expense over the scheduled maturity period of the debt. The costs related to oura line-of-credit arrangement are amortized over the term of the arrangement, regardless of whether there are any outstanding borrowings. Unamortized debt issuance costs are either recognized as a direct deduction from the carrying amount of the related debt or, if related to a line-of-credit facility, as an other noncurrent asset on the consolidated balance sheet.
Product Warranty
A warranty that ensures basic functionality is an assurance-type warranty. A warranty that goes beyond ensuring basic functionality is considered a service-type warranty. The Corporation provides assurance-type warranties; it does not provide service-type warranties. Provisions for productassurance-type warranties are recognized at the time the underlying sale is recorded. The provision is based on historical experience as a percentage of sales adjusted for potential claims when a liability is probable and for known claims.
Employee Benefit Plans
Funded Status
If the fair value of the plan assets exceeds the projected benefit obligation, the over-funded projected benefit obligation is recognized as an asset (prepaid pensions) on the consolidated balance sheet. Conversely, if the projected benefit obligation exceeds the fair value of the plan assets, the under-funded projected benefit obligation is recognized as a liability (employee benefit obligations) on the consolidated balance sheet. Gains and losses arising from the difference between actuarial assumptions and actual experience and unamortized prior service costs are recorded as a separate component of accumulated other comprehensive loss.
33
Net Periodic Pension and Other Postretirement Benefit Costs
Net periodic pension and other postretirement benefit costs includesinclude service cost, interest cost, expected rate of return on the market-related value of plan assets, amortization of prior service costs, and recognized actuarial gains or losses. When actuarial gains or losses exceed 10%10% of the greater of the projected benefit obligation or the market-related value of plan assets, they are amortized to net periodic pension and other postretirement benefit costs over the average remaining service period of the employees expected to receive benefits under the plan or over the remaining life expectancy of the employees expected to receive benefits if “all or almost all” of the plan’s participants are inactive. When actuarial gains or losses are less than 10%10% of the greater of the projected benefit obligation or the market-related value of plan assets, they are included in net periodic pension and other postretirement benefit costs indirectly as a result of lower/higher interest costs arising from a decrease/increase in the projected benefit obligation. The market-related value of plan assets is determined using a five-year moving average which recognizes 20%gains or losses in the fair market value of unrealized gainsassets at the rate of 20% per year.
Warrants
Accounting for warrants includes an initial assessment of whether the warrants qualify as debt or equity. The Corporation’s warrants meet the definition of equity instruments and, losses each year.accordingly, are recorded within shareholders’ equity on the consolidated balance sheet. The fair value of the warrants is determined as of the measurement date. Incremental costs directly attributable to the offering of the securities are deferred and charged against the proceeds of the offering.
Other Comprehensive Income (Loss)
Other comprehensive income (loss) includes changes in assets and liabilities from non-owner sources including foreign currency translation adjustments, unamortized prior service costs and unrecognized actuarial gains and losses associated with employee benefit plans, unrealized holding gains and losses on securities designated as available for sale, and changes in the fair value of derivatives designated and effective as cash flow hedges.
Certain components of other comprehensive income (loss) are presented net of income tax. Foreign currency translation adjustments exclude the effect of income tax since earnings of non-U.S. subsidiaries are deemed to be reinvestedre-invested for an indefinite period of time.
Reclassification adjustments are amounts which are realized during the year and, accordingly, are deducted from other comprehensive income (loss) in the period in which they are included in net income (loss) or when a transaction no longer qualifies as a cash flow hedge. Foreign currency translation adjustments are included in net income (loss) upon sale or upon complete or substantially complete liquidation of an investment in a foreign entity. With respect to employee benefit plans, unamortized prior service costs are included in net income (loss), either immediately upon curtailment of the employee benefit plan or over the average remaining service period or life expectancy of the employees expected to receive benefits, and unrecognized actuarial gains and losses are included in net income (loss) indirectly as a result of lower/higher interest costs arising from a decrease/increase in the projected benefit obligation. Unrealized holding gains and losses on securities are included in net income (loss) when the underlying security is sold.
Changes in the fair value of derivatives are included in net income (loss) when the projected sale occurs or, if a foreign currency purchase contract, over the estimated useful life of the underlying asset.
Foreign Currency Translation
Assets and liabilities of the Corporation’s foreign operations are translated at year-end exchange rates, and the consolidated statements of operations are translated at the average exchange rates for the year. Gains or losses resulting from translating foreign currency financial statements are accumulated as a separate component of accumulated other comprehensive loss until the entity is sold or substantially liquidated.
Revenue Recognition
Revenue fromrecognition requires determination of the sales price, allocation of the sales price to each performance obligation, and satisfaction of each performance obligation. The sales price and performance obligations are outlined in a contract with a customer. A contract is recognizeddeemed to exist when there is persuasive evidence of an arrangement, exists, delivery has occurred,the rights and obligations of the parties are identified, the sales price is fixed or determinable,identifiable, payment terms are known, the contract has commercial substance, and collectability of consideration is reasonably assured. Persuasive evidence of an arrangement identifies the final understanding between the parties as to the specific nature and terms of the agreed-upon transaction that creates enforceable obligations. Itprobable. A contract can be in the form of an executed purchase order from the customer, combined with an order acknowledgment from the Corporation, a sales agreement issued byor a longer-term supply agreement between the customer and the Corporation, or a similar arrangement deemed to be a normal and customary business practice for that particular customer or class of customer.
34
Contracts are short-term in nature with the time between commencement of production to shipment being a few months. A contract could have a single performance obligation or multiple performance obligations for the manufacturing of product(s). For contracts with a single performance obligation, the obligation is satisfied upon transfer of control of the product to the customer. For contracts with multiple performance obligations, the Corporation accounts for individual performance obligations separately if they are distinct. The sales price is allocated to each performance obligation based on the relative standalone selling price of each performance obligation to the total consideration of the contract. The standalone selling price is determined utilizing observable prices to the extent available. If the performance obligations are not distinct and the standalone selling price is not directly observable, the standalone selling price is estimated maximizing the use of observable inputs.
The sales price required to be paid by the customer (collectively,is identifiable from the contract. It is not subject to refund or adjustment, except for a sales agreement).
Deliveryvariable-index surcharge provision which is known at the time of shipment and performanceincreases or decreases, as applicable, the selling price of the product for corresponding changes in the published index cost of certain raw materials and energy. The variable-index surcharge is considered to have occurredrecognized as revenue when the corresponding inventory is revenue recognized.
Likelihood of collectability is assessed prior to acceptance of an order and requires the use of judgment. It considers the customer's ability and intention to pay based on a variety of factors including the customer's historical payment experience. In certain circumstances, the Corporation may require a deposit from the customer, has taken titlea letter of credit or another form of assurance for payment. An allowance for doubtful accounts is maintained based on historical experience. Payment terms are standard to the industry and assumedgenerally require payment 30 days after control transfers to the risks and rewardscustomer.
Transfer of ownershipcontrol is assessed based on the terms of the product.contract. Transfer of control, and therefore revenue recognition, occurs when title, ownership and risk of loss pass to the customer. Typically, this occurs when the product is shipped to the customer (i.e., FOB shipping point), delivered to the customer (i.e., FOB destination), or, for foreign sales, in accordance with trading guidelines known as Incoterms. Incoterms are standard trade definitions used in international contracts and are developed, maintained and promoted by the ICC Commission on Commercial Law and Practice.
Certain customer contracts may include cancellation-for-convenience clauses that provide either (i) the customer with the right to acquire inventory while in-process or (ii) the Corporation with the right for reimbursement with an element of profit in the event the customer cancels. These cancellation-for-convenience clauses result in the recognition of revenue over time and prior to shipment. The sales price requiredamount of revenue and associated costs recognized at a reporting date is based on the costs incurred as of the reporting date in comparison to the estimated total costs to be paid byincurred, which the customerCorporation believes is fixeda faithful depiction of the transfer of control to the customer.
Shipping terms vary across the businesses and typically depend on the product, country of origin and type of transportation (truck or determinable from the sales agreement. It is not subject to refund or adjustment except for a variable-index surcharge provision which increases or decreases, as applicable, the selling price of a mill roll for corresponding changes in the published index cost of certain raw materials. The variable-index surcharge is recognized as revenue when the corresponding revenue for the inventory is recognized. Likelihood of collectability is assessed prior to acceptance of an order.vessel). There are no customer-acceptance provisions other than, perhaps, customer inspection and testing prior to shipment. Post-shipment obligations are insignificant.
Amounts billed to the customer for shipping and handling are recorded within net sales and the related costs are recorded within costs of products sold (excluding depreciation and amortization). Amounts billed for taxes assessed by various government authorities (e.g., sales tax, value-added tax, etc.) are excluded from the determination of net income (loss) and, instead, are recorded as a liability until remitted to the government authority.
Stock-Based Compensation
Stock-based compensation, such as stock options, restricted stock units and performance shares,share units, is recognized over the vesting period based uponon the fair value of the award at the date of grant. For stock options, the fair value is determined by the Black ScholesBlack-Scholes option pricing model and is expensed over the vesting period of three years.years. For restricted stock units, the fair value is equal to the closing price of the Corporation’s common stock on the New York Stock Exchange (“NYSE”) on the date of grant and is expensed over the vestingservice period, of typically three years.years. For performance share unit awards that vest subject to a performance condition, the fair value is equal to the closing price of the Corporation’s stock on the NYSE on the date of grant. For performance share unit awards that vest subject to a market condition, the fair value is determined using a Monte Carlo simulation model. The fair value of performance share unit awards is expensed over the performance period when it is probable that the performance condition will be achieved.
35
Asbestos-Related Costs
The amounts recorded for asbestos-related liabilities and insurance receivables for asbestos-related matters rely on assumptions that are based on currently known facts and strategies. Asbestos-related liabilities are recognized when a liability is probable of occurrence and can be reasonably estimated. The liability includes an estimate of future claims as well as settlement or indemnity costs that would be incurred to resolve both pending and future unasserted claims over the period which such claims can be reasonably estimated. Insurance receivables for asbestos-related matters are recognized for the estimated amount of probable insurance recoveries attributable to the claims for which an asbestos-related liability has been recognized, including the portion of incurred defense costs expected to be reimbursed. Neither the asbestos-related liabilities nor the insurance receivables for asbestos-related matters are discounted to their present values due to the inability to reliably forecast the timing of future cash flows. The asbestos-related liabilities and insurance receivables for asbestos-related matters, as well as the underlying assumptions, are reviewed on a regular basis to determine whether any adjustments to the estimates are required. If it is determined there is an increase in asbestos-related liabilities net of insurance recoveries, then a charge to net income (loss) would be recorded. Similarly, if it is determined there is a decrease in asbestos-related liabilities net of insurance recoveries, then a credit to net income (loss) would be recorded.
Derivative Instruments
Derivative instruments which include forward exchange (for foreign currency sales and purchases) and futures contracts are recorded on the consolidated balance sheet as either an asset or a liability measured at their fair value. The accounting for changes in the fair value of a derivative depends on the use of the derivative. To the extent that a derivative is designated and effective as a cash flow hedge of an exposure to future changes in value, the change in the fair value of the derivative is deferred in accumulated other comprehensive loss. Any portion considered to be ineffective, including that arising from the unlikelihood of an anticipated transaction to occur, is reported as a component of earnings (other income/expense) immediately.
Upon occurrence of the anticipated sale, the foreign currency sales contract designated and effective as a cash flow hedge is de-designated as a fair value hedge, and the change in fair value previously deferred in accumulated other comprehensive loss is
reclassified to earnings (net sales) with subsequent changes in fair value recorded as a component of earnings (other income/expense). Upon occurrence of the anticipated purchase, the foreign currency purchase contract is settled, and the change in fair value deferred in accumulated other comprehensive loss is reclassified to earnings (depreciation and amortization expense) over the life of the underlying assets.asset. Upon settlement of a futures contract, the change in fair value deferred in accumulated other comprehensive loss is reclassified to earnings (costs of products sold, excluding depreciation and amortization) when the corresponding inventory is sold and revenue is recognized. To the extent that a derivative is designated and effective as a hedge of an exposure to changes in fair value, the change in the derivative’s fair value will be offset in the consolidated statement of operations by the change in the fair value of the item being hedged and is recorded as a component of earnings (other income/expense). Cash flows associated with the derivative instruments are recorded as a component of operating activities on the consolidated statement of cash flows.
The Corporation does not enter into derivative transactions for speculative purposes and, therefore, holds no derivative instruments for trading purposes.
Fair Value
Fair value is defined as the price that would be received to sell an asset or paid to transfer a liability in an orderly transaction between market participants as of the measurement date. A hierarchy of inputs is used to determine fair value measurements with three levels. Level 1 inputs are quoted prices in active markets for identical assets or liabilities and are considered the most reliable evidence of fair value. Level 2 inputs are observable prices that are not quoted on active exchanges. Level 3 inputs are unobservable inputs used for measuring the fair value of assets or liabilities.
Legal Costs
Legal costs expected to be incurred in connection with loss contingencies are accrued when such costs are probable and estimable.
Income Taxes
On December 22, 2017, the U.S. federal government enacted the Tax Cuts and Jobs Act (the “Tax Reform”), to become effective January 1, 2018, which, among other things, imposed a one-time tax on deemed repatriated earnings of foreign subsidiaries. Accordingly, the tax impact of this deemed repatriation of previously untaxed foreign earnings was included within the U.S. taxable income for 2017, reducing the overall tax loss generated in the current year. Any future income earned in foreign subsidiaries will no longer be subject to U.S. tax under current U.S. law. Any remittance of future earnings to the U.S. will be subject to foreign withholding requirements; however, the Corporation estimates the impact of this would be insignificant.
Income taxes are recognized during the year in which transactions enter into the determination of financial statement income.income (loss). Any taxes on foreign income in excess of a deemed return on tangible assets of foreign corporations are accounted for as period costs. Deferred income tax assets and liabilities are recognized for the future tax consequences of temporary differences between the book carrying amount and the tax basis of assets and liabilities including net operating loss carryforwards. A valuation allowance is provided against a deferred income tax asset when it is “more likely than not” the asset will not be realized. Similarly, if a determination is made that it is “more likely than not” the deferred income tax asset will be realized, the related valuation allowance would be reduced and a benefit to earnings would be recorded. Penalties and interest are recognized as a component of the income tax provision.
36
Tax benefits are recognized in the consolidated financial statements for tax positions taken or expected to be taken in a tax return when it is “more likely than not” that the tax authorities will sustain the tax position solely on the basis of the position’s technical merits. Consideration is given primarily to legislation and statutes, legislative intent, regulations, rulings, and case law as well as their applicability to the facts and circumstances of the tax position when assessing the sustainability of the tax position. In the event a tax position no longer meets the “more likely than not” criteria, the tax benefit is reversed by recognizing a liability and recording a charge to earnings. Conversely, if a tax position subsequently meets the “more likely than not” criteria, a tax benefit would be recognized by reducing the liability and recording a credit to earnings.
Earnings Per Common Share
Basic earnings per common share is computed by dividing net income (loss) by the weighted averageweighted-average number of common shares outstanding for the period. The computation of diluted earnings per common share is similar to basic earnings per common share except that the denominator is increased to include the dilutive effect of the net additional common shares that would have been outstanding assuming exercise of outstanding stock awards and warrants, calculated using the treasury stock method. The computation of diluted earnings per share would not assume the exercise of an outstanding stock award or warrant if the effect on earnings per common share would be antidilutive. Similarly, the computation of diluted earnings per share would not assume the exercise of outstanding stock awards and warrants if the Corporation incurred a net loss since the effect on earnings per common share would be antidilutive. The weighted averageweighted-average number of
common shares outstanding assuming exercise of dilutive stock awards and warrants was 12,330,40119,444,083 for 2017, 11,951,1812022 and 19,696,397 for 2016 and 10,447,066 for 2015.2021. Weighted-average outstanding stock awards and warrants excluded from the diluted earnings per common share calculation, since the effect would have been antidilutive, were 1,013,0085,339,002 for 2017, 1,163,3962022 and 359,940 for 2016 and 1,138,287 for 2015.2021. With respect to amounts attributable to Ampco-Pittsburgh common shareholders, net income (loss) attributable to Ampco-Pittsburgh common shareholders excludes net income (loss) attributable to noncontrolling interest.
Recently ImplementedIssued Accounting Pronouncements
In January 2018,September 2016, the Financial Accounting Standards Board (“FASB”) issued ASU 2018-02, Income Statement2016-13, Financial Instruments – Reporting Comprehensive IncomeCredit Losses, which allows foradds a reclassification from accumulated other comprehensive income (loss) to retained earnings for the stranded tax effects resulting from the Tax Reform. A stranded tax effect is definednew impairment model, known as the difference in the tax effect of amounts recognized as other comprehensive income (loss) items, using the income tax rate in effect at the time of recognition and the newly enacted income tax rate. ASU 2018-02current expected credit loss (“CECL”) model, that is relevant only to the reclassification of the income tax effects of the Tax Reform; accordingly, the underlying guidance that requires that the effect of a change in tax laws or rates be included in income from continuing operations is not affected. The guidance becomes effective for interim and annual periods beginning after December 15, 2018; however, early adoption is permitted. The Corporation adoptedbased on expected losses rather than incurred losses. Under the new guidance, inan entity recognizes an allowance for its 2017 accountsestimate of expected credit losses at the initial recognition of an in-scope financial instrument and asapplies it to most debt instruments, trade receivables, lease receivables, financial guarantee contracts, and other loan commitments. The CECL model does not have a result, $6,088 was reclassified between accumulated other comprehensive lossminimum threshold for recognition of impairment losses and retained earnings.
In March 2016, the FASB issued ASU 2016-09, Improvementsentities will need to Employee Share-Based Payment Accounting, which requires all income tax effectsmeasure expected credit losses on assets that have a low risk of awards to be recognized in the income statement when the awards vest or are settled.loss. The guidance also requires presentation of excess tax benefits as an operating activity on the statement of cash flows rather than as a financing activity. The amended guidanceoriginally became effective for the Corporation on January 1, 2017, and did not have a significant impact on its financial position, operating results or liquidity.
In July 2015, the FASB issued ASU 2015-11, Simplifying the Measurement of Inventory, which revises the measurement of inventory at the lower of cost or market. In accordance with ASU 2015-11, an entity will measure inventory at the lower of cost and net realizable value, which is defined as the estimated selling price in the ordinary course of business less reasonably predictable costs of completion, disposal and transportation. The amendment does not apply to inventory that is measured using the last-in, first out (LIFO) method. The guidance became effective for2020; however, since the Corporation January 1, 2017, and did not havemeets the definition of a significant impact on its financial position, operating results or liquidity.
Recently Issued Accounting Pronouncements
In August 2017,Smaller Reporting Company, as defined by the FASB issued ASU 2017-12, Derivatives and Hedging, which amends and simplifies existing guidanceSecurities Exchange Commission, the effective date was subsequently revised to allow companies to more accurately present the economic effects of risk management activities in the financial statements. The amended guidance will be effective for interim and annual periodsfiscal years beginning after December 15, 2018; however, early adoption is permitted.2022. The Corporation is currently evaluating the impact the guidance will have on its financial position and operating results. It will not, however, affect the Corporation’s liquidity.
In May 2017, the FASB issued ASU 2017-09, Scope of Modification Accounting, which provides guidance about which changes to the terms and conditions of a share-based payment award require an entity to apply modification accounting. The amendment will be applied prospectively to an award modified on or after the adoption date. The amended guidance will be effective for interim and annual periods beginning after December 15, 2017. The guidance will not affect the Corporation’s financial position, operating results and liquidity as of the date of adoption.
In March 2017, the FASB issued ASU 2017-07, Improving the Presentation of Net Periodic Pension Cost and Net Periodic Postretirement Benefit Cost, which requires an employer who offers defined benefit and postretirement benefit plans to report the service cost component of net periodic benefit cost in the same line item or items as other compensation costs arising from services rendered by employees during the period. The other components of net periodic benefit cost are required to be presented in the income statement separately from the service cost component and outside the subtotal of income from operations. The amendment also allows only for the service cost component of net periodic benefit cost to be eligible for capitalization when applicable. The amended guidance does not change the amount of net periodic benefit cost to be recognized, only where it is to be recognized in the income statement. The amended guidance becomes effective for interim and annual periods beginning after December 15, 2017, and must be applied retrospectively for the presentation of the service cost component and the other components of net periodic pension and other postretirement costs in the income statement and prospectively for capitalization of the service cost component of net periodic benefit cost in inventory. A practical expedient is available permitting employers to use the amounts disclosednearly complete in its pensionassessment of ASU 2016-13 and other postretirement benefit plan footnote (Note 9) as the estimateestimates its impact to apply retrospectively. The guidance will not affect the Corporation’s financial position or liquidity.
In August 2016, the FASB issued ASU 2016-15, Classification of Certain Cash Receipts and Cash Payments, which clarifies guidance on the classification of certain cash receipts and payments in the statement of cash flows. The amended guidance will be
effective for interim and annual periods beginning after December 15, 2017. The guidance will not have a significant impact on the presentation of the Corporation’s cash flow statement, and it will not affect its financial position, operating results or liquidity.
In May 2016, April 2016, March 2016 and May 2014, the FASB issued ASUs 2016-12, 2016-10, 2016-08 and 2014-09, respectively, Revenue from Contracts with Customers (Topic 606), which provides a common revenue standard for U.S. GAAP and IFRS. The guidance establishes principles for reporting information about the nature, amount, timing and uncertainty of revenue and cash flows arising from a company’s contracts with customers. It requires companiesapproximate $500 to apply a five-step model when recognizing revenue relating to the transfer of goods or services to customers in an amount that reflects the consideration that the company expects to be entitled to receive for those goods and services. It also requires comprehensive disclosures regarding revenue recognition. The guidance becomes effective for interim and annual periods beginning after December 15, 2017, and can be implemented on either a full or modified retrospective basis. The Corporation will use the modified retrospective method (a cumulative adjustment to its January 1, 2018 retained earnings). Based on the evaluation of its current contracts and revenue streams, the Corporation determined they will be recorded consistently under both existing generally accepted accounting principles and the new standard. Accordingly, the new guidance will not have a material effect on the Corporation’s financial position, operating results or liquidity. The Corporation’s disclosures, however, will change significantly in response to the requirements of the new guidance.
In February 2016, the FASB issued ASU 2016-02, Leases (Topic 842)$1,000, which requires lessees to recognize assets and liabilities on the balance sheet for the rights and obligations created by all leases with a term of more than one year. Accounting by lessors will remain similar to existing generally accepted accounting principles. The guidance becomes effective for the Corporation January 1, 2019. The Corporation is currently evaluating the impact the guidance will have on its financial position, operating results and liquidity.
In January 2016, the FASB issued ASU 2016-01, Recognition and Measurement of Financial Assets and Liabilities, which simplifies the accounting and disclosures related to equity investments. ASU 2016-01 will require entities to carry certain investments in equity securities at fair value with changes in fair value recorded through net income (loss) versus other comprehensive income (loss). ASU 2016-01 does not apply to investments that qualify for the equity method of accounting or to those that result in consolidation of the investee. The guidance becomes effective for interim and annual periods beginning after December 15, 2017, and must be adopted by means of a cumulative-effect adjustment to retained earnings as of the beginning of the fiscal year of adoption. At December 31, 2017, unrealized holding gains on securities approximated $600 which will be recorded as the cumulative-effectan adjustment to opening retained earnings. Prospectively,earnings as of January 1, 2023.
NOTE 2 - CHANGE IN METHOD OF ACCOUNTING FOR INVENTORY VALUATION
Effective December 31, 2022, the guidanceCorporation changed its method of accounting for the cost of its domestic inventories from the LIFO method to the FIFO method. At December 31, 2021, approximately 35% of the Corporation's inventories were accounted for using the LIFO method and, at December 31, 2022, approximately 41% of the Corporation's inventories would have been accounted for using the LIFO method had the Corporation not changed.
The Corporation believes the change to the FIFO method of inventory valuation is not expected to havepreferable as it provides a significant effect onbetter matching of costs with the physical flow of goods, standardizes the Corporation’s financial position, operating resultsinventory valuation methodology among the locations, and liquidity. improves comparability with industry peers.
NOTE 2 – ACQUISITIONS:
Acquisition of Åkers
On March 3, 2016,A change from the LIFO method to the FIFO method is considered a change in accounting principle requiring all prior periods to be restated as if the Corporation acquired 100%had used the FIFO method to value its domestic inventories for those periods and with a cumulative adjustment recorded to retained deficit, net of tax, of the voting equity interestearliest year presented (i.e., January 1, 2021). The cumulative impact decreased the Corporation's consolidated retained deficit on January 1, 2021, net of Åkers from Altor Fund II GP Limited. The purchase price approximated $74,155 and was comprised of $29,399 in cash, $22,619 intax, by $11,494. There is no significant change to the form of three-year promissory notes (Note 8), and 1,776,604 shares of common stock ofCorporation's deferred income tax assets due to the Corporation which, based onhaving a valuation allowance recorded against those deferred income tax assets (See Note 21).
37
The following tables present the closing price of the Corporation’s common stockconsolidated financial statement line items as of the date of closing, had a fair value of $22,137.
The acquisition added roll production facilities in Sweden, the United States, Slovenia, and China; and a number of sales offices. It enabled cast roll production in the United States, forged roll production in Europe, and a low-cost product alternative for customers.
Operating results of the acquired entities are included in the Forged and Cast Engineered Products segment from the date of acquisition. For the ten months ended December 31, 2016, net sales for Åkers approximated $121,079 and loss before income taxes, including the effects of purchase accounting, approximated $10,130.
The fair value of assets acquired and liabilities assumed as of the date of acquisition is as follows:
Current assets (excluding inventories) |
| $ | 41,703 |
|
Inventories |
|
| 30,332 |
|
Property, plant and equipment |
|
| 71,871 |
|
Intangible assets |
|
| 11,784 |
|
Other noncurrent assets |
|
| 8,068 |
|
Current liabilities |
|
| (71,690 | ) |
Noncurrent liabilities |
|
| (43,153 | ) |
Net assets acquired |
|
| 48,915 |
|
Noncontrolling interest |
|
| (2,019 | ) |
Goodwill |
|
| 27,259 |
|
Base purchase price |
| $ | 74,155 |
|
Goodwill is not amortized but is tested for impairment at the reporting unit level annually, as of October 1, or whenever events or changes in circumstances indicate the carrying amount may not be recoverable. Based on the first step of the two-step quantitative goodwill impairment test performed as of October 1, 2016, the Corporation determined that the carrying value of the Forged and Cast Engineered Products reporting unit was greater than its estimated fair value, and the second step of the two-step quantitative goodwill impairment test was performed to determine the amount of the impairment charge.
As a result of the second step evaluation, the Corporation determined that the goodwill reported in the Forged and Cast Engineered Products reporting unit was fully impaired, primarily due to depressed market conditions and limitations inherent in its current market capitalization, and, accordingly, recorded a goodwill impairment charge of $26,261 for the year ended December 31, 2016. The goodwill impairment charge represents a full impairment and differs2022, as if the Corporation had not changed its method of accounting for its domestic inventories from the amount recognizedLIFO method to the FIFO method:
Consolidated Statement of Operations
|
| Year Ended December 31, 2022 |
| |||||||||
|
| As reported - FIFO |
|
| Effect of Change |
|
| If adjusted - LIFO |
| |||
Costs of products sold (excluding depreciation and amortization) |
| $ | 327,996 |
|
| $ | 2,763 |
|
| $ | 330,759 |
|
Total operating costs and expenses |
|
| 387,411 |
|
|
| 2,763 |
|
|
| 390,174 |
|
Income from operations |
|
| 2,778 |
|
|
| (2,763 | ) |
|
| 15 |
|
Income before income taxes |
|
| 5,556 |
|
|
| (2,763 | ) |
|
| 2,793 |
|
Net income |
|
| 3,980 |
|
|
| (2,763 | ) |
|
| 1,217 |
|
Net income attributable to Ampco-Pittsburgh |
|
| 3,416 |
|
|
| (2,763 | ) |
|
| 653 |
|
Net income per basic share attributable to Ampco-Pittsburgh common shareholders |
| $ | 0.18 |
|
|
| (0.14 | ) |
| $ | 0.04 |
|
Net income per diluted share attributable to Ampco-Pittsburgh common shareholders |
| $ | 0.18 |
|
|
| (0.14 | ) |
| $ | 0.04 |
|
Consolidated Balance Sheet
|
| As of December 31, 2022 |
| |||||||||
|
| As reported - FIFO |
|
| Effect of Change |
|
| If adjusted - LIFO |
| |||
Inventories |
| $ | 121,739 |
|
| $ | (23,282 | ) |
| $ | 98,457 |
|
Total current assets |
|
| 231,408 |
|
|
| (23,282 | ) |
|
| 208,126 |
|
Deferred income tax assets |
|
| 2,141 |
|
|
| 191 |
|
|
| 2,332 |
|
Total assets |
|
| 502,774 |
|
|
| (23,091 | ) |
|
| 479,683 |
|
Retained deficit |
|
| (32,322 | ) |
|
| (23,091 | ) |
|
| (55,413 | ) |
Total liabilities and shareholders' equity |
|
| 502,774 |
|
|
| (23,091 | ) |
|
| 479,683 |
|
Consolidated Statement of Cash Flows
|
| Year Ended December 31, 2022 |
| |||||||||
|
| As reported - FIFO |
|
| Effect of Change |
|
| If adjusted - LIFO |
| |||
Net income |
| $ | 3,980 |
|
| $ | (2,763 | ) |
| $ | 1,217 |
|
Non-cash provisions - net |
| $ | (2,215 | ) |
| $ | 893 |
|
|
| (1,322 | ) |
Changes in assets/liabilities: |
|
|
|
|
|
|
|
|
| |||
Inventories |
|
| (17,903 | ) |
|
| 1,870 |
|
|
| (16,033 | ) |
The following tables present the consolidated financial statement line items affected as of and for the acquisitionyear ended December 31, 2021, as a result of the Corporation changing its method of accounting for its domestic inventories from the LIFO method to the FIFO method.
Consolidated Statement of Operations
|
| Year Ended December 31, 2021 |
| |||||||||
|
| As originally reported - LIFO |
|
| Effect of Change |
|
| As adjusted - FIFO |
| |||
Costs of products sold (excluding depreciation and amortization) |
| $ | 287,639 |
|
| $ | (8,834 | ) |
| $ | 278,805 |
|
Total operating costs and expenses |
|
| 358,536 |
|
|
| (8,834 | ) |
|
| 349,702 |
|
Loss from operations |
|
| (13,616 | ) |
|
| 8,834 |
|
|
| (4,782 | ) |
Loss before income taxes |
|
| (9,829 | ) |
|
| 8,834 |
|
|
| (995 | ) |
Net loss |
|
| (12,134 | ) |
|
| 8,834 |
|
|
| (3,300 | ) |
Net loss attributable to Ampco-Pittsburgh |
|
| (12,695 | ) |
|
| 8,834 |
|
|
| (3,861 | ) |
Net loss per basic share attributable to Ampco-Pittsburgh common shareholders |
| $ | (0.67 | ) |
|
| 0.47 |
|
| $ | (0.20 | ) |
Net loss per diluted share attributable to Ampco-Pittsburgh common shareholders |
| $ | (0.67 | ) |
|
| 0.47 |
|
| $ | (0.20 | ) |
Consolidated Balance Sheet
|
| As of December 31, 2021 |
| |||||||||
|
| As originally reported - LIFO |
|
| Effect of Change |
|
| As adjusted - FIFO |
| |||
Inventories |
| $ | 88,198 |
|
| $ | 20,519 |
|
| $ | 108,717 |
|
Total current assets |
|
| 188,297 |
|
|
| 20,519 |
|
|
| 208,816 |
|
Deferred tax assets |
|
| 2,176 |
|
|
| (191 | ) |
|
| 1,985 |
|
Total assets |
|
| 485,632 |
|
|
| 20,328 |
|
|
| 505,960 |
|
Retained deficit |
|
| (56,066 | ) |
|
| 20,328 |
|
|
| (35,738 | ) |
Total liabilities and shareholders' equity |
|
| 485,632 |
|
|
| 20,328 |
|
|
| 505,960 |
|
38
Consolidated Statement of Cash Flows
|
| Year Ended December 31, 2021 |
| |||||||||
|
| As originally reported - LIFO |
|
| Effect of Change |
|
| As adjusted - FIFO |
| |||
Net loss |
| $ | (12,134 | ) |
| $ | 8,834 |
|
| $ | (3,300 | ) |
Non-cash provisions - net |
| $ | 1,809 |
|
| $ | 384 |
|
| $ | 2,193 |
|
Changes in assets/liabilities: |
|
|
|
|
|
|
|
|
| |||
Inventories |
|
| (18,400 | ) |
|
| (9,218 | ) |
|
| (27,618 | ) |
The following tables present the unaudited interim consolidated financial statement line items affected for 2022 and 2021, as a result of the Corporation changing its method of accounting for its domestic inventories from the LIFO method to the FIFO method.
Unaudited Condensed Consolidated Statements of Operations
|
| Three Months Ended March 31, 2022 |
|
| Three Months Ended March 31, 2021 |
| ||||||||||||||||||
|
| As originally reported - LIFO |
|
| Effect of Change |
|
| As adjusted - FIFO |
|
| As originally reported - LIFO |
|
| Effect of Change |
|
| As adjusted - FIFO |
| ||||||
Costs of products sold (excluding depreciation and amortization) |
| $ | 78,820 |
|
| $ | 1,696 |
|
| $ | 80,516 |
|
| $ | 69,588 |
|
| $ | 432 |
|
| $ | 70,020 |
|
Total operating costs and expenses |
|
| 93,183 |
|
|
| 1,696 |
|
|
| 94,879 |
|
|
| 85,893 |
|
|
| 432 |
|
|
| 86,325 |
|
Income (loss) from operations |
|
| 1,243 |
|
|
| (1,696 | ) |
|
| (453 | ) |
|
| 907 |
|
|
| (432 | ) |
|
| 475 |
|
Income (loss) before income taxes |
|
| 1,665 |
|
|
| (1,696 | ) |
|
| (31 | ) |
|
| 695 |
|
|
| (432 | ) |
|
| 263 |
|
Net income (loss) |
|
| 1,609 |
|
|
| (1,696 | ) |
|
| (87 | ) |
|
| 314 |
|
|
| (432 | ) |
|
| (118 | ) |
Net income (loss) attributable to Ampco-Pittsburgh |
|
| 1,645 |
|
|
| (1,696 | ) |
|
| (51 | ) |
|
| 167 |
|
|
| (432 | ) |
|
| (265 | ) |
Net income (loss) per basic share attributable to Ampco-Pittsburgh common shareholders |
| $ | 0.09 |
|
|
| (0.09 | ) |
| $ | (0.00 | ) |
| $ | 0.01 |
|
|
| (0.02 | ) |
| $ | (0.01 | ) |
Net income (loss) per diluted share attributable to Ampco-Pittsburgh common shareholders |
| $ | 0.08 |
|
|
| (0.08 | ) |
| $ | (0.00 | ) |
| $ | 0.01 |
|
|
| (0.02 | ) |
| $ | (0.01 | ) |
|
| Three Months Ended June 30, 2022 |
|
| Three Months Ended June 30, 2021 |
| ||||||||||||||||||
|
| As originally reported - LIFO |
|
| Effect of Change |
|
| As adjusted - FIFO |
|
| As originally reported - LIFO |
|
| Effect of Change |
|
| As adjusted - FIFO |
| ||||||
Costs of products sold (excluding depreciation and amortization) |
| $ | 87,487 |
|
| $ | (2,404 | ) |
| $ | 85,083 |
|
| $ | 75,433 |
|
| $ | (2,391 | ) |
| $ | 73,042 |
|
Total operating costs and expenses |
|
| 102,902 |
|
|
| (2,404 | ) |
|
| 100,498 |
|
|
| 91,959 |
|
|
| (2,391 | ) |
|
| 89,568 |
|
(Loss) income from operations |
|
| (320 | ) |
|
| 2,404 |
|
|
| 2,084 |
|
|
| 469 |
|
|
| 2,391 |
|
|
| 2,860 |
|
Income before income taxes |
|
| 911 |
|
|
| 2,404 |
|
|
| 3,315 |
|
|
| 2,596 |
|
|
| 2,391 |
|
|
| 4,987 |
|
Net income |
|
| 522 |
|
|
| 2,404 |
|
|
| 2,926 |
|
|
| 1,224 |
|
|
| 2,391 |
|
|
| 3,615 |
|
Net income attributable to Ampco-Pittsburgh |
|
| 403 |
|
|
| 2,404 |
|
|
| 2,807 |
|
|
| 1,063 |
|
|
| 2,391 |
|
|
| 3,454 |
|
Net income per basic share attributable to Ampco-Pittsburgh common shareholders |
| $ | 0.02 |
|
|
| 0.13 |
|
| $ | 0.15 |
|
| $ | 0.06 |
|
|
| 0.12 |
|
| $ | 0.18 |
|
Net income per diluted share attributable to Ampco-Pittsburgh common shareholders |
| $ | 0.02 |
|
|
| 0.12 |
|
| $ | 0.14 |
|
| $ | 0.05 |
|
|
| 0.11 |
|
| $ | 0.16 |
|
|
|
|
|
|
|
|
|
|
|
|
|
|
|
|
|
|
|
| ||||||
|
| Six Months Ended June 30, 2022 |
|
| Six Months Ended June 30, 2021 |
| ||||||||||||||||||
|
| As originally reported - LIFO |
|
| Effect of Change |
|
| As adjusted - FIFO |
|
| As originally reported - LIFO |
|
| Effect of Change |
|
| As adjusted - FIFO |
| ||||||
Costs of products sold (excluding depreciation and amortization) |
| $ | 166,307 |
|
| $ | (708 | ) |
| $ | 165,599 |
|
| $ | 145,021 |
|
| $ | (1,959 | ) |
| $ | 143,062 |
|
Total operating costs and expenses |
|
| 196,085 |
|
|
| (708 | ) |
|
| 195,377 |
|
|
| 177,852 |
|
|
| (1,959 | ) |
|
| 175,893 |
|
Income from operations |
|
| 923 |
|
|
| 708 |
|
|
| 1,631 |
|
|
| 1,376 |
|
|
| 1,959 |
|
|
| 3,335 |
|
Income before income taxes |
|
| 2,576 |
|
|
| 708 |
|
|
| 3,284 |
|
|
| 3,291 |
|
|
| 1,959 |
|
|
| 5,250 |
|
Net income |
|
| 2,131 |
|
|
| 708 |
|
|
| 2,839 |
|
|
| 1,538 |
|
|
| 1,959 |
|
|
| 3,497 |
|
Net income attributable to Ampco-Pittsburgh |
|
| 2,048 |
|
|
| 708 |
|
|
| 2,756 |
|
|
| 1,230 |
|
|
| 1,959 |
|
|
| 3,189 |
|
Net income per basic share attributable to Ampco-Pittsburgh common shareholders |
| $ | 0.11 |
|
|
| 0.03 |
|
| $ | 0.14 |
|
| $ | 0.07 |
|
|
| 0.10 |
|
| $ | 0.17 |
|
Net income per diluted share attributable to Ampco-Pittsburgh common shareholders |
| $ | 0.11 |
|
|
| 0.03 |
|
| $ | 0.14 |
|
| $ | 0.06 |
|
|
| 0.09 |
|
| $ | 0.15 |
|
39
|
| Three Months Ended September 30, 2022 |
|
| Three Months Ended September 30, 2021 |
| ||||||||||||||||||
|
| As originally reported - LIFO |
|
| Effect of Change |
|
| As adjusted - FIFO |
|
| As originally reported - LIFO |
|
| Effect of Change |
|
| As adjusted - FIFO |
| ||||||
Costs of products sold (excluding depreciation and amortization) |
| $ | 84,378 |
|
| $ | (277 | ) |
| $ | 84,101 |
|
| $ | 67,990 |
|
| $ | (1,979 | ) |
| $ | 66,011 |
|
Total operating costs and expenses |
|
| 99,721 |
|
|
| (277 | ) |
|
| 99,444 |
|
|
| 83,546 |
|
|
| (1,979 | ) |
|
| 81,567 |
|
(Loss) income from operations |
|
| (74 | ) |
|
| 277 |
|
|
| 203 |
|
|
| (2,361 | ) |
|
| 1,979 |
|
|
| (382 | ) |
Income (loss) before income taxes |
|
| 2,121 |
|
|
| 277 |
|
|
| 2,398 |
|
|
| (1,175 | ) |
|
| 1,979 |
|
|
| 804 |
|
Net income (loss) |
|
| 1,134 |
|
|
| 277 |
|
|
| 1,411 |
|
|
| (1,466 | ) |
|
| 1,979 |
|
|
| 513 |
|
Net income (loss) attributable to Ampco-Pittsburgh |
|
| 846 |
|
|
| 277 |
|
|
| 1,123 |
|
|
| (1,589 | ) |
|
| 1,979 |
|
|
| 390 |
|
Net income (loss) per basic share attributable to Ampco-Pittsburgh common shareholders |
| $ | 0.04 |
|
|
| 0.02 |
|
| $ | 0.06 |
|
| $ | (0.08 | ) |
|
| 0.10 |
|
| $ | 0.02 |
|
Net income (loss) per diluted share attributable to Ampco-Pittsburgh common shareholders |
| $ | 0.04 |
|
|
| 0.02 |
|
| $ | 0.06 |
|
| $ | (0.08 | ) |
|
| 0.10 |
|
| $ | 0.02 |
|
|
|
|
|
|
|
|
|
|
|
|
|
|
|
|
|
|
|
| ||||||
|
| Nine Months Ended September 30, 2022 |
|
| Nine Months Ended September 30, 2021 |
| ||||||||||||||||||
|
| As originally reported - LIFO |
|
| Effect of Change |
|
| As adjusted - FIFO |
|
| As originally reported - LIFO |
|
| Effect of Change |
|
| As adjusted - FIFO |
| ||||||
Costs of products sold (excluding depreciation and amortization) |
| $ | 250,685 |
|
| $ | (985 | ) |
| $ | 249,700 |
|
| $ | 213,011 |
|
| $ | (3,938 | ) |
| $ | 209,073 |
|
Total operating costs and expenses |
|
| 295,806 |
|
|
| (985 | ) |
|
| 294,821 |
|
|
| 261,398 |
|
|
| (3,938 | ) |
|
| 257,460 |
|
Income (loss) from operations |
|
| 849 |
|
|
| 985 |
|
|
| 1,834 |
|
|
| (985 | ) |
|
| 3,938 |
|
|
| 2,953 |
|
Income before income taxes |
|
| 4,697 |
|
|
| 985 |
|
|
| 5,682 |
|
|
| 2,116 |
|
|
| 3,938 |
|
|
| 6,054 |
|
Net income |
|
| 3,265 |
|
|
| 985 |
|
|
| 4,250 |
|
|
| 72 |
|
|
| 3,938 |
|
|
| 4,010 |
|
Net income (loss) attributable to Ampco-Pittsburgh |
|
| 2,894 |
|
|
| 985 |
|
|
| 3,879 |
|
|
| (359 | ) |
|
| 3,938 |
|
|
| 3,579 |
|
Net income (loss) per basic share attributable to Ampco-Pittsburgh common shareholders |
| $ | 0.15 |
|
|
| 0.05 |
|
| $ | 0.20 |
|
| $ | (0.02 | ) |
|
| 0.21 |
|
| $ | 0.19 |
|
Net income (loss) per diluted share attributable to Ampco-Pittsburgh common shareholders |
| $ | 0.15 |
|
|
| 0.05 |
|
| $ | 0.20 |
|
| $ | (0.02 | ) |
|
| 0.20 |
|
| $ | 0.18 |
|
40
NOTE 3 – INVENTORIES:
Inventories as of December 31, 2022 and 2021 were comprised of the following:
|
| 2022 |
|
| 2021 |
| ||
Raw materials |
| $ | 42,736 |
|
| $ | 28,841 |
|
Work-in-progress |
|
| 48,809 |
|
|
| 47,069 |
|
Finished goods |
|
| 23,231 |
|
|
| 22,481 |
|
Supplies |
|
| 6,963 |
|
|
| 10,326 |
|
Inventories |
| $ | 121,739 |
|
| $ | 108,717 |
|
NOTE 4 – PROPERTY, PLANT AND EQUIPMENT:
Property, plant and equipment as of December 31, 2022 and 2021 was comprised of the following:
|
| 2022 |
|
| 2021 |
| ||
Land and land improvements |
| $ | 9,887 |
|
| $ | 10,377 |
|
Buildings |
|
| 62,102 |
|
|
| 63,166 |
|
Machinery and equipment |
|
| 339,134 |
|
|
| 345,118 |
|
Construction-in-process |
|
| 16,005 |
|
|
| 11,019 |
|
Other |
|
| 6,706 |
|
|
| 6,798 |
|
|
|
| 433,834 |
|
|
| 436,478 |
|
Accumulated depreciation |
|
| (278,836 | ) |
|
| (277,915 | ) |
Property, plant and equipment, net |
| $ | 154,998 |
|
| $ | 158,563 |
|
The land and building of Union Electric Steel UK Limited, an indirect subsidiary of the Corporation (“UES-UK”), equal to approximately $2,565 (£2,122) at December 31, 2022, are held as collateral by the trustees of the UES-UK defined benefit pension plan (see Note 11). Machinery and equipment purchased with proceeds from the equipment financing facility (see Note 9), equal to $6,388 at December 31, 2022, are included in construction-in-process and pledged as collateral for the facility. The remaining assets, other than real property, are pledged as collateral for the Corporation’s revolving credit facility (see Note 9).
Certain land and land improvements and buildings were included in the sale and leaseback financing transactions (see Note 9). Title to these assets lie with the lender; however, since the transactions qualified as financing transactions, versus sales, the assets remain recorded on the Corporation’s consolidated balance sheet.
The gross value of assets under finance leases and the related accumulated amortization approximated $3,917 and $1,577 as of December 31, 2022, respectively, and $3,882 and $1,263 as of December 31, 2021, respectively. Depreciation expense approximated $17,040 and $17,336, including depreciation of assets under finance leases of approximately $496 and $473, for the years ended December 31, 2022 and 2021, respectively.
The potential significant change brought about by the Russia-Ukraine conflict resulting in the European energy crisis was deemed to be a triggering event under ASC 360, Property, Plant and Equipment, causing the Corporation to evaluate whether the property, plant and equipment of an asset group within the FCEP segment was deemed to be impaired. Accordingly, in connection with preparation of its 2023 business plan in the fourth quarter of 2022, the Corporation completed a quantitative analysis of the long-lived assets for the asset group and determined the assets were not impaired. The Corporation continues to evaluate the uncertainty associated with the Russia-Ukraine conflict and, at December 31, 2022, there were no additional triggering events identified. Additionally, there have been no triggering events for the asset groups within the ALP segment.
NOTE 5 – OPERATING LEASE RIGHT-OF-USE ASSETS:
The Corporation leases certain factory and office space and equipment. Additionally, the manufacturing facilities of one of the Corporation’s cast roll joint ventures in China are located on land leased by the joint venture from the other partner. The land lease commenced in 2007, the date the joint venture was formed, and continues through 2054, the expected end date of the joint venture,
41
and includes variable lease payment provisions based on the land standard price prevailing in Taiyuan, China, where the joint venture is located.
Right-of-use assets associated with operating leases as of December 31, 2022 and 2021 were comprised of the following:
|
| 2022 |
|
| 2021 |
| ||
Land |
| $ | 2,729 |
|
| $ | 2,928 |
|
Buildings |
|
| 1,945 |
|
|
| 1,953 |
|
Machinery and equipment |
|
| 690 |
|
|
| 511 |
|
Other |
|
| 367 |
|
|
| 429 |
|
|
|
| 5,731 |
|
|
| 5,821 |
|
Accumulated amortization |
|
| (2,209 | ) |
|
| (1,765 | ) |
Operating lease right-of-use assets, net |
| $ | 3,522 |
|
| $ | 4,056 |
|
NOTE 6 – INTANGIBLE ASSETS:
Intangible assets as of December 31, 2022 and 2021 were comprised of the following:
|
| 2022 |
|
| 2021 |
| ||
Customer relationships |
| $ | 5,375 |
|
| $ | 5,850 |
|
Developed technology |
|
| 3,847 |
|
|
| 4,201 |
|
Trade name |
|
| 2,167 |
|
|
| 2,442 |
|
|
|
| 11,389 |
|
|
| 12,493 |
|
Accumulated amortization |
|
| (6,195 | ) |
|
| (6,289 | ) |
Intangible assets, net |
| $ | 5,194 |
|
| $ | 6,204 |
|
The trade name is an indefinite-lived asset and, accordingly, is not subject to amortization. The fluctuation between the years is due to changes in foreign currency exchange rates usedrates. The following summarizes changes in intangible assets for the years ended December 31:
|
| 2022 |
|
| 2021 |
| ||
Balance at the beginning of the year |
| $ | 6,204 |
|
| $ | 7,217 |
|
Amortization of intangible assets |
|
| (368 | ) |
|
| (541 | ) |
Other, primarily impact from changes in foreign currency exchange rates |
|
| (642 | ) |
|
| (472 | ) |
Balance at the end of the year |
| $ | 5,194 |
|
| $ | 6,204 |
|
Identifiable intangible assets are reviewed for impairment whenever events or circumstances indicate that the carrying values may not be recoverable. The potential significant change brought about by the Russia-Ukraine conflict resulting in the European energy crisis was deemed to translate goodwill from the entities’ local currency to the U.S. dollar.
Acquisition of ASW
On November 1, 2016,be a triggering event causing the Corporation acquired 100%to evaluate whether the identifiable intangible assets of an asset group within the FCEP segment were deemed to be impaired. Accordingly, in connection with preparation of its 2023 business plan in the fourth quarter of 2022, the Corporation completed a quantitative analysis of the voting equity interest of ASW, a specialty steel producer, from CK Pearl Fund, Ltd., CK Pearl Fund L.P.identifiable intangible assets for the asset group and White Oak Strategic Master Fund, L.P.determined the assets were not impaired. The Corporation continues to support its diversification efforts inevaluate the open-die forging market. The purchase price of $13,116 consisted of $3,500 in cashuncertainty associated with the Russia-Ukraine conflict and, $9,616 in the assumption of outstanding indebtedness. The fair value of assets acquired and liabilities assumed as of the date of the acquisition is summarized below.
Current assets (excluding inventories) |
| $ | 6,525 |
|
Inventories |
|
| 6,956 |
|
Property, plant and equipment |
|
| 10,310 |
|
Current liabilities |
|
| (10,675 | ) |
Outstanding indebtedness |
|
| (9,616 | ) |
Base purchase price |
| $ | 3,500 |
|
Operating results of ASW are included in the Forged and Cast Engineered Products segment from the date of acquisition. For the two months endedat December 31, 2016, net sales for ASW approximated $7,523 and loss before income taxes approximated $1,781.2022, there were no additional triggering events identified.
Acquisition-Related Transaction Costs
Acquisition-related transaction costs of $3,056 and $3,383 for the year ended December 31, 2016, and 2015, respectively, were incurred relating principally to the purchase of Åkers and ASW and are included in selling and administrative costs.
Pro Forma Financial Information for the Åkers and ASW Acquisitions (unaudited)
The following financial information presents the combination of the results of operations of Ampco, Åkers and ASW as though the acquisition date for both of the business combinations had occurred as of January 1, 2015. Pro forma adjustments have been made to (i) include the net incremental depreciation and amortization expense associated with recording property, plant and equipment and definite-livedIdentifiable intangible assets at fair valueare expected to be amortized over a weighted-average period of approximately 12 years or $350 for 2023, $350 for 2024, $296 for 2025, $202 for 2026, $224 for 2027, and (ii) remove debt-related expenses associated with previous debt facilities not assumed by the Corporation. The following pro forma financial information is presented for informational purposes only and is not necessarily indicative of the results of operations that would have been achieved had the acquisition occurred at the beginning of 2015:$1,605 thereafter.
|
| Year Ended December 31, |
| ||||
|
| 2016 |
| 2015 |
| ||
Net sales |
| $ | 393,243 |
| $ | 440,265 |
|
Loss before income taxes (includes noncontrolling interest) |
| $ | (63,498 | ) | $ | (11,945 | ) |
Net loss attributable to Ampco-Pittsburgh |
| $ | (85,778 | ) | $ | (24,740 | ) |
Net loss per common share (basic) attributable to Ampco-Pittsburgh |
| $ | (6.94 | ) | $ | (2.03 | ) |
Other Acquisition
On July 29, 2015, the Corporation acquired the assets of AUP. The purchase price of $5,000 was funded by available cash. The pro forma impact on Corporation’s net sales and loss before income taxes was not significant to its consolidated results for 2015.
NOTE 37 – INVESTMENTS IN JOINT VENTURES:
The Corporation has interests in three joint ventures:
Shanxi Åkers TISCO Roll Co., Ltd. (“ATR”) – a cast roll joint venture in China for which the Corporation accounts using the consolidated method of accounting. ATR principally manufactures and sells cast mill rolls for the hot strip mill,mills, steckel millmills and medium plate mill.
MasteelAnhui Baochang Roll Co., Ltd., previously known as Magong Gongchang RollUnited Rollers Co., Ltd. (“MG”) – a forged roll joint venture in China for which effective in 2017, the Corporation accounts using the cost method of accounting. MG principally manufactures and sells large forged backup mill rolls for hot and cold strip mills.
42
Jiangsu GongchangGong-Chang Roll Co., Ltd. (“Gongchang”) – a cast roll joint venture in China for which the Corporation accounts using the cost method of accounting. Gongchang principally manufactures and sells cast mill rolls for hot and cold strip mills, medium/heavy section mills and plate mills.
ATR
In 2007, Åkers AB, a subsidiary of Union Electric Steel Corporation, a wholly owned subsidiary of the Corporation (“UES”), entered into an agreement with Taiyuan Iron & Steel Co., Ltd. (“TISCO”) to form ATR, with Åkers AB owning 59.88%59.88% and TISCO owning 40.12%40.12%. Since Åkers AB is the majority shareholder, has voting rights proportional to its ownership interest and exercises control over TISCO, Åkers AB is considered the primary beneficiary and, accordingly, accounts for its investment in ATR onusing the consolidated method of accounting. The net assets and net income (loss) attributable to TISCO are reflected as noncontrolling interest in the consolidated financial statements.
MG
In 2007,The Corporation has a subsidiary of UES entered into an agreement with Maanshan Iron & Steel Company Limited (Maanshan) to form Union Electric Steel33% interest in MG, Roll Co., Ltd (“UES-MG”), with UES owning 49% and Maanshan owning 51%. Both companies contributed cash for their respective interests (which equated to $14,700 for UES). In November 2016, in connection with an equity restructuring of UES-MG, UES transferred 16% of its equity interest to Gongchang for $2,400, payable in installments over the next three years. As of December 31, 2017, UES received payments of $1,500. As part of the equity restructuring, the joint venture company was renamed Masteel Gongchang Roll Co., Ltd. (“MG”)which is recorded at cost, or $835. The Corporation no longer participatesdoes not participate in the management or daily operation of MG, and has not guaranteed any of theits obligations of the joint venture; accordingly, its maximum exposure of loss is limitedand has no ongoing responsibilities to its remaining investment, which is recorded at cost, or approximately $835, at December 31, 2017.it. Dividends may be declared by the Board of Directors of the joint venture after allocation of after-tax profits to various “funds” equal to the minimum amount required under Chinese laws. law. No dividends were declared or received in 2017, 20162022 or 2015.
Gongchang
The Corporation has a 24%24.03% interest in Gongchang, which is recorded at cost, or $1,340.$1,340. The Corporation does not participate in the management or daily operation of Gongchang, has not guaranteed any of its obligations and has no ongoing responsibilities to it. Dividends may be declared by the Board of Directors of the joint venture after allocation of after-tax profits to various “funds” equal to the minimum amount required under Chinese law. Approximately $395Dividends of dividends$504 and $1,025 were declared and received in 2016. No dividends were declared or received in 2017 or 2015.2022 and 2021, respectively.
NOTE 48 – INVENTORIES:
OTHER CURRENT LIABILITIES:
|
| 2017 |
|
| 2016 |
| ||
Raw materials |
| $ | 24,249 |
|
| $ | 23,964 |
|
Work-in-progress |
|
| 42,840 |
|
|
| 29,198 |
|
Finished goods |
|
| 24,083 |
|
|
| 20,046 |
|
Supplies |
|
| 16,389 |
|
|
| 10,371 |
|
Inventories |
| $ | 107,561 |
|
| $ | 83,579 |
|
At December 31, 2017, and 2016, approximately 42% and 45%, respectively, of the inventories were valued using the LIFO method. The LIFO reserve approximated $(16,063) and $(15,139) at December 31, 2017, and 2016, respectively. During each of the years, inventory quantities decreased for certain locations resulting in a liquidation of LIFO layers which were at lower costs. The effect of the liquidations was to decrease costs of products sold (excluding depreciation and amortization) by approximately $490, $936 and $216 for 2017, 2016 and 2015, respectively. There was no income tax expense recognized in the consolidated statements of operations for 2017 and 2016, due to the Corporation having a valuation allowance recorded against its deferred income tax assets for the jurisdiction where the income was recognized. See Note 15. Accordingly, the effect of the liquidations reduced net loss by approximately $490, or $0.04 per common share, for 2017, $936, or $0.08 per common share, for 2016, and increased net income by approximately $141, or $0.01 per common share, for 2015.
NOTE 5 – PROPERTY, PLANT AND EQUIPMENT:
|
| 2017 |
|
| 2016 |
| ||
Land and land improvements |
| $ | 12,172 |
|
| $ | 11,747 |
|
Buildings |
|
| 68,572 |
|
|
| 66,017 |
|
Machinery and equipment |
|
| 340,396 |
|
|
| 323,684 |
|
Construction-in-process |
|
| 5,019 |
|
|
| 2,595 |
|
Other |
|
| 7,193 |
|
|
| 7,495 |
|
|
|
| 433,352 |
|
|
| 411,538 |
|
Accumulated depreciation |
|
| (218,372 | ) |
|
| (197,130 | ) |
Property, plant and equipment, net |
| $ | 214,980 |
|
| $ | 214,408 |
|
The majority of the assets of the Corporation, except real property including the land and building of UES-UK, is pledged as collateral for the Corporation’s revolving credit facility (see Note 8). Land and buildings of UES-UK, equal to approximately $2,831 (£2,098) at December 31, 2017, are held as collateral by the trustees of the UES-UK defined benefit pension plan (see Note 9). The gross value of assets under capital lease and the related accumulated amortization approximated $4,082 and $1,101, respectively,Other current liabilities as of December 31, 2017,2022 and $3,610 and $691, respectively, as of December 31, 2016.
NOTE 6 – INTANGIBLE ASSETS:
|
| 2017 |
|
| 2016 |
| ||
Customer relationships |
| $ | 6,543 |
|
| $ | 6,244 |
|
Developed technology |
|
| 4,429 |
|
|
| 4,248 |
|
Trade name |
|
| 2,696 |
|
|
| 2,537 |
|
|
|
| 13,668 |
|
|
| 13,029 |
|
Accumulated amortization |
|
| (2,647 | ) |
|
| (1,428 | ) |
Intangible assets, net |
| $ | 11,021 |
|
| $ | 11,601 |
|
The following summarizes changes in intangible assets for the year ended December 31:
|
| 2017 |
|
| 2016 |
| ||
Balance at the beginning of the year |
| $ | 11,601 |
|
| $ | 1,193 |
|
Changes in intangible assets |
|
| 0 |
|
|
| 11,784 |
|
Amortization of intangible assets |
|
| (1,219 | ) |
|
| (1,106 | ) |
Other, primarily impact from changes in foreign currency exchange rates |
|
| 639 |
|
|
| (270 | ) |
Balance at the end of the year |
| $ | 11,021 |
|
| $ | 11,601 |
|
Intangible assets include an indefinite-lived trade name of $2,696 and $2,537 as of December 31, 2017, and 2016, respectively, that is not subject to amortization. Changes during the year ended December 31, 2016, primarily represent intangible assets identified as part2021 were comprised of the Åkers acquisition. Identifiable intangible assets are expected to be amortized over a weighted average period of approximately 12 years or $1,248 for 2018, $1,248 for 2019, $1,248 for 2020, $541 for 2021, $400 for 2022 and $3,640 thereafter.following:
|
| 2022 |
|
| 2021 |
| ||
Customer-related liabilities |
| $ | 16,771 |
|
| $ | 12,548 |
|
Accrued utilities |
|
| 2,484 |
|
|
| 3,098 |
|
Accrued sales commissions |
|
| 1,681 |
|
|
| 1,864 |
|
Accrued interest payable |
|
| 185 |
|
|
| 1,772 |
|
Other |
|
| 3,642 |
|
|
| 1,928 |
|
Other current liabilities |
| $ | 24,763 |
|
| $ | 21,210 |
|
NOTE 7 – OTHER CURRENT LIABILITIES:
|
| 2017 |
|
| 2016 |
| ||
Customer-related liabilities |
| $ | 18,512 |
|
| $ | 21,564 |
|
Accrued interest payable |
|
| 2,697 |
|
|
| 2,274 |
|
Accrued sales commissions |
|
| 2,301 |
|
|
| 1,693 |
|
Other |
|
| 13,579 |
|
|
| 16,666 |
|
Other current liabilities |
| $ | 37,089 |
|
| $ | 42,197 |
|
Customer-related liabilities primarily include liabilities for product warranty claims and deposits received on future orders. The following summarizes changesChanges in the liability for product warranty claims for the yearyears ended December 31:
31, 2022 and 2021 consisted of the following:
|
| 2017 |
|
| 2016 |
|
| 2015 |
| |||
Balance at the beginning of the year |
| $ | 11,521 |
|
| $ | 6,358 |
|
| $ | 6,672 |
|
Acquisitions – opening balance sheet liability for warranty claims |
|
| 0 |
|
|
| 7,130 |
|
|
| 0 |
|
Satisfaction of warranty claims |
|
| (4,014 | ) |
|
| (4,297 | ) |
|
| (2,452 | ) |
Provision for warranty claims |
|
| 3,601 |
|
|
| 3,282 |
|
|
| 2,293 |
|
Other, primarily impact from changes in foreign currency exchange rates |
|
| 594 |
|
|
| (952 | ) |
|
| (155 | ) |
Balance at the end of the year |
| $ | 11,702 |
|
| $ | 11,521 |
|
| $ | 6,358 |
|
|
| 2022 |
|
| 2021 |
| ||
Balance at the beginning of the year |
| $ | 7,331 |
|
| $ | 8,105 |
|
Satisfaction of warranty claims |
|
| (3,020 | ) |
|
| (3,220 | ) |
Provision for warranty claims |
|
| 1,438 |
|
|
| 2,509 |
|
Other, primarily impact from changes in foreign currency exchange rates |
|
| (556 | ) |
|
| (63 | ) |
Balance at the end of the year |
| $ | 5,193 |
|
| $ | 7,331 |
|
NOTE 8 – BORROWING ARRANGEMENTS:
In May 2016,Customer deposits represent amounts collected from, or invoiced to, a customer in advance of revenue recognition and are recorded as an other current liability on the consolidated balance sheet. The liability for customer deposits is reversed when the Corporation entered intosatisfies its performance obligations and control of the inventory transfers to the customer, typically when title transfers. Performance obligations related to customer deposits are expected to be satisfied in less than one year.
43
Changes in customer deposits for the years ended December 31, 2022 and 2021 consisted of the following:
| 2022 |
|
| 2021 |
| ||
Balance at the beginning of the year | $ | 4,328 |
|
| $ | 6,507 |
|
Satisfaction of performance obligations |
| (10,735 | ) |
|
| (12,870 | ) |
Receipt of additional deposits |
| 17,026 |
|
|
| 10,729 |
|
Other, primarily changes in foreign currency exchange rates |
| (166 | ) |
|
| (38 | ) |
Balance at the end of the year | $ | 10,453 |
|
| $ | 4,328 |
|
NOTE 9 – DEBT:
Debt as of December 31, 2022 and 2021 was comprised of the following:
|
| 2022 |
|
| 2021 |
| ||
Revolving credit facility |
| $ | 47,078 |
|
| $ | 29,744 |
|
Sale and leaseback financing obligations |
|
| 41,011 |
|
|
| 20,546 |
|
Industrial Revenue Bonds |
|
| 9,191 |
|
|
| 9,191 |
|
Equipment financing facility |
|
| 6,388 |
|
|
| — |
|
Finance leases |
|
| 1,803 |
|
|
| 1,438 |
|
Outstanding borrowings |
|
| 105,471 |
|
|
| 60,919 |
|
Debt – current portion |
|
| (12,410 | ) |
|
| (20,007 | ) |
Long-term debt |
| $ | 93,061 |
|
| $ | 40,912 |
|
The current portion of debt includes primarily swing loans under the revolving credit facility and the Industrial Revenue Bonds (“IRBs”). By definition, swing loans are temporary advances under the revolving credit facility and short-term in nature. Accordingly, swing loans are classified as a five-year current liability until the amount is either repaid, as customers remit payments, or, if elected by the Corporation, refinanced as a longer-term loan under the revolving credit facility. The swing loans balance was $2,078 and $8,744 at December 31, 2022 and 2021, respectively. Although the IRBs begin to become due in 2027, the bonds can be put back to the Corporation on short notice if they are not able to be remarketed, which is considered remote by the Corporation; accordingly, the IRBs are classified as a current liability. Future principal payments, assuming the swing loans are repaid in 2023 and the IRBs are called in 2023, are $12,410 for 2023, $1,509 for 2024, $1,615 for 2025, $46,617 for 2026, $1,801 for 2027, and $41,519 thereafter.
Revolving Credit and Security Agreement (the “Credit Agreement”)Facility
The Corporation is a party to a revolving credit security agreement with a syndicate of banks.banks that was amended on June 29, 2021 (as amended, the “First Amended and Restated Security Agreement”), and subsequently amended on December 17, 2021, and May 26, 2022. The CreditFirst Amended and Restated Security Agreement, provides for a senior secured asset-based revolving credit facility of $100,000, that replaced the Corporation’s previously existing line of credit and letter of credit facilities. The Credit Agreement provides for initial borrowings notcan be increased to exceed $100,000 with an option to increase the credit facility by an additional $50,000$130,000 at the requestoption of the Corporation and with the approval of the lenders, and an allowance of $20,000 for new equipment financing (see Equipment Financing Facility below) but, otherwise, restricts the Corporation from incurring additional indebtedness outside of the agreement, unless approved by the banks. The Corporation amended the Credit Agreement in 2016 to provide additional intercompany lending capacity to certain of its subsidiaries and expand available currencies for its letters of credits. The Credit Agreement was also amended in 2017 to add Åkers AB and ASW as borrowers and modify regional sublimits. As amended, the Credit Agreementrevolving credit facility includes sublimitssub-limits for letters of credit not to exceed $40,000,$40,000 and European borrowings not to exceed $15,000, and Canadian borrowings not$30,000, of which up to exceed $15,000. Deferred financing fees of approximately $1,250 were incurred$7,500 may be allocated for Swedish borrowings. The maturity date for the Credit Agreementrevolving credit facility is June 29, 2026 and, are being amortized over the lifesubject to other terms and conditions of the Credit Agreement.agreement, would become due on that date.
Availability under the Credit Agreementrevolving credit facility is based on eligible accounts receivable, inventory and fixed assets. Amounts outstanding underDomestic borrowings from the credit facility bear interest, at the Corporation’s option, at either (i) LIBOR plus an applicable margin ranging between 1.25%2.00% to 1.75%2.50% based on the quarterly average excess availability or (ii) the alternate base rate plus an applicable margin ranging between 0.25%1.00% to 0.75%1.50% based on the quarterly average excess availability. European borrowings denominated in euros, pound sterling or krona bear interest at the Successor Rate as defined in the First Amended and Restated Security Agreement. As of December 31, 2022 and 2021, there were no European borrowings outstanding. Additionally, the Corporation is required to pay a commitment fee ranging between 0.25% and 0.375%of 0.25% based on the daily unused portion of the credit facility.
As of December 31, 2017,2022, the Corporation had outstanding borrowings under the First Amended and Restated Credit Agreement of $20,349 (including £1,000 of European borrowings$47,078. The average interest rate approximated 4.50% for its U.K. subsidiary). Interest accrued on the outstanding balance during the year at an average of approximately 2.75%.2022 and 4.00% for 2021. Additionally, the Corporation had utilized a portion of the credit facility for letters of credit (Note 10)(see Note 12). As of December 31, 2017,2022, the remaining availability under the First Amended and Restated Credit Agreement approximated $56,000. No borrowings$28,420, net of standard availability reserves. Deferred financing fees of $485 were incurred in 2021 related to the First Amended and Restated Security Agreement and are being amortized over the remaining term of the agreement.
44
Borrowings outstanding under the CreditFirst Amended and Restated Security Agreement during 2016.
The debt outstanding under the Credit Agreement isare collateralized by a first priority perfected security interest in substantially all of the assets of the Corporation and its subsidiaries (other than real property). Additionally, the CreditFirst Amended and Restated Security Agreement contains customary affirmative and negative covenants and limitations including, but not limited to, investments in certain of its subsidiaries, repurchase of the Corporation's shares, payment of dividends, incurrence of additional indebtedness upstream distributions from subsidiaries,and guaranties, and acquisitions and divestures. Thedivestitures. In addition, the Corporation must also maintain a certain level of excess availability. If excess availability falls below the established threshold, or in an event of default, the Corporation will be required tootherwise maintain a minimum fixed charge coverage ratio of not less than 1.001.05 to 1.00. The Corporation was in compliance with the applicable bank covenants under the First Amended and Restated Security Agreement as of December 31, 2017.2022.
Sale and Leaseback Financing Obligations
In March 2017,September 2018, UES completed a sale and leaseback financing transaction with Store Capital Acquisitions, LLC (“STORE”) for certain of its real property, including its manufacturing facilities in Valparaiso, Indiana and Burgettstown, Pennsylvania, and its manufacturing facility and corporate headquarters located in Carnegie, Pennsylvania (the “UES Properties”).
On August 30, 2022, Air & Liquid completed a sale and leaseback financing transaction with STORE, valued at $15,500, for certain of its real property, including its manufacturing facilities in Lynchburg, Virginia and Amherst, Virginia. Net proceeds, after transaction-related costs, approximated $15,396. On October 14, 2022, Air & Liquid completed a sale and leaseback financing transaction with STORE, valued at $4,500 for its real property, including its manufacturing facility, located in North Tonawanda, New York (collectively with the Corporation repaidVirginia properties, the debt assumed in“ALP Properties”). Net proceeds, after transaction-related costs, approximated $4,460.
In connection with the acquisition of ASW (credit facilityAugust 2022 sale and term loan)leaseback financing transaction, and as modified by the October 2022 sale and leaseback financing transaction, UES and STORE entered into a Second Amended and Restated Master Lease Agreement (the “Restated Lease”), including interest, feeswhich amended and early termination costs. Accordingly, outstanding borrowingsrestated the existing lease agreement between UES and STORE. Pursuant to the Restated Lease, UES will lease the ALP Properties and the UES Properties (collectively, the "Properties"), subject to the terms and conditions of the CorporationRestated Lease, and UES will sublease the ALP Properties to Air & Liquid on the same terms as the Restated Lease. The Restated Lease provides for an initial term of 20 years; however, UES may extend the lease for the Properties for four successive periods of five years each. If fully extended, the Restated Lease would expire in August 2062. UES also has the option to repurchase the Properties, which it may, and intends to, exercise in 2032, for a price equal to the greater of (i) the Fair Market Value of the Properties, or (ii) 115% of Lessor’s Total Investment, with such terms defined in the Restated Lease.
Annual payments for the Properties are equal to $3,347 (the “Base Annual Rent”), payable in equal monthly installments. On each anniversary date through August 2052, the Base Annual Rent will increase each anniversary date by an amount equal to the lesser of 2.04% or 1.25% of the change in the consumer price index, as defined in the Restated Lease. The Base Annual Rent during the remaining ten years of the Restated Lease will be equal to the Fair Market Rent, as defined in the Restated Lease.
In connection with the execution of the Restated Lease, UES and STORE entered into a Disbursement Agreement dated August 30, 2022 (the “Disbursement Agreement”), pursuant to which STORE agreed to provide up to $2,500 to UES towards certain improvements in the Carnegie, Pennsylvania manufacturing facility. As of December 31, 2017, and 2016, consisted of the following:
|
| 2017 |
|
| 2016 |
| ||
Industrial Revenue Bonds |
| $ | 13,311 |
|
| $ | 13,311 |
|
Promissory notes (and interest) |
|
| 25,395 |
|
|
| 23,844 |
|
Revolving Credit and Security Agreement |
|
| 20,349 |
|
|
| 0 |
|
Minority shareholder loan |
|
| 5,325 |
|
|
| 4,990 |
|
Credit facility |
|
| 0 |
|
|
| 7,146 |
|
Term loan |
|
| 0 |
|
|
| 762 |
|
Capital leases |
|
| 1,773 |
|
|
| 2,161 |
|
Outstanding borrowings |
|
| 66,153 |
|
|
| 52,214 |
|
Debt – current portion |
|
| (19,335 | ) |
|
| (26,825 | ) |
Long-term debt |
| $ | 46,818 |
|
| $ | 25,389 |
|
Future principal payments, assuming demand loans are called in 2018 and the Industrial Revenue Bonds are not able to be remarketed, are $19,335 for 2018, $25,844 for 2019, $344 for 2020, $20,585 for 2021 and $45 for 2022. The Corporation also had short-term lines of credit of approximately $800 (£250 in the United Kingdom and €400 in Belgium). No2022, no amounts were outstanding under these linesthe Disbursement Agreement. The Base Annual Rent under the Restated Lease will be adjusted to repay any amounts advanced under the Disbursement Agreement, at the time of credit asthe advance, with such advances to be repaid over the initial term of the Restated Lease of 20 years. Advances under the Disbursement Agreement will be secured by the capital improvements.
The Restated Lease and the Disbursement Agreement contain certain representations, warranties, covenants, obligations, conditions, indemnification provisions and termination provisions customary for those types of agreements.
The effective interest rate approximated 6.73% and 8.06% for 2022 and 2021, respectively. Deferred financing fees of $144 were incurred related to the sale and leaseback of the ALP Properties and are being amortized over the initial term of the Restated Lease of 20 years.
Industrial Revenue Bonds
At December 31, 2017, and 2016.
Industrial Revenue Bonds
As of December 31, 2017,2022, the Corporation had the following Industrial Revenue Bonds (IRBs)IRBs outstanding: (i) $4,120 tax-exempt IRB maturing in 2020, interest at a floating rate which averaged 0.91% during the current year; (ii) $7,116$7,116 taxable IRB maturing in 2027, interest at a floating rate which averaged 1.17% during the current year;1.83% and (iii) $2,0750.19% for 2022 and 2021, respectively; and (ii) $2,075 tax-exempt IRB maturing in 2029, interest at a floating rate which averaged 0.79% during the current year.2.32% and 0.09% for 2022 and 2021, respectively. The IRBs are secured by letters of credit of equivalent amounts and are remarketed periodically at which time the interest rates are reset. If the IRBs are not able to be remarketed, although considered remote by the Corporation, and its bankers, the bondholders can seek reimbursement immediately from the letters of credit which serve as collateral for the bonds.
Promissory Notes
In connection with Accordingly, the acquisition of Åkers, the Corporation issued three-year promissory notes amounting to $22,619. The notes bear interest at 6.5%, compounding annually, with principal and interest payable at maturity on March 3, 2019. As of December 31, 2017, accrued interest approximated $2,776, which is included in long-termIRBs are recorded as current debt on the consolidated balance sheet.sheets.
45
Equipment Financing Facility
On September 29, 2022, UES and Clarus Capital Funding I, LLC (“Clarus”) entered into a Master Loan and Security Agreement, pursuant to which UES can borrow up to $20,000 to finance certain equipment purchases associated with the FCEP capital program, including progress payments and reimbursement of deposits made to date. Each borrowing will constitute a secured loan transaction (each, a “Term Loan”). Each Term Loan will convert to a Term Note on the earlier of (i) the date in which the associated equipment is placed in service or (ii) December 29, 2023. Each Term Note will have a term of 84 months in arrears fully amortizing and will commence on the date of the Term Note.
Interest on each Term Loan will accrue at an annual fixed rate of 8%, payable monthly. Interest on each Term Note will accrue at a fixed rate to be calculated by Clarus equal to the like-term swap rate, as reported in ICE Benchmark, or such other information service available to Clarus, for the week ending immediately prior to the commencement date for such Term Note, plus 4.5%.
The Term Loans and Term Notes will be secured by a first priority security interest in and to all of UES’s rights, title and interests in the underlying equipment.
At December 31, 2022, $6,388 was outstanding as Term Loans.
Minority Shareholder Loan
In 2022, ATR has a $5,325 (RMB 34,655) loanperiodically had loans outstanding with its minority shareholder. TheAmounts borrowed and repaid approximated $5,776 (RMB 38,471) in 2022. In addition, ATR repaid an existing loan originally matured in 2008 but has been renewed continually for one-year periods. 2021 of approximately $1,056 (RMB 6,901). No loans are outstanding as of December 31, 2022 or 2021.
Interest does not compound and has accrued on the outstanding balance, since inception, atborrowings equaled the three-to-five-year loan interest rate set by the People’s Bank of China in effect at the time of renewal. Thethe borrowing, which approximated 4.785% and 5% for 2022 and 2021, respectively. Interest paid in 2022, including interest rate for 2017accumulated on previous loans, approximated 5% and accrued$1,766 (RMB 11,063). Interest paid in 2021 approximated $479 (RMB 3,046). Accrued interest as of December 31, 2017,2021 approximated $2,682$1,713 (RMB 17,457)10,901), which isand was recorded in other current liabilities on the consolidated balance sheet.No interest was outstanding as of December 31, 2022.
CapitalFinance Leases
The Corporation leases equipment under various noncancelable lease agreements ending 20182023 to 2022.2028. Effective interest rates rangeranged between 1.30%approximately 2% and 5.20%.6% for 2022 and between 1% and 3% for 2021. The weighted-average remaining lease term approximated 5 years at December 31, 2022 and 2021. Cash paid for amounts included in the measurement of finance lease liabilities totaled $695 and $884 for the years ended December 31, 2022 and 2021, respectively, of which $55 and $29 were classified as operating cash flows and $640 and $855 were classified as financing cash flows in the consolidated statements of cash flows for each of the respective years. Interest on the finance lease liabilities was insignificant for both years.
NOTE 10 – OPERATING LEASE LIABILITIES:
The current and noncurrent portions of the Corporation’s operating lease arrangements as of December 31, 2022 and 2021 were as follows:
|
| 2022 |
|
| 2021 |
| ||
Operating lease liabilities – current portion |
| $ | 635 |
|
| $ | 641 |
|
Noncurrent operating lease liabilities |
|
| 2,886 |
|
|
| 3,415 |
|
Total operating lease liabilities |
| $ | 3,521 |
|
| $ | 4,056 |
|
Future operating lease payments as of December 31, 2022 were as follows:
2023 |
| $ | 647 |
|
2024 |
|
| 589 |
|
2025 |
|
| 342 |
|
2026 |
|
| 176 |
|
2027 |
|
| 141 |
|
2028 and thereafter |
|
| 3,417 |
|
Total undiscounted payments |
|
| 5,312 |
|
Less: amount representing interest |
|
| (1,791 | ) |
Present value of net minimum lease payments |
| $ | 3,521 |
|
46
At December 31, 2022 and 2021, the weighted-average remaining lease term approximated 7.86 years and 8.76 years, respectively, and the weighted-average discount rate approximated 3.97% and 4.66%, respectively.
Cash paid for amounts included in the measurement of operating lease liabilities totaled $644 and $671 for the years ended December 31, 2022 and 2021, respectively, and was classified as operating cash flows in the consolidated statements of cash flows. The components of lease cost for the years ended December 31, 2022 and 2021, were as follows:
|
| 2022 |
|
| 2021 |
| ||
Short-term operating lease costs |
| $ | 15 |
|
| $ | 29 |
|
Long-term operating lease costs |
|
| 629 |
|
|
| 642 |
|
Total operating lease costs |
| $ | 644 |
|
| $ | 671 |
|
NOTE 911 – PENSION AND OTHER POSTRETIREMENT BENEFITS:
U.S. Pension Benefits
Historically, theThe Corporation had onetwo qualified domestic defined benefit pension plans that were merged as of December 31, 2022. The benefits for participants under either plan (“legacy plan”). As part ofwere not affected by the Åkers acquisition, the Corporation assumed the obligations for two additional U.S. plans (“Akers plans”). Collectively, the plans covermerger. The plan covers substantially all of itsthe Corporation's U.S. employees. During 2015 – 2017, the following amendments were made to the plans:
Effective December 31, 2017, the legacy plan and the Akers salary plan were merged.
Effective June 1, 2016, the Akers salary plan was amended to freezeFor all locations except one, benefit accruals and participation in the plan replacing benefit accrualshave been curtailed and replaced with employer non-elective contributions equaling 3% of compensation to a defined contribution pension plan. The plan freeze resulted in remeasurement of the liability, reducing the liability by approximately $1,181 as of December 31, 2016, and a curtailment gain of $887 for the year ended December 31, 2016.
In 2016, the legacy plan was amended to permit lump sum distributions to inactive deferred vested participants and deferred beneficiaries who were not previously offered a lump sum, which approximated $2,739.
Effective July 1, 2015, the legacy plan was amended to freeze benefit accruals and participation in the plan for non-union hourly and salaried participants and, effective January 1, 2016, for employees of the Union Electric Steel Carnegie Steelworkers Location. Benefits under the legacy plan were replaced with employer contributions of a 3% non-elective base contribution and a matching contribution of up to 4% to a defined contribution plan. The plan changes resulted in curtailment losses of $1,303 for the year ended December 31, 2015.
The U.S. defined benefit pension plans areplan is covered by the Employee Retirement Income Security Act of 1974 (“ERISA”); accordingly, the Corporation’s policy is to fund at least the minimum actuarially computedactuarially-computed annual contribution required under ERISA. No minimum contributions were required for any of the three years for the legacy plan or, since the date of acquisition, for the Akers plans. Minimum contributions for 20182022 were $444 and are expected to approximate $1,300. Estimated benefit payments for subsequent years are $13,672 for 2018, $14,091 for 2019, $14,301 for 2020, $14,566$339 in 2023. No minimum contributions were due for 2021 $14,685 for 2022 and $74,009 for 2023 – 2027.due to relief provided by the American Rescue Plan Act. The fair value of the plan assets as of December 31, 2017,2022 and 2016,2021, approximated $199,138$161,374 and $188,722,$214,937, respectively, in comparison to accumulated benefit obligations of $245,317$185,210 and $235,299$249,180 for the same periods. Employer contributions to the defined contribution plansplan totaled $2,588, $2,466$3,064 and $882$2,893 for 2017, 20162022 and 2015,2021, respectively, and are expected to approximate $2,808$3,400 in 2018.2023.
The Corporation also maintainsmaintained nonqualified defined benefit pension plans for selected executivesexecutive officers in addition to the benefits provided under the Corporation’s qualified defined benefit pension plan. Benefit accruals and participation in the plans have been curtailed. The objectives of the nonqualified plans arewere to provide supplemental retirement benefits or restore benefits lost due to limitations set by the Internal Revenue Service. The assets of the nonqualified plans are held in a grantor tax trust known as a “Rabbi” trust and are subject to claims of the Corporation’s creditors, but otherwise must be used only for purposes of providing benefits under the plans. No contributions were made to the trust in 2015 – 2017 and none are expected in 2018. The fair market value of the trust at December 31, 2017,2022 and 2016,2021, which is included in other noncurrent assets on the consolidated balance sheets, was $4,204$3,353 and $3,863,$4,860, respectively. Changes in the fair market value of the trustThe plans are recorded as a component of other comprehensive income (loss). The plan is treated as a non-funded pension planplans for financial reporting purposes. Accordingly, benefit payments would represent employer contributions. Accumulated benefit obligations approximated $7,202$8,460 and $6,639$11,121 at December 31, 2017, and 2016, respectively. Estimated benefit payments for subsequent years, which would represent employer contributions, are approximately $440 for 2018, $454 for 2019, $464 for 2020, $485 for 2021, $507 for 2022 and $2,570 for 2023 – 2027.2021, respectively.
Employees at one location participate in a multi-employer plan, I.A.M. National Pension Fund (employer identification number 51-6031295, plan number 002), in lieu of the Corporation’s defined benefit pension plan. A multi-employer plan generally receives contributions from two or more unrelated employers pursuant to one or more collective bargaining agreements. The assets contributed by one employer may be used to fund the benefits provided to
employees of other employers in the plan because the plan assets, once contributed, are not restricted to individual employers. The latest report of summary plan information (for the 20162021 plan year) provided by I.A.M. National Pension Fund indicates:
More than 1,650Approximately 1,700 employer locations contribute to the plan
Approximately 100,000 active employees participate in the plan
Assets of approximately $11.7$13.4 billion and a funded status of approximately 96%83.7%.
Less than 100 of the Corporation’s employees participate in the plan and contributions are based on a rate per hour. The Corporation’s contributions to the plan were less than $250$300 for each of 2017, 20162022 and 2015,2021 and represent less than five percent of total contributions to the plan by all contributing employers. Contributions are expected to approximate $250be less than $300 in 2018.2023.
Foreign Pension Benefits
Employees of UES-UK participateparticipated in a defined benefit pension plan that was curtailed effective December 31, 2004, and replaced with a defined contribution pension plan. The UES-UK plans are non-U.S. plans and, therefore, are not covered by ERISA. Instead,Employer contributions to the defined benefit pension plan, when necessary, are agreed to by the Trustees and UES-UK, have agreed to a recovery plan that estimates the amount of employer contributions, based on U.K. regulations, necessary to eliminatewith the funding deficitobjective of maintaining the self-sufficiency of the plan with such estimatesplan. Accordingly, estimated contributions are subject to change based on the future investment performance of the plan’s assets. The U.S. dollar equivalent of employer contributions to the defined benefit pension plan approximated $1,521, $1,522 and $1,715 in 2017, 2016 and 2015, respectively, and are expected to approximate $850 in 2018 at which timeCurrently, the plan is fully funded and nocontributions were required in 2022 or 2021, and none are expected to be fully funded.in 2023. The fair value of the plan’s assets as of December 31, 2017,2022 and 2016,2021, approximated $56,419$41,679 (£41,820)34,475) and $48,055$71,614 (£38,955)53,008), respectively, in comparison to accumulated benefit obligations of $57,540$34,438
47
(£28,485) and $59,651 (£42,650) and $61,277 (£49,673)44,153) for the same periods. Estimated benefit payments for subsequent years are $1,644 for 2018, $1,903 for 2019, $1,768 for 2020, $1,738 for 2021, $1,670 for 2022 and $11,196 for 2023 – 2027. Contributions to the defined contribution pension plan approximated $311, $252$253 and $382$322 in 2017, 20162022 and 2015,2021, respectively, and are expected to approximate $379$250 in 2018.2023.
As part of the Åkers acquisition, theThe Corporation assumed the obligations of has two additional foreign defined benefit pension plans. The plans, which are unfunded.not funded. Accordingly, benefit payments would represent employer contributions. Projected benefit obligations approximated $7,073 and $5,633 at December 31, 2017, and 2016, respectively; accumulated benefit obligations approximated the same. Estimated benefit payments for subsequent years, for both plans combined, are $234 for 2018, $257 for 2019, $248 for 2020, $249 for 2021, $240 for$4,881 and $7,356 at December 31, 2022 and $1,379 for 2023 – 2027.2021, respectively.
Other Postretirement Benefits
The Corporation provides a monthly reimbursement of postretirement health care benefits for up to a 5-year6-year period principally to the bargaining groups of one subsidiary (“legacy OPEB plan”).two subsidiaries. The legacy OPEB plan coversplans cover participants and their spouses and/or dependents who retire under thean existing pension plan on other than a deferred vested basis and at the time of retirement also have also rendered 1510 or more years of continuous service irrespective of age. Retiree life insurance is provided to substantially all retirees.
The Corporation also provides life insurance and health care benefits to former employees of certain discontinued operations. This obligation had been estimated and provided for at the time of disposal.
As part of the Åkers acquisition, the Corporation assumed the obligations for two additional postretirement benefit plans (“Akers OPEB plans”). The Akers OPEB plans cover retiree medical and life insurance benefits. In August 2016, the Corporation modified the Akers OPEB plans whereby retiree health benefits for certain groups of pre-Medicare eligible employees were replaced with a monthly stipend. The plan changes resulted in a reduction in prior service costs decreasing plan liabilities by approximately $4,762, which is being amortized against other postretirement benefit costs over the expected remaining service periods of approximately 7.5 and 12 years, versus recognized immediately. As of December 31, 2017, the Akers OPEB plans were merged.
The Corporation’s postretirement health care and life insurance plans are not funded or subject to any minimum regulatory funding requirements. EstimatedInstead, benefit payments for subsequent years,are made from the general assets of the Corporation at the time they are due.
Significant Activity
Actuarial (gains) losses were comprised of the following components:
|
| U.S. Pension |
|
| Foreign Pension |
|
| Other Postretirement |
| |||||||||||||||
|
| 2022 |
|
| 2021 |
|
| 2022 |
|
| 2021 |
|
| 2022 |
|
| 2021 |
| ||||||
Changes in assumptions |
| $ | (57,439 | ) |
| $ | (6,234 | ) |
| $ | (19,804 | ) |
| $ | (164 | ) |
| $ | (2,225 | ) |
| $ | (365 | ) |
Other |
|
| 202 |
|
|
| 2,027 |
|
|
| (190 | ) |
|
| 167 |
|
|
| (536 | ) |
|
| (442 | ) |
Total actuarial (gains) losses |
| $ | (57,237 | ) |
| $ | (4,207 | ) |
| $ | (19,994 | ) |
| $ | 3 |
|
| $ | (2,761 | ) |
| $ | (807 | ) |
Changes in actuarial assumptions principally include the effect of changes in discount rates which are used to estimate plan liabilities. A 1/4 percentage point decrease in the discount rate would represent employer contributions, forincrease projected and accumulated benefit obligations by approximately $5,800. Conversely, a 1/4 percentage point increase in the legacydiscount rate would decrease projected and Akers OPEB plans areaccumulated benefit obligations by approximately $1,383 for 2018, $1,407 for 2019, $1,429 for 2020, $1,239 for 2021, $1,201 for 2022 and $5,363 for 2023-2027.$5,800.
48
Reconciliations
The following providestables provide a reconciliation of projected benefit obligations (“PBO”), plan assets and the funded status of the plans for the Corporation’s defined benefit plans calculated using a measurement date as of the end of the respective years.
|
| U.S. Pension |
|
| Foreign Pension |
|
| Other Postretirement |
| |||||||||||||||
|
| 2022 |
|
| 2021 |
|
| 2022 |
|
| 2021 |
|
| 2022 |
|
| 2021 |
| ||||||
Change in projected benefit obligations: |
|
|
|
|
|
|
|
|
|
|
|
|
|
|
|
|
|
| ||||||
PBO at January 1 |
| $ | 260,301 |
|
| $ | 273,776 |
|
| $ | 67,007 |
|
| $ | 69,923 |
|
| $ | 10,430 |
|
| $ | 11,410 |
|
Service cost |
|
| 51 |
|
|
| 243 |
|
|
| 286 |
|
|
| 375 |
|
|
| 234 |
|
|
| 245 |
|
Interest cost |
|
| 6,185 |
|
|
| 5,349 |
|
|
| 1,079 |
|
|
| 829 |
|
|
| 220 |
|
|
| 182 |
|
Foreign currency exchange rate changes |
|
| — |
|
|
| — |
|
|
| (6,690 | ) |
|
| (1,354 | ) |
|
| — |
|
|
| — |
|
Actuarial (gains) losses |
|
| (57,237 | ) |
|
| (4,207 | ) |
|
| (19,994 | ) |
|
| 3 |
|
|
| (2,761 | ) |
|
| (807 | ) |
Participant contributions |
|
| — |
|
|
| — |
|
|
| — |
|
|
| — |
|
|
| 30 |
|
|
| 161 |
|
Benefits paid from plan assets |
|
| (14,860 | ) |
|
| (14,457 | ) |
|
| (1,863 | ) |
|
| (2,114 | ) |
|
| — |
|
|
| — |
|
Benefits paid by the Corporation |
|
| (770 | ) |
|
| (403 | ) |
|
| (506 | ) |
|
| (655 | ) |
|
| (509 | ) |
|
| (761 | ) |
PBO at December 31 |
| $ | 193,670 |
|
| $ | 260,301 |
|
| $ | 39,319 |
|
| $ | 67,007 |
|
| $ | 7,644 |
|
| $ | 10,430 |
|
|
|
|
|
|
|
|
|
|
|
|
|
|
|
|
|
|
|
| ||||||
Change in plan assets: |
|
|
|
|
|
|
|
|
|
|
|
|
|
|
|
|
|
| ||||||
Fair value of plan assets at January 1 |
| $ | 214,937 |
|
| $ | 210,880 |
|
| $ | 71,614 |
|
| $ | 66,957 |
|
| $ | — |
|
| $ | — |
|
Actual return on plan assets |
|
| (39,147 | ) |
|
| 18,514 |
|
|
| (21,069 | ) |
|
| 7,550 |
|
|
| — |
|
|
| — |
|
Foreign currency exchange rate changes |
|
| — |
|
|
| — |
|
|
| (7,003 | ) |
|
| (779 | ) |
|
| — |
|
|
| — |
|
Corporate contributions |
|
| 1,214 |
|
|
| 403 |
|
|
| 506 |
|
|
| 655 |
|
|
| 479 |
|
|
| 600 |
|
Participant contributions |
|
| — |
|
|
| — |
|
|
| — |
|
|
| — |
|
|
| 30 |
|
|
| 161 |
|
Gross benefits paid |
|
| (15,630 | ) |
|
| (14,860 | ) |
|
| (2,369 | ) |
|
| (2,769 | ) |
|
| (509 | ) |
|
| (761 | ) |
Fair value of plan assets at December 31 |
| $ | 161,374 |
|
| $ | 214,937 |
|
| $ | 41,679 |
|
| $ | 71,614 |
|
| $ | — |
|
| $ | — |
|
|
|
|
|
|
|
|
|
|
|
|
|
|
|
|
|
|
|
| ||||||
Funded status of the plans: |
|
|
|
|
|
|
|
|
|
|
|
|
|
|
|
|
|
| ||||||
Fair value of plan assets |
| $ | 161,374 |
|
| $ | 214,937 |
|
| $ | 41,679 |
|
| $ | 71,614 |
|
| $ | — |
|
| $ | — |
|
Less benefit obligations |
|
| 193,670 |
|
|
| 260,301 |
|
|
| 39,319 |
|
|
| 67,007 |
|
|
| 7,644 |
|
|
| 10,430 |
|
Funded status at December 31 |
| $ | (32,296 | ) |
| $ | (45,364 | ) |
| $ | 2,360 |
|
| $ | 4,607 |
|
| $ | (7,644 | ) |
| $ | (10,430 | ) |
|
| U.S. Pension Benefits(a) |
|
| Foreign Pension Benefits |
|
| Other Postretirement Benefits |
| |||||||||||||||
|
| 2017 |
|
| 2016 |
|
| 2017 |
|
| 2016 |
|
| 2017 |
|
| 2016 |
| ||||||
Change in projected benefit obligations: |
|
|
|
|
|
|
|
|
|
|
|
|
|
|
|
|
|
|
|
|
|
|
|
|
PBO at January 1 |
| $ | 244,440 |
|
| $ | 181,803 |
|
| $ | 66,910 |
|
| $ | 63,750 |
|
| $ | 19,059 |
|
| $ | 8,117 |
|
Åkers acquisition – PBO at March 3 |
|
| 0 |
|
|
| 68,081 |
|
|
| 0 |
|
|
| 5,393 |
|
|
| 0 |
|
|
| 17,467 |
|
Service cost |
|
| 1,651 |
|
|
| 1,714 |
|
|
| 150 |
|
|
| 314 |
|
|
| 492 |
|
|
| 504 |
|
Interest cost |
|
| 8,413 |
|
|
| 9,977 |
|
|
| 1,845 |
|
|
| 2,250 |
|
|
| 571 |
|
|
| 722 |
|
Plan amendments |
|
| 0 |
|
|
| 0 |
|
|
| 0 |
|
|
| 0 |
|
|
| 165 |
|
|
| (4,762 | ) |
Plan settlements(b) |
|
| 0 |
|
|
| (2,739 | ) |
|
| 0 |
|
|
| 0 |
|
|
| 0 |
|
|
| 0 |
|
Plan curtailments |
|
| 0 |
|
|
| (1,181 | ) |
|
| 0 |
|
|
| 0 |
|
|
| 0 |
|
|
| 0 |
|
Foreign currency exchange rate changes |
|
| 0 |
|
|
| 0 |
|
|
| 5,948 |
|
|
| (11,477 | ) |
|
| 0 |
|
|
| 0 |
|
Actuarial loss (gain) |
|
| 13,825 |
|
|
| (160 | ) |
|
| (7,954 | ) |
|
| 8,869 |
|
|
| (2,170 | ) |
|
| (1,598 | ) |
Participant contributions |
|
| 0 |
|
|
| 0 |
|
|
| 0 |
|
|
| 0 |
|
|
| 92 |
|
|
| 80 |
|
Benefits paid from plan assets |
|
| (12,950 | ) |
|
| (12,679 | ) |
|
| (1,813 | ) |
|
| (2,189 | ) |
|
| 0 |
|
|
| 0 |
|
Benefits paid by the Corporation |
|
| (403 | ) |
|
| (376 | ) |
|
| (473 | ) |
|
| 0 |
|
|
| (1,230 | ) |
|
| (1,471 | ) |
PBO at December 31 |
| $ | 254,976 |
|
| $ | 244,440 |
|
| $ | 64,613 |
|
| $ | 66,910 |
|
| $ | 16,979 |
|
| $ | 19,059 |
|
Change in plan assets: |
|
|
|
|
|
|
|
|
|
|
|
|
|
|
|
|
|
|
|
|
|
|
|
|
Fair value of plan assets at January 1 |
| $ | 188,722 |
|
| $ | 139,376 |
|
| $ | 48,055 |
|
| $ | 49,628 |
|
| $ | 0 |
|
| $ | 0 |
|
Åkers acquisition – fair value of plan assets at March 3 |
|
| 0 |
|
|
| 50,108 |
|
|
| 0 |
|
|
| 0 |
|
|
| 0 |
|
|
| 0 |
|
Actual return on plan assets |
|
| 23,366 |
|
|
| 14,656 |
|
|
| 3,998 |
|
|
| 7,859 |
|
|
| 0 |
|
|
| 0 |
|
Foreign currency exchange rate changes |
|
| 0 |
|
|
| 0 |
|
|
| 4,673 |
|
|
| (8,930 | ) |
|
| 0 |
|
|
| 0 |
|
Corporate contributions |
|
| 403 |
|
|
| 376 |
|
|
| 1,979 |
|
|
| 1,687 |
|
|
| 1,138 |
|
|
| 1,391 |
|
Participant contributions |
|
| 0 |
|
|
| 0 |
|
|
| 0 |
|
|
| 0 |
|
|
| 92 |
|
|
| 80 |
|
Plan settlements(b) |
|
| 0 |
|
|
| (2,739 | ) |
|
| 0 |
|
|
| 0 |
|
|
| 0 |
|
|
| 0 |
|
Gross benefits paid |
|
| (13,353 | ) |
|
| (13,055 | ) |
|
| (2,286 | ) |
|
| (2,189 | ) |
|
| (1,230 | ) |
|
| (1,471 | ) |
Fair value of plan assets at December 31 |
| $ | 199,138 |
|
| $ | 188,722 |
|
| $ | 56,419 |
|
| $ | 48,055 |
|
| $ | 0 |
|
| $ | 0 |
|
Funded status of the plans: |
|
|
|
|
|
|
|
|
|
|
|
|
|
|
|
|
|
|
|
|
|
|
|
|
Fair value of plan assets |
| $ | 199,138 |
|
| $ | 188,722 |
|
| $ | 56,419 |
|
| $ | 48,055 |
|
| $ | 0 |
|
| $ | 0 |
|
Less benefit obligations |
|
| 254,976 |
|
|
| 244,440 |
|
|
| 64,613 |
|
|
| 66,910 |
|
|
| 16,979 |
|
|
| 19,059 |
|
Funded status at December 31 |
| $ | (55,838 | ) |
| $ | (55,718 | ) |
| $ | (8,194 | ) |
| $ | (18,855 | ) |
| $ | (16,979 | ) |
| $ | (19,059 | ) |
|
|
|
|
The following providestables provide a summary of amounts recognized in the consolidated balance sheets at December 31, 2022 and 2021.
|
| U.S. Pension |
|
| Foreign Pension |
|
| Other Postretirement |
| |||||||||||||||
|
| 2022 |
|
| 2021 |
|
| 2022 |
|
| 2021 |
|
| 2022 |
|
| 2021 |
| ||||||
Employee benefit obligations: |
|
|
|
|
|
|
|
|
|
|
|
|
|
|
|
|
|
| ||||||
Prepaid pensions(a) |
| $ | — |
|
| $ | — |
|
| $ | 7,242 |
|
| $ | 11,963 |
|
| $ | — |
|
| $ | — |
|
Accrued payrolls and employee benefits(b) |
|
| (726 | ) |
|
| (740 | ) |
|
| — |
|
|
| — |
|
|
| (833 | ) |
|
| (932 | ) |
Employee benefit obligations(c) |
|
| (31,570 | ) |
|
| (44,624 | ) |
|
| (4,882 | ) |
|
| (7,356 | ) |
|
| (6,811 | ) |
|
| (9,498 | ) |
Total employee benefit obligations |
| $ | (32,296 | ) |
| $ | (45,364 | ) |
| $ | 2,360 |
|
| $ | 4,607 |
|
| $ | (7,644 | ) |
| $ | (10,430 | ) |
|
|
|
|
|
|
|
|
|
|
|
|
|
|
|
|
|
|
| ||||||
Accumulated other comprehensive loss:(d) |
|
|
|
|
|
|
|
|
|
|
|
|
|
|
|
|
|
| ||||||
Net actuarial loss (gain) |
| $ | 44,361 |
|
| $ | 51,476 |
|
| $ | 16,963 |
|
| $ | 16,046 |
|
| $ | (3,031 | ) |
| $ | (405 | ) |
Prior service cost (credit) |
|
| 8 |
|
|
| 15 |
|
|
| (5,952 | ) |
|
| (6,952 | ) |
|
| (4,767 | ) |
|
| (5,803 | ) |
Total accumulated other comprehensive loss |
| $ | 44,369 |
|
| $ | 51,491 |
|
| $ | 11,011 |
|
| $ | 9,094 |
|
| $ | (7,798 | ) |
| $ | (6,208 | ) |
49
|
| U.S. Pension Benefits |
|
| Foreign Pension Benefits |
|
| Other Postretirement Benefits |
| |||||||||||||||
|
| 2017 |
|
| 2016 |
|
| 2017 |
|
| 2016 |
|
| 2017 |
|
| 2016 |
| ||||||
Employee benefit obligations: |
|
|
|
|
|
|
|
|
|
|
|
|
|
|
|
|
|
|
|
|
|
|
|
|
Accrued payrolls and employee benefits(a) |
| $ | (432 | ) |
| $ | (409 | ) |
| $ | 0 |
|
| $ | 0 |
|
| $ | (1,371 | ) |
| $ | (1,276 | ) |
Employee benefit obligations(b) |
|
| (55,406 | ) |
|
| (55,309 | ) |
|
| (8,194 | ) |
|
| (18,855 | ) |
|
| (15,608 | ) |
|
| (17,783 | ) |
|
| $ | (55,838 | ) |
| $ | (55,718 | ) |
| $ | (8,194 | ) |
| $ | (18,855 | ) |
| $ | (16,979 | ) |
| $ | (19,059 | ) |
Accumulated other comprehensive loss:(c) |
|
|
|
|
|
|
|
|
|
|
|
|
|
|
|
|
|
|
|
|
|
|
|
|
Net actuarial loss (gain) |
| $ | 47,252 |
|
| $ | 48,153 |
|
| $ | 25,914 |
|
| $ | 25,547 |
|
| $ | (1,211 | ) |
| $ | 936 |
|
Prior service cost (credit) |
|
| 156 |
|
|
| 209 |
|
|
| (9,174 | ) |
|
| 0 |
|
|
| (13,809 | ) |
|
| (15,581 | ) |
|
| $ | 47,408 |
|
| $ | 48,362 |
|
| $ | 16,740 |
|
| $ | 25,547 |
|
| $ | (15,020 | ) |
| $ | (14,645 | ) |
|
|
|
|
|
|
Amounts included in accumulated other comprehensive loss asAs of December 31, 2017, expected to be recognized in net periodic pension and other postretirement costs in 2018 include:2022, estimated benefit payments for subsequent years are as follows:
|
| U.S. Pension Benefits |
|
| Foreign Pension Benefits |
|
| Other Postretirement Benefits |
| |||
Net actuarial loss (gain) |
| $ | 1,763 |
|
| $ | 784 |
|
| $ | (109 | ) |
Prior service cost (credit) |
|
| 52 |
|
|
| (324 | ) |
|
| (1,607 | ) |
|
| $ | 1,815 |
|
| $ | 460 |
|
| $ | (1,716 | ) |
|
| U.S. Pension |
|
| Foreign Pension |
|
| Other Postretirement |
| |||
2023 |
| $ | 16,017 |
|
| $ | 2,141 |
|
| $ | 856 |
|
2024 |
|
| 15,942 |
|
|
| 2,293 |
|
|
| 865 |
|
2025 |
|
| 15,782 |
|
|
| 2,275 |
|
|
| 846 |
|
2026 |
|
| 15,557 |
|
|
| 2,369 |
|
|
| 656 |
|
2027 |
|
| 15,320 |
|
|
| 2,322 |
|
|
| 618 |
|
2028-2032 |
|
| 72,418 |
|
|
| 12,808 |
|
|
| 2,610 |
|
Total benefit payments |
| $ | 151,036 |
|
| $ | 24,208 |
|
| $ | 6,451 |
|
Investment Policies and Strategies
The investment policies and strategies are determined by the Ampco-Pittsburgh Corporation Retirement Committee (the “Retirement Committee”) and monitored by the Finance and Investment Committee of the Board of Directors of the Corporation for the U.S. pension plansplan and by the Trustees (as appointed by UES-UK and the employees of UES-UK) for the UES-UK pension plan, each of whom employ their own investment managers to manage the plan’s assets in accordance with the policy guidelines. The foreign pension plans of Åkers are unfunded. In 2017, the U.SU.S. defined benefit pension plans adoptedplan follows a glide-path strategy whereby target asset allocations are rebalanced based on projected payment obligations and the funded status of the plans.plan. The U.K. defined benefit pension plan employs a liability-matching portfolio whereby a higher percentage of plan assets are invested in fixed-income securities. Pension assets of the UES-UK plan are invested with the objective of maximizing long-term returns while minimizing material losses to meet future benefit obligations as they become due. Investments in equity securities are primarily in common stocks of publicly traded U.S. and international companies across a broad spectrum of industry sectors. Investments in fixed-income securities are principally A-rated or better bonds with maturities of less than ten years, preferred stocks and convertible bonds. The Corporation believes there are no significant concentrations of risk associated with the Plans’ assets.plan maintaining self-sufficiency.
Attempts to minimize risk include allowing temporary changes to the allocation mix in response to market conditions, diversifying investments among asset categories (e.g., equity securities, fixed-income securities, alternative investments, cash and cash equivalents) and within these asset categories (e.g., economic sector, industry, geographic distribution, size) and consulting with independent financial and legal counsels to assure that the investments and their expected returns and risks are consistent with the goals of the BoardRetirement and Finance and Investment Committees or Trustees.
Investments in equity securities are primarily in common stocks of Directorspublicly-traded U.S. and international companies across a broad spectrum of industry sectors. Investments in fixed-income securities are principally A-rated or Trustees.
better bonds with maturities of less than ten years, preferred stocks and convertible bonds. Investments in equity and fixed-income securities are either direct or through designated mutual funds. The Corporation believes there are no significant concentrations of risk associated with the plans’ assets. With respect to the U.S. pension plans,plan, the following investments are prohibited unless otherwise approved by the Board of Directors: stock of the Corporation, futures and options except for hedging purposes, unregistered or restricted stock, warrants, margin trading, short-selling, real estate excluding public or real estate partnerships, and commodities including art, jewelry and gold. The foreignUES-UK pension plan invests in specific funds. Any investments other than those specifically identified would be considered prohibited.
The following table summarizes target asset allocations for 2022 (within +/-5% considered acceptable) and major asset categories. Certain investments are classified differently for target asset allocation purposes and external reporting purposes. AdoptionThe Corporation intends to continue to liquidate the alternative investments of the glide-path strategy in 2017 did not result in any significant changesU.S. pension plan to the target asset allocations. In December 2016, the Corporation changedprovide additional flexibility with investment managers for the legacy plan; accordingly, there was temporarily a higher amount in cash and cash equivalents.allocation.
|
| U.S. Pension Benefits |
|
| Foreign Pension Benefits |
| ||||||||||||||||||
|
| Target Allocation |
|
| Percentage of Plan Assets |
|
| Target Allocation |
|
| Percentage of Plan Assets |
| ||||||||||||
|
| Dec. 31, 2017 |
|
| 2017 |
|
| 2016 |
|
| Dec. 31, 2017 |
|
| 2017 |
|
| 2016 |
| ||||||
Equity Securities |
|
| 60 | % |
|
| 58 | % |
|
| 47 | % |
|
| 44 | % |
|
| 49 | % |
|
| 48 | % |
Fixed-Income Securities |
|
| 20 | % |
|
| 21 | % |
|
| 21 | % |
|
| 35 | % |
|
| 33 | % |
|
| 34 | % |
Alternative Investments |
|
| 15 | % |
|
| 16 | % |
|
| 8 | % |
|
| 21 | % |
|
| 17 | % |
|
| 18 | % |
Other (primarily cash and cash equivalents) |
|
| 5 | % |
|
| 5 | % |
|
| 24 | % |
|
| 0 | % |
|
| 1 | % |
|
| 0 | % |
|
| U.S. Pension Benefits |
|
| Foreign Pension Benefits |
| ||||||||||||||||||
|
| Target |
|
| Percentage of Plan |
|
| Target |
|
| Percentage of Plan |
| ||||||||||||
|
| Dec. 31, 2022 |
|
| 2022 |
|
| 2021 |
|
| Dec. 31, 2022 |
|
| 2022 |
|
| 2021 |
| ||||||
Equity securities |
|
| 54 | % |
|
| 45 | % |
|
| 50 | % |
|
| 0 | % |
|
| 0 | % |
|
| 15 | % |
Fixed-income securities |
|
| 43 | % |
|
| 49 | % |
|
| 43 | % |
|
| 89 | % |
|
| 89 | % |
|
| 44 | % |
Alternative investments |
|
| 0 | % |
|
| 4 | % |
|
| 4 | % |
|
| 2 | % |
|
| 2 | % |
|
| 29 | % |
Other (primarily cash and cash equivalents) |
|
| 3 | % |
|
| 2 | % |
|
| 3 | % |
|
| 9 | % |
|
| 9 | % |
|
| 12 | % |
Fair Value Measurement of Plan Assets
Equity securities, exchange-traded funds and(“ETFs”), mutual funds and treasury bonds are actively traded on exchanges or broker networks and price quotes for these investments are readily available. Similarly, fixed-income mutual funds consist of debt securities of U.S. and U.K. corporations andWhile not quoted on active exchanges, price quotes for these investmentscorporate and agency bonds are readily available. CommingledSimilarly, certain commingled funds are not traded publicly, but the underlying assets (such as stocks and bonds) held in thesethe funds are traded on active markets and the prices for the underlying assets are readily observable. For securities not actively traded, the fair value may be based on third-party appraisals, discounted cash flow analysis, benchmark yields, and inputs that are currently observable in markets for similar securities.
50
Investment Strategies
The significant investment strategies of the various funds are summarized below.
Fund | Investment Strategy | Primary Investment Objective |
Temporary Investment Funds | Invests primarily in a diversified portfolio of investment grade money market instruments. | Achieve a market level of current income while maintaining stability of principal and liquidity. |
Various Equity Funds | Each fund maintains a diversified holding in common stock of applicable companies (e.g., common stock of small capitalization companies if a small-cap fund, common stock of medium capitalization companies if a mid-cap fund, common stock of foreign corporations if an international fund, etc.). | Outperform the fund’s related index. |
Various | Invests primarily in a diversified portfolio of fixed-income securities of varying maturities or in commingled funds which invest in a diversified portfolio of fixed-income securities of varying maturities. |
|
Alternative Investments – Managed Funds | Invests in equities and equity-like asset classes and strategies (such as public equities, venture capital, private equity, real estate, natural resources, and | Generate a minimum annual inflation adjusted return of 5% and outperform a traditional 70/30 equities/bond portfolio. |
Alternative Investments | Invests in a diversified portfolio of alternative investment styles and | Generate long-term capital appreciation while maintaining a low correlation with the traditional global financial markets. |
Categories of Plan Assets
Asset categories based on the nature and risks of the U.S. Pension Benefit Plans’pension benefit plan's assets as of December 31, 2017,2022 are summarized below.
|
| Quoted Prices in |
|
| Significant Other |
|
| Significant |
|
| Total |
| ||||
Equity Securities: |
|
|
|
|
|
|
|
|
|
|
|
| ||||
U.S. |
|
|
|
|
|
|
|
|
|
|
|
| ||||
Consumer discretionary |
| $ | 2,697 |
|
| $ | — |
|
| $ | — |
|
| $ | 2,697 |
|
Consumer staples |
|
| 2,454 |
|
|
| — |
|
|
| — |
|
|
| 2,454 |
|
Energy |
|
| 1,112 |
|
|
| — |
|
|
| — |
|
|
| 1,112 |
|
Financial |
|
| 3,165 |
|
|
| — |
|
|
| — |
|
|
| 3,165 |
|
Healthcare |
|
| 5,967 |
|
|
| — |
|
|
| — |
|
|
| 5,967 |
|
Industrials |
|
| 4,222 |
|
|
| — |
|
|
| — |
|
|
| 4,222 |
|
Information technology |
|
| 5,631 |
|
|
| — |
|
|
| — |
|
|
| 5,631 |
|
Materials |
|
| 369 |
|
|
| — |
|
|
| — |
|
|
| 369 |
|
Mutual funds and ETFs |
|
| 43,408 |
|
|
| — |
|
|
| — |
|
|
| 43,408 |
|
Real estate |
|
| 279 |
|
|
| — |
|
|
| — |
|
|
| 279 |
|
Telecommunications |
|
| 1,183 |
|
|
| — |
|
|
| — |
|
|
| 1,183 |
|
Utilities |
|
| 324 |
|
|
| — |
|
|
| — |
|
|
| 324 |
|
International |
|
|
|
|
|
|
|
|
|
|
|
| ||||
Consumer discretionary |
|
| 66 |
|
|
| — |
|
|
| — |
|
|
| 66 |
|
Financial |
|
| 450 |
|
|
| — |
|
|
| — |
|
|
| 450 |
|
Healthcare |
|
| 123 |
|
|
| — |
|
|
| — |
|
|
| 123 |
|
Industrials |
|
| 463 |
|
|
| — |
|
|
| — |
|
|
| 463 |
|
Information technology |
|
| 438 |
|
|
| — |
|
|
| — |
|
|
| 438 |
|
Materials |
|
| 646 |
|
|
| — |
|
|
| — |
|
|
| 646 |
|
Total Equity Securities |
|
| 72,997 |
|
|
| — |
|
|
| — |
|
|
| 72,997 |
|
Fixed-Income Securities: |
|
|
|
|
|
|
|
|
|
|
|
| ||||
U.S. |
|
|
|
|
|
|
|
|
|
|
|
| ||||
Corporate bonds |
|
| — |
|
|
| 39,047 |
|
|
| — |
|
|
| 39,047 |
|
Treasury bonds |
|
| 26,247 |
|
|
| — |
|
|
| — |
|
|
| 26,247 |
|
Agency bonds |
|
| — |
|
|
| 231 |
|
|
| — |
|
|
| 231 |
|
Mutual funds and ETFs |
|
| 6,162 |
|
|
| — |
|
|
| — |
|
|
| 6,162 |
|
International |
|
|
|
|
|
|
|
|
|
|
|
| ||||
Corporate bonds |
|
| — |
|
|
| 5,983 |
|
|
| — |
|
|
| 5,983 |
|
Total Fixed-Income Securities |
|
| 32,409 |
|
|
| 45,261 |
|
|
| — |
|
|
| 77,670 |
|
Alternative Investments: |
|
|
|
|
|
|
|
|
|
|
|
| ||||
Managed funds(a) |
|
| — |
|
|
| — |
|
|
| 6,569 |
|
|
| 6,569 |
|
Total Alternative Investments |
|
| — |
|
|
| — |
|
|
| 6,569 |
|
|
| 6,569 |
|
Other: |
|
|
|
|
|
|
|
|
|
|
|
| ||||
Cash and cash equivalents(b) |
|
| 4,138 |
|
|
| — |
|
|
| — |
|
|
| 4,138 |
|
Total Other |
|
| 4,138 |
|
|
| — |
|
|
| — |
|
|
| 4,138 |
|
Total assets |
| $ | 109,544 |
|
| $ | 45,261 |
|
| $ | 6,569 |
|
| $ | 161,374 |
|
52
|
| Quoted Prices in Active Markets for Identical Inputs (Level 1) |
|
| Significant Other Observable Inputs (Level 2) |
|
| Significant Unobservable Inputs (Level 3) |
|
| Total |
| ||||
Equity Securities: |
|
|
|
|
|
|
|
|
|
|
|
|
|
|
|
|
U.S. |
|
|
|
|
|
|
|
|
|
|
|
|
|
|
|
|
Consumer discretionary |
| $ | 637 |
|
| $ | 0 |
|
| $ | 0 |
|
| $ | 637 |
|
Consumer staples |
|
| 896 |
|
|
| 0 |
|
|
| 0 |
|
|
| 896 |
|
Energy |
|
| 427 |
|
|
| 0 |
|
|
| 0 |
|
|
| 427 |
|
Financial |
|
| 1,362 |
|
|
| 0 |
|
|
| 0 |
|
|
| 1,362 |
|
Healthcare |
|
| 1,192 |
|
|
| 0 |
|
|
| 0 |
|
|
| 1,192 |
|
Industrials |
|
| 819 |
|
|
| 0 |
|
|
| 0 |
|
|
| 819 |
|
Information technology |
|
| 2,061 |
|
|
| 0 |
|
|
| 0 |
|
|
| 2,061 |
|
Materials |
|
| 248 |
|
|
| 0 |
|
|
| 0 |
|
|
| 248 |
|
Mutual funds |
|
| 91,258 |
|
|
| 0 |
|
|
| 0 |
|
|
| 91,258 |
|
Telecommunications |
|
| 198 |
|
|
| 0 |
|
|
| 0 |
|
|
| 198 |
|
Utilities |
|
| 204 |
|
|
| 0 |
|
|
| 0 |
|
|
| 204 |
|
Total Equity Securities |
|
| 99,302 |
|
|
| 0 |
|
|
| 0 |
|
|
| 99,302 |
|
Fixed Income Securities: |
|
|
|
|
|
|
|
|
|
|
|
|
|
|
|
|
Corporate bonds |
|
| 0 |
|
|
| 10,801 |
|
|
| 0 |
|
|
| 10,801 |
|
Mutual funds |
|
| 18,884 |
|
|
| 0 |
|
|
| 0 |
|
|
| 18,884 |
|
Treasury bonds |
|
| 6,976 |
|
|
| 0 |
|
|
| 0 |
|
|
| 6,976 |
|
Agency bonds |
|
| 0 |
|
|
| 926 |
|
|
| 0 |
|
|
| 926 |
|
Total Fixed Income Securities |
|
| 25,860 |
|
|
| 11,727 |
|
|
| 0 |
|
|
| 37,587 |
|
Alternative Investments: |
|
|
|
|
|
|
|
|
|
|
|
|
|
|
|
|
Managed funds(a) |
|
| 0 |
|
|
| 0 |
|
|
| 49,838 |
|
|
| 49,838 |
|
Total Alternative Investments |
|
| 0 |
|
|
| 0 |
|
|
| 49,838 |
|
|
| 49,838 |
|
Other: |
|
|
|
|
|
|
|
|
|
|
|
|
|
|
|
|
Cash and cash equivalents(b) |
|
| 11,012 |
|
|
| 0 |
|
|
| 0 |
|
|
| 11,012 |
|
Commingled funds |
|
| 0 |
|
|
| 174 |
|
|
| 0 |
|
|
| 174 |
|
Other(c) |
|
| 2 |
|
|
| 0 |
|
|
| 1,223 |
|
|
| 1,225 |
|
Total Other |
|
| 11,014 |
|
|
| 174 |
|
|
| 1,223 |
|
|
| 12,411 |
|
|
| $ | 136,176 |
|
| $ | 11,901 |
|
| $ | 51,061 |
|
| $ | 199,138 |
|
|
|
|
|
|
|
Asset categories based on the nature and risks of the U.S. Pension Benefit Plans’pension benefit plans' assets as of December 31, 2016,2021 are summarized below.
|
| Quoted Prices in |
|
| Significant Other |
|
| Significant |
|
| Total |
| ||||
Equity Securities: |
|
|
|
|
|
|
|
|
|
|
|
| ||||
U.S. |
|
|
|
|
|
|
|
|
|
|
|
| ||||
Consumer discretionary |
| $ | 6,442 |
|
| $ | — |
|
| $ | — |
|
| $ | 6,442 |
|
Consumer staples |
|
| 3,050 |
|
|
| — |
|
|
| — |
|
|
| 3,050 |
|
Energy |
|
| 1,167 |
|
|
| — |
|
|
| — |
|
|
| 1,167 |
|
Financial |
|
| 4,617 |
|
|
| — |
|
|
| — |
|
|
| 4,617 |
|
Healthcare |
|
| 10,526 |
|
|
| — |
|
|
| — |
|
|
| 10,526 |
|
Industrials |
|
| 8,089 |
|
|
| — |
|
|
| — |
|
|
| 8,089 |
|
Information technology |
|
| 11,819 |
|
|
| — |
|
|
| — |
|
|
| 11,819 |
|
Materials |
|
| 938 |
|
|
| — |
|
|
| — |
|
|
| 938 |
|
Mutual funds and ETFs |
|
| 58,440 |
|
|
| — |
|
|
| — |
|
|
| 58,440 |
|
Real estate |
|
| 824 |
|
|
| — |
|
|
| — |
|
|
| 824 |
|
Telecommunications |
|
| 2,388 |
|
|
| — |
|
|
| — |
|
|
| 2,388 |
|
Utilities |
|
| 146 |
|
|
| — |
|
|
| — |
|
|
| 146 |
|
International |
|
|
|
|
|
|
|
|
|
|
|
| ||||
Consumer discretionary |
|
| 426 |
|
|
| — |
|
|
| — |
|
|
| 426 |
|
Financial |
|
| 751 |
|
|
| — |
|
|
| — |
|
|
| 751 |
|
Healthcare |
|
| 880 |
|
|
| — |
|
|
| — |
|
|
| 880 |
|
Industrials |
|
| 1,410 |
|
|
| — |
|
|
| — |
|
|
| 1,410 |
|
Information technology |
|
| 2,065 |
|
|
| — |
|
|
| — |
|
|
| 2,065 |
|
Materials |
|
| 1,330 |
|
|
| — |
|
|
| — |
|
|
| 1,330 |
|
Total Equity Securities |
|
| 115,308 |
|
|
| — |
|
|
| — |
|
|
| 115,308 |
|
Fixed-Income Securities: |
|
|
|
|
|
|
|
|
|
|
|
| ||||
U.S. |
|
|
|
|
|
|
|
|
|
|
|
| ||||
Corporate bonds |
|
| — |
|
|
| 41,991 |
|
|
| — |
|
|
| 41,991 |
|
Treasury bonds |
|
| 28,694 |
|
|
| — |
|
|
| — |
|
|
| 28,694 |
|
Agency bonds |
|
| — |
|
|
| 257 |
|
|
| — |
|
|
| 257 |
|
Mutual funds and ETFs |
|
| 7,334 |
|
|
| — |
|
|
| — |
|
|
| 7,334 |
|
International |
|
|
|
|
|
|
|
|
|
|
|
| ||||
Corporate bonds |
|
| — |
|
|
| 3,711 |
|
|
| — |
|
|
| 3,711 |
|
Total Fixed-Income Securities |
|
| 36,028 |
|
|
| 45,959 |
|
|
| — |
|
|
| 81,987 |
|
Alternative Investments: |
|
|
|
|
|
|
|
|
|
|
|
| ||||
Managed funds(a) |
|
| — |
|
|
| — |
|
|
| 8,167 |
|
|
| 8,167 |
|
Total Alternative Investments |
|
| — |
|
|
| — |
|
|
| 8,167 |
|
|
| 8,167 |
|
Other: |
|
|
|
|
|
|
|
|
|
|
|
| ||||
Cash and cash equivalents(b) |
|
| 9,349 |
|
|
| — |
|
|
| — |
|
|
| 9,349 |
|
Other(c) |
|
| 76 |
|
|
| — |
|
|
| 50 |
|
|
| 126 |
|
Total Other |
|
| 9,425 |
|
|
| — |
|
|
| 50 |
|
|
| 9,475 |
|
Total assets |
| $ | 160,761 |
|
| $ | 45,959 |
|
| $ | 8,217 |
|
| $ | 214,937 |
|
53
|
| Quoted Prices in Active Markets for Identical Inputs (Level 1) |
|
| Significant Other Observable Inputs (Level 2) |
|
| Significant Unobservable Inputs (Level 3) |
|
| Total |
| ||||
Equity Securities: |
|
|
|
|
|
|
|
|
|
|
|
|
|
|
|
|
U.S. |
|
|
|
|
|
|
|
|
|
|
|
|
|
|
|
|
Bank & financial services |
| $ | 631 |
|
| $ | 0 |
|
| $ | 0 |
|
| $ | 631 |
|
Capital goods |
|
| 75 |
|
|
| 0 |
|
|
| 0 |
|
|
| 75 |
|
Chemicals |
|
| 20 |
|
|
| 0 |
|
|
| 0 |
|
|
| 20 |
|
Commercial services |
|
| 16 |
|
|
| 0 |
|
|
| 0 |
|
|
| 16 |
|
Electronics |
|
| 67 |
|
|
| 0 |
|
|
| 0 |
|
|
| 67 |
|
Health care |
|
| 201 |
|
|
| 0 |
|
|
| 0 |
|
|
| 201 |
|
Mutual funds |
|
| 72,571 |
|
|
| 0 |
|
|
| 0 |
|
|
| 72,571 |
|
Oil & gas |
|
| 87 |
|
|
| 0 |
|
|
| 0 |
|
|
| 87 |
|
Retail |
|
| 101 |
|
|
| 0 |
|
|
| 0 |
|
|
| 101 |
|
Technology |
|
| 188 |
|
|
| 0 |
|
|
| 0 |
|
|
| 188 |
|
Transportation |
|
| 18 |
|
|
| 0 |
|
|
| 0 |
|
|
| 18 |
|
Wholesale distribution |
|
| 16 |
|
|
| 0 |
|
|
| 0 |
|
|
| 16 |
|
Other (represents 8 business sectors) |
|
| 211 |
|
|
| 0 |
|
|
| 0 |
|
|
| 211 |
|
International |
|
|
|
|
|
|
|
|
|
|
|
|
|
|
|
|
Chemicals |
|
| 7 |
|
|
| 0 |
|
|
| 0 |
|
|
| 7 |
|
Technology |
|
| 6 |
|
|
| 0 |
|
|
| 0 |
|
|
| 6 |
|
Total Equity Securities |
|
| 74,215 |
|
|
| 0 |
|
|
| 0 |
|
|
| 74,215 |
|
Fixed Income Securities: |
|
|
|
|
|
|
|
|
|
|
|
|
|
|
|
|
Mutual funds |
|
| 36,601 |
|
|
| 0 |
|
|
| 0 |
|
|
| 36,601 |
|
Total Fixed Income Securities |
|
| 36,601 |
|
|
| 0 |
|
|
| 0 |
|
|
| 36,601 |
|
Alternative Investments: |
|
|
|
|
|
|
|
|
|
|
|
|
|
|
|
|
Managed funds(a) |
|
| 0 |
|
|
| 0 |
|
|
| 33,830 |
|
|
| 33,830 |
|
Total Alternative Investments |
|
| 0 |
|
|
| 0 |
|
|
| 33,830 |
|
|
| 33,830 |
|
Other: |
|
|
|
|
|
|
|
|
|
|
|
|
|
|
|
|
Cash and cash equivalents(b) |
|
| 27,902 |
|
|
| 0 |
|
|
| 0 |
|
|
| 27,902 |
|
Commingled funds |
|
| 0 |
|
|
| 154 |
|
|
| 0 |
|
|
| 154 |
|
Other(c) |
|
| 16,020 |
|
|
| 0 |
|
|
| 0 |
|
|
| 16,020 |
|
Total Other |
|
| 43,922 |
|
|
| 154 |
|
|
| 0 |
|
|
| 44,076 |
|
|
| $ | 154,738 |
|
| $ | 154 |
|
| $ | 33,830 |
|
| $ | 188,722 |
|
|
|
|
|
|
|
Asset categories based on the nature and risks of the Foreign Pension Benefit Plan’sforeign pension benefit plan’s assets as of December 31, 2017,2022 are summarized below.
|
| Quoted Prices in |
|
| Significant Other |
|
| Significant |
|
| Total |
| ||||
Fixed-Income Securities: |
|
|
|
|
|
|
|
|
|
|
|
| ||||
Commingled funds (U.K.) |
| $ | — |
|
| $ | 24,144 |
|
| $ | — |
|
| $ | 24,144 |
|
Commingled funds (International) |
|
| — |
|
|
| 13,355 |
|
|
| 831 |
|
|
| 14,186 |
|
Total Fixed-Income Securities |
|
| — |
|
|
| 37,499 |
|
|
| 831 |
|
|
| 38,330 |
|
Alternative Investments: |
|
|
|
|
|
|
|
|
|
|
|
| ||||
Absolute Return Funds |
|
| — |
|
|
| — |
|
|
| — |
|
|
| — |
|
Cash and cash equivalents |
|
| 647 |
|
|
| 2,702 |
|
|
| — |
|
|
| 3,349 |
|
Total assets |
| $ | 647 |
|
| $ | 40,201 |
|
| $ | 831 |
|
| $ | 41,679 |
|
|
| Quoted Prices in Active Markets for Identical Inputs (Level 1) |
|
| Significant Other Observable Inputs (Level 2) |
|
| Significant Unobservable Inputs (Level 3) |
|
| Total |
| ||||
Equity Securities: |
|
|
|
|
|
|
|
|
|
|
|
|
|
|
|
|
Commingled Funds (U.K.) |
| $ | 0 |
|
| $ | 4,617 |
|
| $ | 0 |
|
| $ | 4,617 |
|
Commingled Funds (International) |
|
| 0 |
|
|
| 23,015 |
|
|
| 0 |
|
|
| 23,015 |
|
Total Equity Securities |
|
| 0 |
|
|
| 27,632 |
|
|
| 0 |
|
|
| 27,632 |
|
Fixed-Income Securities: |
|
|
|
|
|
|
|
|
|
|
|
|
|
|
|
|
Commingled Funds (U.K.) |
|
| 0 |
|
|
| 18,851 |
|
|
| 0 |
|
|
| 18,851 |
|
Alternative Investments: |
|
|
|
|
|
|
|
|
|
|
|
|
|
|
|
|
Hedge and Absolute Return Funds |
|
| 0 |
|
|
| 0 |
|
|
| 9,637 |
|
|
| 9,637 |
|
Cash and cash equivalents |
|
| 299 |
|
|
| 0 |
|
|
| 0 |
|
|
| 299 |
|
|
| $ | 299 |
|
| $ | 46,483 |
|
| $ | 9,637 |
|
| $ | 56,419 |
|
Asset categories based on the nature and risks of the Foreign Pension Benefit Plan’sforeign pension benefit plan’s assets as of December 31, 2016,2021 are summarized below.
|
| Quoted Prices in |
|
| Significant Other |
|
| Significant |
|
| Total |
| ||||
Equity Securities: |
|
|
|
|
|
|
|
|
|
|
|
| ||||
Commingled funds (U.K.) |
| $ | — |
|
| $ | — |
|
| $ | 1,079 |
|
| $ | 1,079 |
|
Commingled funds (International) |
|
| — |
|
|
| 1,663 |
|
|
| 8,205 |
|
|
| 9,868 |
|
Total Equity Securities |
|
| — |
|
|
| 1,663 |
|
|
| 9,284 |
|
|
| 10,947 |
|
Fixed-Income Securities: |
|
|
|
|
|
|
|
|
|
|
|
| ||||
Commingled funds (U.K.) |
| $ | — |
|
|
| 16,320 |
|
|
| — |
|
|
| 16,320 |
|
Commingled funds (International) |
|
| — |
|
|
| 15,281 |
|
|
| 10,197 |
|
|
| 25,478 |
|
Total Fixed-Income Securities |
|
| — |
|
|
| 31,601 |
|
|
| 10,197 |
|
|
| 41,798 |
|
Multi-Asset Commingled Funds (International) |
|
| — |
|
|
| 9,077 |
|
|
| — |
|
|
| 9,077 |
|
Alternative Investments: |
|
|
|
|
|
|
|
|
|
|
|
| ||||
Absolute Return Funds |
|
| — |
|
|
| — |
|
|
| 1,347 |
|
|
| 1,347 |
|
Cash and cash equivalents |
|
| — |
|
|
| 8,445 |
|
|
| — |
|
|
| 8,445 |
|
Total assets |
| $ | — |
|
| $ | 50,786 |
|
| $ | 20,828 |
|
| $ | 71,614 |
|
|
| Quoted Prices in Active Markets for Identical Inputs (Level 1) |
|
| Significant Other Observable Inputs (Level 2) |
|
| Significant Unobservable Inputs (Level 3) |
|
| Total |
| ||||
Equity Securities: |
|
|
|
|
|
|
|
|
|
|
|
|
|
|
|
|
Commingled Funds (U.K.) |
| $ | 0 |
|
| $ | 3,716 |
|
| $ | 0 |
|
| $ | 3,716 |
|
Commingled Funds (International) |
|
| 0 |
|
|
| 19,146 |
|
|
| 0 |
|
|
| 19,146 |
|
Total Equity Securities |
|
| 0 |
|
|
| 22,862 |
|
|
| 0 |
|
|
| 22,862 |
|
Fixed-Income Securities: |
|
|
|
|
|
|
|
|
|
|
|
|
|
|
|
|
Commingled Funds (U.K.) |
|
| 0 |
|
|
| 16,426 |
|
|
| 0 |
|
|
| 16,426 |
|
Alternative Investments: |
|
|
|
|
|
|
|
|
|
|
|
|
|
|
|
|
Hedge and Absolute Return Funds |
|
| 0 |
|
|
| 0 |
|
|
| 8,593 |
|
|
| 8,593 |
|
Cash and cash equivalents |
|
| 174 |
|
|
| 0 |
|
|
| 0 |
|
|
| 174 |
|
|
| $ | 174 |
|
| $ | 39,288 |
|
| $ | 8,593 |
|
| $ | 48,055 |
|
The following table below sets forth a summary of changes in the fair value of the Level 3 plan assets for the U.S. and foreign pension benefit plans for the yearyears ended December 31, 2017.2022 and 2021.
|
| U.S. Pension Benefits |
| Foreign Pension Benefits |
| ||||||||||
|
| 2022 |
|
| 2021 |
| 2022 |
|
| 2021 |
| ||||
Fair value as of January 1 |
| $ | 8,167 |
|
| $ | 7,557 |
| $ | 20,828 |
|
| $ | 23,765 |
|
Transfers from other plan assets |
|
| — |
|
|
| — |
|
| — |
|
|
| 10,214 |
|
Transfers to other plan assets |
|
| (1,677 | ) |
|
| (1,600 | ) |
| (16,557 | ) |
|
| (16,957 | ) |
Realized gains |
|
| 526 |
|
|
| 273 |
|
| 1,763 |
|
|
| 5,989 |
|
Change in net unrealized (losses) gains |
|
| (447 | ) |
|
| 1,937 |
|
| (3,109 | ) |
|
| (2,085 | ) |
Other, primarily impact from changes in foreign currency |
|
| — |
|
|
| — |
|
| (2,094 | ) |
|
| (98 | ) |
Fair value as of December 31 |
| $ | 6,569 |
|
| $ | 8,167 |
| $ | 831 |
|
| $ | 20,828 |
|
|
|
|
| Alternative Investments |
| |||||
|
|
|
| U.S. Pension Benefits |
|
| Foreign Pension Benefits |
| ||
Fair value as of January 1, 2017 |
|
|
| $ | 33,830 |
|
| $ | 8,593 |
|
Contributions |
|
|
|
| 16,000 |
|
|
| 0 |
|
Withdrawals |
|
|
|
| (5,364 | ) |
|
| 0 |
|
Realized gains |
|
|
|
| 1,304 |
|
|
| 0 |
|
Change in net unrealized gains |
|
|
|
| 4,068 |
|
|
| 229 |
|
Other, primarily impact from changes in foreign currency exchange rates |
|
|
|
| 0 |
|
|
| 815 |
|
Fair value as of December 31, 2017 |
|
|
| $ | 49,838 |
|
| $ | 9,637 |
|
The table below sets forth a summary of changes in the fair value of the Level 3 plan assets for U.S. and foreign pension plans for the year ended December 31, 2016.
54
|
| Alternative Investments |
| |||||||||
|
| U.S. Pension Benefits |
|
| Foreign Pension Benefits |
| ||||||
Fair value as of January 1, 2016 |
| $ | 4,967 |
|
| $ | 32,210 |
|
| $ | 10,571 |
|
Withdrawals |
|
| (4,967 | ) |
|
| 0 |
|
|
| 0 |
|
Realized gains |
|
| 0 |
|
|
| 1,857 |
|
|
| 0 |
|
Change in net unrealized losses |
|
| 0 |
|
|
| (237 | ) |
|
| (280 | ) |
Other, primarily impact from changes in foreign currency exchange rates |
|
| 0 |
|
|
| 0 |
|
|
| (1,698 | ) |
Fair value as of December 31, 2016 |
| $ | 0 |
|
| $ | 33,830 |
|
| $ | 8,593 |
|
Net Periodic Pension and Other Postretirement Benefit Costs
The actual return on the fair value of the plan assets is included in determining the funded status of the plans. In determining net periodic pension benefit costs, the expected long-term rate of return on the market-related value of the plan assets is used. Differences between the actual return on the fair value of the plan assets and the expected long-term rate of return on the market-related value of the plan assets are classified as part of unrecognized actuarial gains or losses and are recorded as a component of accumulated other comprehensive loss on the consolidated balance sheet. When these gains or losses exceed 10%10% of the greater of the projected benefit obligation or the market-related value of plan assets, they are amortized to net periodic pension and other postretirement benefit costs over the average remaining service period or life expectancy of the employees expected to receive benefits under the plans. When the gains or losses are less than 10%10% of the greater of the projected benefit obligation or the market-related value of plan assets, they are included in net periodic pension and other postretirement benefit costs indirectly as a result of lower/higher interest costs arising from a decrease/increase in the projected benefit obligation.
Net periodic pension and other postretirement benefit costs include the following components for each of the year ended December 31:years.
|
| U.S. Pension Benefits |
|
| Foreign Pension Benefits |
|
| Other Postretirement Benefits |
|
| U.S. Pension |
|
| Foreign Pension |
|
| Other Postretirement |
| ||||||||||||||||||||||||||||||||||||||||||
|
| 2017 |
|
| 2016 |
|
| 2015 |
|
| 2017 |
|
| 2016 |
|
| 2015 |
|
| 2017 |
|
| 2016 |
|
| 2015 |
|
| 2022 |
|
| 2021 |
|
| 2022 |
|
| 2021 |
|
| 2022 |
|
| 2021 |
| |||||||||||||||
Service cost |
| $ | 1,651 |
|
| $ | 1,714 |
|
| $ | 2,743 |
|
| $ | 150 |
|
| $ | 314 |
|
| $ | 0 |
|
| $ | 492 |
|
| $ | 504 |
|
| $ | 384 |
|
| $ | 51 |
|
| $ | 243 |
|
| $ | 286 |
|
| $ | 375 |
|
| $ | 234 |
|
| $ | 245 |
|
Interest cost |
|
| 8,413 |
|
|
| 9,977 |
|
|
| 7,990 |
|
|
| 1,845 |
|
|
| 2,250 |
|
|
| 2,394 |
|
|
| 571 |
|
|
| 722 |
|
|
| 474 |
| ||||||||||||||||||||||||
Interest cost |
|
| 6,185 |
|
|
| 5,349 |
|
|
| 1,079 |
|
|
| 829 |
|
|
| 220 |
|
|
| 182 |
| ||||||||||||||||||||||||||||||||||||
Expected return on plan assets |
|
| (12,503 | ) |
|
| (13,424 | ) |
|
| (10,996 | ) |
|
| (2,239 | ) |
|
| (2,461 | ) |
|
| (2,681 | ) |
|
| 0 |
|
|
| 0 |
|
|
| 0 |
|
|
| (13,207 | ) |
|
| (12,995 | ) |
|
| (1,945 | ) |
|
| (1,935 | ) |
|
| — |
|
|
| — |
|
Amortization of: |
|
|
|
|
|
|
|
|
|
|
|
|
|
|
|
|
|
|
|
|
|
|
|
|
|
|
|
|
|
|
|
|
|
|
|
|
|
|
|
|
|
|
|
|
|
|
|
|
|
|
|
|
|
| ||||||
Prior service cost (credit) |
|
| 52 |
|
|
| 44 |
|
|
| 371 |
|
|
| 0 |
|
|
| 0 |
|
|
| 0 |
|
|
| (1,607 | ) |
|
| (1,277 | ) |
|
| (672 | ) | ||||||||||||||||||||||||
Prior service cost (credit) |
|
| 8 |
|
|
| 23 |
|
|
| (275 | ) |
|
| (306 | ) |
|
| (1,035 | ) |
|
| (1,030 | ) | ||||||||||||||||||||||||||||||||||||
Actuarial loss (gain) |
|
| 4,111 |
|
|
| 3,324 |
|
|
| 5,440 |
|
|
| 751 |
|
|
| 670 |
|
|
| 845 |
|
|
| (24 | ) |
|
| 36 |
|
|
| 26 |
|
|
| 2,231 |
|
|
| 2,632 |
|
|
| 322 |
|
|
| 635 |
|
|
| (135 | ) |
|
| (78 | ) |
Curtailment (gain) loss |
|
| 0 |
|
|
| (887 | ) |
|
| 1,303 |
|
|
| 0 |
|
|
| 0 |
|
|
| 0 |
|
|
| 0 |
|
|
| 0 |
|
|
| 0 |
| ||||||||||||||||||||||||
|
| $ | 1,724 |
|
| $ | 748 |
|
| $ | 6,851 |
|
| $ | 507 |
|
| $ | 773 |
|
| $ | 558 |
|
| $ | (568 | ) |
| $ | (15 | ) |
| $ | 212 |
| ||||||||||||||||||||||||
Total net periodic pension and other postretirement benefit costs |
| $ | (4,732 | ) |
| $ | (4,748 | ) |
| $ | (533 | ) |
| $ | (402 | ) |
| $ | (716 | ) |
| $ | (681 | ) | ||||||||||||||||||||||||||||||||||||
Assumptions
Assumptions
Assumptions are reviewed on an annual basis. The expected long-term rate of return on plan assets is an estimate of average rates of earnings expected to be earned on funds invested, or to be invested, to provide for the benefits included in the projected benefit obligation. Since these benefits will be paid over many years, the expected long-term rate of return is reflective of current investment returns and investment returns over a longer period. Consideration is also given to target and actual asset allocations, inflation and real risk-free return. A percentage point decrease in the expected long-term rate of return would increase annual pension expense by approximately $2,600. Conversely, a percentage point increase in the expected long-term rate of return would decrease annual pension expense by approximately $2,600. The discount rates used in determining future pension obligations and other postretirement benefits for each of the plans are based on rates of return on high-quality fixed-income investments currently available, and expected to be available, during the period to maturity of the pension and other postretirement benefits. High-quality fixed-income investments are defined as those investments which have received one of the two highest ratings given by a recognized rating agency with maturities of 10+10+ years. With the increase in interest rates during 2022 and the resulting impact on bond yields, the discount rate rose significantly at December 31, 2022 when compared to December 31, 2021. Assumptions about wage increases are not relevant since substantially all the benefits available under the defined benefit pension plans are either frozen or based on a multiplier, versus wages.
The discount rates and weighted-average wage increases used to determine the benefit obligations as of December 31, 2017,2022 and 2016,2021 are summarized below.
|
| U.S. Pension Benefits |
| Foreign Pension Benefits |
| Other Postretirement Benefits | ||||||
|
| 2017 |
| 2016 |
| 2017 |
| 2016 |
| 2017 |
| 2016 |
Discount rate |
| 3.63-3.72% |
| 4.02-4.25% |
| 2.45% |
| 2.50-2.65% |
| 3.46-3.69% |
| 3.90-4.13% |
Wage increases |
| 3.00% |
| 3.00% |
| n/a |
| n/a |
| n/a |
| n/a |
|
| U.S. Pension |
| Foreign Pension |
| Other Postretirement | ||||||
|
| 2022 |
| 2021 |
| 2022 |
| 2021 |
| 2022 |
| 2021 |
Discount rate |
| 5.48-5.49% |
| 2.79-2.91% |
| 4.85% |
| 1.95% |
| 5.49% |
| 2.91% |
In addition, the assumed health care cost trend rate at December 31, 2017,2022 for other postretirement benefits, is 6%6.50% for 20182023 gradually decreasing to 4.75%4.75% in 2020.2028. In selecting rates for current and long-term health care assumptions, the Corporation considers known health care cost increases, the design of the benefit programs, the demographics of its active and retiree populations, and expectations of inflation rates in the future. A one percentage point increase or decrease in the assumed health care cost trend rate would result in an inconsequential change to the postretirement benefit obligation at December 31, 2017, and the annual benefit expense for 2017.
The following assumptions were used to determine net periodic pension and other postretirement benefit costs for the yearyears ended December 31:31, 2022 and 2021.
|
| U.S. Pension |
| Foreign Pension |
| Other Postretirement | ||||||
|
| 2022 |
| 2021 |
| 2022 |
| 2021 |
| 2022 |
| 2021 |
Discount rate |
| 2.79-2.91% |
| 2.50-2.63% |
| 1.95% |
| 1.45% |
| 2.91% |
| 2.61% |
Expected long-term rate of return |
| 6.94% |
| 6.50-7.00% |
| 3.00% |
| 2.90% |
| n/a |
| n/a |
55
|
| U.S. Pension Benefits |
| Foreign Pension Benefits |
| Other Postretirement Benefits | ||||||||||||
|
| 2017 |
| 2016 |
| 2015 |
| 2017 |
| 2016 |
| 2015 |
| 2017 |
| 2016 |
| 2015 |
Discount rate |
| 4.02-4.25% |
| 4.20-4.40% |
| 4.00-4.10% |
| 2.50-2.65% |
| 3.00-3.65% |
| 3.50% |
| 3.90-4.13% |
| 3.80-4.20% |
| 4.00% |
Expected long-term rate of return |
| 6.95-7.50% |
| 6.90-7.75% |
| 8.00% |
| 4.45% |
| 5.40% |
| 5.40% |
| n/a |
| n/a |
| n/a |
Wages increases |
| 3.00% |
| 3.00% |
| 4.00% |
| n/a |
| n/a |
| n/a |
| n/a |
| n/a |
| n/a |
NOTE 1012 – COMMITMENTS AND CONTINGENT LIABILITIES:
Outstanding standby and commercial letters of credit as of December 31, 2017,2022 approximated $22,576, the majority$18,970, of which approximately half serves as collateral for the IRB debt. In addition, in connection with the acquisition of Åkers, the Corporation issued twooutstanding surety bonds to PRI Pensionsgaranti, guaranteeing certain obligations of Åkers Sweden ABthe two unfunded foreign defined benefit pension plans approximated $3,300 (SEK 33,900) as of December 31, 2022.
The Corporation has undertaken a significant capital program to upgrade existing equipment at certain of its FCEP locations which is anticipated to cost approximately $27,000 and Åkers AB under a credit insurance policy relating to pension commitments. The total amount coveredbe substantially completed by December 31, 2023. At December 31, 2022, commitments for future capital expenditures, including those associated with the surety bonds is approximately $4,000 (SEK 33,900)FCEP capital program, approximated $16,400.
Approximately 39%34% of the Corporation’s employees are covered by collective bargaining agreements. Of the nine bargaining agreements one of theor agreements representing approximately 19% of the covered employees, expired in 2017; however, employees continue to work under the expired agreement while negotiations proceed. The remaining agreementswith works councils that have expiration dates ranging from September 2023 to May 2018 to September 2020.2026. Collective bargaining agreements and agreements with works councils expiring in 20182023 (representing approximately 54%59% of the covered employees) will be negotiated with the intent to secure mutually beneficial, long-term arrangements.
See Note 1315 regarding derivative instruments, Note 1920 regarding litigation and Note 2022 for environmental matters.
NOTE 13 – EQUITY RIGHTS OFFERING:
In September 2020, the Corporation completed an equity rights offering, issuing 5,507,889 shares of its common stock and 12,339,256 Series A warrants to existing shareholders. The shares of common stock and warrants are classified as equity instruments in the consolidated statements of shareholders’ equity. Additional proceeds may be received from the future exercise of the Series A warrants. Each Series A warrant provides the holder with the right to purchase 0.4464 shares of common stock at an exercise price of $2.5668, or $5.75 per whole share of common stock, and expires on August 1, 2025. In 2021, the Corporation received proceeds of $3,308 from shareholders who exercised 1,289,009 Series A warrants, equating to the issuance of 575,405 common shares.
In May 2022, the Corporation filed a Tender Offer and Prospectus Supplement (the “Offer”) with the SEC pursuant to which the exercise price of each tendered Series A warrant was temporarily reduced. During the Offer period, the holders of Series A warrants were given the opportunity to exercise their Series A warrants at a temporarily reduced cash exercise price of $1.7856 per Series A warrant (or $4.00 per whole share of common stock). The Offer expired on July 15, 2022. The Corporation raised $193 in gross proceeds resulting from the tender and exercise of 108,378 Series A warrants. Series A warrants not exercised during the Offer period reverted to their original terms including the right to purchase 0.4464 shares of common stock at an exercise price of $2.5668, or $5.75 per whole share of common stock. Stock issuance costs approximated $193 and were recorded against the proceeds in additional paid-in capital.
The following summarizes outstanding warrants as of December 31, 2022 and 2021 and activity for the years then ended.
Number of Warrants | ||||||
Outstanding as of January 1, 2021 | 12,339,256 | |||||
Issued | — | |||||
Converted to common stock | (1,289,009 | ) | ||||
Outstanding as of December 31, 2021 | 11,050,247 | |||||
Issued | — | |||||
Converted to common stock | (108,378 | ) | ||||
Outstanding as of December 31, 2022 | 10,941,869 | |||||
56
NOTE 1114 – ACCUMULATED OTHER COMPREHENSIVE LOSS:
Net changes and ending balances for the various components of other comprehensive income (loss) and for accumulated other comprehensive loss as of and for the years ended December 31, 2022 and 2021 are summarized below.
|
| Foreign |
|
| Unrecognized |
|
| Derivatives |
|
| Total Accumulated |
|
| Noncontrolling Interest |
|
| Accumulated |
| ||||||
January 1, 2021 |
| $ | (11,371 | ) |
| $ | (57,652 | ) |
| $ | 589 |
|
| $ | (68,434 | ) |
| $ | 261 |
|
| $ | (68,695 | ) |
Net change |
|
| (2,951 | ) |
|
| 17,089 |
|
|
| (312 | ) |
|
| 13,826 |
|
|
| 237 |
|
|
| 13,589 |
|
December 31, 2021 |
|
| (14,322 | ) |
|
| (40,563 | ) |
|
| 277 |
|
|
| (54,608 | ) |
|
| 498 |
|
|
| (55,106 | ) |
Net change |
|
| (11,848 | ) |
|
| 7,940 |
|
|
| (125 | ) |
|
| (4,033 | ) |
|
| (727 | ) |
|
| (3,306 | ) |
December 31, 2022 |
| $ | (26,170 | ) |
| $ | (32,623 | ) |
| $ | 152 |
|
| $ | (58,641 | ) |
| $ | (229 | ) |
| $ | (58,412 | ) |
The following summarizes the line items affected on the consolidated statements of operations for components reclassified from accumulated other comprehensive loss for the years ended December 31, 2022 and 2021. Amounts in parentheses represent credits to net income (loss).
|
| 2022 |
|
| 2021 |
| ||
Amortization of unrecognized employee benefit costs: |
|
|
|
|
|
| ||
Other – net |
| $ | 1,116 |
|
| $ | 1,876 |
|
Income tax (provision) |
|
| (1 | ) |
|
| (50 | ) |
Net of income tax |
| $ | 1,115 |
|
| $ | 1,826 |
|
Settlement of cash flow hedges: |
|
|
|
|
|
| ||
Depreciation and amortization (foreign currency purchase contracts) |
| $ | (27 | ) |
| $ | (27 | ) |
Costs of products sold (excluding depreciation and amortization) |
|
| 426 |
|
|
| (1,092 | ) |
Total before income tax |
|
| 399 |
|
|
| (1,119 | ) |
Income tax (provision) benefit |
|
| (12 | ) |
|
| 33 |
|
Net of income tax |
| $ | 387 |
|
| $ | (1,086 | ) |
The income tax effect associated with the various components of other comprehensive income (loss) for the years ended December 31, 2022 and 2021 is summarized below. Amounts in parentheses represent credits to net income (loss) when reclassified to earnings. Certain amounts have no tax effect due to the Corporation having a valuation allowance recorded against the deferred income tax assets for the jurisdiction where the income or expense is recognized. Foreign currency translation adjustments exclude the effect of income taxes since earnings of non-U.S. subsidiaries are deemed to be re-invested for an indefinite period of time.
|
| 2022 |
|
| 2021 |
| ||
Income tax effect associated with changes in: |
|
|
|
|
|
| ||
Unrecognized employee benefit costs |
| $ | 1,554 |
|
| $ | (1,049 | ) |
Fair value of cash flow hedges |
|
| 16 |
|
|
| (38 | ) |
Income tax effect associated with reclassification adjustments: |
|
|
|
|
|
| ||
Amortization of unrecognized employee benefit costs |
|
| (1 | ) |
|
| (50 | ) |
Settlement of cash flow hedges |
|
| (12 | ) |
|
| 33 |
|
57
NOTE 15 – DERIVATIVE INSTRUMENTS:
Certain divisions of the ALP segment are subject to risk from increases in the price of commodities (copper and aluminum) used in the production of inventory. To minimize this risk, futures contracts are entered into which are designated as cash flow hedges. At December 31, 2022, approximately 43% or $2,216 of anticipated copper purchases over the next eight months and 57% or $751 of anticipated aluminum purchases over the next seven months are hedged. At December 31, 2021, approximately 67% or $3,434 of anticipated copper purchases over the next eight months and 56% or $684 of anticipated aluminum purchases over the next six months were hedged.
At December 31, 2022, the Corporation has purchase commitments covering approximately 25% or $760 of anticipated natural gas usage through December 31, 2023, for one of its subsidiaries and approximately 25% or $1,547 of anticipated electricity usage through December 31, 2025,for one of its subsidiaries. Purchases of natural gas and electricity under previously existing commitments approximated $3,077 for 2022. No purchase commitments for anticipated natural gas usage were outstanding during 2021; however, at December 31, 2021, the Corporation had purchase commitments covering approximately 29% or $1,753 of anticipated natural gas usage through December 31, 2023, for one of its subsidiaries and approximately 34% or $2,125 of anticipated electricity usage through December 31, 2024, for two of its subsidiaries. The commitments qualify as normal purchases and, accordingly, are not reflected on the consolidated balance sheet.
The Corporation previously entered into foreign currency purchase contracts to manage the volatility associated with euro-denominated progress payments to be made for certain machinery and equipment. Upon occurrence of an anticipated purchase and placement of the underlying fixed assets in service, the foreign currency purchase contract is settled and the change in fair value deferred in accumulated other comprehensive loss is reclassified to earnings (depreciation and amortization expense) over the life of the underlying asset. As of December 31, 2010, all contracts had been settled, the underlying fixed assets were placed in service and the change in fair value of the foreign currency purchase contract deferred in accumulated other comprehensive loss is being amortized to earnings over the life of the underlying assets.
No portion of the existing cash flow hedges is considered to be ineffective, including any ineffectiveness arising from the unlikelihood of an anticipated transaction to occur. Additionally, no amounts have been excluded from assessing the effectiveness of a hedge. The Corporation does not enter into derivative transactions for speculative purposes and, therefore, holds no derivative instruments for trading purposes.
The change in the fair value of the cash flow contracts is recorded as a component of accumulated other comprehensive loss. Amounts recognized as and reclassified from accumulated other comprehensive loss are recorded as a component of other comprehensive income (loss) and are summarized below. Amounts are after-tax, where applicable. Certain amounts recognized as or reclassified from comprehensive income (loss) for 2022 and 2021 have no tax effect due to the Corporation recording a valuation allowance against the deferred income tax assets in the related jurisdictions.
For the Year Ended December 31, 2022 |
| Beginning of |
|
| Recognized |
|
| Reclassified |
|
| End of |
| ||||
Foreign currency purchase contracts |
| $ | 135 |
|
| $ | — |
|
| $ | 27 |
|
| $ | 108 |
|
Future contracts – copper and aluminum |
|
| 142 |
|
|
| (512 | ) |
|
| (414 | ) |
|
| 44 |
|
Change in fair value |
| $ | 277 |
|
| $ | (512 | ) |
| $ | (387 | ) |
| $ | 152 |
|
|
|
|
|
|
|
|
|
|
|
|
|
| ||||
For the Year Ended December 31, 2021 |
|
|
|
|
|
|
|
|
|
|
|
| ||||
Foreign currency purchase contracts |
| $ | 162 |
|
| $ | — |
|
| $ | 27 |
|
| $ | 135 |
|
Future contracts – copper and aluminum |
|
| 427 |
|
|
| 774 |
|
|
| 1,059 |
|
|
| 142 |
|
Change in fair value |
| $ | 589 |
|
| $ | 774 |
|
| $ | 1,086 |
|
| $ | 277 |
|
The change in fair value reclassified or expected to be reclassified from accumulated other comprehensive loss to earnings is summarized below. All amounts are pre-tax.
|
| Location of Gain (Loss) in |
| Estimated to be |
|
| Years Ended December 31, |
| ||||||
|
| Consolidated Statements of Operations |
| 12 Months |
|
| 2022 |
|
| 2021 |
| |||
Foreign currency purchase contracts |
| Depreciation and amortization |
| $ | 27 |
|
| $ | 27 |
|
| $ | 27 |
|
Futures contracts – copper and |
| Costs of products sold (excluding depreciation and amortization) |
|
| 44 |
|
|
| (414 | ) |
|
| 1,059 |
|
Losses on foreign exchange transactions included in other income (expense) approximated $2,293 and $(1,134) for 2022 and 2021, respectively.
58
NOTE 16 – FAIR VALUE:
The following summarizes financial assets and liabilities reported at fair value on a recurring basis in the consolidated balance sheets at December 31:
2022 |
| Quoted Prices |
|
| Significant |
|
| Significant |
|
| Total |
| ||||
Investments |
|
|
|
|
|
|
|
|
|
|
|
| ||||
Other noncurrent assets |
| $ | 3,353 |
|
| $ | — |
|
| $ | — |
|
| $ | 3,353 |
|
|
|
|
|
|
|
|
|
|
|
|
|
| ||||
2021 |
|
|
|
|
|
|
|
|
|
|
|
| ||||
Investments |
|
|
|
|
|
|
|
|
|
|
|
| ||||
Other noncurrent assets |
| $ | 4,860 |
|
| $ | — |
|
| $ | — |
|
| $ | 4,860 |
|
The investments held as other noncurrent assets represent assets held in the “Rabbi” trust for the purpose of providing benefits under the non-qualified defined benefit pension plan. The fair value of the investments is based on quoted prices of the investments in active markets. The fair value of foreign currency exchange contracts is determined based on the fair value of similar contracts with similar terms and remaining maturities. The fair value of futures contracts is based on market quotations. The fair values of the variable-rate IRB debt and borrowings under the revolving credit facility and other debt facilities approximate their carrying values. Additionally, the fair values of trade receivables and trade payables approximate their carrying values.
NOTE 17 – REVENUE:
Net sales by geographic area and product line for the years ended December 31, 2022 and 2021 are outlined below. Net sales are attributed to the geographic areas based on the location of the customer. Sales to individual foreign countries were less than 10% of consolidated net sales for each of the years.
|
| Net Sales by Geographic Area |
| |||||
|
| 2022 |
|
| 2021 |
| ||
United States |
| $ | 204,952 |
|
| $ | 178,090 |
|
Foreign |
|
| 185,237 |
|
|
| 166,830 |
|
Consolidated total |
| $ | 390,189 |
|
| $ | 344,920 |
|
|
| Net Sales by Product Line |
| |||||
|
| 2022 |
|
| 2021 |
| ||
Forged and cast mill rolls |
| $ | 256,559 |
|
| $ | 234,926 |
|
Forged engineered products |
|
| 42,925 |
|
|
| 25,278 |
|
Heat exchange coils |
|
| 31,395 |
|
|
| 24,372 |
|
Air handling systems |
|
| 29,436 |
|
|
| 26,477 |
|
Centrifugal pumps |
|
| 29,874 |
|
|
| 33,867 |
|
Consolidated total |
| $ | 390,189 |
|
| $ | 344,920 |
|
59
NOTE 18 – STOCK-BASED COMPENSATION:
In May 2016, the shareholders of the Corporation approved the adoption of theThe Ampco-Pittsburgh Corporation 2016 Omnibus Incentive Plan, as amended (the “Incentive Plan”), which authorizes the issuance of up to 1,100,0002,700,000 shares of the Corporation’s common stock for awards under the Incentive Plan. The Incentive Plan replaces the 2011 Omnibus Incentive Plan (the “Predecessor Plan”). No new awards will be granted under the Predecessor Plan. Any awards outstanding under the Predecessor Plan will remain subject to and be paid under the Predecessor Plan, and any shares subject to outstanding awards under the Predecessor Plan that subsequently expire, terminate, or are surrendered or forfeited for any reason without issuance of shares (equal to 84,667 shares at December 31, 2017) will automatically become available for issuance under the Incentive Plan.
Awards under the Incentive Plan may include incentive stock options and non-qualified stock options, stock appreciation rights, restricted shares and restricted stock units, performance awards, other stock-based awards, or short-term cash incentive awards. If any award is canceled, terminates, expires, or lapses for any reason prior to the issuance of the shares, or if the shares are issued under the Incentive Plan and thereafter are forfeited to the Corporation, the shares subject to such awards and the forfeited shares will not count against the aggregate number of shares available under the Incentive Plan. Shares tendered or withheld to pay the option exercise price or tax withholding will continue to count against the aggregate number of shares of common stock available for grant under the Incentive Plan. Any shares repurchased by the Corporation with cash proceeds from the exercise of options will not be added back to the pool of shares available for grant under the Incentive Plan.
The Incentive Plan may be administered by the Board of Directors or the Compensation Committee of the Board of Directors. The Compensation Committee has the authority to determine, within the limits of the express provisions of the Incentive Plan, the individuals to whom the awards will be granted and the nature, amount and terms of such awards.
The Incentive Plan also provides for equity-based awards during any one year to non-employee members of the Board of Directors, based on the grant date fair value, not to exceed $200.$200. The limit does not apply to shares received by a non-employee director at his or her election in lieu of all or a portion of the director’s retainer for board service. The number of shares of common stock issued to non-employee directors was 50,000, 32,090 and 14,310 in 2017, 2016 and 2015, respectively.
The Compensation Committee has granted stock options, time-vesting restricted stock units (RSUs) and performance-vesting restricted stock units (PSUs) to select individuals. Each stock option represents the right to purchase one share of common stock of the Corporation at a designated price, subject to the terms and conditions of the stock option award agreement. All stock options are fully vested. Each RSU represents the right to receive one share of common stock of the Corporation at a future date after the RSU has become earned and vested, subject to the terms and conditions of the RSU award agreement. The RSUs typically vest over a three-year period. The PSUs can be earned depending upon the achievement of a performance or market condition and a time-vesting condition as follows: (i) achievement of a targeted basic earnings per share during thereturn on invested capital over a three-year performance period beginning in the year of grant and continuing for two subsequent years;period; (ii) achievement of a three-year cumulative relative total shareholder return as ranked against other companies included in the Corporation’s peer group; and (iii) remaining continuously employed with the Corporation through the end of the third year following three years from the date of grant. Earlier vesting of the stock units is permitted under certain conditions, such as upon a change of control of the Corporation.Corporation, or as approved by the Board of Directors. In 2021, in connection with the early retirement of two executive officers, the Board of Directors approved modifying certain terms of their outstanding awards including accelerating the vesting requirements. The modifications increased stock-based compensation expense for 2021 by approximately $369.
The grant date fair value for the RSUs equals the closing price of the Corporation’s common stock on the NYSE on the date of grant. The grant date fair value for PSUs subject to a market condition is determined using a Monte Carlo simulation model and the grant date fair value for PSUs that vest subject to a performance condition is equal to the closing price of the Corporation’s stock on the NYSE on the date of grant. The determination of the fair value of these awards takes into consideration the likelihood of achievement of the market or performance condition and, in certain circumstances, is adjusted for subsequent changes in the estimated or actual outcome of the condition. Unrecognized compensation expense associated with the RSUs and PSUs equaled $2,551$2,688 at December 31, 2017,2022, and is expected to be recognized over a weighted averageweighted-average period of approximately 2 years.
A summary of outstandingOutstanding RSUs and exercisable incentive options (RSUs and PSUs)PSUs, which would represent non-vested awards, as of December 31, 2017,2022 and 2021, and activity for the yearyears then ended, December 31, 2017, isare as follows:
|
| Number of |
|
| Weighted- |
|
| Number of |
|
| Weighted- |
| ||||
Outstanding at January 1, 2021 |
|
| 278,658 |
|
| $ | 3.68 |
|
|
| 348,196 |
|
| $ | 4.45 |
|
Granted |
|
| 207,381 |
|
|
| 5.74 |
|
|
| 215,150 |
|
|
| 6.78 |
|
Converted to common stock |
|
| (169,757 | ) |
|
| 4.39 |
|
|
| (133,745 | ) |
|
| 5.98 |
|
Forfeited |
|
| (15,435 | ) |
|
| 4.80 |
|
|
| (96,994 | ) |
|
| 4.30 |
|
Outstanding at December 31, 2021 |
|
| 300,847 |
|
|
| 4.64 |
|
|
| 332,607 |
|
|
| 5.39 |
|
Granted |
|
| 200,485 |
|
|
| 5.50 |
|
|
| 179,389 |
|
|
| 6.80 |
|
Converted to common stock |
|
| (142,968 | ) |
|
| 4.20 |
|
|
| (52,801 | ) |
|
| 4.05 |
|
Forfeited |
|
| (15,182 | ) |
|
| 5.24 |
|
|
| (62,658 | ) |
|
| 3.08 |
|
Outstanding at December 31, 2022 |
|
| 343,182 |
|
| $ | 5.29 |
|
|
| 396,537 |
|
| $ | 6.57 |
|
60
|
| Number of RSUs |
|
| Weighted Average Fair Value |
|
| Number of PSUs |
|
| Weighted Average Fair Value |
| ||||
Outstanding at January 1, 2017 |
|
| 155,845 |
|
| $ | 17.53 |
|
|
| 39,348 |
|
| $ | 21.62 |
|
Granted |
|
| 76,473 |
|
|
| 14.00 |
|
|
| 97,788 |
|
|
| 14.93 |
|
Converted to common stock |
|
| (58,677 | ) |
|
| 17.25 |
|
|
| 0 |
|
| N/A |
| |
Forfeited/cancelled |
|
| (14,935 | ) |
|
| 16.76 |
|
|
| (34,622 | ) |
|
| 14.99 |
|
Outstanding at December 31, 2017 |
|
| 158,706 |
|
| $ | 16.00 |
|
|
| 102,514 |
|
| $ | 17.47 |
|
A summary of outstanding and exercisableOutstanding stock options, all of which are fully vested, as of December 31, 2017,2022 and 2021, and activity for the yearyears then ended, December 31, 2017, isare as follows:
|
| Number of |
|
| Weighted- |
|
| Remaining |
|
| Intrinsic |
| ||||
Outstanding at January 1, 2021 |
|
| 269,250 |
|
| $ | 19.85 |
|
|
| 2.0 |
|
| $ | — |
|
Granted |
|
| — |
|
| N/A |
|
|
|
|
|
|
| |||
Exercised |
|
| — |
|
| N/A |
|
|
|
|
|
|
| |||
Forfeited |
|
| (5,000 | ) |
| 20.00 |
|
|
|
|
|
|
| |||
Expired |
|
| (58,750 | ) |
|
| 25.18 |
|
|
|
|
|
|
| ||
Outstanding at December 31, 2021 |
|
| 205,500 |
|
|
| 18.32 |
|
|
| 1.4 |
|
|
| — |
|
Granted |
|
| — |
|
| N/A |
|
|
|
|
|
|
| |||
Exercised |
|
| — |
|
| N/A |
|
|
|
|
|
|
| |||
Forfeited |
|
| — |
|
| N/A |
|
|
|
|
|
|
| |||
Expired |
|
| (131,500 | ) |
|
| 18.16 |
|
|
|
|
|
|
| ||
Outstanding at December 31, 2022 |
|
| 74,000 |
|
| $ | 18.60 |
|
|
| 0.8 |
|
| $ | — |
|
Exercisable at December 31, 2022 |
|
| 74,000 |
|
| $ | 18.60 |
|
|
| 0.8 |
|
| $ | — |
|
Vested or expected to vest at December 31, 2022 |
|
| 74,000 |
|
| $ | 18.60 |
|
|
| 0.8 |
|
| $ | — |
|
|
| Number of Shares Under Options |
|
| Weighted Average Exercise Price |
|
| Remaining Contractual Life In Years |
|
| Intrinsic Value |
| ||||
Outstanding at January 1, 2017 |
|
| 1,005,836 |
|
| $ | 24.07 |
|
|
| 4.2 |
|
| $ | 0 |
|
Granted |
|
| 0 |
|
| N/A |
|
|
|
|
|
|
|
|
| |
Exercised |
|
| 0 |
|
| N/A |
|
|
|
|
|
|
|
|
| |
Forfeited |
|
| (190,501 | ) |
|
| 26.03 |
|
|
|
|
|
|
|
|
|
Outstanding at December 31, 2017 |
|
| 815,335 |
|
| $ | 23.61 |
|
|
| 3.3 |
|
| $ | 0 |
|
Exercisable at December 31, 2017 |
|
| 815,335 |
|
| $ | 23.61 |
|
|
| 3.3 |
|
| $ | 0 |
|
Vested or expected to vest at December 31, 2017 |
|
| 815,335 |
|
| $ | 23.61 |
|
|
| 3.3 |
|
| $ | 0 |
|
Stock-based compensation expense for all awards, including expense for shares to be issuedassociated with the modified awards and equity-based awards granted to non-employee directors,members of the Board of Directors, approximated $2,400, $2,332$1,665 and $1,328$2,438 for 2017, 20162022 and 2015,2021, respectively. There was noThe income tax benefit recognized in the consolidated statements of operations for 2017 and 2016,was not significant due to the Corporation having a valuation allowance recorded against its deferred income tax assets for the jurisdiction where the expense was recognized. See recognized (see Note 15. The related income tax benefit recognized in the consolidated statements of operations for 2015 approximated $465.21).
NOTE 12 – ACCUMULATED OTHER COMPREHENSIVE LOSS:
Net change and ending balances for the various components of other comprehensive income (loss) and for accumulated other comprehensive loss as of and for the year ended December 31, 2015, 2016 and 2017 are summarized below.
|
| Foreign Currency Translation Adjustments |
|
| Unrecognized Components of Employee Benefit Plans |
|
| Unrealized Holding Gains on Securities |
|
| Derivatives |
|
| Accumulated Other Comprehensive Loss |
| |||||
Balance at January 1, 2015 |
| $ | (4,426 | ) |
| $ | (65,396 | ) |
| $ | 984 |
|
| $ | 85 |
|
| $ | (68,753 | ) |
Net Change |
|
| (3,967 | ) |
|
| 15,453 |
|
|
| (292 | ) |
|
| (40 | ) |
|
| 11,154 |
|
Balance at December 31, 2015 |
|
| (8,393 | ) |
|
| (49,943 | ) |
|
| 692 |
|
|
| 45 |
|
|
| (57,599 | ) |
Net Change |
|
| (14,580 | ) |
|
| 11,307 |
|
|
| (633 | ) |
|
| 506 |
|
|
| (3,400 | ) |
Balance at December 31, 2016 |
|
| (22,973 | ) |
|
| (38,636 | ) |
|
| 59 |
|
|
| 551 |
|
|
| (60,999 | ) |
Net Change |
|
| 11,041 |
|
|
| 10,582 |
|
|
| 573 |
|
|
| 134 |
|
|
| 22,330 |
|
Impact from adoption of ASU 2018-02 (Note 15) |
|
| 0 |
|
|
| (6,142 | ) |
|
| 0 |
|
|
| 54 |
|
|
| (6,088 | ) |
Balance at December 31, 2017 |
| $ | (11,932 | ) |
| $ | (34,196 | ) |
| $ | 632 |
|
| $ | 739 |
|
| $ | (44,757 | ) |
The following summarizes the line items affected on the consolidated statements of operations for components reclassified from accumulated other comprehensive loss for each of the years ended December 31. Amounts in parentheses represent credits to net income (loss).
|
| 2017 |
|
| 2016 |
|
| 2015 |
| |||
Amortization of unrecognized employee benefit costs: |
|
|
|
|
|
|
|
|
|
|
|
|
Costs of products sold (excluding depreciation and amortization) |
| $ | 1,934 |
|
| $ | 2,463 |
|
| $ | 3,604 |
|
Selling and administrative |
|
| 1,148 |
|
|
| (719 | ) |
|
| 3,354 |
|
Other expense |
|
| 201 |
|
|
| 166 |
|
|
| 355 |
|
Total before income tax |
|
| 3,283 |
|
|
| 1,910 |
|
|
| 7,313 |
|
Income tax provision |
|
| 0 |
|
|
| 0 |
|
|
| (2,573 | ) |
Net of income tax |
| $ | 3,283 |
|
| $ | 1,910 |
|
| $ | 4,740 |
|
Realized gains on sale of marketable securities: |
|
|
|
|
|
|
|
|
|
|
|
|
Selling and administrative |
| $ | (29 | ) |
| $ | (1,404 | ) |
| $ | (82 | ) |
Income tax provision |
|
| 0 |
|
|
| 366 |
|
|
| 29 |
|
Net of income tax |
| $ | (29 | ) |
| $ | (1,038 | ) |
| $ | (53 | ) |
Realized gains/losses from settlement of cash flow hedges: |
|
|
|
|
|
|
|
|
|
|
|
|
Net sales (foreign currency sales contracts) |
| $ | 0 |
|
| $ | (6 | ) |
| $ | (17 | ) |
Depreciation and amortization (foreign currency purchase contracts) |
|
| (31 | ) |
|
| (27 | ) |
|
| (27 | ) |
Costs of products sold (excluding depreciation and amortization) (futures contracts – copper and aluminum) |
|
| (639 | ) |
|
| 220 |
|
|
| 751 |
|
Total before income tax |
|
| (670 | ) |
|
| 187 |
|
|
| 707 |
|
Income tax provision |
|
| 0 |
|
|
| (79 | ) |
|
| (272 | ) |
Net of income tax |
| $ | (670 | ) |
| $ | 108 |
|
| $ | 435 |
|
The income tax expense (benefit) associated with the various components of other comprehensive income (loss) for each of the years ended December 31 is summarized below. For 2017 and 2016, there was no income tax benefit for certain items due to the Corporation having a valuation allowance recorded against its deferred income tax assets for the jurisdiction where the expense is recognized. See Note 15. Foreign currency translation adjustments exclude the effect of income taxes since earnings of non-U.S. subsidiaries are deemed to be reinvested for an indefinite period of time.
|
| 2017 |
|
| 2016 |
|
| 2015 |
| |||
Income tax expense (benefit) associated with changes in: |
|
|
|
|
|
|
|
|
|
|
|
|
Unrecognized employee benefit costs |
| $ | 0 |
|
| $ | 0 |
|
| $ | (4,731 | ) |
Unrealized holding losses on marketable securities |
|
| 0 |
|
|
| 0 |
|
|
| 134 |
|
Fair value of cash flow hedges |
|
| 0 |
|
|
| 0 |
|
|
| 294 |
|
Income tax expense (benefit) associated with reclassification adjustments: |
|
|
|
|
|
|
|
|
|
|
|
|
Amortization of unrecognized employee benefit costs |
|
| 0 |
|
|
| 0 |
|
|
| (2,573 | ) |
Realized gains from sale of marketable securities |
|
| 0 |
|
|
| 366 |
|
|
| 29 |
|
Realized losses from settlement of cash flow hedges |
|
| 0 |
|
|
| (79 | ) |
|
| (272 | ) |
NOTE 13 – DERIVATIVE INSTRUMENTS:
Certain operations of the Corporation are subject to risk from exchange rate fluctuations in connection with sales in foreign currencies. To minimize this risk, foreign currency sales contracts are entered into which are designated as cash flow or fair value hedges. As of December 31, 2017, approximately $27,414 of anticipated foreign-denominated sales has been hedged which are covered by fair value contracts settling at various dates through January 2019. The fair value of assets held as collateral for the fair value contracts as of December 31, 2017, approximated $2,025, including a $1,350 standby letter of credit.
Additionally, certain divisions of the Air and Liquid Processing segment are subject to risk from increases in the price of commodities (copper and aluminum) used in the production of inventory. To minimize this risk, futures contracts are entered into which are designated as cash flow hedges. At December 31, 2017, approximately 51% or $2,637 of anticipated copper purchases over the next year and 56% or $524, of anticipated aluminum purchases over the next six months are hedged.
The Corporation previously entered into foreign currency purchase contracts to manage the volatility associated with euro-denominated progress payments to be made for certain machinery and equipment. As of December 31, 2010, all contracts had been settled and the underlying fixed assets were placed in service.
No portion of the existing cash flow or fair value hedges is considered to be ineffective, including any ineffectiveness arising from the unlikelihood of an anticipated transaction to occur. Additionally, no amounts have been excluded from assessing the effectiveness of a hedge.
At December 31, 2017, the Corporation has purchase commitments covering 62% or $1,285 of anticipated natural gas usage for 2018 for one of its subsidiaries. The commitments qualify as normal purchases and, accordingly, are not reflected on the consolidated balance sheet. Purchases of natural gas under previously existing commitments approximated $856, $1,936 and $2,452 for 2017, 2016 and 2015, respectively.
The Corporation does not enter into derivative transactions for speculative purposes and, therefore, holds no derivative instruments for trading purposes.
The following summarizes location and fair value of the foreign currency sales contracts recorded on the consolidated balance sheets as of December 31:
|
| Location |
| 2017 |
|
| 2016 |
| ||
Fair value hedge contracts |
| Other current assets |
| $ | 961 |
|
| $ | 214 |
|
|
| Other noncurrent assets |
|
| 0 |
|
|
| 2 |
|
|
| Other current liabilities |
|
| 89 |
|
|
| 940 |
|
|
| Other noncurrent liabilities |
|
| 1 |
|
|
| 35 |
|
Fair value hedged item |
| Receivables |
|
| (269 | ) |
|
| 121 |
|
|
| Other current assets |
|
| 169 |
|
|
| 808 |
|
|
| Other noncurrent assets |
|
| 16 |
|
|
| 45 |
|
|
| Other current liabilities |
|
| 907 |
|
|
| 233 |
|
|
| Other noncurrent liabilities |
|
| 0 |
|
|
| 5 |
|
The change in the fair value of the cash flow contracts is recorded as a component of accumulated other comprehensive loss. Amounts recognized as and reclassified from accumulated other comprehensive loss are recorded as a component of other comprehensive income (loss) and are summarized below. Amounts are after-tax, where applicable. Certain amounts recognized as comprehensive income (loss) for 2017 and 2016 have no tax effect due to the Corporation recording a valuation allowance against its deferred income tax assets in the related jurisdictions. See Note 15.
For the Year Ended December 31, 2017 |
| Accumulated Other Comprehensive Income (Loss) Beginning of the Year |
|
| Plus Recognized as Comprehensive Income (Loss) |
|
| Less Gain (Loss) Reclassified from Accumulated Other Comprehensive Loss |
|
| Accumulated Other Comprehensive Income (Loss) End of the Year |
| ||||
Foreign currency sales contracts – cash flow hedges |
| $ | 0 |
|
| $ | 0 |
|
| $ | 0 |
|
| $ | 0 |
|
Foreign currency purchase contracts |
|
| 216 |
|
|
| 0 |
|
|
| 31 |
|
|
| 185 |
|
Future contracts – copper and aluminum |
|
| 335 |
|
|
| 804 |
|
|
| 639 |
|
|
| 500 |
|
Change in fair value |
| $ | 551 |
|
| $ | 804 |
|
| $ | 670 |
|
| $ | 685 |
|
|
|
|
|
|
|
|
|
|
|
|
|
|
|
|
|
|
For the Year Ended December 31, 2016 |
|
|
|
|
|
|
|
|
|
|
|
|
|
|
|
|
Foreign currency sales contracts – cash flow hedges |
| $ | 4 |
|
| $ | 0 |
|
| $ | 4 |
|
| $ | 0 |
|
Foreign currency purchase contracts |
|
| 241 |
|
|
| 0 |
|
|
| 25 |
|
|
| 216 |
|
Future contracts – copper and aluminum |
|
| (200 | ) |
|
| 398 |
|
|
| (137 | ) |
|
| 335 |
|
Change in fair value |
| $ | 45 |
|
| $ | 398 |
|
| $ | (108 | ) |
| $ | 551 |
|
|
|
|
|
|
|
|
|
|
|
|
|
|
|
|
|
|
For the Year Ended December 31, 2015 |
|
|
|
|
|
|
|
|
|
|
|
|
|
|
|
|
Foreign currency sales contracts – cash flow hedges |
| $ | 0 |
|
| $ | 14 |
|
| $ | 10 |
|
| $ | 4 |
|
Foreign currency purchase contracts |
|
| 258 |
|
|
| 0 |
|
|
| 17 |
|
|
| 241 |
|
Future contracts – copper and aluminum |
|
| (173 | ) |
|
| (489 | ) |
|
| (462 | ) |
|
| (200 | ) |
Change in fair value |
| $ | 85 |
|
| $ | (475 | ) |
| $ | (435 | ) |
| $ | 45 |
|
The change in fair value reclassified or expected to be reclassified from accumulated other comprehensive loss to earnings is summarized below. All amounts are pre-tax.
|
| Location of Gain (Loss) in Statements |
| Estimated to be Reclassified in the Next |
|
| Year Ended December 31, |
| ||||||||||
|
| of Operations |
| 12 Months |
|
| 2017 |
|
| 2016 |
|
| 2015 |
| ||||
Foreign currency sales contracts – cash flow hedges |
| Net sales |
| $ | 0 |
|
| $ | 0 |
|
| $ | 6 |
|
| $ | 17 |
|
Foreign currency purchase contracts |
| Depreciation and amortization |
|
| 27 |
|
|
| 31 |
|
|
| 27 |
|
|
| 27 |
|
Futures contracts – copper and aluminum |
| Costs of products sold (excluding depreciation and amortization) |
|
| 500 |
|
|
| 639 |
|
|
| (220 | ) |
|
| (751 | ) |
Losses on foreign exchange transactions included in other expense approximated $(463), $(1,161) and $(324) for 2017, 2016 and 2015, respectively.
NOTE 14 – FAIR VALUE:
The following summarizes financial assets and liabilities reported at fair value on a recurring basis in the accompanying consolidated balance sheets at December 31:
2017 |
| Quoted Prices in Active Markets for Identical Inputs (Level 1) |
|
| Significant Other Observable Inputs (Level 2) |
|
| Significant Unobservable Inputs (Level 3) |
|
| Total |
| ||||
Investments |
|
|
|
|
|
|
|
|
|
|
|
|
|
|
|
|
Other noncurrent assets |
| $ | 4,204 |
|
| $ | 0 |
|
| $ | 0 |
|
| $ | 4,204 |
|
Foreign currency exchange contracts |
|
|
|
|
|
|
|
|
|
|
|
|
|
|
|
|
Other current assets |
|
| 0 |
|
|
| 1,130 |
|
|
| 0 |
|
|
| 1,130 |
|
Other noncurrent assets |
|
| 0 |
|
|
| 16 |
|
|
| 0 |
|
|
| 16 |
|
Other current liabilities |
|
| 0 |
|
|
| 996 |
|
|
| 0 |
|
|
| 996 |
|
Other noncurrent liabilities |
|
| 0 |
|
|
| 1 |
|
|
| 0 |
|
|
| 1 |
|
2016 |
|
|
|
|
|
|
|
|
|
|
|
|
|
|
|
|
Investments |
|
|
|
|
|
|
|
|
|
|
|
|
|
|
|
|
Other noncurrent assets |
| $ | 3,863 |
|
| $ | 0 |
|
| $ | 0 |
|
| $ | 3,863 |
|
Foreign currency exchange contracts |
|
|
|
|
|
|
|
|
|
|
|
|
|
|
|
|
Other current assets |
|
| 0 |
|
|
| 1,022 |
|
|
| 0 |
|
|
| 1,022 |
|
Other noncurrent assets |
|
| 0 |
|
|
| 47 |
|
|
| 0 |
|
|
| 47 |
|
Other current liabilities |
|
| 0 |
|
|
| 1,173 |
|
|
| 0 |
|
|
| 1,173 |
|
Other noncurrent liabilities |
|
| 0 |
|
|
| 40 |
|
|
| 0 |
|
|
| 40 |
|
The investments held as other noncurrent assets represent assets held in the “Rabbi” trust for the purpose of providing benefits under the non-qualified defined benefit pension plan. The fair value of the investments is based on quoted prices of the investments in active markets. The fair value of foreign currency exchange contracts is determined based on the fair value of similar contracts with similar terms and remaining maturities. The fair value of futures contracts is based on market quotations. The fair value of the variable-rate debt approximates its carrying value. Additionally, the fair value of trade receivables and trade payables approximates their carrying value.
NOTE 15 – INCOME TAXES:
On December 22, 2017, the U.S. federal government enacted the Tax Reform, to become effective as of January 1, 2018, which, among other things, lowered the U.S. corporate statutory income tax rate from 35% to 21%, implemented a modified territorial tax system and imposed a one-time tax on deemed repatriated earnings of foreign subsidiaries. The Tax Reform negatively impacted the Corporation’s income tax provision by approximately $1,565, principally related to the one-time repatriation transition tax offset by income tax benefits resulting from 100% bonus depreciation. There was no cash outlay due to the Tax Reform, however, it reduced the amount of the Corporation’s carryback refund that it would have been able to receive. Additionally, there was no significant impact from remeasuring its U.S. deferred income tax assets and liabilities at the new enacted statutory income tax rate since these net deferred income tax assets are fully valued. The Corporation will continue to analyze the Tax Reform and refine its provisional amounts, which could potentially impact the measurement of its tax balances.
In response to the enacted Tax Reform, Staff Accounting Bulletin No. 118 (SAB 118) was issued to address the application of U.S. Generally Accepted Accounting Principles in situations when a registrant does not have the necessary information available, prepared, or analyzed (including computations) in reasonable detail to complete the accounting for certain income tax effects of the Tax Reform. As of December 31, 2017, in accordance with SAB 118, the Corporation has made a reasonable estimate of the: (i) one-time repatriation transition tax; (ii) increased bonus depreciation for assets placed in service on or after September 27, 2017; and (iii) effects on the Corporation’s existing deferred tax balances, but has not completed its full accounting for the tax effects of enactment of the Tax Reform. The Corporation anticipates U.S. regulatory agencies will issue further regulations during 2018, which may alter this estimate. The Corporation is continuing to analyze its earnings and profits in foreign jurisdictions and its deferred tax balances.
In January 2018, the FASB released guidance on the accounting for tax on the global intangible low-taxed income (“GILTI”) provisions of the Tax Reform. The GILTI provisions impose a tax on foreign income in excess of a deemed return on tangible assets of foreign corporations. The guidance indicates that either accounting for deferred taxes related to GILTI inclusions or to treating any taxes on GILTI inclusions as period cost are both acceptable methods, subject to an accounting policy election. The Corporation is still evaluating the GILTI provisions and has not yet elected an accounting policy for GILTI. The final determination of the tax effects of enactment of the Tax Reform will be completed within the measurement period of up to one year from the enactment date as permitted by SAB 118, and any adjustments to provisional amounts that are identified during the measurement period will be recorded in the reporting period in which the adjustment is determined.
Furthermore, the Corporation adopted ASU 2018-02, which allows for a reclassification from accumulated other comprehensive income (loss) to retained earnings for the stranded tax effects resulting from the Tax Reform. A stranded tax effect is defined as the difference in the tax effect of amounts recognized as other comprehensive income (loss) items, using the income tax rate in effect at the time of recognition and the newly enacted income tax rate. The new guidance is relevant only to the reclassification of the income tax effects of the Tax Reform; accordingly, the underlying guidance that requires that the effect of a change in tax laws or rates be included in income from continuing operations is not affected. As a result, $6,088 was reclassified between accumulated other comprehensive loss and retained earnings.
(Loss) income before income taxes and equity gains (losses) in joint venture is comprised of the following:
|
| 2017 |
|
| 2016 |
|
| 2015 |
| |||
Domestic |
| $ | (16,988 | ) |
| $ | (26,326 | ) |
| $ | 6,000 |
|
Foreign |
|
| 3,295 |
|
|
| (31,194 | ) |
|
| (1,480 | ) |
(Loss) income before income taxes and equity gains (losses) in joint venture |
| $ | (13,693 | ) |
| $ | (57,520 | ) |
| $ | 4,520 |
|
At December 31, 2017, the Corporation has federal net operating loss carryforwards of $3,208, which begin to expire in 2035. Under the Tax Reform, beginning with 2018, net operating losses can be carried forward indefinitely, but are limited to 80 percent of taxable income in any given year. Additionally, at December 31, 2017, the Corporation had state net operating loss carryforwards of $34,495 which begin to expire in 2018, foreign net operating loss carryforwards of $93,364 which begin to expire in 2018 and capital loss carryforwards of $814 which do not expire. During 2017, the Corporation received $6,540 of U.S. federal and state income tax refunds.
The income tax (benefit) provision consisted of the following:
|
| 2017 |
|
| 2016 |
|
| 2015 |
| |||
Current: |
|
|
|
|
|
|
|
|
|
|
|
|
Federal |
| $ | (4,698 | ) |
| $ | (1,574 | ) |
| $ | 4,577 |
|
State |
|
| (440 | ) |
|
| 465 |
|
|
| 378 |
|
Foreign |
|
| 606 |
|
|
| 414 |
|
|
| (20 | ) |
Current income tax (benefit) provision |
|
| (4,532 | ) |
|
| (695 | ) |
|
| 4,935 |
|
Deferred: |
|
|
|
|
|
|
|
|
|
|
|
|
Federal |
|
| 1,259 |
|
|
| (2,688 | ) |
|
| (2,203 | ) |
State |
|
| (112 | ) |
|
| (1,838 | ) |
|
| 197 |
|
Foreign |
|
| 1,876 |
|
|
| (2,472 | ) |
|
| (296 | ) |
Increase in valuation allowance |
|
| 154 |
|
|
| 30,405 |
|
|
| 0 |
|
Deferred income tax provision (benefit) |
|
| 3,177 |
|
|
| 23,407 |
|
|
| (2,302 | ) |
Total income tax (benefit) provision |
| $ | (1,355 | ) |
| $ | 22,712 |
|
| $ | 2,633 |
|
In 2016, the income tax provision was affected by recognition of a valuation allowance against all U.S. and certain foreign entities as it was considered more-likely-than-not that the net deferred income tax assets would not be realized. The Corporation assessed available positive and negative evidence to estimate whether sufficient future taxable income would be generated to permit use of the existing deferred income tax assets. During 2016, the Corporation incurred three years of cumulative losses, inclusive of the acquired Åkers businesses as if the businesses were held during the entire three-year period. Such objective evidence limits the ability to consider other subjective evidence, such as projections for future growth and profitability. On the basis of this evaluation, the Corporation established an increase in the valuation allowance to recognize the estimated portion of deferred income tax assets that is more-likely-than-not to not be realized. The Corporation has evaluated this position in the current year and determined that the valuation allowance against U.S. and certain foreign entities should remain. The decrease in the valuation allowance during 2017 is primarily due to the reduction in the U.S. corporate statutory income tax rate from 35% to 21%.
The difference between statutory U.S. federal income tax and the Corporation’s effective income tax was as follows:
|
| 2017 |
|
| 2016 |
|
| 2015 |
| |||
Computed at statutory rate |
| $ | (4,428 | ) |
| $ | (19,984 | ) |
| $ | 1,402 |
|
Tax differential on non-U.S. earnings |
|
| (389 | ) |
|
| 1,790 |
|
|
| 106 |
|
State income taxes |
|
| (398 | ) |
|
| (1,535 | ) |
|
| 226 |
|
Manufacturers deduction (I.R.C. Section 199) |
|
| 0 |
|
|
| 204 |
|
|
| (433 | ) |
Meals and entertainment |
|
| 142 |
|
|
| 143 |
|
|
| 136 |
|
Tax credits |
|
| 0 |
|
|
| 0 |
|
|
| (243 | ) |
Goodwill impairment |
|
| 0 |
|
|
| 9,191 |
|
|
| 0 |
|
Increase in valuation allowance |
|
| 154 |
|
|
| 30,405 |
|
|
| 0 |
|
Repatriation transition tax impact |
|
| 3,284 |
|
|
| 0 |
|
|
| 0 |
|
Change in tax rates |
|
| 0 |
|
|
| 1,913 |
|
|
| 224 |
|
Change in uncertain tax positions |
|
| 0 |
|
|
| 114 |
|
|
| 91 |
|
Acquisition-related costs |
|
| 0 |
|
|
| 571 |
|
|
| 981 |
|
Other – net |
|
| 280 |
|
|
| (100 | ) |
|
| 143 |
|
Total income tax (benefit) provision |
| $ | (1,355 | ) |
| $ | 22,712 |
|
| $ | 2,633 |
|
Deferred income tax assets and liabilities as of December 31, 2017, and 2016, are summarized below. Unremitted earnings of the Corporation’s non-U.S. subsidiaries and affiliates are deemed to be permanently reinvested and, accordingly, no deferred income tax liability has been recorded. If the Corporation were to remit any foreign earnings to the U.S., the estimated tax impact would be insignificant.
|
| 2017 |
|
| 2016 |
| ||
Assets: |
|
|
|
|
|
|
|
|
Employment – related liabilities |
| $ | 10,975 |
|
| $ | 18,659 |
|
Pension liability – foreign |
|
| 1,633 |
|
|
| 2,241 |
|
Pension liability – domestic |
|
| 9,004 |
|
|
| 16,133 |
|
Liabilities related to discontinued operations |
|
| 186 |
|
|
| 241 |
|
Capital loss carryforwards |
|
| 308 |
|
|
| 282 |
|
Asbestos-related liability |
|
| 12,179 |
|
|
| 21,024 |
|
Net operating loss – domestic |
|
| 674 |
|
|
| 653 |
|
Net operating loss – state |
|
| 2,782 |
|
|
| 2,123 |
|
Net operating loss – foreign |
|
| 22,856 |
|
|
| 19,106 |
|
Inventory related |
|
| 2,764 |
|
|
| 2,157 |
|
Impairment charge associated with investment in MG |
|
| 1,155 |
|
|
| 2,184 |
|
Investment tax credits – foreign |
|
| 848 |
|
|
| 791 |
|
Other |
|
| 3,181 |
|
|
| 6,660 |
|
Gross deferred income tax assets |
|
| 68,545 |
|
|
| 92,254 |
|
Valuation allowance(1) |
|
| (38,112 | ) |
|
| (45,449 | ) |
|
|
| 30,433 |
|
|
| 46,805 |
|
Liabilities: |
|
|
|
|
|
|
|
|
Depreciation |
|
| (26,915 | ) |
|
| (37,584 | ) |
Mark-to-market adjustment – derivatives |
|
| (4 | ) |
|
| (187 | ) |
Intangible assets – definite life |
|
| (1,186 | ) |
|
| (2,067 | ) |
Intangible assets – indefinite life |
|
| (605 | ) |
|
| (731 | ) |
Other |
|
| (566 | ) |
|
| (2,003 | ) |
Gross deferred income tax liabilities |
|
| (29,276 | ) |
|
| (42,572 | ) |
Net deferred income tax assets |
| $ | 1,157 |
|
| $ | 4,233 |
|
|
|
The following summarizes changes in unrecognized tax benefits for the year ended December 31:
|
| 2017 |
|
| 2016 |
|
| 2015 |
| |||
Balance at the beginning of the year |
| $ | 236 |
|
| $ | 315 |
|
| $ | 52 |
|
Gross increases for tax positions taken in the current year |
|
| 0 |
|
|
| 0 |
|
|
| 0 |
|
Gross increases for tax positions taken in prior years |
|
| 0 |
|
|
| 0 |
|
|
| 283 |
|
Gross decreases in tax positions due to lapse in statute of limitations |
|
| (119 | ) |
|
| (79 | ) |
|
| (20 | ) |
Gross decreases for tax positions taken in prior years |
|
| 0 |
|
|
| 0 |
|
|
| 0 |
|
Gross decreases for tax settlements with taxing authorities |
|
| 0 |
|
|
| 0 |
|
|
| 0 |
|
Balance at the end of the year |
| $ | 117 |
|
| $ | 236 |
|
| $ | 315 |
|
If the unrecognized tax benefits were recognized, $31 would reduce the Corporation’s effective income tax rate. The amount of penalties and interest recognized in the consolidated balance sheets as of December 31, 2017, and 2016, and in the consolidated statements of operations for 2017, 2016 and 2015 is insignificant. Unrecognized tax benefits of $117 are to reverse due to the lapse in the statute of limitations within the next 12 months.
The Corporation is subject to taxation in the United States, various states and foreign jurisdictions, and remains subject to examination by tax authorities for tax years 2014 – 2017. The Corporation is currently under audit by the Internal Revenue Service of its consolidated federal tax returns for the 2014 – 2016 tax years. Additionally, the Pennsylvania Department of Revenue has notified the Corporation’s subsidiary, Union Electric Steel, that it will audit its state income tax returns for the years 2015 and 2016. No material changes are anticipated.
NOTE 16 – OPERATING LEASES:
The Corporation leases certain factory and office space and certain equipment. Operating lease expense was $1,283 in 2017, $1,148 in 2016 and $1,043 in 2015. Operating lease payments for subsequent years are $702 for 2018, $628 for 2019, $524 for 2020, $486 for 2021, $476 for 2022 and $902 thereafter.
NOTE 1719 – RESEARCH AND DEVELOPMENT COSTS:
Expenditures relating to the development of new products, identification of products or process alternatives and modifications and improvements to existing products and processes are expensed as incurred. These expenses approximated $3,386$1,024 for 2017, $2,7162022 and $1,229 for 2016 and $1,137 for 2015.2021.
61
NOTE 18 – RELATED PARTIES:
ATR has a $5,325 (RMB 34,655) loan outstanding with its minority shareholder. The loan originally matured in 2008 but has been renewed continually for one year periods. Interest does not compound and has accrued on the outstanding balance, since inception, at the three-to-five-year loan interest rate set by the People’s Bank of China in effect at the time of renewal. The interest rate for 2017 approximated 5%. Accrued interest approximated $2,682 (RMB 17,457) and $2,265 (RMB 15,730) as of December 31, 2017, and 2016, respectively, which is recorded in other current liabilities on the consolidated balance sheet. Purchases from ATR’s minority shareholder and its affiliates, which were in the ordinary course of business, approximated $7,752 (RMB 52,418) and $6,362 (RMB 42,403) in 2017 and 2016, respectively. Excluding the loan and interest outstanding, the amount payable to ATR’s minority shareholder and its affiliates approximated $296 (RMB 1,929) and $899 (RMB 6,237) at December 31, 2017, and 2016, respectively. Sales to ATR’s minority shareholder and its affiliates, which were in the ordinary course of business, approximated $8,564 (RMB 57,909) and $5,922 (RMB 39,468) for 2017 and 2016, respectively. No amounts were due from ATR’s minority shareholder or its affiliates as of December 31, 2017, or 2016.
Previously, in the ordinary course of business, the Corporation purchased industrial supplies from a subsidiary of The Louis Berkman Company (“LB Co”). Certain directors of the Corporation are either officers, directors and/or shareholders of LB Co. Purchases from LB Co. approximated $955 in 2016 and $1,270 in 2015. In addition, LB Co paid the Corporation approximately $72 in 2015 for certain administrative services. No amounts were due or payable at December 31, 2017, or 2016.
NOTE 1920 – LITIGATION:
The Corporation and its subsidiaries are involved in various claims and lawsuits incidental to their businesses and are also subject to asbestos litigation as described below. In February 2017, the Corporation, its indirect subsidiary Akers National Roll Company, as
well as the Akers National Roll Company Health & Welfare Benefits Plan were named as defendants in a class action complaint filed in the United States District Court for the Western District of Pennsylvania, where the plaintiffs (currently retired former employees of Akers National Roll Company and the United Steel, Paper and Forestry, Rubber, Manufacturing, Energy, Allied Industrial, and Service Workers International Union, AFL-CIO) alleged that the defendants breached collective bargaining agreements and violated the benefit plan by modifying medical benefits of the plaintiffs and similarly situated retirees. The defendants moved to dismiss the case, and plaintiffs petitioned the court to compel arbitration. On June 13, 2017, the District Court compelled arbitration and denied the defendants’ motion to dismiss as moot. Defendants appealed this decision to the Third Circuit Court of Appeals on June 21, 2017. Defendants also filed a motion to stay arbitration pending the resolution of the appeal, and that motion was granted on September 5, 2017. The Third Circuit Court of Appeals will next consider whether the District Court erred in compelling arbitration. While no assurance can be given as to the ultimate outcome of this matter, the Corporation believes that the final resolution of this action will not have a material adverse effect on our results of operations, financial position, liquidity or capital resources.
Asbestos Litigation
Claims have been asserted alleging personal injury from exposure to asbestos-containing components historically used in some products manufactured by predecessors of Air & Liquid (“Asbestos(the “Asbestos Liability”). Air & Liquid and, in some cases, the Corporation, are defendants (among a number of defendants, often in excess of 50) in cases filed in various state and federal courts.
Asbestos Claims
The following table reflects approximate information about the claims for the Asbestos Liability against Air & Liquid and the Corporation for the two years ended December 31, 2017,2022 and 2016:
|
| 2017 |
|
| 2016 |
| ||
Total claims pending at the beginning of the period |
|
| 6,618 |
|
|
| 6,212 |
|
New claims served |
|
| 1,365 |
|
|
| 1,452 |
|
Claims dismissed |
|
| (718 | ) |
|
| (782 | ) |
Claims settled |
|
| (358 | ) |
|
| (264 | ) |
Total claims pending at the end of the period(1) |
|
| 6,907 |
|
|
| 6,618 |
|
Gross settlement and defense costs (in 000’s) |
| $ | 21,431 |
|
| $ | 17,960 |
|
Average gross settlement and defense costs per claim resolved (in 000’s) |
| $ | 19.92 |
|
| $ | 17.17 |
|
|
|
A substantial2021. The majority of the settlement and defense costs reflected in the above table waswere reported and paid by insurers.insurer carriers. Because claims are often filed and can be settled or dismissed in large groups, the amount and timing of settlements, as well as the number of open claims, can fluctuate significantly from period to period.
|
| 2022 |
|
| 2021 |
| ||
Total claims pending at the beginning of the period |
|
| 6,097 |
|
|
| 5,891 |
|
New claims served |
|
| 1,200 |
|
|
| 1,233 |
|
Claims dismissed |
|
| (634 | ) |
|
| (605 | ) |
Claims settled |
|
| (404 | ) |
|
| (422 | ) |
Total claims pending at the end of the period(1) |
|
| 6,259 |
|
|
| 6,097 |
|
Administrative closures(2) |
|
| (3,109 | ) |
|
| (2,941 | ) |
Total active claims pending at the end of the period(2) |
|
| 3,150 |
|
|
| 3,156 |
|
Gross settlement and defense costs paid (in 000’s) |
| $ | 19,834 |
|
| $ | 23,215 |
|
Average gross settlement and defense costs per claim resolved (in 000’s) (3) |
| $ | 19.11 |
|
| $ | 22.60 |
|
Asbestos Insurance
The Corporation and Air & Liquid are parties to a series of settlement agreements (“Settlement Agreements”) with insurersinsurer carriers that have coverage obligations for the Asbestos Liability (the “Settling Insurers”). Under the Settlement Agreements, the Settling Insurers accept financial responsibility, subject to the terms and conditions of the respective agreements, including overall coverage limits, for pending and future claims for the Asbestos Liability. The Settlement Agreements encompass the substantial majority of insurance policies that provide coverage for claims for the Asbestos Liability.
The Settlement Agreements include acknowledgementsacknowledgments that Howden North America, Inc. (“Howden”) is entitled to coverage under policies covering the Asbestos Liability for claims arising out of the historical products manufactured or distributed by Buffalo Forge, a former subsidiary of the Corporation (the “Products”)., which was acquired by Howden. The Settlement Agreements do not provide for any prioritization on access to the applicable policies or any sublimitssub-limits of liability as to Howden or the Corporation and Air & Liquid and, accordingly, Howden may access the coverage afforded by the Settling Insurers for any covered claim arising out of a Product.the Products. In general, access by Howden to the coverage afforded by the Settling Insurers for the Products will erode coverage under the Settlement Agreements available to the Corporation and Air & Liquid for the Asbestos Liability.
InAt December 31, 2006, with the Corporation retained Hamilton, Rabinovitz & Associates, Inc. (“HR&A”),assistance of a nationally recognized expert in the valuation of asbestos liabilities, to assist the Corporation in estimating the potential liability for pending and unasserted future claims for Asbestos Liability. Based on this analysis, the Corporation recorded aits initial reserve for the Asbestos Liability. Since then, the Corporation and the expert have reviewed the Asbestos Liability and the underlying assumptions on a regular basis to determine whether any adjustment to the Asbestos Liability or the underlying assumptions were necessary. When warranted, the Asbestos Liability was adjusted to consider the current trends and new information that became available and, if reasonably estimable, to extend the valuation of asbestos liabilities further into the future. In 2018, the valuation was extended to include claims pending or projected to be asserted through 2013 as of December 31, 2006. HR&A’s analysis has been periodically updated since that time. Most recently, the HR&A analysis was updated in 2016, and additional reserves were establishedestimated final date by which the Corporation asexpects to have settled all asbestos-related claims.
62
In conjunction with the regular updates of December 31, 2016, forthe estimated Asbestos Liability, claims pending or projectedthe Corporation also develops an estimate of defense costs expected to be asserted through 2026.incurred with settling the Asbestos Liability and probable insurance recoveries for the Asbestos Liability and defense costs. In developing the estimate of probable defense costs, the Corporation considers several factors including, but not limited to, current and historical defense-to-indemnity cost ratios and expected defense-to-indemnity costs ratios. In developing the estimate of probable insurance recoveries, the Corporation considers the expert’s projection of settlement costs for the Asbestos Liability and management’s projection of associated defense costs. In addition, the Corporation consults with its outside legal counsel on insurance matters and a nationally recognized insurance consulting firm that it retains to assist with certain policy allocation matters. The Corporation also considers a number of other factors including the Settlement Agreements in effect, policy exclusions, policy limits, policy provisions regarding coverage for defense costs, attachment points, gaps in the coverage, policy exhaustion, the nature of the underlying claims for the Asbestos Liability, estimated erosion of insurance limits on account of claims against Howden arising out of the Products, prior impairment of policies, insolvencies among certain of the insurance carriers, and creditworthiness of the remaining insurer carriers based on publicly available information. Based on these factors, the Corporation estimates the probable insurance recoveries for the Asbestos Liability and defense costs for the corresponding time frame of the Asbestos Liability.
In 2021, primarily as a result of identified changes in claim data and availability of new information, the Corporation engaged Gnarus Advisors LLC (“Gnarus”) to update the estimated Asbestos Liability. The methodology used by HR&AGnarus in its updated projection in 2016 of the operating subsidiaries’ liability for pending and unasserted potential future claims for Asbestos Liability, which iswas substantially the same as the methodology employed previously, which has been accepted by HR&A in prior estimates, relied uponnumerous courts, and included the following factors:
HR&A’s interpretation of a widely accepted forecast of the population likely to have been exposed to asbestos;
epidemiological studies estimating the number of people likely to develop asbestos-related diseases;
HR&A’s analysis of the number of people likely to file an asbestos-related injury claim against the subsidiaries and the Corporation based on such epidemiological data and relevant claims history from January 1, 2014,2018 to September 9, 2016;
an analysis of pending cases, by type of injury claimed and jurisdiction where the claim is filed;
andan analysis of claims resolution history from January 1, 2014,2018 to September 9, 2016,July 31, 2021, to determine the average settlement value of claims, by type of injury claimed and jurisdiction of filing; and
an adjustment for inflation in the future average settlement value of claims, at an annual inflation rate based on the Congressional Budget Office’s ten year forecast of inflation.
UsingBased on this information, HR&Aanalysis, the Corporation recorded an increase to its estimated in 2016 the number of future claims for Asbestos Liability that would be filed through the year 2026, as well as the settlement or indemnity costs that would be incurred to resolve both pending and future unasserted claims through 2026. This methodology has been accepted by numerous courts.
In conjunction with developing the aggregate liability estimate referenced above, the Corporation also developed an estimate of probable insurance recoveries$23,333 for its Asbestos Liabilities. In developing the estimate, the Corporation considered HR&A’s projection for settlement or indemnity costs for Asbestos Liability and management’s projection of associated defense costs (based on the current defense to indemnity cost ratio), as well as a number of additional factors. These additional factors included the Settlement Agreements then in effect, policy exclusions, policy limits, policy provisions regarding coverage for defense costs, attachment points, prior impairment of policies and gaps in the coverage, policy exhaustions, insolvencies among certain of the insurance carriers, and the nature of the underlying claims for Asbestos Liability asserted against the subsidiaries and the Corporation as reflected in the Corporation’s asbestos claims database, as well as estimated erosion of insurance limits on account of claims against Howden arising out of the Products. In addition to consulting with the Corporation’s outside legal counsel on these insurance matters, the Corporation consulted with a nationally recognized insurance consulting firm it retained to assist the Corporation with certain policy allocation matters that also are among the several factors considered by the Corporation when analyzing potential recoveries from relevant historical insurance for Asbestos Liabilities. Based upon all of the factors considered by the Corporation, and taking into account the Corporation’s analysis of publicly available information regarding the credit-worthiness of various insurers, the Corporation estimated the probable insurance recoveries for Asbestos Liability and defense costs through 2026. Although the Corporation believes that the assumptions employed in the insurance valuation were reasonable and previously consulted with its outside legal counsel and insurance consultant regarding those assumptions, there are other assumptions that could have been employed that would have resulted in materially lower insurance recovery projections.
Based on the analyses described above, the Corporation’s reserve at December 31, 2016, for the total costs, including defense costs, for Asbestos Liability claims pending or projected to be asserted through 2026, was $171,181 ofthe estimated final date by which approximately 70% wasthe Corporation expects to have settled all asbestos-related claims. The increase is primarily attributable to recent claim experience, including a higher expected proportion of mesothelioma claims which typically have a higher settlement costs for unasserted claims projectedvalue, offset by a lower defense-to-indemnity cost ratio (reduced to be filed through 202670% from 80% based on experience and future defense costs. The reserve at December 31, 2017, was $149,750. While it is reasonably possibleexpectations) and elimination of an inflationary factor based on historical experience over the past 10+ years which provided no evidence that inflationary pressures influenced settlement averages. In addition, the Corporation will incur additional chargesincreased its estimated insurance receivable by $16,672 for Asbestos Liability and defense costs in excess of the amounts currently reserved, the Corporation believes that there is too much uncertainty to provide for reasonable estimation of the number of future claims, the nature of such claims and the cost to resolve them beyond 2026. Accordingly, no reserve has been recorded for any costs that may be incurred after 2026.
The Corporation’s receivable at December 31, 2016, forestimated insurance recoveries attributable to the claims for which the Corporation’s Asbestos Liability reserve has been established includingand the portion of incurred defense costs covered by the Settlement AgreementsAgreements. The difference between the increase to the Asbestos Liability and the increase to the insurance receivable of $6,661 is recorded as a charge for asbestos-related costs in effect throughthe consolidated statement of operations for 2021.
In 2022, the Corporation revised its defense-to-indemnity cost ratio (reduced from 70% to 65%) based on continuing favorable experience and future expectations, which reduced the Asbestos Liability by $6,905 and insurance receivable by $4,679 with the difference recorded as a credit for asbestos-related costs in the consolidated statement of operations of $2,226 for 2022.
The following table summarizes activity relating to asbestos-related liabilities for the years ended December 31, 2016,2022 and the probable payments and reimbursements relating to the estimated indemnity and defense costs for pending and unasserted future Asbestos Liability claims, was $115,945 ($100,342 at December 31, 2017).2021.
|
| 2022 |
|
| 2021 |
| ||
Asbestos liability, beginning of the year |
| $ | 180,314 |
|
| $ | 180,196 |
|
Settlement and defense costs paid |
|
| (19,834 | ) |
|
| (23,215 | ) |
Change in estimated liability |
|
| (6,905 | ) |
|
| 23,333 |
|
Asbestos liability, end of the year |
| $ | 153,575 |
|
| $ | 180,314 |
|
The following table summarizes activity relating to insurance recoveries for each of the years ended December 31, 2017,2022 and 2016.2021.
|
| 2022 |
|
| 2021 |
| ||
Insurance receivable – asbestos, beginning of the year |
| $ | 121,297 |
|
| $ | 117,937 |
|
Settlement and defense costs paid by insurance carriers |
|
| (10,708 | ) |
|
| (13,312 | ) |
Change in estimated coverage |
|
| (4,679 | ) |
|
| 16,672 |
|
Insurance receivable – asbestos, end of the year |
| $ | 105,910 |
|
| $ | 121,297 |
|
63
|
| 2017 |
|
| 2016 |
| ||
Insurance receivable – asbestos, beginning of the year |
| $ | 115,945 |
|
| $ | 125,423 |
|
Settlement and defense costs paid by insurance carriers(1) |
|
| (15,603 | ) |
|
| (23,138 | ) |
Changes in estimated coverage |
|
| 0 |
|
|
| 13,660 |
|
Insurance receivable – asbestos, end of the year |
| $ | 100,342 |
|
| $ | 115,945 |
|
|
|
The balance of the insurance receivable recorded by the Corporation does not assume any recovery from insolvent carriers and acarriers. A substantial majority of the insurance recoveries deemed probable is from insurance companies rated A – (excellent) or better by A.M. Best Corporation. There can be no assurance, however, that there will not be further insolvencies among the relevant insurance carriers, or that the assumed percentage recoveries for certain carriers will prove correct. The difference between insurance recoveries and projected costs is not due to exhaustion of all insurance coverage for Asbestos Liability. The Corporation and the subsidiaries have substantial additional insurance coverage which the Corporation expects to be available for Asbestos Liability claims and defense costs that the subsidiaries and it may incur after 2026. However, this insurance coverage also can be expected to have gaps creating significant shortfalls of insurance recoveries against claims expense, which could be material in future years.
The amounts recorded byfor the Corporation for Asbestos LiabilitiesLiability and insurance receivablesreceivable rely on assumptions that are based on currently known facts and strategy. The Corporation’s actual expenses or insurance recoveries could be significantly higher or lower than those recorded if assumptions used in the Corporation’s or HR&A’sthe experts’ calculations vary significantly from actual results. Key variables in these assumptions are identified above and also include the number and typenature of new claims to be filed each year, the average cost of disposing of each such new claim, average annual defense costs, compliance by relevant parties with the terms of the Settlement Agreements, the resolution of remaining coverage issues with insurance carriers, and the solvency risk with respect to the relevant insurance carriers. Other factors that may affect the Corporation’s Asbestos Liability and ability to recover under itsthe Corporation’s insurance policies include uncertainties surrounding the litigation process from jurisdiction to jurisdiction and from case to case, reforms that may be made by state and federal courts, and the passage of state or federal tort reform legislation.
The Corporation intends to continue to evaluate its estimatedthe Asbestos Liability and related insurance receivablesreceivable, as well as the underlying assumptions, on a regular basis to determine whether any adjustments to the estimates are required. Due to the uncertainties surrounding asbestos litigation and insurance, these regular reviews may result in the Corporation incurring future charges;adjusting its current reserve; however, the Corporation is currently unable to estimate such future charges.adjustments. Adjustments, if any, to the Corporation’s estimate of its recordedthe Asbestos Liability and/or insurance receivablesreceivable could be material to the operating results for the periods in which the adjustments to the liability or receivable are recorded and to the Corporation’s liquidity and consolidated financial position.position and liquidity.
NOTE 21 – INCOME TAXES:
Income (loss) from operations before income taxes for the years ended December 31, 2022 and 2021 is summarized below. Income (loss) from operations before income taxes for certain foreign entities is classified differently for book reporting and income tax reporting purposes.
|
| 2022 |
|
| 2021 |
| ||
Domestic |
| $ | 1,438 |
|
| $ | (9,223 | ) |
Foreign |
|
| 4,118 |
|
|
| 8,228 |
|
Income (loss) from operations before income taxes |
| $ | 5,556 |
|
| $ | (995 | ) |
The income tax provision for the years ended December 31, 2022 and 2021 consisted of the following:
|
| 2022 |
|
| 2021 |
| ||
Current: |
|
|
|
|
|
| ||
Federal |
| $ | — |
|
| $ | — |
|
State |
|
| 219 |
|
|
| (16 | ) |
Foreign |
|
| 889 |
|
|
| 1,017 |
|
Current income tax provision |
|
| 1,108 |
|
|
| 1,001 |
|
Deferred: |
|
|
|
|
|
| ||
Federal |
|
| (3 | ) |
|
| (1,122 | ) |
State |
|
| 2,177 |
|
|
| (937 | ) |
Foreign |
|
| 52 |
|
|
| 1,138 |
|
(Decrease) increase in valuation allowance |
|
| (1,758 | ) |
|
| 2,225 |
|
Deferred income tax provision |
|
| 468 |
|
|
| 1,304 |
|
Total income tax provision |
| $ | 1,576 |
|
| $ | 2,305 |
|
64
The difference between statutory U.S. federal income tax and the Corporation’s effective income tax for the years ended December 31, 2022 and 2021 was as follows:
|
| 2022 |
|
| 2021 |
| ||
Computed at statutory rate |
| $ | 1,167 |
|
| $ | (209 | ) |
State income taxes |
|
| (924 | ) |
|
| (949 | ) |
Rate change |
|
| 2,857 |
|
|
| 482 |
|
Tax differential on non-U.S. earnings |
|
| — |
|
|
| (49 | ) |
GILTI inclusion |
|
| — |
|
|
| 305 |
|
Stock-based compensation |
|
| 183 |
|
|
| 152 |
|
Meals and entertainment |
|
| 28 |
|
|
| 10 |
|
Adjustments to net operating losses |
|
| 296 |
|
|
| 275 |
|
(Decrease) increase in valuation allowance |
|
| (1,758 | ) |
|
| 2,225 |
|
Other – net |
|
| (273 | ) |
|
| 63 |
|
Total income tax provision |
| $ | 1,576 |
|
| $ | 2,305 |
|
Deferred income tax assets and liabilities as of December 31, 2022 and 2021 are summarized in the following table. Unremitted earnings of the Corporation’s non-U.S. subsidiaries and affiliates are deemed to be permanently re-invested and, accordingly, no deferred income tax liability has been recorded. If the Corporation were to remit any foreign earnings to the U.S., the estimated tax impact would be insignificant.
|
| 2022 |
|
| 2021 |
| ||
Assets: |
|
|
|
|
|
| ||
Employment – related liabilities |
| $ | 4,931 |
|
| $ | 7,378 |
|
Pension liability – domestic |
|
| 5,873 |
|
|
| 7,984 |
|
Capital loss carryforwards |
|
| 182 |
|
|
| 204 |
|
Asbestos-related liability |
|
| 12,005 |
|
|
| 14,685 |
|
Net operating loss – domestic |
|
| 12,224 |
|
|
| 13,156 |
|
Net operating loss – state |
|
| 3,172 |
|
|
| 5,415 |
|
Net operating loss – foreign |
|
| 8,504 |
|
|
| 9,666 |
|
Impairment charge associated with investment in MG |
|
| 956 |
|
|
| 961 |
|
Operating lease right-of-use assets |
|
| 855 |
|
|
| 980 |
|
Interest expense limitation |
|
| 814 |
|
|
| 2,517 |
|
Sale-leaseback |
|
| 9,784 |
|
|
| — |
|
Other |
|
| 643 |
|
|
| 797 |
|
Gross deferred income tax assets |
|
| 59,943 |
|
|
| 63,743 |
|
Valuation allowance |
|
| (31,981 | ) |
|
| (37,889 | ) |
|
|
| 27,962 |
|
|
| 25,854 |
|
Liabilities: |
|
|
|
|
|
| ||
Depreciation |
|
| (24,085 | ) |
|
| (22,015 | ) |
Inventory related |
|
| (1,576 | ) |
|
| (1,511 | ) |
Pension asset – foreign |
|
| (808 | ) |
|
| (1,482 | ) |
Intangible assets – finite life |
|
| (241 | ) |
|
| (565 | ) |
Intangible assets – indefinite life |
|
| (453 | ) |
|
| (510 | ) |
Operating lease liabilities |
|
| (855 | ) |
|
| (980 | ) |
Other |
|
| (321 | ) |
|
| (664 | ) |
Gross deferred income tax liabilities |
|
| (28,339 | ) |
|
| (27,727 | ) |
Net deferred income tax liabilities |
| $ | (377 | ) |
| $ | (1,873 | ) |
65
At December 31, 2022, the Corporation has U.S. federal net operating loss carryforwards of $58,211, of which $54,870 can be carried forward indefinitely but will be limited to 80% of taxable income in any given year. The balance of $3,341 will begin to expire in 2035 and can be used without taxable income limitation. Additionally, at December 31, 2022, the Corporation had state net operating loss carryforwards of $77,747, which begin to expire in 2023, and foreign net operating loss carryforwards of $39,592 and capital loss carryforwards of $730, which do not expire.
Unrecognized tax benefits and changes in unrecognized tax benefits for the years ended December 31, 2022 and 2021 are insignificant. If the unrecognized tax benefits were recognized, the effect on the Corporation’s effective income tax rate would also be insignificant. The amount of penalties and interest recognized in the consolidated balance sheets as of December 31, 2022 and 2021 and in the consolidated statements of operations for 2022 and 2021 is insignificant.
In 2022, new legislation was enacted which will decrease the Pennsylvania state income tax rate from 9.99% to 4.99% in 2031. In 2021, new legislation was enacted which will increase the U.K. corporate income tax rate from 19% to 25% in 2023.
On August 16, 2022, the Inflation Reduction Act (“IRA”) was enacted in the United States. Among other provisions, the IRA included a new 15% Corporate Alternative Minimum Tax (“CAMT”) for corporations with financial income in excess of $1 billion and a 1% excise tax on corporate share repurchases. The CAMT is effective for tax years beginning on or after January 1, 2023. The excise tax on corporate share repurchases is not expected to impact the Corporation as the Corporation's revolving credit facility prohibits the Corporation from repurchasing its shares.
The Corporation is subject to taxation in the United States, various states and foreign jurisdictions, and remains subject to examination by tax authorities for 2013, due to the carryback of net operating losses enabled by the Coronavirus Aid, Relief, and Economic Security Act signed into law in 2020, and for tax years 2019 – 2022.
NOTE 2022 – ENVIRONMENTAL MATTERS:
The Corporation is currently performing certain remedial actions in connection with the sale of real estate previously owned and periodically incurs costs to maintain compliance with environmental laws and regulations. Environmental exposures are difficult to assess and estimate for numerous reasons, including lack of reliable data, the multiplicity of possible solutions, the years of remedial and monitoring activity required, and identification of new sites. In the opinion of management, theThe undiscounted potential liability for remedial actions and environmental compliance measures approximated $100 as of December 31, 2022 and 2021.
NOTE 23 – RELATED PARTIES:
In 2022, ATR periodically had loans outstanding with its minority shareholder. Amounts borrowed and repaid approximated $5,776 (RMB 38,471) in 2022. In addition, ATR repaid an existing loan in 2021 of approximately $440$1,056 (RMB 6,901). No loans are outstanding as of December 31, 2022 or 2021.
Interest on the borrowings equaled the three-to-five-year loan interest rate set by the People’s Bank of China in effect at the time of the borrowing, which approximated 4.785% and 5% for 2022 and 2021, respectively. Interest paid in 2022, including interest accumulated on previous loans, approximated $1,766 (RMB 11,063). Interest paid in 2021 approximated $479 (RMB 3,046). Accrued interest as of December 31, 2021 approximated $1,713 (RMB 10,901), and was recorded in other current liabilities on the consolidated balance sheet. No interest was outstanding as of December 31, 2022.
Purchases from ATR’s minority shareholder and its affiliates, which were in the ordinary course of business, approximated $6,666 (RMB 44,856) and $11,368 (RMB 73,299) in 2022 and 2021, respectively. At December 31, 2022 and 2021, the amount payable to ATR’s minority shareholder and its affiliates for purchases approximated $412 (RMB 2,841) and $1,125 (RMB 7,157), respectively. Additionally, customer deposits from ATR’s minority shareholder and its affiliates approximated $368 (RMB 2,542) and $616 (RMB 3,921) at December 31, 2017, is considered adequate based on information known2022 and 2021, respectively. Sales to date.ATR’s minority shareholder and its affiliates, which were in the ordinary course of business, approximated $9,934 (RMB 66,849) and $9,842 (RMB 63,460) for 2022 and 2021, respectively. At December 31, 2022, the amount due from ATR's minority shareholder or its affiliates approximated $1,066 (RMB 7,352). No amounts were due from ATR’s minority shareholder or its affiliates as of December 31, 2021.
66
NOTE 2124 – BUSINESS SEGMENTS:
The Corporation organizes its business into two operating segments—segments – Forged and Cast Engineered Products and Air and Liquid Processing.Processing. Summarized financial information concerning the Corporation’s reportable segments is shown in the following tables. Corporate assets included under Identifiable Assets represent primarily cash and cash equivalents and other items not allocated to reportable segments. Long-lived assets exclude deferred income tax assets. Corporate costs are comprised of operating costs of the corporate office and other costs not allocated to the segments. The segment information for the Forged and Cast Engineered Products includes information for Åkers and ASW beginning as of December 31, 2016, and from their respective dates of acquisition. The accounting policies are the same as those described in Note 1.1, Summary of Significant Accounting Policies.
|
| Net Sales(1) | Income (Loss) Before Income Taxes |
| ||||||||||||
|
| 2022 |
|
| 2021 |
|
| 2022 |
|
| 2021 - as adjusted |
| ||||
Forged and Cast Engineered Products |
| $ | 299,484 |
|
| $ | 260,204 |
|
| $ | 444 |
|
| $ | 5,073 |
|
Air and Liquid Processing(2) |
|
| 90,705 |
|
|
| 84,716 |
|
|
| 13,686 |
|
|
| 2,601 |
|
Total Reportable Segments |
|
| 390,189 |
|
|
| 344,920 |
|
|
| 14,130 |
|
|
| 7,674 |
|
Corporate costs, including other income (expense) |
|
| — |
|
|
| — |
|
|
| (8,574 | ) |
|
| (8,669 | ) |
Consolidated total |
| $ | 390,189 |
|
| $ | 344,920 |
|
| $ | 5,556 |
|
| $ | (995 | ) |
|
| Capital Expenditures | Depreciation and | Identifiable Assets(3) |
| |||||||||||||||||||
|
| 2022 |
|
| 2021 |
|
| 2022 |
|
| 2021 |
|
| 2022 |
|
| 2021 |
| ||||||
Forged and Cast Engineered Products |
| $ | 15,312 |
|
| $ | 14,929 |
|
| $ | 16,730 |
|
| $ | 17,051 |
|
| $ | 327,277 |
|
| $ | 331,598 |
|
Air and Liquid Processing |
|
| 1,376 |
|
|
| 307 |
|
|
| 667 |
|
|
| 749 |
|
|
| 168,583 |
|
|
| 162,010 |
|
Corporate |
|
| — |
|
|
| — |
|
|
| 11 |
|
|
| 77 |
|
|
| 6,914 |
|
|
| 12,352 |
|
Consolidated total |
| $ | 16,688 |
|
| $ | 15,236 |
|
| $ | 17,408 |
|
| $ | 17,877 |
|
| $ | 502,774 |
|
| $ | 505,960 |
|
|
| Long-lived Assets(4) |
| Income (Loss) Before Income Taxes | ||||||||||||||
Geographic Areas: |
| 2022 |
|
| 2021 |
|
|
| 2022 |
|
| 2021 - as adjusted |
|
| ||||
United States (5) |
| $ | 202,860 |
|
| $ | 218,712 |
|
|
| $ | 1,424 |
|
| $ | (9,314 | ) |
|
Foreign |
|
| 66,365 |
|
|
| 76,447 |
|
|
|
| 4,132 |
|
|
| 8,319 |
|
|
Consolidated total |
| $ | 269,225 |
|
| $ | 295,159 |
|
|
| $ | 5,556 |
|
| $ | (995 | ) |
|
67
|
| Net Sales |
|
| (Loss) Income Before Income Taxes and Equity Gains (Losses) in Joint Venture |
| ||||||||||||||||||
|
| 2017 |
|
| 2016 |
|
| 2015 |
|
| 2017 |
|
| 2016 |
|
| 2015 |
| ||||||
Forged and Cast Engineered Products(1) |
| $ | 344,529 |
|
| $ | 247,652 |
|
| $ | 152,267 |
|
| $ | (1,826 | ) |
| $ | (42,878 | ) |
| $ | (3,444 | ) |
Air and Liquid Processing(1) |
|
| 87,872 |
|
|
| 84,214 |
|
|
| 86,213 |
|
|
| 10,427 |
|
|
| 5,123 |
|
|
| 23,166 |
|
Total Reportable Segments |
|
| 432,401 |
|
|
| 331,866 |
|
|
| 238,480 |
|
|
| 8,601 |
|
|
| (37,755 | ) |
|
| 19,722 |
|
Corporate costs, including other income (expense) |
| 0 |
|
| 0 |
|
| 0 |
|
|
| (22,294 | ) |
|
| (19,765 | ) |
|
| (15,202 | ) | |||
Consolidated total |
| $ | 432,401 |
|
| $ | 331,866 |
|
| $ | 238,480 |
|
| $ | (13,693 | ) |
| $ | (57,520 | ) |
| $ | 4,520 |
|
|
| Capital Expenditures |
|
| Depreciation and Amortization Expense |
|
| Identifiable Assets(2) |
| |||||||||||||||||||||||||||
|
| 2017 |
|
| 2016 |
|
| 2015 |
|
| 2017 |
|
| 2016 |
|
| 2015 |
|
| 2017 |
|
| 2016 |
|
| 2015 |
| |||||||||
Forged and Cast Engineered Products |
| $ | 14,165 |
|
| $ | 9,440 |
|
| $ | 8,608 |
|
| $ | 21,124 |
|
| $ | 19,166 |
|
| $ | 10,468 |
|
| $ | 414,227 |
|
| $ | 348,331 |
|
| $ | 228,718 |
|
Air and Liquid Processing |
|
| 560 |
|
|
| 385 |
|
|
| 494 |
|
|
| 1,072 |
|
|
| 1,183 |
|
|
| 1,262 |
|
|
| 132,341 |
|
|
| 173,017 |
|
|
| 183,024 |
|
Corporate |
|
| 174 |
|
|
| 741 |
|
|
| 305 |
|
|
| 191 |
|
|
| 114 |
|
|
| 57 |
|
|
| 19,031 |
|
|
| 44,541 |
|
|
| 94,414 |
|
|
| $ | 14,899 |
|
| $ | 10,566 |
|
| $ | 9,407 |
|
| $ | 22,387 |
|
| $ | 20,463 |
|
| $ | 11,787 |
|
| $ | 565,599 |
|
| $ | 565,889 |
|
| $ | 506,156 |
|
|
| Net Sales(3) |
|
| Long-Lived Assets(4) |
|
| (Loss) Income Before Income Taxes and Equity Gains (Losses) in Joint Venture |
| |||||||||||||||||||||||||||
Geographic Areas: |
| 2017 |
|
| 2016 |
|
| 2015 |
|
| 2017 |
|
| 2016 |
|
| 2015 |
|
| 2017 |
|
| 2016 |
|
| 2015 |
| |||||||||
United States |
| $ | 236,856 |
|
| $ | 159,531 |
|
| $ | 126,417 |
|
| $ | 235,646 |
|
| $ | 206,460 |
|
| $ | 236,707 |
|
| $ | (18,122 | ) |
| $ | (25,906 | ) |
| $ | 5,855 |
|
Foreign |
|
| 195,545 |
|
|
| 172,335 |
|
|
| 112,063 |
|
|
| 88,116 |
|
|
| 133,141 |
|
|
| 29,198 |
|
| $ | 4,429 |
|
|
| (31,614 | ) |
|
| (1,335 | ) |
|
| $ | 432,401 |
|
| $ | 331,866 |
|
| $ | 238,480 |
|
| $ | 323,762 |
|
| $ | 339,601 |
|
| $ | 265,905 |
|
| $ | (13,693 | ) |
| $ | (57,520 | ) |
| $ | 4,520 |
|
|
| Net Sales by Product Line(5) |
| |||||||||
|
| 2017 |
|
| 2016 |
|
| 2015 |
| |||
Forged and cast mill rolls |
| $ | 254,638 |
|
| $ | 230,531 |
|
| $ | 129,499 |
|
Forged engineered products |
|
| 89,891 |
|
|
| 17,121 |
|
|
| 22,768 |
|
Heat exchange coils |
|
| 28,998 |
|
|
| 28,139 |
|
|
| 32,745 |
|
Centrifugal pumps |
|
| 35,607 |
|
|
| 36,359 |
|
|
| 33,120 |
|
Air handling systems |
|
| 23,267 |
|
|
| 19,716 |
|
|
| 20,348 |
|
|
| $ | 432,401 |
|
| $ | 331,866 |
|
| $ | 238,480 |
|
|
|
|
|
|
|
|
|
QUARTERLY INFORMATION – UNAUDITED
The quarterly information includes the results of operations of Åkers from March 3, 2016, and ASW from November 1, 2016, their respective dates of acquisition. Accordingly, the quarterly information for 2016 is not fully comparable to 2017.
(in thousands, except per share amounts) |
| First Quarter |
|
| Second Quarter |
|
| Third Quarter |
|
| Fourth Quarter |
| ||||
2017 |
|
|
|
|
|
|
|
|
|
|
|
|
|
|
|
|
Net sales |
| $ | 103,516 |
|
| $ | 110,550 |
|
| $ | 103,886 |
|
| $ | 114,449 |
|
Gross profit(a) |
|
| 18,853 |
|
|
| 18,533 |
|
|
| 16,591 |
|
|
| 20,752 |
|
Net loss attributable to Ampco-Pittsburgh(b) |
|
| (4,783 | ) |
|
| (1,913 | ) |
|
| (2,202 | ) |
|
| (3,191 | ) |
Net loss per common share attributable to Ampco-Pittsburgh: |
|
|
|
|
|
|
|
|
|
|
|
|
|
|
|
|
Basic(b) |
|
| (0.39 | ) |
|
| (0.16 | ) |
|
| (0.18 | ) |
|
| (0.26 | ) |
Diluted(b) |
|
| (0.39 | ) |
|
| (0.16 | ) |
|
| (0.18 | ) |
|
| (0.26 | ) |
Comprehensive (loss) income attributable to Ampco-Pittsburgh |
|
| (1,808 | ) |
|
| 2,952 |
|
|
| 1,660 |
|
|
| 7,320 |
|
2016 |
|
|
|
|
|
|
|
|
|
|
|
|
|
|
|
|
Net sales |
| $ | 63,578 |
|
| $ | 93,301 |
|
| $ | 82,861 |
|
| $ | 92,126 |
|
Gross profit(a) |
|
| 12,473 |
|
|
| 15,849 |
|
|
| 15,594 |
|
|
| 11,454 |
|
Net loss attributable to Ampco-Pittsburgh(c) |
|
| (2,890 | ) |
|
| (6,486 | ) |
|
| (27,382 | ) |
|
| (43,062 | ) |
Net loss per common share attributable to Ampco-Pittsburgh: |
|
|
|
|
|
|
|
|
|
|
|
|
|
|
|
|
Basic(c) |
|
| (0.26 | ) |
|
| (0.53 | ) |
|
| (2.23 | ) |
|
| (3.51 | ) |
Diluted(c) |
|
| (0.26 | ) |
|
| (0.53 | ) |
|
| (2.23 | ) |
|
| (3.51 | ) |
Comprehensive loss attributable to Ampco-Pittsburgh(d) |
|
| (1,501 | ) |
|
| (10,739 | ) |
|
| (22,894 | ) |
|
| (47,972 | ) |
|
|
|
|
|
|
|
|
REPORT OF INDEPENDENT REGISTERED PUBLIC ACCOUNTING FIRM
To the shareholdersShareholders and the Board of Directors of
Ampco-Pittsburgh Corporation
Carnegie, Pennsylvania
Opinion on the Consolidated Financial Statements
We have audited the accompanying consolidated balance sheets of Ampco-Pittsburgh Corporation and subsidiaries (the “Corporation”)Corporation) as of December 31, 20172022 and 2016,2021, the related consolidated statements of operations, comprehensive income, (loss), shareholders’ equity, and cash flows for each of the three years in the periodthen ended, December 31, 2017, and the related notes (collectively referred to as the “financial“consolidated financial statements”). In our opinion, the consolidated financial statements present fairly, in all material respects, the financial position of the Corporation as ofat December 31, 20172022 and 2016,2021, and the results of its operations and its cash flows for each of the three years in the periodthen ended December 31, 2017,, in conformity with accounting principles generally accepted in the United States of America.
Change in Accounting Method Related to Inventory
We have also audited,As discussed in accordance withNotes 1 and 2 to the standardsconsolidated financial statements, the Corporation has elected to change its method of accounting for inventory cost in the Public Company Accounting Oversight Board (United States) (PCAOB),United States from the Corporation’s internal control overlast-in, first-out (LIFO) to the first-in, first-out (FIFO) method in 2022. The accounting change has been retrospectively applied to all periods presented in the financial reporting as of December 31, 2017, based on the criteria established in Internal Control—Integrated Framework (2013) issued by the Committee of Sponsoring Organizations of the Treadway Commission and our report dated March 16, 2018, expressed an unqualified opinion on the Corporation’s internal control over financial reporting.statements.
Basis for Opinion
These consolidated financial statements are the responsibility of the Corporation’s management. Our responsibility is to express an opinion on the Corporation’s consolidated financial statements based on our audits. We are a public accounting firm registered with the PCAOBPublic Company Accounting Oversight Board (United States) (PCAOB) and are required to be independent with respect to the Corporation in accordance with the U.S. federal securities laws and the applicable rules and regulations of the Securities and Exchange Commission and the PCAOB.
We conducted our audits in accordance with the standards of the PCAOB. Those standards require that we plan and perform the auditaudits to obtain reasonable assurance about whether the consolidated financial statements are free of material misstatement, whether due to error or fraud. The Corporation is not required to have, nor were we engaged to perform, an audit of its internal control over financial reporting. As part of our audits, we are required to obtain an understanding of internal control over financial reporting but not for the purpose of expressing an opinion on the effectiveness of the Corporation’s internal control over financial reporting. Accordingly, we express no such opinion.
Our audits included performing procedures to assess the risks of material misstatement of the consolidated financial statements, whether due to error or fraud, and performing procedures that respond to those risks. Such procedures included examining, on a test basis, evidence regarding the amounts and disclosures in the consolidated financial statements. Our audits also included evaluating the accounting principles used and significant estimates made by management, as well as evaluating the overall presentation of the consolidated financial statements. We believe that our audits provide a reasonable basis for our opinion.
Critical Audit Matter
The critical audit matter communicated below is a matter arising from the current period audit of the consolidated financial statements that was communicated or required to be communicated to the audit committee and that: (1) relates to accounts or disclosures that are material to the consolidated financial statements and (2) involved our especially challenging, subjective, or complex judgments. The communication of critical audit matters does not alter in any way our opinion on the consolidated financial statements, taken as a whole, and we are not, by communicating the critical audit matter below, providing separate opinions on the critical audit matter or on the accounts or disclosures to which it relates.
Asbestos Liabilities and Related Insurance Receivables
As described in Notes 1 and 20 to the Corporation’s consolidated financial statements, the Corporation has accrued asbestos liabilities of $153.6 million ($23.0 million current and $130.6 million long term) and recorded asbestos-related insurance receivables of $105.9 million ($15.0 million current and $90.9 million noncurrent) as of December 31, 2022. These liabilities and insurance receivables relate to claims that have been asserted alleging personal injury from exposure to asbestos-containing components historically used in certain products manufactured by predecessors of the Corporation’s Air & Liquid Systems Corporation. The Corporation utilizes third-party experts to assist in developing (i) an estimate of the asbestos liability for the probable pending and future claims over the period that the Corporation believes it can reasonably estimate such claims and (ii) an estimate of the insurance receivable for the insurance proceeds expected to be received under existing policies associated with the asbestos liabilities.
68
We identified the valuation of asbestos liabilities and insurance receivables as a critical audit matter. The principal considerations for our determination are: (i) the subjectivity of estimating projected claims including the period for which the Corporation can reasonably estimate the asbestos liabilities, (ii) the estimation process for projected settlement values of reported and unreported claims including the number of claims expected to be filed and adjudicated, the disease type, and the settlement and defense costs to estimate the asbestos liabilities, and (iii) the complexity of determining the associated insurance receivables including the estimated settlement costs for the asbestos liabilities and the associated defense costs, the continued financial solvency of the insurance carriers, and legal interpretation of rights for recovery under the insurance policies and the related settlement agreements. Auditing these elements involved especially challenging auditor judgment due to the nature and extent of audit effort required to address these matters, including the extent of specialized skill or knowledge needed.
The primary procedures we performed to address this critical audit matter included:
/s/ Deloitte & ToucheBDO USA, LLP
Pittsburgh, Pennsylvania
March 16, 2018
We have served as the Corporation’s auditor since 1999.2020.
March 21, 2023
69
ITEM 9. CHANGES IN AND DISAGREEMENTS WITH ACCOUNTANTSACCOUNTANTS ON ACCOUNTING AND FINANCIAL DISCLOSURE
The Corporation did not experience any changes in, or disagreements with its accountants on, accounting and financial disclosure during the period covered.
ITEM 9A. CONTROLS AND PROCEDURES
Disclosure Controls and Procedures. An evaluation of the effectiveness of the Corporation’s disclosure controls and procedures as of the end of the period covered by this report was carried out under the supervision, and with the participation, of management, including the principal executive officer and principal financial officer. Disclosure controls and procedures are defined under Securities and Exchange Commission (“SEC”) rules as controls and other procedures that are designed to ensure that information required to be disclosed by a company in the reports that it files under the Exchange Act is recorded, processed, summarized and reported within required time periods. Disclosure controls and procedures include, without limitation, controls and procedures designed to ensure that information required to be disclosed by an issuer in the reports that it files or submits under the Exchange Act is accumulated and communicated to the issuer’s management, including its principal executive and principal financial officers, or persons performing similar functions, as appropriate, to allow timely decisions regarding required disclosure. Based on that evaluation, the Corporation’s management, including the principal executive officer and principal financial officer, has concluded that, as of December 31, 2022, the Corporation’s disclosure controls and procedures were not effective at the reasonable assurance level as of December 31, 2017.due to material weaknesses (as defined in SEC Rule 12b-2) in its internal control over financial reporting.
Management’s Annual Report on Internal Control Over Financial Reporting. The Corporation’s management is responsible for establishing and maintaining adequate internal control over financial reporting (as defined in Rule 13a – 15(f) under the Securities Exchange Act of 1934, as amended)Act). Internal control over financial reporting cannot provide absolute assurance of achieving financial reporting objectives because of its inherent limitations. Effective internal control over financial reporting can only provide reasonable assurance that the objectives of the control process are met. Internal control over financial reporting is a process that involves human diligence and compliance and is subject to lapses in judgment and breakdowns resulting from human failures. Internal control over financial reporting also can be circumvented by collusion or improper management override. Because of such limitations, there is a risk that material misstatements may not be prevented or detected on a timely basis by internal control over financial reporting. However, these inherent limitations are known features of the financial reporting process. Therefore it is possible to design into the process safeguards to reduce, though not eliminate, this risk. Further, the design of internal control over financial reporting includes the consideration of the benefits of each control relative to the cost of the control.
Management assessed the effectiveness of internal control over financial reporting as of December 31, 2017.2022. In making this assessment, management used the criteria set forth in Internal Control – Integrated Framework (2013) issued by the Committee of Sponsoring Organizations of the Treadway Commission. Based on those criteria and management’s assessment, management, including the principal executive officer and principal financial officer, concluded that the Corporation’sCorporation's internal control over financial reporting was not effective as of December 31, 2017.
The Corporation’s independent registered public accounting firm, Deloitte & Touche LLP, has issued an attestation report on the Corporation’s2022, because of material weaknesses as described below. A material weakness is a deficiency, or a combination of deficiencies, in internal control over financial reporting such that there is a reasonable possibility that a material misstatement of the annual or interim financial statements will not be prevented or detected on a timely basis.
Based upon the aforementioned assessment, management determined that, as of December 31, 2022, there were material weaknesses related to (i) the accounting for the claims asserted alleging personal injury from exposure to asbestos-containing components historically used in some products manufactured by predecessors of Air & Liquid Systems Corporation (“Asbestos Liability”) and (ii) management review control activities related to the tax accounting for a non-routine transaction.
Asbestos Liability: The material weakness related to the Asbestos Liability is a result of the aggregation of the following control deficiencies: insufficient design and business process controls surrounding a new asbestos claims management database, insufficient testing of data migration from the previous asbestos claims management database to the new asbestos claims management database, and inadequate information technology (“IT”) general controls which ensure the integrity of the data and processes that the new asbestos claims management system supports. To provide reasonable assurance regarding the reliability of the consolidated financial statements of the Corporation as of and for the year ended December 31, 2022, the Corporation engaged its internal auditors, Schneider Downs & Co., Inc. (an audit, tax and advisory firm), to assist management in:
70
Accordingly, management believes the consolidated financial statements included in this report fairly present, in all material respects, the Corporation's financial condition, results of operations, changes in shareholders’ equity, and cash flows for the periods presented.
Management’s Remediation Plans and Progress
The Corporation has dedicated a full-time employee to manage the accounting for asbestos claims and costs associated with the Asbestos Liability, with oversight provided by the Corporation's Chief Financial Officer (“CFO”). The asbestos claims and costs associated with the Asbestos Liability will continue to be managed using the new third-party asbestos claims management database. The third-party service provider has committed to provide an appropriate Service Organization Control (“SOC”) report, which will give assurance over the functioning of the third-party system and the sufficiency of its internal controls. The SOC report will be obtained and reviewed by the CFO ensuring the SOC report is appropriate, no material deficiencies exist to cause the inability to rely on the third-party system, and any additional management controls are designed and assessed for operating effectiveness. The Corporation has established limits of authority for its employees utilizing the new third-party asbestos claims management database, which provides an appropriate segregation of duties. Annually, user access to, and user rights within, the new third-party asbestos claims management database will be independently reviewed and approved.
Non-routine Transaction: The material weakness related to management review control activities was attributable to the tax accounting for a non-routine transaction. Specifically, management determined that its management review control activities did not operate at a sufficient level of precision to detect errors related to the tax accounting for the non-routine transaction. This material weakness resulted in classification adjustments between the components of deferred income tax assets and liabilities in Note 21, Income Taxes, to the Corporation's Consolidated Financial Statements;however, no significant adjustments were required to the Corporation's consolidated balance sheets, statements of operations, comprehensive income, shareholders' equity or cash flows. Since the necessary adjustments were made to Note 21, Income Taxes, management believes the consolidated financial statements included herein.in this report fairly present, in all material respects, the Corporation's financial condition, results of operations, changes in shareholders’ equity, and cash flows for the periods presented.
Management’s Remediation Plans and Progress
The Corporation will enhance its management review control activities when assessing the propriety of the accounting for the income tax consequences of a non-routine transaction. Specifically, the Corporation will continue to engage external consultants, under the Corporation's supervision, to provide support and assist the Corporation in its evaluation of such transactions. In addition, the Corporation will enhance its management review controls over income taxes on an interim basis to include specific activities at a more precise level to assess the impacts of non-routine transactions, including the identification of relevant contractual terms and conditions related to such transactions.
Despite management's remediation plans and progress related to the Asbestos Liability and the non-routine transaction, the material weaknesses will not be considered remediated until the applicable controls operate for a sufficient period of time and management has concluded, through testing, that these controls are operating effectively.
Changes in Internal Control Over Financial Reporting. There Except as discussed above, there were no other changes in the Corporation’s internal control over financial reporting during the quarter ended December 31, 2017,2022, that have materially affected, or are reasonably likely to materially affect, its internal control over financial reporting.
REPORT OF INDEPENDENT REGISTERED PUBLIC ACCOUNTING FIRM
To the shareholders and the Board of Directors of Ampco-Pittsburgh Corporation
Opinion on Internal Control over Financial Reporting
We have audited the internal control over financial reporting of Ampco-Pittsburgh Corporation and subsidiaries (the “Corporation”) as of December 31, 2017, based on criteria established in Internal Control — Integrated Framework (2013) issued by the Committee of Sponsoring Organizations of the Treadway Commission (COSO). In our opinion, the Corporation maintained, in all material respects, effective internal control over financial reporting as of December 31, 2017, based on the criteria established in Internal Control — Integrated Framework (2013) issued by COSO.
We have also audited, in accordance with the standards of the Public Company Accounting Oversight Board (United States) (PCAOB), the consolidated financial statements as of and for the year ended December 31, 2017, of the Corporation and our report dated March 16, 2018, expressed an unqualified opinion on those financial statements.
Basis for Opinion
The Corporation’s management is responsible for maintaining effective internal control over financial reporting and for its assessment of the effectiveness of internal control over financial reporting, included in the accompanying Management’s Annual Report on Internal Control Over Financial Reporting. Our responsibility is to express an opinion on the Corporation’s internal control over financial reporting based on our audit. We are a public accounting firm registered with the PCAOB and are required to be independent with respect to the Corporation in accordance with the U.S. federal securities laws and the applicable rules and regulations of the Securities and Exchange Commission and the PCAOB.
We conducted our audit in accordance with the standards of the PCAOB. Those standards require that we plan and perform the audit to obtain reasonable assurance about whether effective internal control over financial reporting was maintained in all material respects. Our audit included obtaining an understanding of internal control over financial reporting, assessing the risk that a material weakness exists, testing and evaluating the design and operating effectiveness of internal control based on the assessed risk, and performing such other procedures as we considered necessary in the circumstances. We believe that our audit provides a reasonable basis for our opinion.
Definition and Limitations of Internal Control over Financial Reporting
A company’s internal control over financial reporting is a process designed to provide reasonable assurance regarding the reliability of financial reporting and the preparation of financial statements for external purposes in accordance with generally accepted accounting principles. A company’s internal control over financial reporting includes those policies and procedures that (1) pertain to the maintenance of records that, in reasonable detail, accurately and fairly reflect the transactions and dispositions of the assets of the company; (2) provide reasonable assurance that transactions are recorded as necessary to permit preparation of financial statements in accordance with generally accepted accounting principles, and that receipts and expenditures of the company are being made only in accordance with authorizations of management and directors of the company; and (3) provide reasonable assurance regarding prevention or timely detection of unauthorized acquisition, use, or disposition of the company’s assets that could have a material effect on the financial statements.
Because of its inherent limitations, internal control over financial reporting may not prevent or detect misstatements. Also, projections of any evaluation of effectiveness to future periods are subject to the risk that the controls may become inadequate because of changes in conditions, or that the degree of compliance with the policies or procedures may deteriorate.
/s/ Deloitte & Touche LLP
Pittsburgh, Pennsylvania
March 16, 2018
None
ITEM 9C. DISCLOSURE REGARDING FOREIGN JURISDICTIONS THAT PREVENT INSPECTIONS
– PART III –
ITEM 10. DIRECTORS, EXECUTIVE OFFICERS AND CORPORATE GOVERNANCE
The information about the Corporation’s directors required by Item 401 of Regulation S-K and not otherwise set forth below is contained under the caption “Proposal 1: Election of Directors” in the Corporation’s definitive Proxy Statement for the 20182023 Annual Meeting of Shareholders (the “Proxy Statement”) which the CompanyCorporation anticipates filing with the Securities and Exchange Commission, pursuant to Regulation 14A, not later than 120 days after the end of the Corporation’s fiscal year, and is incorporated herein by reference. The information required by Item 401 of Regulation S-K regarding executive officers is set forth in Part I, Item 1 of this report under “Executive Officers.”
The information required by Item 405 of Regulation S-K is contained under the caption “Security Ownership of Certain Beneficial Owners and Management”Management - Delinquent Section 16(a) Reports” of the Proxy Statement and is incorporated by reference.
The Corporation and its subsidiaries have adopted a Code of Business Conduct and Ethics that applies to all of their officers, directors and employees, as well as an additional Code of Ethics that applies to the Corporation’s Chief Executive Officer and Chief Financial Officer, which are available on the Corporation’s website at www.ampcopittsburgh.com.www.ampcopittsburgh.com.
The information required by Items 407(c)(3), (d)(4) and (d)(5) of Regulation S-K is includedcontained under the captions “Corporate Governance – Director Nominating Procedures” and “Board Committees;Committees: Director Compensation; Stock Ownership GuidelinesCompensation – Audit Committee” of the Proxy Statement and is incorporated by reference.
ITEM 11. EXECUTIVE COMPENSATION
The information required for this Item 11 is contained in the Proxy Statement under the captions “Director Compensation,” “Compensation Discussion and Analysis (“CDA”),” “Summary Compensation Table,” “Outstanding Equity Awards at Fiscal Year-End,” “Retirement Benefits,” “Potential Payments upon Termination, Resignation or Change in Control,” and “Report of The Compensation Committee InterlocksCommittee” of the Proxy Statement and Insider Participation” and “Compensation Committee Report.”is incorporated by reference.
ITEM 12. SECURITY OWNERSHIP OF CERTAIN BENEFICIAL OWNERS AND MANAGEMENT AND RELATED STOCKHOLDERSSTOCKHOLDER MATTERS
The information required by Item 201(d) of Regulation S-K relating to securities authorized for issuance under equity compensation plans is contained under the caption “Outstanding Equity Awards at Fiscal Year End”“Equity Compensation Plan Information” of the Proxy Statement and is incorporated by reference.
The information required by Item 403 of Regulation S-K is contained under the captionscaption “Security Ownership of Certain Beneficial Owners and Management” of the Proxy Statement and is incorporated by reference.
The information required by Item 404(a)404 of Regulation S-K is contained under the caption “Certain Relationships and Related Transactions” in the Proxy Statement and is incorporated by reference.
The information required by Item 407(a) of Regulation S-K is contained under the caption “Corporate Governance – Board Independence” of the Proxy Statement and is incorporated herein by reference.
ITEM 14. PRINCIPAL ACCOUNTANT FEES AND SERVICES
The information required byfor Item 14 is contained inunder the caption “Report of the Audit Committee” of the Proxy Statement under the caption “Ratification of the Appointment of Deloitte & Touche as the Independent Registered Public Accounting Firm for 2018”and is incorporated herein.
– PARTPART IV –
ITEM 15. EXHIBITS AND FINANCIAL STATEMENT SCHEDULES
THE FOLLOWING DOCUMENTS ARE FILED AS PART OF THIS REPORT:
|
|
– Consolidated Balance Sheets
– Consolidated Statements of Operations
– Consolidated Statements of Comprehensive Income (Loss)
– Consolidated Statements of Shareholders’ Equity
– Consolidated Statements of Cash Flows
– Notes to Consolidated Financial Statements
– Report of Independent Registered Public Accounting Firm (BDO USA, LLP; Pittsburgh, Pennsylvania, United States; PCAOB ID #243)
|
|
The following additional financial data should be read in conjunction with the consolidated financial statements in this Annual Report on Form 10-K. Schedules not included with this additional financial data have been omitted because theystatement schedules are not applicable orto the required information is shown inCorporation since the financial statements or notes thereto:Corporation meets the definition of a Smaller Reporting Company, as defined by the Securities and Exchange Commission per Rule 12b-2 of the Exchange Act.
Exhibit No.
|
| ||
| 2.1 |
| |
|
| ||
|
|
|
|
|
Exhibit No.
| |||
| |||
| |||
| |||
| 2.2 | ||
3.1 | |||
| 3.2 | ||
| |||
| |||
| |||
|
| |||
| |||
| 3.3 | ||
4.1 | |||
| 4.2 | ||
| 4.3 | ||
| |||
| |||
| |||
| |||
| 4.4 |
| |
* | 10.1 | ||
| 10.2 | ||
| |||
| |||
| 10.3 | ||
|
73
| |||
| 10.4 | ||
| 10.5 | ||
| |||
| 10.6 |
| |||
* | 10.7 | ||
* | 10.8 | ||
| |||
* | 10.9 | ||
* | 10.10 | ||
10.11 | |||
10.12 | |||
| 10.13 | ||
| 10.14 | ||
| 10.15 | ||
| 10.16 | ||
* | 10.17 | ||
* | 10.18 | ||
10.19 | |||
† | 18 | ||
74
† | 21 | ||
† | 23.1 | ||
† | 23.2 | ||
† | 31.1 | ||
| 31.2 | ||
| 32.1 | ||
| 32.2 | ||
| 101.INS | Inline XBRL Instance Document – the instance document does not appear in the Interactive Data File | |
** | 101.SCH | Inline XBRL Taxonomy Extension Schema Document | |
** | 101.CAL | Inline XBRL Taxonomy Extension Calculation Linkbase Document | |
** | 101.DEF | Inline XBRL Taxonomy Extension Definition Linkbase Document | |
** | 101.LAB | Inline XBRL Taxonomy Extension Label Linkbase Document | |
** | 101.PRE | Inline XBRL Taxonomy Extension Presentation Linkbase Document | |
** | 104 | Cover Page Interactive Data File (embedded within the Inline XBRL document) |
† Filed herewith
* Management contracts, compensatory plans or arrangements required to be filed as an exhibit hereto pursuant to Item 601 of Regulation S-K.
** Attached as Exhibit 101 to this report are the following documents formatted in Inline XBRL (Extensible Business Reporting Language) as of and for the year ended December 31, 2022: (i) the Consolidated Statement of Operations, (ii) the Consolidated Balance Sheet, (iii) the Consolidated Statement of Shareholders’ Equity, (iv) the Consolidated Statement of Comprehensive Income, (v) the Consolidated Statement of Cash Flows, and (vi) Notes to Consolidated Financial Statements.
ITEM 16. FORM 10-K SUMMARY
Not applicable.
75
SIGNATURES
Pursuant to the requirements of Section 13 or 15(d) of the Securities Exchange Act of 1934, the Registrant has duly caused this report to be signed on its behalf by the undersigned, thereunto duly authorized.
March | AMPCO-PITTSBURGH CORPORATION | |||
By: | /s/ | |||
Name: |
| |||
Title: | Chief Executive Officer | |||
Each person whose individual signature follows hereby authorizes and appoints J. Brett McBrayer and Michael G. McAuley, and each of them, with full power of substitution and re-substitution and full power to act without the other, as his or her true and lawful attorney-in-fact and agent to act in his or her name, place and stead and to execute in the name and on behalf of each person, individually and in each capacity stated, and to file any and all amendments to this annual report on Form 10-K and to file the same, with all exhibits thereto, and other documents in connection therewith, with the Securities and Exchange Commission, granting unto said attorneys-in-fact and agents, and each of them, full power and authority to do and perform each and every act and thing, ratifying and confirming all that said attorneys-in-fact and agents or any of them or their or his or her substitute or substitutes may lawfully do or cause to be done by virtue thereof.
76
Pursuant to the requirements of the Securities Exchange Act of 1934, this report has been signed below by the following persons on behalf of the registrant and in their capacities and on the dates indicated.
SIGNATURE | TITLE | DATE |
/s/ | Director and Chief Executive Officer (Principal Executive Officer) | March 21, 2023 |
| ||
/s/ Michael G. McAuley | Senior Vice President, Chief Financial Officer and Treasurer (Principal Financial and Accounting Officer) | March |
Michael G. McAuley | ||
/s/ James J. Abel | Director | March |
James J. Abel | ||
/s/ | Director | March |
| ||
/s/ Robert A. DeMichiei | Director | March 21, 2023 |
Robert A. DeMichiei | ||
/s/ Elizabeth A. Fessenden | Director | March |
Elizabeth A. Fessenden | ||
/s/ Michael I. German | Director | March |
Michael I. German | ||
|
|
|
| ||
/s/ William K. Lieberman | Director | March |
William K. Lieberman | ||
/s/ Darrell L. McNair | Director | March 21, 2023 |
Darrell L. McNair | ||
/s/ Laurence E. Paul | Director | March |
Laurence E. Paul | ||
/s/ Stephen E. Paul | Director | March |
Stephen E. Paul | ||
/s/ Carl H. Pforzheimer, III | Director | March |
Carl H. Pforzheimer, III | ||
|
|
|
| ||
|
|
|
| ||
|
|
|
|
INDEX TO AMPCO-PITTSBURGH CORPORATION FINANCIAL DATA
77
|
| ||
| |||
| |||
|
|
REPORT OF INDEPENDENT REGISTERED PUBLIC ACCOUNTING FIRM
To the shareholders and the Board of Directors of Ampco-Pittsburgh Corporation
Opinion on the Financial Statement Schedule
We have audited the consolidated financial statements of Ampco-Pittsburgh Corporation and subsidiaries (the “Corporation”) as of December 31, 2017 and 2016, and for each of the three years in the period ended December 31, 2017, and the Corporation’s internal control over financial reporting as of December 31, 2017, and have issued our reports thereon dated March 16, 2018; such reports are included elsewhere in this Form 10-K. Our audits also included the financial statement schedule of the Corporation listed in the Index at Item 15. This financial statement schedule is the responsibility of the Corporation’s management. Our responsibility is to express an opinion on the Corporation’s financial statement schedule based on our audits. In our opinion, such financial statement schedule, when considered in relation to the financial statements taken as a whole, presents fairly, in all material respects, the information set forth therein.
/s/ Deloitte & Touche LLP
Pittsburgh, Pennsylvania
March 16, 2018
Valuation and Qualifying Accounts
For the Years Ended December 31, 2017, 2016 and 2015
(in thousands)
|
| Additions |
|
|
|
|
|
|
|
|
| |||||||||||||
Description |
| Balance at Beginning of Period |
|
| Charged to Costs and Expenses |
|
| Charged to Other Accounts |
|
| Deductions |
|
| Other(4) |
|
| Balance at End of Period |
| ||||||
Year ended December 31, 2017 |
|
|
|
|
|
|
|
|
|
|
|
|
|
|
|
|
|
|
|
|
|
|
|
|
Allowance for doubtful accounts |
| $ | 2,228 |
|
| $ | 317 |
|
| $ | (1,355 | ) | (1) | $ | (230 | ) |
| $ | 2 |
|
| $ | 962 |
|
Valuation allowance against gross deferred income tax assets |
| $ | 45,449 |
|
| $ | 0 |
|
| $ | 154 |
| (2) | $ | (7,990 | ) | (3) | $ | 499 |
|
| $ | 38,112 |
|
Year ended December 31, 2016 |
|
|
|
|
|
|
|
|
|
|
|
|
|
|
|
|
|
|
|
|
|
|
|
|
Allowance for doubtful accounts |
| $ | 983 |
|
| $ | 1,598 |
|
| $ | 0 |
|
| $ | (353 | ) |
| $ | 0 |
|
| $ | 2,228 |
|
Valuation allowance against gross deferred income tax assets |
| $ | 2,481 |
|
| $ | 0 |
|
| $ | 30,405 |
| (2) | $ | 0 |
|
| $ | 12,563 |
|
| $ | 45,449 |
|
Year ended December 31, 2015 |
|
|
|
|
|
|
|
|
|
|
|
|
|
|
|
|
|
|
|
|
|
|
|
|
Allowance for doubtful accounts |
| $ | 1,374 |
|
| $ | 408 |
|
| $ | (762 | ) | (1) | $ | (25 | ) |
| $ | (12 | ) |
| $ | 983 |
|
Valuation allowance against gross deferred income tax assets |
| $ | 3,254 |
|
| $ | 0 |
|
| $ | (715 | ) | (2) | $ | 0 |
|
| $ | (58 | ) |
| $ | 2,481 |
|
|
|
|
|
|
|
|
|
79