
UNITED STATES
SECURITIES AND EXCHANGE COMMISSION
Washington, D.C. 20549
FORM 10-K
(Mark One)
☒ | ANNUAL REPORT PURSUANT TO SECTION 13 OR 15(d) OF THE SECURITIES EXCHANGE |
For the fiscal year ended December 31 2017, 2023
OR
☐ | TRANSITION REPORT PURSUANT TO SECTION 13 OR 15(d) OF THE SECURITIES |
FOR THE TRANSITION PERIOD FROMTO
Commission File Number 001-38184
CAMBRIDGE BANCORP
(Exact name of Registrant as specified in its Charter)
Massachusetts | 04-2777442 |
(State or other jurisdiction of incorporation or organization) | (I.R.S. Employer |
1336 Massachusetts Avenue Cambridge, MA | 02138 |
(Address of principal executive offices) | (Zip Code) |
Registrant’s telephone number, including area code: (617) (617) 876-5500
Securities registered pursuant to Section 12(b) of the Act:
Common Stock | CATC | NASDAQ |
(Title of each class) | (Trading symbol) | (Name of each exchange on which |
Securities registered pursuant to Section 12(g) of the Act:
None
(Title of class)
Indicate by check mark if the Registrant is a well-known seasoned issuer, as defined in Rule 405 of the Securities Act. YES Yes☐ NO No☒
Indicate by check mark if the Registrant is not required to file reports pursuant to Section 13 or 15(d) of the Act. YES Yes☐ NO No☒
Indicate by check mark whether the Registrant: (1) has filed all reports required to be filed by Section 13 or 15(d) of the Securities Exchange Act of 1934 during the preceding 12 months (or for such shorter period that the Registrant was required to file such reports), and (2) has been subject to such filing requirements for the past 90 days. YES Yes☒ NO No☐
Indicate by check mark whether the Registrant has submitted electronically and posted on its corporate Web site, if any, every Interactive Data File required to be submitted and posted pursuant to Rule 405 of Regulation S-T (§232.405 of this chapter) during the preceding 12 months (or for such shorter period that the Registrant was required to submit and post such files)submit). YES Yes☒ NO No☐
Indicate by check mark if disclosure of delinquent filers pursuant to Item 405 of Regulation S-K (§229.405) is not contained herein, and will not be contained, to the best of Registrant’s knowledge, in definitive proxy or information statements incorporated by reference in Part III of this Form 10-K or any amendment to this Form 10-K. ☐
Indicate by check mark whether the registrant is a large accelerated filer, an accelerated filer, a non-accelerated filer, smaller reporting company, or an emerging growth company. See the definitions of “large accelerated filer,” “accelerated filer,” “smaller reporting company,” and “emerging growth company” in Rule 12b-2 of the Exchange Act.
Large accelerated filer | ☐ | Accelerated filer |
| |||
Non-accelerated filer |
|
| ☐ | |||
Emerging growth company | ☐ |
If an emerging growth company, indicate by check mark if the registrant has elected not to use the extended transition period for complying with any new or revised financial accounting standards provided pursuant to Section 13(a) of the Exchange Act. ☐
Indicate by check mark whether the registrant has filed a report on and attestation to its management’s assessment of the effectiveness of its internal control over financial reporting under Section 404(b) of the Sarbanes-Oxley Act (15 U.S.C. 726.2(b)) by the registered public accounting firm that prepared or issued its audit report. Yes ☒No ☐
If securities are registered pursuant to Section 12(b) of the Act, indicate by check mark whether the financial statements of the registrant included in the filing reflect the correction of an error to previously issued financial statements. ☐
Indicate by check mark whether any of those error corrections are restatements that required a recovery analysis of incentive-based compensation received by any of the registrant’s executive officers during the relevant recovery period pursuant to §240.10D-1(b). ☐
Indicate by check mark whether the Registrant is a shell company (as defined in Rule 12b-2 of the Exchange Act). YES Yes☐ NO No☒
The aggregate market value of the voting and non-voting common equity held by non-affiliates of the Registrant, based on the closing price of the shares of common stock on The NASDAQ Stock Market on June 30, 2017,2023, was $265,376,368. $391.7 million. The number of shares of Registrant’s Common Stock outstanding as of March 15, 20188, 2024 was 4,101,581.7,846,510.
DOCUMENTS INCORPORATED BY REFERENCE
Portions of the Registrant’s Definitive Proxy Statement relating to the Annual Meeting of Shareholders, scheduled to be held on May 14, 2018, are incorporated by reference into Part III of this Report.None
Page | ||
1 | ||
Item 1. | 2 | |
Item 1A. |
| |
Item 1B. |
| |
Item |
|
|
Item |
| |
Item |
| |
Item 4. | 25 | |
| ||
Item 5. |
| |
Item 6. |
| |
Item 7. | Management’s Discussion and Analysis of Financial Condition and Results of Operations |
|
Item 7A. |
| |
Item 8. |
| |
Item 9. | Changes in and Disagreements With Accountants on Accounting and Financial Disclosure |
|
Item 9A. |
| |
Item 9B. |
| |
Item 9C. | Disclosure Regarding Foreign Jurisdictions that Prevent Inspections | 108 |
| ||
Item 10. |
| |
Item 11. |
| |
Item 12. | Security Ownership of Certain Beneficial Owners and Management and Related Stockholder Matters |
|
Item 13. | Certain Relationships and Related Transactions, and Director Independence |
|
Item 14. |
| |
| ||
Item 15. |
| |
Item 16. |
| |
|
i
i
Unless the context requires otherwise, all references to the “Company,” “we,” “us,” and “our,” refer to Cambridge Bancorp.
Forward-Looking Statements
This report contains forward-looking statements as defined in the Private Securities Litigation Reform Act of 1995. Such forward-looking statements about the Company and its industry involve substantial risks and uncertainties. Statements other than statements of current or historical fact, including statements regarding the Company’s future financial condition, results of operations, business plans, liquidity, cash flows, projected costs, and the impact of any laws or regulations applicable to the Company, are forward-looking statements. Words such as “anticipates,” “believes,” “estimates,” “expects,” “forecasts,” “intends,” “plans,” “projects,” “may,” “will,” “should,” and other similar expressions are intended to identify these forward-looking statements. Such statements are subject to factors that could cause actual results to differ materially from anticipated results. Such factors include, but are not limited to, the following:
national, regional, and local economic conditions may be less favorable than expected, resulting in, among other things, increased charge-offs of loans, higher provisions for credit losses and/or reduced demand for the Company’s services;
disruptions to the credit and financial markets, either nationally or globally;
the failure to complete the proposed Eastern Merger (as defined below) of the Company and the Bank with Eastern Bankshares, Inc. (“Eastern”), imposition of adverse regulatory conditions, disruption to and uncertainty surrounding the parties’ businesses, the inability to realize expected cost savings or to implement integration plans and other adverse consequences associated with the Eastern Merger
legislative, regulatory, or accounting changes, including changes resulting from the adoption and implementation of the Dodd-Frank Wall Street Reform and Consumer Protection Act (“Dodd-Frank(the “Dodd-Frank Act”), which may adversely affect ourthe Company's business and/or competitive position, impose additional costs on the Company or cause usthe Company to change ourits business practices;
the Dodd-Frank Act’s consumer protection regulations which could adversely affect the Company’s business, financial condition, or results of operations;
disruptions in the Company’s ability to access capital markets which may adversely affect its capital resources and liquidity;
effects of changes in amounts of deposits on the Company's funding costs and net interest margin;
thatthe failure of the Company’s financial reporting controls and procedures may notto prevent or detect all errors or fraud;
the Company’s dependence on the accuracy and completeness of information about clients and counterparties;
the fiscal and monetary policies of the federal government and its agencies;
the failure to satisfy capital adequacy and liquidity guidelines applicable to the Company;
downgrades in the Company’s credit rating;
changes in interest rates which could affect interest rate spreads and net interest income;
1
inability to realize expected cost savings or to implement integration plans and other adverse consequences associated with the Company's merger (the “Northmark Merger”) with Northmark Bank (“Northmark”).
increased pressures from competitors (both banks and non-banks) and/or an inability byof the Company to remain competitive in the financial services industry, particularly in the markets which the Company serves, and keep pace with technological changes;
unpredictable natural or other disasters, which could adversely impact the Company’s customersclients or operations;
a loss of customerclient deposits, which could increase the Company’s funding costs;
the disparate impact that can result from having loans concentrated by loan type, industry segment, borrower type or location of the borrower or collateral;
increased loancredit losses or impairment of goodwill and other intangibles;
negative public opinion which could damage the Company’s reputation and adversely impact business and revenues;
the Company depends on the expertise of key personnel, and if these individuals leave or change their roles without effective replacements, operations may suffer;
the Company may not be able to hire or retain additional qualified personnel, including those acquired in previous acquisitions, and recruiting and compensation costs may increase as a result of turnover, both of which may increase costs and reduce profitability and may adversely impact the Company’s ability to implement the Company’s business strategies; and
changes in the Company’s accounting policies or in accounting standards which could materially affect how the Company reports financial results and condition.
The
Except as required by law, the Company does not undertake, and specifically disclaims any obligation, to publicly release the result of any revisions which may be made to any forward-looking statements to reflect the occurrence of anticipated or unanticipated events or circumstances after the date of such statements. You are cautioned not to place undue reliance on these forward-looking statements.
The Company
Cambridge Bancorp (together with its bank subsidiary, unless the context otherwise requires, the “Company”) is a Massachusetts state-chartered, federally registered bank holding company headquartered in Cambridge, Massachusetts. The Company is a Massachusetts corporation formed in 1983 and has one bank subsidiary, (the “Bank”): Cambridge Trust Company (the “Bank”), formed in 1890. On October 17, 2017, the U.S. Securities and Exchange Commission (“SEC”) declared the Company’s Registration Statement on Form 10, as amended, effective. On October 18, 2017, shares of the Company’s common stock commenced trading on the Nasdaq stock marketNASDAQ Stock Market under the symbol CATC. Prior to this date, the Company’s shares traded on the over-the-counter market. As of December 31, 2017,2023, the Company had total assets of approximately $1.9$5.4 billion. Currently, the Bank operates 10 full-service22 banking offices in six citiesEastern Massachusetts and towns in Eastern Massachusetts.New Hampshire. As a Private Bank,private bank, we focus on fourthree core services that center around client needs. OurThe Company’s core services include Wealth Management, Commercial Banking, Residential Lending and Personal Banking. The Bank’s customersclients consist primarily of consumers and small- and medium-sized businesses in these communities and surrounding areas throughout Massachusetts and New Hampshire.
The Company’s Wealth Management Group has fourfive offices, one in Boston, Massachusetts andin Boston, three in New Hampshire in Concord, Manchester, and Portsmouth.Portsmouth, and one in Southport, Connecticut. As of December 31, 2017,2023, the Company had Assets under Management and Administration of approximately $3.1$4.6 billion. The Wealth Management Group offers comprehensive investment management, as well as trust administration, estate settlement, and financial planning services. OurThe Company’s wealth management clients value personal service and depend on the commitment and expertise of our experienced banking, investment, and fiduciary professionals.
The Wealth Management Group customizes its investment portfolios to help its clients meet their long-term financial goals while moderating short-term stock market volatility.goals. Through careful monitoringdevelopment of an appropriate asset allocation and disciplined security and fund selection, Cambridge Trust’sthe Bank’s in-house
2
investment team provides clients withtargets long-term capital growth while minimizingseeking to minimize downside risk. OurThe Company's internally developed, research-driven process is managed by oura skilled team of portfolio managers and analysts. We build discretionaryThe Company builds portfolios consisting of ourthe best investment ideas, focusing on individual global equities, fixed income securities, exchange-traded funds, and mutual funds. Our team-oriented approach fosters spirited discussion and rigorous evaluation of investments.
The Company offers a wide range of services to commercial enterprises, non-profit organizations, and individuals. The Company emphasizes service to consumers and small- andsmall-and medium-sized businesses in its market area. The Company makesoriginates commercial and industrial (“C&I”) loans, commercial real estate (“CRE”) loans, construction loans, consumer loans, and residential real estate loans (including one-to-four family and home equity lines of credit), and accepts savings, money market, time, and demand deposits. In addition, the Company offers a wide range of commercial and personal banking services which include cash management, online banking, mobile banking, and global payments. The Company has one trademark, “Thought Series.”
The Company’s results of operations are largely dependent on net interest income, which is the difference between the interest earned on loans and securities and interest paid on deposits and borrowings, and non-interest income largely from its wealth management services. The results of operations are affected by the level of income and fees from loans, the cost of deposits, as well as operating expenses, the provision for loan(release of) credit losses, the impact of federal and state income taxes, the relative levels of interest rates, and local and national economic activity.
Through Cambridge Trust, its bank subsidiary,the Bank, the Company focuses on wealth management, the commercial banking business and private banking for clients, including residential lending and personalrelationship banking. Relationship banking focuses on providing exceptional service to clients and in deepening relationships. Within the commercial loan portfolio, the Company has traditionally been a commercial real estate lender andlender. However, in recent years the Company has diversified commercial operations within the areas of commercial and industrial lending to including both Renewable Energy and innovation banking. Through its renewable energy lending efforts, the Company provides financing for developers and operators of commercial and utility scale solar energy projects. Target clients generally include Innovation Banking, which specializes in working with New England-based entrepreneurs,experienced borrowers who have built or managed other renewable energy facilities, and asset based lending that helps companies throughout New Englandfinancing is provided for the construction and New York grow by borrowing againstpermanent financing of new projects, the acquisition of completed projects, or the refinancing of existing assets.operating projects. The Innovation Banking groupGroup has a narrow client focus for lending and provides a local banking option for technology and entrepreneurial companies across a wide range of industries within our market areaarea. Financing includes recurring revenue based lending to support working capital, as well as growth capital term debt with borrowers that are primarily serviced by out-of-market institutions. Personal banking focuses on providing exceptional servicehave demonstrated continued performance to clients and in deepening relationships.plan during their growth progression.
Cambridge Trust Company
The Bank offers a full range of commercial and consumer banking services through its network of 10 full-service22 banking offices in Eastern Massachusetts.Massachusetts and New Hampshire. The Bank is engaged principally in the business of attracting deposits from the public and investing those deposits. The Bank invests those funds in various types of loans, including residential, CRE, commercial and commercial real estate, and a variety of commercialindustrial, and consumer loans. The Bank also invests its deposits and borrowed funds in investment securities and has two wholly-ownedwholly owned Massachusetts security corporations, CTC Security Corporation and CTC Security Corporation III, for this purpose. Deposits at the Bank are insured by the Federal Deposit Insurance Corporation (the “FDIC”) for the maximum amount permitted by FDIC Regulations.regulations.
Investment management and trust services are offered through our one wealth management office located in Boston andMassachusetts , three wealth management offices located in New Hampshire.Hampshire, and one on Connecticut. The Bank also utilizes its subsidiary and non-depository trust company, Cambridge Trust Company of New Hampshire, Inc., to provide specialized wealth management services in New Hampshire. The assets held for wealth management customersclients are not assets of the Bank and, accordingly, are not reflected in the Company’s consolidated balance sheets.
Cambridge Trust CompanyThe Bank is active in the communities we serve.it serves. The Bank makes contributions to various non-profits and local organizations, investmentsinvests in community development lending, and investmentsinvests in low-income housing, all of which strive to improve the communities that our employees and customersclients call home.
Market Area
The Company operates in Eastern Massachusetts and Southern New Hampshire. Our primary lending market includes Middlesex, Essex, Norfolk, and Suffolk Countiescounties in Massachusetts. We benefitMassachusetts and Rockingham and Hillsborough counties in New Hampshire. The Company benefits from the presence of numerous institutions of higher learning, medical care and research centers, a vibrant innovation economy in life sciences and technology, and the corporate headquarters of several significant financial service companies within the Boston area. Eastern Massachusetts also has many high technologyhigh-technology companies employing personnel with specialized skills. These factors affect the demand for wealth management services, residential homes, multi-family apartments, office buildings, shopping centers, industrial warehouses, and other commercial properties.
3
Our lending area is primarily an urban market area with a substantial number of one-to-four unitone-to-four-unit residential properties, some of which are non-owner occupied, as well as apartment buildings, condominiums, office buildings, and retail space. As a result, our loan portfolio contains a significantly greater number of multi-family and commercial real estateCRE loans compared to institutions that operate in non-urban markets.
Our market area is located largely in the Boston-Cambridge-Quincy, Massachusetts/New Hampshire Metropolitan Statistical Area (“MSA”). The United States Census Bureau estimates that asAs of July 1, 2016,February 2024, the Boston metropolitan area is estimated to be the 10th11th largest metropolitan area in the United States.States, based upon data from S & P Global Market Intelligence©. Located adjacent to major transportation corridors, the Boston metropolitan area provides a highly diversified economic base, with major employment sectors ranging from services, education, manufacturing, and wholesale/retail trade, to finance, technology, and medical care. According to the United States Department of Labor, in November 2017,December 2023, the Boston-Cambridge-Quincy,Boston-Cambridge-Newton, Massachusetts/New Hampshire MSA had an unemployment rate of 3.0%3.2% compared to the national unemployment rate of 4.1%3.7%.
Competition
Merger with Eastern Bankshares, Inc.
On September 19, 2023, the Company, the Bank, Eastern, Eastern Bank, Eastern’s subsidiary bank, and Citadel MS 2023, Inc. a direct, wholly owned subsidiary of Eastern (“Merger Sub”) entered into an Agreement and Plan of Merger (the “Merger Agreement”). Pursuant to the terms and subject to the conditions set forth in the Merger Agreement, Eastern will acquire the Company and the Bank through the merger of Merger Sub with and into the Company, with the Company as the surviving entity (the “Eastern Merger”). As soon as reasonably practicable following the Eastern Merger, the Company will merge with and into Eastern, with Eastern as the surviving entity (the “Holdco Merger”). The Merger Agreement further provides that following the Holdco Merger, at a time to be determined by Eastern, the Bank will merge with and into Eastern Bank, with Eastern Bank as the surviving entity. Upon the terms and conditions set forth in the Merger Agreement, at the effective time of the Eastern Merger (the “Effective Time”) each share of Company common stock, par value $1.00 per share, outstanding immediately prior to the Effective Time, other than certain shares held by Eastern or the Company, will be converted into the right to receive 4.956 shares of common stock (the “Exchange Ratio”), par value $0.01 per share, of Eastern (“Eastern Common Stock”). Company shareholders will receive cash in lieu of fractional shares of Eastern Common Stock (the Exchange Ratio and any cash in lieu of fractional shares collectively, the “Merger Consideration”).
Merger with Northmark Bank
On October 1, 2022, the Company completed the Northmark Merger adding three banking offices in Massachusetts. Under the terms of the Agreement and Plan of Merger with Northmark, each outstanding share of Northmark common stock was converted into 0.9950 shares of the Company’s common stock. As a result of the Northmark Merger, former Northmark shareholders received an aggregate of 788,137 shares of the Company's common stock. The total consideration paid amounted to $62.8 million, based on the closing price of $79.74 of the Company's common stock and cash paid for fractional shares on October 1, 2022.
The Company accounted for the Northmark Merger using the acquisition method pursuant to Financial Accounting Standards Board (“FASB”) Accounting Standards Codification (“ASC”) Topic 805, “Business Combinations” (“ASC 805”) Accordingly, the Company recorded merger expenses of $3.6 million and $1.9 million for the years ended December 31, 2023 and December 31, 2022, respectively. In accordance with the Northmark Merger, the Company recorded total assets of $428.7 million, assumed total liabilities of $378.5 million, and recorded $12.6 million in goodwill. Additionally, the Company recorded $2.2 million in provision for credit losses to reflect the impact of merger related allowance for credit losses commensurate with ASC Topic 326, “Financial Instruments Credit Losses” (“ASC 326”) commonly referred to as current expected credit losses (“CECL”) on October 1, 2022. See Note 4 – Mergers for additional details.
Competition
The financial services industry is highly competitive. The Company experiences substantial competition with other commercial banks, savings and loan associations, securities and brokerage companies, mortgage companies, insurance companies, finance companies, money market funds, credit unions, and other non-bank financial service providers in attracting deposits, making loans, and attracting wealth management customers.clients. The competing major commercial banks have greater resources that may provide them a competitive advantage by enabling them to maintain numerous branch offices, invest in technology, and mount extensive advertising campaigns. The increasingly competitive environment is the result of changes in regulation, changes in technology and product delivery systems, additional financial service providers, and the accelerating pace of consolidation among financial services providers.
The financial services industry has become even more competitive as a result of legislative, regulatory, and technological changes and continued consolidation. Banks, securities firms, and insurance companies can merge under the umbrella of a
4
financial holding company, which can offer virtually any type of financial service, including banking, securities underwriting, insurance (both agency and underwriting), and merchant banking. Also, technology has lowered barriers to entry and made it possible for non-banks to offer products and services traditionally provided by banks, such as automatic transfer and automatic payment systems.
Some of the Company’s non-banking competitors have fewer regulatory constraints and may have lower cost structures. In addition, some of the Company’s competitors have assets, capital, and lending limits greater than that of the Company, greater access to capital markets, and offer a broader range of products and services than the Company. These institutions may have the ability to finance wide-ranging advertising campaigns and may also be able to offer lower rates on loans and higher rates on deposits than the Company can offer. Some of these institutions offer services, such as international banking, which the Company does not directly offer.
Various in-state market competitors and out-of-state banks continue to enter or have announced plans to enter or expand their presence in the market areas in which the Company currently operates. With the addition of new banking presences within our market, the Company expects increased competition for loans, deposits, and other financial products and services.
The CompanyBank is a Private Bank,private bank and wealth management firm, stressing the holistic client relationship, and relies upon local promotional activities, the skill and personal relationships established by officers, directors, and employees with their customers,its clients, and specialized services tailored to meet the needs of the communities served. While the Company’sBank’s position varies by market, the Company’s management believes that it can compete effectively as a result of local market knowledge, local decision making, and awareness of customerclient needs.
Supervision and Regulation
General
Banking is a complex, highly regulated industry. Consequently, the performance of the Company and the Bank can be affected not only by management decisions and general and local economic conditions, but also by the statutes enacted by the U.S. Congress and state legislatures, and the regulations and policies of, various governmental regulatory authorities. These authorities include, but are not limited to, the Board of Governors of the Federal Reserve System (the “Federal Reserve”), the Massachusetts Division of Banks (the “MDB”“MA DOB”), the State of New Hampshire Banking Department, and the FDIC. The effect of these statutes, regulations, and policies and any changes to any of them can be significant and cannot be predicted.
The primary goals of bank regulation are to maintain a safe and sound banking system, establish consumer protection standards, and to facilitate the conduct of sound monetary policy. In furtherance of these goals, the U.S. Congress and the Commonwealth of Massachusetts have created largely autonomous regulatory agencies that oversee and have enacted numerous laws that govern banks, bank holding companies, and the banking industry. The system of supervision and regulation applicable to the Company and the Bank establishes a comprehensive framework for the entities’ respective operations and is intended primarily for the protection of the Bank’s depositors and the public, rather than the shareholders and creditors. The following summarizes the significant laws, rules, and regulations governing banks and bank holding companies, including the Company and the Bank, but does not purport to be a complete summary of all applicable laws, rules, and regulations governing bank holding companies and banks or the Company or the Bank. The descriptions are qualified in their entirety by reference to the specific statutes, regulations, and policies discussed. Any change in applicable laws, regulations, or regulatory policies may have a material effect on our businesses, operations, and prospects. The Company is unable to predict the nature or extent of the effects that economic controls or new federal or state legislation may have on our business and earnings in the future.
Regulatory Agencies
Cambridge BancorpThe Company is a legal entity separate and distinct from its first tierfirst-tier bank subsidiary, Cambridge Trust Company,the Bank, and its second tiersecond-tier subsidiaries, Cambridge Trust Company of New Hampshire, Inc., a New Hampshire state-chartered non-depository trust company, and CTC Security Corporation and CTC Security Corporation III, which are used to invest the Bank’s deposits and borrowed funds in investment securities.securities. As a bank holding company, the Company is regulated under the Bank Holding Company Act of 1956, as amended (“BHC Act”), Massachusetts laws applying to bank holding companies and Massachusetts corporations more generally. The Company is subject to inspection, examination, and supervision by the Federal Reserve Board.and the MA DOB.
As a Massachusetts state-chartered insured depository institution, Cambridge Trust Companythe Bank is subject to supervision, periodic examination, and regulation by the MDBMA DOB as its chartering authority, and by the FDIC as its primary federal regulator and the State of New Hampshire Banking Department.regulator. The prior approval of the MDBMA DOB and the FDIC is required, among other things, for the Bank to establish or relocate any additional branch offices, assume deposits, or engage in any merger, consolidation, purchase, or sale of all or substantially all of the assets of any insured depository institution.
Cambridge Trust Company of New Hampshire, Inc. is subject to supervision, periodic examination, and regulation by The State of New Hampshire Banking Department.
5
Bank Holding Company Regulations Applicable to the Company
The BHC Act and other federal laws and regulations subject bank holding companies to particular restrictions on the types of activities in which they may engage and to a range of supervisory requirements and activities, including regulatory enforcement actions for violations of laws and regulations. As a Massachusetts corporation and bank holding company, the Company is also subject to certain limitations and restrictions under applicable Massachusetts corporate law.
Mergers & Acquisitions.
The BHC Act, the Bank Merger Act, the laws of the Commonwealth of Massachusetts applicable to financial institutions, and other federal and state statutes regulate acquisitions of banks and their holding companies. The BHC Act generally limits acquisitions by bank holding companies to banks and companies engaged in activities that the Federal Reserve Board has determined to be so closely related to banking as to be a proper incident thereto. The BHC Act requires every bank holding company to obtain the prior approval of the Federal Reserve before (i) acquiring more than 5% of the voting stock of any bank or other bank holding company, (ii) acquiring all or substantially all of the assets of any bank or bank holding company, or (iii) merging or consolidating with any other bank holding company.
In reviewing applications seeking approval of merger and acquisition transactions, the bank regulatory authorities generally consider, among other things, the competitive effect and public benefits of the transactions, the financial and managerial resources and future prospects of the combined organization (including the capital position of the combined organization), the applicant’s performance record under the Community Reinvestment Act (see —Community Reinvestment Act), fair housing laws, and the effectiveness of the subject organizations in combating money laundering activities.
Non-bank Activities.
Generally, bank holding companies are prohibited, under the BHC Act, from engaging in, or acquiring direct or indirect control of more than 5% of the voting shares of any company engaged in, any activity other than (i) banking or managing or controlling banks or (ii) an activity that the Federal Reserve determines to be so closely related to banking as to be a proper incident to the business of banking. The Federal Reserve has the authority to require a bank holding company to terminate an activity or terminate control of, or liquidate or divest, certain subsidiaries or affiliates when the Federal Reserve believes the activity, or the control of the subsidiary or affiliate constitutes a significant risk to the financial safety, soundness, or stability of any of its bank subsidiaries.
A bank holding company that qualifies and elects to become a financial holding company is permitted to engage in additional activities that are financial in nature or incidental or complementary to financial activity. The Company currently has no plans to make a financial holding company election.
Bank holding companies and their non-banking subsidiaries are prohibited from engaging in activities that represent unsafe and unsound banking practices. For example, under certain circumstances the Federal Reserve’s Regulation Y requires a holding company to give the Federal Reserve prior notice of any redemption or repurchase of its own equity securities if the consideration to be paid, together with the consideration paid for any other redemptions or repurchases in the preceding year, is equal to 10% or more of the bank holding company’s consolidated net worth. The Federal Reserve may oppose the transaction if it believes that the transaction would constitute an unsafe or unsound practice or would violate a regulation. As another example, a bank holding company is prohibited from impairing its subsidiary bank’s soundness by causing the bank to make funds available to non-bank subsidiaries or their customersclients if the Federal Reserve Board believes it is not prudent to do so. The Federal Reserve has the power to assess civil money penalties for knowing or reckless violations if the activities leading to a violation caused a substantial loss to a depository institution. Potential penalties arecan reach as high as almost $2.0 million for each day such activity continues.
Source of Strength.
In accordance with Federal Reserve policy, the Company is expected to act as a source of financial and managerial strength to the Bank. Section 616 of the Dodd-Frank Act codifies the requirement that bank holding companies serve as a source of financial strength to their subsidiary depository institutions. Under this policy, the holding company is expected to commit resources to support its bank subsidiary, including at times when the holding company may not be in a financial position to provide it. As discussed below, the Company could be required to guarantee the capital plan of the Bank if it becomes undercapitalized for purposes of banking regulations. Any capital loans by a bank holding company to its subsidiary bank are subordinate in right of payment to deposits and to certain other indebtedness of such subsidiary bank. The BHC Act provides that, in the event of a bank holding company’s bankruptcy, any commitment by the bank holding company to a federal bank regulatory agency to maintain the capital of a bank subsidiary will be assumed by the bankruptcy trustee and entitled to priority of payment.
6
Regulatory agencies have promulgated regulations to increase the capital requirements for bank holding companies to a level that matches those of banking institutions. See —Capital Adequacy and Prompt Corrective Action and Safety and Soundness.
Annual Reporting & Examinations.
The Company is required to file annual and periodic reports with the Federal Reserve and such additional information as the Federal Reserve may require. The Federal Reserve may examine a bank holding company and any of its subsidiaries and charge the Company for the cost of such an examination.
Imposition of Liability for Undercapitalized Subsidiaries.
Pursuant to Section 38 of the Federal Deposit Insurance Act (the “FDIA”), federal banking agencies are required to take “prompt corrective action” (“PCA”) should an insured depository institution fail to meet certain capital adequacy standards. In the event an institution becomes “undercapitalized,” it must submit a capital restoration plan. The capital restoration plan will not be accepted by the regulators unless each company “having control of” the undercapitalized institution “guarantees”has “guaranteed” the subsidiary’s compliance with the capital restoration plan until it becomeshas been “adequately capitalized.”capitalized” on average during each of four consecutive calendar quarters. For purposes of this statute, the Company has control of the Bank. Under the FDIA, the aggregate guarantee liability of all companies controlling a particular institution is limited to the lesser of 5% of the depository institution’s total assets at the time it became undercapitalized or the amount necessary to bring the institution into compliance with applicable capital standards. The FDIA grants greater powers to the federal banking agencies in situations where an institution becomes “significantly” or “critically” undercapitalized or fails to submit a capital restoration plan. For example, a bank holding company controlling such an institution can be required to obtain prior Federal Reserve approval of proposed distributionsor might be required to consent to a merger or to divest the troubled institution or other affiliates. See — Capital Adequacy and Prompt Corrective Action and Safety and Soundness.
Dividends
Dividends from the Bank are the Company’s principal source of cash revenues. The Company’s earnings and activities are affected by legislation, regulations, and local legislative and administrative bodies and decisions of courts in the jurisdictions in which we conductit conducts business. These include limitations on the ability of the Bank to pay dividends to the Company and our ability to pay dividends to ourthe shareholders. It is the policy of the Federal Reserve that bank holding companies should pay cash dividends on common stock only out of income available over the past year and only if prospective earnings retention is consistent with the organization’s expected future needs and financial condition. TheThis policy provides that bank holding companies should not maintain a level of cash dividends that undermines the bank holding company’s ability to serve as a source of strength to its bank subsidiary. Consistent with such policy, a banking organization should have comprehensive policies on dividend payments that clearly articulate the organization’s objectives and approaches for maintaining a strong capital position and achieving the objectives of the policy statement. The Company has a comprehensive dividend policy in place.
The FDIC has the authority to use its enforcement powers to prohibit a bank from paying dividends if, in its opinion, the payment of dividends would constitute an unsafe or unsound practice. Federal law also prohibits the payment of dividends by a bank that will result in the bank failing to meet its applicable capital requirements on a pro forma basis. Under applicable Massachusetts General Laws chapter 172, section 28,law, the MDBBank’s Board of Directors may declare from net profits cash dividends annually, semi-annually, or quarterly, but not more frequently, and noncash dividends at any time, although no dividends may be declared, credited, or paid so long as there is any impairment of capital stock. The MA DOB Commissioner’s approval is required in order to authorize the payment of a dividend, if the total dividends declared in a calendar year exceed that year’s net profits combined with retained net profits for the preceding two years, less any required transfer to surplus or a fund for the retirement of any preferred stock.
Federal Reserve System
Federal Reserve regulations require depository institutions to maintain reserves against transaction accounts, primarily interest-bearing and regular checking accounts. The Bank’s required reserves can be in the form of vault cash. If vault cash does not fully satisfy the required reserves, the reserves can be in the form of a balance maintained with the Federal Reserve Bank of Boston. Federal Reserve regulations required for 2018 that reserves be maintained against aggregate transaction accounts except for transaction accounts which are exempt up to and including $16 million. Transaction accounts greater than $16 million up to and including $122.3 million have a reserve requirement of 3%. A 10% reserve ratio will be assessed on transaction accounts in excess of $122.3 million. The Federal Reserve generally makes annual adjustments to the tiered reserves. The Bank is in compliance with these reserve requirements.
Under the Federal Deposit Insurance Corporation Improvement Act, banks may be restricted in their ability to accept brokered deposits, depending on their classification. “Well-capitalized” institutions are permitted to accept brokered deposits, but banks that are not well-capitalized are generally restricted from accepting such deposits. The Bank is currently well-capitalized and not restricted from accepting brokered deposits.
Transactions with Affiliates
The Company and the Bank are considered “affiliates” under the Federal Reserve Act (the “FRA”), and transactionsTransactions between a bank and its affiliates are subject to certain restrictions under Sections 23A and 23B of the FRAFederal Reserve Act (the “FRA”) and the Federal Reserve’s implementing Regulation W. The Company is considered an “affiliate” of the Bank under these sections. Generally, Sections 23A and 23B: (1) limit the extent to which an insured depository or its subsidiaries may engage in covered transactions (a) with an affiliate (as defined in such sections) to an amount equal to 10% of such institution’s capital and surplus and (b) with all affiliates, in the aggregate, to an amount equal to 20% of such capital and surplus; and (2) require all transactions with an affiliate, whether or not covered transactions, to be on terms substantially the same, or at least as favorable to the institution or subsidiary, as the terms provided or that would be provided to a non-affiliate. The term “covered transaction” includes the making of loans to an affiliate, purchase securities issued by an affiliate, purchase of assets from an affiliate, issuance of a guarantee on behalf of an affiliate, and other similar types of transactions.
7
In July 2013, the Federal Reserve, the Office of the Comptroller of the Currency (“OCC”(the “OCC”), and the FDIC approved final rules (the “Capital Rules”) establishing a new comprehensive capital framework for U.S. banking organizations. The Capital Rules generally implement the Basel Committee on Banking Supervision’s (the “Basel Committee”) December 2010 final capital framework referred to as “Basel III” for strengthening international capital standards. The Capital Rules revise the definitions and the components of regulatory capital, as well as address other issues affecting the numerator in banking institutions’ regulatory capital ratios. The Capital Rules also address asset risk weights and other matters affecting the denominator in banking institutions’ regulatory capital ratios and replace the existing general risk-weighting approach with a more risk-sensitive approach.
The Capital Rules: (i) include “Common Equity Tier 1” (“CET1”) and related regulatory capital ratio of CET1 to risk-weighted assets; (ii) specify that Tier 1 capital consists of CET1 and “Additional Tier 1 capital” instruments meeting certain revised requirements; (iii) mandate that most deductions/adjustments to regulatory capital measures be made to CET1 and not to the other components of capital; and (iv) expand the scope of the deductions from and adjustments to capital as compared to existing regulations. Under the Capital Rules, for most banking organizations, including the Company, the most common form of Additional Tier 1 capital is non-cumulative perpetual preferred stock, and the most common forms of Tier 2 capital are subordinated notes and a portion of the allocation for loan and leaseallowance for credit losses, in each case, subject to the Capital Rules’ specific requirements.
Pursuant to the Capital Rules, effective January 1, 2015, the minimum capital ratios are as follows:
4.5% CET1 to risk-weighted assets;
6.0% Tier 1 capital (that is, CET1 plus Additional Tier 1 capital) to risk-weighted assets;
8.0% Total capital (that is, Tier 1 capital plus Tier 2 capital) to risk-weighted assets; and
4.0% Tier 1 capital to average consolidated assets as reported on consolidated financial statements (called “leverage ratio”).
The Capital Rules also include a “capital conservation buffer,” composed entirely of CET1, in addition to these minimum risk-weighted asset ratios. ratios (which are each of the first three ratios described above, but not the leverage ratio).The capital conservation buffer is designed to absorb losses during periods of economic stress. Banking institutions with a ratio of CET1 to risk-weighted assets abovethat do not hold the minimum but below therequisite capital conservation buffer will face constraints on dividends, equity, and other capital instrument repurchases, interest payments on capital instruments and compensationdiscretionary bonus payments based on the amount of the shortfall. Thus, when fully phased-in on January 1, 2019, the capital standards applicable to the Company will include an additional capital conservation buffer of 2.5% of CET1, effectively resulting in minimum ratios inclusive of the capital conservation buffer of (i) CET1 to risk-weighted assets of at least 7%, (ii) Tier 1 capital to risk-weighted assets of at least 8.5%, and (iii) total capital to risk-weighted assets of at least 10.5%.
The Capital Rules provide for a number of deductions from and adjustments to CET1. These include, for example, the requirement that mortgage servicing assets, deferred tax assets arising from temporary differences that could not be realized through net operating loss carrybacks, and significant investments in non-consolidated financial entities be deducted from CET1 to the extent that any one such category exceeds 10% of CET1 or all such items, in the aggregate, exceed 15% of CET1. Since January 1, 2015, and continuing until January 1, 2019,In November 2017, the Federal Reserve finalized a rule pausing the phase-in of these deductions and adjustments are being incrementally phased in. for non-advanced approaches institutions. In July 2019, the OCC, the Federal Reserve Board and the FDIC adopted a final rule intended to simplify the Capital Rules described above for non-advanced approaches rule institutions. Institutions were required to implement the provisions of the simplification rule by April 1, 2020. The transition provisions to the Capital Rules issued by these agencies in November 2017 ceased to apply to an institution in the quarter in which it adopted the simplification rule.
In addition, under the current general risk-based capital rules, the effects of accumulated other comprehensive income or loss items included in shareholders’ equity (for example, mark-to-market of securities held in the available for sale portfolio) under U.S. generally accepted accounting principles (“GAAP”) are reversed for the purposes of determining regulatory capital ratios. Pursuant to the Capital Rules, the effects of certain of the above items are not excluded. However, banking organizations, including the Company, that are not subject to the advanced approaches rule, could make a one-time permanent election to exclude these items. The Company made the one-time permanent election to exclude these items.
The Capital Rules also preclude certain hybrid securities, such as trust preferred securities, issued on or after May 19, 2010 from inclusion in bank holding companies’ Tier 1 capital, although bank holding companies that had total consolidated assets of less than $15 billion at December 31, 2009 may include trust preferred securities issued prior to May 19, 2010 as a component of Tier 1 capital.
As noted, implementation of the deductions and other adjustments to CET1 began on January 1, 2015 and are being phased in over a 4-year period (beginning at 40% on January 1, 2015 and an additional 20% per year thereafter). The implementation of the capital conservation buffer began on January 1, 2016 at the 0.625% level and increases by 0.625% on each subsequent January 1, until it reaches 2.5% on January 1, 2019. The risk-weighting categories in the Capital Rules are standardized and include a risk-sensitive number of categories, depending on the nature of the assets, generally ranging from 0% for U.S. government and agency securities, to 1,250% for certain credit exposures, and resulting in higher risk weights for a variety of asset classes.
Management believes8
In September 2019, the OCC, the Federal Reserve Board, and the FDIC adopted a final rule that is intended to further simplify the Capital Rules for depository institutions and their holding companies that have less than $10 billion in total consolidated assets, such as Cambridge Bancorp, if such institutions meet certain qualifying criteria. This final rule became effective on January 1, 2020. Under this final rule, if the Company ismeets the qualifying criteria, including having a leverage ratio (equal to tier 1 capital divided by average total consolidated assets) (greater than 9 percent), the Company will be eligible to opt into the community bank leverage ratio framework. If the Company opts into this framework, the Company will be considered to have satisfied the generally applicable risk-based and leverage capital requirements in compliance,the Capital Rules (as modified pursuant to the simplification rule) and will continuebe considered to behave met the well-capitalized ratio requirements for PCA purposes. The Bank has not elected to adopt this framework.
The Company and the Bank are in compliance with the targetedcurrently applicable capital ratios as such requirements are phased in.requirements.
Prompt Corrective Action and Safety and Soundness
Pursuant to Section 38 of the FDIA, federal banking agencies are required to take “prompt corrective action”Prompt Corrective Action (“PCA”) should a depository institution fail to meet certain capital adequacy standards. At each successive lower capital category, an insured depository institution is subject to more restrictions and prohibitions, including restrictions on growth, restrictions on interest rates paid on deposits, restrictions, or prohibitions on payment of dividends, and restrictions on the acceptance of brokered deposits. For example, “well-capitalized” institutions are permitted to accept brokered deposits, but banks that are not well-capitalized are generally restricted or prohibited from accepting such deposits. Furthermore, if an insured depository institution is classified in one of the undercapitalized categories, it is required to submit a capital restoration plan to the appropriate federal banking agency, and the holding company must guarantee the performance of that plan. Based upon its capital levels, a bank that is classified as well-capitalized, adequately capitalized, or undercapitalized may be treated as though it were in the next lower capital category if the appropriate federal banking agency, after notice and opportunity for hearing, determines that an unsafe or unsound condition or an unsafe or unsound practice warrants such treatment.
For purposes of prompt corrective action,PCA, to be: (i) well-capitalized, a bank must have a total risk-based capital ratio of at least 10%, a Tier 1 risk-based capital ratio of at least 8%, a CET1 risk-based capital ratio of at least 6.5%, and a Tier 1 leverage ratio of at least 5%; (ii) adequately capitalized, a bank must have a total risk-based capital ratio of at least 8%, a Tier 1 risk-based capital ratio of at least 6%, a CET1 risk-based capital ratio of at least 4.5%, and a Tier 1 leverage ratio of at least 4% (but not otherwise meet all of the criteria to be considered “well-capitalized”); (iii) undercapitalized, a bank would have a total risk-based capital ratio of less than 8%, a Tier 1 risk-based capital ratio of less than 6%, a CET1 risk-based capital ratio of less than 4.5%, andor a Tier 1 leverage ratio of less than 4% (but not otherwise meet all of the criteria to be considered “significantly” or “critically” undercapitalized); (iv) significantly undercapitalized, a bank would have a total risk-based capital ratio of less than 6%, a Tier 1 risk-based capital ratio of less than 4%, a CET1 risk-based capital ratio of less than 3%, andor a Tier 1 leverage ratio of less than 3% (but not otherwise meet the criterion to be considered “critically undercapitalized”); and (v) critically undercapitalized, a bank would have a ratio of tangible equity to total assets that is less than or equal to 2%.
The Bank is currently well-capitalized, under the PCA standards.
Bank holding companies and insured banks also may be subject to potential enforcement actions of varying levels of severity by the federal banking agencies for unsafe or unsound practices in conducting their business, or for violation of any law, rule, regulation, condition imposed in writing by the agency or term of a written agreement with the agency. In more serious cases, enforcement actions may include: issuances of directives to increase capital; issuances of formal and informal agreements; impositions of civil monetary penalties; issuances of a cease and desist order that can be judicially enforced; issuances of removal and prohibition orders against officers, directors, and other institution−affiliated parties; terminations of the bank’s deposit insurance; appointment of a conservator or receiver for the bank; and enforcements of such actions through injunctions or restraining orders based upon a judicial determination that the agency would be harmed if such equitable relief was not granted.
The Volcker Rule
Section 619 of the Dodd-Frank Act, commonly known as the Volcker Rule, restricts the ability of banking entities, such as the Company and the Bank, from: (i) engaging in “proprietary trading” and (ii) investing in or sponsoring certain types of funds (“Covered Funds”), subject to certain limited exceptions. Under the Volcker Rule, a Covered Fund is any issuer that would be an investment company under the Investment Company Act (the “ICA”) but for the exemptions in section 3(c)(1) and 3(c)(7) of the ICA, which includes collateralized loan obligation (“CLO”) and collateralized debt obligation securities. The regulation also provides, among other exemptions, an exemption for CLOs meeting certain requirements. The Company is in compliance with the Volcker Rule.
Deposit Insurance
The Bank’s deposit accounts are fully insured by the Deposit Insurance Fund (the “DIF”) of the FDIC up to the deposit insurance limit of $250,000 per depositor, per insured institution, per ownership category, in accordance with applicable laws and regulations.
The FDIC uses a risk-based assessment system that imposes insurance premiums based upon a risk matrix that accounts for a bank’s capital level and supervisory rating (CAMELS rating).(“CAMELS”) rating. The risk matrix uses different risk categories distinguished by capital levels and supervisory ratings. The base for deposit insurance assessments is average consolidated averagetotal assets less average tangible equity. Assessment rates are calculated using formulas that take into account the risk of the institution being assessed. The FDIC may increase or decrease the assessment rate schedule in order to manage the DIF to prescribed statutory target levels. An increase in the risk category for the Bank or in the assessment rates could have an adverse effect on the Bank’s, and consequently the Company’s earnings.
9
The FDIC may terminate deposit insurance if it determines the institution involved has engaged in or is engaging in unsafe or unsound banking practices, is in an unsafe or unsound condition, or has violated applicable laws, regulations, or orders. The Bank is not aware of any practice, condition, or violation that might lead to the termination of its deposit insurance.
The FDIA and FDIC regulations generally limit the ability of an insured depository institution to accept, renew or roll over any brokered deposit unless the institution’s capital category is “well capitalized” or, with the FDIC’s approval, “adequately capitalized.” Depository institutions that have brokered deposits in excess of 10% of total assets are subject to increased FDIC deposit insurance assessments,premium assessments. However, for institutions that are well capitalized and have a CAMELS composite rating of 1 or 2, reciprocal deposits are deducted from brokered deposits. Section 202 of the Economic Growth, Regulatory Relief, and Consumer Protection Act, which was enacted in 2018, amended the FDIA providesto exempt a capped amount of reciprocal deposits from treatment as brokered deposits for additional assessments to be imposed oncertain insured depository institutions to pay for the cost of Financing Corporation (“FICO”) funding. FICO is a mixed-ownership government corporation established by the Competitive Equality Banking Act of 1987, whose sole purpose was to function as a financing vehicle for the now defunct Federal Savings & Loan Insurance Corporation. FICO assessments are adjusted quarterly to reflect changes in the assessment base of the DIF and do not vary depending upon a depository institution’s capitalization or supervisory evaluation. The current annualized assessment rate is approximately three basis points and the rate is adjusted quarterly. These assessments will continue until FICO bonds mature in 2019. institutions.
Depositor Preference
The FDIA provides that, in the event of the “liquidation or other resolution” of an insured depository institution, the claims of depositors of the institution, including the claims of the FDIC as subrogee of insured depositors, and certain claims for administrative expenses of the FDIC as a receiver, will have priority over other general unsecured claims against the institution. If an insured depository institution fails, insured and uninsured depositors, along with the FDIC, will have priority in payment ahead of unsecured, non-deposit creditors, including the parent bank holding company, with respect to any extensions of credit they have made to such insured depository institution.
Consumer Financial Protection
The Company and the Bank are subject to a number of federal and state consumer protection laws that govern itstheir relationship with its customers.clients. These laws include the Consumer Financial Protection Act of 2010, Equal Credit Opportunity Act, the Fair Credit Reporting Act, the Truth in Lending Act, the Truth in Savings Act, the Electronic Fund Transfer Act, the Expedited Funds Availability Act, the Home Mortgage Disclosure Act, the Fair Housing Act, the Real Estate Settlement Procedures Act, the Fair Debt Collection Practices Act, the Right to Financial Privacy Act, the Service MembersServicemembers Civil Relief Act, and these laws’ respective state-law counterparts, as well as state usury laws and laws regarding unfair and deceptive acts and practices. These and other federal laws, among other things, require disclosures of the cost of credit and terms of deposit accounts, provide substantive consumer rights, prohibit discrimination in credit transactions, regulate the use of credit report information, provide financial privacy protections, prohibit unfair, deceptive, and abusive practices, restrict the Bank’s ability to raise interest rates, and subject the Bank to substantial regulatory oversight. Violations of applicable consumer protection laws can result in significant potential liability from litigation brought by customers,clients, including actual damages, restitution, and attorneys’ fees.
Further, the Consumer Financial Protection Bureau (“CFPB”) has broad rulemaking authority for a wide range of consumer financial laws that apply to all banks, including, among other things, the authority to prohibit “unfair, deceptive or abusive” acts and practices. While there are no statutory definitions for those terms, the CFPB has found an act or practice to be “unfair” when: “(i) it causes or is likely to cause substantial injury to consumers; (ii) the injury is not reasonably avoidable by consumers; and (iii) the injury is not outweighed by countervailing benefits to consumers or to competition.” “Deceptive acts or practices” occur when “(i) the act or practice misleads or is likely to mislead the consumer; (ii) the consumer’s interpretation is reasonable under the circumstances; and (iii) the misleading act or practice is material.” Finally, an act or practice is “abusive” when it: “(i) materially interferes with the ability of a consumer to understand a term or condition of a consumer financial product or services;service; or (ii) takes unreasonable advantage of (a) a consumer’s lack of understanding of the material risks, costs, or conditions of the product or services;service; (b) a consumer’s inability to protect his or her interests in selecting or using a consumer financial product or service; or (c) a consumer’s reasonable reliance on a covered person to act in his or her interests.”
Neither the Dodd-Frank Act, nor the individual consumer financial protection laws, prevent states from adopting stricter consumer protection standards.
Community Reinvestment Act
The Community Reinvestment Act of 1977 (the “CRA”), requires depository institutions to assist in meeting the credit needs of their market areas consistent with safe and sound banking practice. Under the CRA, each depository institution is required to help meet the credit needs of its market areas by, among other things, providing credit to lowlow- and moderate incomemoderate-income individuals and communities. These factors are also considered in evaluating mergers, acquisitions, and applications to open a branch or facility. The applicable federal banking agencies regularly conduct CRA examinations to assess the performance of financial institutions and assign one of four ratingsgives a rating to the institution’s records of meeting the credit needs of its community. The Bank received a “Satisfactory” rating during its last examination in August 2017.July 2020.
10
Section 22(h) of the FRA and its implementing Regulation O restricts loans to directors, executive officers, and principal shareholders of a bank or its affiliates, and companies and political or campaign committees controlled by such persons (“insiders”). Under Section 22(h), loansa loan by a bank to insiders and their related interestsany insider may not exceed, together with all other outstanding loans to such personsperson and affiliated entities,any company or political or campaign committee controlled by such person, the institution’s total capital and surplus.bank’s loan-to-one-borrower limit. Loans to insiders above specified amounts must receive the prior approval of the boardCompany’s Board of directors.Directors. Further, under Section 22(h) of the FRA, loans to directors, executive officers, and principal shareholdersinsiders must be made on terms substantially the same as offered in comparable transactions to other persons, except that such insiders may receive preferential loans made under a benefit or compensation program that is widely available to the bank’s (or, if applicable, the bank affiliate’s) employees and does not give preference to the insider over the employees. Section 22(g) of the FRA places additional limitations on loans to executive officers. A violation of these restrictions may result in the assessment of substantial civil monetary penalties on the affected bank or any officer, director, employee, agent, or other person participating in the conduct of the affairs of that bank, the imposition of a cease and desist order, and other regulatory sanctions.
Financial Privacy
The Company is subject to federal laws, including the Gramm-Leach-Bliley Act (the “GLBA”), and certain state laws containing consumer privacy protection provisions. These provisions limit the ability of banks and other financial institutions to disclose nonpublic information about consumers to affiliated and non-affiliated third parties and limit the reuse of certain consumer information received from non-affiliated financial institutions. These provisions require notice of privacy policies to customersclients and, in some circumstances, allow consumers to prevent disclosure of certain nonpublic personal information to affiliates or non-affiliated third parties by means of “opt out” or “opt in” authorizations.
Financial Data Security
The GLBA requires that financial institutions implement comprehensive written information security programs that include administrative, technical, and physical safeguards to protect consumer information. Further, pursuant to interpretive guidance issued under the GLBA and certain state laws, financial institutions are required to notify customersclients and regulators of security breaches that result in unauthorized access to their nonpublicnon-public personal information.information (“NPPI”).
Incentive Compensation
The Dodd-Frank Act requires the federal banking agencies and the SECSecurities and Exchange Commission (the “SEC”) to establish joint regulations or guidelines prohibiting incentive-based payment arrangements at specified regulated entities, including the Company and the Bank, with at least $1 billion in total consolidated assets that encourage inappropriate risks by providing an executive officer, employee, director or principal shareholder with excessive compensation, fees, or benefits that could lead to material financial loss to the entity. The federal banking agencies and the SEC most recently proposed such regulations in 2016, but the2016. The regulations have not yet been finalized. but it is expected that this rulemaking will be a priority in 2024. If the regulations are adopted in the form initially proposed or a similar form, they will restrict the manner in which executive compensation is structured.
The Dodd-Frank Act also requires publicly traded companies to give shareholders a non-binding vote on executive compensation and on so-called “golden parachute” payments in connection with approvals of mergers and acquisitions.
Anti-Money Laundering Initiatives and the USA PATRIOT Act
Under Title III of the USA PATRIOT Act, all financial institutions are required to take certain measures to identify their customers,clients, prevent money laundering, monitor customerclient transactions, and report suspicious activity to U.S. law enforcement agencies. Financial institutions also are required to respond to requests for information from federal banking agencies and law enforcement agencies. Information sharing among financial institutions for the above purposes is encouraged by an exemption granted to complying financial institutions from the privacy provisions of the GLBA and other privacy laws. Financial institutions that hold correspondent accounts for foreign banks or provide private banking services to foreign individuals are required to take measures to avoid dealing with certain foreign individuals or entities, including foreign banks with profiles that raise money laundering concerns, and are prohibited from dealing with foreign “shell banks” and persons from jurisdictions of particular concern. The primary federal banking agencies and the Secretary of the U.S. Department of the Treasury have adopted regulations to implement several of these provisions. All financial institutions also are required to establish internal anti-money laundering programs. The effectiveness of a financial institution in combating money laundering activities is a factor to be considered in any application submitted by the financial institution under the Bank Merger Act. The Company has a Bank Secrecy Act and USA PATRIOT Act compliance program commensurate with its risk profile.
11
The Fair Credit Reporting Act’s Red Flags Rule requires financial institutions with covered accounts (e.g., consumer bank accounts and loans) to develop, implement, and administer an identity theft prevention program. This program must include reasonable policies and procedures to detect suspicious patterns or practices that indicate the possibility of identity theft, such as inconsistencies in personal information or changes in account activity.
Office of Foreign Assets Control Regulation
The Office of Foreign Assets Control (“OFAC”) Regulation
The Office of Foreign Assets Control (OFAC) of the USU.S. Department of the Treasury administers and enforces economic and trade sanctions based on USU.S. foreign policy and national security goals against targeted foreign countries and regimes, terrorists, international narcotics traffickers, those engaged in activities related to the proliferation of weapons of mass destruction, and other threats to the national security, foreign policy, or economy of the United States. OFAC publishes lists of individuals and companies owned or controlled by, or acting for or on behalf of, targeted countries. It also lists individuals, groups, and entities, such as terrorists and narcotics traffickers, designated under programs that are not country-specific.country specific. These are typically known as the OFAC rules based on their administration by the OFAC. The OFAC-administered sanctions targeting countries take many different forms. Generally, they contain one or more of the following elements: (i) restrictions on trade with or investment in a sanctioned country, including prohibitions against direct or indirect imports from and exports to a sanctioned country and prohibitions on “U.S. persons” engaging in financial transactions relating to making investments in, or providing investment-related advice or assistance to, a sanctioned country; and (ii) a blocking of assets in which the government or specially designated nationals of the sanctioned country have an interest by prohibiting transfers of property subject to U.S. jurisdiction (including property in the possession or control of U.S. persons). Blocked assets (property and bank deposits) cannot be paid out, withdrawn, set off, or transferred in any manner without a license from OFAC. Failure to comply with these sanctions could have serious legal and reputational consequences.
EmployeesAvailable Information
The SEC maintains an Internet website at http://www.sec.gov that contains reports, proxy and information statements, and other information regarding issuers that file electronically with the SEC.
Our Internet website is https://www.cambridgetrust.com. You can obtain on our website, free of charge, a copy of our annual reports on Form 10-K, our quarterly reports on Form 10-Q, our current reports on Form 8-K, and any amendments to those reports, as soon as reasonably practicable after we electronically file such reports or amendments with, or furnish them to, the SEC. Our Internet website and the information contained therein or connected thereto are not intended to be incorporated into this Annual Report on Form 10-K.
Human Capital
As of February 28, 2018,December 31, 2023, the Company had 238407 full-time and ninesix part-time employees. At any given time, less than 1% of our employees are temporary. The Company’s employees are not represented by any collective bargaining unit.
The Company is committed to recruiting, developing and promoting a diverse workforce to meet the current and future demands of our business. In 2019, we instituted a policy which requires that all searches for positions Vice President and above include at least one racially or ethnically diverse candidate and one female candidate. All of our positions are listed on multiple job boards specifically targeted towards women, minorities, veterans, and people with disabilities. In 2017, the Company formed a Diversity, Equity and Inclusion Steering Committee, which today comprises twenty (20) members from across the organization, including three members of executive management. This committee meets no less than quarterly and has established goals to further the Company’s Diversity, Equity and Inclusion efforts.
As of December 31, 2023, our overall workforce was 53% female and 23% racially or ethnically diverse. Of those employees with position titles of Vice President and above, 43% were female and 11% were racially or ethnically diverse.
To ensure we provide a rich experience for our employees, we measure organizational culture and engagement by periodically engaging independent third parties to conduct cultural assessments and employee engagement surveys. Our employee driven Engagement Committee focus on monitoring and making continuous improvements to our work environment and employee engagement.
12
The Company encourages employees to contribute their personal best while respecting the balance between work and personal life. To empower employees to reach their potential, we provide training and development programs including traditional classroom training and coaching and experiential learning through Company-wide initiative beyond the scope of their everyday responsibilities. We also provide access to virtual and self-directed online courses in topics ranging from compliance to management skills through our online learning system. To identify and develop our next generation of leaders, we have a robust talent and succession planning process and specialized programs to support the development of our talent pipeline at different levels. The Company believes that its employee relations are good.
Risks Related to our Business and Industry
Deterioration in local economic conditions may negatively impact our financial performance.
The Company’s success depends primarily on the general economic conditions in Eastern Massachusetts and New Hampshire and the specific local markets in which the Company operates. Unlike larger national or other regional banks that are more geographically diversified, the Company provides banking and financial services to customersclients primarily in Massachusetts and New Hampshire. The local economic conditions in these areas have a significant impact on the demand for the Company’s products and services as well as the ability of the Company’s customersclients to repay loans, the value of the collateral securing loans, and the stability of the Company’s deposit funding sources.
A downturn in our local economy may limit funds available for deposit and may negatively affect our borrowers’ ability to repay their loans on a timely basis, both of which could have an impact on our profitability.
Negative developments affecting the banking industry, and resulting media coverage, have eroded customer confidence in the banking system.
The high-profile bank failures involving First Republic Bank, Silicon Valley Bank and Signature Bank in 2023 have generated significant market volatility among publicly traded bank holding companies and, in particular, banks like the Company. These market developments have negatively impacted customer confidence in the safety and soundness of small and mid-size banks. As a result, customers may choose to maintain deposits with larger financial institutions or invest in higher yielding short-term fixed income securities, all of which could materially adversely impact the Company’s liquidity, loan funding capacity, net interest margin, capital and results of operations. While the Department of the Treasury, the Federal Reserve, and the Federal Deposit Insurance Corporation have made statements ensuring that depositors of these recently failed banks would have access to their deposits, including uninsured deposit accounts, there is no guarantee that such actions will be successful in restoring customer confidence in regional banks and the banking system more broadly.
Variations in interest rates may negatively affect our financial performance.
The Company’s earnings and financial condition are largely dependent upon net interest income, which is the difference between interest earned from loans and investments and interest paid on deposits and borrowings. The narrowing of interest rate spreads could adversely affect the Company’s earnings and financial condition. The Company cannot predict with certainty, or control, changes in interest rates. Regional and local economic conditions and the policies of regulatory authorities, including monetary policies of the Federal Reserve, affect interest income and interest expense. HighOur net interest income and net interest margin may be negatively impacted during periods of rate tightening due to pressure on our funding costs, particularly if we are unable to realize higher rates on our assets at a pace that matches that of the funding. Rising interest rates could also affect the amount of loans that the Company can originate because higher rates could cause customersclients to apply for fewer mortgages or cause depositors to shift funds from accounts that have a comparatively lower cost to accounts with a higher cost. The Company may also experience customerclient attrition due to competitor pricing. If the cost of interest-bearing deposits increases at a rate greater than the yields on interest-earning assets increase, then net interest income will be negatively affected. Changes in the asset and liability mix may also affect net interest income. Similarly, lower interest rates cause higher yielding assets to prepay and floating or adjustable rateadjustable-rate assets to reset to lower rates. If the Company is not able to reduce its funding costs sufficiently, due to either competitive factors or the maturity schedule of existing liabilities, then the Company’s net interest margin will decline.
Although management believes it has implemented effective asset and liability management strategies to mitigate the potential adverse effects of changes in interest rates on the Company’s results of operations, any substantial or unexpected change in, or prolonged change in market interest rates could have a material adverse effect on the Company’s financial condition and results of operations.
13
Rising interest rates have decreased the value of the Company’s held-to-maturity securities portfolio, and the Company would realize losses if it were required to sell such securities to meet liquidity needs.
As a result of inflationary pressures and the resulting rapid increases in interest rates over the last two years, the trading value of previously issued government and other fixed income securities has declined significantly. These securities make up a majority of the securities portfolio of most banks in the U.S., including the Company’s, resulting in unrealized losses embedded in the held-to-maturity portion of U.S. banks’ securities portfolios. While the Company does not currently intend to sell these securities, if the Company were required to sell such securities to meet liquidity needs, it may incur losses, which could impair the Company’s capital, financial condition, and results of operations and require the Company to raise additional capital on unfavorable terms, thereby negatively impacting its profitability. While the Company has taken actions to maximize its funding sources, there is no guarantee that such actions will be successful or sufficient in the event of sudden liquidity needs. Furthermore, while the Federal Reserve Board has announced a Bank Term Funding Program available to eligible depository institutions secured by U.S. treasuries, agency debt and mortgage-backed securities, and other qualifying assets as collateral at par, to mitigate the risk of potential losses on the sale of such instruments, there is no guarantee that such programs will be effective in addressing liquidity needs as they arise.
Changes in the economy or the financial markets could materially affect our financial performance.
Downturns in the United States or global economies or financial markets could adversely affect the demand for and income received from the Company'sCompany’s fee-based services. Revenues from the Wealth Management Group depend in large part on the level of assets under management and administration. Market volatility that leads customersclients to liquidate investments, as well as lower asset values, can reduce our level of assets under management and administration and thereby decrease our investment management and administration revenues.
Our loan portfolio includes loans with a higher risk of loss.
The Bank originates commercial and industrialC&I loans, commercial real estateCRE loans, consumer loans, and residential mortgage loans primarily within our market area. Our lending strategy focuses on residential real estate lending, as well as servicing commercial customers,clients, including increased emphasis on commercial and industrialC&I lending, and commercial deposit relationships. Commercial and industrial loans, commercial real estateC&I, CRE loans, and consumer loans may expose a lender to greater credit risk than loans secured by residential real estate because the collateral securing these loans may not be sold as easily as residential real estate. In addition, commercial real estateCRE and commercial and industrialC&I loans may also involve relatively large loan balances to individual borrowers or groups of borrowers. These loans also have greater credit risk than residential real estate for the following reasons:
Commercial Real EstateCRE Loans. Repayment is dependent on income being generated in amounts sufficient to cover operating expenses and debt service.
Commercial and IndustrialC&I Loans. Repayment is generally dependent upon the successful operation of the borrower’s business.
Consumer Loans. Consumer loans are collateralized, if at all, with assets that may not provide an adequate source of payment of the loan due to depreciation, damagefluctuate in value based on market conditions or loss.
Any downturn in the real estate market or local economy could adversely affect the value of the properties securing the loans or revenues from the borrowers’ businesses thereby increasing the risk of non-performing loans.
We may experience losses and expenses if security interests granted for loans are not enforceable.
When the Company makes loans, it sometimes obtains liens, such as real estate mortgages or other asset pledges, to provide the Company with a security interest in collateral. If there is a loan default, the Company may seek to foreclose upon collateral and enforce the security interests to obtain repayment and eliminate or mitigate the Company’s loss. Drafting errors, recording errors, other defects or imperfections in the security interests granted to the Company and/or changes in law may render liens granted to the Company unenforceable. The Company may incur losses or expenses if security interests granted to the Company are not enforceable.
14
If our allowance for loancredit losses is not sufficient to cover actual loan losses, then our earnings will decrease.
The Bank’s loan customersclients may not repay their loans according to their terms and the collateral securing the payment of these loans may be insufficient to pay any remaining loan balance. The Bank therefore may experience significant loancredit losses, which could have a material adverse effect on our operating results. Material additions to our allowance for loancredit losses also would materially decrease our net income, and the charge-off of loans may cause us to increase the allowance. The Bank makes various assumptions and judgments about the collectability of the loan portfolio, including the creditworthiness of our borrowers and the value of the real estate and other assets serving as collateral for the repayment of many of our loans. We rely on our loan quality reviews, our experience, and our evaluation of economic conditions, among other factors, in determining the amount of the allowance for loancredit losses. If our assumptions prove to be incorrect, our allowance for loancredit losses may not be sufficient to cover losses inherent in our loan portfolio, resulting in additions to our allowance.
Strong competition within our industry and market area could hurt our performance and slow our growth.
The Company operates in a competitive market for both attracting deposits, which is our primary source of funds, and originating loans. Historically, our most direct competition for deposits has come from savings and commercial banks. Our competition for loans comes principally from commercial banks, savings institutions, mortgage banking firms, credit unions, finance companies, mutual funds, insurance companies, and investment banking firms. We also face additional competition from internet-based institutions and brokerage firms. Competition for loan originations and deposits may limit our future growth and earnings prospects.
The Company’s ability to compete successfully depends on a number of factors, including, among other things:
the ability to develop, maintain, and build upon long-term customerclient relationships based on service quality, high ethical standards and reputation;
the ability to expand the Company’s market position;
the scope, relevance, and pricing of products and services offered to meet customerclient needs and demands;
the rate at which the Company introduces new products, services, and technologies relative to its competitors;
customerclient satisfaction with the Company’s level of service;
industry and general economic trends; and
the ability to attract and retain talented employees.
Failure to perform in any of these areas could significantly weaken the Company’s competitive position, which could adversely affect the Company’s growth and profitability, which, in turn, could have a material adverse effect on the Company’s financial condition and results of operations.
The Company’s earnings may not grow if we are unable to successfully attractcore deposits and lending opportunities and execute opportunities to generate fee-based income.
The Company has historically experienced growth, and our future business strategy is subject to extensive government regulation and supervision, which may interfere with our abilitycontinue to conduct our business and may negatively impact our financial results.
The Company, primarily throughexpand. Historically, the Bank and certain non-bank subsidiaries, are subject to extensive federal and state regulation and supervision. Banking regulations are primarily intended to protect depositors’ funds, the Depositors Insurance Fund (“DIF”) and the safety and soundness of the banking system as a whole, not shareholders. These regulations affect the Company’s lending practices, capital structure, investment practices, dividend policy, and growth among other things. Congress and federal banking agencies continually review banking laws, regulations, and policies for possible changes. Changes to statutes, regulations, or regulatory policies, including changes in interpretation or implementation of statutes, regulations, or policies, could affect the Company in substantial and unpredictable ways. Such changes could subject the Company to additional costs, limit the types of financial services and products the Company may offer, and/or limit the pricing the Company may charge on certain banking services, among other things. Compliance personnel and resources may increase our costs of operations and adversely impact our earnings.
Failure to comply with laws, regulations, or policies could result in sanctions by regulatory agencies, civil money penalties, and/or reputation damage, which could have a material adverse effect on our business, financial condition, and results of operations. While the Company has policies and procedures designed to prevent any such violations, there can be no assurance that such violations will not occur.
State and federal banking agencies periodically conduct examinations of our business, including for compliance with lawsloans and regulations, anddeposits has been the principal factor in our failure to comply with any supervisory actions to which we are or become subject as a result of such examinations may adversely affect our business.
Federal and state regulatory agencies periodically conduct examinations of our business, including our compliance with laws and regulations. If, as a result of an examination, an agency were to determine that the financial, capital resources, asset quality, earnings prospects, management, liquidity, or other aspects of any of our operations had become unsatisfactory or violates any law or regulation, such agency may take certain remedial or enforcement actions it deems appropriate to correct any deficiency. Remedial or enforcement actions include the power to enjoin “unsafe or unsound” practices, to require affirmative actions to correct any conditions resulting from any violation or practice, to issue an administrative order that can be judicially enforced against a bank, to direct an increase in the bank’s capital, to restrict the bank’s growth, to assess civil monetary penalties against a bank’s officers or directors, and to remove officers and directors.net-interest income. In the event that the FDIC concludes that, among other things, our financial conditions cannot be corrected or that there is an imminent risk of loss to our depositors, it may terminate our deposit insurance. The CFPB also has authority to take enforcement actions, including cease-and desist orders or civil monetary penalties, if it finds that we offer consumer financial products and services in violation of federal consumer financial protection laws.
If we are unable to comply with future regulatory directives, or with the terms of any future supervisory requirements to which we may become subject, then we could become subject to a variety of supervisory actions and orders, including cease and desist orders, prompt corrective actions, Memorandum of Understanding, and other regulatory enforcement actions. Such supervisory actions could, among other things, impose greater restrictions onexecute our business as well asstrategy of continued growth in loans and deposits, our ability to develop any new business. The Company could also be required to raise additional capital, or dispose of certain assets and liabilities within a prescribed time period, or both. Failure to implement remedial measures as required by financial regulatory agencies could result in additional orders or penalties from federal and state regulators, which could trigger one or more of the remedial actions described above. The terms of any supervisory action and associated consequences with any failure to comply with any supervisory action could have a material negative effect on our business, operating flexibility, and overall financial condition.
The Company is subject to liquidity risk, which could adversely affect net interest income and earnings.
The purpose of the Company’s liquidity management is to meet the cash flow obligations of its customers for both deposits and loans. The primary liquidity measurement the Company utilizes is called basic surplus, which captures the adequacy of the Company’s access to reliable sources of cash relative to the stability of its funding mix of average liabilities. This approach recognizes the importance of balancing levels of cash flow liquidity from short- and long-term securities with the availability of dependable borrowing sources which can be accessed when necessary. However, competitive pressure on deposit pricing could result in a decrease in the Company’s deposit base or an increase in funding costs. In addition, liquidity will come under additional pressure if loan growth exceeds deposit growth. These scenarios could lead to a decrease in the Company’s basic surplus measure below the minimum policy level of 5%. To manage this risk, the Company has the ability to purchase brokered certificates of deposit, borrow against established borrowing facilities with other banks (Federal funds), and enter into repurchase agreements with investment companies. Depending on the level of interest rates, the Company’s net interest income, and therefore earnings could be adversely affected.
Ourimpacted. The Company’s ability to service our debt, pay dividends, and otherwise pay our obligations as they come due is substantially dependent on capital distributions from our subsidiary.
The holding company is a separate and distinct legal entity from its subsidiary. It receives substantially all of its revenue from dividends from its subsidiary, Cambridge Trust Company. These dividends are the principal source of fundscontinue to pay dividends on the Company’s common stock. Various federal and/or state laws and regulations limit the amount of dividends that the Bank may pay to the Company. Also, the Company’s right to participate in a distribution of assets upon a subsidiary’s liquidation or reorganization is subject to the prior claims of the subsidiary’s creditors. In the event the Bank is unable to pay dividends to the Company, the Company may not be able to service debt, pay obligations, or pay dividends on the Company’s common stock. The inability to receive dividends from the Bank could have a material adverse effect on the Company’s business, financial condition, and results of operations.
A breach of information security, including cyber-attacks, could disrupt our business and impact our earnings.
The Company depends upon data processing, communication, and information exchange on a variety of computing platforms and networks and over the internet. In addition, we rely on the services of a variety of vendors to meet our data processing and communication needs. Despite existing safeguards, we cannot be certain that all of our systems are free from vulnerability to attack or other technological difficulties or failures. If information security is breached or difficulties or failures occur, despite the controls we and our third party vendors have instituted, information can be lost or misappropriated, resulting in financial loss or costs to us, reputational harm, or damages to others. Such costs or losses could exceed the amount of insurance coverage, if any, which would adversely affect our earnings.
The Company may be adversely affected by fraud.
The Company is inherently exposed to operational risk in the form of theft and other fraudulent activity by employees, customers, and other third parties targeting the Company and/or the Company’s customers or data. Such activity may take many forms, including check fraud, electronic fraud, wire fraud, phishing, social engineering, and other dishonest acts.
Although the Company devotes substantial resources to maintaining effective policies and internal controls to identify and prevent such incidents, given the increasing sophistication of possible perpetrators, the Company may experience financial losses or reputational harm as a result of fraud.
The Company continually encounters technological change and the failure to understand and adapt to these changes could hurt our business.
The financial services industry is continually undergoing rapid technological change with frequent introductions of new technology-driven products and services. The effective use of technology increases efficiency and enables financial institutions to better serve customers and to reduce costs. The Company’s future successgrow depends, in part, upon itsour ability to address the needs of its customers by using technologyexpand our market share, to provide productssuccessfully attract core deposits and services that will satisfy customer demands,identify loan and investment opportunities, as well as opportunities to create additional efficiencies in the Company’s operations. Many of the Company’s competitors have substantially greater resourcesgenerate fee-based income. Our ability to invest in technological improvements. The Company may not be ablemanage growth successfully will also depend on whether we can continue to effectively implement new technology-driven productsefficiently fund asset growth and services or be successful in marketing these productsmaintain asset quality and services to its customers. Failure to successfully keep pace with technological changes affecting the financial services industry could have a material adverse impactcost controls, as well as on the Company’s business and, in turn, the Company’s financial condition and results of operations.
The Company relies on third parties to provide key components of its business infrastructure.
The Company relies on third parties to provide key components for its business operations,factors beyond our control, such as data processing and storage, recording and monitoring transactions, online banking interfaces and services, internet connections, and network access. While the Company selects these third-party vendors carefully, it does not control their actions. Any problems caused by these third parties, including those resulting from breakdowns or other disruptions in communication services provided by a vendor, failure of a vendor to handle current or higher volumes, cyber-attacks and security breaches at a vendor, failure of a vendor to provide services for any reason, or poor performance of services by a vendor, could adversely affect the Company’s ability to deliver products and services to its customers and otherwise conduct its business. Financial or operational difficulties of a third-party vendor could also hurt the Company’s operations if those difficulties interfere with the vendor's ability to serve the Company. Replacing these third party vendors could create significant delays and expense that adversely affect the Company’s business and performance.
The possibility of the economy’s return to recessionaryeconomic conditions and the possibility of further turmoil or volatility in the financial markets would likely have an adverse effect on our business, financial position, and results of operations.
The economy in the United States and globally has experienced volatility in recent years and may continue to do so for the foreseeable future. There can be no assurance that economic conditions will not worsen. Unfavorable or uncertain economic conditions can be caused by declines in economic growth, business activity, or investor or business confidence, limitations on the availability or increases in the cost of credit and capital, increases in inflation or interest rates, the timing and impact of changing governmental policies, natural disasters, terrorist attacks, acts of war, or a combination of these or other factors. A worsening of business and economic conditions could have adverse effects on our business, including the following:interest-rate trends.
15
investors may have less confidence in the equity markets in general and in financial services industry stocks in particular, which could place downward pressure on the Company’s stock price and resulting market valuation;
economic and market developments may further affect consumer and business confidence levels and may cause declines in credit usage and adverse changes in payment patterns, causing increases in delinquencies and default rates;
the Company’s ability to assess the creditworthiness of its customers may be impaired if the models and approaches the Company uses to select, manage and underwrite its customers become less predictive of future behaviors;
the Company could suffer decreases in demand for loans or other financial products and services or decreased deposits or other investments in accounts with the Company;
customers of the Company’s Wealth Management Group may liquidate investments, which together with lower asset values, may reduce the level of assets under management and administration, and thereby decrease the Company’s investment management and administration revenues;
competition in the financial services industry could intensify as a result of the increasing consolidation of financial services companies in connection with current market conditions or otherwise; and
the value of loans and other assets or collateral securing loans may decrease.
The Company is subject to other-than-temporary impairment risk, which could negatively impact our financial performance.
The Company recognizes an impairment charge when the decline in the fair value of equity, debt securities, and cost-method investments below their cost basis are judged to be other-than-temporary. Significant judgment is used to identify events or circumstances that would likely have a significant adverse effect on the future use of the investment. The Company considers various factors in determining whether an impairment is other-than-temporary, including the severity and duration of the impairment, forecasted recovery, the financial condition and near-term prospects of the investee, whether the Company has the intent to sell and whether it is more likely than not it will be forced to sell the security in question. Information about unrealized gains and losses is subject to changing conditions. The values of securities with unrealized gains and losses will fluctuate, as will the values of securities that we identify as potentially distressed. Our current evaluation of other-than-temporary impairments reflects our intent to hold securities for a reasonable period of time sufficient for a forecasted recovery of fair value. However, our intent to hold certain of these securities may change in future periods as a result of facts and circumstances impacting a specific security. If our intent to hold a security with an unrealized loss changes and we do not expect the security to fully recover prior to the expected time of disposition, we will write down the security to its fair value in the period that our intent to hold the security changes.
The risks presented by acquisitions could adversely affect our financial condition and results of operations.
The business strategy of the Company may include growth through acquisition. Any future acquisitions will be accompanied by the risks commonly encountered in acquisitions. These risks may include, among other things:
our ability to realize anticipated cost savings;
the difficulty of integrating operations and personnel, the loss of key employees;
the potential disruption of our or the acquired company’s ongoing business in such a way that could result in decreased revenues, the inability of our management to maximize our financial and strategic position;
the inability to maintain uniform standards, controls, procedures, and policies; and
the impairment of relationships with the acquired company’s employees and customers as a result of changes in ownership and management.
The Company cannot provide any assurance that we will be successful in overcoming these risks or any other problems encountered in connection with acquisitions. Our inability to overcome these risks could have an adverse effect on the achievement of our business strategy and results of operations.
There are substantial risks and uncertainties associated with the introduction or expansion of lines of business or new products and services within existing lines of business.
From time to time, the Company may implement new lines of business or offer new products and services within existing lines of business. There are substantial risks and uncertainties associated with these efforts, particularly in instances where the markets are not fully developed. In developing and marketing new lines of business and/or new products and services, the Company may invest significant time and resources. Initial timetables for the introduction and development of new lines of business and/or new products or services may not be achieved, and price and profitability targets may not prove attainable. External factors, such as compliance with regulations, competitive alternatives, and shifting market preferences, may also impact the successful implementation of a new line of business or a new product or service. Furthermore, any new line of business and/or new product or service could have a significant impact on the effectiveness of the Company’s system of internal controls. Failure to successfully manage these risks in the development and implementation of new lines of business or new products or services could have a material adverse effect on the Company’s business, results of operations, and financial condition.
Our controlsThe Company is subject to liquidity risk, which could adversely affect net interest income and procedures may fail orearnings.
The purpose of the Company’s liquidity management practices is to meet the cash flow obligations of its clients for both deposits and loans. One liquidity measurement the Company utilizes is called basic surplus, which captures the adequacy of the Company’s access to reliable sources of cash relative to the stability of its funding mix of average liabilities. This approach recognizes the importance of balancing levels of cash flow liquidity from short- and long-term securities with the availability of dependable borrowing sources which can be circumvented, which mayaccessed when necessary. However, competitive pressure on deposit pricing could result in a material adverse effectdecrease in the Company’s deposit base or an increase in funding costs. In addition, liquidity will come under additional pressure if loan growth exceeds deposit growth. To manage this risk, the Company has the ability to borrow from the Federal Home Loan Bank (“FHLB”) of Boston, the Federal Reserve Bank of Boston (“FRB of Boston”), purchase brokered deposits, borrow against established borrowing facilities with other banks (Federal funds), and enter into repurchase agreements with investment companies. Depending on the level of interest rates, the Company’s net interest income, and therefore earnings, could be adversely affected.
Our ability to service our business.debt, pay dividends, and otherwise pay our obligations as they come due is substantially dependent on capital distributions from our subsidiary.
Management regularly reviewsThe Company is a separate and updates our internal controls, disclosure controlsdistinct legal entity from its subsidiary, the Bank. It receives substantially all of its revenue from dividends from the Bank. These dividends are the principal source of funds to pay dividends on the Company’s common stock. Various federal and/or state laws and procedures, and corporate governance policies. Any systemregulations limit the amount of controls, however well designed and operated, is based in part on certain assumptions and can provide only reasonable, not absolute, assurancesdividends that the objectivesBank may pay to the Company. Also, the Company’s right to participate in a distribution of assets upon a subsidiary’s liquidation or reorganization is subject to the prior claims of the system are met. Any failuresubsidiary’s depositors and certain other creditors. In the event the Bank is unable to pay dividends to the Company, the Company may not be able to service debt, pay obligations, or circumvention ofpay dividends on the controls and procedures or failureCompany’s common stock. The inability to comply with regulations related toreceive dividends from the Bank could have a material adverse effect on ourthe Company’s business, financial condition, and results of operations and financial condition.operations.
The Company is exposeddepends on its executive officers and key personnel to risk of environmental liabilities with respect to properties to which we obtain title.
A significant portioncontinue the implementation of our loan portfolio is secured by real estate. In the course of ourlong-term business we may foreclose and take title to real estatestrategy and could be subject to environmental liabilities with respect to these properties. harmed by the loss of their services.
The Company may be held liablebelieves that its continued growth and future success will depend in large part upon the skills of our management team. The competition for qualified personnel in the financial services industry is intense, and the loss of our key personnel, or an inability to a government entitycontinue to attract or to third parties for property damage, personal injury, investigation,retain and clean-up costs incurred by these parties in connection with environmental contamination or may be required to clean up hazardous or toxic substances or chemical releases at a property. The costs associated with investigation and remediation activities could be substantial. In addition, if we are the owner or former owner of a contaminated site, we may be subject to common law claims by third parties based on damages and costs resulting from environmental contamination emanating from the property. These costs and claimsmotivate key personnel could adversely affect our business. We cannot provide any assurance that we will be able to retain our existing key personnel, attract additional qualified personnel, or effectively manage the succession of key personnel. Although we have change of control agreements with our actively employed named executive officers, the loss of the services of one or more of our executive officers or key personnel could impair our ability to continue to develop our business strategy.
16
The Company relies on third parties to provide key components of its business infrastructure.
The Company relies on third parties to provide key components for its business operations, such as data processing and storage, recording and monitoring transactions, online banking interfaces and services, internet connections, and network access. While the Company selects these third-party vendors carefully, it does not control their actions. Any problems caused by these third parties, including those resulting from breakdowns or other disruptions in communication services provided by a vendor, failure of a vendor to handle current or higher volumes, cyber-attacks and security breaches at a vendor, failure of a vendor to provide services for any reason, or poor performance of services by a vendor, could adversely affect the Company’s ability to deliver products and services to its clients and otherwise conduct its business. Financial or operational difficulties of a third-party vendor could also hurt the Company’s operations if those difficulties interfere with the vendor’s ability to serve the Company. Replacing these third-party vendors could create significant delays and expense that adversely affect the Company’s business and performance.
The possibility of the economy’s return to recessionary conditions and the possibility of further turmoil or volatility in the financial markets would likely have an adverse effect on our business, financial position, and results of operations,operations.
The economy in the United States and prospects.globally has experienced volatility in recent years and may continue to experience such volatility for the foreseeable future. There can be no assurance that economic conditions will not worsen. Unfavorable or uncertain economic conditions can be caused by declines in economic growth, business activity, or investor or business confidence, limitations on the availability or increases in the cost of credit and capital, fluctuations in inflation or interest rates, the timing and impact of changing governmental policies, natural disasters, climate change, epidemics / pandemics, such as COVID-19, terrorist attacks, acts of war, or a combination of these or other factors. A worsening of business and economic conditions could have adverse effects on our business, including the following:
The Company may be adversely affected by the soundness of other financial institutions, including the FHLB of Boston.
Our ability to engage in routine funding transactions could be adversely affected by the actions and commercial soundness of other financial institutions. Financial services companies are interrelated as a result of trading, clearing, counterparty, or other relationships. The Company has exposure to different industries and counterparties, and we routinely execute transactions with counterparties in the financial services industry, including brokers and dealers, commercial banks, investment banks, mutual and hedge funds, and other institutional clients. As a result, defaults by, or even rumors or questions about, one or more financial services companies, or the financial services industry generally, have led to market-wide liquidity problems and could lead to losses or defaults by us or by other institutions. Many of these transactions expose us to credit risk in the event of default of our counterparty or client. In addition, our credit risk may be exacerbated if the collateral held by us cannot be realized or is liquidated at prices not sufficient to recover the full amount of the loan or derivative exposure due us. These circumstances could lead to impairments or write-downs in a bank’s securities portfolio and periodic gains or losses on other investments under mark-to-market accounting treatment. We could incur additional losses to our securities portfolio in the future as a result of these issues. There is no assurance that any such losses would not materially and adversely affect our business, financial condition, or results of operations.
The Company owns common stock of the FHLB of Boston in order to qualify for membership in the FHLB system, which enables it to borrow funds under the FHLB of Boston’s advance program. The carrying value and fair market value of our FHLB of Boston common stock was $4.2$19.1 million as of December 31, 2017.2023. There are 11 branches of the FHLB, including
17
Boston, which are jointly liable for the consolidated obligations of the FHLB system. To the extent that one FHLB branch cannot meet its obligations to pay its share of the system’s debt, other FHLB branches can be called upon to make the payment. Any adverse effects onwithin the FHLB of Boston could adversely affect the value of our investment in its common stock and our ability to rely on the FHLB as a funding source and this could negatively impact our results of operations.
Risks Related to an Investment in the Company’s Securities
The Company’s common stock price may fluctuate significantly.
The market price of the Company’s common stock may fluctuate significantly in response to a number of factors including, but not limited to:
the political climate and whether the proposed policies of the current Presidentialpresidential administration in the U.S. that have affected market prices for financial institution stocks are successfully implemented;
changes in securities analysts’ recommendations or expectations of financial performance;
volatility of stock market prices and volumes;
incorrect information or speculation;
changes in industry valuations;
announcements regarding proposed acquisitions;
actions taken against the Company by various regulatory agencies;
changes in authoritative accounting guidance;
changes in general domestic economic conditions such as inflation rates, tax rates, unemployment rates, labor and healthcare cost trend rates, recessions, and changing government policies, laws, and regulations; and
severe weather, natural disasters, climate change, epidemics / pandemics such as COVID-19, acts of war or terrorism, and other external events.
ThereFuture issuance of our common stock may have a dilutive effect and may reduce the voting power and relative percentage interests of current common shareholders in our earnings and market value, and there may be future sales or other dilution of the Company’s equity, which may adversely affect the market price of the Company’s stock.
TheFuture issuances of shares of our common stock, including for acquisitions, may have a dilutive effect and may reduce the voting power and relative percentage interests of current common shareholders in our earnings and market value. Additionally, the Company is not restricted from issuing additional common stock, including any securities that are convertible into or exchangeable for, or that represent the right to receive, common stock. The Company also grants shares of common stock to employees and directors under the Company’s incentive plan each year. The issuance of any additional shares of the Company’s common stock or securities convertible into, exchangeable for or that represent the right to receive common stock, or the exercise of such securities could be substantially dilutive to shareholders of the Company’s common stock. Holders of the Company’s common stock have no preemptive rights that entitle such holders to purchase their pro rata share of any offering of shares or any class or series. Because the Company’s decision to issue securities in any future offering will depend on market conditions, its acquisition activity and other factors, the Company cannot predict or estimate the amount, timing, or nature of its future offerings. Thus, the Company’s shareholders bear the risk of the Company’s future offerings reducing the market price of the Company’s common stock and diluting their stock holdings in the Company.
Risks Related to Legal, Governmental and Regulatory Changes
The Company dependsis subject to extensive government regulation and supervision, which may interfere with its ability to conduct its business and may negatively impact its financial results.
The Company, primarily through the Bank, Cambridge Trust Company of New Hampshire, Inc., and certain non-bank subsidiaries, are subject to extensive federal and state regulation and supervision. Banking regulations are primarily intended to protect depositors’ funds, the DIF and the safety and soundness of the banking system as a whole, not shareholders. These laws and regulations affect the Company’s lending practices, capital structure, investment practices, dividend policy, and growth, among other things. The U.S. Congress and federal and state banking agencies continually review banking laws, regulations, and policies for possible changes. Changes to statutes, regulations, or regulatory policies, including changes in interpretation or implementation of statutes, regulations, or policies, could affect the Company in substantial and unpredictable
18
ways. Such changes could subject the Company to additional costs, limit the types of financial services and products the Company may offer, and/or limit the pricing the Company may charge on certain banking services, among other things. Compliance personnel and resources may increase our costs of operations and adversely impact our earnings.
Failure to comply with laws, regulations, or policies could result in sanctions by regulatory agencies, civil money penalties, and/or reputation damage, which could have a material adverse effect on our executive officersbusiness, financial condition, and key personnelresults of operations. While the Company has policies and procedures designed to continue the implementationprevent any such violations, there can be no assurance that such violations will not occur.
State and federal banking agencies periodically conduct examinations of our long-term business, strategyincluding for compliance with laws and could be harmed by the lossregulations, and our failure to comply with any supervisory actions to which we are or become subject as a result of their services.
The Company believes that our continued growth and future success will depend in large part upon the skills of our management team. The competition for qualified personnel in the financial services industry is intense, and the loss of our key personnel, or an inability to continue to attract or retain and motivate key personnel couldsuch examinations may adversely affect our business. We
Federal and state regulatory agencies periodically conduct examinations of our business, including our compliance with laws and regulations. If, as a result of an examination, an agency were to determine that the financial, capital resources, asset quality, earnings prospects, management, liquidity, or other aspects of any of our operations had become unsatisfactory or violates any law or regulation, such agency may take certain remedial or enforcement actions it deems appropriate to correct any deficiency. Remedial or enforcement actions include the power to enjoin “unsafe or unsound” practices, to require affirmative actions to correct any conditions resulting from any violation or practice, to issue an administrative order that can be judicially enforced against a bank, to direct an increase in the bank’s capital, to restrict the bank’s growth, to assess civil monetary penalties against a bank’s officers or directors, and to remove officers and directors. In the event that the FDIC concludes that, among other things, our financial condition cannot assurebe corrected or that there is an imminent risk of loss to our depositors, it may terminate our deposit insurance. The CFPB also has authority to take enforcement actions, including cease-and desist orders or civil monetary penalties, if it finds that we willoffer consumer financial products and services in violation of federal consumer financial protection laws.
The Company also anticipates increased regulatory scrutiny – in the course of routine examinations and otherwise – and new regulations directed towards banks of similar size to the Bank, designed to address negative developments in the banking industry, including the high-profile bank failures involving First Republic Bank, Silicon Valley Bank and Signature Bank in 2023, all of which may increase the Company’s costs of doing business and reduce its profitability. Among other things, there may be able to retain our existing key personnel, attract additional qualified personnel, or effectively manage the succession of key personnel. We have change of control agreements with our actively employed named executive officers,an increased focus by both regulators and investors on deposit composition and the losslevel of uninsured deposits. Due to the composition of the servicesBank’s deposits and percentage of uninsured deposits, the Bank could face increased scrutiny.
If we are unable to comply with future regulatory directives, or with the terms of any future supervisory requirements to which we may become subject, then we could become subject to a variety of supervisory actions and orders, including cease and desist orders, PCA, memoranda of understanding, and other regulatory enforcement actions. Such supervisory actions could, among other things, impose greater restrictions on our business, as well as our ability to develop any new business. The Company could also be required to raise additional capital or dispose of certain assets and liabilities within a prescribed time period, or both. Failure to implement remedial measures as required by financial regulatory agencies could result in additional orders or penalties from federal and state regulators, which could trigger one or more of our executive officersthe remedial actions described above. The terms of any supervisory action and key personnelassociated consequences with any failure to comply with any supervisory action could impair our ability to continue to develophave a material negative effect on our business, strategy.operating flexibility, and overall financial condition.
The Company may be subject to more stringent capital requirements.
The Bank and the Company are each subject to capital adequacy guidelines and other regulatory requirements specifying minimum amounts and types of capital which each of the Bank and the Company must maintain. From time to time, the regulators implement changes to these regulatory capital adequacy guidelines. If we fail to meet these minimum capital guidelines and other regulatory requirements, then our financial condition would be materially and adversely affected. In light of proposedAny changes to regulatory capital requirements contained in the Dodd-Frank Act and the regulatory accords on international banking institutions formulated by the Basel Committee and implemented by the Federal Reserve and the Office of the Comptroller of the Currency (“OCC”), we may be required to satisfy additional, more stringent, capital adequacy standards. The ultimate impact of the revised capital and liquidity standards on us cannot be determined at this time and will depend on a number of factors, including the treatment and implementation by the federal banking regulators. These requirements, however, and any other new regulations, could adversely affect our ability to pay dividends or could require us to reduce business levels or to raise capital, including in ways that may adversely affect our financial condition or results of operations.
Accounting standards periodically change and the application of our accounting policies and methods may require management to make estimates about matters that are uncertain.
The regulatory bodies that establish accounting standards, including, among others, the FASB, and the SEC, periodically revise or issue new financial accounting and reporting standards that govern the preparation of our consolidated financial statements. The effect of such revised or new standards on our financial statements can be difficult to predict and can materially impact how we record and report our financial condition and results of operations.
In addition, management must exercise judgment in appropriately applying many of our accounting policies and methods, so they comply with generally accepted accounting principles. In some cases, management may have to select a particular accounting policy or method from two or more alternatives. In some cases, the accounting policy or method chosen might be
19
reasonable under the circumstances and yet might result in our reporting materially different amounts than would have been reported if we had selected a different policy or method. Accounting policies are critical to fairly presenting our financial condition and results of operations and may require management to make difficult, subjective, or complex judgments about matters that are uncertain.
Our controls and procedures may fail or be circumvented, which may result in a material adverse effect on our business.
Management regularly reviews and updates our internal controls, disclosure controls and procedures, and corporate governance policies. Any system of controls, however well designed and operated, is based in part on certain assumptions and can provide only reasonable, not absolute, assurances that the objectives of the system are met. Any failure or circumvention of the controls and procedures or failure to comply with regulations related to could have a material adverse effect on our business, results of operations and financial condition.
Legal proceedings to which we are subject or may become subject may have a material adverse impact on our financial position and results of operations.
Like many banks and other financial services organizations in our industry, we are from time to time involved in various legal proceedings and subject to claims and other actions related to our business activities brought by clients, employees, and others. All such legal proceedings are inherently unpredictable and, regardless of the merits of the claims, litigation is often expensive, time-consuming, disruptive to our operations and resources, and distracting to management. If resolved against us, such legal proceedings could result in excessive verdicts and judgments, injunctive relief, equitable relief, and other adverse consequences that may affect our financial condition and how we operate our business. Similarly, if we settle such legal proceedings, it may affect our financial condition and how we operate our business. Future court decisions, alternative dispute resolution awards, matters arising due to business expansion, or legislative activity may increase our exposure to litigation and regulatory investigations. In some cases, substantial non-economic remedies or punitive damages may be sought. Although we maintain liability insurance coverage, there can be no assurance that such coverage will cover any particular verdict, judgment, or settlement that may be entered against us, that such coverage will prove to be adequate, or that such coverage will continue to remain available on acceptable terms, if at all. Legal proceedings to which we are subject or may become subject may have a material adverse impact on our financial position and results of operations.
The Company is exposed to risk of environmental liabilities with respect to properties to which we obtain title.
A significant portion of our loan portfolio is secured by real estate. In the course of our business, we may foreclose and take title to real estate and could be subject to environmental liabilities with respect to these properties. The Company may be held liable to a government entity or to third parties for property damage, personal injury, investigation, and clean-up costs incurred by these parties in connection with environmental contamination or may be required to clean up hazardous or toxic substances or chemical releases at a property. The costs associated with investigation and remediation activities could be substantial. In addition, if we are the owner or former owner of a contaminated site, we may be subject to common law claims by third parties based on damages and costs resulting from environmental contamination emanating from the property. These costs and claims could adversely affect our business, results of operations, and prospects.
Risks Related to Cybersecurity and Data Privacy
A breach of information security, including cyber-attacks, could disrupt our business and impact our earnings.
The Company depends upon data processing, communication, and information exchange on a variety of computing platforms and networks and over the internet. In addition, we rely on the services of a variety of vendors to meet our data processing and communication needs. Despite existing safeguards, we cannot be certain that all of our systems are free from vulnerability to attack or other technological difficulties or failures. During the normal course of our business, we have experienced and we expect to continue to experience attempts to breach our systems, none of which has been material to the Company to date, and we may be unable to protect sensitive data and the integrity of our systems. If information security is breached or difficulties or failures occur, despite the controls we and our third-party vendors have instituted, information can be lost or misappropriated, resulting in financial loss or costs to us, reputational harm, or damages to others. Such costs or losses could exceed the amount of insurance coverage, if any, which would adversely affect our earnings.
The Company may be adversely affected by fraud.
The Company is inherently exposed to operational risk in the form of theft and other fraudulent activity by employees, clients, and other third parties targeting the Company and/or the Company’s clients or data. Such activity may take many forms, including check fraud, electronic fraud, wire fraud, phishing, social engineering, and other dishonest acts. During the normal course of our business, we have been subjected to and we expect to continue to be subject to theft and fraudulent activity, none of which has been material to the Company to date.
20
The Company continually encounters technological change and the failure to understand and adapt to these changes could hurt its business.
The financial services industry is continually undergoing rapid technological change with frequent introductions of new technology-driven products and services. The effective use of technology increases efficiency and enables financial institutions to better serve clients and to reduce costs. The Company’s future success depends, in part, upon its ability to address the needs of its clients by using technology to provide products and services that will satisfy client demands, as well as to create additional efficiencies in the Company’s operations. Many of the Company’s competitors have substantially greater resources to invest in technological improvements. The Company may not be able to effectively implement new technology-driven products and services or be successful in marketing these products and services to its clients. Failure to successfully keep pace with technological changes affecting the financial services industry could have a material adverse impact on the Company’s business and, in turn, the Company’s financial condition and results of operations.
Risks Related to the Eastern Merger
The pendency of the Eastern Merger could adversely affect our business, results of operations and financial condition.
The pendency of the Eastern Merger could cause disruptions in and create uncertainty surrounding our business, including affecting our relationships with our existing and future customers, suppliers and employees, which could have an adverse effect on our business, results of operations and financial condition, regardless of whether the proposed Eastern Merger is completed. In particular, we could potentially lose additional important personnel as a result of the departure of employees who decide to pursue other opportunities in light of the Eastern Merger. We could also potentially lose additional customers or suppliers, and new customer or supplier contracts could be delayed or decreased. In addition, we have allocated, and will continue to allocate, significant management resources towards the completion of the transaction, which could adversely affect our business and results of operations.
We are subject to restrictions on the conduct of our business prior to the consummation of the Eastern Merger as provided in the Merger Agreement, including, among other things, certain restrictions on our ability to acquire other businesses, sell or transfer our assets, and amend our organizational documents. These restrictions could result in our inability to respond effectively to competitive pressures, industry developments and future opportunities, retain key employees and may otherwise harm our business, results of operations and financial condition.
Because the price of Eastern Common Stock will fluctuate, our shareholders cannot be certain of the market value of the Merger Consideration.
Upon completion of the Eastern Merger, each share of our common stock will be converted into the right to receive 4.956 shares of Eastern Common Stock. The dollar value of the Eastern Common Stock that our shareholders will receive upon completion of the Eastern Merger will depend upon the market value of Eastern Common Stock at the time of completion of the Eastern Merger, which may be lower or higher than the closing price of Eastern Common Stock on the last full trading day preceding the date the Merger Agreement was executed. The market values of Eastern Common Stock and our common stock have varied since we entered into the Merger Agreement and will continue to vary in the future due to changes in the business, operations or prospects of us and Eastern, market assessments of the Eastern Merger, regulatory considerations, market and economic considerations, and other factors, most of which are beyond our control.
The Eastern Merger is subject to the receipt of consents and approvals from governmental authorities that may delay the date of completion of the Eastern Merger or impose conditions that could have an adverse effect on the Company.
Before the Eastern Merger may be completed, various consents, approvals, waiver or non-objections must be obtained from state and federal governmental authorities, including the Board of Governors of the Federal Reserve System, the FDIC, the Massachusetts Commissioner of Banks, the Massachusetts Housing Partnership, and the New Hampshire Banking Department. Satisfying the requirements of these governmental authorities may delay the date of completion of the Eastern Merger. In addition, these governmental authorities may include conditions on the completion of the Eastern Merger, or require changes to the terms of the Eastern Merger. The parties are not obligated to complete the Eastern Merger should any regulatory approval contain any prohibition, limitation or other requirement that Eastern’s board of directors reasonably determines in good faith would, individually or in the aggregate, materially reduce the benefits of the Eastern Merger to such a degree that Eastern would not have entered into the Merger Agreement had such condition, restriction or requirement been known at the date of the Merger Agreement.
Failure to complete the Eastern Merger could negatively impact the stock price of the Company and future businesses and financial results of the Company.
21
If the Eastern Merger is not completed, the ongoing businesses, financial condition and results of operation of the Company may be adversely affected and market prices of the Company’s common stock may decline significantly, particularly to the extent that the current market prices reflect a market assumption that the Eastern Merger will be consummated. If the consummation of the Eastern Merger is delayed, including by the receipt of a competing acquisition proposal, the Company’s business, financial condition and results of operations may be materially adversely affected.
In addition, the Company has incurred and will incur substantial expenses in connection with the negotiation and completion of the transactions contemplated by the Merger Agreement, as well as the costs and expenses of filing, printing and mailing the joint proxy statement/prospectus and all filing and other fees paid to the SEC and other regulatory agencies in connection with the Eastern Merger. If the Eastern Merger is not completed, the Company would have to recognize these expenses without realizing the expected benefits of the Eastern Merger. Any of the foregoing, or other risks arising in connection with the failure of or delay in consummating the Eastern Merger, including the diversion of management attention from pursuing other opportunities and the constraints in the Merger Agreement on the ability to make significant changes to the Company’s ongoing business during the pendency of the Eastern Merger, could have a material adverse effect on the Company’s businesses, financial conditions and results of operations.
Additionally, the Company’s business may have been adversely impacted by the failure to pursue other beneficial opportunities due to the focus of management on the Eastern Merger, without realizing any of the anticipated benefits of completing the Eastern Merger. If the Merger Agreement is terminated and the Company’s board of directors seeks another merger or business combination, the Company’s shareholders cannot be certain that the Company will be able to find a party willing to engage in a transaction on more attractive terms than the Eastern Merger.
Eastern may be unable to successfully integrate our operations or otherwise realize the expected benefits from the Eastern Merger, which could adversely affect Eastern’s results of operations and financial condition.
The Eastern Merger involves the integration of two companies that have previously operated independently. The difficulties of combining the operations of the two companies include:
The process of integrating operations could cause an interruption of, or loss of momentum in, the activities of the business and the loss of key personnel. The integration of the two companies will require the experience and expertise of certain of our key employees who are expected to be retained by Eastern. Eastern may not be successful in retaining these employees for the time period necessary to successfully integrate our operations with those of Eastern. The diversion of management’s attention and any delay or difficulty encountered in connection with the Eastern Merger and the integration of the two companies’ operations could have an adverse effect on the business and results of operations of Eastern following the Eastern Merger.
The success of the Eastern Merger will depend, in part, on Eastern’s ability to realize the anticipated benefits and cost savings from combining the Company’s business with Eastern’s. If Eastern is unable to successfully integrate the Company, the anticipated benefits and cost savings of the Eastern Merger may not be realized fully or may take longer to realize than expected. For example, Eastern may fail to realize the anticipated increase in earnings and cost savings anticipated to be derived from the Eastern Merger. In addition, as with regard to any merger, a significant decline in asset valuations or cash flows may also cause Eastern not to realize expected benefits.
The Company’s shareholders will not be entitled to dissenters’ or appraisal rights in the Eastern Merger.
Dissenters’ or appraisal rights are statutory rights that, if applicable under law, enable shareholders to dissent from an extraordinary transaction, such as a merger, and to demand that the corporation pay the fair value for their shares as determined by a court in a judicial proceeding instead of receiving the consideration offered to shareholders in connection with the extraordinary transaction. Under the Massachusetts Business Corporation Act, holders of Company common stock will not be entitled to dissenters’ or appraisal rights in the Eastern Merger with respect to their shares of Company common stock.
22
Risks Related to Acquisitions
The risks presented by acquisitions, such as the Northmark Merger, could adversely affect our financial condition and results of operations.
The business strategy of the Company may include growth through acquisitions such as the Northmark Merger. Any such future acquisitions will be accompanied by the risks commonly encountered in acquisitions. These risks may include, among other things:
The Company cannot provide any assurance that we will be successful in overcoming these risks or any other problems encountered in connection with acquisitions. Our inability to overcome these risks could have an adverse effect on the achievement of our business strategy and results of operations.
The ongoing integration of the Company and Northmark will present significant challenges that may result in the combined business not operating as effectively as expected or in the failure to achieve some or all of the anticipated benefits of the transaction.
The benefits and synergies expected to result from the Northmark Merger will depend in part on whether the operations of Northmark can be integrated in a timely and efficient manner with those of the Company. The Company will face challenges in consolidating its functions with those of Northmark, and integrating the organizations, procedures, and operations of the two businesses. The integration of the Company and Northmark will be complex and time-consuming, and the management teams of both companies will have to dedicate substantial time and resources to it. These efforts could divert management’s focus and resources from serving existing clients or other strategic opportunities and from day-to-day operational matters during the integration process. Failure to successfully integrate operations of the Company and Northmark could result in the failure to achieve some of the anticipated benefits from the transaction, including cost savings and other operating efficiencies, and the Company may not be able to capitalize on the existing relationships of Northmark to the extent anticipated, or it may take longer, or be more difficult or expensive than expected to achieve these goals. This could have an adverse effect on the business, results of operations, financial condition, or prospects of the Company and/or the Bank after the transaction.
Unanticipated costs relating to the Northmark Merger could reduce the Company’s future earnings per share.
The Company and the Bank believe that each has reasonably estimated the likely costs of integrating the operations of the Bank and Northmark, and the incremental costs of operating as a combined company. However, it is possible that unexpected transaction costs such as taxes, fees or professional expenses or unexpected future operating expenses such as increased personnel costs or increased taxes, as well as other types of unanticipated adverse developments, could have a material adverse effect on the results of operations and financial condition of the combined company. If unexpected costs are incurred, the Northmark Merger could have a dilutive effect on the Company’s earnings per share. In other words, after the completion of the Northmark Merger, the earnings per share of the Company’s common stock could be less than anticipated or even less than if the Northmark Merger had not been completed.
General Risks
Natural disasters, climate change, acts of war or terrorism, the impact of health epidemics and other adverse external events could detrimentally affect our financial condition and results of operations.
Natural disasters, climate change, acts of war or terrorism, such as the ongoing Russia-Ukraine war and Israel-Hamas war, health epidemics such as COVID-19, and other adverse external events could have a significant negative impact on our ability to conduct business or upon third parties who perform operational services for us or our clients. Such events also could affect the stability of our deposit base, impair the ability of borrowers to repay outstanding loans, impair the value of collateral securing loans, cause significant property damage, result in lost revenue or cause us to incur additional expenses.
23
In the event of a natural disaster, the spread of COVID-19 to our market areas or other adverse external events, our business, services, asset quality, financial condition and results of operations could be adversely affected.
Item 1B. UnresolvedUnresolved Staff Comments.
None.
Risk Management and Strategy
The Company maintains robust processes for assessing, identifying and managing materials risks from cybersecurity threats. The Company’s cybersecurity program is based on the National Institute of Standards and Technology (“NIST”) Cybersecurity Framework, as well as the GLBA and the risk of cybersecurity threats is integrated into the Company’s Enterprise Risk Management (“ERM”) program, governed by the Board level Risk Committee. The ERM program includes an annual risk prioritization process to identify key enterprise risks. Each key risk is assigned risk owners to establish action plans and implement risk mitigation strategies. The cybersecurity threat risk action plan is managed at the enterprise level and led by the Director of Information Security. Periodically, the risk owners review and update the cybersecurity threat risk action plan to provide the status on specific risk mitigation actions and to identify new threats. To oversee and identify cybersecurity threat risks on a day-to-day basis, including from third-party service providers, the Company maintains a security operations center with round-the-clock monitoring, and the Director of Information Security along with the Chief Information Officer (“CIO”) receives regular reports on industry activity. Management also assesses the cybersecurity proficiency of potential third-party vendors and cloud suppliers before utilizing their services. The assessment identifies cybersecurity-related risks an includes recommendations to enhance the security of new cloud computing services. The Company reassesses cloud suppliers quarterly.
The Company works to continually assess, identify and manage cybersecurity risks. In addition, the Company engages with third-party cybersecurity specialists to provide an independent assessment of the Company’s cybersecurity programs to maintain compliance and operational excellence. Management periodically reviews operational plans and modifies them in response to changes in the threat landscape and otherwise as needed. Management has not identified risks from cybersecurity threats, including as a result of any previous cybersecurity incidents, that have materially affected or are reasonably likely to materially affect the Company, including its business strategy, results of operations or financial condition. See “Item 1A. Risk Factors” above for more information.
Governance
The Board of Directors is responsible for overseeing the assessment and management of enterprise-level risks that may impact the Company. The Risk Committee has primary responsibility for overseeing risk management, including oversight of risks from cybersecurity threats. Management, including the CIO and Director of Information Security, reports on cybersecurity matters at least quarterly to the Board, primarily through the Risk Committee, including an annual report regarding specific risks and mitigation efforts within the Company. Management provides benchmarking information and updates on key operational and compliance metrics to the Board. In addition, cybersecurity training is provided to the full Board, including training by third-party experts, to educate directors on the current cyber threat environment and measures companies can take to mitigate risks and impact of cyber attacks.
The Company maintains a Cybersecurity Incident Response Plan (the “CSIRP”), which establishes an organizational framework and guidelines intended to facilitate an effective response and handling of cybersecurity incidents that could jeopardize the availability, integrity, or confidentiality of the Cambridge Trust Company’s assets. The CSIRP outlines roles and responsibilities, criteria for measuring the severity of a cybersecurity incident, and an escalation framework, including processes for informing legal counsel and the Board of Directors of material cybersecurity incidents. As described above, management is actively involved in assessing and managing the Company’s material cybersecurity risks. The CIO, the Director of Information Technology as well as the Director of Information Security primarily lead these efforts. The CIO, who reports directly to CEO, is responsible for the oversight of the Company’s entire information technology operations. The Director of Information Security reports directly to the Risk Committee and has responsibility for leadership of the Company’s cybersecurity program.
24
Item 2. Properties.
The Company conducts its business through 11 full-service22 banking offices, including its main banking office and headquarters in Cambridge, Massachusetts, itsMassachusetts. The Company also has operations centercenters in Burlington, Massachusetts fourand Portsmouth, New Hampshire, and five wealth management offices and one off-site ATM. The following table sets forth certain information regarding our properties as of December 31, 2017:offices.
Location |
| Ownership |
| Year Opened |
| Year of Lease Expiration |
Headquarters(1): |
| Leased |
| 1890 |
| 2021(6) |
1336 Massachusetts Avenue |
|
|
|
|
|
|
Cambridge, MA 02138 |
|
|
|
|
|
|
Operations Center(2): |
| Leased |
| 1996 |
| 2030(7) |
78 Blanchard Road |
|
|
|
|
|
|
Burlington, MA 01803 |
|
|
|
|
|
|
Branch Offices: |
|
|
|
|
|
|
361 Trapelo Road |
| Leased |
| 2008 |
| 2023(8) |
Belmont, MA 02478 |
|
|
|
|
|
|
65 Beacon Street |
| Leased |
| 1998 |
| 2023(9) |
Boston, MA 02108 |
|
|
|
|
|
|
565 Tremont Street |
| Leased |
| 2012 |
| 2022(7) |
Boston, MA 02118 |
|
|
|
|
|
|
353 Huron Avenue |
| Owned |
| 1974 |
| NA |
Cambridge, MA 02138 |
|
|
|
|
|
|
415 Main Street(3) |
| Leased |
| 1969 |
| 2028(8) |
Cambridge, MA 02142 |
|
|
|
|
|
|
1720 Massachusetts Avenue |
| Leased |
| 1989 |
| 2019(7) |
Cambridge, MA 02138 |
|
|
|
|
|
|
350 Massachusetts Avenue(4) |
| Leased |
| 1998 |
| 2018 |
Cambridge, MA 02139 |
|
|
|
|
|
|
75 Main Street |
| Owned |
| 1990 |
| NA |
Concord, MA 01742 |
|
|
|
|
|
|
1690 Massachusetts Avenue |
| Leased |
| 2010 |
| 2020(7) |
Lexington, MA 02420 |
|
|
|
|
|
|
494 Boston Post Road |
| Owned |
| 1982 |
| NA |
Weston, MA 02493 |
|
|
|
|
|
|
Wealth Management Offices: |
|
|
|
|
|
|
75 State Street, 18th Floor |
| Leased |
| 2013 |
| 2019(9) |
Boston, MA 02109 |
|
|
|
|
|
|
49 South Main Street, Suite 203(5) |
| Leased |
| 1996 |
| 2025(8) |
Concord, NH 03301 |
|
|
|
|
|
|
1000 Elm Street, Suite 201 |
| Leased |
| 2015 |
| 2025(8) |
Manchester, NH 03101 |
|
|
|
|
|
|
One Harbour Place, Suite 240 |
| Leased |
| 2011 |
| 2021(8) |
Portsmouth, NH 03801 |
|
|
|
|
|
|
|
|
|
|
|
|
|
|
|
|
|
|
|
|
|
|
|
|
From time to time, the Company and its subsidiaries may be parties to various claims and lawsuits arising in the ordinary course of their normal business activities. Although the ultimate outcome of these suits, if any, cannot be ascertained at this time, it is the opinion of management that none of these matters, even if it resolved adversely to the Company, will have a material adverse effect on the Company’s consolidated financial position. The Company is not currently party to any material pending legal proceedings.
Item 4. Mine Safety Disclosures.
None.
25
PART II
Item 5. Market for Registrant’s Common Equity Related Stockholder Matters and Issuer Purchases of Equity Securities.
On October 17, 2017, the SEC declared the Company’s Registration Statement on Form 10, as amended, effective.
Market Information
On October 18, 2017, shares of the Company’s common stock commenced trading on the Nasdaq stock marketNASDAQ Stock Market under the symbol CATC.“CATC”. Prior to this date, the Company’s shares traded on the over the counterover-the-counter market. The following table summarizes quarterly high and low stock price ranges, the end
As of quarter closing price and dividends paid per share for the years ended December 31, 2017 and 2016:
|
| High |
|
| Low |
|
| Close |
|
| Dividend declared per share |
| ||||
Year ended December 31, 2017 |
|
|
|
|
|
|
|
|
|
|
|
|
|
|
|
|
First Quarter |
| $ | 67.00 |
|
| $ | 61.50 |
|
| $ | 65.00 |
|
| $ | 0.46 |
|
Second Quarter |
| $ | 70.00 |
|
| $ | 64.90 |
|
| $ | 67.25 |
|
| $ | 0.46 |
|
Third Quarter |
| $ | 72.50 |
|
| $ | 64.25 |
|
| $ | 69.75 |
|
| $ | 0.47 |
|
Fourth Quarter |
| $ | 87.15 |
|
| $ | 69.90 |
|
| $ | 79.80 |
|
| $ | 0.47 |
|
Year ended December 31, 2016 |
|
|
|
|
|
|
|
|
|
|
|
|
|
|
|
|
First Quarter |
| $ | 47.65 |
|
| $ | 45.30 |
|
| $ | 46.25 |
|
| $ | 0.46 |
|
Second Quarter |
| $ | 49.90 |
|
| $ | 46.15 |
|
| $ | 46.59 |
|
| $ | 0.46 |
|
Third Quarter |
| $ | 50.45 |
|
| $ | 46.45 |
|
| $ | 50.05 |
|
| $ | 0.46 |
|
Fourth Quarter |
| $ | 62.90 |
|
| $ | 50.05 |
|
| $ | 62.29 |
|
| $ | 0.46 |
|
At February 28, 2018,March 8, 2024, there were 341 holders of record7,846,510shares of the Company’s common stock.stock outstanding held by 484 holders of record. The number of record-holders may not reflect the number of persons or entities holding stock in nominee name through banks, brokerage firms, and other nominees. The closing price of the Company’s common stock on December 31, 2023 was $69.40. The Company declared cash dividends of $2.68 and $2.56 per share in 2023 and 2022, respectively.
The continued payment of dividends depends upon our profitability, debt and equity structure, earnings, financial condition, need for capital and other factors, including economic conditions, regulatory restrictions, and tax considerations. We cannot guarantee the payment of dividends or that, if paid, that dividends will not be reduced or eliminated in the future.
The only funds available for the payment of dividends on our capital stock will be cash and cash equivalents held by us, dividends paid to us by the Bank, and borrowings. The Bank will be prohibited from paying cash dividends to us to the extent that any such payment would reduce the Bank’s capital below required capital levels.
The Company’s primary source of funds for dividends paid to shareholders is the receipt of dividends from the Bank. A discussion of the restrictions on the advance of funds or payments of dividends by the Bank to the Company is included in “Supervision and Regulation – Dividends.”
The following compares the cumulative total shareholder return on the Company’s common stock against the cumulative total return of the KBW NASDAQ CompositeBank Index and the SNL Bank NASDAQS&P U.S. BMI Banks Index from December 31, 20122018 to December 31, 2017.2023. The results presented assume that the value of the Company’s common stock and each index was $100.00 on December 31, 2012.2018. The total return assumes reinvestment of dividends.
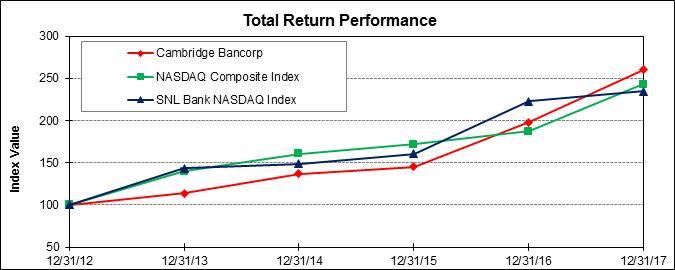

|
| Period Ending |
| |||
Index | 12/31/12 | 12/31/13 | 12/31/14 | 12/31/15 | 12/31/16 | 12/31/17 |
Cambridge Bancorp | 100.00 | 113.76 | 137.12 | 145.17 | 197.83 | 260.43 |
NASDAQ Composite Index | 100.00 | 140.12 | 160.78 | 171.97 | 187.22 | 242.71 |
SNL Bank NASDAQ Index | 100.00 | 143.73 | 148.86 | 160.70 | 222.81 | 234.58 |
Source: S&PStandard & Poor’s Global Market Intelligence © 20172023
26
The stock price performance shown on the stockThis performance graph and associatedshall not be deemed “filed” for the purposes of Section 18 of the Securities Exchange Act of 1934, as amended, (the “Exchange Act”), or incorporated by reference into any filing by us under the Securities Act of 1933, as amended, or the Exchange Act, except as shall be expressly set forth by specific reference in such filing.
Unregistered Sales of Equity Securities
(a) Sales of Unregistered Securities
None.
(b) Use of Proceeds
None.
(c) Issuer Purchases of Equity Securities
The following table below is not necessarily indicativesets forth the information regarding the Company’s repurchases of future price performance. Information used inits common stock during the graph and table was obtained from a third party provider, a source believed to be reliable, butthree months ended December 31, 2023:
|
| Total Number of |
|
| Weighted Average |
|
| ||
|
|
|
|
|
|
|
| ||
Period |
|
|
|
|
|
|
| ||
October 1 to October 31, 2023 |
|
| — |
|
| $ | — |
|
|
November 1 to November 30, 2023 |
|
| 379 |
|
| $ | 60.01 |
|
|
December 1 to December 31, 2023 |
|
| — |
|
| $ | — |
|
|
Total |
|
| 379 |
|
|
|
|
| |
On March 13, 2023, the Company’s Board of Directors authorized a share repurchase program (the “2023 Repurchase Program”) to acquire from time to time up to 5.0% of the total number of outstanding shares of the Company’s common stock as of December 31, 2022, with such purchases occurring prior to March 13, 2024, provided that the aggregate purchase price does not responsible forexceed $32.4 million. The timing and amount of any errorsshares of the Company’s common stock repurchased under the 2023 Repurchase Program will be determined by the Company’s management based on its evaluation of market conditions and other factors. The 2023 Repurchase Program may be suspended or omissions in such information.
Issuer Purchase of Equity Securities
Except as previously reported in our quarterly reportdiscontinued at any time. The 2023 Repurchase Program replaces an earlier repurchase program (the “2022 Repurchase Program”) which expired on Form 10-Q and Registration Statement on Form 10 filed with the Securities and Exchange Commission during 2017, theMarch 14, 2023. The Company did not repurchase any additional shares duringunder the year ended December 31, 2017.
Recent Sales of Unregistered Securities
Except as previously reported in our quarterly report on Form 10-Q2022 and Registration Statement on Form 10 filed with the Securities and Exchange Commission during 2017, there were no additional unregistered sales of equity securities2023 Repurchase Program during the year ended December 31, 2017.2023.
Item 6. Selected Financial Data.Reserved
The selected consolidated financial data set forth below does not purport to be complete and should be read in conjunction with, and is qualified in its entirety by, the more detailed information including the Consolidated Financial Statements and related Notes, and the section entitled “Management’s27
Item 7. Management’s Discussion and Analysis of Financial Condition and Results of Operations”.Operations.
|
| December 31, |
| |||||||||||||||||
|
| 2017 |
|
| 2016 |
|
| 2015 |
|
| 2014 |
|
| 2013 |
| |||||
|
| (dollars in thousands, except per share data) |
| |||||||||||||||||
Operating Data |
|
|
|
|
|
|
|
|
|
|
|
|
|
|
|
|
|
|
|
|
Interest Income |
| $ | 61,191 |
|
| $ | 57,028 |
|
| $ | 54,341 |
|
| $ | 50,371 |
|
| $ | 47,661 |
|
Interest Expense |
|
| 3,587 |
|
|
| 3,355 |
|
|
| 2,694 |
|
|
| 2,098 |
|
|
| 2,194 |
|
Net interest and dividend Income |
|
| 57,604 |
|
|
| 53,673 |
|
|
| 51,647 |
|
|
| 48,273 |
|
|
| 45,467 |
|
Provision for Loan Losses |
|
| 362 |
|
|
| 132 |
|
|
| 1,075 |
|
|
| 1,550 |
|
|
| 1,500 |
|
Noninterest Income |
|
| 30,224 |
|
|
| 28,661 |
|
|
| 25,865 |
|
|
| 24,464 |
|
|
| 23,181 |
|
Noninterest Expense |
|
| 59,292 |
|
|
| 56,750 |
|
|
| 53,192 |
|
|
| 49,007 |
|
|
| 46,111 |
|
Income Before Taxes |
|
| 28,174 |
|
|
| 25,452 |
|
|
| 23,245 |
|
|
| 22,180 |
|
|
| 21,037 |
|
Income Taxes |
|
| 13,358 |
|
|
| 8,556 |
|
|
| 7,551 |
|
|
| 7,236 |
|
|
| 6,897 |
|
Net Income |
| $ | 14,816 |
|
| $ | 16,896 |
|
| $ | 15,694 |
|
| $ | 14,944 |
|
| $ | 14,140 |
|
|
|
|
|
|
|
|
|
|
|
|
|
|
|
|
|
|
|
|
|
|
Average shares outstanding, basic |
|
| 4,030,530 |
|
|
| 3,990,343 |
|
|
| 3,938,117 |
|
|
| 3,886,692 |
|
|
| 3,839,146 |
|
Average shares outstanding, diluted |
|
| 4,065,754 |
|
|
| 4,028,944 |
|
|
| 3,993,599 |
|
|
| 3,957,416 |
|
|
| 3,907,201 |
|
Total shares outstanding |
|
| 4,082,188 |
|
|
| 4,036,879 |
|
|
| 4,000,181 |
|
|
| 3,940,536 |
|
|
| 3,884,851 |
|
Basic Earnings Per Share |
| $ | 3.64 |
|
| $ | 4.19 |
|
| $ | 3.94 |
|
| $ | 3.81 |
|
| $ | 3.65 |
|
Diluted Earnings Per Share |
| $ | 3.61 |
|
| $ | 4.15 |
|
| $ | 3.93 |
|
| $ | 3.78 |
|
| $ | 3.62 |
|
Dividends Declared Per Share |
| $ | 1.86 |
|
| $ | 1.84 |
|
| $ | 1.80 |
|
| $ | 1.68 |
|
| $ | 1.59 |
|
Dividend payout ratio (1) |
|
| 51 | % |
|
| 44 | % |
|
| 46 | % |
|
| 44 | % |
|
| 44 | % |
|
|
|
|
|
|
|
|
|
|
|
|
|
|
|
|
|
|
|
|
|
Financial Condition Data |
|
|
|
|
|
|
|
|
|
|
|
|
|
|
|
|
|
|
|
|
Total Assets |
| $ | 1,949,934 |
|
| $ | 1,848,999 |
|
| $ | 1,706,201 |
|
| $ | 1,573,692 |
|
| $ | 1,533,710 |
|
Total Deposits |
|
| 1,775,400 |
|
|
| 1,686,038 |
|
|
| 1,557,224 |
|
|
| 1,370,536 |
|
|
| 1,409,047 |
|
Total Loans |
|
| 1,350,899 |
|
|
| 1,320,154 |
|
|
| 1,192,214 |
|
|
| 1,080,766 |
|
|
| 942,451 |
|
Shareholders' equity |
|
| 147,957 |
|
|
| 134,671 |
|
|
| 125,063 |
|
|
| 116,258 |
|
|
| 109,283 |
|
Book Value Per Share |
| $ | 36.24 |
|
| $ | 33.36 |
|
| $ | 31.26 |
|
| $ | 29.50 |
|
| $ | 28.13 |
|
|
|
|
|
|
|
|
|
|
|
|
|
|
|
|
|
|
|
|
|
|
Performance Ratios |
|
|
|
|
|
|
|
|
|
|
|
|
|
|
|
|
|
|
|
|
Return on Average Assets |
|
| 0.79 | % |
|
| 0.95 | % |
|
| 0.95 | % |
|
| 0.98 | % |
|
| 0.99 | % |
Return on Average Shareholders' equity |
|
| 10.47 | % |
|
| 12.77 | % |
|
| 12.91 | % |
|
| 12.87 | % |
|
| 13.63 | % |
Equity to assets |
|
| 7.55 | % |
|
| 7.44 | % |
|
| 7.36 | % |
|
| 7.62 | % |
|
| 7.28 | % |
Interest rate spread (2) |
|
| 3.16 | % |
|
| 3.12 | % |
|
| 3.24 | % |
|
| 3.31 | % |
|
| 3.31 | % |
Net Interest Margin, taxable equivalent (3) |
|
| 3.25 | % |
|
| 3.21 | % |
|
| 3.32 | % |
|
| 3.37 | % |
|
| 3.38 | % |
Efficiency ratio (4) |
|
| 67.51 | % |
|
| 68.93 | % |
|
| 68.62 | % |
|
| 67.38 | % |
|
| 67.17 | % |
|
|
|
|
|
|
|
|
|
|
|
|
|
|
|
|
|
|
|
|
|
Wealth Management Assets |
|
|
|
|
|
|
|
|
|
|
|
|
|
|
|
|
|
|
|
|
Market Value of Assets Under Management & Administration |
| $ | 3,085,669 |
|
| $ | 2,689,103 |
|
| $ | 2,449,139 |
|
| $ | 2,371,012 |
|
| $ | 2,204,186 |
|
|
|
|
|
|
|
|
|
|
|
|
|
|
|
|
|
|
|
|
|
|
Asset Quality |
|
|
|
|
|
|
|
|
|
|
|
|
|
|
|
|
|
|
|
|
Non-Performing Loans |
| $ | 1,298 |
|
| $ | 1,676 |
|
| $ | 1,481 |
|
| $ | 1,629 |
|
| $ | 1,703 |
|
Non-Performing Loans/Total Loans |
|
| 0.10 | % |
|
| 0.13 | % |
|
| 0.12 | % |
|
| 0.15 | % |
|
| 0.18 | % |
Net (Charge-Offs)/Recoveries |
| $ | (303 | ) |
| $ | (62 | ) |
| $ | (153 | ) |
| $ | 11 |
|
| $ | 260 |
|
Allowance/Total Loans |
|
| 1.13 | % |
|
| 1.16 | % |
|
| 1.27 | % |
|
| 1.32 | % |
|
| 1.35 | % |
|
|
|
|
|
|
|
|
|
|
|
|
|
|
|
|
|
|
|
|
|
Capital Ratios (5): |
|
|
|
|
|
|
|
|
|
|
|
|
|
|
|
|
|
|
|
|
Total capital |
|
| 13.75 | % |
|
| 13.14 | % |
|
| 13.05 | % |
|
| 13.18 | % |
|
| 13.38 | % |
Tier 1 capital |
|
| 12.50 | % |
|
| 11.89 | % |
|
| 11.80 | % |
|
| 11.93 | % |
|
| 12.18 | % |
Common Equity Tier 1 |
|
| 12.50 | % |
|
| 11.89 | % |
|
| 11.80 | % |
| N/A |
|
| N/A |
| ||
Tier 1 leverage capital |
|
| 8.06 | % |
|
| 7.95 | % |
|
| 7.75 | % |
|
| 7.75 | % |
|
| 7.63 | % |
|
|
|
|
|
|
|
|
|
|
|
|
|
|
|
|
|
|
|
|
|
Other Data: |
|
|
|
|
|
|
|
|
|
|
|
|
|
|
|
|
|
|
|
|
Number of full service offices |
|
| 11 |
|
|
| 11 |
|
|
| 12 |
|
|
| 12 |
|
|
| 12 |
|
Full time equivalent employees |
|
| 239 |
|
|
| 238 |
|
|
| 228 |
|
|
| 225 |
|
|
| 225 |
|
|
|
|
|
|
|
|
|
|
|
Item 7. Management’s Discussion and Analysis of Financial Condition and Results of Operations.OVERVIEW
OVERVIEW
Cambridge Bancorp (together with its bank subsidiary, unless the context otherwise requires, the “Company”) is a Massachusetts state-chartered, federally registered bank holding company headquartered in Cambridge, Massachusetts. The Company is a Massachusetts corporation formed in 1983 and has one banking subsidiary, (the “Bank”): Cambridge Trust Company, formed in 1890. At December 31, 2017,2023, the Company had total assets of approximately $1.9$5.4 billion. Currently, the Bank operates 10 full-service22 banking offices in six citiesEastern Massachusetts and towns in Eastern Massachusetts.New Hampshire. The Company’s Wealth Management Group has fourfive offices, one in Boston, Massachusetts, and three in New Hampshire in Concord, Manchester, and Portsmouth.Portsmouth, and one in Southport, Connecticut. The Company’s Assets under Management and Administration as of December 31, 20172023 were approximately $3.1$4.6 billion. The Bank’s clients consist primarily of small- and medium-sized businesses and retail customersclients in these communities and surrounding areas throughout Massachusetts and New Hampshire.
The Company’s results of operations are largely dependent on net interest income, which is the difference between the interest earned on loans and securities and interest paid on deposits and borrowings. The results of operations are also affected by the level of income and fees earned from wealth management services and loans, deposits, as well as operating expenses, the provision for loan(release of) credit losses, the impact of federal and state income taxes, and the relative levels of interest rates and economic activity.
Critical Accounting PoliciesEstimates
Accounting policies involving significant judgments
Estimates and assumptions by management, whichare necessary in the application of certain accounting policies and can be susceptible to significant change. Critical accounting policies are defined as those that involve a significant level of estimation uncertainty and have had, or could have a material impact on the carrying valueCompany's financial condition or results of certain assets and impact income, are considered critical accounting policies.
operations. The Company considers the allowance for loancredit losses and income taxes to be its critical accounting policies.estimates.
Allowance for loan lossesCredit Losses
Arriving at an appropriate level of allowance
The Company evaluates the need for loan losses involves a high degree of judgment. Management maintains an allowance for credit losses on all financial assets measured at amortized cost, including loans receivable and held to maturity securities, in accordance with FASB ASC Topic 326, Financial Instruments – Credit Losses (“ASC Topic 326”), on a quarterly basis. ASC Topic 326 requires a methodology to estimate current expected credit losses (“CECL”) over the life of a loan, losseswhich incorporates applying a reasonable and supportable forecast period before reverting back to absorb losses inherenthistorical data. ASC Topic 326 also applies to off-balance sheet credit exposures not accounted for as insurance (i.e. loan commitments, standby letters of credit, financial guarantees, and other similar investments) and net investments in leases recognized by a lessor in accordance with Accounting Standards Update (“ASU”) 2016-02 – Leases (Topic 842).
Losses on loan receivables are estimated and recognized upon origination of the loan, portfolio. The allowance is based on assessmentsexpected credit losses for the life of the probable estimated losses inherent inloan balance as of the loan portfolio. Management’speriod end date. The Company’s methodology for assessing the appropriateness of the allowance consists of several key elements, which include the specific allowances, if appropriate, for identified problem loans, formula allowance, and possibly an unallocated allowance.
The provision for loan losses and the level ofcalculating the allowance for credit losses(“ACL”) on loans consists of quantitative and qualitative components.
The quantitative component of the ACL on loans is model-based and utilizes a forward-looking macroeconomic forecast. The Company uses a discounted cash flow method, incorporating probability of default and loss given default forecasted based on statistically derived economic variable loss drivers, to estimate expected credit losses. This process includes estimates which involve modeling loss projections attributable to existing loan losses reflects management’s estimatebalances, and considering historical experience, current conditions, and future expectations for homogeneous pools of probable loan losses inherent inloans over a reasonable and supportable forecast period. The historical information either experienced by the loan portfolioCompany or by a selection of peer banks, when appropriate, is derived from a combination of recessionary and non-recessionary performance periods for which data is available.
The reasonable and supportable forecast period is primarily determined based upon the stability of current economic conditions at the balance sheeteach measurement date. Management uses a systematic processconsiders the accuracy level of historical loss forecast estimates, the specific loan level models and methodology utilized, and considers material changes in growth, credit strategy, and its business which may not be applicable within the current environment. For periods beyond the reasonable and supportable forecast period, we revert to establish the allowancehistorical information over a period for loan losses each quarter. To determine the total allowance for loan losses, management estimates the allowance needed for eachwhich comparable data is available.
The qualitative component of the following segmentsACLconsiders (i) the uncertainty of the loan portfolio: (1) residential mortgage loans, (2) commercial mortgage loans, including multi-family loans and construction loans, (3) home equity loans and lines of credit, (4) commercial & industrial loans, and (5) consumer loans.
The establishment of the allowance for eachforward-looking scenarios; (ii) certain portfolio segment is based on a process that evaluates the risk characteristics, relevant to eachsuch as portfolio segment and takes into consideration multiple internal and external factors.
Internal factors include, but are not limited to:
(a) the loss emergence period,
(b) historic levels and trendsconcentrations, real estate values, changes in the number and amount of loans on non-accrual and past due charge-offs,loans; and (iii) model limitations; among other factors. Qualitative adjustments are considered when management believes expected credit losses are not representative of historical loss experience alone, and should be adjusted to reflect the current
28
conditions and characteristics of the Company’s own portfolio. They are made at the segment level, considering any required adjustments for differences in underwriting standards, portfolio mix, and other relevant data shifts over time.
We regularly review our collection experience (including delinquencies risk ratings, and foreclosures,
(c) levelnet charge-offs) in determining our allowance for credit losses. We also consider our historical loss experience to date based on actual defaulted loans and changesoverall portfolio indicators including delinquent and non-accrual loans, trends in industry, geographic,loan volume and lending terms, credit concentrations,
(d) underwriting policies and adherenceother observable environmental factors, such as unemployment and interest rate changes.
The underlying assumptions, estimates and assessments we use to estimate the allowance for credit losses reflect management’s best estimate of model assumptions and forecasted conditions at that time. Changes in such policies,estimates can significantly affect the allowance and provision for credit losses. It is possible and likely that we will experience credit losses that are different from our current estimates. Charge-offs are deducted from the allowance for credit losses when we judge the principal to be uncollectible, and subsequent recoveries are added to the allowance, generally at the time cash is received on a charged-off account.
(e)
Because the growthmethodology is based upon historical experience and vintagetrends, current economic data, reasonable and supportable forecasts, as well as management’s judgment, factors may arise that result in different estimations. Deteriorating conditions or assumptions could lead to increases in the ACL on loans; conversely, improving conditions or assumptions could lead to further reductions in the ACL on loans.
The expected credit losses for unfunded commitments are measured over the contractual period of the portfolios,Company’s exposure to credit risk. The estimate of credit loss incorporates assumptions for both the likelihood and
(f) amount of funding over the experienceestimated life of the commitments, for the risk of loss, and any changes in, lending and credit personnel.
External factors include, but are not limited to:
(a)current conditions and trends in the localexpectations. Management periodically reviews and national economy and
(b) levels and trends in national delinquent and non-performing loans.
The Bank evaluates certain loans individuallyupdates its assumptions for specific impairment. A loan is considered impaired when,estimated funding rates based on current informationhistorical rates, and events, it is probablefactors such as portfolio growth, changes to organizational structure, economic conditions, borrowing habits, or any other factor which could impact the likelihood that the Bankfunding will be unable to collect the scheduled payments of principal or interest when due according to the contractual terms of the loan agreement. Loans that experience insignificant payment delays and payment shortfalls generallyoccur. The Company does not reserve for unfunded commitments which are not classified as impaired. Loans are selected for evaluation based upon internal risk rating, delinquency status, or non-accrual status. A specific allowance amount is allocated to an individual loan when such loan has been deemed impaired and when the amount of the probable loss is able to be estimated. Estimates of loss may be determined by the present value of anticipated future cash flows, the loan’s observable fair market value, or the fair value of the collateral, if the loan is collateral dependent.unconditionally cancellable.
Income Taxes
The Company and its subsidiaries file income tax returns in the U.S. federal jurisdiction, the Commonwealth of Massachusetts, the State of New Hampshire, the State of Connecticut, the State of Maine, and other states as required. Income taxes are accounted for under the asset and liability method. Deferred tax assets and liabilities are reflected at currently enacted income tax rates applicable to the period in which the deferred tax assets or liabilities are expected to be realized or settled. As changes in tax laws or rates are enacted, deferred tax assets and liabilities are adjusted through the provision for income taxes.tax expense. Deferred tax assets are reviewed quarterly and reduced by a valuation allowance if, based upon the information available, it is more likely than not that some or all of the deferred tax assets will not be realized. Interest and penalties related to unrecognized tax benefits, if incurred, are recognized as a component of income tax expense.
In accordance with the Tax Cuts and Jobs Act of 2017 (the “Tax Act”), the Company re-measured its net deferred tax assets which resulted in a one-time non-cash write-down of its net deferred tax assets and recognized an additional income tax expense of $3.9 million for the year ended December 31, 2017. Effective in 2018, the change in tax law will reduce the Company’s statutory federal tax rate from 35% to 21%.
Recent Accounting Developments
See Note 3 to the Audited Consolidated Financial Statements – Recently Issued and Adopted Accounting Standards for additional details ofon recently issued and adopted accounting pronouncements and their expected impact on the Corporation’sCompany’s financial statements.
29
Selected Financial Highlights
The selected consolidated financial highlights set forth below do not purport to be complete and should be read in conjunction with, and is qualified in its entirety by, the more detailed information including the Consolidated Financial Statements and related Notes and within this section entitled “Management’s Discussion and Analysis of Financial Condition and Results of Operations.”
|
| December 31, |
| |||||||||||||||||
|
| 2023 |
|
| 2022 |
|
| 2021 |
|
| 2020 |
|
| 2019 |
| |||||
|
| (dollars in thousands, except per share data) |
| |||||||||||||||||
Operating Data |
|
|
|
|
|
|
|
|
|
|
|
|
|
|
| |||||
Interest Income |
| $ | 218,534 |
|
| $ | 159,993 |
|
| $ | 133,514 |
|
| $ | 129,378 |
|
| $ | 96,339 |
|
Interest Expense |
|
| 97,728 |
|
|
| 16,778 |
|
|
| 5,533 |
|
|
| 9,145 |
|
|
| 17,643 |
|
Net Interest and Dividend Income |
|
| 120,806 |
|
|
| 143,215 |
|
|
| 127,981 |
|
|
| 120,233 |
|
|
| 78,696 |
|
Provision for (Release of) Credit Losses |
|
| 904 |
|
|
| 3,881 |
|
|
| (1,294 | ) |
|
| 18,310 |
|
|
| 3,004 |
|
Noninterest Income |
|
| 41,730 |
|
|
| 43,009 |
|
|
| 44,324 |
|
|
| 39,525 |
|
|
| 36,401 |
|
Noninterest Expense |
|
| 115,223 |
|
|
| 110,382 |
|
|
| 100,484 |
|
|
| 98,085 |
|
|
| 78,175 |
|
Income Before Taxes |
|
| 46,409 |
|
|
| 71,961 |
|
|
| 73,115 |
|
|
| 43,363 |
|
|
| 33,918 |
|
Income Taxes |
|
| 12,300 |
|
|
| 19,052 |
|
|
| 19,091 |
|
|
| 11,404 |
|
|
| 8,661 |
|
Net Income (a GAAP Measure) |
| $ | 34,109 |
|
| $ | 52,909 |
|
| $ | 54,024 |
|
| $ | 31,959 |
|
| $ | 25,257 |
|
|
|
|
|
|
|
|
|
|
|
|
|
|
|
|
| |||||
Operating Net Income (a non-GAAP measure)* |
| $ | 40,157 |
|
| $ | 56,549 |
|
| $ | 54,828 |
|
| $ | 43,870 |
|
| $ | 29,156 |
|
Average shares outstanding, basic |
|
| 7,828,316 |
|
|
| 7,163,223 |
|
|
| 6,926,257 |
|
|
| 6,289,481 |
|
|
| 4,629,255 |
|
Average shares outstanding, diluted |
|
| 7,843,482 |
|
|
| 7,213,223 |
|
|
| 6,990,603 |
|
|
| 6,344,409 |
|
|
| 4,661,720 |
|
Total shares outstanding |
|
| 7,845,452 |
|
|
| 7,796,440 |
|
|
| 6,968,192 |
|
|
| 6,926,728 |
|
|
| 5,400,868 |
|
Basic Earnings Per Share |
| $ | 4.35 |
|
| $ | 7.35 |
|
| $ | 7.76 |
|
| $ | 5.07 |
|
| $ | 5.41 |
|
Diluted Earnings Per Share |
| $ | 4.34 |
|
| $ | 7.30 |
|
| $ | 7.69 |
|
| $ | 5.03 |
|
| $ | 5.37 |
|
Operating Diluted Earnings Per Share (a non-GAAP measure)* |
| $ | 5.12 |
|
| $ | 7.80 |
|
| $ | 7.81 |
|
| $ | 6.90 |
|
| $ | 6.20 |
|
Dividends Declared Per Share |
| $ | 2.68 |
|
| $ | 2.56 |
|
| $ | 2.38 |
|
| $ | 2.12 |
|
| $ | 2.04 |
|
Dividend payout ratio (1) |
|
| 62 | % |
|
| 35 | % |
|
| 31 | % |
|
| 42 | % |
|
| 38 | % |
|
|
|
|
|
|
|
|
|
|
|
|
|
|
| ||||||
Financial Condition Data |
|
|
|
|
|
|
|
|
|
|
|
|
|
|
| |||||
Total Assets |
| $ | 5,417,666 |
|
| $ | 5,559,737 |
|
| $ | 4,891,544 |
|
| $ | 3,949,297 |
|
| $ | 2,855,563 |
|
Total Deposits |
| $ | 4,321,178 |
|
| $ | 4,815,376 |
|
| $ | 4,331,152 |
|
| $ | 3,403,083 |
|
| $ | 2,358,878 |
|
Total Loans |
| $ | 4,021,544 |
|
| $ | 4,062,856 |
|
| $ | 3,319,106 |
|
| $ | 3,153,648 |
|
| $ | 2,226,728 |
|
Shareholders' Equity |
| $ | 534,573 |
|
| $ | 517,552 |
|
| $ | 437,837 |
|
| $ | 401,732 |
|
| $ | 286,561 |
|
Book Value Per Share |
| $ | 68.14 |
|
| $ | 66.38 |
|
| $ | 62.83 |
|
| $ | 58.00 |
|
| $ | 53.06 |
|
Tangible Book Value Per Share (a non-GAAP measure)* |
| $ | 59.08 |
|
| $ | 57.15 |
|
| $ | 55.01 |
|
| $ | 50.07 |
|
| $ | 46.66 |
|
|
|
|
|
|
|
|
|
|
|
|
|
|
|
| ||||||
Performance Ratios |
|
|
|
|
|
|
|
|
|
|
|
|
|
|
| |||||
Return on Average Assets |
|
| 0.62 | % |
|
| 1.03 | % |
|
| 1.24 | % |
|
| 0.91 | % |
|
| 0.97 | % |
Operating Return on Average Assets (a non-GAAP measure)* |
|
| 0.73 | % |
|
| 1.10 | % |
|
| 1.26 | % |
|
| 1.25 | % |
|
| 1.12 | % |
Return on Average Shareholders' equity |
|
| 6.50 | % |
|
| 11.56 | % |
|
| 12.93 | % |
|
| 9.09 | % |
|
| 11.40 | % |
Operating Return on Tangible Common Equity (a non-GAAP measure)* |
|
| 8.86 | % |
|
| 14.18 | % |
|
| 15.10 | % |
|
| 14.38 | % |
|
| 14.80 | % |
Total Shareholders’ Equity to Total Assets |
|
| 9.87 | % |
|
| 9.31 | % |
|
| 8.95 | % |
|
| 10.17 | % |
|
| 10.04 | % |
Interest rate spread (2) |
|
| 1.53 | % |
|
| 2.72 | % |
|
| 3.05 | % |
|
| 3.52 | % |
|
| 2.93 | % |
Net Interest Margin, taxable equivalent (3) |
|
| 2.30 | % |
|
| 2.92 | % |
|
| 3.12 | % |
|
| 3.65 | % |
|
| 3.22 | % |
Efficiency ratio * |
|
| 70.89 | % |
|
| 59.27 | % |
|
| 58.32 | % |
|
| 61.40 | % |
|
| 67.92 | % |
Operating Efficiency Ratio (a non-GAAP measure)* |
|
| 66.47 | % |
|
| 57.99 | % |
|
| 57.67 | % |
|
| 56.66 | % |
|
| 63.78 | % |
|
|
|
|
|
|
|
|
|
|
|
|
|
|
| ||||||
Wealth Management Assets |
|
|
|
|
|
|
|
|
|
|
|
|
|
|
| |||||
Market Value of Assets Under Management & Administration |
| $ | 4,595,209 |
|
| $ | 4,059,819 |
| $ | 4,853,119 |
| $ | 4,167,903 |
| $ | 3,452,852 |
| |||
|
|
|
|
|
|
|
|
|
|
|
|
|
|
| ||||||
Asset Quality |
|
|
|
|
|
|
|
|
|
|
|
|
|
|
| |||||
Non-Performing Loans |
| $ | 16,567 |
|
| $ | 6,542 |
|
| $ | 5,386 |
|
| $ | 8,962 |
|
| $ | 5,651 |
|
Non-Performing Loans/Total Loans |
|
| 0.41 | % |
|
| 0.16 | % |
|
| 0.16 | % |
|
| 0.28 | % |
|
| 0.25 | % |
Net Loan (Charge-Offs) Recoveries |
| $ | (70 | ) |
| $ | 53 |
|
| $ | 154 |
|
| $ | (439 | ) |
| $ | (1,592 | ) |
Allowance/Total Loans |
|
| 0.97 | % |
|
| 0.93 | % |
|
| 1.04 | % |
|
| 1.14 | % |
|
| 0.82 | % |
|
|
|
|
|
|
|
|
|
|
|
|
|
|
| ||||||
Capital Ratios (4): |
|
|
|
|
|
|
|
|
|
|
|
|
|
|
| |||||
Total capital |
|
| 14.13 | % |
|
| 13.52 | % |
|
| 13.56 | % |
|
| 13.93 | % |
|
| 13.61 | % |
Tier 1 capital |
|
| 13.03 | % |
|
| 12.45 | % |
|
| 12.40 | % |
|
| 12.68 | % |
|
| 12.70 | % |
Common Equity Tier 1 |
|
| 13.03 | % |
|
| 12.45 | % |
|
| 12.40 | % |
|
| 12.68 | % |
|
| 12.70 | % |
Tier 1 leverage capital |
| 8.90 | % |
| 8.51 | % |
|
| 8.31 | % |
|
| 8.89 | % |
|
| 8.98 | % | ||
|
|
|
|
|
|
|
|
|
|
|
|
|
|
| ||||||
Other Data: |
|
|
|
|
|
|
|
|
|
|
|
|
|
|
| |||||
Number of full-service offices |
| 22 |
|
| 22 |
|
| 19 |
|
| 21 |
|
| 16 |
| |||||
Full time equivalent employees |
|
| 407 |
|
|
| 440 |
|
| 384 |
|
| 372 |
|
| 303 |
| |||
* See “GAAP to Non-GAAP Reconciliations” section below
30
Results of Operations
Results of Operations for the years ended December 31, 20172023 and 20162022
General. Net income decreased by $2.1$18.8 million, or 12.3%35.5%, to $14.8$34.1 million for the year ended December 31, 2017,2023, from $16.9$52.9 million for the year ended December 31, 2016. The decrease was2022, primarily due to a $4.8$19.4 million increase in income tax expense and a $2.5 million increase in noninterest expense, partially offset by a $3.7 million increase in net interest and dividend income after the provision for loan losses, and a $1.6 million increase in noninterest income. The increase in income tax expense was mainly due to the enactment of the Tax Act. The change in tax law will reduce the statutory federal tax rate from 35% to 21% effective in 2018 and required the Company to take a one-time non-cash write-down of its net deferred tax assets of $3.9 million, as these deferred tax assets were required to be re-measured using the new lower tax rate in 2017.
Net Interest and Dividend Income. Net interest and dividend income after provision for loan losses increased by $3.7 million, or 6.9% to $57.2 million for the year ended December 31, 2017, from $53.5 million for the year ended December 31, 2016. The increasedecrease in net interest and dividend income after provision for loancredit losses, was primarily due to higher average loan balances. Interest on loans increaseda $4.8 million increase in noninterest expenses, (including $7.2 million in merger expenses), partially offset by $3.0a $6.8 million or 6.1%decrease in income tax expense.
Diluted earnings per share were $4.34 for the year ended December 31, 2017, as compared to2023, representing a 40.5% decrease over diluted earnings per share of $7.30 for the year ended December 31, 2016. Total2022.
Net Interest and Dividend Income. Net interest and dividend income before the provision for credit losses decreased by $22.4 million, or 15.6%, to $120.8 million for the year ended December 31, 2023, as compared to $143.2 million for the year ended December 31, 2022. This decrease was primarily due to higher costs of funds, partially offset by an increase in average interest-earningearning assets and higher yields on earning assets.
Average interest earning assets increased $97.9by $309.7 million, or 5.7%6.3%, to $1.8$5.25 billion for the year ended December 31, 20172023 from $1.7$4.94 billion in 2016.2022, primarily due to growth within the loan portfolio from the Northmark Merger, partially offset by a lower investment portfolio. The Company’s net interest margin, on a fully tax equivalent basis, increased fourdecreased 62 basis points to 3.25%2.30% for the year ended December 31, 2017,2023, as compared to 3.21%2.92% in 2016, and the net interest rate spread2022.
Average interest-bearing liabilities increased four basis pointsby $566.7 million, or 18.0%, to 3.16%$3.71 billion for the year ended December 31, 2017,2023 from $3.14 billion in 2022, primarily due to growth in average deposits from the Northmark Merger, inclusive of wholesale deposits, and an increase in average borrowed funds. The Company experienced an increase in average checking account balances of $337.3 million, an increase in average retail certificates of deposit of $476.6 million, and an increase in average borrowed funds of $168.8 million. They were partially offset by decreases in average savings deposit balances of $267.7 million and a decrease in average money market accounts of $148.3 million.
The average cost of funds increased to 1.86% for the year ended December 31, 2023, as compared to 3.12% in 2016.0.34% for the year endedDecember 31, 2022.
Interest and Dividend Income. Total interest and dividend income increased by $4.2$58.5 million, or 7.3%36.6%, to $61.2$218.5 millionfor the year ended December 31, 2023, as compared to $160.0 millionin 2022, primarily due to higher yielding assets coupled with growth within the loan portfolio.
Interest Expense.Interest expense increased by $81.0 million, or 482.5% to $97.7 million for the year ended December 31, 2017, from $57.02023, as compared to$16.8 million in 2016. The2022, primarily driven by an increase in interestthe cost of deposits and dividend income was primarily due tohigher borrowing expense.
Provision for Credit Losses. The Company recorded a $3.0 million increase in interest income on loans and a $1.0 million increase in interest income on investment securities. Total average interest-earning assets increased $97.9 million, or 5.7%, to $1.8 billionprovision for credit losses of $904,000 for the year ended December 31, 2017 from $1.7 billion in 2016.
Interest Expense. Interest expense increased by $232,000, or 6.9%,2023, as compared to $3.6a provision for credit losses of $3.9 million for the year ended December 31, 2017, from $3.42022, which included $2.2 million in 2016. The increase was primarilyfor the recognition of the CECL merger accounting impact as a result of a $69.5 million increase in the average balance of interest-bearing liabilities. The average cost of interest bearing liabilities remained unchanged from 2016 and stood at 0.29%.Northmark merger.
Provision for Loan Losses. The Company recorded a provision fornet loan lossescharge-offs of $362,000$70,000 or 0.00% of total loans, for the year ended December 31, 2017,2023, as compared to a provision for loan lossesnet recoveries of $132,000 in 2016. We recorded net charge-offs $53,000, or 0.00%of $303,000total loans for the year ended December 31, 2017, compared to net charge-offs of $62,000 during 2016. 2022.
The allowance for loancredit losses for loans was $15.3$38.9 million, or 1.13%0.97% of total loans outstanding at December 31, 2017,2023, as compared to $15.3$37.8 million, or 1.16%0.93% of total loans outstanding at year end 2016.December 31, 2022.
31
Noninterest Income. Noninterest Total noninterest income increaseddecreased by $1.6$1.3 million, or 5.5%3.0%, to $30.2$41.7 million for the year ended December 31, 2017,2023, as compared to $28.7$43.0 million for the year ended December 31, 2016,2022. This change was primarily the result of lower bank owned life insurance (“BOLI”) income, lower other income, and lower loan related derivative income, partially offset by higher deposit account fees. Noninterest income was 25.7% and 23.1% of total revenue for the year ended December 31, 2023 and 2022, respectively.
The categories of wealth managementWealth Management revenues are shown in the following table:
|
| For the Year Ended December 31, |
| |||||||||||||
|
| 2017 |
|
| 2016 |
|
| For the Year Ended December 31, |
| |||||||
|
| (dollars in thousands) |
|
| 2023 |
|
| 2022 |
| |||||||
Wealth management revenues: |
|
|
|
|
|
|
|
| ||||||||
|
| (dollars in thousands) |
| |||||||||||||
Wealth Management revenues: |
|
|
|
|
|
| ||||||||||
Trust and investment advisory fees |
| $ | 21,850 |
|
| $ | 19,346 |
|
| $ | 31,743 |
|
| $ | 31,992 |
|
Asset-based revenues |
|
| 21,850 |
|
|
| 19,346 |
| ||||||||
Financial planning fees and other service fees |
|
| 1,179 |
|
|
| 1,043 |
|
|
| 1,261 |
|
|
| 1,042 |
|
Total wealth management revenues |
| $ | 23,029 |
|
| $ | 20,389 |
|
| $ | 33,004 |
|
| $ | 33,034 |
|
The following table presents the changes in wealth management assets under management:
|
| For the Year Ended December 31, |
| |||||
|
| 2023 |
|
| 2022 |
| ||
|
| (dollars in thousands) |
| |||||
Wealth management assets under management |
|
|
|
|
|
| ||
Balance at the beginning of the period |
| $ | 3,875,747 |
|
| $ | 4,656,183 |
|
Gross client asset inflows |
|
| 583,196 |
|
|
| 699,466 |
|
Gross client asset outflows |
|
| (643,924 | ) |
|
| (917,636 | ) |
Net market impact |
|
| 511,133 |
|
|
| (562,266 | ) |
Balance at the end of the period |
| $ | 4,326,152 |
|
| $ | 3,875,747 |
|
Weighted average management fee |
|
| 0.78 | % |
|
| 0.78 | % |
|
| For the Year Ended December 31, |
| |||||
|
| 2017 |
|
| 2016 |
| ||
|
| (dollars in thousands) |
| |||||
Wealth management assets under management |
|
|
|
|
|
|
|
|
Balance at the beginning of the period |
| $ | 2,572,760 |
|
| $ | 2,329,208 |
|
Gross client asset inflows |
|
| 445,125 |
|
|
| 506,173 |
|
Gross client asset outflows |
|
| (371,274 | ) |
|
| (312,604 | ) |
Net investment appreciation & income |
|
| 324,711 |
|
|
| 49,983 |
|
Balance at the end of the period |
| $ | 2,971,322 |
|
| $ | 2,572,760 |
|
Weighted average management fee |
|
| 0.80 | % |
|
| 0.79 | % |
32
There were no significant changes to the average fee rates and fee structure forduring the yearyears ended December 31, 2017 and 2016.2023 or 2022.
Noninterest Expense. NoninterestTotal noninterest expense increased by $2.5$4.8 million, or 4.5%4.4%, to $59.3$115.2 million for the year ended December 31, 2017,2023, as compared to $56.8$110.4 million in 2016, primarily driven by higher salaries and benefits expense and professional services. The increase in salaries and benefits expense of $2.2 million is primarily due to annual merit increases, increased staffing to support business initiatives, and higher employee benefit costs. The increase in professional services of $980,000 is a result of increased recruitment fees, legal costs, audits and exams, compensation consulting, marketing consulting, training and development, and costs associated with the registration of our securities with the SEC.
Noninterest expense increases were partially offset by decreases in occupancy and equipment expense of $217,000 and lower FDIC insurance expense of $205,000 for the year ended December 31, 2017,2022, primarily driven by an increase in non-operating expense and FDIC insurance expense, partially offset by lower professional fees, lower marketing expense, and lower salary and benefits expense.
Income Tax Expense. The Company recorded a provision for income taxes of $12.3 million for the twelve months ended December 31, 2023, a decrease of $6.8 million, as compared to 2016.$19.1 million for the twelve months ended December 31, 2022. The effective tax rate was 26.5%, for both the twelve months ended December 31, 2023 and the twelve months ended December 31, 2022.
Income Tax
Results of Operations for the years ended December 31, 2022 and 2021
General. Net income decreased by $1.1 million, or 2.1%, to $52.9 million for the year ended December 31, 2022, from $54.0 million for the year ended December 31, 2021, primarily due to a $9.9 million increase in noninterest expenses including $1.9 million in merger expenses, and a $5.2 million increase in the provision for credit losses, partially offset by a $15.2 million increase in net interest and dividend income before the provision for credit losses.
Diluted earnings per share were $7.30 for the year ended December 31, 2022, representing a 5.1% decrease over diluted earnings per share of $7.69 for the year ended December 31, 2021.
Net Interest and Dividend Income. Net interest and dividend income before the provision for (release of) credit losses increased by $15.2 million, or 11.9%, to $143.2 million for the year ended December 31, 2022, as compared to $128.0 million for the year ended December 31, 2021. This increase was primarily due to an increase in average earning assets (both organic and as a result of the Northmark Merger) and higher asset yields, partially offset by a decrease in Paycheck Protection Program (“PPP”) loan income, lower loan accretion associated with merger accounting, and higher costs of funds.
33
Average interest earning assets increased by $810.7 million, or 19.6%, to $4.94 billion for the year ended December 31, 2022 from $4.13 billion in 2021, primarily due to the Northmark Merger combined with organic growth within the loan and investment securities portfolios. The Company’s net interest margin, on a fully tax equivalent basis, decreased 20 basis points to 2.92% for the year ended December 31, 2022, as compared to 3.12% in 2021.
Average interest-bearing liabilities increased by $516.4 million, or 19.7%, to $3.14 billion for the year ended December 31, 2022 from $2.63 billion in 2021, primarily due to the Northmark Merger. The Company experienced an increase in average money market accounts of $400.8 million, an increase in average checking account balances of $77.2 million, an increase in average borrowed funds of $67.1 million, and an increase in retail certificates of deposit of $31.2 million, partially offset by a decrease in average savings deposit balances of $59.9 million.The average cost of funds increased to 0.34% for the year ended December 31, 2022, as compared to 0.13% for the year endedDecember 31, 2021.
Interest and Dividend Income. Total interest and dividend income increased by $26.5 million, or 19.8%, to $160.0 million for the year ended December 31, 2022, as compared to $133.5 million in 2021, primarily due to growth within the loans and investment securities portfolios, partially offset by lower PPP loan related income and lower loan accretion associated with merger accounting.
Interest Expense. In accordance withInterest expense increased by $11.2 million, or 203.2% to $16.8 million for the Tax Act,year ended December 31, 2022, as compared to $5.5 million in 2021, primarily driven by an increase in the cost of deposits and higher borrowing expense.
Provision for Credit Losses. The Company re-measured its net deferred tax assets which resulted inrecorded a one-time non-cash write-down of its net deferred tax assets and recognized an additional income tax expenseprovision for credit losses of $3.9 million for the year ended December 31, 2017. The Company recorded2022, as compared to a provision for income taxesrelease of $13.4credit losses of $1.3 million for the year ended December 31, 2017, compared to a provision for income taxes of $8.62021, which included $2.2 million for 2016, reflecting effective tax ratesthe recognition of 47.41%, and 33.62%, respectively. the CECL merger accounting impact as a result of the Northmark merger, inclusive of unfunded commitments.
The Company also recognized $221,000recorded net recoveries of tax benefit resulting from the adoption$53,000 or 0.00% of new accounting guidance for share-based payments during 2017.
Results of Operationstotal loans, for the yearsyear ended December 31, 2016 and 20152022, as compared to net recoveries of $154,000, or 0.00% of total loans for the year ended December 31, 2021.
General. Net income increased $1.2
The allowance for credit losses for loans was $37.8 million, or 7.7%0.93% of total loans outstanding at December 31, 2022, as compared to $34.5 million, or 1.04% of total loans outstanding at December 31, 2021.
Noninterest Income. Inclusive of the Northmark Merger, total noninterest income decreased by $1.3 million, or 3.0%, to $16.9$43.0 million for the year ended December 31, 2016, from $15.72022, as compared to $44.3 million the year ended December 31, 2021. This was primarily the result of lower wealth management revenue, lower loan related derivative income, and lower gains on loans sold. These items were partially offset by higher bank owned life insurance income, higher deposit account fees, and higher other income.Noninterest income was 23.1% and 25.7% of total revenue for the year ended December 31, 2022 and 2021, respectively.
Net Interest and Dividend Income. Net interest and dividend income after provision for loan losses increased by $3.0 million to $53.5$35.0 million for the year ended December 31, 2016, from $50.62021, primarily due to decline in both the bond and equity markets. Wealth Management Assets Under Management and Administration were $4.1 billion at December 31, 2022, as compared to $4.9 billion at December 31, 2021.
Interest and Dividend Income. Total interest and dividend incomepolicy surrender.
Interest Expense. Interest expense increased $661,000,$844,000, or 24.5%41.7%, to $3.4$2.9 million for the yeartwelve months ended December 31, 2016, from $2.72022, as compared to $2.0 million for the yeartwelve months ended December 31, 2015. The increase was driven by a $76.8 million increase in the average balance of interest-bearing liabilities as well an increase in the average cost of interest bearing liabilities of four basis points to 0.29% from 0.25%.
Interest expense on interest-bearing deposits increased by $801,000 to $3.3 million for the year ended December 31, 2016, from $2.5 million for the year ended December 31, 2015. This increase was2021, primarily due to an increase of $151.9 millionequity warrant revenue and success fees associated with Innovation Banking loans, in the average balance of interest-bearing depositsaddition to $1.2 billion at December 31, 2016, from $1.0 billion at December 31, 2015. The average cost of interest-bearing deposits remained low at 0.28% for the year ended December 31, 2016, compared to 0.24% for the year ended December 31, 2015. The average cost of certificates of deposits increased slightly during the year ended December 31, 2016 as compared to the year ended December 31, 2015, and we experienced an increase in the average cost of savings accounts for the year ended December 31, 2016, as compared to the year ended December 31, 2015 as the Bank has been able to grow these products and attract new relationships.
Provision for Loan Losses. The Company recordedgains recognized on a provision for loan losses of $132,000 for the year ended December 31, 2016, compared to a provision for loan losses of $1.1 million for the year ended December 31, 2015. The decrease in provision expense is primarily due to the change in the allowance methodology that occurred during 2016. We recorded net charge-offs of $62,000 for the year ended December 31, 2016, compared to net charge-offs of $153,000 during the year ended December 31, 2015. The allowance for loan losses was $15.3 million, or 1.16% of total loans, at December 31, 2016, compared to $15.2 million, or 1.27% of total loans, at December 31, 2015.community development fund investment.
Noninterest Income. Noninterest income increased $2.8 million to $28.7 million in 2016, compared to $25.9 million in 2015. The Company’s wealth management revenue is the largest component of noninterest income and increased by $1.1 million, or 6.0%, to $20.4 million compared, to $19.2 million for 2015. Assets under Management combined with Assets under Administration were $2.7 billion at year-end 2016, compared to $2.4 billion at year-end 2015.34
The categories of wealth managementWealth Management revenues are shown in the following table:
|
| For the Year Ended December 31, |
| |||||||||||||
|
| 2016 |
|
| 2015 |
| For the Year Ended December 31, | |||||||||
|
| (dollars in thousands) |
| 2022 | 2021 | |||||||||||
Wealth management revenues: |
|
|
|
|
|
|
|
| ||||||||
(dollars in thousands) | ||||||||||||||||
Wealth Management revenues: | ||||||||||||||||
Trust and investment advisory fees |
| $ | 19,346 |
|
| $ | 18,388 |
| $ | 31,992 | $ | 34,092 | ||||
Asset-based revenues |
|
| 19,346 |
|
|
| 18,388 |
| ||||||||
Financial planning fees and other service fees |
|
| 1,043 |
|
|
| 854 |
| 1,042 | 945 | ||||||
Total wealth management revenues |
| $ | 20,389 |
|
| $ | 19,242 |
| $ | 33,034 | $ | 35,037 | ||||
The following table presents the changes in wealth management assets under management:
For the Year Ended December 31, | ||||||||
2022 | 2021 | |||||||
(dollars in thousands) | ||||||||
Wealth management assets under management | ||||||||
Balance at the beginning of the period | $ | 4,656,183 | $ | 3,994,152 | ||||
Acquired wealth management assets | — | — | ||||||
Gross client asset inflows | 699,466 | 532,507 | ||||||
Gross client asset outflows | (917,636 | ) | (442,679 | ) | ||||
Net market impact | (562,266 | ) | 572,203 | |||||
Balance at the end of the period | $ | 3,875,747 | $ | 4,656,183 | ||||
Weighted average management fee | 0.78 | % | 0.79 | % | ||||
|
| For the Year Ended December 31, |
| |||||
|
| 2016 |
|
| 2015 |
| ||
|
| (dollars in thousands) |
| |||||
Wealth management assets under management |
|
|
|
|
|
|
|
|
Balance at the beginning of the period |
| $ | 2,329,208 |
|
| $ | 2,290,227 |
|
Gross client asset inflows |
|
| 506,173 |
|
|
| 382,026 |
|
Gross client asset outflows |
|
| (312,604 | ) |
|
| (374,692 | ) |
Net investment appreciation & income |
|
| 49,983 |
|
|
| 31,647 |
|
Balance at the end of the period |
| $ | 2,572,760 |
|
| $ | 2,329,208 |
|
Weighted average management fee |
|
| 0.79 | % |
|
| 0.79 | % |
There were no significant changes to the average fee rates and fee structure forduring the yearyears ended December 31, 2016 and 2015.2022 or 2021.
Noninterest Expense. NoninterestTotal noninterest expense, inclusive of the Northmark Merger, increased $3.6by $9.9 million, or 9.9%, to $56.8$110.4 million for the year ended December 31, 2016, from $53.22022, as compared to $100.5 million for the year ended December 31, 2015. This increase was2021, primarily driven by increases in salaries and employee benefits expense, data processing expense, nonoperating expenses, and FDIC expense, partially offset by decreases in professional services and marketing expense.
Income Tax Expense. The Company recorded a provision for income taxes of $8.6$19.1 million for both the years ended December 31, 2022, and December 31, 2021. The effective tax rate was 26.5%, for the year ended December 31, 2016,2022, as compared to a provision for income taxes of $7.6 million26.1% for the year ended December 31, 2015, reflecting effective tax rates of 33.62% and 32.49%, respectively. The effective tax rate was reduced from the statutory federal income tax rate of 35% largely as a result of the benefits of tax-exempt income, partially offset by state income tax expense. The effective tax rate for the year ended December 31, 2016, as compared to the effective tax rate for the year ended December 31, 2015, increased primarily as a result of higher state income tax expense.
Results of Operations for the years ended December 31, 2015 and 2014
General. Net income increased $750,000, or 5.0%, to $15.7 million for the year ended December 31, 2015, from $14.9 million for the year ended December 31, 2014.2021. The increase was primarily due to the tax effects of a $3.8 million increaseBOLI policy surrender and death benefit claim during the second fiscal quarter of 2022 and the impact of non-deductible merger related expenses.
35
Changes in net interest and dividend income after the provision for loan losses, a $1.4 million increase in noninterest income, partially offsetFinancial Condition
Total Assets. Total assets decreased by a $4.2 million increase in noninterest expense, and a $315,000 increase in income tax expense.
Net Interest and Dividend Income. Net interest and dividend income after provision for loan losses increased by $3.8 million to $50.6 million for the year ended December 31, 2015, from $46.7 million for the year ended December 31, 2014. The increase in net interest and dividend income after provision for loan losses was primarily due to strong loan growth in both 2015 and 2014. Interest income on loans increased by $4.9$142.1 million, or 12.0%. Total average interest-earning assets increased to $1.7 billion for the year ended December 31, 2015,2.6%, from $1.5 billion for the year ended December 31, 2014. The Company’s net interest margin, on a fully taxable basis, decreased five basis points to 3.32% for the year ended December 31, 2015, compared to 3.37% for the year ended December 31, 2014, and the net interest rate spread decreased seven basis point to 3.24% for the year ended December 31, 2015, compared to 3.31% for the year ended December 31, 2014.
Interest and Dividend Income. Total interest and dividend income increased $4.0 million, or 7.9%, to $54.3 million for the year ended December 31, 2015, from $50.4 million for the year ended December 31, 2014. The increase in interest and dividend income was primarily due to a $4.9 million increase in interest income on loans partially offset by a $1.1 million decrease in interest income on investment securities. The increase in interest income on loans resulted primarily from a $152.6 million increase in the average balance of loans.
Interest Expense. Interest expense increased $596,000, or 28.4%, to $2.7 million for the year ended December 31, 2015, from $2.1 million for the year ended December 31, 2014. The increase was driven by an $84.0 million increase in the average balance of interest-bearing liabilities as well an increase in the average cost of interest bearing liabilities of four basis points to 0.25% from 0.21%.
Interest expense on interest-bearing deposits increased by $509,000 to $2.5 million for the year ended December 31, 2015, from $2.0 million for the year ended December 31, 2014. This increase was primarily due to an increase of $71.4 million in the average balance of interest-bearing deposits to $1.0$5.56 billion at December 31, 2015, from $937.0 million at2022, and were $5.42 billion as of December 31, 2014. The average cost of interest-bearing deposits remained low at 0.24% for the year ended December 31, 2015, compared to 0.21% for the year ended December 31, 2015. The average cost of certificates of deposits increased slightly during the year ended December 31, 2015, as compared to the year ended December 31, 2014, and we experienced an increase in the average cost of savings accounts for the year ended December 31, 2015, as compared to the year ended December 31, 2014 as the Bank was able to grow these products and attract new relationships.2023.
Provision for Loan Losses. The Company recorded a provision for loan losses of $1.1 million for the year ended December 31, 2015, compared to a provision for loan losses of $1.6 million for the year ended December 31, 2014. We recorded net charge-offs of $153,000 for the year ended December 31, 2015, compared to net recoveries of $11,000 during the year ended December 31, 2014. The allowance for loan losses was $15.2 million, or 1.27% of total loans, at December 31, 2015, compared to $14.3 million, or 1.32% of total loans, at December 31, 2014.
Noninterest Income. Noninterest income increased $1.4 million to $25.9 million in 2015, compared to $24.5 million in 2014. The Company’s wealth management revenue is the largest component of noninterest income and increased by $1.3 million, or 7.2%, to $19.2 million, compared to $17.9 million for 2014. Assets under Management combined with Assets under Administration were $2.4 billion at year-end 2015 compared to $2.4 billion at year-end 2014.
The categories of wealth management revenues are shown in the following table:
|
| For the Year Ended December 31, |
| |||||
|
| 2015 |
|
| 2014 |
| ||
|
| (dollars in thousands) |
| |||||
Wealth management revenues |
|
|
|
|
|
|
|
|
Trust and investment advisory fees |
| $ | 18,388 |
|
| $ | 17,104 |
|
Asset-based revenues |
|
| 18,388 |
|
|
| 17,104 |
|
Financial planning fees and other service fees |
|
| 854 |
|
|
| 850 |
|
Total wealth management revenues |
| $ | 19,242 |
|
| $ | 17,954 |
|
The following table presents the changes in wealth management assets under management:
|
| For the Year Ended December 31, |
| |||||
|
| 2015 |
|
| 2014 |
| ||
|
| (dollars in thousands) |
| |||||
Wealth management assets under management |
|
|
|
|
|
|
|
|
Balance at the beginning of the period |
| $ | 2,290,227 |
|
| $ | 2,139,752 |
|
Gross client asset inflows |
|
| 382,026 |
|
|
| 342,754 |
|
Gross client asset outflows |
|
| (374,692 | ) |
|
| (287,205 | ) |
Net investment appreciation & income |
|
| 31,647 |
|
|
| 94,926 |
|
Balance at the end of the period |
| $ | 2,329,208 |
|
| $ | 2,290,227 |
|
|
|
|
|
|
|
|
|
|
Weighted average management fee |
|
| 0.79 | % |
|
| 0.76 | % |
There were no significant changes to the average fee rates and fee structure for the year ended December 31, 2015 and 2014.
Noninterest Expense. Noninterest expense increased $4.2 million to $53.2 million for the year ended December 31, 2015, from $49.0 million for the year ended December 31, 2014. The increase in salary and benefits of $3.0 million is primarily due to higher retirement plan expenses, annual merit increases, and higher health care costs. The increase of $514,000 in occupancy and equipment for the year is the result of increased cost of facilities and amortization of leasehold improvements and higher software maintenance costs. The increase of $263,000 in marketing expense is primarily the result of additional marketing initiatives in 2015. The increase of $252,000 in professional services is primarily the result of higher consulting fees. The increase of $240,000 in data processing expense is largely attributable to increased transaction volumes and new products.
Income Tax Expense. The Company recorded a provision for income taxes of $7.6 million for the year ended December 31, 2015, compared to a provision for income taxes of $7.2 million for the year ended December 31, 2014, reflecting effective tax rates of 32.49% and 32.63%, respectively. The effective tax rate was reduced from the statutory federal income tax rate of 35% largely as a result of the benefits of tax-exempt income, partially offset by state income tax expense.
Changes in Financial Condition
Total Assets. Total assets increased $100.9 million, or 5.5%, to $1.9 billion at December 31, 2017, from $1.8 billion at December 31, 2016. The increase was primarily the result of a $49.5 million, or 91.7% increase in cash and cash equivalents and a $30.7 million, or 2.4% increase in net loans.
Cash and Cash Equivalents. Cash and cash equivalents increased by $49.5$2.3 million, to $103.6or 7.4%, from $30.7 million at December 31, 2017, from $54.12022 to $33.0 million at December 31, 2016.2023.
Investment Securities. The carrying value ofCompany’s total investment securities portfolio decreased by $108.2 million, or 9.0%, from $1.21 billion at December 31, 2022 to $1.10 billion at December 31, 2023, primarily due to investment paydowns during the period.
Loans. Total loans decreased by $41.3 million, or 1.0%, to $4.02 billion at December 31, 2023, from $4.06 billion at December 31, 2022.
Loans Held for Sale. Loans held for sale decreased to $0 at December 31, 2017 from $6.5$343.7 million at December 31, 2016. The balance of loans held for sale usually relates to the timing and volume of residential loans originated for sale and the ultimate sale transaction which is typically executed within a short-time following the loan origination.
Loans. Net loans increased by $30.72023, from $350.7 million or 2.4%, to $1.3 billion at December 31, 2017, from $1.3 billion2022.
Bank-Owned Life Insurance. The Company invests in bank-owned life insuranceBOLI to help offset the costs of our employee benefit plan obligations. Bank-owned life insuranceBOLI also generally provides noninterest income that is nontaxable. At December 31, 2017,2023, our investment in bank-owned life insurance was $31.1BOLI increased by $781,000, or 2.3%, to $35.3 million, an increase of $584,000 from $30.5$34.5 million at December 31, 2016,2022, primarily due to the increases in the cash surrender value of the policies.policies during the twelve months ended 2023.
Deposits. Deposits increased $89.4
Goodwill and Merger Related intangibles. Goodwill and merger related intangible assets totaled $71.0 million and $72.0 million at December 31, 2023 and December 31, 2022, respectively.
Other Assets. Other assets decreased by $1.9 million, or 5.3%1.8% to $103.4 million at December 31, 2023, from $105.3 million at December 31, 2022, primarily due to the change in fair value of loan level derivative assets.
Deposits. Total deposits, excluding wholesale deposits, decreasedby $404.3 million, or 9.1%, to $1.8$4.03 billion at December 31, 2017,2023, from $1.7$4.43 billion at December 31, 2016. The increase was2022. Total deposits, inclusive of wholesale deposits, decreased by $494.2 million, or 10.3%, to $4.32 billion at December 31, 2023, as compared to $4.82 billion at December 31, 2023, primarily due to a $50.6lower money market balances, lower savings account balance, and lower wholesale deposit balances.
Borrowings.0.32% for the year ended December 31, 2022, an increase of 153 basis points. The cost of total deposits excluding wholesale deposits was 1.54% for the year ended December 31, 2023, as compared to 0.26% for the year ended December 31, 2022, an increase of 128 basis points. At December 31, 2017,2023, the spot cost of non-wholesale deposits was 1.88%, an increase of 108 basis points as compared to 0.80% at December 31, 2022.
Borrowings. At December 31, 2023, borrowings consisted primarily of advances from the FHLB of Boston. At December 31, 2022, borrowings consisted primarily of advances from the FHLB of Boston and reverse repurchase agreements. Total borrowings decreased $167,000increased by $346.9 million, or 329.8%, to $3.6$452.2 millionat December 31, 2023, from $105.2 million at December 31, 2017, from $3.72022, as the Company migrated wholesale funding toward FHLB Boston borrowings.
Shareholders’ Equity. Total shareholders’ equity increased $17.0 million, or 3.3%, to $534.6 million at December 31, 2016.
Shareholders’ Equity. Total shareholders’ equity increased $13.3 million, or 9.9%, to $148.02023, from $517.6 million at December 31, 2017, from $134.72022, primarily due to net income of $34.1 million, a decrease in unrealized losses on the available for sale investment portfolio of $3.1 million, partially offset by dividend payments of $21.0 million.
36
The Company’s book value per share increased by $1.76 to $68.14 at December 31, 2016.2023, as compared to $66.38 at December 31, 2022. The increaseCompany’s ratio of tangible common equity to tangible assets increased 55 basis points to 8.67% at December 31, 2023, as compared to 8.12% at December 31, 2022. Tangible book value per share grew by $1.93, or 3.4%, to $59.08 as of December 31, 2023, as compared to $57.15 as of December 31, 2022.
GAAP to Non-GAAP Reconciliations (dollars in thousands except per share data)
Statement on Non-GAAP Measures: The Company believes the presentation of the following non-GAAP financial measures provides useful supplemental information that is essential to an investor’s proper understanding of the resultresults of operations and financial condition of the Company. Management uses non-GAAP financial measures in its analysis of the Company’s performance. These non-GAAP measures should not be viewed as substitutes for the financial measures determined in accordance with GAAP, nor are they necessarily comparable to non-GAAP performance measures that may be presented by other companies.
The following table summarizes the calculation of the Company’s operating net income and operating diluted earnings per share:
|
| For the Year Ended December 31, |
| |||||||||||||||||
Operating Net Income / Operating Diluted Earnings Per Share |
|
|
|
|
|
|
|
|
|
|
|
|
|
|
| |||||
|
| 2023 |
|
| 2022 |
|
| 2021 |
|
| 2020 |
|
| 2019 |
| |||||
|
| (dollars in thousands, except share data) |
| |||||||||||||||||
|
|
|
|
|
|
|
|
|
|
|
|
|
|
|
| |||||
Net Income (a GAAP measure) |
| $ | 34,109 |
|
| $ | 52,909 |
|
| $ | 54,024 |
|
| $ | 31,959 |
|
| $ | 25,257 |
|
Less: Death benefits on bank owned life insurance ("BOLI") and policy surrender |
|
| — |
|
| $ | (1,157 | ) |
|
| — |
|
|
| — |
|
|
| — |
|
Add: Mergers and contractual termination expenses |
|
| 7,180 |
|
|
| 3,059 |
|
|
| 1,118 |
|
|
| 7,612 |
|
|
| 4,721 |
|
Add: Provision for credit losses for acquired loans |
|
| — |
|
|
| 2,239 |
|
|
| — |
|
|
| 8,638 |
|
|
| — |
|
Add: (Gain) loss on disposition of investment securities |
|
| — |
|
|
| — |
|
|
| — |
|
|
| (69 | ) |
|
| 79 |
|
Less: Tax effect of BOLI surrender |
|
| — |
|
|
| 736 |
|
|
| — |
|
|
| — |
|
|
| — |
|
Less: Tax effect of non-operating expenses (1) |
|
| (1,132 | ) |
|
| (1,237 | ) |
|
| (314 | ) |
|
| (4,270 | ) |
|
| (901 | ) |
Operating Net Income (a non-GAAP measure) |
| $ | 40,157 |
|
| $ | 56,549 |
|
| $ | 54,828 |
|
| $ | 43,870 |
|
| $ | 29,156 |
|
Less: Dividends and Undistributed Earnings Allocated |
|
| (36 | ) |
|
| (273 | ) |
|
| (252 | ) |
|
| (64 | ) |
|
| (243 | ) |
Operating Net Income Applicable to Common |
| $ | 40,121 |
|
| $ | 56,276 |
|
| $ | 54,576 |
|
| $ | 43,806 |
|
| $ | 28,913 |
|
Weighted Average Diluted Shares |
|
| 7,843,482 |
|
|
| 7,213,913 |
|
|
| 6,990,603 |
|
|
| 6,344,409 |
|
|
| 4,661,720 |
|
Operating Diluted Earnings Per Share |
| $ | 5.12 |
|
| $ | 7.80 |
|
| $ | 7.81 |
|
| $ | 6.90 |
|
| $ | 6.20 |
|
(1) The net tax benefit associated with non-operating items is determined by assessing whether each non-operating item is included or excluded from net taxable income and applying the Company’s combined marginal tax rate to only those items included in net taxable income.
The following tables summarize the calculation of the Company’s tangible common equity ratio and tangible book value per share for the periods indicated:
|
| December 31, 2023 |
|
| December 31, 2022 |
|
| December 31, 2021 |
|
| December 31, 2020 |
|
| December 31, 2019 |
| |||||
|
| (in thousands, except share data) |
| |||||||||||||||||
Tangible Common Equity: |
|
|
|
|
|
|
|
|
|
|
|
|
|
|
| |||||
Shareholders' equity (GAAP) |
| $ | 534,573 |
|
| $ | 517,552 |
|
| $ | 437,837 |
|
| $ | 401,732 |
|
| $ | 286,561 |
|
Less: Goodwill and acquisition related intangibles (GAAP) |
|
| (71,089 | ) |
|
| (71,982 | ) |
|
| (54,529 | ) |
|
| (54,889 | ) |
|
| (34,544 | ) |
Tangible Common Equity (a non-GAAP measure) |
| $ | 463,484 |
|
| $ | 445,570 |
|
| $ | 383,308 |
|
| $ | 346,843 |
|
| $ | 252,017 |
|
Total assets (GAAP) |
| $ | 5,417,666 |
|
| $ | 5,559,737 |
|
| $ | 4,891,544 |
|
| $ | 3,949,297 |
|
| $ | 2,855,563 |
|
Less: Goodwill and acquisition related intangibles (GAAP) |
|
| (71,089 | ) |
|
| (71,982 | ) |
|
| (54,529 | ) |
|
| (54,889 | ) |
|
| (34,544 | ) |
Tangible assets (a non-GAAP measure) |
| $ | 5,346,577 |
|
| $ | 5,487,755 |
|
| $ | 4,837,015 |
|
| $ | 3,894,408 |
|
| $ | 2,821,019 |
|
Tangible Common Equity Ratio (a non-GAAP measure) |
|
| 8.67 | % |
|
| 8.12 | % |
|
| 7.92 | % |
|
| 8.91 | % |
|
| 8.93 | % |
|
|
|
|
|
|
|
|
|
|
|
|
|
|
|
| |||||
Tangible Book Value Per Share: |
|
|
|
|
|
|
|
|
|
|
|
|
|
|
| |||||
Tangible Common Equity (a non-GAAP measure) |
| $ | 463,484 |
|
| $ | 445,570 |
|
| $ | 383,308 |
|
| $ | 346,843 |
|
| $ | 252,017 |
|
Common shares outstanding |
|
| 7,845,452 |
|
|
| 7,796,440 |
|
|
| 6,968,192 |
|
|
| 6,926,728 |
|
|
| 5,400,868 |
|
Tangible Book Value Per Share (a non-GAAP measure) |
| $ | 59.08 |
|
| $ | 57.15 |
|
| $ | 55.01 |
|
| $ | 50.07 |
|
| $ | 46.66 |
|
37
The following tables summarize the calculation of the Company’s efficiency and operating ratios for the periods indicated:
|
| For the Year Ended December 31, |
| |||||||||||||||||
|
|
|
|
|
|
|
|
|
|
|
|
|
|
|
| |||||
|
| 2023 |
|
| 2022 |
|
| 2021 |
|
| 2020 |
|
| 2019 |
| |||||
|
| (dollars in thousands) |
| |||||||||||||||||
Efficiency Ratio: (1) |
|
|
|
|
|
|
|
|
|
|
|
|
|
|
| |||||
Noninterest expense |
| $ | 115,223 |
|
| $ | 110,382 |
|
| $ | 100,484 |
|
| $ | 98,085 |
|
| $ | 78,175 |
|
Net interest and dividend income |
| $ | 120,806 |
|
| $ | 143,215 |
|
| $ | 127,981 |
|
| $ | 120,233 |
|
| $ | 78,696 |
|
Total noninterest income |
|
| 41,730 |
|
|
| 43,009 |
|
|
| 44,324 |
|
|
| 39,525 |
|
|
| 36,401 |
|
Total revenue |
| $ | 162,536 |
|
| $ | 186,224 |
|
| $ | 172,305 |
|
| $ | 159,758 |
|
| $ | 115,097 |
|
Efficiency Ratio |
|
| 70.89 | % |
|
| 59.27 | % |
|
| 58.32 | % |
|
| 61.40 | % |
|
| 67.92 | % |
|
|
|
|
|
|
|
|
|
|
|
|
|
|
|
| |||||
Operating Efficiency Ratio: (2) |
|
|
|
|
|
|
|
|
|
|
|
|
|
|
| |||||
Noninterest expense |
| $ | 115,223 |
|
| $ | 110,382 |
|
| $ | 100,484 |
|
| $ | 98,085 |
|
| $ | 78,175 |
|
Mergers and contractual termination expenses (Pretax) |
|
| (7,180 | ) |
|
| (3,059 | ) |
|
| (1,118 | ) |
|
| (7,612 | ) |
|
| (4,721 | ) |
Operating expense (a non-GAAP measure) |
| $ | 108,043 |
|
| $ | 107,323 |
|
| $ | 99,366 |
|
| $ | 90,473 |
|
| $ | 73,454 |
|
|
|
|
|
|
|
|
|
|
|
|
|
|
|
|
| |||||
Total revenue |
| $ | 162,536 |
|
| $ | 186,224 |
|
| $ | 172,305 |
|
| $ | 159,758 |
|
| $ | 115,097 |
|
Add:(gain) loss on disposition of investment securities |
|
| — |
|
|
| — |
|
|
| — |
|
|
| (69 | ) |
| $ | 79 |
|
Death benefit on bank owned life insurance (“BOLI”) and policy surrender (Pretax) |
|
| — |
|
|
| (1,157 | ) |
|
| — |
|
|
| — |
|
|
| — |
|
Operating revenue (a non-GAAP measure) |
| $ | 162,536 |
|
| $ | 185,067 |
|
| $ | 172,305 |
|
| $ | 159,689 |
|
| $ | 115,176 |
|
Operating Efficiency Ratio (a non-GAAP measure) |
|
| 66.47 | % |
|
| 57.99 | % |
|
| 57.67 | % |
|
| 56.66 | % |
|
| 63.78 | % |
|
| For the Year Ended December 31, |
| |||||||||||||||||
|
|
|
|
|
|
|
|
|
|
|
|
|
|
|
| |||||
|
| 2023 |
|
| 2022 |
|
| 2021 |
|
| 2020 |
|
| 2019 |
| |||||
|
| (dollars in thousands) |
| |||||||||||||||||
Operating Return on Tangible Common Equity: (3) |
|
|
|
|
|
|
|
|
|
|
|
|
|
|
| |||||
Operating Net Income (a non-GAAP measure) |
| $ | 40,157 |
|
| $ | 56,549 |
|
| $ | 54,828 |
|
| $ | 43,870 |
|
| $ | 29,156 |
|
Average common equity |
| $ | 524,672 |
|
| $ | 457,540 |
|
| $ | 417,768 |
|
| $ | 351,477 |
|
| $ | 221,617 |
|
Average goodwill and merger related intangibles |
|
| (71,538 | ) |
|
| (58,859 | ) |
|
| (54,707 | ) |
|
| (46,476 | ) |
|
| (24,577 | ) |
Average tangible common equity (a non-GAAP measure) |
| $ | 453,134 |
|
| $ | 398,681 |
|
| $ | 363,061 |
|
| $ | 305,001 |
|
| $ | 197,040 |
|
Operating Return on Tangible Common Equity (a non-GAAP measure) |
|
| 8.86 | % |
|
| 14.18 | % |
|
| 15.10 | % |
|
| 14.38 | % |
|
| 14.80 | % |
|
|
|
|
|
|
|
|
|
|
|
|
|
|
|
| |||||
Operating Return on Average Assets: (4) |
|
|
|
|
|
|
|
|
|
|
|
|
|
|
| |||||
Operating Net Income (a non-GAAP measure) |
| $ | 40,157 |
|
| $ | 56,549 |
|
| $ | 54,828 |
|
| $ | 43,870 |
|
| $ | 29,156 |
|
Average assets |
| $ | 5,486,130 |
|
| $ | 5,150,336 |
|
| $ | 4,343,873 |
|
| $ | 3,523,249 |
|
| $ | 2,600,316 |
|
Operating Return on Average Assets (a non-GAAP measure) |
|
| 0.73 | % |
|
| 1.10 | % |
|
| 1.26 | % |
|
| 1.25 | % |
|
| 1.12 | % |
38
Investment Securities
The Company’s securities portfolio consists of securities available for sale (“AFS”) and securities held to maturity (“HTM”). The largest component of the securities portfolio is mortgage-backed securities, all of which are issued by U.S. government agencies or U.S. government-sponsored enterprises.
Securities available for sale consist of certain U.S. Government Sponsored Enterprises (“GSE”) andobligations, U.S. GSE mortgage-backed securities, and corporate debt securities, and mutual funds.securities. These securities are carried at fair value, and unrealized gains and losses net of applicable income taxes are recognized as a separate component of shareholders’ equity.
The fair value of securities available for sale totaled $205.0$137.8 million and included gross unrealized gains of $260,000$4,000 and gross unrealized losses of $4.2$25.5 million at December 31, 2017.2023. At December 31, 2016,2022, the fair value of securities available for sale totaled $325.6$153.4 million and included gross unrealized gains of $515,000$7,000 and gross unrealized losses of $4.6$28.6 million.
Securities classified as held to maturity consist of certain U.S. GSE and U.S. GSE mortgage-backed securities, corporate debt securities, U.S. Treasury Notes, and state, county, and municipal securities. Securities held to maturity as of December 31, 20172023 are carried at their amortized cost of $232.2$959.3 million. At December 31, 2016,2022, the amortized cost of securities held to maturity totaled $82.5 million.$1.05 billion.
The following table sets forth the fair value of available for sale investment securities, the amortized costs of held to maturity, and the percentage distribution at the dates indicated:indicated.
|
| December 31, |
|
| December 31, |
| ||||||||||
|
| 2023 |
|
| 2022 |
| ||||||||||
|
| Amount |
|
| Percent |
|
| Amount |
|
| Percent |
| ||||
|
| (dollars in thousands) |
| |||||||||||||
Available for sale securities |
|
|
|
|
|
|
|
|
|
|
|
| ||||
U.S. GSE obligations |
| $ | 20,462 |
|
|
| 15 | % |
| $ | 19,733 |
|
|
| 13 | % |
Mortgage-backed securities |
|
| 117,376 |
|
|
| 85 | % |
|
| 132,683 |
|
|
| 86 | % |
Corporate debt securities |
|
| — |
|
|
| — | % |
|
| 1,000 |
|
|
| 1 | % |
Total securities available for sale |
| $ | 137,838 |
|
|
| 100 | % |
| $ | 153,416 |
|
|
| 100 | % |
Held to maturity securities |
|
|
|
|
|
|
|
|
|
|
|
| ||||
U.S. Treasury Notes |
| $ | 3,039 |
|
|
| — | % |
| $ | 3,970 |
|
|
| — | % |
Mortgage-backed securities |
|
| 871,426 |
|
|
| 91 | % |
|
| 951,372 |
|
|
| 91 | % |
Corporate debt securities |
|
| 250 |
|
|
| — | % |
|
| 250 |
|
|
| — | % |
Municipal securities |
|
| 84,617 |
|
|
| 9 | % |
|
| 96,405 |
|
|
| 9 | % |
Total securities held to maturity |
| $ | 959,332 |
|
|
| 100 | % |
| $ | 1,051,997 |
|
|
| 100 | % |
Total |
| $ | 1,097,170 |
|
|
|
|
| $ | 1,205,413 |
|
|
|
| ||
|
| December 31, |
| |||||||||||||||||||||
|
| 2017 |
|
| 2016 |
|
| 2015 |
| |||||||||||||||
|
| Amount |
|
| Percent |
|
| Amount |
|
| Percent |
|
| Amount |
|
| Percent |
| ||||||
|
| (dollars in thousands) |
| |||||||||||||||||||||
Available for sale securities |
|
|
|
|
|
|
|
|
|
|
|
|
|
|
|
|
|
|
|
|
|
|
|
|
U.S. GSE obligations |
| $ | 88,791 |
|
|
| 43 | % |
| $ | 138,709 |
|
|
| 43 | % |
| $ | 139,770 |
|
|
| 40 | % |
Mortgage-backed securities |
|
| 110,626 |
|
|
| 55 | % |
|
| 181,299 |
|
|
| 56 | % |
|
| 205,806 |
|
|
| 59 | % |
Corporate debt securities |
|
| 5,001 |
|
|
| 2 | % |
|
| 5,029 |
|
|
| 1 | % |
|
| 985 |
|
|
| 1 | % |
Mutual funds |
|
| 599 |
|
|
| 0 | % |
|
| 604 |
|
|
| 0 | % |
|
| 612 |
|
|
| 0 | % |
Total securities available for sale |
| $ | 205,017 |
|
|
| 100 | % |
| $ | 325,641 |
|
|
| 100 | % |
| $ | 347,173 |
|
|
| 100 | % |
Held to maturity securities |
|
|
|
|
|
|
|
|
|
|
|
|
|
|
|
|
|
|
|
|
|
|
|
|
U.S. GSE obligations |
| $ | 32,572 |
|
|
| 14 | % |
| $ | — |
|
|
| 0 | % |
| $ | — |
|
|
| 0 | % |
Mortgage-backed securities |
|
| 117,155 |
|
|
| 50 | % |
|
| 696 |
|
|
| 1 | % |
|
| 1,306 |
|
|
| 2 | % |
Corporate debt securities |
|
| 1,998 |
|
|
| 1 | % |
|
| — |
|
|
| 0 | % |
|
| — |
|
|
| 0 | % |
Municipal securities |
|
| 80,463 |
|
|
| 35 | % |
|
| 81,806 |
|
|
| 99 | % |
|
| 81,757 |
|
|
| 98 | % |
Total securities held to maturity |
| $ | 232,188 |
|
|
| 100 | % |
| $ | 82,502 |
|
|
| 100 | % |
| $ | 83,063 |
|
|
| 100 | % |
Total |
| $ | 437,205 |
|
|
| 100 | % |
| $ | 408,143 |
|
|
| 100 | % |
| $ | 430,236 |
|
|
| 100 | % |
39
The following tables settable sets forth the composition and maturities of investment securities. Actual maturities may differ from contractual maturities because borrowers may have the right to call or prepay obligations with or without call or prepayment penalties.
|
| December 31, 2023 |
| |||||||||||||||||||||||||||||||||||||
|
| Within One Year |
|
| After One, But |
|
| After Five, But |
|
| After Ten Years |
|
| Total |
| |||||||||||||||||||||||||
|
| Amortized Cost |
|
| Weighted |
|
| Amortized Cost |
|
| Weighted |
|
| Amortized Cost |
|
| Weighted |
|
| Amortized Cost |
|
| Weighted |
|
| Amortized Cost |
|
| Weighted |
| ||||||||||
|
| (dollars in thousands) |
| |||||||||||||||||||||||||||||||||||||
Available for sale |
|
|
|
|
|
|
|
|
|
|
|
|
|
|
|
|
|
|
|
|
|
|
|
|
|
|
|
|
|
| ||||||||||
U.S. GSE |
| $ | — |
|
|
| — |
|
| $ | 9,998 |
|
|
| 0.5 | % |
| $ | 5,000 |
|
|
| 2.3 | % |
| $ | 8,000 |
|
|
| 2.6 | % |
| $ | 22,998 |
|
|
| 1.6 | % |
Mortgage-backed |
|
| — |
|
|
| — |
|
|
| 11,466 |
|
|
| 1.9 | % |
|
| 37,207 |
|
|
| 1.5 | % |
|
| 91,705 |
|
|
| 1.7 | % |
|
| 140,378 |
|
|
| 1.6 | % |
Total available |
| $ | — |
|
|
| 0.0 | % |
| $ | 21,464 |
|
|
| 1.3 | % |
| $ | 42,207 |
|
|
| 1.6 | % |
| $ | 99,705 |
|
|
| 1.7 | % |
| $ | 163,376 |
|
|
| 1.6 | % |
|
|
|
|
|
|
|
|
|
|
|
|
|
|
|
|
|
|
|
|
|
|
|
|
|
|
|
|
|
|
| ||||||||||
Held to maturity |
|
|
|
|
|
|
|
|
|
|
|
|
|
|
|
|
|
|
|
|
|
|
|
|
|
|
|
|
|
| ||||||||||
U.S. treasury Notes |
| $ | 2,076 |
|
|
| 4.2 | % |
| $ | 963 |
|
|
| 4.1 | % |
| $ | — |
|
|
| 0.0 | % |
| $ | — |
|
|
| 0.0 | % |
| $ | 3,039 |
|
|
| 4.1 | % |
Mortgage-backed |
|
| — |
|
|
| — |
|
|
| 23,490 |
|
|
| 2.6 | % |
|
| 50,094 |
|
|
| 1.8 | % |
|
| 797,842 |
|
|
| 1.8 | % |
|
| 871,426 |
|
|
| 1.9 | % |
Corporate debt |
|
| 250 |
|
|
| 2.0 | % |
|
| — |
|
|
| — |
|
|
| — |
|
|
| — |
|
|
| — |
|
|
| — |
|
|
| 250 |
|
|
| 2.0 | % |
Municipal |
|
| 2,666 |
|
|
| 3.1 | % |
|
| 22,397 |
|
|
| 3.6 | % |
|
| 22,051 |
|
|
| 3.2 | % |
|
| 37,503 |
|
|
| 2.7 | % |
|
| 84,617 |
|
|
| 3.1 | % |
Total held to |
| $ | 4,992 |
|
|
| 3.5 | % |
| $ | 46,850 |
|
|
| 3.1 | % |
| $ | 72,145 |
|
|
| 2.2 | % |
| $ | 835,345 |
|
|
| 1.9 | % |
| $ | 959,332 |
|
|
| 2.0 | % |
Total |
| $ | 4,992 |
|
|
| 3.5 | % |
| $ | 68,314 |
|
|
| 2.5 | % |
| $ | 114,352 |
|
|
| 2.0 | % |
| $ | 935,050 |
|
|
| 1.9 | % |
| $ | 1,122,708 |
|
|
| 1.9 | % |
|
| Within One Year |
|
| After One, But Within Five Years |
|
| After Five, But Within Ten Years |
|
| After Ten Years |
|
| Total |
|
| |||||||||||||||||||||||||
|
| Amortized Cost |
|
| Weighted Average Yield (1) |
|
| Amortized Cost |
|
| Weighted Average Yield (1) |
|
| Amortized Cost |
|
| Weighted Average Yield (1) |
|
| Amortized Cost |
|
| Weighted Average Yield (1) |
|
| Amortized Cost |
|
| Weighted Average Yield (1) |
|
| ||||||||||
At December 31, 2017 |
| (dollars in thousands) |
|
| |||||||||||||||||||||||||||||||||||||
Available for sale securities |
|
|
|
|
|
|
|
|
|
|
|
|
|
|
|
|
|
|
|
|
|
|
|
|
|
|
|
|
|
|
|
|
|
|
|
|
|
|
|
|
|
U.S. GSE obligations |
| $ | 14,999 |
|
|
| 1.1 | % |
| $ | 75,022 |
|
|
| 1.3 | % |
| $ | — |
|
|
| — |
|
| $ | — |
|
|
| — |
|
| $ | 90,021 |
|
|
| 1.3 | % |
|
Mortgage-backed securities |
|
| 93 |
|
|
| 4.7 | % |
|
| 129 |
|
|
| 5.4 | % |
|
| 26,319 |
|
|
| 1.7 | % |
|
| 86,643 |
|
|
| 1.9 | % |
|
| 113,184 |
|
|
| 1.9 | % |
|
Corporate debt securities |
|
| — |
|
|
| — |
|
|
| 4,034 |
|
|
| 1.7 | % |
|
| 1,000 |
|
|
| 2.6 | % |
|
| — |
|
|
| — |
|
|
| 5,034 |
|
|
| 1.8 | % |
|
Total available for sale securities |
| $ | 15,092 |
|
|
| 1.1 | % |
| $ | 79,185 |
|
|
| 1.3 | % |
| $ | 27,319 |
|
|
| 1.8 | % |
| $ | 86,643 |
|
|
| 1.9 | % |
| $ | 208,239 |
|
|
| 1.6 | % |
|
|
|
|
|
|
|
|
|
|
|
|
|
|
|
|
|
|
|
|
|
|
|
|
|
|
|
|
|
|
|
|
|
|
|
|
|
|
|
|
|
|
|
Held to maturity securities |
|
|
|
|
|
|
|
|
|
|
|
|
|
|
|
|
|
|
|
|
|
|
|
|
|
|
|
|
|
|
|
|
|
|
|
|
|
|
|
|
|
U.S. GSE obligations |
| $ | — |
|
|
| — |
|
| $ | 32,572 |
|
|
| 2.2 | % |
| $ | — |
|
|
| — |
|
| $ | — |
|
|
| — |
|
| $ | 32,572 |
|
|
| 2.2 | % |
|
Mortgage-backed securities |
|
| 6 |
|
|
| 4.5 | % |
|
| 256 |
|
|
| 4.4 | % |
|
| 25,485 |
|
|
| 2.1 | % |
|
| 91,408 |
|
|
| 2.2 | % |
|
| 117,155 |
|
|
| 2.2 | % |
|
Corporate debt securities |
|
| — |
|
|
| — |
|
|
| 1,998 |
|
|
| 2.5 | % |
|
| — |
|
|
| — |
|
|
| — |
|
|
| — |
|
|
| 1,998 |
|
|
| 2.5 | % |
|
Municipal securities |
|
| 3,675 |
|
|
| 6.1 | % |
|
| 13,320 |
|
|
| 5.7 | % |
|
| 34,426 |
|
|
| 4.7 | % |
|
| 29,042 |
|
|
| 4.6 | % |
|
| 80,463 |
|
|
| 4.9 | % |
|
Total held to maturity securities |
| $ | 3,681 |
|
|
| 6.1 | % |
| $ | 48,146 |
|
|
| 3.2 | % |
| $ | 59,911 |
|
|
| 3.5 | % |
| $ | 120,450 |
|
|
| 2.8 | % |
| $ | 232,188 |
|
|
| 3.1 | % |
|
Total |
| $ | 18,773 |
|
|
| 2.1 | % |
| $ | 127,331 |
|
|
| 2.0 | % |
| $ | 87,230 |
|
|
| 3.0 | % |
| $ | 207,093 |
|
|
| 2.4 | % |
| $ | 440,427 |
|
|
| 2.4 | % |
|
| Within One Year |
|
| After One, But Within Five Years |
|
| After Five, But Within Ten Years |
|
| After Ten Years |
|
| Total |
| ||||||||||||||||||||||||||
|
| Amortized Cost |
|
| Weighted Average Yield (1) |
|
| Amortized Cost |
|
| Weighted Average Yield (1) |
|
| Amortized Cost |
|
| Weighted Average Yield (1) |
|
| Amortized Cost |
|
| Weighted Average Yield (1) |
|
| Amortized Cost |
|
| Weighted Average Yield (1) |
| ||||||||||
At December 31, 2016 |
| (dollars in thousands) |
| |||||||||||||||||||||||||||||||||||||
Available for sale securities |
|
|
|
|
|
|
|
|
|
|
|
|
|
|
|
|
|
|
|
|
|
|
|
|
|
|
|
|
|
|
|
|
|
|
|
|
|
|
|
|
U.S. GSE obligations |
| $ | 15,016 |
|
|
| 1.1 | % |
| $ | 125,010 |
|
|
| 1.3 | % |
| $ | — |
|
|
| — |
|
| $ | — |
|
|
| — |
|
| $ | 140,026 |
|
|
| 1.3 | % |
Mortgage-backed securities |
|
| 17 |
|
|
| 4.8 | % |
|
| 789 |
|
|
| 5.2 | % |
|
| 28,693 |
|
|
| 1.8 | % |
|
| 154,475 |
|
|
| 1.8 | % |
|
| 183,974 |
|
|
| 1.8 | % |
Corporate debt securities |
|
| — |
|
|
| — |
|
|
| 4,054 |
|
|
| 1.7 | % |
|
| 1,000 |
|
|
| 2.0 | % |
|
| — |
|
|
| — |
|
|
| 5,054 |
|
|
| 1.7 | % |
Total available for sale securities |
| $ | 15,033 |
|
|
| 1.1 | % |
| $ | 129,853 |
|
|
| 1.3 | % |
| $ | 29,693 |
|
|
| 1.8 | % |
| $ | 154,475 |
|
|
| 1.8 | % |
| $ | 329,054 |
|
|
| 1.6 | % |
|
|
|
|
|
|
|
|
|
|
|
|
|
|
|
|
|
|
|
|
|
|
|
|
|
|
|
|
|
|
|
|
|
|
|
|
|
|
|
|
|
Held to maturity securities |
|
|
|
|
|
|
|
|
|
|
|
|
|
|
|
|
|
|
|
|
|
|
|
|
|
|
|
|
|
|
|
|
|
|
|
|
|
|
|
|
Mortgage-backed securities |
| $ | 1 |
|
|
| 6.1 | % |
| $ | 630 |
|
|
| 4.5 | % |
| $ | 3 |
|
|
| 4.8 | % |
| $ | 62 |
|
|
| 7.1 | % |
| $ | 696 |
|
|
| 4.7 | % |
Municipal securities |
|
| 1,605 |
|
|
| 6.3 | % |
|
| 15,996 |
|
|
| 5.9 | % |
|
| 29,563 |
|
|
| 4.7 | % |
|
| 34,642 |
|
|
| 4.3 | % |
|
| 81,806 |
|
|
| 4.8 | % |
Total held to maturity securities |
| $ | 1,606 |
|
|
| 6.3 | % |
| $ | 16,626 |
|
|
| 5.8 | % |
| $ | 29,566 |
|
|
| 4.7 | % |
| $ | 34,704 |
|
|
| 4.3 | % |
| $ | 82,502 |
|
|
| 4.8 | % |
Total |
| $ | 16,639 |
|
|
| 1.6 | % |
| $ | 146,479 |
|
|
| 1.9 | % |
| $ | 59,259 |
|
|
| 3.2 | % |
| $ | 189,179 |
|
|
| 2.3 | % |
| $ | 411,556 |
|
|
| 2.2 | % |
|
|
Management evaluates securitiesThe Company did not record an allowance for other-than-temporary impairmentcredit losses on at least a quarterly basis, and more frequently when economic or market conditions warrant such evaluation. Consideration is given to: (1) the length of time and the extent to which the fair value has been less than cost; (2) the financial condition and near-term prospects of the issuer; and (3) the intent and ability of the Company to retain its investment in the issuer for a period of time sufficient to allow for any anticipated recovery in fair value.
Assecurities as of December 31, 2017, 1182023 or 2022. The Company regularly reviews debt securities for expected credit loss using both qualitative and one equity security had gross unrealized losses, with an aggregate depreciationquantitative criteria, as necessary based on the composition of 1.5% from the Company’s amortized cost basis. The largest unrealized loss percentage of any single security was 10.9% (or $73,000) of its amortized cost. The largest unrealized dollar loss of any single security was $185,000 (or 3.7%) of its amortized cost.portfolio at period end.
As of December 31, 2016, 132 debt securities and one equity security had gross unrealized losses, with an aggregate depreciation of 1.7% from the Company’s amortized cost basis. The largest unrealized loss percentage of any single security was 10.2% (or $51,000) of its amortized cost. The largest unrealized dollar loss of any single security was $189,000 (or 3.8%) of its amortized cost.Loans
Loans
The Company’s lending activities are conducted principally in Eastern Massachusetts.Massachusetts and Southern New Hampshire. The Company grants single-familysingle- and multi-family residential loans, commercial & industrial (“C&I), commercial real estate (“CRE”),&I loans, CRE loans, construction loans, and a variety of consumer loans. Most of the loans granted by the Company are secured by real estate collateral. Repayment of the Company’s residential loans areis generally dependent on the health of the employment market in the borrowers’ geographic areas and that of the general economy, with liquidation of the underlying real estate collateral being typically viewed as the primary source of repayment in the event of borrower default. The repayment of C&I loans depends primarily on the cash flow and credit worthiness of the borrower and secondarily on the underlying collateral provided by the borrower. As borrower cash flow may be difficult to predict, liquidation of the underlying collateral securing these loans is typically viewed as the primary source of repayment in the event of borrower default. However, collateral typically consists of equipment, inventory, accounts receivable, or other business assets that may fluctuate in value, so the liquidation of collateral in the event of default is often an insufficient source of repayment. For renewable energy loans, cash flow is generally dependent on energy output and is generated from the contracted sale of energy credits or wholesale energy sales as well as state mandated incentive programs. For PPP loans, the SBA generally guarantees 100% of the PPP loans made to eligible borrowers. The entire principal amount of the borrower’s PPP loan, including any accrued interest, is eligible to be reduced by the loan forgiveness amount subject to program requirements. The Company’s CRE loans are primarily made based on the cash flow from the collateral property and secondarily on the underlying collateral provided by the borrower, with liquidation of the underlying real estate collateral typically being viewed as the primary source of repayment in the event of borrower default. The Company’s construction loans are primarily made based on the borrower’s expected ability to execute and the future completed value of the collateral property, with sale of the underlying real estate collateral typically being viewed as the primary source of repayment.
40
The following summary shows the composition of the loan portfolio at the dates indicated:
|
| December 31, |
|
| December 31, 2023 |
|
| December 31, 2022 |
| |||||||||||||||||||||||||||||||||||||||||||||||
|
| 2017 |
|
| % of Total |
|
| 2016 |
|
| % of Total |
|
| 2015 |
|
| % of Total |
|
| 2014 |
|
| % of Total |
|
| 2013 |
|
| % of Total |
|
| 2023 |
|
| % of |
|
| 2022 |
|
| % of |
| ||||||||||||||
|
| (dollars in thousands) |
|
| (dollars in thousands) |
| ||||||||||||||||||||||||||||||||||||||||||||||||||
Residential mortgage |
|
|
|
|
|
|
|
|
|
|
|
|
|
|
|
|
|
|
|
|
|
|
|
|
|
|
|
|
|
|
|
|
|
|
|
|
|
|
|
|
|
|
|
|
|
|
|
|
|
|
|
| ||||
Mortgages - fixed rate |
| $ | 298,851 |
|
|
| 22 | % |
| $ | 305,404 |
|
|
| 23 | % |
| $ | 338,576 |
|
|
| 29 | % |
| $ | 322,780 |
|
|
| 30 | % |
| $ | 314,551 |
|
|
| 33 | % |
| $ | 813,374 |
|
|
| 20 | % |
| $ | 902,968 |
|
|
| 22 | % |
Mortgages - adjustable rate |
|
| 239,027 |
|
|
| 18 | % |
|
| 228,028 |
|
|
| 17 | % |
|
| 206,835 |
|
|
| 17 | % |
|
| 183,796 |
|
|
| 17 | % |
|
| 143,159 |
|
|
| 15 | % |
|
| 760,632 |
|
|
| 19 | % |
|
| 703,958 |
|
|
| 17 | % |
Deferred costs net of unearned fees |
|
| 1,042 |
|
|
| 0 | % |
|
| 972 |
|
|
| 0 | % |
|
| 834 |
|
|
| 0 | % |
|
| 640 |
|
|
| 0 | % |
|
| 466 |
|
|
| 0 | % | ||||||||||||||||
Construction |
|
| 45,863 |
|
|
| 1 | % |
|
| 35,299 |
|
|
| 1 | % | ||||||||||||||||||||||||||||||||||||||||
Deferred costs, net of unearned fees |
|
| 6,395 |
|
|
| 0 | % |
|
| 6,613 |
|
|
| 0 | % | ||||||||||||||||||||||||||||||||||||||||
Total residential mortgages |
|
| 538,920 |
|
|
| 40 | % |
|
| 534,404 |
|
|
| 40 | % |
|
| 546,245 |
|
|
| 46 | % |
|
| 507,216 |
|
|
| 47 | % |
|
| 458,176 |
|
|
| 48 | % |
|
| 1,626,264 |
|
|
| 40 | % |
|
| 1,648,838 |
|
|
| 40 | % |
Commercial mortgage |
|
|
|
|
|
|
|
|
|
|
|
|
|
|
|
|
|
|
|
|
|
|
|
|
|
|
|
|
|
|
|
|
|
|
|
|
|
|
|
|
|
|
|
|
|
|
|
|
| |||||||
Mortgages - nonowner occupied |
|
| 562,203 |
|
|
| 41 | % |
|
| 513,578 |
|
|
| 39 | % |
|
| 422,923 |
|
|
| 35 | % |
|
| 370,871 |
|
|
| 35 | % |
|
| 304,509 |
|
|
| 33 | % | ||||||||||||||||
Mortgages - non-owner occupied |
|
| 1,648,408 |
|
|
| 41 | % |
|
| 1,592,732 |
|
|
| 39 | % | ||||||||||||||||||||||||||||||||||||||||
Mortgages - owner occupied |
|
| 35,343 |
|
|
| 3 | % |
|
| 43,932 |
|
|
| 3 | % |
|
| 43,265 |
|
|
| 4 | % |
|
| 46,954 |
|
|
| 4 | % |
|
| 44,999 |
|
|
| 5 | % |
|
| 167,522 |
|
|
| 4 | % |
|
| 183,591 |
|
|
| 5 | % |
Construction |
|
| 35,904 |
|
|
| 3 | % |
|
| 58,406 |
|
|
| 4 | % |
|
| 44,624 |
|
|
| 4 | % |
|
| 23,879 |
|
|
| 2 | % |
|
| 13,584 |
|
|
| 1 | % |
|
| 113,133 |
|
|
| 3 | % |
|
| 135,782 |
|
|
| 3 | % |
Deferred costs net of unearned fees |
|
| 199 |
|
|
| 0 | % |
|
| 224 |
|
|
| 0 | % |
|
| 259 |
|
|
| 0 | % |
|
| 138 |
|
|
| 0 | % |
|
| 202 |
|
|
| 0 | % | ||||||||||||||||
Deferred costs, net of unearned fees |
|
| 2,410 |
|
|
| 0 | % |
|
| 2,318 |
|
|
| 0 | % | ||||||||||||||||||||||||||||||||||||||||
Total commercial mortgages |
|
| 633,649 |
|
|
| 47 | % |
|
| 616,140 |
|
|
| 46 | % |
|
| 511,071 |
|
|
| 43 | % |
|
| 441,842 |
|
|
| 41 | % |
|
| 363,294 |
|
|
| 39 | % |
|
| 1,931,473 |
|
|
| 48 | % |
|
| 1,914,423 |
|
|
| 47 | % |
Home equity |
|
|
|
|
|
|
|
|
|
|
|
|
|
|
|
|
|
|
|
|
|
|
|
|
|
|
|
|
|
|
|
|
|
|
|
|
|
|
|
|
|
|
|
|
|
|
|
|
| |||||||
Home equity - lines of credit |
|
| 70,326 |
|
|
| 5 | % |
|
| 70,883 |
|
|
| 6 | % |
|
| 59,676 |
|
|
| 5 | % |
|
| 53,492 |
|
|
| 5 | % |
|
| 43,521 |
|
|
| 5 | % |
|
| 92,730 |
|
|
| 2 | % |
|
| 108,961 |
|
|
| 3 | % |
Home equity - term loans |
|
| 3,863 |
|
|
| 0 | % |
|
| 3,925 |
|
|
| 0 | % |
|
| 3,630 |
|
|
| 0 | % |
|
| 2,934 |
|
|
| 0 | % |
|
| 2,985 |
|
|
| 0 | % |
|
| 2,679 |
|
|
| 0 | % |
|
| 2,098 |
|
|
| 0 | % |
Deferred costs net of unearned fees |
|
| 255 |
|
|
| 0 | % |
|
| 243 |
|
|
| 0 | % |
|
| 216 |
|
|
| 0 | % |
|
| 153 |
|
|
| 0 | % |
|
| 129 |
|
|
| 0 | % | ||||||||||||||||
Deferred costs, net of unearned fees |
|
| 240 |
|
|
| 0 | % |
|
| 292 |
|
|
| 0 | % | ||||||||||||||||||||||||||||||||||||||||
Total home equity |
|
| 74,444 |
|
|
| 5 | % |
|
| 75,051 |
|
|
| 6 | % |
|
| 63,522 |
|
|
| 5 | % |
|
| 56,579 |
|
|
| 5 | % |
|
| 46,635 |
|
|
| 5 | % |
|
| 95,649 |
|
|
| 2 | % |
|
| 111,351 |
|
|
| 3 | % |
Commercial & industrial |
|
|
|
|
|
|
|
|
|
|
|
|
|
|
|
|
|
|
|
|
|
|
|
|
|
|
|
|
|
|
|
|
|
|
|
|
|
|
|
| ||||||||||||||||
Commercial & industrial |
|
| 65,305 |
|
|
| 5 | % |
|
| 59,638 |
|
|
| 5 | % |
|
| 42,209 |
|
|
| 4 | % |
|
| 49,263 |
|
|
| 5 | % |
|
| 50,513 |
|
|
| 5 | % | ||||||||||||||||
Deferred costs net of unearned fees |
|
| (10 | ) |
|
| 0 | % |
|
| 68 |
|
|
| 0 | % |
|
| 175 |
|
|
| 0 | % |
|
| 229 |
|
|
| 0 | % |
|
| 245 |
|
|
| 0 | % | ||||||||||||||||
Total commercial & industrial |
|
| 65,295 |
|
|
| 5 | % |
|
| 59,706 |
|
|
| 5 | % |
|
| 42,384 |
|
|
| 4 | % |
|
| 49,492 |
|
|
| 5 | % |
|
| 50,758 |
|
|
| 5 | % | ||||||||||||||||
Commercial and industrial |
|
|
|
|
|
|
|
|
| |||||||||||||||||||||||||||||||||||||||||||||||
Commercial and industrial |
|
| 342,475 |
|
|
| 9 | % |
|
| 349,026 |
|
|
| 9 | % | ||||||||||||||||||||||||||||||||||||||||
PPP loans |
|
| 653 |
|
|
| 0 | % |
|
| 1,384 |
|
|
| 0 | % | ||||||||||||||||||||||||||||||||||||||||
Unearned fees, net of deferred costs |
|
| 583 |
|
|
| 0 | % |
|
| 240 |
|
|
| 0 | % | ||||||||||||||||||||||||||||||||||||||||
Total commercial and industrial |
|
| 343,711 |
|
|
| 9 | % |
|
| 350,650 |
|
|
| 9 | % | ||||||||||||||||||||||||||||||||||||||||
Consumer |
|
|
|
|
|
|
|
|
|
|
|
|
|
|
|
|
|
|
|
|
|
|
|
|
|
|
|
|
|
|
|
|
|
|
|
|
|
|
|
|
|
|
|
|
|
|
|
|
| |||||||
Secured |
|
| 37,272 |
|
|
| 3 | % |
|
| 33,386 |
|
|
| 3 | % |
|
| 27,390 |
|
|
| 2 | % |
|
| 23,749 |
|
|
| 2 | % |
|
| 20,931 |
|
|
| 3 | % |
|
| 22,592 |
|
|
| 1 | % |
|
| 35,679 |
|
|
| 1 | % |
Unsecured |
|
| 1,303 |
|
|
| 0 | % |
|
| 1,451 |
|
|
| 0 | % |
|
| 1,585 |
|
|
| 0 | % |
|
| 1,873 |
|
|
| 0 | % |
|
| 2,643 |
|
|
| 0 | % |
|
| 1,822 |
|
|
| 0 | % |
|
| 1,897 |
|
|
| 0 | % |
Deferred costs net of unearned fees |
|
| 16 |
|
|
| 0 | % |
|
| 16 |
|
|
| 0 | % |
|
| 17 |
|
|
| 0 | % |
|
| 15 |
|
|
| 0 | % |
|
| 14 |
|
|
| 0 | % | ||||||||||||||||
Deferred costs, net of unearned fees |
|
| 33 |
|
|
| 0 | % |
|
| 18 |
|
|
| 0 | % | ||||||||||||||||||||||||||||||||||||||||
Total consumer |
|
| 38,591 |
|
|
| 3 | % |
|
| 34,853 |
|
|
| 3 | % |
|
| 28,992 |
|
|
| 2 | % |
|
| 25,637 |
|
|
| 2 | % |
|
| 23,588 |
|
|
| 3 | % |
|
| 24,447 |
|
|
| 1 | % |
|
| 37,594 |
|
|
| 1 | % |
Total loans |
| $ | 1,350,899 |
|
|
| 100 | % |
| $ | 1,320,154 |
|
|
| 100 | % |
| $ | 1,192,214 |
|
|
| 100 | % |
| $ | 1,080,766 |
|
|
| 100 | % |
| $ | 942,451 |
|
|
| 100 | % |
| $ | 4,021,544 |
|
|
| 100 | % |
| $ | 4,062,856 |
|
|
| 100 | % |
Residential Mortgage.Residential real estate loans held in portfolio amountedwere to $538.9 million $1.63 billionat December 31, 2017, an increase2023, a decrease of $4.5$22.6 million, or 0.8%1.4%, from $1.65 billion at December 31, 20162022 and consisted of one-to-four family residential mortgage loans.loans, or for the construction thereof. The residential mortgage portfolio represented 40% of total loans both at December 31, 20172023 and December 31, 2016. 2022, respectively.
The average loan balance outstanding in the residential portfolio was $526,000 and the largest individual residential mortgage loan outstanding was $5.5 million as of December 31, 2023. At December 31, 2023, this loan was performing in accordance with its original terms.
The Bank offers fixed and adjustable rateadjustable-rate residential mortgage and construction loans with maturities up to 30 years. One-to-four family residential mortgage loans are generally underwritten according to Federal National Mortgage Association (“Fannie Mae”) or Federal Home Loan Mortgage Corporation (“Freddie MacMac”) guidelines, and we refer to loans that conform to such guidelines as “conforming loans.” The Bank generally originates and purchases both fixed and adjustable rateadjustable-rate mortgage loans in amounts up to the maximum conforming loan limits as established by the Federal Housing Finance Agency, which increased to $424,100$726,200 in 20172023 from $417,000$647,200 in 2016,2022, for one-unit properties. In addition, the Bank also offers loans above conforming lending limits typically referred to as “jumbo” loans and interest only loans. These loans are typically underwritten to jumbo conforming guidelines; however, the Bank may choose to hold a jumbo loan within its portfolio with underwriting criteria that does not exactly match conforming guidelines. The Bank may also, from time to time, purchase residential loans that are either jumbo, conforming, or meet our Community Reinvestment Act (“CRA”)meets it CRA requirements. Purchases have historically been made to satisfy CRA requirements for lending to lowlow- and moderate incomemoderate-income borrowers within the Bank’s CRA Assessment Area.
Generally, our residential construction loans are based on complete value per plans and specifications, with loan proceeds used to construct the house for single family primary residence. Loans are provided for terms up to 12 months during the construction
41
phase, with loan-to-values that generally do not exceed 80% on as complete basis. The loans then convert to permanent financing at terms up to 360 months.
The Company does not offer reverse mortgages, nor do wedoes it offer loans that provide for negative amortization of principal, such as “Option ARM” loans, where the borrower can pay less than the interest owed on the loan, resulting in an increased principal balance during the life of the loan. We doThe Company does not offer “subprime loans” (loans that are made with low down payments to borrowers with weakened credit histories typically characterized by payment delinquencies, previous charge-offs, judgments, bankruptcies, or borrowers with questionable repayment capacity as evidenced by low credit scores or high debt-burden ratios) or Alt-A loans (defined as loans having less than full documentation).
Residential real estate loans are originated both for sale to the secondary market, as well as for retention in the Bank’s loan portfolio. The decision to sell a loan to the secondary market or retain within the portfolio is determined based on a variety of factors, including, but not limited to, the Bank’s asset/liability position, the current interest rate environment, and customerclient preference.
Indemnification. In general, the Company does not sell loans with recourse, except to the extent that it arises from standard loan-sale contract provisions. These provisions cover violations of representations and warranties and, under certain circumstances, first payment default by borrowers. These indemnifications may include the repurchase of loans by the Company and are considered customary provisions in the secondary market for conforming mortgage loan sales. Repurchases and losses have been rare, and no provision is made for losses at the time of sale. There were no such repurchases for the year ended December 31, 2023.
The Company was servicing mortgage loans sold to others without recourse of approximately $99.8$173.9 million at December 31, 20172023 and $95.7$191.9 million at December 31, 2016.
The average loan balance outstanding in the residential portfolio was $384,000 and the largest individual residential mortgage loan outstanding was $4.2 million as of December 31, 2017. At December 31, 2017, this loan was performing in accordance with its original terms.2022.
The table below presents residential real estate loan origination activity for the periods indicated:
|
| December 31, |
|
| For the Year Ended December 31, |
| ||||||||||||||
|
| 2017 |
|
| 2016 |
|
| 2015 |
|
| 2023 |
|
| 2022 |
| |||||
|
| (dollars in thousands) |
|
| (dollars in thousands) |
| ||||||||||||||
Originations for retention in portfolio |
| $ | 101,307 |
|
| $ | 78,787 |
|
| $ | 116,783 |
|
| $ | 182,300 |
|
| $ | 432,008 |
|
Originations for sale to the secondary market |
|
| 15,663 |
|
|
| 65,283 |
|
|
| 23,601 |
|
|
| 6,451 |
|
|
| 4,515 |
|
Total |
| $ | 116,970 |
|
| $ | 144,070 |
|
| $ | 140,384 |
|
| $ | 188,751 |
|
| $ | 436,523 |
|
Loans are sold with servicing retained or released. The table below presents residential real estate loan sale activity for the periods indicated:
|
| December 31, |
| For the Year Ended December 31, |
| ||||||||||||||
|
| 2017 |
|
| 2016 |
|
| 2015 |
| 2023 |
|
| 2022 |
| |||||
|
| (dollars in thousands) |
| (dollars in thousands) |
| ||||||||||||||
Loans sold with servicing rights retained |
| $ | 10,338 |
|
| $ | 50,022 |
|
| $ | 24,843 |
| $ | 6,451 |
|
| $ | 5,834 |
|
Loans sold with servicing rights released |
|
| 11,906 |
|
|
| 8,646 |
|
|
| 617 |
|
| — |
|
|
| — |
|
Total |
| $ | 22,244 |
|
| $ | 58,668 |
|
| $ | 25,460 |
| $ | 6,451 |
|
| $ | 5,834 |
|
Loans sold with the retention of servicing typically result in the capitalization of servicing rights. Loan servicing rights are included in other assets and are subsequently amortized as an offset to other income over the estimated period of servicing. The net balance of capitalized servicing rights amounted to $793,000totaled $1.5 million and $812,000$1.7 million at December 31, 20172023 and December 31, 2016,2022, respectively.
Commercial Mortgage. Commercial real estateCRE loans were $633.6 million$1.93 billion as of December 31, 2017,2023, an increase of $17.5$17.1 million, or 2.8%0.9%, from $616.1 million$1.91 billion at December 31, 2016.2022. The commercial real estateCRE loan portfolio represented 47%48% and 46%47% of total loans at December 31, 20172023 and December 31, 2016,2022, respectively. The average loan balance outstanding in this portfolio was $1.7 million and the largest individual CRE loan outstanding was $28.4 million as of December 31, 2023. At December 31, 2023, this commercial mortgage was performing in accordance with its original terms.
Commercial real estateCRE loans are secured by a variety of property types with approximately 90.4% of the total at December 31, 2017 composedinclusive of multi-family dwellings, retail facilities, office buildings, commercial mixed use, lodging, and industrial and warehouse properties. The average loan balance outstanding in this portfolio was $1.6 millionproperties, and the largest individual commercial real estate loan outstanding was $16.8 million as of December 31, 2017. At December 31, 2017, this commercial mortgage was performing in accordance with its original terms.other specialized properties.
Generally, our commercial real estateCRE loans are for terms of up to ten10 years, with loan-to-values that generally do not exceed 75%. Amortization schedules are long term,long-term, and thus, a balloon payment is generally due at maturity. Under most circumstances, the Bank will offer to rewrite or otherwise extend the loan at prevailing interest rates.
42
Generally, our commercial construction loans are speculative in nature, with loan proceeds used to acquire and develop real estate property for sale or rental. Loans are typically provided for terms up to 36 months during the construction phase, with loan-to-values that generally do not exceed 75% on both an “as is” and “as complete and stabilized” basis. Construction projects are primarily for the development of residential property types, inclusive of one-to-four family and multifamily properties.
Home Equity.The home equity portfolio totaled $74.4$95.6 million and $75.1$111.4 million at December 31, 20172023 and December 31, 2016,2022, respectively. The home equity portfolio represented 5% and 6%2% of total loans at December 31, 20172023 and 3% at December 31, 2016, respectively.2022. At December 31, 2023, the largest home equity line of credit was a $2.0 million line of credit and had an outstanding balance of $2.0 million at December 31, 2023. At December 31, 2023, this line of credit was performing in accordance with its original terms.
Home equity lines of credit are extended as both first and second mortgages on owner-occupied residential and one-to-four family investment properties in the Bank’s market area. Home equity lines of credit are generally underwritten with the same criteria that we use to underwrite one-to-four family residential mortgage loans.
Our home equity lines of credit are revolving lines of credit, which generally have a term between 15 and 20 years, with draws available for the first ten10 years. Our 15 year15-year lines of credit are interest only during the first ten10 years and amortize on a five yearfive-year basis thereafter. Our 20 year20-year lines of credit are interest only during the first ten10 years and amortize on a ten year10-year basis thereafter. We generally originate home equity lines of credit with loan-to-value ratios of up to 80% when combined with the principal balance of the existing first mortgage loan, although loan-to-value ratios may occasionally exceed 80% on a case by casecase-by-case basis. Maximum combined loan-to-values are determined based on an applicant’s loan/line amount and the estimated property value. Lines of credit above $1$1.0 million generally will not exceed combined loan-to-value of 75%. Rates are adjusted monthly based on changes in a designated market index. At December 31, 2017, our largest home equity line of credit was a $2.0 million line of credit and had an outstanding balance of $1.4 million. At December 31, 2017, this line of credit was performing in accordance with its original terms.
We also offer home equity term loans, which are extended as second mortgages on owner-occupied residential properties in our market area. Our home equity term loans are fixed-ratefixed rate second mortgage loans, which generally have a term between 5five and 20 years.
Commercial and Industrial (C&I)(“C&I”). The commercial and industrialC&I portfolio totaled $65.3$343.7 million at December 31, 2017, an increase2023, a decrease of $5.6$6.9 million, or 9.4%2.0%, from $59.7$350.7 million at December 31, 2016.2022. C&I loans represented 5%9% of total loans both at December 31, 20172023 and December 31, 2016.2022, respectively. The average loan balance outstanding in this portfolio was $103,000$395,000, and the largest individual commercial and industrial loan outstanding was $6.8$20.0 million as of December 31, 2017.2023. At December 31, 2017,2023, this loan was performing in accordance with its original terms.
The Company’s C&I loan customersclients represent various small- and middle- marketmiddle-market established businesses involved in professional and financial services, accommodation and food services, utilities, health care, wholesale trade, manufacturing, distribution, retailing, and non-profits. Most clients are privately owned businesses with markets that range from local to national in scope. Many of the loans to this segment are secured by liens on corporate assets and the personal guarantees of the principals. The Company also makes loans to entrepreneurial and technology businesses. Thebusinesses, where regional economic strength or weakness impacts the relative risks in this loan category. Therecategory, in addition to renewable energy lending which is little concentrationmore specialized in nature. The Company has expanded its exposure within renewable energy lending but otherwise there are no significant concentrations in any one business sector, and loan risks are generally diversified among many borrowers.
Consumer.
At December 31, 2023, commercial solar loans totaled $114.4 million and the average loan balance outstanding in this portfolio was $2.0 million. The largest individual loan outstanding was $7.2 million, and this loan was performing in accordance with its original terms at December 31, 2023.
Consumer Loans. The consumer loan portfolio totaled $38.6$24.4 million at December 31, 2017, an increase2023, a decrease of $3.7$13.1 million, or 10.7%35.0%, from $34.9$37.6 million at December 31, 2016.2022. Consumer loans represented 3%1% of the total loansloan portfolio at both December 31, 20172023 and December 31, 2016. 2022. The average loan balance outstanding in this portfolio was $8,000 and the largest individual consumer loan outstanding was $2.0 million as of December 31, 2023. At December 31, 2023, this loan was performing in accordance with its original terms.
Consumer loans include secured and unsecured loans, lines of credit, and personal installment loans. Unsecured consumer loans generally have greater risk compared to longer-term loans secured by improved, owner-occupied real estate,particularly consumer loans that are secured by rapidly depreciable assets. The secured consumer loans and lines portfolio are generally fully secured by pledged assets, such as bank accounts or investments.
Loan Portfolio Maturities. The following table summarizes the dollar amount of loans maturing in our portfolio based on their loan type and contractual terms to maturity at December 31, 2017.2023. The table does not include any estimate of prepayments, which can significantly shorten the average life of all loans and may cause our actual repayment experience to differ from that
43
shown below. Demand loans, loans having no stated repayment schedule or maturity, and overdraft loans are reported as being due in one year or less.
|
| December 31, 2017 |
|
| December 31, 2023 |
| ||||||||||||||||||||||||||||||
|
| One Year or Less |
|
| One to Five Years |
|
| Over Five Years |
|
| Total |
|
| One Year |
|
| One to |
|
| After Five Years through Fifteen Years |
|
| After Fifteen Years |
|
| Total |
| |||||||||
|
| (dollars in thousands) |
|
| (dollars in thousands) |
| ||||||||||||||||||||||||||||||
Residential mortgage |
| $ | 1,042 |
|
| $ | 6,340 |
|
| $ | 531,538 |
|
| $ | 538,920 |
|
| $ | 963 |
|
| $ | 11,790 |
|
| $ | 94,118 |
|
| $ | 1,519,393 |
|
| $ | 1,626,264 |
|
Commercial mortgage |
|
| 6,804 |
|
|
| 146,198 |
|
|
| 480,647 |
|
|
| 633,649 |
|
|
| 157,503 |
|
|
| 635,533 |
|
|
| 1,019,252 |
|
|
| 119,185 |
|
|
| 1,931,473 |
|
Home equity |
|
| 255 |
|
|
| 1,555 |
|
|
| 72,634 |
|
|
| 74,444 |
|
|
| 2,049 |
|
|
| 10,280 |
|
|
| 34,084 |
|
|
| 49,236 |
|
|
| 95,649 |
|
Commercial & Industrial |
|
| 24,467 |
|
|
| 21,560 |
|
|
| 19,268 |
|
|
| 65,295 |
| ||||||||||||||||||||
Commercial and industrial |
|
| 41,968 |
|
|
| 146,932 |
|
|
| 89,203 |
|
|
| 65,608 |
|
|
| 343,711 |
| ||||||||||||||||
Consumer |
|
| 38,521 |
|
|
| 70 |
|
|
| — |
|
|
| 38,591 |
|
|
| 23,831 |
|
|
| 298 |
|
|
| 318 |
|
|
| — |
|
|
| 24,447 |
|
Total |
| $ | 71,089 |
|
| $ | 175,723 |
|
| $ | 1,104,087 |
|
| $ | 1,350,899 |
|
| $ | 226,314 |
|
| $ | 804,833 |
|
| $ | 1,236,975 |
|
| $ | 1,753,422 |
|
| $ | 4,021,544 |
|
Loan Portfolio by Interest Rate Type. The following table summarizes the dollar amount of loans maturing over one year in our portfolio based on whether the loan has a fixed, adjustable, or variablefloating rate of interest and their contractual terms to maturity at December 31, 2017. The table does not include any estimate of prepayments, which can significantly shorten the average life of all loans and may cause our actual repayment experience to differ from that shown below. Demand loans, loans having no stated repayment schedule or maturity, and overdraft2023. Floating rate loans are reported as being due in one year or less.tied to a market index while adjustable-rate loans are adjusted based on the contractual terms of the loan.
|
| December 31, 2017 |
| |||||||||||||
|
| One Year or Less |
|
| One to Five Years |
|
| Over Five Years |
|
| Total |
| ||||
|
| (dollars in thousands) |
| |||||||||||||
Predetermined interest rates |
| $ | 8,763 |
|
| $ | 122,398 |
|
| $ | 516,502 |
|
| $ | 647,663 |
|
Floating or adjustable interest rates |
|
| 62,326 |
|
|
| 53,325 |
|
|
| 587,585 |
|
|
| 703,236 |
|
Total |
| $ | 71,089 |
|
| $ | 175,723 |
|
| $ | 1,104,087 |
|
| $ | 1,350,899 |
|
|
| December 31, 2023 |
| |||||||||||||
|
| Fixed |
|
| Adjustable |
|
| Floating |
|
| Total |
| ||||
|
| (dollars in thousands) |
| |||||||||||||
Residential mortgage |
| $ | 822,944 |
|
| $ | 802,357 |
|
| $ | — |
|
| $ | 1,625,301 |
|
Commercial mortgage |
|
| 803,159 |
|
|
| 438,666 |
|
|
| 532,145 |
|
|
| 1,773,970 |
|
Home equity |
|
| 2,473 |
|
|
| 582 |
|
|
| 90,545 |
|
|
| 93,600 |
|
Commercial and industrial |
|
| 42,615 |
|
|
| 23,910 |
|
|
| 235,218 |
|
|
| 301,743 |
|
Consumer |
|
| 616 |
|
|
| — |
|
|
| - |
|
|
| 616 |
|
Total |
| $ | 1,671,807 |
|
| $ | 1,265,515 |
|
| $ | 857,908 |
|
| $ | 3,795,230 |
|
Nonperforming Loans, MODIFICATION, and TROUBLED DEBT RESTRUCTURINGS (TDRs(“TDRs”)
The composition of nonperforming assetsloans is as follows:
|
| December 31, |
|
| December 31, |
|
| ||
|
| 2023 |
|
| 2022 |
|
| ||
|
| (dollars in thousands) |
|
| |||||
Non-performing loans |
| $ | 16,516 |
|
| $ | 6,542 |
|
|
Loans past due > 90 days, but still accruing |
|
| 51 |
|
|
| — |
|
|
Total non-performing loans |
| $ | 16,567 |
|
| $ | 6,542 |
|
|
Non-performing loans as a percentage of gross loans |
|
| 0.41 | % |
|
| 0.16 | % |
|
Non-performing loans as a percentage of total assets |
|
| 0.31 | % |
|
| 0.12 | % |
|
|
| December 31, |
| |||||||||||||||||
|
| 2017 |
|
| 2016 |
|
| 2015 |
|
| 2014 |
|
| 2013 |
| |||||
|
| (dollars in thousands) |
| |||||||||||||||||
Nonaccruals |
| $ | 1,148 |
|
| $ | 1,023 |
|
| $ | 1,481 |
|
| $ | 1,620 |
|
| $ | 1,582 |
|
Loans past due > 90 days, but still accruing |
|
| — |
|
|
| 232 |
|
|
| — |
|
|
| 9 |
|
|
| 121 |
|
Troubled debt restructurings |
|
| 150 |
|
|
| 421 |
|
|
| — |
|
|
| — |
|
|
| — |
|
Total nonperforming loans |
| $ | 1,298 |
|
| $ | 1,676 |
|
| $ | 1,481 |
|
| $ | 1,629 |
|
| $ | 1,703 |
|
Accruing troubled debt restructured loans |
| $ | 29 |
|
| $ | — |
|
| $ | — |
|
| $ | — |
|
| $ | — |
|
Nonperforming loans as a percentage of gross loans |
|
| 0.10 | % |
|
| 0.13 | % |
|
| 0.12 | % |
|
| 0.15 | % |
|
| 0.18 | % |
Nonperforming loans as a percentage of total assets |
|
| 0.07 | % |
|
| 0.09 | % |
|
| 0.09 | % |
|
| 0.10 | % |
|
| 0.11 | % |
At December 31, 2017, 2016, and 2015, impairedTotal non-performing loans had specific reserves of $93,000, $190,000, and $174,000, respectively. There were no specific reserves for impaired loans as of December 31, 2014, and 2013.
Nonaccrual Loans. Loans are typically placed on nonaccrual status when any payment of principal and/or interest is 90 days or more past due, unless the collateral is sufficient to cover both principal and interest and the loan is in the process of collection. The Company monitors closely the performance of its loan portfolio. In addition to the monitoring and review of loan performance internally, the Company has contracted with an independent organization to review the Company’s commercial and commercial real estate loan portfolios. This independent review was performed in each of the past five years. The status of delinquent loans, as well as situations identified as potential problems, is reviewed on a regular basisincreased by senior management.
Troubled Debt Restructurings. Loans are considered restructured in a troubled debt restructuring when the Company has granted concessions to a borrower due to the borrower’s financial condition that it otherwise would not have considered. These concessions may include modifications of the terms of the debt such as deferral of payments, extension of maturity, reduction of principal balance, reduction of the stated interest rate other than normal market rate adjustments, or a combination of these concessions. Debt may be bifurcated with separate terms for each tranche of the restructured debt. Restructuring a loan in lieu of aggressively enforcing the collection of the loan may benefit the Company by increasing the ultimate probability of collection.
Restructured loans are classified as accruing or non-accruing based on management’s assessment of the collectability of the loan. Loans which are already on nonaccrual status at the time of the restructuring generally remain on nonaccrual status for approximately six months or longer before management considers such loans for return to accruing status. Accruing restructured loans are placed into nonaccrual status if and when the borrower fails to comply with the restructured terms and management deems it unlikely that the borrower will return to a status of compliance in the near term.
Troubled debt restructurings are classified as impaired loans. The Company identifies loss allocations for impaired loans on an individual loan basis.
Nonperforming loans decreased during 2017 from 2016 primarily as a result of lower TDRs$10.0 million at December 31, 2017,2023 as compared to December 31, 2016. Nonperforming loans increased2022, primarily due to an owner occupied commercial real estate loan placed on non-accrual during 2016 from 2015 primarily as a resultthe fourth quarter of increases in troubled debt restructurings. Nonaccrual loans decreased during 2016, primarily as a result of a decrease in nonperforming commercial mortgage and commercial & industrial loans.2023.
The Company continues to closely monitor closely the portfolio of nonperformingnon-performing loans for which management has concerns regarding the ability of the borrowers to perform. The majority of the loans are secured by real estate and are considered to have adequate collateral value to cover the loan balances at December 31, 20172023 and December 31, 2016,2022, although such values may fluctuate with changes in the economy and the real estate market.
Allowance for Loan Losses In addition to the monitoring and review of loan performance internally, the Company has contracted with an independent organization to review the Company’s commercial and CRE loan portfolios. This independent review was performed in each of the past five years.
Non-accrual Loans. Loans are typically placed on non-accrual status when any payment of principal and/or interest is 90 days or more past due unless the collateral is sufficient to cover both principal and interest and the loan is in the process of collection, or if payment in full of principal or interest is not expected. The Company maintains an allowancemonitors closely the performance of its loan portfolio. The status of delinquent loans, as well as situations identified as potential problems, is reviewed on a regular basis by management.
44
Modifications and Restructurings. The Company adopted ASU 2022-02, which eliminates the recognition and measurement of a troubled debt restructuring (“TDR”). Due to the removal of the TDR designation, the Company evaluates all loan restructurings according to the accounting guidance for loan losses in an amount determined by management onmodifications to determine if the basis of the character of the loans, loan performance, financial condition of borrowers, the value of collateral securing loans, and other relevant factors. We provide for loan losses based upon the consistent application of our documented allowance for loan loss methodology. All loan losses are charged to the allowance for loan losses and all recoveries are credited to it. Additions to the allowance for loan losses are provided by charges to income based on various factors which, in our judgment, deserve current recognition in estimating probable losses. We regularly review the loan portfolio, including a review of our classified assets, and make provisions for loan losses in order to maintain the allowance for loan losses in accordance with GAAP. The allowance for loan losses consists primarily of two components:
|
|
|
|
Actual loan losses may be significantly more than the allowance for loan losses we have established, which could have a material negative effect on our financial results.
The adjustments to historical loss experience are based on our evaluation of several quantitative, qualitative, and environmental factors, including:
the loss emergence period which represents the average amount of time between when loss events occur for specific loan types and when such problem loans are identified and the related loss amounts are confirmed through charge-offs;
changes in any concentration of credit (including, but not limited to, concentrations by geography, industry, or collateral type);
changes in the number and amount of non-accrual loans and past due loans;
changes in national, state, and local economic trends;
changes in the types of loans in the loan portfolio;
changes in the experience and ability of personnel;
changes in lending strategies; and
changes in lending policies and procedures.
In addition, we may establish an unallocated allowance to provide for probable losses that have been incurred as of the reporting date but are not reflected in the allocated allowance.
We evaluate the allowance for loan losses based upon the combined total of the specific and general components. Generally when the loan portfolio increases, absent other factors, the allowance for loan loss methodologyrestructuring results in a higher dollarnew loan or a continuation of the existing loan. Loan modifications to borrowers experiencing financial difficulty that result in a change in the timing or amount of estimated probable losses than would becontractual cash flows include situations where there is principal forgiveness, interest rate reductions, other-than-insignificant payment delays, term extensions, and combinations of the case withoutlisted modifications. Modification of a loan in lieu of aggressively enforcing the increase. Generally, whencollection of the loan portfolio decreases, absent other factors,may benefit the allowance for loan losses methodology results in a lower dollar amountCompany by increasing the ultimate probability of estimated probable losses than would be the case without the decrease. Periodically, management conducts an analysis to estimate the loss emergence period for various loan categoriescollection.
Modified loans are classified as accruing or non-accruing based on samples of historical charge-offs. Model output by loan category is reviewed to evaluate the reasonablenessmanagement’s assessment of the reserve levels in comparison tocollectability of the estimated loss emergence period applied to historical loss experience.
We evaluate the loan portfolioloan. Loans which are already on a quarterly basis and the allowance is adjusted accordingly. While we use the best information available to make evaluations, future adjustments to the allowance may be necessary if conditions differ substantially from the information used in making the evaluations. In addition, various regulatory agencies, as an integral part of their examination process, will periodically review the allowance for loan losses. Such agencies may require us to recognize additions to the allowance based on their analysis of information available to themnon-accrual status at the time of their examination.the modification generally remain on non-accrual status for approximately six months or longer before management considers such loans for return to accruing status. Accruing modified loans are placed into non-accrual status if and when the borrower fails to comply with the modification terms and management deems it unlikely that the borrower will return to a status of compliance in the near term.
During the year ended December 31, 2023, the Company made no loan modifications or restructurings due to borrower financial difficulty.
Allowance for CREDIT Losses
The following table summarizes the changes inratios related to the Company’s allowance for loancredit losses and certain asset quality indicators for the years indicated:
|
| Year ended December 31, |
| |||||||||||||||||
|
| 2017 |
|
| 2016 |
|
| 2015 |
|
| 2014 |
|
| 2013 |
| |||||
|
| (dollars in thousands) |
| |||||||||||||||||
Period-end loans outstanding (net of unearned discount and deferred loan fees) |
| $ | 1,350,899 |
|
| $ | 1,320,154 |
|
| $ | 1,192,214 |
|
| $ | 1,080,766 |
|
| $ | 942,451 |
|
Average loans outstanding (net of unearned discount and deferred loan fees) |
| $ | 1,333,341 |
|
| $ | 1,262,497 |
|
| $ | 1,144,965 |
|
| $ | 993,162 |
|
| $ | 836,427 |
|
Balance of allowance for loan losses at the beginning of year |
| $ | 15,261 |
|
| $ | 15,191 |
|
| $ | 14,269 |
|
| $ | 12,708 |
|
| $ | 10,948 |
|
Loans charged-off: |
|
|
|
|
|
|
|
|
|
|
|
|
|
|
|
|
|
|
|
|
Commercial and industrial |
|
| (284 | ) |
|
| (71 | ) |
|
| (124 | ) |
|
| (20 | ) |
|
| (25 | ) |
Commercial mortgage |
|
| — |
|
|
| — |
|
|
| — |
|
|
| — |
|
|
| — |
|
Residential mortgage |
|
| — |
|
|
| — |
|
|
| (37 | ) |
|
| (13 | ) |
|
| — |
|
Home Equity |
|
| — |
|
|
| — |
|
|
| (1 | ) |
|
| — |
|
|
| (15 | ) |
Consumer |
|
| (39 | ) |
|
| (33 | ) |
|
| (16 | ) |
|
| (12 | ) |
|
| (21 | ) |
Total loans charged-off |
| $ | (323 | ) |
| $ | (104 | ) |
| $ | (178 | ) |
| $ | (45 | ) |
| $ | (61 | ) |
Recovery of loans previously charged-off: |
|
|
|
|
|
|
|
|
|
|
|
|
|
|
|
|
|
|
|
|
Commercial and industrial |
|
| 13 |
|
|
| 14 |
|
|
| 4 |
|
|
| 2 |
|
|
| 237 |
|
Commercial mortgage |
|
| — |
|
|
| 7 |
|
|
| 8 |
|
|
| 9 |
|
|
| 8 |
|
Residential mortgage |
|
| — |
|
|
| 13 |
|
|
| — |
|
|
| — |
|
|
| 59 |
|
Home Equity |
|
| — |
|
|
| 1 |
|
|
| — |
|
|
| — |
|
|
| — |
|
Consumer |
|
| 7 |
|
|
| 7 |
|
|
| 13 |
|
|
| 45 |
|
|
| 17 |
|
Total recoveries of loans previously charged-off: |
|
| 20 |
|
|
| 42 |
|
|
| 25 |
|
|
| 56 |
|
|
| 321 |
|
Net loan (charge-offs) recoveries |
| $ | (303 | ) |
| $ | (62 | ) |
| $ | (153 | ) |
| $ | 11 |
|
| $ | 260 |
|
Provision charged to operating expense |
|
| 362 |
|
|
| 132 |
|
|
| 1,075 |
|
|
| 1,550 |
|
|
| 1,500 |
|
Balance at end of period |
| $ | 15,320 |
|
| $ | 15,261 |
|
| $ | 15,191 |
|
| $ | 14,269 |
|
| $ | 12,708 |
|
Ratio of net (charge-offs) recoveries during the year to average loans outstanding |
|
| (0.02 | )% |
|
| (0.00 | )% |
|
| (0.01 | )% |
|
| 0.00 | % |
|
| 0.03 | % |
Ratio of allowance for loan losses to loans outstanding |
|
| 1.13 | % |
|
| 1.16 | % |
|
| 1.27 | % |
|
| 1.32 | % |
|
| 1.35 | % |
|
| For the Year Ended December 31, |
| |||||||||
|
| 2023 |
|
| 2022 |
|
| 2021 |
| |||
|
| (dollars in thousands) |
| |||||||||
Period-end loans outstanding (net of unearned fees and deferred costs) |
| $ | 4,021,544 |
|
| $ | 4,062,856 |
|
| $ | 3,319,106 |
|
Average loans outstanding (net of unearned fees and deferred costs) |
| $ | 4,029,579 |
|
| $ | 3,600,815 |
|
| $ | 3,240,876 |
|
Loans on non-accrual |
| $ | 16,516 |
|
| $ | 5,839 |
|
| $ | 4,628 |
|
Allowance for credit losses balance at end of period |
| $ | 38,944 |
|
| $ | 37,774 |
|
| $ | 34,496 |
|
Net (charge-offs) recoveries to average loans outstanding- Total |
|
| 0.00 | % |
|
| 0.00 | % |
|
| 0.00 | % |
Non-accrual loans to loans outstanding at year end |
|
| 0.41 | % |
|
| 0.14 | % |
|
| 0.14 | % |
Ratio of allowance for credit losses on loans to loans on non-accrual |
|
| 235.80 | % |
|
| 646.93 | % |
|
| 745.38 | % |
Ratio of allowance for credit losses to loans outstanding |
|
| 0.97 | % |
|
| 0.93 | % |
|
| 1.04 | % |
The level of charge-offs depends on many factors, including the national and regional economy. Cyclical lagging factors may result in charge-offs being higher than historical levels. The dollar amount of the allowance for loan losses increased primarily as a result of loan growth and changes in the portfolio composition. Although the allowance is allocated between categories, the entire allowance is available to absorb losses attributable to all loan categories. Management believes that the allowance for loancredit losses is adequate.
45
The following table presents the ratio of net charge-offs to average loans outstanding within each loan category:
|
| For the Year Ended December 31, | |||||||||||||||||||||||||||||||||||
|
| 2023 |
|
| 2022 |
|
| 2021 |
|
| |||||||||||||||||||||||||||
|
| Average Balance |
|
| Net (Charge-offs) Recoveries |
|
| Net (Charge-offs) Recoveries to Total Average Loans |
|
| Average Balance |
|
| Net (Charge-offs) Recoveries |
|
| Net (Charge-offs) Recoveries to Total Average Loans |
|
| Average Balance |
|
| Net (Charge-offs) Recoveries |
|
| Net (Charge-offs) Recoveries to Total Average Loans |
|
| |||||||||
|
| (dollars in thousands) |
|
| |||||||||||||||||||||||||||||||||
Residential mortgages |
| $ | 1,629,768 |
|
|
| — |
|
|
| 0.00 |
| % | $ | 1,508,546 |
|
|
| 4 |
|
|
| 0.00 |
| % | $ | 1,343,112 |
|
|
| (4 | ) |
|
| 0.00 |
| % |
Commercial mortgages |
|
| 1,916,154 |
|
|
| — |
|
|
| 0.00 |
|
|
| 1,661,235 |
|
|
| — |
|
|
| 0.00 |
|
|
| 1,424,126 |
|
|
| 30 |
|
|
| 0.00 |
|
|
Home equity |
|
| 97,906 |
|
|
| — |
|
|
| 0.00 |
|
|
| 95,441 |
|
|
| — |
|
|
| 0.00 |
|
|
| 94,949 |
|
|
| — |
|
|
| 0.00 |
|
|
Commercial and industrial |
|
| 352,744 |
|
|
| (25 | ) |
|
| 0.00 |
|
|
| 292,872 |
|
|
| 66 |
|
|
| 0.00 |
|
|
| 338,494 |
|
|
| 140 |
|
|
| 0.00 |
|
|
Consumer |
|
| 35,607 |
|
|
| (45 | ) |
|
| 0.00 |
|
|
| 42,721 |
|
|
| (17 | ) |
|
| 0.00 |
|
|
| 40,195 |
|
|
| (12 | ) |
|
| 0.00 |
|
|
Total |
| $ | 4,032,179 |
|
|
| (70 | ) |
|
| 0.00 |
| % | $ | 3,600,815 |
|
|
| 53 |
|
|
| 0.00 |
| % | $ | 3,240,876 |
|
|
| 154 |
|
|
| 0.00 |
| % |
The following table presents the allocation of the allowance for credit losses for loans by loan category:
|
|
|
| |||||||||||||||||||||
|
| December 31, 2023 |
|
| December 31, 2022 |
| ||||||||||||||||||
|
| Allowance Amount |
|
| % of Allowance |
|
| % of Total Loans |
|
| Allowance Amount |
|
| % of Allowance |
|
| % of Total Loans |
| ||||||
|
| (dollars in thousands) |
| |||||||||||||||||||||
Residential mortgages |
| $ | 8,399 |
|
|
| 22 | % |
|
| 40 | % |
| $ | 13,321 |
|
|
| 35 | % |
|
| 40 | % |
Commercial mortgages |
|
| 24,452 |
|
|
| 63 |
|
|
| 48 |
|
|
| 19,086 |
|
| 50 |
|
| 47 |
| ||
Home equity |
|
| 580 |
|
|
| 1 |
|
|
| 2 |
|
|
| 573 |
|
| 2 |
|
| 3 |
| ||
Commercial and industrial |
|
| 4,940 |
|
|
| 13 |
|
|
| 9 |
|
|
| 4,153 |
|
| 11 |
|
| 9 |
| ||
Consumer |
|
| 573 |
|
|
| 1 |
|
|
| 1 |
|
|
| 641 |
|
| 2 |
|
| 1 |
| ||
Total Allowance |
| $ | 38,944 |
|
|
| 100 | % |
|
| 100 | % |
| $ | 37,774 |
|
|
| 100 | % |
|
| 100 | % |
See additional discussion regarding the allowance for credit losses in Item 7 under the caption “Critical Accounting Estimates” and in Note 7 to the Audited Consolidated Financial Statements.
Sources of Funds
General. Deposits traditionally have been ourthe Company's primary source of funds for ourits investment and lending activities. The Company can also borrowsborrow from the FHLB of Boston and the Federal Reserve Bank of Boston (“FRB of Boston”), and can utilize repurchase agreements and brokered deposits to supplement cash flow needs, to lengthen the maturities of liabilities for interest rate risk management purposes, and to manage our cost of funds. OurThe Company's additional sources of funds are scheduled payments and prepayments of principal and interest on loans and investment securities, and fee income, and proceeds from the sales of loans and securities.
Deposits. The Company accepts deposits primarily from customersclients in the communities in which ourits branches and offices are located, as well as from small- and medium-sized businesses and other customersclients throughout ourits lending area. We relyThe Company relies on ourits competitive pricing and products, convenient locations, and client service to attract and retain deposits. We offerThe Company offers a variety of deposit accounts with a range of interest rates and terms. Our deposit accounts consist of relationship checking for consumers and businesses, statement savings accounts, certificates of deposit, money market accounts, interest on lawyer trust accounts, commercial and regular checking accounts, and individual retirement accounts. Deposit rates and terms are based primarily on current business strategies, market interest rates, liquidity requirements, and ourthe Company's deposit growth goals. The BankCompany may also access the brokeredwholesale deposit market for funding.
46
The following table sets forth the Company’s deposits for the periods indicated:
|
| December 31, 2023 | December 31, 2022 |
|
| ||||||||||||
|
| Amount |
|
| Percent |
|
| Amount |
|
| Percent |
|
| ||||
|
| (dollars in thousands) |
|
| |||||||||||||
Demand deposits (non-interest bearing) |
| $ | 1,032,413 |
|
|
| 23.9 |
| % | $ | 1,366,395 |
|
|
| 28.4 |
| % |
Interest-bearing checking |
|
| 1,132,518 |
|
|
| 26.2 |
|
|
| 908,961 |
|
|
| 18.9 |
|
|
Money market |
|
| 983,480 |
|
|
| 22.8 |
|
|
| 1,162,773 |
|
|
| 24.1 |
|
|
Savings |
|
| 498,386 |
|
|
| 11.6 |
|
|
| 790,628 |
|
|
| 16.4 |
|
|
Retail certificates of deposit under $250,000 |
|
| 212,694 |
|
|
| 4.9 |
|
|
| 117,532 |
|
|
| 2.5 |
|
|
Retail certificates of deposit of $250,000 or greater |
|
| 170,020 |
|
|
| 3.9 |
|
|
| 87,528 |
|
|
| 1.8 |
|
|
Wholesale certificates of deposit |
|
| 291,667 |
|
|
| 6.7 |
|
|
| 381,559 |
|
|
| 7.9 |
|
|
Total |
| $ | 4,321,178 |
|
|
| 100.0 |
| % | $ | 4,815,376 |
|
|
| 100.0 |
| % |
At December 31, 2017, we2023, the Company had a total of $107.2$382.7 million in certificates of deposit, excluding brokered deposits, of which $65.2$363.9 millionhad remaining maturities of one year or less. Based on historical experience and our current pricing strategy, we believe the Bank will retain a large portion of these accounts upon maturity. The BankCompany had total brokered deposits of $52.7 million, $56.3$291.7 million and $56.3$381.6 million at December 31, 2017, 2016,2023 and 2015,2022, respectively. Brokered deposits at December 31, 2023 and December 31, 2022 had remaining maturities of less than six months.
The following table set forthamount of deposits above the average balancesFDIC’s limit of the Bank’s deposits for the periods indicated:$250,000 was $1.42 billion and $2.50 billion as of December 31, 2023 and 2022, respectively.
|
| December 31, |
| |||||||||||||||||||||||||||||||||
|
| 2017 |
|
| 2016 |
|
| 2015 |
| |||||||||||||||||||||||||||
|
| Amount |
|
| Percent |
|
| Weighted Average Rate |
|
| Amount |
|
| Percent |
|
| Weighted Average Rate |
|
| Amount |
|
| Percent |
|
| Weighted Average Rate |
| |||||||||
|
| (dollars in thousands) |
| |||||||||||||||||||||||||||||||||
Demand deposits (non-interest bearing) |
| $ | 470,871 |
|
|
| 28.2 | % |
|
| — |
|
| $ | 454,977 |
|
|
| 28.2 | % |
|
| — |
|
| $ | 421,886 |
|
|
| 29.5 | % |
|
| — |
|
Interest bearing checking |
|
| 394,132 |
|
|
| 23.6 | % |
|
| 0.05 | % |
|
| 365,946 |
|
|
| 22.7 | % |
|
| 0.02 | % |
|
| 326,454 |
|
|
| 22.8 | % |
|
| 0.03 | % |
Money Market |
|
| 68,891 |
|
|
| 4.1 | % |
|
| 0.15 | % |
|
| 79,409 |
|
|
| 4.9 | % |
|
| 0.15 | % |
|
| 82,365 |
|
|
| 5.8 | % |
|
| 0.20 | % |
Savings |
|
| 571,659 |
|
|
| 34.2 | % |
|
| 0.35 | % |
|
| 538,297 |
|
|
| 33.3 | % |
|
| 0.23 | % |
|
| 449,497 |
|
|
| 31.4 | % |
|
| 0.32 | % |
Retail certificates of deposit under $100,000 |
|
| 40,447 |
|
|
| 2.4 | % |
|
| 0.49 | % |
|
| 44,394 |
|
|
| 2.7 | % |
|
| 0.51 | % |
|
| 48,097 |
|
|
| 3.4 | % |
|
| 0.54 | % |
Retail certificates of deposit of $100,000 or greater |
|
| 71,030 |
|
|
| 4.2 | % |
|
| 0.64 | % |
|
| 75,861 |
|
|
| 4.7 | % |
|
| 0.63 | % |
|
| 77,468 |
|
|
| 5.4 | % |
|
| 0.61 | % |
Wholesale certificates of deposit |
|
| 54,933 |
|
|
| 3.3 | % |
|
| 1.56 | % |
|
| 56,295 |
|
|
| 3.5 | % |
|
| 1.38 | % |
|
| 24,449 |
|
|
| 1.7 | % |
|
| 1.38 | % |
Total |
| $ | 1,671,963 |
|
|
| 100 | % |
|
| 0.23 | % |
| $ | 1,615,179 |
|
|
| 100 | % |
|
| 0.18 | % |
| $ | 1,430,216 |
|
|
| 100 | % |
|
| 0.19 | % |
CertificatesRetail certificates of deposit of $100,000$250,000 or greater by maturity are as follows:
|
| December 31, |
| |||||||||
|
| 2017 |
|
| 2016 |
|
| 2015 |
| |||
|
| (dollars in thousands) |
| |||||||||
Less than 3 months remaining |
| $ | 22,995 |
|
| $ | 20,363 |
|
| $ | 26,050 |
|
3 to 5 months remaining |
|
| 10,535 |
|
|
| 9,751 |
|
|
| 9,362 |
|
6 to 11 months remaining |
|
| 6,361 |
|
|
| 8,583 |
|
|
| 10,698 |
|
12 months or more remaining |
|
| 29,202 |
|
|
| 33,658 |
|
|
| 29,748 |
|
Total |
| $ | 69,093 |
|
| $ | 72,355 |
|
| $ | 75,858 |
|
|
|
|
| |||||
|
| December 31, 2023 |
|
| December 31, 2022 |
| ||
|
| (dollars in thousands) |
| |||||
Within three months |
| $ | 51,355 |
|
| $ | 32,560 |
|
Over 3 months, within six months |
|
| 68,770 |
|
|
| 16,162 |
|
Over six months, within twelve months |
|
| 43,709 |
|
|
| 18,152 |
|
Over twelve months. |
|
| 6,186 |
|
|
| 20,654 |
|
Total |
| $ | 170,020 |
|
| $ | 87,528 |
|
Retail certificates of deposit of $100,000 or greater totaled $69.1 million, $74.2 million and $72.4 million at December 31, 2017, 2016 and 2015, respectively. Interest expense on retail certificates of deposit of $100,000$250,000 or greater was $446,000, $475,000$3.9 million, $385,000, and $482,000$551,000 for the years ended December 31, 2017, 20162023, December 31, 2022, and 2015,December 31, 2021, respectively.
The following table sets forth certificates of deposit, excluding brokered deposits, classified by interest rate as of the dates indicated:
|
| December 31, |
|
|
|
| ||||||||||||||
|
| 2017 |
|
| 2016 |
|
| 2015 |
|
| December 31, 2023 |
|
| December 31, 2022 |
| |||||
|
| (dollars in thousands) |
|
| (dollars in thousands) |
| ||||||||||||||
Interest Rate: |
|
|
|
|
|
|
|
|
|
|
|
|
|
|
|
|
|
| ||
Less than 1.00% |
| $ | 75,284 |
|
| $ | 84,971 |
|
| $ | 100,302 |
| ||||||||
0.00% to 0.50% |
| $ | 56,255 |
|
| $ | 101,559 |
| ||||||||||||
0.51% to 1.00% |
|
| 2,787 |
|
|
| 26,606 |
| ||||||||||||
1.00% to 1.99% |
|
| 84,546 |
|
|
| 86,191 |
|
|
| 78,088 |
|
|
| 2,961 |
|
|
| 28,736 |
|
2.00% to 2.99% |
|
| 4,844 |
|
|
| 11,009 |
| ||||||||||||
3.00% to 3.99% |
|
| 9,867 |
|
|
| 19,493 |
| ||||||||||||
4.00% to 4.99% |
|
| 226,857 |
|
|
| 17,657 |
| ||||||||||||
5.00% to 5.99% |
|
| 79,143 |
|
|
| - |
| ||||||||||||
Total |
| $ | 159,830 |
|
| $ | 171,162 |
|
| $ | 178,390 |
|
| $ | 382,714 |
|
| $ | 205,060 |
|
Borrowings. Total borrowings were $452.2 million, an increase of $346.9 millionas compared to $105.2 million at December 31, 2022.The Bank’sCompany’s borrowings at December 31, 2023 consisted primarily of advances from the FHLB of Boston, and the FHLB of Boston and repurchase agreements at December 31, 2022. FHLB of Boston advances are collateralized by a blanket pledge agreement on the Bank’sCompany’s FHLB of Boston stock and residential mortgages held in the Bank’s portfolios. The Bank’s borrowings with the FHLB of Boston totaled $3.6 millionCompany pledged investment securities as collateral for its repurchase agreements at December 31, 2017, a decrease of $167,000 compared to $3.7 million at December 31, 2016. 2022.
The Bank’sCompany’s remaining borrowing capacity at the FHLB of Boston at December 31, 20172023 was approximately $302.1 $522.4million. In addition, the BankCompany has a $10.0 million line of credit with the FHLB of Boston. See Note 11, “Borrowings,” forBoston and a schedule, including related interest rates$10.0 million line of credit with a correspondent bank.
47
In March 2023, the Federal Reserve Board announced the creation of a new Bank Term Funding Program (“BTFP”). The BTFP offers loans of up to one year in length to banks, savings associations, credit unions, and other information.eligible depository institutions pledging U.S. Treasuries, agency debt and mortgage-backed securities, and other qualifying assets as collateral. These assets will be valued at par.
The Company had no borrowings outstanding with the FRB of Boston at December 31, 2023 or 2022. The Company’s remaining borrowing capacity at the FRB of Boston at December 31, 2023 was approximately $1.8 billion, inclusive of approximately $192.7 million in estimated borrowing capacity through the FRB Term Funding program, which is ending in March 2024, if the Company were to pledge assets under the BTFP.
The Company periodically enters into repurchase agreements with its larger deposit and commercial clients as part of its cash management services which are typically overnight borrowings. There were no repurchase agreements with clients at December 31, 2023. Repurchase agreements with clients totaled $5.0 million at December 31, 2022.
48
Net Interest MarginMargiN
Net interest income represents the difference between interest earned, primarily on loans and investments, and interest paid on funding sources, primarily deposits and borrowings. Interest rate spread is the difference between the average rate earned on total interest-earning assets and the average rate paid on total interest-bearing liabilities. Net interest margin is the amount of net interest income, on a fully taxable-equivalent basis, expressed as a percentage of average interest-earning assets. The average rate earned on earning assets is the amount of annualized taxable equivalent interest income expressed as a percentage of average earning assets. The average rate paid on interest-bearing liabilities is equal to annualized interest expense as a percentage of average interest-bearing liabilities.
The following table sets forth the distribution of the Company’s daily average assets, liabilities and shareholders’ equity, and average rates earned or paid on a fully taxable equivalent basis for each of the periods indicated:
|
| Year Ended |
| |||||||||||||||||||||||||||||||||
|
| December 31, 2023 |
|
| December 31, 2022 |
|
| December 31, 2021 |
| |||||||||||||||||||||||||||
|
| Average |
|
| Interest |
|
| Rate |
|
| Average |
|
| Interest |
|
| Rate |
|
| Average |
|
| Interest |
|
| Rate |
| |||||||||
|
| (dollars in thousands) |
| |||||||||||||||||||||||||||||||||
ASSETS |
|
|
|
|
|
|
|
|
|
|
|
|
|
|
|
|
|
|
|
|
|
|
|
|
|
|
| |||||||||
Interest-earning assets |
|
|
|
|
|
|
|
|
|
|
|
|
|
|
|
|
|
|
|
|
|
|
|
|
|
|
| |||||||||
Loans (2) |
|
|
|
|
|
|
|
|
|
|
|
|
|
|
|
|
|
|
|
|
|
|
|
|
|
|
| |||||||||
Taxable |
| $ | 3,977,438 |
|
| $ | 193,483 |
|
|
| 4.86 | % |
| $ | 3,552,934 |
|
| $ | 135,965 |
|
|
| 3.83 | % |
| $ | 3,203,126 |
|
| $ | 120,019 |
|
|
| 3.75 | % |
Tax-exempt |
|
| 52,141 |
|
|
| 1,969 |
|
|
| 3.78 |
|
|
| 47,881 |
|
|
| 1,832 |
|
|
| 3.83 |
|
|
| 37,750 |
|
|
| 1,525 |
|
|
| 4.04 |
|
Securities available for sale (3) |
|
|
|
|
|
|
|
|
|
|
|
|
|
|
|
|
|
|
|
|
|
|
|
|
|
|
| |||||||||
Taxable |
|
| 173,034 |
|
|
| 2,758 |
|
|
| 1.59 |
|
|
| 194,612 |
|
|
| 2,680 |
|
|
| 1.38 |
|
|
| 217,096 |
|
|
| 2,617 |
|
|
| 1.21 |
|
Securities held to maturity |
|
|
|
|
|
|
|
|
|
|
|
|
|
|
|
|
|
|
|
|
|
|
|
|
|
|
| |||||||||
Taxable |
|
| 917,057 |
|
|
| 16,831 |
|
|
| 1.84 |
|
|
| 978,321 |
|
|
| 16,875 |
|
|
| 1.72 |
|
|
| 424,499 |
|
|
| 6,847 |
|
|
| 1.61 |
|
Tax-exempt |
|
| 90,361 |
|
|
| 2,804 |
|
|
| 3.10 |
|
|
| 100,057 |
|
|
| 3,135 |
|
|
| 3.13 |
|
|
| 104,114 |
|
|
| 3,329 |
|
|
| 3.20 |
|
Cash and cash equivalents |
|
| 38,219 |
|
|
| 722 |
|
|
| 1.89 |
|
|
| 64,790 |
|
|
| 262 |
|
|
| 0.40 |
|
|
| 141,278 |
|
|
| 150 |
|
|
| 0.11 |
|
Total interest-earning assets (4) |
|
| 5,248,250 |
|
|
| 218,567 |
|
|
| 4.16 | % |
|
| 4,938,595 |
|
|
| 160,749 |
|
|
| 3.25 | % |
|
| 4,127,863 |
|
|
| 134,487 |
|
|
| 3.26 | % |
Non-interest-earning assets |
|
| 275,919 |
|
|
|
|
|
|
|
|
| 246,813 |
|
|
|
|
|
|
|
|
| 251,652 |
|
|
|
|
|
|
| ||||||
Allowance for credit losses |
|
| (38,039 | ) |
|
|
|
|
|
|
|
| (35,072 | ) |
|
|
|
|
|
|
|
| (35,642 | ) |
|
|
|
|
|
| ||||||
Total assets |
| $ | 5,486,130 |
|
|
|
|
|
|
|
| $ | 5,150,336 |
|
|
|
|
|
|
|
| $ | 4,343,873 |
|
|
|
|
|
|
| ||||||
LIABILITIES AND SHAREHOLDERS’ |
|
|
|
|
|
|
|
|
|
|
|
|
|
|
|
|
|
|
|
|
|
|
|
|
|
|
| |||||||||
Interest-bearing deposits |
|
|
|
|
|
|
|
|
|
|
|
|
|
|
|
|
|
|
|
|
|
|
|
|
|
|
| |||||||||
Checking accounts |
| $ | 1,090,277 |
|
| $ | 18,653 |
|
|
| 1.71 | % |
| $ | 753,001 |
|
| $ | 1,285 |
|
|
| 0.17 | % |
| $ | 675,753 |
|
| $ | 265 |
|
|
| 0.04 | % |
Savings accounts |
|
| 629,406 |
|
|
| 5,919 |
|
|
| 0.94 |
|
|
| 897,146 |
|
|
| 1,554 |
|
|
| 0.17 |
|
|
| 957,039 |
|
|
| 861 |
|
|
| 0.09 |
|
Money market accounts |
|
| 1,017,535 |
|
|
| 30,107 |
|
|
| 2.96 |
|
|
| 1,165,793 |
|
|
| 7,999 |
|
|
| 0.69 |
|
|
| 765,021 |
|
|
| 2,769 |
|
|
| 0.36 |
|
Certificates of deposit |
|
| 717,106 |
|
|
| 30,286 |
|
|
| 4.22 |
|
|
| 240,468 |
|
|
| 3,760 |
|
|
| 1.56 |
|
|
| 209,311 |
|
|
| 1,079 |
|
|
| 0.52 |
|
Total interest-bearing deposits |
|
| 3,454,324 |
|
|
| 84,965 |
|
|
| 2.46 | % |
|
| 3,056,408 |
|
|
| 14,598 |
|
|
| 0.48 | % |
|
| 2,607,124 |
|
|
| 4,974 |
|
|
| 0.19 | % |
Other borrowed funds |
|
| 254,387 |
|
|
| 12,763 |
|
|
| 5.02 |
|
|
| 85,580 |
|
|
| 2,180 |
|
|
| 2.55 |
|
|
| 18,466 |
|
|
| 559 |
|
|
| 3.03 |
|
Total interest-bearing liabilities |
|
| 3,708,711 |
|
|
| 97,728 |
|
|
| 2.64 | % |
|
| 3,141,988 |
|
|
| 16,778 |
|
|
| 0.53 | % |
|
| 2,625,590 |
|
|
| 5,533 |
|
|
| 0.21 | % |
Non-interest-bearing liabilities |
|
|
|
|
|
|
|
|
|
|
|
|
|
|
|
|
|
|
|
|
|
|
|
|
|
|
| |||||||||
Demand deposits |
|
| 1,134,875 |
|
|
|
|
|
|
|
|
| 1,446,745 |
|
|
|
|
|
|
|
|
| 1,197,056 |
|
|
|
|
|
|
| ||||||
Other liabilities |
|
| 117,872 |
|
|
|
|
|
|
|
|
| 104,063 |
|
|
|
|
|
|
|
|
| 103,459 |
|
|
|
|
|
|
| ||||||
Total liabilities |
|
| 4,961,458 |
|
|
|
|
|
|
|
|
| 4,692,796 |
|
|
|
|
|
|
|
|
| 3,926,105 |
|
|
|
|
|
|
| ||||||
Shareholders’ equity |
|
| 524,672 |
|
|
|
|
|
|
|
|
| 457,540 |
|
|
|
|
|
|
|
|
| 417,768 |
|
|
|
|
|
|
| ||||||
Total liabilities & shareholders’ equity |
| $ | 5,486,130 |
|
|
|
|
|
|
|
| $ | 5,150,336 |
|
|
|
|
|
|
|
| $ | 4,343,873 |
|
|
|
|
|
|
| ||||||
Net interest income on a fully taxable equivalent |
|
|
|
|
| 120,839 |
|
|
|
|
|
|
|
|
| 143,971 |
|
|
|
|
|
|
|
|
| 128,954 |
|
|
|
| ||||||
Less taxable equivalent adjustment |
|
|
|
|
| (1,003 | ) |
|
|
|
|
|
|
|
| (1,043 | ) |
|
|
|
|
|
|
|
| (1,019 | ) |
|
|
| ||||||
Net interest income |
|
|
|
| $ | 119,836 |
|
|
|
|
|
|
|
| $ | 142,928 |
|
|
|
|
|
|
|
| $ | 127,935 |
|
|
|
| ||||||
Net interest spread (5) |
|
|
|
|
|
|
|
| 1.53 | % |
|
|
|
|
|
|
|
| 2.72 | % |
|
|
|
|
|
|
|
| 3.05 | % | ||||||
Net interest margin (6) |
|
|
|
|
|
|
|
| 2.30 | % |
|
|
|
|
|
|
|
| 2.92 | % |
|
|
|
|
|
|
|
| 3.12 | % | ||||||
|
| For the Year Ended |
| |||||||||||||||||||||||||||||||||
|
| December 31, 2017 |
|
| December 31, 2016 |
|
| December 31, 2015 |
| |||||||||||||||||||||||||||
|
| Average Balance |
|
| Interest Income/ Expenses (1) |
|
| Rate Earned/ Paid (1) |
|
| Average Balance |
|
| Interest Income/ Expenses (1) |
|
| Rate Earned/ Paid (1) |
|
| Average Balance |
|
| Interest Income/ Expenses (1) |
|
| Rate Earned/ Paid (1) |
| |||||||||
|
| (dollars in thousands) |
| |||||||||||||||||||||||||||||||||
ASSETS |
|
|
|
|
|
|
|
|
|
|
|
|
|
|
|
|
|
|
|
|
|
|
|
|
|
|
|
|
|
|
|
|
|
|
|
|
Interest-earning assets |
|
|
|
|
|
|
|
|
|
|
|
|
|
|
|
|
|
|
|
|
|
|
|
|
|
|
|
|
|
|
|
|
|
|
|
|
Loans (2) |
|
|
|
|
|
|
|
|
|
|
|
|
|
|
|
|
|
|
|
|
|
|
|
|
|
|
|
|
|
|
|
|
|
|
|
|
Taxable |
| $ | 1,318,284 |
|
| $ | 51,238 |
|
|
| 3.89 | % |
| $ | 1,249,205 |
|
| $ | 48,353 |
|
|
| 3.87 | % |
| $ | 1,137,992 |
|
| $ | 45,149 |
|
|
| 3.97 | % |
Tax-exempt |
|
| 15,057 |
|
|
| 764 |
|
|
| 5.07 |
|
|
| 15,973 |
|
|
| 638 |
|
|
| 3.99 |
|
|
| 7,990 |
|
|
| 322 |
|
|
| 4.03 |
|
Securities available for sale (3) |
|
|
|
|
|
|
|
|
|
|
|
|
|
|
|
|
|
|
|
|
|
|
|
|
|
|
|
|
|
|
|
|
|
|
|
|
Taxable |
|
| 248,787 |
|
|
| 4,011 |
|
|
| 1.61 |
|
|
| 334,292 |
|
|
| 5,184 |
|
|
| 1.55 |
|
|
| 343,589 |
|
|
| 5,841 |
|
|
| 1.70 |
|
Securities held to maturity |
|
|
|
|
|
|
|
|
|
|
|
|
|
|
|
|
|
|
|
|
|
|
|
|
|
|
|
|
|
|
|
|
|
|
|
|
Taxable |
|
| 111,452 |
|
|
| 2,310 |
|
|
| 2.07 |
|
|
| 979 |
|
|
| 46 |
|
|
| 4.70 |
|
|
| 1,754 |
|
|
| 80 |
|
|
| 4.56 |
|
Tax-exempt |
|
| 81,528 |
|
|
| 4,000 |
|
|
| 4.91 |
|
|
| 82,797 |
|
|
| 4,211 |
|
|
| 5.09 |
|
|
| 79,238 |
|
|
| 4,256 |
|
|
| 5.37 |
|
Cash and due from banks |
|
| 41,888 |
|
|
| 291 |
|
|
| 0.69 |
|
|
| 35,895 |
|
|
| 114 |
|
|
| 0.32 |
|
|
| 26,062 |
|
|
| 37 |
|
|
| 0.14 |
|
Total interest-earning assets (4) |
|
| 1,816,996 |
|
|
| 62,614 |
|
|
| 3.45 | % |
|
| 1,719,141 |
|
|
| 58,546 |
|
|
| 3.41 | % |
|
| 1,596,625 |
|
|
| 55,685 |
|
|
| 3.49 | % |
Non interest-earning assets |
|
| 73,532 |
|
|
|
|
|
|
|
|
|
|
| 73,559 |
|
|
|
|
|
|
|
|
|
|
| 71,490 |
|
|
|
|
|
|
|
|
|
Allowance for loan losses |
|
| (15,392 | ) |
|
|
|
|
|
|
|
|
|
| (15,371 | ) |
|
|
|
|
|
|
|
|
|
| (14,910 | ) |
|
|
|
|
|
|
|
|
Total assets |
| $ | 1,875,136 |
|
|
|
|
|
|
|
|
|
| $ | 1,777,329 |
|
|
|
|
|
|
|
|
|
| $ | 1,653,205 |
|
|
|
|
|
|
|
|
|
LIABILITIES AND SHAREHOLDERS’ EQUITY |
|
|
|
|
|
|
|
|
|
|
|
|
|
|
|
|
|
|
|
|
|
|
|
|
|
|
|
|
|
|
|
|
|
|
|
|
Interest-bearing deposits |
|
|
|
|
|
|
|
|
|
|
|
|
|
|
|
|
|
|
|
|
|
|
|
|
|
|
|
|
|
|
|
|
|
|
|
|
Checking accounts |
| $ | 394,132 |
|
| $ | 131 |
|
|
| 0.03 | % |
| $ | 365,946 |
|
| $ | 82 |
|
|
| 0.02 | % |
| $ | 326,454 |
|
| $ | 106 |
|
|
| 0.03 | % |
Savings accounts |
|
| 571,659 |
|
|
| 1,457 |
|
|
| 0.25 |
|
|
| 538,297 |
|
|
| 1,567 |
|
|
| 0.29 |
|
|
| 449,497 |
|
|
| 1,118 |
|
|
| 0.25 |
|
Money market accounts |
|
| 68,891 |
|
|
| 103 |
|
|
| 0.15 |
|
|
| 79,409 |
|
|
| 131 |
|
|
| 0.16 |
|
|
| 82,365 |
|
|
| 164 |
|
|
| 0.20 |
|
Certificates of deposit |
|
| 166,410 |
|
|
| 1,434 |
|
|
| 0.86 |
|
|
| 176,550 |
|
|
| 1,480 |
|
|
| 0.84 |
|
|
| 150,014 |
|
|
| 1,071 |
|
|
| 0.71 |
|
Total interest-bearing deposits |
|
| 1,201,092 |
|
|
| 3,125 |
|
|
| 0.26 | % |
|
| 1,160,202 |
|
|
| 3,260 |
|
|
| 0.28 | % |
|
| 1,008,330 |
|
|
| 2,459 |
|
|
| 0.24 | % |
Other borrowed funds |
|
| 36,074 |
|
|
| 462 |
|
|
| 1.28 |
|
|
| 7,489 |
|
|
| 95 |
|
|
| 1.27 |
|
|
| 82,557 |
|
|
| 235 |
|
|
| 0.28 |
|
Total interest-bearing liabilities |
|
| 1,237,166 |
|
|
| 3,587 |
|
|
| 0.29 | % |
|
| 1,167,691 |
|
|
| 3,355 |
|
|
| 0.29 | % |
|
| 1,090,887 |
|
|
| 2,694 |
|
|
| 0.25 | % |
Non-interest-bearing liabilities |
|
|
|
|
|
|
|
|
|
|
|
|
|
|
|
|
|
|
|
|
|
|
|
|
|
|
|
|
|
|
|
|
|
|
|
|
Demand deposits |
|
| 470,871 |
|
|
|
|
|
|
|
|
|
|
| 454,977 |
|
|
|
|
|
|
|
|
|
|
| 421,886 |
|
|
|
|
|
|
|
|
|
Other liabilities |
|
| 25,611 |
|
|
|
|
|
|
|
|
|
|
| 22,394 |
|
|
|
|
|
|
|
|
|
|
| 18,828 |
|
|
|
|
|
|
|
|
|
Total liabilities |
|
| 1,733,648 |
|
|
|
|
|
|
|
|
|
|
| 1,645,062 |
|
|
|
|
|
|
|
|
|
|
| 1,531,601 |
|
|
|
|
|
|
|
|
|
Shareholders’ equity |
|
| 141,488 |
|
|
|
|
|
|
|
|
|
|
| 132,267 |
|
|
|
|
|
|
|
|
|
|
| 121,604 |
|
|
|
|
|
|
|
|
|
Total liabilities & shareholders’ equity |
| $ | 1,875,136 |
|
|
|
|
|
|
|
|
|
| $ | 1,777,329 |
|
|
|
|
|
|
|
|
|
| $ | 1,653,205 |
|
|
|
|
|
|
|
|
|
Net interest income on a fully taxable equivalent basis |
|
|
|
|
|
| 59,027 |
|
|
|
|
|
|
|
|
|
|
| 55,191 |
|
|
|
|
|
|
|
|
|
|
| 52,991 |
|
|
|
|
|
Less taxable equivalent adjustment |
|
|
|
|
|
| (1,668 | ) |
|
|
|
|
|
|
|
|
|
| (1,697 | ) |
|
|
|
|
|
|
|
|
|
| (1,603 | ) |
|
|
|
|
Net interest income |
|
|
|
|
| $ | 57,359 |
|
|
|
|
|
|
|
|
|
| $ | 53,494 |
|
|
|
|
|
|
|
|
|
| $ | 51,388 |
|
|
|
|
|
Net interest spread (5) |
|
|
|
|
|
|
|
|
|
| 3.16 | % |
|
|
|
|
|
|
|
|
|
| 3.12 | % |
|
|
|
|
|
|
|
|
|
| 3.24 | % |
Net interest margin (6) |
|
|
|
|
|
|
|
|
|
| 3.25 | % |
|
|
|
|
|
|
|
|
|
| 3.21 | % |
|
|
|
|
|
|
|
|
|
| 3.32 | % |
|
|
|
|
|
|
|
|
|
|
49 |
|
The following table describes the extent to which changes in interest rates and changes in the volume of interest-earning assets and interest-bearing liabilities have affected the Company’s interest income and interest expense during the periods indicated. Information is provided in each category with respect to: (i) changes attributable to changes in volumes (changes in average balance multiplied by prior year average rate), (ii) changes attributable to changes in rate (change in average interest rate multiplied by prior year average balance), and (iii) changes attributable to the combined impact of volumes and rates have been allocated proportionately to separate volume and rate categories.
|
| Year Ended December 31, 2023 |
|
| Year Ended December 31, 2022 |
| ||||||||||||||||||
|
| Compared with |
|
| Compared with |
| ||||||||||||||||||
|
| Year Ended December 31, 2022 |
|
| Year Ended December 31, 2021 |
| ||||||||||||||||||
|
| Increase/(Decrease) |
|
| Increase/(Decrease) |
| ||||||||||||||||||
|
| Volume |
|
| Rate |
|
| Total |
|
| Volume |
|
| Rate |
|
| Total |
| ||||||
|
| (dollars in thousands) |
|
| (dollars in thousands) |
| ||||||||||||||||||
Interest income |
|
|
|
|
|
|
|
|
|
|
|
|
|
|
|
|
|
| ||||||
Loans |
|
|
|
|
|
|
|
|
|
|
|
|
|
|
|
|
|
| ||||||
Taxable |
| $ | 17,592 |
|
| $ | 39,926 |
|
| $ | 57,518 |
|
| $ | 13,341 |
|
| $ | 2,605 |
|
| $ | 15,946 |
|
Tax-exempt |
|
| 161 |
|
|
| (24 | ) |
|
| 137 |
|
|
| 391 |
|
|
| (84 | ) |
|
| 307 |
|
Securities available for sale |
|
|
|
|
|
|
|
|
|
|
|
|
|
|
|
|
|
| ||||||
Taxable |
|
| (316 | ) |
|
| 394 |
|
|
| 78 |
|
|
| (287 | ) |
|
| 350 |
|
|
| 63 |
|
Securities held to maturity |
|
|
|
|
|
|
|
|
|
|
|
|
|
|
|
|
|
| ||||||
Taxable |
|
| (1,090 | ) |
|
| 1,046 |
|
|
| (44 | ) |
|
| 9,522 |
|
|
| 506 |
|
|
| 10,028 |
|
Tax-exempt |
|
| (301 | ) |
|
| (30 | ) |
|
| (331 | ) |
|
| (128 | ) |
|
| (66 | ) |
|
| (194 | ) |
Cash and cash equivalents |
|
| (147 | ) |
|
| 607 |
|
|
| 460 |
|
|
| (118 | ) |
|
| 230 |
|
|
| 112 |
|
Total interest income |
| $ | 15,899 |
|
| $ | 41,919 |
|
| $ | 57,818 |
|
| $ | 22,721 |
|
| $ | 3,541 |
|
| $ | 26,262 |
|
Interest expense |
|
|
|
|
|
|
|
|
|
|
|
|
|
|
|
|
|
| ||||||
Deposits |
|
|
|
|
|
|
|
|
|
|
|
|
|
|
|
|
|
| ||||||
Checking accounts |
|
| 821 |
|
|
| 16,547 |
|
|
| 17,368 |
|
|
| 34 |
|
|
| 986 |
|
|
| 1,020 |
|
Savings accounts |
|
| (593 | ) |
|
| 4,958 |
|
|
| 4,365 |
|
|
| (57 | ) |
|
| 750 |
|
|
| 693 |
|
Money market accounts |
|
| (1,142 | ) |
|
| 23,250 |
|
|
| 22,108 |
|
|
| 1,930 |
|
|
| 3,300 |
|
|
| 5,230 |
|
Certificates of deposit |
|
| 14,275 |
|
|
| 12,251 |
|
|
| 26,526 |
|
|
| 183 |
|
|
| 2,498 |
|
|
| 2,681 |
|
Total interest-bearing deposits |
|
| 13,361 |
|
|
| 57,006 |
|
|
| 70,367 |
|
|
| 2,090 |
|
|
| 7,534 |
|
|
| 9,624 |
|
Other borrowed funds |
|
| 7,095 |
|
|
| 3,488 |
|
|
| 10,583 |
|
|
| 1,723 |
|
|
| (102 | ) |
|
| 1,621 |
|
Total interest expense |
| $ | 20,456 |
|
| $ | 60,494 |
|
| $ | 80,950 |
|
| $ | 3,813 |
|
| $ | 7,432 |
|
| $ | 11,245 |
|
Change in net interest income |
| $ | (4,557 | ) |
| $ | (18,575 | ) |
| $ | (23,132 | ) |
| $ | 18,908 |
|
| $ | (3,891 | ) |
| $ | 15,017 |
|
Excluding the impact of merger-related loan accretion, the adjusted net interest margin for the year ended December 31, 2023, was 2.25%, representing a 62 basis points decrease over the adjusted net interest margin for the year ended December 31, 2022 of 2.87%.
|
| Year Ended |
| |||||||||
|
| December 31, 2023 |
| |||||||||
|
| Average |
|
| Interest |
|
| Rate |
| |||
|
| (dollars in thousands) |
| |||||||||
Total interest-earning assets (GAAP) |
| $ | 5,248,250 |
|
|
|
|
|
|
| ||
Net interest income on a fully taxable equivalent basis (GAAP) |
|
|
|
| $ | 120,839 |
|
|
|
| ||
Net interest margin on a fully taxable equivalent basis (GAAP) |
|
|
|
|
|
|
|
| 2.30 | % | ||
Less: Accretion of loan fair value adjustments (GAAP) |
|
|
|
|
| (2,567 | ) |
|
| -0.05 | % | |
Adjusted net interest margin on a fully taxable equivalent basis (non-GAAP) |
| $ | 5,248,250 |
|
| $ | 118,272 |
|
|
| 2.25 | % |
Excluding the impact of merger-related loan accretion, the adjusted net interest margin for the year ended December 31, 2022, was 2.87%, representing a 6 basis points decrease over the adjusted net interest margin for the year ended December 31, 2021 of 2.93%.
|
| Years Ended December 31, 2017 |
|
| Years Ended December 31, 2016 |
| ||||||||||||||||||
|
| Compared with |
|
| Compared with |
| ||||||||||||||||||
|
| Years Ended December 31, 2016 |
|
| Years Ended December 31, 2015 |
| ||||||||||||||||||
|
| Increase/(Decrease) Due to Change in |
|
| Increase/(Decrease) Due to Change in |
| ||||||||||||||||||
|
| Volume |
|
| Rate |
|
| Total |
|
| Volume |
|
| Rate |
|
| Total |
| ||||||
|
| (dollars in thousands) |
|
| (dollars in thousands) |
| ||||||||||||||||||
Interest income |
|
|
|
|
|
|
|
|
|
|
|
|
|
|
|
|
|
|
|
|
|
|
|
|
Loans |
|
|
|
|
|
|
|
|
|
|
|
|
|
|
|
|
|
|
|
|
|
|
|
|
Taxable |
| $ | 2,684 |
|
| $ | 201 |
|
| $ | 2,885 |
|
| $ | 4,326 |
|
| $ | (1,122 | ) |
| $ | 3,204 |
|
Tax-exempt |
|
| (38 | ) |
|
| 164 |
|
|
| 126 |
|
|
| 319 |
|
|
| (3 | ) |
|
| 316 |
|
Securities available for sale |
|
|
|
|
|
|
|
|
|
|
|
|
|
|
|
|
|
|
|
|
|
|
|
|
Taxable |
|
| (1,371 | ) |
|
| 198 |
|
|
| (1,173 | ) |
|
| (155 | ) |
|
| (502 | ) |
|
| (657 | ) |
Securities held to maturity |
|
|
|
|
|
|
|
|
|
|
|
|
|
|
|
|
|
|
|
|
|
|
|
|
Taxable |
|
| 2,304 |
|
|
| (40 | ) |
|
| 2,264 |
|
|
| (36 | ) |
|
| 2 |
|
|
| (34 | ) |
Tax-exempt |
|
| (64 | ) |
|
| (147 | ) |
|
| (211 | ) |
|
| 187 |
|
|
| (232 | ) |
|
| (45 | ) |
Cash and due from banks |
|
| 22 |
|
|
| 155 |
|
|
| 177 |
|
|
| 18 |
|
|
| 59 |
|
|
| 77 |
|
Total interest income |
| $ | 3,537 |
|
| $ | 531 |
|
| $ | 4,068 |
|
| $ | 4,659 |
|
| $ | (1,798 | ) |
| $ | 2,861 |
|
Interest expense |
|
|
|
|
|
|
|
|
|
|
|
|
|
|
|
|
|
|
|
|
|
|
|
|
Deposits |
|
|
|
|
|
|
|
|
|
|
|
|
|
|
|
|
|
|
|
|
|
|
|
|
Checking accounts |
|
| 7 |
|
|
| 42 |
|
|
| 49 |
|
|
| 12 |
|
|
| (36 | ) |
|
| (24 | ) |
Savings accounts |
|
| 93 |
|
|
| (203 | ) |
|
| (110 | ) |
|
| 241 |
|
|
| 208 |
|
|
| 449 |
|
Money market accounts |
|
| (16 | ) |
|
| (12 | ) |
|
| (28 | ) |
|
| (6 | ) |
|
| (27 | ) |
|
| (33 | ) |
Certificates of deposit |
|
| (87 | ) |
|
| 41 |
|
|
| (46 | ) |
|
| 206 |
|
|
| 203 |
|
|
| 409 |
|
Total interest-bearing deposits |
|
| (3 | ) |
|
| (132 | ) |
|
| (135 | ) |
|
| 453 |
|
|
| 348 |
|
|
| 801 |
|
Other borrowed funds |
|
| 366 |
|
|
| 1 |
|
|
| 367 |
|
|
| (368 | ) |
|
| 228 |
|
|
| (140 | ) |
Total interest expense |
| $ | 363 |
|
| $ | (131 | ) |
| $ | 232 |
|
| $ | 85 |
|
| $ | 576 |
|
| $ | 661 |
|
Change in net interest income |
| $ | 3,174 |
|
| $ | 662 |
|
| $ | 3,836 |
|
| $ | 4,574 |
|
| $ | (2,374 | ) |
| $ | 2,200 |
|
50
Year Ended | ||||||||||||
December 31, 2022 | ||||||||||||
Average | Interest | Rate | ||||||||||
(dollars in thousands) | ||||||||||||
Total interest-earning assets (GAAP) | $ | 4,938,595 | ||||||||||
Net interest income on a fully taxable equivalent basis (GAAP) | $ | 143,971 | ||||||||||
Net interest margin on a fully taxable equivalent basis (GAAP) | 2.92 | % | ||||||||||
Less: Accretion of loan fair value adjustments (GAAP) | (2,259 | ) | -0.05 | % | ||||||||
Adjusted net interest margin on a fully taxable equivalent basis (non-GAAP) | $ | 4,938,595 | $ | 141,712 | 2.87 | % | ||||||
Market Risk and Asset Liability Management
Market risk is the risk of loss from adverse changes in market prices and rates. The Company’s market risk arises primarily from interest rate risk inherent in its investment, borrowing, lending and deposit-taking activities.deposit gathering activities, and within the Company’s wealth management operations. To that end, management actively monitors and manages its interest rate risk exposure.
The Company’s profitability is affected by fluctuations in interest rates. A sudden and substantial change in interest rates may adversely impact the Company’s earnings to the extent that the interest rates borne by assets and liabilities do not change at the same speed, to the same extent, or on the same basis. The Company monitors the impact of changes in interest rates on its net interest income using several tools.
The Company’s primary objective in managing interest rate risk is to minimize the adverse impact of changes in interest rates on the Company’s net interest income and capital, while structuring the Company’s asset-liability structure to obtain the maximum yield-cost spread on that structure. The Company relies primarily on its asset-liability structure to control interest rate risk.
The Company’s interest rate risk measurement philosophy focuses on maintaining an appropriate balance between the theoretical and the practical; especially given that the primary objective of the Company’s overall asset/liability management process is to assess the level of interest rate risk in the Company’s balance sheet.
Therefore, the Company models a set of interest rate scenarios capturing the financial effects of a range of plausible rate scenarios; the collective impact of which is designed to enable the Company to understand the nature and extent of its sensitivity to interest rate changes. Doing so necessitates an assessment of rate changes over varying time horizons and of varying/sufficient degrees such that the impact of embedded options within the balance sheet are sufficiently examined. Plausible rate scenarios are also intended to capture the notion of “rational expectations” as it relates to how the impact of rate changes “are likely” to flow through the Company’s actual earnings.
The Company has designed its interest rate risk measurement activities to include the following core elements:
The Company’s primary tools in managing Interest Rate Risk (“IRR”) are income simulation models. The income simulation models are utilized to quantify the potential impact of changing interest rates on earnings and to identify expected earnings trends given longer-term rate cycles. Standard gap reports are also utilized to provide supporting detailed information.
The Company also recognizes that a sustained environment of higher/lower interest rates will affect the underlying value of the Company’s assets, liabilities and off-balance sheet instruments since the present value of their future cash flows (and the cash flows themselves) change when interest rates change. In order to monitor the long-term structural and economic position of the balance sheet, the Asset/Liability Committee ( the “ALCO” or the “Committee”) reviews the Economic Value of Equity (“EVE”) measure on a quarterly basis.
IRR considerations include but are not limited to:
51
The Company has established limits for both the Company’s IRR position and EVE position as described below which are designed to monitor against both gradual and rapid changes in interest rates due to known and unknown or exogenous factors.
The Company has established the following limits for IRR:
The Company has established the following limits for changes to EVE:
Interest Rate Shock |
|
|
|
|
(in basis points) |
| Maximum Sensitivity |
| EVE Ratio |
|
|
|
|
|
+400 |
| -40% |
| 5% |
+300 |
| -30% |
| 5% |
+200 |
| -20% |
| 5% |
+100 |
| -10% |
| 5% |
0 |
| - |
| - |
-100 |
| -10% |
| 5% |
-200 |
| -20% |
| 5% |
-300 |
| -30% |
| 5% |
A violation of the Company’s Investment & Asset Liability policy will only occur when both the Maximum Sensitivity threshold and the Minimum EVE Ratio are breached at the same time.
The Company evaluates its IRR and EVE limits on a periodic basis (not less frequently than annually), including in response to increases in the federal funds rate and other economic developments, and, as a result of that evaluation, will, as appropriate, modify the applicable limit. The ALCO then approves any modifications of the IRR or EVE limits.
As part of its quarterly report to the Company’s Risk Committee, the ALCO reviews the Company’s IRR position relative to the current limits noted above. All IRR exceptions are discussed and documented by the Risk Committee in its minutes and are available for review at the Board of Directors’ (the “Board”) next subsequent meeting. If any of the current limits are exceeded for more than two consecutive quarterly periods, the ALCO will discuss with the Risk Committee its plans to bring the Company back within the applicable limits, or, if no action is recommended, the ALCO will discuss why it believes no action is appropriate. In order for the Company to continue to operate outside the limits for more than two consecutive quarterly periods, approval of the Risk Committee is required. For the periods ended December 31, 2023 and December 31, 2022, the ALCO did not approve any risk profiles that do not conform to management and Board risk tolerances, including the IRR and EVE limits.
The Company believes its existing IRR and EVE limits, policies and controls are adequate at this time.
Use of interest rate derivatives. The Company utilizes derivative financial instruments with the intent of reducing economic risk, in particular interest rate risk, both in an up interest rate environment and in a down interest rate environment. The below interest rate risk simulations and EVE model outputs reflect the use of derivatives.
The Company currently uses interest rate floor derivatives as part of its interest rate risk management strategy. Interest rate floor derivatives designated as cash flow hedges involve the receipt by the Company of variable-rate amounts from the derivative counterparty if interest rates fall below the strike rate on the instrument in exchange for payment by the Company of an upfront premium. This derivative financial instrument is used to hedge the variable cash flows associated with the Company’s variable-rate assets and helps protect in a down rate environment.
52
Additionally, the Company uses interest rate swap derivatives to manage its exposure to changes in interest rates. The Company is exposed to changes in the fair value of certain pools of fixed-rate assets due to changes in benchmark interest rates. The Company uses interest rate swap derivatives to manage its exposure to changes in fair value on these instruments attributable to changes in the designated benchmark interest rate. The Company’s interest rate swaps designated as fair value hedges involve the payment by the Company of fixed-rate amounts to the derivative counterparty in exchange for the Company receiving variable-rate payments over the life of the instrument without the exchange of the underlying notional amount. These derivative instruments help protect in an up rate environment.
Interest Rate Sensitivity. The Company actively manages its interest rate sensitivity position. The objectives of interest rate risk management are to control exposure of net interest income to risks associated with interest rate movements and to achieve sustainable growth in net interest income. The Company’s Asset Liability Committee (“ALCO”), using policies and procedures approved by the Company’s board of directors, is responsibleResponsibility for the management of the Company’s interest rate sensitivity position.position falls under the authority of the Company's Board which, in turn, has assigned authority for its formulation, revision and administration to the Risk Committee of the Board who reviews, approves and reports on information provided by the ALCO. The Company manages interest rate sensitivity by changing the mix, pricing, and re-pricing characteristics of its assets and liabilities, through the management of its investment portfolio, its offerings of loan and selected deposit terms, and through wholesale funding. Wholesale funding consists of, but is not limited to, multiple sources, including borrowings with the FHLB of Boston, the Federal Reserve BankFRB of Boston’s discount window,Boston, and certificates of deposit from institutional brokers.
The Company uses several tools to manage its interest rate risk including interest rate sensitivity analysis, or gap analysis, market value of portfolio equity analysis, interest rate simulations under various rate scenarios, and net interest margin reports. The results of these reports are compared to limits established by the Company’s ALCO policies and appropriate adjustments are made if the results are outside the established limits.
The following tables demonstratetable demonstrates the annualized result of an interest rate simulation and the estimated effect that a parallel interest rate shift, or “shock,“instantaneous shock,” in the yield curve and subjective adjustments in deposit pricing might have on the Company’s projected net interest income over the next 12 and 24 months.
ThisAs of December 31, 2023:
|
| Year 1 |
| Year 2 |
Change in Interest |
| Percentage Change |
| Percentage Change |
Parallel rate shocks |
|
|
|
|
+300 |
| (5.9) |
| 2.0 |
+200 |
| (4.0) |
| 4.3 |
+100 |
| (1.9) |
| 7.1 |
–100 |
| 1.8 |
| 10.1 |
–200 |
| 2.5 |
| 9.7 |
The following table demonstrates the annualized result of an interest rate simulation assumesand the estimated effect that a gradual interest rate shift in the yield curve and subjective adjustments in deposit pricing might have on the Company’s projected net interest income over the next 12 and 24 months.
As of December 31, 2023:
|
| Year 1 |
| Year 2 |
Change in Interest |
| Percentage Change |
| Percentage Change |
Gradual rate shifts |
|
|
|
|
+200 |
| (2.0) |
| 3.5 |
–100 |
| (0.9) |
| 11.2 |
–200 |
| (2.1) |
| 12.1 |
These simulations assume that there is no growth in interest-earning assets or interest-bearing liabilities over the next 12 and 24 months. The changes to net interest income shown belowabove are in compliance with the Company’s policy guidelines.
As
These estimates of December 31, 2017:changes in the Company’s net interest income require us to make certain assumptions including loan- and mortgage-related investment prepayment speeds, reinvestment rates, deposit cost, deposit repricing, deposit maturities and decay rates. These assumptions are inherently uncertain and, as a result, the Company cannot precisely predict the impact of changes in interest rates on net interest income. Although the analysis provides an indication of the Company's interest rate risk exposure at a particular point in time, such estimates are not intended to, and do not, provide a precise forecast of the effect of changes in market interest rates and will differ from actual results.
Change in Interest Rates (in Basis Points) |
| Percentage Change in Net Interest Income |
+400 |
| 2.6 |
+300 |
| 2.1 |
+200 |
| 1.6 |
+100 |
| 0.9 |
–100 |
| (8.3) |
53
As of December 31, 2016:
Change in Interest Rates (in Basis Points) |
| Percentage Change in Net Interest Income |
+400 |
| 1.0 |
+300 |
| 1.1 |
+200 |
| 1.2 |
+100 |
| 0.7 |
–100 |
| (6.8) |
Economic Value of Equity Analysis. The Company also analyzes the sensitivity of the Bank’s financial condition to changes in interest rates through our economic value of equity model. This analysis measures the difference between estimated changes in the present value of the Bank’s assets and estimated changes in the present value of the Bank’s liabilities assuming various changes in current interest rates.
The Bank’s economic value of equity analysis as of December 31, 20172023, estimated that, in the event of an instantaneous 200 basis point increase in interest rates, the Bank would experience a 12.2% increase23.6% decrease in the economic value of equity.equity for the next 12 months, resulting in an economic value of equity ratio of 8.0%. This shock scenario assumes an instantaneous increase in deposit and wholesale funding rates at December 31, 2023 levels with no benefit assumed of asset repricing into a higher rate environment. At the same date, ourthe analysis estimated that, in the event of an instantaneous 100200 basis point decrease in interest rates, the Bank would experience a 22.8% decrease18.7% increase in the economic value of equity. equity, resulting in an economic value of equity ratio of 11.0%. This shock scenario assumes an instantaneous decrease in deposit and wholesale funding rates at December 31, 2023 levels, while assets are valued in a lower rate environment. The falling rate shocks for the economic value of equity analysis result in improved valuations as the cost to replace the Bank’s core deposits is reduced but is more than offset by the increased value of the bank’s assets.
The estimates of changes in the economic value of ourthe Company's equity require us to make certain assumptions including loanloan- and mortgage-related investment prepayment speeds, reinvestment rates, anddeposit cost, deposit repricing, deposit maturities and decay rates. These assumptions are inherently uncertain and, as a result, wethe Company cannot precisely predict the impact of changes in interest rates on the economic value of ourits equity. Although ourthe economic value of equity analysis provides an indication of ourthe Company's interest rate risk exposure at a particular point in time, such estimates are not intended to, and do not, provide a precise forecast of the effect of changes in market interest rates on the economic value of ourthe Company's equity and will differ from actual results.
LIQUIDITY AND CAPITAL RESOURCES
Impact of Inflation and Changing Prices. Our The Company’sConsolidated Financial Statements and related notes have been prepared in accordance with GAAP. GAAP generally requires the measurement of financial position and operating results in terms of historical dollars without consideration of changes in the relative purchasing power of money over time due to inflation. The impact of inflation, including the elevated inflation during the last two years, is reflected in the Company's increased cost of our operations. Unlike industrial companies, ourthe Company's assets and liabilities are primarily monetary in nature. As a result, generally speaking, changes in market interest rates have a greater impact on performance than the effects of inflation.
Liquidity. Liquidity is defined as the Company’s ability to generate adequate cash to meet its needs for day-to-day operations and material longlong- and short-term commitments. Liquidity risk is the risk of potential loss if the Company were unable to meet its funding requirements at a reasonable cost. The Company manages its liquidity based on demand and specific events and uncertainties to meet current and future financial and contractual obligations of a short-term nature. The Company’s objective in managing liquidity is to respond to the needs of depositors and borrowers, as well as increase to earnings enhancement opportunities in a changing marketplace.
The Company’s liquidity position is managed on a daily basis as part of the daily settlement function and continuously as part of the formal asset liability management process. The Bank’s liquidity is maintained by managing its core deposits as the primary source, selling investment securities, selling loans in the secondary market, borrowing from the FHLB of Boston and FRB of Boston, entering into repurchase agreements, and purchasing wholesale certificates of deposit as its secondary sources. At December 31, 2023, the Company had access to funds totaling $2.55 billion, inclusive of approximately $192.7 million estimated availability as part of the FRB Boston's Bank Term Funding Program.
The sources of funds for dividends paid by the Company are dividends received from the Bank and liquid funds held by the Company. The Company and the Bank are regulated enterprises and their abilities to pay dividends are subject to regulatory review and restriction. Certain regulatory and statutory restrictions exist regarding dividends, loans, and advances from the Bank to the Company. Generally, the Bank has the ability to pay dividends to the Company subject to minimum regulatory capital requirements.
Quarterly, the ALCORisk Committee reviews the Company’s liquidity needs and reports any findings (if required) to the Board of Directors.Board.
Capital Adequacy. Total shareholders’ equity was $148.0$534.6 million at December 31, 2017,2023, as compared to $134.7$517.6 million at December 31, 2016.2022. The Company’s equity increased primarily as a result ofdue to net income of $14.8$34.1 million, an additional $4.0 million in other comprehensive income associated with the Company’s defined benefit pension plan, an increase of $2.4 million in additional paid-in capital related to stock-based compensation, partially offset by regular dividend payments of $7.6 million for$21.0 million. Based on past performance and current expectations, the year.
The ratioCompany believes that cash and cash equivalents, investments, and other sources of average total equity to average total assets amounted to 7.55% at December 31, 2017. This compares to a ratio of 7.44% at December 31, 2016. Book value per share at December 31, 2017liquidity will satisfy its currently anticipated working capital needs, capital expenditures, and 2016 amounted to $36.24other liquidity requirements associated with its operations through the next 12 months and $33.36, respectively.the reasonably foreseeable future.
54
The Company and the Bank are subject to various regulatory capital requirements. As of December 31, 2017,2023, the Company and the Bank exceeded the regulatory minimum levels to be considered “well capitalized.“well-capitalized.” See Note 17 13 - Shareholders’ equity to the Consolidated Financial Statements for additional discussion of regulatory capital requirements.
Contractual Obligations, Commitments, and Contingencies
TheAs of December 31, 2023 and December 31, 2022, the Company had outstanding commitments to extend credit of $994.2 million and $1.07 billion, respectively, commitments to originate loans of $18.4 million and $25.4 million, and commitments associated with outstanding letters of credit of $34.1 million and $24.2 million, respectively. Since commitments associated with commitments to extend credit and outstanding letters of credit may expire unused, the total outstanding may not necessarily reflect the actual future cash funding requirements.
As of December 31, 2023, the Company had cash and cash equivalents of $33.0 million, as compared with $30.7 million at December 31, 2022, an increase of $2.3 million, or 7.4%.
In the ordinary course of business, the Company has entered into numerous contractual obligations and commitments. The following tables summarizetable summarizes the Company’s contractual cash obligations and other commitments by maturity at December 31, 2017:2023:
|
| Payments Due — By Period as of December 31, 2017 |
|
| Payments Due — By Period as of December 31, 2023 |
| ||||||||||||||||||||||||||||||||||
CONTRACTUAL OBLIGATIONS |
| Total |
|
| Less Than One Year |
|
| One to Three Years |
|
| Three to Five Years |
|
| After Five Years |
|
| Total |
|
| Less Than |
|
| One to |
|
| Three to |
|
| After Five |
| ||||||||||
|
| (dollars in thousands) |
|
| (dollars in thousands) |
| ||||||||||||||||||||||||||||||||||
FHLBB advances |
| $ | 3,579 |
|
| $ | 170 |
|
| $ | 3,409 |
|
| $ | — |
|
| $ | — |
|
| $ | 452,155 |
|
| $ | 406,000 |
|
| $ | 45,000 |
|
| $ | 717 |
|
| $ | 438 |
|
Retirement benefit obligations |
|
| 25,580 |
|
|
| 2,120 |
|
|
| 4,475 |
|
|
| 4,924 |
|
|
| 14,061 |
|
|
| 32,174 |
|
|
| 2,844 |
|
|
| 5,966 |
|
|
| 6,070 |
|
|
| 17,294 |
|
Lease obligations |
|
| 31,370 |
|
|
| 4,164 |
|
|
| 7,301 |
|
|
| 5,204 |
|
|
| 14,701 |
|
|
| 27,133 |
|
|
| 6,959 |
|
|
| 10,727 |
|
|
| 5,547 |
|
|
| 3,900 |
|
Certificates of deposit |
|
| 159,830 |
|
|
| 90,368 |
|
|
| 52,956 |
|
|
| 16,506 |
|
|
| — |
|
|
| 674,381 |
|
|
| 655,266 |
|
|
| 17,306 |
|
|
| 1,809 |
|
|
| — |
|
Total contractual cash obligations |
| $ | 220,359 |
|
| $ | 96,822 |
|
| $ | 68,141 |
|
| $ | 26,634 |
|
| $ | 28,762 |
|
| $ | 1,185,843 |
|
| $ | 1,071,069 |
|
| $ | 78,999 |
|
| $ | 14,143 |
|
| $ | 21,632 |
|
|
| Amounts of Commitments Expiring — By Period as of December 31, 2017 |
| |||||||||||||||||
OTHER COMMITMENTS |
| Total |
|
| Less Than One Year |
|
| One to Three Years |
|
| Three to Five Years |
|
| After Five Years |
| |||||
|
| (dollars in thousands) |
| |||||||||||||||||
Unused portion of existing lines of credit |
| $ | 304,298 |
|
| $ | 141,575 |
|
| $ | 46,257 |
|
| $ | 23,171 |
|
| $ | 93,295 |
|
Standby letters of credit |
|
| 8,322 |
|
|
| 7,935 |
|
|
| — |
|
|
| 387 |
|
|
| — |
|
Originations of new loans |
|
| 45,061 |
|
|
| 45,061 |
|
|
| — |
|
|
| — |
|
|
| — |
|
Total commitments |
| $ | 357,681 |
|
| $ | 194,571 |
|
| $ | 46,257 |
|
| $ | 23,558 |
|
| $ | 93,295 |
|
On October 23, 2017, the Company announced its decision to freeze the accrual of benefits within the Pension Plan, effective December 31, 2017. Further discussion regarding commitments and contingencies can be found in Note 16 – financial instruments with off-balance sheet risk and Note 17 – Commitments and Contingencies to the Consolidated Financial Statements.
Financial Instruments with Off-Balance-Sheet Risk
The Company is party to financial instruments with off-balance-sheet risk in the normal course of business to meet the financing needs of its customers.clients. These financial instruments primarily include commitments to originate and sell loans, standby letters of credit, unused lines of credit, and unadvanced portions of construction loans. The instruments involve, to varying degrees, elements of credit and interest rate risk in excess of the amount recognized in the consolidated balance sheet. The contract or notional amounts of those instruments reflect the extent of involvement the Company has in these particular classes of financial instruments.
The Company’s exposure to credit loss in the event of nonperformance by the other party to the financial instrument for loan commitments, standby letters of credit and unadvanced portions of construction loans is represented by the contractual amount of those instruments. The Company uses the same credit policies in making commitments and conditional obligations as it does for on-balance-sheet instruments.
Off-Balance-Sheet Arrangements. Our significant off-balance-sheet arrangements consist of the following:
Commitmentscommitments to originate and sell loans,
Standbystandby and commercial letters of credit,
Unusedunused lines of credit,
Unadvancedunadvanced portions of construction loans,
Unadvancedunadvanced portions of other loans,
Loanloan related derivatives,
Risk participation agreements55
Off-balance-sheet arrangements are more fully discussed in Note 1516 – Financial Instruments with Off-Balance-Sheet Risk to the Consolidated Financial Statements.
Item 7A. Quantitative and Qualitative Disclosures About Market Risk.
The information required by this item is included in Item 7 of this report under “Market Risk and Asset Liability Management.”
56
Item 8. Financial StatementsStatements and Supplementary Data.
Report of Independent Registered Public Accounting Firm
To the Shareholders and Board of Directors
Cambridge Bancorp:
Opinion on the Consolidated Financial Statements
We have audited the accompanying consolidated balance sheets of Cambridge Bancorp and subsidiaries (the Company) as of December 31, 2017 and 2016, the related consolidated statements of income, comprehensive income, changes in shareholders’ equity, and cash flows for each of the years in the three‑year period ended December 31, 2017, and the related notes (collectively, the consolidated financial statements). In our opinion, the consolidated financial statements present fairly, in all material respects, the financial position of the Company as of December 31, 2017 and 2016, and the results of its operations and its cash flows for each of the years in the three‑year period ended December 31, 2017, in conformity with U.S. generally accepted accounting principles.
Basis for Opinion
These consolidated financial statements are the responsibility of the Company’s management. Our responsibility is to express an opinion on these consolidated financial statements based on our audits. We are a public accounting firm registered with the Public Company Accounting Oversight Board (United States) (PCAOB) and are required to be independent with respect to the Company in accordance with the U.S. federal securities laws and the applicable rules and regulations of the Securities and Exchange Commission and the PCAOB.
We conducted our audits in accordance with the standards of the PCAOB. Those standards require that we plan and perform the audit to obtain reasonable assurance about whether the consolidated financial statements are free of material misstatement, whether due to error or fraud. Our audits included performing procedures to assess the risks of material misstatement of the consolidated financial statements, whether due to error or fraud, and performing procedures that respond to those risks. Such procedures included examining, on a test basis, evidence regarding the amounts and disclosures in the consolidated financial statements. Our audits also included evaluating the accounting principles used and significant estimates made by management, as well as evaluating the overall presentation of the consolidated financial statements. We believe that our audits provide a reasonable basis for our opinion.
/s/ KPMG LLP
We have served as the Company’s auditor since 2006.
Boston, Massachusetts
March 21, 2018
CAMBRIDGE BANCORP AND SUBSIDIARIES
|
| December 31, 2023 |
|
| December 31, 2022 |
| ||
|
| (dollars in thousands, except share information) |
| |||||
Assets |
|
|
|
|
|
| ||
Cash and cash equivalents |
| $ | 33,004 |
|
| $ | 30,719 |
|
Investment securities |
|
|
|
|
|
| ||
Available for sale, at fair value (amortized cost $163,376 and $182,027, respectively) |
|
| 137,838 |
|
|
| 153,416 |
|
Held to maturity, at amortized cost (fair value $805,428 and $885,586, respectively) |
|
| 959,332 |
|
|
| 1,051,997 |
|
Total investment securities |
|
| 1,097,170 |
|
|
| 1,205,413 |
|
|
|
|
|
|
|
| ||
Loans |
|
|
|
|
|
| ||
Residential mortgage |
|
| 1,626,264 |
|
|
| 1,648,838 |
|
Commercial mortgage |
|
| 1,931,473 |
|
|
| 1,914,423 |
|
Home equity |
|
| 95,649 |
|
|
| 111,351 |
|
Commercial and industrial |
|
| 343,711 |
|
|
| 350,650 |
|
Consumer |
|
| 24,447 |
|
|
| 37,594 |
|
Total loans |
|
| 4,021,544 |
|
|
| 4,062,856 |
|
Less: allowance for credit losses on loans |
|
| (38,944 | ) |
|
| (37,774 | ) |
Net loans |
|
| 3,982,600 |
|
|
| 4,025,082 |
|
Federal Home Loan Bank of Boston Stock, at cost |
|
| 19,056 |
|
|
| 6,264 |
|
Bank owned life insurance |
|
| 35,265 |
|
|
| 34,484 |
|
Banking premises and equipment, net |
|
| 21,753 |
|
|
| 23,297 |
|
Right-of-use asset operating leases |
|
| 23,233 |
|
|
| 25,098 |
|
Deferred income taxes, net |
|
| 15,299 |
|
|
| 17,990 |
|
Accrued interest receivable |
|
| 15,765 |
|
|
| 14,118 |
|
Goodwill |
|
| 64,539 |
|
|
| 64,539 |
|
Merger-related intangibles, net |
|
| 6,550 |
|
|
| 7,443 |
|
Other assets |
|
| 103,432 |
|
|
| 105,290 |
|
Total assets |
| $ | 5,417,666 |
|
| $ | 5,559,737 |
|
Liabilities |
|
|
|
|
|
| ||
Deposits |
|
|
|
|
|
| ||
Demand non interest bearing |
| $ | 1,032,413 |
|
| $ | 1,366,395 |
|
Interest-bearing checking |
|
| 1,132,518 |
|
|
| 908,961 |
|
Money market |
|
| 983,480 |
|
|
| 1,162,773 |
|
Savings |
|
| 498,386 |
|
|
| 790,628 |
|
Certificates of deposit |
|
| 674,381 |
|
|
| 586,619 |
|
Total deposits |
|
| 4,321,178 |
|
|
| 4,815,376 |
|
Borrowings |
|
| 452,155 |
|
|
| 105,212 |
|
Operating lease liabilities |
|
| 25,165 |
|
|
| 27,413 |
|
Other liabilities |
|
| 84,595 |
|
|
| 94,184 |
|
Total liabilities |
|
| 4,883,093 |
|
|
| 5,042,185 |
|
Shareholders’ Equity |
|
|
|
|
|
| ||
Common stock, par value $1.00; Authorized: 10,000,000 shares; Outstanding: 7,845,452 shares and 7,796,440 shares, respectively |
|
| 7,845 |
|
|
| 7,796 |
|
Additional paid-in capital |
|
| 293,950 |
|
|
| 293,186 |
|
Retained earnings |
|
| 250,492 |
|
|
| 237,369 |
|
Accumulated other comprehensive loss |
|
| (17,714 | ) |
|
| (20,799 | ) |
Total shareholders’ equity |
|
| 534,573 |
|
|
| 517,552 |
|
Total liabilities and shareholders’ equity |
| $ | 5,417,666 |
|
| $ | 5,559,737 |
|
Auditor
|
| December 31, 2017 |
|
| December 31, 2016 |
| ||
|
| (dollars in thousands, except par value) |
| |||||
Assets |
|
|
|
|
|
|
|
|
Cash and cash equivalents |
| $ | 103,591 |
|
| $ | 54,050 |
|
Investment securities |
|
|
|
|
|
|
|
|
Available for sale, at fair value (amortized cost $208,911 and $329,726, respectively) |
|
| 205,017 |
|
|
| 325,641 |
|
Held to maturity, at amortized cost (fair value $233,554 and $83,755, respectively) |
|
| 232,188 |
|
|
| 82,502 |
|
Total investment securities |
|
| 437,205 |
|
|
| 408,143 |
|
Loans held for sale, at lower of cost or fair value |
|
| — |
|
|
| 6,506 |
|
Loans |
|
|
|
|
|
|
|
|
Residential mortgage |
|
| 538,920 |
|
|
| 534,404 |
|
Commercial mortgage |
|
| 633,649 |
|
|
| 616,140 |
|
Home equity |
|
| 74,444 |
|
|
| 75,051 |
|
Commercial & Industrial |
|
| 65,295 |
|
|
| 59,706 |
|
Consumer |
|
| 38,591 |
|
|
| 34,853 |
|
Total loans |
|
| 1,350,899 |
|
|
| 1,320,154 |
|
Less: allowance for loan losses |
|
| (15,320 | ) |
|
| (15,261 | ) |
Net loans |
|
| 1,335,579 |
|
|
| 1,304,893 |
|
Stock in FHLB of Boston, at cost |
|
| 4,242 |
|
|
| 4,098 |
|
Bank owned life insurance |
|
| 31,083 |
|
|
| 30,499 |
|
Banking premises and equipment, net |
|
| 9,310 |
|
|
| 10,451 |
|
Deferred income taxes, net |
|
| 8,273 |
|
|
| 13,693 |
|
Accrued interest receivable |
|
| 5,128 |
|
|
| 4,627 |
|
Other assets |
|
| 15,523 |
|
|
| 12,039 |
|
Total assets |
| $ | 1,949,934 |
|
| $ | 1,848,999 |
|
Liabilities |
|
|
|
|
|
|
|
|
Deposits |
|
|
|
|
|
|
|
|
Demand |
| $ | 493,613 |
|
| $ | 472,923 |
|
Interest bearing checking |
|
| 462,957 |
|
|
| 430,706 |
|
Money market |
|
| 69,259 |
|
|
| 72,057 |
|
Savings |
|
| 589,741 |
|
|
| 539,190 |
|
Certificates of deposit |
|
| 159,830 |
|
|
| 171,162 |
|
Total deposits |
|
| 1,775,400 |
|
|
| 1,686,038 |
|
Short-term borrowings |
|
| — |
|
|
| — |
|
Long-term borrowings |
|
| 3,579 |
|
|
| 3,746 |
|
Other liabilities |
|
| 22,998 |
|
|
| 24,544 |
|
Total liabilities |
|
| 1,801,977 |
|
|
| 1,714,328 |
|
Shareholders’ Equity |
|
|
|
|
|
|
|
|
Common stock, par value $1.00; Authorized 10,000,000 shares; Outstanding: 4,082,188 shares and 4,036,879 shares, respectively |
|
| 4,082 |
|
|
| 4,037 |
|
Additional paid-in capital |
|
| 35,663 |
|
|
| 33,253 |
|
Retained earnings |
|
| 114,093 |
|
|
| 107,262 |
|
Accumulated other comprehensive loss |
|
| (5,881 | ) |
|
| (9,881 | ) |
Total shareholders’ equity |
|
| 147,957 |
|
|
| 134,671 |
|
Total liabilities and shareholders’ equity |
| $ | 1,949,934 |
|
| $ | 1,848,999 |
|
The accompanying notes are an integral part of these consolidated financial statements.
57
CAMBRIDGE BANCORP AND SUBSIDIARIES
CONSOLIDATED STATEMENTSSTATEMENTS OF INCOME
|
| For the Year Ended December 31, |
| |||||||||
|
| 2023 |
|
| 2022 |
|
| 2021 |
| |||
|
| (dollars in thousands, except per share information) |
| |||||||||
Interest and dividend income |
|
|
|
|
|
|
|
|
| |||
Interest on taxable loans |
| $ | 193,483 |
|
| $ | 135,965 |
|
| $ | 120,019 |
|
Interest on tax-exempt loans |
|
| 1,555 |
|
|
| 1,447 |
|
|
| 1,205 |
|
Interest on taxable investment securities |
|
| 19,589 |
|
|
| 19,555 |
|
|
| 9,464 |
|
Interest on tax-exempt investment securities |
|
| 2,215 |
|
|
| 2,477 |
|
|
| 2,630 |
|
Dividends on FHLB of Boston stock |
|
| 970 |
|
|
| 287 |
|
|
| 46 |
|
Interest on overnight investments |
|
| 722 |
|
|
| 262 |
|
|
| 150 |
|
Total interest and dividend income |
|
| 218,534 |
|
|
| 159,993 |
|
|
| 133,514 |
|
Interest expense |
|
|
|
|
|
|
|
|
| |||
Interest on deposits |
|
| 84,965 |
|
|
| 14,598 |
|
|
| 4,974 |
|
Interest on borrowed funds |
|
| 12,763 |
|
|
| 2,180 |
|
|
| 559 |
|
Total interest expense |
|
| 97,728 |
|
|
| 16,778 |
|
|
| 5,533 |
|
Net interest and dividend income |
|
| 120,806 |
|
|
| 143,215 |
|
|
| 127,981 |
|
Provision for (release of) credit losses |
|
| 904 |
|
|
| 3,881 |
|
|
| (1,294 | ) |
Net interest and dividend income after provision for credit losses |
|
| 119,902 |
|
|
| 139,334 |
|
|
| 129,275 |
|
Noninterest income |
|
|
|
|
|
|
|
|
| |||
Wealth management revenue |
|
| 33,004 |
|
|
| 33,034 |
|
|
| 35,037 |
|
Deposit account fees |
|
| 3,345 |
|
|
| 2,913 |
|
|
| 1,939 |
|
ATM/Debit card income |
|
| 1,728 |
|
|
| 1,663 |
|
|
| 1,567 |
|
Bank owned life insurance income |
|
| 778 |
|
|
| 1,808 |
|
|
| 801 |
|
Gain on loans sold, net |
|
| 56 |
|
|
| 98 |
|
|
| 832 |
|
Loan related derivative income |
|
| 399 |
|
|
| 625 |
|
|
| 2,124 |
|
Other income |
|
| 2,420 |
|
|
| 2,868 |
|
|
| 2,024 |
|
Total noninterest income |
|
| 41,730 |
|
|
| 43,009 |
|
|
| 44,324 |
|
Noninterest expense |
|
|
|
|
|
|
|
|
| |||
Salaries and employee benefits |
|
| 69,806 |
|
|
| 70,109 |
|
|
| 65,127 |
|
Occupancy and equipment |
|
| 14,454 |
|
|
| 14,364 |
|
|
| 13,898 |
|
Data processing |
|
| 10,313 |
|
|
| 10,706 |
|
|
| 8,829 |
|
Professional services |
|
| 3,675 |
|
|
| 4,728 |
|
|
| 5,391 |
|
Marketing |
|
| 1,773 |
|
|
| 2,301 |
|
|
| 2,536 |
|
FDIC insurance |
|
| 2,835 |
|
|
| 1,845 |
|
|
| 1,318 |
|
Non-operating expenses |
|
| 7,180 |
|
|
| 3,059 |
|
|
| 1,118 |
|
Other expenses |
|
| 5,187 |
|
|
| 3,270 |
|
|
| 2,267 |
|
Total noninterest expense |
|
| 115,223 |
|
|
| 110,382 |
|
|
| 100,484 |
|
Income before income taxes |
|
| 46,409 |
|
|
| 71,961 |
|
|
| 73,115 |
|
Income tax expense |
|
| 12,300 |
|
|
| 19,052 |
|
|
| 19,091 |
|
Net income |
| $ | 34,109 |
|
| $ | 52,909 |
|
| $ | 54,024 |
|
Share data: |
|
|
|
|
|
|
|
|
| |||
Weighted average shares outstanding, basic |
|
| 7,828,316 |
|
|
| 7,163,223 |
|
|
| 6,926,257 |
|
Weighted average shares outstanding, diluted |
|
| 7,843,482 |
|
|
| 7,213,913 |
|
|
| 6,990,603 |
|
Basic earnings per share |
| $ | 4.35 |
|
| $ | 7.35 |
|
| $ | 7.76 |
|
Diluted earnings per share |
| $ | 4.34 |
|
| $ | 7.30 |
|
| $ | 7.69 |
|
|
| For the Year Ended December 31, |
| |||||||||
|
| 2017 |
|
| 2016 |
|
| 2015 |
| |||
|
| (dollars in thousands, except share data) |
| |||||||||
Interest and dividend income |
|
|
|
|
|
|
|
|
|
|
|
|
Interest on taxable loans |
| $ | 51,238 |
|
| $ | 48,353 |
|
| $ | 45,149 |
|
Interest on tax-exempt loans |
|
| 496 |
|
|
| 415 |
|
|
| 209 |
|
Interest on taxable investment securities |
|
| 6,321 |
|
|
| 5,230 |
|
|
| 5,921 |
|
Interest on tax-exempt investment securities |
|
| 2,600 |
|
|
| 2,737 |
|
|
| 2,766 |
|
Dividends on FHLB of Boston stock |
|
| 245 |
|
|
| 179 |
|
|
| 259 |
|
Interest on overnight investments |
|
| 291 |
|
|
| 114 |
|
|
| 37 |
|
Total interest and dividend income |
|
| 61,191 |
|
|
| 57,028 |
|
|
| 54,341 |
|
Interest expense |
|
|
|
|
|
|
|
|
|
|
|
|
Interest on deposits |
|
| 3,125 |
|
|
| 3,260 |
|
|
| 2,459 |
|
Interest on borrowed funds |
|
| 462 |
|
|
| 95 |
|
|
| 235 |
|
Total interest expense |
|
| 3,587 |
|
|
| 3,355 |
|
|
| 2,694 |
|
Net interest and dividend income |
|
| 57,604 |
|
|
| 53,673 |
|
|
| 51,647 |
|
Provision for loan losses |
|
| 362 |
|
|
| 132 |
|
|
| 1,075 |
|
Net interest and dividend income after provision for loan losses |
|
| 57,242 |
|
|
| 53,541 |
|
|
| 50,572 |
|
Noninterest income |
|
|
|
|
|
|
|
|
|
|
|
|
Wealth management revenue |
|
| 23,029 |
|
|
| 20,389 |
|
|
| 19,242 |
|
Deposit account fees |
|
| 3,142 |
|
|
| 2,922 |
|
|
| 2,324 |
|
ATM/Debit card income |
|
| 1,182 |
|
|
| 1,140 |
|
|
| 1,192 |
|
Bank owned life insurance income |
|
| 584 |
|
|
| 612 |
|
|
| 667 |
|
(Loss) gain on disposition of investment securities |
|
| (3 | ) |
|
| 438 |
|
|
| 690 |
|
Gain on loans held for sale |
|
| 355 |
|
|
| 916 |
|
|
| 609 |
|
Loan related derivative income |
|
| 780 |
|
|
| 1,323 |
|
|
| 260 |
|
Other income |
|
| 1,155 |
|
|
| 921 |
|
|
| 881 |
|
Total noninterest income |
|
| 30,224 |
|
|
| 28,661 |
|
|
| 25,865 |
|
Noninterest expense |
|
|
|
|
|
|
|
|
|
|
|
|
Salaries and employee benefits |
|
| 36,707 |
|
|
| 34,529 |
|
|
| 30,838 |
|
Occupancy and equipment |
|
| 9,114 |
|
|
| 9,331 |
|
|
| 9,024 |
|
Data processing |
|
| 4,956 |
|
|
| 5,024 |
|
|
| 4,807 |
|
Professional services |
|
| 3,374 |
|
|
| 2,394 |
|
|
| 2,260 |
|
Marketing |
|
| 1,620 |
|
|
| 1,706 |
|
|
| 2,380 |
|
FDIC Insurance |
|
| 629 |
|
|
| 834 |
|
|
| 854 |
|
Other expenses |
|
| 2,892 |
|
|
| 2,932 |
|
|
| 3,029 |
|
Total noninterest expense |
|
| 59,292 |
|
|
| 56,750 |
|
|
| 53,192 |
|
Income before income taxes |
|
| 28,174 |
|
|
| 25,452 |
|
|
| 23,245 |
|
Income tax expense |
|
| 13,358 |
|
|
| 8,556 |
|
|
| 7,551 |
|
Net income |
| $ | 14,816 |
|
| $ | 16,896 |
|
| $ | 15,694 |
|
Share data |
|
|
|
|
|
|
|
|
|
|
|
|
Weighted average number of shares outstanding, basic |
|
| 4,030,530 |
|
|
| 3,990,343 |
|
|
| 3,938,117 |
|
Weighted average number of shares outstanding, diluted |
|
| 4,065,754 |
|
|
| 4,028,944 |
|
|
| 3,993,599 |
|
Basic earnings per share |
| $ | 3.64 |
|
| $ | 4.19 |
|
| $ | 3.94 |
|
Diluted earnings per share |
| $ | 3.61 |
|
| $ | 4.15 |
|
| $ | 3.93 |
|
The accompanying notes are an integral part of these consolidated financial statements.
58
CAMBRIDGE BANCORP AND SUBSIDIARIES
CONSOLIDATED STATEMENTS OF COMPREHENSIVE INCOME (LOSS)
|
| For the Year Ended December 31, |
| |||||||||
|
| 2017 |
|
| 2016 |
|
| 2015 |
| |||
|
| (dollars in thousands) |
| |||||||||
Net income |
| $ | 14,816 |
|
| $ | 16,896 |
|
| $ | 15,694 |
|
Other comprehensive income/(loss), net of tax: |
|
|
|
|
|
|
|
|
|
|
|
|
Unrealized gains/(losses) on available for sale securities |
|
|
|
|
|
|
|
|
|
|
|
|
Unrealized holding gains/(losses) arising during period |
|
| 128 |
|
|
| (735 | ) |
|
| (980 | ) |
Less: reclassification adjustment for losses/(gains) included in net income |
|
| 1 |
|
|
| (281 | ) |
|
| (443 | ) |
Total unrealized gains/(losses) on securities |
|
| 129 |
|
|
| (1,016 | ) |
|
| (1,423 | ) |
Defined benefit retirement plans |
|
|
|
|
|
|
|
|
|
|
|
|
Change in retirement liabilities |
|
| 3,871 |
|
|
| (437 | ) |
|
| 40 |
|
Other comprehensive income/(loss) |
|
| 4,000 |
|
|
| (1,453 | ) |
|
| (1,383 | ) |
Comprehensive income |
| $ | 18,816 |
|
| $ | 15,443 |
|
| $ | 14,311 |
|
|
| For the Year Ended December 31, |
| |||||||||
|
| 2023 |
|
| 2022 |
|
| 2021 |
| |||
|
| (dollars in thousands) |
| |||||||||
Net income |
| $ | 34,109 |
|
| $ | 52,909 |
|
| $ | 54,024 |
|
Other comprehensive income (loss), net of tax: |
|
|
|
|
|
|
|
|
| |||
Available for sale securities |
|
|
|
|
|
|
|
|
| |||
Unrealized holding gains (losses) |
|
| 2,336 |
|
|
| (18,736 | ) |
|
| (4,622 | ) |
Interest rate swaps designated as cash flow hedges |
|
|
|
|
|
|
|
|
| |||
Unrealized holding losses |
|
| (495 | ) |
|
| (1,563 | ) |
|
| (959 | ) |
Less: reclassification adjustment for gains (losses) realized in net income |
|
| 389 |
|
|
| (600 | ) |
|
| (1,864 | ) |
Total unrealized losses on interest rate swaps |
|
| (106 | ) |
|
| (2,163 | ) |
|
| (2,823 | ) |
Defined benefit retirement plans |
|
|
|
|
|
|
|
|
| |||
Change in retirement liabilities |
|
| 855 |
|
|
| 1,310 |
|
|
| 3,801 |
|
Other comprehensive income (loss) |
|
| 3,085 |
|
|
| (19,589 | ) |
|
| (3,644 | ) |
Comprehensive income |
| $ | 37,194 |
|
| $ | 33,320 |
|
| $ | 50,380 |
|
The accompanying notes are an integral part of these consolidated financial statements.
59
CAMBRIDGE BANCORP AND SUBSIDIARIES
|
| Common Stock |
|
| Additional Paid-In Capital |
|
| Retained Earnings |
|
| Accumulated Other Comprehensive (Loss ) / Income |
|
| Total Shareholders’ Equity |
| |||||
|
| (dollars in thousands, except per share data) |
| |||||||||||||||||
Balance at December 31, 2014 |
| $ | 3,941 |
|
| $ | 28,264 |
|
| $ | 91,098 |
|
| $ | (7,045 | ) |
| $ | 116,258 |
|
Net income |
|
| — |
|
|
| — |
|
|
| 15,694 |
|
|
| — |
|
|
| 15,694 |
|
Other comprehensive loss |
|
| — |
|
|
| — |
|
|
| — |
|
|
| (1,383 | ) |
|
| (1,383 | ) |
Share based compensation |
|
| 22 |
|
|
| 476 |
|
|
| — |
|
|
| — |
|
|
| 498 |
|
Exercise of stock options |
|
| 36 |
|
|
| 1,080 |
|
|
| — |
|
|
| — |
|
|
| 1,116 |
|
Shares issued to ESOP and Directors |
|
| 15 |
|
|
| 710 |
|
|
| — |
|
|
| — |
|
|
| 725 |
|
Dividends declared ($1.80 per share) |
|
| — |
|
|
| — |
|
|
| (7,178 | ) |
|
| — |
|
|
| (7,178 | ) |
Shares repurchased |
|
| (14 | ) |
|
| (103 | ) |
|
| (550 | ) |
|
| — |
|
|
| (667 | ) |
Balance at December 31, 2015 |
| $ | 4,000 |
|
| $ | 30,427 |
|
| $ | 99,064 |
|
| $ | (8,428 | ) |
| $ | 125,063 |
|
|
|
|
|
|
|
|
|
|
|
|
|
|
|
|
|
|
|
|
|
|
Net income |
|
| — |
|
|
| — |
|
|
| 16,896 |
|
|
| — |
|
|
| 16,896 |
|
Other comprehensive loss |
|
| — |
|
|
| — |
|
|
| — |
|
|
| (1,453 | ) |
|
| (1,453 | ) |
Share based compensation |
|
| 12 |
|
|
| 956 |
|
|
| — |
|
|
| — |
|
|
| 968 |
|
Exercise of stock options |
|
| 41 |
|
|
| 1,367 |
|
|
| — |
|
|
| — |
|
|
| 1,408 |
|
Shares issued to ESOP and Directors |
|
| 16 |
|
|
| 761 |
|
|
| — |
|
|
| — |
|
|
| 777 |
|
Dividends declared ($1.84 per share) |
|
| — |
|
|
| — |
|
|
| (7,428 | ) |
|
| — |
|
|
| (7,428 | ) |
Shares repurchased |
|
| (32 | ) |
|
| (258 | ) |
|
| (1,270 | ) |
|
| — |
|
|
| (1,560 | ) |
Balance at December 31, 2016 |
| $ | 4,037 |
|
| $ | 33,253 |
|
| $ | 107,262 |
|
| $ | (9,881 | ) |
| $ | 134,671 |
|
|
|
|
|
|
|
|
|
|
|
|
|
|
|
|
|
|
|
|
|
|
Net income |
|
| — |
|
|
| — |
|
|
| 14,816 |
|
|
| — |
|
|
| 14,816 |
|
Other comprehensive income |
|
| — |
|
|
| — |
|
|
| — |
|
|
| 4,000 |
|
|
| 4,000 |
|
Share based compensation |
|
| 15 |
|
|
| 985 |
|
|
| — |
|
|
| — |
|
|
| 1,000 |
|
Exercise of stock options |
|
| 25 |
|
|
| 740 |
|
|
| — |
|
|
| — |
|
|
| 765 |
|
Shares issued to ESOP and Directors |
|
| 12 |
|
|
| 745 |
|
|
| — |
|
|
| — |
|
|
| 757 |
|
Dividends declared ($1.86 per share) |
|
| — |
|
|
| — |
|
|
| (7,582 | ) |
|
| — |
|
|
| (7,582 | ) |
Shares repurchased |
|
| (7 | ) |
|
| (60 | ) |
|
| (403 | ) |
|
| — |
|
|
| (470 | ) |
Balance at December 31, 2017 |
| $ | 4,082 |
|
| $ | 35,663 |
|
| $ | 114,093 |
|
| $ | (5,881 | ) |
| $ | 147,957 |
|
|
| For the Year Ended December 31, |
| |||||||||||||||||
|
| Common |
|
| Additional |
|
| Retained |
|
| Accumulated |
|
| Total |
| |||||
|
| (dollars in thousands, except per share data) |
| |||||||||||||||||
|
|
|
|
|
|
|
|
|
|
|
|
|
|
|
| |||||
Balance at December 31, 2020 |
| $ | 6,927 |
|
| $ | 226,967 |
|
| $ | 165,404 |
|
| $ | 2,434 |
|
| $ | 401,732 |
|
Net income |
|
| — |
|
|
| — |
|
|
| 54,024 |
|
|
| — |
|
|
| 54,024 |
|
Other comprehensive loss |
|
| — |
|
|
| — |
|
|
| — |
|
|
| (3,644 | ) |
|
| (3,644 | ) |
Share based compensation and other share-based activity |
|
| 41 |
|
|
| 2,238 |
|
|
| — |
|
|
| — |
|
|
| 2,279 |
|
Dividends declared ($2.38 per share) |
|
| — |
|
|
| — |
|
|
| (16,554 | ) |
|
| — |
|
|
| (16,554 | ) |
Balance at December 31, 2021 |
| $ | 6,968 |
|
| $ | 229,205 |
|
| $ | 202,874 |
|
| $ | (1,210 | ) |
| $ | 437,837 |
|
|
|
|
|
|
|
|
|
|
|
|
|
|
|
|
| |||||
Balance at December 31, 2021 |
| $ | 6,968 |
|
| $ | 229,205 |
|
| $ | 202,874 |
|
| $ | (1,210 | ) |
| $ | 437,837 |
|
Net income |
|
| — |
|
|
| — |
|
|
| 52,909 |
|
|
| — |
|
|
| 52,909 |
|
Other comprehensive loss |
|
| — |
|
|
| — |
|
|
| — |
|
|
| (19,589 | ) |
|
| (19,589 | ) |
Share based compensation and other share-based activity |
|
| 39 |
|
|
| 1,920 |
|
|
| — |
|
|
| — |
|
|
| 1,959 |
|
Dividends declared ($2.56 per share) |
|
| — |
|
|
| — |
|
|
| (18,414 | ) |
|
| — |
|
|
| (18,414 | ) |
Common stock issued for Northmark merger |
|
| 789 |
|
|
| 62,061 |
|
|
| — |
|
|
| — |
|
|
| 62,850 |
|
Balance at December 31, 2022 |
| $ | 7,796 |
|
| $ | 293,186 |
|
| $ | 237,369 |
|
| $ | (20,799 | ) |
| $ | 517,552 |
|
|
|
|
|
|
|
|
|
|
|
|
|
|
|
|
| |||||
Balance at December 31, 2022 |
| $ | 7,796 |
|
| $ | 293,186 |
|
| $ | 237,369 |
|
| $ | (20,799 | ) |
| $ | 517,552 |
|
Net income |
|
| — |
|
|
| — |
|
|
| 34,109 |
|
|
| — |
|
|
| 34,109 |
|
Other comprehensive income |
|
| — |
|
|
| — |
|
|
| — |
|
|
| 3,085 |
|
|
| 3,085 |
|
Share based compensation and other share-based activity |
|
| 49 |
|
|
| 764 |
|
|
| — |
|
|
| — |
|
|
| 813 |
|
Dividends declared ($2.68 per share) |
|
| — |
|
|
| — |
|
|
| (20,986 | ) |
|
| — |
|
|
| (20,986 | ) |
Balance at December 31, 2023 |
| $ | 7,845 |
|
| $ | 293,950 |
|
| $ | 250,492 |
|
| $ | (17,714 | ) |
| $ | 534,573 |
|
The accompanying notes are an integral part of these consolidated financial statements.
60
CAMBRIDGE BANCORP AND SUBSIDIARIES
CONSOLIDATED STATEMENTS OF CASH FLOWS
|
| For the Year Ended December 31, |
|
| For the Year Ended December 31, |
| ||||||||||||||||||
|
| 2017 |
|
| 2016 |
|
| 2015 |
|
| 2023 |
|
| 2022 |
|
| 2021 |
| ||||||
|
| (dollars in thousands) |
|
| (dollars in thousands) |
| ||||||||||||||||||
CASH FLOWS FROM OPERATING ACTIVITIES |
|
|
|
|
|
|
|
|
|
|
|
|
|
|
|
|
|
|
|
|
| |||
Net income |
| $ | 14,816 |
|
| $ | 16,896 |
|
| $ | 15,694 |
|
| $ | 34,109 |
|
| $ | 52,909 |
|
| $ | 54,024 |
|
Adjustments to reconcile net income to net cash provided by operating activities: |
|
|
|
|
|
|
|
|
|
|
|
|
|
|
|
|
|
|
|
|
| |||
Provision for loan losses |
|
| 362 |
|
|
| 132 |
|
|
| 1,075 |
| ||||||||||||
Amortization of deferred charges and fees, net |
|
| 972 |
|
|
| 1,655 |
|
|
| 1,027 |
| ||||||||||||
Depreciation and amortization |
|
| 1,948 |
|
|
| 2,107 |
|
|
| 1,935 |
| ||||||||||||
Provision for (release of) credit losses |
|
| 904 |
|
|
| 3,881 |
|
|
| (1,294 | ) | ||||||||||||
Amortization (accretion) of deferred charges and fees, net |
|
| 2,330 |
|
|
| 2,282 |
|
|
| (1,434 | ) | ||||||||||||
Depreciation (accretion), and amortization, net |
|
| 1,193 |
|
|
| 726 |
|
|
| (1,838 | ) | ||||||||||||
Bank owned life insurance income |
|
| (584 | ) |
|
| (612 | ) |
|
| (667 | ) |
|
| (778 | ) |
|
| (1,808 | ) |
|
| (801 | ) |
Loss/(gain) on disposition of investment securities |
|
| 3 |
|
|
| (438 | ) |
|
| (690 | ) | ||||||||||||
Compensation expense from stock option and restricted stock grants |
|
| 1,000 |
|
|
| 968 |
|
|
| 498 |
| ||||||||||||
Share-based compensation and other share-based activity |
|
| 813 |
|
|
| 1,959 |
|
|
| 2,279 |
| ||||||||||||
Change in accrued interest receivable |
|
| (501 | ) |
|
| (405 | ) |
|
| (297 | ) |
|
| (1,647 | ) |
|
| (4,280 | ) |
|
| 352 |
|
Deferred income tax expense (benefit) |
|
| 2,687 |
|
|
| (828 | ) |
|
| (762 | ) | ||||||||||||
Deferred income tax expense |
|
| 1,665 |
|
|
| 587 |
|
|
| 2,899 |
| ||||||||||||
Change in loans held for sale |
|
| — |
|
|
| 1,490 |
|
|
| 5,419 |
| ||||||||||||
Change in other assets, net |
|
| (751 | ) |
|
| (2,552 | ) |
|
| (1,024 | ) |
|
| 2,950 |
|
|
| (32,056 | ) |
|
| 5,473 |
|
Change in other liabilities, net |
|
| 2,264 |
|
|
| 4,748 |
|
|
| 2,918 |
|
|
| (8,449 | ) |
|
| 26,260 |
|
|
| 429 |
|
Change in loans held for sale |
|
| 6,506 |
|
|
| (6,506 | ) |
|
| 284 |
| ||||||||||||
Other, net |
|
| (7 | ) |
|
| 43 |
|
|
| 25 |
| ||||||||||||
Net cash provided by operating activities |
|
| 28,715 |
|
|
| 15,208 |
|
|
| 20,016 |
|
|
| 33,090 |
|
|
| 51,950 |
|
|
| 65,508 |
|
CASH FLOWS FROM INVESTING ACTIVITIES |
|
|
|
|
|
|
|
|
|
|
|
|
|
|
|
|
|
|
|
|
| |||
Origination of loans |
|
| (354,657 | ) |
|
| (275,866 | ) |
|
| (260,020 | ) |
|
| (650,604 | ) |
|
| (1,265,305 | ) |
|
| (1,327,044 | ) |
Proceeds from principal payments of loans |
|
| 323,632 |
|
|
| 147,282 |
|
|
| 148,049 |
|
|
| 692,563 |
|
|
| 850,886 |
|
|
| 1,170,430 |
|
Purchase of loans |
|
| — |
|
|
| (23,655 | ) |
|
| — |
| ||||||||||||
Proceeds from calls/maturities of securities available for sale |
|
| 47,955 |
|
|
| 156,272 |
|
|
| 168,787 |
|
|
| 18,414 |
|
|
| 29,040 |
|
|
| 42,169 |
|
Proceeds from sales of securities available for sale and held to maturity |
|
| 77,369 |
|
|
| 18,070 |
|
|
| 47,625 |
| ||||||||||||
Purchase of securities available for sale |
|
| (5,091 | ) |
|
| (154,719 | ) |
|
| (225,912 | ) |
|
| — |
|
|
| (10,170 | ) |
|
| (9,927 | ) |
Proceeds from sales of securities |
|
| — |
|
|
| 19,018 |
|
|
| — |
| ||||||||||||
Proceeds from calls/maturities of securities held to maturity |
|
| 34,488 |
|
|
| 11,450 |
|
|
| 6,206 |
|
|
| 91,558 |
|
|
| 132,173 |
|
|
| 70,800 |
|
Purchase of securities held to maturity |
|
| (184,505 | ) |
|
| (11,238 | ) |
|
| (9,691 | ) |
|
| — |
|
|
| (205,137 | ) |
|
| (801,775 | ) |
(Purchase) sale of FHLB of Boston stock |
|
| (144 | ) |
|
| 2,367 |
|
|
| 1,490 |
| ||||||||||||
Death benefit on bank-owned life insurance |
|
| — |
|
|
| 4,025 |
|
|
| — |
| ||||||||||||
Redemption on bank-owned life insurance |
|
| — |
|
|
| 10,759 |
|
|
| — |
| ||||||||||||
(Purchase) redemption of FHLB of Boston stock |
|
| (12,792 | ) |
|
| (1,215 | ) |
|
| 918 |
| ||||||||||||
Purchase of banking premises and equipment |
|
| (807 | ) |
|
| (1,187 | ) |
|
| (4,939 | ) |
|
| (1,372 | ) |
|
| (1,776 | ) |
|
| (2,033 | ) |
Net cash used by investing activities |
|
| (61,760 | ) |
|
| (107,569 | ) |
|
| (128,405 | ) | ||||||||||||
Net cash acquired in business combinations |
|
| — |
|
|
| 82,174 |
|
|
| — |
| ||||||||||||
Net cash provided by (used in) investing activities |
|
| 137,767 |
|
|
| (379,183 | ) |
|
| (856,462 | ) | ||||||||||||
CASH FLOWS FROM FINANCING ACTIVITIES |
|
|
|
|
|
|
|
|
|
|
|
|
|
|
|
|
|
|
|
|
| |||
Change in demand, interest bearing, money market and savings accounts |
|
| 100,694 |
|
|
| 136,042 |
|
|
| 131,193 |
| ||||||||||||
Change in demand, interest-bearing, money market and savings accounts |
|
| (581,959 | ) |
|
| (216,751 | ) |
|
| 1,020,821 |
| ||||||||||||
Change in certificates of deposit |
|
| (11,411 | ) |
|
| (7,309 | ) |
|
| 55,495 |
|
|
| 87,430 |
|
|
| 327,938 |
|
|
| (92,552 | ) |
Change in short-term borrowings |
|
| — |
|
|
| — |
|
|
| (69,000 | ) | ||||||||||||
Proceeds from long-term borrowings |
|
| — |
|
|
| — |
|
|
| 3,950 |
| ||||||||||||
Repayment of long-term borrowings |
|
| (167 | ) |
|
| (164 | ) |
|
| (40 | ) | ||||||||||||
Change in borrowings |
|
| 346,943 |
|
|
| 85,026 |
|
|
| (16,393 | ) | ||||||||||||
Cash dividends paid on common stock |
|
| (7,582 | ) |
|
| (7,428 | ) |
|
| (7,178 | ) |
|
| (20,986 | ) |
|
| (18,414 | ) |
|
| (16,554 | ) |
Repurchase of common stock |
|
| (470 | ) |
|
| (1,560 | ) |
|
| (667 | ) | ||||||||||||
Proceeds from issuance of common stock |
|
| 1,522 |
|
|
| 2,185 |
|
|
| 1,841 |
| ||||||||||||
Net cash provided by financing activities |
|
| 82,586 |
|
|
| 121,766 |
|
|
| 115,594 |
| ||||||||||||
Net decrease in cash and cash equivalents |
|
| 49,541 |
|
|
| 29,405 |
|
|
| 7,205 |
| ||||||||||||
Net cash (used in) provided by financing activities |
|
| (168,572 | ) |
|
| 177,799 |
|
|
| 895,322 |
| ||||||||||||
Net change in cash and cash equivalents |
|
| 2,285 |
|
|
| (149,434 | ) |
|
| 104,368 |
| ||||||||||||
Cash and cash equivalents at beginning of period |
|
| 54,050 |
|
|
| 24,645 |
|
|
| 17,440 |
|
|
| 30,719 |
|
|
| 180,153 |
|
|
| 75,785 |
|
Cash and cash equivalents at end of period |
| $ | 103,591 |
|
| $ | 54,050 |
|
| $ | 24,645 |
|
| $ | 33,004 |
|
| $ | 30,719 |
|
| $ | 180,153 |
|
SUPPLEMENTAL DISCLOSURES OF CASH FLOW INFORMATION: |
|
|
|
|
|
|
|
|
|
|
|
|
|
|
|
|
|
|
|
|
| |||
Cash paid during the period for: |
|
|
|
|
|
|
|
|
|
|
|
|
|
|
|
|
|
|
|
|
| |||
Interest |
| $ | 3,579 |
|
| $ | 3,371 |
|
| $ | 2,644 |
|
| $ | 92,544 |
|
| $ | 15,805 |
|
| $ | 5,656 |
|
Income taxes |
| $ | 10,100 |
|
| $ | 9,205 |
|
| $ | 8,220 |
|
|
| 12,902 |
|
|
| 21,822 |
|
|
| 9,054 |
|
Significant non-cash transactions |
|
|
|
|
|
|
|
|
| |||||||||||||||
Common Stock issued to shareholders due to merger |
|
| — |
|
|
| 62,850 |
|
|
| — |
| ||||||||||||
Fair value of assets acquired, net of cash acquired |
|
| — |
|
|
| 346,501 |
|
|
| — |
| ||||||||||||
Fair value of liabilities assumed |
|
| — |
|
|
| 378,453 |
|
|
| — |
| ||||||||||||
The accompanying notes are an integral part of these consolidated financial statements.
61
CAMBRIDGE BANCORP AND SUBSIDIARIES
NOTES TO CONSOLIDATED FINANCIAL STATEMENTS
DECEMBERDecember 31, 20172023
|
|
The accompanying consolidated financial statements include the accounts of Cambridge Bancorp (the “Company”) and its wholly owned subsidiary, Cambridge Trust Company (the “Bank”), and the Bank’s subsidiaries, Cambridge Trust Company of New Hampshire, Inc., CTC Security Corporation, and CTC Security Corporation III. References to the Company herein relate to the consolidated group of companies. All significant intercompany accounts and transactions have been eliminated in preparation of the consolidated financial statements.
The Company is a state-chartered, federally registered bank holding company headquartered in Cambridge, Massachusetts, that was incorporated in 1983. The Company is the sole shareholder of the Bank, a Massachusetts trust company chartered in 1890 which is a commercial bank. We areThe Company is a private bank offering a full range of private banking and wealth management services to ourits clients. The Private Bankingprivate banking business, the Company’s only reportable operating segment, is managed as a single strategic unit.
As a Private Bank,private bank, the Company focuses on four core services that center around client needs. The core services include Wealth Management, Commercial Banking, Residential Lending, and Personal Banking. The Bank offers a full range of commercial and consumer banking services through its network of 11 full-service22 banking offices in Massachusetts.Massachusetts and New Hampshire. The Bank is engaged principally in the business of attracting deposits from the public and investing those deposits. The Bank invests those funds in various types of loans, including residential and commercial real estate, and a variety of commercial and consumer loans. The Bank also invests its deposits and borrowed funds in investment securities and has two wholly-owned wholly owned Massachusetts security corporations, CTC Security Corporation and CTC Security Corporation III, for this purpose. Deposits at the Bank are insured by the Federal Deposit Insurance Corporation (“FDIC”) for the maximum amount permitted by FDIC Regulations.
Trust and investment management services are offered through the Bank’s full-service branchesprivate banking offices in Massachusetts a wealth management office located in Boston, and threeNew Hampshire, and its wealth management offices located in New Hampshire inBoston, Massachusetts, Concord, Manchester, and Portsmouth.Portsmouth, New Hampshire, and Southport, Connecticut. The Bank also utilizes itshas a non-depository trust company, Cambridge Trust Company of New Hampshire, Inc., in providing wealth management services in New Hampshire.which allows non-New Hampshire residents the opportunity to take advantage of the state’s favorable trust laws. The assets held for wealth management customersclients are not assets of the Bank and, accordingly, are not reflected in the accompanying consolidated balance sheets. Total assets managed on behalf of wealth management clients were approximately $3.0 billion and $2.6 billion at December 31, 2017 and 2016, respectively.
| 2. SUMMARY OF SIGNIFICANT ACCOUNTING POLICIES |
Basis of Presentation
The consolidated financial statements have been prepared in conformity with U.S. generally accepted accounting principles (“GAAP”).
Use of Estimates
The preparation of consolidated financial statements in conformity with GAAP requires management to make estimates and assumptions that affect the reported amounts of assets and liabilities and disclosure of contingent assets and liabilities at the date of the consolidated financial statements. Actual results could differ from those estimates. The allowance for loancredit losses, the fair values of financial instruments, and the valuation of deferred tax assets, and the valuation of assets acquired and liabilities assumed in business combinations are particularly subject to change.
Reclassifications
Reclassifications
Certain amounts in the prior year’s financial statements may have been reclassified to conform with the current year’s presentation.
Cash and Cash Equivalents
Cash and cash equivalents consist of cash on hand, amounts due from banks, and overnight investments.
Investment securities are classified as either ‘held“held to maturity’maturity” or ‘available“available for sale’sale” in accordance with the Financial Accounting Standards Board’sBoard (“FASB”) Accounting Standards Codification (“ASC”) Topic 320, “Investments – Debt and Equity Securities.” Debt securities that management has the positive intent and ability to hold to maturity are classified as held to maturity and are carriedrecorded at cost, adjusted for the amortization of premiums and the accretion of discounts, using the effective-yield method or straight line. U.S. Government Sponsored Enterprises (“GSE”) and U.S. Government Agency obligations represent debt securities issued by the Federal Farm Credit Bank, the Federal Home Loan Banks (“FHLB”), the Government National Mortgage Association (“GNMA”), the Federal National Mortgage Association (“FNMA”), or the Federal Home Loan Mortgage Corporation (“FHLMC”). Mortgage-backed securities represent Pass-Through Certificates and Collateralized Mortgage Obligations either issued by, or collateralized by securities issued by GNMA, FNMA, or FHLMC. Mortgage-backed securities are adjusted for amortization of premiums and accretion of discounts, using the effective-yield method over the estimated average lives of the investments.amortized cost.
62
Debt and equity securities not classified as held to maturity are classified as available for sale and carried at fair value with unrealized after-tax gains and losses reported net as a separate component of shareholders’ equity. The Company classifies its securities based on its intention at the time of purchase.
DeclinesPurchase premiums and discounts are recognized in interest income using the effective yield or straight-line method over the term of the securities, except for callable debt securities for which the purchase premiums are recognized through the earliest call date. Gains and losses on the sale of debt securities are recorded on the trade date and determined using the specific identification method.
Allowance for Credit Losses - Held to Maturity Securities
The Company measures expected credit losses on held to maturity debt securities on a collective basis by security type and risk rating where available. The reserve for each pool is calculated based on a Probability of Default/Loss Given Default (“PD/LGD”) basis taking into consideration the expected life of each security. Held to maturity securities which are issued by the United States of America (“U.S.”) or are guaranteed by U.S. federal agencies do not currently have an allowance for credit loss as the Company determined these securities are either backed by the full faith and credit of the U.S. government and/or there is an unconditional commitment to make interest payments and to return the principal investment in full to investors when a debt security reaches maturity. The Company will evaluate this position no less than annually, however, certain items which may cause the Company to change this methodology include legislative changes that remove a government-sponsored enterprise’s (“GSE”) ability to draw funds from the U.S. government, or legislative changes to housing policy that reduce or eliminate the U.S. government’s implicit guarantee on such securities. For securities which are not U.S. treasury or agency backed, risk ratings are generally sourced from Moody’s or Standard & Poor’s. The Company updates loss given default, probability of default, and recovery rates for each security as that information becomes available but no less than annually. The expected remaining life to maturity of each applicable security is updated quarterly. Any expected credit losses on held to maturity securities would be presented as an allowance rather than as a direct write-down through the consolidated statements of income if the Company does not intend to sell or believes that it is more likely than not that the Company will be required to sell the security.
Allowance for Credit Losses - Available for Sale Securities
The Company measures expected credit losses on available for sale securities based upon the gain or loss position of the security. For available for sale debt securities in an unrealized loss position, which the Company does not intend to sell, or it is not more likely than not that the Company will be required to sell the security before recovery of the Company’s amortized cost, the Company evaluates qualitative criteria to determine any expected loss. This includes among other items the financial health of, and specific prospects for the issuer, including whether the issuer is in compliance with the terms and covenants of the security. The Company also evaluates quantitative criteria including determining whether there has been an adverse change in expected future cash flows of the security. If the Company does not expect to recover the entire amortized cost basis of the security, an allowance for credit losses would be recorded, with a related charge to earnings, limited by the amount of the fair value of investment securities below theirthe security less its amortized cost that are deemed to be other-than-temporary are reflected in earnings as realized losses tocost. If the extent the impairment is related to credit losses. The amount of the impairment related to other factors is recognized in other comprehensive income. In estimating other-than-temporary impairment losses, management considers: (1) the length of time and the extent to which the fair value has been less than cost; (2) the financial condition and near-term prospects of the issuer; and (3) the Company’s intentCompany intends to sell the security or whether it is more likely than not that the Company will be required to sell the debt security before recovery of its anticipated recovery.amortized cost basis, the Company recognizes the entire difference between the security’s amortized cost basis and its fair value in earnings.
Loans
Loans and the Allowance for Loan Losses
Loans are reported at the amount of their outstanding principal, including deferred loan origination fees and costs, reduced by unearned discounts, and the allowance for loancredit losses. Loan origination fees, net of related direct incremental loan origination costs, are deferred and amortized as an adjustment to yield over the life of the related loans. Unearned discount is recognized as an adjustment to the loan yield, using the interest method over the contractual life of the related loan. When a loan is paid off, the unamortized portion of net fees or unearned discount is recognized as interest income.
Loans are considered delinquent when a payment of principal and/or interest becomes past due 30 days following its scheduled payment due date.
Loans on which the accrual of interest has been discontinued are designated as non-accrual loans. Accrual of interest income is discontinued when concern exists as to the collectability of principal or interest or typically when a loan becomes over 90 days delinquent. Additionally, when a loan is placed on non-accrual status, all interest previously accrued but not collected is reversed against current period income. Loans aremay be removed from non-accrual when they become less than 90 days past due, they have maintained current payment status for a sustained period of time, and when concern no longer exists as to the collectability of principal or interest. Interest collected
Allowance for Credit Losses - Loans
Losses on non-accruing loans is either applied against principal or reported as income according to management’s judgment as to the collectability of principal.
A loan is considered impaired when, based on current informationreceivables are estimated and events, it is probable that the Company will be unable to collect the scheduled payments of principal or interest when due according to the contractual termsrecognized upon origination of the loan, agreement. Under certain circumstances,based on expected credit losses for the life of the loan balance as of the period end date. The Company’s methodology for calculating the allowance for credit losses(“ACL”) on loans consists of quantitative and qualitative components. The Company uses a discounted cash flow method incorporating probability of default and loss given default forecasted based on statistically derived economic variable loss drivers combined with qualitative factors, to estimate expected credit losses. This process includes estimates which involve modeling loss projections attributable to existing loan balances, considering historical experience, current conditions, and future expectations for homogeneous pools of loans over the reasonable and supportable forecast period. The reasonable and supportable forecast period is determined based upon the accuracy level of historical loss forecast estimates, the specific loan level models and methodology utilized, and considers material changes in growth and credit strategy, and business changes. For periods beyond a reasonable and supportable forecast interval, the Company reverts to historical information over a period for which comparable data is available. The historical information either experienced by the Company, or by a selection of peer banks when appropriate, is derived from a combination of recessionary and non-recessionary performance periods for which data is available. Similar to the reasonable and supportable forecast period, the Company reassesses the
63
reversion period at the segment level, considering any required adjustments for differences in underwriting standards, portfolio mix, and other relevant data shifts over time.
The Company generally segments its loan receivable population into homogeneous pools of loans. Consistent with the Company’s other assumptions, the Company regularly reviews segmentation to determine whether the homogeneous pools remain relevant as risk characteristics change. When a loan no longer meets the criteria of its initial pooling as a result of credit deterioration or other changes, the Company may restructureevaluate the termscredit for estimated losses on an individual basis if the Company determines that the credit no longer retains the same risk characteristics. To the extent that there are a multitude of these loans with new similar risk characteristics, the Company would anticipate a loan as a concessionchange to a borrower. These restructuredthe pooling methodology. Loans that do not share risk characteristics are evaluated on an individual basis and are not included in the collective evaluation. For loans with real estate collateral, when management determines that foreclosure is probable, expected credit losses are generally also considered impaired loans. Impairment is measuredbased on a loan-by-loan basis by either the present value of expected future cash flows discounted at the loan’s effective interest rate, the loan’s obtainable market price, or the fair value of the collateral ifat the reporting date, adjusted for selling costs as appropriate.
The qualitative component of the ACL considers (i) the uncertainty of forward-looking scenarios; (ii) certain portfolio characteristics, such as portfolio concentrations, real estate values, changes in the number and amount of non-accrual and past due loans; and (iii) model limitations; among other factors. Qualitative adjustments are considered when management believes expected credit losses are not representative of historical loss experience alone, and should be adjusted to reflect the current conditions and characteristics of the Company’s own portfolio. They are made at the segment level, considering any required adjustments for differences in underwriting standards, portfolio mix, and other relevant data shifts over time.
The Company evaluates the allowance for credit losses on loans quarterly. The Company regularly reviews its collection experience (including delinquencies and net charge-offs) in determining its allowance for credit losses. The Company also considers its historical loss experience to date based on actual defaulted loans and overall portfolio indicators including delinquent and non-accrual loans, trends in loan volume and lending terms, credit policies and other observable environmental factors such as unemployment and interest rate changes.
The underlying assumption estimates and assessments the Company uses to estimate the allowance for credit losses reflects the Company’s best estimate of model assumptions and forecasted conditions at that time. Changes in such estimates can significantly affect the allowance and provision for (release of) credit losses. It is collateral dependent. Large groups of smaller balance homogeneous loanspossible and likely that the Company will experience credit losses that are collectively evaluated for impairment.different from the current estimates.
The provision for (release of) credit losses charged to income is based on management’s judgment of the amount necessary to maintain the allowance at a level to provide for expected credit losses for the life of the loan losses andbalances as of the levelevaluation date. When management believes that the collectability of a loan’s principal balance, or portions thereof, is unlikely, the principal amount is charged against the allowance for loan losses reflects management’s estimate of probable loan losses inherent in the loan portfolio at the balance sheet date. Management uses a systematic process and methodologycredit losses. Recoveries on loans that have been previously charged off are credited to establish the allowance for loancredit losses, each quarter. To determinegenerally at the totaltime cash is received on a charged-off account. The allowance for loan losses,is an estimate, is made by management of the allowance needed for each of the following segments of the loan portfolio: (a) residential mortgage loans, (b) commercial mortgage loans, (c) home equity loans, (d) commercial & industrial loans, and (e) consumer loans. Portfolio segmentsultimate losses may vary from current estimates. As adjustments become necessary, they are further disaggregated into classes of loans. The establishment of the allowance for each portfolio segment is based on a process that evaluates the risk characteristics relevant to each portfolio segment and takes into consideration multiple internal and external factors. Internal factors include, but are not limited to, (a) historic levels and trends in charge-offs, delinquencies, risk ratings, and foreclosures, (b) level and changes in industry, geographic, and credit concentrations, (c) underwriting policies and adherence to such policies, (d) the growth and vintage of the portfolios, and (e) the experience of, and any changes in, lending and credit personnel. External factors include, but are not limited to, (a) conditions and trendsreported in the local and national economy and (b) levels and trendsresults of operations through the provision for (release of) credit losses in national delinquent and non-performing loans.
The Bank evaluates certain loans individually for specific impairment. A loan is considered impaired when, based on current information and events, it is probable that the Bank will be unable to collect the scheduled payments of principal or interest when due according to the contractual terms of the loan agreement. Loans that experience insignificant payment delays and payment shortfalls generally are not classified as impaired. Loans are selected for evaluation based upon internal risk rating, delinquency status, or non-accrual status. A specific allowance amount is allocated to an individual loan when such loan has been deemed impaired and when the amount of the probable loss is able to be estimated. Estimates of loss may be determined by the present value of anticipated future cash flows, the loan’s observable fair market value, or the fair value of the collateral, if the loan is collateral dependent.period in which they become known.
Risk characteristics relevant to each portfolio segment are as follows:
Residential mortgage and home equity loans – The BankCompany generally does not originate loans in these segments with a loan-to-value ratio greater than 80%80%, unless covered by private mortgage insurance, and in all cases not greater than a loan-to-value ratio of 97%97%. The BankCompany does not originate subprime loans. Loans in these segments are secured by one-to-four family residential real estate, and repayment is primarily dependent on the credit quality of the individual borrower.
Commercial mortgage loans – This includes multi-family properties and construction. The BankCompany generally does not originate loans in this segment with a loan-to-value ratio greater than 75%75%. Loans in this segment are secured by owner-occupied and nonowner-occupiednon-owner-occupied commercial real estate (“CRE”), and repayment is primarily dependent on the cash flows of the property (if nonowner-occupied)non-owner-occupied) or of the business (if owner-occupied).
Commercial and industrial loans (“C&I”) – Loans in this segment are made to businesses and are generally secured by equipment, accounts receivable, or inventory, as well as the personal guarantees of the principal owners of the business, and repayment is primarily dependent on the cash flows generated by the business. In addition, this segment includes certain loans issued under the U. S. Small Business Administration’s (“SBA”) Paycheck Protection Program (“PPP”). These loans are guaranteed and are not evaluated for an allowance for credit losses because the Company expects the guarantees will be effective, if necessary.
64
Consumer loans – Loans in this segment are made to individuals and can be secured or unsecured. Repayment is primarily dependent on the credit quality of the individual borrower.
The majority of the Bank’sCompany’s loans are concentrated in Eastern Massachusetts and Southern New Hampshire and therefore the overall health of the local economy, including unemployment rates, vacancy rates, and consumer spending levels, can have a material effect on the credit quality of all of these portfolio segments.
The process to determine the allowance for loancredit losses requires management to exercise considerable judgment regarding the risk characteristics of the loan portfolio segments and the effect of relevant internal and external factors.
Allowance for Credit Losses - Unfunded Commitments
The expected credit losses for unfunded commitments are measured over the contractual period of the Company’s exposure to credit risk. The estimate of credit loss incorporates assumptions for both the likelihood and amount of funding over the estimated life of the commitments, for the risk of loss, and current conditions and expectations. Management periodically reviews and updates its assumptions for estimated funding rates based on historical rates, and factors such as portfolio growth, changes to organizational structure, economic conditions, borrowing habits, or any other factor which could impact the likelihood that funding will occur. The Company does not reserve for unfunded commitments which are unconditionally cancellable.
Acquired Loans
Acquired loans are recorded at fair value at the date of acquisition based on a discounted cash flow methodology that considers various factors, including the type of loan and related collateral, classification status, fixed or variable interest rate, term of loan and whether or not the loan was amortizing, and a discount rate reflecting the Company’s assessment of risk inherent in the cash flow estimates. Purchased loans are grouped together according to similar risk characteristics and are treated in the aggregate when applying various valuation techniques. These cash flow evaluations are inherently subjective as they may be susceptible to significant change.
Effective January 1, 2020, loans acquired in a business combination that have experienced more-than-insignificant deterioration in credit quality since origination are considered purchased credit deteriorated (“PCD”) loans. The Company evaluates acquired loans for deterioration in credit quality based on, but not limited to, the following: (1) non-accrual status; (2) troubled debt restructured designation; (3) risk ratings of special mention, substandard or doubtful; (4) watchlist credits; and (5) delinquency status, including loans that are current on acquisition date, but had been previously delinquent. At the acquisition date, an estimate of expected credit losses is made for groups of PCD loans with similar risk characteristics and individual PCD loans without similar risk characteristics. This initial allowance for credit losses is allocated to individual PCD loans and added to the purchase price or acquisition date fair values to establish the initial amortized cost basis of the PCD loans. As the initial allowance for credit losses is added to the purchase price, there is no credit loss expense recognized upon acquisition of a PCD loan. Any difference between the unpaid principal balance of PCD loans and the amortized cost basis is considered to relate to noncredit factors and results in a discount or premium. Discounts and premiums are recognized through interest income on a level-yield method over the life of the loans.
For acquired loans not deemed PCD at acquisition, the differences between the initial fair value and the unpaid principal balance are recognized as interest income on a level-yield basis over the lives of the related loans. At the acquisition date, an initial allowance for expected credit losses is estimated and recorded as provision for loancredit losses. The subsequent measurement of expected credit losses charged to incomefor all acquired loans is based on management’s judgmentthe same as the subsequent measurement of the amount necessary to maintain the allowance at a level to provideexpected credit losses for probable inherent loan losses. When management believes that the collectability of a loan’s principal balance, or portions thereof, is unlikely, the principal amount is charged against the allowanceoriginated loans.
Loans Held for loan losses. Recoveries on loans that have been previously charged off are credited to the allowance for loan losses as received. The allowance is an estimate, and ultimate losses may vary from current estimates. As adjustments become necessary, they are reported in the results of operations through the provision for loan losses in the period in which they become known.Sale
Residential mortgage loans originated and intended for sale in the secondary market are classified as held for sale at the time of their origination and are carried at the lower of cost or fair value on an individual loan basis. Changes in fair value relating to loans held for sale below the loans cost basis are charged against gain on loans held for sale.sold. Gains and losses on the actual sale of the residential loans are recorded in earnings as net gains (losses) on loans held for salesold, net on the consolidated statements of income.
Bank Owned Life Insurance
Bank owned life insurance (“BOLI”) represents life insurance on the lives of certain active and former employees who have provided positive consent allowing the BankCompany to be the beneficiary of such policies. Since the BankCompany is the primary beneficiary of the insurance policies, increases in the cash value of the policies, as well as insurance proceeds received in excess of cash surrender value, are recorded in other noninterest income, and are not subject to income taxes. Applicable regulations generally limit ourthe Company’s investment in bank-owned life insuranceBOLI to 25%25% of ourits Tier 1 capital plus ourits allowance for loancredit losses. The BankCompany reviews the financial strength of the insurance carriers prior to the purchase of BOLI and at least annually thereafter.
65
Banking Premises and Equipment
Land is stated at cost. Buildings, leasehold improvements, and equipment are stated at cost, less accumulated depreciation, and amortization, which is computed using the straight-line method over the estimated useful lives of the assets or the terms of the leases, if shorter. The cost of ordinary maintenance and repairs is charged to expense when incurred.
Leases
The Company leases office space and certain branch locations under noncancelable operating leases, several of which have renewal options to extend lease terms. Upon commencement of a new lease, the Company will recognize a right-of-use (“ROU”) asset and corresponding lease liability. The Company makes the decision on whether to renew an option to extend a lease by considering various factors. The Company will recognize an adjustment to its ROU asset and lease liability when lease agreements are amended and executed. The discount rate used in determining the present value of lease payments is based on the Company’s incremental borrowing rate for borrowings with terms similar to each lease at commencement date. The Company has lease agreements with lease and non-lease components, which are generally accounted for separately. For real estate leases, non-lease components and other non-components, such as common area maintenance charges, real estate taxes, and insurance, are not included in the measurement of the lease liability since they are generally able to be segregated.
Marketing Expense
Advertising costs are expensed as incurred.
Other Real Estate Owned
Other real estate owned (“OREO”) consists of properties formerly pledged as collateral to loans, which have been acquired by the BankCompany through foreclosure proceedings or acceptance of a deed in lieu of foreclosure. Upon transfer of a loan to foreclosure status, an appraisal is obtained and any excess of the loan balance over the fair value, less estimated costs to sell, is charged against the allowance for loancredit losses. Expenses and subsequent adjustments to the fair value are treated as noninterest expense through other operating expense.expenses.
Goodwill, Core Deposit Intangibles, and Other Intangible Assets
Goodwill represents the excess of the purchase price over the fair value of net assets acquired in a business combination. Core deposit intangible (“CDI”) represents a premium paid to acquire the core deposits of an institution and is recorded as an intangible asset. Goodwill and intangible assets that are not amortized are tested for impairment, based on their fair values, at least annually. There was no goodwill impairment recognized during 2023, 2022, or 2021. Identifiable intangible assets that are subject to amortization are also reviewed for impairment based on their fair value. Any impairment is recognized as a charge to earnings and the adjusted carrying amount of the intangible asset becomes its new accounting basis. The remaining useful life of an intangible asset that is being amortized is also evaluated each reporting period to determine whether events and circumstances warrant a revision to the remaining period of amortization. The Company is amortizing the CDI on a straight-line basis over a ten-year period.
Mortgage servicing assetsrights (“MSR”) are recognized as separate assets when rights are acquired through purchase or through sale of financial assets with servicing rights retained. The fair value of the servicing rights is determined by estimating the present value of future net cash flows, taking into consideration market loan prepayment speeds, discount rates, servicing costs, and other economic factors. For purposes of measuring impairment, the underlying loans are generally stratified into relatively homogeneous pools based on predominant risk characteristics which include product type (i.e., fixed or adjustable)characteristics. Because of the small size of this asset class, and interest rate bands.its relative homogeneity, only one stratum is used. If the aggregate carrying value of the capitalized mortgage servicing rights for athis stratum exceeds its fair value, MSR impairment is recognized in earnings through a valuation allowance for the difference. As the loans are repaid and net servicing revenue is earned, the MSR asset is amortized as an offset to loan servicing income. Servicing revenues are expected to exceed this amortization expense. However, if actual prepayment experience or defaults exceed what was originally anticipated, net servicing revenues may be less than expected and mortgage servicing rightsincome may be impaired.negative.
Income Taxes
The Company and its subsidiaries file income tax returns in the U.S. federal jurisdiction, in the Commonwealth of Massachusetts, and the state of New Hampshire, the State of Connecticut, the state of Maine, and other states as required. For the tax year 2017,ended December 31, 2023, the Company willexpects to file taxes in Massachusetts, New Hampshire, and New Hampshire.Maine.
66
Income taxes are accounted for under the asset and liability method. Deferred tax assets and liabilities are reflected at currently enacted income tax rates applicable to the period in which the deferred tax assets or liabilities are expected to be realized or settled. As changes in tax laws or rates are enacted, deferred tax assets and liabilities are adjusted through income tax expenses in the provision for income taxes.period of enactment. Deferred tax assets are reviewed quarterly and reduced by a valuation allowance if, based upon the information available, it is more likely than not that some or all of the deferred tax assets will not be realized.
Interest and penalties related to unrecognized tax benefits, if incurred, are recognized as a component of income tax expense.
Wealth ManagementFee Revenue
The Tax Cuts and Jobs Act of 2017 was enacted on December 22, 2017. Effective in 2018, the change in tax law will reduce the Company’s statutory federal tax rate from 35% to 21%. The Company recordedearns wealth management fees for providing investment management, trust administration, and financial planning services to clients. The Company’s performance obligation under these contracts is satisfied over time as the wealth management services are provided. Fees are recognized monthly based on the monthly value of the assets under management and the applicable fee rate, or at a one-time non-cash write-downfixed annual rate, depending on the terms of net deferred taxthe contract. No performance-based incentives are earned on wealth management contracts.
The Company also earns trust fees for servicing as trustee for certain clients. As trustee, the Company serves as a fiduciary, administers the client’s trust, and in some cases, manages the assets of $3.9 millionthe trust. The Company’s performance obligation under these agreements is satisfied over time as these deferred tax assets were required to be re-measured using the new lower tax rate in 2017.
Wealthadministrative and management revenues include assetservices are provided. Fees are recognized monthly based revenues (trust and investment advisory fees) that are primarily accrued as earned based uponon a percentage of asset valuesthe market value of the account or at a fixed annual rate as outlined in the agreement. The Company also earns fees for trust related activities. The Company’s performance obligation under management or administration. Also includedthese agreements is satisfied at a point in wealth management revenues are transaction-based revenues (financial planning feestime and other service fees), which are recognized as revenue to the extent thatwhen these services have been completed.performed.
Other Banking Fee revenue fromIncome
The Company charges a variety of fees to its clients for services provided on the deposit and deposit management related accounts. Each fee is either transaction-based or assessed monthly. The types of fees include service charges is generallyon accounts, wire transfer fees, maintenance fees, ATM fee charges, and other miscellaneous charges related to the accounts. These fees are not governed by individual contracts with clients. They are charged to clients based on disclosures presented to these clients upon opening these accounts, along with updated disclosures when changes are made to the fee structures. The transaction-based fees are recognized in revenue when earned.charged to the client based on specific activity on the client’s account. Monthly service and maintenance charges are recognized in the month they are earned and are charged directly to the client’s account.
Pension and Retirement Plans
The Company sponsoredsponsors a defined benefit pension plan (the “Pension Plan”) and a postretirement health care plan covering substantially all employees hired before May 2, 2011. On October 23,Effective December 31, 2017, the Company announced its decision to freeze the accrual of benefits for all participants in the Pension Plan effective as of December 31, 2017. Total pension obligations at year end includes a curtailment gain of $7.4 million due to the pension plan freeze. Benefits for the pension plan were based primarily on years of service and the employee’s average monthly pay during the five highest consecutive plan years of the employee’s final ten years.was frozen. Benefits for the postretirement health care plan wereare based on years of service. ExpenseExpenses for both of these plans isthe postretirement health care plan are recognized over the employee’s service life utilizing the projected unit credit actuarial cost method. Contributions are periodically made toEffective November 7, 2019, the pensionpostretirement health care plan to comply with the Employee Retirement Income Security Act of 1974, as amended (“ERISA”), funding standards, and the Internal Revenue Code of 1986, as amended. was frozen for employees hired after that date.
The Company also sponsors non-qualified retirement programs that provide supplemental retirement benefits to certain current and former executives. Prior to 2016, the Company provided individual non-qualified defined benefit supplemental executive retirement plans (“DB SERPs”) to certain executives. The DB SERPs generally provide for an annual benefit payable in equal monthly installments following the executive’s retirement and continuing for at least the remainder of his or her lifetime, with such annual benefit generally based on the executive’s years of service and his or her highest three consecutive years of base salary and bonus. In 2016, the Company’s Board of Directors discontinued the use of DB SERPs for new entrants to the Company’s non-qualified retirement programs. Instead, new entrants are provided with individual non-qualified defined contribution supplemental executive retirement plans (“DC SERPs”). Under the DC SERPs, the Company contributesmay contribute an amount equal to 10%10% of the executive’s base salary and bonus to his or her account under the Company’s non-qualified deferred compensation plan, the Executive Deferred Compensation Plan. Expense for the DB SERPs is recognized over the executive’s service life utilizing the projected unit credit actuarial cost method. Expense for the DC SERPs is recognized as incurred.
The Company maintains a Profit SharingProfit-Sharing Plan (“PSP”) that provides for deferral of federal and state income taxes on employee contributions allowed under Section 401(k) of federal law. The Company matchedmatches employee contributions up to 100%100% of the first 3%4% of each participant’s salary.salary, eligible bonus, and eligible incentive. Each year, the Company may also make a discretionary contribution to the PSP.PSP based on eligible salary, bonus, and incentive. Employees wereare eligible to participate in the 401(k) featurePSP on the first day of their initial date of service. Employees are also eligible to participate in the discretionary contribution portion of the PSP on the first business daydate of the quarter following their initial date of service and attainment of age 21. Employees were eligible to participate in discretionary contribution featureservice. The employee must be employed on the last day of the PSP on January 1 and July 1 of eachcalendar year provided they have attainedor retire at the normal retirement age of 21 and65 during the completion of 12 months of service consisting of at least 1,000 hours.calendar year to receive the discretionary contribution.
67
Share-Based Compensation
Share-based compensation plans provide for stock option awards, ofrestricted stock optionsawards, time-based restricted stock units (“RSUs”), and other equity incentives, including nonvested share awards and nonvested performance share units.performance-based restricted stock units (“PRSUs”).
Compensation expense for restricted stock awards is recognized over the servicevesting period based on the fair value at the date of grant. Awards of nonvested share unitsRSUs and nonvested performance share unitsPRSUs are valued at the fair market value of the Company’s common stock as of the award date. Nonvested performance share unitPRSUs’ compensation expense is based on the most recent performance assumption available and is adjusted as assumptions change. If the goals are not met, vesting does not occur, and no compensation cost will be recognized and any recognized compensation costs will be reversed. Stock-based awards that do not require future service are expensed immediately. The Company estimates expected forfeitures in determining compensation expense.the year of grant.
Derivative Instruments and Hedging Activities
Derivative instruments related to commercial loan swaps, mirror swaps with counterparties, and risk participation agreements are considered “derivatives.”
Derivatives are recognized as either assets or liabilities on the consolidated balance sheetsheets and are measured at fair value. The accounting for changes in the fair value of such derivatives depends on the intended use of the derivative and resulting designation. For derivatives not designated as hedges, changes in fair value of the derivative instruments are recognized in earnings in noninterest income.
For derivatives designated as fair value hedges, changes in the fair value of such derivatives are recognized in earnings together with the changes in the fair value of the related hedged item. The net amount, if any, represents hedge ineffectiveness and is reflected in earnings.
For derivatives designated as cash flow hedges, the effective portion of changes in the fair value of the derivative is recorded in other comprehensive income (loss) and recognized in earnings when the hedged transaction affects earnings. The ineffective portion of changes in the fair value of cash flow hedges is recognized directly in earnings.
For derivatives not designated as hedges, changes in fair value of the derivative instruments are recognized in earnings, in noninterest income.
The accrued net settlements on derivatives that qualify for hedge accounting are recorded in interest income or interest expense based on the item being hedged. Changes in fair value of such derivatives including accrued net settlements that do not qualify for hedge accounting are reported in noninterest income.
Fair Value Measurements
Fair value is defined as the price that would be received to sell an asset or paid to transfer a liability in an orderly transaction between market participants at the measurement date. The Company measures the fair values of its financial instruments in accordance with accounting guidance that requires an entity to base fair value on exit price and maximize the use of observable inputs and minimize the use of unobservable inputs to determine the exit price.
ASC 820, “Fair Value Measurements and Disclosures” establishes a fair value hierarchy that gives the highest priority to quoted prices in active markets and the lowest priority to unobservable data and requires fair value measurements to be disclosed by level within the hierarchy. The three broad levels defined by the fair value hierarchy are as follows:
Level 1 – Quoted prices are available in active markets for identical assets or liabilities as of the reported date. The type of financial instruments included in Level 1 are highly liquid cash instruments with quoted prices such as government or agency securities, listed equities, and money market securities, as well as listed derivative instruments.
Level 2 – Pricing inputs are other than quoted prices in active markets, which are either directly or indirectly observable as of the reported date. The nature of these financial instruments includes cash instruments for which quoted prices are available but traded less frequently, derivative instruments whose fair value has been derived using a model where inputs to the model are directly observable in the market or can be derived principally from or corroborated by observable market data, and instruments that are fair valued using other financial instruments, the parameters of which can be directly observed. Instruments which are generally included in this category are corporate bonds and loans, mortgage whole loans, municipal bonds, and over-the-counter derivatives.
Level 3 – Instruments that have little to no pricing observability as of the reported date. These financial instruments do not have two-way markets and are measured using management’s best estimate of fair value, where the inputs into the determination of fair value require significant management judgment to estimation. Instruments that are included in this category generally include certain commercial mortgage loans, certain private equity investments, distressed debt, non-investment grade residual interests in securitizations, as well as certain highly structured over-the-counter derivative contracts.
Earnings per Common Share
Earnings per common share is computed using the more dilutive two-class method prescribed under ASC Topic 260, “Earnings Per Share.” ASC Topic 260 provides that unvested share-based payment awards that contain nonforfeitable rights to dividends or dividend equivalents (whether paid or unpaid) are participating securities and shall be included in the computation of earnings per share pursuant to the two-class method. We haveThe Company has determined that ourits outstanding non-vested stock awards are participating securities.
Under the two-class method, basic earnings per common share is computed by dividing net earnings allocated to common stock by the weighted-average number of common shares outstanding during the applicable period, excludingincluding outstanding participating securities. Diluted earnings per common share is computed using the weighted-average number of shares determined for the basic earnings per common share computation plus the dilutive effect of common stock equivalents. A reconciliation of the weighted-average shares used
68
in calculating basic earnings per common share and the weighted average common shares used in calculating diluted earnings per common share for the reported periods is provided in Note 2120 - Earnings Per Share.Share.
Management has reviewed events occurring through March 21, 2018,12, 2024, the date the consolidated financial statements were issued and determined that no subsequent events occurred requiring adjustment to or disclosure in these consolidated financial statements.
|
|
Accounting Pronouncements Adopted in 2023
In March 2022, the Financial Accounting Standards Board (the “FASB”(“FASB”) issued amended guidance to address certain stranded income tax effects in accumulated other comprehensive incomeAccounting Standards Update (“AOCI”ASU”) resulting from the Tax Cuts2022-02, Financial Instruments – Credit Losses (Topic 326): Troubled Debt Restructurings and Jobs Act. The ASU requires the following:
A description of the accounting policy for releasing income tax effects from AOCI,
Whether we elect to reclassify the stranded income tax effects from the Tax Cuts and Jobs Act, and
Information about the other income tax effects that are reclassified.
Vintage Disclosures.The amendments in this ASU affect any organization thateliminate the accounting guidance for troubled debt restructurings (“TDRs”) by creditors in Subtopic 310-40, Receivables – Troubled Debt Restructurings by Creditors, while enhancing disclosure requirements for certain loan refinancings and restructurings by creditors when a borrower is requiredexperiencing financial difficulty. For public business entities, the amendments in this ASU require an entity to apply the provisionsdisclose current-period gross write-offs by year of Topic 220, Income Statement—Reporting Comprehensive Income,origination for financing receivables and has items of other comprehensive incomenet investments in leases. This ASU was effective for which the related tax effects are presented in other comprehensive income as required by GAAP.fiscal years beginning after December 15, 2022, including interim periods within those fiscal years. Early adoption was permitted. The Company adopted thisthe new standard effectiveon January 1, 2018. The2023 and the adoption of this guidance willdid not have a material impact on ourthe consolidated balance sheets, statements of income, and cash flows. financial statements.
Accounting Standard Update No. 2017-12 -
In March 2022, the FASB issued ASU 2022-01, Derivatives and Hedging: Targeted Improvements to Accounting for Hedging Activities (“ASU 2017-12”). On August 28, 2017, the FASB issued a new standard that allows companies to better align their hedge accounting and risk management activities(Topic 815): Fair Value Hedging - Portfolio Layer Method. The new standard willamendments in this ASU allow multiple hedged layers to be designated for a single closed portfolio of financial assets or one or more beneficial interests secured by a portfolio of financial instruments. The amendments in this ASU also reduceclarify thecost and complexity of applying hedge accounting. The standard requires companies to change the recognition and presentation of the effects of hedge accounting by:
Eliminating therequirementtoseparatelymeasureandreporthedge ineffectiveness;and
Requiringcompaniestopresentalloftheelementsofhedgeaccounting thataffectearningsinthesameincomestatementlineasthehedgeditem.
The standard also permits hedge accounting for strategiesand promote consistency in the reporting of hedge basis adjustments applicable to both a single hedged layer and multiple hedged layers. These amendments are effective for which hedge accounting was not historically permitted todayfiscal years beginning after December 15, 2022, and includesinterim periods within those fiscal years. The Company adopted the new alternatives for measuring the hedged item for fair value hedges of interest rate risk. Furthermore, the standard eases the requirements for effectiveness testing, hedge documentation, applying the critical terms match method, and introduces new alternatives that will permit companies to reduce the risk of material error corrections if they misapply the shortcut method. The new accounting standard is effective on January 1, 20192023 and provided the additional disclosures required for the Company, and early adoption is permitted.Company's fair value hedging relationships.
The new standard requires a modified retrospective transition method in which the Company will recognize the cumulative effect of the change on the opening balance of each affected component of equity in the statement of financial position as of the date of adoption. While the Company continues
Accounting Pronouncements Yet to assess all potential impacts of the standard, we currently expect adoption to have an immaterial impact on our consolidated financial statements.be Adopted
Accounting Standards Update No. 2017-08 - Premium Amortization on Purchased Callable Debt Securities (“ASU 2017-08”). On March 30, 2017,
In December 2023, the FASB issued guidanceASU 2023-09, Income Taxes (Topic 740): Improvements to amendIncome Tax Disclosures. The amendments are to enhance the amortization period for certain purchased callable debt securities held at a premium.transparency and decision usefulness of income tax disclosures. The new guidanceASU requires that public business entities to amortize premium on callable debt securities to the earliest call date. Shortening the amortization period is generally expected to more closely align the interest income recognition with the expectations incorporatedan annual basis (1) disclose specific categories in the market pricing onrate reconciliation, (2) provide additional information for reconciling items that meet a quantitative threshold. and also includes certain other amendments to improve the underlying securities. Under GAAP, entities generally amortize the premium as an adjustmenteffectiveness of yield over the contractual life of the instrument. Debt securities held at a discount will continue to be amortized to maturity.income tax disclosures. The amended guidanceamendments in this Update are effective for annual periods beginning after December 15, 2024. The Company is effective on January 1, 2020 for the Company, and early adoption is permitted. This guidance should be applied using a modified retrospective transition method. Additionally, in the period of adoption, we will provide disclosures about a change in accounting principle. We are currently assessing the impact the adoption of this guidance will have on ourits consolidated balance sheets,financial statements and disclosures.
Eastern Bankshares, Inc.
On September 19, 2023, the Company, the Bank, Eastern Bankshares, Inc. (“Eastern”), Eastern Bank, Eastern’s subsidiary bank, and Citadel MS 2023, Inc. a direct, wholly owned subsidiary of income,Eastern (“Merger Sub”) entered into an Agreement and Plan of Merger (the “Merger Agreement”). Pursuant to the terms and subject to the conditions set forth in the Merger Agreement, Eastern will acquire the Company and the Bank through the merger of Merger Sub with and into the Company, with the Company as the surviving entity (the “Merger”). As soon as reasonably practicable following the Merger, the Company will merge with and into Eastern, with Eastern as the surviving entity (the “Holdco Merger”). The Merger Agreement further provides that following the Holdco Merger, at a time to be determined by Eastern, the Bank will merge with and into Eastern Bank, with Eastern Bank as the surviving entity. Upon the terms and conditions set forth in the Merger Agreement, at the effective time of the Merger (the “Effective Time”) each share of Company common stock, par value $1.00 per share, outstanding immediately prior to the Effective Time, other than certain shares held by Eastern or the Company, will be converted into the right to receive 4.956 shares of common stock (the “Exchange Ratio”), par value $0.01 per share, of Eastern (“Eastern Common Stock”). Company shareholders will receive cash in lieu of fractional shares of Eastern Common Stock (the Exchange Ratio and any cash in lieu of fractional shares collectively, the “Merger Consideration”).
Northmark Bank
The Company completed its merger (the “Northmark Merger”) with Northmark Bank. (“Northmark”) on October 1, 2022 Under the terms of the Agreement and Plan of Merger, each outstanding share of Northmark common stock was converted into 0.9950 shares of the Company’s common stock. As a result of the merger, former Northmark stockholders received an aggregate of 788,137 shares of
69
the Company's common stock. The total consideration paid amounted to $62.8 million, based on the closing price of $79.74 of the Company’s common stock and cash flows.paid for fractional shares on October 1, 2022.
Accounting Standards Update No. 2017-07 - Improving the Presentation of Net Periodic Pension Cost and Net Periodic Postretirement Benefit Cost (“ASU 2017-07”). On March 10, 2017, the FASB issued amended guidance primarily to improve the presentation of net periodic pension cost and net periodic postretirement benefit cost, as discussed below. The new guidance will require that an employer report the service cost component in the same line item or items as other compensation costs arising from services rendered by the pertinent employees during the period. The amended guidance is effective on January 1, 2020Company accounted for the Company. This guidance should be appliedmerger using a modified retrospective transition method. We are currently assessing the impact that the adoptionacquisition method pursuant to ASC Topic 805, “Business Combinations.” and recorded total assets of this guidance will have on our consolidated balance sheets, statements$428.7 million, including $12.6 million in goodwill, and assumed total liabilities of income,$378.5 million.
At December 31, 2023 and cash flows.
Accounting Standards Update No. 2016-18 - Restricted Cash (“ASU 2016-18”). On November 17, 2016, the FASB issued amended guidance to require that a statement of cash flows explain the change during the period in the total of cash, cash equivalents, and amounts generally described as restricted cash or restricted cash equivalents. Therefore, amounts generally described as restricted cash and restricted cash equivalents should be included withDecember 31, 2022, cash and cash equivalents when reconciling the beginning-of-periodtotaled $33.0 million and end-of-period total$30.7 million, respectively. There were no amounts shown on the statement of cash flows. The guidance is effective on January 1, 2018 for the Company, and early adoption is permitted. This guidance should be applied using a retrospective transition method to each period presented. The adoption of this guidance will not have a material impact on our consolidated balance sheets, statements of income, and cash flows.
Accounting Standards Update No. 2016-15 - Classification of Certain Cash Receipts and Cash Payments (“ASU 2016-15”). On August 26, 2016, the FASB issued amendments to clarify guidance on the classification of certain cash receipts and payments in the statement of cash flows. This guidance is intended to reduce existing diversity in practice in how certain cash receipts and cash payments are presented and classified on the statement of cash flows. This guidance is effective for the Company for interim and annual periods beginning on January 1, 2018, and early adoption is permitted. This guidance should be applied using a retrospective transition method to each period presented. The adoption of this guidance will not have a material impact on our consolidated balance sheets, statements of income, and cash flows.
Accounting Standards Update No. 2016-13 - Financial Instruments - Measurement of Credit Losses on Financial Instruments (“ASU 2016-13”). On June 16, 2016, the FASB issued ASU 2016-13, which will significantly change how entities measure and recognize credit impairment for many financial assets. Under this standard, the new current expected credit loss model will require entities to immediately recognize an estimate of credit losses expected to occur over the remaining life of the financial assets that are in the scope of the standard. This new guidance also made targeted amendments to the current impairment model for available for sale debt securities. This guidance will be effective for the Company for the fiscal years beginning after December 15, 2020, including interim periods within those fiscal years. Early adoption for fiscal years and interim periods beginning after December 15, 2018 is permitted. We are in the process of evaluating this guidance and its effect on our consolidated balance sheets, statements of income, and cash flows. We are currently developing an implementation plan which will include assessment of processes, portfolio segmentation, model development, system requirements and the identification of data and resource needs to implement this standard. We are also currently evaluating selected third-party vendor solutions to assist us in implementing the requirements of ASU 2016-13.
Accounting Standards Update No. 2016-09 - Improvements to Employee Share-Based Payment Accounting (“ASU 2016-09”). On March 30, 2016, the FASB issued ASU 2016-09 as part of the initiative to reduce the complexity in accounting standards. The updated guidance addresses several areas for simplification, including accounting for employee share-based payment transactions and the income tax consequences, classification of awards as either equity or liabilities, and classification on the statement of cash flows. The Company adopted the guidance on January 1, 2017 using the prospective method and recorded a tax benefit of $221,000 for the year ended December 31, 2017.
Accounting Standards Update No. 2016-02 - Leases (“ASU 2016-02”). On February 25, 2016, the FASB issued guidance that requires recognition of lease assets and lease liabilities on the statement of condition and disclosure of key information about leasing arrangements. In particular, this guidance requires a lessee of operating or finance leases to recognize on the statement of condition a liability to make lease payments and a right-of-use asset representing its right to use the underlying asset for the lease term. However, for leases with a term of 12 months or less, a lessee is permitted to make an accounting policy election not to recognize lease assets and lease liabilities. Under previous GAAP, a lessee was not required to recognize lease assets and lease liabilities arising from operating leases on the statement of condition. The guidance becomes effective for the Company for the interim and annual periods beginning on January 1, 2019, and early adoption is permitted. We are currently assessing the impact the adoption of this guidance will have on our consolidated balance sheets, statements of income, and cash flows. We have created a project team responsible for identifying the population of leases, evaluating the required accounting changes, and developing the processes and procedures needed to implement ASU 2016-02.
Accounting Standards Update No. 2016-01 - Recognition and Measurement of Financial Assets and Financial Liabilities (“ASU 2016-01”). On January 5, 2016, the FASB issued amended guidance on certain aspects of recognition, measurement, presentation, and disclosure of financial instruments. This guidance includes, but is not limited to, the following:
Requires equity investments (with certain exceptions) to be measured at fair value with changes in fair value recognized in net income.
Requires an entity to present separately in other comprehensive income the portion of the total change in the fair value of a liability resulting from a change in the instrument-specific credit risk when the entity has elected to measure the liability at fair value in accordance with the fair value option for financial instruments.
Requires separate presentation of financial assets and financial liabilities by measurement category and form of financial asset (that is, securities or loans and receivables) on the statement of condition or the accompanying notes to the financial statements.
|
|
Eliminates the requirement for public entities to disclose the method(s) and significant assumptions used to estimate the fair value that is required to be disclosed for financial instruments measuredmaintained at amortized cost on the statement of condition.
This guidance becomes effective for the Company for the interim and annual periods beginning on January 1, 2018, and early adoption is only permitted for certain provisions. The amendments, in general, are required to be applied by means of a cumulative-effect adjustment on the statement of condition as of the beginning of the period of adoption. The adoption of this guidance is not expected to have a material impact on our consolidated balance sheets, statements of income, and cash flows.
Accounting Standards Update No. 2014-09 - Revenue from Contracts with Customers (“ASU 2014-09”). On May 28, 2014, the FASB issued Accounting Standards Update (“ASU”) No. 2014-09, “Revenue from Contracts with Customers,” which requires an entity to recognize the amount of revenue to which it expects to be entitled for the transfer of promised goods or services to customers. The new guidance supersedes current U.S. GAAP guidance on revenue recognition and requires the use of more estimates and judgments than the current revenue standards. The new guidance does not apply to revenue associated with financial instruments that are accounted for under other accounting standards. Accordingly, the new revenue recognition guidance does not have an impact on our consolidated results of operations associated with our loan portfolios, investments and derivatives.
We adopted the new standard as of January 1, 2018, the effective date. The Company evaluated the timing and recognition of revenue for its wealth management fees, deposit fees, and other income within noninterest income. We concluded that the adoption of this guidance did not have an impact on our consolidated balance sheets, statements of income, and cash flows. Under the new standard, we will expand our revenue disclosures in the first quarter of 2018.
|
|
At December 31, 2017 and December 31, 2016, cash and due from banks totaled $103.6 million and $54.1 million, respectively. Of this amount, $12.8 million and $11.2 million, respectively, were maintained to satisfy the reserve requirements of the Federal Reserve Bank of Boston (“FRB of Boston”). Additionally, at December 31, 20172023 and 2016,December 31, 2022. At December 31, 2023 and December 31, 2022, the Company pledged $500,000$500,000 to the New Hampshire Banking Department relating to Cambridge Trust Company of New Hampshire, Inc.’s operations in that state. The Company did not have any cash pledged as collateral to derivative counterparties at December 31, 2023 or at December 31, 2022. See Note 21 -Derivatives and Hedging Activities for a discussion of the Company’s derivative and hedging activities.
| 6. INVESTMENT SECURITIES |
Investment securities have been classified in the accompanying consolidated balance sheets according to management’s intent. The carrying amounts of securities and their approximate fair values were as follows:
|
| December 31, 2017 |
|
| December 31, 2016 |
|
| December 31, 2023 |
|
| December 31, 2022 |
| ||||||||||||||||||||||||||||||||||||||||||||||||||||
|
| Amortized Cost |
|
| Gross Unrealized Gains |
|
| Gross Unrealized Losses |
|
| Fair Value |
|
| Amortized Cost |
|
| Gross Unrealized Gains |
|
| Gross Unrealized Losses |
|
| Fair Value |
|
| Amortized |
|
| Gross |
|
| Gross |
|
| Fair |
|
| Amortized |
|
| Gross |
|
| Gross |
|
| Fair |
| ||||||||||||||||
|
| (dollars in thousands) |
|
| (dollars in thousands) |
| ||||||||||||||||||||||||||||||||||||||||||||||||||||||||||
Available for sale securities |
|
|
|
|
|
|
|
|
|
|
|
|
|
|
|
|
|
|
|
|
|
|
|
|
|
|
|
|
|
|
|
|
|
|
|
|
|
|
|
|
|
|
|
|
|
|
|
|
| |||||||||||||||
U.S. GSE obligations |
| $ | 90,021 |
|
| $ | — |
|
| $ | (1,230 | ) |
| $ | 88,791 |
|
| $ | 140,026 |
|
| $ | 23 |
|
| $ | (1,340 | ) |
| $ | 138,709 |
| ||||||||||||||||||||||||||||||||
U.S. Government Sponsored |
| $ | 22,998 |
|
| $ | — |
|
| $ | (2,536 | ) |
| $ | 20,462 |
|
| $ | 22,997 |
|
| $ | — |
|
| $ | (3,264 | ) |
| $ | 19,733 |
| ||||||||||||||||||||||||||||||||
Mortgage-backed securities |
|
| 113,184 |
|
|
| 248 |
|
|
| (2,806 | ) |
|
| 110,626 |
|
|
| 183,974 |
|
|
| 479 |
|
|
| (3,154 | ) |
|
| 181,299 |
|
|
| 140,378 |
|
|
| 4 |
|
|
| (23,006 | ) |
|
| 117,376 |
|
|
| 158,034 |
|
|
| 3 |
|
|
| (25,354 | ) |
|
| 132,683 |
|
Corporate debt securities |
|
| 5,034 |
|
|
| 12 |
|
|
| (45 | ) |
|
| 5,001 |
|
|
| 5,054 |
|
|
| 13 |
|
|
| (38 | ) |
|
| 5,029 |
|
|
| — |
|
|
| — |
|
|
| — |
|
|
| — |
|
|
| 996 |
|
|
| 4 |
|
|
| — |
|
|
| 1,000 |
|
Mutual funds |
|
| 672 |
|
|
| — |
|
|
| (73 | ) |
|
| 599 |
|
|
| 672 |
|
|
| — |
|
|
| (68 | ) |
|
| 604 |
| ||||||||||||||||||||||||||||||||
Total available for sale securities |
| $ | 208,911 |
|
| $ | 260 |
|
| $ | (4,154 | ) |
| $ | 205,017 |
|
| $ | 329,726 |
|
| $ | 515 |
|
| $ | (4,600 | ) |
| $ | 325,641 |
|
| $ | 163,376 |
|
| $ | 4 |
|
| $ | (25,542 | ) |
| $ | 137,838 |
|
| $ | 182,027 |
|
| $ | 7 |
|
| $ | (28,618 | ) |
| $ | 153,416 |
|
|
|
|
|
|
|
|
|
|
|
|
|
|
|
|
|
|
|
|
|
|
|
|
|
|
|
|
|
|
|
|
|
|
|
|
|
|
|
|
|
|
|
|
|
|
|
|
|
|
| |||||||||||||||
Held to maturity securities |
|
|
|
|
|
|
|
|
|
|
|
|
|
|
|
|
|
|
|
|
|
|
|
|
|
|
|
|
|
|
|
|
|
|
|
|
|
|
|
|
|
|
|
|
|
|
|
|
| |||||||||||||||
U.S. GSE obligations |
| $ | 32,572 |
|
| $ | — |
|
| $ | (166 | ) |
| $ | 32,406 |
|
| $ | — |
|
| $ | — |
|
| $ | — |
|
| $ | — |
| ||||||||||||||||||||||||||||||||
U.S. Treasury Notes |
| $ | 3,039 |
|
| $ | — |
|
| $ | (13 | ) |
| $ | 3,026 |
|
| $ | 3,970 |
|
| $ | — |
|
| $ | (18 | ) |
| $ | 3,952 |
| ||||||||||||||||||||||||||||||||
Mortgage-backed securities |
|
| 117,155 |
|
|
| 7 |
|
|
| (906 | ) |
|
| 116,256 |
|
|
| 696 |
|
|
| 23 |
|
|
| — |
|
|
| 719 |
|
|
| 871,426 |
|
|
| 17 |
|
|
| (146,397 | ) |
|
| 725,046 |
|
|
| 951,372 |
|
|
| 4 |
|
|
| (157,208 | ) |
|
| 794,168 |
|
Corporate debt securities |
|
| 1,998 |
|
|
| 4 |
|
|
| — |
|
|
| 2,002 |
|
|
| — |
|
|
| — |
|
|
| — |
|
|
| — |
|
|
| 250 |
|
|
| — |
|
|
| (2 | ) |
|
| 248 |
|
|
| 250 |
|
|
| — |
|
|
| (6 | ) |
|
| 244 |
|
Municipal securities |
|
| 80,463 |
|
|
| 2,544 |
|
|
| (117 | ) |
|
| 82,890 |
|
|
| 81,806 |
|
|
| 1,894 |
|
|
| (664 | ) |
|
| 83,036 |
|
|
| 84,617 |
|
|
| 24 |
|
|
| (7,533 | ) |
|
| 77,108 |
|
|
| 96,405 |
|
|
| 88 |
|
|
| (9,271 | ) |
|
| 87,222 |
|
Total held to maturity securities |
| $ | 232,188 |
|
| $ | 2,555 |
|
| $ | (1,189 | ) |
| $ | 233,554 |
|
| $ | 82,502 |
|
| $ | 1,917 |
|
| $ | (664 | ) |
| $ | 83,755 |
|
| $ | 959,332 |
|
| $ | 41 |
|
| $ | (153,945 | ) |
| $ | 805,428 |
|
| $ | 1,051,997 |
|
| $ | 92 |
|
| $ | (166,503 | ) |
| $ | 885,586 |
|
Total |
| $ | 441,099 |
|
| $ | 2,815 |
|
| $ | (5,343 | ) |
| $ | 438,571 |
|
| $ | 412,228 |
|
| $ | 2,432 |
|
| $ | (5,264 | ) |
| $ | 409,396 |
|
| $ | 1,122,708 |
|
| $ | 45 |
|
| $ | (179,487 | ) |
| $ | 943,266 |
|
| $ | 1,234,024 |
|
| $ | 99 |
|
| $ | (195,121 | ) |
| $ | 1,039,002 |
|
All of the Company’s mortgage-backed securities have been issued by, or are collateralized by securities issued by, eitherthe Government National Mortgage Association (Ginnie Mae)(“Ginnie Mae” or “GNMA”), the Federal National Mortgage Association (Fannie Mae)(“Fannie Mae” or “FNMA”), or the Federal Home Loan Mortgage Corporation (Freddie Mac)(“Freddie Mac” or “FHLMC”).
70
The amortized cost and fair value of debt investments,investment securities, aggregated by the contractual maturity, are shown below. Municipal securities are aggregated by the earliest of call date or contractual maturity. Maturities of mortgage-backed securities do not take into consideration scheduled amortization or prepayments. Actual maturities may differ from contractual maturities because issuers may have the right to call or prepay obligations with or without call or prepayment penalties.
|
| December 31, 2023 |
| |||||||||||||||||||||||||||||||||||||
|
| Within One Year |
|
| After One, But |
|
| After Five, But |
|
| After Ten Years |
|
| Total |
| |||||||||||||||||||||||||
|
| Amortized |
|
| Fair |
|
| Amortized |
|
| Fair |
|
| Amortized |
|
| Fair |
|
| Amortized |
|
| Fair |
|
| Amortized |
|
| Fair |
| ||||||||||
|
| (dollars in thousands) |
| |||||||||||||||||||||||||||||||||||||
Available for sale securities |
|
|
|
|
|
|
|
|
|
|
|
|
|
|
|
|
|
|
|
|
|
|
|
|
|
|
|
|
|
| ||||||||||
U.S. Government Sponsored Enterprise obligations |
| $ | — |
|
| $ | — |
|
| $ | 9,998 |
|
| $ | 9,360 |
|
| $ | 5,000 |
|
| $ | 4,506 |
|
| $ | 8,000 |
|
| $ | 6,596 |
|
| $ | 22,998 |
|
| $ | 20,462 |
|
Mortgage-backed securities |
|
| — |
|
|
| — |
|
|
| 11,466 |
|
|
| 10,877 |
|
|
| 37,207 |
|
|
| 31,611 |
|
|
| 91,705 |
|
|
| 74,888 |
|
|
| 140,378 |
|
|
| 117,376 |
|
Total available for sale securities |
| $ | — |
|
| $ | — |
|
| $ | 21,464 |
|
| $ | 20,237 |
|
| $ | 42,207 |
|
| $ | 36,117 |
|
| $ | 99,705 |
|
| $ | 81,484 |
|
| $ | 163,376 |
|
| $ | 137,838 |
|
|
|
|
|
|
|
|
|
|
|
|
|
|
|
|
|
|
|
|
|
|
|
|
|
|
|
|
|
|
|
| ||||||||||
Held to maturity securities |
|
|
|
|
|
|
|
|
|
|
|
|
|
|
|
|
|
|
|
|
|
|
|
|
|
|
|
|
|
| ||||||||||
U.S. Treasury Notes |
| $ | 2,076 |
|
| $ | 2,065 |
|
| $ | 963 |
|
| $ | 961 |
|
| $ | — |
|
| $ | — |
|
| $ | — |
|
| $ | — |
|
| $ | 3,039 |
|
| $ | 3,026 |
|
Mortgage-backed securities |
|
| — |
|
|
| — |
|
|
| 23,490 |
|
|
| 22,378 |
|
|
| 50,094 |
|
|
| 43,247 |
|
|
| 797,842 |
|
|
| 659,421 |
|
|
| 871,426 |
|
|
| 725,046 |
|
Corporate debt securities |
|
| 250 |
|
|
| 248 |
|
|
| — |
|
|
| — |
|
|
| — |
|
|
| — |
|
|
| — |
|
|
| — |
|
|
| 250 |
|
|
| 248 |
|
Municipal securities |
|
| 2,666 |
|
|
| 2,663 |
|
|
| 22,397 |
|
|
| 22,309 |
|
|
| 22,051 |
|
|
| 21,620 |
|
|
| 37,503 |
|
|
| 30,516 |
|
|
| 84,617 |
|
|
| 77,108 |
|
Total held to maturity securities |
| $ | 4,992 |
|
| $ | 4,976 |
|
| $ | 46,850 |
|
| $ | 45,648 |
|
| $ | 72,145 |
|
| $ | 64,867 |
|
| $ | 835,345 |
|
| $ | 689,937 |
|
| $ | 959,332 |
|
| $ | 805,428 |
|
Total |
| $ | 4,992 |
|
| $ | 4,976 |
|
| $ | 68,314 |
|
| $ | 65,885 |
|
| $ | 114,352 |
|
| $ | 100,984 |
|
| $ | 935,050 |
|
| $ | 771,421 |
|
| $ | 1,122,708 |
|
| $ | 943,266 |
|
|
| Within One Year |
|
| After One, But Within Five Years |
|
| After Five, But Within Ten Years |
|
| After Ten Years |
|
| Total |
| |||||||||||||||||||||||||
|
| Amortized Cost |
|
| Fair Value |
|
| Amortized Cost |
|
| Fair Value |
|
| Amortized Cost |
|
| Fair Value |
|
| Amortized Cost |
|
| Fair Value |
|
| Amortized Cost |
|
| Fair Value |
| ||||||||||
At December 31, 2017 |
| (dollars in thousands) |
| |||||||||||||||||||||||||||||||||||||
Available for sale securities |
|
|
|
|
|
|
|
|
|
|
|
|
|
|
|
|
|
|
|
|
|
|
|
|
|
|
|
|
|
|
|
|
|
|
|
|
|
|
|
|
U.S. GSE obligations |
| $ | 14,999 |
|
| $ | 14,916 |
|
| $ | 75,022 |
|
| $ | 73,875 |
|
| $ | — |
|
| $ | — |
|
| $ | — |
|
| $ | — |
|
| $ | 90,021 |
|
| $ | 88,791 |
|
Mortgage-backed securities |
|
| 93 |
|
|
| 94 |
|
|
| 129 |
|
|
| 134 |
|
|
| 26,319 |
|
|
| 25,800 |
|
|
| 86,643 |
|
|
| 84,598 |
|
|
| 113,184 |
|
|
| 110,626 |
|
Corporate debt securities |
|
| — |
|
|
| — |
|
|
| 4,034 |
|
|
| 3,990 |
|
|
| 1,000 |
|
|
| 1,011 |
|
|
| — |
|
|
| — |
|
|
| 5,034 |
|
|
| 5,001 |
|
Total available for sale securities |
| $ | 15,092 |
|
| $ | 15,010 |
|
| $ | 79,185 |
|
| $ | 77,999 |
|
| $ | 27,319 |
|
| $ | 26,811 |
|
| $ | 86,643 |
|
| $ | 84,598 |
|
| $ | 208,239 |
|
| $ | 204,418 |
|
|
|
|
|
|
|
|
|
|
|
|
|
|
|
|
|
|
|
|
|
|
|
|
|
|
|
|
|
|
|
|
|
|
|
|
|
|
|
|
|
|
Held to maturity securities |
|
|
|
|
|
|
|
|
|
|
|
|
|
|
|
|
|
|
|
|
|
|
|
|
|
|
|
|
|
|
|
|
|
|
|
|
|
|
|
|
U.S. GSE obligations |
| $ | — |
|
| $ | — |
|
| $ | 32,572 |
|
| $ | 32,406 |
|
| $ | — |
|
| $ | — |
|
| $ | — |
|
| $ | — |
|
| $ | 32,572 |
|
| $ | 32,406 |
|
Mortgage-backed securities |
|
| 6 |
|
|
| 6 |
|
|
| 256 |
|
|
| 261 |
|
|
| 25,485 |
|
|
| 25,271 |
|
|
| 91,408 |
|
|
| 90,718 |
|
|
| 117,155 |
|
|
| 116,256 |
|
Corporate debt securities |
|
| — |
|
|
| — |
|
|
| 1,998 |
|
|
| 2,002 |
|
|
| — |
|
|
| — |
|
|
| — |
|
|
| — |
|
|
| 1,998 |
|
|
| 2,002 |
|
Municipal securities |
|
| 3,675 |
|
|
| 3,685 |
|
|
| 13,320 |
|
|
| 13,592 |
|
|
| 34,426 |
|
|
| 35,785 |
|
|
| 29,042 |
|
|
| 29,828 |
|
|
| 80,463 |
|
|
| 82,890 |
|
Total held to maturity securities |
| $ | 3,681 |
|
| $ | 3,691 |
|
| $ | 48,146 |
|
| $ | 48,261 |
|
| $ | 59,911 |
|
| $ | 61,056 |
|
| $ | 120,450 |
|
| $ | 120,546 |
|
| $ | 232,188 |
|
| $ | 233,554 |
|
Total |
| $ | 18,773 |
|
| $ | 18,701 |
|
| $ | 127,331 |
|
| $ | 126,260 |
|
| $ | 87,230 |
|
| $ | 87,867 |
|
| $ | 207,093 |
|
| $ | 205,144 |
|
| $ | 440,427 |
|
| $ | 437,972 |
|
The following tables show the Company’s investment securities with gross unrealized losses, for which an allowance for credit losses has not been recorded at December 31, 2023 or at December 31, 2022, aggregated by investment category and length of time that individual investment securities have been in a continuous loss position:
|
| December 31, 2023 |
| |||||||||||||||||||||
|
| Less than 12 months |
|
| 12 months or longer |
|
| Total |
| |||||||||||||||
|
| Fair |
|
| Unrealized |
|
| Fair |
|
| Unrealized |
|
| Fair |
|
| Unrealized |
| ||||||
|
| (dollars in thousands) |
| |||||||||||||||||||||
Available for sale securities |
|
|
|
|
|
|
|
|
|
|
|
|
|
|
|
|
|
| ||||||
U.S. Government Sponsored Enterprise |
| $ | — |
|
| $ | — |
|
| $ | 20,462 |
|
| $ | (2,536 | ) |
| $ | 20,462 |
|
| $ | (2,536 | ) |
Mortgage-backed securities |
|
| 79 |
|
|
| (1 | ) |
|
| 113,478 |
|
|
| (23,005 | ) |
|
| 113,557 |
|
|
| (23,006 | ) |
Total available for sale securities |
| $ | 79 |
|
| $ | (1 | ) |
| $ | 133,940 |
|
| $ | (25,541 | ) |
| $ | 134,019 |
|
| $ | (25,542 | ) |
|
|
|
|
|
|
|
|
|
|
|
|
|
|
|
|
|
|
| ||||||
Held to maturity securities |
|
|
|
|
|
|
|
|
|
|
|
|
|
|
|
|
|
| ||||||
U.S. Treasury Notes |
| $ | 961 |
|
| $ | (2 | ) |
| $ | 2,065 |
|
| $ | (11 | ) |
| $ | 3,026 |
|
| $ | (13 | ) |
Mortgage-backed securities |
|
| — |
|
|
| — |
|
|
| 723,042 |
|
|
| (146,397 | ) |
|
| 723,042 |
|
|
| (146,397 | ) |
Corporate debt securities |
|
| — |
|
|
| — |
|
|
| 248 |
|
|
| (2 | ) |
|
| 248 |
|
|
| (2 | ) |
Municipal securities |
|
| 17,401 |
|
|
| (79 | ) |
|
| 44,548 |
|
|
| (7,454 | ) |
|
| 61,949 |
|
|
| (7,533 | ) |
Total held to maturity securities |
| $ | 18,362 |
|
| $ | (81 | ) |
| $ | 769,903 |
|
| $ | (153,864 | ) |
| $ | 788,265 |
|
| $ | (153,945 | ) |
Total |
| $ | 18,441 |
|
| $ | (82 | ) |
| $ | 903,843 |
|
| $ | (179,405 | ) |
| $ | 922,284 |
|
| $ | (179,487 | ) |
|
| December 31, 2017 |
| |||||||||||||||||||||
|
| Less than 12 months |
|
| 12 months or longer |
|
| Total |
| |||||||||||||||
|
| Fair Value |
|
| Unrealized Losses |
|
| Fair Value |
|
| Unrealized Losses |
|
| Fair Value |
|
| Unrealized Losses |
| ||||||
|
| (dollars in thousands) |
| |||||||||||||||||||||
Temporarily Impaired Securities |
|
|
|
|
|
|
|
|
|
|
|
|
|
|
|
|
|
|
|
|
|
|
|
|
Available for sale securities |
|
|
|
|
|
|
|
|
|
|
|
|
|
|
|
|
|
|
|
|
|
|
|
|
U.S. GSE obligations |
| $ | 4,979 |
|
| $ | (21 | ) |
| $ | 83,812 |
|
| $ | (1,209 | ) |
| $ | 88,791 |
|
| $ | (1,230 | ) |
Mortgage-backed securities |
|
| 12,526 |
|
|
| (157 | ) |
|
| 94,663 |
|
|
| (2,649 | ) |
|
| 107,189 |
|
|
| (2,806 | ) |
Corporate debt securities |
|
| — |
|
|
| — |
|
|
| 3,990 |
|
|
| (45 | ) |
|
| 3,990 |
|
|
| (45 | ) |
Mutual funds |
|
| — |
|
|
| — |
|
|
| 599 |
|
|
| (73 | ) |
|
| 599 |
|
|
| (73 | ) |
Total available for sale securities |
| $ | 17,505 |
|
| $ | (178 | ) |
| $ | 183,064 |
|
| $ | (3,976 | ) |
| $ | 200,569 |
|
| $ | (4,154 | ) |
|
|
|
|
|
|
|
|
|
|
|
|
|
|
|
|
|
|
|
|
|
|
|
|
|
Held to maturity securities |
|
|
|
|
|
|
|
|
|
|
|
|
|
|
|
|
|
|
|
|
|
|
|
|
U.S. GSE obligations |
| $ | 27,407 |
|
| $ | (166 | ) |
| $ | — |
|
| $ | — |
|
| $ | 27,407 |
|
| $ | (166 | ) |
Mortgage-backed securities |
|
| 115,926 |
|
|
| (906 | ) |
|
| 3 |
|
|
| — |
|
|
| 115,929 |
|
|
| (906 | ) |
Corporate debt securities |
|
| — |
|
|
| — |
|
|
| — |
|
|
| — |
|
|
| — |
|
|
| — |
|
Municipal securities |
|
| 2,041 |
|
|
| (19 | ) |
|
| 6,459 |
|
|
| (98 | ) |
|
| 8,500 |
|
|
| (117 | ) |
Total held to maturity securities |
| $ | 145,374 |
|
| $ | (1,091 | ) |
| $ | 6,462 |
|
| $ | (98 | ) |
| $ | 151,836 |
|
| $ | (1,189 | ) |
Total temporarily impaired securities |
| $ | 162,879 |
|
| $ | (1,269 | ) |
| $ | 189,526 |
|
| $ | (4,074 | ) |
| $ | 352,405 |
|
| $ | (5,343 | ) |
71
| December 31, 2016 |
| ||||||||||||||||||||||
|
| Less than 12 months |
|
| 12 months or longer |
|
| Total |
| |||||||||||||||
|
| Fair Value |
|
| Unrealized Losses |
|
| Fair Value |
|
| Unrealized Losses |
|
| Fair Value |
|
| Unrealized Losses |
| ||||||
|
| (dollars in thousands) |
| |||||||||||||||||||||
Temporarily Impaired Securities |
|
|
|
|
|
|
|
|
|
|
|
|
|
|
|
|
|
|
|
|
|
|
|
|
Available for sale securities |
|
|
|
|
|
|
|
|
|
|
|
|
|
|
|
|
|
|
|
|
|
|
|
|
U.S. GSE obligations |
| $ | 118,686 |
|
| $ | (1,340 | ) |
| $ | — |
|
| $ | — |
|
| $ | 118,686 |
|
| $ | (1,340 | ) |
Mortgage-backed securities |
|
| 149,859 |
|
|
| (2,795 | ) |
|
| 14,422 |
|
|
| (359 | ) |
|
| 164,281 |
|
|
| (3,154 | ) |
Corporate debt securities |
|
| 4,016 |
|
|
| (38 | ) |
|
| — |
|
|
| — |
|
|
| 4,016 |
|
|
| (38 | ) |
Mutual funds |
|
| — |
|
|
| — |
|
|
| 604 |
|
|
| (68 | ) |
|
| 604 |
|
|
| (68 | ) |
Total available for sale securities |
| $ | 272,561 |
|
| $ | (4,173 | ) |
| $ | 15,026 |
|
| $ | (427 | ) |
| $ | 287,587 |
|
| $ | (4,600 | ) |
|
|
|
|
|
|
|
|
|
|
|
|
|
|
|
|
|
|
|
|
|
|
|
|
|
Held to maturity securities |
|
|
|
|
|
|
|
|
|
|
|
|
|
|
|
|
|
|
|
|
|
|
|
|
Mortgage-backed securities |
| $ | 1 |
|
| $ | — |
|
| $ | 3 |
|
| $ | — |
|
| $ | 4 |
|
| $ | — |
|
Municipal securities |
|
| 18,626 |
|
|
| (664 | ) |
|
| — |
|
|
| — |
|
|
| 18,626 |
|
|
| (664 | ) |
Total held to maturity securities |
| $ | 18,627 |
|
| $ | (664 | ) |
| $ | 3 |
|
| $ | — |
|
| $ | 18,630 |
|
| $ | (664 | ) |
Total temporarily impaired securities |
| $ | 291,188 |
|
| $ | (4,837 | ) |
| $ | 15,029 |
|
| $ | (427 | ) |
| $ | 306,217 |
|
| $ | (5,264 | ) |
|
| December 31, 2022 |
| |||||||||||||||||||||
|
| Less than 12 months |
|
| 12 months or longer |
|
| Total |
| |||||||||||||||
|
| Fair |
|
| Unrealized |
|
| Fair |
|
| Unrealized |
|
| Fair |
|
| Unrealized |
| ||||||
|
| (dollars in thousands) |
| |||||||||||||||||||||
Available for sale securities |
|
|
|
|
|
|
|
|
|
|
|
|
|
|
|
|
|
| ||||||
U.S. Government Sponsored Enterprise |
| $ | 10,722 |
|
| $ | (2,278 | ) |
| $ | 9,012 |
|
| $ | (986 | ) |
| $ | 19,734 |
|
| $ | (3,264 | ) |
Mortgage-backed securities |
|
| 41,832 |
|
|
| (3,097 | ) |
|
| 90,545 |
|
|
| (22,257 | ) |
|
| 132,377 |
|
|
| (25,354 | ) |
Total available for sale securities |
| $ | 52,554 |
|
| $ | (5,375 | ) |
| $ | 99,557 |
|
| $ | (23,243 | ) |
| $ | 152,111 |
|
| $ | (28,618 | ) |
|
|
|
|
|
|
|
|
|
|
|
|
|
|
|
|
|
|
| ||||||
Held to maturity securities |
|
|
|
|
|
|
|
|
|
|
|
|
|
|
|
|
|
| ||||||
U.S. Treasury Notes |
| $ | 3,952 |
|
| $ | (18 | ) |
| $ | — |
|
| $ | — |
|
| $ | 3,952 |
|
| $ | (18 | ) |
Mortgage-backed securities |
|
| 230,708 |
|
|
| (22,362 | ) |
|
| 562,835 |
|
|
| (134,846 | ) |
|
| 793,543 |
|
|
| (157,208 | ) |
Corporate debt securities |
|
| 243 |
|
|
| (6 | ) |
|
| — |
|
|
| — |
|
|
| 243 |
|
|
| (6 | ) |
Municipal securities |
|
| 51,969 |
|
|
| (4,388 | ) |
|
| 13,714 |
|
|
| (4,883 | ) |
|
| 65,683 |
|
|
| (9,271 | ) |
Total held to maturity securities |
| $ | 286,872 |
|
| $ | (26,774 | ) |
| $ | 576,549 |
|
| $ | (139,729 | ) |
| $ | 863,421 |
|
| $ | (166,503 | ) |
Total |
| $ | 339,426 |
|
| $ | (32,149 | ) |
| $ | 676,106 |
|
| $ | (162,972 | ) |
| $ | 1,015,532 |
|
| $ | (195,121 | ) |
Securities are evaluated by management for other-than-temporary impairment on at least a quarterly basis, and more frequently when economic or market conditions warrant such evaluation. Consideration is given to: (1) the length of time and the extent to which the fair value has been less than cost; (2) the financial condition and near-term prospects of the issuer; and (3) the intent and ability of the Company to retain its investment in the issuer for a period of time sufficient to allow for any anticipated recovery in fair value.
As of December 31, 2017, 1182023, 415 debt securities and one equity security had gross unrealized losses, with an aggregate depreciation of 1.49%16.3% from the Company’s amortized cost basis. The largest unrealized dollar loss of any single security was $1.9 million, or 22.2% of its amortized cost. The largest unrealized loss percentage of any single security was 10.90% (or $73,000)36.6% of its amortized cost. The largest unrealized dollar loss of any single security was $185,000 (or 3.71%) of its amortized cost.cost, or $855,000.
As of December 31, 2016, 132 debt securities and one equity security had gross unrealized losses, with an aggregate depreciation of 1.69% from the Company’s amortized cost basis. The largest unrealized loss percentage of any single security was 10.16% (or $51,000) of its amortized cost. The largest unrealized dollar loss of any single security was $189,000 (or 3.79%) of its amortized cost.
The Company believes that the nature and duration of impairmentunrealized losses on its debt security positions are primarily a function of interest rate movements and changes in investment spreads and does not consider full repayment of principal on the reported debt obligations to be at risk. Since nearly all of these securities are rated “investment grade” and a)(a) the Company does not intend to sell these securities before recovery and b) that(b) it is more likely than not that the Company will not be required to sell these securities before recovery, the Company does not consider these securitiesexpect to be other-than-temporarily impairedsuffer a credit loss as of December 31, 2017 and 2016.2023.
There were no investment securities pledged as collateral for repurchase agreements at December 31, 2023.
The following table sets forth information regarding sales of investment securities and the resulting gains or losses from such sales:
|
| For the Year Ended December 31, |
|
| For the Year Ended December 31, |
| ||||||||||||||||||
|
| 2017 |
|
| 2016 |
|
| 2015 |
|
| 2023 |
|
| 2022 |
|
| 2021 |
| ||||||
|
| (dollars in thousands) |
|
| (dollars in thousands) |
| ||||||||||||||||||
Amortized cost of securities sold |
| $ | 77,372 |
|
| $ | 17,632 |
|
| $ | 46,935 |
|
| $ | — |
|
| $ | 19,018 |
|
| $ | — |
|
Gain/(loss) realized on securities sold |
|
| (3 | ) |
|
| 438 |
|
|
| 690 |
| ||||||||||||
Gross gains realized on securities sold |
|
| — |
|
|
| — |
|
|
| — |
| ||||||||||||
Gross losses realized on securities sold |
|
| — |
|
|
| — |
|
|
| — |
| ||||||||||||
Net proceeds from securities sold |
| $ | 77,369 |
|
| $ | 18,070 |
|
| $ | 47,625 |
|
| $ | — |
|
| $ | 19,018 |
|
| $ | — |
|
The Company’s lending activities are conducted principally in Eastern Massachusetts. The Company grants single-familymonitors the credit quality of certain debt securities through the use of credit rating among other factors on a quarterly basis. Credit ratings are opinions about the credit quality of a security and multi-family residential loans, commercial & industrial (“C&I), commercial real estate (“CRE”), construction loans, and a variety of consumer loans. Most of the loans grantedare utilized by the Company to make informed decisions. Investment grade securities are securedrated BBB-/Baa3 or higher and are generally considered to be of low risk. At December 31, 2023 and 2022 respectively, the Company’s debt securities portfolio did not contain any securities below investment grade, as reported by real estate collateral. Repaymentmajor credit rating agencies. At December 31, 2023 and 2022, respectively, none of the Company's investment securities were delinquent or in non-accrual status.
The following tables summarize the credit rating of the Company’s residential loansdebt securities portfolio at December 31, 2023 and December 31, 2022.
72
|
| December 31, 2023 |
| |||||||||||||||||||||
|
| Mortgage-backed Securities (1) |
|
| Corporate Debt Securities |
|
| Municipal Securities |
|
| U.S. GSE Obligations |
|
| U.S. Treasury Notes |
|
| Total |
| ||||||
|
| (dollars in thousands) |
| |||||||||||||||||||||
Available for sale securities, at fair value |
|
|
|
|
|
|
|
|
|
|
|
|
|
|
|
|
|
| ||||||
AAA/AA/A |
| $ | 117,376 |
|
| $ | — |
|
| $ | — |
|
| $ | 20,462 |
|
| $ | — |
|
| $ | 137,838 |
|
Total available for sale securities |
| $ | 117,376 |
|
| $ | — |
|
| $ | — |
|
| $ | 20,462 |
|
| $ | — |
|
| $ | 137,838 |
|
Held to maturity securities, at amortized cost |
|
|
|
|
|
|
|
|
|
|
|
|
|
|
|
|
|
| ||||||
AAA/AA/A |
| $ | 871,426 |
|
| $ | 250 |
|
| $ | 84,617 |
|
| $ | — |
|
| $ | 3,039 |
|
| $ | 959,332 |
|
Total held to maturity securities |
| $ | 871,426 |
|
| $ | 250 |
|
| $ | 84,617 |
|
| $ | — |
|
| $ | 3,039 |
|
| $ | 959,332 |
|
|
| December 31, 2022 |
| |||||||||||||||||||||
|
| Mortgage-backed Securities (1) |
|
| Corporate Debt Securities |
|
| Municipal Securities |
|
| U.S. GSE Obligations |
|
| U.S. Treasury Notes |
|
| Total |
| ||||||
|
| (dollars in thousands) |
| |||||||||||||||||||||
Available for sale securities, at fair value |
|
|
|
|
|
|
|
|
|
|
|
|
|
|
|
|
|
| ||||||
AAA/AA/A |
| $ | 132,683 |
|
| $ | — |
|
| $ | — |
|
| $ | 19,733 |
|
| $ | — |
|
| $ | 152,416 |
|
BBB/BB/B |
|
| — |
|
|
| 1,000 |
|
|
| — |
|
|
| — |
|
|
| — |
|
|
| 1,000 |
|
Total available for sale securities |
| $ | 132,683 |
|
| $ | 1,000 |
|
| $ | — |
|
| $ | 19,733 |
|
| $ | — |
|
| $ | 153,416 |
|
Held to maturity securities, at amortized cost |
|
|
|
|
|
|
|
|
|
|
|
|
|
|
|
|
|
| ||||||
AAA/AA/A |
| $ | 951,372 |
|
| $ | 250 |
|
| $ | 96,405 |
|
| $ | — |
|
| $ | 3,970 |
|
| $ | 1,051,997 |
|
Total held to maturity securities |
| $ | 951,372 |
|
| $ | 250 |
|
| $ | 96,405 |
|
| $ | — |
|
| $ | 3,970 |
|
| $ | 1,051,997 |
|
73
CRE loans are primarily made based on the cash flow from the collateral property and secondarily on the underlying collateral provided by the borrower, with liquidation of the underlying real estate collateral typically being viewed as the primary source of repayment in the event of borrower default. The Company’s construction loans are primarily made based on the borrower’s expected ability to execute and the future completed value of the collateral property, with sale of the underlying real estate collateral typically being viewed as the primary source of repayment.
Loans outstanding are detailed by category as follows:
|
| December 31, 2017 |
|
| December 31, 2016 |
|
| December 31, 2023 |
|
| December 31, 2022 |
| ||||
|
| (dollars in thousands) |
|
| (dollars in thousands) |
| ||||||||||
Residential mortgage |
|
|
|
|
|
|
|
|
|
|
|
|
| |||
Mortgages - fixed rate |
| $ | 298,851 |
|
| $ | 305,403 |
|
| $ | 813,374 |
|
| $ | 902,968 |
|
Mortgages - adjustable rate |
|
| 239,027 |
|
|
| 228,028 |
|
|
| 760,632 |
|
|
| 703,958 |
|
Deferred costs net of unearned fees |
|
| 1,042 |
|
|
| 973 |
| ||||||||
Construction |
|
| 45,863 |
|
|
| 35,299 |
| ||||||||
Deferred costs, net of unearned fees |
|
| 6,395 |
|
|
| 6,613 |
| ||||||||
Total residential mortgages |
|
| 538,920 |
|
|
| 534,404 |
|
|
| 1,626,264 |
|
|
| 1,648,838 |
|
|
|
|
|
|
|
|
|
|
|
|
|
|
| |||
Commercial mortgage |
|
|
|
|
|
|
|
|
|
|
|
|
| |||
Mortgages - nonowner occupied |
|
| 562,203 |
|
|
| 513,578 |
| ||||||||
Mortgages - non-owner occupied |
|
| 1,648,408 |
|
|
| 1,592,732 |
| ||||||||
Mortgages - owner occupied |
|
| 35,343 |
|
|
| 43,932 |
|
|
| 167,522 |
|
|
| 183,591 |
|
Construction |
|
| 35,904 |
|
|
| 58,406 |
|
|
| 113,133 |
|
|
| 135,782 |
|
Deferred costs net of unearned fees |
|
| 199 |
|
|
| 224 |
| ||||||||
Deferred costs, net of unearned fees |
|
| 2,410 |
|
|
| 2,318 |
| ||||||||
Total commercial mortgages |
|
| 633,649 |
|
|
| 616,140 |
|
|
| 1,931,473 |
|
|
| 1,914,423 |
|
|
|
|
|
|
|
|
|
|
|
|
|
|
| |||
Home equity |
|
|
|
|
|
|
|
|
|
|
|
|
| |||
Home equity - lines of credit |
|
| 70,326 |
|
|
| 70,883 |
|
|
| 92,730 |
|
|
| 108,961 |
|
Home equity - term loans |
|
| 3,863 |
|
|
| 3,925 |
|
|
| 2,679 |
|
|
| 2,098 |
|
Deferred costs net of unearned fees |
|
| 255 |
|
|
| 243 |
| ||||||||
Deferred costs, net of unearned fees |
|
| 240 |
|
|
| 292 |
| ||||||||
Total home equity |
|
| 74,444 |
|
|
| 75,051 |
|
|
| 95,649 |
|
|
| 111,351 |
|
|
|
|
|
|
|
|
|
|
|
|
|
|
| |||
Commercial & industrial |
|
|
|
|
|
|
|
| ||||||||
Commercial & industrial |
|
| 65,305 |
|
|
| 59,638 |
| ||||||||
Deferred costs net of unearned fees |
|
| (10 | ) |
|
| 68 |
| ||||||||
Total commercial & industrial |
|
| 65,295 |
|
|
| 59,706 |
| ||||||||
Commercial and industrial |
|
|
|
|
| |||||||||||
Commercial and industrial |
|
| 342,475 |
|
|
| 349,026 |
| ||||||||
Paycheck Protection Program loans |
|
| 653 |
|
|
| 1,384 |
| ||||||||
Unearned fees, net of deferred costs |
|
| 583 |
|
|
| 240 |
| ||||||||
Total commercial and industrial |
|
| 343,711 |
|
|
| 350,650 |
| ||||||||
|
|
|
|
|
|
|
|
|
|
|
|
|
| |||
Consumer |
|
|
|
|
|
|
|
|
|
|
|
|
| |||
Secured |
|
| 37,272 |
|
|
| 33,386 |
|
|
| 22,592 |
|
|
| 35,679 |
|
Unsecured |
|
| 1,303 |
|
|
| 1,451 |
|
|
| 1,822 |
|
|
| 1,897 |
|
Deferred costs net of unearned fees |
|
| 16 |
|
|
| 16 |
| ||||||||
Deferred costs, net of unearned fees |
|
| 33 |
|
|
| 18 |
| ||||||||
Total consumer |
|
| 38,591 |
|
|
| 34,853 |
|
|
| 24,447 |
|
|
| 37,594 |
|
Total loans |
| $ | 1,350,899 |
|
| $ | 1,320,154 |
|
| $ | 4,021,544 |
|
| $ | 4,062,856 |
|
Directors and officers of the Company and their associates are customersclients of, and have other transactions with, the Company in the normal course of business. All loans and commitments included in such transactions were made on substantially the same terms, including interest rates and collateral, as those prevailing at the time for comparable transactions with other persons and do not involve more than normal risk of collection or present other unfavorable features. At December 31, 2017
Asset Quality
The Company’s philosophy toward managing its loan portfolios is predicated upon careful monitoring, which stresses early detection and December 31, 2016, totalresponse to delinquent and default situations. The Company seeks to make arrangements to resolve any delinquent or default situation over the shortest possible time frame. As a general rule, loans outstandingmore than 90 days past due with respect to such directors and officers were $516,000 and $690,000, respectively. Duringprincipal or interest are classified as non-accrual loans. The Company may use discretion regarding other loans over 90 days past due if the year ended December 31, 2017, $124,000loan is well secured and/or in process of additions and $298,000 of repayments were made to these loans. There were $355,000 of additions and $406,000 of repayments during the year ended December 31, 2016. At December 31, 2017 and 2016, all of the loans to directors and officers were performing according to their original terms.collection.
74
The following tables set forth information regarding non-performing loans disaggregated by loan category:
|
| December 31, 2023 |
| |||||||||||||||||
|
| Residential |
|
| Commercial |
|
| Home |
|
| Commercial and |
|
| Total |
| |||||
|
| (dollars in thousands) |
| |||||||||||||||||
Non-performing loans: |
|
|
|
|
|
|
|
|
|
|
|
|
|
|
| |||||
Non-accrual loans |
| $ | 6,412 |
|
| $ | 9,758 |
|
| $ | 285 |
|
| $ | 61 |
|
| $ | 16,516 |
|
Loans past due >90 days, but still accruing |
|
| — |
|
|
| — |
|
|
| — |
|
|
| 51 |
|
|
| 51 |
|
Total |
| $ | 6,412 |
|
| $ | 9,758 |
|
| $ | 285 |
|
| $ | 112 |
|
| $ | 16,567 |
|
|
| December 31, 2022 |
| |||||||||||||||||
|
| Residential |
|
| Commercial |
|
| Home |
|
| Commercial and |
|
| Total |
| |||||
|
| (dollars in thousands) |
| |||||||||||||||||
Non-performing loans: |
|
|
|
|
|
|
|
|
|
|
|
|
|
|
| |||||
Non-accrual loans |
| $ | 4,733 |
|
| $ | 311 |
|
| $ | 722 |
|
| $ | 73 |
|
| $ | 5,839 |
|
Troubled debt restructurings |
|
| 622 |
|
|
| — |
|
|
| — |
|
|
| 81 |
|
| $ | 703 |
|
Total |
| $ | 5,355 |
|
| $ | 311 |
|
| $ | 722 |
|
| $ | 154 |
|
| $ | 6,542 |
|
It is the Company’s policy to reverse any accrued interest when a loan is put on non-accrual status and, generally, to record any payments received from a borrower related to a loan on non-accrual status as a reduction of the amortized cost basis of the loan. The Company did not record any interest income on non-accrual loans during the years ended December 31, 2023 and December 31, 2022. Accrued interest reversed against interest income for the year ended December 31, 2023 and December 31, 2022 was immaterial.
There were no significant commitments to lend additional funds to borrowers whose loans were on non-accrual status at December 31, 2023 and December 31, 2022.
A financial asset is considered collateral-dependent when the debtor is experiencing financial difficulty and repayment is expected to be provided substantially through the sale or operation of the collateral. Expected credit losses for collateral-dependent loans are based on the fair value of the collateral at the reporting date, adjusted for selling costs as appropriate.
|
| December 31, 2017 |
| |||||||||||||||||||||
|
| Residential Mortgages |
|
| Commercial Mortgages |
|
| Home Equity |
|
| Commercial & Industrial |
|
| Consumer |
|
| Total |
| ||||||
|
| (dollars in thousands) |
| |||||||||||||||||||||
Non-performing loans: |
|
|
|
|
|
|
|
|
|
|
|
|
|
|
|
|
|
|
|
|
|
|
|
|
Non-accrual loans |
| $ | 918 |
|
| $ | 213 |
|
| $ | 17 |
|
| $ | — |
|
| $ | — |
|
| $ | 1,148 |
|
Loans past due >90 days, but still accruing |
|
| — |
|
|
| — |
|
|
| — |
|
|
| — |
|
|
| — |
|
|
| — |
|
Troubled debt restructurings |
|
| 121 |
|
|
| — |
|
|
| — |
|
|
| 29 |
|
|
| — |
|
|
| 150 |
|
Total |
| $ | 1,039 |
|
| $ | 213 |
|
| $ | 17 |
|
| $ | 29 |
|
| $ | — |
|
| $ | 1,298 |
|
The following table presents the amortized costs basis and related reserve amount of individually analyzed collateral-dependent loans by portfolio segment.
|
| For the Year Ended December 31, |
| |||||||||||
|
| 2023 |
|
| 2022 |
| ||||||||
|
| Amortized Cost Basis |
| Reserve Amount |
|
| Amortized Cost Basis |
| Reserve Amount |
| ||||
|
| (dollars in thousands) |
|
|
|
|
|
| ||||||
Commercial mortgage |
| $ | 9,611 |
| $ | 2,345 |
|
| $ | - |
| $ | - |
|
Commercial & Industrial |
|
| 64 |
|
| 43 |
|
|
| 103 |
|
| 82 |
|
Total |
| $ | 9,675 |
| $ | 2,388 |
|
| $ | 103 |
| $ | 82 |
|
|
| December 31, 2016 |
| |||||||||||||||||||||
|
| Residential Mortgages |
|
| Commercial Mortgages |
|
| Home Equity |
|
| Commercial & Industrial |
|
| Consumer |
|
| Total |
| ||||||
|
| (dollars in thousands) |
| |||||||||||||||||||||
Non-performing loans: |
|
|
|
|
|
|
|
|
|
|
|
|
|
|
|
|
|
|
|
|
|
|
|
|
Non-accrual loans |
| $ | 998 |
|
| $ | — |
|
| $ | — |
|
| $ | 24 |
|
| $ | 1 |
|
| $ | 1,023 |
|
Loans past due >90 days, but still accruing |
|
| — |
|
|
| 232 |
|
|
| — |
|
|
| — |
|
|
| — |
|
|
| 232 |
|
Troubled debt restructurings |
|
| 132 |
|
|
| — |
|
|
| — |
|
|
| 289 |
|
|
| — |
|
|
| 421 |
|
Total |
| $ | 1,130 |
|
| $ | 232 |
|
| $ | — |
|
| $ | 313 |
|
| $ | 1 |
|
| $ | 1,676 |
|
Loan Modifications
Pursuant to ASU 2022-02, the Company evaluates all loan restructurings according to the accounting guidance for loan modifications to determine if the restructuring results in a new loan or a continuation of the existing loan. An assessment of whether a borrower is experiencing financial difficulty is made at the time of a modification. Loan modifications to borrowers experiencing financial difficulty that result in a change in the timing or amount of contractual cash flows include situations where there is principal forgiveness, interest rate reductions, other-than-insignificant payment delays, term extensions, and combinations of the listed modifications. Therefore, the disclosures related to loan restructurings are only for modifications that directly affect cash flows.
For the year ended December 31, 2023, the Company made no loan modifications to borrower’s experiencing financial difficulty.
Troubled Debt Restructurings (“TDRs”)
Loans arePrior to the adoption of ASU 2022-02, loans were considered restructured in a troubled debt restructuring when the Company has granted concessions to a borrower due to the borrower’s financial condition that it otherwise would not have considered. These concessions may
75
have include modifications of the terms of the debt such as deferral of payments, extension of maturity, reduction of principal balance, reduction of the stated interest rate other than normal market rate adjustments, or a combination of these concessions. Debt may be bifurcated with separate terms for each tranche of the restructured debt. Restructuring a loan in lieu of aggressively enforcing the collection of the loan may benefit the Company by increasing the ultimate probability of collection.
Restructured loans arewere classified as accruing or non-accruing based on management’s assessment of the collectability of the loan. Loans which arewere already on nonaccrualnon-accrual status at the time of the restructuring generally remainremained on nonaccrualnon-accrual status for approximately six months or longer before management considersconsidered such loans for return to accruing status. Accruing restructured loans arewere placed into nonaccrualnon-accrual status if and when the borrower failsfailed to comply with the restructured terms and management deemsdeemed it unlikely that the borrower will return to a status of compliance in the near term. TDRs were individually evaluated for credit losses.
Troubled debt restructurings are classified as impaired loans. The Company identifies loss allocations for impaired loans on an individual loan basis.
DuringThere were no new TDRs during the year ended December 31, 2017, the Company modified one loan with a pre-modification carrying value (which consists2022. As of the unpaid principal balance, net of charge-offs and unamortized deferred loan origination fees and costs, at the time of the restructuring) of $65,000 and a post-modification carrying value of $48,000. At December 31, 2017, this loan had a carrying value of $29,000. At December 31, 2017, three2022, four loans were determined to be TDRs with a total carrying value of $150,000. Two loans designated as TDRs were charged-off during the fourth quarter of 2017.$704,000. There were no TDR defaults during the year ended December 31, 2017.2022.
During the year ended December 31, 2016, the Company modified five loans with a pre-modification carrying value (which consists of the unpaid principal balance, net of charge-offs and unamortized deferred loan origination fees and costs, at the time of the restructuring) of $445,000 and a post-modification carrying value of $444,000. At December 31, 2016, these loans had a carrying value of $421,000. There were no TDR defaults during the year ended December 31, 2016.
The allowance for loan losses included specific reserves for these troubled debt restructurings of approximately $0 and $117,000, at December 31, 2017 and 2016, respectively.
As of December 31, 2017,2023 and 2016,December 31, 2022, there were no significant commitments to lend additional funds to borrowers whose loans were restructured.
Pursuant to Section 4013 of the CARES Act, financial institutions could suspend the requirements under U.S. GAAP related to TDRs for modifications made before December 31, 2020 to loans that were current as of December 31, 2019. As a result of the enactment of the Consolidated Appropriations Act, 2021, in January 2021, the suspension of TDR accounting was extended to, and expired on January 1, 2022. The requirement that a loan be not more than 30 days past due as of December 31, 2019 was still applicable. In response to the COVID-19 pandemic and its economic impact to clients, a short-term modification program that complied with the CARES Act was implemented to provide temporary payment relief to those borrowers directly impacted by COVID-19. The deferred payments along with interest accrued during the deferral period are due and payable on the maturity date. Under issued guidance, provided that these loans were current as of either year end or the date of the modification, these loans were not considered TDR loans at December 31, 2023 and will not be reported as past due during the deferral period. The Company had no loans in deferral as of December 31, 2023.
Foreclosure proceedings
As of December 31, 2023, there were two loans in process of foreclosure with a carrying value of approximately $1.5 million. Both of these loans are secured by one to four family residential property. As of December 31, 2022, there were no loans in process of foreclosure.
Loans by Credit Quality Indicator. The following tables contain period-end balances of loans receivable disaggregated by credit quality indicator:Indicator
|
| December 31, 2017 |
| |||||||||
|
| Residential Mortgages |
|
| Home Equity |
|
| Consumer |
| |||
|
| (dollars in thousands) |
| |||||||||
Credit risk profile based on payment activity: |
|
|
|
|
|
|
|
|
|
|
|
|
Performing |
| $ | 537,881 |
|
| $ | 74,427 |
|
| $ | 38,591 |
|
Non-performing |
|
| 1,039 |
|
|
| 17 |
|
|
| — |
|
Total |
| $ | 538,920 |
|
| $ | 74,444 |
|
| $ | 38,591 |
|
|
|
|
|
|
|
|
|
|
|
|
|
|
|
|
|
|
|
| Commercial Mortgages |
|
| Commercial & Industrial |
| ||
Credit risk profile by internally assigned grade: |
|
|
|
|
|
|
|
|
|
|
|
|
1-6 (Pass) |
|
|
|
|
| $ | 629,852 |
|
| $ | 56,755 |
|
7 (Special Mention) |
|
|
|
|
|
| 3,584 |
|
|
| 8,126 |
|
8 (Substandard) |
|
|
|
|
|
| 213 |
|
|
| 414 |
|
9 (Doubtful) |
|
|
|
|
|
| — |
|
|
| — |
|
10 (Loss) |
|
|
|
|
|
| — |
|
|
| — |
|
Total |
|
|
|
|
| $ | 633,649 |
|
| $ | 65,295 |
|
|
| December 31, 2016 |
| |||||||||
|
| Residential Mortgages |
|
| Home Equity |
|
| Consumer |
| |||
|
| (dollars in thousands) |
| |||||||||
Credit risk profile based on payment activity: |
|
|
|
|
|
|
|
|
|
|
|
|
Performing |
| $ | 533,273 |
|
| $ | 75,051 |
|
| $ | 34,852 |
|
Non-performing |
|
| 1,131 |
|
|
| — |
|
|
| 1 |
|
Total |
| $ | 534,404 |
|
| $ | 75,051 |
|
| $ | 34,853 |
|
|
|
|
|
|
|
|
|
|
|
|
|
|
|
|
|
|
|
| Commercial Mortgages |
|
| Commercial & Industrial |
| ||
Credit risk profile by internally assigned grade: |
|
|
|
|
|
|
|
|
|
|
|
|
1-6 (Pass) |
|
|
|
|
| $ | 612,636 |
|
| $ | 56,310 |
|
7 (Special Mention) |
|
|
|
|
|
| 2,861 |
|
|
| 1,431 |
|
8 (Substandard) |
|
|
|
|
|
| 643 |
|
|
| 1,965 |
|
9 (Doubtful) |
|
|
|
|
|
| — |
|
|
| — |
|
10 (Loss) |
|
|
|
|
|
| — |
|
|
| — |
|
Total |
|
|
|
|
| $ | 616,140 |
|
| $ | 59,706 |
|
With respect to residential real estate mortgages, home equity, and consumer loans, the BankCompany utilizes the following categories as indicators of credit quality:
Performing – These loans are accruing and are considered having low to moderate risk.
Non-performing – These loans either have been placedare on non-accrual or are past due more than 90 days but are still accruing andor are restructured. These loans may contain greater than average risk.
With respect to commercial real estate mortgages and commercial loans, the BankCompany utilizes a 10 grade10-grade internal loan rating system as an indicator of credit quality. The grades are as follows:
Loans rated 1-6 (Pass) – These loans are considered “pass” rated with low to moderate risk.
Loans rated 7 (Special Mention) – These loans have potential weaknesses warranting close attention, which, if left uncorrected, may result in deterioration of the credit at some future date.
Loans rated 8 (Substandard) – These loans have well-defined weaknesses that jeopardize the orderly liquidation of the debt under the original loan terms. Loss potential exists but is not identifiable in any one customer.
|
|
Loans rated 10 (Loss) – These loans are considered uncollectible and continuance as a bankable asset is not warranted.
76
The following tables contain period-end balances of loans receivable disaggregated by credit quality indicator:
|
| Credit Quality Indicator - by Origination Year as of December 31, 2023 |
| |||||||||||||||||||||||||||||
|
|
|
|
|
|
|
|
|
|
|
|
|
|
|
|
|
|
|
|
|
|
|
|
| ||||||||
|
| 2023 |
|
| 2022 |
|
| 2021 |
|
| 2020 |
|
| 2019 |
|
| Prior |
|
| Revolving loans amortized cost basis |
|
| Total |
| ||||||||
|
| (dollars in thousands) |
| |||||||||||||||||||||||||||||
Residential Mortgage: |
|
|
|
|
|
|
|
|
|
|
|
|
|
|
|
|
|
|
|
|
|
|
|
| ||||||||
Current |
| $ | 92,911 |
|
| $ | 331,817 |
|
| $ | 507,677 |
|
| $ | 274,988 |
|
| $ | 111,715 |
|
| $ | 300,744 |
|
| $ | — |
|
| $ | 1,619,852 |
|
Non-performing |
|
|
|
|
|
|
|
|
|
|
| 193 |
|
|
| 1,490 |
|
|
| 4,729 |
|
|
| — |
|
|
| 6,412 |
| |||
Total |
| $ | 92,911 |
|
| $ | 331,817 |
|
| $ | 507,677 |
|
| $ | 275,181 |
|
| $ | 113,205 |
|
| $ | 305,473 |
|
| $ | — |
|
| $ | 1,626,264 |
|
Current-period gross write-offs |
| $ | — |
|
| $ | — |
|
| $ | — |
|
| $ | — |
|
| $ | — |
|
| $ | — |
|
| $ | — |
|
| $ | — |
|
|
|
|
|
|
|
|
|
|
|
|
|
|
|
|
|
|
|
|
|
|
|
|
|
| ||||||||
Home equity: |
|
|
|
|
|
|
|
|
|
|
|
|
|
|
|
|
|
|
|
|
|
|
|
| ||||||||
Current |
| $ | 8,085 |
|
| $ | 2,411 |
|
| $ | 2,241 |
|
| $ | 1,399 |
|
| $ | 2,587 |
|
| $ | 14,674 |
|
| $ | 63,967 |
|
| $ | 95,364 |
|
Non-performing |
|
|
|
|
| 58 |
|
|
|
|
|
|
|
|
|
|
|
| 227 |
|
|
| — |
|
|
| 285 |
| ||||
Total |
| $ | 8,085 |
|
| $ | 2,469 |
|
| $ | 2,241 |
|
| $ | 1,399 |
|
| $ | 2,587 |
|
| $ | 14,901 |
|
| $ | 63,967 |
|
| $ | 95,649 |
|
Current-period gross write-offs |
| $ | — |
|
| $ | — |
|
| $ | — |
|
| $ | — |
|
| $ | — |
|
| $ | — |
|
| $ | — |
|
| $ | — |
|
|
|
|
|
|
|
|
|
|
|
|
|
|
|
|
|
|
|
|
|
|
|
|
|
| ||||||||
Consumer: |
|
|
|
|
|
|
|
|
|
|
|
|
|
|
|
|
|
|
|
|
|
|
|
| ||||||||
Current |
| $ | 7,281 |
|
| $ | 7,459 |
|
| $ | 1,706 |
|
| $ | 2,841 |
|
| $ | 694 |
|
| $ | 3,842 |
|
| $ | 624 |
|
| $ | 24,447 |
|
Non-performing |
|
| — |
|
|
| — |
|
|
| — |
|
|
| — |
|
|
| — |
|
|
| — |
|
|
| — |
|
|
| — |
|
Total |
| $ | 7,281 |
|
| $ | 7,459 |
|
| $ | 1,706 |
|
| $ | 2,841 |
|
| $ | 694 |
|
| $ | 3,842 |
|
| $ | 624 |
|
| $ | 24,447 |
|
Current-period gross write-offs |
| $ | — |
|
| $ | — |
|
| $ | — |
|
| $ | — |
|
| $ | — |
|
| $ | 67 |
|
| $ | — |
|
| $ | 67 |
|
|
| Credit Quality Indicator - by Origination Year as of December 31, 2023 |
| |||||||||||||||||||||||||||||
|
| 2023 |
|
| 2022 |
|
| 2021 |
|
| 2020 |
|
| 2019 |
|
| Prior |
|
| Revolving loans amortized cost basis |
|
| Total |
| ||||||||
|
| (dollars in thousands) |
| |||||||||||||||||||||||||||||
Commercial Mortgage: |
|
|
|
|
|
|
|
|
|
|
|
|
|
|
|
|
|
|
|
|
|
|
|
| ||||||||
Credit risk profile by internally assigned grade: |
|
|
|
|
|
|
|
|
|
|
|
|
|
|
|
|
|
|
|
|
|
|
|
| ||||||||
1-6 (Pass) |
| $ | 69,636 |
|
| $ | 466,760 |
|
| $ | 360,331 |
|
| $ | 226,994 |
|
| $ | 258,296 |
|
| $ | 459,472 |
|
| $ | — |
|
| $ | 1,841,489 |
|
7 (Special Mention) |
|
| 1,826 |
|
|
| 1,822 |
|
|
| — |
|
|
| 1,507 |
|
|
| 48,470 |
|
|
| 25,493 |
|
|
| — |
|
|
| 79,118 |
|
8 (Substandard) |
|
| — |
|
|
| 1,096 |
|
|
| — |
|
|
| — |
|
|
| — |
|
|
| 9,770 |
|
|
| — |
|
|
| 10,866 |
|
9 (Doubtful) |
|
| — |
|
|
| — |
|
|
| — |
|
|
| — |
|
|
| — |
|
|
| — |
|
|
| — |
|
|
| — |
|
10 (Loss) |
|
| — |
|
|
| — |
|
|
| — |
|
|
| — |
|
|
| — |
|
|
| — |
|
|
| — |
|
|
| — |
|
Total |
| $ | 71,462 |
|
| $ | 469,678 |
|
| $ | 360,331 |
|
| $ | 228,501 |
|
| $ | 306,766 |
|
| $ | 494,735 |
|
| $ | — |
|
| $ | 1,931,473 |
|
Current-period gross write-offs |
| $ | — |
|
| $ | — |
|
| $ | — |
|
| $ | — |
|
| $ | — |
|
| $ | — |
|
| $ | — |
|
| $ | — |
|
Commercial and Industrial: |
|
|
|
|
|
|
|
|
|
|
|
|
|
|
|
|
|
|
|
|
|
|
|
| ||||||||
Credit risk profile by internally assigned grade: |
|
|
|
|
|
|
|
|
|
|
|
|
|
|
|
|
|
|
|
|
|
|
|
| ||||||||
1-6 (Pass) |
| $ | 43,388 |
|
| $ | 107,494 |
|
| $ | 46,678 |
|
| $ | 50,660 |
|
| $ | 22,325 |
|
| $ | 40,647 |
|
| $ | 436 |
|
| $ | 311,628 |
|
7 (Special Mention) |
|
| 60 |
|
|
| 25,057 |
|
|
| 92 |
|
|
| 3,467 |
|
|
| 2 |
|
|
| 121 |
|
|
| 10 |
|
|
| 28,809 |
|
8 (Substandard) |
|
| — |
|
|
| 1,321 |
|
|
| — |
|
|
| 256 |
|
|
| 1,575 |
|
|
| 122 |
|
|
| — |
|
|
| 3,274 |
|
9 (Doubtful) |
|
| — |
|
|
| — |
|
|
| — |
|
|
| — |
|
|
| — |
|
|
| — |
|
|
| — |
|
|
| — |
|
10 (Loss) |
|
| — |
|
|
| — |
|
|
| — |
|
|
| — |
|
|
| — |
|
|
| — |
|
|
| — |
|
|
| — |
|
Total |
| $ | 43,448 |
|
| $ | 133,872 |
|
| $ | 46,770 |
|
| $ | 54,383 |
|
| $ | 23,902 |
|
| $ | 40,890 |
|
| $ | 446 |
|
| $ | 343,711 |
|
Current-period gross write-offs |
| $ | — |
|
| $ | — |
|
| $ | — |
|
| $ | — |
|
| $ | — |
|
| $ | 62 |
|
| $ | — |
|
| $ | 62 |
|
77
Delinquencies
|
| Credit Quality Indicator - by Origination Year as of December 31, 2022 |
| |||||||||||||||||||||||||||||
|
| 2022 |
|
| 2021 |
|
| 2020 |
|
| 2019 |
|
| 2018 |
|
| Prior |
|
| Revolving loans amortized cost basis |
|
| Total |
| ||||||||
|
| (dollars in thousands) |
| |||||||||||||||||||||||||||||
Residential Mortgage: |
|
|
|
|
|
|
|
|
|
|
|
|
|
|
|
|
|
|
|
|
|
|
|
| ||||||||
Current |
| $ | 339,634 |
|
| $ | 531,147 |
|
| $ | 294,370 |
|
| $ | 119,414 |
|
| $ | 84,215 |
|
| $ | 274,703 |
|
| $ | — |
|
| $ | 1,643,483 |
|
Non-performing |
|
| — |
|
|
| — |
|
|
| 206 |
|
|
| 315 |
|
|
| 684 |
|
|
| 4,150 |
|
|
| — |
|
|
| 5,355 |
|
Total |
| $ | 339,634 |
|
| $ | 531,147 |
|
| $ | 294,576 |
|
| $ | 119,729 |
|
| $ | 84,899 |
|
| $ | 278,853 |
|
| $ | — |
|
| $ | 1,648,838 |
|
|
|
|
|
|
|
|
|
|
|
|
|
|
|
|
|
|
|
|
|
|
|
|
|
| ||||||||
Home equity: |
|
|
|
|
|
|
|
|
|
|
|
|
|
|
|
|
|
|
|
|
|
|
|
| ||||||||
Current |
| $ | 5,291 |
|
| $ | 2,958 |
|
| $ | 1,349 |
|
| $ | 1,541 |
|
| $ | 867 |
|
| $ | 479 |
|
| $ | 98,144 |
|
| $ | 110,629 |
|
Non-performing |
|
| — |
|
|
| — |
|
|
| — |
|
|
| — |
|
|
| — |
|
|
| — |
|
|
| 722 |
|
|
| 722 |
|
Total |
| $ | 5,291 |
|
| $ | 2,958 |
|
| $ | 1,349 |
|
| $ | 1,541 |
|
| $ | 867 |
|
| $ | 479 |
|
| $ | 98,866 |
|
| $ | 111,351 |
|
|
|
|
|
|
|
|
|
|
|
|
|
|
|
|
|
|
|
|
|
|
|
|
|
| ||||||||
Consumer: |
|
|
|
|
|
|
|
|
|
|
|
|
|
|
|
|
|
|
|
|
|
|
|
| ||||||||
Current |
| $ | 13,263 |
|
| $ | 8,573 |
|
| $ | 5,602 |
|
| $ | 836 |
|
| $ | 2,092 |
|
| $ | 6,631 |
|
| $ | 597 |
|
| $ | 37,594 |
|
Non-performing |
|
| — |
|
|
| — |
|
|
| — |
|
|
| — |
|
|
| — |
|
|
| — |
|
|
| — |
|
|
| — |
|
Total |
| $ | 13,263 |
|
| $ | 8,573 |
|
| $ | 5,602 |
|
| $ | 836 |
|
| $ | 2,092 |
|
| $ | 6,631 |
|
| $ | 597 |
|
| $ | 37,594 |
|
|
| Credit Quality Indicator - by Origination Year as of December 31, 2022 |
| |||||||||||||||||||||||||||||
|
| 2022 |
|
| 2021 |
|
| 2020 |
|
| 2019 |
|
| 2018 |
|
| Prior |
|
| Revolving loans amortized cost basis |
|
| Total |
| ||||||||
|
| (dollars in thousands) |
| |||||||||||||||||||||||||||||
Commercial Mortgage: |
|
|
|
|
|
|
|
|
|
|
|
|
|
|
|
|
|
|
|
|
|
|
|
| ||||||||
Credit risk profile by internally |
|
|
|
|
|
|
|
|
|
|
|
|
|
|
|
|
|
|
|
|
|
|
|
| ||||||||
1-6 (Pass) |
| $ | 448,919 |
|
| $ | 366,414 |
|
| $ | 240,023 |
|
| $ | 269,899 |
|
| $ | 131,415 |
|
| $ | 383,473 |
|
| $ | — |
|
| $ | 1,840,143 |
|
7 (Special Mention) |
|
| — |
|
|
| — |
|
|
| 4,562 |
|
|
| 41,578 |
|
|
| 21,697 |
|
|
| 6,132 |
|
|
| — |
|
|
| 73,969 |
|
8 (Substandard) |
|
| — |
|
|
| — |
|
|
| — |
|
|
| — |
|
|
| — |
|
|
| 311 |
|
|
| — |
|
|
| 311 |
|
9 (Doubtful) |
|
| — |
|
|
| — |
|
|
| — |
|
|
| — |
|
|
| — |
|
|
| — |
|
|
| — |
|
|
| — |
|
10 (Loss) |
|
| — |
|
|
| — |
|
|
| — |
|
|
| — |
|
|
| — |
|
|
| — |
|
|
| — |
|
|
| — |
|
Total |
| $ | 448,919 |
|
| $ | 366,414 |
|
| $ | 244,585 |
|
| $ | 311,477 |
|
| $ | 153,112 |
|
| $ | 389,916 |
|
| $ | — |
|
| $ | 1,914,423 |
|
Commercial and Industrial: |
|
|
|
|
|
|
|
|
|
|
|
|
|
|
|
|
|
|
|
|
|
|
|
| ||||||||
Credit risk profile by internally |
|
|
|
|
|
|
|
|
|
|
|
|
|
|
|
|
|
|
|
|
|
|
|
| ||||||||
1-6 (Pass) |
| $ | 130,418 |
|
| $ | 69,030 |
|
| $ | 65,390 |
|
| $ | 29,543 |
|
| $ | 20,549 |
|
| $ | 27,310 |
|
| $ | 475 |
|
| $ | 342,715 |
|
7 (Special Mention) |
|
| — |
|
|
| 4,211 |
|
|
| 130 |
|
|
| 161 |
|
|
| 407 |
|
|
| 121 |
|
|
| 10 |
|
|
| 5,040 |
|
8 (Substandard) |
|
| — |
|
|
| — |
|
|
| 628 |
|
|
| 2,102 |
|
|
| 81 |
|
|
| 84 |
|
|
| — |
|
|
| 2,895 |
|
9 (Doubtful) |
|
| — |
|
|
| — |
|
|
| — |
|
|
| — |
|
|
| — |
|
|
| — |
|
|
| — |
|
|
| — |
|
10 (Loss) |
|
| — |
|
|
| — |
|
|
| — |
|
|
| — |
|
|
| — |
|
|
| — |
|
|
| — |
|
|
| — |
|
Total |
| $ | 130,418 |
|
| $ | 73,241 |
|
| $ | 66,148 |
|
| $ | 31,806 |
|
| $ | 21,037 |
|
| $ | 27,515 |
|
| $ | 485 |
|
| $ | 350,650 |
|
Loans origination dates in the tables above reflect the original date, or the date of a material modification of a previously originated loan, for both organic originations and acquired loans.
Delinquencies
The past due status of a loan is determined in accordance with its contractual repayment terms. All loan types are reported past due when one scheduled payment is due and unpaid for 30 days or more. Loan delinquencies can be attributed to many factors, such as but not limited to, a continuing weakness in, or deteriorating, economic conditions in the region in which the collateral is located, the loss of a tenant or lower lease rates for commercial borrowers, or the loss of income for consumers and the resulting liquidity impacts on the borrowers.
78
The following tables contain period-end balances of loans receivable disaggregated by past due status:
|
| December 31, 2017 |
| |||||||||||||||||||||
|
| 30-59 Days Past Due |
|
| 60-89 Days Past Due |
|
| 90 Days or Greater |
|
| Total Past Due |
|
| Current Loans |
|
| Total |
| ||||||
|
| (dollars in thousands) |
| |||||||||||||||||||||
Residential Mortgages |
| $ | 1,353 |
|
| $ | 706 |
|
| $ | 64 |
|
| $ | 2,123 |
|
| $ | 536,797 |
|
| $ | 538,920 |
|
Commercial Mortgages |
|
| — |
|
|
| 32 |
|
|
| — |
|
|
| 32 |
|
|
| 633,617 |
|
|
| 633,649 |
|
Home Equity |
|
| 1 |
|
|
| — |
|
|
| 17 |
|
|
| 18 |
|
|
| 74,426 |
|
|
| 74,444 |
|
Commercial & Industrial |
|
| — |
|
|
| — |
|
|
| — |
|
|
| — |
|
|
| 65,295 |
|
|
| 65,295 |
|
Consumer loans |
|
| 176 |
|
|
| — |
|
|
| — |
|
|
| 176 |
|
|
| 38,415 |
|
|
| 38,591 |
|
Total |
| $ | 1,530 |
|
| $ | 738 |
|
| $ | 81 |
|
| $ | 2,349 |
|
| $ | 1,348,550 |
|
| $ | 1,350,899 |
|
|
| December 31, 2023 |
| |||||||||||||||||||||
|
| 30-59 Days |
|
| 60-89 Days |
|
| 90 Days or Greater |
|
| Total |
|
| Current |
|
| Total |
| ||||||
|
| (dollars in thousands) |
| |||||||||||||||||||||
Residential mortgage |
| $ | 16,768 |
|
| $ | 1,234 |
|
| $ | 2,548 |
|
| $ | 20,550 |
|
| $ | 1,605,714 |
|
| $ | 1,626,264 |
|
Commercial mortgage |
|
| 1,885 |
|
|
| — |
|
|
| — |
|
|
| 1,885 |
|
|
| 1,929,588 |
|
|
| 1,931,473 |
|
Home equity |
|
| 1,855 |
|
|
| 171 |
|
|
| — |
|
|
| 2,026 |
|
|
| 93,623 |
|
|
| 95,649 |
|
Commercial and industrial |
|
| 1,477 |
|
|
| 301 |
|
|
| 58 |
|
|
| 1,836 |
|
|
| 341,875 |
|
|
| 343,711 |
|
Consumer |
|
| 251 |
|
|
| 14 |
|
|
| — |
|
|
| 265 |
|
|
| 24,182 |
|
|
| 24,447 |
|
Total |
| $ | 22,236 |
|
| $ | 1,720 |
|
| $ | 2,606 |
|
| $ | 26,562 |
|
| $ | 3,994,982 |
|
| $ | 4,021,544 |
|
|
| December 31, 2022 |
| |||||||||||||||||||||
|
| 30-59 Days |
|
| 60-89 Days |
|
| 90 Days |
|
| Total |
|
| Current |
|
| Total |
| ||||||
|
| (dollars in thousands) |
| |||||||||||||||||||||
Residential mortgage |
| $ | 11,359 |
|
| $ | 1,454 |
|
| $ | 1,809 |
|
| $ | 14,622 |
|
| $ | 1,634,216 |
|
| $ | 1,648,838 |
|
Commercial mortgage |
|
| — |
|
|
| — |
|
|
| — |
|
|
| — |
|
|
| 1,914,423 |
|
|
| 1,914,423 |
|
Home equity |
|
| 962 |
|
|
| 393 |
|
|
| 214 |
|
|
| 1,569 |
|
|
| 109,782 |
|
|
| 111,351 |
|
Commercial and industrial |
|
| 65 |
|
|
| 269 |
|
|
| — |
|
|
| 334 |
|
|
| 350,316 |
|
|
| 350,650 |
|
Consumer |
|
| 81 |
|
|
| — |
|
|
| — |
|
|
| 81 |
|
|
| 37,513 |
|
|
| 37,594 |
|
Total |
| $ | 12,467 |
|
| $ | 2,116 |
|
| $ | 2,023 |
|
| $ | 16,606 |
|
| $ | 4,046,250 |
|
| $ | 4,062,856 |
|
|
| December 31, 2016 |
| |||||||||||||||||||||
|
| 30-59 Days Past Due |
|
| 60-89 Days Past Due |
|
| 90 Days or Greater |
|
| Total Past Due |
|
| Current Loans |
|
| Total |
| ||||||
|
| (dollars in thousands) |
| |||||||||||||||||||||
Residential Mortgages |
| $ | 698 |
|
| $ | 179 |
|
| $ | 602 |
|
| $ | 1,479 |
|
| $ | 532,925 |
|
| $ | 534,404 |
|
Commercial Mortgages |
|
| — |
|
|
| 250 |
|
|
| 232 |
|
|
| 482 |
|
|
| 615,658 |
|
|
| 616,140 |
|
Home Equity |
|
| 4 |
|
|
| — |
|
|
| — |
|
|
| 4 |
|
|
| 75,047 |
|
|
| 75,051 |
|
Commercial & Industrial |
|
| 173 |
|
|
| — |
|
|
| 1 |
|
|
| 174 |
|
|
| 59,532 |
|
|
| 59,706 |
|
Consumer loans |
|
| 6 |
|
|
| 5 |
|
|
| — |
|
|
| 11 |
|
|
| 34,842 |
|
|
| 34,853 |
|
Total |
| $ | 881 |
|
| $ | 434 |
|
| $ | 835 |
|
| $ | 2,150 |
|
| $ | 1,318,004 |
|
| $ | 1,320,154 |
|
As ofThere were two loans 90 days or more past due and still accruing at December 31, 2017 and 2016, loans secured by one- to four-family residential property amounting to $64,000 and $0, respectively, were in process of foreclosure.2023 totaling $51,000.
There were no significant commitments to lend additional funds to borrowers whose loans were on nonaccrualnon-accrual status at December 31, 2017.2023 and December 31, 2022.
Impaired Loans
Impaired loans are loans for which it is probable that the Company will not be able to collect all amounts due according to the contractual terms of the loan agreements and loans restructured in a troubled debt restructuring. The recorded investment in impaired loans consists of unpaid principal balance, net of charge-offs, interest payments received applied to principal and unamortized deferred loan origination fees and costs.
The following is information pertaining to impaired loans:
|
| For the Year Ended December 31, 2017 |
| |||||||||||||||||
|
| Carrying Value |
|
| Average Carrying Value |
|
| Unpaid Principal Balance |
|
| Related Allowance |
|
| Interest Income Recognized |
| |||||
|
| (dollars in thousands) |
| |||||||||||||||||
With no required reserve recorded: |
|
|
|
|
|
|
|
|
|
|
|
|
|
|
|
|
|
|
|
|
Commercial and industrial |
| $ | 29 |
|
| $ | 36 |
|
| $ | 29 |
|
| $ | — |
|
| $ | 2 |
|
Commercial real estate |
|
| 213 |
|
|
| 224 |
|
|
| 227 |
|
|
| — |
|
|
| 3 |
|
Residential real estate |
|
| 904 |
|
|
| 931 |
|
|
| 1,103 |
|
|
| — |
|
|
| — |
|
Home equity |
|
| 86 |
|
|
| 91 |
|
|
| 116 |
|
|
| — |
|
|
| — |
|
Total |
|
| 1,232 |
|
|
| 1,282 |
|
|
| 1,475 |
|
|
| — |
|
|
| 5 |
|
With required reserve recorded: |
|
|
|
|
|
|
|
|
|
|
|
|
|
|
|
|
|
|
|
|
Commercial and industrial |
|
| — |
|
|
| — |
|
|
| — |
|
|
| — |
|
|
| — |
|
Commercial real estate |
|
| — |
|
|
| — |
|
|
| — |
|
|
| — |
|
|
| — |
|
Residential real estate |
|
| 64 |
|
|
| 66 |
|
|
| 64 |
|
|
| 93 |
|
|
| 1 |
|
Home equity |
|
| — |
|
|
| — |
|
|
| — |
|
|
| — |
|
|
| — |
|
Total |
|
| 64 |
|
|
| 66 |
|
|
| 64 |
|
|
| 93 |
|
|
| 1 |
|
Total: |
|
|
|
|
|
|
|
|
|
|
|
|
|
|
|
|
|
|
|
|
Commercial and industrial |
|
| 29 |
|
|
| 36 |
|
|
| 29 |
|
|
| — |
|
|
| 2 |
|
Commercial real estate |
|
| 213 |
|
|
| 224 |
|
|
| 227 |
|
|
| — |
|
|
| 3 |
|
Residential real estate |
|
| 968 |
|
|
| 997 |
|
|
| 1,167 |
|
|
| 93 |
|
|
| 1 |
|
Home equity |
|
| 86 |
|
|
| 91 |
|
|
| 116 |
|
|
| — |
|
|
| — |
|
Total |
| $ | 1,296 |
|
| $ | 1,348 |
|
| $ | 1,539 |
|
| $ | 93 |
|
| $ | 6 |
|
|
| For the Year Ended December 31, 2016 |
| |||||||||||||||||
|
| Carrying Value |
|
| Average Carrying Value |
|
| Unpaid Principal Balance |
|
| Related Allowance |
|
| Interest Income Recognized |
| |||||
|
| (dollars in thousands) |
| |||||||||||||||||
With no required reserve recorded: |
|
|
|
|
|
|
|
|
|
|
|
|
|
|
|
|
|
|
|
|
Commercial and industrial |
| $ | — |
|
| $ | — |
|
| $ | — |
|
| $ | — |
|
| $ | — |
|
Commercial real estate |
|
| — |
|
|
| — |
|
|
| — |
|
|
| — |
|
|
| — |
|
Residential real estate |
|
| 528 |
|
|
| 542 |
|
|
| 687 |
|
|
| — |
|
|
| — |
|
Home equity |
|
| 102 |
|
|
| 105 |
|
|
| 126 |
|
|
| — |
|
|
| 1 |
|
Total |
|
| 630 |
|
|
| 647 |
|
|
| 813 |
|
|
| — |
|
|
| 1 |
|
With required reserve recorded: |
|
|
|
|
|
|
|
|
|
|
|
|
|
|
|
|
|
|
|
|
Commercial and industrial |
|
| 289 |
|
|
| 297 |
|
|
| 295 |
|
|
| 114 |
|
|
| 2 |
|
Commercial real estate |
|
| — |
|
|
| — |
|
|
| — |
|
|
| — |
|
|
| — |
|
Residential real estate |
|
| 499 |
|
|
| 505 |
|
|
| 509 |
|
|
| 76 |
|
|
| 21 |
|
Home equity |
|
| — |
|
|
| — |
|
|
| — |
|
|
| — |
|
|
| — |
|
Total |
|
| 788 |
|
|
| 802 |
|
|
| 804 |
|
|
| 190 |
|
|
| 23 |
|
Total: |
|
|
|
|
|
|
|
|
|
|
|
|
|
|
|
|
|
|
|
|
Commercial and industrial |
|
| 289 |
|
|
| 297 |
|
|
| 295 |
|
|
| 114 |
|
|
| 2 |
|
Commercial real estate |
|
| — |
|
|
| — |
|
|
| — |
|
|
| — |
|
|
| — |
|
Residential real estate |
|
| 1,027 |
|
|
| 1,047 |
|
|
| 1,196 |
|
|
| 76 |
|
|
| 21 |
|
Home equity |
|
| 102 |
|
|
| 105 |
|
|
| 126 |
|
|
| — |
|
|
| 1 |
|
Total |
| $ | 1,418 |
|
| $ | 1,449 |
|
| $ | 1,617 |
|
| $ | 190 |
|
| $ | 24 |
|
| For the Year Ended December 31, 2015 |
| ||||||||||||||||||
|
| Carrying Value |
|
| Average Carrying Value |
|
| Unpaid Principal Balance |
|
| Related Allowance |
|
| Interest Income Recognized |
| |||||
|
| (dollars in thousands) |
| |||||||||||||||||
With no required reserve recorded: |
|
|
|
|
|
|
|
|
|
|
|
|
|
|
|
|
|
|
|
|
Commercial and industrial |
| $ | — |
|
| $ | — |
|
| $ | — |
|
| $ | — |
|
| $ | — |
|
Commercial real estate |
|
| 543 |
|
|
| 558 |
|
|
| 628 |
|
|
| — |
|
|
| 16 |
|
Residential real estate |
|
| — |
|
|
| — |
|
|
| — |
|
|
| — |
|
|
| — |
|
Home equity |
|
| — |
|
|
| — |
|
|
| — |
|
|
| — |
|
|
| — |
|
Total |
|
| 543 |
|
|
| 558 |
|
|
| 628 |
|
|
| — |
|
|
| 16 |
|
With required reserve recorded: |
|
|
|
|
|
|
|
|
|
|
|
|
|
|
|
|
|
|
|
|
Commercial and industrial |
|
| 513 |
|
|
| 518 |
|
|
| 514 |
|
|
| 174 |
|
|
| 20 |
|
Commercial real estate |
|
| — |
|
|
| — |
|
|
| — |
|
|
| — |
|
|
| — |
|
Residential real estate |
|
| — |
|
|
| — |
|
|
| — |
|
|
| — |
|
|
| — |
|
Home equity |
|
| — |
|
|
| — |
|
|
| — |
|
|
| — |
|
|
| — |
|
Total |
|
| 513 |
|
|
| 518 |
|
|
| 514 |
|
|
| 174 |
|
|
| 20 |
|
Total: |
|
|
|
|
|
|
|
|
|
|
|
|
|
|
|
|
|
|
|
|
Commercial and industrial |
|
| 513 |
|
|
| 518 |
|
|
| 514 |
|
|
| 174 |
|
|
| 20 |
|
Commercial real estate |
|
| 543 |
|
|
| 558 |
|
|
| 628 |
|
|
| — |
|
|
| 16 |
|
Residential real estate |
|
| — |
|
|
| — |
|
|
| — |
|
|
| — |
|
|
| — |
|
Home equity |
|
| — |
|
|
| — |
|
|
| — |
|
|
| — |
|
|
| — |
|
Total |
| $ | 1,056 |
|
| $ | 1,076 |
|
| $ | 1,142 |
|
| $ | 174 |
|
| $ | 36 |
|
Allowance for LoanCredit Losses
The Company maintains an allowance for loan losses in an amount determined by management on the basis of the character of the loans, loan performance, financial condition of borrowers, the value of collateral securing loans, and other relevant factors. We provide for loan losses based upon the consistent application of our documented allowance for loan loss methodology. All loan losses are charged to the allowance for loan losses and all recoveries are credited to it. Additions to the allowance for loan losses are provided by charges to income based on various factors which, in our judgment, deserve current recognition in estimating probable losses. We regularly review the loan portfolio, including a review of our classified assets, and make provisions for loan losses in order to maintain the allowance for loan losses in accordance with GAAP. The allowance for loan losses consists primarily of two components:
|
|
|
|
Actual loan losses may be significantly more than the allowance for loan losses we have established, which could have a material negative effect on our financial results.
The adjustments to historical loss experience are based on our evaluation of several quantitative, qualitative, and environmental factors, including:
the loss emergence period, which represents the average amount of time between when loss events occur for specific loan types and when such problem loans are identified and the related loss amounts are confirmed through charge-offs;
changes in any concentration of credit (including, but not limited to, concentrations by geography, industry, or collateral type);
changes in national, state, and local economic trends;
changes in the types of loans in the loan portfolio;
changes in the experience and ability of personnel;
changes in lending strategies; and
changes in lending policies and procedures.
In addition, we may establish an unallocated allowance to provide for probable losses that have been incurred as of the reporting date but are not reflected in the allocated allowance.
We evaluate the allowance for loan losses based upon the combined total of the specific and general components. Generally, when the loan portfolio increases, absent other factors, the allowance for loan loss methodology results in a higher dollar amount of estimated probable losses than would be the case without the increase. Generally, when the loan portfolio decreases, absent other factors, the allowance for loan losses methodology results in a lower dollar amount of estimated probable losses than would be the case without the decrease. Periodically, management conducts an analysis to estimate the loss emergence period for various loan categories based on samples of historical charge-offs. Model output by loan category is reviewed to evaluate the reasonableness of the reserve levels in comparison to the estimated loss emergence period applied to historical loss experience.
We evaluate the loan portfolio on a quarterly basis and the allowance is adjusted accordingly. While we use the best information available to make evaluations, future adjustments to the allowance may be necessary if conditions differ substantially from the information used in making the evaluations. In addition, various regulatory agencies, as an integral part of their examination process, will periodically review the allowance for loan losses. Such agencies may require us to recognize additions to the allowance based on their analysis of information available to them at the time of their examination.
The following tables contain changes in the allowance for loancredit losses disaggregated by loan type:category:
|
| For The Year Ended December 31, 2023 |
| |||||||||||||||||||||||||
|
| Residential |
|
| Commercial |
|
| Home |
|
| Commercial & |
|
| Consumer |
|
| Unfunded Commitments |
|
| Total |
| |||||||
|
| (dollars in thousands) |
| |||||||||||||||||||||||||
Allowance for credit loss: |
|
|
|
|
|
|
|
|
|
|
|
|
|
|
|
|
|
|
|
|
| |||||||
Allowance for credit losses - loan |
|
|
|
|
|
|
|
|
|
|
|
|
|
|
|
|
|
|
|
|
| |||||||
Balance at December 31, 2022 |
| $ | 13,321 |
|
| $ | 19,086 |
|
| $ | 573 |
|
| $ | 4,153 |
|
| $ | 641 |
|
| $ | — |
|
| $ | 37,774 |
|
Charge-offs |
|
| — |
|
|
| — |
|
|
| — |
|
|
| (62 | ) |
|
| (67 | ) |
|
| — |
|
|
| (129 | ) |
Recoveries |
|
| — |
|
|
| — |
|
|
| — |
|
|
| 37 |
|
|
| 22 |
|
|
| — |
|
|
| 59 |
|
Provision for (release of) credit |
|
| (4,922 | ) |
|
| 5,366 |
|
|
| 7 |
|
|
| 812 |
|
|
| (23 | ) |
|
| — |
|
|
| 1,240 |
|
Allowance for credit losses - loan portfolio |
| $ | 8,399 |
|
| $ | 24,452 |
|
| $ | 580 |
|
| $ | 4,940 |
|
| $ | 573 |
|
| $ | — |
|
| $ | 38,944 |
|
Allowance for credit losses - |
|
|
|
|
|
|
|
|
|
|
|
|
|
|
|
|
|
|
|
|
| |||||||
Balance at December 31, 2022 |
| $ | — |
|
| $ | — |
|
| $ | — |
|
| $ | — |
|
| $ | — |
|
| $ | 2,096 |
|
| $ | 2,096 |
|
Provision for (release of) credit |
|
| — |
|
|
| — |
|
|
| — |
|
|
| — |
|
|
| — |
|
|
| (336 | ) |
|
| (336 | ) |
Allowance for credit losses- |
| $ | — |
|
| $ | — |
|
| $ | — |
|
| $ | — |
|
| $ | — |
|
| $ | 1,760 |
|
| $ | 1,760 |
|
Total allowance for credit loss |
| $ | 8,399 |
|
| $ | 24,452 |
|
| $ | 580 |
|
| $ | 4,940 |
|
| $ | 573 |
|
| $ | 1,760 |
|
| $ | 40,704 |
|
|
| For the Year Ended December 31, 2017 |
| |||||||||||||||||||||||||
|
| Residential Mortgages |
|
| Commercial Mortgages |
|
| Home Equity |
|
| Commercial & Industrial |
|
| Consumer |
|
| Impaired |
|
| Total |
| |||||||
|
| (dollars in thousands) |
| |||||||||||||||||||||||||
Allowance for loan losses: |
|
|
|
|
|
|
|
|
|
|
|
|
|
|
|
|
|
|
|
|
|
|
|
|
|
|
|
|
Balance at December 31, 2016 |
| $ | 4,898 |
|
| $ | 8,451 |
|
| $ | 651 |
|
| $ | 807 |
|
| $ | 264 |
|
| $ | 190 |
|
| $ | 15,261 |
|
Charge-offs |
|
| — |
|
|
| — |
|
|
| — |
|
|
| (284 | ) |
|
| (39 | ) |
|
| — |
|
|
| (323 | ) |
Recoveries |
|
| — |
|
|
| — |
|
|
| — |
|
|
| 13 |
|
|
| 7 |
|
|
| — |
|
|
| 20 |
|
Provision |
|
| 149 |
|
|
| (162 | ) |
|
| (21 | ) |
|
| 410 |
|
|
| 83 |
|
|
| (97 | ) |
|
| 362 |
|
Balance at December 31, 2017 |
| $ | 5,047 |
|
| $ | 8,289 |
|
| $ | 630 |
|
| $ | 946 |
|
| $ | 315 |
|
| $ | 93 |
|
| $ | 15,320 |
|
79
|
| For the Year Ended December 31, 2016 |
| |||||||||||||||||||||||||||||
|
| Residential Mortgages |
|
| Commercial Mortgages |
|
| Home Equity |
|
| Commercial & Industrial |
|
| Consumer |
|
| Unallocated |
|
| Impaired |
|
| Total |
| ||||||||
|
| (dollars in thousands) |
| |||||||||||||||||||||||||||||
Allowance for loan losses: |
|
|
|
|
|
|
|
|
|
|
|
|
|
|
|
|
|
|
|
|
|
|
|
|
|
|
|
|
|
|
|
|
Balance at December 31, 2015 |
| $ | 5,244 |
|
| $ | 8,094 |
|
| $ | 699 |
|
| $ | 615 |
|
| $ | 354 |
|
| $ | 11 |
|
| $ | 174 |
|
| $ | 15,191 |
|
Change in methodology |
|
| 336 |
|
|
| (377 | ) |
|
| (3 | ) |
|
| 136 |
|
|
| (92 | ) |
|
| — |
|
|
| — |
|
|
| — |
|
Charge-offs |
|
| — |
|
|
| — |
|
|
| — |
|
|
| (71 | ) |
|
| (33 | ) |
|
| — |
|
|
| — |
|
|
| (104 | ) |
Recoveries |
|
| 13 |
|
|
| 7 |
|
|
| 1 |
|
|
| 14 |
|
|
| 7 |
|
|
| — |
|
|
| — |
|
|
| 42 |
|
Provision |
|
| (695 | ) |
|
| 727 |
|
|
| (46 | ) |
|
| 113 |
|
|
| 28 |
|
|
| (11 | ) |
|
| 16 |
|
|
| 132 |
|
Balance at December 31, 2016 |
| $ | 4,898 |
|
| $ | 8,451 |
|
| $ | 651 |
|
| $ | 807 |
|
| $ | 264 |
|
| $ | — |
|
| $ | 190 |
|
| $ | 15,261 |
|
|
| For The Year Ended December 30, 2022 |
| |||||||||||||||||||||||||
|
| Residential |
|
| Commercial |
|
| Home |
|
| Commercial & |
|
| Consumer |
|
| Unfunded Commitments |
|
| Total |
| |||||||
|
| (dollars in thousands) |
| |||||||||||||||||||||||||
Allowance for credit loss: |
|
|
|
|
|
|
|
|
|
|
|
|
|
|
|
|
|
|
|
|
| |||||||
Allowance for credit losses - loan |
|
|
|
|
|
|
|
|
|
|
|
|
|
|
|
|
|
|
|
|
| |||||||
Balance at December 31, 2021 |
| $ | 13,383 |
|
| $ | 17,133 |
|
| $ | 406 |
|
| $ | 2,989 |
|
| $ | 585 |
|
| $ | — |
|
| $ | 34,496 |
|
Provision for acquired loans |
|
| 527 |
|
|
| 1,337 |
|
|
| 117 |
|
|
| 113 |
|
|
| 8 |
|
|
| — |
|
|
| 2,102 |
|
Initial allowance for PCD |
|
| 19 |
|
|
| 37 |
|
|
| — |
|
|
| — |
|
|
| — |
|
|
| — |
|
|
| 56 |
|
Charge-offs |
|
| — |
|
|
| — |
|
|
| — |
|
|
| (23 | ) |
|
| (29 | ) |
|
| — |
|
|
| (52 | ) |
Recoveries |
|
| 4 |
|
|
| — |
|
|
| — |
|
|
| 89 |
|
|
| 12 |
|
|
| — |
|
|
| 105 |
|
Provision for (release of) credit |
|
| (612 | ) |
|
| 579 |
|
|
| 50 |
|
|
| 985 |
|
|
| 65 |
|
|
| — |
|
|
| 1,067 |
|
Allowance for credit losses - loan portfolio |
| $ | 13,321 |
|
| $ | 19,086 |
|
| $ | 573 |
|
| $ | 4,153 |
|
| $ | 641 |
|
| $ | — |
|
| $ | 37,774 |
|
Allowance for credit losses - |
|
|
|
|
|
|
|
|
|
|
|
|
|
|
|
|
|
|
|
|
| |||||||
Balance at December 31, 2021 |
| $ | — |
|
| $ | — |
|
| $ | — |
|
| $ | — |
|
| $ | — |
|
| $ | 1,384 |
|
| $ | 1,384 |
|
Acquired loan commitments |
|
| — |
|
|
| — |
|
|
| — |
|
|
| — |
|
|
| — |
|
|
| 137 |
|
|
| 137 |
|
Provision for credit |
|
| — |
|
|
| — |
|
|
| — |
|
|
| — |
|
|
| — |
|
|
| 575 |
|
|
| 575 |
|
Allowance for credit losses- |
|
| — |
|
|
| — |
|
|
| — |
|
|
| — |
|
|
| — |
|
|
| 2,096 |
|
|
| 2,096 |
|
Total allowance for credit loss |
| $ | 13,321 |
|
| $ | 19,086 |
|
| $ | 573 |
|
| $ | 4,153 |
|
| $ | 641 |
|
| $ | 2,096 |
|
| $ | 39,870 |
|
| For the Year Ended December 31, 2015 |
| ||||||||||||||||||||||||||||||
|
| Residential Mortgages |
|
| Commercial Mortgages |
|
| Home Equity |
|
| Commercial & Industrial |
|
| Consumer |
|
| Unallocated |
|
| Impaired |
|
| Total |
| ||||||||
|
| (dollars in thousands) |
| |||||||||||||||||||||||||||||
Allowance for loan losses: |
|
|
|
|
|
|
|
|
|
|
|
|
|
|
|
|
|
|
|
|
|
|
|
|
|
|
|
|
|
|
|
|
Balance at December 31, 2014 |
| $ | 5,174 |
|
| $ | 7,285 |
|
| $ | 679 |
|
| $ | 750 |
|
| $ | 328 |
|
| $ | 53 |
|
| $ | — |
|
| $ | 14,269 |
|
Charge-offs |
|
| (37 | ) |
|
| — |
|
|
| (1 | ) |
|
| (124 | ) |
|
| (16 | ) |
|
| — |
|
|
| — |
|
|
| (178 | ) |
Recoveries |
|
| — |
|
|
| 8 |
|
|
| — |
|
|
| 4 |
|
|
| 13 |
|
|
| — |
|
|
| — |
|
|
| 25 |
|
Provision |
|
| 107 |
|
|
| 801 |
|
|
| 21 |
|
|
| (15 | ) |
|
| 29 |
|
|
| (42 | ) |
|
| 174 |
|
|
| 1,075 |
|
Balance at December 31, 2015 |
| $ | 5,244 |
|
| $ | 8,094 |
|
| $ | 699 |
|
| $ | 615 |
|
| $ | 354 |
|
| $ | 11 |
|
| $ | 174 |
|
| $ | 15,191 |
|
The following tables contain period-end balancesBalances of accrued interest receivable excluded from amortized cost and the calculation of allowance for loancredit losses amounted to $13.5 million, $11.6 million, and related loans receivable disaggregated by impairment method:$6.8 million at December 31, 2023, December 31, 2022, and December 31, 2021, respectively.
|
| December 31, 2017 |
| |||||||||||||||||||||
|
| Residential Mortgages |
|
| Commercial Mortgages |
|
| Home Equity |
|
| Commercial & Industrial |
|
| Consumer |
|
| Total |
| ||||||
|
| (dollars in thousands) |
| |||||||||||||||||||||
Allowance for loan losses |
|
|
|
|
|
|
|
|
|
|
|
|
|
|
|
|
|
|
|
|
|
|
|
|
Individually evaluated for impairment |
| $ | 93 |
|
| $ | — |
|
| $ | — |
|
| $ | — |
|
| $ | — |
|
| $ | 93 |
|
Collectively evaluated for impairment |
|
| 5,047 |
|
|
| 8,289 |
|
|
| 630 |
|
|
| 946 |
|
|
| 315 |
|
|
| 15,227 |
|
Total |
| $ | 5,140 |
|
| $ | 8,289 |
|
| $ | 630 |
|
| $ | 946 |
|
| $ | 315 |
|
| $ | 15,320 |
|
|
|
|
|
|
|
|
|
|
|
|
|
|
|
|
|
|
|
|
|
|
|
|
|
|
Loans receivable |
|
|
|
|
|
|
|
|
|
|
|
|
|
|
|
|
|
|
|
|
|
|
|
|
Individually evaluated for impairment |
| $ | 968 |
|
| $ | 213 |
|
| $ | 86 |
|
| $ | 29 |
|
| $ | — |
|
| $ | 1,296 |
|
Collectively evaluated for impairment |
|
| 537,952 |
|
|
| 633,436 |
|
|
| 74,358 |
|
|
| 65,266 |
|
|
| 38,591 |
|
|
| 1,349,603 |
|
Total |
| $ | 538,920 |
|
| $ | 633,649 |
|
| $ | 74,444 |
|
| $ | 65,295 |
|
| $ | 38,591 |
|
| $ | 1,350,899 |
|
|
| December 31, 2016 |
| |||||||||||||||||||||
|
| Residential Mortgages |
|
| Commercial Mortgages |
|
| Home Equity |
|
| Commercial & Industrial |
|
| Consumer |
|
| Total |
| ||||||
|
| (dollars in thousands) |
| |||||||||||||||||||||
Allowance for loan losses |
|
|
|
|
|
|
|
|
|
|
|
|
|
|
|
|
|
|
|
|
|
|
|
|
Individually evaluated for impairment |
| $ | 69 |
|
| $ | — |
|
| $ | 7 |
|
| $ | 114 |
|
| $ | — |
|
| $ | 190 |
|
Collectively evaluated for impairment |
|
| 4,898 |
|
|
| 8,452 |
|
|
| 650 |
|
|
| 807 |
|
|
| 264 |
|
|
| 15,071 |
|
Total |
| $ | 4,967 |
|
| $ | 8,452 |
|
| $ | 657 |
|
| $ | 921 |
|
| $ | 264 |
|
| $ | 15,261 |
|
|
|
|
|
|
|
|
|
|
|
|
|
|
|
|
|
|
|
|
|
|
|
|
|
|
Loans receivable |
|
|
|
|
|
|
|
|
|
|
|
|
|
|
|
|
|
|
|
|
|
|
|
|
Individually evaluated for impairment |
| $ | 1,027 |
|
| $ | — |
|
| $ | 102 |
|
| $ | 289 |
|
| $ | — |
|
| $ | 1,418 |
|
Collectively evaluated for impairment |
|
| 533,377 |
|
|
| 616,140 |
|
|
| 74,949 |
|
|
| 59,417 |
|
|
| 34,853 |
|
|
| 1,318,736 |
|
Total |
| $ | 534,404 |
|
| $ | 616,140 |
|
| $ | 75,051 |
|
| $ | 59,706 |
|
| $ | 34,853 |
|
| $ | 1,320,154 |
|
As discussed in Note 2, Summary of Significant Accounting Policies, the provision for loan losses is evaluated on a periodic basis by management in order to determine the adequacy of the allowance for loan losses.
In 2016, the Company updated its methodology for determining its allowance for loan losses to better reflect changes in the risk profile of its loan portfolio including greater disaggregation of environmental factors, an update to assigned risk allocations for qualitative factors, and an update to the historical loss experience look-back period. The updates did not significantly impact the individual loan portfolios or the total allowance.
|
|
As a voluntary member of the FHLB of Boston, the BankCompany is required to invest in stock of the FHLB of Boston (which is considered a restricted equity security) in an amount based upon its outstanding advances from the FHLB of Boston. At December 31, 2017,2023 and December 31, 2016,2022, the Bank’sCompany’s investment in FHLB of Boston stock totaled $4.2$19.1 million and $4.1$6.3 million, respectively. No market exists for shares of this stock. The Bank’sCompany’s cost for FHLB of Boston stock is equal to its par value. Upon redemption of the stock, which is at the discretion of the FHLB of Boston, the Bank would receive an amount equal to the par value of the stock. At its discretion, the FHLB of Boston may also declare dividends on its stock.
The Bank’sCompany’s investment in FHLB of Boston stock is reviewed for impairment at each reporting date based on the ultimate recoverability of the cost basis of the stock. As of December 31, 20172023 and December 31, 2016, 2022, no impairment has been recognized.
| 9. BANKING PREMISES AND EQUIPMENT |
A summary of the cost and accumulated depreciation and amortization of property, leasehold improvements, and equipment is presented below:
|
| December 31, |
|
| Estimated | |||||
|
| 2023 |
|
| 2022 |
|
| Useful Lives | ||
|
| (dollars in thousands) |
|
|
| |||||
Land |
| $ | 3,396 |
|
| $ | 3,396 |
|
|
|
Building and leasehold improvements |
|
| 25,586 |
|
|
| 25,588 |
|
| 3-30 years |
Equipment, including vaults |
|
| 21,460 |
|
|
| 20,165 |
|
| 3-20 years |
Work in process |
|
| 149 |
|
|
| 22 |
|
|
|
Subtotal |
|
| 50,591 |
|
|
| 49,171 |
|
|
|
Accumulated depreciation and amortization |
|
| (28,838 | ) |
|
| (25,874 | ) |
|
|
Total |
| $ | 21,753 |
|
| $ | 23,297 |
|
|
|
|
| December 31, |
|
| Estimated | |||||
|
| 2017 |
|
| 2016 |
|
| Useful Lives | ||
|
| (dollars in thousands) |
|
|
| |||||
Land |
| $ | 1,116 |
|
| $ | 1,116 |
|
|
|
Building and leasehold improvements |
|
| 12,839 |
|
|
| 12,801 |
|
| 3-30 years |
Equipment, including vaults |
|
| 11,185 |
|
|
| 10,506 |
|
| 3-20 years |
Construction in process |
|
| 9 |
|
|
| 25 |
|
|
|
Subtotal |
|
| 25,149 |
|
|
| 24,448 |
|
|
|
Accumulated depreciation and amortization |
|
| (15,839 | ) |
|
| (13,997 | ) |
|
|
Total |
| $ | 9,310 |
|
| $ | 10,451 |
|
|
|
80
Total depreciation expense for the years ended December 31, 2017, 2016,2023, 2022, and 20152021 amounted to approximately $1.9$2.8 million, $2.1$2.7 million, and $1.9$2.6 million, respectively, and is included in occupancy and equipment expenses in the accompanying consolidated statements of income.
|
|
Goodwill
Core deposit intangible (“CDI”). At December 31, 20172023 and 2016,December 31, 2022, the carrying value of goodwill, which is included in otherCDI assets totaled $412,000$6.5 million and $412,000,$7.4 million, respectively. Goodwill is testedThe Company recorded amortization expense of CDI assets totaling $893,000, $494,000, and $361,000 for impairment, based on its fair value, at least annually. As ofthe years ended December 31, 20172023, December 31, 2022, and 2016, no goodwill impairment has been recognized.December 31, 2021, respectively. The weighted-average remaining amortization period for CDI was 7.7years and 8.7 years at December 31, 2023 and December 31, 2022, respectively.
Mortgage servicing rights. Certainrights. Periodically, the Company sells certain residential mortgage loans are periodically sold by the Company to the secondary market. Loans held for sale totaled $0 and $6.5 million at December 31, 2017 and December 31, 2016, respectively. Generally, these loans are sold without recourse or other credit enhancements.
The Company sells loans and either releases or retains the servicing rights. For loans sold with servicing rights retained, we providethe Company provides the servicing for the loans on a per-loan fee basis. The Company was servicing mortgage loans sold to others without recourse of approximately $173.9 million at December 31, 2023 and $191.9 million at December 31, 2022.Mortgage loans sold andwith servicing rights retained during the years ended December 31, 2017, 20162023, December 31, 2022, and 2015December 31, 2021 were $11.9$6.4 million, $50.0$5.8 million, and $24.8$25.3 million, respectively, with net gains recognized in gain on loans held for sale of $182,000, $998,000 and $622,000, respectively.
AnThe following table provides an analysis of mortgage servicing rights, which are included in other assets, follows:assets:
|
| Mortgage Servicing Rights |
|
| Valuation Allowance |
|
| Total |
| |||||||||||||||
|
| (dollars in thousands) |
|
| Mortgage |
|
| Valuation |
|
| Total |
| ||||||||||||
Balance at December 31, 2014 |
| $ | 332 |
|
| $ | — |
|
| $ | 332 |
| ||||||||||||
|
| (dollars in thousands) |
| |||||||||||||||||||||
Balance at December 31, 2020 |
| $ | 1,361 |
|
| $ | (142 | ) |
| $ | 1,219 |
| ||||||||||||
Mortgage servicing rights capitalized |
|
| 305 |
|
|
| — |
|
|
| 305 |
|
|
| 281 |
|
|
| — |
|
|
| 281 |
|
Amortization charged against servicing income |
|
| (138 | ) |
|
| — |
|
|
| (138 | ) |
|
| (559 | ) |
|
| — |
|
|
| (559 | ) |
Change in impairment reserve |
|
| — |
|
|
| (8 | ) |
|
| (8 | ) |
|
| — |
|
|
| 142 |
|
|
| 142 |
|
Balance at December 31, 2015 |
| $ | 499 |
|
| $ | (8 | ) |
| $ | 491 |
| ||||||||||||
Balance at December 31, 2021 |
| $ | 1,083 |
|
| $ | — |
|
| $ | 1,083 |
| ||||||||||||
|
|
|
|
|
|
|
|
|
|
|
|
|
|
|
|
|
|
|
| |||||
Balance at December 31, 2021 |
| $ | 1,083 |
|
| $ | — |
|
| $ | 1,083 |
| ||||||||||||
Mortgage servicing rights acquired as a result of the Northmark merger |
|
| 785 |
|
|
| — |
|
|
| 785 |
| ||||||||||||
Mortgage servicing rights capitalized |
|
| 545 |
|
|
| — |
|
|
| 545 |
|
|
| 71 |
|
|
| — |
|
|
| 71 |
|
Amortization charged against servicing income |
|
| (202 | ) |
|
| — |
|
|
| (202 | ) |
|
| (274 | ) |
|
| — |
|
|
| (274 | ) |
Change in impairment reserve |
|
| — |
|
|
| (22 | ) |
|
| (22 | ) | ||||||||||||
Balance at December 31, 2016 |
| $ | 842 |
|
| $ | (30 | ) |
| $ | 812 |
| ||||||||||||
Balance at December 31, 2022 |
| $ | 1,665 |
|
| $ | — |
|
| $ | 1,665 |
| ||||||||||||
|
|
|
|
|
|
|
|
|
|
|
|
|
|
|
|
|
|
|
| |||||
Balance at December 31, 2022 |
| $ | 1,665 |
|
| $ | — |
|
| $ | 1,665 |
| ||||||||||||
Mortgage servicing rights capitalized |
|
| 132 |
|
|
| — |
|
|
| 132 |
|
|
| 74 |
|
|
| — |
|
|
| 74 |
|
Amortization charged against servicing income |
|
| (151 | ) |
|
| — |
|
|
| (151 | ) |
|
| (269 | ) |
|
| — |
|
|
| (269 | ) |
Change in impairment reserve |
|
| — |
|
|
| — |
|
|
| — |
| ||||||||||||
Balance at December 31, 2017 |
| $ | 823 |
|
| $ | (30 | ) |
| $ | 793 |
| ||||||||||||
Balance at December 31, 2023 |
| $ | 1,470 |
|
| $ | — |
|
| $ | 1,470 |
| ||||||||||||
The fair value of ourthe Company’s mortgage servicing rights (“MSR”) portfolio was $1.0$2.4 million and $2.3 million as of December 31, 20172023 and 2016.2022, respectively. The fair value of mortgage servicing rights is estimated based on the present value of expected cash flows, incorporating assumptions for discount rate, prepayment speed, and servicing cost.
The weighted-average amortization period for mortgage servicing rights portfolio was 7.37.8 years and 8.07.1 years at December 31, 20172023 and December 31, 2016,2022, respectively.
81
The estimated aggregate future amortization expense for mortgage servicing rights for each of the next five years and thereafter is as follows:
|
| Future Amortization Expense |
| |
|
| (dollars in thousands) |
| |
2024 |
| $ | 173 |
|
2025 |
|
| 153 |
|
2026 |
|
| 136 |
|
2027 |
|
| 121 |
|
2028 |
|
| 109 |
|
Thereafter |
|
| 778 |
|
Total |
| $ | 1,470 |
|
Year ended December 31: |
| Future Amortization Expense |
| |
|
| (dollars in thousands) |
| |
2018 |
| $ | 103 |
|
2019 |
|
| 92 |
|
2020 |
|
| 82 |
|
2021 |
|
| 72 |
|
2022 |
|
| 63 |
|
Thereafter |
|
| 381 |
|
Total |
| $ | 793 |
|
|
|
Deposits are summarized as follows:
|
| December 31, 2023 |
|
| December 31, 2022 |
| ||
|
| (dollars in thousands) |
| |||||
Demand deposits (non-interest bearing) |
| $ | 1,032,413 |
|
| $ | 1,366,395 |
|
Interest bearing checking |
|
| 1,132,518 |
|
|
| 908,961 |
|
Money market |
|
| 983,480 |
|
|
| 1,162,773 |
|
Savings |
|
| 498,386 |
|
|
| 790,628 |
|
Retail certificates of deposit under $250,000 |
|
| 212,694 |
|
|
| 117,532 |
|
Retail certificates of deposit $250,000 or greater |
|
| 170,020 |
|
|
| 87,528 |
|
Brokered certificates of deposit |
|
| 291,667 |
|
|
| 381,559 |
|
Total deposits |
| $ | 4,321,178 |
|
| $ | 4,815,376 |
|
|
| December 31, 2017 |
|
| December 31, 2016 |
| ||
|
| (dollars in thousands) |
| |||||
Demand deposits (non-interest bearing) |
| $ | 493,613 |
|
| $ | 472,923 |
|
Interest bearing checking |
|
| 462,957 |
|
|
| 430,706 |
|
Money market |
|
| 69,259 |
|
|
| 72,057 |
|
Savings |
|
| 589,741 |
|
|
| 539,190 |
|
Retail certificates of deposit under $100,000 |
|
| 38,068 |
|
|
| 42,471 |
|
Retail certificates of deposit $100,000 or greater |
|
| 69,093 |
|
|
| 72,355 |
|
Wholesale certificates of deposit |
|
| 52,669 |
|
|
| 56,336 |
|
Total deposits |
| $ | 1,775,400 |
|
| $ | 1,686,038 |
|
Certificates of deposit had the following schedule of maturities:
|
| December 31, 2017 |
|
| December 31, 2016 |
| ||
|
| (dollars in thousands) |
| |||||
Less than 3 months remaining |
| $ | 40,716 |
|
| $ | 32,268 |
|
3 to 5 months remaining |
|
| 19,107 |
|
|
| 17,558 |
|
6 to 11 months remaining |
|
| 30,545 |
|
|
| 36,240 |
|
12 to 23 months remaining |
|
| 42,421 |
|
|
| 44,467 |
|
24 to 47 months remaining |
|
| 20,017 |
|
|
| 29,826 |
|
48 months or more remaining |
|
| 7,024 |
|
|
| 10,803 |
|
Total certificates of deposit |
| $ | 159,830 |
|
| $ | 171,162 |
|
|
| December 31, 2023 |
|
| December 31, 2022 |
| ||
|
| (dollars in thousands) |
| |||||
2023 |
| $ | — |
|
| $ | 533,513 |
|
2024 |
|
| 655,266 |
|
|
| 39,753 |
|
2025 |
|
| 11,388 |
|
|
| 5,377 |
|
2026 |
|
| 5,918 |
|
|
| 6,021 |
|
2027 |
|
| 1,315 |
|
|
| 1,955 |
|
2028 and after |
|
| 494 |
|
|
| — |
|
Total certificates of deposit |
| $ | 674,381 |
|
| $ | 586,619 |
|
Interest expense on retail certificates of deposit $100,000 or greater was $446,000, $475,000 and $482,000 for the years ended December 31, 2017, 2016 and 2015, respectively.
The aggregate amount of certificates of deposit in denominations that meet or exceed the FDIC insurance limit of $250,000 at December 31, 2017 and 2016 was $44.7 million and $46.0 million, respectively.
Related Party Deposits
Deposit accounts of directors, executive officers, and their respective affiliates totaled $3.1$1.7 million and $7.2$2.7 million as of December 31, 20172023 and 2016,2022, respectively.
Federal Home Loan Bank Advances
At December 31, 2023 the Company had $406.0 million of short-term advances from the FHLB of Boston, with a weighted average rate of 5.38%. For the year ended December 31, 2023 the average daily balance for short-term advances was $157.1 million and the highest month end balance was $406.0 million. At December 31, 2022, the Company had $100.2 million of short-term advances from the FHLB of Boston, with a weighted average rate of 4.38%. For the year ended December 31, 2022 the average daily balance for short-term advances was $68.4 million and the highest month end balance was $279.0 million.
At December 31, 2023 the Company had $46.2 million of long-term advances from the FHLB of Boston, with a weighted average rate of 4.17%. At December 31, 2022, the Company had no long-term advances from the FHLB of Boston.
82
Information relating to short-termthe Company’s borrowings, istheir remaining maturities, and weighted average interest rates are presented below:
|
| For the Year Ended December 31, |
| |||||
|
| 2017 |
|
| 2016 |
| ||
|
| (dollars in thousands) |
| |||||
FHLB of Boston short-term advances |
|
|
|
|
|
|
|
|
Ending balance |
| $ | — |
|
| $ | — |
|
Average daily balance |
|
| 32,418 |
|
|
| 3,668 |
|
Highest month-end balance |
|
| 110,000 |
|
|
| 21,000 |
|
Weighted average interest rate |
|
| 1.21 | % |
|
| 0.54 | % |
|
| For the Year Ended December 31, |
| |||||||||||||
|
| 2023 |
|
| 2022 |
| ||||||||||
|
| Amount |
|
| Weighted Average Interest Rate |
|
| Amount |
|
| Weighted Average Interest Rate |
| ||||
|
| (dollars in thousands) |
|
|
|
| ||||||||||
Within one year |
| $ | 406,000 |
|
|
| 5.38 | % |
| $ | 100,176 |
|
|
| 4.38 | % |
Over one year to three years |
|
| 45,000 |
|
|
| 4.27 | % |
|
| — |
|
|
| — | % |
Over three years to five years (1) |
|
| 717 |
|
|
| — | % |
|
| — |
|
|
| — | % |
Over five years(1) |
|
| 438 |
|
|
| — | % |
|
| — |
|
|
| — | % |
Total FHLB of Boston |
| $ | 452,155 |
|
|
| 5.26 | % |
| $ | 100,176 |
|
|
| 4.38 | % |
(1) Includes advances under the FHLB of Boston Jobs for New England (“JNE”) program, which are zero rate borrowings.
Information relatingSecurities Sold Under Agreements to long-term borrowings is presented below:Repurchase
|
| December 31, 2017 |
|
| December 31, 2016 |
| ||||||||||
|
| Amount |
|
| Rate |
|
| Amount |
|
| Rate |
| ||||
|
| (dollars in thousands) |
| |||||||||||||
FHLB of Boston long-term advances |
|
|
|
|
|
|
|
|
|
|
|
|
|
|
|
|
Due 09/01/2020; amortizing |
| $ | 3,579 |
|
|
| 1.94 | % |
| $ | 3,746 |
|
|
| 1.94 | % |
The Company periodically enters into repurchase agreements with its larger deposit and commercial clients as part of its cash management services which are typically overnight borrowings. There were no repurchase agreements with clients outstanding as of December 31, 2023. Repurchase agreements with clients totaled $5.0 million as of December 31, 2022. The daily average balance of securities sold under agreements to repurchase during the year ended December 31, 2023 was $1.7 million and during the year ended December 31, 2022 was $1.2 million. The Company retained control of the securities underlying these agreements.
Unused Borrowing Capacity with the FHLB of Boston and FRB of Boston
All short- and long-term borrowings with the FHLB of Boston are secured by the Bank’sCompany’s stock in the FHLB of Boston and a blanket lien on “qualified collateral” defined principally as 90% of the market value of certain U.S. Government and GSE obligations and 75%60% - 70% of the carrying value of certain residential mortgage loans. Based upon collateral pledged, the Bank’s unused borrowing capacity with the FHLB of Boston at December 31, 20172023 was approximately $302.1$532.0 million.
The BankCompany also has a line of credit with the FRB of Boston. The Company did not have any outstanding FRB borrowings at December 31, 2023 or December 31, 2022. At December 31, 20172023 and 2016,December 31, 2022, the BankCompany had pledged commercial real estateinvestment securities, CRE, and commercial & industrialhome equity loans with aggregate principal balances of approximately $287.6 million$2.11 billion and $306.8$970.1 million, respectively, as collateral for this line of credit. Based upon the collateral pledged, the Bank’sCompany’s unused borrowing capacity with the FRB of Boston at December 31, 20172023 and 20162022 was approximately $158.0$1.76 billion and $680.4 million, and $159.6 million, respectively.
| 13. INCOME TAXES |
Earnings in 2017 were impacted by the Tax Cuts and Jobs Act of 2017. The change in tax law required a one-time non-cash write-down of our net deferred tax assets of $3.9 million as these deferred tax assets were required to be re-measured using the new lower tax rate in 2017. Effective in 2018, the change in tax law will reduce the Company’s statutory federal tax rate from 35% to 21%.
The components of income tax expense were as follows:
|
| For the Year Ended December 31, |
| |||||||||
|
| 2023 |
|
| 2022 |
|
| 2021 |
| |||
|
| (dollars in thousands) |
| |||||||||
Current income tax expense |
|
|
|
|
|
|
|
|
| |||
Federal |
| $ | 7,740 |
|
| $ | 12,906 |
|
| $ | 11,330 |
|
State |
|
| 2,895 |
|
|
| 5,559 |
|
|
| 4,862 |
|
Total current income tax expense |
|
| 10,635 |
|
|
| 18,465 |
|
|
| 16,192 |
|
|
|
|
|
|
|
|
|
|
| |||
Deferred income tax expense |
|
|
|
|
|
|
|
|
| |||
Federal |
|
| 1,091 |
|
|
| 455 |
|
|
| 1,840 |
|
State |
|
| 574 |
|
|
| 132 |
|
|
| 1,059 |
|
Total deferred income tax expense |
|
| 1,665 |
|
|
| 587 |
|
|
| 2,899 |
|
Total income tax expense |
| $ | 12,300 |
|
| $ | 19,052 |
|
| $ | 19,091 |
|
|
| For the Year Ended December 31, |
| |||||||||
|
| 2017 |
|
| 2016 |
|
| 2015 |
| |||
|
| (dollars in thousands) |
| |||||||||
Current |
|
|
|
|
|
|
|
|
|
|
|
|
Federal |
| $ | 8,446 |
|
| $ | 7,551 |
|
| $ | 6,855 |
|
State |
|
| 2,225 |
|
|
| 1,833 |
|
|
| 1,458 |
|
Total current expense |
|
| 10,671 |
|
|
| 9,384 |
|
|
| 8,313 |
|
|
|
|
|
|
|
|
|
|
|
|
|
|
Deferred |
|
|
|
|
|
|
|
|
|
|
|
|
Federal |
|
| 2,948 |
|
|
| (645 | ) |
|
| (594 | ) |
State |
|
| (261 | ) |
|
| (183 | ) |
|
| (168 | ) |
Total deferred |
|
| 2,687 |
|
|
| (828 | ) |
|
| (762 | ) |
Total income tax expense |
| $ | 13,358 |
|
| $ | 8,556 |
|
| $ | 7,551 |
|
83
The following is a reconciliation of the total income tax provision,expense, calculated at statutory federal income tax rates, to the income tax provision in the consolidated statements of income:
|
| For the Year Ended December 31, |
| |||||||||
|
| 2023 | 2022 | 2021 |
| |||||||
|
| (dollars in thousands) |
| |||||||||
Income tax expense at statutory rate of 21.0% |
| $ | 9,746 |
|
| $ | 15,112 |
|
| $ | 15,354 |
|
Increase/(decrease) resulting from: |
|
|
|
|
|
|
|
|
| |||
State tax, net of federal tax benefit |
|
| 2,741 |
|
|
| 4,496 |
|
|
| 4,678 |
|
Tax-exempt income |
|
| (597 | ) |
|
| (814 | ) |
|
| (795 | ) |
ESOP dividends |
|
| (151 | ) |
|
| (150 | ) |
|
| (145 | ) |
Bank owned life insurance |
|
| (148 | ) |
|
| (133 | ) |
|
| (165 | ) |
Compensation limited under 162(m) |
|
| 112 |
|
|
| 193 |
|
|
| 226 |
|
Benefit from stock compensation |
|
| 17 |
|
|
| (81 | ) |
|
| (46 | ) |
Non-deductible acquisition costs |
|
| 657 |
|
|
| 182 |
|
|
| — |
|
Non-deductible expenses |
|
| 71 |
|
|
| 44 |
|
|
| 55 |
|
BOLI surrender, death benefit |
|
| — |
|
|
| 310 |
|
|
| — |
|
Other |
|
| (148 | ) |
|
| (107 | ) |
|
| (71 | ) |
Total income tax expense |
| $ | 12,300 |
|
| $ | 19,052 |
|
| $ | 19,091 |
|
|
| For the Year Ended December 31, |
| |||||||||||||||||||||
|
| 2017 |
|
| Rate |
|
| 2016 |
|
| Rate |
|
| 2015 |
|
| Rate |
| ||||||
|
| (dollars in thousands) |
| |||||||||||||||||||||
Provision at statutory rates |
| $ | 9,861 |
|
|
| 35.00 | % |
| $ | 8,908 |
|
|
| 35.00 | % |
| $ | 8,136 |
|
|
| 35.00 | % |
Increase/(decrease) resulting from: |
|
|
|
|
|
|
|
|
|
|
|
|
|
|
|
|
|
|
|
|
|
|
|
|
State tax, net of federal tax benefit |
|
| 1,277 |
|
|
| 4.53 |
|
|
| 1,073 |
|
|
| 4.22 |
|
|
| 839 |
|
|
| 3.61 |
|
Tax-exempt income |
|
| (1,079 | ) |
|
| (3.83 | ) |
|
| (1,099 | ) |
|
| (4.32 | ) |
|
| (1,041 | ) |
|
| (4.48 | ) |
ESOP dividends |
|
| (216 | ) |
|
| (0.77 | ) |
|
| (214 | ) |
|
| (0.84 | ) |
|
| (207 | ) |
|
| (0.89 | ) |
Bank owned life insurance |
|
| (205 | ) |
|
| (0.73 | ) |
|
| (214 | ) |
|
| (0.84 | ) |
|
| (233 | ) |
|
| (1.00 | ) |
Benefit from stock compensation |
|
| (190 | ) |
|
| (0.67 | ) |
|
| — |
|
|
| — |
|
|
| — |
|
|
| — |
|
Impact of Tax Cuts and Jobs Act |
|
| 3,870 |
|
|
| 13.74 |
|
|
| — |
|
|
| — |
|
|
| — |
|
|
| — |
|
Other |
|
| 40 |
|
|
| 0.15 |
|
|
| 102 |
|
|
| 0.40 |
|
|
| 57 |
|
|
| 0.25 |
|
Total income tax expense |
| $ | 13,358 |
|
|
| 47.42 | % |
| $ | 8,556 |
|
|
| 33.62 | % |
| $ | 7,551 |
|
|
| 32.49 | % |
The Company’s 20172023 and 20162022 net deferred tax assets were measured using 21%a 27.95% federal and 35%,state blended tax rate, respectively, and consisted of the following components:
|
| December 31, 2017 |
|
| December 31, 2016 |
|
| December 31, 2023 |
|
| December 31, 2022 |
| ||||
|
| (dollars in thousands) |
|
| (dollars in thousands) |
| ||||||||||
Gross deferred tax assets |
|
|
|
|
|
|
|
|
|
|
|
|
| |||
Allowance for loan losses |
| $ | 4,306 |
|
| $ | 6,234 |
| ||||||||
Accrued retirement benefits |
|
| 2,430 |
|
|
| 5,595 |
| ||||||||
Unrealized losses on AFS securities |
|
| 905 |
|
|
| 1,496 |
| ||||||||
Allowance for credit losses |
| $ | 11,377 |
|
| $ | 11,142 |
| ||||||||
Unrealized losses on available for sale securities |
|
| 6,652 |
|
|
| 7,390 |
| ||||||||
Incentive compensation |
|
| 1,082 |
|
|
| 1,413 |
|
|
| 1,379 |
|
|
| 1,819 |
|
Equity based compensation |
|
| 351 |
|
|
| 333 |
|
|
| 910 |
|
|
| 1,298 |
|
Rent |
|
| 266 |
|
|
| 299 |
| ||||||||
Lease liabilities |
|
| 7,033 |
|
|
| 7,661 |
| ||||||||
ESOP dividends |
|
| 174 |
|
|
| 249 |
|
|
| 202 |
|
|
| 200 |
|
Intangibles and fair value marks (merger related) |
|
| 1,841 |
|
|
| 2,322 |
| ||||||||
Other |
|
| 164 |
|
|
| 295 |
|
|
| 528 |
|
|
| 931 |
|
Total gross deferred tax assets |
|
| 9,678 |
|
|
| 15,914 |
|
|
| 29,922 |
|
|
| 32,763 |
|
|
|
|
|
|
|
|
|
|
|
|
|
|
| |||
Gross deferred tax liabilities |
|
|
|
|
|
|
|
|
|
|
|
|
| |||
Deferred loan origination costs |
|
| (401 | ) |
|
| (625 | ) |
|
| (2,835 | ) |
|
| (2,886 | ) |
Retirement benefits |
|
| (2,460 | ) |
|
| (1,745 | ) | ||||||||
Depreciation of premises and equipment |
|
| (667 | ) |
|
| (1,100 | ) |
|
| (2,353 | ) |
|
| (2,551 | ) |
Right-of-use asset |
|
| (6,493 | ) |
|
| (7,014 | ) | ||||||||
Mortgage servicing rights |
|
| (223 | ) |
|
| (332 | ) |
|
| (411 | ) |
|
| (465 | ) |
Goodwill |
|
| (114 | ) |
|
| (164 | ) |
|
| (115 | ) |
|
| (115 | ) |
Derivative transactions |
|
| 44 |
|
|
| 3 |
| ||||||||
Total gross deferred tax liabilities |
|
| (1,405 | ) |
|
| (2,221 | ) |
|
| (14,623 | ) |
|
| (14,773 | ) |
Net deferred tax asset |
| $ | 8,273 |
|
| $ | 13,693 |
|
| $ | 15,299 |
|
| $ | 17,990 |
|
It is management’s belief that it is more likely than not that the reversal of deferred tax liabilities and results of future operations will generate sufficient taxable income to realize the deferred tax assets. Therefore, no valuation allowance was required at either December 31, 2017 or 20162023 and December 31, 2022 for the deferred tax assets. It should be noted, however, that factors beyond management’s control, such as the general state of the economy and real estate values, can affect future levels of taxable income and that no assurance can be given that sufficient taxable income will be generated in future periods to fully absorb deductible temporary differences.
84
A summary of the change in the net deferred tax asset is as follows:
| For the Year Ended December 31, |
| |||||
| 2023 |
|
| 2022 |
| ||
|
|
| |||||
Balance at beginning of year: | $ | 17,990 |
|
| $ | 9,985 |
|
Deferred tax expense |
| (1,665 | ) |
|
| (587 | ) |
Merger accounting |
| — |
|
|
| 1,853 |
|
Accumulated other comprehensive income |
| (1,026 | ) |
|
| 6,739 |
|
Balance at end of year | $ | 15,299 |
|
| $ | 17,990 |
|
At December 31, 20172023 and 2016,December 31, 2022, the Company had no unrecognized tax benefits or any uncertain tax positions. The Company does not expect the total amount of unrecognized tax benefits to significantly increase in the next 12 months.
The Company’s federal income tax returns are open and subject to examination from the 20142020 through 2023 tax return year and forward.years. The Company’s state income tax returns are open from the 2014 and later2020 through 2023 tax return years based on individual statestates’ statute of limitations.
On January 1, 2017, we adopted Accounting Standards Update No. 2016-09 - “Improvements to Employee Share-Based Payment Accounting” (“ASU 2016-09”). ASU 2016-09 requires that excess tax benefits or tax deficiencies be recognized as income tax benefit or expense in earnings in the period that they occur. During the year ended December 31, 2017, the Company recognized a tax benefit of $221,000.
The Company has a noncontributory, defined benefit pension plan (“Pension Plan”) covering substantially all employees hired before May 2, 2011. Employees in positions requiring at least 1,000 hours of service per year were eligible to participate upon the attainment of age 21 and the completion of 12 months of service. Benefits are based primarily on years of service and the employee’s average monthly pay during the five highest consecutive plan years of the employee’s final ten years. On October 23, 2017, the Company announced its decision to freeze the accrual of benefits within the Pension Plan, effective December 31, 2017. The Company also provides supplemental retirement benefits to certain current and former executive officers of the Company under the terms of Supplemental Executive Retirement Agreements (“Supplemental Retirement Plan”). Prior to 2016, the Company provided individual non-qualified defined benefit supplemental executive retirement plans (“DB SERPs”) to certain executives. The DB SERPs generally provide for an annual benefit payable in equal monthly installments following the executive’s retirement and continuing for at least the remainder of his or her lifetime, with such annual benefit generally based on the executive’s years of service and his or her highest three consecutive years of base salary and bonus. In 2016, the Company’s Board discontinued the use of DB SERPs for new entrants to the Company’s non-qualified retirement programs. Instead, new entrants are provided with individual non-qualified defined contribution supplemental executive retirement plans (“DC SERPs”). Under the DC SERPs, the Company contributes an amount equal to 10% of the executive’s base salary and bonus to his or her account under the Company’s non-qualified deferred compensation plan, the Executive Deferred Compensation Plan. The Company also offers postretirement health care benefits for current and future retirees of the Bank. Certain employees receive a fixed monthly benefit at age 65 toward the purchase of postretirement medical coverage. The benefit received is based on the employee’s years of active service. Effective November 7, 2019, the postretirement health care plan was frozen for employees hired after that date. The Company froze the accrual of benefits on the qualified defined benefit pension plan in 2017. The Company did not make any contributions to the qualified defined benefit pension plan during the years ended December 31, 2023 and December 31, 2022. The Company uses a December 31st measurement date each year to determine the benefit obligations for these plans.
Projected benefit obligations and funded status were as follows:
|
| Pension Plan |
|
| Supplemental Retirement Plan |
|
| Pension Plan |
|
| Supplemental |
| ||||||||||||||||||||
|
| 2017 |
|
| 2016 |
|
| 2017 |
|
| 2016 |
|
| 2023 |
|
| 2022 |
|
| 2023 |
|
| 2022 |
| ||||||||
|
| (dollars in thousands) |
|
| (dollars in thousands) |
| ||||||||||||||||||||||||||
Change in projected benefit obligation |
|
|
|
|
|
|
|
|
|
|
|
|
|
|
|
|
|
|
|
|
|
|
|
|
|
|
|
| ||||
Obligation at beginning of year |
| $ | 43,915 |
|
| $ | 40,653 |
|
| $ | 8,891 |
|
| $ | 8,419 |
|
| $ | 35,598 |
|
| $ | 47,875 |
|
| $ | 8,060 |
|
| $ | 10,075 |
|
Service cost |
|
| 1,500 |
|
|
| 1,561 |
|
|
| 267 |
|
|
| 282 |
|
|
| — |
|
|
| — |
|
|
| 273 |
|
|
| 399 |
|
Interest cost |
|
| 1,826 |
|
|
| 1,771 |
|
|
| 364 |
|
|
| 366 |
|
|
| 1,806 |
|
|
| 1,309 |
|
|
| 399 |
|
|
| 260 |
|
Effect of curtailment |
|
| (7,366 | ) |
|
| — |
|
|
| — |
|
|
| — |
| ||||||||||||||||
Actuarial loss/(gain) |
|
| 5,313 |
|
|
| 1,044 |
|
|
| 182 |
|
|
| 316 |
| ||||||||||||||||
Actuarial (gain) loss |
|
| 1,175 |
|
|
| (11,754 | ) |
|
| 81 |
|
|
| (2,057 | ) | ||||||||||||||||
Benefits paid |
|
| (1,245 | ) |
|
| (1,114 | ) |
|
| (500 | ) |
|
| (492 | ) |
|
| (1,937 | ) |
|
| (1,832 | ) |
|
| (616 | ) |
|
| (617 | ) |
Obligation at end of year |
|
| 43,943 |
|
|
| 43,915 |
|
|
| 9,204 |
|
|
| 8,891 |
|
|
| 36,642 |
|
|
| 35,598 |
|
|
| 8,197 |
|
|
| 8,060 |
|
Change in plan assets |
|
|
|
|
|
|
|
|
|
|
|
|
|
|
|
|
|
|
|
|
|
|
|
|
|
|
|
| ||||
Fair value at beginning of year |
|
| 39,821 |
|
|
| 38,482 |
|
|
| — |
|
|
| — |
|
|
| 50,349 |
|
|
| 60,638 |
|
|
| — |
|
|
| — |
|
Actual return on plan assets |
|
| 6,671 |
|
|
| 2,453 |
|
|
| — |
|
|
| — |
|
|
| 5,716 |
|
|
| (8,457 | ) |
|
| — |
|
|
| — |
|
Employer contribution |
|
| — |
|
|
| — |
|
|
| 500 |
|
|
| 492 |
|
|
| — |
|
|
| — |
|
|
| 616 |
|
|
| 617 |
|
Benefits paid |
|
| (1,245 | ) |
|
| (1,114 | ) |
|
| (500 | ) |
|
| (492 | ) |
|
| (1,937 | ) |
|
| (1,832 | ) |
|
| (616 | ) |
|
| (617 | ) |
Fair value at end of year |
|
| 45,247 |
|
|
| 39,821 |
|
|
| — |
|
|
| — |
|
|
| 54,128 |
|
|
| 50,349 |
|
|
| — |
|
|
| — |
|
Funded status at end of year |
| $ | 1,304 |
|
| $ | (4,094 | ) |
| $ | (9,204 | ) |
| $ | (8,891 | ) |
| $ | 17,486 |
|
| $ | 14,751 |
|
| $ | (8,197 | ) |
| $ | (8,060 | ) |
Amounts recognized inThe funded status of the Company’s Pension Plan is included within other assets and the funded status of the Company’s Supplemental Retirement Plan is included within other liabilities on the Company’s consolidated balance sheets consisted of:at December 31, 2023 and 2022.
|
| Pension Plan |
|
| Supplemental Retirement Plan |
| ||||||||||
|
| 2017 |
|
| 2016 |
|
| 2017 |
|
| 2016 |
| ||||
|
| (dollars in thousands) |
| |||||||||||||
Other assets/(liabilities) |
| $ | 1,304 |
|
| $ | (4,094 | ) |
| $ | (9,204 | ) |
| $ | (8,891 | ) |
|
| Pension Plan |
|
| Supplemental |
| ||||||||||
|
| 2023 |
|
| 2022 |
|
| 2023 |
|
| 2022 |
| ||||
|
| (dollars in thousands) |
| |||||||||||||
Accumulated benefit obligation |
| $ | 36,642 |
|
| $ | 35,598 |
|
| $ | 7,823 |
|
| $ | 7,627 |
|
85
Amounts recognized in accumulated other comprehensive lossincome (loss) consisted of:
|
| Pension Plan |
|
| Supplemental |
| ||||||||||
|
| 2023 |
|
| 2022 |
|
| 2023 |
|
| 2022 |
| ||||
|
| (dollars in thousands) |
| |||||||||||||
Net actuarial (gain) loss |
| $ | (964 | ) |
| $ | 373 |
|
| $ | (535 | ) |
| $ | (617 | ) |
Total |
| $ | (964 | ) |
| $ | 373 |
|
| $ | (535 | ) |
| $ | (617 | ) |
|
| Pension Plan |
|
| Supplemental Retirement Plan |
| ||||||||||
|
| 2017 |
|
| 2016 |
|
| 2017 |
|
| 2016 |
| ||||
|
| (dollars in thousands) |
| |||||||||||||
Net actuarial loss/(gain) |
| $ | 5,021 |
|
| $ | 11,798 |
|
| $ | 861 |
|
| $ | 679 |
|
Prior service (benefit) |
|
| (16 | ) |
|
| (20 | ) |
|
| — |
|
|
| — |
|
Total |
| $ | 5,005 |
|
| $ | 11,778 |
|
| $ | 861 |
|
| $ | 679 |
|
Certain disaggregated information related to our pension plans were as follows:
|
| Pension Plan |
|
| Supplemental Retirement Plan |
| ||||||||||
|
| 2017 |
|
| 2016 |
|
| 2017 |
|
| 2016 |
| ||||
|
| (dollars in thousands) |
| |||||||||||||
Projected benefit obligation |
| $ | 43,943 |
|
| $ | 43,915 |
|
| $ | 9,204 |
|
| $ | 8,891 |
|
Accumulated benefit obligation |
|
| 43,943 |
|
|
| 37,473 |
|
|
| 9,028 |
|
|
| 8,891 |
|
Fair value of plan assets |
|
| 45,247 |
|
|
| 39,821 |
|
|
| — |
|
|
| — |
|
Funded status at end of year |
|
| 1,304 |
|
|
| (4,094 | ) |
|
| (9,204 | ) |
|
| (8,891 | ) |
The components of net periodic benefit cost and amounts recognized in other comprehensive income/income (loss) were as follows:
|
| Pension Plan |
|
| Supplemental |
| ||||||||||
|
| 2023 |
|
| 2022 |
|
| 2023 |
|
| 2022 |
| ||||
|
| (dollars in thousands) |
| |||||||||||||
Net periodic benefit cost |
|
|
|
|
|
|
|
|
|
|
|
| ||||
Service cost |
| $ | — |
|
| $ | — |
|
| $ | 273 |
|
| $ | 399 |
|
Interest cost |
|
| 1,806 |
|
|
| 1,309 |
|
|
| 399 |
|
|
| 260 |
|
Expected return on assets |
|
| (3,204 | ) |
|
| (3,876 | ) |
|
| — |
|
|
| — |
|
Amortization of net actuarial loss |
|
| — |
|
|
| — |
|
|
| — |
|
|
| 28 |
|
Net periodic expense (benefit) |
|
| (1,398 | ) |
|
| (2,567 | ) |
|
| 672 |
|
|
| 687 |
|
Amounts recognized in other comprehensive income (loss) |
|
|
|
|
|
|
|
|
|
|
|
| ||||
Net actuarial loss/(gain) |
|
| (1,337 | ) |
|
| 579 |
|
|
| 81 |
|
|
| (2,057 | ) |
Amortization of net actuarial loss |
|
| — |
|
|
| — |
|
|
| — |
|
|
| (28 | ) |
Total recognized in other comprehensive income (loss) |
|
| (1,337 | ) |
|
| 579 |
|
|
| 81 |
|
|
| (2,085 | ) |
Total recognized in net periodic expense (benefit) and other |
| $ | (2,735 | ) |
| $ | (1,988 | ) |
| $ | 753 |
|
| $ | (1,398 | ) |
|
| Pension Plan |
|
| Supplemental Retirement Plan |
| ||||||||||
|
| 2017 |
|
| 2016 |
|
| 2017 |
|
| 2016 |
| ||||
|
| (dollars in thousands) |
| |||||||||||||
Net periodic benefit cost |
|
|
|
|
|
|
|
|
|
|
|
|
|
|
|
|
Service cost |
| $ | 1,500 |
|
| $ | 1,561 |
|
| $ | 267 |
|
| $ | 282 |
|
Interest cost |
|
| 1,826 |
|
|
| 1,771 |
|
|
| 364 |
|
|
| 366 |
|
Expected return on assets |
|
| (2,741 | ) |
|
| (2,837 | ) |
|
| — |
|
|
| — |
|
Amortization of prior service credit |
|
| (4 | ) |
|
| (4 | ) |
|
| — |
|
|
| 64 |
|
Amortization of net actuarial loss |
|
| 794 |
|
|
| 891 |
|
|
| — |
|
|
| — |
|
Net periodic benefit cost |
|
| 1,375 |
|
|
| 1,382 |
|
|
| 631 |
|
|
| 712 |
|
Amounts recognized in other comprehensive income/( loss) |
|
|
|
|
|
|
|
|
|
|
|
|
|
|
|
|
Net actuarial loss/(gain) |
|
| 1,383 |
|
|
| 1,429 |
|
|
| 182 |
|
|
| 251 |
|
Amortization of prior service credit |
|
| 4 |
|
|
| 4 |
|
|
| — |
|
|
| — |
|
Amortization of net actuarial gain |
|
| (794 | ) |
|
| (891 | ) |
|
| — |
|
|
| — |
|
Curtailment gain |
|
| (7,366 | ) |
|
| — |
|
|
| — |
|
|
| — |
|
Total recognized in other comprehensive income/( loss) |
|
| (6,773 | ) |
|
| 542 |
|
|
| 182 |
|
|
| 251 |
|
Total recognized in net periodic benefit cost and other comprehensive income/( loss) |
| $ | (5,398 | ) |
| $ | 1,924 |
|
| $ | 813 |
|
| $ | 963 |
|
Weighted-average assumptions used to determine projected benefit obligations are as follows:
|
| Pension Plan |
|
| Supplemental Retirement Plan |
|
| Pension Plan |
|
| Supplemental |
| ||||||||||||||||||||
|
| 2017 |
|
| 2016 |
|
| 2017 |
|
| 2016 |
|
| 2023 |
|
| 2022 |
|
| 2023 |
|
| 2022 |
| ||||||||
Discount rate |
|
| 3.58 | % |
|
| 4.25 | % |
|
| 3.39 | % |
|
| 4.25 | % |
|
| 5.00 | % |
|
| 5.22 | % |
|
| 4.95 | % |
|
| 5.15 | % |
Rate of compensation increase |
|
| 4.00 | % |
|
| 4.00 | % |
|
| 4.00 | % |
|
| 4.00 | % |
| N/A |
| N/A |
|
|
| 4.00 | % |
|
| 4.00 | % | |||
Weighted-average assumptions used to determine the net periodic benefit cost arein each year were as follows:
|
| Pension Plan |
|
| Supplemental Retirement Plan |
|
| Pension Plan |
|
| Supplemental |
| ||||||||||||||||||||
|
| 2017 |
|
| 2016 |
|
| 2017 |
|
| 2016 |
|
| 2023 |
|
| 2022 |
|
| 2023 |
|
| 2022 |
| ||||||||
Discount rate |
|
| 4.25 | % |
|
| 4.35 | % |
|
| 4.25 | % |
|
| 4.35 | % |
|
| 5.22 | % |
|
| 2.79 | % |
|
| 5.15 | % |
|
| 2.63 | % |
Expected long-term return on plan assets |
|
| 7.00 | % |
|
| 7.50 | % |
| NA |
|
| NA |
|
|
| 6.50 | % |
|
| 6.50 | % |
| N/A |
| N/A |
| |||||
Rate of compensation increase |
|
| 4.00 | % |
|
| 4.00 | % |
|
| 4.00 | % |
|
| 4.00 | % |
| N/A |
| N/A |
|
|
| 4.00 | % |
|
| 4.00 | % | |||
To develop the expected long-term rate of return on assets assumption for the pension plan,Pension Plan, the Company considered the historical returns and the future expectations for returns for each asset class, as well as target asset allocations of the pension portfolio. Based on this analysis, the Company selected 7.00% as the long-term rate of return on asset assumption.
The Company maintains an Investment Policy for its defined benefit pension plan.Pension Plan. The objective of this policy is to seek a balance between capital appreciation, current income, and preservation of capital, with a longer term weighting towards equities because of the extended time horizon of the pension plan.capital.
The Investment Policy guidelines suggest that the target asset allocation percentages are from 30%0% to 60%60% in domestic large cap equities, from 5%0% to 20%20% in domestic small/mid cap equities, from 0%0% to 20%20% in international and emerging equities, and from 20%20% to 50%100% in cash and fixed income. The Company does not expect to make a contribution to its defined benefit pension plan in 2018.
86
The Company’s defined pension planPension Plan weighted-average asset allocations by asset category were as follows:
|
| December 31, |
|
| December 31, |
| ||||||||||
|
| 2017 |
|
| 2016 |
|
| 2023 |
|
| 2022 |
| ||||
Equity securities |
|
| 65 | % |
|
| 67 | % |
|
| 45 | % |
|
| 60 | % |
Debt securities |
|
| 29 |
|
|
| 28 |
|
|
| 20 |
|
|
| 33 |
|
Other |
|
| 2 |
|
|
| — |
| ||||||||
Cash and equivalents |
|
| 4 |
|
|
| 5 |
|
|
| 35 |
|
|
| 7 |
|
Total |
|
| 100 | % |
|
| 100 | % |
|
| 100 | % |
|
| 100 | % |
The three broad levels of fair values used to measure the pension planPension Plan assets are as follows:
Level 1 – Quoted prices for identical assets in active markets.
Level 2 – Quoted prices for similar assets in active markets; quoted prices for identical or similar assets in inactive markets; and model-derived valuations in which all significant inputs and significant value drivers are observable in active markets.
Level 3 – Valuations derived from techniques in which one or more significant inputs or significant value drivers are unobservable in the markets and which reflect the Company’s market assumptions.
The following table summarizes the various categories of the pension plan’sPension Plan’s assets:
|
| Fair Value as of December 31, 2017 |
| |||||||||||||
|
| Level 1 |
|
| Level 2 |
|
| Level 3 |
|
| Total |
| ||||
|
| (dollars in thousands) |
| |||||||||||||
Asset category |
|
|
|
|
|
|
|
|
|
|
|
|
|
|
|
|
Cash and cash equivalents |
| $ | 1,627 |
|
| $ | — |
|
| $ | — |
|
| $ | 1,627 |
|
Fixed Income |
|
| — |
|
|
| 7,292 |
|
|
| — |
|
|
| 7,292 |
|
Equity securities |
|
|
|
|
|
|
|
|
|
|
|
|
|
|
|
|
Common Stock |
|
|
|
|
|
|
|
|
|
|
|
|
|
|
|
|
Large cap core |
|
| 18,026 |
|
|
| — |
|
|
| — |
|
|
| 18,026 |
|
Mid cap core |
|
| 56 |
|
|
| — |
|
|
| — |
|
|
| 56 |
|
Small cap core |
|
| 2,333 |
|
|
| — |
|
|
| — |
|
|
| 2,333 |
|
Mutual funds |
|
|
|
|
|
|
|
|
|
|
|
|
|
|
|
|
Domestic Equity |
|
| 4,564 |
|
|
| — |
|
|
| — |
|
|
| 4,564 |
|
International |
|
| 3,818 |
|
|
| — |
|
|
| — |
|
|
| 3,818 |
|
Domestic Fixed Income |
|
| 7,531 |
|
|
|
|
|
|
|
|
|
|
| 7,531 |
|
Preferred Stock |
|
| — |
|
|
| — |
|
|
| — |
|
|
| — |
|
Total |
| $ | 37,955 |
|
| $ | 7,292 |
|
| $ | — |
|
| $ | 45,247 |
|
|
| Fair Value as of December 31, 2023 |
| |||||||||||||
|
| Level 1 |
|
| Level 2 |
|
| Level 3 |
|
| Total |
| ||||
|
| (dollars in thousands) |
| |||||||||||||
Asset category |
|
|
|
|
|
|
|
|
|
|
|
| ||||
Cash and cash equivalents |
| $ | 18,755 |
|
| $ | — |
|
| $ | — |
|
| $ | 18,755 |
|
Fixed income |
|
| — |
|
|
| 8,129 |
|
|
| — |
|
|
| 8,129 |
|
Equity securities |
|
|
|
|
|
|
|
|
|
|
|
| ||||
Mutual funds |
|
|
|
|
|
|
|
|
|
|
|
| ||||
Domestic equity |
|
| 15,285 |
|
|
| — |
|
|
| — |
|
|
| 15,285 |
|
International |
|
| 2,798 |
|
|
| — |
|
|
| — |
|
|
| 2,798 |
|
Domestic fixed income |
|
| 9,161 |
|
|
| — |
|
|
| — |
|
|
| 9,161 |
|
Total |
| $ | 45,999 |
|
| $ | 8,129 |
|
| $ | — |
|
| $ | 54,128 |
|
|
| Fair Value as of December 31, 2022 |
| |||||||||||||
|
| Level 1 |
|
| Level 2 |
|
| Level 3 |
|
| Total |
| ||||
|
| (dollars in thousands) |
| |||||||||||||
Asset category |
|
|
|
|
|
|
|
|
|
|
|
| ||||
Cash and cash equivalents |
| $ | 3,676 |
|
| $ | — |
|
| $ | — |
|
| $ | 3,676 |
|
Fixed income |
|
| — |
|
|
| 12,347 |
|
|
| — |
|
|
| 12,347 |
|
Equity securities |
|
|
|
|
|
|
|
|
|
|
|
| ||||
Mutual funds |
|
|
|
|
|
|
|
|
|
|
|
| ||||
Domestic equity |
|
| 24,201 |
|
|
| — |
|
|
| — |
|
|
| 24,201 |
|
International |
|
| 3,942 |
|
|
| — |
|
|
| — |
|
|
| 3,942 |
|
Domestic fixed income |
|
| 6,183 |
|
|
| — |
|
|
| — |
|
|
| 6,183 |
|
Total |
| $ | 38,002 |
|
| $ | 12,347 |
|
| $ | — |
|
| $ | 50,349 |
|
| Fair Value as of December 31, 2016 |
| ||||||||||||||
|
| Level 1 |
|
| Level 2 |
|
| Level 3 |
|
| Total |
| ||||
|
| (dollars in thousands) |
| |||||||||||||
Asset category |
|
|
|
|
|
|
|
|
|
|
|
|
|
|
|
|
Cash and cash equivalents |
| $ | 2,112 |
|
| $ | — |
|
| $ | — |
|
| $ | 2,112 |
|
Fixed Income |
|
| — |
|
|
| 11,186 |
|
|
| — |
|
|
| 11,186 |
|
Equity securities |
|
|
|
|
|
|
|
|
|
|
|
|
|
|
|
|
Common stocks |
|
|
|
|
|
|
|
|
|
|
|
|
|
|
|
|
Large cap core |
|
| 10,905 |
|
|
| — |
|
|
| — |
|
|
| 10,905 |
|
Mid cap core |
|
| 4,380 |
|
|
| — |
|
|
| — |
|
|
| 4,380 |
|
Small cap core |
|
| 2,338 |
|
|
| — |
|
|
| — |
|
|
| 2,338 |
|
Mutual funds |
|
|
|
|
|
|
|
|
|
|
|
|
|
|
|
|
Domestic Equity |
|
| 4,472 |
|
|
| — |
|
|
| — |
|
|
| 4,472 |
|
International |
|
| 4,327 |
|
|
| — |
|
|
| — |
|
|
| 4,327 |
|
Preferred Stock |
|
| 101 |
|
|
| — |
|
|
| — |
|
|
| 101 |
|
Total |
| $ | 28,635 |
|
| $ | 11,186 |
|
| $ | — |
|
| $ | 39,821 |
|
There were no transfers between fair value levels during the years ended December 31, 20172023 and 2016.December 31, 2022.
The Company offers postretirement health care benefits for current and future retirees of the Bank. Employees receive a fixed monthly benefit at age 65 toward the purchase of postretirement medical coverage. The benefit received is based on the employee’s years of active service. The Company uses a December 31 measurement date each year to determine the benefit obligation for this plan. On
87
November 7, 2019, the Company announced its decision to freeze the accrual of benefits to new hires within the plan. The plan is unfunded and plan obligations were $489,000 and $424,000 at December 31, 2023 and December 31, 2022, respectively.
Projected benefit obligations and funded status were as follows:
|
| Postretirement Healthcare Plan |
| |||||
|
| 2017 |
|
| 2016 |
| ||
|
| (dollars in thousands) |
| |||||
Change in projected benefit obligation |
|
|
|
|
|
|
|
|
Obligation at beginning of year |
| $ | 568 |
|
| $ | 621 |
|
Service cost |
|
| 19 |
|
|
| 17 |
|
Interest cost |
|
| 23 |
|
|
| 24 |
|
Actuarial loss/(gain) |
|
| 37 |
|
|
| (68 | ) |
Benefits paid |
|
| (30 | ) |
|
| (26 | ) |
Obligation at end of year |
|
| 617 |
|
|
| 568 |
|
Change in plan assets |
|
|
|
|
|
|
|
|
Fair value at beginning of year |
|
| — |
|
|
| — |
|
Actual return on plan assets |
|
| — |
|
|
| — |
|
Employer contribution |
|
| 30 |
|
|
| 26 |
|
Benefits paid |
|
| (30 | ) |
|
| (26 | ) |
Fair value at end of year |
|
| — |
|
|
| — |
|
Funded status at end of year |
| $ | (617 | ) |
| $ | (568 | ) |
Amounts recognized in the consolidated balance sheets consisted of:
|
| Postretirement Healthcare Plan |
| |||||
|
| 2017 |
|
| 2016 |
| ||
|
| (dollars in thousands) |
| |||||
Other liabilities |
| $ | (617 | ) |
| $ | (568 | ) |
Amounts recognized in accumulated other comprehensive loss consisted of:
|
| Postretirement Healthcare Plan |
| |||||
|
| 2017 |
|
| 2016 |
| ||
|
| (dollars in thousands) |
| |||||
Net actuarial (gain)/loss |
| $ | (82 | ) |
| $ | (128 | ) |
Prior service cost |
|
| — |
|
|
| — |
|
Total |
| $ | (82 | ) |
| $ | (128 | ) |
Information for pension plans with an accumulated benefit obligation in excess of plan assets:
|
| Postretirement Healthcare Plan |
| |||||
|
| 2017 |
|
| 2016 |
| ||
|
| (dollars in thousands) |
| |||||
Projected benefit obligation |
| $ | 617 |
|
| $ | 568 |
|
Accumulated benefit obligation |
|
| 617 |
|
|
| 568 |
|
Fair value of plan assets |
|
| — |
|
|
| — |
|
The components of net periodic benefit cost and amounts recognized in other comprehensive income were as follows:
|
| Postretirement Healthcare Plan |
| |||||
|
| 2017 |
|
| 2016 |
| ||
|
| (dollars in thousands) |
| |||||
Net periodic benefit cost |
|
|
|
|
|
|
|
|
Service cost |
| $ | 19 |
|
| $ | 17 |
|
Interest cost |
|
| 23 |
|
|
| 24 |
|
Expected return on assets |
|
| — |
|
|
| — |
|
Amortization of prior service credit |
|
| — |
|
|
| (4 | ) |
Amortization of net actuarial gain |
|
| (9 | ) |
|
| (9 | ) |
Net periodic benefit cost |
|
| 33 |
|
|
| 28 |
|
Amounts recognized in other comprehensive income/( loss) |
|
|
|
|
|
|
|
|
Net actuarial (gain) loss |
|
| 37 |
|
|
| (68 | ) |
Amortization of prior service credit |
|
| — |
|
|
| 4 |
|
Amortization of net actuarial gain |
|
| 9 |
|
|
| 9 |
|
Total recognized in other comprehensive income/( loss) |
|
| 46 |
|
|
| (55 | ) |
Total recognized in net periodic benefit cost and other comprehensive income/( loss) |
| $ | 79 |
|
| $ | (27 | ) |
Weighted-average assumptions used to determine projected benefit obligations are as follows:
|
| Postretirement Healthcare Plan |
| |||||
|
| 2017 |
|
| 2016 |
| ||
Discount rate |
|
| 3.58 | % |
|
| 4.25 | % |
Rate of compensation increase |
| NA |
|
| NA |
| ||
Weighted-average assumptions used to determine net periodic benefit cost are as follows:
|
| Postretirement Healthcare Plan |
| |||||
|
| 2017 |
|
| 2016 |
| ||
Discount rate |
|
| 4.25 | % |
|
| 4.35 | % |
Expected long-term return on plan assets |
| NA |
|
| NA |
| ||
Rate of compensation increase |
| NA |
|
| NA |
| ||
Assumed health care cost trend rates are as follows:
|
| Postretirement Healthcare Plan |
| |||||
|
| 2017 |
|
| 2016 |
| ||
Health care cost trend rate assumed for next year |
|
| 4.00 | % |
|
| 4.00 | % |
Rate to which the cost trend rate is assumed to decline (the ultimate trend rate) |
|
| 4.00 | % |
|
| 4.00 | % |
Year that the rate reaches the ultimate trend rate |
| 2017 |
|
| 2016 |
| ||
Assumed health care trend rates have a significant effect on the amounts reported for the health care plans. A one-percentage-point change in assumed health care cost trend rates would have the following effects:
|
| One Percentage Point |
| |||||
|
| Increase |
|
| Decrease |
| ||
|
| (dollars in thousands) |
| |||||
Effect on total service and interest cost |
| $ | — |
|
| $ | — |
|
Effect on postretirement benefit obligation |
|
| 4 |
|
|
| (3 | ) |
Benefits expected to be paid in the next ten years are as follows:
|
| Pension Plan |
|
| Supplemental Retirement Plan |
|
| Postretirement Healthcare Plan |
|
| Total |
| ||||
|
| (dollars in thousands) |
| |||||||||||||
Year-ended December 31, |
|
|
|
|
|
|
|
|
|
|
|
|
|
|
|
|
2018 |
| $ | 1,507 |
|
| $ | 585 |
|
| $ | 28 |
|
| $ | 2,120 |
|
2019 |
|
| 1,541 |
|
|
| 583 |
|
|
| 28 |
|
|
| 2,152 |
|
2020 |
|
| 1,714 |
|
|
| 580 |
|
|
| 29 |
|
|
| 2,323 |
|
2021 |
|
| 1,776 |
|
|
| 578 |
|
|
| 28 |
|
|
| 2,382 |
|
2022 |
|
| 1,916 |
|
|
| 596 |
|
|
| 30 |
|
|
| 2,542 |
|
2023-2027 inclusive |
|
| 10,968 |
|
|
| 2,931 |
|
|
| 162 |
|
|
| 14,061 |
|
Ten year total |
| $ | 19,422 |
|
| $ | 5,853 |
|
| $ | 305 |
|
| $ | 25,580 |
|
|
| Pension |
|
| Supplemental |
|
| Postretirement |
|
| Total |
| ||||
|
| (dollars in thousands) |
| |||||||||||||
Year-ended December 31, |
|
|
|
|
|
|
|
|
|
|
|
| ||||
2024 |
| $ | 2,207 |
|
| $ | 614 |
|
| $ | 23 |
|
| $ | 2,844 |
|
2025 |
|
| 2,287 |
|
|
| 611 |
|
|
| 24 |
|
|
| 2,922 |
|
2026 |
|
| 2,413 |
|
|
| 607 |
|
|
| 24 |
|
|
| 3,044 |
|
2027 |
|
| 2,340 |
|
|
| 602 |
|
|
| 24 |
|
|
| 2,966 |
|
2028 |
|
| 2,483 |
|
|
| 596 |
|
|
| 25 |
|
|
| 3,104 |
|
2029-2033 |
|
| 12,961 |
|
|
| 4,192 |
|
|
| 141 |
|
|
| 17,294 |
|
Total |
| $ | 24,691 |
|
| $ | 7,222 |
|
| $ | 261 |
|
| $ | 32,174 |
|
The estimated amounts that will be amortized from accumulated other comprehensive income into net periodic benefit cost during 2018 are as follows:
|
| Pension Plan |
|
| Supplemental Retirement Plan |
|
| Postretirement Healthcare Plan |
|
| Total |
| ||||
|
| (dollars in thousands) |
| |||||||||||||
Prior service cost |
| $ | (4 | ) |
| $ | — |
|
| $ | — |
|
| $ | (4 | ) |
Net (gain)/loss |
|
| 63 |
|
|
| — |
|
|
| (1 | ) |
|
| 62 |
|
Total |
| $ | 59 |
|
| $ | — |
|
| $ | (1 | ) |
| $ | 58 |
|
Employee Profit Sharing and 401(k) Plan
The Company maintains a Profit SharingProfit-Sharing Plan (“PSP”) that provides for deferral of federal and state income taxes on employee contributions allowed under Section 401(k) of federal law. The Company matchedmatches employee contributions up to 100%100% of the first 3%4% of each participant’s salary. Each year, the Company may also make a discretionary contribution to the PSP.salary, eligible bonus, and eligible incentive. Employees wereare eligible to participate in the 401(k) feature of the PSP on the first business day of the quarter following their initial date of service and attainment of age 21. Employees were eligibleservice. The Company may also make discretionary contributions to participate in discretionary contribution feature of the PSP on January 1 and July 1 of each year provided they have attained the age of 21 and the completion of 12 months of service consisting of at least 1,000 hours.PSP.
Employee Stock Ownership Plan
The Company has an Employee Stock Ownership Plan (“ESOP”) for its eligible employees. Employees are eligible to participate upon the attainment of age 21 and the completion of 12 months of service consisting of at least 1,000 hours. Historically, the ESOP would purchase from the Company shares presently authorized but unissued at a price determined by an independent appraiser and certified by a committee of the trustees of the ESOP. Purchases of the Company’s stock by the ESOP will be funded solely by employer contributions.contributions or reinvestment of cash dividends.
Total expenses related to the Profit Sharing and ESOP Plans for the years ended December 31, 2017, 20162023, 2022, and 2015,2021 amounted to approximately $1.5 $2.8million, $949,000$4.5 million, and $900,000,$4.0 million, respectively.
In 1993,Defined Contribution SERP Plan
For executives participating in the Defined Contribution SERP Plan (“DC SERP”) plan, the Company adoptedmade a Stock Option Plan for key employees as an incentive for themcontribution of 10% of each executive’s base salary and bonus to assist the Company in achieving long-range performance goals. During 2005,his or her account under the Company’s shareholders amendedDC SERP. Total expenses related to the planCompany’s DC SERP for the years ended December 31, 2023, 2022, and 2021 amounted to permit the issuance of restricted stock, restricted stock units,$25,000, $271,000, and stock appreciation rights.$201,000, respectively.
In 2017, the Company adopted the 2017 Equity and Cash Incentive Plan (the “2017 Plan”) and all future awards willfrom date of adoption are anticipated to be made under the 2017 Plan. The 2017 planPlan permits the issuance of restricted stock, restricted stock units (both time and performance-based), stock options, and stock appreciation rights.
Stock options time-vest over a five-year period. All options expire ten years from the date granted and have been issued at fair value at the date of grant which, in some instances, may be less than publicly traded values. A summary of stock options outstanding as of December 31, 2017 and 2016, and changes during the years ended on those dates is presented below:
|
| 2017 |
|
| 2016 |
| ||||||||||
|
| Number of Options |
|
| Weighted Average Exercise Price |
|
| Number of Options |
|
| Weighted Average Exercise Price |
| ||||
Stock Options |
|
|
|
|
|
|
|
|
|
|
|
|
|
|
|
|
Outstanding at beginning of year |
|
| 45,612 |
|
| $ | 30.23 |
|
|
| 108,952 |
|
| $ | 29.72 |
|
Granted |
|
| — |
|
|
| — |
|
|
| — |
|
|
| — |
|
Forfeited |
|
| — |
|
|
| — |
|
|
| — |
|
|
| — |
|
Expired |
|
| (4,500 | ) |
|
| 30.11 |
|
|
| (21,900 | ) |
|
| 28.11 |
|
Exercised |
|
| (24,735 | ) |
|
| 30.93 |
|
|
| (41,440 | ) |
|
| 30.01 |
|
Outstanding at end of year |
|
| 16,377 |
|
|
| 29.21 |
|
|
| 45,612 |
|
|
| 30.23 |
|
Exercisable at end of year |
|
| 16,377 |
|
| $ | 29.21 |
|
|
| 45,612 |
|
| $ | 30.23 |
|
The following table summarizes information about stock options outstanding at December 31, 2017:
|
| Options Outstanding |
|
| Options Exercisable |
| ||||||||||||
Range of Exercise Price |
| Number Outstanding at 12/31/2017 |
|
| Weighted Average Remaining Contractual Life |
| Weighted Average Exercise Price |
|
| Number Exercisable at 12/31/2017 |
|
| Weighted Average Exercise Price |
| ||||
$26.99 - $29.99 |
|
| 16,377 |
|
| 0.04 years |
| $ | 29.21 |
|
|
| 16,377 |
|
| $ | 29.21 |
|
|
|
|
|
|
|
|
|
|
|
|
|
|
|
|
|
|
|
|
|
|
| 16,377 |
|
| 0.04 years |
| $ | 29.21 |
|
|
| 16,377 |
|
| $ | 29.21 |
|
Restricted stock awards time-vest either over a three-year or five-year period and have beenare fair valued as of the date of grant. The holders of restricted stock awards participate fully in the rewards of stock ownership of the Company, including voting and dividend rights. A summary of non-vested restricted sharesstock outstanding as of December 31, 20172023 and 2016,2022, and changes during the years ended on those dates, is presented below:
|
| 2017 |
|
| 2016 |
| ||||||||||
|
| Number of Shares |
|
| Weighted Average Grant Value |
|
| Number of Shares |
|
| Weighted Average Grant Value |
| ||||
Restricted stock |
|
|
|
|
|
|
|
|
|
|
|
|
|
|
|
|
Non-vested at beginning of year |
|
| 41,957 |
|
| $ | 44.17 |
|
|
| 47,808 |
|
| $ | 42.08 |
|
Granted |
|
| 18,906 |
|
|
| 64.62 |
|
|
| 16,346 |
|
|
| 46.35 |
|
Vested |
|
| (14,113 | ) |
|
| 42.62 |
|
|
| (18,050 | ) |
|
| 40.86 |
|
Forfeited |
|
| (3,510 | ) |
|
| 49.19 |
|
|
| (4,147 | ) |
|
| 43.00 |
|
Non-vested at end of year |
|
| 43,240 |
|
| $ | 53.13 |
|
|
| 41,957 |
|
| $ | 44.17 |
|
|
| December 31, 2023 |
|
| December 31, 2022 |
| ||||||||||
|
| Number |
|
| Weighted |
|
| Number |
|
| Weighted |
| ||||
Restricted stock |
|
|
|
|
|
|
|
|
|
|
|
| ||||
Non-vested at beginning of year |
|
| 34,572 |
|
| $ | 82.19 |
|
|
| 34,622 |
|
| $ | 78.20 |
|
Granted |
|
| 16,468 |
|
|
| 81.49 |
|
|
| 14,380 |
|
|
| 87.10 |
|
Vested |
|
| (10,771 | ) |
|
| 80.94 |
|
|
| (11,450 | ) |
|
| 76.50 |
|
Forfeited |
|
| (2,363 | ) |
|
| 84.25 |
|
|
| (2,980 | ) |
|
| 81.43 |
|
Non-vested at end of year |
|
| 37,906 |
|
| $ | 82.11 |
|
|
| 34,572 |
|
| $ | 82.19 |
|
88
Performance-based restricted stock units vest based upon the Company’s performance over a three-year period and have beenare fair valued as of the date of grant. The holders of performance-based restricted stock units do not participate in the rewards of stock ownership of the Company until vested. A summary of non-vested performance-based restricted stock units outstanding as of December 31, 20172023 and 2016,2022, and changes during the years ended on those dates, is presented below:
|
| December 31, 2023 |
|
| December 31, 2022 |
| ||||||||||
|
| Number |
|
| Weighted |
|
| Number |
|
| Weighted |
| ||||
Performance-based restricted stock units |
|
|
|
|
|
|
|
|
|
|
|
| ||||
Non-vested at beginning of year |
|
| 72,134 |
|
| $ | 80.83 |
|
|
| 74,699 |
|
| $ | 73.59 |
|
Granted |
|
| 31,744 |
|
|
| 59.19 |
|
|
| 37,263 |
|
|
| 88.18 |
|
Vested (Performance achieved) |
|
| (27,965 | ) |
|
| 76.00 |
|
|
| (34,248 | ) |
|
| 70.36 |
|
Forfeited |
|
| (7,984 | ) |
|
| 73.87 |
|
|
| (5,580 | ) |
|
| 79.92 |
|
Non-vested at end of year |
|
| 67,929 |
|
| $ | 73.87 |
|
|
| 72,134 |
|
| $ | 80.83 |
|
Time-based restricted stock units vest over a three-year-period and are fair valued as of the date of the grant. The holders of time-based restricted stock units do not participate in the rewards of stock ownership of the Company until vested. A summary of non-vested time-based restricted stock units outstanding as of December 31, 2023 and December 31, 2022, and changes during the years ended on those dates, is presented below:
|
| 2017 |
|
| 2016 |
| ||||||||||
�� |
| Number of Units |
|
| Weighted Average Grant Value |
|
| Number of Units |
|
| Weighted Average Grant Value |
| ||||
Performance-based restricted stock units |
|
|
|
|
|
|
|
|
|
|
|
|
|
|
|
|
Non-vested at beginning of year |
|
| 25,941 |
|
| $ | 45.17 |
|
|
| 20,149 |
|
| $ | 43.05 |
|
Granted |
|
| 12,079 |
|
|
| 64.72 |
|
|
| 14,305 |
|
|
| 46.00 |
|
Vested (Performance achieved) |
|
| — |
|
|
| — |
|
|
| — |
|
|
| — |
|
Forfeited |
|
| (8,597 | ) |
|
| 46.19 |
|
|
| (1,713 | ) |
|
| 44.94 |
|
Expired (Performance not achieved) |
|
| (7,810 | ) |
|
| 44.17 |
|
|
| (6,800 | ) |
|
| 40.70 |
|
Non-vested at end of year |
|
| 21,613 |
|
| $ | 56.05 |
|
|
| 25,941 |
|
| $ | 45.17 |
|
|
| December 31, 2023 |
|
| December 31, 2022 |
| ||||||||||
|
| Number |
|
| Weighted |
|
| Number |
|
| Weighted |
| ||||
Time-based restricted stock units |
|
|
|
|
|
|
|
|
|
|
|
| ||||
Non-vested at beginning of year |
|
| 13,551 |
|
| $ | 82.81 |
|
|
| 13,836 |
|
| $ | 75.91 |
|
Granted |
|
| 28,946 |
|
|
| 53.94 |
|
|
| 8,796 |
|
|
| 88.18 |
|
Vested |
|
| (7,431 | ) |
|
| 80.96 |
|
|
| (7,417 | ) |
|
| 75.94 |
|
Forfeited |
|
| (3,048 | ) |
|
| 63.54 |
|
|
| (1,664 | ) |
|
| 84.40 |
|
Non-vested at end of year |
|
| 32,018 |
|
| $ | 58.98 |
|
|
| 13,551 |
|
| $ | 82.81 |
|
The following table presents the amounts recognized in the consolidated financial statements of income for restricted stock, options, nonvested share awardstime-based restricted stock units, and nonvested performance shares:performance-based restricted stock units:
|
| December 31, |
|
| For the Year Ended December 31, |
| ||||||||||||||||||
|
| 2017 |
|
| 2016 |
|
| 2015 |
|
| 2023 |
|
| 2022 |
|
| 2021 |
| ||||||
|
| (dollars in thousands) |
|
| (dollars in thousands) |
| ||||||||||||||||||
Share-based compensation expense |
| $ | 1,045 |
|
| $ | 997 |
|
| $ | 520 |
|
| $ | 1,589 |
|
| $ | 2,875 |
|
| $ | 3,476 |
|
Related income tax benefit |
| $ | 427 |
|
| $ | 407 |
|
| $ | 212 |
|
| $ | 444 |
|
| $ | 804 |
|
| $ | 970 |
|
In 1993, the Company initiated a Director Stock Plan (the “DSP Plan”). The DSP and 2017 Plan allowallows Directors of the Company to receive their annual retainer fee in the form of stock in the Company. Total shares issued to Directors under the DSP and 2017 Plan in the years ended December 31, 20172023 and 2016December 31, 2022 were 3,67212,195 and 5,577,7,386, respectively. All future awards will be made under the 2017 Plan.
|
|
To meet the financing needs of its customers,clients, the BankCompany is a party to financial instruments with off-balance-sheet risk in the normal course of business. These financial instruments are primarily comprised of commitments to extend credit, commitments to sell residential real estate mortgage loans risk participation agreements, and standby letters of credit. Those instruments involve, to varying degrees, elements of credit and interest rate risk in excess of the amounts recognized in the consolidated balance sheets.
The Bank’sCompany’s exposure to credit loss in the event of nonperformance by the other party to the financial instrument for loan commitments and standby letters of credit is represented by the contractual amount of those instruments assuming that the amounts are fully advanced and that collateral or other security is of no value. The BankCompany generally uses the same credit policies in making commitments and conditional obligations as it does for on-balance-sheet instruments.
89
Off-balance-sheet financial instruments with contractual amounts that present credit risk includedinclude the following:
|
| December 31, 2017 |
|
| December 31, 2016 |
| ||
|
| (dollars in thousands) |
| |||||
Financial instruments whose contractual amount represents credit risk: |
|
|
|
|
|
|
|
|
Commitments to extend credit: |
|
|
|
|
|
|
|
|
Unused portion of existing lines of credit |
| $ | 304,298 |
|
| $ | 256,767 |
|
Origination of new loans |
|
| 45,061 |
|
|
| 26,024 |
|
Standby letters of credit |
|
| 8,322 |
|
|
| 7,763 |
|
|
|
|
|
|
|
|
|
|
Financial instruments whose notional amount exceeds the amount of credit risk: |
|
|
|
|
|
|
|
|
Commitments to sell residential mortgage loans |
|
| 1,490 |
|
|
| 9,622 |
|
Customer related derivative contracts: |
|
|
|
|
|
|
|
|
Interest rate swaps with customers |
|
| 74,758 |
|
|
| 68,372 |
|
Mirror swaps with counterparties |
|
| 74,758 |
|
|
| 68,372 |
|
Risk participation agreements with counterparties |
|
| 38,494 |
|
|
| 16,378 |
|
|
| December 31, 2023 |
|
| December 31, 2022 |
| ||
|
| (dollars in thousands) |
| |||||
Financial instruments whose contractual amount represents credit risk: |
|
|
|
|
|
| ||
Commitments to extend credit: |
|
|
|
|
|
| ||
Unused portion of existing lines of credit |
| $ | 994,196 |
|
| $ | 1,073,567 |
|
Origination of new loans |
|
| 18,341 |
|
|
| 25,411 |
|
Standby letters of credit |
|
| 34,063 |
|
|
| 24,234 |
|
Financial instruments whose notional amount exceeds the amount of credit risk: |
|
|
|
|
|
| ||
Commitments to sell residential mortgage loans |
|
| 795 |
|
|
| 250 |
|
Standby letters of credit are conditional commitments issued by the BankCompany to guarantee performance of a customerclient to a third party. Those guarantees are primarily issued to support public and private borrowing arrangements. Most guarantees extend for one year. The credit risk involved in issuing letters of credit is essentially the same as that involved in extending loan facilities to customers.clients. The collateral supporting those commitments varies and may include real property, accounts receivable, or inventory.
Commitments to extend credit are agreements to lend to a customerclient as long as there is no violation of any condition established in the contract. Commitments generally have fixed expiration dates or other termination clauses and may require payment of a fee. Since some of the commitments may expire without being drawn upon, the total commitment amounts do not necessarily represent future cash requirements. The BankCompany evaluates each customer’sclient’s creditworthiness on a case-by-case basis. The amount of collateral obtained upon extension of the credit is based on management’s credit evaluation of the customer.client. Collateral held varies, but may include primary residences, accounts receivable, inventory, property, plant and equipment, and income-producing commercial real estate.CRE.
See Note 21 - Derivatives and Hedging Activities for a discussion of the Company’s derivatives and hedging activities.
|
|
Lease Commitments. The Company is obligated under various lease agreements covering its main office, branch offices, and other locations. These agreements are accounted for as operating leases and their terms expire between 20182022 and 20302032 and, in some instances, contain options to renew for periods up to 25 years.
The Company recognizes its operating leases on its consolidated balance sheet by recording a lease liability, representing the Company’s legal obligation to make lease payments, and a ROU asset, representing the Company’s legal right to use the leased office space and banking centers. The Company does not include renewal options for leases as part of its ROU assets and lease liabilities unless they are deemed reasonably certain to exercise. The Company does not have any material sub-lease agreements as of December 31, 2023.
Operating lease expenses are comprised of operating lease costs and variable lease costs, net of sublease income, and are recognized over the lease term.
Variable lease payments that are not dependent on an index or a rate or changes in variable payments based on an index or rate after the commencement date are excluded from the measurement of the lease liability, recognized in the period incurred and included within variable lease costs below.
90
The Company determines whether a contract contains a lease based on whether a contract, or a part of a contract, conveys the right to control the use of an identified asset for a period of time in exchange for consideration. The discount rate is determined as either the rate implicit in the lease or, when a rate cannot be readily determined, the Company’s incremental borrowing rate. The incremental borrowing rate is the rate of interest that the Company would have to pay to borrow on a collateralized basis over a similar term.
The components of operating lease cost and other related information are as follows:
| For the Year Ended December 31, |
| ||||||||||
|
| 2023 |
|
| 2022 |
|
| 2021 |
| |||
|
| (dollars in thousands) |
| |||||||||
Operating lease cost |
| $ | 6,849 |
|
| $ | 6,965 |
|
| $ | 6,976 |
|
Variable lease cost (cost excluded from lease payments) |
|
| 27 |
|
|
| 38 |
|
|
| 13 |
|
Sublease income |
|
| (512 | ) |
|
| (316 | ) |
|
| (65 | ) |
Total operating lease cost |
| $ | 6,364 |
|
| $ | 6,687 |
|
| $ | 6,924 |
|
Other Information |
|
|
|
|
|
| ||||||
Cash paid for amounts included in the measurement of lease liabilities - operating cash flows for operating leases |
| $ | 7,370 |
|
| $ | 7,263 |
|
| $ | 7,259 |
|
Operating Lease - operating cash flows (liability reduction) |
|
| 6,619 |
|
|
| 6,401 |
|
|
| 6,252 |
|
Weighted average lease term - operating leases |
| 4.92 Years |
|
| 5.45 Years |
|
| 6.13 Years |
| |||
Weighted average discount rate - operating leases |
|
| 3.01 | % |
|
| 3.01 | % |
|
| 2.94 | % |
The total minimum rentalslease payments due in future periods under these agreements in effect at December 31, 20172023 were as follows:
Year Ended |
| Future Minimum |
| |
December 31, |
| Lease Payments |
| |
|
| (dollars in thousands) |
| |
2018 |
|
| 4,164 |
|
2019 |
|
| 3,894 |
|
2020 |
|
| 3,407 |
|
2021 |
|
| 3,080 |
|
2022 |
|
| 2,124 |
|
Thereafter |
|
| 14,701 |
|
Total minimum lease payments |
| $ | 31,370 |
|
|
| Future Minimum |
| |
December 31, 2023 |
| Lease Payments |
| |
|
| (dollars in thousands) |
| |
2024 |
| $ | 6,959 |
|
2025 |
|
| 5,982 |
|
2026 |
|
| 4,745 |
|
2027 |
|
| 2,958 |
|
2028 |
|
| 2,589 |
|
Thereafter |
|
| 3,900 |
|
Total minimum lease payments |
| $ | 27,133 |
|
Less: interest |
|
| (1,968 | ) |
Total lease liability |
| $ | 25,165 |
|
Several lease agreements contain clauses calling for escalation of minimum lease payments contingent on increases in real estate taxes, gross income adjustments, percentage increases in the consumer price index, and certain ancillary maintenance costs. Total rental expense amounted to approximately $4.7was $7.5 million, $4.6$7.6 million, and $4.2$7.3 million for the years ended December 31, 2017, 2016 and 2015, respectively.
Under the terms of a sublease agreement, the Company will receive minimum annual rental payments of approximately $32,000 through July 31, 2019. Total rental income amounted to approximately $64,000, $76,000 and $33,000 for the years ended2023, December 31, 2017, 2016,2022, and 2015,December 31, 2021, respectively.
Change in Control Agreements. The Company has entered into agreements with its Chief Executive Officer and with certain other senior officers, whereby, following the occurrence of a change in control of the Company, if employment is terminated (except because of death, retirement, disability, or for “cause” as defined in the agreements) or is voluntarily terminated for “good reason,” as defined in the agreements, said officers will be entitled to receive additional compensation, as defined in the agreements.
|
|
Capital guidelines issued by the Federal Reserve Bank (the “FRB”) and by the FDIC require that the Company and the Bank maintain minimum capital levels for capital adequacy purposes. These regulations also require banks and their holding companies to maintain higher capital levels to be considered “well-capitalized.” Failure to meet minimum capital requirements can initiate certain mandatory, and possibly additional discretionary actions by regulators that, if undertaken, could have a direct material effect on the Company’s financial statements. Under capital adequacy guidelines and the regulatory framework for prompt corrective action, there are specific capital guidelines that involve quantitative measures of assets, liabilities, and certain off-balance-sheet items as calculated under regulatory accounting practices.
The risk-based capital rules are designed to makeCapital Rules: (i) include “Common Equity Tier 1” (“CET1”) and related regulatory capital more sensitiveratio of CET1 to differences in risk profiles among bank and bank holding companies, to account for off-balance-sheet exposure, and to minimize disincentives for holding liquid assets.
On July 2, 2013, the Federal Reserve Bank approved the final rules implementing the Basel Committee on Banking Supervision’s capital guidelines for U.S. banks (“Basel III Capital Rules”). On July 9, 2013, the FDIC also approved, as an interim final rule, the regulatory capital requirements for U.S. banks, following the actions of the FRB. On April 8, 2014, the FDIC adopted as final its interim final rule, which is identical in substance to the final rules issued by the FRB in July 2013. Under the final rules, minimum requirements increased for both the quantity and quality of capital held by the Bank. The rules include a new common equityrisk-weighted assets; (ii) specify that Tier 1 capital risk-weighted assets minimum ratioconsists of 4.5%, raiseCET1 and “Additional Tier 1 capital” instruments meeting certain revised requirements; (iii) mandate that most deductions/adjustments to regulatory capital measures be made to CET1 and not to the other components of capital;
91
and (iv) expand the scope of the deductions from and adjustments to capital as compared to existing regulations. Under the Capital Rules, for most banking organizations, including the Company, the most common form of Additional Tier 1 capital is non-cumulative perpetual preferred stock, and the most common forms of Tier 2 capital are subordinated notes and a portion of the allowance for credit losses, in each case, subject to the Capital Rules’ specific requirements.
Pursuant to the Capital Rules, effective January 1, 2015, the minimum ratio ofcapital ratios are as follows:
Additionally, the Company is required to 6.0%, require amaintain additional capital conservation buffer of 2.5% of CET1, effectively resulting in minimum ratioratios inclusive of Totalthe capital conservation buffer of (i) CET1 to risk-weighted assets of 8.0%at least 7%, and require a minimum Tier 1 leverage ratio of 4.0%.
The Basel III Capital Rules became effective for the Company and the Bank on January 1, 2015 (subject to a phase-in period for the capital conservation buffer discussed below). Quantitative measures established by the Basel III Capital Rules to ensure capital adequacy require the maintenance of minimum amounts and ratios (set forth in the table below) of Common Equity Tier 1 capital, Tier 1 capital and Total capital (as defined in the regulations) to risk-weighted assets (as defined), and of Tier 1 capital to adjusted quarterly average assets (as defined).
When fully phased in on January 1, 2019, the Basel III Capital Rules will require the Company and the Bank to maintain: (i) a minimum ratio of Common Equity(ii) Tier 1 capital to risk-weighted assets of at least 4.5%8.5%, plus a 2.5% “capital conservation buffer” (which is added to the 4.5% Common Equity Tier 1 capital ratio as that buffer is phased in, effectively resulting in a minimum ratio of Common Equity Tier 1and (iii) total capital to risk-weighted assets of at least 7.0% upon full implementation), (ii) a minimum ratio of Tier 1 capital to risk-weighted assets of at least 6.0%, plus the capital conservation buffer (which is added to the 6.0% Tier 1 capital ratio as that buffer is phased in, effectively resulting in a minimum Tier 1 capital ratio of 8.5% upon full implementation), (iii) a minimum ratio of Total capital (that is, Tier 1 plus Tier 2) to risk-weighted assets of at least 8.0%, plus the capital conservation buffer (which is added to the 8.0% total capital ratio as that buffer is phased in, effectively resulting in a minimum total capital ratio of 10.5% upon full implementation), and (iv) a minimum leverage ratio of 4.0%, calculated as the ratio of Tier 1 capital to average quarterly assets.10.5%.
The implementation of the capital conservation buffer began on January 1, 2016 at the 0.625% level and will be phased in over a four-year period (increasing by that amount on each subsequent January 1, until it reaches 2.5% on January 1, 2019). The capital conservation buffer is designed to absorb losses during periods of economic stress and, as detailed above, effectively increases the minimum required risk-weighted capital ratios. Banking institutions with a ratio of Common Equity Tier 1 capital to risk-weighted assets below the effective minimum (4.5% plus the capital conservation buffer) will face constraints on dividends, equity repurchases and compensation based on the amount of the shortfall.
Management believes that as of December 31, 20172023 and 2016,2022, the Company and the Bank met all applicable minimum capital requirements and were considered “well-capitalized” by both the FRBFederal Reserve Board and the FDIC. There have been no events or conditions since
The Company adopted ASU 2016-13 on January 1, 2020. The joint federal bank regulatory agencies issued an interim final rule that allows banking organizations to phase-in the endeffects of the year that management believes would have changedCECL accounting standard in their regulatory capital, over a three-year period from January 1, 2022 through December 31, 2024. The Company did not elect to delay the Company’s oradoption of CECL and did not adopt the Bank’s category.transition period for regulatory capital.
The Company’s and the Bank’s actual and required capital measures were as follows:
|
| Actual |
|
| Minimum Capital |
|
| Minimum To Be |
| |||||||||||||||
|
| Amount |
|
| Ratio |
|
| Amount |
|
| Ratio |
|
| Amount |
|
| Ratio |
| ||||||
|
| (dollars in thousands) |
| |||||||||||||||||||||
At December 31, 2023 |
|
|
|
|
|
|
|
|
|
|
|
|
|
|
|
|
|
| ||||||
Cambridge Bancorp: |
|
|
|
|
|
|
|
|
|
|
|
|
|
|
|
|
|
| ||||||
Total capital (to risk-weighted assets) |
| $ | 521,903 |
|
|
| 14.1 | % |
| $ | 387,763 |
|
|
| 10.5 | % |
| N/A |
|
| N/A |
| ||
Tier 1 capital (to risk-weighted assets) |
|
| 481,198 |
|
|
| 13.0 | % |
|
| 313,903 |
|
|
| 8.5 | % |
| N/A |
|
| N/A |
| ||
Common equity tier I capital (to risk-weighted assets) |
|
| 481,198 |
|
|
| 13.0 | % |
|
| 258,508 |
|
|
| 7.0 | % |
| N/A |
|
| N/A |
| ||
Tier 1 capital (to average assets) |
|
| 481,198 |
|
|
| 8.9 | % |
|
| 216,281 |
|
|
| 4.0 | % |
| N/A |
|
| N/A |
| ||
Cambridge Trust Company: |
|
|
|
|
|
|
|
|
|
|
|
|
|
|
|
|
|
| ||||||
Total capital (to risk-weighted assets) |
| $ | 500,355 |
|
|
| 13.6 | % |
| $ | 387,727 |
|
|
| 10.5 | % |
| $ | 369,264 |
|
|
| 10.0 | % |
Tier 1 capital (to risk-weighted assets) |
|
| 459,650 |
|
|
| 12.5 | % |
|
| 313,874 |
|
|
| 8.5 | % |
|
| 295,411 |
|
|
| 8.0 | % |
Common equity tier I capital (to risk-weighted assets) |
|
| 459,650 |
|
|
| 12.5 | % |
|
| 258,485 |
|
|
| 7.0 | % |
|
| 240,022 |
|
|
| 6.5 | % |
Tier 1 capital (to average assets) |
|
| 459,650 |
|
|
| 8.5 | % |
|
| 216,268 |
|
|
| 4.0 | % |
|
| 270,335 |
|
|
| 5.0 | % |
|
| Actual |
|
| Minimum Capital Required For Capital Adequacy |
|
| Minimum Capital Required For Capital Adequacy Plus Capital Conservation Buffer Basel III Phase-In Schedule |
|
| Minimum Capital Required For Capital Adequacy Plus Capital Conservation Buffer Basel III Fully Phased In |
|
| Minimum To Be Well-Capitalized Under Prompt Corrective Action Provisions |
| |||||||||||||||||||||||||
|
| Amount |
|
| Ratio |
|
| Amount |
|
| Ratio |
|
| Amount |
|
| Ratio |
|
| Amount |
|
| Ratio |
|
| Amount |
|
| Ratio |
| ||||||||||
|
| (dollars in thousands) |
| |||||||||||||||||||||||||||||||||||||
At December 31, 2017 |
|
|
|
|
|
|
|
|
|
|
|
|
|
|
|
|
|
|
|
|
|
|
|
|
|
|
|
|
|
|
|
|
|
|
|
|
|
|
|
|
Cambridge Bancorp: |
|
|
|
|
|
|
|
|
|
|
|
|
|
|
|
|
|
|
|
|
|
|
|
|
|
|
|
|
|
|
|
|
|
|
|
|
|
|
|
|
Total capital (to risk-weighted assets) |
| $ | 168,615 |
|
|
| 13.7 | % |
| $ | 98,136 |
|
|
| 8.0 | % |
| $ | 113,470 |
|
|
| 9.25 | % |
| $ | 128,804 |
|
|
| 10.5 | % |
| N/A |
|
| N/A |
| ||
Tier I capital (to risk-weighted assets) |
|
| 153,281 |
|
|
| 12.5 | % |
|
| 73,602 |
|
|
| 6.0 | % |
|
| 88,936 |
|
|
| 7.25 | % |
|
| 104,270 |
|
|
| 8.5 | % |
| N/A |
|
| N/A |
| ||
Common equity tier I capital (to risk-weighted assets) |
|
| 153,281 |
|
|
| 12.5 | % |
|
| 55,202 |
|
|
| 4.5 | % |
|
| 70,535 |
|
|
| 5.75 | % |
|
| 85,869 |
|
|
| 7.0 | % |
| N/A |
|
| N/A |
| ||
Tier I capital (to average assets) |
|
| 153,281 |
|
|
| 8.1 | % |
|
| 76,026 |
|
|
| 4.0 | % |
|
| 76,026 |
|
|
| 4.00 | % |
|
| 76,026 |
|
|
| 4.0 | % |
| N/A |
|
| N/A |
| ||
Cambridge Trust Company: |
|
|
|
|
|
|
|
|
|
|
|
|
|
|
|
|
|
|
|
|
|
|
|
|
|
|
|
|
|
|
|
|
|
|
|
|
|
|
|
|
Total capital (to risk-weighted assets) |
| $ | 164,880 |
|
|
| 13.4 | % |
| $ | 98,136 |
|
|
| 8.0 | % |
| $ | 113,470 |
|
|
| 9.25 | % |
| $ | 128,804 |
|
|
| 10.5 | % |
| $ | 122,670 |
|
|
| 10.0 | % |
Tier I capital (to risk-weighted assets) |
|
| 149,546 |
|
|
| 12.2 | % |
|
| 73,602 |
|
|
| 6.0 | % |
|
| 88,936 |
|
|
| 7.25 | % |
|
| 104,270 |
|
|
| 8.5 | % |
|
| 98,136 |
|
|
| 8.0 | % |
Common equity tier I capital (to risk-weighted assets) |
|
| 149,546 |
|
|
| 12.2 | % |
|
| 55,202 |
|
|
| 4.5 | % |
|
| 70,535 |
|
|
| 5.75 | % |
|
| 85,869 |
|
|
| 7.0 | % |
|
| 79,736 |
|
|
| 6.5 | % |
Tier I capital (to average assets) |
|
| 149,546 |
|
|
| 7.9 | % |
|
| 76,026 |
|
|
| 4.0 | % |
|
| 76,026 |
|
|
| 4.00 | % |
|
| 76,026 |
|
|
| 4.0 | % |
|
| 95,033 |
|
|
| 5.0 | % |
|
|
|
|
|
|
|
|
|
|
|
|
|
|
|
|
|
|
|
|
|
|
|
|
|
|
|
|
|
|
|
|
|
|
|
|
|
|
|
|
|
At December 31, 2016 |
|
|
|
|
|
|
|
|
|
|
|
|
|
|
|
|
|
|
|
|
|
|
|
|
|
|
|
|
|
|
|
|
|
|
|
|
|
|
|
|
Cambridge Bancorp: |
|
|
|
|
|
|
|
|
|
|
|
|
|
|
|
|
|
|
|
|
|
|
|
|
|
|
|
|
|
|
|
|
|
|
|
|
|
|
|
|
Total capital (to risk-weighted assets) |
| $ | 159,141 |
|
|
| 13.1 | % |
| $ | 96,873 |
|
|
| 8.0 | % |
| $ | 104,441 |
|
|
| 8.625 | % |
| $ | 127,145 |
|
|
| 10.5 | % |
| N/A |
|
| N/A |
| ||
Tier I capital (to risk-weighted assets) |
|
| 144,003 |
|
|
| 11.9 | % |
|
| 72,654 |
|
|
| 6.0 | % |
|
| 80,223 |
|
|
| 6.625 | % |
|
| 102,927 |
|
|
| 8.5 | % |
| N/A |
|
| N/A |
| ||
Common equity tier I capital (to risk-weighted assets) |
|
| 144,003 |
|
|
| 11.9 | % |
|
| 54,491 |
|
|
| 4.5 | % |
|
| 62,059 |
|
|
| 5.125 | % |
|
| 84,763 |
|
|
| 7.0 | % |
| N/A |
|
| N/A |
| ||
Tier I capital (to average assets) |
|
| 144,003 |
|
|
| 7.9 | % |
|
| 72,488 |
|
|
| 4.0 | % |
|
| 72,488 |
|
|
| 4.000 | % |
|
| 72,488 |
|
|
| 4.0 | % |
| N/A |
|
| N/A |
| ||
Cambridge Trust Company: |
|
|
|
|
|
|
|
|
|
|
|
|
|
|
|
|
|
|
|
|
|
|
|
|
|
|
|
|
|
|
|
|
|
|
|
|
|
|
|
|
Total capital (to risk-weighted assets) |
| $ | 156,928 |
|
|
| 13.0 | % |
| $ | 96,873 |
|
|
| 8.0 | % |
| $ | 104,441 |
|
|
| 8.625 | % |
| $ | 127,145 |
|
|
| 10.5 | % |
| $ | 121,091 |
|
|
| 10.0 | % |
Tier I capital (to risk-weighted assets) |
|
| 141,790 |
|
|
| 11.7 | % |
|
| 72,654 |
|
|
| 6.0 | % |
|
| 80,223 |
|
|
| 6.625 | % |
|
| 102,927 |
|
|
| 8.5 | % |
|
| 96,873 |
|
|
| 8.0 | % |
Common equity tier I capital (to risk-weighted assets) |
|
| 141,790 |
|
|
| 11.7 | % |
|
| 54,491 |
|
|
| 4.5 | % |
|
| 62,059 |
|
|
| 5.125 | % |
|
| 84,763 |
|
|
| 7.0 | % |
|
| 78,709 |
|
|
| 6.5 | % |
Tier I capital (to average assets) |
|
| 141,790 |
|
|
| 7.8 | % |
|
| 72,488 |
|
|
| 4.0 | % |
|
| 72,488 |
|
|
| 4.000 | % |
|
| 72,488 |
|
|
| 4.0 | % |
|
| 90,610 |
|
|
| 5.0 | % |
92
|
| Actual |
|
| Minimum Capital |
|
| Minimum To Be |
| |||||||||||||||
|
| Amount |
|
| Ratio |
|
| Amount |
|
| Ratio |
|
| Amount |
|
| Ratio |
| ||||||
|
| (dollars in thousands) |
| |||||||||||||||||||||
At December 31, 2022 |
|
|
|
|
|
|
|
|
|
|
|
|
|
|
|
|
|
| ||||||
Cambridge Bancorp: |
|
|
|
|
|
|
|
|
|
|
|
|
|
|
|
|
|
| ||||||
Total capital (to risk-weighted assets) |
| $ | 506,239 |
|
|
| 13.5 | % |
| $ | 393,285 |
|
|
| 10.5 | % |
| N/A |
|
| N/A |
| ||
Tier 1 capital (to risk-weighted assets) |
|
| 466,369 |
|
|
| 12.5 | % |
|
| 318,373 |
|
|
| 8.5 | % |
| N/A |
|
| N/A |
| ||
Common equity tier I capital (to risk-weighted assets) |
|
| 466,369 |
|
|
| 12.5 | % |
|
| 262,190 |
|
|
| 7.0 | % |
| N/A |
|
| N/A |
| ||
Tier 1 capital (to average assets) |
|
| 466,369 |
|
|
| 8.5 | % |
|
| 219,309 |
|
|
| 4.0 | % |
| N/A |
|
| N/A |
| ||
Cambridge Trust Company: |
|
|
|
|
|
|
|
|
|
|
|
|
|
|
|
|
|
| ||||||
Total capital (to risk-weighted assets) |
| $ | 490,175 |
|
|
| 13.1 | % |
| $ | 393,246 |
|
|
| 10.5 | % |
| $ | 374,520 |
|
|
| 10.0 | % |
Tier 1 capital (to risk-weighted assets) |
|
| 450,305 |
|
|
| 12.0 | % |
|
| 318,342 |
|
|
| 8.5 | % |
|
| 299,616 |
|
|
| 8.0 | % |
Common equity tier I capital (to risk-weighted assets) |
|
| 450,305 |
|
|
| 12.0 | % |
|
| 262,164 |
|
|
| 7.0 | % |
|
| 243,438 |
|
|
| 6.5 | % |
Tier 1 capital (to average assets) |
|
| 450,305 |
|
|
| 8.2 | % |
|
| 219,296 |
|
|
| 4.0 | % |
|
| 274,120 |
|
|
| 5.0 | % |
|
|
The components of other income were as follows:
|
| For the Year Ended December 31, |
| |||||||||
|
| 2017 |
|
| 2016 |
|
| 2015 |
| |||
|
| (dollars in thousands) |
| |||||||||
Safe deposit box income |
| $ | 348 |
|
| $ | 366 |
|
| $ | 342 |
|
Loan fee income |
|
| 473 |
|
|
| 229 |
|
|
| 248 |
|
Miscellaneous income |
|
| 334 |
|
|
| 326 |
|
|
| 291 |
|
Total other income |
| $ | 1,155 |
|
| $ | 921 |
|
| $ | 881 |
|
The components of other operating expenses were as follows:
|
| For the Year Ended December 31, |
| |||||||||
|
| 2017 |
|
| 2016 |
|
| 2015 |
| |||
|
| (dollars in thousands) |
| |||||||||
Director fees |
| $ | 576 |
|
| $ | 513 |
|
| $ | 561 |
|
Contributions / Public relations |
|
| 432 |
|
|
| 434 |
|
|
| 517 |
|
Printing and supplies |
|
| 251 |
|
|
| 291 |
|
|
| 341 |
|
Travel and entertainment |
|
| 339 |
|
|
| 331 |
|
|
| 302 |
|
Dues and memberships |
|
| 260 |
|
|
| 276 |
|
|
| 286 |
|
Physical security |
|
| 172 |
|
|
| 233 |
|
|
| 282 |
|
Postage and mailing |
|
| 229 |
|
|
| 241 |
|
|
| 264 |
|
Miscellaneous expense |
|
| 633 |
|
|
| 613 |
|
|
| 476 |
|
Total other operating expenses |
| $ | 2,892 |
|
| $ | 2,932 |
|
| $ | 3,029 |
|
|
|
Comprehensive income (loss) is defined as all changes to shareholders’ equity except investments by and distributions to shareholders. Net income is a component of comprehensive income (loss), with all other components referred to in the aggregate as “other comprehensive income.income (loss).” The Company’s other comprehensive income (loss) consists of unrealized gains or losses on securities held at year-end classified as available for sale, cash flow hedges, and the component of the unfunded retirement liability computed in accordance with the requirements of ASC Topic 715, “Compensation – Retirement Benefits.” The before-tax and after-tax amount of each of these categories, as well as the tax (expense)/benefit of each, is summarized as follows:
|
| For the Year Ended |
|
| For the Year Ended |
|
| For the Year Ended |
| |||||||||||||||||||||||||||
|
| Before |
|
| Tax |
|
| Net-of- |
|
| Before |
|
| Tax |
|
| Net-of- |
|
| Before |
|
| Tax |
|
| Net-of- |
| |||||||||
|
|
|
|
| (dollars in thousands) |
|
|
|
| |||||||||||||||||||||||||||
Available for sale securities |
|
|
|
|
|
|
|
|
|
|
|
|
|
|
|
|
|
|
|
|
|
|
|
|
|
|
| |||||||||
Unrealized holding gains (losses) |
| $ | 3,073 |
|
| $ | (737 | ) |
| $ | 2,336 |
|
| $ | (25,144 | ) |
| $ | 6,408 |
|
| $ | (18,736 | ) |
| $ | (6,245 | ) |
| $ | 1,623 |
|
| $ | (4,622 | ) |
Reclassification adjustment for (gains) losses realized in net income (1) |
|
| — |
|
|
| — |
|
|
| — |
|
|
| — |
|
|
| — |
|
|
| — |
|
|
| — |
|
|
| — |
|
|
| — |
|
Interest rate swaps designated as cash flow hedges |
|
|
|
|
|
|
|
|
|
|
|
|
|
|
|
|
|
|
|
|
|
|
|
|
|
|
| |||||||||
Unrealized holding gains (losses) |
|
| (687 | ) |
|
| 192 |
|
|
| (495 | ) |
|
| (2,170 | ) |
|
| 607 |
|
|
| (1,563 | ) |
|
| (1,329 | ) |
|
| 370 |
|
|
| (959 | ) |
Reclassification adjustment for (gains) losses recognized in net income (2) |
|
| 539 |
|
|
| (150 | ) |
|
| 389 |
|
|
| (832 | ) |
|
| 232 |
|
|
| (600 | ) |
|
| (2,587 | ) |
|
| 723 |
|
|
| (1,864 | ) |
Defined benefit retirement plans |
|
|
|
|
|
|
|
|
|
|
|
|
|
|
|
|
|
|
|
|
|
|
|
|
|
|
| |||||||||
Net change in retirement liability |
|
| 1,186 |
|
|
| (331 | ) |
|
| 855 |
|
|
| 1,818 |
|
|
| (508 | ) |
|
| 1,310 |
|
|
| 5,273 |
|
|
| (1,472 | ) |
|
| 3,801 |
|
Total other comprehensive income (loss) |
| $ | 4,111 |
|
| $ | (1,026 | ) |
| $ | 3,085 |
|
| $ | (26,328 | ) |
| $ | 6,739 |
|
| $ | (19,589 | ) |
| $ | (4,888 | ) |
| $ | 1,244 |
|
| $ | (3,644 | ) |
(1) Reported in gain (loss) on disposition of investment securities line item in the Consolidated Statements of Income.
(2) Reported in interest on payable loans line item in the Consolidated Statements of Income.
|
| For the Year Ended December 31, 2017 |
|
| For the Year Ended December 31, 2016 |
|
| For the Year Ended December 31, 2015 |
| |||||||||||||||||||||||||||
|
| Before Tax Amount |
|
| Tax (Expense) or Benefit |
|
| Net-of-tax Amount |
|
| Before Tax Amount |
|
| Tax (Expense) or Benefit |
|
| Net-of-tax Amount |
|
| Before Tax Amount |
|
| Tax (Expense) or Benefit |
|
| Net-of-tax Amount |
| |||||||||
|
|
|
|
| (dollars in thousands) |
|
|
|
| |||||||||||||||||||||||||||
Unrealized gains/(losses) on available for sale securities |
|
|
|
|
|
|
|
|
|
|
|
|
|
|
|
|
|
|
|
|
|
|
|
|
|
|
|
|
|
|
|
|
|
|
|
|
Unrealized holding gains/(losses) arising during the period |
| $ | 187 |
|
| $ | (59 | ) |
| $ | 128 |
|
| $ | (1,224 | ) |
| $ | 489 |
|
| $ | (735 | ) |
| $ | (1,504 | ) |
| $ | 524 |
|
| $ | (980 | ) |
Reclassification adjustment for losses/(gains) recognized in net income |
|
| 3 |
|
|
| (2 | ) |
|
| 1 |
|
|
| (438 | ) |
|
| 157 |
|
|
| (281 | ) |
|
| (690 | ) |
|
| 247 |
|
|
| (443 | ) |
Defined benefit retirement plans |
|
|
|
|
|
|
|
|
|
|
|
|
|
|
|
|
|
|
|
|
|
|
|
|
|
|
|
|
|
|
|
|
|
|
|
|
Net change in retirement liability |
|
| 6,545 |
|
|
| (2,674 | ) |
|
| 3,871 |
|
|
| (738 | ) |
|
| 301 |
|
|
| (437 | ) |
|
| 67 |
|
|
| (27 | ) |
|
| 40 |
|
Total Other Comprehensive Income/(Loss) |
| $ | 6,735 |
|
| $ | (2,735 | ) |
| $ | 4,000 |
|
| $ | (2,400 | ) |
| $ | 947 |
|
| $ | (1,453 | ) |
| $ | (2,127 | ) |
| $ | 744 |
|
| $ | (1,383 | ) |
The components of accumulated other comprehensive income are as follows:
| For the Year Ended |
|
| For the Year Ended |
| ||||||||||||||||||
| Before Tax Amount |
|
| Deferred (tax) benefit |
|
| Net-of-tax Amount |
|
| Before Tax Amount |
|
| Deferred (tax) benefit |
|
| Net-of-tax Amount |
| ||||||
| (dollars in thousands) |
| |||||||||||||||||||||
Available for sale securities | $ | (25,538 | ) |
| $ | 6,651 |
|
| $ | (18,887 | ) |
| $ | (28,611 | ) |
| $ | 7,390 |
|
| $ | (21,221 | ) |
Interest Rate swaps designated as cash flow hedges |
| (157 | ) |
|
| 44 |
|
|
| (113 | ) |
|
| (14 | ) |
|
| 4 |
|
|
| (10 | ) |
Defined benefit retirement plans |
| 1,785 |
|
|
| (499 | ) |
|
| 1,286 |
|
|
| 600 |
|
|
| (168 | ) |
|
| 432 |
|
Total accumulated other comprehensive income | $ | (23,910 | ) |
| $ | 6,196 |
|
| $ | (17,714 | ) |
| $ | (28,025 | ) |
| $ | 7,226 |
|
| $ | (20,799 | ) |
Reclassifications out of Accumulated Other Comprehensive Income (“AOCI”) are presented below:
|
| For the Year Ended December 31, |
|
|
| |||||||||
Details about Accumulated Other Comprehensive Income (Loss) Components |
| 2017 |
|
| 2016 |
|
| 2015 |
|
| Affected Line Item in the Statement where Net Income is Presented | |||
|
| (dollars in thousands) |
|
|
| |||||||||
Unrealized gains and losses on available for sale securities |
| $ | (3 | ) |
| $ | 438 |
|
| $ | 690 |
|
| (Loss) gain on disposition of investment securities |
Tax benefit or (expense) |
|
| 2 |
|
|
| (157 | ) |
|
| (247 | ) |
| Provision for income taxes |
Net of tax |
| $ | (1 | ) |
| $ | 281 |
|
| $ | 443 |
|
| Net income |
93
The following represents a reconciliation between basic and diluted earnings per share:
|
|
| For the Year Ended December 31, |
| |||||||||
|
|
| 2023 |
|
| 2022 |
|
| 2021 |
| |||
|
| (dollars in thousands, except per share data) |
| ||||||||||
Earnings per common share - basic: |
|
|
|
|
|
|
|
|
|
| |||
Numerator: |
|
|
|
|
|
|
|
|
|
| |||
Net income |
|
| $ | 34,109 |
|
| $ | 52,909 |
|
| $ | 54,024 |
|
Less dividends and undistributed earnings allocated |
|
|
| (31 | ) |
|
| (257 | ) |
|
| (250 | ) |
Net income applicable to common shareholders |
|
| $ | 34,078 |
|
| $ | 52,652 |
|
| $ | 53,774 |
|
|
|
|
|
|
|
|
|
|
|
| |||
Denominator: |
|
|
|
|
|
|
|
|
|
| |||
Weighted average common shares outstanding |
|
|
| 7,828 |
|
|
| 7,163 |
|
|
| 6,926 |
|
Earnings per common share - basic |
|
| $ | 4.35 |
|
| $ | 7.35 |
|
| $ | 7.76 |
|
|
|
|
|
|
|
|
|
|
|
| |||
Earnings per common share - diluted: |
|
|
|
|
|
|
|
|
|
| |||
Numerator: |
|
|
|
|
|
|
|
|
|
| |||
Net income |
|
| $ | 34,109 |
|
| $ | 52,909 |
|
| $ | 54,024 |
|
Less dividends and undistributed earnings allocated |
|
|
| (31 | ) |
|
| (257 | ) |
|
| (250 | ) |
Net income applicable to common shareholders |
|
| $ | 34,078 |
|
| $ | 52,652 |
|
| $ | 53,774 |
|
|
|
|
|
|
|
|
|
|
|
| |||
Denominator: |
|
|
|
|
|
|
|
|
|
| |||
Weighted average common shares outstanding |
|
|
| 7,828 |
|
|
| 7,163 |
|
|
| 6,926 |
|
Dilutive effect of common stock equivalents |
|
|
| 15 |
|
|
| 51 |
|
|
| 65 |
|
Weighted average diluted common shares outstanding |
|
|
| 7,843 |
|
|
| 7,214 |
|
|
| 6,991 |
|
Earnings per common share - diluted |
|
| $ | 4.34 |
|
| $ | 7.30 |
|
| $ | 7.69 |
|
|
| For the Year Ended December 31, |
| |||||||||
|
| 2017 |
|
| 2016 |
|
| 2015 |
| |||
|
| (dollars in thousands, except per share data) |
| |||||||||
Earnings per common share - basic: |
|
|
|
|
|
|
|
|
|
|
|
|
Numerator: |
|
|
|
|
|
|
|
|
|
|
|
|
Net income |
| $ | 14,816 |
|
| $ | 16,896 |
|
| $ | 15,694 |
|
Less dividends and undistributed earnings allocated to participating securities |
|
| (157 | ) |
|
| (182 | ) |
|
| (182 | ) |
Net income applicable to common shareholders |
| $ | 14,659 |
|
| $ | 16,714 |
|
| $ | 15,512 |
|
|
|
|
|
|
|
|
|
|
|
|
|
|
Denominator: |
|
|
|
|
|
|
|
|
|
|
|
|
Weighted average common shares outstanding |
|
| 4,031 |
|
|
| 3,990 |
|
|
| 3,938 |
|
Earnings per common share - basic |
| $ | 3.64 |
|
| $ | 4.19 |
|
| $ | 3.94 |
|
|
|
|
|
|
|
|
|
|
|
|
|
|
Earnings per common share - diluted: |
|
|
|
|
|
|
|
|
|
|
|
|
Numerator: |
|
|
|
|
|
|
|
|
|
|
|
|
Net income |
| $ | 14,816 |
|
| $ | 16,896 |
|
| $ | 15,694 |
|
Less dividends and undistributed earnings allocated to participating securities |
|
| (157 | ) |
|
| (181 | ) |
|
| — |
|
Net income applicable to common shareholders |
| $ | 14,659 |
|
| $ | 16,715 |
|
| $ | 15,694 |
|
|
|
|
|
|
|
|
|
|
|
|
|
|
Denominator: |
|
|
|
|
|
|
|
|
|
|
|
|
Weighted average common shares outstanding |
|
| 4,031 |
|
|
| 3,990 |
|
|
| 3,938 |
|
Dilutive effect of common stock equivalents |
|
| 35 |
|
|
| 39 |
|
|
| 56 |
|
Weighted average diluted common shares outstanding |
|
| 4,066 |
|
|
| 4,029 |
|
|
| 3,994 |
|
Earnings per common share - diluted |
| $ | 3.61 |
|
| $ | 4.15 |
|
| $ | 3.93 |
|
|
|
The Company utilizes interest rate swaps and floors to mitigate exposure to interest rate risk and to facilitate the needs of its clients. The Company’s derivative financial instruments are used to manage differences in the amount, timing, and duration of the Company’s known or expected cash receipts principally related to the Company’s assets.
The Company is exposed to certain risk arising from both its business operations and economic conditions. The Company principally manages its exposures to a wide variety of business and operational risks through management of its core business activities. The Company manages economic risks, including interest rate, liquidity, and credit risk primarily by managing the amount, sources, and duration of its assets and liabilities and the use of derivative financial instruments. Specifically, the Company enters into derivative financial instruments to manage exposures that arise from business activities that result in the receipt or payment of future known and uncertain cash amounts, the value of which are determined by interest rates. The Company’s existing credit derivatives result from loan participation arrangements, therefore, are not used to manage interest rate risk in the Company’s assets or liabilities.
Cash Flow Hedges of Interest Rate Risk
The Company’s objectives in using interest rate derivatives are to accommodateadd stability to interest income and to manage its exposure to interest rate movements. To accomplish this objective, the business requirementsCompany primarily uses interest rate floors as part of its customers. Derivativesinterest rate risk management strategy. Interest rate floors designated as cash flow hedges involve the receipt of variable-rate amounts from a counterparty if interest rates fall below the strike rate on the contract in exchange for an up-front premium. During 2023, such derivatives were used to hedge the variable cash flows associated with variable-rate assets.
94
For derivatives designated and that qualify as cash flow hedges of interest rate risk, the gain or loss on the derivative is recorded in AOCI and AOCL and subsequently reclassified into interest income in the same period(s) during which the hedged transaction affects earnings. Gains and losses on the derivative representing hedge components excluded from the assessment of effectiveness are recognized over the life of the hedge on a systematic and rational basis. The earnings recognition of excluded components is presented in interest income. Amounts reported in AOCI and AOCL related to derivatives will be reclassified to interest income as either assets or liabilitiesinterest payments are received on the balance sheet and are measured at fair value. Company’s variable-rate assets.
During fiscal year 2024, the Company estimates that $391,000 will be reclassified out of AOCI into earnings, as a decrease to interest income.
Fair Value Hedges of Interest Rate Risk
The accounting forCompany is exposed to changes in the fair value of certain pools of fixed-rate assets due to changes in benchmark interest rates. The Company uses interest rate swaps to manage its exposure to changes in fair value on these instruments attributable to changes in the designated benchmark interest rate. The Company’s interest rate swaps designated as fair value hedges involve the payment of fixed-rate amounts to a counterparty in exchange for the Company receiving variable-rate payments over the life of the agreements without the exchange of the underlying notional amount.
For derivatives dependsdesignated and that qualify as fair value hedges, the gain or loss on the intended usederivative as well as the offsetting loss or gain on the hedged item attributable to the hedged risk are recognized in interest income.
The Company recorded the following amounts on the balance sheet related to cumulative basis adjustment for fair value hedges:
Line Item in the Statement of Financial Position in Which the Hedged Item is Included | Carrying Amount of the Hedged Assets/(Liabilities) |
|
| Cumulative Amount of Fair Value Hedging Adjustment Included in the Carrying Amount of the Hedged Assets/(Liabilities) |
| ||||||||
| December 31, 2023 |
| December 31, 2022 |
|
| December 31, 2023 |
| December 31, 2022 |
| ||||
| (dollars in thousands) |
| |||||||||||
Fixed rate loans | $ | 498,825 |
| $ | — |
|
| $ | 1,175 |
| $ | — |
|
Total | $ | 498,825 |
| $ | — |
|
| $ | 1,175 |
| $ | — |
|
These amounts include the amortized cost basis of closed portfolios of fixed rate residential loans used to designate hedging relationships in which the hedged item is the stated amount of assets in the closed portfolio anticipated to be outstanding for the designated hedged period. At December 31, 2023, the amortized cost basis of the derivativeclosed portfolios used in these hedging relationships was $681.1 million; the cumulative basis adjustments associated with these hedging relationships was $1.2 million; and resulting designation.the notional amount of the designated hedged items were $500.0 million. The Company had no fair value hedges at December 31, 2022. The notional amounts of these agreements do not represent amounts exchanged by the parties and, thus, are not a measure of the potential loss exposure. At December 31, 2023, the Company’s fair value hedges had a weighted average remaining maturity of 1.28 years, and a weighted average fixed rate of 4.16%.
Derivatives not designated as hedging instruments
Derivatives not designated as hedges are not speculative and result from a service the Company provides to certain clients. For the Company’s clients, these are interest rate swaps and risk participation agreements.
Interest Rate Swaps
Swaps. The Company has enteredenters into interest rate swap contracts to help commercial loan borrowers manage their interestrate risk. The interest rate swap contracts with commercial loan borrowers allow them to convert floating-rate loan payments to fixed-rate fixed rateloan payments. When the BankCompany enters into an interest rate swap contract with a commercial loan borrower, it simultaneouslyenters into a “mirror” swap contract with a third party. The third party exchanges the client’s fixed‑rateborrower’s fixed-rate loan payments for floating-rateloan payments. As of December 31, 2017 and 2016, the Bank had interest rate swap contracts with commercial loan borrowers with notional amounts of $74.8 million and $68.4 million, respectively, and equal amounts of “mirror” swap contracts with third-party financial institutions. These derivatives are not designated as hedges and therefore, changes in fair value are recognized in earnings. Becausethese derivatives have mirror-image contractual terms, the changes in fair value substantially offset each other through earnings. Feesearned in connection with the execution of derivatives related to this program are recognized in earnings through other loan relatedderivative income.
The credit risk associated with swap transactions is the risk of default by the counterparty. To minimize this risk, the Company only enters into interest rate agreements only with highly rated counterparties that management believes to be creditworthy. The notional amounts of these agreements do not represent amounts exchanged by the parties and, thus, are not a measure of the potential loss exposure.
Risk Participation Agreements
Agreements.The Company has enteredenters into risk participation agreements (“RPAs”) with other banks participating in commercial loan arrangements. Participating banks guarantee the performance on borrower-related interest rate swap contracts. RPAs are derivative financial instruments and are recorded at fair value. These derivatives are not designated as hedges and therefore, changes in fair value are recognized in earnings with a corresponding offset within other liabilities.earnings.
95
Under a risk participation-out agreement, a derivative asset, the Company participates out a portion of the credit risk associated with the interest rate swap position executed with the commercial borrower, forand pays a fee paid to the participating bank. Under a risk participation-in agreement, a derivative liability, the Company assumes, or participates in, a portion of the credit risk associated with the interest rate swap position with the commercial borrower forand receives a fee received from the other bank.
As of December 31, 2017,The following tables present the notional amounts ofamount, the risk participation-in agreementslocation, and risk participation-out agreements were $38.5 million and $0, respectively.
The following table presents the fair values of derivative instruments in the Company’s Consolidated consolidated balance sheets:
|
| December 31, 2023 |
| |||||||||||||||||
|
| Derivative Assets |
|
| Derivative Liabilities |
| ||||||||||||||
|
| Notional Amount |
|
| Balance Sheet |
| Fair Value |
|
| Notional Amount |
|
| Balance Sheet |
| Fair Value |
| ||||
|
| (dollars in thousands) |
|
| (dollars in thousands) |
| ||||||||||||||
Derivatives designated as hedging instruments |
|
|
|
|
|
|
|
|
|
|
|
|
|
| ||||||
Interest rate contracts-cash flow hedging relationships |
| $ | 100,000 |
|
| Other Assets |
| $ | 1,284 |
|
| $ | — |
|
| Other Liabilities |
| $ | — |
|
Interest rate contracts-fair value hedging relationships |
|
| 400,000 |
|
| Other Assets |
|
| 1,620 |
|
|
| 100,000 |
|
| Other Liabilities |
|
| 485 |
|
Total derivatives designated as hedging instruments |
|
|
|
|
|
| $ | 2,904 |
|
|
|
|
|
|
| $ | 485 |
| ||
Derivatives not designated as hedging instruments |
|
|
|
|
|
|
|
|
|
|
|
|
|
| ||||||
Loan related derivative contracts |
|
|
|
|
|
|
|
|
|
|
|
|
|
|
|
| ||||
Interest rate contracts |
| $ | 486,310 |
|
| Other Assets |
| $ | 40,338 |
|
| $ | 486,310 |
|
| Other Liabilities |
| $ | 40,338 |
|
Risk participation agreements-out to counterparties |
|
| 53,847 |
|
| Other Assets |
|
| 18 |
|
|
| — |
|
| Other Liabilities |
|
| — |
|
Risk participation agreements-in with counterparties |
|
| — |
|
| Other Assets |
|
| — |
|
|
| 98,779 |
|
| Other Liabilities |
|
| 62 |
|
Total derivatives not designated as hedging instruments |
|
|
|
|
|
| $ | 40,356 |
|
|
|
|
|
|
| $ | 40,400 |
| ||
|
| December 31, 2022 |
| |||||||||||||||||
|
| Derivative Assets |
|
| Derivative Liabilities |
| ||||||||||||||
|
| Notional Amount |
|
| Balance Sheet |
| Fair Value |
|
| Notional Amount |
|
| Balance Sheet |
| Fair Value |
| ||||
|
| (dollars in thousands) |
|
| (dollars in thousands) |
| ||||||||||||||
Derivatives designated as hedging instruments |
|
|
|
|
|
|
|
|
|
|
|
|
|
| ||||||
Interest rate contracts-cash flow hedging relationships |
| $ | 250,000 |
|
| Other Assets |
| $ | 1,966 |
|
| $ | — |
|
| Other Liabilities |
| $ | — |
|
Total derivatives designated as hedging instruments |
|
|
|
|
|
| $ | 1,966 |
|
|
|
|
|
|
| $ | — |
| ||
Derivatives not designated as hedging instruments |
|
|
|
|
|
|
|
|
|
|
|
|
|
|
|
| ||||
Loan related derivative contracts |
|
|
|
|
|
|
|
|
|
|
|
|
|
| ||||||
Interest rate contracts |
| $ | 499,619 |
|
| Other Assets |
| $ | 50,784 |
|
| $ | 499,619 |
|
| Other Liabilities |
| $ | 50,784 |
|
Risk participation agreements-out to counterparties |
|
| 46,604 |
|
| Other Assets |
|
| 23 |
|
|
| — |
|
| Other Liabilities |
|
| — |
|
Risk participation agreements-in with counterparties |
|
| — |
|
| Other Assets |
|
| — |
|
|
| 71,046 |
|
| Other Liabilities |
|
| 43 |
|
Total derivatives not designated as hedging instruments |
|
|
|
|
|
| $ | 50,807 |
|
|
|
|
|
|
| $ | 50,827 |
| ||
The following tables present the changes to AOCI and AOCL as a result of cash flow hedge accounting as of the periods presented:
|
| Twelve Months Ended December 31, 2023 |
| |||||||||||||||||||||||
|
| Amount of Gain or (Loss) Recognized in OCI |
|
| Amount of Gain or (Loss) Recognized in OCI Included Component |
|
| Amount of Gain or (Loss) Recognized in OCI Excluded Component |
|
| Location of Gain or (Loss) |
| Amount of Gain or (Loss) Reclassified from AOCL into Income |
|
| Amount of Gain or (Loss) Reclassified from AOCL into Income Included Component |
|
| Amount of Gain or (Loss) Reclassified from AOCL into Income Excluded Component |
| ||||||
|
| (dollars in thousands) |
|
|
|
| (dollars in thousands) |
| ||||||||||||||||||
Interest rate contracts |
| $ | (687 | ) |
| $ | — |
|
| $ | (687 | ) |
| Interest Income |
| $ | (539 | ) |
| $ | (96 | ) |
| $ | (443 | ) |
96
|
| Twelve Months Ended December 31, 2022 |
| |||||||||||||||||||||||
|
| Amount of Gain or (Loss) Recognized in OCI |
|
| Amount of Gain or (Loss) Recognized in OCI - Included Component |
|
| Amount of Gain or (Loss) Recognized in OCI - Excluded Component |
|
| Location of Gain or (Loss) |
| Amount of Gain or (Loss) Reclassified from AOCI into Income |
|
| Amount of Gain or (Loss) Reclassified from AOCI into Income Included Component |
|
| Amount of Gain or (Loss) Reclassified from AOCI into Income Excluded Component |
| ||||||
|
| (dollars in thousands) |
|
|
|
| (dollars in thousands) |
| ||||||||||||||||||
Interest rate contracts |
| $ | (2,170 | ) |
| $ | 607 |
|
| $ | (1,563 | ) |
| Interest Income |
| $ | 832 |
|
| $ | 1,026 |
|
| $ | (194 | ) |
The following table presents the effect of the Company’s derivative financial instruments that are not designated as hedging instruments on the consolidated statements of incomeas of the periods presented:
|
|
|
| Amount of Gain or (Loss) Recognized in Income |
| |||||||||
|
|
|
| For the Year Ended December 31, |
| |||||||||
|
|
|
| 2023 |
|
| 2022 |
|
| 2021 |
| |||
|
| Location of Gain or (Loss) |
| (dollars in thousands) |
| |||||||||
Other contracts |
| Loan-related derivative income |
| $ | (86 | ) |
| $ | (166 | ) |
| $ | (124 | ) |
Credit-risk-related Contingent Features
By entering into derivative transactions, the Company is exposed to credit risk to the extent that counterparties to the derivative contracts do not perform as required. Should a counterparty fail to perform under the terms of a derivative contract, the Company’s credit exposure on interest rate swaps is limited to the net positive fair value and accrued interest of all swaps with each counterparty. The Company seeks to minimize counterparty credit risk through credit approvals, limits, monitoring procedures, and obtaining collateral, where appropriate. Institutional counterparties must have an investment grade credit rating and be approved by the Company’s Board of Directors. As such, management believes the risk of incurring credit losses on derivative contracts with institutional counterparties is remote.
The Company has agreements with its derivative counterparties that contain a provision where if the Company defaults on any of its indebtedness, including default where repayment of the indebtedness has not been accelerated by the lender, then the Company could also be declared in default on its derivative obligations. In addition, the Company also has agreements with certain of its derivative counterparties that contain a provision where if the Company fails to maintain its status as a well- capitalized institution, then the counterparty could terminate the derivative position(s) and the Company would be required to settle its obligations under the agreements.
Balance Sheets:Sheet Offsetting
Certain financial instruments may be eligible for offset in the consolidated balance sheet and/or subject to master netting arrangements or similar agreements. The Company’s derivative transactions with institutional counterparties are generally executed under International Swaps and Derivative Association (“ISDA”) master agreements which include “right of set-off” provisions. In such cases there is generally a legally enforceable right to offset recognized amounts and there may be an intention to settle such amounts on a net basis. Generally, the Company does not offset such financial instruments for financial reporting purposes.
|
|
|
| Derivative Assets |
|
|
|
| Derivative Liabilities |
| ||||||||||
|
| Balance Sheet Location |
| December 31, 2017 |
|
| December 31, 2016 |
|
| Balance Sheet Location |
| December 31, 2017 |
|
| December 31, 2016 |
| ||||
|
|
|
| (dollars in thousands) |
|
|
|
| (dollars in thousands) |
| ||||||||||
Derivatives not Designated as Hedging Instruments |
|
|
|
|
|
|
| |||||||||||||
Loan related derivative contracts |
|
|
|
|
|
|
|
|
|
|
|
|
|
|
|
|
|
|
|
|
Interest rate swaps with customers |
| Other Assets |
| $ | 1,859 |
|
| $ | 1,632 |
|
| Other Liabilities |
| $ | — |
|
| $ | — |
|
Mirror swaps with counterparties |
| Other Assets |
|
| — |
|
|
| — |
|
| Other Liabilities |
|
| 1,859 |
|
|
| 1,632 |
|
Risk participation agreements |
| Other Assets |
|
| — |
|
|
| — |
|
| Other Liabilities |
|
| 81 |
|
|
| 12 |
|
Total |
|
|
| $ | 1,859 |
|
| $ | 1,632 |
|
|
|
| $ | 1,940 |
|
| $ | 1,644 |
|
97
The following tables present the information about financial instruments that are eligible for offset in the consolidated balance sheets as of December 31, 2023 and December 31, 2022:
|
|
|
| Gross Amounts Not Offset |
|
|
|
| ||||||||||||||||
|
| Gross Amounts Recognized |
|
| Gross Amounts Offset |
|
| Net Amounts Recognized |
|
| Financial Instruments |
|
| Collateral Pledged (Received) |
|
| Net Amount |
| ||||||
|
| December 31, 2023 |
| |||||||||||||||||||||
| (dollars in thousands) |
| ||||||||||||||||||||||
Offsetting of Derivative Assets |
|
|
|
|
|
|
|
|
|
|
|
|
|
|
|
|
|
| ||||||
Derivative Assets |
| $ | 43,260 |
|
| $ | — |
|
| $ | 43,260 |
|
| $ | 971 |
|
| $ | (41,319 | ) |
| $ | 970 |
|
|
|
|
|
|
|
|
|
|
|
|
|
|
|
|
|
|
|
| ||||||
Offsetting of Derivative Liabilities |
|
|
|
|
|
|
|
|
|
|
|
|
|
|
|
|
|
| ||||||
Derivative Liabilities |
| $ | 40,885 |
|
| $ | — |
|
| $ | 40,885 |
|
| $ | 971 |
|
| $ | — |
|
| $ | 39,914 |
|
|
|
|
|
|
|
|
|
| ||||||||||||||||
|
|
|
| Gross Amounts Not Offset |
|
|
|
| ||||||||||||||||
|
| Gross Amounts Recognized |
|
| Gross Amounts Offset |
|
| Net Amounts Recognized |
|
| Financial Instruments |
|
| Collateral Pledged (Received) |
|
| Net Amount |
| ||||||
|
| December 31, 2022 |
| |||||||||||||||||||||
| (dollars in thousands) |
| ||||||||||||||||||||||
Offsetting of Derivative Assets |
|
|
|
|
|
|
|
|
|
|
|
|
|
|
|
|
|
| ||||||
Derivative Assets |
| $ | 52,773 |
|
| $ | — |
|
| $ | 52,773 |
|
| $ | 48 |
|
| $ | (52,130 | ) |
| $ | 595 |
|
|
|
|
|
|
|
|
|
|
|
|
|
|
|
|
|
|
|
| ||||||
Offsetting of Derivative Liabilities |
|
|
|
|
|
|
|
|
|
|
|
|
|
|
|
|
|
| ||||||
Derivative Liabilities |
| $ | 50,827 |
|
| $ | — |
|
| $ | 50,827 |
|
| $ | 48 |
|
| $ | — |
|
| $ | 50,875 |
|
At December 31, 2023 and December 31, 2022, there were no derivatives in a net liability position related to these financial instruments.
| 22. FAIR VALUE MEASUREMENTS |
The following is a summary of the carrying values and estimated fair values of the Company’s significant financial instruments as of the dates indicated:
|
| December 31, 2023 |
|
| December 31, 2022 |
| ||||||||||
|
| Carrying |
|
| Estimated |
|
| Carrying |
|
| Estimated |
| ||||
|
| (dollars in thousands) |
| |||||||||||||
Financial assets |
|
|
|
|
|
|
|
|
|
|
|
| ||||
Cash and cash equivalents |
| $ | 33,004 |
|
| $ | 33,004 |
|
| $ | 30,719 |
|
| $ | 30,719 |
|
Securities available for sale |
|
| 137,838 |
|
|
| 137,838 |
|
|
| 153,416 |
|
|
| 153,416 |
|
Securities held to maturity |
|
| 959,332 |
|
|
| 805,428 |
|
|
| 1,051,997 |
|
|
| 885,586 |
|
Loans, net |
|
| 3,982,600 |
|
|
| 3,530,958 |
|
|
| 4,025,082 |
|
|
| 3,783,051 |
|
FHLB of Boston stock |
|
| 19,056 |
|
|
| 19,056 |
|
|
| 6,264 |
|
|
| 6,264 |
|
Accrued interest receivable |
|
| 15,765 |
|
|
| 15,765 |
|
|
| 14,118 |
|
|
| 14,118 |
|
Mortgage servicing rights |
|
| 1,470 |
|
|
| 2,401 |
|
|
| 1,665 |
|
|
| 2,336 |
|
Interest rate contracts - cash flow hedge |
|
| 1,284 |
|
|
| 1,284 |
|
|
| 1,966 |
|
|
| 1,966 |
|
Interest rate contracts - fair value hedge |
|
| 1,620 |
|
|
| 1,620 |
|
|
| — |
|
|
| — |
|
Loan level interest rate swaps |
|
| 40,338 |
|
|
| 40,338 |
|
|
| 50,784 |
|
|
| 50,784 |
|
Risk participation agreements out to counterparties |
|
| 18 |
|
|
| 18 |
|
|
| 23 |
|
|
| 23 |
|
|
|
|
|
|
|
|
|
|
|
|
|
| ||||
Financial liabilities |
|
|
|
|
|
|
|
|
|
|
|
| ||||
Deposits, excluding wholesale deposits |
|
| 4,029,511 |
|
|
| 4,026,404 |
|
|
| 4,433,817 |
|
|
| 4,429,190 |
|
Wholesale deposits |
|
| 291,667 |
|
|
| 291,748 |
|
|
| 381,559 |
|
|
| 381,505 |
|
Borrowings |
|
| 452,155 |
|
|
| 451,492 |
|
|
| 105,212 |
|
|
| 105,202 |
|
Interest rate contracts - fair value hedge |
|
| 485 |
|
|
| 485 |
|
|
| — |
|
|
| — |
|
Loan level interest rate swaps |
|
| 40,338 |
|
|
| 40,338 |
|
|
| 50,784 |
|
|
| 50,784 |
|
Risk participation agreements in with counterparties |
|
| 62 |
|
|
| 62 |
|
|
| 43 |
|
|
| 43 |
|
|
| December 31, 2017 |
|
| December 31, 2016 |
| ||||||||||
|
| Carrying Value |
|
| Estimated Fair Value |
|
| Carrying Value |
|
| Estimated Fair Value |
| ||||
|
| (dollars in thousands) |
| |||||||||||||
Financial assets |
|
|
|
|
|
|
|
|
|
|
|
|
|
|
|
|
Cash and cash equivalents |
| $ | 103,591 |
|
| $ | 103,591 |
|
| $ | 54,050 |
|
| $ | 54,050 |
|
Securities available for sale |
|
| 205,017 |
|
|
| 205,017 |
|
|
| 325,641 |
|
|
| 325,641 |
|
Securities held to maturity |
|
| 232,188 |
|
|
| 233,554 |
|
|
| 82,502 |
|
|
| 83,755 |
|
Loans, net |
|
| 1,335,579 |
|
|
| 1,304,719 |
|
|
| 1,304,893 |
|
|
| 1,286,497 |
|
Loans held for sale |
|
| — |
|
|
| — |
|
|
| 6,506 |
|
|
| 6,506 |
|
FHLB Boston stock |
|
| 4,242 |
|
|
| 4,242 |
|
|
| 4,098 |
|
|
| 4,098 |
|
Bank owned life insurance |
|
| 31,083 |
|
|
| 31,083 |
|
|
| 30,499 |
|
|
| 30,499 |
|
Accrued interest receivable |
|
| 5,128 |
|
|
| 5,128 |
|
|
| 4,627 |
|
|
| 4,627 |
|
Mortgage servicing rights |
|
| 793 |
|
|
| 1,049 |
|
|
| 812 |
|
|
| 1,032 |
|
Loan level interest rate swaps |
|
| 1,859 |
|
|
| 1,859 |
|
|
| 1,632 |
|
|
| 1,632 |
|
|
|
|
|
|
|
|
|
|
|
|
|
|
|
|
|
|
Financial liabilities |
|
|
|
|
|
|
|
|
|
|
|
|
|
|
|
|
Deposits |
|
| 1,775,400 |
|
|
| 1,772,838 |
|
|
| 1,686,038 |
|
|
| 1,684,065 |
|
Short-term borrowings |
|
| — |
|
|
| — |
|
|
| — |
|
|
| — |
|
Long-term borrowings |
|
| 3,579 |
|
|
| 3,559 |
|
|
| 3,746 |
|
|
| 3,745 |
|
Loan level interest rate swaps |
|
| 1,859 |
|
|
| 1,859 |
|
|
| 1,632 |
|
|
| 1,632 |
|
Risk participation agreements |
|
| 81 |
|
|
| 81 |
|
|
| 12 |
|
|
| 12 |
|
98
The Company follows ASC Topic 820, “Fair Value Measurements and Disclosures” (“ASC 820”), for financial assets and liabilities. ASC Topic 820 defines fair value, establishes a framework for measuring fair value, and expands disclosure requirements about fair value measurements. ASC Topic 820, among other things, emphasizes that fair value is a market-based measurement, not an entity-specific measurement, and states that a fair value measurement should be determined based on the assumptions the market participants would use in pricing the asset or liability. In addition, ASC Topic 820 specifies a hierarchy of valuationsvaluation techniques based on whether the types of valuation information (“inputs”) are observable or unobservable. Observable inputs reflect market data obtained from independent sources, while unobservable inputs reflect the Company’s market assumptions. These two types of inputs have created the following fair value hierarchy:
Level 1 – Quoted prices for identical assets or liabilities in active markets.
Level 2 – Quoted prices for similar assets or liabilities in active markets; quoted prices for identical or similar assets or liabilities in inactive markets; and model-derived valuations in which all significant inputs and significant value drivers are observable in active markets.
Level 3 – Valuations derived from techniques in which one or more significant inputs or significant value drivers are unobservable in the markets and which reflect the Company’s market assumptions.
Under ASC Topic 820, fair values are based on the price that would be received to sell an asset or paid to transfer a liability in an orderly transaction between market participants at the measurement date. When available, the Company uses quoted market prices to determine fair value. If quoted prices are not available, fair value is based upon valuation techniques, such as matrix pricing or other models that use, where possible, current market-based or independently sourced market parameters, such as interest rates. If observable market-based inputs are not available, the Company uses unobservable inputs to determine appropriate valuation adjustments using methodologies applied consistently over time.
Valuation techniques based on unobservable inputs are highly subjective and require judgments regarding significant matters, such as the amount and timing of future cash flows and the selection of discount rates that may appropriately reflect market and credit risks.
Changes in these judgments often have a material impact on the fair value estimates. In addition, since these estimates are as of a specific point in time, they are susceptible to material near-term changes. The fair values disclosed do not reflect any premium or discount that could result from offering significant holdings of financial instruments at bulk sale, nor do they reflect the possible tax ramifications or estimated transaction costs. Changes in economic conditions may also dramatically affect the estimated fair values.
The Company uses fair value measurements to record fair value adjustments to certain assets and liabilities and to determine fair value disclosures. Securities available for sale, and derivative instruments, and hedges are recorded at fair value on a recurring basis. Additionally, from time to time, the Company may be required to record at fair value other assets on a nonrecurring basis, such as loans held for sale, mortgage servicing rights, other real estate owned, and individually evaluated collateral dependent impaired loans. The Company uses an exit price notion for its fair value disclosures.
The following tables summarize certain assets reported at fair value on a recurring basis:
|
| Fair Value as of December 31, 2023 |
| |||||||||||||
|
| Level 1 |
|
| Level 2 |
|
| Level 3 |
|
| Total |
| ||||
|
| (dollars in thousands) |
| |||||||||||||
Measured on a recurring basis |
|
|
|
|
|
|
|
|
|
|
|
| ||||
Securities available for sale |
|
|
|
|
|
|
|
|
|
|
|
| ||||
U.S. GSE obligations |
| $ | — |
|
| $ | 20,462 |
|
| $ | — |
|
| $ | 20,462 |
|
Mortgage-backed securities |
|
| — |
|
|
| 117,376 |
|
|
| — |
|
|
| 117,376 |
|
Other assets |
|
|
|
|
|
|
|
|
|
|
|
| ||||
Interest rate swaps with clients |
|
| — |
|
|
| 40,338 |
|
|
| — |
|
|
| 40,338 |
|
Risk participation agreements -out to counterparties |
|
| — |
|
|
| 18 |
|
|
| — |
|
|
| 18 |
|
Interest rate contracts - cash flow hedge |
|
| — |
|
|
| 1,284 |
|
|
| — |
|
|
| 1,284 |
|
Interest rate contracts - fair value hedge |
|
| — |
|
|
| 1,620 |
|
|
| — |
|
|
| 1,620 |
|
Other liabilities |
|
|
|
|
|
|
|
|
|
|
|
| ||||
Interest rate swaps with counterparties |
|
| — |
|
|
| 40,338 |
|
|
| — |
|
|
| 40,338 |
|
Risk participation agreements-in with counterparties |
|
| — |
|
|
| 62 |
|
|
| — |
|
|
| 62 |
|
Interest rate contracts - fair value hedge |
|
| — |
|
|
| 485 |
|
|
| — |
|
|
| 485 |
|
|
| Fair Value as of December 31, 2017 |
| |||||||||||||
|
| Level 1 |
|
| Level 2 |
|
| Level 3 |
|
| Total |
| ||||
|
| (dollars in thousands) |
| |||||||||||||
Measured on a recurring basis |
|
|
|
|
|
|
|
|
|
|
|
|
|
|
|
|
Securities available for sale |
|
|
|
|
|
|
|
|
|
|
|
|
|
|
|
|
U.S. GSE obligations |
| $ | — |
|
| $ | 88,791 |
|
| $ | — |
|
| $ | 88,791 |
|
Mortgage-backed securities |
|
| — |
|
|
| 110,626 |
|
|
| — |
|
|
| 110,626 |
|
Corporate debt securities |
|
| — |
|
|
| 5,001 |
|
|
| — |
|
|
| 5,001 |
|
Mutual funds |
|
| 599 |
|
|
| — |
|
|
| — |
|
|
| 599 |
|
Other assets |
|
|
|
|
|
|
|
|
|
|
|
|
|
|
|
|
Interest rate swaps with customers |
|
| — |
|
|
| 1,859 |
|
|
| — |
|
|
| 1,859 |
|
Other liabilities |
|
|
|
|
|
|
|
|
|
|
|
|
|
|
|
|
Mirror swaps with counterparties |
|
| — |
|
|
| 1,859 |
|
|
| — |
|
|
| 1,859 |
|
Risk participation agreements |
|
| — |
|
|
| 81 |
|
|
| — |
|
|
| 81 |
|
99
|
| Fair Value as of December 31, 2022 |
| |||||||||||||
|
| Level 1 |
|
| Level 2 |
|
| Level 3 |
|
| Total |
| ||||
|
| (dollars in thousands) |
| |||||||||||||
Measured on a recurring basis |
|
|
|
|
|
|
|
|
|
|
|
| ||||
Securities available for sale |
|
|
|
|
|
|
|
|
|
|
|
| ||||
U.S. GSE obligations |
| $ | — |
|
| $ | 19,733 |
|
| $ | — |
|
| $ | 19,733 |
|
Mortgage-backed securities |
|
| — |
|
|
| 132,683 |
|
|
| — |
|
|
| 132,683 |
|
Corporate debt securities |
|
| — |
|
|
| 1,000 |
|
|
| — |
|
|
| 1,000 |
|
Other assets |
|
|
|
|
|
|
|
|
|
|
|
| ||||
Interest rate swaps with clients |
|
| — |
|
|
| 50,784 |
|
|
| — |
|
|
| 50,784 |
|
Risk participation agreements-out to counterparties |
|
| — |
|
|
| 23 |
|
|
| — |
|
|
| 23 |
|
Interest rate contracts |
|
| — |
|
|
| 1,966 |
|
|
| — |
|
|
| 1,966 |
|
Other liabilities |
|
|
|
|
|
|
|
|
|
|
|
| ||||
Interest rate swaps with counterparties |
|
| — |
|
|
| 50,784 |
|
|
| — |
|
|
| 50,784 |
|
Risk participation agreements-in with counterparties |
|
| — |
|
|
| 43 |
|
|
| — |
|
|
| 43 |
|
| Fair Value as of December 31, 2016 |
| ||||||||||||||
|
| Level 1 |
|
| Level 2 |
|
| Level 3 |
|
| Total |
| ||||
|
| (dollars in thousands) |
| |||||||||||||
Measured on a recurring basis |
|
|
|
|
|
|
|
|
|
|
|
|
|
|
|
|
Securities available for sale |
|
|
|
|
|
|
|
|
|
|
|
|
|
|
|
|
U.S. GSE obligations |
| $ | — |
|
| $ | 138,709 |
|
| $ | — |
|
| $ | 138,709 |
|
Mortgage-backed securities |
|
| — |
|
|
| 181,299 |
|
|
| — |
|
|
| 181,299 |
|
Corporate debt securities |
|
| — |
|
|
| 5,029 |
|
|
| — |
|
|
| 5,029 |
|
Mutual funds |
|
| 604 |
|
|
| — |
|
|
| — |
|
|
| 604 |
|
Other assets |
|
|
|
|
|
|
|
|
|
|
|
|
|
|
|
|
Interest rate swaps with customers |
|
| — |
|
|
| 1,632 |
|
|
| — |
|
|
| 1,632 |
|
Other liabilities |
|
|
|
|
|
|
|
|
|
|
|
|
|
|
|
|
Mirror swaps with counterparties |
|
| — |
|
|
| 1,632 |
|
|
| — |
|
|
| 1,632 |
|
Risk participation agreements |
|
| — |
|
|
| 12 |
|
|
| — |
|
|
| 12 |
|
There were no assets measured at fair value on a non-recurring basis during the year ended December 31, 2017.
The following table presents the carrying value of assets held at December 31, 2016,2023 and December 31, 2022, which were measured at fair value on a non-recurring basis duringbasis:
|
| December 31, 2023 |
| |||||||||||||
|
| Level 1 |
|
| Level 2 |
|
| Level 3 |
|
| Total |
| ||||
|
| (dollars in thousands) |
| |||||||||||||
Items recorded at fair value on a non-recurring basis |
|
|
|
|
|
|
|
|
|
|
|
| ||||
Assets |
|
|
|
|
|
|
|
|
|
|
|
| ||||
Individually evaluated collateral dependent loans |
| $ | — |
|
| $ | — |
|
| $ | 9,675 |
|
| $ | 9,675 |
|
Total |
| $ | — |
|
| $ | — |
|
| $ | 9,675 |
|
| $ | 9,675 |
|
|
| December 31, 2022 |
| |||||||||||||
|
| Level 1 |
|
| Level 2 |
|
| Level 3 |
|
| Total |
| ||||
|
| (dollars in thousands) |
| |||||||||||||
Items recorded at fair value on a non-recurring basis |
|
|
|
|
|
|
|
|
|
|
|
| ||||
Assets |
|
|
|
|
|
|
|
|
|
|
|
| ||||
Individually evaluated collateral dependent loans |
| $ | — |
|
| $ | — |
|
| $ | 103 |
|
| $ | 103 |
|
Total |
| $ | — |
|
| $ | — |
|
| $ | 103 |
|
| $ | 103 |
|
Individually evaluated collateral dependent loans. Collateral dependent loans are carried at the year ended December 31, 2016:lower of cost or fair value of the collateral less estimated costs to sell which approximates fair value. The Company uses the appraisal value of the collateral and applies certain adjustments depending on the nature, quality, and type of collateral securing the loan.
|
| December 31, 2016 |
| |||||||||||||
|
| Level 1 |
|
| Level 2 |
|
| Level 3 |
|
| Total |
| ||||
|
| (dollars in thousands) |
| |||||||||||||
Items recorded at fair value on a nonrecurring basis |
|
|
|
|
|
|
|
|
|
|
|
|
|
|
|
|
Assets |
|
|
|
|
|
|
|
|
|
|
|
|
|
|
|
|
Collateral dependent impaired loans |
| $ | — |
|
| $ | — |
|
| $ | 654 |
|
| $ | 654 |
|
Loans held for sale |
|
| — |
|
|
| — |
|
|
| 6,506 |
|
|
| 6,506 |
|
Total |
| $ | — |
|
| $ | — |
|
| $ | 7,160 |
|
| $ | 7,160 |
|
There were no transfers between fair value levels for the years ended December 31, 20172023 and 2016.2022.
The following is a description of the principal valuation methodologies used by the Company to estimate the fair values of its financial instruments.
Investment Securities
For investment securities, fair values are primarily based upon valuations obtained from a national pricing service which uses matrix pricing with inputs that are observable in the market or can be derived from, or corroborated by, observable market data. When available, quoted prices in active markets for identical securities are utilized.
Loans Held for Sale
For loans held for sale, fair values are estimated using projected future cash flows, discounted at rates based upon either trades of similar loans or mortgage-backed securities, or at current rates at which similar loans would be made to borrowers with similar credit ratings and for similar remaining maturities.
100
Loans
Loans
For most categories of loans, fair values are estimated using projected future cash flows, discounted at rates based upon either trades of similar loans or mortgage-backed securities, or at current rates at which similar loans would be made to borrowers with similar credit ratings, and for similar remaining maturities. Projected estimated cash flows are adjusted for prepayment assumptions, liquidity premium assumptions, and credit loss assumptions. Loans that are deemed to be impaired in accordance with ASC Topic 310, “Receivables”, are valued based upon the lower of cost or fair value of the underlying collateral.
FHLB of Boston Stock
The fair value of FHLB of Boston stock equals its carrying value since such stock is only redeemable at its par value.
Deposits
The fair value of non-maturity deposit accounts is the amount payable on demand at the reporting date. This amount does not take into account the value of the Bank’sCompany’s long-term relationships with core depositors. The fair value of fixed-maturity certificates of deposit is estimated using a replacement cost of funds approach and is based upon rates currently offered for deposits of similar remaining maturities.
Long-Term Borrowings
For long-term borrowings, fair values are estimated using future cash flows, discounted at rates based upon current costs for debt securities with similar terms and remaining maturities.
Other Financial Assets and Liabilities
Cash and cash equivalents, accrued interest receivable, and short-term borrowings have fair values which approximate their respective carrying values because these instruments are payable on demand or have short-term maturities and present relatively low credit risk and interest rate risk.
Derivative Instruments and Hedges
The valuation of these instruments is determined using widely accepted valuation techniques including discounted cash flow analysis on the expected cash flows of each derivative. This analysis reflects the contractual terms of the derivatives, including the period to maturity, and uses observable market-based inputs, including interest rate curves and implied volatilities. The BankCompany incorporates credit valuation adjustments to appropriately reflect nonperformance risk in the fair value measurements. In adjusting the fair value of its derivative contracts for the effect of nonperformance risk, the BankCompany has considered the impact of netting and any applicable credit enhancements, such as collateral postings.
Off-Balance-Sheet Financial Instruments
In the course of originating loans and extending credit, the BankCompany will charge fees in exchange for its commitment. While these commitment fees have value, the BankCompany has not estimated their value due to the short-term nature of the underlying commitments and their immateriality.
Values Not Determined
In accordance with ASC Topic 820, the Company has not estimated fair values for non-financial assets such as banking premises and equipment, goodwill, the intangible value of the Bank’sCompany’s portfolio of loans serviced for itself, and the intangible value inherent in the Bank’sCompany’s deposit relationships (i.e., core deposits), among others. Accordingly, the aggregate fair value amounts presented do not represent the underlying value of the Company.
23. Condensed Financial Statements of Parent Company
2017 Quarters |
| Fourth |
|
| Third |
|
| Second |
|
| First |
| ||||
|
| (dollars in thousands, except share data) |
| |||||||||||||
Interest and Dividend Income |
| $ | 15,744 |
|
| $ | 15,673 |
|
| $ | 15,101 |
|
| $ | 14,673 |
|
Interest Expense |
|
| 970 |
|
|
| 1,034 |
|
|
| 871 |
|
|
| 712 |
|
Net Interest and Dividend Income |
|
| 14,774 |
|
|
| 14,639 |
|
|
| 14,230 |
|
|
| 13,961 |
|
Provision for Loan Losses |
|
| 2 |
|
|
| 310 |
|
|
| 20 |
|
|
| 30 |
|
Net Interest and Dividend Income after Provision for Loan Losses |
|
| 14,772 |
|
|
| 14,329 |
|
|
| 14,210 |
|
|
| 13,931 |
|
Noninterest Income |
|
| 7,575 |
|
|
| 7,977 |
|
|
| 7,345 |
|
|
| 7,327 |
|
Noninterest Expense |
|
| 15,012 |
|
|
| 14,602 |
|
|
| 14,732 |
|
|
| 14,946 |
|
Income Before Taxes |
|
| 7,335 |
|
|
| 7,704 |
|
|
| 6,823 |
|
|
| 6,312 |
|
Income Taxes |
|
| 6,371 |
|
|
| 2,694 |
|
|
| 2,309 |
|
|
| 1,984 |
|
Net Income |
| $ | 964 |
|
| $ | 5,010 |
|
| $ | 4,514 |
|
| $ | 4,328 |
|
Share Data: |
|
|
|
|
|
|
|
|
|
|
|
|
|
|
|
|
Average Shares Outstanding, Basic |
|
| 4,038,948 |
|
|
| 4,037,026 |
|
|
| 4,034,397 |
|
|
| 4,011,925 |
|
Average Shares Outstanding, Diluted |
|
| 4,073,707 |
|
|
| 4,070,332 |
|
|
| 4,068,360 |
|
|
| 4,050,791 |
|
Basic Earnings Per Share |
| $ | 0.24 |
|
| $ | 1.23 |
|
| $ | 1.11 |
|
| $ | 1.07 |
|
Diluted Earnings Per Share |
| $ | 0.23 |
|
| $ | 1.22 |
|
| $ | 1.10 |
|
| $ | 1.06 |
|
2016 Quarters |
| Fourth |
|
| Third |
|
| Second |
|
| First |
| ||||
|
| (dollars in thousands, except share data) |
| |||||||||||||
Interest and Dividend Income |
| $ | 14,663 |
|
| $ | 14,315 |
|
| $ | 13,989 |
|
| $ | 14,061 |
|
Interest Expense |
|
| 763 |
|
|
| 795 |
|
|
| 872 |
|
|
| 925 |
|
Net Interest and Dividend Income |
|
| 13,900 |
|
|
| 13,520 |
|
|
| 13,117 |
|
|
| 13,136 |
|
Provision for (Release of) Loan Losses |
|
| (206 | ) |
|
| 113 |
|
|
| 150 |
|
|
| 75 |
|
Net Interest and Dividend Income after Provision for Loan Losses |
|
| 14,106 |
|
|
| 13,407 |
|
|
| 12,967 |
|
|
| 13,061 |
|
Noninterest Income |
|
| 7,278 |
|
|
| 7,615 |
|
|
| 7,100 |
|
|
| 6,668 |
|
Noninterest Expense |
|
| 14,595 |
|
|
| 14,163 |
|
|
| 14,001 |
|
|
| 13,991 |
|
Income Before Taxes |
|
| 6,789 |
|
|
| 6,859 |
|
|
| 6,066 |
|
|
| 5,738 |
|
Income Taxes |
|
| 2,366 |
|
|
| 2,284 |
|
|
| 2,046 |
|
|
| 1,860 |
|
Net Income |
| $ | 4,423 |
|
| $ | 4,575 |
|
| $ | 4,020 |
|
| $ | 3,878 |
|
Share Data: |
|
|
|
|
|
|
|
|
|
|
|
|
|
|
|
|
Average Shares Outstanding, Basic |
|
| 3,995,495 |
|
|
| 3,996,687 |
|
|
| 3,987,696 |
|
|
| 3,963,504 |
|
Average Shares Outstanding, Diluted |
|
| 4,034,687 |
|
|
| 4,043,651 |
|
|
| 4,037,522 |
|
|
| 4,005,954 |
|
Basic Earnings Per Share |
| $ | 1.10 |
|
| $ | 1.13 |
|
| $ | 1.00 |
|
| $ | 0.97 |
|
Diluted Earnings Per Share |
| $ | 1.08 |
|
| $ | 1.13 |
|
| $ | 1.00 |
|
| $ | 0.97 |
|
The condensed balance sheets of Cambridge Bancorp, the Parent Company, as of December 31, 2017 2023and 2016December 31, 2022 and the condensed statements of income and cash flows for each of the years in the three-year period ended December 31, 2017,2023 are presented below. The statements of changes in shareholders’ equity are identical to the consolidated statements of changes in shareholders’ equity and are therefore not presented here.
101
Condensed Balance Sheet
|
| December 31, |
| |||||
|
| 2023 |
|
| 2022 |
| ||
|
| (dollars in thousands) |
| |||||
ASSETS |
|
|
|
|
|
| ||
Cash and cash equivalents |
| $ | 21,212 |
|
| $ | 15,747 |
|
Goodwill |
|
| 33 |
|
|
| 33 |
|
Other assets |
|
| 337 |
|
|
| 318 |
|
Investment in subsidiary |
|
| 512,991 |
|
|
| 501,454 |
|
Total assets |
| $ | 534,573 |
|
| $ | 517,552 |
|
SHAREHOLDERS’ EQUITY |
|
|
|
|
|
| ||
Shareholders’ equity |
| $ | 534,573 |
|
| $ | 517,552 |
|
Total shareholders’ equity |
| $ | 534,573 |
|
| $ | 517,552 |
|
|
| December 31, |
| |||||
|
| 2017 |
|
| 2016 |
| ||
|
| (dollars in thousands) |
| |||||
ASSETS |
|
|
|
|
|
|
|
|
Cash |
| $ | 3,735 |
|
| $ | 2,213 |
|
Investment in subsidiary, at equity |
|
| 144,222 |
|
|
| 132,458 |
|
Total assets |
| $ | 147,957 |
|
| $ | 134,671 |
|
SHAREHOLDERS’ EQUITY |
|
|
|
|
|
|
|
|
Shareholders’ equity |
| $ | 147,957 |
|
| $ | 134,671 |
|
Total shareholders’ equity |
| $ | 147,957 |
|
| $ | 134,671 |
|
Condensed Statements of Income
|
| For the Year Ended December 31, |
| |||||||||
|
| 2023 |
|
| 2022 |
|
| 2021 |
| |||
|
| (dollars in thousands) |
| |||||||||
Income |
|
|
|
|
|
|
|
|
| |||
Dividends from subsidiary |
| $ | 27,320 |
|
| $ | 24,734 |
|
| $ | 25,995 |
|
Total income |
|
| 27,320 |
|
|
| 24,734 |
|
|
| 25,995 |
|
Expenses |
|
|
|
|
|
|
|
|
| |||
Interest expense |
|
| — |
|
|
| — |
|
|
| — |
|
Other expenses |
|
| 158 |
|
|
| 148 |
|
|
| 150 |
|
Total expenses |
|
| 158 |
|
|
| 148 |
|
|
| 150 |
|
Income before income taxes and equity in undistributed income of subsidiary |
|
| 27,162 |
|
|
| 24,586 |
|
|
| 25,845 |
|
Income tax benefit |
|
| (43 | ) |
|
| (40 | ) |
|
| (42 | ) |
Income of parent company |
|
| 27,205 |
|
|
| 24,626 |
|
|
| 25,887 |
|
Equity in undistributed income of subsidiary |
|
| 6,904 |
|
|
| 28,283 |
|
|
| 28,137 |
|
Net income |
| $ | 34,109 |
|
| $ | 52,909 |
|
| $ | 54,024 |
|
|
| For the Year Ended December 31, |
| |||||||||
|
| 2017 |
|
| 2016 |
|
| 2015 |
| |||
|
| (dollars in thousands) |
| |||||||||
Income |
|
|
|
|
|
|
|
|
|
|
|
|
Dividends from subsidiary |
| $ | 8,052 |
|
| $ | 3,412 |
|
| $ | 7,845 |
|
Total income |
|
| 8,052 |
|
|
| 3,412 |
|
|
| 7,845 |
|
Income before equity in undistributed income of subsidiary |
|
| 8,052 |
|
|
| 3,412 |
|
|
| 7,845 |
|
Equity in undistributed income of subsidiary |
|
| 6,764 |
|
|
| 13,484 |
|
|
| 7,849 |
|
Net income |
| $ | 14,816 |
|
| $ | 16,896 |
|
| $ | 15,694 |
|
102
Condensed Statements of Cash Flows
|
| For the Year Ended December 31, |
| |||||||||
|
| 2023 |
|
| 2022 |
|
| 2021 |
| |||
|
| (dollars in thousands) |
| |||||||||
CASH FLOWS FROM OPERATING ACTIVITIES: |
|
|
|
|
|
|
|
|
| |||
Net income |
| $ | 34,109 |
|
| $ | 52,909 |
|
| $ | 54,024 |
|
Adjustments to reconcile net income to net cash provided |
|
|
|
|
|
|
|
|
| |||
Deferred income tax benefit |
|
| (43 | ) |
|
| (40 | ) |
|
| (42 | ) |
Change in other assets, net |
|
| 24 |
|
|
| 12 |
|
|
| — |
|
Change in other liabilities, net |
|
| — |
|
|
| — |
|
|
| 13 |
|
Undistributed income of subsidiary |
|
| (6,904 | ) |
|
| (28,283 | ) |
|
| (28,137 | ) |
Net cash provided by operating activities |
|
| 27,186 |
|
|
| 24,598 |
|
|
| 25,858 |
|
CASH FLOWS FROM INVESTING ACTIVITIES: |
|
|
|
|
|
|
|
|
| |||
Net cash used in investing activities |
|
| — |
|
|
| — |
|
|
| — |
|
CASH FLOWS FROM FINANCING ACTIVITIES: |
|
|
|
|
|
|
|
|
| |||
Proceeds from the issuance of common stock |
|
| 599 |
|
|
| 580 |
|
|
| 519 |
|
Repurchase of common stock |
|
| (1,334 | ) |
|
| (1,320 | ) |
|
| (1,440 | ) |
Cash dividends paid on common stock |
|
| (20,986 | ) |
|
| (18,414 | ) |
|
| (16,554 | ) |
Net cash provided by/(used in) financing activities |
|
| (21,721 | ) |
|
| (19,154 | ) |
|
| (17,475 | ) |
Net increase (decrease) in cash |
|
| 5,465 |
|
|
| 5,444 |
|
|
| 8,383 |
|
Cash at beginning of year |
|
| 15,747 |
|
|
| 10,303 |
|
|
| 1,920 |
|
Cash at end of year |
| $ | 21,212 |
|
| $ | 15,747 |
|
| $ | 10,303 |
|
SUPPLEMENTAL DISCLOSURES OF CASH FLOW INFORMATION: |
|
|
|
|
|
|
|
|
| |||
Significant non-cash transactions |
|
|
|
|
|
|
|
|
| |||
Common Stock issued to shareholders due to merger |
| $ | — |
|
| $ | 62,850 |
|
| $ | — |
|
|
| For the Year Ended December 31, |
| |||||||||
|
| 2017 |
|
| 2016 |
|
| 2015 |
| |||
|
| (dollars in thousands) |
| |||||||||
CASH FLOWS FROM OPERATING ACTIVITIES: |
|
|
|
|
|
|
|
|
|
|
|
|
Net income |
| $ | 14,816 |
|
| $ | 16,896 |
|
| $ | 15,694 |
|
Adjustments to reconcile net income to net cash provided by operating activities |
|
|
|
|
|
|
|
|
|
|
|
|
Undistributed income of subsidiary |
|
| (6,764 | ) |
|
| (13,484 | ) |
|
| (7,849 | ) |
Net cash provided by operating activities |
|
| 8,052 |
|
|
| 3,412 |
|
|
| 7,845 |
|
CASH FLOWS FROM BY FINANCING ACTIVITIES: |
|
|
|
|
|
|
|
|
|
|
|
|
Proceeds from the issuance of common stock |
|
| 1,522 |
|
|
| 2,020 |
|
|
| 1,777 |
|
Repurchase of common stock |
|
| (470 | ) |
|
| (1,560 | ) |
|
| (667 | ) |
Cash dividends paid on common stock |
|
| (7,582 | ) |
|
| (7,428 | ) |
|
| (7,178 | ) |
Net cash used in financing activities |
|
| (6,530 | ) |
|
| (6,968 | ) |
|
| (6,068 | ) |
Net increase (decrease) in cash |
|
| 1,522 |
|
|
| (3,556 | ) |
|
| 1,777 |
|
Cash at beginning of year |
|
| 2,213 |
|
|
| 5,769 |
|
|
| 3,992 |
|
Cash at end of year |
| $ | 3,735 |
|
| $ | 2,213 |
|
| $ | 5,769 |
|
103
Report of Independent Registered Public Accounting Firm
To the Shareholders and the Board of Directors of Cambridge Bancorp:
Opinion on the Consolidated Financial Statements
We have audited the accompanying consolidated balance sheets of Cambridge Bancorp and subsidiaries (the Company) as of December 31, 2023, and 2022, the related consolidated statements of income, comprehensive income, changes in shareholders’ equity, and cash flows for each of the years in the three-year period ended December 31, 2023, and the related notes (collectively, “the financial statements”). In our opinion, the financial statements present fairly, in all material respects, the financial position of the Company as of December 31, 2023, and 2022, and the results of its operations and its cash flows for each of the years in the three-year period ended December 31, 2023, in conformity with accounting principles generally accepted in the United States of America.
We have also audited, in accordance with the standards of the Public Company Accounting Oversight Board (United States) (“PCAOB”), the Company’s internal control over financial reporting as of December 31, 2023, based on criteria established in Internal Control - Integrated Framework issued by the Committee of Sponsoring Organizations of the Treadway Commission (“COSO”) in 2013, and our report dated March 12, 2024 expressed an unqualified opinion on the effectiveness of the Company's internal control over financial reporting.
Basis for Opinion
These financial statements are the responsibility of the Company's management. Our responsibility is to express an opinion on the Company’s financial statements based on our audits. We are a public accounting firm registered with the PCAOB and are required to be independent with respect to the Company in accordance with U.S. federal securities laws and the applicable rules and regulations of the Securities and Exchange Commission and the PCAOB.
We conducted our audits in accordance with the standards of the PCAOB. Those standards require that we plan and perform the audits to obtain reasonable assurance about whether the financial statements are free of material misstatement, whether due to error or fraud. Our audits included performing procedures to assess the risks of material misstatement of the financial statements, whether due to error or fraud, and performing procedures that respond to those risks. Such procedures included examining, on a test basis, evidence regarding the amounts and disclosures in the financial statements. Our audits also included evaluating the accounting principles used and significant estimates made by management, as well as evaluating the overall presentation of the financial statements. We believe that our audits provide a reasonable basis for our opinion.
Critical Audit Matter
The critical audit matter communicated below is a matter arising from the current period audit of the financial statements that was communicated or required to be communicated to the Company’s Audit Committee and that: (1) relates to accounts or disclosures that are material to the financial statements and (2) involved our especially challenging, subjective, or complex judgments. The communication of a critical audit matter does not alter in any way our opinion on the financial statements, taken as a whole, and we are not, by communicating the critical audit matter below, providing a separate opinion on the critical audit matter or on the accounts or disclosures to which it relates.
Allowance for Credit Losses– Qualitative Factors and Forecasts
Critical Audit Matter Description
As described in Notes 2 and 7 to the financial statements, the Company has recorded an allowance for credit losses for its loan portfolio in the amount of $38.9 million as of December 31, 2023 representing management’s estimate of credit losses over the remaining expected life of the Company’s loan portfolio as of that date. Management determined this amount, and corresponding provision for credit loss expense, pursuant to the application of Accounting Standards Codification Topic 326, Financial Instruments – Credit Losses.
104
The Company’s methodology to determine its allowance for credit losses incorporates qualitative assessments of its current loan portfolio and economic conditions, and the application of forecasted economic conditions. We determined that performing procedures relating to these components of the Company’s methodology is a critical audit matter.
The principal considerations for our determination are (i) the application of significant judgment and estimation on the part of management, which in turn led to a high degree of auditor judgment and subjectivity in performing procedures and evaluating audit evidence obtained, and (ii) significant audit effort was necessary in evaluating management’s methodology, significant assumptions and calculations.
How the Critical Audit Matter was Addressed in the Audit
Addressing the matter involved performing procedures and evaluating audit evidence in connection with forming our overall opinion on the financial statements. These procedures included testing the effectiveness of controls relating to the Company’s determination of qualitative factors and forecasted economic conditions. These procedures also included, among others, testing management’s process for determining the qualitative reserve component, evaluating the appropriateness of management’s methodology relating to the qualitative reserve component and testing the completeness and accuracy of data utilized by management.
/s/ Wolf & Company, P.C.
Boston, Massachusetts
March 12, 2024
We have served as the Company’s auditor since 2020.
105
Report of Independent Registered Public Accounting Firm
To the Shareholders and the Board of Directors of Cambridge Bancorp:
Opinion on the Internal Control Over Financial Reporting
We have audited Cambridge Bancorp and subsidiaries’ (the Company) internal control over financial reporting as of December 31, 2023, based on criteria established in Internal Control – Integrated Framework issued by the Committee of Sponsoring Organizations of the Treadway Commission in 2013. In our opinion, the Company maintained, in all material respects, effective internal control over financial reporting as of December 31, 2023, based on criteria established in Internal Control – Integrated Framework issued by the Committee of Sponsoring Organizations of the Treadway Commission in 2013.
We have also audited, in accordance with the standards of the Public Company Accounting Oversight Board (United States) (PCAOB), the December 31, 2023 consolidated financial statements of the Company and our report dated March 12, 2024 expressed an unqualified opinion.
Basis for Opinion
The Company’s management is responsible for maintaining effective internal control over financial reporting and for its assessment of the effectiveness of internal control over financial reporting in the accompanying Management’s Report on Internal Control Over Financial Reporting. Our responsibility is to express an opinion on the Company’s internal control over financial reporting based on our audit. We are a public accounting firm registered with the PCAOB and are required to be independent with respect to the Company in accordance with U.S. federal securities laws and the applicable rules and regulations of the Securities and Exchange Commission and the PCAOB.
We conducted our audit in accordance with the standards of the PCAOB. Those standards require that we plan and perform the audit to obtain reasonable assurance about whether effective internal control over financial reporting was maintained in all material respects. Our audit included obtaining an understanding of internal control over financial reporting, assessing the risk that a material weakness exists, and testing and evaluating the design and operating effectiveness of internal control based on the assessed risk. Our audit also included performing such other procedures as we considered necessary in the circumstances. We believe that our audit provides a reasonable basis for our opinion.
Definition and Limitations of Internal Control Over Financial Reporting
A company's internal control over financial reporting is a process designed to provide reasonable assurance regarding the reliability of financial reporting and the preparation of financial statements for external purposes in accordance with generally accepted accounting principles. A company's internal control over financial reporting includes those policies and procedures that (1) pertain to the maintenance of records that, in reasonable detail, accurately and fairly reflect the transactions and dispositions of the assets of the company; (2) provide reasonable assurance that transactions are recorded as necessary to permit preparation of financial statements in accordance with generally accepted accounting principles, and that receipts and expenditures of the company are being made only in accordance with authorizations of management and directors of the company; and (3) provide reasonable assurance regarding prevention or timely detection of unauthorized acquisition, use or disposition of the company's assets that could have a material effect on the financial statements.
Because of its inherent limitations, internal control over financial reporting may not prevent or detect misstatements. Also, projections of any evaluation of effectiveness to future periods are subject to the risk that controls may become inadequate because of changes in conditions, or that the degree of compliance with the policies or procedures may deteriorate.
/s/ Wolf & Company, P.C.
Boston, Massachusetts
March 12, 2024
106
Item 9. Changes in and Disagreements With AccountantsAccountants on Accounting and Financial Disclosure.
None.None
Item 9A. Controls and Procedures.
A. Disclosure Controls and Procedures
As required by Rules 13a-15 and 15d-15 of the Securities Exchange Act of 1934, the Company has evaluated, with the participation of management, including the Chief Executive Officer and the Chief Financial Officer, as of the end of the period covered by this report, the effectiveness of the design and operation of its disclosure controls and procedures.
Based on such evaluation, the Chief Executive Officer and Chief Financial Officer have concluded that such disclosure controls and procedures were effective as of December 31, 20172023 in ensuring that material information required to be disclosed by the Company, including its consolidated subsidiaries:
|
|
|
|
On a quarterly basis, the Company evaluates the disclosure controls and procedures and may, from time to time, make changes aimed at enhancing their effectiveness and to ensure that the Company’s systems evolve with its business.
B.
Changes in Internal Controls over Financial Reporting
There were no changes in the Company’s internal control over financial reporting that have materially affected, or are reasonably likely to materially affect, the Company’s internal control over financial reporting in 2023.
Management’s Report on Internal Control Over Financial Reporting
The management of the Company is responsible for establishing and maintaining adequate internal control (as defined in Rule 13a-15(f) under the Securities Exchange Act of 1934, as amended) over financial reporting. The Company’s internal control over financial reporting is a process designed to provide reasonable assurance to the Company’s Chief Executive Officer and Chief Financial Officer regarding the reliability of financial reporting and preparation of the Company’s financial statements in accordance with accounting principles generally accepted in the U.S.
In designing and evaluating the Company’s disclosure controls and procedures, the Company and its management recognize that any controls and procedures, no matter how well designed and operated, can provide only a reasonable assurance of achieving the desired control objectives, and management was required to apply its judgment in evaluating and implementing possible controls and procedures. Therefore, even those systems determined to be effective can provide only reasonable assurance with respect to financial statement preparation and presentation and may not prevent or detect misstatements. Also, projections of any evaluation of effectiveness to future periods are subject to the risk that controls may become inadequate because of changes in conditions or that the degree of compliance with the policies or procedures may deteriorate.
The Company’s management assessed the effectiveness of the Company’s internal control over financial reporting as of December 31, 2017.2023. In making this assessment, management used the criteria set forth in Internal Control—Integrated Framework (2013) issued by the Committee of Sponsoring Organizations of the Treadway Commission (“COSO”). in 2013. Based on management’s assessment, the Company believes that, as of December 31, 2017,2023, the Company’s internal control over financial reporting is effective based on the criteria established by Internal Control—Integrated Framework (2013) issued by COSO.COSO in 2013.
C. ChangesWolf & Company, P.C, an independent registered public accounting firm, has audited the Company’s consolidated financial statements included in Internal Controls over Financial Reporting
There have been no changes inthis Annual Report on Form 10-K and, as part of its audit, has issued its report, included herein on page 106, on the effectiveness of the Company’s internal controlscontrol over financial reporting that have materially affected, or are reasonably likely to materially affect, the Company’s internal controls over financial reporting in 2017.reporting.
Item 9B. Other Information.
None.Rule 10b5-1 Trading Plans
During the quarter ended December 31, 2023, none of the Company’s directors or executive officers adopted or terminated any contract, instruction or written plan for the purchase of Company securities that was intended to satisfy the affirmative defense conditions of Rule 1-b5-1(c) or any “non-Rule 10b5-1 trading arrangement.
Item 9C. Disclosure Regarding Foreign Jurisdictions that Prevent Inspections
Not applicable.
108
Item 10. Directors, Executive Officers and Corporate Governance.
Directors
The information required by this Item appears underBoard is divided into three classes. Generally, one class of directors is elected annually for a term of three years. Directors continue to serve until their term expires and until their respective successors are elected and qualified, unless they die, resign, or are removed. The Board is currently comprised of 16 members. Unless otherwise stated, each person has held his or her current occupation for the captions “Proposal 1: Electionlast five years.
Directors |
| Age (1) |
| Term Expires |
| Position(s) Held |
| Director Since (2) |
Jeanette G. Clough |
| 70 |
| 2024 |
| Director |
| 2008 |
Christine Fuchs |
| 54 |
| 2026 |
| Director |
| 2019 |
Simon R. Gerlin |
| 65 |
| 2024 |
| Director |
| 2020 |
Pamela A. Hamlin |
| 59 |
| 2026 |
| Director |
| 2019 |
Kathryn M. Hinderhofer |
| 72 |
| 2024 |
| Director |
| 2020 |
Hambleton Lord |
| 62 |
| 2024 |
| Director |
| 2012 |
Thalia M. Meehan |
| 62 |
| 2025 |
| Director |
| 2019 |
Daniel R. Morrison |
| 60 |
| 2026 |
| Director |
| 2019 |
Leon A. Palandjian |
| 54 |
| 2026 |
| Director |
| 2006 |
Laila S. Partridge |
| 59 |
| 2026 |
| Director |
| 2019 |
Jody A. Rose |
| 47 |
| 2025 |
| Director |
| 2019 |
Cathleen A. Schmidt |
| 64 |
| 2025 |
| Director |
| 2016 |
Denis K. Sheahan |
| 58 |
| 2025 |
| Director, Chairman, President & CEO |
| 2015 |
R. Gregg Stone |
| 71 |
| 2024 |
| Director |
| 2009 |
Jane C. Walsh |
| 70 |
| 2026 |
| Director |
| 2022 |
Andargachew S. Zelleke |
| 62 |
| 2025 |
| Director |
| 2022 |
(1) Ages are presented as of December 31, 2023.
(2) Includes terms served on the Board of Directors” “Board of DirectorsCambridge Trust, as applicable.
The principal occupation, education and Committees –business experience, where applicable, of each director are set forth below. Unless otherwise indicated, principal occupations shown for each director have extended for five or more years.
Jeanette G. Clough, Age 70. Since November 1998 until June 2021, Ms. Clough served as the Chief Executive Officer and President of Mount Auburn Hospital. Ms. Clough has served as a director of the Company and of Cambridge Trust since 2008. The Board Committees – Audithas determined that Ms. Clough is qualified to serve as a director based upon her experience as a Chief Executive Officer of a large healthcare organization and her knowledge of the life sciences industry, which is important to the communities served by Cambridge Trust.
Christine Fuchs, Age 54.Ms. Fuchs has extensive experience in the financial services industry and as an active participant in Greater Boston’s start-up community. Ms. Fuchs spent her career at Wellington Management as Associate Director of Global Industry Research where she led a team of nearly 100 investment professionals and served on the Compensation Committee” “Executive Officers,” and “Section 16(a) Beneficial Ownership Reporting Compliance”Equity Review management committees. Prior to her management position, Ms. Fuchs served for a decade as an equity analyst and sector fund manager, responsible for the active management of $2 billion in assets. Since retiring from Wellington Management, Ms. Fuchs has emerged as an active member of the start-up ecosystem in Greater Boston, as an angel investor, advisor and mentor. She currently serves on the board of Launchpad Venture Group. Ms. Fuchs holds an M.B.A. in Finance from the Wharton School of the University of Pennsylvania and is a CFA Charterholder. The Board has determined that Ms. Fuchs is qualified to serve as a director based upon her prior service as a director on numerous boards and her background in financial services.
Simon R. Gerlin, Age 65. Mr. Gerlin is the Chief Financial Officer and Executive Vice President of Finance of MassDevelopment, a development finance agency and land bank, working with businesses, nonprofits, banks, and communities to stimulate economic growth. Prior to MassDevelopment, Mr. Gerlin served in executive finance, compliance, and audit roles at Clean Harbors Environmental Services. He also spent 16 years at PricewaterhouseCoopers LLP, becoming a partner and serving clients in numerous sectors such as energy and utilities, manufacturing, and higher education. Mr. Gerlin received a B.A. in political science from Middlebury College and holds an M.B.A. from Harvard Business School. He is a certified public accountant, a member of the American Society of CPAs, and a former member of the Wellesley Bancorp, Inc. Board of Directors. The Board has determined that Mr. Gerlin is qualified to serve as a director based upon his prior service as a director and member of numerous board committees of Wellesley Bancorp, Inc., his knowledge of banking regulation and risk management, and his training as a certified public accountant.
Pamela A. Hamlin, Age 59.Ms. Hamlin is a creative business leader with over 30 years of marketing and general management experience and a track record of leading and growing an acclaimed global creative agency, while driving marketing and business strategy for major Fortune 500 clients across a wide range of industries. Ms. Hamlin is currently the President of York Creative Collective (YCC)
109
where she leads strategy and operations across a portfolio of consumer companies and brands. Prior to YCC, she was an engine for growth, evolution and cultural vibrancy at Arnold Worldwide for 20 years. As Global CEO, Ms. Hamlin oversaw the Arnold global network and was responsible for driving the vision and strategy for the agency. Previously, Ms. Hamlin served as President of Arnold’s Boston headquarters office, and as Managing Partner, Director of Account Management. Ms. Hamlin’s career in advertising began in account management and business development positions and evolved to senior leadership roles at leading agencies like Ingalls, Quinn & Johnson, HBM/Creamer and Leonard/Monahan. The Board has determined that Ms. Hamlin is qualified to serve as a director based upon her background in marketing and leading business strategy for major corporations.
Kathryn M. Hinderhofer,Age 72. Ms. Hinderhofer has spent over 35 years in the financial services industry and retired as Executive Vice President of Operations and Technology from National Bank Holdings Corp (“NBH”) in 2015. Prior to this, Ms. Hinderhofer was an Executive Vice President at Citizens Financial Group where she was responsible for business integration activities for acquisitions and divestitures of banks. Most recently, Ms. Hinderhofer has completed various consulting assignments for banks in New England in her field of expertise, she currently serves as a director of Micronotes, Inc., a cloud-based marketing automation company in Boston. The Board has determined that Ms. Hinderhofer is qualified to serve as a director based upon her prior service as a director and member of numerous board committees of Wellesley Bancorp, Inc., her extensive background in the banking and financial services industry, and her knowledge of banking regulation and risk management.
Hambleton Lord (Lead Director), Age 62. Mr. Lord has over 30 years’ experience in the software industry founding and building industry leading companies. He is the retired CEO and Co-Founder of Seraf, a financial services software company that provides professional portfolio management tools for investors in early-stage companies. In addition, he is the Chairman of Emeritus of Launchpad Venture Group, a Boston-based angel investor group that focuses on seed stage technology and life science companies. Mr. Lord has served as a director of the Company and of Cambridge Trust since 2012. The Board has determined that Mr. Lord is qualified to serve as a director based upon his prior service as a director of the Company and of Cambridge Trust including his service on numerous Board committees, his experience as an angel investor, his knowledge of the software industry and innovation economy in Massachusetts, and his knowledge of the business communities in the Company’s Proxy Statement datedmarket area.
Thalia M. Meehan, Age 62. Ms. Meehan is currently an independent director at Safety Insurance Group, Inc., a provider of automobile, home and business owners’ insurance. Ms. Meehan retired from Putnam Investments in 2016 after 27 years in the Tax Exempt Bond Group, where she was Team Leader and Portfolio Manager from 2006 to 2016. She was previously Head of Tax Exempt Credit Research at Putnam. Ms. Meehan also serves on the Municipal Securities Rulemaking Board. Ms. Meehan is a CFA charter holder and a graduate of Williams College. The Board has determined that Ms. Meehan is qualified to serve as a director based upon her prior service as a director on numerous boards and her background in financial services.
Daniel R. Morrison, Age 60. Mr. Morrison served as CEO of Cambridge Trust New Hampshire until retiring in 2021. Prior to joining the Company in 2019, Mr. Morrison spent over 12 years at Optima Bank & Trust Company as Chairman, President and Chief Executive Officer. Mr. Morrison has experience in positions of executive leadership at publicly traded companies and knowledge of the communities that the Company serves. The Board has determined that Mr. Morrison is qualified to serve as a director based upon his prior service as a director of Optima Bank & Trust, his extensive experience in and knowledge of the banking and financial services industry, and his experience in and involvement with business and civic organizations in the communities in the Company’s market area.
Leon A. Palandjian, MD, CFA, Age 54. Dr. Palandjian is the Chief Risk Officer of Intercontinental Real Estate Corporation, a national real estate investment, development, and management firm headquartered in Boston, Massachusetts. His investment experience spans venture capital and private and public equity, in the life science and real estate sectors. Dr. Palandjian has served as a director of the Company and of Cambridge Trust since 2006, was Lead Director of the Board from 2014 until January 2017 and is currently Chair of the Trust Committee. The Board has determined that Dr. Palandjian is qualified to serve as a director based upon his prior service as a director of the Company and of Cambridge Trust including his service on numerous Board committees, his extensive experience in equity investment and finance, his CFA qualification, his knowledge of risk management, and his knowledge of the communities in the Company’s market area.
Laila S. Partridge, Age 59.Ms. Partridge is an entrepreneur and technology executive with expertise in identifying disruptive technologies and turning them to competitive advantage. She was a manager and investor at Intel Capital, during the early days of that organization’s formation and has led several technology companies as Chief Executive Officer. Ms. Partridge currently serves as the CEO of HardTech Project, a company developing solutions for early-stage hardware funding. Previously, she served as Managing Director of the STANLEY + Techstars Accelerator between 2019 and 2022, directing a global effort on behalf of Stanley Black & Decker to invest in early stage technology companies and grow innovative new technology solutions. Ms. Partridge has served on the board of directors of LightwaveLogic, Inc., a technology platform company, since August 2023. The Board has determined that Ms. Partridge is qualified to serve as a director based upon her prior service as a director of the Company and of Cambridge Trust, her background in venture capital, and her extensive work with startups.
110
Jody A. Rose, Age 47. Ms. Rose is the Cofounder and Board Director of Hack.Diversity, a non-profit organization committed to transforming the economy by breaking down barriers for Black and Latine professionals in technology. Formerly the President of The New England Venture Capital Association (the “NEVCA”), Ms. Rose has been working in collaboration with the venture and start-up communities since 2015 to help foster a more innovative, collaborative, and inclusive ecosystem. Ms. Rose’s achievements include successfully leading the entrepreneurial community’s fight for non-compete reform, and co-founding one of New England’s most innovative workforce development programs – Hack.Diversity, now the foundation arm of the NEVCA. Ms. Rose has held executive-level roles with both enterprise corporations and lean startups, focusing primarily on mobile, eCommerce and digital media. Prior to joining the NEVCA in 2015, Ms. Rose served as the SVP of Digital Strategy and Corporate Development at Blueprint NYC, an event production agency based in New York. Previous to that, Ms. Rose led National Mobile and Brand Partnerships for micro-location mobile marketing platform, Swirl Networks. Before joining Swirl, Ms. Rose served as Director of National Brand Partnerships at Rue Gilt Groupe, an online shopping and lifestyle company. In addition to serving on the board of Hack.Diversity, Ms. Rose serves on The Rapid7 Foundation Board, and serves on The New England Capital Association Board. The Board has determined that Ms. Rose is qualified to serve as a director based upon her prior service as a director on numerous boards and her background in marketing and venture capital.
Cathleen A. Schmidt, Age 64. Ms. Schmidt has extensive leadership experience in banking and professional services. Prior to retiring in September of 2021, she served as Chief Executive Officer at McLane Middleton Professional Association, the largest full-service law firm headquartered in Manchester, New Hampshire with offices in Massachusetts. She held that position for over eight years. Prior to that, she served as President and CEO of Citizen’s Bank New Hampshire/Vermont. She has served as a director of the Company and of Cambridge Trust since 2016. The Board has determined that Ms. Schmidt is qualified to serve as a director based upon her prior service as a director of the Company and of Cambridge Trust including her service on numerous Board committees. In addition, Ms. Schmidt brings to the Board her experience in executive management of a large regional bank, expertise in retail banking, and knowledge of the New Hampshire market.
Denis K. Sheahan, Chairman, President & Chief Executive Officer, Age 58. Mr. Sheahan serves as Chairman, President & Chief Executive Officer of Cambridge Trust Company and Cambridge Bancorp. Prior to joining Cambridge Trust Company in April 3, 2018 prepared2015, Mr. Sheahan spent 19 years at Independent Bank Corp. and Rockland Trust where he served as Chief Financial Officer and Chief Operating Officer. Prior to joining Rockland Trust Company, Mr. Sheahan served as Vice President of Finance for BayBanks, Inc. Mr. Sheahan currently serves as Board Trustee for Cambridge Community Foundation, Chairs the Finance Committee and is Secretary/Treasurer of the Board of the Massachusetts Housing Partnership, he serves as an Advisory Board member of the Rian Immigrant Center, is a Board member and Treasurer for the Annual MeetingCambridge Family YMCA. Mr. Sheahan also serves as a member of Shareholdersthe Board of Directors of the Massachusetts Bankers Association, and is a Board Trustee for the Massachusetts Bankers Association Charitable Foundation, Inc. The Board has determined that Mr. Sheahan is qualified to serve as a director based upon his prior service as a director of the Company and of Cambridge Trust and his extensive experience in many areas of banking and financial services. Mr. Sheahan has experience in positions of executive leadership at publicly traded companies and knowledge of the communities that the Company serves.
R. Gregg Stone, Age 71. Mr. Stone serves as Manager of Kestrel Management, LLC, through which he manages venture capital and family investments. He has worked in the investment industry since 1986 when he joined Pell, Rudman & Co., Inc. as a Vice President from the law firm Hemenway & Barnes. Mr. Stone has served on the boards of a number of private companies and charities and served on the board of NovaCare from its acquisition by Foster Management Company in 1985 through its initial public offering in 1986 until 1993. Mr. Stone has served as director of the Company and of Cambridge Trust since 2009. The Board has determined that Mr. Stone is qualified to serve as a director based upon his prior service as a director of the Company and of Cambridge Trust including his service on numerous Board committees, and his background in investment management and venture capital.
Jane C. Walsh,Age 70. Prior to joining the Company in 2022, Ms. Walsh served as President and CEO of Northmark Bank, becoming the first founding female commercial bank President in Massachusetts when Northmark Bank opened for business in December 1987. Ms. Walsh began her career at Arlington Trust Company, where she held various management positions and achieved the rank of Executive Vice President leading the Investment, Operations and Data Processing Divisions of a $1.2 billion bank. Ms. Walsh is extremely committed to her community and industry, as evidenced by her past and present service on various Boards, including Arthur Griffin Center, Federal Reserve Bank of Boston, Kiwanis Club of Greater Lawrence, Lanam Club, Massachusetts Bankers Association, Massachusetts Business Roundtable, Massachusetts Hospital Association, Massachusetts Medicaid Policy Institute, Merrimack College, Merrimack Valley Chamber of Commerce, St. Mary’s Parish in Winchester, Winchester Hospital, and Beth Israel Lahey Health. Ms. Walsh received her undergraduate degree from Merrimack College, her Master of Business Administration from Northeastern University, and the Certified Bank Auditor (CBA) designation from the Chartered Bank Auditors Association. Jane currently serves on the St. Mary Parish Finance Council and the Beth Israel Lahey Health Board.The Board has determined that Ms. Walsh is qualified to serve as a director based upon her extensive experience in and knowledge of the banking and financial services industry, and her experience in and involvement with business and civic organizations in the communities in the Company’s market area.
111
Andargachew S. Zelleke, Age 62. Dr. Zelleke has two decades’ experience as an educator on leadership and management, negotiation, corporate governance and, more recently, US-China relations. He is presently in his 13th year as the MBA Class of 1962 Senior Lecturer of Business Administration at Harvard Business School, having taught previously at the Harvard Kennedy School and the University of Pennsylvania’s Wharton School. His prior leadership roles have included Project Director and Steering Committee member of the American Academy of Arts and Sciences’ Corporate Responsibility Project, and Co-Director of the Harvard Kennedy School’s Center for Public Leadership. Dr. Zelleke was co-editor of Restoring Trust in American Business (MIT Press, 2005); is a life member of the Council on Foreign Relations; and has twice won the Greenhill Award for outstanding contributions to the Harvard Business School community. Early in his career he practiced corporate law at Cleary Gottlieb Steen & Hamilton and at White & Case, and taught at the UCLA School of Law. He has prior public company board experience at Innodata Inc., a global data engineering company. Dr. Zelleke received his A.B., A.M., J.D. and Ph.D. (Organizational Behavior) from Harvard University. The Board has determined that Dr. Zelleke is qualified to serve as a director based on his prior public company board experience and his background in corporate governance.
INFORMATION ABOUT THE COMPANY’S EXECUTIVE OFFICERS WHO ARE NOT DIRECTORS
The following individuals are the current executive officers of the Company and/or Cambridge Trust who are not directors. The executive officers hold office until their respective successors have been appointed and qualified, or until death, resignation or removal by the Board. Ages presented are as of December 31, 2023.
Peter Halberstadt, Age 45. Mr. Halberstadt joined Cambridge Trust in 2004 and serves as Senior Vice President and Chief Credit Officer, leading the Credit Risk function for the bank. Mr. Halberstadt also oversees the Enterprise Risk Management functions. Prior to joining Cambridge Trust, Mr. Halberstadt worked at Century Bank in a credit related role.
Steven Mead, Age 50. Mr. Mead serves as Senior Vice President and Chief Commercial Banking Officer at Cambridge Trust where he leads the commercial lending teams in both Massachusetts and New Hampshire. Mr. Mead joined Cambridge Trust in 2012, after serving in similar roles at Sovereign Bank and Cambridge Savings Bank.
Kerri A. Mooney, Age 55. Ms. Mooney joined Cambridge Trust in 2018 and serves as Senior Vice President and Chief Deposit Officer; she previously served as Senior Vice President and Director of Private Banking Offices from June 2018 to January 2023. Prior to joining Cambridge Trust Ms. Mooney worked as the Director of Branches for HarborOne Bank from October 2016 to June 2018. Prior to that, she was the First Vice President and District Manager at Rockland Trust from July 2010 to October 2016 where she led Rockland Trust’s Greater Boston banking offices.
Puneet Nevatia, Age 50. Mr. Nevatia joined Cambridge Trust in 2018 as Senior Vice President and Chief Information Officer. Prior to his appointment, Mr. Nevatia served as an Executive Client Partner within the financial services division of Sapient Corporation, a global consulting company that provides business, technology, digital transformation, and marketing services to clients since October 2012. Prior to Sapient, Mr. Nevatia worked in a number of financial service firms, including Babson Capital and Wellington Management.
Pilar Pueyo, Age 62. Ms. Pueyo joined Cambridge Trust in 2016 as Senior Vice President, and Director of Human Resources. Prior to joining Cambridge Trust, Ms. Pueyo spent 17 years at Boston Private Bank and Trust Company where she was responsible for the delivery and execution of Human Resources strategy, programs, and services to support its business strategy.
Danielle Remis Hackel, Age 53. Ms. Hackel serves as Senior Vice President and Chief Marketing Officer of Cambridge Trust, providing strategic, operational, and administrative oversight for the marketing function. Prior to joining the Company in 2021, Ms. Hackel spent three years at Harbourvest Partners in various capacities including Vice President and Co-Head of Marketing. Prior to joining Harbourvest Partners, Ms. Hackel held a variety of managing sales and marketing roles as Head of Institutional Marketing at State Street Global Advisors.
Joseph P. Sapienza,Age 53. Mr. Sapienza joined Cambridge Trust in 1996 and currently serves as Senior Vice President and Interim Chief Financial Officer, and Director of Accounting and Controller, in which roles he oversees the Finance and Accounting departments, including internal and external financial and regulatory reporting.
Jeffrey F. Smith,Age 58. Mr. Smith serves as Executive Vice President, Head of Wealth Management at Cambridge Trust. He joined Cambridge Trust in June 2023 from the Rockland Trust Investment Management Group where he served as a Senior Vice President since 1999. He started his financial services career in 1987 with Scudder, Stevens and Clark in Boston.
John J. Sullivan, Age 64. Mr. Sullivan serves as Senior Vice President, Director of Consumer Lending at Cambridge Trust. Mr. Sullivan has held various leadership positions within the private banking and wealth management industry. Prior to joining Cambridge Trust in 2017, Mr. Sullivan spent 16 years at Boston Private Bank & Trust Company, where he served in various capacities including Executive
112
Vice President, Wealth Management and Trust; and Executive Vice President, Residential Lending. Prior to that, he spent 10 years at Citizens Bank as a Residential Loan Officer.
Family Relationships
There are no family relationships among any of our directors or executive officers that would require disclosure under Item 401(d) of Regulation S-K promulgated under the Securities Act.
Involvement in Certain Legal Proceedings
None of our directors or executive officers has been involved in any legal proceeding in the past ten years that would require disclosure under Item 401(f) of Regulation S-K promulgated under the Securities Act.
Board Diversity Matrix (As of March 12, 2024)
| ||||||||
Total Number of Directors |
| 16 | ||||||
|
|
|
|
| |
| | Did Not |
|
|
|
| Disclose | ||||
| Female | Male | Non-Binary | Gender | ||||
Part I: Gender Identity |
| | | | | | | |
Directors |
| 9 | | 7 | | — | | — |
Part II: Demographic Background |
| | | | | | | |
African American or Black |
| 1 | | 1 | | — | | — |
Alaskan Native or Native American |
| — | | — | | — | | — |
Asian |
| — | | — | | — | | — |
Hispanic or Latino |
| — | | — | | — | | — |
Native Hawaiian or Pacific Islander |
| — | | — | | — | | — |
White |
| 8 | | 6 | | — | | — |
Two or More Races or Ethnicities |
| — | | — | | — | | — |
LGBTQ+ |
| 1 | ||||||
Did Not Disclose Demographic Background |
| — | ||||||
Committees of the Board of Directors
The Board has an Audit Committee, Compensation Committee, Governance Committee and a Risk Committee along with other various committees. The Board has adopted a charter for each of the Audit Committee, the Compensation Committee, the Governance Committee and the Risk Committee, as well as qualification guidelines for board members. The following table provides meeting information for the fiscal year ended December 31, 2023, for each committee:
113
Name |
| Audit Committee |
| Compensation Committee |
| Governance Committee |
| Risk Committee |
Jeanette G. Clough |
|
|
| • |
| • |
| • |
Christine Fuchs |
|
|
|
|
| • |
|
|
Simon R. Gerlin |
| ★C |
|
|
|
|
| • |
Pamela A. Hamlin |
| • |
| C |
|
|
|
|
Kathryn M. Hinderhofer |
| • |
|
|
|
|
| C |
Hambleton Lord |
|
|
| • |
| • |
|
|
Thalia M. Meehan |
|
|
|
|
|
|
| • |
Daniel R. Morrison |
|
|
|
|
|
|
| • |
Leon A. Palandjian |
|
|
| • |
|
|
|
|
Laila S. Partridge |
| • |
| • |
|
|
|
|
Jody A. Rose |
| • |
|
|
| • |
|
|
Cathleen A. Schmidt |
|
|
| • |
| C |
|
|
Denis K. Sheahan |
|
|
|
|
|
|
|
|
R. Gregg Stone |
|
|
|
|
| • |
|
|
Jane C. Walsh |
|
|
|
|
|
|
| • |
Andargachew S. Zelleke |
| • |
|
|
| • |
|
|
Total meetings in 2023 |
| 4 |
| 7 |
| 4 |
| 4 |
C Committee Chair
★ Financial Expert
Audit Committee
The Audit Committee oversees the Company’s accounting and financial reporting processes, including its internal audit function, the external and internal audits of the Company’s financial statements, the integrity of the financial statements of the Company, the qualifications, independence and performance of the independent auditor engaged by the Company and compliance with applicable legal and regulatory requirements. The Audit Committee may form and delegate authority to one or more subcommittees (including a subcommittee consisting of a single member), as it deems appropriate from time to time under the circumstances. A copy of the Audit Committee’s charter is available on the Company’s website at: http://ir.cambridgetrust.com/govdocs. During the fiscal year ended December 31, 2023, the Audit Committee held four meetings. The members of the Audit Committee currently are Mses. Hamlin, Hinderhofer, Partridge, and Rose, and Messrs. Gerlin (Chair) and Zelleke. Each of the members of the Audit Committee meets the independence requirements under the NASDAQ Listing Rules and applicable rules and regulations of the SEC. The Board has determined that each member of the Audit Committee is financially literate and that Mr. Gerlin qualifies as an “audit committee financial expert,” as that term is defined in Item 407(d)(5) of Regulation S-K.
Audit Committee Report
The Audit Committee has reviewed and discussed the Company’s audited financial statements for the fiscal year ended December 31, 2023, with management and the Company’s independent registered public accounting firm, Wolf & Company, P.C. The Audit Committee has discussed with Wolf & Company, P.C. the matters required to be held May 14, 2018, which is incorporated hereindiscussed by reference.
Item 11. Executive Compensation.
the applicable requirements of the Public Company Accounting Oversight Board and the SEC. The informationAudit Committee has also received the written disclosures and the letter from Wolf & Company, P.C. required by applicable requirements of the Public Company Accounting Oversight Board regarding Wolf & Company, P.C.’s communications with the Audit Committee concerning independence, and has discussed with Wolf & Company, P.C. the firm’s independence. Based on the foregoing, the Audit Committee recommended to the Board of Directors that the Company’s
114
audited financial statements be included in this Item appearsAnnual Report on Form 10-K for the fiscal year ended December 31, 2023, for filing with the SEC.
Audit Committee of the Board of Directors of Cambridge Bancorp | |
Simon R. Gerlin, (Chair) | |
Pamela A. Hamlin | |
Kathryn M. Hinderhofer | |
Laila S. Partridge Jody A. Rose | |
Andargachew S. Zelleke |
Governance Committee
The Governance Committee has overall responsibility for recommending corporate governance policies and procedures and board operations for the Company and for the oversight of the Company’s ESG and sustainability efforts. The Governance Committee provides recommendations for action by the Board related to the appropriate size, composition, function, needs and effectiveness of the Board and its committees, develops and implements corporate governance principles and practices for the Company and oversees implementation of the Company’s Code of Ethics (as defined below), including reviewing Company transactions involving related parties and other potential conflicts of interest. The Governance Committee identifies director candidates, reviews the qualifications and experience of each person considered as a nominee for election or reelection as a director, and recommends director nominees to fill vacancies on the Board for approval by the Board and the shareholders. A copy of the Governance Committee’s charter is available on the Company’s website at: http://ir.cambridgetrust.com/govdocs. During the fiscal year ended December 31, 2023, the Governance Committee held four meetings. The members of the Governance Committee currently are Mses. Clough, Fuchs, Rose, and Schmidt (Chair), and Messrs. Lord, Stone, and Zelleke. Each member of the Governance Committee meets the independence requirements under the captions “Compensation DiscussionNASDAQ Listing Rules.
Compensation Committee
The Compensation Committee’s responsibilities include: (i) assisting the Board in carrying out its responsibilities in determining the compensation of the President & Chief Executive Officer, and Analysis,” “Directorthe other executive officers of the Company and Cambridge Trust; (ii) establishing compensation policies that will attract and retain qualified personnel through an overall level of compensation that is comparable to, and competitive with, others in the industry and in particular, peer financial institutions; and (iii) assisting the Board with the design and development, for approval, of equity and cash compensation plans.
During the fiscal year ended December 31, 2023 the Compensation Table,” “ExecutiveCommittee held seven meetings. The members of the Compensation” “Compensation Committee currently are Mses. Clough, Hamlin (Chair), Partridge, and Schmidt and Messrs. Lord and Palandjian. Each of the members of the Compensation Committee meets the independence requirements under the NASDAQ Listing Rules, and also serves on the Compensation Committee of the Company’s subsidiary, Cambridge Trust. A copy of the Compensation Committee’s charter is available on the Company’s website at: http://ir.cambridgetrust.com/govdocs. The Compensation Committee may delegate to its chairperson or any other Compensation Committee member such power and authority as the Compensation Committee deems appropriate, except such powers and authorities required by law to be exercised by the whole Compensation Committee or subcommittee thereof.
Compensation Committee Interlocks and Insider Participation
In 2023, the Compensation Committee was comprised entirely of independent directors, Mses. Clough, Hamlin (Chair), Partridge, and Schmidt, and Messrs. Lord and Palandjian. No member of the Compensation Committee is a current, or during 2023 was a former, executive officer or employee of the Company or any of its subsidiaries. In 2023, none of the Company’s executive officers served on the board of directors or compensation committee of any entity that had one or more of its executive officers serving on the Board or the Compensation Committee of the Company.
Risk Committee
The Risk Committee oversees the Company’s enterprise-wide risk management framework, including the strategies, policies, procedures, and systems, established by management to identify, assess, measure, and manage the major risks facing the Company. The Risk Committee approves and reviews the Company’s risk management framework, reviews major risks facing the Company and management’s assessment of the Company’s aggregate enterprise-wide risk profile, and annually reviews and recommends to the Board the articulation of the Company’s risk appetite. Among other duties and responsibilities, the Risk Committee oversees Asset Liability Management, the Information Technology and Information Security functions at the Bank, and reviews the Company’s Compliance,
115
CRA, and Anti-Money Laundering Programs. The Risk Committee may form and delegate authority to one or more subcommittees (including a subcommittee consisting of a single member) as it deems appropriate from time to time under the circumstances.
A copy of the Risk Committee’s charter is available on the Company’s website at: http://ir.cambridgetrust.com/govdocs. During the fiscal year ended December 31, 2023, the Risk Committee held four meetings. The members of the Risk Committee currently are Mses. Clough, Hinderhofer (Chair), Meehan, and Walsh, and Messrs. Gerlin and Morrison. Each of the members of the Risk Committee meets the independence requirements under the NASDAQ Listing Rules.
Code of Ethics
The Board has adopted a code of ethics (the “Code of Ethics”) that applies to all employees, officers and directors. Each employee, officer and director participates in an annual training session that focuses on topics covered by the Company’s Code of Ethics. The training reinforces the Company’s core values and commitment to full compliance with applicable laws and regulations. The Code of Ethics is supplemented by a new code of conduct (the “Code of Conduct”) that applies to all employees, officers and directors, and defines appropriate business conduct and provides recourse in the event of violations. The Code of Ethics and the Code of Conduct are available on the Company’s website at: http://ir.cambridgetrust.com/govdocs. The inclusion of the Company’s website address here and elsewhere in this Annual Report on Form 10-K does not include or incorporate by reference the information on the Company’s website into this Annual Report on Form 10-K.
A printed copy of the Committee charters (referenced in “Committees of the Board of Directors”) and the Code of Ethics can also be obtained, without charge, by contacting the Company at the following address:
Cambridge Bancorp
1336 Massachusetts Avenue
Cambridge, MA 02138
ATTN: Corporate Secretary
DELINQUENT SECTION 16(A) REPORTS
Section 16(a) of the Exchange Act requires directors and executive officers, and persons who own more than 10% of the Company’s common stock, to report to the SEC their initial ownership of the Company’s common stock and any subsequent changes in that ownership. Specific due dates for these reports have been established by the SEC and we are required to disclose in this Annual Report on Form 10-K any late filings or failures to file.
Based solely on review of the copies of such reports furnished to us and written representations from reporting persons that no other reports were required during the fiscal year ended December 31, 2023, we believe that, during the 2023 fiscal year, all of the Company’s directors and executive officers complied with all Section 16(a) filing requirements applicable to them.
Item 11. Executive Compensation.
Compensation Discussion and Analysis
This Compensation Discussion and Analysis discusses our compensation policies and determinations that apply to our current and former executive officers that are our Named Executive Officers (“NEOs”) for the 2023 fiscal year. When we refer to our “NEOs,” we are referring to the following individuals whose 2023 compensation is set forth below in the Summary Compensation Table and “Compensationsubsequent compensation tables, as applicable.
Executive | Position | |
Denis K. Sheahan | President & Chief Executive Officer | |
Michael F. Carotenuto(1) | Former Executive Vice President, Chief Financial Officer | |
Joseph P. Sapienza | Senior Vice President, Interim Chief Financial Officer | |
Kerri A. Mooney | Senior Vice President, Chief Deposit Officer | |
Puneet Nevatia | Senior Vice President, Chief Information Officer | |
Jennifer A. Pline(2) | Former Executive Vice President, Head of Wealth Management | |
Jeffrey F. Smith(3) | Executive Vice President, Head of Wealth Management |
(1) Mr. Carotenuto resigned as Executive Vice President, Chief Financial Officer effective June 12, 2023.
(2) Ms. Pline retired as Executive Vice President, Head of Wealth Management effective June 30, 2023.
(3) Mr. Smith was hired as the Executive Vice President, Head of Wealth Management effective June 5, 2023.
116
Compensation Best Practices
The Company aims to support the long-term interests of shareholders through best-practice compensation programs and policies. The Compensation Committee Report”reviews on an ongoing basis the Company’s executive compensation program to evaluate whether it supports the Company’s executive compensation philosophies and objectives and is aligned with shareholder interests. Our executive compensation practices are comprised of the following, each of which the Compensation Committee believes reinforces our executive compensation objectives:
Executive Compensation Program Design
What We Do | What We Don’t Do | |
☐ Align pay with performance by having the majority of 2023 target total direct compensation for NEOs consist of performance-based compensation ☐ Generally seek to position target total direct compensation for NEOs at the median of the competitive market ☐ Place appropriate focus on the role of management in investing in the future of our business through innovation, technology, and strategic alliances | ☐ No uncapped payouts under our short- or long-term incentive plans ☐ No purely formulaic calculations of annual short-term incentive bonus amounts – Compensation Committee retains the ability to exercise discretion in determining payouts |
Equity Award Practices
What We Do | What We Don’t Do | |
☐ Grant all equity awards with a multi-year vesting schedule to maintain alignment with longer-term Company performance ☐Structure the majority (55%) of equity awards as performance-based restricted stock units (“PRSUs”) in the long-term incentive plan. PRSU vesting is subject to performance relative to outperforming comparable banks over a three-year period ☐ Include non-solicitation provisions and related forfeiture | ☐ No payment of dividends or dividend equivalents on unearned performance-based units ☐ No repricing underwater stock options or backdating of options without shareholder approval |
Compensation Governance and Risk Mitigation
What We Do | What We Don’t Do | |
☐ Review our peer group annually and regularly engage in rigorous benchmarking to align our executive compensation program with the market ☐ Review and verify annually the independence of the Compensation Committee’s independent compensation consultant ☐ Conduct a periodic compensation program risk assessment ☐ Require our senior executives to satisfy meaningful stock ownership guidelines to strengthen the alignment with our shareholders’ interests ☐ Maintain a clawback policy that allows us to recover annual and long-term performance-based compensation if we are required to restate our financial results, other than a restatement due to changes in accounting principles or applicable law ☐ Hold an advisory vote on executive compensation on an annual basis to provide our shareholders with an opportunity to give feedback on our executive compensation program ☐ Cap annual performance-based cash bonuses at 150% of target | ☐ No tax gross-ups of 280G excise taxes ☐ No single-trigger change-in-control bonus payments or vesting of equity awards ☐ We do not allow for pledging of our common stock ☐ We do not allow for employees to hedge or sell short our common stock |
Compensation Committee Actions in 2023
The Compensation Committee made the following decisions in or with respect to 2023.
Action | |
✓ | Adjusted base salaries of certain NEOs based on a review of peer market data. The CEO’s base salary remained unchanged for 2023. |
✓ | Approved a 2023 Incentive Plan payout based on Company and individual performance, which was paid in February 2024 to eligible NEOs. Operating Return on Tangible Common Equity (“Operating ROTCE”) was |
117
achieved at 59.53% and Operating Income was achieved at 65.25% resulting in 62.39% award payout for Company performance. Individual achievement varied by executive and resulted in awards equal to 50% of base salary for the CEO and between 17% and 37% of base salary for the other eligible NEOs. | |
✓ | Granted equity awards in April 2023 to each NEO in the form of PRSUs (55%) and time-based restricted stock units (“RSUs”) (45%), except for (i) Mr. Sapienza, who received time-based restricted stock awards (“RSAs”) (100%) in February 2023 prior to his promotion, and (ii) Mr. Smith, who received RSUs (100%) in August 2023 in connection with his hire. |
✓ | Certified a 2021-2023 PRSU payout at 50.5% of target which was distributed on March 7, 2024. |
✓ | Engaged independent compensation consultants to provide data and advise to assist them in their deliberations. |
✓ | Maintained at risk CEO Compensation at 66% for 2023. |
✓ | Approved a compensation package for Mr. Smith as the new Head of Wealth Management following Ms. Pline’s retirement. |
The Compensation Committee approved the following compensation for each NEO:
| Base Salary | Annual Incentive Plan (AIP) Award | Long-Term Incentive (LTI) Award | Total | ||||||||||||
Executive | 2023 |
| Change from 2022 | 2023 |
| Change from 2022 | 2023 |
| Change from 2022 | 2023 |
| Change from 2022 | ||||
Denis K. Sheahan | $ | 590,545 |
| 0% | $ | 294,232 |
| -31% | $ | 800,000 |
| 0% | $ | 1,684,777 |
| -7% |
Michael F. Carotenuto (1) | $ | 338,250 |
| 0% | $ | — |
| N/A | $ | 225,000 |
| 0% | $ | 563,250 |
| -23% |
Joseph P. Sapienza (2) | $ | 300,000 |
| 60% | $ | 50,574 |
| N/A | $ | 30,083 |
| 20% | $ | 380,657 |
| 45% |
Kerri A. Mooney | $ | 310,000 |
| 8% | $ | 113,271 |
| -10% | $ | 225,000 |
| 0% | $ | 648,271 |
| 2% |
Puneet Nevatia (3) | $ | 345,000 |
| 4% | $ | 116,320 |
| -27% | $ | 175,000 |
| 0% | $ | 636,320 |
| -4% |
Jennifer A. Pline (4) | $ | 462,584 |
| 0% | $ | — |
| N/A | $ | — |
| N/A | $ | 462,584 |
| -46% |
Jeffrey F. Smith (5) | $ | 550,000 |
| N/A | $ | — |
| N/A | $ | 500,000 |
| N/A | $ | 1,050,000 |
| N/A |
118
Oversight Responsibilities for Executive Compensation
Responsible Party | Primary Role and Responsibilities Relating to Compensation Decisions |
Compensation Committee | • Oversees the executive compensation program, policies, and practices, taking into account business goals and strategies, legal and regulatory developments, and evolving best practices; • Approves performance goals for purposes of compensation decisions for the NEOs; • Conducts an annual evaluation of the President & CEO’s performance in consultation with the full Board and determines his compensation; • Reviews and approves the President & CEO’s recommendations for compensation for the other NEOs and senior executives, making changes when deemed appropriate; • Approves all changes to the composition of the peer group; and • Reviews and makes recommendations to the Board with respect to Director compensation. |
Independent Consultant to the Compensation Committee* | • Provides the Compensation Committee with analysis and advice pertaining to the President & CEO, executive, and Director compensation program design, including industry survey analysis, explanation of current and developing best practices, and regulatory changes; • Recommends a relevant group of peer companies and appropriate sources of survey data against which to compare the competitiveness and structure of the President & CEO, executive, and Director compensation; • Analyzes peer companies’ President & CEO and executive compensation annually, and Director compensation every two years, to assist the Compensation Committee in determining the appropriateness and competitiveness of the President & CEO, executive, and Director compensation; • Reviews any proposed changes to the President & CEO, executive, and Director compensation program design; • Reviews compensation disclosure materials; and • Provides specific analysis and advice periodically as requested by the Compensation Committee. |
Senior Management | •The President & CEO recommends to the Compensation Committee annual compensation for the other NEOs and senior executives based on his assessment of their performance; •The President & CEO, SVP of Human Resources work with the Compensation Committee Chairperson to set agendas, prepare materials for Compensation Committee meetings, and generally attend meetings, as appropriate, and prepare meeting minutes; and •The Chief Financial Officer also works with the SVP of Human Resources in the preparation of materials for Compensation Committee meetings. •No member of management is present in Compensation Committee meetings when matters related to his or her individual compensation is under discussion, when the Compensation Committee is approving or deliberating on the President & CEO compensation, or when the Compensation Committee otherwise meets in executive session. |
*During 2023, the Compensation Committee was assisted by its independent compensation consultant Meridian Compensation Partners, LLC. Other than the support that it provided to the Compensation Committee, Meridian Compensation Partners, LLC provided no other services to the Company or management and only received fees from the Company for the services provided to the Compensation Committee. The Compensation Committee conducted an evaluation of the independence of its advisor considering the relevant regulations of the SEC and the NASDAQ listing standards. The Compensation Committee concluded that Meridian Compensation Partners, LLC was independent of the Company and the services performed by this firms and the individual consultants employed by Meridian Compensation Partners, LLC raised no conflicts of interest.
COMPENSATION GOVERNANCE PRACTICES
How Compensation Decisions Are Made
Compensation Philosophy
The Company’s compensation philosophy is designed to provide our NEOs with a total compensation package that is competitive with market practice while varying awards to recognize Company and individual performance. The objective is to provide competitive pay for achieving performance goals consistent with the Company’s business objectives and performance compared to industry. Actual compensation should exceed market when superior performance is achieved, and be lower than market when performance falls below expectations.
In aggregate, the objectives of the Company’s compensation program are to:
Since a significant portion of the executive officers’ total compensation is performance-based (short-term and long-term incentives), the Company expects its compensation will vary on an annual basis, however, over the long-term, the executive officers compensation will align with the Company’s long-term performance. In the aggregate, the Company believes its total compensation program provides
119
appropriate balance that enables the Company to ensure proper pay-performance alignment and reduces the potential that its plans might motivate inappropriate risk-taking. The Company’s program balances:
Compensation Elements and Objectives
In support of our executive compensation philosophy and objectives, our executive compensation program consists of the following three key elements, which in total are targeted at the median of our competitive market:
Compensation Key Elements
Base Salary | |||||||||
Provides a fixed amount of compensation executives receive which is positioned generally at the median of the competitive market for similar positions, but takes into account each individual’s experience, skills, and performance, which supports our compensation philosophy of attracting and retaining talented executives. | |||||||||
| Annual Performance-Based Cash Bonus Rewards the achievement of annual goals for Company financial performance, as well as key annual individual goals that strengthen the business and position the Company for long-term success. Target bonus percentages are positioned at the median of the competitive market for similar positions. | ||||||||
Equity-Based Long-Term Incentive | |||||||||
Motivates long-term performance and aligns executives with shareholder interests, which supports our compensation philosophy of rewarding long-term performance and sustained shareholder value creation in a way that attracts and retains talented executives. Long-term incentive opportunities: 55% of award value is in the form of PRSUs and 45% in RSUs. We expect actual vesting of awards to generally align with the Company’s financial performance compared to peer institutions. | |||||||||
120
Compensation Mix
The Compensation Committee evaluates the mix of compensation components for our NEOs. Pay mix is balanced considering short and long-term time horizons, allocation between cash and equity, and between fixed and variable compensation components. In determining the compensation mix, the Compensation Committee strives to motivate near-term performance, while simultaneously focusing the executives on longer-term corporate goals that drive shareholder value.

When the Compensation Committee makes decisions with respect to each element of an executive’s compensation, it also considers the total compensation that may be awarded to the executive. The Compensation Committee makes compensation decisions that are consistent with the Company’s compensation philosophy, considering each element and the combined total compensation delivered through the Company’s executive compensation programs.
Use of Peer Group and Survey Information
The Compensation Committee engaged Meridian Compensation Partners, LLC to conduct a competitive review of the Company’s executive compensation program. The review included an analysis of similarly-sized publicly traded banks in the region (peer group) and national and regional surveys that cover a wider group of relevant companies. The Compensation Committee uses the competitive review in conjunction with other data and considerations when making executive compensation decisions.
The Compensation Committee engaged Meridian Compensation Partners, LLC to assess the relevance of the companies within the peer group and suggest changes where appropriate. Banks selected as peers for compensation purposes are publicly traded banks that align with some or all of the following criteria:
Based on these criteria, the following companies were included in the Company’s Proxy Statementpeer proxy group for analyses relating to 2023 compensation:
Arrow Financial | German American Bancorp |
Bar Harbor Bankshares | HBT Financial |
Camden National | Orrstown Financial Services |
CNB Financial | Peapack-Gladstone Financial |
Community Trust Bancorp | S&T Bancorp |
121
Enterprise Bancorp | Stock Yards Bancorp |
Financial Institutions | Tompkins Financial |
First Business Financial Services | Univest Financial |
First Mid Bancshares | Washington Trust Bancorp |
Compensation Program Elements
Base Salary
In early 2023, the Compensation Committee maintained the current base salaries for Messrs. Sheehan and Carotenuto and Ms. Pline. Mr. Nevatia and Ms. Mooney received a merit increase and a market adjustment to further reflect the responsibilities and duties of the role. Adjustments were effective January 1, 2023 for Ms. Mooney and July 1, 2023 for Mr. Nevatia. Upon Mr. Sapienza’s appointment to Senior Vice President, Interim Chief Financial Officer, his base salary was adjusted, effective July 1, 2023.
Executive | 2023 Base Salary |
| Increase (%) | 2022 Base Salary |
| ||
Denis K. Sheahan | $ | 590,545 |
| 0% | $ | 590,545 |
|
Michael F. Carotenuto (1) | $ | 338,250 |
| 0% | $ | 338,250 |
|
Joseph P. Sapienza | $ | 300,000 |
| 60% | $ | 186,919 |
|
Kerri A. Mooney | $ | 310,000 |
| 8% | $ | 286,574 |
|
Puneet Nevatia | $ | 345,000 |
| 4% | $ | 330,971 |
|
Jennifer A. Pline (2) | $ | 462,584 |
| 0% | $ | 462,584 |
|
Jeffrey F. Smith (3) | $ | 550,000 |
| N/A | N/A |
| |
(1) Mr. Carotenuto resigned from the Company effective on June 12, 2023.
(2) Ms. Pline retired from the Company effective on June 30, 2023.
(3) Mr. Smith was hired as the Executive Vice President, Head of Wealth Management effective June 5, 2023.
Short-Term Incentives
The 2023 Incentive Plan is the Company’s short-term incentive compensation plan. It is an annual plan that begins each January 1, the first day of the Company’s fiscal year.
Performance goals are established in two performance categories: Company and individual performance. The Company performance metrics for 2023 were operating Return on Tangible Common Equity (ROTCE) and Pre-tax Operating Income. The operating ROTCE (after-tax) performance was compared to budget. The operating income goal was tied to the Company’s fiscal year budget and reflected operating income prior to security gains/losses and taxes and other extraordinary items including merger charges and other non-recurring expenses. Individual goals focused on either department/team performance (e.g. lending growth, deposit growth) and/or individual performance. The mix of goals varied by role.
In order for any award to be paid under the plan, The Company must achieve at least 50% of its targeted pre-tax operating income. Assuming the pre-tax operating income hurdle is achieved, payouts under the 2023 Incentive Plan are determined by multiplying the target award by the weighted percentage of performance achieved for Company and individual performance. Award payouts range from 0% to 150% of an executive’s award opportunity based on achieving Company and individual performance goals.
The payout under the 2023 Incentive Plan was determined by multiplying the target award by the weighted percentage of performance achieved for Company and individual performance.
Overall Performance | ||||||||
Target Annual | x | Company | + | Individual | = | Actual Annual Cash Incentive | ||
25% - 75% Weighting | 25% - 75% Weighting | |||||||
122
The Compensation Committee administers the 2023 Incentive Plan and has final authority with respect to all matters or disputes relating to the plan. The 2023 Incentive Plan expressly reserved the Compensation Committee’s right, in its sole and absolute discretion, to reduce, including a reduction to zero, any award otherwise payable. Payouts under the 2023 Incentive Plan are subject to a clawback provision, as well as any similar provisions of applicable law or regulation.
The Compensation Committee has the right, in its sole and absolute discretion, to make adjustments to the Company performance factor within the defined parameters set forth in the 2023 Incentive Plan including the following: one-time, non-recurring, or extraordinary events or any other reason that the Compensation Committee deems appropriate; to adjust any awards by considering factors such as regulatory compliance and credit quality; and to reduce, including a reduction to zero, any cash award otherwise payable.
Taking into consideration the recommendations of the independent compensation consultants and the CEO’s recommendations for the 2018other NEOs, the Compensation Committee assigns each eligible NEO an incentive award target as a percentage of year end base salary. The Compensation Committee also assigns each eligible NEO a weighting between Company and individual performance. All eligible NEOs have a meaningful portion based on Company performance. In general, the eligible NEOs with business line responsibilities also have a significant weighting on the achievement of business unit responsibilities.
The following table presents the incentive opportunities and weightings for the 2023 Incentive Plan for eligible NEOs.
Executive | Target as a Percentage of Base Salary | Company Performance Weighting | Individual Performance Weighting |
Denis K. Sheahan | 60% | 75% | 25% |
Michael F. Carotenuto (1) | 40% | 75% | 25% |
Joseph P. Sapienza | 40% | 75% | 25% |
Kerri A. Mooney | 40% | 25% | 75% |
Puneet Nevatia | 40% | 75% | 25% |
Jennifer A. Pline (1) | N/A | N/A | N/A |
Jeffrey F. Smith (1) | N/A | N/A | N/A |
(1) Messrs. Carotenuto and Smith and Ms. Pline did not receive a payout under the 2023 Incentive Plan.
Company Performance Measures and Goals. The Compensation Committee reviewed and approved the 2023 Company performance measures and weightings of the 2023 Incentive Plan. Target Company performance is based on the 2023 corporate budget as approved by the Board. In determining the 2023 Operating ROTCE and Operating Income targets noted in the table below, the Compensation Committee reviewed 2022 target levels and actual results along with management’s 2023 budgeting expectations. Both the 2023 Operating Income and 2023 Operating ROTCE per budget target were reduced from 2022. While the Company continued to have a strong earnings profile, the impact of a rising interest rate environment had an anticipated unfavorable impact on budgeted earnings in 2023.
The following table summarizes the outcomes of the 2023 Incentive Plan, resulting in a total achievement of 62.39% of target for the Company Performance component.
Company Performance Measures | 2023 Company Performance Goals | Actual Performance | |||
(Equally Weighted) | Threshold | Target | Stretch | ||
Operating Return on Tangible Common Equity (ROTCE) | 80% of budgeted ROTCE 8.46% | 100% of budgeted ROTCE per budget 10.57% | 120% of budgeted ROTCE 12.69% | 8.86% ROTCE or 59.53% | |
Operating Income | 80% of budgeted $49.8 million | Operating income per $62.2 million | 120% of budgeted $74.7 million Total Achievement: | $53.6 million or 65.25% 62.39% | |
123
Individual Performance Measures and Goals. In addition to the Company performance, participants had individual goals that focused on department/team performance (such as lending growth or deposit growth) and/or individual performance. The mix of these goals varies by role. Performance targets and ranges for each measure were set at the beginning of 2023. If performance-to-goal cannot be quantified, committee judgment was used to evaluate goal attainment.
The following table describes the respective NEO’s achievement against his or her individual goals under the 2023 Incentive Plan and the payout percentage, as approved by the Compensation Committee with respect to the respective NEO:
Executive (1) | Percentage Achieved | Individual Performance Goal Results |
Denis K. Sheahan | 145.0% | • Executed on specific financial objectives, focused on strengthening liquidity and capital during a challenging environment • Executed on specific duties related to the pending merger with Eastern Bank • Achieved leadership goals (2) |
Joseph P. Sapienza | 150.0% | • Assumed Interim Chief Financial Officer role in July 2023 • Executed on specific duties related to the pending merger with Eastern Bank • Managed the successful completion of the Northmark Bank core system conversion • Improved internal and external reporting • Achieved leadership goals (2) |
Kerri A. Mooney | 101.0% | • Managed deposit retention • Led improvements to client experience • Assisted in development of digital banking strategy • Executed on specific duties related to the pending merger with Eastern Bank • Achieved leadership goals (2) |
Puneet Nevatia | 150.0% | • Led the successful completion of the Northmark Bank core system conversion • Oversaw continued improvement to information security and information technology infrastructure • Executed on specific duties related to the pending merger with Eastern Bank • Implemented and supported business line platforms • Achieved leadership goals (2) |
(1) Messrs. Carotenuto and Smith and Ms. Pline did not receive a payout under the 2023 Incentive Plan.
(2) Leadership goals for each NEO generally involve specific operational objectives in the executive’s business line or function along with goals related to management such as employee development and engagement.
Incentive Plan Award Payouts. Payouts were made to eligible NEOs under the 2023 Incentive Plan based on their achievement of both Company and individual goals. Messrs. Carotenuto and Smith and Ms. Pline did not receive a payout under the 2023 Incentive Plan. The Compensation Committee has discretion under the management incentive plan to withhold or adjust any incentive compensation in its sole discretion as it deems appropriate.
The portion of payouts under the 2023 Incentive Plan were based on performance against Company results, assessed against threshold, target and stretch performance levels as described above. Payouts for performance between threshold and stretch were calculated using straight line interpolation using a 50% payout for threshold performance, a 100% payout for target performance, and a 150% payout for
124
stretch performance. The following table shows the Company’s performance against each Bank performance measure and the resulting payout percentage (dollars in thousands):
Using the tables above the eligible NEOs who were participants in the 2023 Incentive Plan at the end of the fiscal year achieved the following.
| Target Short-Term Incentive Opportunity |
| Bank Performance |
| Individual Performance |
| Short-Term Incentive Paid (2) |
| % of | ||||||||||||
|
|
| Target |
| Earned % | Subtotal |
| Target |
| Earned % | Subtotal |
|
|
|
| ||||||
Denis K. Sheahan | $ | 354,327 |
| $ | 265,745 |
| 62.39% | $ | 165,788 |
| $ | 88,582 |
| 145.0% | $ | 128,444 |
| $ | 294,232 |
| 83.0% |
Joseph P. Sapienza (1) | $ | 60,000 |
| $ | 45,000 |
| 62.39% | $ | 28,074 |
| $ | 15,000 |
| 150.0% | $ | 22,500 |
| $ | 50,574 |
| 84.0% |
Kerri A. Mooney | $ | 124,000 |
| $ | 31,000 |
| 62.39% | $ | 19,341 |
| $ | 93,000 |
| 101.0% | $ | 93,930 |
| $ | 113,271 |
| 91.0% |
Puneet Nevatia | $ | 138,000 |
| $ | 103,500 |
| 62.39% | $ | 64,570 |
| $ | 34,500 |
| 150.0% | $ | 51,750 |
| $ | 116,320 |
| 84.0% |
In January 2024, the Compensation Committee and the Company’s Board approved the following payouts to the eligible NEOs under the 2023 Incentive Plan:
|
|
|
| |
| Payout (1) |
| % of Base Salary | |
Denis K. Sheahan | $ | 294,232 |
| 50% |
Joseph P. Sapienza (2) | $ | 50,574 |
| 17% |
Kerri A. Mooney | $ | 113,271 |
| 37% |
Puneet Nevatia | $ | 116,320 |
| 34% |
Other Short-Term Incentives
Mr. Smith was hired as Executive Vice President, Head of Wealth Management, effective June 5, 2023 and was not eligible for a payout under the 2023 Incentive Plan. Pursuant to Mr. Smith’s offer letter, dated May 17, 2023, he is eligible to receive a cash sign-on incentive bonus of $750,000 that is payable in two installments, less applicable withholdings, of which $450,000 was payable in 2023 and the remaining $300,000 is payable in the first payroll cycle in 2024 after the anniversary of his start date, subject to continued service through such date (the “Smith Cash Sign-on Incentive”). The Smith Cash Sign-on Incentive is subject to a clawback provision.
Mr. Carotenuto resigned as Executive Vice President, Chief Financial Officer, effective June 12, 2023. Prior to Mr. Carotenuto’s departure and to reward him for his assistance with the Eastern Bankshares Inc. merger announced in 2023, Mr. Carotenuto received a one-time cash bonus of $175,000.
Mr. Sapienza was named Interim Chief Financial Officer, effective July 1, 2023. In connection with Mr. Sapienza’s promotion, he became eligible to participate in the 2023 Incentive Plan beginning as of July 1, 2023. Mr. Sapienza also received a bonus totaling $30,563 from a broad-based bonus pool available to employees.
Long-Term Incentives
Equity compensation and stock ownership link the net worth of executive officers to the performance of the Company’s common stock. The Compensation Committee believes long-term incentive awards serve three key purposes:
125
The Compensation Committee reviewed peer practices and proxy advisor guidelines and made two changes to the long-term incentive program in 2023 to reflect market practices and alignment between pay and performance. The mix of time and performance contingent awards was rebalanced from 25% RSUs and 75% PSUs in 2022 to 45% RSUs and 55% PRSUs in 2023, which is more reflective of peer practices, aids in the Company’s retention of executives and promotes greater stock ownership. In conjunction with this change, the Compensation Committee adjusted the relative performance grid to require greater than median performance for a target-level payout under the program and the stretch-level was reduced from 90th percentile to 75thpercentile, reflecting the practices predominant among our peer group.
Based on the grant date value of the awards and assuming target level of achievement, the 2023 long-term incentive (“LTI”) awards granted to our NEOs were composed 45% of RSUs, which vest based on service requirements alone, and 55% of PRSUs, which vest based on a combination of performance and service requirements, except for (i) Mr. Sapienza, who received 100% RSAs, and (ii) Mr. Smith, who received 100% RSUs.
PRSUs awarded in 2023 vest based on the Bank’s relative operating ROA as compared to the performance of banks included in a comparator index. Operating ROA was chosen to encourage multi-year earnings growth and a level of strong Bank profitability that should result ultimately in strong shareholder value creation. The bank comparator index is defined as publicly traded banks in the northeast U.S. with assets between $1 billion and $10 billion. Any dividends declared during the performance period are accrued and paid out in cash only to the extent that the PRSUs are earned following the completion of the performance period.
The range of performance levels and corresponding payout schedule is shown in the table below. In 2023, the Compensation Committee reviewed the relative performance percentile positioning, and adjusted the percentile positing for target- and stretch-level performance. These adjustments reflect the Compensation Committees review of proxy advisor commentary and practices among the Company’s peer group.
Threshold | Target | Stretch | ||||||||
Relative three-year average operating ROA | 25th percentile | 55th percentile | 75th percentile | |||||||
Payout | 25% of award | 100% of award | 200% of award | |||||||
2023 Target LTI Awards
The following table summarizes the grant-date fair value of the awards calculated using the closing price on the grant date multiplied by the units awarded of the 2023 LTI awards for those NEOs who were eligible to receive a grant in 2023. The table assumes the PRSUs vest based on target level of achievement:
2023 Long-Term Incentive Target Values |
| |||||||||||
Executive (1) | PRSUs (at Target) (2) |
| RSUs |
| RSAs |
| Total Grant-Date Fair Value |
| ||||
Denis K. Sheahan | $ | 440,000 |
| $ | 360,000 |
| $ | — |
| $ | 800,000 |
|
Joseph P. Sapienza | $ | — |
| $ | — |
| $ | 30,082 |
| $ | 30,082 |
|
Kerri A. Mooney | $ | 123,750 |
| $ | 101,250 |
| $ | — |
| $ | 225,000 |
|
Puneet Nevatia | $ | 96,250 |
| $ | 78,750 |
| $ | — |
| $ | 175,000 |
|
Jeffrey F. Smith | $ | — |
| $ | 500,024 |
|
|
| $ | 500,024 |
| |
2021 PRSU Results and Final Award Payouts
In February 2021, the Company granted PRSU awards to certain eligible executives, including NEOs Messrs. Sheahan, Carotenuto and Nevatia and Ms. Mooney and Pline. The 2021 PRSUs were eligible to vest upon achievement of Operating ROA and Operating EPS as
126
compared to the comparator index for the period January 1, 2021 through December 31, 2023. The final award payouts are summarized in the following tables.
The table below presents the PRSU performance metrics and weightings. Performance levels and payouts were based on prevalent market practices for performance contingent equity awards using relative metrics.
|
| Percentile vs. Comparator Group |
| Payout as a % of Award Target | ||||
Performance Metric | Weighting | Threshold | Target | Stretch |
| Threshold | Target | Stretch |
Relative three-year average operating ROA | 50% | 25th | 50th | 90th |
| 25% | 100% | 200% |
Relative three-year average operating diluted EPS growth performance | 50% | 25th | 50th | 90th |
| 25% | 100% | 200% |
Total | 100% |
|
|
|
|
|
|
|
Based on the Company’s performance against the established comparator index through December 31, 2023, the Compensation Committee determined that these awards would vest at 50.5% of target.
Performance Metric | Weighting | Percentile Rank | Payout % of Target |
Relative three-year average operating ROA | 50% | 42th | 38.0% |
Relative three-year average operating diluted EPS growth performance | 50% | 25th | 12.5% |
Total | 100% |
| 50.5% |
The following table presents the number of PRSUs at target and vesting at 50.5% of target for the 2021 – 2023 performance period for each NEO.
Executive (1) | Target # of Shares |
| # of Shares Vested |
| ||
Denis K. Sheahan (2) |
| 5,862 |
|
| 2,961 |
|
Kerri A. Mooney |
| 1,649 |
|
| 833 |
|
Puneet Nevatia |
| 916 |
|
| 463 |
|
Jennifer A. Pline |
| 1,374 |
|
| 694 |
|
Other Long-Term Incentives
Mr. Smith was hired as Executive Vice President, Head of Wealth Management, effective June 5, 2023. In connection with his offer letter, Mr. Smith was awarded a new hire time-vested RSU award with a fair market value of $500,000 on August 15, 2023, conditioned on his continued service through the grant date. Mr. Smith’s 2023 time-vested RSU will vest ratable over a three-year period, subject to the applicable terms and conditions, including the Bank’s right to recoupment of any vested portion of the RSUs in the event Mr. Smith is terminated for cause (as defined in Mr. Smith’s offer letter) or if he voluntarily resigns employment prior to the third anniversary of his hire. Mr. Smith will not participate in the long-term incentive plan until January 1, 2025.
Prior to Mr. Sapienza’s promotion to Senior Vice President, Interim Chief Financial Officer, he was awarded a time-vested RSA award with a fair market value of $30,083 calculated using the closing price on the grant date of February 15, 2023 multiplied by the number of shares awarded. Mr. Sapienza’s 2023 time-vested RSAs will vest ratable over a five-year period, subject to the applicable terms and conditions.
Retirement Benefits
Nonqualified Retirement Plans for Executive Officers. The Company maintains several nonqualified retirement programs for executive officers. Historically, the Board provided a nonqualified defined benefit supplemental executive retirement plan (a “DB SERP”) to help accomplish the objectives of its nonqualified executive officer retirement program. In 2016, the Board approved, at the recommendation of the Compensation Committee, a change to this program. New entrants to the Company’s nonqualified deferred compensation program for executives are now provided a periodic Company contribution to the Cambridge Trust Company Executive Deferred Compensation Plan (the “EDCP”), a nonqualified defined contribution supplemental executive retirement plan, pursuant to individual participation agreements (each, a “DC SERP Agreement”). As of December 31, 2023, only Mr. Sheahan had a DB SERP. Mr. Carotenuto and Ms. Pline participate in the EDCP with additional Company contributions under a DC SERP Agreement. Mr. Carotenuto and Ms. Pline’s participation in the EDCP ceased upon their separation from service with the Company and the Bank. For detailed descriptions of Mr.
127
Sheahan’sDB SERP and the DC SERP Agreements for the other eligible NEOs, please refer to the sections entitled “Executive Compensation Tables – Pension Benefits” and “Executive Compensation Tables – Nonqualified Deferred Compensation,” respectively.
The EDCP also permits certain highly compensated employees of the Company to defer up to 50% of their base salaries, up to 100% of annual incentive compensation, and 100% of any award of RSUs or PRSUs. The Compensation Committee administers the EDCP and annually selects the employees who are eligible to participate. Each participant is 100% vested in his or her account and has the right to direct the deemed investment of his or her account balance by choosing from among investment alternatives made available by the Compensation Committee, with any deferrals of RSUs or PRSUs deemed invested in Company common stock. The deemed investments are credited with earnings or losses arising from the investment fund performance. No participant account is credited with above-market or preferential returns pursuant to the terms of the EDCP. A participant’s account balance will be paid out, subject to the terms of the EDCP. Subject to the terms of the EDCP, participants will receive a distribution of their deferred compensation account balance upon a separation from service, or upon death or disability, in a lump sum payment, unless the participant has elected annual installment payments (when available). Participants may also elect to receive an in-service distribution and distribution in the event of an unforeseeable emergency is available. Mr. Sheahan was the only NEO who deferred into the EDCP in 2023.
Qualified Retirement Plans for Executive Officers. The Company sponsors the Cambridge Bancorp Employee Retirement Plan, a tax-qualified, non-contributory defined benefit pension plan (the “DB Plan”) covering substantially all employees hired before May 2, 2011, including Mr. Sapienza. The plan was frozen to new employees hired after that date. In October 2017, the Company announced its decision to freeze the accrual of benefits for all participants in the DB Plan, effective as of December 31, 2017. The actuarially determined present values of the NEO’s retirement benefits as of the end of last year are reported in the section entitled “Executive Compensation Tables – Pension Benefits.” Mr. Sapienza is the only NEO who participates in the DB Plan.
The Company also maintains a tax-qualified defined contribution plan (the “Profit Sharing Plan” or “401(k) Plan”) that provides for deferral of federal and state income taxes on employee contributions allowed under Section 401(k) of the Internal Revenue Code of 1986, as amended (the “Internal Revenue Code”). The Company matches employee contributions up to 100% of the first 4% of each participant’s salary. Each year, the Company may also make discretionary contributions to the Profit Sharing Plan. Employees, including our NEOs, are eligible to participate in the 401(k) feature of the Profit Sharing Plan on the first day of their initial date of service. Employees, including our NEOs, are eligible to participate in the discretionary contribution portion of the Profit Sharing Plan on the first day of their initial date of service. The employee must be employed on the last day of the calendar year or retire at the normal retirement age of 65 during the calendar year to receive the discretionary contribution. All of the NEOs participated in the 401(k) Plan in 2023.
In addition to the DB Plan and the Profit Sharing Plan, the Company maintains the ESOP. The ESOP is a tax-qualified defined contribution plan in which our employees, including our NEOs, are eligible to participate on either January 1 or July 1 of each year, whichever date occurs soonest after the employee has attained the age of 21 and completed 12 months of service consisting of at least 1,000 hours of service. In general, pursuant to the terms of the ESOP, the Company contributes funds to the ESOP trust fund, and the contributed funds are allocated among all the participants’ accounts according to their relative levels of compensation (subject to IRS limits). During 2023 all of our NEOs, other than Mr. Smith, participated in the ESOP.
Perquisites
The Company provides certain perquisites to Mr. Sheahan that the Compensation Committee believes are reasonable and consistent with the Company’s overall compensation program. To encourage his active presence in our local community, the Company reimburses Mr. Sheahan a net benefit amount of up to $50,000 per year for expenses incurred in connection with maintaining housing near our Harvard Square office, and as a car allowance, net of income taxes resulting from such reimbursements. In 2023, the Company reimbursed Mr. Sheahan for housing and car expenses in the amount of $50,000, and for the income taxes resulting from such reimbursements in the amount of $36,207. The attributed costs of the perquisites provided to Mr. Sheahan for 2023 are included in the “All Other Compensation” column of the “Summary Compensation Table” in the Executive Compensation section of this Item 11.
Change in Control Agreements and Other Severance Arrangements
The Company has entered into double-trigger change in control letter agreements with certain key employees, including the NEOs. The change in control arrangements are designed to promote stability and continuity of senior leadership. The Compensation Committee believes that the interests of shareholders will be best served if the interests of management are aligned with them. The Compensation Committee further believes that providing change in control benefits should eliminate, or at least reduce, the reluctance of management to pursue potential change in control transactions that may be in the best interests of shareholders. Messrs. Nevatia, Sheahan, Smith and Sapienza, and Ms. Mooney currently maintain change in control agreements with the Company. Mr. Smith also has a severance benefit under the terms of his offer letter with the Bank in the event his employment is terminated without cause (as defined in Mr. Smith’s offer letter) within 12 months of his date of hire.
128
Transition Agreement. On December 30, 2022, Ms. Pline entered into a Transition Agreement and General Release with the Company and the Bank in connection with a leadership change within the Company’s Wealth Management division. As consideration for entering into the agreement, which includes a customary general release of claims against the Company and the Bank from Ms. Pline, Ms. Pline retired as of June 30, 2023 and transitioned her knowledge, duties and responsibilities to the Bank’s Chief Executive Officer or his designee in exchange for a lump sum cash payment equal to twelve months of her base salary, and such separation payments totaled $462,584. In connection with her separation of service, Ms. Pline resigned all officer and director positions with the Company, the Bank and the Cambridge Trust Company Foundation, as applicable.
Tax and Accounting Considerations
Taxation of “Parachute” Payments. Sections 280G and 4999 of the Internal Revenue Code provide that certain individuals who hold significant equity interests in the Company and certain executive officers and other service providers may be subject to significant additional taxes if they receive payments or benefits in connection with a change in control of the Company that exceed certain prescribed limits, and that we (or our successor) may forfeit a deduction on the amounts subject to this additional tax. We did not provide any executive officer, including any of the NEOs, with a “gross-up” or other reimbursement payment for any tax liability that the executive officer might owe as a result of the application of Sections 280G or 4999 of the Internal Revenue Code, and we have not agreed, and are not otherwise obligated, to provide any executive officer with such a “gross-up” or other reimbursement.
Accounting for Stock-Based Compensation. The Company follows Financial Accounting Standards Board Accounting Standards Codification Topic 718 (“ASC 718”), for our stock-based compensation awards. ASC 718 requires companies to measure the compensation expense for all share-based payment awards made to employees based on the grant date fair value of these awards. This calculation is performed for accounting purposes and reported in the compensation tables below, even though our executive officers may never realize any value from their awards.
Compensation Policies and Practices
Summary | |
Director Stock Ownership, Executive Stock Ownership and Retention of Stock | In December 2017, the Compensation Committee approved stock ownership guidelines intended to ensure that the interests of our executives and directors are economically aligned with those of our shareholders. The requirements under that policy were determined after a review of peer and broader market ownership guideline levels. These guidelines establish target levels of ownership of our common stock within five years (either by December 31, 2023, or within five years of becoming subject to the guidelines). Guidelines are calculated based on the following multiples of compensation: • President and Chief Executive Officer – a multiple of three times annual base salary; • Other Executive Officers – a multiple of one times annual base salary; and • Non-Employee Directors – three times annual equity retainer. The Compensation Committee believes that the target multiples applicable to the President & Chief Executive Officer and our other executive officers are appropriate given the greater relative scope of responsibilities relating to long-term shareholder value creation associated with those positions. These target levels determine whether the executive must retain additional stock acquired upon the vesting and release of restricted stock awards (“RSAs”) or restricted stock units (including RSUs and PRSUs). Specifically, unless and until the value of our common stock held by a participant equals or exceeds his or her target level at the end of a calendar year, this executive must retain: • At least 50% of our common stock received upon the vesting and release of RSAs or restricted stock units during the following year, after payment or withholding of any applicable exercise price and taxes; and • All other shares of our common stock held by the participant. We apply the value of unvested RSAs and RSUs toward satisfying these guidelines, but do not apply the value of unvested PRSUs, as the PRSUs are “at risk” and the associated shares may or may not ultimately be delivered. Compliance with the guidelines will be measured annually as of December 31 and reviewed by the Compensation Committee. As of year-end 2023, all NEOs who have been subject to the guidelines for five years or longer have achieved the stock ownership guidelines. |
Recovery of Incentive Compensation (Clawback Provisions) | Under our incentive plans or award agreements in which the NEOs participate, we may seek to recover certain performance-based incentive compensation (including incentive-based equity compensation) granted to our executives in the event we are required to restate our financial results, other than a restatement due to changes in accounting principles or applicable law. |
Policy on Short Sales, Derivatives, Hedging, and Pledging of Stock | Pursuant to our Insider Trading and Confidentiality Policy (the “Policy”), no employee (including officers) or non-employee director of the Company may engage in short sales of our securities, purchases or sales of puts, calls or other derivative securities based on our securities, or purchases of financial instruments that are |
129
designed to hedge or offset any decrease in the market value of our securities. The Policy also prohibits our directors and senior executives from pledging or otherwise encumbering our equity securities as collateral for indebtedness, including holding shares in a margin or similar account that would subject our equity securities to margin calls. | |
Equity Grant Practices | The Company’s practice is to grant annual equity awards to eligible recipients, including our NEOs, typically during the first quarter of the year. In the event of grants related to new hires or other off-cycle awards, the grants are generally made during the mid-month of each quarter following approval of the award. |
Compensation Risk Assessment | The Compensation Committee oversees a periodic risk assessment of the Company’s compensation programs to determine whether such programs are reasonably likely to have a material adverse effect on the Company. For 2023, the Compensation Committee concluded that the Company’s compensation programs were appropriately balanced to mitigate compensation-related risk with cash and stock elements, financial and non-financial goals, formal goals and discretion, and short-term and long-term rewards. The Company also has policies to mitigate compensation-related risk, including stock ownership guidelines, clawback provisions, and prohibitions on employee pledging and hedging activities, as described above. Furthermore, the Compensation Committee believes the Company’s policies on ethics and compliance along with its internal controls also mitigate against unnecessary or excessive risk-taking. |
Clawback Policy
In November 2023, the Board of Directors adopted the Cambridge Bancorp Incentive Compensation Recoupment Policy (the “Clawback Policy”), effective October 2, 2023, in accordance with Rule 10D-1 of the Exchange Act and NASDAQ listing standards. The Clawback Policy applies to current and former executive officers of the Company as defined in Rule 10D-1 (“Covered Executives”), and will be administered by the Compensation Committee. In the event the Company is required to prepare an accounting restatement, it is the Company’s policy to recover excess incentive compensation received by any Covered Executive during the recoupment period. A copy of the Clawback Policy is filed as Exhibit 97.1 to this Annual MeetingReport on Form 10-K.
Compensation Committee Report
The Compensation Committee met with management to review and discuss the Compensation Discussion and Analysis disclosures discussed above. Based on such review and discussion, the Compensation Committee recommended to the Board of Shareholders,Directors that the Compensation Discussion and Analysis be included in this Annual Report on Form 10-K for the 2023 fiscal year, and the Board of Directors has approved the recommendation.
Compensation Committee of the Board of Directors of Cambridge Bancorp | |
Jeanette Clough Pamela A. Hamlin (Chair) | |
Hambleton Lord Leon Palandjian Laila S. Partridge Cathleen A. Schmidt |
130
Executive Compensation Tables
SUMMARY COMPENSATION TABLE
The following information is furnished for the principal executive officer, the principal financial officer, the former principal financial officer, the next three most highly compensated current executive officers, and one highly compensated former executive officer of the Company, for the fiscal year ended December 31, 2023. These individuals are referred to in this Annual Report on Form 10-K as “NEOs.”
Name and Principal Position |
| Year |
| Salary |
|
| Bonus |
|
| Stock Awards |
|
| Non-Equity Incentive Plan Compensation |
|
| Change in |
|
| All Other Compensation |
|
| Total |
| |||||||
(a) |
| (b) |
| (c) |
|
| (d) |
|
| (e) |
|
| (g) |
|
| (h) |
|
| (i) |
|
| (j) |
| |||||||
Denis K. Sheahan, |
| 2023 |
| $ | 590,545 |
|
| $ | — |
|
| $ | 800,000 |
|
| $ | 294,232 |
|
| $ | 33,700 |
|
| $ | 105,510 |
|
| $ | 1,823,987 |
|
President & CEO |
| 2022 |
| $ | 590,545 |
|
| $ | — |
|
| $ | 800,000 |
|
| $ | 428,334 |
|
| $ | — |
|
| $ | 116,480 |
|
| $ | 1,935,359 |
|
|
| 2021 |
| $ | 565,495 |
|
| $ | — |
|
| $ | 600,000 |
|
| $ | 431,701 |
|
| $ | 250,861 |
|
| $ | 118,255 |
|
| $ | 1,966,312 |
|
Michael F. Carotenuto, |
| 2023 |
| $ | 182,135 |
|
| $ | 175,000 |
|
| $ | 225,000 |
|
| $ | — |
|
| $ | — |
|
| $ | 38,460 |
|
| $ | 620,595 |
|
Former EVP, CFO (4) |
| 2022 |
| $ | 338,250 |
|
| $ | — |
|
| $ | 225,000 |
|
| $ | 166,942 |
|
| $ | — |
|
| $ | 79,601 |
|
| $ | 809,793 |
|
|
| 2021 |
| $ | 304,030 |
|
| $ | — |
|
| $ | 168,750 |
|
| $ | 155,117 |
|
| $ | — |
|
| $ | 28,636 |
|
| $ | 656,533 |
|
Joseph P. Sapienza, SVP, Interim CFO (5) |
| 2023 |
| $ | 243,284 |
|
| $ | 30,562 |
|
| $ | 30,083 |
|
| $ | 50,574 |
|
| $ | — |
|
| $ | 15,804 |
|
| $ | 370,307 |
|
Kerri A. Mooney, EVP, CDO |
| 2023 |
| $ | 310,000 |
|
| $ | — |
|
| $ | 225,000 |
|
| $ | 113,271 |
|
| $ | — |
|
| $ | 18,486 |
|
| $ | 666,757 |
|
Puneet Nevatia, EVP, CIO |
| 2023 |
| $ | 337,716 |
|
| $ | — |
|
| $ | 175,000 |
|
| $ | 116,320 |
|
| $ | — |
|
| $ | 19,303 |
|
| $ | 648,339 |
|
Jennifer A. Pline, |
| 2023 |
| $ | 231,292 |
|
| $ | — |
|
| $ | — |
|
| $ | — |
|
| $ | — |
|
| $ | 475,784 |
|
| $ | 707,076 |
|
Former EVP, WM (6) |
| 2022 |
| $ | 462,584 |
|
| $ | — |
|
| $ | 225,000 |
|
| $ | 170,997 |
|
| $ | — |
|
| $ | 96,279 |
|
| $ | 954,860 |
|
|
| 2021 |
| $ | 442,963 |
|
| $ | — |
|
| $ | 168,750 |
|
| $ | 197,563 |
|
| $ | — |
|
| $ | 92,286 |
|
| $ | 901,562 |
|
Jeffrey F. Smith, EVP, WM (7) |
| 2023 |
| $ | 306,731 |
|
| $ | 450,000 |
|
| $ | 500,000 |
|
| $ | — |
|
| $ | — |
|
| $ | 1,058 |
|
| $ | 1,257,789 |
|
131
|
|
| 401(k) Plan Company Contributions(1) |
|
| ESOP Company Contributions(2) |
|
| Company Contributions to DC SERP(3) |
|
| Personal Expense Reimbursements(4) |
|
| Severance and Separation Payments |
|
| Total |
| ||||||
Denis K. Sheahan |
|
| $ | 13,200 |
|
| $ | 6,103 |
|
| $ | — |
|
| $ | 86,207 |
|
| $ | — |
|
| $ | 105,510 |
|
Michael F. Carotenuto |
|
| $ | 13,200 |
|
| $ | — |
|
| $ | 25,260 |
|
| $ | — |
|
| $ | — |
|
| $ | 38,460 |
|
Joseph P. Sapienza |
|
| $ | 10,134 |
|
| $ | 5,670 |
|
| $ | — |
|
| $ | — |
|
| $ | — |
|
| $ | 15,804 |
|
Kerri A. Mooney |
|
| $ | 12,383 |
|
| $ | 6,103 |
|
| $ | — |
|
| $ | — |
|
| $ | — |
|
| $ | 18,486 |
|
Puneet Nevatia |
|
| $ | 13,200 |
|
| $ | 6,103 |
|
| $ | — |
|
| $ | — |
|
| $ | — |
|
| $ | 19,303 |
|
Jennifer A. Pline |
|
| $ | 13,200 |
|
| $ | — |
|
| $ | — |
|
| $ | — |
|
| $ | 462,584 |
|
| $ | 475,784 |
|
Jeffrey F. Smith |
|
| $ | 1,058 |
|
| $ | — |
|
| $ | — |
|
| $ | — |
|
| $ | — |
|
| $ | 1,058 |
|
The following table sets forth information on plan-based awards made to eligible NEOs in 2023.
|
|
|
|
|
|
|
|
|
|
|
|
|
|
|
|
|
| All Other |
|
|
| Grant |
| ||||||||
|
|
|
|
|
|
|
|
|
|
|
|
|
|
|
|
|
| Stock |
|
|
| Date |
| ||||||||
|
|
|
|
|
|
|
|
|
|
|
|
|
|
|
|
|
| Awards: |
|
|
| Fair |
| ||||||||
|
|
|
|
|
|
|
|
|
|
|
|
|
|
|
|
|
| Number |
|
|
| Value of |
| ||||||||
|
|
|
| Estimated Future |
|
| Estimated Future |
|
| of Shares |
|
|
| Stock and |
| ||||||||||||||||
|
|
|
| Payouts Under Non-Equity |
|
| Payouts Under |
|
| of Stock |
|
|
| Option |
| ||||||||||||||||
|
|
|
| Incentive Plan Awards (1) |
|
| Equity Incentives Plan Awards (2) |
|
| or Units (3) |
|
|
| Awards (4) |
| ||||||||||||||||
Name |
| Grant Date |
| Threshold |
| Target |
| Maximum |
|
| Threshold (#) |
| Target (#) |
| Maximum (#) |
|
| (#) |
|
|
| ($) |
| ||||||||
(a) |
| (b) |
| (c)($) |
| (d)($) |
| (e)($) |
|
| (f) |
| (g) |
| (h) |
|
| (i) |
|
|
| (l) |
| ||||||||
Denis K. Sheahan |
| 1/19/2023 |
| $ | 177,164 |
| $ | 354,327 |
| $ | 531,491 |
|
|
|
|
|
|
|
|
|
|
|
|
|
|
| |||||
|
| 4/28/2023 |
|
|
|
|
|
|
|
|
| 2,130 |
|
| 8,519 |
|
| 17,038 |
|
|
|
|
|
| $ | 440,000 |
| ||||
|
| 4/28/2023 |
|
|
|
|
|
|
|
|
|
|
|
|
|
|
|
| 6,970 |
|
|
| $ | 360,000 |
| ||||||
Michael F. Carotenuto |
| 4/28/2023 |
|
|
|
|
|
|
|
|
| 599 |
|
| 2,396 |
|
| 4,792 |
|
|
|
|
|
| $ | 123,750 |
| ||||
|
| 4/28/2023 |
|
|
|
|
|
|
|
|
|
|
|
|
|
|
|
| 1,960 |
|
|
| $ | 101,250 |
| ||||||
Joseph P. Sapienza |
| 1/19/2023 |
| $ | 30,000 |
| $ | 60,000 |
| $ | 90,000 |
|
|
|
|
|
|
|
|
|
|
|
|
|
|
| |||||
|
| 2/15/2023 |
|
|
|
|
|
|
|
|
|
|
|
|
|
|
|
| 358 |
|
|
| $ | 30,083 |
| ||||||
Kerri A. Mooney |
| 1/19/2023 |
| $ | 62,000 |
| $ | 124,000 |
| $ | 186,000 |
|
|
|
|
|
|
|
|
|
|
|
|
|
|
| |||||
|
| 4/28/2023 |
|
|
|
|
|
|
|
|
| 599 |
|
| 2,396 |
|
| 4,792 |
|
|
|
|
|
| $ | 123,750 |
| ||||
|
| 4/28/2023 |
|
|
|
|
|
|
|
|
|
|
|
|
|
|
|
| 1,960 |
|
|
| $ | 101,250 |
| ||||||
Puneet Nevatia |
| 1/19/2023 |
| $ | 69,000 |
| $ | 138,000 |
| $ | 207,000 |
|
|
|
|
|
|
|
|
|
|
|
|
|
|
| |||||
|
| 4/28/2023 |
|
|
|
|
|
|
|
|
| 466 |
|
| 1,864 |
|
| 3,728 |
|
|
|
|
|
| $ | 96,275 |
| ||||
|
| 4/28/2023 |
|
|
|
|
|
|
|
|
|
|
|
|
|
|
|
| 1,525 |
|
|
| $ | 78,725 |
| ||||||
Jennifer A. Pline (5) |
| 1/19/2023 |
|
|
|
|
|
|
|
|
|
|
|
|
|
|
|
|
|
|
|
|
| ||||||||
Jeffrey F. Smith (5) |
| 8/15/2023 |
|
|
|
|
|
|
|
|
|
|
|
|
|
|
|
| 8,811 |
|
|
| $ | 500,024 |
| ||||||
132
OUTSTANDING EQUITY AWARDS AT FISCAL YEAR-END
The table set forth below contains individual equity awards that were outstanding as of December 31, 2023, for the NEOs, with market values determined by multiplying the number of shares of stock or units, as applicable, by $69.40, the per share closing price of the Company’s common stock on December 29, 2023, the last trading day of the year. No NEO had any option awards outstanding as of December 31, 2023.
|
| Stock Awards |
| |||||||||||||
Name |
| Number of Shares or Units of Stock That Have Not Vested |
|
| Market Value of Shares or Units of Stock That Have Not Vested |
|
| Equity Incentive Plan Awards: |
|
| Equity Incentive Plan Awards: |
| ||||
(a) |
| (b) |
|
| (c) |
|
| (d) |
|
| (e) |
| ||||
Denis K. Sheahan |
|
| 6,970 |
| (1) | $ | 483,718 |
|
|
|
|
|
|
| ||
|
|
| 1,513 |
| (2) | $ | 105,002 |
|
|
|
|
|
|
| ||
|
|
| 652 |
| (3) | $ | 45,249 |
|
|
|
|
|
|
| ||
|
|
|
|
|
|
|
|
| 13,608 |
| (4) | $ | 944,395 |
| ||
|
|
|
|
|
|
|
|
| 17,038 |
| (5) | $ | 1,182,437 |
| ||
Joseph P. Sapienza |
|
| 50 |
| (6) | $ | 3,470 |
|
|
|
|
|
|
| ||
|
|
| 100 |
| (7) | $ | 6,940 |
|
|
|
|
|
|
| ||
|
|
| 150 |
| (8) | $ | 10,410 |
|
|
|
|
|
|
| ||
|
|
| 228 |
| (9) | $ | 15,823 |
|
|
|
|
|
|
| ||
|
|
| 358 |
| (10) | $ | 24,845 |
|
|
|
|
|
|
| ||
Kerri A. Mooney |
|
| 1,960 |
| (1) | $ | 136,024 |
|
|
|
|
|
|
| ||
|
|
| 426 |
| (2) | $ | 29,564 |
|
|
|
|
|
|
| ||
|
|
| 184 |
| (3) | $ | 12,770 |
|
|
|
|
|
|
| ||
|
|
|
|
|
|
|
|
| 3,828 |
| (4) | $ | 265,663 |
| ||
|
|
|
|
|
|
|
|
| 4,792 |
| (5) | $ | 332,565 |
| ||
Puneet Nevatia |
|
| 1,525 |
| (1) | $ | 105,835 |
|
|
|
|
|
|
| ||
|
| 331 |
| (2) | $ | 22,971 |
|
|
|
|
|
|
| |||
|
| 102 |
| (3) | $ | 7,079 |
|
|
|
|
|
|
| |||
|
|
|
|
|
|
|
|
| 2,976 |
| (4) | $ | 206,534 |
| ||
|
|
|
|
|
|
|
|
| 3,728 |
| (5) | $ | 258,723 |
| ||
Jennifer A. Pline |
|
|
|
|
|
|
|
| 1,914 |
| (4) | $ | 132,832 |
| ||
Jeffrey F. Smith |
|
| 8,811 |
| (11) | $ | 611,483 |
|
|
|
|
|
|
| ||
Michael F. Carotenuto (12) |
|
|
| (12) |
|
|
|
|
|
|
|
| ||||
133
STOCK VESTED
The following table sets forth information with respect to the aggregate number of stock awards vested during 2023 and the value realized:
|
| Stock Awards |
| |||||
Name (a) |
| Number of Shares Acquired on Vesting |
|
| Value Realized on Vesting |
| ||
Denis K. Sheahan |
|
| 10,777 |
|
| $ | 819,882 |
|
Michael F. Carotenuto |
|
| 3,030 |
|
| $ | 230,514 |
|
Joseph P. Sapienza |
|
| 256 |
|
| $ | 21,402 |
|
Kerri A. Mooney |
|
| 3,030 |
|
| $ | 230,514 |
|
Puneet Nevatia |
|
| 1,732 |
|
| $ | 132,148 |
|
Jennifer A. Pline |
|
| 3,162 |
|
| $ | 237,683 |
|
Pension Benefits
Mr. Sheahan participates in the DB SERP, which provides for an annual benefit generally payable in equal monthly installments commencing on the first day of the month following his termination of employment on or after attaining age 65 and continuing for the greater of his lifetime or 20 years, subject to Mr. Sheahan’s execution and delivery of an effective release of claims and compliance with the non-competition covenants in the DB SERP. Mr. Sheahan’s annual benefit is an amount equal to his final average compensation (generally, an amount equal to the highest three consecutive years of his annual base salary and cash bonus) multiplied by two percent for every year from the date that he was hired to the date of his termination of employment (not to exceed 60%), less certain social
134
security benefits. In general, should Mr. Sheahan voluntarily terminate employment prior to age 65, the benefit is reduced based on his actual years of service on his termination date.
The Company also maintains a frozen DB Plan covering substantially all employees hired before May 2, 2011. Mr. Sapienza is the only NEO in the DB Plan. In general, participants in the DB Plan who retire upon attaining the plan’s normal retirement age of 65 are entitled to a monthly payment equal to one-twelfth of the product of (a) the sum of (i) 0.90% of the participant’s “final average compensation” (generally the participant’s average annual compensation during the five consecutive plan years in the last ten plan years of his or her employment with the Company affording the participant the highest average annual compensation), plus (ii) 0.55% of the participant’s average final compensation in excess of the average Social Security wage base for the 35-year period ending in the year in which the participant attains his or her Social Security retirement age multiplied by(b) the participant’s number of years of credited service (not in excess of 35 years). Participants who have reached age 55 and completed five years of credited service are generally eligible to retire and elect to receive an early retirement benefit equal to the actuarial equivalent of the monthly benefit described above.
The following table provides details of the present value of the accumulated benefit and years of credited service for Mr. Sheahan under his DB SERP and for Mr. Sapienza under the DB Plan as of December 31, 2023. The accumulated benefit shown in the table has been calculated assuming each executive terminated employment as of December 31, 2023. The present value of the accumulated benefit was then calculated assuming the executive will start receiving his pension at age 65. The assumptions used for Mr. Sheahan’s DB SERP and for Mr. Sapienza’s DB Plan are discussed in Note 14 – Pension and Retirement Plans to the Consolidated Financial Statements. The remaining NEOs do not participate in a DB SERP or the DB Plan.
PENSION BENEFITS
The following table shows the estimated present value of the accumulated benefit under the DB Plan and DB SERP for those NEOs who participated in the DB Plan and DB SERP.
Name (a) |
| Plan Name |
| Number of Years Credited Service |
| Present Value of Accumulated Benefit |
|
| Payments During Last Fiscal Year |
| ||
Denis K. Sheahan (1) |
| DB SERP |
| 9 |
| $ | 1,229,839 |
|
| $ | — |
|
Joseph P. Sapienza (1) |
| DB Plan |
| 22 |
| $ | 253,869 |
|
| $ | — |
|
Nonqualified Deferred Compensation
Under the terms of a “DC SERP” Agreement, while employed, Ms. Pline and Mr. Carotenuto received a Company contribution to the EDCP in an amount equal to 10% of the executive’s base salary and bonus. Ms. Pline and Mr. Carotenuto have the right to direct the investment of their account balances in the EDCP (including amounts contributed by the Company) by choosing from among the available investment alternatives, and their accounts are credited with earnings or losses arising from performance of their deemed investments. Subject to the terms of the EDCP, participant account balances are distributed upon a separation from service, or upon death or disability, in a lump sum cash payment (with any deferral of PRSUS and RSUs paid in shares of Company common stock), unless they elect to receive annual installment payments.
The following table provides details regarding each eligible NEO’s participation in the Company’s various nonqualified deferred compensation plans as of December 31, 2023. Only Mr. Carotenuto and Ms. Pline participated in the Company’s non-qualified deferred compensation plans in 2023:
Nonqualified Deferred Compensation
|
| Plan |
| Executive Contributions in Last Fiscal Year |
|
| Company |
|
| Aggregate Earnings in Last Fiscal Year |
|
| Aggregate Withdrawals / |
|
| Aggregate |
| |||||
|
| (b) |
| (c) |
|
| (d) |
|
| (e) |
|
| (f) |
|
| (g) |
| |||||
Name (a) |
|
|
| (1) |
|
| (1) |
|
| (2) |
|
|
|
|
| (2) |
| |||||
Michael F. Carotenuto |
| EDCP |
| $ | — |
|
| $ | 25,260 |
|
| $ | 5,579 |
|
| $ | — |
|
| $ | 80,097 |
|
Jennifer A. Pline |
| EDCP |
| $ | 85,499 |
|
| $ | — |
|
| $ | 52,918 |
|
| $ | — |
|
| $ | 425,907 |
|
|
| EDCP |
| $ | — |
|
| $ | — |
|
| $ | 60,818 |
|
| $ | — |
|
| $ | 457,506 |
|
135
Potential Payments Upon Termination or Change in Control
The following table shows the estimated benefits payable to our NEOs in the event of the NEO’s termination of employment under various scenarios or upon a change in control of the Company. The amounts shown assume a termination of employment or change in control on December 31, 2023. The market values of equity awards was determined by multiplying the applicable number of shares of stock or units by $69.40, the per share closing price of the Company’s common stock on December 29, 2023, the last trading day of the year. The amounts shown do not include payments or benefits provided under insurance or other plans that are generally available to all salaried employees. The actual amounts to be paid can only be determined at the time of the NEO’s separation from the Company or upon the occurrence of a change in control.
Potential Payments Upon Termination or Change in Control |
| |||||||||||||||||||
Name and Benefit (5) |
| Involuntary | Voluntary Termination and Change in Control | Involuntary | Disability | Death |
| |||||||||||||
Denis K. Sheahan |
|
|
|
|
|
|
|
|
|
|
|
|
|
|
| |||||
Severance Payment (6) |
| — |
|
| $ | 2,959,764 |
|
| $ | 2,959,764 |
|
| — |
|
| — |
| |||
DB SERP Enhancement (2) |
| — |
|
| $ | 1,303,608 |
|
| $ | 1,303,608 |
|
| $ | 647,495 |
|
| $ | 1,075,809 |
| |
Equity Award Vesting (3) |
| $ | 1,107,645 |
|
| — |
|
| $ | 2,104,208 |
|
| $ | 2,104,208 |
|
| $ | 2,104,208 |
| |
Total Amount |
| $ | 1,107,645 |
|
| $ | 4,263,372 |
|
| $ | 6,367,580 |
|
| $ | 2,751,703 |
|
| $ | 3,180,017 |
|
280G Cutback (4) |
| — |
|
| — |
|
| $ | (885,687 | ) |
| — |
|
| — |
| ||||
Net Amount |
| $ | 1,107,645 |
|
| $ | 4,263,372 |
|
| $ | 5,481,893 |
|
| $ | 2,751,703 |
|
| $ | 3,180,017 |
|
Joseph P. Sapienza |
|
|
|
|
|
|
|
|
|
|
|
|
|
|
| |||||
Severance Payment (6) |
| — |
|
| — |
|
| $ | 511,137 |
|
| — |
|
| — |
| ||||
Equity Award Vesting (3) |
| $ | 16,691 |
|
| — |
|
| $ | 61,488 |
|
| $ | 61,488 |
|
| $ | 61,488 |
| |
Total Amount |
| $ | 16,691 |
|
| $ | — |
|
| $ | 572,625 |
|
| $ | 61,488 |
|
| $ | 61,488 |
|
280G Cutback (4) |
| — |
|
| — |
|
|
| — |
|
| — |
|
| — |
| ||||
Net Amount |
| $ | 16,691 |
|
| $ | — |
|
| $ | 572,625 |
|
| $ | 61,488 |
|
| $ | 61,488 |
|
Kerri A. Mooney |
|
|
|
|
|
|
|
|
|
|
|
|
|
|
| |||||
Severance Payment (6) |
| — |
|
| — |
|
| $ | 840,189 |
|
| — |
|
| — |
| ||||
Equity Award Vesting (3) |
| $ | 311,610 |
|
| — |
|
| $ | 591,913 |
|
| $ | 591,913 |
|
| $ | 591,913 |
| |
Total Amount |
| $ | 311,610 |
|
| $ | — |
|
| $ | 1,432,102 |
|
| $ | 591,913 |
|
| $ | 591,913 |
|
280G Cutback (4) |
| — |
|
| — |
|
| $ | (198,322 | ) |
| — |
|
| — |
| ||||
Net Amount |
| $ | 311,610 |
|
| $ | — |
|
| $ | 1,233,780 |
|
| $ | 591,913 |
|
| $ | 591,913 |
|
Puneet Nevatia |
|
|
|
|
|
|
|
|
|
|
|
|
|
|
| |||||
Severance Payment (6) |
| — |
|
| — |
|
| $ | 937,368 |
|
| — |
|
| — |
| ||||
Equity Award Vesting (3) |
| $ | 214,525 |
|
| — |
|
| $ | 432,084 |
|
| $ | 432,084 |
|
| $ | 432,084 |
| |
Total Amount |
| $ | 214,525 |
|
| $ | — |
|
| $ | 1,369,452 |
|
| $ | 432,084 |
|
| $ | 432,084 |
|
280G Cutback (4) |
| — |
|
| — |
|
|
| — |
|
| — |
|
| — |
| ||||
Net Amount |
| $ | 214,525 |
|
| $ | — |
|
| $ | 1,369,452 |
|
| $ | 432,084 |
|
| $ | 432,084 |
|
Jeffrey F. Smith |
|
|
|
|
|
|
|
|
|
|
|
|
|
|
| |||||
Severance Payment (6) (8) |
| $ | 550,000 |
|
| — |
|
| $ | 1,100,000 |
|
| — |
|
| — |
| |||
Welfare Benefit Continuation (7) |
|
|
|
|
|
|
| $ | 36,128 |
|
|
|
|
|
|
| ||||
Equity Award Vesting (3) |
| $ | 67,943 |
|
| — |
|
| $ | 611,483 |
|
| $ | 611,483 |
|
| $ | 611,483 |
| |
Total Amount |
| $ | 617,943 |
|
| $ | — |
|
| $ | 1,747,611 |
|
| $ | 611,483 |
|
| $ | 611,483 |
|
280G Cutback (4) |
| — |
|
| — |
|
|
| — |
|
| — |
|
| — |
| ||||
Net Amount |
| $ | 617,943 |
|
| $ | — |
|
| $ | 1,747,611 |
|
| $ | 611,483 |
|
| $ | 611,483 |
|
136
Equity Awards. Our NEOs can hold up to three types of unvested equity awards — RSAs, PRSUs, and RSUs. In the event the NEOs experience a covered termination of employment or there is a change in control of the Company, the unvested equity awards would be vested, as described below.
For the PRSUs granted to our NEOs, upon a termination of employment by the Company other than for cause (as defined in the applicable award agreement) or upon a NEO’s retirement (as defined in the applicable award agreement), the target number of units would be prorated based on the number of completed months in the applicable performance period and the NEOs would remain eligible to earn this prorated award based on the Company’s actual performance through the end of the applicable performance period. For the RSUs granted, upon termination of employment other than for cause or upon retirement, the number of units would be prorated based on the number of completed months of service. For the RSAs granted, upon termination of employment other than for cause (as defined in the applicable award agreement) or as a result of the NEO’s retirement (as defined in the applicable award agreement), then restrictions will lapse as to a prorated number of RSAs based on the number of completed months of service. Upon a termination of employment due to death or disability, all of our NEOs would be entitled to (a) full vesting of their unvested RSUs and RSAs, and (b) vesting at target level for their unvested PRSUs.
Upon the occurrence of a change in control, if the NEO’s employment is terminated other than for cause (as defined in the applicable award agreement) within 12 months after such change in control and prior to the last day of the vesting period for RSUs and RSAs or the performance period for PRSUs, the NEO’s equity awards will vest. RSUs and RSAs will vest in the number of units subject to the applicable award while PRSUs will vest in the greater of (i) the target number of units subject to the award and (ii) the number of units determined by the Compensation Committee based on actual performance through the date of termination. The maximum number of PRSUs that may vest equals 200% of the target number of units provided for in the applicable award agreement.
Change in Control Agreements.The Company currently maintains double-trigger change in control agreements with Mr. Sapienza, Ms. Mooney, Mr. Nevatia, and Mr. Smith. Mr. Sheahan’s SERP agreement contains legacy modified single-trigger payment for cash severance and SERP benefit enhancement which he can voluntarily terminate during the period beginning six months and ending twelve months following change in control. This provision is referenced in the good reason definition of his change in control agreement. The change in control agreements with Mr. Carotenuto and Ms. Pline expired upon their separation from service with the Company and the
137
Bank. Except as otherwise noted below, the change in control agreements contain substantially the same terms and conditions. In the event of a change in control (as defined below) and a qualifying termination of employment (as described below), each of these NEOs would be eligible for: (1) a severance payment equal to a multiple of his or her average compensation over a period of years (generally the highest three consecutive years of annual base salary and bonus), as determined at the time of termination and (2) welfare benefit continuation (at the NEO’s cost, except in the case of Mr. Smith as specified below) for a specified period following the NEO’s termination date (or, if shorter, until comparable benefits are received from another source), in each case as set forth in the applicable agreement. The severance multiples and welfare benefit continuation period for each NEO are set forth in the following table:
Severance Multiple | Welfare Benefit Continuation Period | |
Sheahan | 3x | 36 Months |
Sapienza, Mooney, and Nevatia | 2x | 12 Months |
Smith | 2x | 24 Months (1) |
Payments under the change in control agreements would be triggered in the event of a change in control of the Company or the Bank where, within 12 months (24 months in Mr. Smith’s change in control agreement) after the change in control (1) the Company or the Bank terminates the NEO for reasons other than due to death or for “cause” or “disability” (each, as defined in the change in control agreements) or (2) the NEO resigns for “good reason” (as defined in the change in control agreements but generally including a material reduction in the nature or scope of the NEO’s responsibilities, authorities or duties, a material reduction in the NEO’s base salary or a relocation of the NEO’s principal place of business of more than 40 miles from the current principal executive office). Benefits may also be payable in the event of a potential change in control where (1) the Company or the Bank terminates the NEO for reasons other than due to death or for cause or disability, or (2) the NEO resigns for good reason, in either case, within the period ending upon the earlier of: 12 months (24 months in Mr. Smith’s change in control agreement) from the occurrence of the potential change in control, death, disability or retirement (each, as defined in the change in control agreements), the change in control, or a determination by the Board that a potential change in control no longer exists.
In the event any payments or benefits provided under the change in control agreements, together with any other payments or benefits, would constitute “parachute payments” under Section 280G of the Internal Revenue Code and would be subject to the excise tax imposed by Section 4999 of the Internal Revenue Code, the change in control agreements provide for a “best net” approach that reduces the payments and benefits otherwise provided to the applicable NEO in connection with a change in control so that no portion of such payments or benefits would be subject to the excise tax if such reduction would result in the applicable NEO receiving a greater amount of payments and benefits on an after-tax basis.
A “change in control” (as defined in the change in control agreements) includes a change that would be required to be reported by the Company or the Bank under the Exchange Act and an acquisition of control as defined in the Bank Holding Company Act of 1956, as amended, or the Bank Control Act of 1978, as amended. A “potential change in control” (as defined in Mr. Sheahan’s change in control agreement) would exist if the Company and/or the Bank enter into an agreement to consummate a transaction involving a change in control, any person (including the Company) publicly announces an intention to take or consider taking actions that would constitute a change in control, any person acquires a 20% or more of the voting power of the Company or the Board of the Company or the Bank adopt a resolution to the effect that a potential change in control has occurred.
The change in control agreements include a 12-month noncompetition covenant and, in certain circumstances, provide an opportunity for the Company and the Bank to remedy a good-reason-triggering event. The change in control agreements also provide for a six-month delay in payments to a “specified employee” within the meaning of Section 409A of the Internal Revenue Code, if required.
Mr. Sheahan’s DB SERP. Under the terms of Mr. Sheahan’s DB SERP, if Mr. Sheahan (a) becomes entitled to benefits under his change in control agreement or (b) experiences a termination of employment due to his death, the annual benefit under his DB SERP will be calculated and paid as described above under “Pension Benefits,” except that he will be deemed to have been employed for an additional three plan years (up to a maximum of 30 plan years) and the installment payments from the Company will begin the month following his termination of employment, regardless of his age, and continue for his lifetime (or, in the case of his death, for 20 years). In addition, if Mr. Sheahan becomes entitled to benefits under his change in control agreement, the non-competition covenant of his DB SERP will terminate. If Mr. Sheahan experiences termination of employment due to his “disability” (as defined in his DB SERP) prior to his attainment of normal retirement age, the annual benefit under his DB SERP will be calculated and paid as described above under “Pension Benefits,” except that the installment payments from the Company will begin the month following his termination of employment due to disability.
138
CEO Pay Ratio
We are providing the following information about the relationship of the annual total compensation of our median employee and the annual total compensation of, our Chief Executive Officer (our “CEO”):
For 2023, our last completed fiscal year:
Based on this information, we reasonably estimate that the ratio of our CEO’s annual total compensation to the annual total compensation of our median employee was 17:1. Our pay ratio estimate has been calculated in a manner consistent with Item 402(u) of Regulation S-K.
For purposes of determining the total compensation actually paid, we included: the amount of base salary paid during the year and the amount of any cash incentives paid during the year (which includes annual cash incentives that are generally paid in February for performance during the prior fiscal year). We did not include any adjustments for the value of benefits provided or the annualization of pay for any employees who were employed by us for only part of the year.
We identified our median employee based on the total compensation actually paid for fiscal year 2023 to all 407 members of our workforce (including full-time, part-time and temporary employees), other than our CEO, who were employed on December 31, 2023. Upon identifying the median employee, we calculated our median employee’s annual total compensation for fiscal year 2023 according to the SEC’s instructions for preparing the Summary Compensation Table. We then calculated our CEO’s annual total compensation according to the SEC’s instructions for preparing the Summary Compensation Table and calculated the ratio between the two numbers.
The disclosure presented above is a reasonable estimate. Because the SEC rules for identifying the median employee and calculating the pay ratio allow companies to use different methodologies, exemptions, estimates and assumptions, this disclosure may not be comparable to the pay ratio reported by other companies.
Director Compensation
Non-employee directors of the Company and Cambridge Trust receive both cash and equity compensation as described below. Board compensation is reviewed by comparison to peer institutions using publicly available information. Director compensation is designed to attract and retain persons who are well qualified to serve as directors of the Company and Cambridge Trust.
Directors are paid an annual retainer in the amount of $40,000 as a fully vested common stock award to align their interests with those of the shareholders. In 2023, such awards totaled 813 shares of common stock for each independent director. Directors also receive a $20,000 annual cash retainer.
Non-employee directors of the Company and Cambridge Trust also receive cash compensation in the form of fees for attending Board and committee meetings. Directors receive additional compensation for service as Chair of a Committee.
Annual fees for non-employee directors as Lead Director and Committee Chairs of the Company and of Cambridge Trust during 2023 are paid in cash and were as follows:
Position |
| Annual Fee |
| |
Lead Director |
| $ | 15,000 |
|
Chairperson Audit Committee |
| $ | 8,250 |
|
Chairperson Compensation Committee |
| $ | 8,250 |
|
Chairperson Governance Committee |
| $ | 8,250 |
|
Chairperson Risk Committee |
| $ | 8,250 |
|
Chairperson Trust Committee |
| $ | 8,250 |
|
Board meeting fees for the Company during 2023 were $1,000 per meeting. Committee meeting fees for the Company during 2023 were $700 per meeting. The Committee for which directors receive meeting fees other than the Audit, Governance, Risk and Compensation Committees, is the Trust Committee. Board meeting fees for Cambridge Trust Company of New Hampshire, a subsidiary of Cambridge Trust Company, were $700 per meeting during 2023.
Annual fees paid to directors are based on a year of service that begins at the annual meeting of the Company’s shareholders and runs through the date of the next annual meeting.
139
No annual retainer or meeting fees are paid to any director who is an employee of the Company or Cambridge Trust.
The following table summarizes the compensation paid to the Company’s directors for the fiscal year ended December 31, 2023, other than Denis K. Sheahan, whose compensation is fully reflected in the Summary Compensation Table above.
2023 DIRECTOR COMPENSATION
|
|
|
|
|
|
|
|
|
|
|
|
| ||||
Name (a) |
| Fees Earned |
|
| Stock Awards |
|
| All Other Compensation |
|
| Total |
| ||||
Jeanette G. Clough |
| $ | 40,700 |
|
| $ | 40,000 |
|
| $ | 1,089 |
|
| $ | 81,789 |
|
Christine Fuchs |
| $ | 39,900 |
|
| $ | 40,000 |
|
| $ | 1,089 |
|
| $ | 80,989 |
|
Simon R. Gerlin |
| $ | 46,150 |
|
| $ | 40,000 |
|
| $ | 1,089 |
|
| $ | 87,239 |
|
Pamela A. Hamlin |
| $ | 49,950 |
|
| $ | 40,000 |
|
| $ | 1,089 |
|
| $ | 91,039 |
|
Kathryn M. Hinderhofer |
| $ | 47,450 |
|
| $ | 40,000 |
|
| $ | 1,089 |
|
| $ | 88,539 |
|
Hambleton Lord |
| $ | 60,500 |
|
| $ | 40,000 |
|
| $ | 1,089 |
|
| $ | 101,589 |
|
Thalia M. Meehan |
| $ | 38,900 |
|
| $ | 40,000 |
|
| $ | 1,089 |
|
| $ | 79,989 |
|
Daniel R. Morrison |
| $ | 39,900 |
|
| $ | 40,000 |
|
| $ | 3,889 |
|
| $ | 83,789 |
|
Leon A. Palandjian |
| $ | 49,550 |
|
| $ | 40,000 |
|
| $ | 1,089 |
|
| $ | 90,639 |
|
Laila S. Partridge |
| $ | 42,000 |
|
| $ | 40,000 |
|
| $ | 1,089 |
|
| $ | 83,089 |
|
Jody A. Rose |
| $ | 38,200 |
|
| $ | 40,000 |
|
| $ | 1,089 |
|
| $ | 79,289 |
|
Cathleen A. Schmidt |
| $ | 50,950 |
|
| $ | 40,000 |
|
| $ | 3,889 |
|
| $ | 94,839 |
|
R. Gregg Stone |
| $ | 42,400 |
|
| $ | 40,000 |
|
| $ | 1,089 |
|
| $ | 83,489 |
|
Jane C. Walsh |
| $ | 41,300 |
|
| $ | 40,000 |
|
| $ | 1,089 |
|
| $ | 82,389 |
|
Andargachew S. Zelleke |
| $ | 38,900 |
|
| $ | 40,000 |
|
| $ | 1,089 |
|
| $ | 79,989 |
|
Item 12. Security Ownership of Certain Beneficial Owners and Management and Related Stockholder Matters.
Required
SECURITY OWNERSHIP OF CERTAIN BENEFICIAL OWNERS AND MANAGEMENT
Under SEC rules, beneficial ownership includes any shares of common stock for which a person has sole or shared voting power or investment power and any shares of common stock which the person has the right to acquire within 60 days through the exercise of any option, warrant or right, through conversion of any security or pursuant to the automatic termination of a power of attorney or revocation of a trust, discretionary account or similar arrangement. The following tables set forth certain information regarding securityas to the number and percentage of shares of common stock beneficially owned as of March 8, 2024, (i) by each person known by the Company to own beneficially more than 5% of the Company’s outstanding shares of common stock, (ii) by each of the Company’s directors and executive officers, and (iii) by all directors and executive officers as a group. As of March 8, 2024,there were 7,846,510 shares of common stock outstanding.
Principal Shareholders
The following table contains common stock ownership information for persons known to us to beneficially own more than 5% of certain beneficial ownersthe Company’s common stock as of March 8,2024.
Name of Beneficial Owner |
| Amount and Nature of Beneficial Ownership (1) |
|
| Percent of | |
BlackRock, Inc. |
|
| 633,933 |
|
| 8.1% |
140
|
|
|
|
|
| |
The Vanguard Group, Inc. |
|
| 410,645 |
|
| 5.2% |
Security Ownership of Officers and management appearsDirectors
Name |
| Number of |
|
| Percent of Common Stock Outstanding |
| ||
Directors: |
|
|
|
|
|
| ||
Jeanette G. Clough |
|
| 7,039 |
|
| ** |
| |
Christine Fuchs |
|
| 3,738 |
|
| ** |
| |
Simon R. Gerlin |
|
| 5,451 |
|
| ** |
| |
Pamela A. Hamlin |
|
| 2,738 |
|
| ** |
| |
Kathryn M. Hinderhofer |
|
| 6,271 |
|
| ** |
| |
Hambleton Lord |
|
| 7,083 |
|
| ** |
| |
Thalia M. Meehan |
|
| 2,786 |
|
| ** |
| |
Daniel R. Morrison |
|
| 41,841 |
|
| ** |
| |
Leon A. Palandjian |
|
| 17,455 |
|
| ** |
| |
Laila S. Partridge |
|
| 2,738 |
|
| ** |
| |
Jody A. Rose |
|
| 2,786 |
|
| ** |
| |
Cathleen A. Schmidt |
|
| 4,868 |
|
| ** |
| |
Denis K. Sheahan |
|
| 51,848 |
|
| ** |
| |
R. Gregg Stone |
|
| 14,377 |
|
| ** |
| |
Jane C. Walsh |
|
| 133,679 |
|
|
| 1.7 | % |
Andargachew S. Zelleke |
|
| 1,118 |
|
| ** |
| |
Named Executive Officers other than Directors: |
|
|
|
|
|
| ||
Michael F. Carotenuto (3) |
|
| — |
|
| ** |
| |
Jennifer A. Pline (4) |
|
| 12,634 |
|
| ** |
| |
Kerri A. Mooney |
|
| 5,089 |
|
| ** |
| |
Puneet Nevatia |
|
| 6,200 |
|
| ** |
| |
Joseph P. Sapienza |
|
| 7,069 |
|
| ** |
| |
Jeffrey F. Smith |
|
| — |
|
| ** |
| |
|
|
|
|
|
|
| ||
Directors and executive officers as a group (25 individuals) |
|
| 341,939 |
|
|
| 4.4 | % |
** Represents less than 1% of the Company’s outstanding shares.
141
SECURITIES AUTHORIZED FOR ISSUANCE UNDER EQUITY COMPENSATION PLANS
The following table sets forth the aggregate information of the Company’s equity compensation plans in effect as of December 31, 2023:
Plan Category |
| Number of securities to |
|
| Weighted-average |
|
| Number of securities |
| |||
|
| (a) (1) |
|
| (b) (2) |
|
| (c)(3) |
| |||
Equity compensation plans approved by shareholders |
|
| 137,853 |
|
| $ | — |
|
|
| 148,339 |
|
Equity compensation plans not approved by shareholders |
|
| — |
|
|
| — |
|
|
| — |
|
Total |
|
| 137,853 |
|
| $ | — |
|
|
| 148,339 |
|
Item 13. Certain Relationships and Related Transactions, and Director Independence.
Related-Person Transactions Policy and Procedures
Pursuant to regulatory requirements and other applicable law, the Boards of the Company and/or Cambridge Trust must approve certain extensions of credit, contracts, and other transactions between the Company and/or Cambridge Trust and any director or executive officer or their immediate family members and affiliates. The information requiredCompany requires that any transaction between the Company and/or Cambridge Trust and any director or executive officer, or any of their immediate family members or affiliates, must be made on terms comparable to those that would apply to a similar transaction with an unrelated, similarly situated third-party and must be approved in advance. The Governance Committee is responsible for oversight and implementation of the procedures for review of related party transactions, which are most commonly applied to extensions of credit by this ItemCambridge Trust. The Company’s policy and procedures with respect to related person transactions are set forth in the Governance Committee’s charter and the Company’s Code of Ethics.
Transactions with Certain Related Persons
The Company did not engage in any related person transactions during 2023 within the meaning of applicable SEC rules, including any transaction or series of transactions in which: (i) the Company was, is incorporated herein by referenceor will be a participant; (ii) the amount involved exceeds $120,000; and (iii) a related person had, has or will have a direct or indirect material interest. Certain directors and officers of the Company and Bank and members of their immediate family are at present, as in the past, customers of the Bank and have transactions with the Bank in the ordinary course of business. In addition, certain of the directors are at present, as in the past, also directors, officers or shareholders of corporations or members of partnerships that are customers of the Bank and have transactions with the Bank in the ordinary course of business. Such transactions with directors and officers of the Company and the Bank and their families and with such corporations and partnerships were made in the ordinary course of business, were made on substantially the same terms, including interest rates and collateral on loans, as those prevailing at the time for comparable transactions with other persons, did not involve more than the normal risk of collectability or present other features unfavorable to the captions “IndebtednessBank, were performing according to their original terms at December 31, 2023, and Other Transactions,” “Policieswere made in compliance with banking regulations. The directors annually approve amounts to be paid to related parties for services rendered. The Company reviews related party transactions periodically.
Board of Directors Independence
Rule 5605 of the NASDAQ Market Place Rules (the “NASDAQ Listing Rules”) requires that independent directors compose a majority of a listed company’s board of directors. In addition, the NASDAQ Listing Rules require that, subject to specified exceptions, each member of a listed company’s audit, compensation, and Procedures for Related Party Transactions”corporate governance committees be independent and “Corporate Governance – Director Independence”that audit committee members also satisfy independence criteria set forth in Rule 10A-3 under the Exchange Act. Under Rule 5605(a)(2) of the NASDAQ Listing Rules, a director will only qualify as an “independent director” if, in the Company’s Proxy Statementopinion of the Board, that person does not have a relationship that would interfere with the exercise of independent judgment in carrying out the responsibilities of a director. In order to be considered independent for purposes of Rule 10A-3 under the 2018 Annual MeetingExchange Act, a member of Shareholders.an audit committee of a listed company may not, other than in his or her capacity as a member of the audit committee, the board of directors or any other board committee: (i) accept, directly or indirectly, any consulting, advisory or other compensatory fee from the listed company or any of its subsidiaries; or
142
(ii) be an affiliated person of the listed company or any of its subsidiaries. In addition to satisfying general independence requirements under the NASDAQ Listing Rules, members of a compensation committee must also satisfy independence requirements set forth in Rule 10C-1 under the Exchange Act and NASDAQ Listing Rule 5605(d)(2). Pursuant to Rule 10C-1 under the Exchange Act and NASDAQ Listing Rule 5605(d)(2), in affirmatively determining the independence of a member of a compensation committee of a listed company, the board of directors must consider all factors specifically relevant to determining whether that member has a relationship with the company which is material to that member’s ability to be independent from management in connection with the duties of a compensation committee member, including: (a) the source of compensation of such member, including any consulting, advisory or other compensatory fee paid by the company to such member; and (b) whether such member is affiliated with the company, a subsidiary of the company or an affiliate of a subsidiary of the company.
The Board consults with outside legal counsel to ensure that its determinations are consistent with relevant securities and other laws and regulations regarding the definition of “independent,” including those set forth in pertinent NASDAQ Listing Rules, as in effect from time to time.
Consistent with these considerations, the Board has affirmatively determined that all of its continuing directors, as well as Board Nominees, satisfy general independence requirements under the NASDAQ Listing Rules, other than Messrs. Morrison, and Sheahan. In making this determination, the Board found that none of the directors, other than Messrs. Morrison, and Sheahan, had a material or other disqualifying relationship with us that would interfere with the exercise of independent judgment in carrying out the responsibilities of a director, and that each director, other than Messrs. Morrison, and Sheahan, is “independent” as that term is defined under Rule 5605(a)(2) of the NASDAQ Listing Rules. The Board determined that Mr. Morrison who served as Chief Executive Officer of Cambridge Trust New Hampshire until December 31, 2021 and, Mr. Sheahan, President & Chief Executive Officer, are not independent directors by virtue of their current and prior employment with us. The Board also determined that each member of the Audit, Compensation and Governance Committees satisfies the independence standards for such committees established by the SEC and the NASDAQ Listing Rules, as applicable.
Item 14. Principal Accounting Fees and Services.
Our independent registered public accounting firm is Wolf & Company, P.C. (“Wolf & Company”), Boston, Massachusetts (PCAOB ID No.: 392).
The information requiredfollowing table shows the fees paid or accrued by this Item is incorporated hereinthe Company for professional services provided by referenceWolf & Company during the fiscal years ended December 31, 2023 and December 31, 2022:
|
| 2023 |
|
| 2022 |
| ||
Audit Fees |
| $ | 360,000 |
|
| $ | 365,000 |
|
Audit Related Services (1) |
|
| 54,200 |
|
|
| 36,680 |
|
Tax Fees (2) |
|
| 57,500 |
|
|
| 42,000 |
|
All Other Fees (3) |
|
| 183,788 |
|
|
| 219,792 |
|
Total |
| $ | 655,488 |
|
| $ | 663,472 |
|
Audit Committee Pre-Approval Requirements
The Audit Committee typically provides specific prior approval for each engagement of the Bancorp’s Proxy Statement forindependent auditor to perform services, but it may from time to time pre-approve certain types of services up to a specified limit. The Audit Committee has considered the 2018 Annual Meetingnature of Shareholders.the tax and other non-audit services provided by Wolf & Company, including discussing them with Wolf & Company and management, and has determined that they are compatible with Wolf & Company’s independence. The Audit Committee pre-approved 100% of the services performed by the independent registered public accounting firm pursuant to the powers delegated to the Audit Committee.
143
Item 15. Exhibits, Financial Statement Schedules.
(a) Documents filed as a Part of this Annual Report on Form 10-K:
(1) Financial Statements—Included in Item 8 of this Annual Report on Form 10-K.
Audited Consolidated Financial Statements
Consolidated Balance Sheets as of December 31, |
|
| |
| |
| |
| |
| |
Report of Independent Registered Public Accounting Firm | 104 |
(2) Financial Statement Schedules
|
|
|
|
|
|
1. Financial Statements. The financial statements of the Company required in response to this item are listed in response to Part II, Item 8 of this Annual Report on Form 10-K.
2. Financial Statement Schedules. There are no financial statement schedules that are required to be filed as part of this form since they are not applicable, or the information is included in the consolidated financial statements.
3. Exhibits. The following exhibits are included as part of this Form 10-K.
(3) Index to Exhibits.
Exhibit Number | Description | |
| ||
2.1 | ||
2.2 | ||
3.1 | ||
3.2 | ||
4.1 | ||
| Description of Cambridge Bancorp | |
| ||
| ||
| ||
| ||
| ||
|
| |
| ||
| ||
| ||
144
| ||
| ||
| ||
| ||
| ||
| ||
|
| |
|
| |
| ||
| ||
| ||
10.12# | ||
10.13# | Change in Control Agreement with Kerri Mooney, dated August 6, 2019. | |
10.14# | Change in Control Agreement with Puneet Nevatia, dated August 6, 2019. | |
10.15** | ||
|
| |
21# | ||
| ||
| ||
| ||
31.2*# |
|
| |
32.1*# | ||
| ||
|
| |
| Inline XBRL Instance Document - the instance document does not appear in the Interactive data File because XBRL tags are embedded within the Inline XBRL | |
101.SCH | Inline XBRL Taxonomy Extension Schema With Embedded Linkbases Document | |
|
| |
104 | ||
| Cover page interactive data file (formatted as Inline XBRL | |
|
| |
|
|
|
|
|
|
# Filed herewith.
* Furnished herewith
** Management Compensatory plans or arrangements.
Item 16. Form 10-K Summary.
None.
145
Pursuant to the requirements of the Securities Exchange Act of 1934, the registrant has duly caused this report to be signed on its behalf by the undersigned thereunto duly authorized.
CAMBRIDGE BANCORP | ||
March | By: |
|
Denis K. Sheahan | ||
Chairman, President & Chief Executive Officer | ||
March | ||
By: |
| |
| ||
Senior Vice President, Interim Chief Financial Officer | ||
Pursuant to the requirements of the Securities Exchange Act of 1934, as amended, this Report has been signed below by the following persons on behalf of the Registrant in the capacities and on the dates indicated.
Name | Title | Date | ||
/s/ Denis K. Sheahan | Chairman, President & Chief Executive Officer | March | ||
Denis K. Sheahan | (Principal Executive Officer) | |||
/s/ | Senior Vice President, Interim Chief Financial Officer | March | ||
| (Principal Financial Officer and Principal Accounting Officer) | |||
|
|
| ||
| ||||
/s/ Jeanette G. Clough | Director | March | ||
Jeanette G. Clough | ||||
/s/ | Director | March | ||
| ||||
/s/ | Director | March | ||
| ||||
/s/ Pamela A. Hamlin | Director | March 12, 2024 | ||
Pamela A. Hamlin | ||||
/s/ Kathryn M. Hinderhofer | Director | March 12, 2024 | ||
Kathryn M. Hinderhofer | ||||
/s/ Hambleton Lord | Director | March | ||
Hambleton Lord | ||||
/s/ Thalia M. Meehan | Director | March 12, 2024 | ||
Thalia M. Meehan | ||||
/s/ Daniel R. Morrison | Director | March 12, 2024 | ||
Daniel R. Morrison | ||||
/s/ Leon A. Palandjian | Director | March | ||
Leon A. Palandjian | ||||
/s/ Laila S. Partridge | Director | March 12, 2024 | ||
Laila S. Partridge | ||||
/s/ Jody A. Rose | Director | March 12, 2024 | ||
Jody A. Rose | ||||
/s/ Cathleen A. Schmidt | Director | March | ||
Cathleen A. Schmidt | ||||
/s/ R. Gregg Stone | Director | March | ||
R. Gregg Stone | ||||
/s/ | Director | March | ||
| ||||
/s/ |
| March | ||
| ||||
|
|
| ||
| ||||
|
|
| ||
| ||||
|
|
| ||
|
146
96
