

UNITED STATES
SECURITIES AND EXCHANGE COMMISSION
Washington, D.C. 20549
FORM 10-K
(Mark One)
| Annual Report Pursuant to Section 13 or 15(d) of the Securities Exchange Act of |
For the fiscal year ended February 3 |
or
☐ | Transition Report Pursuant to Section 13 or 15(d) of the Securities Exchange Act of 1934 |
For the Transition period from ____________ to ___________ |
Commission file number 1-11084
KOHL’S CORPORATIONCORPORATION
(Exact name of registrant as specified in its charter)
Wisconsin | 39-1630919 | |
(State or other jurisdiction of incorporation or organization) | (I.R.S. Employer Identification No.) | |
N56 W17000 Ridgewood Drive, Menomonee Falls, Wisconsin | 53051 | |
(Address of principal executive offices) | (Zip Code) |
Registrant’s telephone number, including area code (262) (262) 703-7000
Securities registered pursuant to Section 12(b) of the Act:
Title of each class | Trading Symbol(s) | Name of each exchange on which registered |
Common Stock, $.01 | KSS | New York Stock Exchange |
|
|
Securities registered pursuant to Section 12(g) of the Act:
None
Indicate by check mark if the registrant is a well-known seasoned issuer, as defined in Rule 405 of the Securities Act. Yes X ☒ No .☐
Indicate by check mark if the registrant is not required to file reports pursuant to Section 13 or Section 15(d) of the Act. Yes ☐No X .☒
Indicate by check mark whether the registrant (1) has filed all reports required to be filed by Section 13 or 15(d) of the Securities Exchange Act of 1934 during the preceding 12 months (or for such shorter period that the registrant was required to file such reports), and (2) has been subject to such filing requirements for the past 90 days. Yes X ☒ No .☐
Indicate by check mark whether the registrant has submitted electronically and posted on its corporate Website, if any, every Interactive Data File required to be submitted and posted pursuant to Rule 405 of Regulations S-T (232.405 of this chapter) during the preceding 12 months (or for such shorter period that the registrant was required to submit and post such files). Yes X ☒ No .☐
Indicate by check mark if disclosure of delinquent filers pursuant to Item 405 of Regulation S-K (229.405 of this chapter) is not contained herein, and will not be contained, to the best of registrant’s knowledge, in definitive proxy or information statements incorporated by reference in Part III of this Form 10-K or any amendment to this Form 10-K. X .
Indicate by check mark whether the registrant is a large accelerated filer, an accelerated filer, a non-accelerated filer, a smaller reporting company, or an emerging growth company. See definitions of “large accelerated filer,” “accelerated filer,” “smaller reporting company”company,” and “emerging growth company” in Rule 12b-2 of the Exchange Act. (Check one):
Large accelerated filer X Accelerated filer Non-accelerated filer (Do not check if a smaller reporting company)
Large Accelerated Filer | ☒ | Accelerated Filer | ☐ | |||
Non-Accelerated Filer | ☐ | Smaller Reporting Company | ☐ | |||
Emerging Growth Company | ☐ |
Smaller reporting company Emerging growth company
If an emerging growth company, indicate by check mark if the registrant has elected not to use the extended transition period for complying with any new or revised financial accounting standards provided pursuant to Section 13(a) of the Exchange Act. ☐
Indicate by check mark whether the registrant has filed a report on and attestation to its management’s assessment of the effectiveness of its internal control over financial reporting under Section 404(b) of the Sarbanes-Oxley Act (15 U.S.C.7262(b)) by the registered public accounting firm that prepared or issued its audit report. ☒
If securities are registered pursuant to Section 12(b) of the Act, indicate by check mark whether the financial statements of the registrant included in the filing reflect the correction of an error to previously issued financial statements. ☐
Indicate by check mark whether any of those error corrections are restatements that required a recovery analysis of incentive-based compensation received by any of the registrant’s executive officers during the relevant recovery period pursuant to §240.10D-1(b). ☐
Indicate by check mark whether the registrant is a shell company (as defined in Rule 12b-2 of the Exchange Act). Yes ☐No X .☒
At July 28, 2017,2023, the aggregate market value of the voting stock of the Registrant held by stockholdersshareholders who were not affiliates of the Registrant was approximately $7.0$3.1 billion (based upon the closing price of Registrant’s Common Stock on the New York Stock Exchange on such date).
At March 14, 2018,20, 2024, the Registrant had outstanding an aggregate of 168,236,899110,906,777 shares of its Common Stock.
Documents Incorporated by Reference:
Portions of the Definitive Proxy Statement for the Registrant’s 2024 Annual Meeting of Shareholders to be held on May 16, 2018 are incorporated into Part III.
KOHL’S CORPORATION
INDEX
INDEX
Item 1. | 3 | |||||
Item 1A. |
| |||||
Item 1B. |
| |||||
Item |
| |||||
Item |
| |||||
Item |
| |||||
Item |
| |||||
Item 4A. | 17 | |||||
Item 5. |
| |||||
Item 6. |
| |||||
Item 7. | Management’s Discussion and Analysis of Financial Condition and Results of Operations |
| ||||
Item 7A. | Quantitative and Qualitative Disclosures |
| ||||
Item 8. |
| |||||
Item 9. | Changes |
| ||||
Item 9A. |
| |||||
Item 9B. |
| |||||
Item 9C. | Disclosure Regarding Foreign Jurisdictions That Prevent Inspections | 60 | ||||
Item 10. |
| |||||
Item 11. |
| |||||
Item 12. | Security Ownership of Certain Beneficial Owners and Management and Related Stockholder Matters |
| ||||
Item 13. | Certain Relationships and Related Transactions, and Director Independence |
| ||||
Item 14. |
| |||||
Item 15. |
| |||||
Item 16. |
| |||||
| ||||||
| ||||||
2
PART I
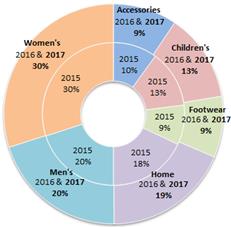
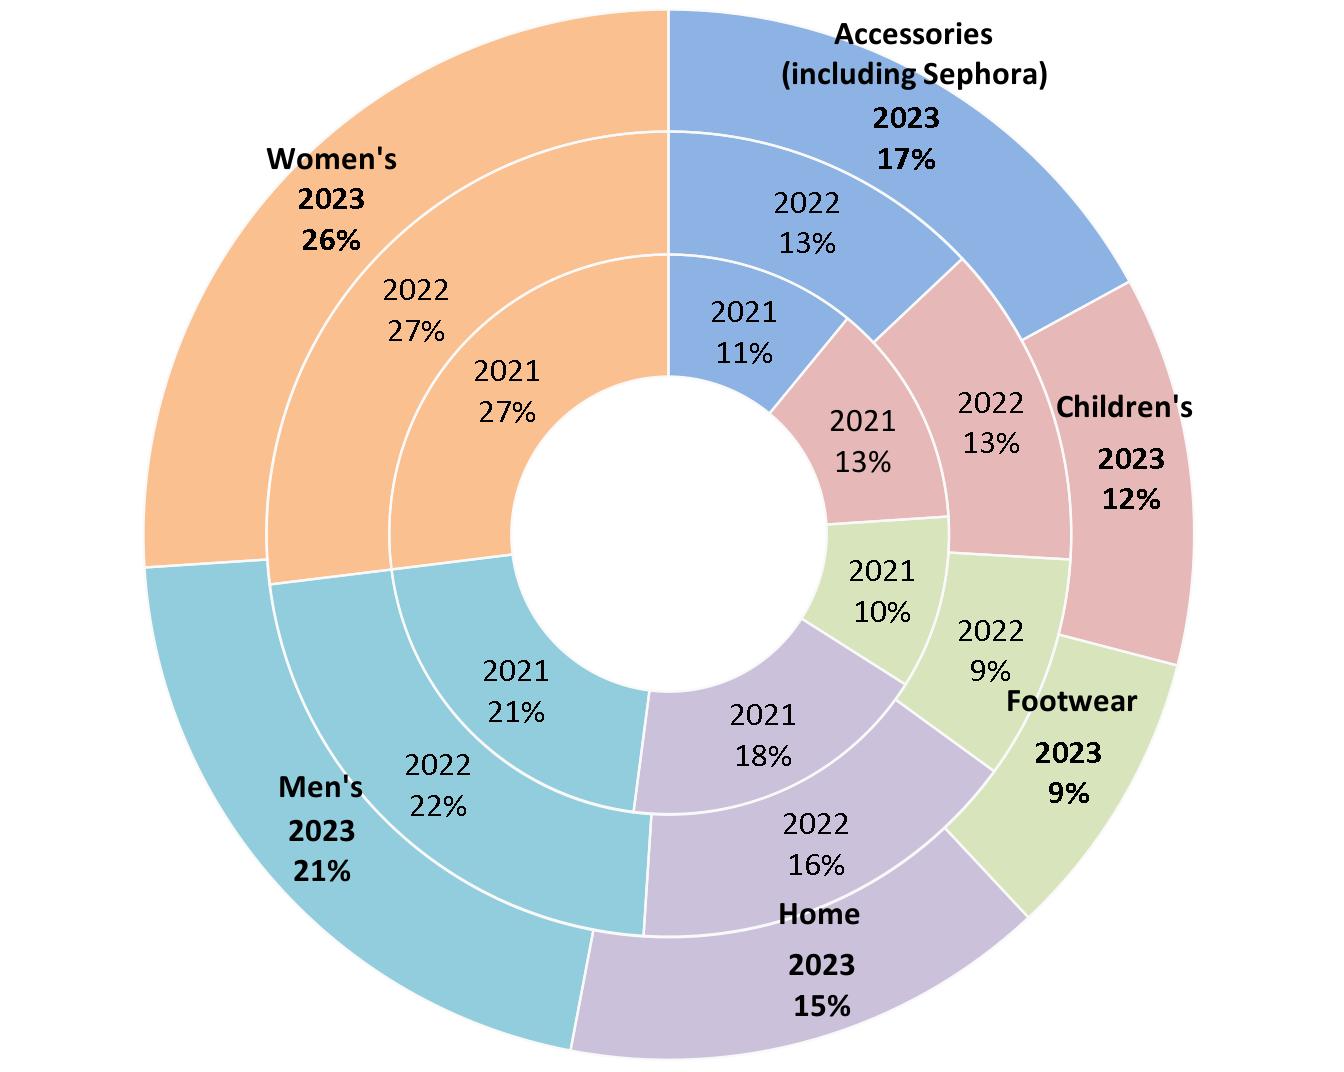
Kohl’s Corporation (the “Company," “Kohl’s,” "we," "our""our," or "us") was organized in 1988 and is a Wisconsin corporation. As of February 3, 2018,2024, we operated 1,1581,174 Kohl's department stores and a website (www.Kohls.com), 12 FILA outlets, and four Off-Aisle clearance centers.. Our Kohl's stores and website sell moderately-priced proprietaryprivate and national brand apparel, footwear, accessories, beauty, and home products. Our Kohl's stores generally carry a consistent merchandise assortment with some differences attributable to local preferences.preferences, store size, and Sephora at Kohl's shop-in-shops ("Sephora shops"). Our website includes merchandise thatwhich is available in our stores, as well as merchandise that is available only online.
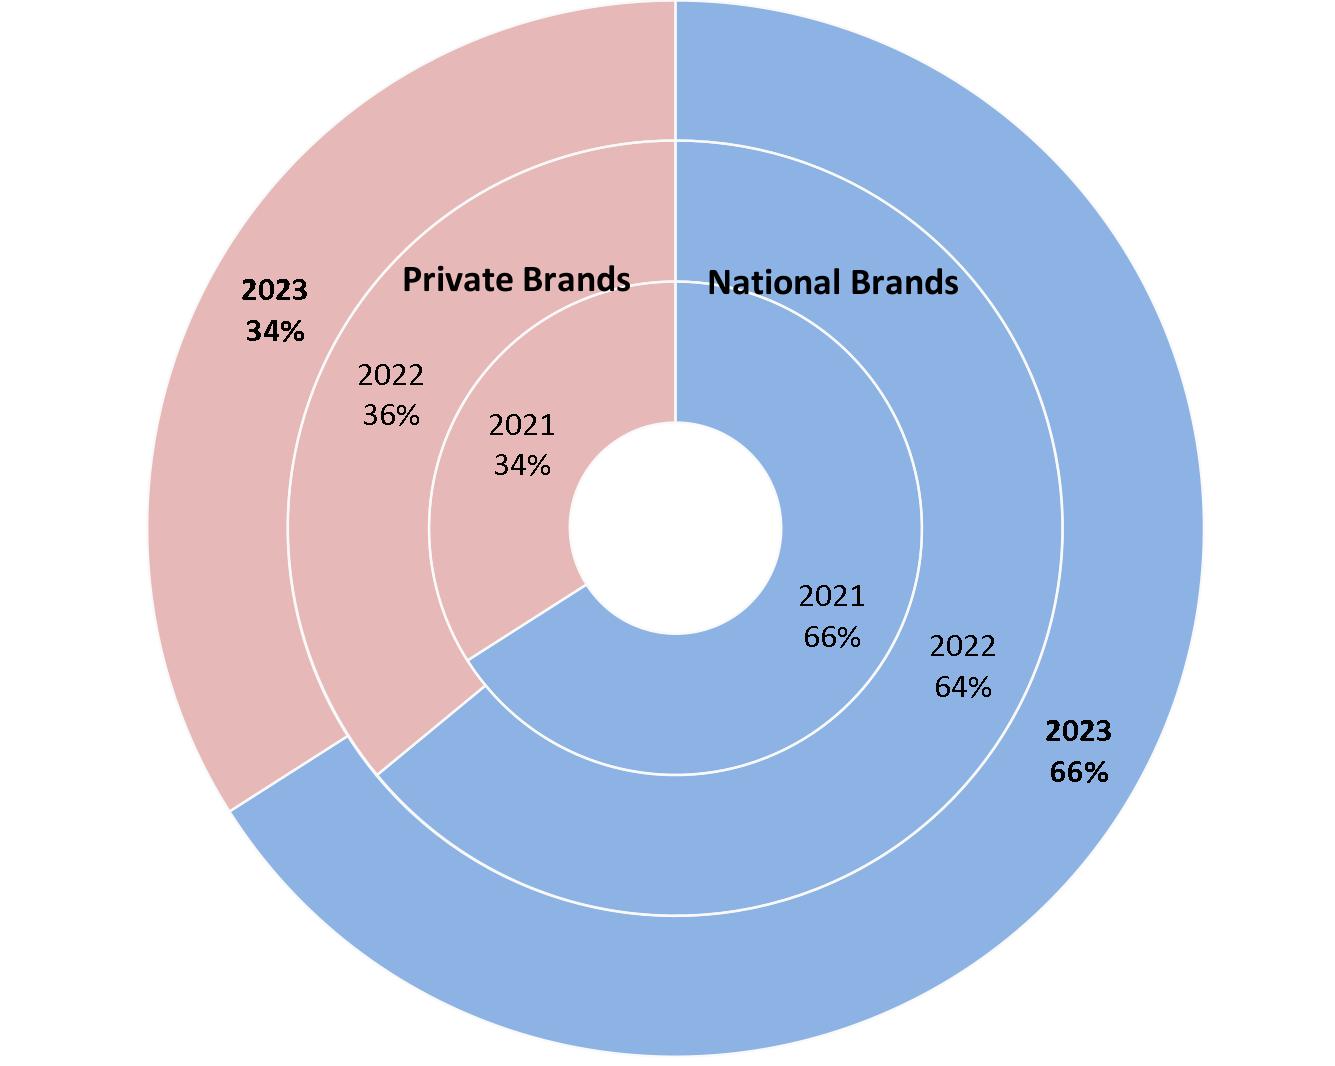
Our merchandise mix includes both national brands and proprietaryprivate brands that are available only at Kohl's. Our proprietaryprivate portfolio includes well-known established private brands such as Apt. 9, Croft & Barrow, Jumping Beans, SO, and Sonoma Goods for Life, and Tek Gear, and exclusive brands that are developed and marketed through agreements with nationally-recognized brands such as Food Network, Jennifer Lopez, Marc Anthony, Rock & RepublicLC Lauren Conrad, Nine West, and Simply Vera Vera Wang. NationalCompared to national brands, private brands generally have higherlower selling prices, but lowerhigher gross margins, than proprietary brands.margins.
The following tables summarize our net sales penetration by line of business and brand type over the last three years:

Our fiscal year ends on the Saturday closest to January 31st each year. Unless otherwise stated, references to years in this report relate to fiscal years rather than to calendar years. The following fiscal periods are presented in this report.report:
| Fiscal Year | Ended | Number of Weeks |
| |
| 2017 | February 3, 2018 |
| 53 |
|
| 2016 | January 28, 2017 |
| 52 |
|
| 2015 | January 30, 2016 |
| 52 |
|
Fiscal Year | Ended | Number of Weeks |
2023 | February 3, 2024 | 53 |
2022 | January 28, 2023 | 52 |
2021 | January 29, 2022 | 52 |
For discussion of our financial results, see Item 7, "Management's Discussion and Analysis of Financial Condition and Results of Operations."
3
Distribution
We receive substantially all of our store merchandise at our nine retail distribution centers and six e-fulfillment centers. A small amount of our merchandise is delivered directly to the stores by vendors or their distributors. The retail distribution centers, which are strategically located throughout the United States, ship merchandise to each store by contract carrier several times a week.carrier. Digital sales may be picked up in our stores or are shipped to the customer from a Kohl’s fulfillmente-fulfillment center, retail distribution center or store; by a third-party fulfillment center;store, or directly by a third-party vendor.
See Item 2, “Properties,” for additional information about our distribution and e-fulfillment centers.
3Human Capital
TableAt Kohl’s, we strive to create a welcoming and inclusive culture of Contentscare. We believe our associates are our most valuable asset and a differentiator for our business. Our teams of associates take care of each other, our customers and the communities we serve. We support our associates by fostering a safe and healthy work environment, offering competitive total compensation and benefits, including many health and wellness offerings, providing ongoing training and development opportunities, and cultivating an inclusive culture where all associates feel a sense of belonging and appreciation.
During 2017,2023, we employed an average of approximately 137,00096,000 associates, includingwhich included approximately 33,00036,000 full-time and 104,00060,000 part-time associates. The number of associates varies during the year, peaking during the back-to-school and holiday seasons. None of our associates are represented by a collective bargaining unit. We believe our relationswe maintain positive relationships with our associates.
Health, Safety, and Wellness
We lead initiatives that ensure the way we communicate, work, and develop our product enables our customers and associates to shop, work, and engage in a safe environment. We have a team dedicated to defining plans and preparing for business crisis events, including natural disasters and other unplanned disruptions like those brought on by the COVID-19 pandemic. To keep a healthy workforce, we maintain an advocacy program that provides associates with 24/7 access to medical professionals following a work accident. We continue to pursue innovative ways to educate our teams on safety. Associates at our stores, distribution, and e-fulfillment centers receive specialized training to enhance our safety culture and reduce associate accidents.
Diversity, Equity, and Inclusion
At Kohl’s, we are committed to our Diversity, Equity, and Inclusion ("DEI") strategy focused on Our People, Our Customers, and Our Community. This strategy accelerates how we are embedding DEI throughout our business by being intentional about our programs and practices and holding ourselves accountable to the work.
We are committed to creating an environment where diversity is valued at all levels, everyone feels a sense of equity, and where inclusion is evident across our business. Our DEI strategy is embedded into our acquisition and retention practices for all associates. We strive to celebrate our differences and help more customers see themselves reflected in our brands.
We are focused on growing leaders by engaging talent in internal and external professional development offerings and we are working to develop inclusive leaders through programs aimed at building awareness and encouraging advocacy. In the space of continuous development and engagement, we have eight Business Resource Groups with members focused on championing and enhancing diversity and inclusion efforts across our business.
4
At Kohl's, we believe our leaders are responsible for strengthening, modeling, and supporting our DEI efforts by ensuring that they are building a culture and environment where our associates feel seen, and their unique needs, experiences, abilities, and perspectives are valued and heard. Each leader is responsible for creating a caring culture and experience for our team, one that embraces and strives to understand our differences, and provides an inclusive environment for all. We work to provide learning opportunities for our leaders and associates to build a more diverse and inclusive workforce and engage associates on how that creates a competitive advantage.
Compensation and Benefits
We are committed to providing competitive and fair compensation and benefits programs to our associates and offer a range of benefits that are meaningful to our associates' everyday lives, with a commitment to supporting all aspects of associates' well-being. All eligible associates receive a 100% match (up to 5% of pay) in Kohl’s 401(k) Savings Plan after one year of employment. Full-time associates are very good.offered medical, dental, vision, prescription drug, disability and life insurance coverage, paid time off, and a merchandise discount. Part-time associates are offered a primary care health and pharmacy plan, dental, vision, supplementary life insurance, and a merchandise discount. Kohl's also offers adoption and surrogacy reimbursement options. Kohl's has Wellness Centers available to associates at corporate and credit locations, distribution centers, and e-commerce fulfillment centers, as well as for near-site store and remote associates within the vicinity.
CompetitionKohl's fosters associates' total well-being, which includes a number of benefits that focus on mental well-being and health, including the Employee Assistance Program, counseling coverage, mental well-being activities, webinars, business resource groups, support groups, and leader resources. We empower our associates’ work-life balance by giving them access to a full range of professional resources. An education benefit was introduced in 2022, which provides fully-funded tuition, books, and fees for associates pursuing high school completion, select certificates, and undergraduate degrees.
Training and Development
Behind our success are great teams of talented individuals who embody our values. We are committed to attracting, growing, and engaging talent, while giving associates equitable opportunities for career growth. Our talent management team brings together performance management, talent assessment, succession planning, and career planning. This team provides tools, resources, and best practices to ensure we have the right talent in the right roles at the right time. We invest in executive coaching, assessments, internal programs, external courses, peer networks, and more.
From initial onboarding to high potential leadership development, we believe in training and career growth for our associates. We encourage our associates to keep their skills fresh through different mediums ranging from live workshops to on-demand skills training available through our online library of courses. We also provide training to teams that provide skills and mindsets to help them perform at their highest level. Additionally, our development teams throughout the company provide job-specific training to ensure associates have the tools they need to excel in their jobs and serve our customers.
We are committed to the highest integrity standards and maintain a Code of Ethics to guide ethical decision-making for associates. As a company of integrity, we expect our associates to be honest and accountable. Our ethics training, which we require all associates to take annually, is refreshed yearly to ensure topics covered are relevant and impactful. The training helps connect ethics to an associate's day-to-day job responsibilities and promotes honesty, integrity, and fairness.
5
Competition
The retail industry is highly competitive. Management considers style, qualityproduct and pricevalue to be the most significant competitive factors in the industry. Merchandise mix, brands, service, loyalty programs, credit availability, and customer experience and convenience are also key competitive factors. Our primary competitors are online retailers, off-price retailers, warehouse clubs, mass merchandisers, specialty stores, traditional department stores, upscale mass merchandisers, off-price retailers, specialty stores, internet and catalog businesses and other forms of retail commerce. Our specific competitors vary from market to market.
Merchandise Vendors
We purchase merchandise from numerous domestic and foreign suppliers. All business partnerssuppliers must meet certain requirements in order to do business with us. Our Terms of Engagement are part of our purchase order terms and conditions and include provisions regarding laws and regulations, employment practices, ethical standards, environmental and legal requirements, communication, monitoring/monitoring and compliance, record keeping, subcontracting, and corrective action. Our expectation isWe expect that all business partnerssuppliers will comply with these Terms of Engagementour purchase terms and quickly remediate any deficiencies, if noted, in order to maintain our business relationship.
Approximately 25%A third-party purchasing agent sources approximately 15% of the merchandise we sell is sourced through a third-party purchasing agent.sell. No vendorsvendor individually accounted for more than 10% of our net purchases in 2017.2023. We have no significant long-term purchase commitments or arrangements with any of our suppliers and believe that we are not dependent on any one supplier.supplier or one geographical location. We believe we have good working relationships with our suppliers.
Seasonality
Our business, like that of mostother retailers, is subject to seasonal influences. The majority of our salesSales and income are typically realizedhigher during the second half of each fiscal year. The back-to-school season extends from August through September and represents approximately 15% of our annual sales. Approximately 30% of our annual sales occur during the holiday season in the months of November and December.seasons. Because of the seasonality of our business, results for any quarter are not necessarily indicative of the results that may be achieved for thea full fiscal year.
Trademarks and Service Marks
KOHL'S®is a registered trademark owned by one of our wholly-owned subsidiaries. We consider this mark and the accompanying goodwill to be valuable to our business. This subsidiary has over 200 additional registered trademarks, most of which are used in connection with our private brand products.
We consider the KOHL'S® mark, all other trademarks, and the accompanying goodwill to be valuable to our business.
Available Information
Our corporate website is https://corporate.kohls.com. Through the “Investors” portion of this website, we make available, free of charge, our proxy statements, Annual Reports on Form 10-K, Quarterly Reports on Form 10-Q, Current Reports on Form 8-K, SECSecurities and Exchange Commission (“SEC”) Forms 3, 4, and 5, and any amendments to those reports filed or furnished pursuant to Sections 13(a) and 15(d) of the Securities Exchange Act of 1934, as amended, as soon as reasonably practicable after such material has been filed with, or furnished to, the Securities and Exchange Commission (“SEC”).SEC.
4
The following have also been posted on our website, under the caption “Investors” and sub-captionsub-captions "Corporate Governance" or “ESG”:
Committee charters of our Board of Directors’ Audit Committee, Compensation Committee, Finance Committee, and Governance & Nominating and ESG Committee
Corporate Governance Guidelines
Code of Ethics
Corporate Social Responsibility Report6
InformationThe information contained on our website is not part of this Annual Report on Form 10-K. Paper copies of any of the materials listed above will be provided without charge to any shareholder submitting a written request to our Investor Relations Department at N56 W17000 Ridgewood Drive, Menomonee Falls, Wisconsin 53051 or via e-mail to Investor.Relations@Kohls.com.
This Form 10-K contains “forward-looking statements” made within the meaning of the Private Securities Litigation Reform Act of 1995. Words such as "believes," "anticipates," "plans," "may," "intends," "will," "should," "expects""expects," and similar expressions are intended to identify forward-looking statements. Forward-looking statements alsoinclude the statements under management's discussion and analysis, financial and capital outlook and may include comments about our future sales or financial performance and our plans, performance and other objectives, expectations or intentions, such as statements regarding our liquidity, debt service requirements, planned capital expenditures, future businessstore initiatives, and adequacy of capital resources and reserves. ThereForward-looking statements are based on management’s then current views and assumptions and, as a number of important factorsresult, are subject to certain risks and uncertainties that could cause ouractual results to differ materially from those indicated by theprojected. As such, forward-looking statements including, among others,are qualified by those risk factors described below. Forward-looking statements relate to the date made, and we undertake no obligation to update them.
Our sales, revenues, gross margin, expenses, and operating results could be negatively impacted by a number of factors including, but not limited to those described below. Many of these risk factors are outside of our control. If we are not successful in managing these risks, they could have a negative impact on our sales, revenues, gross margin, expenses, and/or operating results.
Macroeconomic and Industry Risks
General economic conditions, consumer spending levels, and/or other conditions could decline.
Consumer spending habits, including spending for the merchandise that we sell, are affected by many factors including prevailing economic conditions, inflation and measures to control inflation, consumer responses to recessionary concerns, levels of employment, salaries and wage rates, prevailing interest rates, housing costs, energy and fuel costs, income tax rates and policies, consumer confidence, consumer perception of economic conditions, and the consumer’s disposable income, credit availability, and debt levels. The moderate incomemoderate-income consumer, which is our core customer, is especially sensitive to these factors. A slowdown in the U.S. economy or an uncertain economic outlook could adversely affect consumer spending habits. As all of our stores are located in the United States, we are especially susceptible to deteriorations in the U.S. economy.
Consumer confidence is also affected by the domestic and international political situation. The outbreak or escalation of war, or the occurrence of terrorist acts or other hostilities in or affecting the United States, could lead to a decrease in spending by consumers.
Future pandemics could have a material adverse impact on our business, financial condition, and results of operations. The impact of, and actions taken in response to COVID-19, had a significant impact on the retail industry generally and our business. Future pandemics could have a material adverse effect on our business, financial condition, and results of operations.
Our competitors could make changes to their pricing and other practices.
The retail industry is highly competitive. We compete for customers, associates, locations, merchandise, services, and other important aspects of our business with many other local, regional, and national retailers. Those competitors include online retailers, off-price retailers, warehouse clubs, mass merchandisers, specialty stores, traditional department stores, upscale mass merchandisers, off-price retailers, specialty stores, internet and catalog businesses, and other forms of retail commerce.
57
We consider style, qualityproduct and pricevalue to be the most significant competitive factors in our industry. The continuing migration and evolution of retailing to digital channels has increased our challenges in differentiating ourselves from other retailers especially as it relates to national brands. In particular, consumers are able tocan quickly and conveniently comparison shop with digital tools, which can lead to decisions based solely on price. Unanticipated changes in the pricing and other practices of our competitors may adversely affect our performance.performance and lead to loss of market share in one or more categories.
Tax, trade and tradeclimate, and other ESG-related policies and regulations could change or be implemented and adversely change.affect our business and results of operations.
Uncertainty with respect to tax and trade policies, tariffs, and government regulations affecting trade between the United States and other countries has recently increased. We source theThe majority of our merchandise from manufacturers locatedgoods sourced are manufactured outside of the United States, primarily in Asia. Major developments in tax policy or trade relations, such as the imposition of tariffs on imported products, could have a material adverse effect on our business, results of operations, and liquidity. Furthermore, increased governmental focus on climate change and other ESG matters may result in complex regulatory requirements that may directly or indirectly have a significant impact on the costs of our operations, including energy, resources used to produce our products and compliance costs, which may have a material adverse effect on our business and results of operations. We also expect there will likely be increasing levels of regulation, disclosure-related and otherwise, with respect to ESG matters. Increased regulation and increased stakeholder expectations will likely lead to increased costs as well as scrutiny that could heighten all of the ESG-related risks we are subject to. Additionally, many of our suppliers may be subject to similar regulations and expectations, which may exacerbate existing risks or create new ones, including risks that may not be known to us. Any of these developments may have a material adverse effect on our business and results of operations.
Operational Risks
We may be unable to offer merchandise that resonates with existing customers and attracts new customers as well as successfully manage our inventory levels.
Our business is dependent on our ability to anticipate fluctuations in consumer demand for a wide variety of merchandise. Failure to accurately predict constantly changing consumer tastes, preferences, spending patterns, and other lifestyle decisions could create inventory imbalances and adversely affect our performance and long-term relationships with our customers. Additionally, failure to accurately predict changing consumer tastes may result in excess inventory, which could result in additional markdowns and adversely affect our operating results. Negative publicity surrounding us, our activities, or the products we offer, including consumer perception of our response to political and social issues, and campaigns by political activists promoting certain causes, could adversely impact our brand image and may decrease demand for our products, thereby adversely affecting our business, results of operations, cash flows or financial condition. As with most retailers, we also experience inventory shrinkage due to theft or damage. Higher rates of inventory shrinkage or increased security or other costs to combat inventory shrinkage could adversely affect our results of operations and financial condition, and our efforts to contain or reduce inventory shrinkage may not be successful.
We may be unable to source merchandise in a timely and cost-effective manner.
Approximately 25%A third-party purchasing agent sources approximately 15% of the merchandise we sell is sourced through a third-party purchasing agent.sell. The remaining merchandise is sourced from a wide variety of domestic and international vendors. Our ability to find qualified vendors and access to brands or products in a timely and efficient manner is a significant challenge which is typically even more difficult for goods sourced outside the United States, substantially all of which are shipped by ocean to ports in the United States. Political or financial instability, trade restrictions, tariffs, currency exchange rates, transport capacity and costs, pandemic outbreaks, work stoppages, port strikes, port congestion and delays, information technology challenges, and other factors relating to foreign trade are beyond our control and have impacted or could continue to adversely
8
impact our performance and cause us to pay more to obtain inventory or result in having the wrong inventory at the wrong time. In addition, certain laws and regulations impose import restrictions for goods, which may induce greater supply chain compliance costs and may result in delays to us or adversely impact our performance.inventory. Where we are the importer of record, we may be subject to additional regulatory and other requirements.
Increases in the price of merchandise, raw materials, fuel, and labor, or their reduced availability, could increase our cost of merchandise sold. The price and availability of raw materials may fluctuate substantially, depending on a variety of factors, including demand, weather, supply conditions, transportation costs, energy prices, work stoppages, government regulation and policy, economic climates, market speculation, and other unpredictable factors. An inability to mitigate these cost increases, unless sufficiently offset with our pricing actions, might cause a decrease in our profitability.operating results. Any related pricing actions might cause a decline in our sales volume. Additionally, a decreasereduction in the availability of raw materials could impair ourthe ability to meet our production or purchasing requirements in a timely manner. Both the increased cost and lower availability of merchandise, raw materials, fuel, and labor may also have an adverse impact on our cash and working capital needs as well as those of our suppliers.
If any of our significant vendors were to become subject to bankruptcy, receivership, or similar proceedings, we may be unable to arrange for alternate or replacement contracts, transactions, or business relationships on terms as favorable as current terms, which could adversely affect our sales and operating results.
6
Our vendors may not adhere to our Terms of Engagement or to applicable laws.
A substantial portion of our merchandise is received from vendors and factories outside of the United States. We require all of our suppliers to comply with all applicable local and national laws and regulations and our Terms of Engagement for Kohl's Business Partners. These Terms of Engagement include provisions regarding laws and regulations, employment practices, ethical standards, environmental and legal requirements, communication, monitoring/compliance, record keeping, subcontracting, and corrective action. From time to time, suppliers may not be in compliance with these standards or applicable laws. Significant or continuing noncompliance with such standards and laws by one or more suppliers could have a negative impact on our reputation and our results of operations.
Our marketing may be ineffective.
We believe that differentiating Kohl's in the marketplace is critical to our success. We design our marketing and loyalty programs to increase awareness of our brands and to build personalized connections with new and existing customers. We believe these programs will strengthen customer loyalty, increase the number and frequency of customers that shop our stores and website, and increase our sales. If our marketing and loyalty programs are not successful or efficient, our sales and operating results could be adversely affected.
The reputation and brand image of Kohl’s and the Kohl's brand or our proprietary brands and products we sell could be damaged.
We believe the Kohl's brand name and many of our proprietaryprivate brand names are powerful sales and marketing tools. We devote significant resources to promotingdevelop, promote, and protecting them. We develop and promote proprietaryprotect private brands that have generatedgenerate national recognition. In some cases, the private brands or the marketing of such brands are tied to or affiliated with well-known individuals. We also associate the Kohl’s brand with third-party national brands that we sell in our store and through our partnerships with companies in pursuit of strategic initiatives. Further, we focus on ESG as a component of our strategy, and we have and may at times continue to engage in voluntary initiatives (such as voluntary disclosures, certifications, or goals, among others) to improve the ESG profile of our company and/or products. For example, we publish an annual report to share information with our partners, shareholders, customers, and associates regarding our ESG progress. These disclosures reflect our goals and other expectations and assumptions, which are necessarily uncertain and may not be realized. Such initiatives may be costly, even if realized, may not have the desired effect, and actions or statements that we may take based on expectations, assumptions, or third-party
9
information that we currently believe to be reasonable may subsequently be determined to be erroneous or be subject to misinterpretation. At the same time, investor and other stakeholder expectations, and voluntary and regulatory ESG disclosure standards and policies, continue to evolve. We may be subject to investor or regulator engagement and/or litigation on our ESG initiatives and disclosures, even if such initiatives are currently voluntary. We also note that divergent views regarding ESG principles are emerging in the U.S., and in particular, in U.S. state-level regulation and enforcement efforts and among certain activist stakeholders. To the extent ESG matters negatively impact our brand and reputation, they may also impede our ability to compete as effectively to attract and retain employees or customers, which may adversely impact our operations, business, financial condition, results of operations, cash flow and prospects.
Damage to the reputations (whether or not justified) of the Kohl’s brand, our proprietaryprivate brand names, or any affiliated individuals or companies with which we have partnered, could arise from product failures; concerns about human rights, working conditions, and other labor rights and conditions associated with our own operations or where merchandise is produced; perceptions of our diversity, equity, and inclusion efforts; perceptions of our pricing and return policies; litigation; vendor violations of our Terms of Engagement; perceptions of the national vendors and/or other third parties with which we partner; failure, or perceived failure, to realize our ESG goals on a timely basis or at all; perceptions of our management of ESG risks and opportunities; our performance on various ESG ratings; failure to meet evolving investor and other stakeholder expectations with respect to ESG matters; or various other forms of adverse publicity, especially in social media outlets. Damage to our reputationThis type of reputational damage may result in deterioration in our relationships with stakeholders and/or a reduction in sales, earnings,operating results, and shareholder value.
There may be concerns about the safety of products that we sell.
If our merchandise offerings do not meet applicable safety standards or our customers' expectations regarding safety, we could experience lost sales, experience increased costs, and/or be exposed to legal and reputational risk. Events that give rise to actual, potential, or perceived product safety concerns could expose us to government enforcement action and/or private litigation. Reputational damage caused by real or perceived product safety concerns could have a negative impact on our sales and operating results.
We may be unable to adequately maintain and/or update our information systems.
The efficient operation of our business is dependent on our information systems. In particular, we rely on our information systems to effectively manage sales, distribution, and merchandise planning and allocation functions. We also generate sales thoughthrough the operations of our Kohls.com website. We frequently make investments that will help maintain and update our existing information systems. We also depend on third parties as it relates to our information systems. The potential problems and interruptions associated with implementing technology initiatives, or the failure of our information systems to perform as designed, or the failure to successfully partner with our third party service providers, such as our cloud platform providers, could disrupt our business and harm our sales and profitability.
7
Our information technology projects may not yield their intended results.
We regularly have internal information technology projects in process. Although the technology is intended to increase productivity and operating efficiencies, these projects may not yield their intended results or may deliver an adverse user or customer experience. We may incur significant costs in connection with the implementation, ongoing use, or discontinuation of technology projects, or fail to successfully implement these technology initiatives, or achieve the anticipated efficiencies from such projects, any of which could adversely affect our operations, liquidity, and financial condition. In addition, we may not be able to adapt or adapt quickly enough to technological change, including that brought about by the use of artificial intelligence. If our competitors are more successful in adapting to such changes or otherwise incorporating such changes into their business or operations, this could have a material adverse impact on our business and results of operations.
10
Weather conditions and natural disasters could adversely affect consumer shopping patterns.patterns and disrupt our operations.
A significant portion of ourOur business is apparel, footwear, accessories, beauty, and ishome products. Both our business and our supply chain are subject to weather conditions. As a result, our operating results may be adversely affected by severe or unexpected weather conditions.conditions (including those that may be caused by climate change). Frequent or unusually heavy snow, ice, or rain storms; natural disasters such as earthquakes, tornadoes, floods, fires, and hurricanes; or extended periods of unseasonable temperatures or droughts could adversely affect our supply chain or our performance by affecting consumer shopping patterns and diminishing demand for seasonal merchandise and/or causingmerchandise. In addition, these events could cause physical damage to our properties.properties or impact our supply chain, making it difficult or impossible to timely deliver seasonally appropriate merchandise. Climate change may impact the frequency and/or intensity of such events, as well as contribute to various chronic changes in the physical environment. Although we maintain crisis management and disaster response plans and may take various actions to mitigate our business risks associated with such events and climate change, our mitigation strategies may be inadequate to address such a major disruption event.
Further, unseasonable weather conditions, including unusually warm weather in the fall or winter months or abnormally wet or cold weather in the spring or summer months, whether due to climate change or otherwise, could have a material adverse effect on our business, financial condition, and operating results, as consumer spending may be inconsistent with our typical inventory purchasing cycle.
We may be unable to successfully execute an omnichannel strategy.
Customer expectations about the methods by which they purchase and receive products or services are evolving. Customers are increasingly using technology and mobile devices to rapidly compare products and prices, and to purchase products. Once products are purchased, customers are seeking alternate options for delivery of those products. We must continually anticipate and adapt to these changes in the purchasing process. Our ability to compete with other retailers and to meet our customercustomers' expectations may suffer if we are unable to provide relevant customer-facing technology and omnichannel experiences. OurWe have taken steps to simplify our value strategy by eliminating online-only promotions in favor of omnichannel pricing across the enterprise. This pressured our digital performance in 2023. While we believe this approach aligns with our long-term strategy, our efforts may not produce the intended results. Similarly, as we refine our value strategy to be less promotional, our efforts may negatively impact the loyalty of certain customers and our efforts to mitigate this impact may not be successful.
In addition, our ability to compete may also suffer if Kohl’s, our suppliers, or our third-party shipping and delivery vendors are unable to effectively and efficiently fulfill and deliver orders, especially during the holiday season when sales volumes are especially high. Consequently, our results of operations could be adversely affected.
Our business is seasonal in nature, which could negatively affect our sales, revenues, operating results, and cash requirements.
Our business is subject to seasonal influences, with a major portion of sales and income historically realized during the second half of the fiscal year, which includes the back-to-school and holiday seasons.
If we do not properlyadequately stock or restock popular products, particularly during the back-to-school and holiday seasons, we may fail to meet customer demand, which could affect our revenue and our future growth. If we overstock products, we may be required to take significant inventory markdowns or write-offs, which could reduce profitability. Underestimating customer demand, or failing to timely receive merchandise to meet demand, can lead to inventory shortages and missed sales opportunities, as well as negative customer experiences.
11
We have and may continue to experience an increase in costs associated with shipping digital orders due to complimentary upgrades,promotional shipping offers, split shipments, freight surcharges due to peak capacity constraints, and additional long-zone shipments necessary to ensure timely delivery for the holiday season. If too many customers access our website within a short period of time, particularly during peak selling periods, we may experience system interruptions that make our website unavailable or prevent us from efficiently fulfilling orders, which may reduce the volume of goods we sell and the attractiveness of our products and services. Also, third-party delivery and direct ship vendors may be unable to deliver merchandise on a timely basis.
This seasonality causes our operating results and cash needs to vary considerably from quarter to quarter. Additionally, any decrease in sales or profitability during the second half of the fiscal year could have a disproportionately adverse effect on our results of operations.
8
Changes in credit card operations and payment-related risks could adversely affect our sales, revenues, and/or profitability.
Our credit card operations facilitate merchandise sales and generate additional revenue from fees related to extending credit. The proprietaryprivate label and co-branded Kohl's credit card accounts are owned by an unrelated third-party, but we share in the net risk-adjusted revenue of the portfolio, which is defined as the sum of finance charges, late fees, and other revenue less write-offs of uncollectible accounts. Changes in funding costs related to interest rate fluctuations are shared similar to the revenue when interest rates exceed defined amounts. Though management currently believes that increases in funding costs will be largely offset by increases in finance charge revenue, increases in funding costs could adversely impact the profitability of this program. On March 5, 2024, the Consumer Financial Protection Bureau ("CFPB") finalized a rule lowering the safe harbor dollar amount credit card companies can charge for late fees for a missed payment. The rule reduces the typical amount of late fees that can be charged, which could have a negative impact on Kohl’s credit card revenues, particularly if Kohl’s steps to mitigate the impact of such rule are not successful.
Changes in credit card use and applications, payment patterns, credit fraud, and default rates may also result from a variety of economic, legal, social, and other factors that we cannot control or predict with certainty. Changes that adversely impact our ability to extend credit and collect payments could negatively affect our results.
We also accept payment from customers in a variety of ways, such as cash, checks, debit cards, gift cards, mobile payments, as well as other forms, which subject us to rules, regulations, contractual obligations, and other compliance requirements such as those related to payment network rules and operating guidelines, as well as potential fraud, which may have an adverse impact on our operating results.
We may be unable to attract, develop, and retain quality associates while controlling costs, which could adversely affect our operating results.
Our performance is dependent on attracting and retaining a large number of quality associates, including our senior management team and other key associates. While we have succession plans for our senior management team, they may not be adequate to replace members of our senior management, including our Chief Executive Officer, or may not be successfully executed.
Many associates are in entry levelentry-level or part-time positions with historically high rates of turnover. Many of our strategic initiatives require that we hire and/or develop associates with appropriate experience. Our staffing needs are especially high during the holiday season. Competition for these associates is intense. We cannot be sure that we will be able to attract and retain a sufficient number of qualified personnel in future periods.
Our ability to meet our labor needs while controlling costs is subject to external factors such as government benefits, unemployment levels and labor participation rates, prevailing wage rates, minimum wage legislation, actions by our competitors in compensation levels, perceptions of our employee experience, potential labor organizing efforts, and
12
changing demographics. Competitive and regulatory pressures have already significantly increased our labor costs. Further changes that adversely impact our ability to attract and retain quality associates could adversely affect our performance and/or profitability. In addition, changes in federal and state laws relating to employee benefits, including, but not limited to, sick time, paid time off, leave of absence, minimum wage, wage-and-hour, overtime, meal-and-break time, and joint/co-employment could cause us to incur additional costs, which could negatively impact our profitability.
Capital Risks
We may be unable to raise additional capital or maintain bank credit on favorable terms, which could adversely affect our business and financial condition.
We have historically relied on the public debt markets to raise capital to partially fund our operations and growth. We have also historically maintained lines of credit with financial institutions. In January 2023, we upsized and replaced our unsecured credit facility with a $1.5 billion senior secured, asset based revolving credit facility. Changes in the credit and capital markets, including market disruptions, limited liquidity, and interest rate fluctuations may increase the cost of financing or restrict our access to these potential sources of future liquidity. Our continued access to these liquidity sources on favorable terms depends on multiple factors, including our operating performance and maintaining strong debt ratings. IfDuring 2022, our credit ratings fallwere reduced below desirable levels,investment grade, which resulted in an increase in the interest rate on a portion of our long-term debt. During the first quarter of 2023, S&P downgraded our senior unsecured credit rating from BB+ to BB and Moody's downgraded our rating from Ba2 to Ba3. These downgrades have caused our cost of borrowing to increase, and further downgrades would cause our cost of borrowing to further increase. Declines in our credit ratings may also adversely affect our ability to access the debt markets and the terms and our cost of funds for new debt issuances couldissuances. If our credit ratings were to be adverselyfurther downgraded, or general market conditions were to ascribe higher risk to our credit rating levels, our industry, or our Company, our access to capital and the cost of debt financing may be negatively impacted. Additionally, if unfavorable capital market conditions exist if and when we were to seek additional financing, we may not be able to raise sufficient capital on favorable terms and on a timely basis (if at all). The terms of current and future debt agreements could restrict our business operations or cause future financing to be unavailable due to our covenant restrictions then in effect. Also, if we are unable to comply with the covenants under our revolving credit facility, the lenders under that agreement will have the right to terminate their commitments thereunder and declare the outstanding loans thereunder to be immediately due and payable. A default under our revolving credit facility could trigger a cross-default, acceleration, or other consequences under other indebtedness or financial instruments to which we are a party. If our access to capital was to become significantly constrained or our cost of capital was to increase significantly our financial condition, results of operations, and cash flows could be adversely affected.
9
Our capital allocation could be inefficient or ineffective.
Our goal is to invest capital to maximize our overall long-term returns. This includes spending on inventory, capital projects and expenses, managing debt levels, and periodically returning value to our shareholders through share repurchases and dividends. To a large degree, capital efficiency reflects how well we manage our other key risks. The actions taken to address other specific risks may affect how well we manage the more general risk of capital efficiency. If we do not properly allocate our capital to maximize returns, we may fail to produce optimal financial results, and we may experience a reduction in shareholder value.
13
Legal and Regulatory Risks
Regulatory and legal matters could adversely affect our business operations and change financial performance.
Various aspects of our operations are subject to federal, state, or local laws, rules, and regulations, including consumer regulations, any of which may change from time to time. The costs and other effects of new or changed legal requirements cannot be determined with certainty. For example, new legislation or regulations may result in increased costs directly for our compliance or indirectly to the extent such requirements increase prices of goods and services, reduce the availability of raw materials, or further restrict our ability to extend credit to our customers.
We continually monitor the state and federal legal/legal and regulatory environmentenvironments for developments that may impact us. Failure to detect changes and comply with such laws and regulations may result in an erosion of our reputation, disruption of business, and/or loss of associate morale. Additionally, we are regularly involved in various litigation matters that arise out of the conduct of our business. Litigation or regulatory developments could adversely affect our business operations and financial performance.
SensitiveOur efforts to protect the privacy and security of sensitive or confidential customer, associate, or company information could be improperly disclosed or lost,unsuccessful, which could severely damage our reputation, expose us to risks of litigation and liability, disrupt our operations, and harm our business.
As part of our normal course of business, we collect, retain, process, and retaintransmit sensitive and confidential customer, associate, and company information. The protectionWe also engage third-party vendors that provide technology, systems, and services to facilitate our collection, retention, processing, and transmission of this datainformation. It is extremely important to us, our associates and our customers. Despite the considerable security measures we have in place,possible that our facilities and systems and those of our third-party service providers, may bevendors are vulnerable to cybersecurity threats, security breaches, system failures, acts of vandalism, fraud, misappropriation, computer viruses,malware, ransomware, and other malicious or harmful code, misplaced or lost data, programming and/or human errors, or employee negligence,insider threats, or other similar events. The ever-evolving and increasingly sophisticated methods of cyber-attack may be difficult or impossible to anticipate and/or detect. Any data security breachincident involving the breach, misappropriation, loss, or other unauthorized disclosure of sensitive and/or confidential information, whether by us or our vendors, could disrupt our operations, damage our reputation and customers' willingness to shop in our stores or on our website, violate applicable laws, regulations, orders and agreements, and subject us to additional costs and liabilities which could be material. In addition, the regulatory environment related to data privacy and cybersecurity is constantly changing, with new and increasingly demanding requirements applicable to our business. Maintaining our compliance with those requirements, including recently enacted state consumer privacy laws, may increase our compliance costs, require changes to our business practices, limit our ability to use and collect data, impact our customers’ shopping experience, reduce our business efficiency, and subject us to additional regulatory scrutiny or data breach litigation.
Item 1B. Unresolved Staff Comments
Not applicable.
Item 1C. Cybersecurity
Cybersecurity Risk Management and Strategy
We have developed and implemented a cybersecurity risk management program intended to protect the confidentiality, integrity, and availability of our critical systems and information. We designed and assess our program based on the National Institute of Standards and Technology Cybersecurity Framework (NIST CSF), International Organization for Standardization (ISO) 27001, and Payment Card Industry Data Security Standard (PCI DSS). This does not imply that we meet any particular technical standards, specifications, or requirements, only that we use these frameworks as a guide to help us identify, assess, and manage cybersecurity risks relevant to our business.
14
Our cybersecurity risk management program is integrated into our overall enterprise risk management program and shares common methodologies, reporting channels, and governance processes that apply across the enterprise risk management program to other legal, compliance, strategic, operational, and financial risk areas. Our cybersecurity risk management program includes:
We have not identified risks from known cybersecurity threats, including as a result of any prior cybersecurity incidents, that have materially affected us, including our operations, business strategy, results of operations, or financial condition. We face risks from cybersecurity threats that, if realized, are reasonably likely to materially affect us, including our operations, business strategy, results of operations, or financial condition. See "Risk Factors- Legal and Regulatory Risks".
Cybersecurity Governance
Our Board considers cybersecurity risk as part of its risk oversight function and has delegated to its Audit Committee oversight of cybersecurity and other information technology risks. Our Audit Committee oversees management’s implementation of our cybersecurity risk management program.
Our Audit Committee receives regular reports from management on our cybersecurity risks, and our full Board receives a periodic update. In addition, management updates the Audit Committee, as necessary, regarding any material cybersecurity incidents, as well as significant incidents.
Our Audit Committee reports to the full Board regarding its activities, including those related to cybersecurity. Board members receive presentations on cybersecurity topics from our Chief Technology Officer (CTO), Chief Risk and Compliance Officer (CRCO), and Chief Information Security Officer (CISO) or external experts as part of the Board’s continuing education on topics that impact public companies.
Our management team, including our CTO, CRCO, and CISO, has overall responsibility for assessing and managing our material risks from cybersecurity threats. The team has primary responsibility for our overall cybersecurity risk management program and supervises both our internal cybersecurity personnel and our retained external cybersecurity consultants. Our management team’s experience includes over 25 years of technology and finance leadership experience across multiple industries for our CTO, over 30 years of experience in the Legal, Risk and Compliance disciplines for our CRCO, and over 20 years of cybersecurity leadership experience for our CISO.
Our management team is informed about and monitors the prevention, detection, mitigation, and remediation of key cybersecurity risks and incidents through various means, which may include briefings from internal security personnel, threat intelligence and other information obtained from governmental, public or private sources, including external consultants engaged by us, and alerts and reports produced by security tools deployed in the information technology environment.
15
Stores
As of February 3, 2018,2024, we operated 1,1581,174 Kohl's department stores with 82.882 million selling square feet in 49 states. We also operate four Off-Aisle clearance centers and 12 FILA outlets.
Our typical store lease has an initial term of 20-25 years and four to eight five-year renewal options for consecutive five-year extension terms.options. Substantially all of our leases provide for a minimum annual rent that is fixed or adjusts to set levels during the lease term, including renewals. Approximately one-fourthSome of theour store leases provide for additional rent based on a percentage of sales over designated levels.
10
The following tables summarize key information about our Kohl's stores as of February 3, 2018:2024:
Number of Stores by State | |||||
Mid-Atlantic Region: | Northeast Region: | South Central Region: | |||
Delaware | 5 | Connecticut | 20 | Arkansas | 8 |
Maryland | 23 | Maine | 5 | Kansas | 12 |
Pennsylvania | 51 | Massachusetts | 26 | Louisiana | 7 |
Virginia | 31 | New Hampshire | 11 | Missouri | 27 |
West Virginia | 8 | New Jersey | 38 | Oklahoma | 11 |
|
| New York | 50 | Texas | 89 |
|
| Rhode Island | 4 |
|
|
|
| Vermont | 2 |
|
|
Total Mid-Atlantic | 118 | Total Northeast | 156 | Total South Central | 154 |
|
|
|
|
|
|
Midwest Region: | Southeast Region: | West Region: | |||
Illinois | 66 | Alabama | 14 | Alaska | 1 |
Indiana | 42 | Florida | 50 | Arizona | 26 |
Iowa | 18 | Georgia | 33 | California | 117 |
Michigan | 46 | Kentucky | 18 | Colorado | 24 |
Minnesota | 28 | Mississippi | 5 | Idaho | 6 |
Nebraska | 8 | North Carolina | 31 | Montana | 4 |
North Dakota | 4 | South Carolina | 17 | Nevada | 13 |
Ohio | 59 | Tennessee | 20 | New Mexico | 4 |
South Dakota | 4 |
|
| Oregon | 11 |
Wisconsin | 42 |
|
| Utah | 12 |
|
|
|
| Washington | 21 |
|
|
|
| Wyoming | 2 |
Total Midwest | 317 | Total Southeast | 188 | Total West | 241 |
Location |
| Ownership | ||
Strip centers | 951 |
| Owned | 406 |
Freestanding | 161 |
| Leased | 521 |
Community & regional malls | 62 |
| Ground leased | 247 |
Number of Stores by State | |||||||
Mid-Atlantic Region: |
| Northeast Region: |
| South Central Region: | |||
Delaware | 5 |
| Connecticut | 22 |
| Arkansas | 8 |
Maryland | 23 |
| Maine | 5 |
| Kansas | 12 |
Pennsylvania | 50 |
| Massachusetts | 25 |
| Louisiana | 8 |
Virginia | 31 |
| New Hampshire | 11 |
| Missouri | 27 |
West Virginia | 7 |
| New Jersey | 38 |
| Oklahoma | 11 |
|
|
| New York | 51 |
| Texas | 84 |
|
|
| Rhode Island | 4 |
|
|
|
|
|
| Vermont | 2 |
|
|
|
Total Mid-Atlantic | 116 |
| Total Northeast | 158 |
| Total South Central | 150 |
|
|
|
|
|
|
|
|
Midwest Region: |
| Southeast Region: |
| West Region: | |||
Illinois | 66 |
| Alabama | 14 |
| Alaska | 1 |
Indiana | 40 |
| Florida | 51 |
| Arizona | 26 |
Iowa | 18 |
| Georgia | 32 |
| California | 117 |
Michigan | 46 |
| Kentucky | 17 |
| Colorado | 24 |
Minnesota | 27 |
| Mississippi | 5 |
| Idaho | 5 |
Nebraska | 7 |
| North Carolina | 30 |
| Montana | 3 |
North Dakota | 4 |
| South Carolina | 16 |
| Nevada | 12 |
Ohio | 59 |
| Tennessee | 20 |
| New Mexico | 5 |
South Dakota | 4 |
|
|
|
| Oregon | 11 |
Wisconsin | 41 |
|
|
|
| Utah | 12 |
|
|
|
|
|
| Washington | 19 |
|
|
|
|
|
| Wyoming | 2 |
Total Midwest | 312 |
| Total Southeast | 185 |
| Total West | 237 |
16
Location |
| Ownership | ||
Strip centers | 779 |
| Owned | 412 |
Community & regional malls | 83 |
| Leased | 509 |
Freestanding | 296 |
| Ground leased | 237 |
Distribution Centers
The following table summarizes key information about each of our distribution centers.and e-fulfillment centers:
|
|
| Year Opened |
| Square Footage |
| |
| Store distribution centers: |
|
|
|
|
|
|
| Findlay, Ohio |
| 1994 |
|
| 780,000 |
|
| Winchester, Virginia |
| 1997 |
|
| 420,000 |
|
| Blue Springs, Missouri |
| 1999 |
|
| 540,000 |
|
| Corsicana, Texas |
| 2001 |
|
| 540,000 |
|
| Mamakating, New York |
| 2002 |
|
| 605,000 |
|
| San Bernardino, California |
| 2002 |
|
| 575,000 |
|
| Macon, Georgia |
| 2005 |
|
| 560,000 |
|
| Patterson, California |
| 2006 |
|
| 360,000 |
|
| Ottawa, Illinois |
| 2008 |
|
| 328,000 |
|
| Online fulfillment centers: |
|
|
|
|
|
|
| Monroe, Ohio |
| 2001 |
|
| 1,200,000 |
|
| San Bernardino, California |
| 2010 |
|
| 970,000 |
|
| Edgewood, Maryland |
| 2011 |
|
| 1,450,000 |
|
| DeSoto, Texas |
| 2012 |
|
| 1,200,000 |
|
| Plainfield, Indiana |
| 2017 |
|
| 936,000 |
|
| Year | Square |
Store distribution centers: |
|
|
Findlay, Ohio | 1994 | 780,000 |
Winchester, Virginia | 1997 | 450,000 |
Blue Springs, Missouri | 1999 | 540,000 |
Corsicana, Texas | 2001 | 540,000 |
Mamakating, New York | 2002 | 605,000 |
San Bernardino, California | 2002 | 575,000 |
Macon, Georgia | 2005 | 560,000 |
Patterson, California | 2006 | 365,000 |
Ottawa, Illinois | 2008 | 330,000 |
E-commerce fulfillment centers: |
|
|
Monroe, Ohio | 2001 | 1,225,000 |
San Bernardino, California | 2010 | 970,000 |
Edgewood, Maryland | 2011 | 1,450,000 |
DeSoto, Texas | 2012 | 1,515,000 |
Plainfield, Indiana | 2017 | 975,000 |
Etna, Ohio | 2021 | 1,300,000 |
We own all of the distribution and e-fulfillment centers except the San Bernardino, California locations and Corsicana, Texas, which isare leased.
11
We own our corporate headquarters in Menomonee Falls, Wisconsin. We also own or lease additional buildings and office space, which are used by various corporate departments, including our credit operations.
We are not currentlyFor a party to any materialdescription of our legal proceedings, but are subject to certain legal proceedings and claims from time to time that arise outsee Note 7, Contingencies, of the conduct ofnotes to our business.consolidated financial statements included elsewhere in this Annual Report on Form 10-K, which is incorporated by reference in response to this item.
Item 4. Mine Safety Disclosures
Not applicable.
Item 4A. Information about Our Executive Officers
Our executive officers as of February 3, 20182024 were as follows:
Name | Age | Position |
|
|
|
|
| Chief Financial Officer |
Fred Hand | 60 | Senior Executive Vice President, Director of Stores |
Nick Jones | 51 | Chief Merchandising and |
|
| Senior Executive Vice President, Chief |
|
| Senior Executive Vice President, Chief |
|
| Senior Executive Vice President, Chief |
17
Thomas A. Kingsbury
Mr. Mansell is responsible for Kohl’s strategic direction, long-term growth and profitability. HeKingsbury has served as Chairman since September 2009,our Chief Executive Officer since August 2008February 2023 and President and Director since February 1999. We previously announced Mr. Mansell’s retirementserved as the Chairman of the Board, Chief Executive Officer and Presidentour Interim CEO from December 2022 through January 2023 and as a director since May 2021. Mr. Kingsbury has more than 40 years of Kohl’s effective as ofexperience in the close ofretail industry. Prior to joining the 2018 Annual Meeting of Shareholders or any adjournment thereof. Mr. Mansell began his retail careerCompany in 1975.
Ms. Gass joined Kohl's in June 2013 as Chief Customer Officer and was named Chief Merchandising and Customer Officer in June 2015 and CEO-elect in September 2017. She is responsible for all of Kohl's merchandising, planning and allocation, and product development functions as well as the company's overall customer engagement strategy, including marketing, public relations, social media and philanthropic efforts. Previously, she served inDecember 2022, he held a variety of management positions with Starbucks Coffee Company since 1996, most recentlycompany and board leadership roles at Kohl’s, Burlington Stores, Inc., and The May Department Stores Company. He led Burlington Stores, Inc. as President Starbucks Coffee EMEA (Europe, Middle East, Russia and Africa) from 2011 to May 2013. Ms. Gass began her retail career in 1991.
Ms. Chawla joined Kohl's in November 2015 as Chief Operating Officer and was named President-elect in September 2017. She is responsible for Kohl's full omnichannel operations. She oversees all store operations, logistics and supply chain network, information and digital technology, and omnichannel strategy, planning and operations. Previously, she had served with Walgreens as President of Digital and Chief MarketingExecutive Officer from February2008 to 2019 and served on the Burlington Stores Board of Directors from 2008 to 2020, including as Chairman from 2014 to November 20152019 and President, E-Commerceas Executive Chairman from January 20112019 to February 2014. 2020.
Jill Timm
Ms. Chawla began her retail and digital career in 2000.
Mr. Besanko joined Kohl’s in July 2017Timm has served as Chief Financial Officer since November 2019. Ms. Timm joined the Company in 1999 and is responsible for financial planning and analysis, investor relations, financial reporting, accounting operations, tax, treasury, non-merchandise purchasing, credit and capital investment strategies. Previously, he served with Supervalu, Inc. as Executive Vice President, Chief Operating Officer and Chief Financial Officer from October 2015 to July 2017 and Executive Vice President and Chief Financial Officer from August 2013 to October 2015. Mr. Besanko alsohas held a number of progressive leadership roles across several areas of finance, most recently having served as Executive Vice President Chief Financial Officer and Chief Administrative Officerof Finance. Prior to joining the Company, she served as senior auditor at OfficeMax, Inc. from 2008 to August 2013 and Executive Vice President, Chief Financial Officer at Circuit City from 2007 to 2008. On November 10, 2008, Circuit City and severalArthur Andersen LLP. Ms. Timm has more than 20 years of its subsidiaries filed voluntary petitions for relief under Chapter 11 of the United States Bankruptcy Codeexperience in the United States Bankruptcy Court for the Eastern District of Virginia. Circuit City’s Chapter 11retail industry.
12
Table of ContentsFred Hand
plan of liquidation was confirmed by the Bankruptcy Court on September 14, 2010. In addition to his business experience, he served 26 years in the U.S. Air Force where he rose to the rank of Lieutenant Colonel. Mr. Besanko began his retail career in 1996.
Mr. Schepp was promoted to the principal officer position of Chief Administrative Officer in June 2015 and is responsible for Kohl's human resources, legal, risk management and compliance, real estate, business development and store construction and design functions. He previouslyHand has served as Senior Executive Vice President, Human Resources, General CounselDirector of Stores since September 2023. Prior to joining the Company, Mr. Hand served as Chief Executive Officer of Tuesday Morning from August 2020 to May 2021. Prior to that, he was Chief Operating Officer at Burlington, where he led the Stores organization for more than 13 years. Mr. Hand has also held a variety of senior leadership roles in stores and Secretaryvisual merchandising at May Department Stores (then Macy's) and Filene's. Mr. Hand has more than 30 years of retail experience.
Nick Jones
Mr. Jones has served as Chief Merchandising and Digital Officer since March 2023. Prior to joining the Company, Mr. Jones served as Chief Executive Officer at Joules Group — a premium British lifestyle clothing brand from April 2013September 2019 to June 2015,August 2022. Mr. Jones has also held a variety of business and merchandise leadership positions with ASDA/Walmart UK and Marks & Spencer. Mr. Jones has more than 25 years of retail experience.
Jennifer Kent
Ms. Kent has served as Senior Executive Vice President, General CounselChief Legal Officer and Corporate Secretary since February 2023. Prior to joining the Company, Ms. Kent served in various legal leadership roles at Quad/Graphics, Inc., a publicly traded Milwaukee-based company, from May 20112010 to April 2013 andFebruary 2023, most recently having served as its Executive Vice President and Chief People and Legal Officer and Corporate Secretary. Ms. Kent also held a variety of other legal roles throughout her career, including as an Associate General Counsel at Harley-Davidson Motor Company, an Assistant United States Attorney at the U.S. Attorney’s Office, and Secretaryas an associate at Foley & Lardner LLP. Ms. Kent has over 25 years of legal experience.
Siobhán Mc Feeney
Ms. Mc Feeney has served as Senior Executive Vice President, Chief Technology Officer since July 2022. She joined the Company in January 2020 as Senior Vice President, Technology. Prior to joining the Company, Ms. Mc Feeney served in a number of technology leadership roles, including leading innovation and strategy at Pivotal Software, Inc. from 2014 to January 2020. Ms. Mc Feeney has also held various leadership roles at AAA Northern California, including Chief Financial Officer, Chief Information Officer, and Interim Chief Executive Officer. Ms. Mc Feeney has more than 25 years of technology and finance experience.
Christie Raymond
Ms. Raymond has served as Senior Executive Vice President, Chief Marketing Officer since August 20012022. She joined the Company in October 2017 as Senior Vice President, Media and Personalization and was promoted to May 2011. Mr. Schepp began hisExecutive Vice President, Customer Engagement, Analytics & Insights in June 2020. Prior to joining the Company, she served in marketing, new business, and strategic planning leadership roles at The Walt Disney Company and Aspen Club Technologies. Ms. Raymond has 15 years of marketing and retail career in 1992.industry experience.
18
Item 5. Market for Registrant’s Common Equity, Related Stockholder Matters, and Issuer Purchases of Equity Securities
Market information
Our Common Stock has been traded on the New York Stock Exchange ("NYSE") since May 19, 1992, under the symbol “KSS.” The prices in the table set forth below indicate the high and low sales prices of our Common Stock per the New York Stock Exchange Composite Price History and our quarterly cash dividends per common share for each quarter in 2017 and 2016.
|
|
| 2017 |
|
|
| 2016 |
| ||||||||||||||||||
|
|
| High |
|
| Low |
|
| Dividend |
|
|
| High |
|
| Low |
|
| Dividend |
| ||||||
| Fourth quarter |
| $ | 69.14 |
|
| $ | 37.97 |
|
| $ | 0.55 |
|
|
| $ | 59.43 |
|
| $ | 39.00 |
|
| $ | 0.50 |
|
| Third quarter |
|
| 47.44 |
|
|
| 36.50 |
|
|
| 0.55 |
|
|
|
| 46.15 |
|
|
| 37.70 |
|
|
| 0.50 |
|
| Second quarter |
|
| 42.13 |
|
|
| 35.16 |
|
|
| 0.55 |
|
|
|
| 45.07 |
|
|
| 34.49 |
|
|
| 0.50 |
|
| First quarter |
|
| 44.50 |
|
|
| 36.66 |
|
|
| 0.55 |
|
|
|
| 51.13 |
|
|
| 39.69 |
|
|
| 0.50 |
|
Holders
On February 28, 2018, our Board of Directors approved an 11% increase in our dividend to $0.61 per common share. The dividend will be paid on March 28, 2018 to shareholders of record asAs of March 14, 2018. In 2017, we paid aggregate cash dividends of $368 million.
Holders
As of March 14, 2018,20, 2024, there were approximately 4,0003,200 record holders of our Common Stock.
13
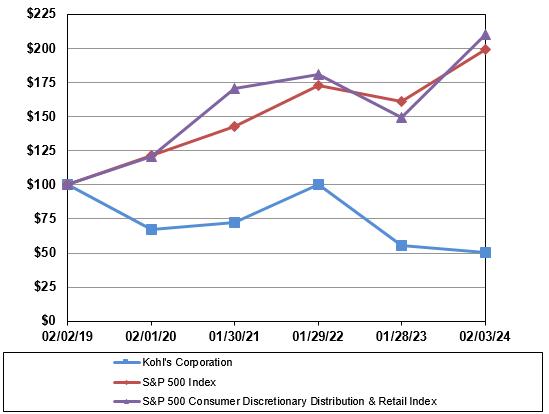
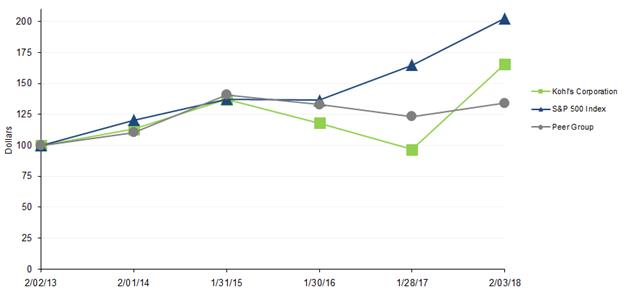
The graph below compares our cumulative five-year shareholder return to that of the Standard & Poor’s (“S&P”) 500 Index and a Peer Groupthe S&P 500 Consumer Discretionary Distribution & Retail Index, that is consistent withformerly known as the retail peer group used in the Compensation DiscussionS&P 500 Retailing Index. The S&P 500 Consumer Discretionary Distribution & Analysis section of our Proxy Statement for our May 16, 2018 Annual Meeting of Shareholders. The Peer GroupRetail Index was calculated by S&P Global, a Standard & Poor’s business and includes Bed, Baththe same companies within the S&P Consumer Discretionary Distribution & Beyond Inc.;Retail Index. The Gap, Inc.; J.C. Penney Company, Inc.; L Brands, Inc.; Macy’s, Inc.; Nordstrom, Inc.; Ross Stores, Inc.; Sears Holding Corporation; Target Corporation; and The TJX Companies, Inc. The Peer GroupS&P 500 Consumer Discretionary Distribution & Retail Index is weighted by the market capitalization of each component company at the beginning of each period. The graph assumes an investment of $100 on February 2, 20132019 and reinvestment of dividends. The calculations exclude trading commissions and taxes.
19
| Company / Index |
| Feb 2, 2013 |
|
| Feb 1, 2014 |
|
| Jan 31, 2015 |
|
| Jan 30, 2016 |
|
| Jan 28, 2017 |
|
| Feb 3, 2018 |
| ||||||
| Kohl’s Corporation |
| $ | 100.00 |
|
| $ | 113.07 |
|
| $ | 137.13 |
|
| $ | 117.90 |
|
| $ | 96.59 |
|
| $ | 165.78 |
|
| S&P 500 Index |
|
| 100.00 |
|
|
| 120.30 |
|
|
| 137.42 |
|
|
| 136.50 |
|
|
| 164.99 |
|
|
| 202.66 |
|
| Peer Group Index |
|
| 100.00 |
|
|
| 110.41 |
|
|
| 140.97 |
|
|
| 132.93 |
|
|
| 123.18 |
|
|
| 134.02 |
|
Company / Index | Feb 2, | Feb 1, | Jan 30, | Jan 29, | Jan 28, | Feb 3, |
Kohl’s Corporation | $100.00 | $67.42 | $72.06 | $100.18 | $55.41 | $50.62 |
S&P 500 Index | 100.00 | 121.56 | 142.53 | 172.46 | 161.03 | 199.42 |
S&P 500 Consumer Discretionary Distribution & Retail Index | 100.00 | 120.61 | 170.52 | 180.58 | 149.54 | 210.02 |
Recent Sales of Unregistered Securities; Use of Proceeds from Registered Securities
We did not sell any equity securities from 2015 through 2017in fiscal year 2023 that were not registered under the Securities Act.
Purchases of Equity Securities by the Issuer and Affiliated Purchasers
In 2016,February 2022, our Board of Directors increased the remaining share repurchase authorization under our existing share repurchase program to $2.0$3.0 billion. Purchases under the repurchase program may be made in the open market, through block trades, and other negotiated transactions. We expect to execute the share repurchase program primarily in open market transactions, subject to market conditions. There is no fixed termination date for the repurchase program, and the program may be suspended, discontinued, or accelerated at any time.
14
The following table contains information for shares repurchased and shares acquired from employees in lieu of amounts required to satisfy minimum tax withholding requirements upon the vesting of the employees’ restricted stock during the three fiscal months ended February 3, 2018:2024:
(Dollars in Millions, Except per Share Data) | Total Number of Shares Purchased | Average Price Paid Per Share | Total Number of Shares Purchased as Part of Publicly Announced Plans or Programs | Approximate Dollar Value of Shares That May Yet Be Purchased under the Plans or Programs |
October 29 - November 25, 2023 | 2,444 | $22.54 | — | $2,476 |
November 26 – December 30, 2023 | 47,766 | 25.53 | — | 2,476 |
December 31, 2023 - February 3, 2024 | 69,227 | 26.32 | — | 2,476 |
Total | 119,437 | $25.93 | — |
|
Item 6. Reserved
| Period |
| Total Number of Shares Purchased During Period |
|
| Average Price Paid Per Share |
|
| Total Number of Shares Purchased as Part of Publicly Announced Plans or Programs |
|
| Approximate Dollar Value of Shares that May Yet Be Purchased Under the Plans or Programs (Dollars in Millions) |
| ||||
| October 29 - November 25, 2017 |
|
| 320,380 |
|
| $ | 41.98 |
|
|
| 318,312 |
|
| $ | 1,606 |
|
| November 26 – December 30, 2017 |
|
| 117,520 |
|
|
| 49.34 |
|
|
| 89,600 |
|
|
| 1,602 |
|
| December 31, 2017 - February 3, 2018 |
|
| 12,787 |
|
|
| 62.85 |
|
|
| 1,400 |
|
|
| 1,602 |
|
| Total |
|
| 450,687 |
|
| $ | 44.49 |
|
|
| 409,312 |
|
|
| 1,602 |
|
20
15
Item 6. Selected Consolidated Financial Data
The selected consolidated financial data presented below should be read in conjunction with our consolidated financial statements and related notes included elsewhere in this document.
| (Dollars in Millions, Except per Share and per Square Foot Data) | 2017 (e) | 2016 | 2015 | 2014 | 2013 | |||||||||||||||
| Net sales |
|
|
|
|
|
|
|
|
|
|
|
|
|
|
|
|
|
|
|
|
| Dollars |
| $ | 19,095 |
|
| $ | 18,686 |
|
| $ | 19,204 |
|
| $ | 19,023 |
|
| $ | 19,031 |
|
| Net sales increase (decrease) |
|
| 2.2 | % |
|
| (2.7 | )% |
|
| 1.0 | % |
|
| 0.0 | % |
|
| (1.3 | )% |
| Comparable sales (a) |
|
| 1.5 | % |
|
| (2.4 | )% |
|
| 0.7 | % |
|
| (0.3 | )% |
|
| (1.2 | )% |
| Per selling square foot (b) |
| $ | 229 |
|
| $ | 224 |
|
| $ | 228 |
|
| $ | 226 |
|
| $ | 227 |
|
| Gross margin |
|
|
|
|
|
|
|
|
|
|
|
|
|
|
|
|
|
|
|
|
| Dollars |
| $ | 6,919 |
|
| $ | 6,742 |
|
| $ | 6,939 |
|
| $ | 6,925 |
|
| $ | 6,944 |
|
| As a percent of sales |
|
| 36.2 | % |
|
| 36.1 | % |
|
| 36.1 | % |
|
| 36.4 | % |
|
| 36.5 | % |
| Selling, general and administrative expenses |
|
|
|
|
|
|
|
|
|
|
|
|
|
|
|
|
|
|
|
|
| Dollars |
| $ | 4,512 |
|
| $ | 4,435 |
|
| $ | 4,452 |
|
| $ | 4,350 |
|
| $ | 4,313 |
|
| As a percent of sales |
|
| 23.6 | % |
|
| 23.7 | % |
|
| 23.2 | % |
|
| 22.9 | % |
|
| 22.7 | % |
| Operating income |
|
|
|
|
|
|
|
|
|
|
|
|
|
|
|
|
|
|
|
|
| Dollars |
|
|
|
|
|
|
|
|
|
|
|
|
|
|
|
|
|
|
|
|
| Reported (GAAP) |
| $ | 1,416 |
|
| $ | 1,183 |
|
| $ | 1,553 |
|
| $ | 1,689 |
|
| $ | 1,742 |
|
| Adjusted (non-GAAP) (c) |
| $ | 1,416 |
|
| $ | 1,369 |
|
| $ | 1,553 |
|
| $ | 1,689 |
|
| $ | 1,742 |
|
| As a percent of sales |
|
|
|
|
|
|
|
|
|
|
|
|
|
|
|
|
|
|
|
|
| Reported (GAAP) |
|
| 7.4 | % |
|
| 6.3 | % |
|
| 8.1 | % |
|
| 8.9 | % |
|
| 9.2 | % |
| Adjusted (non-GAAP) (c) |
|
| 7.4 | % |
|
| 7.3 | % |
|
| 8.1 | % |
|
| 8.9 | % |
|
| 9.2 | % |
| Net income |
|
|
|
|
|
|
|
|
|
|
|
|
|
|
|
|
|
|
|
|
| Reported (GAAP) |
| $ | 859 |
|
| $ | 556 |
|
| $ | 673 |
|
| $ | 867 |
|
| $ | 889 |
|
| Adjusted (non-GAAP) (c) |
| $ | 703 |
|
| $ | 673 |
|
| $ | 781 |
|
| $ | 867 |
|
| $ | 889 |
|
| Diluted earnings per share |
|
|
|
|
|
|
|
|
|
|
|
|
|
|
|
|
|
|
|
|
| Reported (GAAP) |
| $ | 5.12 |
|
| $ | 3.11 |
|
| $ | 3.46 |
|
| $ | 4.24 |
|
| $ | 4.05 |
|
| Adjusted (non-GAAP) (c) |
| $ | 4.19 |
|
| $ | 3.76 |
|
| $ | 4.01 |
|
| $ | 4.24 |
|
| $ | 4.05 |
|
| Dividends per share |
| $ | 2.20 |
|
| $ | 2.00 |
|
| $ | 1.80 |
|
| $ | 1.56 |
|
| $ | 1.40 |
|
| Balance sheet |
|
|
|
|
|
|
|
|
|
|
|
|
|
|
|
|
|
|
|
|
| Total assets |
| $ | 13,340 |
|
| $ | 13,574 |
|
| $ | 13,606 |
|
| $ | 14,333 |
|
| $ | 14,228 |
|
| Working capital |
| $ | 2,680 |
|
| $ | 2,273 |
|
| $ | 2,362 |
|
| $ | 2,721 |
|
| $ | 2,412 |
|
| Long-term debt |
| $ | 2,797 |
|
| $ | 2,795 |
|
| $ | 2,792 |
|
| $ | 2,780 |
|
| $ | 2,777 |
|
| Capital lease and financing obligations |
| $ | 1,717 |
|
| $ | 1,816 |
|
| $ | 1,916 |
|
| $ | 1,968 |
|
| $ | 2,069 |
|
| Shareholders’ equity |
| $ | 5,426 |
|
| $ | 5,177 |
|
| $ | 5,491 |
|
| $ | 5,991 |
|
| $ | 5,978 |
|
| Cash flow |
|
|
|
|
|
|
|
|
|
|
|
|
|
|
|
|
|
|
|
|
| Cash flow from operations |
| $ | 1,691 |
|
| $ | 2,153 |
|
| $ | 1,484 |
|
| $ | 2,027 |
|
| $ | 1,187 |
|
| Capital expenditures |
| $ | 672 |
|
| $ | 768 |
|
| $ | 690 |
|
| $ | 682 |
|
| $ | 643 |
|
| Free cash flow (d) |
| $ | 881 |
|
| $ | 1,269 |
|
| $ | 681 |
|
| $ | 1,237 |
|
| $ | 1,130 |
|
| Return on average shareholders’ equity |
|
|
|
|
|
|
|
|
|
|
|
|
|
|
|
|
|
|
|
|
| Reported (GAAP) |
|
| 16.7 | % |
|
| 10.6 | % |
|
| 11.8 | % |
|
| 14.7 | % |
|
| 14.8 | % |
| Adjusted (non-GAAP) (c) |
|
| 13.7 | % |
|
| 12.5 | % |
|
| 13.5 | % |
|
| 14.7 | % |
|
| 14.8 | % |
| Kohl's store information |
|
|
|
|
|
|
|
|
|
|
|
|
|
|
|
|
|
|
|
|
| Number of stores |
|
| 1,158 |
|
|
| 1,154 |
|
|
| 1,164 |
|
|
| 1,162 |
|
|
| 1,158 |
|
| Total square feet of selling space (in thousands) |
|
| 82,804 |
|
|
| 82,757 |
|
|
| 83,810 |
|
|
| 83,750 |
|
|
| 83,671 |
|
|
|
|
|
|
|
|
|
|
|
16
Item 7. Management’s Discussion and Analysis of Financial Condition and Results of Operations
Executive Summary
AsKohl's is a leading omnichannel retailer operating 1,174 stores and a website (www.Kohls.com) as of February 3, 2018, we operated 1,158 Kohl's department stores, a website (www.Kohls.com), 12 FILA outlets, and four Off-Aisle clearance centers. 2024.Our Kohl's stores and website sell moderately priced proprietarymoderately-priced private and national brand apparel, footwear, accessories, beauty, and home products. Our Kohl's stores generally carry a consistent merchandise assortment with some differences attributable to local preferences.preferences, store size, and Sephora shops. Our website includes merchandise which is available in our stores, as well as merchandise that is available only online.
Sales increased 2.2%Key financial results for 2023 as compared to $19.1 billion for 2017. We saw consistent improvement during2022 include:
52-week period ending January 27, 2024 versus the 52-week period ended January 28, 2023, decreased 4.7%.
points.
For the year, net income on a GAAP basistotal revenue, SG&A expense was $859 million, or $5.12 per diluted share.
Tax reform and a favorable state tax settlement reduced our 2017 tax expense by $156 million and increased our diluted earnings per share by $0.93. The 53rd week in the 2017 retail calendar increased our diluted earnings per share by approximately $0.10.
Excluding the tax benefits, our net income was $703 million and our diluted earnings per share were $4.19,31.5%, an increase of 11% over 2016, excluding $0.6567 basis points.
Our Strategy
Kohl's strategy is focused on delivering long-term shareholder value. To achieve this, the Company has established four overarching priorities to drive improved sales and profitability. These priorities include enhancing the customer experience, accelerating and simplifying its value strategies, managing inventory and expenses with discipline, and strengthening the balance sheet.
Financial and Capital Outlook
For fiscal year 2024, the Company currently expects the following:
The Company’s guidance includes the potential impact from credit card late fee regulatory changes in 2016.
See "Resultsthe second half of Operations" and "Liquidity and Capital Resources" for additional details about our financial results, how we define comparable sales, the impact of the 53rd week and tax reform and the state tax settlement in 2017, and the impairment, store closing and other costs in 2016.2024.
2018 Outlook21
Our current expectations for 2018 are as follows:
|
|
|
|
|
|
|
|
|
|
|
|
|
|
|
|
|
|
|
|
This guidance excludes the impact of the new revenue recognition standard which we are required to adopt in 2018. For additional details on the standard, see Note 1 to our Consolidated Financial Statements.
17
Results of Operations
53rd WeekFor our comparison and discussion of 2022 and 2021, see Item 7. Management's Discussion and Analysis of Financial Condition and Results of Operations in Part II of our 2022 Form 10-K.
53rd Week
The retail calendar for fiscal January 20182023 included a fifth week, resulting in a 14-week fiscal fourth quarter and a 53-week year. During this 53rd week, net sales were approximately $170 million; selling, general and administrative expenses were approximately $30 million; and interest was approximately $3 million. The 53rd week increased our net income by approximately $15 million and our diluted earnings per share by approximately $0.10 for the year. Our comparable sales in 20172023 exclude the impact of the 53rd53rd week and compare the 52 weeks ended January 27, 20182024 to the 52 weeks ended January 28, 2017.2023.
Net Sales
As an omnichannel retailer, it is often difficultNet sales includes revenue from the sale of merchandise, net of expected returns and deferrals due to distinguish between a "store" salefuture performance obligations, and a "digital" sale. Belowshipping revenue.
Comparable sales is a list of some omnichannel examples:
Digital customers can chose to have most online orders either shipped to their home or picked up in anymeasure that highlights the performance of our stores.
Approximately 75%stores and digital channel by measuring the change in sales for a period over the comparable, prior-year period of our digital customers also shop in our stores.
Digital orders may be shipped from a dedicated E-Commerce fulfillment center, aequivalent length. Comparable sales includes all store a retail distribution center, direct ship vendors or any combination of the above.
Stores increaseand digital sales, by providing customers opportunities to view, touch and/or try on physical merchandise before ordering online.
Online purchases can easily be returned in our stores.
Kohl's Cash couponsexcept sales from stores open less than 12 months, stores that have been closed, and Yes2You rewards can be redeemed online or in store regardless ofstores that have been relocated where they were earned.
In-store customers can order from online kiosks in our stores.
Customers who utilize our mobile app while in the store may receive mobile coupons to use when they check out.
Because we do not have a clear distinction between "store" sales and "digital" sales, we do not report them separately.
Kohl’s store sales are included in comparable sales after the store has been open for 12 full months. Digital sales and sales at remodeled and relocated Kohl’s stores are included in comparable sales, unless square footage has changed by more than 10%. We measure the change in digital sales by including all sales initiated online or through mobile applications, including omnichannel transactions which are fulfilled through our stores.
We measure digital penetration as digital sales over net sales. These amounts do not take into consideration fulfillment node, digital returns processed in stores, and coupon behaviors.
Comparable sales and digital penetration measures vary across the retail industry. As a result, our comparable sales calculation and digital penetration may not be consistent with the similarly titled measures reported by other companies.
The following tablegraph summarizes net sales dollars and changes in comparable sales:
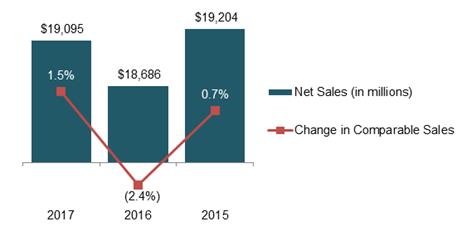
18
Net sales increased $409 million, or 2.2%, to $19.1 billion for 2017. Approximately $170 million of the increase was due to the 53rd week in the fiscal 2017 calendar. The remaining increase was primarily due to a 1.5% increase in comparable sales. The increasechange in comparable sales reflects higher averageover the prior year. As our stores were closed for a period during 2020, we have not included a measure of 2021 comparable sales as we do not believe it is a meaningful metric over this period of time.
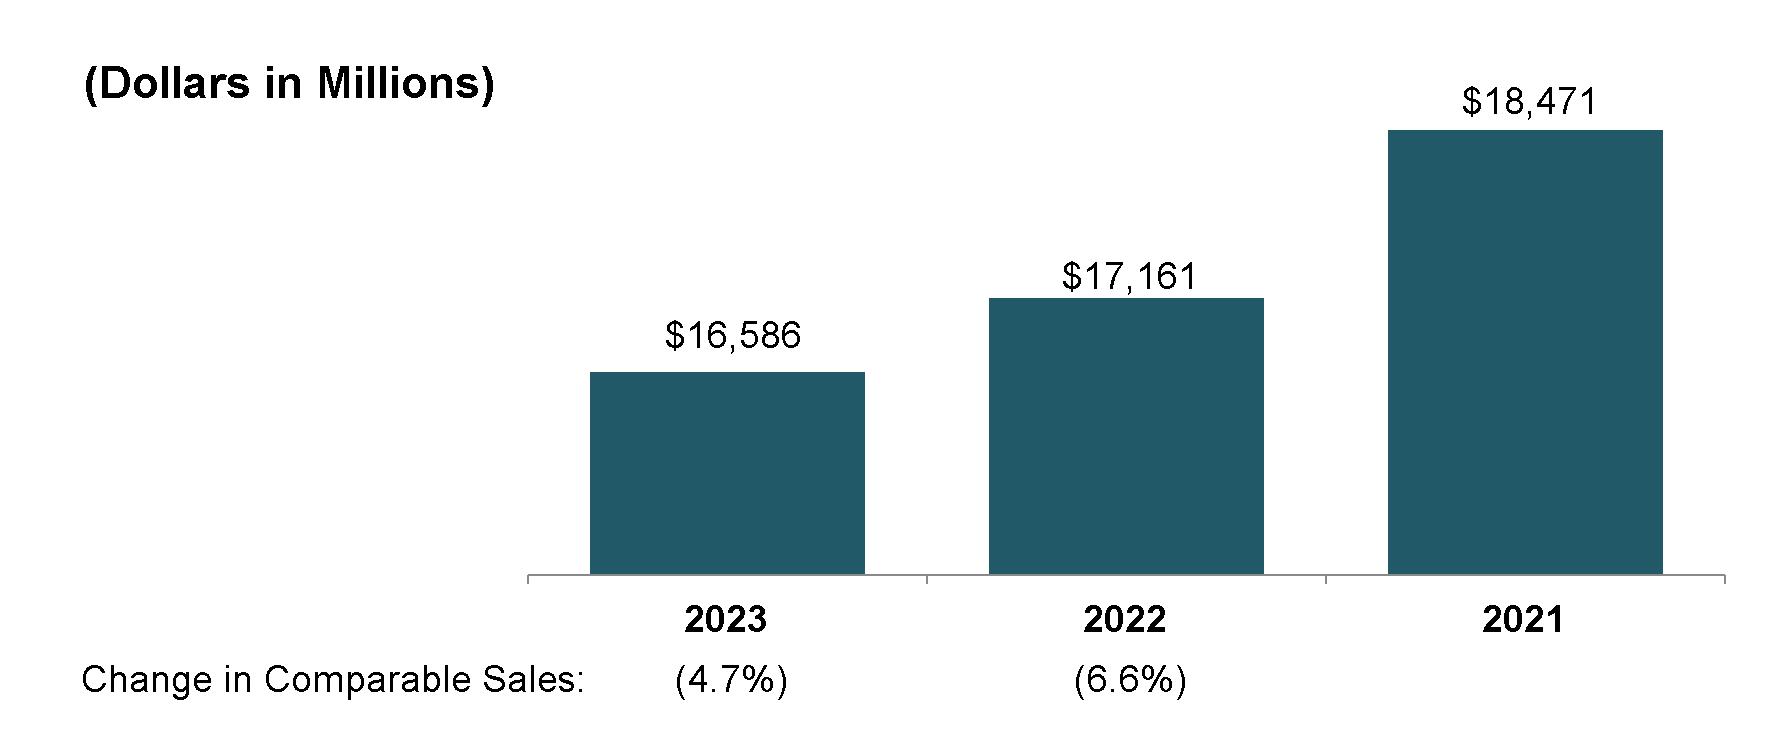
2023 compared to 2022
Net sales decreased $575 million, or (3.4%), to $16.6 billion for 2023.
22
Geographically, all regions reported higher sales in 2017.
2016 compared to 2015
Net sales decreased $518 million, or 2.7%, to $18.7 billion for 2016. The decrease was primarily due to a 2.4% decrease in comparable sales. The lower comparable sales were due to fewer transactions, partially offset by higher average transaction values due to increases in both selling prices and units per transaction.
By line of business, Footwear and Men’s were the strongest categories. All other categoriesas they underperformed the Company average. Partially offsetting this decrease was a 23% increase in Accessories driven by over a 90% increase in Sephora compared to the prior year. Sephora sales exceeded $1.4 billion in 2023.
(Dollars in Millions) | 2023 | 2022 | Change |
Women's | $4,281 | $4,654 | (8.0%) |
Men's | 3,455 | 3,679 | (6.1%) |
Accessories (including Sephora) | 2,813 | 2,279 | 23.4% |
Home | 2,533 | 2,791 | (9.2%) |
Children's | 2,060 | 2,176 | (5.3%) |
Footwear | 1,444 | 1,582 | (8.7%) |
Net Sales | $16,586 | $17,161 | (3.4%) |
Other Revenue
FromOther revenue includes revenue from credit card operations, third-party advertising on our website, unused gift cards and merchandise return cards (breakage), and other non-merchandise revenue.
The following graph summarizes other revenue:
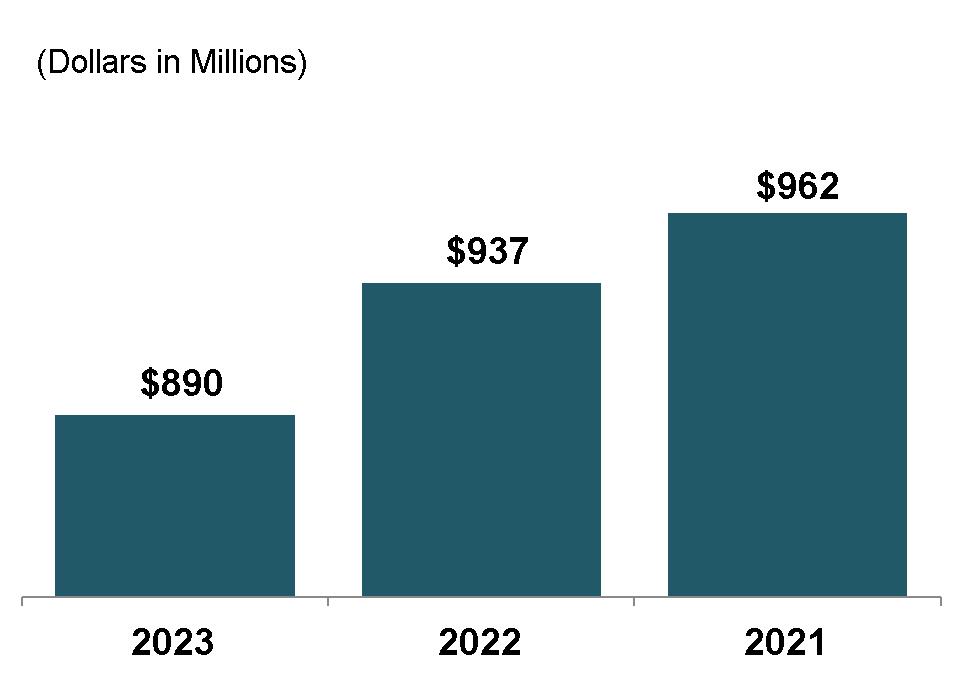
Other revenue decreased $47 million in 2023 driven by a regional perspective,decline in credit revenue due to increasing credit loss rates.
In addition, as it relates to our credit business and recent regulatory developments, the West, Southeast,CFPB has finalized a rule that will lower the late fees credit card companies can charge. The final rule will have a negative impact on our credit card revenues if unmitigated. We are actively pursuing various initiatives to mitigate the effects of this ruling including scaling our recently launched co-brand card and Midwest outperformedother various initiatives with Capital One, our credit partner. We are closely monitoring developments on this ruling, specifically as it relates to the Company averagetiming of implementation.
23
Cost of Merchandise Sold and the South Central, Mid-Atlantic and Northeast underperformed.
Gross Margin
Gross marginCost of merchandise sold includes the total cost of products sold, including product development costs, net of vendor payments other than reimbursement of specific, incremental, and identifiable costs; inventory shrink; markdowns; freight expenses associated with moving merchandise from our vendors to our distribution centers; shipping and handling expenses offor digital sales; and terms cash discount; and depreciationdiscount. Our cost of product development facilities and equipment. Our gross marginmerchandise sold may not be comparable with that of other retailers because we include distribution center and buying costs in selling, general, and administrative expenses while other retailers may include these expenses in cost of merchandise sold.

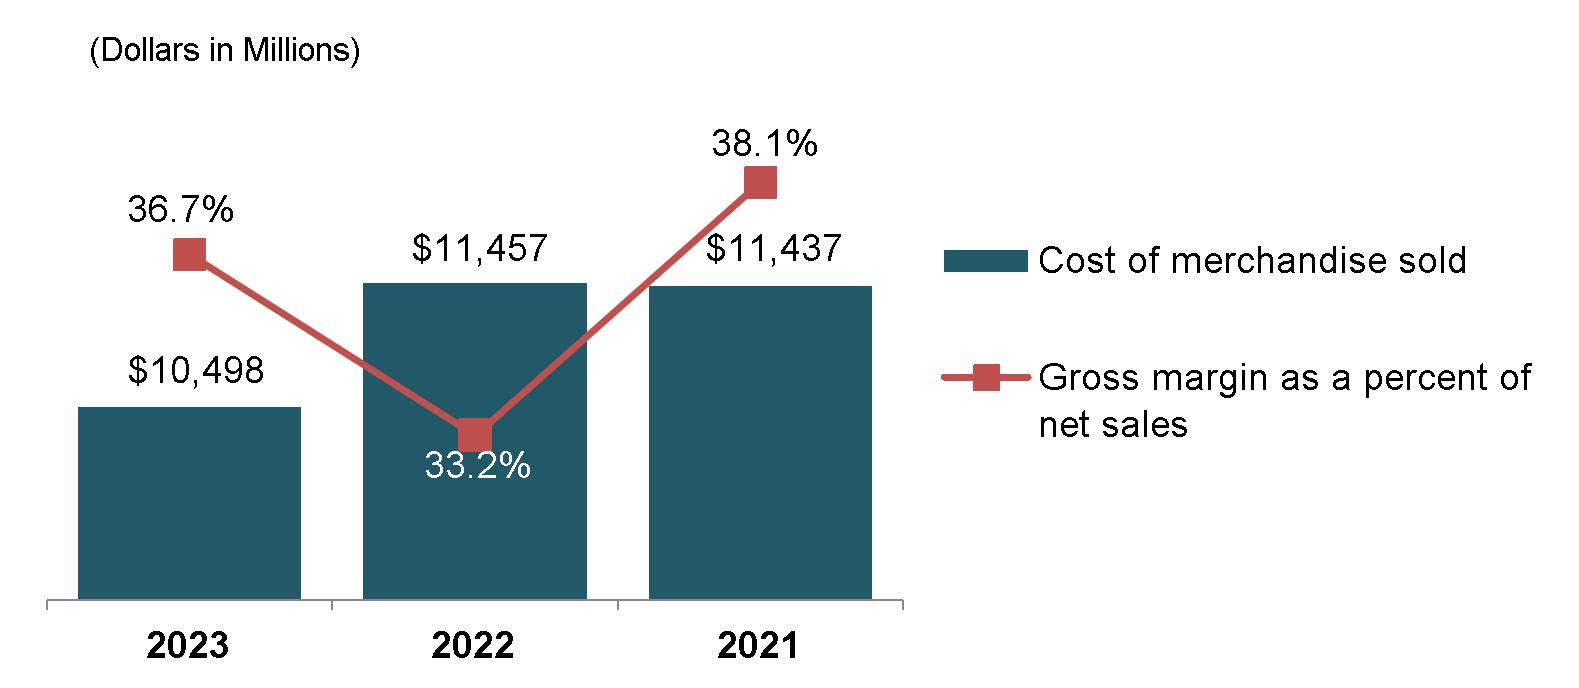
Gross margin is calculated as net sales less cost of merchandise sold. Gross margin as a percent of net salesincreased 15 bps347 basis points in 2017.2023 compared to 2022. The increase in gross margin was drivenby lower clearance markdowns, lower freight costs, reduced digital-related cost of shipping, and the simplification of our value strategies.
We expect gross margin to expand 40 to 50 basis points in 2024, driven by strong inventory management, lower freight expense, and less promotional and permanent markdowns, slightly offset by higher shipping costs. continued benefits from the simplification of our value strategies.
Gross margin as a percentage of sales in 2016 was consistent with 2015 as higher merchandise margin was substantially offset by higher shipping costs.
19
Selling, General, and Administrative Expenses
Selling, General and Administrative Expenses (“SG&A”) include&A includes compensation and benefit costs (including stores, headquarters,corporate, buying, and merchandising and distribution centers); occupancy and operating costs of our retail, distribution, and corporate facilities; freight expenses associated with moving merchandise from our distribution centers to our retail stores and among distribution and retail facilities;facilities other than expenses to fulfill digital sales; marketing expenses, offset by vendor payments for reimbursement of specific, incremental, and identifiable costs; net revenues fromexpenses related to our Kohl’s credit card operations; and other administrative revenues and expenses. We do not include depreciation and amortization in SG&A. The classification of these expenses varies across the retail industry.
Many of our expenses, including store payroll and distribution costs, are variable in nature. These costs generally increase as sales increase, and decrease as sales decrease. We measure both the change in these variableour expenses and the expense as a percentpercentage of sales.revenue and changes in this percentage compared to the prior year. If the expense as a percent of salesrevenue decreased from the prior year, the expense "leveraged" and indicates that the expense was well-managed or effectively generated additional sales.. If the expense as a percent of salesrevenue increased over the prior year, the expense "deleveraged" and indicates that sales growth was less than expense growth..
24
The following graph summarizes the increases and (decreases)changes in SG&A by expense type from 2016 to 2017 (Dollars in Millions):between 2022 and 2023:
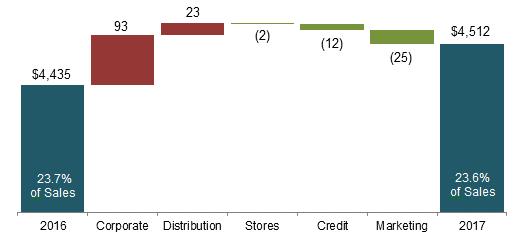
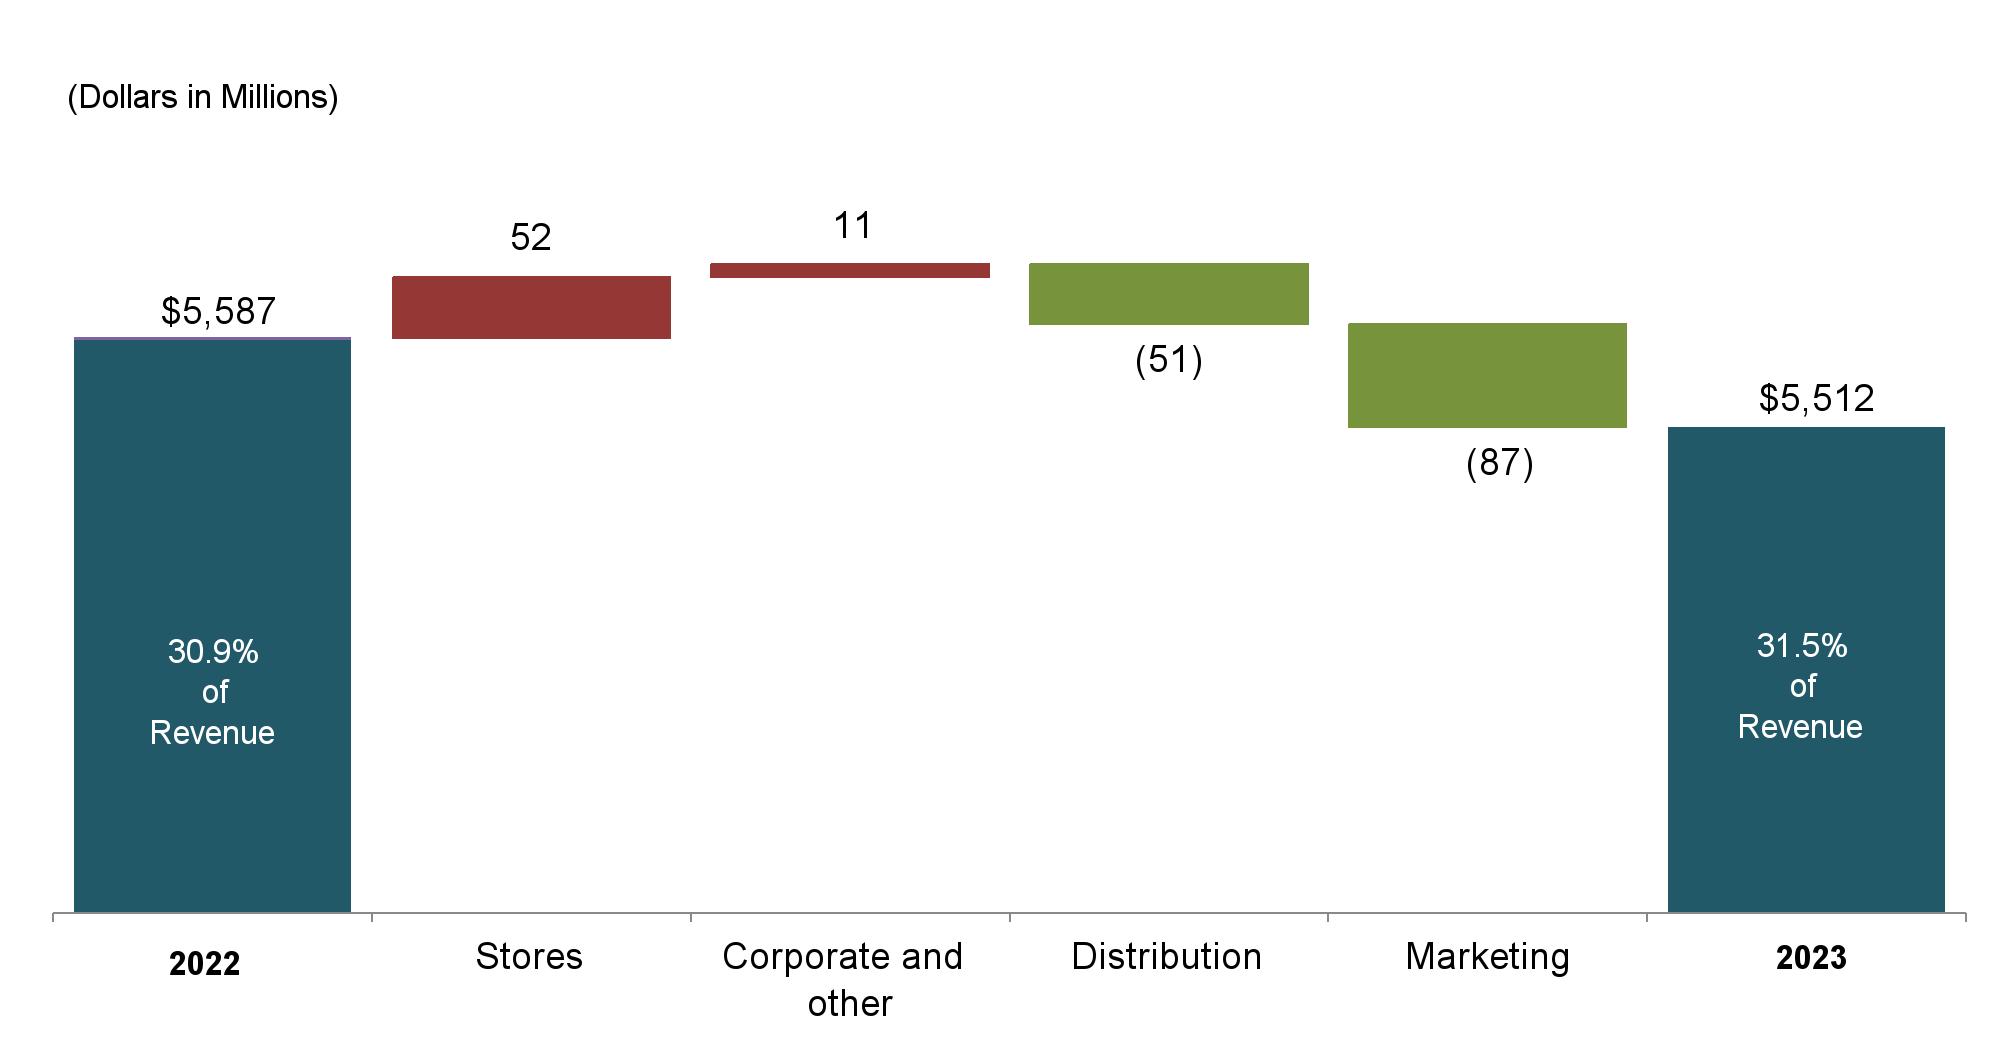
SG&A increased $77decreased $75 million, or 2%1.3%, to $4.5$5.5 billion for 2017. Approximately $30 million of the increase was due to the 53rd week in the fiscal 2017 calendar.2023. As a percentage of sales,revenue, SG&A decreased, or leveraged,deleveraged by 11(67) basis points.
The increase in corporate expenses reflects higher technology spend as we migratedecrease was primarily driven by decreased marketing investments across all channels and decreased distribution costs due to the cloudlower receipts and higher incentive compensation as a result of our strong financial performance in 2017.
increased productivity.Distribution costs, which exclude payroll related to online originated orders that were shipped from our stores, were $303$406 million for 2017, $23 million higher than 2016. The increase was due2023 compared to growth in digital sales and the opening of our fifth E-Commerce facility.
In our stores, decreases in controllable expenses were substantially offset by higher store payroll due to on-going wage pressure and omnichannel support of ship-from-store and buy online, pick-up in store operations.
Earnings from our credit card operations, net of servicing and other credit-related expenses, were $496 million in 2017, $12 million higher than 2016. The increase is due to lower marketing and operating costs.
Marketing costs, excluding credit card costs, reflect efficiencies in our non-customer facing spend and the benefit of not repeating a non-productive marketing event.
20
The following graph summarizes the increases and (decreases) in SG&A by expense type from 2015 to 2016 (Dollars in Millions):

SG&A decreased $17 million to $4.4 billion for 2016. As a percentage of sales, SG&A increased, or deleveraged, by 55 basis points in 2016.
Marketing costs, excluding credit card costs, reflect higher digital media spending.
Distribution costs, which exclude payroll related to online originated orders that were shipped from our stores, were $280$457 million for 2016, $2 million higher than 2015. Increases due to higher fulfillment costs resulting from our growing digital business were partially offset by lower store distribution costs.
The decrease in corporate expenses reflects higher technology spending which was more than offset by expense management in other corporate areas.
The decrease in store expenses includes reductions in store controllable expense, partially offset by higher store payroll due to on-going wage pressure and omnichannel support of ship-from-store and buy online, pick-up in store operations.
Earnings from our credit card operations, net of servicing and other credit-related expenses, were $484 million in 2016, $28 million higher than 2015. The increase is due to higher finance charges and late fees due to growth in the portfolio. Additionally, lower marketing costs were partially offset by higher servicing costs.
Other Expenses
(Dollars in Millions) |
| 2017 |
|
| 2016 |
|
| 2015 |
| |||
Depreciation and amortization |
| $ | 991 |
|
| $ | 938 |
|
| $ | 934 |
|
Interest expense, net |
|
| 299 |
|
|
| 308 |
|
|
| 327 |
|
Impairments, store closing and other costs |
|
| — |
|
|
| 186 |
|
|
| — |
|
Loss on extinguishment of debt |
|
| — |
|
|
| — |
|
|
| 169 |
|
The increase in depreciation and amortization from 2016 to 2017 includes a $22 million write-off of information technology (“IT”) projects that no longer fit into our strategic and cloud migration plans. The increase was also driven by the opening of our fifth E-commerce fulfillment center and other IT investments. The increase from 2015 to 2016 reflected higher IT amortization which was partially offset by lower store depreciation due to maturing of our stores and store closures.
The decreases in net interest expense in both periods were due to lower interest on capital leases as the portfolio matures. Also contributing to2022. Partially offsetting the decreases were higherincreased store costs. Store expenses were driven by increased wages, continued investments in Sephora openings, and other store-related expenses.
In 2024, SG&A dollars are expected to be flat to slightly down with wage inflation being offset by labor productivity improvements and marketing efficiency.
Other Expenses
(Dollars in Millions) | 2023 | 2022 | 2021 |
Depreciation and amortization | $749 | $808 | $838 |
Interest expense, net | 344 | 304 | 260 |
Loss on extinguishment of debt | — | — | 201 |
Depreciation and amortization decreased in 2023, primarily driven by reduced capital spending in technology.
Net interest incomeexpense increased in 2023 compared to 2022 due to higher yields and investment balances in 2017 and favorable interest rates achieved during our $1.1 billion debt refinancing in 2015.borrowings under the revolving credit facility as well as Sephora related lease amendments.
21
Impairments, store closing and other costs includes the following costs related to closing 18 stores in 2016 and the organizational realignment at our corporate office:
| |||
| |||
|
|
| |
|
|
| |
| |||
|
| ||
|
| ||
|
| ||
|
|
|
During 2015,In 2021, we completed a cash tender offer and redemption for $1,085 million of senior unsecured debt. We recognized a $169loss of $201 million loss onfrom the extinguishment of debt which included a $163 million bond tender premium paid to holdersdebt.
Income Taxes
(Dollars in Millions) | 2023 | 2022 | 2021 |
Provision (benefit) for income taxes | $56 | $(39) | $281 |
Effective tax rate | 15.1% | 68.1% | 23.1% |
25
(Dollars in Millions) |
| 2017 |
|
| 2016 |
|
| 2015 |
| |||
Provision for income taxes |
| $ | 258 |
|
| $ | 319 |
|
| $ | 384 |
|
Effective tax rate |
|
| 23.1 | % |
|
| 36.5 | % |
|
| 36.3 | % |
On December 22, 2017 the Tax Cuts & Jobs Act (“the Act”) was signed into law. The Act contains several key tax provisions including the reduction of the corporate income tax rate from 35% to 21% effective January 1, 2018, and a variety of other changes including the acceleration of certain business asset expenses and reductionsFiscal year 2023 resulted in the amount of executive pay that could qualify as a tax deduction.
Accounting standards require us to recognize the effect of the tax law changes in the period of enactment. However, the SEC staff issued Staff Accounting Bulletin (“SAB”) 118, which allows us to record provisional amounts during a measurement period.
We have calculated our best estimate of the impact of the Act on our 2017an income tax provision compared to an income tax benefit in accordance with our understanding offiscal year 2022 due to the Actpre-tax book income in fiscal year 2023 compared to the pre-tax book loss in 2022.
GAAP to Non-GAAP Reconciliation
(Dollars in Millions, Except per Share Data) | Operating Income | Income (loss) before Income Taxes | Net Income (loss) | Earnings (loss) per Diluted Share |
2023 |
|
|
|
|
GAAP | $717 | $373 | $317 | $2.85 |
Loss on extinguishment of debt | — | — | — | — |
Income tax impact of items noted above | — | — | — | — |
Adjusted (non-GAAP)(1) | $717 | $373 | $317 | $2.85 |
2022 |
|
|
|
|
GAAP | $246 | $(58) | $(19) | $(0.15) |
Loss on extinguishment of debt | — | — | — | — |
Income tax impact of items noted above | — | — | — | — |
Adjusted (non-GAAP)(1) | $246 | $(58) | $(19) | $(0.15) |
2021 |
|
|
|
|
GAAP | $1,680 | $1,219 | $938 | $6.32 |
Loss on extinguishment of debt | — | 201 | 201 | 1.35 |
Income tax impact of items noted above | — | — | (50) | (0.34) |
Adjusted (non-GAAP) | $1,680 | $1,420 | $1,089 | $7.33 |
(1) Amounts shown for 2023 and guidance available2022 are GAAP as ofthere are no adjustments to Non-GAAP. These amounts are shown for comparability purposes.
We believe the date of this filing. For 2017, the reductionadjusted results in the tax rate is prorated, resulting in a current year statutory federal tax rate of 33.7%. In 2017, we recorded a total tax benefit of $136 million relatedGAAP to the current year federal tax rate reduction and the re-measurement of our deferred tax assets and liabilities as well as a $20 million benefit from the settlement of a significant state tax dispute.
Net Income and Earnings per Diluted Share
(Dollars in Millions, Except per Share Data) | Income before Taxes |
| Net Income |
| Earnings per Diluted Share |
| ||||||
2017 |
|
|
|
|
|
|
|
|
|
|
|
|
GAAP |
| $ | 1,117 |
|
| $ | 859 |
|
| $ | 5.12 |
|
Federal tax reform benefits |
|
| — |
|
|
| (136 | ) |
|
| (0.81 | ) |
State tax settlement |
|
| — |
|
|
| (20 | ) |
|
| (0.12 | ) |
Adjusted (non-GAAP) |
| $ | 1,117 |
|
| $ | 703 |
|
| $ | 4.19 |
|
2016 |
|
|
|
|
|
|
|
|
|
|
|
|
GAAP |
| $ | 875 |
|
| $ | 556 |
|
| $ | 3.11 |
|
Impairments, store closing and other costs |
|
| 186 |
|
|
| 117 |
|
|
| 0.65 |
|
Adjusted (non-GAAP) |
| $ | 1,061 |
|
| $ | 673 |
|
| $ | 3.76 |
|
2015 |
|
|
|
|
|
|
|
|
|
|
|
|
GAAP |
| $ | 1,057 |
|
| $ | 673 |
|
| $ | 3.46 |
|
Loss on extinguishment of debt |
|
| 169 |
|
|
| 108 |
|
|
| 0.55 |
|
Adjusted (non-GAAP) |
| $ | 1,226 |
|
| $ | 781 |
|
| $ | 4.01 |
|
22
We believe adjusted resultsNon-GAAP table are useful because they provide enhanced visibility into our results for the periods excluding the impact of infrequentcertain items such as those included in the tax settlement and federal reform in 2017, impairments, store closing and other costs in 2016, and the loss on extinguishment of debt in 2015.table. However, these non-GAAP financial measures are not intended to replace the comparable GAAP measures.
Inflation
Although weWe expect that our operations will continue to be influenced by general economic conditions, including food, fuel, and energy prices, higher unemployment, wage inflation, and by costs to source our merchandise, we do not believe that inflation has had a material effect on our results of operations. However, thereincluding tariffs. There can be no assuranceassurances that such factors will not impact our business will not be impacted by such factors in the future.
Liquidity and Capital Resources
Capital Allocation
Our capital allocation strategy is to invest to maximize our overall long-term return and maintain a strong balance sheet, with a long-term objective of achieving an investment grade rating. We follow a disciplined approach to capital allocation based on the following priorities: first we invest in our business to drive long-term profitable growth; second we pay a quarterly dividend; third we will complete debt reduction transactions, when appropriate; and fourth we return excess cash to shareholders through our share repurchase program.
We will continue to invest in the business, as we plan to invest approximately $500 million in 2024, including the expansion of Sephora shops, the launch of Babies "R" Us, and the expansion of queuing lines to 350 stores. We remain committed to the dividend, and on February28, 2024, our Board of Directors declared a quarterly cash dividend of $0.50 per share. The dividend will be paid on April 3, 2024 to all shareholders of record at the close of business on March 20, 2024. Last, we retired $164 million of notes due in February 2023 and $111 million of notes due December 2023. We are not planning any share repurchases until our balance sheet is strengthened on a path towards the long term target leverage ratio of 2.5 times adjusted earnings before interest, taxes, depreciation, amortization, and rent ("EBITDAR") (utilizing an eight times cash rent calculation for lease obligations) as calculated in our capital structure ratio below.
26
Our period-end cash and cash equivalents balance increased to $183 million from $153 million in 2022. Our cash and cash equivalents balance includes short-term investments of $15 million and $10 million as of February 3, 2024, and January 28, 2023, respectively. Our investment policy is designed to preserve principal and liquidity of our short-term investments. This policy allows investments in large money market funds or in highly rated direct short-term instruments. We also place dollar limits on our investments in individual funds or instruments.
The following table presents our primary cash requirementsuses and sources of funds.cash:
Cash | Cash Sources |
• Operational needs, including salaries, rent, taxes, and other operating costs • Inventory • Capital expenditures • • Debt reduction • Share repurchases
| • Cash flow from operations
• Line of credit under our revolving credit facility • Issuance of debt |
Our working capital and inventory levels typically build throughout the fall, peaking during the November and December holiday selling season.
The following table includes cash balances and changes.changes:
(Dollars in Millions) | 2023 | 2022 | 2021 |
Cash and cash equivalents | $183 | $153 | $1,587 |
Net cash provided by (used in): |
|
|
|
Operating activities | $1,168 | $282 | $2,271 |
Investing activities | (562) | (783) | (570) |
Financing activities | (576) | (933) | (2,385) |
Adjusted free cash flow (a) | $519 | $(639) | $1,556 |
| (Dollars in Millions) |
| 2017 |
|
| 2016 |
|
| 2015 |
| |||
| Cash and cash equivalents |
| $ | 1,308 |
|
| $ | 1,074 |
|
| $ | 707 |
|
| Net cash provided by (used in): |
|
|
|
|
|
|
|
|
|
|
|
|
| Operating activities |
| $ | 1,691 |
|
| $ | 2,153 |
|
| $ | 1,484 |
|
| Investing activities |
|
| (649 | ) |
|
| (756 | ) |
|
| (681 | ) |
| Financing activities |
|
| (808 | ) |
|
| (1,030 | ) |
|
| (1,503 | ) |
| Free cash flow |
| $ | 881 |
|
| $ | 1,269 |
|
| $ | 681 |
|
(a)Non-GAAP
Operating Activities
Netmeasure. Please see the “GAAP to Non-GAAP Reconciliation” for a reconciliation of adjusted free cash flow to net cash provided by operations decreased $462 millionoperating activities.
Operating Activities
Our operating cash outflows generally consist of payments to $1.7our employees for wages, salaries and other employee benefits, payments to our merchandise vendors for inventory (net of vendor allowances), payments to our shipping carriers, and payments to our landlords for rent. Operating cash outflows also include payments for income taxes and interest payments on our debt borrowings.
Operating activities generated cash of $1.2 billion in 2017. The decrease was primarily attributable2023 compared to changes$282 million in accounts payable.
Net2022. Operating cash provided by operationsflow increased $669 million to $2.2 billion in 2016. The increase is primarily due to reductionshigher net income and strong inventory management in inventory2023. Inventory management resulted in managing receipts, down 9% versus last year. We placed a lower percentage of our overall receipts in the early part of the buying cycle to allow for additional flexibility to chase receipts based on trending sales, establish a better flow of goods to our stores and increased accounts payable.maintain better in-stock positions, with the goal of minimizing the risk of future markdowns and out-of-stock positions.
Investing Activities
Our investing cash outflows include payments for capital expenditures, including investments in new and existing stores, improvements to supply chain, and technology costs. Our investing cash inflows are generally from proceeds from sales of property and equipment.
Net cash used in investing activities decreased $107$221 million to $649$562 million in 2017.2023. The decrease was primarily due to the completiondriven by fewer rollouts of the beauty rollout, corporate improvements,Sephora shop build-outs and new storesstore refreshes undertaken in 2016.
Net cash used in investing activities increased $75 million to $756 million in 2016, primarily due to higher spending2023, consistent with our capital expenditure plans for our fifth E-Commerce fulfillment center.fiscal 2023.
27
23
The following chart summarizes expected and actual capital expenditures by major category ascategory:

In 2023, we opened 254 full size Sephora shops and 45 small format shops. We now have a percentageSephora presence in over 900 of total capital expenditures:

We expect totalour stores, including 860 full size 2,500 square foot Sephora shops and 50 small format Sephora shops. In 2024, we are planning to open approximately 140 small format Sephora shops, and plan on opening the remaining Sephora shops in 2025 which will bring a Sephora presence to the entire Kohl's chain. In 2024, we anticipate capital expenditures of approximately $700$500 million, including the expansion of Sephora shops, the launch of Babies "R" Us, and the expansion of queuing lines to 350 stores. We will continue to invest in enhancing our omnichannel capabilities.
Financing Activities
Our financing strategy is to ensure adequate liquidity and access to capital markets. We also strive to maintain a balanced portfolio of debt maturities, while minimizing our borrowing costs. Our ability to access the public debt market has provided us with adequate sources of liquidity. Our continued access to these markets depends on multiple factors, including the condition of debt capital markets, our operating performance, and maintaining strong credit ratings.
During the first quarter of 2023, S&P downgraded our senior unsecured credit rating from BB+ to BB and Moody's downgraded our rating from Ba2 to Ba3 while both also revised their outlook to negative. While Fitch reaffirmed our credit rating, they also revised their outlook to negative.
As of February 3, 2024, our credit ratings and outlook were as follows:
Moody’s | S&P | Fitch | |
Long-term debt | Ba3 | BB | BBB- |
Outlook | Negative | Negative | Negative |
As a result of the downgrades, the interest rate on our 3.375% notes due May 2031 and 9.50% notes due May 2025 increased 50 basis points in May 2023 due to the coupon adjustment provisions within these notes. In 2022, our credit rating was also downgraded which resulted in the interest rates increasing 75 basis points, of which 25 basis points was effective in 2022 and the remaining 50 basis points became effective in May 2023. In total, the interest rate of both these notes have increased 125 basis points since their issuance. If our credit ratings are lowered further, our ability to access the public debt markets, our cost of funds, and other terms for new debt issuances could be adversely impacted. Each of the credit rating agencies reviews its rating periodically and there is no guarantee our current credit ratings will remain the same.
28
The majority of our financing activities generally include proceeds and/or repayments of long-term debt, dividend payments, and in 2022 and 2021 repurchases of common stock. Financing cash outflows also include payments to our landlords for leases classified as financing leases and financing obligations.
Financing activities used $576 million in fiscal 2018.2023 compared to $933 million in 2022. The actualdecrease is driven by no treasury stock purchases occurring in 2023 partially offset by repayment of long-term borrowings.
In January 2023, we entered into a Credit Agreement with various lenders which provides for a $1.5 billion senior secured, asset based revolving credit facility that will mature in January 2028 and replaced our existing senior unsecured revolving credit facility. The revolver is secured by substantially all of our assets other than real estate, and contains customary events of default and financial, affirmative, and negative covenants, including but not limited to, a springing financial covenant related to our fixed charge coverage ratio and restrictions on indebtedness, liens, investments, asset dispositions, and restricted payments. Outstanding borrowings under the credit facility bear interest at a variable rate based on SOFR plus the applicable margin. Borrowings under the revolving credit facility, recorded as short-term debt, had $92 million outstanding as of February 3, 2024, and had $85 million as of January 28, 2023.
In February 2023, $164 million in aggregate principal amount of our future capital expenditures will depend on the number3.25% notes matured and timingwere repaid, and in December 2023, $111 million in aggregate principal amount of new storesour 4.75% notes matured and refreshes; expansion and renovations to distribution centers; the mix of owned, leased or acquired stores; and IT and corporate spending. We do not anticipate that our capital expenditures will be limited by any restrictive covenants in our financing agreements.were repaid.
Financing Activities
NetThere was no cash used in financing activities decreased $222 million to $808 million in 2017, primarily due to a $251 million decrease infor treasury stock purchases.purchases in 2023 compared to $658 million used in 2022. Share repurchases are discretionary in nature. The timing and amount of repurchases isare based upon available cash balances, our stock price, and other factors. As previously noted, we are not planning any share repurchases until our balance sheet is strengthened on a path towards the long term target leverage ratio of 2.5 times adjusted EBITDAR (utilizing an eight times cash rent calculation for lease obligations).
Net cash usedCash dividend payments were $220 million ($2.00 per share) in financing activities decreased $4732023 and $239 million to $1.0 billion($2.00 per share) in 2016, primarily due to a $444 million decrease in treasury stock purchases.2022.
During 2015, we completed a cash tender offer and redemption for $1.1 billion of our higher coupon senior unsecured debt and issued $650Adjusted Free Cash Flow
We generated $519 million of 4.25% notes due in July 2025 and $450 million of 5.55% notes due in July 2045. Both notes include semi-annual, interest-only payments that began in January 17, 2016. Proceeds of the issuances and cash on hand were used to pay the principal, premium and accrued interest of the acquired and redeemed debt.
We may again seek to retire or purchase our outstanding debt through open market cash purchases, privately negotiated transactions or otherwise. Such repurchases, if any, will depend on prevailing market conditions, our liquidity requirements, contractual restrictions and other factors. The amounts involved could be material.
On November 3, 2017 we amended and restated our existing credit facility with various lenders which provides for a $1.0 billion senior unsecured five-year revolving credit facility that will mature in November 2022. Among other things, the agreement includes a maximum leverage ratio financial covenant and restrictions on liens and subsidiary indebtedness.
As of February 3, 2018, our credit ratings were as follows:
|
|
| |
|
|
|
|
24
During 2017, we paid cash dividends of $368 million as detailed in the following table:
|
|
| First Quarter |
|
| Second Quarter |
|
| Third Quarter |
|
| Fourth Quarter |
| ||||
| Declaration date |
| February 22 |
|
| May 10 |
|
| August 8 |
|
| November 8 |
| ||||
| Record date |
| March 8 |
|
| June 7 |
|
| September 6 |
|
| December 6 |
| ||||
| Payment date |
| March 22 |
|
| June 21 |
|
| September 20 |
|
| December 20 |
| ||||
| Amount per common share |
| $ | 0.55 |
|
| $ | 0.55 |
|
| $ | 0.55 |
|
| $ | 0.55 |
|
On February 28, 2018, our Board of Directors declared a quarterly cash dividend on our common stock of $0.61 per share, an 11% increase over our prior dividend. The dividend is payable March 28, 2018 to shareholders of record at the close of business on March 14, 2018.
Free Cash Flow
We generated $881 million ofadjusted free cash flow for 2017;2023 compared to a decreasenegative adjusted free cash flow of $388$639 million from 2016. As discussed above, the decreasein 2022. The increase is primarily the resultdriven by more cash provided by operating activities due to a higher net income and a reduction in inventory purchases of 9%, and a decrease in accounts payable. Freecapital expenditures related to less Sephora shop build-outs and store refreshes in 2023.Adjusted free cash flow is a non-GAAP financial measure which we define as net cash provided by operating activities and proceeds from financing obligations (which generally represent landlord reimbursements of construction costs) less capital expenditures and capitalfinance lease and financing obligation payments. FreeAdjusted free cash flow should be evaluated in addition to, and not considered a substitute for, other financial measures such as net income and net cash flow provided by operations.operating activities. We believe that adjusted free cash flow represents our ability to generate additional cash flow from our business operations. See the key financial ratio calculations section above.
29
Liquidity Ratios
The following table provides additionalreconciles net cash provided by operating activities (a GAAP measure) to adjusted free cash flow (a non-GAAP measure):
(Dollars in Millions) | 2023 | 2022 | 2021 |
Net cash provided by operating activities | $1,168 | $282 | $2,271 |
Acquisition of property and equipment | (577) | (826) | (605) |
Free cash flow | $591 | $(544) | $1,666 |
Finance lease and financing obligation payments | $(93) | $(106) | $(125) |
Proceeds from financing obligations | 21 | 11 | 15 |
Adjusted free cash flow | $519 | $(639) | $1,556 |
Key Financial Ratios
Key financial ratios that provide certain measures of our liquidity.liquidity are as follows:
| (Dollars in Millions) |
| 2017 |
|
| 2016 |
| ||
| Working capital |
| $ | 2,680 |
|
| $ | 2,273 |
|
| Current ratio |
|
| 2.01 |
|
|
| 1.76 |
|
(Dollars in Millions) | 2023 | 2022 |
Working capital | $798 | $621 |
Current ratio | 1.31 | 1.20 |
Our working capital and inventory levels typically build throughout the fall, peaking during the November and December holiday selling season.
Liquidity measuresThe increase in our ability to meet short-term cash needs. Workingworking capital increased $407 million and our current ratio increased 25 basis points over year-end 2016 primarily due to higher cash balances.
The accounts payable as a percent of inventory ratio decreased to 35.9%, a 382 basis point reduction from the prior year ratio.
Return on Investment Ratios
The following table provides additional measures of our return on investments.
| 2017 | 2016 | 2015 | ||||||
Ratio of earnings to fixed charges |
| 3.4 |
|
| 2.8 |
|
| 3.1 |
|
Return on assets |
| 6.4 | % |
| 4.1 | % |
| 4.7 | % |
Return on gross investment ("ROI") (a) |
| 13.9 | % |
| 12.6 | % |
| 14.5 | % |
|
|
Changes in earnings drove changes in our return on investment ratios. See Exhibit 12.1 to this Annual Report on Form 10-K for the calculation of our ratio of earnings to fixed charges and the key financial ratio calculations below for the return on assets and ROI calculations.
We believe that ROI is a useful financial measure in evaluating our operating performance. When analyzed in conjunction with our net earnings and total assets and compared with return on assets, it provides investors with a useful tool to evaluate our ongoing operations and our management of assets from period to period. ROI is a non-GAAP financial measure which we define as earnings before interest, taxes, depreciation, amortization and rent (“EBITDAR”) divided by average gross investment. Our ROI calculation may not be comparable to similarly titled measures reported by other companies. ROI should be evaluated in addition to, and not considered a substitute for, other financial measures such as return on assets.
25
The following table provides additional measures of our capital structure.
|
| 2017 |
|
| 2016 |
| ||
Debt/capitalization |
|
| 45.4 | % |
|
| 47.1 | % |
Adjusted debt to EBITDAR (a) |
|
| 2.54 |
|
|
| 2.64 |
|
|
|
The decreases in our capital structure ratios are primarily due to higher earnings.a reduction in our short-term debt as we repaid $275 million in short-term notes that matured as well as a reduction in accounts payable offset by a decrease in inventory due to strong inventory management.
Capital Structure Ratio
The following table shows our capital structure ratio (non-GAAP financial measure):
| 2023 | 2022 |
Adjusted debt to EBITDAR | 3.63 | 4.92 |
Adjusted Debtdebt to EBITDAR is a non-GAAP financial measure which we define as our adjusted outstanding debt balance divided by EBITDAR. The decrease in our adjusted EBITDAR.debt to EBITDAR ratio is driven by higher operating income as well as repayment of long-term debt. We believe thatprovide our adjusted debt levels are best analyzed using this measure. Ourto EBITDAR ratio to our ratings agencies and our current goals aregoal is to maintainachieve a ratio thatof 2.5 which demonstrates our commitment to an investment grade rating and allows us to operate with an efficient capital structure for our size, growth plans, and industry. We are currently exceeding our target goalAdjusted debt to take advantageEBITDAR is a liquidity measure and not a measure of financial performance under GAAP and should be considered in addition to, and not as a favorable, low interest ratesubstitute for debt environment.or other GAAP financial measures of liquidity. Our Adjusted Debtadjusted debt to EBITDAR calculation may not be comparable to similarly-titled measures reported by other companies. Adjusted Debt
30
The following table includes our adjusted debt to EBITDAR shouldcalculation:
(Dollars in Millions) | 2023 | 2022 |
Finance lease and financing obligations | $2,763 | $2,880 |
Borrowings under revolving credit facility | 92 | 85 |
Long-term debt | 1,638 | 1,912 |
Total debt | $4,493 | $4,877 |
Operating leases | 2,883 | 2,689 |
Total debt (including operating leases) | $7,376 | $7,566 |
Less: Operating lease, finance lease, and financing obligation liabilities (a) | (5,646) | (5,569) |
Add: Cash-based lease equivalent debt (a) | 4,584 | 4,488 |
Adjusted debt | $6,314 | $6,485 |
Net income (loss) | $317 | $(19) |
Provision (benefit) for income taxes | 56 | (39) |
Interest expense, net | 344 | 304 |
Depreciation and amortization | 749 | 808 |
Rent expense | 271 | 264 |
EBITDAR (b) | $1,737 | $1,318 |
Adjusted debt to EBITDAR | 3.63 | 4.92 |
Debt Covenant Compliance
Our debt agreements contain varioussenior secured, asset based revolving credit facility contains customary events of default and financial, affirmative and negative covenants, including limitationsbut not limited to, a springing financial covenant relating to our fixed charge coverage ratio and restrictions on additional indebtedness, liens, investments, asset dispositions, and a maximum permitted debt ratio.restricted payments. As of February 3, 2018,2024, we were in compliance with all debt covenants and expect to remain in compliance during 2018. See the key financial ratio calculations section below for our debt covenant calculation. covenants.
Key Financial Ratio Calculations
The following table includes our ROI and return on assets calculations:
| (Dollars in Millions) |
| 2017 |
|
| 2016 |
|
| 2015 |
| |||
| Operating income |
| $ | 1,416 |
|
| $ | 1,183 |
|
| $ | 1,553 |
|
| Depreciation and amortization |
|
| 991 |
|
|
| 938 |
|
|
| 934 |
|
| Rent expense |
|
| 293 |
|
|
| 276 |
|
|
| 279 |
|
| EBITDAR |
| $ | 2,700 |
|
| $ | 2,397 |
|
| $ | 2,766 |
|
| Average: (a) |
|
|
|
|
|
|
|
|
|
|
|
|
| Total assets |
| $ | 13,419 |
|
| $ | 13,584 |
|
| $ | 14,288 |
|
| Cash equivalents and long-term investments (b) |
|
| (629 | ) |
|
| (476 | ) |
|
| (703 | ) |
| Other assets |
|
| (32 | ) |
|
| (35 | ) |
|
| (40 | ) |
| Accumulated depreciation and amortization |
|
| 7,217 |
|
|
| 6,558 |
|
|
| 6,203 |
|
| Accounts payable |
|
| (1,548 | ) |
|
| (1,515 | ) |
|
| (1,623 | ) |
| Accrued liabilities |
|
| (1,155 | ) |
|
| (1,188 | ) |
|
| (1,175 | ) |
| Other long-term liabilities |
|
| (674 | ) |
|
| (620 | ) |
|
| (556 | ) |
| Capitalized rent (c) |
|
| 2,767 |
|
|
| 2,654 |
|
|
| 2,672 |
|
| Gross investment (“AGI”) |
| $ | 19,365 |
|
| $ | 18,962 |
|
| $ | 19,066 |
|
| Return on assets (“ROA”) (d) |
|
| 6.4 | % |
|
| 4.1 | % |
|
| 4.7 | % |
| Return on gross investment (“ROI”) (e) |
|
| 13.9 | % |
|
| 12.6 | % |
|
| 14.5 | % |
|
|
|
|
|
|
|
|
|
|
26
The following table reconciles net cash provided by operating activities (a GAAP measure) to free cash flow (a non-GAAP measure).
| (Dollars in Millions) |
| 2017 |
|
| 2016 |
|
| 2015 |
| |||
| Net cash provided by operating activities |
| $ | 1,691 |
|
| $ | 2,153 |
|
| $ | 1,484 |
|
| Acquisition of property and equipment |
|
| (672 | ) |
|
| (768 | ) |
|
| (690 | ) |
| Capital lease and financing obligation payments |
|
| (138 | ) |
|
| (127 | ) |
|
| (114 | ) |
| Proceeds from financing obligations |
|
| - |
|
|
| 11 |
|
|
| 1 |
|
| Free cash flow |
| $ | 881 |
|
| $ | 1,269 |
|
| $ | 681 |
|
The following table includes our debt/capitalization and Adjusted Debt to EBITDAR calculations:
| (Dollars in Millions) | 2017 |
| 2016 |
|
| |||||
| Capital lease and financing obligations |
| $ | 1,717 |
|
| $ | 1,816 |
|
|
|
| Long-term debt |
|
| 2,797 |
|
|
| 2,795 |
|
|
|
| Debt |
|
| 4,514 |
|
|
| 4,611 |
|
|
|
| Equity |
|
| 5,426 |
|
|
| 5,177 |
|
|
|
| Capitalization |
| $ | 9,940 |
|
| $ | 9,788 |
|
|
|
| Debt/capitalization |
|
| 45.4 | % |
|
| 47.1 | % |
|
|
|
|
|
|
|
|
|
|
|
|
|
|
| Total debt |
| $ | 4,514 |
|
| $ | 4,611 |
|
|
|
| Rent x 8 |
|
| 2,344 |
|
|
| 2,208 |
|
|
|
| Adjusted debt |
| $ | 6,858 |
|
| $ | 6,819 |
|
|
|
| Operating income |
| $ | 1,416 |
|
| $ | 1,183 |
|
|
|
| Depreciation and amortization |
|
| 991 |
|
|
| 938 |
|
|
|
| Rent expense |
|
| 293 |
|
|
| 276 |
|
|
|
| EBITDAR |
|
| 2,700 |
|
|
| 2,397 |
|
|
|
| Impairments, store closing and other costs |
|
| — |
|
|
| 186 |
|
|
|
| Adjusted EBITDAR |
| $ | 2,700 |
|
| $ | 2,583 |
|
|
|
| Adjusted debt to adjusted EBITDAR |
|
| 2.54 |
|
|
| 2.64 |
|
|
|
The following table includes our debt ratio calculation, as defined by our debt agreements:
| (Dollars in Millions) | 2017 | |||
| Included Indebtedness |
|
|
|
|
| Consolidated indebtedness |
| $ | 4,533 |
|
| Permitted exclusions for L/C obligations |
|
| - |
|
| Permitted exclusions for unamortized debt discount |
|
| (5 | ) |
| Subtotal |
|
| 4,528 |
|
| Rent x 8 |
|
| 2,344 |
|
| Included indebtedness |
| $ | 6,872 |
|
| Debt Compliance EBITDAR - Rolling 12 |
|
|
|
|
| Net income |
| $ | 859 |
|
| Interest charges |
|
| 299 |
|
| Income taxes |
|
| 258 |
|
| Depreciation and amortization |
|
| 991 |
|
| Capital losses from the disposition of fixed assets |
|
| - |
|
| Other non-cash expenses reducing net income |
|
| 69 |
|
| Subtotal |
|
| 2,476 |
|
| Non-cash items increasing net income |
|
| (11 | ) |
| Capital gains from the disposition of fixed assets |
|
| (14 | ) |
| Subtotal |
|
| 2,451 |
|
| Rent |
|
| 293 |
|
| Consolidated EBITDAR |
| $ | 2,744 |
|
| Debt ratio (a) |
|
| 2.50 |
|
| Maximum permitted debt ratio |
|
| 3.75 |
|
|
|
27
OurMaterial contractual obligations arising in the normal course of business primarily consist of long-term debt and related interest payments, principal and interest payments for leases, and other purchase obligations. See Notes 2 and 3 to the Consolidated Financial Statements for amounts outstanding on February 3, 2024 related to debt and leases.
Other purchase obligations primarily include royalties, legally binding minimum lease and interest payments for stores opening in 2024 or later, as well as payments associated with technology, marketing, and donation agreements. The obligations were $540 million as of February 3, 2018 were as follows:2024.
|
|
| Maturing in: |
| |||||||||||||||||
| (Dollars in Millions) |
| Total |
|
| 2018 |
|
| 2019 and 2020 |
|
| 2021 and 2022 |
|
| 2023 and after |
| |||||
| Recorded contractual obligations: |
|
|
|
|
|
|
|
|
|
|
|
|
|
|
|
|
|
|
|
|
| Long-term debt |
| $ | 2,815 |
|
| $ | — |
|
| $ | — |
|
| $ | 650 |
|
| $ | 2,165 |
|
| Capital lease and financing obligations |
|
| 1,243 |
|
|
| 114 |
|
|
| 221 |
|
|
| 182 |
|
|
| 726 |
|
|
|
|
| 4,058 |
|
|
| 114 |
|
|
| 221 |
|
|
| 832 |
|
|
| 2,891 |
|
| Unrecorded contractual obligations: |
|
|
|
|
|
|
|
|
|
|
|
|
|
|
|
|
|
|
|
|
| Interest payments: |
|
|
|
|
|
|
|
|
|
|
|
|
|
|
|
|
|
|
|
|
| Long-term debt |
|
| 1,584 |
|
|
| 137 |
|
|
| 258 |
|
|
| 237 |
|
|
| 952 |
|
| Capital lease and financing obligations |
|
| 2,161 |
|
|
| 159 |
|
|
| 290 |
|
|
| 255 |
|
|
| 1,457 |
|
| Operating leases (a) |
|
| 5,123 |
|
|
| 259 |
|
|
| 508 |
|
|
| 483 |
|
|
| 3,873 |
|
| Other (b) |
|
| 972 |
|
|
| 336 |
|
|
| 322 |
|
|
| 189 |
|
|
| 125 |
|
|
|
|
| 9,840 |
|
|
| 891 |
|
|
| 1,378 |
|
|
| 1,164 |
|
|
| 6,407 |
|
| Total |
| $ | 13,898 |
|
| $ | 1,005 |
|
| $ | 1,599 |
|
| $ | 1,996 |
|
| $ | 9,298 |
|
|
|
|
|
Off-Balance Sheet Arrangements
We have not provided any financial guarantees as of year-end 2017.fiscal 2023.
We have not created, and are not party to, any special-purpose or off-balance sheet entities for the purpose of raising capital, incurring debt, or operating our business. We do not have any arrangements or relationships with entities that are not consolidated into the financial statements that are reasonably likely to materially affect our financial condition, liquidity, results of operations, or capital resources.
Critical Accounting Policies and Estimates
The preparation of financial statements in conformity with accounting principles generally accepted in the United States requires us to make estimates and assumptions that affect the reported amounts. Management has discussed the development, selection, and disclosure of these estimates and assumptions with the Audit Committee of our Board of Directors. There have been no significant changes in the critical accounting policies and estimates discussed in our 2016 Form 10-K.
31
Retail Inventory Method and Inventory Valuation
We valueThe majority of our inventorymerchandise inventories are valued at the lower of cost or market with cost determined on the first-in, first-out (“FIFO”) basis using the retail inventory method (“RIM”). Under RIM, the valuation of inventoriesinventory at cost and the resulting gross margins are calculated by applying a cost-to-retail ratio to the retail value of inventory. RIM is an averaging method that has been widely used in the inventories.retail industry due to its practicality. The use of RIM will generally result in inventoriesinventory being valued at the lower of cost or market assince permanent markdowns are taken as a reduction of the retail value of inventories. A reserve is recorded if the future estimated selling price is less than cost.
RIM inherently requires management judgment and estimates, such as the amount and timing of permanent markdowns to clear unproductive or slow-moving inventory, which may impact the ending inventory valuation as
28
well as gross margin. Factors considered in the determination of permanent markdowns include current and anticipated demand, customer preferences, age of the merchandise, fashion trends, and weather conditions.
Inventory shrinkage is estimated as a percent of sales for the period between the last physical inventory count and the balance sheet date. Shrink is the difference between the recorded amount of inventory and the physical inventory. We generally perform an annual physical inventory count at the majority of our stores, E-Commerce fulfillment centers, and distribution centers. The shrinkage rate from the most recent physical inventory, in combination with current events and historical experience, is used as the standard for the shrinkage accrual rate for the next inventory cycle. Historically, our actual physical inventory count results have shown our estimates to be reliable.
Vendor Allowances
We frequently receive allowances from our vendors for discountsmarkdowns that we have taken in order to sell the vendor’svendors' merchandise and/or to support gross margins earned on those sales. This markdown support generally relates to sold inventory or permanent markdowns and, accordingly, is reflected as a reduction to cost of merchandise sold. Markdown support related to merchandise that has not yet been sold is recorded in inventory.
We also receive support from vendors for marketing and other costs that we have incurred to sell the vendors’ merchandise. To the extent the reimbursements are for specific, incremental, and identifiable costs incurred to sell the vendor's products and do not exceed the costs incurred, they are recognized as a reduction of selling, general,Selling, General, and administrative expenses.Administrative Expenses. If these criteria are not met, the support is recorded in inventory and reflected as a reduction of costs of merchandise sold when the related merchandise is sold.
Insurance Reserve Estimates
We are primarily self-insured for costs related to workers’ compensation, general liability, and employee-related health care benefits. We use a third-party actuary to estimate the liabilities associated with these risks. The actuary considers historical claims experience, demographic and severity factors, health care trends, and actuarial assumptions to estimate the liabilities associated with these risks. Historically, our actuarial estimates have not been materially different from actual results.
Impairment of Long-Lived Assets
We review our long-lived assets for impairment when events or changes in circumstances, such as decisions to close a store or significant operatingcash flow losses, indicate the carrying value of the asset may not be recoverable. All long-lived assets are reviewed for impairment at least annually.
32
If our evaluations, which are performed on an undiscounted cash flow basis, indicate that the carrying amount of the asset may be not be recoverable, the potential impairment is measured as the excess of carrying value over the fair value of the impaired asset.
Identifying impaired assets and quantifying the related impairment loss, if any, requires significant estimates by management. The most significant of these estimates is the cash flow expected to result from the use and eventual disposition of the asset. When determining the stream of projected future cash flows associated with an individual store, management estimates future store performance including sales, growth rates, gross margin, and controllable expenses, such as store payroll and occupancy expense. Projected cash flows must be estimated for future periods throughout the remaining life of the property, which may be as many as 40 years in the future. The accuracy of these estimates will be impacted by a number of factors including general economic conditions, changes in competitive landscape, and our ability to effectively manage the operations of the store.
Other than the stores which we closed in 2016, we have not historically experienced any significant impairment of long-lived assets. Additionally, impairment of an individual building and related improvements, net of accumulated depreciation, would not generally be material to our financial results.
29
In 2016, we closed numerous leased stores prior to their scheduled lease expiration. In addition to future rent obligations, the closed store reserve includes estimates for operating and other expenses expected to be incurred over the remaining lease term, some of which extend through January 2030.
Income Taxes
We regularly evaluate the likelihood of realizing the benefit for income tax positions we have taken in various federal and state filings by considering all relevant facts, circumstances, and information available to us. If we believe it is more likely than not that our position will be sustained, we recognize a benefit at the largest amount which we believe is cumulatively greater than 50% likely to be realized.
Unrecognized tax benefits require significant management judgment regarding applicable statutes and their related interpretation, the status of various income tax audits, and our particular facts and circumstances. Also, as audits are completed or statutes of limitations lapse, it may be necessary to record adjustments to our taxes payable, deferred tax assets, tax reserves, or income tax expense. Although we believe we have adequately reserved for our uncertain tax positions, no assurance can be given that the final tax outcome of these matters will not be different. Income taxes are further described in Note 5 of the Consolidated Financial Statements.
Leases
Accounting for leased properties requires compliance with technical accounting rules and significant judgment by management. Application of these accounting rules and assumptions made by management will determine whether we are considered the owner for accounting purposes or whetherif the lease is accounted for as a capital or operating lease.
If we are considered the owner for accounting purposes or thefinance lease, is considered a capital lease, we record the property and a related financing or capital lease obligation on our balance sheet. The asset is then depreciated over its expected lease term. Rent payments for these properties are recognized as interest expense and a reduction of the financing or capital lease obligation.
If the lease is considered an operating lease, it is not recorded on our balance sheet and rent expense is recognized onor a straight-line basis over the expected lease term.financing obligation.
The mostfollowing are significant estimates used by management in accounting for property leasesreal estate and the impact of these estimates are as follows:other leases:
ExpectedAccounting lease term—Our expectedaccounting lease term includes both contractual leaseall noncancelable periods and cancelable optionrenewal periods where failure to exercise suchthat are reasonably assured of being exercised. Typically, renewal options are considered reasonably assured of being exercised if we have made significant leasehold improvements that would result in an economic penalty.exceed the initial or renewal lease term and the cash flow performance of the store remains strong. The expected lease term is used in determining whether the lease is accounted for as an operating lease or a capitalfinance lease. A lease
30
|
Fair market value of leased asset—The fair market value of leased retail property is generally estimated based on comparable market data as provided by third-party appraisers or consideration received from the landlord. Fair market value is used in determining whether the lease is accounted for as an operating lease or a capitalfinance lease. A lease is considered a capital lease if the net present value
Leases are further described in Note 3 of the lease payments is greater than 90%Consolidated Financial Statements.
33
Sephora Arrangement
In 2020, we entered into an arrangement with Sephora to be the exclusive beauty offering at Kohl's and bring a transformational, elevated beauty experience to Kohl’s. We sell prestige beauty products through Sephora-branded retail shops in certain Kohl’s stores and through a Sephora-branded offering on Kohls.com. We have opened 860 full size 2,500 square foot Sephora shops and 50 small format Sephora shops to date, and are planning to have a presence in all Kohl's stores by 2025.
Both parties to the arrangement are active participants and are exposed to significant risks and rewards dependent on the success of the fair market valueactivities of the property. Increasingarrangement. The arrangement involves various activities including the fair market value reducesmerchandising, marketing, and operations of the probability that a lease will be considered a capital lease. Fair market valueshops and Kohls.com. Kohl’s is also usedthe principal on sales transactions with our customers and we recognize sales, cost of merchandise sold, and operating expenses in determining the amount of property and related financing obligation to be recognizedrespective lines on our balance sheetconsolidated statements of operations. Kohl’s owns and manages the inventory and funds capital expenditures for certain leased propertiesthe arrangement. The parties share equally in the operating profit of the arrangement which incorporates all expenses to run the arrangement including depreciation expense related to the assets. Amounts due to Sephora for their share of the operating profits are considered owned for accounting purposes.recorded in cost of merchandise sold.
Item 7A. Quantitative and Qualitative Disclosures Aboutabout Market Risk
AllOur operating results are subject to interest rate risk as the $600 million of notes issued in April 2020, $113 million of which remain outstanding, and the $500 million of notes issued in March 2021 include coupon rate step ups if our long-term debt at year-end 2017is downgraded to below a BBB- credit rating by S&P Global Ratings or Baa3 by Moody's Investors Service, Inc., both of which occurred in 2022 and 2023. All other long-term debt is at fixed interest rates and, therefore, is not affected by changes in interest rates. When our long-term debt instruments mature, we may refinance them at thenthe existing market interest rates, which may be more or less than interest rates on the maturing debt.
We are also subject to interest rate risk from changes in the interest rates under our $1.5 billion revolving credit facility. Outstanding borrowings under the credit facility bear interest at a variable rate based on SOFR plus the applicable margin. Outstanding borrowings under the revolving credit facility, recorded as short-term debt, were $92 million as of February 3, 2024.
We share in the net risk-adjusted revenue of the Kohl’s credit card portfolio as defined by the sum of finance charges, late fees, and other revenue less write-offs of uncollectible accounts. We also share the costs of funding the outstanding receivables as interest rates exceed defined rates. As a result, our share of profits from the credit card portfolio may be negatively impacted by increases in interest rates. The reduced profitability, if any, will be impacted by various factors, including our ability to pass higher funding costs on to the credit card holders and the outstanding receivable balance. Recent increases in interest rates have not had a material impact on our financial results. The impact of future increases, if any,balance, and cannot be reasonably estimated at this time. Additionally, the CFPB finalized a rule in March 2024 which will lower the safe harbor dollar amount credit card companies can charge for late fees for a late payment. The rule will have a negative impact on our credit card revenues if our steps to mitigate the impact of such rule are not successful.
34
Item 8. Financial Statements and Supplementary Data
The
Index to Consolidated Financial Statements | Page |
Consolidated Financial Statements | |
Report of Independent Registered Public Accounting Firm (Ernst & Young LLP PCAOB ID: 42) | 36 |
39 | |
40 | |
41 | |
42 | |
43 | |
43 | |
49 | |
50 | |
53 | |
54 | |
56 | |
57 | |
58 |
Schedules have been omitted as they are not applicable.
35
Report Of Independent Registered Public Accounting Firm
To the Shareholders and the Board of Directors of Kohl’s Corporation
Opinion on the Financial Statements
We have audited the accompanying consolidated balance sheets of Kohl’s Corporation (the Company) as of February 3, 2024 and January 28, 2023, the related consolidated statements of operations, changes in shareholders’ equity and cash flows for each of the three years in the period ended February 3, 2024, and the related notes (collectively referred to as the “consolidated financial statements“). In our opinion, the consolidated financial statements present fairly, in all material respects, the financial position of the Company at February 3, 2024 and January 28, 2023, and the results of its operations and its cash flows for each of the three years in the period ended February 3, 2024, in conformity with U.S. generally accepted accounting principles.
We also have audited, in accordance with the standards of the Public Company Accounting Oversight Board (United States) (PCAOB), the Company’s internal control over financial reporting as of February 3, 2024, based on criteria established in Internal Control-Integrated Framework issued by the Committee of Sponsoring Organizations of the Treadway Commission (2013 framework) and our report dated March 21, 2024 expressed an unqualified opinion thereon.
Basis for Opinion
These financial statements are the responsibility of the Company‘s management. Our responsibility is to express an opinion on the Company‘s financial statements based on our audits. We are a public accounting firm registered with the PCAOB and are required to be independent with respect to the Company in accordance with the U.S. federal securities laws and the applicable rules and regulations of the Securities and Exchange Commission and the PCAOB.
We conducted our audits in accordance with the standards of the PCAOB. Those standards require that we plan and perform the audit to obtain reasonable assurance about whether the financial statements are free of material misstatement, whether due to error or fraud. Our audits included performing procedures to assess the risks of material misstatement of the financial statements, whether due to error or fraud, and performing procedures that respond to those risks. Such procedures included examining, on a test basis, evidence regarding the amounts and disclosures in the financial statements. Our audits also included evaluating the accounting principles used and significant estimates made by management, as well as evaluating the overall presentation of the financial statements. We believe that our audits provide a reasonable basis for our opinion.
Critical Audit Matters
The critical audit matters communicated below are matters arising from the current period audit of the financial statements that were communicated or required to be communicated to the audit committee and that: (1) relate to accounts or disclosures that are material to the financial statements and (2) involved our especially challenging, subjective or complex judgments. The communication of critical audit matters does not alter in any way our opinion on the consolidated financial statements, taken as a whole, and we are not, by communicating the critical audit matters below, providing separate opinions on the critical audit matters or on the accounts or disclosures to which they relate.
36
Description of the Matter | Merchandise Inventories At February 3, 2024, the Company’s merchandise inventories balance was $2.9 billion. As described in Note 1 to the consolidated financial statements, merchandise inventories are valued at the lower of cost or market using the retail inventory method (“RIM”). Under RIM, the valuation of inventory at cost and the resulting gross margins are calculated by applying a cost-to-retail ratio to the retail value of inventory. RIM is an averaging method that has been widely used in the retail industry due to its practicality. The use of RIM results in inventory valued at lower of cost or market since permanent markdowns are taken as a reduction to the retail value of inventories. The calculation of inventory under RIM includes a number of inputs including the retail value of inventory, cost value of inventory and adjustments to inventory costs such as markdown allowances, shrinkage and permanent markdowns. As a result of the number of inputs and the involvement of multiple software applications used to capture the high volume of transactions processed by the Company, auditing inventory requires extensive audit effort. In addition, the inventory process is supported by a number of automated and IT dependent controls that elevate the importance of the IT general controls that support the underlying software applications including those developed by the Company. | |
How We Addressed the Matter in Our Audit | We obtained an understanding, evaluated the design and tested the operating effectiveness of controls over the Company’s inventory process, including the RIM calculation and underlying IT general controls, and controls over the data transfers between applications. Our substantive audit procedures included, among others, evaluating the key inputs into the RIM calculation, including purchases, sales, shrinkage, vendor allowances and markdowns. Our testing included agreeing data back to source information including third party vendor invoices, third party inventory count information, and cash receipts. We also performed analytical procedures including margin analysis, analytics with respect to key inventory metrics such as shrinkage, turns and store inventory in conjunction with analysis related to markdowns and purchase price adjustments. | |
Unrecognized Tax Benefits | ||
Description of the Matter | As described in Note 5 to the consolidated financial statements, at February 3, 2024, the Company had gross unrecognized tax benefits of $200 million. The Company’s uncertain tax positions are subject to audit by federal and state taxing authorities, and the resolution of such audits may span multiple years. Management’s analysis of extent to which its tax positions in certain jurisdictions are more-likely-than-not to be sustained was significant to our audit because the amounts are material to the financial statements and the related assessment process is complex and involves significant judgments. Such judgments included the interpretation of laws, regulations, and tax rulings related to uncertain tax positions. |
37
How We Addressed the Matter in Our Audit | We obtained an understanding, evaluated the design, and tested the operating effectiveness of controls over the Company’s process to assess whether tax positions are more-likely-than-not to be sustained upon examination. For example, we tested controls over management’s identification of uncertain tax positions and its application of the recognition and measurement principles, including management’s review of the inputs and calculations of unrecognized tax benefits resulting from uncertain tax positions. To test management’s recognition and measurement of liabilities associated with uncertain tax positions, our audit procedures included, among others, evaluation of the status of open income tax examinations and the potential implications of those examinations on the current year income tax provision based on the application of income tax laws. We analyzed the Company’s assumptions and data used to determine the amount of tax benefit to recognize and tested the accuracy of the calculations. We also tested the technical merits of existing positions, including an evaluation of whether the positions are more-likely-than-not to be sustained in an examination and the statute of limitations assumptions related to the Company’s calculation of liabilities for uncertain tax positions. We involved our tax professionals to assist in the evaluation of tax law relative to the Company’s open income tax examinations and changes from prior years. |
/s/ Ernst & Young LLP
We have served as the Company’s auditor since 1986.
Milwaukee, Wisconsin
March 21, 2024
38
KOHL’S CORPORATION
CONSOLIDATED BALANCE SHEETS
(Dollars in Millions) | February 3, 2024 | January 28, 2023 |
Assets |
|
|
Current assets: |
|
|
Cash and cash equivalents | $183 | $153 |
Merchandise inventories | 2,880 | 3,189 |
Other | 347 | 394 |
Total current assets | 3,410 | 3,736 |
Property and equipment, net | 7,720 | 7,926 |
Operating leases | 2,499 | 2,304 |
Other assets | 380 | 379 |
Total assets | $14,009 | $14,345 |
|
|
|
Liabilities and Shareholders’ Equity |
|
|
Current liabilities: |
|
|
Accounts payable | $1,134 | $1,330 |
Accrued liabilities | 1,201 | 1,220 |
Borrowings under revolving credit facility | 92 | 85 |
Current portion of: |
|
|
Long-term debt | — | 275 |
Finance leases and financing obligations | 83 | 94 |
Operating leases | 102 | 111 |
Total current liabilities | 2,612 | 3,115 |
Long-term debt | 1,638 | 1,637 |
Finance leases and financing obligations | 2,680 | 2,786 |
Operating leases | 2,781 | 2,578 |
Deferred income taxes | 107 | 129 |
Other long-term liabilities | 298 | 337 |
Shareholders’ equity: |
|
|
Common stock - 161 and 378 million shares issued | 2 | 4 |
Paid-in capital | 3,528 | 3,479 |
Treasury stock, at cost, 50 and 267 million shares | (2,571) | (13,715) |
Retained earnings | 2,934 | 13,995 |
Total shareholders’ equity | $3,893 | $3,763 |
Total liabilities and shareholders’ equity | $14,009 | $14,345 |
See accompanying Notes to Consolidated Financial Statements
39
KOHL’S CORPORATION
CONSOLIDATED STATEMENTS OF OPERATIONS
(Dollars in Millions, Except per Share Data) | 2023 | 2022 | 2021 |
Net sales | $16,586 | $17,161 | $18,471 |
Other revenue | 890 | 937 | 962 |
Total revenue | 17,476 | 18,098 | 19,433 |
Cost of merchandise sold | 10,498 | 11,457 | 11,437 |
Operating expenses: |
|
|
|
Selling, general, and administrative | 5,512 | 5,587 | 5,478 |
Depreciation and amortization | 749 | 808 | 838 |
Operating income | 717 | 246 | 1,680 |
Interest expense, net | 344 | 304 | 260 |
Loss on extinguishment of debt | — | — | 201 |
Income (loss) before income taxes | 373 | (58) | 1,219 |
Provision (benefit) for income taxes | 56 | (39) | 281 |
Net income (loss) | $317 | $(19) | $938 |
Net income (loss) per share: |
|
|
|
Basic | $2.88 | $(0.15) | $6.41 |
Diluted | $2.85 | $(0.15) | $6.32 |
See accompanying Notes to Consolidated Financial Statements
40
KOHL’S CORPORATION
(Dollars in Millions, Except per Share Data) | 2023 | 2022 | 2021 |
Common stock |
|
|
|
Balance, beginning of period | $4 | $4 | $4 |
Stock-based awards | — | — | — |
Retirement of treasury stock | (2) | — | — |
Balance, end of period | $2 | $4 | $4 |
|
|
|
|
Paid-in capital |
|
|
|
Balance, beginning of period | $3,479 | $3,375 | $3,319 |
Stock-based awards | 49 | 39 | 56 |
Final settlement of accelerated share repurchase | — | 65 | — |
Balance, end of period | $3,528 | $3,479 | $3,375 |
|
|
|
|
Treasury stock |
|
|
|
Balance, beginning of period | $(13,715) | $(12,975) | $(11,595) |
Treasury stock purchases | — | (723) | (1,355) |
Stock-based awards | (16) | (21) | (27) |
Dividends paid | 3 | 4 | 2 |
Retirement of treasury stock | 11,157 | — | — |
Balance, end of period | $(2,571) | $(13,715) | $(12,975) |
|
|
|
|
Retained earnings |
|
|
|
Balance, beginning of period | $13,995 | $14,257 | $13,468 |
Net (loss) earnings | 317 | (19) | 938 |
Dividends paid | (223) | (243) | (149) |
Retirement of treasury stock | (11,155) | — | — |
Balance, end of period | $2,934 | $13,995 | $14,257 |
|
|
|
|
Total shareholders' equity, end of period | $3,893 | $3,763 | $4,661 |
|
|
|
|
Common stock |
|
|
|
Shares, beginning of period | 378 | 377 | 377 |
Stock-based awards | — | 1 | — |
Retirement of treasury stock | (217) | — | — |
Shares, end of period | 161 | 378 | 377 |
Treasury stock |
|
|
|
Shares, beginning of period | (267) | (246) | (219) |
Treasury stock purchases | — | (21) | (27) |
Retirement of treasury stock | 217 | — | — |
Shares, end of period | (50) | (267) | (246) |
Total shares outstanding, end of period | 111 | 111 | 131 |
|
|
|
|
Dividends paid per common share | $2.00 | $2.00 | $1.00 |
See accompanying Notes to Consolidated Financial Statements
41
KOHL’S CORPORATION
CONSOLIDATED STATEMENTS OF CASH FLOWS
(Dollars in Millions) | 2023 | 2022 | 2021 |
Operating activities |
|
|
|
Net income (loss) | $317 | $(19) | $938 |
Adjustments to reconcile net income (loss) to net cash provided by operating activities: |
|
|
|
Depreciation and amortization | 749 | 808 | 838 |
Share-based compensation | 42 | 30 | 48 |
Deferred income taxes | (8) | (84) | (92) |
Loss on extinguishment of debt | — | — | 201 |
Non-cash lease expense | 92 | 106 | 139 |
Other non-cash expense | 6 | 30 | 12 |
Changes in operating assets and liabilities: |
|
|
|
Merchandise inventories | 315 | (116) | (467) |
Other current and long-term assets | 11 | 87 | 569 |
Accounts payable | (196) | (353) | 206 |
Accrued and other long-term liabilities | (67) | (99) | 21 |
Operating lease liabilities | (93) | (108) | (142) |
Net cash provided by operating activities | 1,168 | 282 | 2,271 |
Investing activities |
|
|
|
Acquisition of property and equipment | (577) | (826) | (605) |
Proceeds from sale of real estate | 26 | 43 | 35 |
Other | (11) | — | — |
Net cash used in investing activities | (562) | (783) | (570) |
Financing activities |
|
|
|
Proceeds from issuance of debt | — | — | 500 |
Net borrowings under revolving credit facility | 7 | 85 | — |
Deferred financing costs | — | (6) | (8) |
Treasury stock purchases | — | (658) | (1,355) |
Shares withheld for taxes on vested restricted shares | (16) | (21) | (27) |
Dividends paid | (220) | (239) | (147) |
Repayment of long-term borrowings | (275) | — | (1,044) |
Premium paid on redemption of debt | — | — | (192) |
Finance lease and financing obligation payments | (93) | (106) | (125) |
Proceeds from financing obligations | 21 | 11 | 15 |
Proceeds from stock option exercises | — | 1 | 1 |
Other | — | — | (3) |
Net cash used in financing activities | (576) | (933) | (2,385) |
Net increase (decrease) in cash and cash equivalents | 30 | (1,434) | (684) |
Cash and cash equivalents at beginning of period | 153 | 1,587 | 2,271 |
Cash and cash equivalents at end of period | $183 | $153 | $1,587 |
Supplemental information |
|
|
|
Interest paid, net of capitalized interest | $331 | $284 | $246 |
Income taxes paid | 69 | 111 | 370 |
See accompanying Notes to Consolidated Financial Statements
42
1. Business and Summary of Accounting Policies
Business
As of February 3, 2024, we operated 1,174 stores and a website (www.Kohls.com). Our Kohl's stores and website sell moderately-priced private and national brand apparel, footwear, accessories, beauty, and home products. Our Kohl's stores generally carry a consistent merchandise assortment with some differences attributable to local preferences, store size, and Sephora. Our website includes merchandise which is available in our stores, as well as merchandise which is available only online.
Our authorized capital stock consists of 800 million shares of $0.01 par value common stock and 10 million shares of $0.01 par value preferred stock.
Consolidation
The Consolidated Financial Statements include the accounts of Kohl’s Corporation and its subsidiaries including Kohl’s, Inc., its primary operating company. All intercompany accounts and transactions have been eliminated.
Accounting Period
Our fiscal year ends on the Saturday closest to January 31st each year. Unless otherwise stated, references to years in these notes relate to fiscal years rather than to calendar years. The following fiscal periods are presented in these notes:
Fiscal Year | Ended | Number of Weeks |
2023 | February 3, 2024 | 53 |
2022 | January 28, 2023 | 52 |
2021 | January 29, 2022 | 52 |
Use of Estimates
The preparation of Consolidated Financial Statements in conformity with U.S. GAAP requires management to make estimates and assumptions that affect the amounts reported in the Consolidated Financial Statements and accompanying notes. Actual results could differ from those estimates.
Cash and Cash Equivalents
In addition to money market investments, cash equivalents include commercial paper and certificates of deposit with original maturities of three months or less. We carry these investments at cost which approximates fair value.
Also included in cash and cash equivalents are amounts due from credit card transactions with settlement terms of less than five days. Credit and debit card receivables included within cash were $74 million at February 3, 2024 and $76 million at January 28, 2023.
Merchandise Inventories
The majority of our merchandise inventories are valued at the lower of cost or market using RIM. Under RIM, the valuation of inventory at cost and the resulting gross margins are calculated by applying a cost-to-retail ratio to the retail value of inventory. RIM is an averaging method that has been widely used in the retail industry due to its practicality. The use of RIM will result in inventory being valued at the lower of cost or market since permanent markdowns are taken as a reduction of the retail value of inventories. A reserve is recorded if the future estimated selling price is less than cost.
43
Other Current Assets
Other current assets consist of the following:
(Dollars in Millions) | February 3, 2024 | January 28, 2023 |
Prepaids | $166 | $170 |
Other receivables | 157 | 183 |
Income taxes receivable (a) | 10 | 27 |
Other | 14 | 14 |
Other current assets | $347 | $394 |
Property and Equipment
Property and equipment consist of the following:
(Dollars in Millions) | February 3, 2024 | January 28, 2023 |
Land | $1,088 | $1,100 |
Buildings and improvements: |
|
|
Owned | 8,377 | 8,225 |
Leased | 2,369 | 2,446 |
Fixtures and equipment | 1,718 | 1,807 |
Information technology | 1,326 | 1,580 |
Construction in progress | 56 | 49 |
Total property and equipment, at cost | 14,934 | 15,207 |
Less accumulated depreciation and amortization | (7,214) | (7,281) |
Property and equipment, net | $7,720 | $7,926 |
Certain amounts in the prior period related to the removal of fully depreciated assets no longer in use have been reclassified to
conform with the current year's presentation.
Construction in progress includes property and equipment which is not ready for its intended use.
Property and equipment are recorded at cost, less accumulated depreciation. Depreciation is calculated using the straight-line method over the estimated useful lives of the assets. Owned buildings and improvements include owned buildings on owned and leased land as well as leasehold improvements on leased properties. Leased property and improvements to leased property are amortized on a straight-line basis over the term of the lease or useful life of the asset, whichever is less. Leases are further described in Note 3 of the Consolidated Financial Statements.
The annual provisions for depreciation and amortization generally use the following ranges of useful lives:
Buildings and improvements | 5-40 years |
Fixtures and equipment | 3-15 years |
Information technology | 3-5 years |
As of February 3, 2024, and January 28, 2023, we had assets held for sale of $19 million.
Long-Lived Assets
All property and equipment and other long-lived assets are reviewed for potential impairment at least annually or when events or changes in circumstances indicate that the asset’s carrying value may not be recoverable. If such indicators are present, it is determined whether the sum of the estimated undiscounted future cash flows attributable to such assets is less than the carrying value of the assets. A potential impairment has occurred if projected future undiscounted cash flows are less than the carrying value of the assets. No impairments were recorded in 2023. An impairment of $22 million was recorded in 2022 related to corporate facilities in Selling, General, and Administrative Expenses. No impairments were recorded in 2021.
44
Other Noncurrent Assets
Other noncurrent assets consist of the following:
(Dollars in Millions) | February 3, 2024 | January 28, 2023 |
Income taxes receivable (a) | $200 | $195 |
Deferred tax assets (a) | 32 | 46 |
Other | 148 | 138 |
Other noncurrent assets | $380 | $379 |
Accrued Liabilities
Accrued liabilities consist of the following:
(Dollars in Millions) | February 3, 2024 | January 28, 2023 |
Gift cards and merchandise return cards | $327 | $356 |
Sales, property, and use taxes | 162 | 184 |
Payroll and related fringe benefits | 138 | 141 |
Income taxes payable (a) | 40 | 12 |
Other | 534 | 527 |
Accrued liabilities | $1,201 | $1,220 |
Self-Insurance
We use a combination of insurance and self-insurance for a number of risks.
We retain the initial risk of $500,000 per occurrence in workers’ compensation claims and $250,000 per occurrence in general liability claims. We record reserves for workers’ compensation and general liability claims which include the total amounts that we expect to pay for a fully developed loss and related expenses, such as fees paid to attorneys, experts, and investigators.
We are fully self-insured for employee-related health care benefits, a portion of which is paid by our associates.
We use a third-party actuary to estimate the liabilities associated with workers’ compensation, general liability, and employee-related health care risks. These liabilities include amounts for both reported claims and incurred, but not reported losses. The total liabilities, net of collateral held by third parties, for these risks were $54 million as of February 3, 2024 and $55 million as of January 28, 2023.
For property losses, we are subject to a $5 million self-insured retention ("SIR"). Once the SIR is incurred, each loss is subject to a $250,000 deductible, except for flooding in high hazard zones which is subject to a $1 million deductible, and catastrophic events, such as earthquakes and windstorms, which are subject to a 2-5% deductible.
Treasury Stock
We account for repurchases of common stock and shares withheld in lieu of taxes when restricted stock vests using the cost method with common stock in treasury classified in the Consolidated Balance Sheets as a reduction of shareholders’ equity.
We retired 217 million shares of treasury stock during the first quarter of 2023. The shares were returned to the status of authorized but unissued shares. The retirement of treasury stock is recognized as a deduction from common stock for the shares' par value and any excess of cost over par as a deduction from retained earnings.
45
On August 18, 2022, we entered into an accelerated share repurchase agreement ("ASR") with Goldman Sachs to repurchase $500 million of the Company's common stock. This ASR was part of the $3.0 billion share repurchase program authorized by our Board of Directors in February 2022. On August 22, 2022, we received an initial delivery of 11.8 million shares of common stock, representing 80% of the total shares expected to be repurchased under the ASR. Final settlement occurred on November 7, 2022, with an additional 6.1 million shares of common stock being delivered, resulting in a total of 17.9 million shares with an average purchase price of approximately $28 per share.
Revenue Recognition
Net Sales
Net sales includes revenue from the sale of merchandise, net of expected returns and deferrals due to future performance obligations, and shipping revenues. Net sales are recognized when merchandise is received by the customer and we have fulfilled all performance obligations. We do not have any sales that are recorded as commissions.
The following table summarizes net sales by line of business:
(Dollars in Millions) | 2023 | 2022 | 2021 |
Women's | $4,281 | $4,654 | $4,927 |
Men's | 3,455 | 3,679 | 3,867 |
Accessories (including Sephora) | 2,813 | 2,279 | 2,100 |
Home | 2,533 | 2,791 | 3,344 |
Children's | 2,060 | 2,176 | 2,435 |
Footwear | 1,444 | 1,582 | 1,798 |
Net Sales | $16,586 | $17,161 | $18,471 |
Other Revenue
Other revenue includes revenue from credit card operations, third-party advertising on our website, unused gift cards and merchandise return cards (breakage), and other non-merchandise revenue.
Revenue from credit card operations includes our share of the finance charges, late fees, and other revenue less write-offs of uncollectible accounts of the Kohl’s credit card pursuant to the Credit Card Program Agreement. Expenses related to our credit card operations are reported in Selling, General, and Administrative Expenses.
Revenue from unredeemed gift cards and merchandise return cards (breakage) is recorded in proportion to and over the time period the cards are actually redeemed.
46
Cost of Merchandise Sold and Selling, General, and Administrative Expenses
The following table illustrates the primary costs classified in Cost of Merchandise Sold and Selling, General, and Administrative Expenses:
Cost of Merchandise Sold | Selling, General, and Administrative Expenses |
• Total cost of products sold including product development costs, net of vendor payments other than reimbursement of specific, incremental, and identifiable costs • Inventory shrink • Markdowns • Freight expenses associated with moving merchandise from our vendors to our distribution centers • Shipping expenses for digital sales • Terms cash discount | • Compensation and benefit costs including: • Stores • Corporate, including buying • Distribution centers • Occupancy and operating costs of our retail, distribution, and corporate facilities • Expenses related to our credit card operations • Freight expenses associated with moving merchandise from our distribution centers to our retail stores and between distribution and retail facilities other than expenses to fulfill digital sales • Marketing expenses, offset by vendor payments for reimbursement of specific, incremental, and identifiable costs • Other non-operating revenues and expenses |
The classification of these expenses varies across the retail industry.
Vendor Allowances
We receive consideration for a variety of vendor-sponsored programs, such as markdown allowances, and promotion and marketing support. The vendor consideration is recorded as earned either as a reduction of Cost of Merchandise Sold or Selling, General, and Administrative Expenses. Promotional and marketing allowances are intended to offset our marketing costs to promote vendors’ merchandise. Markdown allowances are recorded as a reduction of inventory costs.
Fair Value
Fair value measurements are required to be classified and disclosed in one of the following pricing categories:
Level 1: | Financial instruments with unadjusted, quoted prices listed on active market exchanges. | |
Level 2: | Financial instruments lacking unadjusted, quoted prices from active market exchanges, including over-the-counter traded financial instruments. The prices for the financial instruments are determined using prices for recently traded financial instruments with similar underlying terms as well as directly or indirectly observable inputs, such as interest rates and yield curves that are observable at commonly quoted intervals. | |
Level 3: | Financial instruments that are not actively traded on a market exchange. This category includes situations where there is little, if any, market activity for the financial instrument. The prices are determined using significant unobservable inputs or valuation techniques. | |
Current assets and liabilities are reported at cost, which approximates fair value. Cash and cash equivalents are classified as Level 1 as carrying value approximates fair value because maturities are less than three months.
47
Marketing
Marketing costs are expensed when the marketing is first seen. Marketing costs, net of related vendor allowances, are as follows:
(Dollars in Millions) | 2023 | 2022 | 2021 |
Gross marketing costs | $839 | $940 | $948 |
Vendor allowances | (43) | (57) | (55) |
Net marketing costs | $796 | $883 | $893 |
Net marketing costs as a percent of total revenue | 4.6% | 4.9% | 4.6% |
Income Taxes
Income taxes are accounted for under the asset and liability method. Under this reportmethod, deferred tax assets and liabilities are recorded based on differences between the amounts of assets and liabilities recognized for financial reporting purposes and such amounts recognized for income tax purposes. Deferred tax assets and liabilities are calculated using the enacted tax rates and laws that are expected to be in effect when the differences are expected to reverse. We establish valuation allowances for deferred tax assets when we believe it is more likely than not that the asset will not be realizable for tax purposes. We recognize interest and penalty expense related to unrecognized tax benefits in our provision for income tax expense.
Net Income (Loss) Per Share
Basic net income (loss) per share is net income (loss) divided by the average number of common shares outstanding during the period. Diluted net income (loss) per share includes incremental shares assumed for share-based awards and stock warrants. The potentially dilutive shares outstanding during the period include unvested restricted stock units, unvested restricted stock awards, and warrants, which utilize the treasury stock method, as well as unvested performance share units that utilize the contingently issuable share method. Potentially dilutive shares are excluded from the computations of diluted earnings per share (“EPS”) if their effect would be anti-dilutive.
The information required to compute basic and diluted net income (loss) per share is as follows:
(Dollars and Shares in Millions, Except per Share Data) | 2023 | 2022 | 2021 |
Numerator—Net income (loss) | $317 | $(19) | $938 |
Denominator—Weighted-average shares: |
|
|
|
Basic | 110 | 120 | 146 |
Dilutive impact | 1 | — | 2 |
Diluted | 111 | 120 | 148 |
Net income (loss) per share: |
|
|
|
Basic | $2.88 | $(0.15) | $6.41 |
Diluted | $2.85 | $(0.15) | $6.32 |
The following potential shares of common stock were excluded from the diluted net income (loss) per share calculation because their effect would have been anti-dilutive:
(Shares in Millions) | 2023 | 2022 | 2021 |
Anti-dilutive shares | 3 | 4 | 2 |
Share-Based Awards
Stock-based compensation expense is generally recognized on a straight-line basis over the vesting period based on the fair value of awards which are expected to vest. The fair value of all share-based awards is estimated on the date of grant.
48
Recent Accounting Pronouncements
Accounting Standards Issued and Adopted
There are no recently issued accounting pronouncements that had a material impact on our financial statements.
Accounting Standards Issued but not yet Effective
Standard | Description | Effect on our Financial Statements |
Segment Reporting (ASU 2023-07) Issued November 2023 Effective for Fiscal Years beginning after December 15, 2023 and interim periods within fiscal years beginning after December 15, 2024 | The amendments in this ASU improve reportable segment disclosure requirements, primarily through enhanced disclosures around significant segment expenses. | We are evaluating the impact of the new required disclosures on our financial statements but do not expect the effect of the adoption to be material. |
Income Taxes (ASU 2023-09) Issued December 2023 Effective for Fiscal Years beginning after December 15, 2024 | The ASU requires entities to provide additional information in the rate reconciliation table and additional disclosures around income taxes paid. | We are evaluating the impact of the new required disclosures on our financial statements but do not expect the effect of the adoption to be material. |
2. Debt
Long-term debt, which excludes borrowings on the revolving credit facility, consists of the following unsecured debt:
|
|
| Outstanding | |
Maturity (Dollars in Millions) | Effective Rate at Issuance | Coupon Rate | February 3, 2024 | January 28, 2023 |
2023 | 3.25% | 3.25% | $— | $164 |
2023 | 4.78% | 4.75% | — | 111 |
2025 | 9.50% | 10.75% | 113 | 113 |
2025 | 4.25% | 4.25% | 353 | 353 |
2029 | 7.36% | 7.25% | 42 | 42 |
2031 | 3.40% | 4.63% | 500 | 500 |
2033 | 6.05% | 6.00% | 112 | 112 |
2037 | 6.89% | 6.88% | 101 | 101 |
2045 | 5.57% | 5.55% | 427 | 427 |
Outstanding unsecured senior debt |
|
| 1,648 | 1,923 |
Unamortized debt discounts and deferred financing costs |
|
| (10) | (11) |
Current portion of unsecured senior debt |
|
| — | (275) |
Long-term unsecured senior debt |
|
| $1,638 | $1,637 |
Effective interest rate at issuance |
|
| 5.06% | 4.89% |
49
Our estimated fair value of unsecured senior long-term debt is determined using Level 1 inputs, using financial instruments with unadjusted, quoted prices listed on active market exchanges. The estimated fair value of our unsecured senior debt was $1.3 billion at February 3, 2024 and $1.6 billion at January 28, 2023.
In 2023, $164 million in aggregate principal amount of our 3.25% notes and $111 million in aggregate principal amount of our 4.75% notes matured and were repaid.
During the first quarter of 2023, S&P downgraded our senior unsecured credit rating from BB+ to BB and Moody's downgraded our rating from Ba2 to Ba3. As a result of the downgrades, the interest rate on our 3.375% notes due May 2031 and 9.50% notes due May 2025 increased 50 basis points in May 2023 due to the coupon adjustment provisions within these notes. Our credit rating was also downgraded in 2022. This resulted in the interest rates increasing 75 basis points, with 25 basis points effective in 2022 and the remaining 50 basis points effective in May 2023. In total, the interest rate of both these notes have increased 125 basis points since their issuance.
Borrowings under the revolving credit facility, recorded as short-term debt, were $92 million as of February 3, 2024, and $85 million as of January 28, 2023. Outstanding borrowings under the credit facility bear interest at a variable rate based on SOFR plus the applicable margin. As of February 3, 2024, we had $26 million of standby and trade letters of credit outstanding under the credit facility, which reduces the available borrowing capacity.
Our various debt agreements contain covenants including limitations on additional indebtedness and certain financial tests. As of February 3, 2024, we were in compliance with all covenants of the various debt agreements.
We also had outstanding standby and trade letters of credit outside of the credit facility totaling approximately $12 million at February 3, 2024.
3. Leases
We lease certain property and equipment used in our operations. Some of our store leases include additional rental payments based on a percentage of sales over contractual levels or payments that are adjusted periodically for inflation.Our typical store lease has an initial term of 20 to 25 years and four to eightfive-year renewal options.
Lease assets represent our right to use an underlying asset for the lease term. Lease assets are recognized at commencement date based on the value of the lease liability and are adjusted for any lease payments made to the lessor at or before commencement date, minus any lease incentives received and any initial direct costs incurred by the lessee.
Lease liabilities represent our contractual obligation to make lease payments. At the commencement date, the lease liabilities equal the present value of minimum lease payments over the lease term. As the implicit interest rate is not readily identifiable in our leases, we estimate our collateralized incremental borrowing rate to calculate the present value of lease payments.
Leases with a term of 12 months or less are excluded from the balance; we recognize lease expense for these leases on a straight-line basis over the lease term. We combine lease and non-lease components for new and modified leases.
We opened 254 full size Sephora shops within our Kohl's stores during 2023 and now have 860 full size Sephora shops open as of the end of the fiscal year. Due to the investments we made in the full size Sephora shops, we reassessed our lease term when construction began as these assets will have significant economic value to us when
50
the lease term becomes exercisable. The impact of these assessments resulted in additional lease term, additional lease assets and liabilities, and, in some cases, changes to the classification.
The following tables summarize our operating and finance leases, which are predominately store related, and where they are presented in our Consolidated Financial Statements:
Consolidated Balance Sheets |
|
| |
(Dollars in Millions) | Classification | February 3, 2024 | January 28, 2023 |
Assets |
|
|
|
Operating leases | Operating leases | $2,499 | $2,304 |
Finance leases | Property and equipment, net | 1,883 | 2,033 |
Total operating and finance leases | 4,382 | 4,337 | |
Liabilities |
|
|
|
Current |
|
|
|
Operating leases | Current portion of operating leases | 102 | 111 |
Finance leases | Current portion of finance leases and financing obligations | 74 | 76 |
Noncurrent |
|
|
|
Operating leases | Operating leases | 2,781 | 2,578 |
Finance leases | Finance leases and financing obligations | 2,242 | 2,344 |
Total operating and finance leases | $5,199 | $5,109 | |
Consolidated Statement of Operations |
|
|
| |
(Dollars in Millions) | Classification | 2023 | 2022 | 2021 |
Operating leases | Selling, general, and administrative | $271 | $264 | $298 |
Finance Leases |
|
|
|
|
Amortization of leased assets | Depreciation and amortization | 121 | 126 | 98 |
Interest on leased assets | Interest expense, net | 144 | 140 | 111 |
Total operating and finance leases |
| $536 | $530 | $507 |
Consolidated Statement of Cash Flows |
|
|
|
(Dollars in Millions) | 2023 | 2022 | 2021 |
Cash paid for amounts included in measurement of leased liabilities |
|
|
|
Operating cash flows from operating leases | $272 | $266 | $311 |
Operating cash flows from finance leases | 140 | 133 | 105 |
Financing cash flows from finance leases | 78 | 86 | 93 |
The following table summarizes future lease payments by fiscal year:
| February 3, 2024 | ||
(Dollars in millions) | Operating Leases | Finance Leases | Total |
2024 | $268 | $213 | $481 |
2025 | 263 | 208 | 471 |
2026 | 256 | 206 | 462 |
2027 | 256 | 205 | 461 |
2028 | 254 | 202 | 456 |
After 2028 | 3,902 | 3,303 | 7,205 |
Total lease payments | $5,199 | $4,337 | $9,536 |
Amount representing interest | (2,316) | (2,021) | (4,337) |
Lease liabilities | $2,883 | $2,316 | $5,199 |
Total lease payments include $3.9 billion related to options to extend operating lease terms that are reasonably certain of being exercised and $3.2 billion related to options to extend finance lease terms that are reasonably certain of being exercised. Additionally, total lease payments exclude $13 million of legally binding lease payments for leases signed but not yet commenced.
51
The following table summarizes weighted-average remaining lease term and discount rate:
| February 3, 2024 | January 28, 2023 |
Weighted-average remaining term (years) |
|
|
Operating leases | 20 | 20 |
Finance leases | 20 | 20 |
Weighted-average discount rate |
|
|
Operating leases | 6% | 6% |
Finance leases | 6% | 6% |
Other lease information is as follows:
(Dollars in Millions) | 2023 | 2022 | 2021 |
Property and equipment acquired (disposed) through exchange of: |
|
|
|
Finance lease liabilities | (36) | 714 | 841 |
Operating lease liabilities | 278 | 179 | 2 |
Financing Obligations
Historical failed sale-leasebacks that did not qualify for sale-leaseback accounting upon adoption of ASC 842 continue to be accounted for as financing obligations.
The following tables summarize our financing obligations, which are all store related, and where they are presented in our Consolidated Financial Statements:
Consolidated Balance Sheets |
|
| |
(Dollars in millions) | Classification | February 3, 2024 | January 28, 2023 |
Assets |
|
|
|
Financing obligations | Property and equipment, net | $44 | $49 |
Liabilities |
|
|
|
Current | Current portion of finance leases and financing obligations | 9 | 18 |
Noncurrent | Finance leases and financing obligations | 438 | 442 |
Total financing obligations |
| $447 | $460 |
Consolidated Statement of Operations |
|
|
| |
(Dollars in millions) | Classification | 2023 | 2022 | 2021 |
Amortization of financing obligation assets | Depreciation and amortization | $5 | $7 | $10 |
Interest on financing obligations | Interest expense, net | 70 | 58 | 41 |
Total financing obligations |
| $75 | $65 | $51 |
Consolidated Statement of Cash Flows |
|
|
|
(Dollars in millions) | 2023 | 2022 | 2021 |
Cash paid for amounts included in measurement of financing obligations |
|
|
|
Operating cash flows from financing obligations | $68 | $56 | $40 |
Financing cash flows from financing obligations | 15 | 20 | 32 |
Proceeds from financing obligations | 21 | 11 | 15 |
52
The following table summarizes future financing obligation payments by fiscal year:
| February 3, 2024 |
(Dollars in millions) | Financing Obligations |
2024 | $73 |
2025 | 79 |
2026 | 79 |
2027 | 79 |
2028 | 76 |
After 2028 | 1,163 |
Total lease payments | $1,549 |
Non-cash gain on future sale of property | 115 |
Amount representing interest | (1,217) |
Financing obligation liability | $447 |
Total payments exclude $21 million of legally binding payments for contracts signed, but not yet commenced.
The following table summarizes the weighted-average remaining term and discount rate for financing obligations:
| February 3, 2024 | January 28, 2023 |
Weighted-average remaining term (years) | 16 | 13 |
Weighted-average discount rate | 16% | 14% |
The following table shows the cash rent out flows for the operating leases, finance leases, and financing obligations:
Consolidated Statement of Cash Flows |
|
|
|
(Dollars in millions) | 2023 | 2022 | 2021 |
Operating cash flows from operating leases | $272 | $266 | $311 |
Operating cash flows from finance leases | 140 | 133 | 105 |
Financing cash flows from finance leases | 78 | 86 | 93 |
Operating cash flows from financing obligations | 68 | 56 | 40 |
Financing cash flows from financing obligations | 15 | 20 | 32 |
Total cash rent | $573 | $561 | $581 |
4. Benefit Plans
We have a defined contribution savings plan covering all full-time and certain part-time associates. Participants in this plan may invest up to 99% of their base compensation, subject to certain statutory limits. We match 100% of the first 5% of each participant’s contribution, subject to certain statutory limits.
We also offer a non-qualified deferred compensation plan to a group of executives which provides for pre-tax compensation deferrals up to 75% of salary and 100% of bonus. Deferrals and earned investment returns are 100% vested.
The total costs for both of these benefit plans were $52 million for 2023, $50 million for 2022 and $51 million for 2021.
53
5. Income Taxes
Deferred income taxes consist of the following:
(Dollars in Millions) | February 3, 2024 | January 28, 2023 |
Deferred tax liabilities: | ||
Property and equipment | $521 | $542 |
Lease assets | 1,151 | 1,140 |
Merchandise inventories | 45 | 33 |
Total deferred tax liabilities | 1,717 | 1,715 |
Deferred tax assets: | ||
Lease obligations | 1,468 | 1,448 |
Accrued and other liabilities, including stock-based compensation | 200 | 201 |
Federal benefit on state tax reserves | 21 | 26 |
Valuation allowance | (47) | (43) |
Total deferred tax assets | 1,642 | 1,632 |
Net deferred tax liability | $75 | $83 |
Deferred tax assets included in other long-term assets totaled $32 million as of February 3, 2024 and $46 million as of January 28, 2023. As of February 3, 2024, the Company had state net operating loss carryforwards, net of valuation allowances, of $28 million, and state credit carryforwards, net of valuation allowances, of $4 million, which will expire between 2024 and 2044. As of January 28, 2023, state net operating loss carryforwards, net of valuation allowances, were $41 million, and state credit carryforwards, net of valuation allowances, were $3 million.
The components of the Provision (benefit) for income taxes were as follows:
(Dollars in Millions) | 2023 | 2022 | 2021 |
Current federal | $78 | $39 | $311 |
Current state | (14) | 6 | 63 |
Deferred federal | (18) | (70) | (59) |
Deferred state | 10 | (14) | (34) |
Provision (benefit) for income taxes | $56 | $(39) | $281 |
The effective tax rate differs from the amount that would be provided by applying the statutory U.S. corporate tax rate due to the following items:
(Dollars in Millions) | 2023 | 2022 | 2021 |
Taxes computed at federal statutory rate | $78 | $(12) | $256 |
State income taxes, net of federal tax benefit | 16 | (1) | 32 |
Federal NOL carryback | — | — | (4) |
Uncertain tax positions | (28) | (16) | 7 |
Federal tax credits | (9) | (8) | (14) |
Other | (1) | (2) | 4 |
Total | $56 | $(39) | $281 |
Effective tax rate | 15.1% | 68.1% | 23.1% |
Our income tax provisions or benefits were $56 million tax provision, $39 million tax benefit, and $281 million tax provision in fiscal year 2023, 2022, and 2021, respectively. Fiscal year 2023 and 2021 resulted in an income tax provision compared to an income tax benefit in fiscal year 2022 due to the pre-tax book income in fiscal year 2023 and 2021 compared to the pre-tax book loss in 2022. In addition, in fiscal year 2023 and 2022, we recorded a net tax benefit for the impact of favorable results from uncertain tax positions, compared to an income tax provision related to uncertain tax positions in fiscal year 2021.
54
We have analyzed filing positions in all of the federal and state jurisdictions where we are required to file income tax returns, as well as all open tax years in these jurisdictions. The significant federal and state returns subject to examination are the 2015 through 2023 tax years. Certain tax agencies have proposed adjustments, which we are currently appealing. If we do not prevail on our appeals, we do not anticipate that the adjustments would result in a material change in our financial position.
We assess our income tax positions and record tax liabilities for all years subject to examination based upon management’s evaluation of the facts and circumstances and information available at the reporting dates. For those income tax positions where it is more-likely-than-not, based on technical merits, that a tax benefit will be sustained upon the conclusion of an examination, we have recorded the largest amount of tax benefit having a cumulatively greater than 50% likelihood of being realized upon ultimate settlement with the applicable taxing authority, assuming that it has full knowledge of all relevant information. For those tax positions which do not meet the more-likely-than-not threshold regarding the ultimate realization of the related tax benefit, no tax benefit has been recorded in the financial statements. In addition, we provide for interest and penalties, as applicable, and record such amounts as a component of the overall income tax provision. A reconciliation of the beginning and ending gross amount of unrecognized tax benefits is as follows:
(Dollars in Millions) | 2023 | 2022 |
Balance at beginning of year | $219 | $276 |
Increases due to tax positions taken in prior years | 10 | 1 |
Increases due to tax positions taken in current year | 6 | 7 |
Decreases due to: |
|
|
Tax positions taken in prior years | (32) | (57) |
Settlements with taxing authorities | — | (2) |
Lapse of applicable statute of limitations | (3) | (6) |
Balance at end of year | $200 | $219 |
Included above in the tax positions taken in prior years for 2022 is a reclass between the unrecognized tax benefits and the deferred tax liability; it had no impact on page F-3.the effective tax rate. Not included in the unrecognized tax benefits reconciliation above are gross unrecognized accrued interest and penalties of $33 million at February 3, 2024 and $41 million at January 28, 2023. Interest and penalties were a tax benefit of $8 million in 2023 and $1 million in 2022, and a tax expense of $3 million in 2021.
Our net unrecognized tax benefits that, if recognized, would affect our effective tax rate were $186 million as of February 3, 2024 and $202 million as of January 28, 2023. It is reasonably possible that our unrecognized tax positions may change within the next 12 months, primarily as a result of ongoing audits. While it is possible that one or more of these examinations may be resolved in the next year, it is not anticipated that a significant impact to the unrecognized tax benefit balance will occur.
We have both payables and receivables for income taxes recorded on our balance sheet. Receivables included in other current assets totaled $10 million as of February 3, 2024 and $27 million as of January 28, 2023. Receivables included in other long term assets totaled $200 million as of February 3, 2024 and $195 million as of January 28, 2023. The majority of the receivable balance relates to the cash benefit of the 2020 net operating loss that has not yet been received. Payables included in current liabilities totaled $40 million as of February 3, 2024 and $12 million as of January 28, 2023.
55
6. Stock-Based Awards
We currently grant share-based compensation pursuant to the Kohl’s Corporation 2017 Long-Term Compensation Plan, which provides for the granting of various forms of equity-based awards, including nonvested stock, performance share units, and options to purchase shares of our common stock, to officers, key employees, and directors. As of February 3, 2024, there were 9.0 million shares authorized and 5.0 million shares available for grant under the 2017 Long-Term Compensation Plan. Options and nonvested stock that are surrendered or terminated without issuance of shares are available for future grants.
Annual grants are typically made in the first quarter of the fiscal year. Grants to newly-hired and promoted employees and other discretionary grants are made periodically throughout the remainder of the year.
Nonvested Restricted Stock Awards and Units
We grant shares of nonvested restricted stock awards and units to eligible key employees and to our Board of Directors. Substantially all awards have restriction periods tied primarily to employment and/or service. Employee awards generally vest over five years. Director awards vest over the term to which the director was elected, generally one year. In lieu of cash dividends, holders of nonvested stock awards are granted restricted stock equivalents which vest consistently with the underlying nonvested stock awards. Holders of restricted stock units are granted shares upon vesting in lieu of cash dividends.
The fair value of nonvested stock awards and units is the closing price of our common stock on the date of grant. We may acquire shares from employees in lieu of amounts required to satisfy minimum tax withholding requirements upon the vesting of the employee’s unvested stock award. Such shares are then designated as treasury shares.
The following table summarizes nonvested stock and restricted stock unit activity, including restricted stock equivalents and restricted stock unit equivalents issued in lieu of cash dividends:
| 2023 | 2022 | 2021 | |||
(Shares and Units in Thousands) | Shares | Weighted Average Grant Date Fair Value | Shares | Weighted Average Grant Date Fair Value | Shares | Weighted Average Grant Date Fair Value |
Balance at beginning of year | 2,439 | $39.40 | 2,769 | $36.17 | 3,451 | $32.09 |
Granted | 2,229 | 22.97 | 1,098 | 47.67 | 696 | 55.31 |
Vested | (1,160) | 36.65 | (1,060) | 38.73 | (1,165) | 35.80 |
Forfeited | (409) | 31.48 | (368) | 41.71 | (213) | 34.68 |
Balance at end of year | 3,099 | $29.66 | 2,439 | $39.40 | 2,769 | $36.17 |
The aggregate fair value of awards at the time of vesting was $43 million in 2023, $41 million in 2022, and $42 million in 2021.
Performance Share Units
We grant performance-based share units ("performance share units") to certain executives. The performance measurement period for these performance share units is three fiscal years. The fair market value of the grants is determined using a Monte-Carlo valuation on the date of grant (Level 3 inputs).
The actual number of shares which will be earned at the end of the three-year vesting periods will vary based on our cumulative financial performance over the vesting periods. The number of performance share units earned will be modified up or down based on Kohl's Relative Total Shareholder Return against a defined peer group during the vesting periods. The payouts, if earned, will be settled in Kohl's common stock after the end of each multi-year performance periods.
56
The following table summarizes performance share unit activity by year:
| 2023 | 2022 | 2021 | |||
(Units in Thousands) | Units | Weighted Average Grant Date Fair Value | Units | Weighted Average Grant Date Fair Value | Units | Weighted Average Grant Date Fair Value |
Balance at beginning of year | 813 | $45.87 | 856 | $42.74 | 1,037 | $49.95 |
Granted | 770 | 20.23 | 553 | 40.92 | 225 | 58.07 |
Vested | (582) | 23.78 | — | — | (211) | 72.21 |
Forfeited | (224) | 65.80 | (596) | 36.79 | (195) | 66.88 |
Balance at end of year | 777 | $31.26 | 813 | $45.87 | 856 | $42.74 |
Stock Options
There are no stock options outstanding as of February 3, 2024.
The following table summarizes our stock option activity:
| 2023 | 2022 | 2021 | |||
(Shares in Thousands) | Shares | Weighted Average Exercise Price | Shares | Weighted Average Exercise Price | Shares | Weighted Average Exercise Price |
Balance at beginning of year | — | $— | 12 | $48.66 | 36 | $52.15 |
Exercised | — | — | (12) | 48.66 | (23) | 54.00 |
Forfeited/expired | — | — | — | — | (1) | 51.27 |
Balance at end of year | — | $— | — | $— | 12 | $48.66 |
The intrinsic value of options exercised represents the excess of our stock price at the time the option was exercised over the exercise price and was $0 in 2023 and less than $1 million in 2022 and 2021.
Stock Warrants
Effective April 18, 2019, in connection with our entry into a commercial agreement with Amazon.com Services, Inc. (“Amazon”), we issued warrants to an affiliate of Amazon, to purchase up to 1,747,441 shares of our common stock at an exercise price of $69.68, subject to customary anti-dilution provisions. The fair value was estimated to be $17.52 per warrant using a binomial lattice method. The warrants vest in five equal annual installments, and the first installment vested on January 15, 2020. The last installment vested on January 15, 2024 and all 1,747,441 shares were vested and unexercised as of February 3, 2024. The warrants will expire on April 18, 2026.
Other Required Disclosures
Stock-based compensation expense is included in Selling, General, and Administrative Expenses in our Consolidated Statements of Income. Stock-based compensation expense, net of forfeitures, totaled $42 million for 2023, $30 million for 2022, and $48 million for 2021. At February 3, 2024, we had approximately $93 million of unrecognized share-based compensation expense, which is expected to be recognized over a weighted-average period of 1.5 years.
7. Contingencies
On September 2, 2022, Sean Shanaphy, an alleged shareholder of the Company, filed a putative class action lawsuit in the U.S. District Court for the Eastern District of Wisconsin alleging violations of Sections 10(b), 14(a) and 20(a) of the Securities and Exchange Act of 1934 and certain rules promulgated thereunder. Shanaphy v. Kohl’s Corporation, No. 2:22-cv- 01016-LA (E.D. Wis.). The plaintiff asserts claims on behalf of persons and entities that purchased or otherwise acquired the Company’s securities between October 20, 2020 and May 19, 2022 (the “Class Period”), and seeks compensatory damages, interest, fees, and costs. The complaint alleges that members of the putative class suffered losses as a result of (1) false or misleading statements and withholding of information regarding the
57
conception, execution, and outcomes of the Company’s strategic plan announced on October 20, 2020 and the Company’s financial results for the first quarter of fiscal 2022 and (2) the Company’s internal controls over financial reporting, disclosure controls, and corporate governance mechanisms. The case is in its early stages. On May 23, 2023, the court appointed Thomas Frame as lead plaintiff. On October 19, 2023, the lead plaintiff filed an amended complaint with substantially similar claims and allegations which named the Company, certain of its current and former directors and its Chief Financial Officer as defendants and revised the Class Period to be August 19, 2021 to July 1, 2022. The Company intends to vigorously defend against these claims, and on December 2, 2023 filed a motion to dismiss the amended complaint in its entirety. On January 18, 2024, the plaintiff filed its opposition to the Company’s motion. The Company filed a reply brief in support of its motion on February 20, 2024. Due to the early stages of this matter, the Company is unable to estimate a reasonably possible range of loss, if any, that may result from this matter.
In addition to what is noted above, we are subject to certain legal proceedings and claims arising out of the ordinary conduct of our business. In the opinion of management, the outcome of these proceedings and claims will not have a material adverse effect on our Consolidated Financial Statements.
8. Subsequent Events
On February 28, 2024, our Board of Directors of Kohl's Corporation declared a quarterly cash dividend of $0.50 per share. The dividend will be paid on April 3, 2024 to all shareholders of record at the close of business on March 20, 2024.
Item 9. Changes Inin and Disagreements with Accountants on Accounting and Financial Disclosures
None
Item 9A. Controls and Procedures
Evaluation of Disclosure Controls and Procedures
Under the supervision and with the participation of our management, including our Chief Executive Officer and Chief Financial Officer, we carried out an evaluation of the effectiveness of the design and operation of our disclosure controls and procedures (the “Evaluation”) at a reasonable assurance level as of the last day of the period covered by this Report.report.
Based upon the Evaluation, our Chief Executive Officer and Chief Financial Officer have concluded that our disclosure controls and procedures are effective at the reasonable assurance level. "DisclosureDisclosure controls and procedures" isprocedures are defined by Rule 13a-15(e) of the Securities Exchange Act of 1934 (the "Exchange Act") as controls and other procedures that are designed to ensure that information required to be disclosed in the reports that we file or submit under the Exchange Act is recorded, processed, summarized, and reported within the time periods specified by the SEC's rules and forms. Disclosure controls and procedures include, without limitation, controls and procedures designed to ensure that information required to be disclosed in the reports that we file or submit under the Exchange Act is accumulated and communicated to our management, including our Chief Executive Officer and Chief Financial Officer, to allow timely decisions regarding required disclosures.
It should be noted that the design of any system of controls is based in part upon certain assumptions about the likelihood of future events and there can be no assurance that any design will succeed in achieving our stated goals under all potential future conditions, regardless of how remote.
3158
Management’s Annual Report on Internal Control over Financial Reporting
Our management is responsible for establishing and maintaining adequate internal control over financial reporting. Our internal control system was designed to provide reasonable assurance to our management and Board of Directors regarding the preparation and fair presentation of our published financial statements.
All internal control systems, no matter how well designed, have inherent limitations. Therefore, even those systems determined to be effective can provide only reasonable assurance with respect to financial statement preparation and presentation.
Our management assessed the effectiveness of our internal control over financial reporting as of February 3, 2018.2024. In making this assessment, management used the criteria set forth by the Committee of Sponsoring Organizations of the Treadway Commission (“COSO”) in Internal Control—Integrated Framework (2013 Framework). Based on this assessment, our management has concluded that as of February 3, 2018,2024, our internal control over financial reporting was effective based on those criteria.
Ernst & Young LLP, an independent registered public accounting firm, has audited the Consolidated Financial Statements included in this Annual Report on Form 10-K and, as part of its audit, has issued an attestation report, included herein, on the effectiveness of our internal control over financial reporting.
Changes in Internal Control Overover Financial Reporting
During the last fiscal quarter, thereThere were no changes in our internal controlscontrol over financial reporting during fiscal 2023 that have materially affected, or are reasonably likely to materially affect, such controls, including any corrective actions with regard to significant deficiencies and material weaknesses.our internal control over financial reporting.
Report of Independent Registered Public Accounting Firm
To the Shareholders and the Board of Directors of Kohl’s Corporation
Opinion on Internal Control over Financial Reporting
We have audited Kohl’s Corporation’s internal control over financial reporting as of February 3, 2018,2024, based on criteria established in Internal Control—Integrated Framework issued by the Committee of Sponsoring Organizations of the Treadway Commission (2013 Framework)framework) (the COSO criteria). In our opinion, Kohl’s Corporation (the Company) maintained, in all material respects, effective internal control over financial reporting as of February 3, 2018,2024, based on the COSO criteria.
We also have audited, in accordance with the standards of the Public Company Accounting Oversight Board (United States) (PCAOB), the consolidated balance sheets of the Company as of February 3, 20182024 and January 28, 2017,2023, and the related consolidated statements of income,operations, changes in shareholders’ equity and cash flows for each of the three years in the period ended February 3, 2018,2024, and the related notes and our report dated March 23, 2018,21, 2024 expressed an unqualified opinion thereon.
Basis for Opinion
The Company’s management is responsible for maintaining effective internal control over financial reporting and for its assessment of the effectiveness of internal control over financial reporting included in the accompanying Management’s Annual Report on Internal Control over Financial Reporting. Our responsibility is to express an opinion on the Company’s internal control over financial reporting based on our audit. We are a public accounting firm registered with the PCAOB and are required to be independent with respect to the Company in accordance with the U.S. federal securities laws and the applicable rules and regulations of the Securities and Exchange Commission and the PCAOB.
3259
We conducted our audit in accordance with the standards of the PCAOB. Those standards require that we plan and perform the audit to obtain reasonable assurance about whether effective internal control over financial reporting was maintained in all material respects.
Our audit included obtaining an understanding of internal control over financial reporting, assessing the risk that a material weakness exists, testing and evaluating the design and operating effectiveness of internal control based on the assessed risk, and performing such other procedures as we considered necessary in the circumstances. We believe that our audit provides a reasonable basis for our opinion.
Definition and Limitations of Internal Control Overover Financial Reporting
A company’s internal control over financial reporting is a process designed to provide reasonable assurance regarding the reliability of financial reporting and the preparation of financial statements for external purposes in accordance with generally accepted accounting principles. A company’s internal control over financial reporting includes those policies and procedures that (1) pertain to the maintenance of records that, in reasonable detail, accurately and fairly reflect the transactions and dispositions of the assets of the company; (2) provide reasonable assurance that transactions are recorded as necessary to permit preparation of financial statements in accordance with generally accepted accounting principles, and that receipts and expenditures of the company are being made only in accordance with authorizations of management and directors of the company; and (3) provide reasonable assurance regarding prevention or timely detection of unauthorized acquisition, use, or disposition of the company’s assets that could have a material effect on the financial statements.
Because of its inherent limitations, internal control over financial reporting may not prevent or detect misstatements. Also, projections of any evaluation of effectiveness to future periods are subject to the risk that controls may become inadequate because of changes in conditions, or that the degree of compliance with the policies or procedures may deteriorate.
/s/ Ernst & Young LLP
Milwaukee, Wisconsin
March 23, 201821, 2024
During the three months ended February 3, 2024, no director or Section 16 officer of the Company adopted or terminated a “Rule 10b5-1 trading arrangement” or “non-Rule 10b5-1 trading arrangement,” as each term is defined in Item 408(a) of Regulation S-K.
Item 9C. Disclosure Regarding Foreign Jurisdictions That Prevent Inspections
NoneNot applicable.
3360
PART III
Item 10. Directors, Executive Officers, and Corporate Governance
For information with respect to our Directors, the Board of Directors’ committees and our written codeCode of ethics,Ethics, see the applicable portions of the “Questions and Answers About our Board of Directors and Corporate“Corporate Governance Matters” and “Item“Proposal One: Election of Directors” sections of the Definitive Proxy Statement for our May 16, 20182024 Annual Meeting of Shareholders (“our 20182024 Proxy”), which information is incorporated herein by reference. For information with respect to Section 16 reports, see the information provided in the “Section 16(a) Beneficial Ownership Reporting Compliance” section of our 2018 Proxy, which information is incorporated herein by reference.
Any amendment to or waiver from the provisions of the Code of Ethics that is applicable to our Chief Executive Officer, Chief Financial Officer, or other key finance associates will be disclosed on the “Corporate Governance” portion of http://corporate.kohls.com. We intend to satisfy our disclosure requirements under item 5.05 of form 8-K regarding any amendments or waivers by posting such information at this location or our website.
For information with respect to Section 16 reports, see the information provided in the "Delinquent Section 16(a) Reports" section of our 2024 Proxy, which information is incorporated herein by reference.
See also Item 4A, Information about our Executive Officers of Part 1 hereof.1.
Item 11. Executive Compensation
See the information provided in the applicable portions of the “Questions and Answers About our Board of Directors and Corporate“Corporate Governance Matters” and “Item, “Proposal One: Election of Directors” sections of our 2018 Proxy, including the, "Compensation Committee Report", and "Compensation Discussion & Analysis", sections of our 2024 Proxy, which information is incorporated herein by reference.
Item 12. Security Ownership of Certain Beneficial Owners and Management and Related Stockholder Matters
See the information provided in the “Security Ownership of Certain Beneficial Owners, Directors, and Management” sectionand "Proposal 4: Approval of the Kohl's Corporation 2024 Long-Term Compensation Plan" sections of our 20182024 Proxy, which information is incorporated herein by reference.
The following table includes shares of common stock outstanding and available for issuance under our existing equity compensation plans as of February 3, 2018.
Plan Category | (a) Number of Securities to be Issued Upon Exercise of Outstanding Options, Warrants and Rights |
| (b) Weighted-Average Exercise Price of Outstanding Options, Warrants and Rights |
| (c) Number of Securities Remaining Available for Future Issuance Under Equity Compensation Plans (excluding securities reflected in column (a)) | ||
Equity compensation plans approved by security holders |
1,139,327 |
|
| $50.51 |
|
| 9,056,536 |
Equity compensation plans not approved by security holders(1) |
— |
|
| — |
|
| — |
Total | 1,139,327 |
|
| $50.51 |
|
| 9,056,536 |
|
|
Item 13. Certain Relationships and Related Transactions, and Director Independence
See the information provided in the “Independence Determinations & Related“Director Independence” and “Related Person Transactions” sectionsections of our 20182024 Proxy, which information is incorporated herein by reference.
Item 14. Principal AccountantAccounting Fees and Services
See the information provided in the “Fees Paid to Ernst & Young” section of our 20182024 Proxy, which information is incorporated herein by reference.
3461
PART IV
Item 15. Exhibits and Financial Statement Schedules
Documents filed as part of this report
|
|
See Index to Consolidated Financial Statements, on page F-1, the Report of Independent Registered Public Accounting Firm, on page F-2 and the Consolidated Financial Statements, beginning on page F-3, allin Part II, Item 8 of which are incorporated herein by reference.this Form 10-K.
|
|
All schedules have been omitted as they are not applicable.
Exhibit |
|
|
|
| Document if Incorporated by Reference | |
3.1 | Amended and Restated Articles of Incorporation of the Company | Exhibit 3.1 of the Company’s Current Report on Form 8-K filed on May 16, 2011 | |
3.2 | Exhibit 3.1 of the Company’s Current Report on Form 8-K filed on | ||
4.1 |
| ||
| Certain other long-term debt is described in Note 2 of the Notes to Consolidated Financial Statements. The Company agrees to furnish to the Commission, upon request, copies of any instruments defining the rights of holders of any such long-term debt described in Note 2 and not filed herewith. | ||
| Exhibit | ||
| Exhibit | ||
| Exhibit 10.1 of the Company’s Annual Report on Form 10-K for the fiscal year ended February 1, 2003 | ||
| Exhibit 10.4 of the Company’s Annual Report on Form 10-K for the fiscal year ended January 28, 2006 |
35
|
|
| |
| Exhibit 10.6 of the Company’s Annual Report on Form 10-K for the fiscal year ended January 29, 2005 | ||
| Summary of Executive Life and Accidental Death and Dismemberment Plans* | Exhibit 10.7 of the Company’s Annual Report on Form 10-K for the fiscal year ended January 29, 2005 | |
| Annex B to the Proxy Statement on Schedule 14A filed on March 24, 2016 in connection with the Company’s 2016 Annual Meeting of Shareholders | ||
|
| ||
|
| ||
|
| ||
|
| ||
|
| ||
|
| ||
|
| ||
|
| ||
|
| ||
|
| ||
| Exhibit | ||
| Annex A to the Proxy Statement on Schedule 14A filed on March 13, 2017 in connection with the company's 2017 Annual Meeting |
62
Exhibit | Description | Document if Incorporated by Reference | |
| Exhibit 10.2 of the Company's Quarterly Report on Form 10-Q for the fiscal quarter ended July 29, 2017 | ||
| Exhibit 10.1 of the Company's Quarterly Report on Form 10-Q for the fiscal quarter ended July 29, 2017 | ||
| |||
| Exhibit 10.25 of the Company’s Annual Report on Form 10-K for the fiscal year ended February 1, 2020 | ||
10.12 | Form of Restricted Stock Unit Agreement for persons party to an Employment Agreement | Exhibit 10.2 of the Company’s Quarterly Report on Form 10-Q for the fiscal quarter ended May 1, 2021 | |
10.13 | Form of Restricted Stock Unit Agreement for persons party to an Executive Compensation Agreement | Exhibit 10.3 of the Company’s Quarterly Report on Form 10-Q for the fiscal quarter ended May 1, 2021 | |
10.14 | Exhibit 10.4 of the Company’s Quarterly Report on Form 10-Q for the fiscal quarter ended May 1, 2021 | ||
10.15 | Exhibit | ||
10.16 | Exhibit 10.1 of the Company’s Quarterly Report on Form 10-Q for the fiscal quarter ended July 30, 2022 | ||
10.17 | Exhibit 10.2 of the Company’s Quarterly Report on Form 10-Q for the fiscal quarter ended July 30, 2022 | ||
10.18 | Cash Award Agreement between Kohl's, Inc. and Jill Timm effective as of November 29, 2022.* | Exhibit 10.1 of the Company’s Quarterly Report on Form 10-Q for the fiscal quarter ended October 29, 2022 | |
10.19 | Exhibit 10.1 of the Company’s Current Report on Form 8-K filed on |
36
|
|
| |
| Exhibit 10.1 of the Company’s Current Report on Form 8-K filed on February 2, 2023 | ||
10.21 | Exhibit | ||
| Exhibit 10.1 | ||
| Exhibit | ||
| Exhibit 10.1 to Amendment No. 2 to the Company’s Current Report on Form 8-K filed on May 12, 2023 | ||
10.25 | Exhibit 10.4 of the Company’s Quarterly Report on Form 10-Q for the fiscal quarter ended April 29, 2023 |
63
Exhibit | Description | Document if Incorporated by Reference | |
10.26 | Executive Compensation Agreement between Nicholas Jones and Kohl's, Inc. dated as of March 20, 2023* | Exhibit 10.5 of the Company’s Quarterly Report on Form 10-Q for the fiscal quarter ended April 29, 2023 | |
10.27 | Exhibit | ||
10.28 | Exhibit | ||
|
| ||
|
| ||
| |||
| |||
10.32 | Executive Compensation Agreement between Fred Hand and Kohl's Inc. dated as of September 25, 2023* | ||
10.33 | |||
21.1 |
| ||
23.1 | |||
31.1 | |||
31.2 | |||
32.1 | |||
32.2 | |||
|
| ||
| Inline XBRL Instance Document | ||
101.SCH | Inline XBRL Taxonomy Extension Schema With Embedded Linkbase Documents | ||
| Cover Page Interactive Data File (formatted as inline XBRL | ||
|
| ||
|
| ||
|
| ||
|
*A management contract or compensatory plan or arrangement.
Item 16. Form 10-K Summary
Not applicable.
3764
SIGNATURES
Pursuant to the requirements of Section 13 or 15 (d)15(d) of the Securities Exchange Act of 1934, the Registrant has duly caused this report to be signed on its behalf by the undersigned, thereunto duly authorized.
Kohl’s Corporation | ||
By: | / | |
| ||
| ||
(Principal Executive Officer) | ||
/ | ||
| ||
Chief Financial Officer | ||
(Principal Financial and Accounting Officer) |
Dated: March 23, 201821, 2024
Pursuant to the requirements of the Securities Exchange Act of 1934, this report has been signed below by the following persons on behalf of the Registrant and in the capacities and on the date indicated above:
/ | / | |||
| Thomas A. Kingsbury | |||
Chairman | Chief Executive Officer | |||
Director (Principal Executive Officer) | ||||
/s/ Wendy Arlin | /s/ Robbin Mitchell | |||
|
| |||
Director | Director | |||
|
| |||
/s/ Michael Bender | /s/ Jonas Prising | |||
|
| |||
Director | Director | |||
|
| |||
/s/ Yael Cosset | /s/ John E. Schlifske | |||
| John E. Schlifske
|
|
38
Index to Consolidated Financial Statements
| ||
| Director | |
| ||
|
| /s/ Adrianne Shapira |
|
| Adrianne Shapira |
|
| Director |
| ||
|
| /s/ Adolfo Villagomez |
|
| Adolfo Villagomez |
|
| Director |
| ||
|
| |
|
| |
|
| |
| ||
|
Schedules have been omitted as they are not applicable.
F-1
REPORT OF INDEPENDENT REGISTERED PUBLIC ACCOUNTING FIRM
To the Shareholders and the Board of Directors of Kohl’s Corporation
Opinion on the Financial Statements
We have audited the accompanying consolidated balance sheets of Kohl’s Corporation (the “Company“) as of February 3, 2018 and January 28, 2017, the related consolidated statements of income, changes in shareholders’ equity and cash flows, for each of the three years in the period ended February 3, 2018, and the related notes (collectively referred to as the “financial statements“). In our opinion, the consolidated financial statements present fairly, in all material respects, the financial position of the Company as of February 3, 2018 and January 28, 2017, and the results of its operations and its cash flows for each of the three years in the period ended February 3, 2018, in conformity with US generally accepted accounting principles.
We also have audited, in accordance with the standards of the Public Company Accounting Oversight Board (United States) (PCAOB), the Company’s internal control over financial reporting as of February 3, 2018, based on criteria established in Internal Control-Integrated Framework issued by the Committee of Sponsoring Organizations of the Treadway Commission (2013 framework) and our report dated March 23, 2018 expressed an unqualified opinion thereon.
Basis for Opinion
These financial statements are the responsibility of the Company‘s management. Our responsibility is to express an opinion on the Company‘s financial statements based on our audits. We are a public accounting firm registered with the PCAOB and are required to be independent with respect to the Company in accordance with the US federal securities laws and the applicable rules and regulations of the Securities and Exchange Commission and the PCAOB.
We conducted our audits in accordance with the standards of the PCAOB. Those standards require that we plan and perform the audit to obtain reasonable assurance about whether the financial statements are free of material misstatement, whether due to error or fraud. Our audits included performing procedures to assess the risks of material misstatement of the financial statements, whether due to error or fraud, and performing procedures that respond to those risks. Such procedures include examining, on a test basis, evidence regarding the amounts and disclosures in the financial statements. Our audits also included evaluating the accounting principles used and significant estimates made by management, as well as evaluating the overall presentation of the financial statements. We believe that our audits provide a reasonable basis for our opinion.
/s/ Ernst & Young LLP
We have served as the Company’s auditor since 1986.
Milwaukee, Wisconsin
March 23, 2018
F-2
CONSOLIDATED BALANCE SHEETS
(Dollars in Millions) | February 3, 2018 | January 28, 2017 | ||||
Assets |
|
|
|
|
|
|
Current assets: |
|
|
|
|
|
|
Cash and cash equivalents | $ | 1,308 |
| $ | 1,074 |
|
Merchandise inventories |
| 3,542 |
|
| 3,795 |
|
Other |
| 481 |
|
| 378 |
|
Total current assets |
| 5,331 |
|
| 5,247 |
|
Property and equipment, net |
| 7,773 |
|
| 8,103 |
|
Other assets |
| 236 |
|
| 224 |
|
Total assets | $ | 13,340 |
| $ | 13,574 |
|
|
|
|
|
|
|
|
Liabilities and Shareholders’ Equity |
|
|
|
|
|
|
Current liabilities: |
|
|
|
|
|
|
Accounts payable | $ | 1,271 |
| $ | 1,507 |
|
Accrued liabilities |
| 1,155 |
|
| 1,224 |
|
Income taxes payable |
| 99 |
|
| 112 |
|
Current portion of capital lease and financing obligations |
| 126 |
|
| 131 |
|
Total current liabilities |
| 2,651 |
|
| 2,974 |
|
Long-term debt |
| 2,797 |
|
| 2,795 |
|
Capital lease and financing obligations |
| 1,591 |
|
| 1,685 |
|
Deferred income taxes |
| 213 |
|
| 272 |
|
Other long-term liabilities |
| 662 |
|
| 671 |
|
Shareholders’ equity: |
|
|
|
|
|
|
Common stock - 373 and 371 million shares issued |
| 4 |
|
| 4 |
|
Paid-in capital |
| 3,078 |
|
| 3,003 |
|
Treasury stock, at cost, 205 and 197 million shares |
| (10,651 | ) |
| (10,338 | ) |
Accumulated other comprehensive loss |
| (11 | ) |
| (14 | ) |
Retained earnings |
| 13,006 |
|
| 12,522 |
|
Total shareholders’ equity | $ | 5,426 |
| $ | 5,177 |
|
Total liabilities and shareholders’ equity | $ | 13,340 |
| $ | 13,574 |
|
See accompanying Notes to Consolidated Financial Statements
F-3
CONSOLIDATED STATEMENTS OF INCOME
| (Dollars in Millions, Except per Share Data) |
| 2017 |
|
| 2016 |
|
| 2015 |
| |||
| Net sales |
| $ | 19,095 |
|
| $ | 18,686 |
|
| $ | 19,204 |
|
| Cost of merchandise sold |
|
| 12,176 |
|
|
| 11,944 |
|
|
| 12,265 |
|
| Gross margin |
|
| 6,919 |
|
|
| 6,742 |
|
|
| 6,939 |
|
| Operating expenses: |
|
|
|
|
|
|
|
|
|
|
|
|
| Selling, general and administrative |
|
| 4,512 |
|
|
| 4,435 |
|
|
| 4,452 |
|
| Depreciation and amortization |
|
| 991 |
|
|
| 938 |
|
|
| 934 |
|
| Impairments, store closing and other costs |
|
| — |
|
|
| 186 |
|
|
| — |
|
| Operating income |
|
| 1,416 |
|
|
| 1,183 |
|
|
| 1,553 |
|
| Interest expense, net |
|
| 299 |
|
|
| 308 |
|
|
| 327 |
|
| Loss on extinguishment of debt |
|
| — |
|
|
| — |
|
|
| 169 |
|
| Income before income taxes |
|
| 1,117 |
|
|
| 875 |
|
|
| 1,057 |
|
| Provision for income taxes |
|
| 258 |
|
|
| 319 |
|
|
| 384 |
|
| Net income |
| $ | 859 |
|
| $ | 556 |
|
| $ | 673 |
|
| Net income per share: |
|
|
|
|
|
|
|
|
|
|
|
|
| Basic |
| $ | 5.14 |
|
| $ | 3.12 |
|
| $ | 3.48 |
|
| Diluted |
| $ | 5.12 |
|
| $ | 3.11 |
|
| $ | 3.46 |
|
See accompanying Notes to Consolidated Financial Statements
F-4
CONSOLIDATED STATEMENTS OF CHANGES IN SHAREHOLDERS’ EQUITY
|
|
| Common Stock |
|
|
|
|
|
| Treasury Stock |
|
| Accumulated Other |
|
|
|
|
|
|
|
|
| |||||||||||
| (Dollars in Millions, Except per Share Data) |
| Shares |
|
| Amount |
|
| Paid-In Capital |
|
| Shares |
|
| Amount |
|
| Comprehensive Loss (a) |
|
| Retained Earnings |
|
| Total |
| ||||||||
| Balance at January 31, 2015 |
|
| 367 |
|
| $ | 4 |
|
| $ | 2,743 |
|
|
| (166 | ) |
| $ | (8,744 | ) |
| $ | (20 | ) |
| $ | 12,008 |
|
| $ | 5,991 |
|
| Comprehensive income |
|
| — |
|
|
| — |
|
|
| — |
|
|
| — |
|
|
| — |
|
|
| 3 |
|
|
| 673 |
|
|
| 676 |
|
| Stock options and awards, net of tax |
|
| 3 |
|
|
| — |
|
|
| 201 |
|
|
| (1 | ) |
|
| (27 | ) |
|
| — |
|
|
| — |
|
|
| 174 |
|
| Dividends paid ($1.80 per common share) |
|
| — |
|
|
| — |
|
|
| — |
|
|
| — |
|
|
| 3 |
|
|
| — |
|
|
| (352 | ) |
|
| (349 | ) |
| Treasury stock purchases |
|
| — |
|
|
| — |
|
|
| — |
|
|
| (17 | ) |
|
| (1,001 | ) |
|
| — |
|
|
| — |
|
|
| (1,001 | ) |
| Balance at January 30, 2016 |
|
| 370 |
|
|
| 4 |
|
|
| 2,944 |
|
|
| (184 | ) |
|
| (9,769 | ) |
|
| (17 | ) |
|
| 12,329 |
|
|
| 5,491 |
|
| Comprehensive income |
|
| — |
|
|
| — |
|
|
| — |
|
|
| — |
|
|
| — |
|
|
| 3 |
|
|
| 556 |
|
|
| 559 |
|
| Stock options and awards, net of tax |
|
| 1 |
|
|
| — |
|
|
| 59 |
|
|
| — |
|
|
| (17 | ) |
|
| — |
|
|
| — |
|
|
| 42 |
|
| Dividends paid ($2.00 per common share) |
|
| — |
|
|
| — |
|
|
| — |
|
|
| — |
|
|
| 5 |
|
|
| — |
|
|
| (363 | ) |
|
| (358 | ) |
| Treasury stock purchases |
|
| — |
|
|
| — |
|
|
| — |
|
|
| (13 | ) |
|
| (557 | ) |
|
| — |
|
|
| — |
|
|
| (557 | ) |
| Balance at January 28, 2017 |
|
| 371 |
|
| $ | 4 |
|
| $ | 3,003 |
|
|
| (197 | ) |
| $ | (10,338 | ) |
| $ | (14 | ) |
| $ | 12,522 |
|
| $ | 5,177 |
|
| Comprehensive income |
|
| — |
|
|
| — |
|
|
| — |
|
|
| — |
|
|
| — |
|
|
| 3 |
|
|
| 859 |
|
|
| 862 |
|
| Stock options and awards, net of tax |
|
| 2 |
|
|
| — |
|
|
| 75 |
|
|
| — |
|
|
| (14 | ) |
|
| — |
|
|
| — |
|
|
| 61 |
|
| Dividends paid ($2.20 per common share) |
|
| — |
|
|
| — |
|
|
| — |
|
|
| — |
|
|
| 7 |
|
|
| — |
|
|
| (375 | ) |
|
| (368 | ) |
| Treasury stock purchases |
|
| — |
|
|
| — |
|
|
| — |
|
|
| (8 | ) |
|
| (306 | ) |
|
| — |
|
|
| — |
|
|
| (306 | ) |
| Balance at February 3, 2018 |
|
| 373 |
|
| $ | 4 |
|
| $ | 3,078 |
|
|
| (205 | ) |
| $ | (10,651 | ) |
| $ | (11 | ) |
| $ | 13,006 |
|
| $ | 5,426 |
|
|
|
See accompanying Notes to Consolidated Financial Statements
F-5
CONSOLIDATED STATEMENTS OF CASH FLOWS
| (Dollars in Millions) | 2017 | 2016 | 2015 | |||||||||
| Operating activities |
|
|
|
|
|
|
|
|
|
|
|
|
| Net income |
| $ | 859 |
|
| $ | 556 |
|
| $ | 673 |
|
| Adjustments to reconcile net income to net cash provided by operating activities: |
|
|
|
|
|
|
|
|
|
|
|
|
| Depreciation and amortization |
|
| 991 |
|
|
| 938 |
|
|
| 934 |
|
| Share-based compensation |
|
| 55 |
|
|
| 41 |
|
|
| 48 |
|
| Deferred income taxes |
|
| (61 | ) |
|
| 13 |
|
|
| (38 | ) |
| Other non-cash expenses, net |
|
| 2 |
|
|
| 30 |
|
|
| 24 |
|
| Impairments, store closing and other costs |
|
| — |
|
|
| 57 |
|
|
| — |
|
| Loss on extinguishment of debt |
|
| — |
|
|
| — |
|
|
| 169 |
|
| Changes in operating assets and liabilities: |
|
|
|
|
|
|
|
|
|
|
|
|
| Merchandise inventories |
|
| 264 |
|
|
| 249 |
|
|
| (215 | ) |
| Other current and long-term assets |
|
| (83 | ) |
|
| (45 | ) |
|
| 43 |
|
| Accounts payable |
|
| (236 | ) |
|
| 256 |
|
|
| (260 | ) |
| Accrued and other long-term liabilities |
|
| (50 | ) |
|
| 81 |
|
|
| 53 |
|
| Income taxes |
|
| (50 | ) |
|
| (23 | ) |
|
| 53 |
|
| Net cash provided by operating activities |
|
| 1,691 |
|
|
| 2,153 |
|
|
| 1,484 |
|
| Investing activities |
|
|
|
|
|
|
|
|
|
|
|
|
| Acquisition of property and equipment |
|
| (672 | ) |
|
| (768 | ) |
|
| (690 | ) |
| Other |
|
| 23 |
|
|
| 12 |
|
|
| 9 |
|
| Net cash used in investing activities |
|
| (649 | ) |
|
| (756 | ) |
|
| (681 | ) |
| Financing activities |
|
|
|
|
|
|
|
|
|
|
|
|
| Treasury stock purchases |
|
| (306 | ) |
|
| (557 | ) |
|
| (1,001 | ) |
| Shares withheld for taxes on vested restricted shares |
|
| (14 | ) |
|
| (17 | ) |
|
| (27 | ) |
| Dividends paid |
|
| (368 | ) |
|
| (358 | ) |
|
| (349 | ) |
| Debt refinancing, net |
|
| — |
|
|
| — |
|
|
| (160 | ) |
| Capital lease and financing obligation payments |
|
| (138 | ) |
|
| (127 | ) |
|
| (114 | ) |
| Proceeds from stock option exercises |
|
| 18 |
|
|
| 18 |
|
|
| 147 |
|
| Proceeds from financing obligations |
|
| — |
|
|
| 11 |
|
|
| 1 |
|
| Net cash used in financing activities |
|
| (808 | ) |
|
| (1,030 | ) |
|
| (1,503 | ) |
| Net increase (decrease) in cash and cash equivalents |
|
| 234 |
|
|
| 367 |
|
|
| (700 | ) |
| Cash and cash equivalents at beginning of period |
|
| 1,074 |
|
|
| 707 |
|
|
| 1,407 |
|
| Cash and cash equivalents at end of period |
| $ | 1,308 |
|
| $ | 1,074 |
|
| $ | 707 |
|
| Supplemental information |
|
|
|
|
|
|
|
|
|
|
|
|
| Interest paid, net of capitalized interest |
| $ | 297 |
|
| $ | 299 |
|
| $ | 318 |
|
| Income taxes paid |
|
| 272 |
|
|
| 314 |
|
|
| 372 |
|
| Non-cash investing and financing activities |
|
|
|
|
|
|
|
|
|
|
|
|
| Property and equipment acquired through additional liabilities |
| $ | 42 |
|
| $ | 54 |
|
| $ | 63 |
|
See accompanying Notes to Consolidated Financial Statements
F-6
KOHL’S CORPORATION
NOTES TO CONSOLIDATED FINANCIAL STATEMENTS
1. Business and Summary of Accounting Policies
Business
As of February 3, 2018, we operated 1,158 department stores, a website (www.Kohls.com), 12 FILA outlets, and four Off-Aisle clearance centers. Our Kohl's stores and website sell moderately-priced proprietary and national brand apparel, footwear, accessories, beauty and home products. Our Kohl's stores generally carry a consistent merchandise assortment with some differences attributable to local preferences. Our website includes merchandise which is available in our stores, as well as merchandise which is available only online.
Our authorized capital stock consists of 800 million shares of $0.01 par value common stock and 10 million shares of $0.01 par value preferred stock.
Consolidation
The consolidated financial statements include the accounts of Kohl’s Corporation and its subsidiaries including Kohl’s Department Stores, Inc., its primary operating company. All intercompany accounts and transactions have been eliminated.
Accounting Period
Our fiscal year ends on the Saturday closest to January 31st each year. Unless otherwise stated, references to years in this report relate to fiscal years rather than to calendar years. The following fiscal periods are presented in this report.
Fiscal year |
| Ended |
| Number of Weeks |
| |
2017 |
| February 3, 2018 |
|
| 53 |
|
2016 |
| January 28, 2017 |
|
| 52 |
|
2015 |
| January 30, 2016 |
|
| 52 |
|
Use of Estimates
The preparation of consolidated financial statements in conformity with accounting principles generally accepted in the United States requires management to make estimates and assumptions that affect the amounts reported in the consolidated financial statements and accompanying notes. Actual results could differ from those estimates.
Cash and Cash Equivalents
In addition to money market investments, cash equivalents include commercial paper and certificates of deposit with original maturities of three months or less. We carry these investments at cost which approximates fair value.
Also included in cash and cash equivalents are amounts due from credit card transactions with settlement terms of less than five days. Credit and debit card receivables included within cash were $83 million at February 3, 2018 and $81 million at January 28, 2017.
F-7
KOHL’S CORPORATION
NOTES TO CONSOLIDATED FINANCIAL STATEMENTS—(Continued)
Merchandise inventories are valued at the lower of cost or market with cost determined on the first-in, first-out (“FIFO”) basis using the retail inventory method (“RIM”). Under RIM, the valuation of inventory at cost and the resulting gross margins are calculated by applying a cost-to-retail ratio to the retail value inventory. RIM is an averaging method that has been widely used in the retail industry due to its practicality. The use of RIM will result in inventory being valued at the lower of cost or market since permanent markdowns are currently taken as a reduction of the retail value of inventory. We would record an additional reserve if the future estimated selling price is less than cost.
Property and Equipment
Property and equipment consist of the following:
| (Dollars in Millions) | Feb 3, 2018 |
| Jan 28, 2017 |
| ||||
| Land |
| $ | 1,115 |
|
| $ | 1,118 |
|
| Buildings and improvements: |
|
|
|
|
|
|
|
|
| Owned |
|
| 8,062 |
|
|
| 8,004 |
|
| Leased |
|
| 1,813 |
|
|
| 1,801 |
|
| Fixtures and equipment |
|
| 1,700 |
|
|
| 1,711 |
|
| Information technology |
|
| 2,337 |
|
|
| 1,939 |
|
| Construction in progress |
|
| 152 |
|
|
| 318 |
|
| Total property and equipment, at cost |
|
| 15,179 |
|
|
| 14,891 |
|
| Less accumulated depreciation and amortization |
|
| (7,406 | ) |
|
| (6,788 | ) |
| Property and equipment, net |
| $ | 7,773 |
|
| $ | 8,103 |
|
Construction in progress includes property and equipment which is not ready for its intended use.
Property and equipment is recorded at cost, less accumulated depreciation. Depreciation is calculated using the straight-line method over the estimated useful lives of the assets. Leased property and improvements to leased property are amortized on a straight-line basis over the term of the lease or useful life of the asset, whichever is less.
The annual provisions for depreciation and amortization generally use the following ranges of useful lives:
|
| |
|
| |
|
|
Store Closure and Restructure Reserve
The following table summarizes changes in the store closure and restructure reserve during 2017:
| (Dollars in Millions) |
| Store Lease Obligations |
|
| Severance |
|
| Total |
| |||
| Balance - January 28, 2017 |
| $ | 103 |
|
| $ | 3 |
|
| $ | 106 |
|
| Payments |
|
| (10 | ) |
|
| (3 | ) |
|
| (13 | ) |
| Reversals |
|
| (6 | ) |
|
| — |
|
|
| (6 | ) |
| Balance - February 3, 2018 |
| $ | 87 |
|
| $ | — |
|
| $ | 87 |
|
F-8
KOHL’S CORPORATION
NOTES TO CONSOLIDATED FINANCIAL STATEMENTS—(Continued)
All property and equipment and other long-lived assets are reviewed for potential impairment when events or changes in circumstances indicate that the asset’s carrying value may not be recoverable. If such indicators are present, it is determined whether the sum of the estimated undiscounted future cash flows attributable to such assets is less than the carrying value of the assets. A potential impairment has occurred if projected future undiscounted cash flows are less than the carrying value of the assets. No material impairments were recorded in 2017 or 2015 as a result of the tests performed. An impairment relating to store closures was recorded in 2016.
Accrued Liabilities
Accrued liabilities consist of the following:
| (Dollars in Millions) |
| Feb 3, 2018 |
|
| Jan 28, 2017 |
| ||
| Gift cards and merchandise return cards |
| $ | 330 |
|
| $ | 329 |
|
| Sales, property and use taxes |
|
| 151 |
|
|
| 183 |
|
| Payroll and related fringe benefits |
|
| 173 |
|
|
| 147 |
|
| Credit card liabilities |
|
| 125 |
|
|
| 67 |
|
| Other |
|
| 376 |
|
|
| 498 |
|
| Accrued liabilities |
| $ | 1,155 |
|
| $ | 1,224 |
|
Self-Insurance
We use a combination of insurance and self-insurance for a number of risks.
We retain the initial risk of $500,000 per occurrence in workers’ compensation claims and $250,000 per occurrence in general liability claims. We record reserves for workers’ compensation and general liability claims which include the total amounts that we expect to pay for a fully developed loss and related expenses, such as fees paid to attorneys, experts and investigators.
We are fully self-insured for employee-related health care benefits, a portion of which is paid by our associates.
We use a third-party actuary to estimate the liabilities associated with workers’ compensation, general liability and employee-related health care risks. These liabilities include amounts for both reported claims and incurred, but not reported losses. Total liabilities for these risks were $53 million as of February 2, 2018 and $65 million as of January 28, 2017.
Our self-insured retention for property losses differs based on the type of claim. For catastrophic claims such as earthquakes, floods and windstorms, the retained amount varies from 2 - 5% of the insurance claim. For other standard claims, such as fire and building damages, we are self-insured for the first $250,000 per occurrence of the property loss.
Treasury Stock
We account for repurchases of common stock and shares withheld in lieu of taxes when restricted stock vests using the cost method with common stock in treasury classified in the Consolidated Balance Sheets as a reduction of shareholders’ equity.
F-9
KOHL’S CORPORATION
NOTES TO CONSOLIDATED FINANCIAL STATEMENTS—(Continued)
The tax effects of interest rate derivatives included in other comprehensive income are as follows:
| (Dollars in Millions) |
| 2017 |
|
| 2016 |
|
| 2015 |
| |||
| Before-tax amounts |
| $ | 5 |
|
| $ | 5 |
|
| $ | 5 |
|
| Tax expense |
|
| (2 | ) |
|
| (2 | ) |
|
| (2 | ) |
| After-tax amounts |
| $ | 3 |
|
| $ | 3 |
|
| $ | 3 |
|
Revenue Recognition
Revenue from the sale of merchandise is recognized when received by the customer, net of any returns. Net sales do not include sales tax as we are considered a pass-through conduit for collecting and remitting sales taxes.
Revenue from Kohl's gift card sales is recognized upon gift card redemption. Income from unredeemed cards (breakage) is recorded in proportion and over the time period gift cards are actually redeemed.
Cost of Merchandise Sold and Selling, General and Administrative Expenses
The following table illustrates the primary costs classified in Cost of Merchandise Sold and Selling, General and Administrative Expenses:
|
|
|
|
The classification of these expenses varies across the retail industry.
Vendor Allowances
We receive consideration for a variety of vendor-sponsored programs, such as markdown allowances, volume rebates, and promotion and marketing support. The vendor consideration is recorded as earned either as a reduction of inventory costs or Selling, General and Administrative Expenses. Promotional and marketing allowances are intended to offset our marketing costs to promote vendors’ merchandise. Markdown allowances and volume rebates are recorded as a reduction of inventory costs.
F-10
KOHL’S CORPORATION
NOTES TO CONSOLIDATED FINANCIAL STATEMENTS—(Continued)
We maintain programs in which customers earn rewards, which can be applied to future purchases, based on their spending and other promotional activities. We accrue the cost of anticipated redemptions related to the programs when the rewards are earned on the initial purchase. The costs of the programs are recorded in Cost of Merchandise Sold.
Fair Value
Fair value measurements are required to be classified and disclosed in one of the following pricing categories:
|
| |
|
| |
|
| |
Current assets and liabilities are reported at cost, which approximate fair value.
Leases
We lease certain property and equipment used in our operations.
We are often involved extensively in the construction of leased stores. In many cases, we are responsible for construction cost over runs or non-standard tenant improvements (e.g. roof or HVAC systems). As a result of this involvement, we are deemed the “owner” for accounting purposes during the construction period, so are required to capitalize the construction costs on our Balance Sheet. Upon completion of the project, we perform a sale-leaseback analysis to determine if we can remove the assets from our Balance Sheet. In many of our leases, we are reimbursed a portion of the construction costs via adjusted rental payments and/or cash payments or have terms which fix the rental payments for a significant percentage of the leased asset’s economic life. These items generally are considered “continuing involvement” which precludes us from derecognizing the assets from our Balance Sheet when construction is complete. In conjunction with these leases, we also record financing obligations equal to the cash proceeds or fair market value of the assets received from the landlord. At the end of the lease term, including exercise of any renewal options, the net remaining financing obligation over the net carrying value of the fixed asset will be recognized as a non-cash gain on sale of the property. We do not report rent expense for the properties which are owned for accounting purposes. Rather, rental payments under the lease are recognized as a reduction of the financing obligation and interest expense.
Some of our leased property and equipment are recorded as capital leases. These assets are included in property and equipment and depreciated over the term of the lease. We do not report rent expense for capital leases. Rather, rental payments under the lease are recognized as a reduction of the capital lease obligation and interest expense.
All other leases are considered operating leases. Assets subject to an operating lease and the related lease payments are not recorded on our Balance Sheet. Rent expense is recognized on a straight-line basis over the expected lease term.
F-11
KOHL’S CORPORATION
NOTES TO CONSOLIDATED FINANCIAL STATEMENTS—(Continued)
The lease term for all types of leases begins on the date we become legally obligated for the rent payments or we take possession of the building or land, whichever is earlier. The lease term includes cancelable option periods where failure to exercise such options would result in an economic penalty. Failure to exercise such options would result in the recognition of accelerated depreciation expense of the related assets.
Marketing
Marketing costs are expensed when the marketing is first seen. Marketing costs, net of related vendor allowances, are as follows:
| (Dollars in Millions) | 2017 | 2016 | 2015 | |||||||||||
| Gross marketing costs |
| $ | 1,124 |
|
|
| $ | 1,164 |
|
|
| $ | 1,171 |
|
| Vendor allowances |
|
| (138 | ) |
|
|
| (148 | ) |
|
|
| (160 | ) |
| Net marketing costs |
| $ | 986 |
|
|
| $ | 1,016 |
|
|
| $ | 1,011 |
|
| Net marketing costs as a percent of net sales |
|
| 5.2 | % |
|
|
| 5.4 | % |
|
|
| 5.3 | % |
Income Taxes
Income taxes are accounted for under the asset and liability method. Under this method, deferred tax assets and liabilities are recorded based on differences between the amounts of assets and liabilities recognized for financial reporting purposes and such amounts recognized for income tax purposes. Deferred tax assets and liabilities are calculated using the enacted tax rates and laws that are expected to be in effect when the differences are expected to reverse. We establish valuation allowances for deferred tax assets when we believe it is more likely than not that the asset will not be realizable for tax purposes. We recognize interest and penalty expense related to unrecognized tax benefits in our provision for income tax expense.
Net Income Per Share
Basic net income per share is net income divided by the average number of common shares outstanding during the period. Diluted net income per share includes incremental shares assumed for share-based awards.
The information required to compute basic and diluted net income per share is as follows:
| (Dollars in Millions, Except per Share Data) |
| 2017 |
|
| 2016 |
|
| 2015 |
| |||
| Numerator—net income |
| $ | 859 |
|
| $ | 556 |
|
| $ | 673 |
|
| Denominator—weighted average shares |
|
|
|
|
|
|
|
|
|
|
|
|
| Basic |
|
| 167 |
|
|
| 178 |
|
|
| 193 |
|
| Impact of dilutive share-based awards (a) |
|
| 1 |
|
|
| 1 |
|
|
| 2 |
|
| Diluted |
|
| 168 |
|
|
| 179 |
|
|
| 195 |
|
| Net income per share: |
|
|
|
|
|
|
|
|
|
|
|
|
| Basic |
| $ | 5.14 |
|
| $ | 3.12 |
|
| $ | 3.48 |
|
| Diluted |
| $ | 5.12 |
|
| $ | 3.11 |
|
| $ | 3.46 |
|
|
|
Share-Based Awards
Stock-based compensation expense is generally recognized on a straight-line basis over the vesting period based on the fair value of awards which are expected to vest. The fair value of all share-based awards is estimated on the date of grant.
F-12
KOHL’S CORPORATION
NOTES TO CONSOLIDATED FINANCIAL STATEMENTS—(Continued)
Recent Accounting Pronouncements
The following table provides a brief description of issued, but not yet effective, accounting standards:
|
|
|
|
|
|
|
|
|
Long-term debt includes the following unsecured senior debt as of February 3, 2018 and January 28, 2017:
| Maturity (Dollars in Millions) |
Effective Rate |
| Coupon Rate | Outstanding | ||||||||
| 2021 |
|
| 4.81 | % |
|
| 4.00 | % |
| $ | 650 |
|
| 2023 |
|
| 3.25 | % |
|
| 3.25 | % |
|
| 350 |
|
| 2023 |
|
| 4.78 | % |
|
| 4.75 | % |
|
| 300 |
|
| 2025 |
|
| 4.25 | % |
|
| 4.25 | % |
|
| 650 |
|
| 2029 |
|
| 7.36 | % |
|
| 7.25 | % |
|
| 99 |
|
| 2033 |
|
| 6.05 | % |
|
| 6.00 | % |
|
| 166 |
|
| 2037 |
|
| 6.89 | % |
|
| 6.88 | % |
|
| 150 |
|
| 2045 |
|
| 5.57 | % |
|
| 5.55 | % |
|
| 450 |
|
|
|
|
| 4.88 | % |
|
|
|
|
| $ | 2,815 |
|
Long-term debt is net of unamortized debt discounts and deferred financing costs of $18 million at February 3, 2018 and $20 million at January 28, 2017.
F-13
KOHL’S CORPORATION
NOTES TO CONSOLIDATED FINANCIAL STATEMENTS—(Continued)
Our long-term debt is classified as Level 1, financial instruments with unadjusted, quoted prices listed on active market exchanges. The estimated fair value of our long-term debt was $2.9 billion at February 3, 2018 and $2.7 billion at January 28, 2017.
On November 3, 2017, we amended and restated our existing $1.0 billion senior unsecured five-year revolving credit facility with various lenders that matures in November 2022. Among other things, the agreement includes a maximum leverage ratio financial covenant (which is consistent with the ratio under our prior credit agreement) and restrictions on liens and subsidiary indebtedness.
Our various debt agreements contain covenants including limitations on additional indebtedness and certain financial tests. As of February 3, 2018, we were in compliance with all covenants of the various debt agreements.
We also had outstanding trade letters of credit totaling approximately $48 million at February 3, 2018 issued under uncommitted lines with two banks.
Rent expense charged to operations was $293 million for 2017, $276 million for 2016, and $279 million for 2015. In addition to rent payments, we are often required to pay real estate taxes, insurance and maintenance costs on leased properties. These items are not included in the future minimum lease payments listed below. Many store leases include multiple renewal options, exercisable at our option, that generally range from four to eight additional five-year periods.
Future minimum lease payments at February 3, 2018 were as follows:
| (Dollars in Millions) |
| Capital Lease and Financing Obligations |
|
| Operating Leases |
| ||
| Fiscal year: |
|
|
|
|
|
|
|
|
| 2018 |
| $ | 273 |
|
| $ | 259 |
|
| 2019 |
|
| 264 |
|
|
| 256 |
|
| 2020 |
|
| 247 |
|
|
| 252 |
|
| 2021 |
|
| 230 |
|
|
| 247 |
|
| 2022 |
|
| 207 |
|
|
| 236 |
|
| Thereafter |
|
| 2,183 |
|
|
| 3,873 |
|
|
|
|
| 3,404 |
|
| $ | 5,123 |
|
| Non-cash gain on future sale of property |
|
| 474 |
|
|
|
|
|
| Amount representing interest |
|
| (2,161 | ) |
|
|
|
|
| Present value of lease payments |
| $ | 1,717 |
|
|
|
|
|
We have a defined contribution savings plan covering all full-time and certain part-time associates. Participants in this plan may invest up to 99% of their base compensation, subject to certain statutory limits. We match 100% of the first 5% of each participant’s contribution, subject to certain statutory limits.
We also offer a non-qualified deferred compensation plan to a group of executives which provides for pre-tax compensation deferrals up to 75% of salary and 100% of bonus. Deferrals and credited investment returns are 100% vested.
The total costs for these benefit plans were $49 million for 2017, $47 million for 2016, and $49 million for 2015.
F-14
KOHL’S CORPORATION
NOTES TO CONSOLIDATED FINANCIAL STATEMENTS—(Continued)
Deferred income taxes consist of the following:
| (Dollars in Millions) |
| Feb 3, 2018 |
| Jan 28, 2017 | ||||
| Deferred tax liabilities: |
|
|
|
|
|
|
|
|
| Property and equipment |
| $ | 788 |
|
| $ | 1,226 |
|
| Merchandise inventories |
|
| 63 |
|
|
| 95 |
|
| Total deferred tax liabilities |
|
| 851 |
|
|
| 1,321 |
|
| Deferred tax assets: |
|
|
|
|
|
|
|
|
| Capital lease and financing obligations |
|
| 445 |
|
|
| 711 |
|
| Accrued and other liabilities, including stock-based compensation |
|
| 106 |
|
|
| 194 |
|
| Accrued step rent liability |
|
| 76 |
|
|
| 111 |
|
| Federal benefit on state tax reserves |
|
| 30 |
|
|
| 47 |
|
| Unrealized loss on interest rate swap |
|
| 5 |
|
|
| 9 |
|
| Merchandise inventories |
|
| — |
|
|
| — |
|
| Total deferred tax assets |
|
| 662 |
|
|
| 1,072 |
|
| Net deferred tax liability |
| $ | 189 |
|
| $ | 249 |
|
Deferred tax assets included in other long-term assets totaled $24 million as of February 3, 2018 and $23 million as of January 28, 2017.
The components of the provision for income taxes were as follows:
| (Dollars in Millions) |
| 2017 |
|
| 2016 |
|
| 2015 |
| |||
| Current federal |
| $ | 299 |
|
| $ | 272 |
|
| $ | 397 |
|
| Current state |
|
| 26 |
|
|
| 25 |
|
|
| 34 |
|
| Deferred federal |
|
| (86 | ) |
|
| 16 |
|
|
| (35 | ) |
| Deferred state |
|
| 19 |
|
|
| 6 |
|
|
| (12 | ) |
| Provision for income taxes |
| $ | 258 |
|
| $ | 319 |
|
| $ | 384 |
|
On December 22, 2017, H.R. 1, originally the Tax Cuts & Jobs Act (“the Act”), was signed into law making significant changes to the Internal Revenue Code. Changes include a corporate rate decrease from 35% to 21%, effective January 1, 2018, as well as a variety of other changes including the acceleration of expensing of certain business assets and reductions in the amount of executive pay that could qualify as a tax deduction.
On December 22, 2017, Staff Accounting Bulletin No. 118 (“SAB 118”) was issued to address the application of U.S. GAAP in situations when a registrant does not have the necessary information available, prepared or analyzed in reasonable detail to complete the accounting for certain income tax effects of the Act. For matters that have not been completed, provisional amounts are recorded to the extent they can be reasonably estimated.
We have calculated our best estimate of the impact of the Act in our year end income tax provision in accordance with our understanding of the Act and guidance available as of the date of this filing. For 2017, the reduction in the tax rate is prorated, resulting in a current year statutory federal tax rate of 33.7%. The provisional amount related to the current year federal tax rate reduction and the re-measurement of our deferred tax assets and liabilities is recorded as a total tax benefit of $136 million. This estimate may be impacted as we further analyze available tax accounting methods and elections, state tax conformity to the federal tax changes and guidance issued by regulatory bodies that provide interpretive guidance of the Act.
F-15
KOHL’S CORPORATION
NOTES TO CONSOLIDATED FINANCIAL STATEMENTS—(Continued)
The effective tax rate differs from the amount that would be provided by applying the statutory U.S. corporate tax rate due to the following items:
|
|
| 2017 |
|
|
| 2016 |
|
|
| 2015 |
|
| |||
| Federal statutory rate |
|
| 33.7 | % |
|
|
| 35.0 | % |
|
|
| 35.0 | % |
|
| State income taxes, net of federal tax benefit |
|
| 1.0 |
|
|
|
| 2.4 |
|
|
|
| 2.1 |
|
|
| Re-measurement of deferred tax assets and liabilities |
|
| (10.9 | ) |
|
|
| — |
|
|
|
| — |
|
|
| Other federal tax credits |
|
| (0.7 | ) |
|
|
| (0.9 | ) |
|
|
| (0.8 | ) |
|
| Effective tax rate |
|
| 23.1 | % |
|
|
| 36.5 | % |
|
|
| 36.3 | % |
|
The re-measurement of deferred tax assets and liabilities above includes the following impacts:
Revaluation of deferred taxes that existed on December 22, 2017, the enactment date of the Act65
Deferred taxes that were created after December 22, 2017. These items were deducted at the federal statutory rate of 33.7%, but will reverse at the newly enacted 21% rate.
We have analyzed filing positions in all of the federal and state jurisdictions where we are required to file income tax returns, as well as all open tax years in these jurisdictions. The federal returns subject to examination are for the 2008 through 2017 tax years. State returns subject to examination vary depending upon the state. Generally, the 2014 through 2017 tax years are subject to state examination. The earliest state open period is 2006. Certain states have proposed adjustments which we are currently appealing. If we do not prevail on our appeals, we do not anticipate that the adjustments would result in a material change in our financial position.
During 2017, we resolved a significant state tax dispute. The resolution relates to fiscal years 2003 through 2012. As a result of the settlement, we recorded a $30 million pre-tax benefit in 2017.
A reconciliation of the beginning and ending gross amount of unrecognized tax benefits is as follows:
| (Dollars in Millions) |
| 2017 |
|
| 2016 |
| ||
| Balance at beginning of year |
| $ | 149 |
|
| $ | 139 |
|
| Increases due to: |
|
|
|
|
|
|
|
|
| Tax positions taken in prior years |
|
| — |
|
|
| 3 |
|
| Tax positions taken in current year |
|
| 18 |
|
|
| 15 |
|
| Decreases due to: |
|
|
|
|
|
|
|
|
| Tax positions taken in prior years |
|
| (13 | ) |
|
| — |
|
| Settlements with taxing authorities |
|
| (16 | ) |
|
| (6 | ) |
| Lapse of applicable statute of limitations |
|
| (3 | ) |
|
| (2 | ) |
| Balance at end of year |
| $ | 135 |
|
| $ | 149 |
|
Not included in the unrecognized tax benefits reconciliation above are gross unrecognized accrued interest and penalties of $33 million at February 3, 2018 and $29 million at January 28, 2017. We had interest and penalty expense of $4 million for 2017, $6 million for 2016, and none for 2015.
Our total unrecognized tax benefits that, if recognized, would affect our effective tax rate were $112 million as of February 3, 2018 and $110 million as of January 28, 2017. It is reasonably possible that our unrecognized tax positions may change within the next 12 months, primarily as a result of ongoing audits. While it is possible that one or more of these examinations may be resolved in the next year, it is not anticipated that a significant impact to the unrecognized tax benefit balance will occur.
We have both payables and receivables for current income taxes recorded on our balance sheet. Receivables included in other current assets totaled $62 million as of February 3, 2018 and $27 million as of January 28, 2017.
F-16
KOHL’S CORPORATION
NOTES TO CONSOLIDATED FINANCIAL STATEMENTS—(Continued)
We currently grant share-based compensation pursuant to the Kohl’s Corporation 2017 Long-Term Compensation Plan, which provides for the granting of various forms of equity-based awards, including nonvested stock, performance share units and options to purchase shares of our common stock, to officers, key employees and directors. As of February 3, 2018, there were 9.0 million shares authorized and 9.1 million shares available for grant under the 2017 Long-Term Compensation Plan. Options and nonvested stock that are surrendered or terminated without issuance of shares are available for future grants. We also have outstanding options which were granted under previous compensation plans.
Annual grants are typically made in the first quarter of the fiscal year. Grants to newly-hired and promoted employees and other discretionary grants are made periodically throughout the remainder of the year.
Stock Options
The majority of stock options granted to employees vest in five equal annual installments. Outstanding options granted to employees after 2005 have a term of seven years. Outstanding options granted to employees prior to 2006 have a term of up to 15 years. Outstanding options granted to directors have a term of 10 years.
All stock options have an exercise price equal to the fair market value of the common stock on the date of grant. The fair value of each option award was estimated using a Black-Scholes option valuation model.
The following table summarizes our stock option activity:
|
|
| 2017 |
|
| 2016 |
|
| 2015 |
| |||||||||||||||
| (Shares in Thousands) |
| Shares |
|
| Weighted Average Exercise Price |
|
| Shares |
|
| Weighted Average Exercise Price |
|
| Shares |
|
| Weighted Average Exercise Price |
| ||||||
| Balance at beginning of year |
|
| 2,350 |
|
| $ | 53.29 |
|
|
| 3,076 |
|
| $ | 52.65 |
|
|
| 6,211 |
|
| $ | 52.95 |
|
| Exercised |
|
| (359 | ) |
|
| 50.94 |
|
|
| (410 | ) |
|
| 46.86 |
|
|
| (2,815 | ) |
|
| 52.79 |
|
| Forfeited/expired |
|
| (852 | ) |
|
| 58.00 |
|
|
| (316 | ) |
|
| 55.39 |
|
|
| (320 | ) |
|
| 57.36 |
|
| Balance at end of year |
|
| 1,139 |
|
| $ | 50.51 |
|
|
| 2,350 |
|
| $ | 53.29 |
|
|
| 3,076 |
|
| $ | 52.65 |
|
The intrinsic value of options exercised represents the excess of our stock price at the time the option was exercised over the exercise price and was $3 million in 2017, $2 million in 2016, $52 million in 2015.
Additional information related to stock options outstanding and exercisable at February 3, 2018, segregated by exercise price range, is summarized below:
| (Shares in Thousands) |
| Stock Options Outstanding |
|
| Stock Options Exercisable |
| ||||||||||||||||||
| Range of Exercise Prices |
| Shares |
|
| Weighted Average Remaining Contractual Life (in years) |
|
| Weighted Average Exercise Price |
|
| Shares |
|
| Weighted Average Remaining Contractual Life (in years) |
|
| Weighted Average Exercise Price |
| ||||||
| $ 41.24 – $ 50.00 |
|
| 561 |
|
|
| 1.5 |
|
| $ | 47.73 |
|
|
| 524 |
|
|
| 1.5 |
|
| $ | 47.81 |
|
| $ 50.01 – $ 64.49 |
|
| 578 |
|
|
| 1.0 |
|
|
| 53.21 |
|
|
| 520 |
|
|
| 0.8 |
|
|
| 53.16 |
|
| Balance at end of year |
|
| 1,139 |
|
|
| 1.3 |
|
| $ | 50.51 |
|
|
| 1,044 |
|
|
| 1.1 |
|
| $ | 50.47 |
|
| Intrinsic value (in thousands) |
| $ | 14,771 |
|
|
|
|
|
|
|
|
|
| $ | 13,575 |
|
|
|
|
|
|
|
|
|
The intrinsic value of outstanding and exercisable stock options represents the excess of our closing stock price on February 3, 2018 ($63.47) over the exercise price multiplied by the applicable number of stock options
F-17
KOHL’S CORPORATION
NOTES TO CONSOLIDATED FINANCIAL STATEMENTS—(Continued)
We have also awarded shares of nonvested common stock to eligible key employees and to our Board of Directors. Substantially all awards have restriction periods tied primarily to employment and/or service. Employee awards generally vest over five years. Director awards vest over the term to which the director was elected, generally one year. In lieu of cash dividends, holders of nonvested stock awards are granted restricted stock equivalents which vest consistently with the underlying nonvested stock awards.
The fair value of nonvested stock awards is the closing price of our common stock on the date of grant. We may acquire shares from employees in lieu of amounts required to satisfy minimum tax withholding requirements upon the vesting of the employee’s unvested stock award. Such shares are then designated as treasury shares.
The following table summarizes nonvested stock activity, including restricted stock equivalents issued in lieu of cash dividends:
|
|
| 2017 |
|
| 2016 |
|
| 2015 |
| |||||||||||||||
| (Shares in Thousands) |
| Shares |
|
| Weighted Average Grant Date Fair Value |
|
| Shares |
|
| Weighted Average Grant Date Fair Value |
|
| Shares |
|
| Weighted Average Grant Date Fair Value |
| ||||||
| Balance at beginning of year |
|
| 2,163 |
|
| $ | 52.75 |
|
|
| 2,211 |
|
| $ | 57.37 |
|
|
| 2,431 |
|
| $ | 52.29 |
|
| Granted |
|
| 1,624 |
|
|
| 39.69 |
|
|
| 1,128 |
|
|
| 46.61 |
|
|
| 955 |
|
|
| 65.02 |
|
| Vested |
|
| (772 | ) |
|
| 52.14 |
|
|
| (935 | ) |
|
| 55.54 |
|
|
| (957 | ) |
|
| 52.61 |
|
| Forfeited |
|
| (204 | ) |
|
| 59.58 |
|
|
| (241 | ) |
|
| 55.54 |
|
|
| (218 | ) |
|
| 55.16 |
|
| Balance at end of year |
|
| 2,811 |
|
| $ | 45.60 |
|
|
| 2,163 |
|
| $ | 52.75 |
|
|
| 2,211 |
|
| $ | 57.37 |
|
The aggregate fair value of awards at the time of vesting was $40 million in 2017, $52 million in 2016, and $50 million in 2015.
Performance Share Units
We grant performance-based restricted stock units ("performance share units") to certain executives. The performance measurement period for these performance share units is three fiscal years. The fair market value of the grants are determined using a Monte-Carlo valuation on the date of grant.
The actual number of shares which will be earned at the end of the three-year vesting periods will vary based on our cumulative financial performance over the vesting periods. The number of performance share units earned will be modified up or down based on Kohl’s Relative Total Shareholder Return against a defined peer group during the vesting periods. The payouts, if earned, will be settled in Kohl's common stock after the end of each multi-year performance periods.
The following table summarizes performance share unit activity by year of grant:
|
|
| 2017 |
|
| 2016 |
|
| 2015 |
| |||||||||||||||
| (Shares in Thousands) |
| Shares |
|
| Weighted Average Grant Date Fair Value |
|
| Shares |
|
| Weighted Average Grant Date Fair Value |
|
| Shares |
|
| Weighted Average Grant Date Fair Value |
| ||||||
| Balance at beginning of year |
|
| 512 |
|
| $ | 57.82 |
|
|
| 357 |
|
| $ | 63.58 |
|
|
| 221 |
|
| $ | 56.76 |
|
| Granted |
|
| 365 |
|
|
| 40.83 |
|
|
| 309 |
|
|
| 47.89 |
|
|
| 177 |
|
|
| 70.50 |
|
| Vested |
|
| (106 | ) |
|
| 57.58 |
|
|
| — |
|
|
| — |
|
|
| — |
|
|
| — |
|
| Forfeited |
|
| (111 | ) |
|
| 78.35 |
|
|
| (154 | ) |
|
| 59.74 |
|
|
| (41 | ) |
|
| 56.71 |
|
| Balance at end of year |
|
| 660 |
|
| $ | 44.97 |
|
|
| 512 |
|
| $ | 57.82 |
|
|
| 357 |
|
| $ | 63.58 |
|
F-18
KOHL’S CORPORATION
NOTES TO CONSOLIDATED FINANCIAL STATEMENTS—(Continued)
Stock-based compensation expense, other than that included in Impairments, store closing and other costs, is included in Selling, General and Administrative Expenses in our Consolidated Statements of Income. Stock-based compensation expense totaled $55 million for 2017, $44 million for 2016 and $48 million for 2015. At February 3, 2018, we had approximately $98 million of unrecognized share-based compensation expense, which is expected to be recognized over a weighted-average period of 1.5 years.
At any time, we may be subject to investigations, legal proceedings, or claims related to the on-going operation of our business, including claims both by and against us. Such proceedings typically involve claims related to various forms of liability, contract disputes, allegations of violations of laws or regulations or other actions brought by us or others including our employees, consumers, competitors, suppliers or governmental agencies. We routinely assess the likelihood of any adverse outcomes related to these matters on a case by case basis, as well as the potential ranges of losses and fees. We establish accruals for our potential exposure, as appropriate, for significant claims against us when losses become probable and reasonably estimable. Where we are able to reasonably estimate a range of potential losses relating to significant matters, we record the amount within that range that constitutes our best estimate. We also disclose the nature of and range of loss for claims against us when losses are reasonably possible and material. These accruals and disclosures are determined based on the facts and circumstances related to the individual cases and require estimates and judgments regarding the interpretation of facts and laws, as well as the effectiveness of strategies or other factors beyond our control.
8. Quarterly Financial Information (Unaudited)
|
|
| 2017 |
| |||||||||||||
| (Dollars and Shares in Millions, Except per Share Data) |
| First |
|
| Second |
|
| Third |
|
| Fourth |
| ||||
| Net sales |
| $ | 3,843 |
|
| $ | 4,144 |
|
| $ | 4,332 |
|
| $ | 6,776 |
|
| Gross margin |
| $ | 1,398 |
|
| $ | 1,633 |
|
| $ | 1,595 |
|
| $ | 2,293 |
|
| Selling, general and administrative expenses |
| $ | 975 |
|
| $ | 983 |
|
| $ | 1,095 |
|
| $ | 1,459 |
|
| Net income |
| $ | 66 |
|
| $ | 208 |
|
| $ | 117 |
|
| $ | 468 |
|
| Basic shares |
|
| 170 |
|
|
| 168 |
|
|
| 166 |
|
|
| 165 |
|
| Basic net income per share |
| $ | 0.39 |
|
| $ | 1.24 |
|
| $ | 0.70 |
|
| $ | 2.83 |
|
| Diluted shares |
|
| 171 |
|
|
| 168 |
|
|
| 166 |
|
|
| 167 |
|
| Diluted net income per share |
| $ | 0.39 |
|
| $ | 1.24 |
|
| $ | 0.70 |
|
| $ | 2.81 |
|
|
|
| 2016 |
| |||||||||||||
| (Dollars and Shares in Millions, Except per Share Data) |
| First |
|
| Second |
|
| Third |
|
| Fourth |
| ||||
| Net sales |
| $ | 3,972 |
|
| $ | 4,182 |
|
| $ | 4,327 |
|
| $ | 6,205 |
|
| Gross margin |
| $ | 1,412 |
|
| $ | 1,650 |
|
| $ | 1,607 |
|
| $ | 2,072 |
|
| Selling, general and administrative expenses |
| $ | 1,008 |
|
| $ | 986 |
|
| $ | 1,080 |
|
| $ | 1,360 |
|
| Impairments, store closing and other costs |
| $ | 64 |
|
| $ | 128 |
|
| $ | (6 | ) |
| $ | — |
|
| Net income |
| $ | 17 |
|
| $ | 140 |
|
| $ | 146 |
|
| $ | 252 |
|
| Basic shares |
|
| 183 |
|
|
| 180 |
|
|
| 177 |
|
|
| 174 |
|
| Basic net income per share |
| $ | 0.09 |
|
| $ | 0.77 |
|
| $ | 0.83 |
|
| $ | 1.45 |
|
| Diluted shares |
|
| 184 |
|
|
| 181 |
|
|
| 177 |
|
|
| 175 |
|
| Diluted net income per share |
| $ | 0.09 |
|
| $ | 0.77 |
|
| $ | 0.83 |
|
| $ | 1.44 |
|
Due to changes in stock prices during the year and timing of share repurchases and issuances, the sum of quarterly net income per share may not equal the annual net income per share.
F-19