Page | ||||
Item 1. |
| |||
Item 1A. |
| |||
Item 1B. |
| |||
Item |
| |||
Item |
| |||
Item |
| |||
Item 4. | 50 | |||
| ||||
Item 5. |
| |||
Item 6. |
| |||
Item 7. | Management’s Discussion and Analysis of Financial Condition and Results of Operations |
| ||
Item 7A. |
| |||
Item 8. |
| |||
Item 9. | Changes in and Disagreements With Accountants on Accounting and Financial Disclosure |
| ||
Item 9A. |
| |||
Item 9B. |
| |||
Item 9C. | Disclosure Regarding Foreign Jurisdictions that Prevent Inspections | 69 | ||
| ||||
Item 10. |
| |||
Item 11. |
| |||
Item 12. | Security Ownership of Certain Beneficial Owners and Management and Related Stockholder Matters |
| ||
Item 13. | Certain Relationships and Related Transactions, and Director Independence |
| ||
Item 14. |
| |||
Item 15. |
| |||
Item 16. |
| |||
| ||||
| ||||
| ||||
2
3
This Annual Report on Form 10-K contains forward-looking statements within the meaning of Section 27A of the Securities Act and Section 21E of the Exchange Act. The forward-looking statements are contained principally in, but not limited to, the sections titled “Business,” “Risk Factors,” and “Management’s Discussion and Analysis of Financial Condition and Results of Operations,” as well as elsewhere in this Annual Report on Form 10-K. Forward-looking statements are identified by the use of the words “would,” “could,” “will,” “may,” “expect,” “believe,” “should,” “anticipate,” “outlook,” “if,” “future,” “intend,” “plan,” “estimate,” “predict,” “potential,” “target,” “seek,” “continue,” “foreseeable” or “forecast” and similar words and phrases, including the negatives of these terms, or other variations of these terms, that denote future events. Forward-looking statements include, but are not limited to, information concerning our possible or assumed future results of operations, competitive position, industry environment, potential growth opportunities and the effects of competition, our product development strategy and areas of focus, our market opportunity, our ability to develop new solutions, including our ability to integrate and apply acquired technologies to our solutions, our future financial and operating performance, sales and marketing strategy, investment strategy and the results of our investments, research and development, customer and supplier relationships, inventory levels, customer demand and our ability to secure design wins, industry trends, our cash needs and capital requirements, and expectations about seasonality, taxes, and operating expenses. These statements reflect our current views with respect to future events and our potential financial performance and are subject to risks and uncertainties that could cause our actual results and financial position to differ materially and adversely from what is projected or implied in any forward-looking statements included in this Annual Report on Form 10-K.
Factors that could affect such forward-looking statements include, but are not limited to, risks associated with revenue being generated from new customers or design wins, neither of which is assured; our ability to retain and expand customer relationships and to achieve design wins; economic factors beyond our control, including risks associated with high inflation and recessionary concerns; geopolitical factors beyond our control, including tensions between the United States and China and the ongoing hostility between Russia and Ukraine; the potential impact of pandemics and endemics, such as the COVID-19 pandemic, on our operations or the operations of our supply chain or our customers; our ability to timely produce sufficient quantities of our products on a cost-effective basis through our third-party vendors; the commercial success of our customers’ products; our growth strategy; our ability to anticipate future market demands and future needs and preferences of our customers; our ability to introduce new and enhanced solutions;solutions, including our ability to license software modules; the expansion of our current markets and our ability to successfully enter new markets; anticipated trends and challenges, including competition, in the markets in which we operate; our expectations regarding the adoption of computer vision;vision technology; our ability to effectively generate and manage growth; our ability to retain key employees; the potential for intellectual property disputes or other litigation; the risks described under Item 1A of Part I—“Risk Factors,” Item 7 of Part II—“Management’s Discussion and Analysis of Financial Condition and Results of Operations,” and elsewhere in this Annual Report on Form 10-K; and those discussed in other documents we file with the Securities and Exchange Commission. You are cautioned not to place undue reliance on the forward-looking statements, which speak only as of the date of this Annual Report on Form 10-K. We have no obligation (and expressly disclaim any such obligation) to update or alter any forward-looking statements, whether as a result of new information or otherwise except as otherwise required by securities regulations.
For purposes of this Annual Report, the terms “Ambarella”, “the Company”, “we”, “us” and “our” refer to Ambarella, Inc. and its consolidated subsidiaries.
3
Overview
We areITEM 1. BUSINESS
Overview
Ambarella is a leading developer of semiconductorlow-power system-on-a-chip, or SoC, semiconductors and software for edge artificial intelligence, or AI, applications. Our technologies make electronic systems smarter, enabling features such as person detection, object classification, and analytics, in addition to performing complex data analysis in real time, delivering high quality imagery, and preserving vital system resources such as power and network bandwidth. We specialize in the development of deployable, scalable designs for intelligent electronic systems that utilize high-bandwidth sensors offering a proven path to mass production.
Incorporated in 2004, we have primarily served human-viewing applications with video and image processors for enterprise, public infrastructure and home applications, such as internet protocol, or IP, security cameras, sports cameras, wearables, aerial drones, and aftermarket automotive video recorders. We are now leveraging our human-viewing heritage to pursue the machine sensing market. Our recent development efforts have focused on creating advanced AI inference technology that enables edge devices to visually perceive the environment and make decisions based on the data collected from cameras and other types of sensors, such as 4D radar. This category of AI technology is known as computer vision (CV), or edge inference AI, and our AI inference SoCs integrate our state-of-the-art video processor technology together with our recently developed deep learning neural network processing solutionstechnology, which we refer to as CVflow®. The CVflow-architecture supports a variety of AI inference algorithms, including object detection, classification and tracking, semantic and instance segmentation, image processing, stereo object detection, and terrain mapping. Our latest third generation CVflow technology enables us to address incremental and computationally intense AI applications for videodeep fusion, deep planning, and large language models (LLMs), as well as to efficiently process transformer AI networks. In addition, CVflow can process other sensor modalities, including lidar, radar, time of flight, thermal and near infrared (NIR), and allows customers to differentiate their products by porting their own or third party neural networks and/or classical computer vision algorithms to our CVflow-based SoCs. Our AI technology is creating opportunities for us to address a broader range of markets and applications while also allowing us to capture more content per electronic system.
Our new CV3 AI central domain controller family of SoCs is specifically architected for automated driving applications. In addition to offering our existing advanced camera perception processing, CV3 adds sensor fusion and planning layers that enable high-definition, or HD, video capture, analysis, sharinga broader set of fully-automated devices. Our recently announced N1 SoC is capable of running LLM inferencing with models up to 34 billion parameters, enabling a range of AI applications in IoT devices, including industrial robotics, intelligent healthcare imaging and display. A device that captures video includes four primary components:diagnostics, edge AI servers running multi-modal LLMs, and autonomous fleet telematics.
In November 2021, we acquired Oculii Corp., a lens, an image sensor, a video processordeveloper of high definition radar technology. Oculii’s adaptive AI software algorithms are designed to enable radar perception using current production radar chips to achieve significantly higher resolution, longer range and storage memory. The video processor is the most complex of these four primary components as it converts raw video input into a format thatgreater accuracy. Oculii’s software can be deployed on our existing CVflow SoCs, operating in conjunction with leading radar RF solutions to significantly increase safety and reliability. We recently introduced a centralized radar architecture that synergistically leverages Oculii’s adaptive AI software algorithms together with our CV3 domain controller family, resulting in improved perception, lower power consumption and reduced bills-of-material for mobility applications compared to the current generation of radar systems utilized in the market today.
Ambarella’s products are now used in a wide variety of human viewing and computer vision applications, including a variety of automotive camera systems, video security cameras, mobile and fixed robots, industrial applications, and consumer devices, such as action, drone and 360° cameras.
Industry Background and Target Markets
Computer vision functionality has historically been executed with graphics processing units (GPU), field programmable gate-arrays (FPGA) or general purpose microprocessors (CPU) in servers or data centers. This approach requires large amounts of data to be transported from an end-point electronic system or device into the network infrastructure, where the data may be stored, processed, and distributed efficientlythen sent back to the end point, creating added delay, power consumption and incremental expense from data communications, server processing and storage. In some applications, unacceptable levels of latency are introduced by the transportation of this data, minimizing or, in some cases, analyzeseliminating the videoutility of the product. In addition, this approach often requires personal information to be transmitted from the end-point device to the network infrastructure, potentially raising privacy and security concerns.
4

We believe the AI inference end-point market, sometimes referred to as the system’s edge, requires a fundamentally different SoC architecture versus the GPU, FPGA and CPU approach commonly used in the data center. Our CV SoCs are optimized for the requirements of the edge inference market to automate processes. We combineprovide highly accurate results, significant processing power, small form factor and minimal latency while consuming very low amounts of power and simultaneously delivering both human viewing and computer vision functionality, often while supporting multiple cameras and multiple AI inference applications with a single SoC incorporated in an end-point device. In addition, privacy and security can be enhanced, as critical personal information may not need to enter the network infrastructure.
Our first AI SoC was introduced in 2018 and the CV3 SoC integrates our processor designthird generation CVflow technology. Our development efforts are now focused on SoCs that provide both human viewing and computer vision functionality. With the acquisition of Oculii, we complement our advanced camera perception capabilities with advanced radar perception to enable higher levels of autonomy.
We are focusing on the automotive and Internet-of-Things (IoT) end markets that require increasingly sophisticated AI inference workloads and processing performance:
5
6
The flexibility of our technology platform enables us to deliver our solutions for numerous applications in multiple markets. We initially focused our technology platform on the infrastructure market, where we were able to differentiate our solutions for broadcast customers based on high performance, low power consumption, transmission and storage efficiency and small form factor. Leveraging these same capabilities, we then designed high-performance solutions for the camera market. As a result of the advantages of our solutions, we became a leading provider of video processing solutions for cameras that capture both HD video and high-resolution still images simultaneously.
In the camera market, our platform enables the creation of high-quality video content in wearable cameras, automotive cameras, professional and consumer Internet Protocol, or IP, security cameras, cameras incorporated into unmanned aerial vehicles, also referred to as UAVs or drones,conferencing and virtual reality cameras, also referred to as 360° cameras. Our revenue over the last three years has been generated primarily from sales of our solutions for incorporation into specialized video and image capture devices such as wearable sports cameras, automotive aftermarket cameras, IP security cameras and UAVs. In the infrastructure market, our solutions efficiently manage IP video traffic, broadcast encoding and transcoding and IP video delivery applications.
Over the last several years, we have been expanding our development efforts on computer vision technology that will complement our image processing and video compression technology. We are focused on developing advanced computer vision algorithms and high-performance, low-power hardware platforms to enhance processing acceleration. In 2017, we introduced our first computer vision chip, the CV1 SoC. We believe that enhanced computer vision performance will be critical both to our current video markets, including IP security, wearable and UAV cameras, as well as future markets such as automotive OEM cameras for advanced driving assistance systems, or ADAS, and autonomous vehicles, and robotics. To accelerate our computer vision development, we acquired VisLab S.r.l., or VisLab, in June 2015. VisLab is a developer of computer vision algorithms and intelligent control systems for autonomous driving applications, and we are incorporating its algorithm technology into advanced computer vision solutions for the automotive market, as well as other markets.
We sell our solutions to leading original design manufacturers, or ODMs, and original equipment manufacturers, or OEMs, globally. We refer to ODMs as our customers and OEMs as our end customers, except as otherwise indicated or as the context otherwise requires. In the camera market, our video processing solutions are designed into products from leading OEMs including 360 Smart, Axis Communications AB, Avigilon Corporation, Carcam Electronics Technology Co., Ltd., Dahua Technology Co., Ltd., Dajiang Innovation Technology Inc., Denso Ten Limited, Garmin Ltd., GoPro Inc., or GoPro, Hikvision Digital Technology Co., JVC Kenwood Corporation and affiliated entities, Nest Labs (owned by Google), Ring, Inc., Robert Bosch GmbH and affiliated entities, Thinkware Corporation, and XiaoYi Technology Co., Ltd., who source our solutions from ODMs including Altek Corporation, Chicony Electronics Co., Ltd., Dynacolor, Inc., Flex Ltd., and affiliated entities, affiliated entities of Hon Hai Precision Industry Co., Ltd., Jabil Circuit, Inc., San Jet Technology Corp., Sercomm Corporation, and Sky Light Digital Ltd. In the infrastructure market, our solutions are designed into products from leading OEMs including Harmonic Inc., Motorola Mobility, Inc. (owned by Arris Group, Inc.) and Telefonaktiebolaget LM Ericsson, who source our solutions from leading ODMs such as Plexus Corp. We intend to continue to build and strengthen our relationships with existing customers and also diversify our customer base. We believe our relationships with leading ODMs and OEMs provide us with insight into product roadmaps and trends in the marketplace, which we intend to leverage to identify new opportunities and applications for our solutions. We sell our solutions worldwide using our direct sales force and our distributors, including Wintech Microelectronics Co., Ltd., or Wintech. Sales through Wintech represented approximately 59%, 60% and 67% of our revenue for the fiscal years ended January 31, 2018, 2017, and 2016, respectively.
We employ a fabless manufacturing strategy and are currently shipping the majority of our solutions in the 28 nanometer, or nm, process node, although our most recently introduced SoCs are developed in the 14nm and 10nm process nodes. As of January 31, 2018, we had 706 employees worldwide, approximately 81% of whom are in research and development. Our headquarters are located in Santa Clara, California, and we also have research and development design centers and business development offices in Taiwan, China, Italy, Japan, and South Korea. For our fiscal years ended January 31, 2018, 2017 and 2016, we recorded revenue of $295.4 million, $310.3 million and $316.4 million, respectively, and net income of $18.9 million, $57.8 million and $76.5 million, respectively. We have generated net income in each quarter beginning with the first quarter of fiscal year 2010, and we have generated cash from operations in each of fiscal years starting from 2009.
Ambarella was founded and incorporated in the Cayman Islands in January 2004. Our registered address is PO Box 309GT, Ugland House, South Church Street, George Town, Grand Cayman, Cayman Islands. The address of our U.S. operating subsidiary is Ambarella Corporation, 3101 Jay Street, Santa Clara, California. Our website is www.ambarella.com. You can obtain copies of our Forms 10-K, 10-Q, 8-K, and other filings with the Securities and Exchange Commission, or SEC, and all amendments to these filings, free of charge, from our website as soon as reasonably practicable following our filing of any of these reports with the SEC. In addition, you may read and copy any material we file with the SEC at the SEC’s Public Reference Room at 100 F Street, NE, Washington, D.C. 20549. You may obtain information on the operation of the Public Reference Room by calling the SEC at 1-800-SEC-0330. The SEC also maintains a website that contains reports, proxy, and information statements, and other information regarding registrants that file electronically with the SEC at www.sec.gov. We also use the investor relations section of our website (http://investor.ambarella.com) and our website (www.ambarella.com) as a means of disclosing material information and for complying with our disclosure obligations under Regulation FD. Information on our website is not incorporated into this Annual Report on Form 10-K or our other securities filings and is not a part of such filings.
Industry Background
Trends Impacting the Video Content Creation and Distribution Markets
Video traffic is growing at a significant rate. The market trends that are fundamentally impacting video content creation and distribution include the following:
Increasing Number of Video Capture Devices. Traditionally, HD video was captured using large, power intensive and expensive dedicated devices. Improvements in HD video capture quality, device size and cost have allowed video capture functionality to be incorporated into a broad range of devices. Today, smartphones, tablets, wearable cameras, automotive cameras, IP security cameras and UAVs, are increasingly including both HD video capture and high-quality still image capture. In addition to the significant growth in the number of devices, new applications are emerging for video capture devices, including law enforcement, personal security and social media.
Growing User-Generated Content. Historically, most video content was created by media companies, professional studios and large broadcasters that possessed the equipment, expertise and other resources necessary to produce and distribute such programming. However, with the proliferation of low-cost digital video devices and greater penetration of broadband connectivity, individuals are playing a greater role in content creation and distribution. Websites such as YouTube and Facebook have enabled an effective new channel to widely distribute, store and display video and other rich media. In addition to user-created videos, other user-generated content such as video sharing, video conferencing and video instant messaging through services provided by Alphabet Inc., Apple, Inc., Facebook, Inc., Skype and Snap Inc., among others, are becoming increasingly popular.
Broadband Penetration Enabling the Proliferation of the Video Cloud. The adoption of high-speed broadband and the proliferation of connected devices such as smartphones, tablets, laptops, desktop computers and connected televisions have allowed consumers to more easily download and share IP video accessed upon demand through the video cloud. The video cloud has led to new business models based on personal content such as streaming video provided by services like YouTube. Additionally, consumers are leveraging the video cloud for security by utilizing an IP camera and cloud infrastructure to watch live HD video streaming on any web connected device. This video cloud application has enabled expansion of the connected home to include intelligent IP surveillance systems that detect activity and then stream encrypted HD video through secure servers and alert end users.
Advancements in Display Technology. The increasing proliferation of HD displays in television and in mobile connected devices such as laptops, smartphones and tablets is accelerating HD video content growth. This trend highlights the new paradigm of escalating consumer expectations of video quality, such that video is comparable to high-resolution still images, which drove the transition from standard definition to HD, and we believe will drive the transition to ultra high-definition, or UHD. UHD is commonly referred to as 4K video, which supports up to 4096x2160 pixels per frame, more than four times greater resolution than the current Full HD standard, which supports up to 1920x1080 pixels per frame.
Evolving Requirements for Video Capture and Distribution
Evolving requirements for cameras and broadcast infrastructure equipment typically center around video definition and frame rates, ability to capture high-quality still images and video, advanced video features, computer vision functionality, and transcoding capability:
Higher Definition and Higher Frame Rates. The demand for enhanced video resolution has been increasing in both the camera and infrastructure markets. Consumers expect video quality to be closer to high-resolution still images, which continues to drive the transition from standard definition to Full HD and beyond. Similarly, as new display technologies enable higher resolutions and higher frame rates, we believe consumer demand will continue to drive the requirement for UHD or 4K video capture and transmission.
Ability to Capture High-Quality Still Images and Video. Historically, consumers purchased devices that either provide high-quality image capture or record high-quality video. This was the result of consumer preference, as reasonably priced and sized devices would provide only one of those attributes. However, as a result of technological improvements, consumer devices that deliver both attributes have proliferated to the point that a pure video capture device or still image capture device is becoming uncommon. Increasingly, devices are able to simultaneously capture HD video and high-quality still images without adversely impacting the quality of either. We believe devices that can capture Full HD video while encoding a second mobile resolution video for uploading to the Internet or streaming over a Wi-Fi network will expand consumer demand for specialized video capture devices. Additionally, we believe advanced low-light processing including high dynamic range and high-ISO processing will continue to improve image quality even in challenging lighting conditions. We believe image stabilization technology enables stable video recording during high-motion conditions, which are often encountered when using sports cameras and UAVs.
Connectivity. Integrated wireless capability using wireless links such as Bluetooth and Wi-Fi has become a prevalent feature across many classes of video capture devices. Consumers want to watch, control and capture real-time video using their smartphones as the remote control and viewer for wirelessly enabled wearable and sports cameras. Additionally, rather than storing images and video to local media and transferring to a computer later, consumers are demanding the ability to wirelessly transfer and share their video content to websites such as YouTube, Facebook and other online media albums. In video security applications, connectivity to cloud services allows users to monitor surveillance video in real-time on their smartphones or tablets. The storage of video in the cloud also provides protection against theft of the video content and enables users the capability to play back the stored video.
Ability to Deliver Feature-Rich Video. The addition of de-warping capability allows cameras to utilize a wide angle or “fish eye” lens to cover a wide viewing area. In security applications this capability can allow a single camera to replace multiple cameras and may also eliminate the need for mechanical pan-tilt-zoom in the cameras. In consumer virtual reality, or VR, cameras, the ability to capture, de-warp and stich images from two image sensors allows 360° video creation. In automotive markets, the ability to combine and display images captured by multiple cameras can allow the automotive camera recorder to capture and display images from the front, rear and sides of the car. Wide dynamic range, or WDR, and high dynamic range, or HDR, processing capabilities provide greater dynamic range between the lightest and darkest areas of an image, permitting captured still images to reveal details that would otherwise be lost against a bright background.
Transcoding. The ability to decode and simultaneously re-encode high-quality video streams in multiple formats, which is commonly referred to as transcoding, using dense, small form factor and power-efficient hardware is a critical requirement for content providers and the video cloud. Given the differing connection speeds and capacities in current communication networks, broadcasters must be able to deliver video to consumers at varying bit-rate and quality levels. Furthermore, the significant increase in the number and types of devices capable of displaying video, from HD televisions to smartphones, requires broadcasters and other distributors to have the capability to provide video content in multiple formats and source resolutions. As consumers increasingly view video on smartphones and tablets, in addition to traditional televisions and PCs, the ability to trans-rate video content in real time to the various resolutions and bit-rates supported by smartphones or tablets is essential.
Our Competitive Strengths
Our platform technology solutions provide performance attributes that satisfy the stringent demands of the camera market, enable integration of HD video and image capture capabilities in portable devices, and provide computer vision capabilities that address the evolving needs of the automotive and other markets, and meet the highest standards of the infrastructure market.IoT markets. We believe that our leadership in HD video and image processing applications is the result of our competitive strengths, including:
High-Performance, Low Power Video and Image Algorithm Expertise. Our solutions provide Full HD and UHD video at exceptional resolution and frame rates. Our extensive algorithm expertise, which facilitates efficient video and image compression, enables our solutions to achieve low power consumption without compromising performance. Our solutions achieve high storage and transmission efficiencies through innovative and complex video and image compression algorithms that significantly reduce the output bit-rate. This smaller storage footprint directly benefits the performance of our solutions in several ways including lower memory storage requirements and reduced bandwidth needs for transmission, which is more conducive to sharing content between devices. These benefits are particularly important in transcoding and video cloud applications. Our solutions can enable high-performance image capture of up to 30 32-megapixel still images per second. Our solutions can deliver clear images in low light conditions because of our 3D motion compensated temporal filtering, or MCTF, and multiple exposure processing. Additionally, our WDR and HDR processing capabilities provide greater dynamic range between the lightest and darkest areas of an image, permitting captured still images to reveal details that would otherwise be lost against a bright background. Our advanced de-warping capability enables cameras to use wide angle lenses to capture images from a wide area, making it ideal for a variety of IP security camera applications, as well as 3D electronic image stabilization and surround view for automotive applications.
Proprietary Video Processing Architecture. Our proprietary video processing architecture is designed to efficiently integrate our advanced compression algorithms into our SoCs to offer exceptional storageAI, Radar and transmission efficiencies at lower power across multiple products and end markets. We engineered our very-large-scale integration, or VLSI, architecture with a focus on high-performance video compression as opposed to solutions that are based on a still image processing architecture with add-on video capabilities. Due to our primary focus on video processing compression, we believe that our solutions offer exceptional performance metrics with lower power requirements and reduced die sizes. Our integrated algorithms and architecture also enable simultaneous processing of multiple video and image streams.
Proprietary Computer Vision Architecture.Our proprietary computer visionAI processing architecture, known as CVflow, uses a flexible computer vision hardware engine programmed with a high level algorithm description to achieve increased performance while minimizing die size and power consumption. The CVflow architecture specifies data flow connections between a set of optimized AI and computer vision operators, such as the convolution and matrix multiply functions that are specifically optimized for deep learning algorithms. The CVflow architecture supports a variety of AI, radar and computer vision algorithms, including object detection, classification and tracking, semantic and instance segmentation, image processing, and stereo obstacle detectionobject detection. Our latest third generation CVflow technology enables us to efficiently process transformer AI networks, which are an enabling technology for next generation automotive and terrain mapping technology, andgenerative AI markets. CVflow also allows customers to differentiate their products by porting their own algorithms and neural networks to our CVflow-based chips.
•
Highly Integrated SoC Solutions Based on a Scalable Platform. Our product families leverage a flexible and highly-scalable platform including our core high-performance AI and video processing architecture combined with an extensive set of integrated peripherals. Our flexible and highly-scalable platform enables our customers to address multiple applications and markets with reduced design cycles and costs. Our software compatible portfolio of products, with a broad range of performance and price points, allows our customers to develop a range of end products from a common software base.
Broad Domain Experience in Video Processing and Delivery. Our engineering team, whose core members have worked together for over 20 years, includes leading innovators in video processing and delivery. Our VLSI team has We also provide extensive multi-gigahertz, superscalar CPU design experiencesoftware tools to map algorithms from Intel Corporation, Advanced Micro Devices, Inc. and Sun Microsystems, Inc. Our team has developed many industry firstscommonly-used AI frameworks such as the first single chip MPEG-2 encoder, the first consumer MPEG-2 transcoding SoC, the first single chip HD H.264 encoder and camera SoC and the first 1080p60 and UHD infrastructure SoC.PyTorch or TensorFlow into our proprietary CVflow architecture. Our team has developed an ecosystem of high-performance software and hardware solutionsdevelopment kits (SDKs) contain reference code for specific features that reduce customer system development time and cost, thus allowing for accelerated time-to-market.
7
Key Global Relationships with Leading OEM and ODM Customers. Our solutions have been designed into top-tier OEM brands currently in the market.
Products
We have established collaborative relationshipsa wide range of products in our portfolio, including products that have commercially shipped, products for which we have shipped engineering samples and products that are under development. We typically introduce two to three new silicon products per year which, when combined with most of the leading ODMs and OEMs that serve our primary markets. We intend to leverage these relationships to identify new opportunities and applications for our solutions, and we intend to continue to actively engage with ODMs and OEMs at every stage of their design cycles. We actively engage with OEMs on design specifications and with ODMs on product implementation. Additionally, approximately 72% of our employees are located in Asia, primarily in Taiwan and China, strategically placing us near many of our customers and allowingflexible software development kits, allow us to provide superior sales, design and technical support and to strengthen our customer relationships.
Our technology platform delivers a high-performance, low power video and image processing solution that can be tailored with our software solution to meetoffer product families addressing the specific needs of multiplea wide range of end markets. Our HD video and image processing SoCs, based on our proprietary technology platform, are highly configurable and enable our customers to deliver exceptional quality video and still imagery in small, easy-to-use devices with low power requirements. Our customized software solutions include firmware, middleware and software development kits to optimize system-level functions and allow rapid integration of our solution into customer products and tailor specifications to customer requirements. We also provide customers in all of our core markets with guidelines known as reference designs so that they can efficiently incorporate our solutions in their product designs.
In addition to enabling small device size and low power consumption, our SoC solutions make possible differentiated functionalities, such as computer vision functionality, simultaneous video and image capture, multiple-stream video capture, image stabilization and wireless connectivity. We intend
Central Domain Controller. Our CV3-AD685, the first production version of the CV3 family of automotive AI domain controllers, targets L2+ to leverage our core technology platformL4 autonomous vehicles and advanced robots. Its next-generation CVflow® AI engine includes neural network processing that is 20x faster than the previous generation of CV2 SoCs, along with additional general vector processing capabilities to address other videoprovide the overall performance required for full autonomous driving (AD) stack processing, markets that have high-performance, robust connectivity, low latency and low power requirements. In addition, we are developing computer vision functionality for the consumer and professional IP security, UAV and automotive markets to enhance the capabilities of our SoCs. We believe that including computer vision, functionality onHD 4D radar, deep fusion and planning. It also integrates advanced image processing, a dense stereo and optical flow engine, Arm® Cortex® A78AE and R52 CPUs, an automotive GPU for visualizations, and a hardware security module (HSM). The CV3-AD685 is an “algorithm first” architecture that provides support for the SoC, such as face recognition, object identificationentire AD software stack.
CVflow SoCs. Our AI architecture, incorporated into our CV family of SoCs, extracts and avoidance and motion detection will expand the addressable market for our SoC solutions.
We currently sell our solutions into the following end markets:
Professional IP Security Cameras. These cameras are used for video monitoring and security surveillance in professional applications. Our solutions enable the streaming of multipleprocesses data from video streams, enabling our customers to enable remote monitoring at multiple locations. Embedded intelligence supportsdevelop intelligent camera systems. These SoCs combine advanced analytics including motion detectionimage processing, high-resolution video encoding and people tracking. The cameras often have the ability to operate in low light conditions and over wide temperature ranges in order to be used in outdoor environments.
Consumer IP Security Cameras. Consumer IP security cameras are designed for home or small business use and are typically connected to cloud services and applications via home networks using WiFi. These cameras may require very low bitrate operation to support HD resolution over limited bandwidth broadband connections, while small form factors may require very low power operation. The implementation of intelligent motion detection may reduce the number of false alarms.
Automotive Cameras. We sell solutions into several automotive markets both for aftermarket and OEM applications. In the automotive aftermarket, we sell solutions for small video cameras mounted on board vehicles to record traffic accidents and help establish records for insurance and liability purposes. Our MotorVu™ 3D 360° Surround View reference design for the automotive OEM market brings high quality HD video to multi-camera parking assistance applications and features a dedicated video engine to combine multiple HD video streams for 3D scene rendering. Also, for the OEM market, electronic mirrors utilize cameras and LCD displays to augment optical rear view and side view mirrors to provide a wider, unobstructed field of view. We believe our low power, high-performance, small form factor solutions are well suited for this market.
Wearable Cameras including Sports, Commercial and Social Media. Durable cameras that provide HD video quality increasingly include embedded connectivity to share and display video. Our low power, high-resolution and connected solutions can be foundCVflow AI processing in a variety of cameras in this end market.
UAVs or Drones. These cameras are used for capturing aerial video or photographs. Our high-performance, high frame rate and low power architecture enables improved functionality with Full HD video capture. In addition, our abilitysingle, low-power design to provide high-resolution still image capture and HD video capture simultaneously enables hybrid capability for the user.
Virtual Reality Cameras. This new class of cameras is used typically for capturing 360° video or, in higher-end camera models, for capturing 360° plus 3D video. Standalone 360° video cameras capture video images from two sensors and encode both video streams in high resolution while simultaneously stitching the two images together in real time.
Broadcast and Traffic Management. Broadcasting equipment that enables HD video to be distributed through satellite, cable and IP infrastructures comprises this market. Our SoC solutions enable high-performance, low power consumption broadcast devices with small form factors, thereby reducing bandwidth needs, energy usage and costs of additional hardware. Our solutions enable an increased number of channels per encoder due to high compression efficiencies. They also make possible a new class of transcoderssmart edge devices for applications including smart home security, retail monitoring, consumer robotics, and occupancy monitoring. Some of our CVflow SoCs are manufactured to satisfy the functional safety requirements of the automotive market. Our third generation CVflow-based SoCs enable efficient processing or transformer AI networks, which are an enabling technology for next generation automotive and generative AI markets.
AI Neural Processor. Based on our proprietary architecture, our N1 SoC provides highly-efficient AI performance for neural network computation in combination with a general vector processor (GVP), an advanced image processor, a dense stereo and optical flow engine, and a GPU, in a single SoC. The N1 is designed for implementing industrial robotics, smart cities, intelligent healthcare imaging and diagnostics, multi-camera AI processing hub, edge AI servers running multi-modal LLMs, and autonomous fleet telematics.
Vision Processor SoCs. Our video and image processing SoCs integrate an advanced image sensor pipeline (ISP), H.264 and/or H.265 encoders, and a powerful ARM CPU for advanced analytics, flight control, WiFi streaming, and other user applications. Our unique architecture and advanced process node technology lower power consumption while maintaining high performance for security camera and consumer applications such as connected drones, sports cameras, and 360º (VR) cameras.
High Definition Radar. Through our acquisition of Oculii, we offer adaptive AI software algorithms designed to enable radar perception using current production radar chips to achieve significantly higher resolution, longer range and greater accuracy. These improvements eliminate the need for specialized high-resolution radar chips, which have significantly higher power consumption and cost than conventional radar solutions. We recently introduced a centralized radar architecture that leverages Oculii’s adaptive AI software algorithms together with our CV3 processor family to enable both central processing of raw radar data and deep, low-level fusion with other sensor inputs, including cameras, lidar and ultrasonics.
Serializer/Deserializers. Our B6 and B8 SerDes (Serializer/Deserializer) products are mixed-signal (analog and digital) semiconductors used to transport data short distances (up to 10 meters) from a CMOS image sensor, often in a remote camera location, to our video and CV SoCs. The SerDes chips are used to add additional camera(s) to an automotive application, as well as used as a bridge chip for other automotive applications, such as a MIPI combiner, splitter or display driver. Our SerDes chips are also used in security applications such as ATMs that can simultaneously encodeuse a single B8 chip for connecting multiple remote cameras to a single video processor SoC.
Software Modules. We separately license proprietary software modules that can be used in conjunction with a customer’s internally developed software and/or with third-party software. Features that may be licensed include functionality for a variety of automotive applications, including dataloggers, ADAS and stream multiple video formats to different end devicesautonomous driving systems, eMirrors and can change video resolution and transmission rates based on available bandwidth and the display capability of receiving devices.in-cabin applications. Additionally, our neural-network image signal processing (NN-ISP) software module improves low light imaging in security camera applications.
8
The chart below describes our current product lines and target markets:lines:
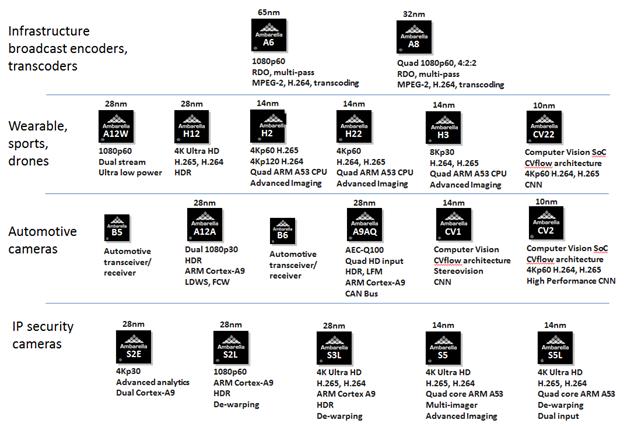
Technology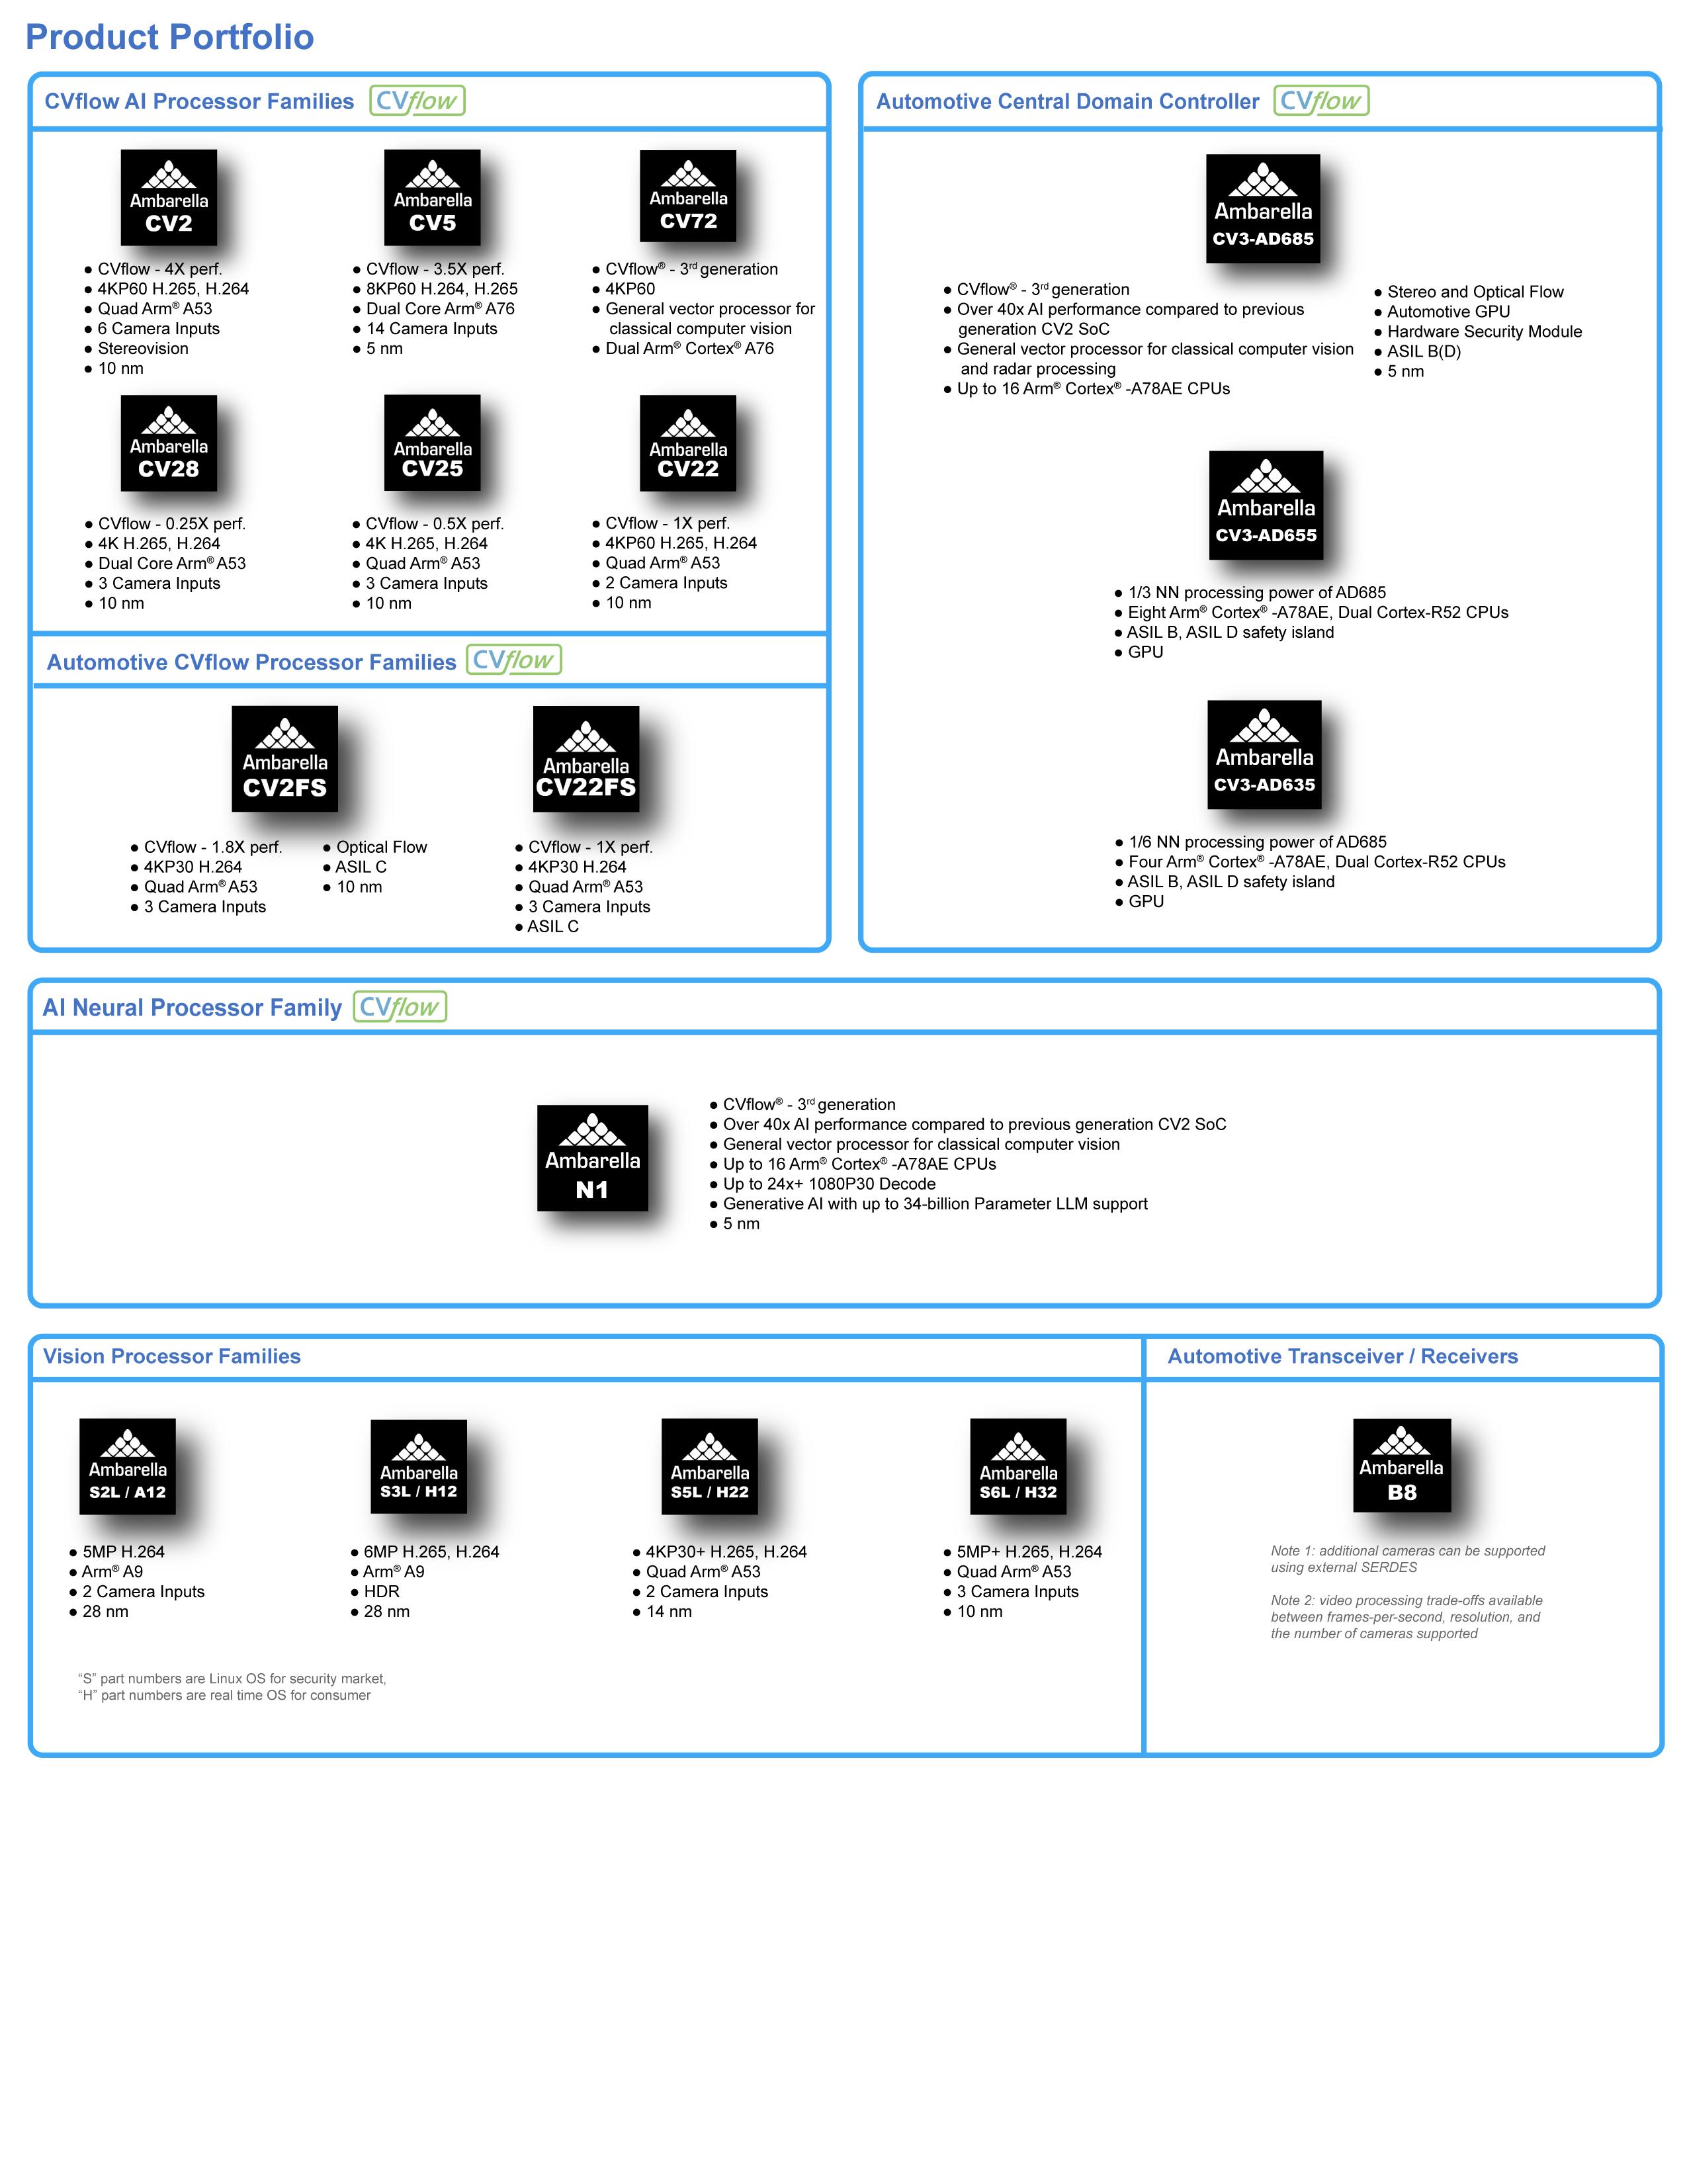
9
Technology
Our semiconductor processing solutions enable artificial intelligence and computer vision processing, HD, UHD and 8K UHD (up to 3840x2160p60)7680 x 4320p60) video and image processing, and video compression, sharing and display while offering exceptional power, size, and performance characteristics.
Key differentiators of our technology include:
flexible and scalable CVflow processors for deep learning, HD radar processing and other CV algorithms that cover a broad range of consumer, professional and automotive requirements with power and die size efficiency;
algorithmssoftware development kit comprised of application programming interfaces, or APIs, to facilitate integration into customers’ products; and tools for high-speed image processing with high image qualityporting and power efficiency;
scalable architecture that covers the gamut of consumer and professional HD video camera and encoding applications from Full HD to UHD performance levels;
ability to encode multiple video streams simultaneously to support simultaneous recording and video streaming, or streaming to multiple devices with different resolutions;
ability to capture, process and encode multiple image sensors simultaneously to support multiple viewpoints, including surround view and virtual reality applications;
algorithms to stabilize video from camera motion in challenging conditions, such as sports and UAV cameras;
low-power architecture with minimal system memory footprint;
andprogrammable architecture that balances flexibility, quality, power and die size;
full software development kit comprised of APIs to facilitate integration into customers’ products;
size with powerful CPUs and dedicatedoptimized hardware acceleration to support advanced analytics functions;
10
support for transcoding between video formats, for example MPEG-2 to H.264 and H.265;
|
|
optimized deep learning algorithms for multi class object detection, including vehicles, pedestrians, cycles, traffic signs and traffic lights;
stereo obstacle detection for obstacles that are not in the training data to provide robust safety; and
full autonomous algorithm stack for automotive and drone applications, including fusion for multiple cameras and sensor modalities, mapping and localization algorithms and planning.
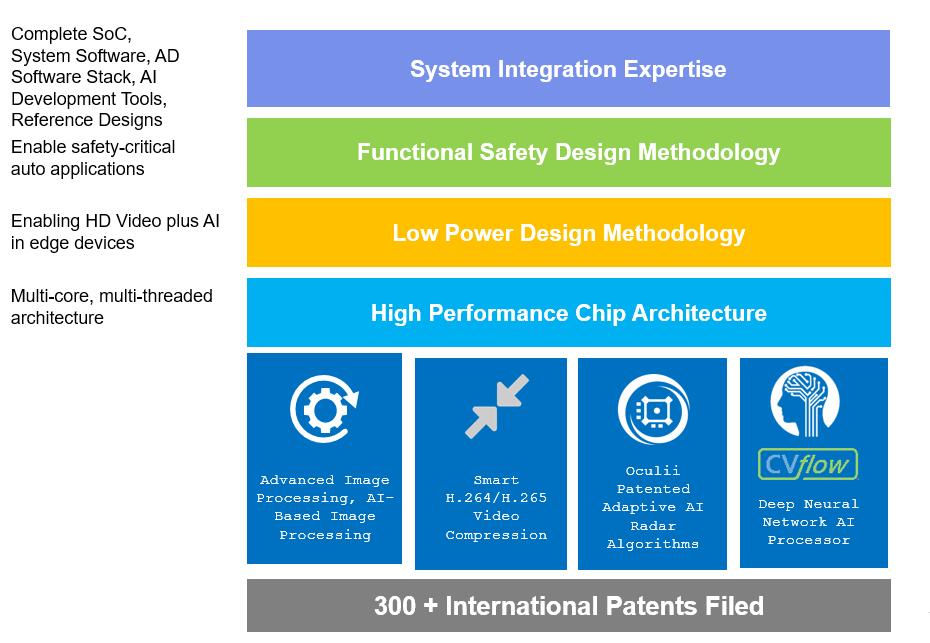
Our technology platform comprised of our video, image and computer vision processors, is based on a high-performance, low-power architecture supported by a high level of system integration. The building blocks of our platform are illustrated below:

Our technology platform enables the capture of high-resolution still images and HDUHD video while simultaneously performing CV processing and encoding HD video for high-quality storage and lower resolution video for Internet sharing and wireless networking. Multi stream video capture enhances the consumer experience by offering the ability to instantaneously share captured video without having to go through a transcoding process. Our computer stereo vision processing solutions provide the ability to detect generic objects without training, allowing more robust decisions to be made in applications such as autonomous driving.real time streaming.
AmbaClear
CVflow
Our proprietary image signal processing architecture, known as AmbaClear, incorporates advanced algorithms to convert raw sensor data to high-resolution still and HD video images concurrently. Image processing algorithms include sensor, lens and color correction, demosaicing, which is a process used to reconstruct a full color image from incomplete color samples, noise filtering, detail enhancement and image format conversion. For example, raw sensor data can be captured at up to 16-megapixel resolution at 60 frames per second and filtered down to two megapixels for HD video processing while selected 16-megapixel frames are concurrently processed by the still image processor. This image processing reduces noise in the input video and improves video quality resulting in better storage and transmission efficiencies. Our WDR and HDR processing capabilities handle greater dynamic range between the lightest and darkest areas of an image, permitting video images to reveal details that would otherwise be lost against a bright background. Our advanced de-warping capability enables cameras to use wide angle lenses to capture images from a wide area, making it ideal for a variety of IP security camera and surround view applications.
Our proprietary HD video processing architecture, known as AmbaCast, incorporates advanced algorithms for motion estimation, motion-compensated 3D temporal filtering, mode decision and rate control. Successful implementation of these computationally intensive steps has helped us maximize compression efficiency. We support all three compression profiles—baseline, main and high—as specified in the H.264 video compression standard. We also support the main profile H.265 video compression standard with up to 2x better compression efficiency compared to our H.264 video compression technology.
Our solutions for the broadcast infrastructure market allow OEMs to offer H.265, H.264 and MPEG-2 encoding formats. All of our video encoding solutions have decoding capabilities as well.
CVflow
Our proprietaryAI computer vision processing architecture, known as CVflow,CVflow®, uses a flexible computer vision hardware engine programmed with a high leveldata flow graph algorithm description to achieve increased performance while minimizing die size and power consumption. This description allows the hardware to maximize use of its resources by exploiting all available parallelism without software intervention. The CVflow architecture specifies data flow connections between a set of optimized AI and computer vision operators, such as the convolution and matrix multiply functions that are specifically optimizedused for deep learning algorithms. Our CVflow engine is also capable of running large language model inferencing, with models up to 34 billion parameters run on a single N-1 SoC. The CVflow architecture also supports a variety of computer visionother algorithms, including radar processing, stereo obstacle detection and terrain mapping technology.sensor fusion. Our third generation CVflow-based SoCs enable efficient processing or transformer AI networks, which are an enabling technology for next generation automotive and generative AI markets. Our platform allows customers to differentiate their products by porting and optimizing their own algorithms and neural networks to our CVflow-based chips using industry-standard training tools and frameworks.APIs.
Computer Vision and Radar Technology
Computer vision is a core technology that complements our proprietary image processing and video compression technology. Our current SoC solutionsWe have up to four high performance ARM processors with NEONTM acceleration that provide a flexibledeveloped efficient deep learning algorithms for object detection and cost-effective manner in which to run computer vision algorithms. We are focusing on developing advanced computer vision algorithms and high-performance, low-power hardware acceleration. We believe that enhanced computer vision performance will be critical both tosegmentation leveraging our current video markets, including IP security, wearable, and UAV cameras, as well as future markets such as automotive cameras for OEM applications.
deep understanding of the CVflow processor. A significant feature of our computer visionthird generation CVflow SoCs is support for HD stereo obstacle detection, which utilizes stereo cameras to perceive depth.and HD radar based depth and velocity sensing. We believe HD stereo and HD radar are complementary sensor modalities that stereoprovide robust depth information after fusion. This depth information provides an important augmentation to monocular computer vision processing, resulting in an extra margin of safety for autonomous driving and other applications. Monocular processing depends on training to detect obstacles, and may not detect obstacles that are not represented in the training set. Stereo cameras and radar detect obstacles without relying on training for specific obstacle categories because the depth information is used to directly construct a three-dimensional model of the camera’s surroundings, including any obstacles. This allows more robust decisions to be made in applications such as autonomous driving.
11
Compatible Family of SoC Solutions
Our current SoC designs integrate our fully-programmable and highly-efficient CVflow architecture, UHD image processing and video compression, applications processing and system functions onto a single chip, delivering exceptional performance, quality and power efficiency with differentiated features. Our multi-core DSP architecture is highly scalable and balances software programmability with hardware-accelerated performance to achieve extremely low power consumption and maximized camera battery life. We have used this scalability to develop an extensive family of software compatible SoCs with a wide range of performance and price points (CV28, CV25, CV22, CV2, CV2FS, CV5, CV72, CV3 AD685, and CV-3 High Dev). This scalable, programmable architecture provides our customers with the flexibility they need to quickly develop a wide range of differentiated products. Additionally, our SoCs integrate mixed signal (analog/digital) functionality and high speed interfaces required for interfacing to advanced high-speed CMOS sensors and industry standard interfaces such as PCI-E, USB 3.2 and HDMI 2.0. Our next generation CV3 family extends our CVflow architecture to cover L2+/L3/L4 autonomous driving and other high performance safety critical applications. The CV3 family will cover multiple performance and price points with a software compatible SDK.
Software Development Kits
We provide to our customers fully-functional software development kits with a suite of APIs which allow customers to rapidly integrate our solution, adjust product specifications and provide additional functionality to their systems, thereby enabling them to differentiate their product offerings and reduce time to market. We have software development kits for all of our core markets.
We also provide a toolkit to accelerate the development of computer vision algorithms onto our hardware. We provide tools to map and optimize algorithms developed in commonly used computer vision frameworks such as PyTorch or TensorFlow into our proprietary CVflow architecture. We also provide a framework for development of higher-level computer vision tasks. This enables our customers to write complex computer vision algorithms with multiple tasks running in parallel on multiple processing engines, as would be required in applications such as autonomous driving.
Software Modules
We are developing optimized software modules to give customers the option to leverage our expertise and reduce development time and expense. These modules include HD radar processing for standalone and central radar processing, DL based low light and HDR image processing, monocular and stereo camera perception, and autonomous driving stack modules optimized for the CV3 family, including fusion for multiple cameras and sensor modalities, mapping and localization algorithms and planning.
AmbaClear
Our proprietary image signal processing architecture, known as AmbaClear, incorporates advanced algorithms to convert raw sensor data to UHD video and/or still images. Image processing algorithms include sensor, lens and color correction, HDR tone mapping, color processing and de-mosaicing to reconstruct a full color image from incomplete color samples and specialized color filters, noise filtering, detail enhancement and image format conversion. For example, raw sensor data can be captured at up to 32-megapixel (8K) resolution at 60 frames per second. This image processing reduces noise in the sensor data and improves color, contrast and sharpness resulting in improved computer vision performance, enhanced human viewing and enhanced storage and transmission efficiencies. Our WDR and HDR processing capabilities handle greater dynamic range between the lightest and darkest areas of an image, permitting video images to reveal details that would otherwise be lost against a bright background. We have developed efficient scalable deep learning algorithms for advanced low light processing and HDR tone mapping that augment our image processing hardware. These algorithms provide significant image quality improvements over our standard image processing while running in real time at HD and higher resolutions. Our advanced de-warping capability enables cameras to use wide angle lenses to capture images from a wide area, making it ideal for a variety of IP security camera and surround view applications. Our RGB- infrared fusion capability allows a single sensor to produce simultaneous RGB and infrared images for sensing and improved low light performance.
AmbaCast
Our proprietary UHD video compression architecture, known as AmbaCast, incorporates advanced algorithms for motion estimation, motion-compensated 3D temporal filtering, mode decision and AI based rate control. Successful implementation of these computationally intensive steps has helped us maximize compression efficiency. We support H.264 and H.265 video compression standard with our H.265 providing up to 2x better compression efficiency compared to our H.264 video compression technology.
12
Design Methodology
The success of our technology platform stems from our algorithm-drivenalgorithm driven design methodology. We do extensive algorithm studies in deep learning AI, image processing and compression including our internally developed and public external algorithms. We use these studies to develop high power and die area efficient processing engines compared with general purpose processors like CPUs and GPUs. We also include a high degree of programmability to provide flexibility in supporting new algorithms that we and our customers develop. We test and verify our algorithms on our proprietary architectural model prior to implementing our algorithmsprocessor engines in hardware. Our advanced verification methodology validates our approach through simultaneous modeling of architecture, algorithms, and the hardware itself. This redundant approach enables us to identify and remediate any weaknesses early in the development cycle, providing a solid foundation on which we build our hardware implementation, and enhances our ability to achieve first-pass silicon success. We have a history of using several process nodes from 130nm through 10nm. In fiscal year 2015, we began investing in development of our next generation SoCs in the 14nm process node and announced our first 14 nm SoC in January 2016 and our second 14 nm SoC in January 2017. In fiscal year 2017, we began investing in development of our next generation SoCs in the 10nm process node, and we announced our first 10nm SoC in January 2018. We possess extensive expertise in AI deep learning, video and imaging algorithms, as well as deep sub-micron digital and mixed-signal design experience.
Our SoC designs integrate HD and UHD video processing, image processing, applications processing and system functions onto a single chip, delivering exceptional video and image quality with differentiated features, including advanced wireless connectivity. Our multi-core DSP architecture is highly scalable and balances software programmability with hardware-accelerated performance to achieve extremely low power consumption and maximize camera battery life. The programmable architecture provides our customers with the flexibility they need to quickly develop a wide range of differentiated products. Additionally, our SoCs integrate mixed signal (analog/digital) functionality and high speed interfaces required for interfacing to advanced high-speed CMOS sensors and industry standard interfaces such as USB 3.0 and HDMI 2.0. Our newest SoCs also feature our fully-programmable and highly-efficient CVflow architecture to provide significant computer vision performance with very low power consumption. Recently introduced SoCs include the following:
Our CV1 SoC, which we announced in January 2018, is the first in a family of UHD computer vision processors based on our new CVflow architecture. The CV1 SoC supports computer vision processing for one stereo pair of 4K UHD sensors, or four stereo pairs of 1080p sensors running at 30 frames per second. This enables the CV1 SoC to detect obstacles at a range of 150 meters using the single 4K stereo pair for automotive applications, or at shorter distances in a 360 degree surround view format with the four 1080p stereo pairs. The CV1 SoC features an advanced image signal processor capable of HDR processing to deliver high quality images even in low light and high-contrast environments.
|
|
Our S5L SoC, announced in April 2017, is designed for professional IP cameras and includes 4K HDR processing and multi-streaming. The S5L SoC delivers 4Kp30 video at under 1.5 watts and bitrates as low as 512 Kbits per second. The S5L SoC features a quad-core ARM Cortex A53 CPU for advanced analytics, including object and person detection to reduce false alarms and maximize battery life in battery-powered designs. The S5L SoC’s on-chip lens distortion correction engine supports wide angle lenses up to 180 degrees, while the dual independent video inputs facilitate seamless dual-lens designs.
|
|
Software Development Kits
We provide to our customers fully-functional software development kits with a suite of application programming interfaces or APIs, which allow customers to rapidly integrate our solution, adjust product specifications and provide additional functionality to their systems, thereby enabling them to differentiate their product offerings and reduce time to market. We have software development kits for all of our core markets. For example, our video streaming technology enables the camera’s image to be previewed on a smartphone, so the camera can be optimally set up and controlled remotely, or video can be streamed directly to Internet cloud services. To enable this functionality, end customers deploy our Wireless Camera Developer’s Kit, or the Kit, which enables the design of cameras that combine still photography and Full or Ultra HD video with wireless video streaming. The Kit leverages our multi-stream encoding capability which supports the recording of Full or Ultra HD video locally while simultaneously recording and streaming a second stream. The Kit enables accelerated end customer product development.
For the security market, we provide a fully-featured IP Camera Software Development Kit, or the IP Camera SDK, based on a LinuxTM operating system. The IP Camera SDK includes middleware software with multi-streaming capability, control for our 4K H.264/H.265 encoder hardware, support for peripherals such as sensors and Wi-Fi chipsets, and other functions needed to build a 4K Ultra HD multi-streaming IP camera. The IP Camera SDK leverages our SoCs’ capabilities for 4K video, multi-streaming, HDR, video de-warping, video analytics, and multi-sensor connectivity. For example, the IP Camera SDK enables an IP camera to record a stream locally at 4K resolution while streaming another video to a remote client over an Ethernet connection at reduced resolution. We also provide extensions to the IP Camera SDK to address specific submarket segments such as doorbells and battery-powered cameras, which can take advantage of the fast-boot, low power, and advanced multi-view video modes of our chips.Customers
We also provide a toolkit to accelerate the development of computer vision algorithms onto our hardware. We provide tools to map algorithms from commonly used computer vision frameworks such as Caffe or Tensorflow into our proprietary CVflow architecture. We also provide a framework for development of higher-level computer vision tasks. This enables our customers to write complex computer vision algorithms with multiple tasks running in parallel, as would be required in applications such as autonomous driving.
Customers
We sell our solutions to leading original design manufacturers, or ODMs, and original equipment manufacturers, or OEMs, globally. In the automotive OEM market, we may sell our solutions to Tier-1 suppliers that develop and sell devices incorporating our solutions to automotive OEMs. We refer to ODMs and Tier-1 suppliers as our customers and OEMs as our end customers, except as otherwise indicated or as the context otherwise requires. In the camera market, our video processing solutions are designed into products from leading OEMs including 360 Smart, Axis Communications AB, Avigilon Corporation, Carcam Electronics Technology Co., Ltd., Dahua Technology Co., Ltd., Dajiang Innovation Technology Inc., Denso Ten Limited, Garmin Ltd., GoPro Inc., or GoPro, Hikvision Digital Technology Co., JVC Kenwood Corporation and affiliated entities, Nest Labs (owned by Google), Ring, Inc., Robert Bosch GmbH and affiliated entities, Thinkware Corporation, and XiaoYi Technology Co., Ltd., who source our solutions from ODMs including Altek Corporation, Chicony Electronics Co., Ltd., Dynacolor, Inc., Flex Ltd., and affiliated entities, affiliated entities of Hon Hai Precision Industry Co., Ltd., Jabil Circuit, Inc., San Jet Technology Corp., Sercomm Corporation, and Sky Light Digital Ltd. In the infrastructure market, our solutions are designed into products from leading OEMs including Harmonic Inc., Motorola Mobility, Inc. (owned by Arris Group, Inc.) and Telefonaktiebolaget LM Ericsson, who source our solutions from leading ODMs such as Plexus Corp.
Sales to customers in Asia accounted for approximately 79%, 73%79%, and 91%86% of our total revenue in the fiscal years ended January 31, 2018, 20172024, 2023, and 2016,2022, respectively. Certain prior year revenue amounts have been reclassifiedof revenue by geographic region have been adjusted to conform toreflect the fiscal year 2018 presentation.appropriate bill-to location for the related revenue. These reclassificationsadjustments did not impact the total revenues in each fiscal year.any of the years presented. As many of our OEM end customers or their ODM manufacturers are located in Asia, we anticipate that a majority of our revenue will continue to come from sales to customers in that region. Although a large percentage of our sales are made to customers in Asia, we believe that a significant number of the products designed by these customers and incorporating our SoCs are then sold to consumers globally. In fiscal years 2018, 2017 and 2016, 98%, 98% and 97% of our revenue was attributable to sales of our solutions into the camera markets, respectively, and 2%, 2% and 3% of our revenue was attributable to sales of our solutions into the infrastructure market, respectively. To date, all of our sales have been denominated in U.S. dollars.
We work closely with our end customer OEMs and ODMs throughout their product design cycles that often last sixnine to nineeighteen months for the camera market, thoughmany of our target markets, although new products within the camera market may have longer design cycles, and 12 to 18particularly those implementing advanced AI features. Product design cycles for certain portions of the automotive market generally last longer than eighteen months, particularly for the infrastructure market.products containing user safety features. As a result, we are able to develop long-term relationships with our customers as our technology becomes embedded in their products. Consequently, we believe we are well positioned to not only be designed into our customers’ current products, but also to continuallycontinue to develop next-generation HD video and image processing solutions for their future products.
The product life cycles in the camera marketmany of our target markets typically range from sixtwelve to 1824 months. TheWe expect that product life cycleslifecycles in the infrastructure marketautomotive OEM and the industrial and robotics markets will typically range from two to five years, wherebe longer than 24 months, as new product introductions occur less frequently. For many of our solutions, early engagement with our customers’ technical staff is necessary for success. To ensure an adequate level of early engagement, our application and development engineers work closely with our customers to adjust product specifications and add functionality into their products.
In fiscal year 2018,2024, the customers representing 10% or more of revenue were WT Microelectronics Co., Ltd., formerly Wintech the Company’s distributor, and GoPro, Inc.Microelectronics Co., Ltd., or GoPro, a direct OEM customer,WT, our non-exclusive sales representative and fulfillment partner in Asia other than Japan, and Chicony Electronics Co., Ltd., or Chicony, one ODM that manufactures devices incorporating our solutions on behalf of multiple end-customers, which accounted for approximately 59%53% and 12%14% of total revenue, respectively. The revenues for GoPro in fiscal year 2018 included direct shipments to GoProbut did not include shipments to GoPro’s ODMs through Wintech, which represented an additional approximately 1% of our total revenue in fiscal 2018. We currently rely, and expect to continue to rely, on a limited number of customers for a significant portion of our revenue. In fiscal years 2018, 2017 and 2016, sales directly and through our distributors to our five largest ODM and OEM customers collectively accounted for approximately 51%, 56% and 56% of our total revenues, respectively, and sales to our 10 largest ODM and OEM customers collectively accounted for approximately 65%, 68% and 69% of our total revenues, respectively.
Sales and Marketing
We sell our solutions worldwide using our direct sales force and our distributors. We have direct sales personnel covering the United States, Asia and Europe, and we operate sales offices in Santa Clara, California and Hong Kong, and business development offices in China, Germany, Japan, South Korea, and Taiwan. In addition, in each of these locations we employ a staff of field applications engineers to provide direct engineering support locally to our customers.
13
Our sales cycles typically require a significant investment of time and a substantial expenditure of resources before we can realize revenue from the sale of our solutions, if any. Our typical sales cycle consists of a multi-month sales and development process involving our customers’ system designers and management and our sales personnel and software engineers. If successful, this process culminates in a customer’s decision to use our solutions in its system, which we refer to as a design win. Our sales efforts are typically directed to the OEM of the product that will incorporate our computer vision and video and image processing solution, but the eventual design and incorporation of our SoC into the product may be handled by an ODM or Tier-1 supplier on behalf of the OEM. Volume production may begin within sixnine to 18 months after a design win, depending on the complexity of our customer’s product and other factors upon which we may have little or no influence. Once our solutions have been incorporated into a customer’s design, they are likely to be used for the life cycle of the customer’s product. Conversely, a design loss to a competitor will likely preclude any opportunity for future revenue from such customer’s product.
The end markets into which we sell our products have seen significant changes as consumer preferences have evolved in response to new technologies. As a result, the composition of our revenue may differ meaningfully during periods of technology or consumer preference changes. For example, in fiscal year 2011, pocket video revenue represented approximately 40% of our total revenue. The proliferation of smartphones and their ability to capture high-quality video and still images significantly impacted this market, decreasing pocket video cameras’ contribution to approximately zero percent of total revenue by fiscal year 2013. Conversely, our total revenue in the 2013-2018 fiscal years was primarily derived from markets for specialized video and image capture devices, such as the wearable camera market, the IP security camera market, the automotive aftermarket and the UAV camera market. We expect shifts in consumer use of video capture to continue to change over time, as more specialized use cases emerge and video capture continues to proliferate, which could significantly impact any of these markets.
Our sales are generally made pursuant to purchase orders received approximately four to 1830 weeks prior to the scheduled product delivery date, depending upon agreed terms with our customers and the current manufacturing lead time at the time the purchase order is received. These purchase orders may not be cancelled without charge upon notification within an agreed period of time in advance of the delivery date, which may be as short as 30 days. Due to the scheduling requirements of our foundry, assembly and test contractors, we generally provide our contractors with our production forecasts and place firm orders for products with our suppliers up to 20 weeks prior to the anticipated delivery date, usually without a purchase order from our own customers.written consent. Our standard warranty provides that our SoCs containing defects in materials, workmanship or performance may be returned for a refund of the purchase price or for replacement, at our discretion. We may agree to different warranty terms with specific customers from time to time.
ManufacturingOur sales are primarily made through standard purchase orders for delivery of products. Our manufacturing production is based on estimates and advance non-binding commitments from customers as to future purchases. We follow industry practice that allows customers to cancel, change or defer orders with limited advance notice prior to shipment. Given this practice, we do not believe that backlog is a reliable indicator of future revenue levels.
Manufacturing
We employ a fabless business model and use third-party foundries and assembly and test contractors to manufacture, assemble and test our solutions. This outsourced manufacturing approach allows us to focus our resources on the design, sales and marketing of our solutions and avoid the cost associated with owning and operating our own manufacturing facility. Our engineers work closely with foundries and other contractors to increase yields, lower manufacturing costs and improve quality. In addition, we believe outsourcing many of our manufacturing and assembly activities provides us the flexibility needed to respond to new market opportunities, simplifies our operations and significantly reduces our capital requirements. We do not have a guaranteed level of production capacity from any of our suppliers’ facilities to produce our solutions. We carefully qualify each of our suppliers and their subcontractors and processes in order to meet the extremely high-quality and reliability standards required of our solutions.
Our sales are primarily made through standard purchase orders for delivery of products. Our manufacturing production is based on estimates and advance non-binding commitments from customers as to future purchases. We follow industry practice that allows customers to cancel, change or defer orders with limited advance notice prior to shipment. Given this practice, we do not believe that backlog is a reliable indicator of future revenue levels.
Wafer Fabrication
We have a history of using several process nodes from 130nm130 nm through 10nm.5 nm. We aim to use the most advanced manufacturing process technology appropriate for our products that is available from our third-party foundries. As a result, we periodically evaluate the benefits of migrating our solutions to smaller geometry process technologies in order to improve performance and efficiency. We believe this strategy will help us remain competitive. While we currently manufacture the majority of our solutions in 28nm silicon wafer productionthe 28 nm, 14 nm and 10 nm process geometry utilizing the services of several different foundries. In fiscal year 2015, we began investing in developmentnodes, our most recent products are manufactured in the 14nm5 nm process node, and we announced our first 14nm SoC in January 2016 and our second 14nm SoC in January 2017. In fiscal year 2017, we began investing in development innode. Currently, the 10nm process node, and we announced our first 10nm SoC in January 2018. Currently, thesubstantial majority of our SoCs are supplied by Samsung Electronics Co., Ltd., or Samsung in facilities located in Austin, Texas and South Korea, from whom we have the option to purchase both fully-assembled and tested products as well as tested die in wafer form for assembly. We also have small volumes of some products supplied by Global UniChip Corporation, or GUC, in Taiwan, from whom we purchase fully-assembled and tested products. The wafers used by GUC in the assembly of our productsGlobalFoundries Inc. Our foundry vendors are manufactured by Taiwan Semiconductor Manufacturing Co., Ltd., or TSMC, in Taiwan.ISO 9001 certified.
Assembly and Testing
Samsung subcontracts the assembly and initial testing of the assembled chips it supplies to us to Signetics Corporation and STATS ChipPAC Ltd. In the case of purchases of tested die from Samsung, we contract the assembly to Advanced Semiconductor Engineering, Inc., or ASE. GUC subcontractsWe contract the assembly of the products it suppliessupplied by Global Foundries Inc. to us to ASE and Powertech Technology Inc.ASE. Final testing of all of our products is handled primarily by Sigurd Corporation or King Yuan Electronics Co., Ltd. or Sigurd Corporation under the supervision of our engineers. All test software and related processes for our products are developed by our engineers. We continually monitor the results of testing at all of our test contractors to ensure that our testing procedures are properly implemented.
As part of our total quality assurance program, our quality management system has been certified to ISO 9001:20002015 standards. Our foundryassembly and testing vendors are also ISO 9001 certified.
Due to the scheduling requirements of our foundry, assembly and test contractors, we generally provide our contractors with our production forecasts and place firm orders for products with our suppliers up to 36 weeks prior to the anticipated delivery date, or potentially longer during times of acute capacity shortages, usually without a purchase order from our own customers.
14
Research and Development
We believe our technology is a competitive advantage and we engage in substantial research and development efforts to develop new products and integrate additional features andAI computer vision capabilities into our HD and UHD video processing solutions, such as computer vision capabilities.solutions. We believe that our continued success depends on our ability to both introduce improved versions of our existing solutions and to develop new solutions for the markets that we serve. As of January 31, 2018, 81%2024, approximately 75% of our employees are engaged in research and development. Our research and development team is comprised of both semiconductor and software designers. Our semiconductor design team has extensive experience in large-scale semiconductor design, including architecture description, logic and circuit design, implementation and verification. Our software design team has extensive experience in development and verification of software for the HD video market. Because the integration of hardware and software is a key competitive advantage of our solutions, our hardware and software design teams work closely together throughout the product development process. The experience of our hardware and software design teams enables us to effectively assess the tradeoffs and advantages when determining which features and capabilities of our solutions should be implemented in hardware and in software.
We have assembled a core team of experienced engineers and systems designers in four research and development design centers located in the United States, China, Italy, and Taiwan.
For the fiscal years ended January 31, 2018, 2017 and 2016, our research and development expense was $115.5 million, $101.2 million and $82.9 million, respectively.Competition
Competition
The global semiconductor market in general, and the AI and video and image processing markets in particular, are highly competitive. We expect competition to increase and intensify as more and larger semiconductor companies enter our markets and as we enterpenetrate new markets.markets, such as the automotive OEM market. Increased competition could result in price pressure, reduced profitability and loss of market share, any of which could materially and adversely affect our business, revenue and operating results.
Our competitors range from large, international companies offering a wide range of semiconductor products to smaller companies specializing in narrow markets. In the wearable sports cameraIoT market, our primary competitors are vertically integrated divisions of camera device OEMs, including Sony Corporation, or Sony, and Panasonic Corporation, as well asinclude AMLogic Inc., Fuzhou Rockchip Electronics Co., Ltd., HiSilicon Technologies Co., Ltd., or HiSilicon, and Socionext Inc.which is owned by Huawei Technologies Co., or Socionext, an entity created from the merger of the system LSI businesses of Fujitsu Ltd. and Panasonic Corporation. In the IP security camera market, our primary competitors include Fullhan MicroelectronicsIngenic Semiconductor Co., Ltd., Geo Semiconductor, Inc., Grain Media, Inc., which was recently acquired by Novatek Microelectronics Corp., or Novatek, HiSilicon, IntelNVIDIA Corporation, or Intel, Movidius Ltd., which was recently acquired by Intel,NVIDIA, OmniVision Technologies, Inc., or OmniVision, Qualcomm Incorporated, or Qualcomm, Realtek Semiconductor Corp.Sigmastar Technology Ltd., and Socionext and Texas Instruments Incorporated, or Texas Instruments, as well as vertically integrated divisions of IP Security camera device OEMs, including Axis Communications AB and Sony.Inc. In the automotive camera market, we compete against Allwinner Technology Co., Ltd., Alpha ImagingHorizon Robotics Inc., iCatch Technology, Corp., Core Logic, Inc., Mobileye, a subsidiary of Intel Corporation, Novatek, NVIDIA, NXP Semiconductors N.V., OmniVision, Qualcomm, Renesas Electronics Corporation, Sunplus Technology Co. Ltd., and Texas Instruments. Our primary competitors in the UAV camera market include HiSilicon, Intel, NVIDIA Corporation and Qualcomm. Our primary competitors in the infrastructure market include GigPeak, Inc., Intel, and Texas Instruments. Certain of our customers and suppliers also have divisions that produce products competitivethat compete with ours.
Our ability to compete successfully depends on elements both within and outside of our control, including industry and general economic trends. Many of our competitors are substantially larger, have greater financial, technical, marketing, distribution, customer support and other resources, are more established than we are, and have significantly better brand recognition and broader product offerings which may enable them to develop and enable new technology into product solutions better or faster than us and to better withstand adverse economic or market conditions in the future.
Our ability to compete successfully in the rapidly evolving HD video marketcamera markets depends on several factors, including:
the design and manufacturing of new solutions, including software, that anticipate the video processing and integration needs of our customers’ next-generation products and applications;
performance of our computer vision solutions, as measured by convolutional neural network performance, video and still picture image quality, resolution and frame processing rates;
power consumption efficiency of our solutions;
the ease of implementation of our products by customers;
the strength of our customer relationships;
the selection of the foundry process technology and architecture tradeoffs to meet customers’ product requirements in a timely manner;
reputation and reliability;
customer support; and
the cost of the total solution.
15
We believe we compete favorably with respect to these factors, particularly because our solutions typically provide high-performance and low power consumption video, CNN performance, efficient integration of our advanced algorithms, exceptional storage and transmission efficiencies at lower power, highly-integrated SoC solutions based on a scalable platform, and comprehensive and flexible software. We cannot ensure, however, that our solutions will continue to compete favorably or that we will be successful in the face of increasing competition from new products introduced by existing or new competitors.
Intellectual Property
We rely on a combination of intellectual property rights, including patents, trade secrets, copyrights and trademarks, and contractual protections, to protect our core technology and intellectual property. As of January 31, 2018,2024, we had 107344 issued patents in the United States, 42123 of which were continuation or divisional patents, six10 issued patents issued in Europe, five8 issued patents in China, six8 issued patents in Japan and 7864 pending and provisional patent applications in the United States. The issued and allowed patents in the United States expire beginning in 2024 through 2035. Many of our2042. Our issued patents and pending patent applications primarily relate to image and video processing and HD video compression.compression, AI processing, system level camera, and radar perception applications spanning multiple market segments.
We may not receive competitive advantages from any rights granted under our patents, and our patent applications may not result in the issuance of any new patents. In addition, any patent we hold may be opposed, contested, circumvented, designed around by a third party or found to be unenforceable or invalidated. Others may develop technologies that are similar or superior to our proprietary technologies, duplicate our proprietary technologies or design around patents owned or licensed by us.
In addition to our own intellectual property, we also use third-party licenses for certain technologies embedded in our SoC solutions. These are typically non-exclusive contracts provided under royalty-accruing or paid-up licenses. These licenses are generally perpetual or automatically renewed for so long as we continue to pay any maintenance fees that may be due. To date, maintenance fees have not constituted a significant portion of our capital expenditures. While we do not believe our business is dependent to any significant degree on any individual third-party license, we expect to continue to use and may license additional third-party technology for our solutions.
We generally control access to and use of our confidential information through employing internal and external controls, including contractual protections with employees, contractors and customers. We rely in part on U.S. and international copyright laws to protect our mask work. All employees and consultants are required to execute confidentiality agreements in connection with their employment and consulting relationships with us. We also require them to agree to disclose and assign to us all inventions conceived or made in connection with the employment or consulting relationship.
Despite our efforts to protect our intellectual property, unauthorized parties may still copy or otherwise obtain and use our software, technology or other information that we regard as proprietary intellectual property. In addition, we intendcontinue to expand our international operations,operate internationally, and effective patent, copyright, trademark and trade secret protection may not be available or may be limited in foreign countries.
The semiconductor industry is characterized by vigorous protection and pursuit of intellectual property rights and positions, which has resulted in protracted and expensive litigation for many companies. Our customers have in the past received, and we expect that in the future we may receive, communications from various industry participants alleging infringement of their patents, trade secrets or other intellectual property rights by our solutions. In addition, certain of our end customers have been the subject of lawsuits alleging infringement of patents by products incorporating our solutions. Any lawsuits could subject us to significant liability for damages, invalidate our proprietary rights and harm our business and our ability to compete. Any litigation, regardless of success or merit, could cause us to incur substantial expenses, reduce our sales and divert the efforts of our technical and management personnel. In the event we receive an adverse result in any litigation, we could be required to pay substantial damages, seek licenses from third parties, which may not be available on reasonable terms or at all, cease sale of products, expend significant resources to develop alternative technology or discontinue the use of processes requiring the relevant technology.Seasonality
Seasonality
Our business tendshas tended to be seasonal with higher revenue in our second and third fiscal quarterquarters as our customers typically increase their production to meet holiday shopping season or year-end demand for their products. We also may experience seasonally lower demand in our first and fourth fiscal quarterquarters due in part to the Asia-based portion of the IP security camera market as a result of industry seasonality and the impact of ODM and OEM factory closures associated with the Chinese New Year holiday. These seasonal fluctuations may diminish if our revenue diversifies and becomes less dependent on sales of our customers’ consumer products.
EmployeesGovernmental Regulation
AtOur business and operations around the world are subject to government regulation at the national, state or local level addressing, among other matters, applicable environmental laws, health and safety laws and regulations, laws relating to export controls and economic sanctions, and the rules of industrial standards bodies such as the International Standards Organization and governmental agencies such as the Federal Trade Commission.
16
We believe that our properties and operations comply in all material respects with applicable laws protecting the environment and worker health and safety. As a fabless semiconductor company, we do not manufacture our own products but do maintain laboratory space at certain of our facilities to facilitate the development, evaluation and testing of our SoC products. These laboratories may maintain small quantities of hazardous materials. While we believe we are in material compliance with applicable law concerning the safeguarding of these materials and with respect to other matters relating to health, safety and the environment, the risk of liability relating to hazardous conditions or materials cannot be eliminated completely. To date, we have not incurred significant expenditures relating to environmental compliance at our facilities nor have we experienced any material issues relating to employee health and safety.
In addition to environmental and worker health and safety laws, our business is subject to various rules and regulations and executive orders relating to export controls and trade sanctions. Certain of our products are subject to the Export Administration Regulations (EAR), which are administered by the United States Department of Commerce’s Bureau of Industry and Security (BIS), and we may from time to time be required to obtain an export license before we can export certain products or technology to specified countries or customers. In addition, the EAR imposes broad controls on entities listed on sanctioned persons lists, including the BIS Entity List. If one of our customers is listed on the BIS Entity List or another U.S. government sanctioned persons’ list, then subject to certain exceptions, we will, as a general rule, be precluded from doing business with that customer. For example, certain of our Chinese customers, or their affiliated entities, have been added to the BIS Entity List in the last couple of years, which limits our ability to ship certain products to these customers. We cannot guarantee that export control restrictions or sanctions imposed in the future will not prevent, or materially limit, our ability to conduct business with certain customers or in certain countries. Any failure to comply with these laws could result in governmental enforcement actions, including substantial monetary penalties and denial of export privileges.
Human Capital Resources
Innovation has been the lifeblood of our company since our founding in 2004. We continually strive to develop leading-edge image and video, and now AI, processors using the most advanced semiconductor processes available to create high performance, power efficient SoCs. We depend on our people to sustain our competitive advantages.
As of January 31, 2018,2024, we employed a total of 706915 people, including 154253 in the United States, 505581 in Asia, primarily 343 in Taiwan and 224 in China, and Taiwan and 4781 in Europe. We also engage temporary employees and consultants. NoneApproximately 75% of our employees are eitherengaged in research and development, 2% in operations, and 23% in sales, marketing and administration. As of January 31, 2024, women represented 29% of our independent directors, 19% of senior management, 17% of our technical roles, and 20% of our total workforce. Of our total employee workforce, approximately 37% is represented by a labor union or subject to a collective bargaining agreement.work council in Taiwan. The work council group, which is common in Taiwan, is comprised of employees elected by the general employee base in that location. We have not experienced any work stoppages, and we consider our global employee relations to be good. Despite employees working in geographically disparate locations and differences in cultures, we strive to treat all employees as part of one team working together. Our Chief Executive Officer holds quarterly town hall style meetings with employees of all of our offices to keep employees apprised of company activities and objectives and to provide an opportunity for all employees to meet and ask questions. All employees receive training in the prevention of sexual harassment and abusive conduct in the workplace.
Our human capital resources objectives include attracting and retaining talented and experienced employees. We utilize multiple online search tools, specialized recruiting firms, employee referral programs and university hires to ensure a varied outreach approach for candidates. We are committed to ensuring the human rights of our worldwide workforce and treating all employees with dignity and respect. We offer a combination of competitive base salary, time-based equity incentives and bonus plans linked to financial and strategic performance that are designed to motivate and reward personnel with annual grants of stock-based and cash-based incentive compensation awards, plus other benefits, in order to increase stockholder value and the success of our company by motivating such individuals to perform to the best of their abilities and achieve both our short and long-term objectives. We offer competitive benefits tailored to local markets and laws and designed to support employee health, welfare and retirement; examples of such benefits include paid time off; 401(k), pension or other retirement plans; an employee stock purchase plan; basic and voluntary life, disability and supplemental insurance; medical, dental and vision insurance; health savings and flexible spending accounts; relocation assistance; and employee assistance programs. Approximately 90% of eligible U.S. employees participate in our 401(k) plan, and 91% of eligible employees participated in the most recent offering period of our employee stock purchase plan.
The average tenure of our employees is approximately 7.6 years and approximately 31% of our employees have been employed by us for more than 10 years. We believe our compensation and benefits packages, combined with our employeesculture that promotes teamwork, innovation and hands-on experience from the first day of employment, contribute to be good.low employee turnover and an above-average tenure. We monitor employee turnover rates by region and our company as a whole. Our worldwide voluntary employee turnover rate in fiscal year 2024 was approximately 5.6%.
17
Corporate Information
Ambarella was founded and incorporated in the Cayman Islands in January 2004. Our registered address is PO Box 309GT, Ugland House, South Church Street, George Town, Grand Cayman, Cayman Islands. The address of our U.S. operating subsidiary is Ambarella Corporation, 3101 Jay Street, Santa Clara, California. The Securities and Exchange Commission, or SEC, maintains a website at www.sec.gov that contains reports, proxy, and information statements, and other information regarding registrants that file electronically. You may also obtain copies of our Forms 10-K, 10-Q, 8-K, and other filings with the SEC, and all amendments to these filings, free of charge, by visiting the Investor Relations page on our website (http://investor.ambarella.com) as soon as reasonably practicable following our filing of any of these reports with the SEC. Information concerning revenue, results of operations, assets and revenue by geographic areaon our website is set forth in Item 6, “Selected Financial Data” and Note 15, “Segment Reporting,” of Notes to Consolidated Financial Statements ofnot incorporated into this Annual Report on Form 10-K or our other securities filings and is incorporated herein by reference. Information concerning risks attendant to our foreign operations is set forth below in Item 1A, “Risk Factors.”not a part of such filings.
Certain factors may have a material adverse effect on our business, financial condition and results of operations. You should consider carefully the risks and uncertainties described below, in addition to other information contained in this Annual Report on Form 10-K, including our consolidated financial statements and related notes. The risks and uncertainties described below are not the only ones we face. Additional risks and uncertainties that we are unaware of, or that we currently believe are not material, may also become important factors that adversely affect our business. If any of the following risks actually occurs, our business, financial condition, results of operations, and future prospects could be materially and adversely affected. In that event, the trading price of our ordinary shares could decline, and you could lose part or all of your investment.
Risks Related
Summary of Risk Factors
Our business and our industry is subject to Our Businessnumerous risks and Our Industryuncertainties, including those described in the following Risk Factors. These risks include, but are not limited to, the following:
18
19
Risks Related to Our Business and Our Industry
Impacts of the global semiconductor supply shortage and uncertain macroeconomic conditions could adversely affect our business, financial condition, and results of operations.
During the COVID-19 global pandemic, various restrictions were put in place causing a temporary decline in demand for certain items. As restrictions began easing across the world, an increase in demand for products containing semiconductor chips exacerbated bottlenecks in the supply chain, resulting in a global semiconductor supply shortage impacting our industry, which resulted in a lengthening of the manufacturing lead time for our products and impacting the normal forecasting and ordering patterns of our customers. While we work closely with our suppliers and customers to minimize the potential adverse impacts of these considerations of supply shortage and longer lead times, we have experienced increased volatility in our business. In recent periods, some customers have indicated they are reducing their inventory levels as lead times for semiconductor chips and other components used by customers begin to shrink, which has reduced, and may continue to reduce, such customers’ demand for our products and harm our financial results. Weak economic conditions or uncertain demand for their products may exacerbate such customers’ inventory reduction efforts, further impacting such customers’ demand for our products. To the extent customers face supply chain issues with respect to other components needed to pair with our products in order to produce their end products, such customers may delay future orders of our products or hold inventory of our products for longer periods of time. With respect to our suppliers, we have in the past experienced supply constraints for certain chips from Samsung and we may in the future experience similar issues. Impacts of the global supply shortages and uncertainty in customer demand and the worldwide economy in general may be exacerbated by the impacts of high inflation and global banking concerns, and we may experience increased volatility in sales and revenues as a result.
If our customers do not design our solutions into their product offerings, or if our customers’ product offerings are not commercially successful, our business would suffer.
We sell our video and image processing system-on-a-chip, or SoC, solutions to original equipment manufacturers, or OEMs, who include our SoCs in their products, and to original design manufacturers, or ODMs, who include our SoCs in the products that they supply to OEMs. We generally refer to ODMs as our customers and OEMs as our end customers, except as otherwise indicated or as the context otherwise requires. Our video and image processing SoCs are generally incorporated into our customers’ products at the design stage, which is referred to as a design win. As a result, we rely on OEMs to design our solutions into the products that they design and sell. Without these design wins, our business would be significantly harmed. We often incur significant expenditures developing a new SoC solution without any assurance that anany OEM will select our solution for design into its own product. Once an OEM designs a competitor’s device into its product, it becomes significantly more difficult for us to sell our SoC solutions to that OEM because changing suppliers involves significant cost, time, effort and risk for the OEM. We anticipate that it will take longer and require more resources and greater expenditures to achieve design wins, and likely take longer to generate revenue from such design wins, in the new markets we are targeting, such as the OEM automotive and robotics markets, than our legacy camera markets. We also face certain competitive disadvantages in these markets relative to larger competitors that have significantly more resources and a longer history working with OEMs and ODMs in these markets. In addition, trade tensions between the United States and China and potential new export restrictions may make it more difficult to secure future design wins with China customers.
Even if an OEM designs one of our SoC solutions into its product, we cannot be assured that the OEM’s product will be commercially successful over time or at all. For example, in the past we have secured design wins for cameracustomer products that were never commercially released by our customer or did not sell in volumes initially forecast by the customer, as a result of factors beyond our control. Similarly, higher than normal customer inventory levels at GoPro, Inc., or GoPro, significantly reduced GoPro’s demand for our solutions and negatively reduced our revenue in the fiscal quarter ended January 31, 2016 and in the first half of fiscal years 2017 and 2018. If other products or other product categories incorporating our SoC solutions are not commercially successful or experience rapid decline, our revenue and business will suffer.
Similarly, even if an OEM designs one of our SoC solutions into its product, we are not assured that we will receive or continue to receive new design wins from that OEM. For example, GoPro,OEM, which could negatively impact our largestbusiness.
If we fail to penetrate new markets, including the automotive OEM customerand ADAS market, our revenue and financial condition could be harmed.
20
We believe that our future revenue growth, if any, significantly depends on our ability to expand within the Internet of Things, or IoT, camera markets with our new artificial intelligence, or AI, computer vision SoC solutions, and the OEM automotive, robotics and industrial markets. Our AI computer vision SoC solutions have functionality that may also be applicable to other developing markets, such as processing of large language models (LLMs). Each of these markets presents distinct and substantial risks and, in fiscal year 2017,many cases, requires us to develop new functionality or software to address the particular requirements of that market. If any of these markets do not develop as we currently anticipate, the technical requirements of these markets evolve in ways we do not anticipate, the development of such markets is delayed or impacted by factors outside of our control, or if we are unable to penetrate them successfully with our solutions, our revenue could decline and our financial condition would be negatively impacted. Some of these markets are primarily served by only a few large, multinational OEMs with substantial negotiating power relative to us and, in some instances, with internal solutions that are competitive to our products. Meeting the technical requirements and securing design wins with any of these companies requires a substantial investment of our time and resources and we cannot assure you that we will secure design wins from these or other companies or that we will achieve meaningful revenue from the sales of our solutions into these markets. In addition, we face competition from larger competitors with greater resources and more history in these markets, which may put us at a competitive disadvantage to these larger competitors. If we fail to penetrate these or other new markets we are targeting, our financial condition would likely suffer. Moreover, if we are successful in achieving design wins in these new markets, it will likely take longer to generate revenue from such design wins than in our traditional markets.
If we fail to develop and introduce new or enhanced solutions that meet market requirements on a timely basis, our ability to attract and retain customers could be impaired and our competitive position could be harmed.
We operate in a dynamic environment characterized by rapidly changing technologies. To compete successfully, we must design, develop, market and sell enhanced solutions that provide increasingly higher levels of performance and functionality and that meet the technical and cost expectations of our customers. Our existing or future solutions could be rendered obsolete by the introduction of new products by our competitors; convergence of other markets with or into the camera market; the market adoption of products based on new or alternative technologies; the emergence of new industry standards applicable to our solutions; or the requirement of additional functionality included in video processors. In addition, some of the markets for our solutions are characterized by frequent introduction of next-generation and new products, short product life cycles, increasing demand for added functionality and significant price competition. As we develop and introduce new solutions, we also face the risk that customers may not value or be willing to bear the cost of incorporating these newer solutions into their products, particularly if they believe their customers are satisfied with current solutions. Regardless of the improved features or superior performance of the newer solutions, customers may be unwilling to adopt our new solutions due to design or pricing constraints. If we or our customers are unable to manage product transitions in a timely and cost-effective manner, our business and results of operations would suffer.
Our failure to anticipate or timely develop new or enhanced solutions in response to technological shifts could result in decreased revenue and our competitors achieving design wins that we sought. In particular, we may experience difficulties with product design, development of new software, manufacturing, marketing or qualification that could delay or prevent our development, introduction or marketing of new or enhanced solutions. In addition, for some markets, such as the automotive OEM market, we need to establish and maintain relationships with third-party suppliers or software providers in order to effectively market our solutions to end-customers. Failure to establish these relationships could harm our ability to achieve design wins. Delays in product development could impair our relationships with our customers and negatively impact sales of our solutions under development. If we fail to introduce new or enhanced solutions that meet the needs of our customers or penetrate new markets in a timely fashion, we will lose market share, and our operating results will be adversely affected.
Uncertain risks relating to the adoption, use or application of emerging technologies, including artificial intelligence, by our customers and in our business, could adversely impact our financial results and result in reputational harm and liability.
Many of our products support AI functionality implemented in our customers’ products, such as object detection, classification and tracking, image processing, and terrain mapping. Our latest generation of products also enable us to address computationally intense AI applications for deep fusion, deep planning, and large language models (LLMs) in edge devices. The adoption of AI solutions may not develop in the manner or in the time periods we anticipate and, as the markets for AI solutions are still developing, demand for these products may be unpredictable and vary significantly from one period to another. These factors may adversely impact demand for our AI related products. In addition, compliance with evolving government regulations worldwide related to AI may increase the costs related to the development of AI products and solutions and limit global adoption, which may also adversely impact demand for our AI related products.
21
Concerns relating to the responsible use of AI in our and our customers’ products may result in reputational and financial harm and liability. AI poses emerging ethical issues and presents risks and challenges that could affect its adoption, and therefore our business. If we or our customers enable or offer solutions that draw controversy due to their perceived or actual impact on society, such as AI solutions that have unintended consequences or are controversial, we may experience reputational harm, competitive harm or legal liability.
Shortages in, or increased costs of, wafers and materials could adversely impact our gross margins and lead to reduced revenues.
Worldwide manufacturing capacity for silicon wafers is relatively inelastic. If the demand for silicon wafers or assembly material exceeds market supply, our supply of silicon wafers or assembly material could quickly become limited or prohibitively expensive. Silicon wafers constitute a material portion of our product cost and if we are unable to purchase wafers at favorable prices, our results of operations and financial condition will be adversely affected. The semiconductor industry has usedrecently experienced significant shortages of manufacturing capacity, which resulted in a competing solution in onelengthening of its recently introduced mainstream cameras,the manufacturing lead time for our products and which has hadat times harmed our revenue. While this capacity shortage has improved, lead times for our products remain longer than normal, which could negatively impact our ability to meet our customer’s demand for our products and will continuehave an adverse impact on our revenue, results of operations and customer relationships. We have also experienced, during times of supply chain capacity shortages, customers placing orders for our products that exceed their actual demand, which may lead to us manufacturing a surplus of products and could have a significant negative impact on our revenue. In fiscal year 2018, revenues for direct shipments to GoPro accounted for approximately 12%results of our total revenue. We estimated that the revenues for shipments to GoPro’s ODMs represented an additional approximately 1% of our total revenue in fiscal year 2018. We anticipate that revenue from GoPro will represent a significantly smaller percentage of our total revenue in fiscal year 2019operations and beyond.
We depend on a limited number of customerscash reserves and end customers for a significant portion of our revenue. If we fail to retain or expand our customer relationships, our revenue could decline.
We derive a significant portion of our revenue from a limited number of ODMs who build products on behalf of a limited number of OEMs and from a limited number of OEMs to whom we ship directly. We anticipate that this customer concentration will continue for the foreseeable future. In fiscal years 2018, 2017 and 2016, sales directly and through our distributorslead to our five largest ODMcustomers having excess inventory. In recent periods, some customers have indicated they are reducing their inventory levels as lead times for semiconductor chips and OEMother components used by customers collectively accounted for approximately 51%, 56% and 56% of our total revenue, respectively, and sales to our ten largest ODM and OEM customers collectively accounted for approximately 65%, 68% and 69% of our total revenue, respectively. We believe that our operating results for the foreseeable future will continue to depend on sales to a relatively small number of customers and end-customers. In the future, these customersshrink, which may decide not to purchase our SoC solutions at all, may purchase fewer solutions than they did in the past or may alter their purchasing patterns. As substantially all of our sales to date have been made on a purchase order basis, these customers may cancel, change or delay product purchase commitments with little or no notice to us and without penalty and may make our revenue volatile from period to period. For example, GoPro, our largest OEM customer in fiscal year 2017, has used a competing solution in one of its recently introduced mainstream cameras, which had and will continue to have a significant negative impact on our revenue. Similarly, our customer DJI recently introduced a UAV incorporating a competing solution that we expect will negatively impact DJI’sreduce such customers’ demand for our solutionsproducts in future periods. The loss of a significant customer, or substantial reduction in purchases by a significant customer, could happen again at any timeperiods and without notice, and such loss would likely harm our financial conditionresults.
Our primary inventory warehouse is located in Hong Kong and results of operations. Moreover, because severalmay be affected by continued political, social, health and economic conditions in Hong Kong.
We operate a warehouse facility in Hong Kong through which the substantial majority of our largest OEMfinished SoCs are shipped to customers or our logistic partners. Hong Kong has experienced, and continues to experience, political unrest and social strife in addition to the impact of the COVID-19 pandemic. The Bureau of Industry and Security, or BIS, has imposed restrictions on exports and reexports of U.S.-controlled items to Hong Kong by imposing on Hong Kong the same stringent licensing requirements applicable to China. It is possible that the U.S. government may take future measures to impose stricter export controls or duties on shipments made to Hong Kong, which could harm our business, increase the cost of conducting our operations in Hong Kong or result in retaliatory actions against U.S. interests. While we have not been materially impacted by these problems to date, continued deterioration in political, social or economic conditions in Hong Kong or future unforeseen problems, including health pandemics, could affect deliveries of our SoCs to our customers or logistic partners, possibly resulting in business interruptions, substantially delayed or lost sales, loss of inventory, or increased expenses that cannot be passed on to customers, any of which could ultimately have a dominant positionmaterial adverse effect on our business and financial results. In addition, we could be forced to relocate our warehouse operations, either temporarily or permanently, to another potentially costlier location (or a location resulting in theirhigher tax costs) or find alternative potentially costlier methods of shipping our finished SoCs to customers and logistic partners.
Our target markets a loss of a significant customer may not grow or develop as we currently expect and are subject to market risks, any of which could harm our business, revenue and operating results.
We are focusing our development resources on addressing computer vision applications, primarily in the automotive and IoT markets. The application of computer vision functionality in these markets is relatively new, and we may be easily replaced through salesunable to other customerspredict the timing or development of these markets with accuracy. For example, a slower than expected adoption rate for AI technology in that market.
In addition,automotive or IP security camera applications could slow the demand for our relationships with some customers may deter other potential customers who compete with these customers from buyingnew solutions. Similarly, changes in the projected growth rate for ADAS or autonomous driving technology in the automotive market due to government regulations or changes in consumer preferences could negatively impact demand for our solutions. To attract new customersIf our key target markets do not grow, grow slower, or retain existing customers,do not develop in ways that we currently expect, demand for our SoCs may have to offer these customers favorable prices onnot materialize as expected, and our solutions. In that event, our average selling pricesbusiness and gross margins would decline. The loss of a key customer, a reduction in sales to any key customer or our inability to attract new customersoperating results could seriously impact our revenue and harm our results of operations.suffer.
Our customers may cancel their orders, change production quantities or delay production. If we fail to accurately forecast demand for our solutions, revenue shortfalls or excess, obsolete or insufficient inventory could result.
22
Our customers typically do not provide us with firm, long-term purchase commitments. Substantially allA substantial majority of our sales are made on a purchase order basis, which permits our customers to cancel, change or delay their product purchase commitments with little or no notice to us and often without penalty to them. Because production lead times often exceed the amount of time required by our customers to fill their orders, we often must build SoCs in advance of receiving orders from customers, relying on an imperfect demand forecast to project volumes and product mix. As a result of a number of factors, including longer manufacturing times for our products and increased demand from customers during fiscal year 2023, we increased our inventory levels. In recent periods, some customers have indicated they are reducing their inventory levels of our products, which may reduce such customers’ demand for our products in future quarters.
Our SoCs are incorporated into products manufactured by or for our end customers, and as a result, demand for our solutions is influenced by the demand for our customers’ products. Our ability to accurately forecast demand can be adversely affected by a number of factors, including inaccurate forecasting by our customers, miscalculations by our customers of their inventory requirements, changes in market conditions including reductions in market activity due to pandemics, adverse changes in our product order mix and fluctuating demand for our customers’ products. For example, higher than normal customer inventory levels at GoPro significantly impacted our revenue in the fiscal quarter ended January 31, 2016 and in the first half of fiscal years 2017 and 2018. Higher than normal customer inventory levels can occur in the future. Even after an order is received, our customers may cancel these orders, request a decrease in production quantities or request a delay in the delivery of our solutions. Any such cancellation, decrease or delay subjects us to a number of risks, most notably that our projected sales will not materialize on schedule or at all, leading to unanticipated revenue shortfalls and excess or obsolete inventory that we may be unable to sell to other customers.
Alternatively, if we are unable to project customer requirements accurately, we may not build enough SoCs, which could lead to delays in product shipments and lost sales opportunities in the near term, as well as force our customers to identify alternative sources, which could affect our ongoing relationships with these customers. We have in the past had customers significantly increase their requested production quantities with little or no advance notice. If we do not fulfill customer demands in a timely manner, our customers may cancel their orders and we may be subject to customer claims for cost of replacement. In addition, the rapid pace of innovation in our industry could render portions of our inventory obsolete. Excess or obsolete inventory levels could result in unexpected expenses or increases in our reserves that could adversely affect our business, operating results and financial condition.
We depend on a limited number of customers and end customers for a significant portion of our revenue. If we fail to retain or expand our customer relationships, our revenue could decline.
We derive a significant portion of our revenue from a limited number of ODMs who build products on behalf of a limited number of OEMs and from a limited number of OEMs to whom we ship directly. We anticipate that this customer concentration will continue for the foreseeable future. In fiscal year 2024, two customers represented 10% or more of our revenue. WT Microelectronics Co., Ltd., or WT, which serves as our non-exclusive sales representative and fulfillment partner in Asia other than Japan, and Chicony Electronics Co., Ltd., or Chicony, one ODM which manufactures devices incorporating our solutions on behalf of multiple end-customers, accounted for approximately 53% and 14% of total revenue, respectively. In addition, any significant future cancellationswe believe that revenue from our top 10 end customers, either directly or deferralsthrough a distributor or an ODM, accounted for approximately 51% of product orders could harm our margins, increasetotal revenue in fiscal year 2024. We believe that our write-offs due to product obsolescence and restrict our ability to fund our operations.
Our target markets may not grow or develop as we currently expect and are subject to market risks, any of which could harm our business, revenue and operating results.
To date, our revenue has been attributable to demand for our video and image processing SoCsresults in the cameranear term will continue to depend on sales to a relatively small number of customers and infrastructure markets andend customers. In the growth offuture, these overall markets. We initially focused oncustomers may decide not to purchase our SoC solutions at all, may purchase fewer solutions than they did in the infrastructure market, and then leveraged our knowledge and experience to design solutions for the camera market. We now derivepast or may alter their purchasing patterns. As substantially all of our sales to date have been made on a purchase order basis, these customers may cancel, change or delay product purchase commitments with little or no notice to us and often without penalty and may make our revenue volatile from the camera market, and our operating results are increasingly affected by trendsperiod to period, which has happened in the camera market. These trends include demand for higher resolution, increasing functionality, longer battery life, greater storage, connectivity requirements and computer vision technology, while accommodating more sophisticated standards for video compression. We may be unable to predict the timingpast. The loss of a significant customer, or development of these markets with accuracy. For example, the proliferation of smartphones having the ability to capture high-quality video and still images has significantly impacted the camera marketsubstantial reduction in purchases by a relatively short period ofsignificant customer, could happen again at any time and continues to impact this market. In the Internet Protocol, or IP, security camera market, a slower than expected adoption rate for digital technology in place of analog solutions could slow the demand for our solutions. In the automotive market, a slower than anticipated adoption of advanced driving assistance systemswithout notice, and autonomous driving functionality could reduce demand for our new computer vision solutions. If our target markets, such as wearable cameras, automotive cameras, IP security cameras, and unmanned aerial vehicle cameras, also referred to as UAVs or drones, do not grow or develop in ways that we currently expect, demand for our video and image processing SoCs may not materialize as expected and our business and operating results could suffer.
If we fail to penetrate new markets, our revenue and financial condition could be harmed.
In the past several years, substantially all of our revenue was generated from sales of our products to OEMs and ODMs of HD video cameras. Our future revenue growth, if any, will depend in part on our ability to expand within the camera markets with our video and image processing SoC solutions, particularly in the professional IP security and home security and monitoring camera markets, the automotive camera market, and the UAV market, as well as emerging markets such as the virtual reality camera and robotics markets. Each of these markets presents distinct and substantial risks and, in many cases, requires us to develop new functionality or software to address the particular requirements of that market. For example, we expect that computer vision functionality will become an increasingly important requirement in many of our current and future markets, including automotive, IP security, UAV, wearable camera and robotics markets. As a result, we believe that our ability to develop advanced computer vision technology and gain customer acceptance of our technology will be critical to our future success. Development of products to address new markets, such as the OEM automotive and robotics markets, could negatively impact our ability to develop new products for our current markets, which mayloss would likely harm our financial condition particularly in the near term. In addition, we anticipate that as we move into new markets, such as the OEM automotive and robotics markets, we will likely face competition from larger competitors with greater resources and more history in these markets. If any of these markets do not develop as we currently anticipate or if we are unable to penetrate them successfully with our solutions, our revenue could decline.
Some of these markets are primarily served by only a few large, multinational OEMs with substantial negotiating power relative to us and, in some instances, with internal solutions that are competitive to our products. Meeting the technical requirements and securing design wins with any of these companies will require a substantial investment of our time and resources. We cannot assure you that we will secure design wins from these or other companies or that we will achieve meaningful revenue from the sales of our solutions into these markets. In addition, in these new markets, such as the OEM automotive and robotics markets, we will likely face competition from larger competitors with greater resources and more history in these markets.
If we fail to penetrate these or other new markets we are targeting, our revenue likely will decrease over time and our financial condition would likely suffer.
If we fail to develop and introduce new or enhanced solutions on a timely basis, our ability to attract and retain customers could be impaired and our competitive position could be harmed.
We operate in a dynamic environment characterized by rapidly changing technologies and technological obsolescence. To compete successfully, we must design, develop, market and sell enhanced solutions that provide increasingly higher levels of performance and functionality and that meet the cost expectations of our customers. Our existing or future solutions could be rendered obsolete by the introduction of new products by our competitors; convergence of other markets, such as smartphones, with or into the camera market; the market adoption of products based on new or alternative technologies; the emergence of new industry standards for video compression; or the requirement of additional functionality included in our products, such as analytics or computer vision functionality. In addition, the markets for our solutions are characterized by frequent introduction of next-generation and new products, short product life cycles, increasing demand for added functionality and significant price competition. If we or our customers are unable to manage product transitions in a timely and cost-effective manner, our business and results of operations would suffer.
Our failure to anticipate or timely develop new or enhanced solutions in response to technological shifts could result in decreased revenue and our competitors achieving design wins that we sought. In particular, we may experience difficulties with product design, development of new software, manufacturing, marketing or qualification that could delay or prevent our development, introduction or marketing of new or enhanced solutions. In addition, delays in development could impair our relationships with our customers and negatively impact salesoperations. Moreover, because several of our solutions under development. Moreover, it is possible that ourlargest OEM customers have a dominant position in their markets, a loss of a significant customer may develop their own product or adopt a competitor’s solution for products that they currently buy from us. If we fail to introduce new or enhanced solutions that meet the needs of our customers or penetrate new markets in a timely fashion, we will lose market share and our operating results willnot be adversely affected.easily replaced.
Fluctuations in our operating results on a quarterly and annual basis could cause the market price of our ordinary shares to decline.
Our revenue and operating results have fluctuated significantly from period to period in the past and are likely to do so in the future. In particular, our business tends to be seasonal with higher revenue in our third quarter as our customers typically increase their production to meet holiday shopping season or year-end demand for their products. We also may experience seasonally lower demand in our first quarter in the Asia-based portion of the IP security camera market as a result of industry seasonality and the impact of ODM and OEM factory closures associated with the Chinese New Year holiday. As a result, you should not rely on period-to-period comparisons of our operating results as an indication of our future performance. In future periods, our revenue and results of operations may be below the expectations of analysts and investors, which could cause the market price of our ordinary shares to decline.
Factors that may affect our operating results include:
fluctuations in demand, sales cycles, product mix, and prices for our products;
the forecasting, scheduling, rescheduling or cancellation of orders by our customers;
shifts in consumer preferences and any resultant change in demand for video and image capture devices into which our solutions are incorporated;
changes in the competitive dynamics of our markets, including new entrants or pricing pressures;
delays in our customers’ ability to manufacture and ship products that incorporate our solutions caused by internal and external factors beyond our control;
our ability to successfully define, design and release new solutions in a timely manner that meet our customers’ needs;
changes in manufacturing costs, including wafer, test and assembly costs, mask costs, manufacturing yields and product quality and reliability;
timely availability of adequate manufacturing capacity from our manufacturing subcontractors;
the timing of product announcements by our competitors or by us;
incurrence of research and development and related new products expenditures;
write-downs of inventory for excess quantities and technological obsolescence;
future accounting pronouncements and changes in accounting policies;
volatility in our share price, which may lead to higher stock-based compensation expense;
volatility in our effective tax rate;
general socioeconomic and political conditions in the countries where we operate or where our products are sold or used; and
costs associated with litigation, especially related to intellectual property.
Moreover, the semiconductor industry has historically been cyclical in nature, reflecting overall economic conditions as well as budgeting and buying patterns of consumers. We expect these cyclical conditions to continue. As a result, our quarterly operating results are difficult to predict, even in the near term. Our expense levels are relatively fixed in the short term and are based, in part, on our expectations of future revenue. If revenue levels are below our expectations, we may experience material impacts on our business, including declines in margins and profitability, or incur losses. For example, in the first half of fiscal year 2017 and in the fourth quarter of fiscal year 2018, our revenue declined 21% and 19%, respectively, compared to the same periods of the prior fiscal years, resulting in a substantial decline in profit and cash flows from operating activities. We may experience similar declines in the future, which would harm our operating results.
Achieving design wins is subject to lengthy competitive selection processes that require us to incur significant costs. Even if we begin a product design, a customer may decide to cancel or change its product plans, resulting in no revenue from such expenditures.
We are focused on selling our video and image processingSoC solutions to ODMs and OEMs for incorporation into their products at the design stage. These efforts to achieve design wins typically are lengthy, especially in emerging markets, we intend to address such as the OEM automotive market, and in any case can require us to both incur design and development costs and dedicate scarce engineering resources in pursuit of a single customer opportunity. We may not prevail in the competitive selection process, and even when we do achieve a design win, we may never generate any revenue despite incurring development expenditures. For example, in the past we had achieved certain design wins and projected substantial future revenue as a result of such design wins. Subsequently, based on factors outside of our control, the applicable end customers abruptly cancelled the projects, with no notice to us, resulting in a loss of projected revenue. In addition, even if an OEM designs one of our SoC solutions into one of its products, we cannot be assured that we will secure new design wins from that OEM for future products. For example, GoPro, our largest OEM customer in fiscal year 2017, has used a competing solution in one of its recently introduced mainstream cameras, which will have a significant negative impact on our revenue in the current fiscal year and beyond.
These risks are exacerbated by the fact that some of our end customers’ products, particularly in the camera market, likely will have short life cycles. Further, even after securing a design win, we have experienced and may again experience delays in generating revenue from our solutions as a result of the lengthy product development cycle typically required, if we generate any revenue at all as a result of any such design win.
23
Our customers generally take a considerable amount of time to evaluate our solutions. The typical time from early engagement by our sales force to actual product introduction runs from nine to 12 months for the camera market,IoT markets and 12 to 24 months for the infrastructure market, though it may takepotentially significantly longer in new markets we intend to address such as the OEM automotive, robotics and roboticsindustrial markets. The delays inherent in these lengthy sales cycles increase the risk that a customer will decide to cancel, curtail, reduce or delay its product plans, causing us to lose anticipated sales. In addition, any delay or cancellation of a customer’s plans could harm our financial results, as we may have incurred significant expense and generated no revenue. Finally, our customers’ failure to successfully market and sell their products could reduce demand for our SoC solutions and harm our business, financial condition and results of operations. If we were unable to generate revenue after incurring substantial expenses to develop any of our solutions, our business would suffer.
The average selling prices
Some of videoour customers may require our products and image processing solutionsour third-party contractors to undergo a qualification process that does not assure product sales. If we are unsuccessful or delayed in qualifying these products or third-party contractors with a customer, our target markets have historically decreased over timebusiness and will likely do sooperating results could suffer.
Prior to purchasing our products, some of our customers, particularly in the future,automotive market, may require that our products and our third-party contractors undergo extensive qualification processes, which could harminvolve testing of our revenue and gross margins.
Average selling prices of semiconductor products in the markets we serve have historically decreased over time,customers’ systems, as well as testing for reliability of our products and we expect such declinesour supply chain. This qualification process may take several months and qualification of a product by a customer does not assure any sales of the product to continuethat customer. Even after successful qualification and sales of a product to occur for our solutions over time. Our gross margins and financial results will suffer if we are unable to offset reductionsa customer, a subsequent revision in our average selling prices by reducingthird party contractors’ manufacturing process or our costs, developingselection of a new supplier may require a new qualification process, which may result in delays and in our holding excess or enhanced SoC solutions on a timely basisobsolete inventory. After our products are qualified, it can take several months or more before the customer commences volume production of components or systems that incorporate our products. Despite these uncertainties, we devote substantial resources, including design, engineering, sales, marketing and management efforts, to qualify our products with higher selling prices or gross margins, or increasing our sales volumes. Additionally, because we do not operate our own manufacturing, assembly or testing facilities, we may not be able to reduce our costs as rapidly as companies that operate their own facilities, and our costs may even increase, which could also reduce our gross margins. In the past, we have reduced the prices of our SoC solutionscustomers in anticipation of future competitive pricing pressures, new product introductions by ussales. If we are unsuccessful or our competitors and other factors. Recently, we have experienced competitive pricing pressures at the low endsdelayed in qualifying these products with a customer, sales of the automotive aftermarket camera marketproducts to the customer may be precluded or delayed, which may impede our growth and China-based IP security camera market. We expect that we will havecause our business to address pricing pressures again in the future, which could require us to reduce the prices of our SoC solutions and harm our operating results.suffer.
We expect competition to increase in the future, which could have an adverse effect on our revenue and market share.
The global semiconductor market in general, and the videocomputer vision and video/image processing markets in particular, are highly competitive. We compete in different target markets to various degrees on the basis of a number of competitive factors, including our solutions’ performance, features, functionality, energy efficiency, size, ease with which our solution may be integrated into our customers’ products, customer support, reliability and price, as well as on the basis of our reputation. We expect competition to increase and intensify as more and larger semiconductor companies enter our markets and as existing competitors improve or expand their product offerings. We also expect that the trend among large OEMs grow their internal resources and potentiallyto seek to develop their own semiconductor solutions.solutions will continue and expand, particularly in camera markets experiencing consolidation, such as the IP security market. In addition, as we move into newin our newer markets, such as the OEM automotive and robotics markets, we will face competition from larger competitors with greater resources, longer histories in these markets.markets and established relationships with OEMs and ODMs. Increased competition could result in price pressure, reduced profitability and loss of market share, any of which could harm our business, revenue and operating results.
Our competitors range from large, international companies with greater resources offering a wide range of semiconductor products to smaller, nimble companies specializing in narrow markets. In the wearable sports cameraIoT market, our primary competitors are vertically integrated divisions of camera device OEMs, including Sony Corporation, or Sony, and Panasonic Corporation, as well asinclude AMLogic Inc., Fuzhou Rockchip Electronics Co., Ltd., HiSilicon Technologies Co., Ltd., or HiSilicon, and Socionext Inc.which is owned by Huawei Technologies Co., or Socionext, an entity created from the merger of the system LSI businesses of Fujitsu Ltd. and Panasonic Corporation. In the IP security camera market, our primary competitors include Fullhan MicroelectronicsIngenic Semiconductor Co., Ltd., Geo Semiconductor, Inc., Grain Media, Inc., which was recently acquired by Novatek Microelectronics Corp., or Novatek, HiSilicon, IntelNVIDIA Corporation, or Intel, Movidius Ltd., which was recently acquired by Intel,NVIDIA, OmniVision Technologies, Inc., or OmniVision, Qualcomm Incorporated, or Qualcomm, Realtek SemiconductorSigmaStar Technology Corp., and Socionext and Texas Instruments Incorporated, or Texas Instruments, as well as vertically integrated divisions of IP Security camera device OEMs, including Axis Communications AB and Sony.Inc. In the automotive camera market, we compete against Allwinner Technology Co., Ltd., Alpha ImagingHorizon Robotics Inc., iCatch Technology, Corp., Core Logic, Inc., Mobileye, a subsidiary of Intel Corporation, Novatek, NVIDIA, NXP Semiconductors N.V., OmniVision, Qualcomm, Renesas Electronics Corporation, Sunplus Technology Co. Ltd., and Texas Instruments. Our primary competitors in the UAV camera market include HiSilicon, Intel, NVIDIA Corporation and Qualcomm. Our primary competitors in the infrastructure market include GigPeak, Inc., Intel, and Texas Instruments. Certain of our customers and suppliers also have divisions that produce products competitive with ours.ours and other customers may seek to vertically integrate competitive solutions in the future. In addition, certain third-party developers of technology competitive to our solutions have licensed their technology, including image signal processing and computer vision IP, which potentially enables a greater number of competitors to offer competitive solutions. We expect competition in our current markets to increase in the future as existing competitors improve or expand their product offerings and as potential new competitors enter these markets.
Our ability to compete successfully depends on elements both within and outside of our control, including industry and general economic trends.control. Many of our competitors are substantially larger, have greater financial, technical, marketing, distribution, customer support and other resources, are more established than we are and have significantly better brand recognition and broader product offerings than us, which may enable them to develop and enable new technology into product solutions better or faster than us and to better withstand adverse economic or market conditions in the future. Our ability to compete will depend on a number of factors, including:
our ability to anticipate market and technology trends and successfully develop solutions that meet market needs;
our success in identifying and penetrating new markets, applications and customers;
our ability to understand the price points and performance metrics of competing products in the marketplace;
our solutions’ performance and cost-effectiveness relative to that of competing products;
24
our ability to develop and maintain relationships with key OEMs and ODMs;
our products’ effective implementation of video processing or radar standards;
our ability to protect our intellectual property;
our ability to expand international operations in a timely and cost-efficient manner;
our ability to deliver products in volume on a timely basis at competitive prices;
our ability to support our customers’ incorporation of our solutions into their products; and
our ability to recruit design and application engineers with expertise in imagecomputer vision, video and image processing technologies and sales and marketing personnel.
Our competitors may also establish cooperative relationships among themselves or with third parties or acquire companies that provide similar products to ours. As a result, new competitors or alliances may emerge that could acquire significant market share. Any of these factors, alone or in combination with others, could harm our business and result in a loss of market share and an increase in pricing pressure.
A breach of our security systems may have a material adverse effect on our business.
Our security systems are designed to maintain the physical security of our facilities and information systems and protect our customers’, suppliers’ and employees’ confidential information. Accidental or willful security breaches or incidents or other unauthorized access by third parties to our facilities or our information systems or the existence of computer viruses or other malicious code or security vulnerabilities in our data or software could expose us to a risk of loss, unavailability, misappropriation and other unauthorized processing of proprietary and confidential information. The costs to us to eliminate or alleviate cyber or other security problems, bugs, viruses, ransomware and other malicious software programs and security vulnerabilities could be significant, and our efforts to address these problems may not be successful and could result in interruptions and delays that may impede our sales, product distribution, financial reporting or other critical functions. In addition, we could incur significant costs in notifying affected persons and entities and otherwise complying with the multitude of foreign, federal, state and local laws and regulations relating to the unauthorized access to, or use or disclosure of, personal information.
25
Security breaches and incidents, computer malware and computer hacking attacks have become more prevalent and sophisticated. These threats are constantly evolving, making it increasingly difficult to successfully defend against or implement adequate preventive measures, and we may face difficulties or delays in identifying and otherwise responding to any security breach or incident. Moreover, remote work by our personnel and remote access to our systems have increased significantly, which also increases our cybersecurity risk profile. We expect to incur significant costs in an effort to detect and prevent security breaches and incidents, and we may face increased costs and requirements to expend substantial resources in the event of an actual or perceived security breach or incident. Our policies and security measures cannot guarantee security, and our IT infrastructure, including our networks and systems, may be vulnerable to security breaches and incidents, cyber-attacks, or fraud. Third parties have attempted, and will likely continue to attempt, to penetrate and/or infect our network and systems with malicious software and phishing attacks in an effort to gain access to our network and systems. Experienced computer programmers and hackers may be able to penetrate our security controls and misappropriate or compromise our confidential information or that of third parties or create system disruptions. Computer programmers and hackers also may be able to deploy viruses, worms and other malicious software programs that attack our information systems and cause disruptions of our business. For portions of our IT infrastructure, we rely on products and services provided by third parties. These third-party products and services relate to, among other things, human resources, electronic communication services and some finance functions, and we are, of necessity, dependent on salesthe security systems of these third-party providers. These third-party service providers are subject to similar, and in certain cases greater, security threats than we face. These third-party providers may also experience breaches, incidents, and attacks compromising or otherwise impacting their products, and their products may contain security vulnerabilities, each of which could impact our systems, and unauthorized access to the systems of our cloud-based service providers, any other security breaches or incidents impacting such systems, or the existence of computer viruses, ransomware or other malicious code in their data or software could expose us to a limited numberrisk of loss, misappropriation, unavailability and other unauthorized processing of information. Data security breaches and incidents may also result from non-technical means, including, for example, intentional malfeasance or negligence by an employee or contractor. Any data security breach or incident or theft, misuse, loss, unavailability or other unauthorized processing of this information, or the perception that any of these matters has occurred, could result in, among other things, damage to our reputation, allegations by our customers that we have not performed our contractual obligations, regulatory investigations and other proceedings, litigation by affected parties and possible penalties, damages, and other liabilities, any of which could have a material adverse effect on our business, financial condition, our reputation, and our relationships with our customers and partners. We may also encounter or be subject to bugs, errors, or hacking or other events resulting in system interruptions or other disruptions, corruption or loss of data, an inability to accurately process or record transactions, and security or technical reliability issues. All of these could harm our ability to conduct core operating functions such as product development, customer support, processing purchase orders and invoices, product distribution, recording and reporting financial and management information on a timely and accurate basis, and could impact our internal control compliance efforts. Due to conflicts and geopolitical events such as the ongoing hostility between Russia and Ukraine, we and our vendors, contractors, and other third parties we work with are vulnerable to a heightened risk of cybersecurity attacks, phishing attacks, viruses, malware, ransomware, hacking or similar breaches and incidents from nation-state and affiliated actors, including attacks that could materially disrupt our supply chain and our systems and operations.
Additionally, we cannot be certain that our insurance coverage will be adequate or otherwise protect us with respect to claims, expenses, fines, penalties, business loss, data loss, litigation, regulatory actions, or other impacts arising from security breaches or incidents, or that such coverage will continue to be available on acceptable terms or at all. Any of these results could adversely affect our business, financial condition, and operating results.
While we intend to continue to invest in research and development, we may be unable to make the substantial investments that are required to remain competitive in our business.
The semiconductor industry requires substantial investment in research and development in order to bring to market new and enhanced solutions. Our research and development expense was $215.1 million, $204.9 million and $167.3 million in fiscal years 2024, 2023 and 2022, respectively. In general, we expect to increase our research and development expenditures in future periods as compared to prior periods as part of our strategy of focusing on the development of innovative computer vision, video and image processing solutions with increased functionality, and a decline in market adoption of these solutions could harm our business.
From inception through January 31, 2018, our revenue has been generated primarily fromas we target key markets, such as the sale of a limited number of high-definition, or HD, videoautomotive OEM and image processing SoC solutions in the camera and infrastructurerobotics markets. Moreover, we currently derive substantially all of our revenue from the sale of our SoCs for use in the camera market and we expect to do so for the next several years. As a result, continued market adoption of our SoC solutions in the camera market is critical to our future success. If demand for our SoC solutions were to decline, or demand for products incorporating our solutions declines, does not continue to grow or does not grow as expected, our revenue would decline and our business would be harmed.
We do not have long-term supply contracts with our third-party manufacturing vendors, and they may not allocate sufficient capacity to us at reasonable prices to meet future demands for our solutions.
The semiconductor industry is subject to intense competitive pricing pressure from customers and competitors. Accordingly, any increase in the cost of our solutions, whether by adverse purchase price variances or adverse manufacturing cost variances, will reduce our gross margins and operating profit. We currently do not have long-term supply contracts with most of our primary third-party vendors, and we negotiate pricing with our main vendors on a purchase order-by-purchase order basis. Therefore, they are not obligated to perform services or supply product to us for any specific period, in any specific quantities, or at any specific price, except as may be provided in a particular purchase order. Availability of foundry capacity has in the recent past been limited due to strong demand. The ability of our foundry vendors to provide us with a product, which is sole sourced at each foundry, is limited by their available capacity, existing obligations and technological capabilities. Foundry capacity may not be available when we need it or at reasonable prices. None of our third-party foundry or assembly and test vendors has provided contractual assurances to us that adequate capacity will be available to us to meet our anticipated future demand for our solutions. Our foundry and assembly and test vendors may allocate capacity to the production of other companies’ products while reducing deliveries to us on short notice. In particular, other companies that are larger and better financed than we are or that have long-term agreements with our foundry or assembly and test vendors may cause our foundry or assembly and test vendors to reallocate capacity to them, decreasing the capacity available to us. Converting or transferring manufacturing from a primary location or supplier to a backup foundry vendor could be expensive and would likely take at least two or more quarters. There are only a few foundries, including Samsung and Taiwan Semiconductor Manufacturing Co., Ltd., or TSMC, that are currently available for certain advanced process technologies that we utilize or may utilize, 10 or 7 nanometer. As we continue to develop solutions in advanced process nodes we will be increasingly dependent upon such foundries.
If, in the future, we enter into arrangements with suppliers that include additional fees to expedite delivery, nonrefundable deposits or loans in exchange for capacity commitments or commitments to purchase specified quantities over extended periods, such arrangements may be costly, reduce our financial flexibility and be on terms unfavorable to us, if we are able to secure such arrangements at all. Moreover, if we are able to secure foundry capacity, we may be obligated to use all of that capacity or incur penalties. These penalties could harm our financial results. To date, we have not entered into any such arrangements with our suppliers. If we need additional foundry or assembly and test subcontractors because of increased demand or the inability to obtain timely and adequate deliveries from our current vendors, we may not be able to do so cost-effectively, if at all.
A substantial portion of our revenue is processed through a single distributor and the loss of this distributor may cause disruptions in our shipments, which may adversely affect our operations and financial condition.
We sell a significant percentage of our solutions through a single distributor, Wintech Microelectronics Co., Ltd., or Wintech, which serves as our non-exclusive sales representative in Asia, other than Japan. Approximately 59%, 60% and 67% of our revenue was derived from sales through Wintech for the fiscal years ended January 31, 2018, 2017 and 2016, respectively. We anticipate that a significant portion of our revenue will continue to be derived from sales through Wintech in the foreseeable future. Our current agreement with Wintech is effective until September 2018, unless it is terminated earlier by either party for any or no reason with 90 days written notice or by failure of the breaching party to cure a material breach within 30 days following written notice of such material breach by the non-breaching party. Our agreement with Wintech will automatically renew for additional successive 12-month terms unless at least 60 days before the end of the then-current term either party provides written notice to the other party that it elects not to renew the agreement. Termination of the relationship with Wintech, either by us or by Wintech, could result in a temporary or permanent loss of revenue. We may not be successful in finding suitable alternative distributors on satisfactory terms, or at all, and this could adversely affect our ability to effectively sell our solutions in certain geographical locations or to certain end customers. Furthermore, Wintech, or any successor or other distributors we do business with, may face issues obtaining credit, which could impair their ability to make timely payments to us.
We are subject to risks associated with our distributors' product inventories.
We sell many of our products to customers through distributors who maintain their own inventory of our products for sale to dealers and end customers. We allow limited price adjustments on sales to distributors. Price adjustments may be effected by way of credits for future product or by cash payments to the distributor, either in arrears or in advance, using estimates based on historical transactions. Currently we recognize revenues for sales to distributors upon sell through by the distributors. Upon the adoption of Accounting Standards Update No. 2014-09, Revenue from Contracts with Customers (Topic 606) (“ASU 606”) effective February 1, 2018, we will recognize revenue on sales to distributors upon shipment and transfer of control (known as “sell-in” revenue recognition) based on the amount of consideration expected to be received. To the extent that the actual consideration received is materially different from estimated variable consideration used in revenue recognition, we may be required to adjust revenue in subsequent periods.
If our distributors are unable to sell an adequate amountpredict whether we will have sufficient resources to achieve the level of their inventoryinvestment in research and development required to remain competitive. For example, development in the latest process nodes, such as 5 nanometer, or nm, or smaller, costs significantly more than required to develop in larger process nodes, such as 14 or 10nm. This added cost could prevent us from being able to maintain a technology advantage over larger competitors that have significantly more resources to invest in research and development. In addition, we cannot assure you that the technologies which are the focus of our products in a given quarter to dealersresearch and end customersdevelopment expenditures will become commercially successful or if they decide to decrease their inventories forgenerate any reason, such as adverse global economic conditions or a downturn in technology spending, our sales to these distributors and our revenues may decline. We also face the risk that our distributors may purchase, or for other reasons accumulate, inventory levels of our products in any particular quarter in excess of future anticipated sales to end customers. If such sales do not occur in the time frame anticipated by these distributors for any reason, these distributors may substantially decrease the amount of product they order from us in subsequent periods until their inventory levels realign with end-customer demand, which would harm our business and could adversely affect our revenues in such subsequent periods. Our reserve estimates associated with products stocked by our distributors are based largely on reports that our distributors provide to us on a weekly or monthly basis. To date, we believe this resale and channel inventory data have been generally accurate. To the extent that these data are inaccurate or not received in a timely manner, we may not be able to make reserve estimates for future periods accurately or at all.revenue.
Deterioration of the financial conditions of our customers could adversely affect our operating results.
Deterioration of the financial condition of our distributors or customers could adversely impact our collection of accounts receivable. We regularly review the collectability and creditworthiness of our distributors and customers to determine an appropriate allowance for doubtful receivables. Based on our review of our distributors and customers, we currently have only immaterial reserves for uncollectible accounts. If our uncollectible accounts, however, were to exceed our current or future allowance for doubtful receivables, our operating results would be negatively impacted.
The loss of any of our key personnel could seriously harm our business.
26
We believe our future success depends in large part upon the continuing services of the members of our senior management team and various engineering and other technical personnel. If one or more of our senior executives or other key personnel are unable or unwilling to continue in their present positions, we may not be able to replace them easily or at all, our business may be disrupted, and our financial condition and results of operations may be materially and adversely affected. In addition, if any member of our senior management team or any of our other key personnel joins a competitor or forms a competing company, we may experience material disruption of our operations and development plans and lose customers, know-how and key professionals and staff members, and we may incur increased operating expenses as the attention of other senior executives is diverted to recruit replacements for key personnel.
We rely on highly skilled personnel and, if we are unable to hire, retain or motivate key personnel, we may not be able to grow effectively.
Our performance largely depends on the talents and efforts of highly skilled individuals. Our future success depends on our continuing ability to identify, hire, develop, motivate, and retain highly skilled personnel for all areas of our organization. Our industry is characterized by high demand and intense competition for talent.talent, particularly for engineering personnel. The pool of qualified candidates is limited, particularly in Silicon Valley and parts of Asia for very-large-scale integration, or VLSI, and artificial intelligence and computer vision engineers, and certain of our competitors and potential competitors with greater resources have directly targeted our employees. In addition, ourwe also face competition in hiring artificial intelligence engineers, including from companies with which we do not directly compete. Our compensation arrangements, such as our equity award programs, may not always be successful in attracting new employees and retaining and motivating our existing employees. Our continued ability to compete effectively, and to grow our business, depends on our ability to attract new employees and to retain and motivate our existing employees.
If
The average selling prices of semiconductor solutions in our target markets have typically decreased over time and will likely do so in the future, which could harm our revenue and gross margins.
Average selling prices of semiconductor products in the markets we serve have historically decreased over time, and we expect such declines to occur for our solutions over time. Our gross margins and financial results will suffer if we are unable to offset reductions in our average selling prices by reducing our costs, developing new or enhanced SoC solutions, such as our new AI computer vision-based solutions, on a timely basis with higher selling prices or gross margins, or increasing our sales volumes. Additionally, because we do not generate revenue growth,operate our own manufacturing, assembly or testing facilities, we may not be able to executereduce our business plancosts as rapidly as companies that operate their own facilities, and our operating resultscosts may even increase, which could suffer.
You should not rely onalso reduce our revenue growth, gross margins or operating results for any prior quarterly or annual periods as an indication of our future operating performance.margins. In the past, we have experienced significant growthreduced the prices of our SoC solutions in a short periodanticipation of time. Our revenue increased from $21.5 million in fiscal year 2008future competitive pricing pressures, new product introductions by us or our competitors and other factors. We expect that we will have to $316.4 million in fiscal year 2016. Recently, however, we have not sustained this growth rate. Our revenue decreased to $310.3 million in fiscal year 2017 and to $295.4 million in fiscal year 2018. We continue to investaddress pricing pressures again in the developmentfuture, particularly in markets experiencing consolidation, which could require us to reduce the prices of new technology andour SoC solutions and expectharm our research and development expenditures to increase compared to prior periods. Accordingly, if we are unable to generate or maintain adequate revenue growth, our financial results could suffer and our stock price could decline.operating results.
If we are unable to manage any future growth, we may not be able to execute our business plan and our operating results could suffer.
Our business has grown rapidly.rapidly in the past. Our future operating results depend to a large extent on our ability to successfully manage any expansion and growth, including the challenges of managing a company with headquartersan executive management team in the United States and the majority of its employees in Asia. We are increasing our investment in research and development and other functions to grow our business and address new markets, such as the OEM automotive market.and robotics markets. To manage our growth successfully, and handle the responsibilities of being a public company, we believe we must effectively, among other things:
recruit, hire, train and manage additional qualified engineers for our research and development activities, particularly in our offices in Asia and especially for the positions of semiconductor design and systems, applications engineering andAI computer vision development;
add additional sales and business development personnel;
add additional finance and accounting personnel;
maintain and improve our administrative, financial and operational systems, procedures and controls; and
enhance our information technology support for enterprise resource planning and design engineering by adapting and expanding our systems and tool capabilities, and properly training new hires as to their use.
27
We are likely to incur the costs associated with theseany increased investments earlier than some of the anticipated benefits, and the return on these investments, if any, may be lower, may develop more slowly than we expect or may not materialize. In addition, development of products to address emerging markets, such as the OEM automotive market, could negatively impact our ability to develop new products for our current markets, which may harm our financial condition, particularly in the near term.
If we are unable to manage our growth effectively, we may not be able to take advantage of market opportunities or develop new solutions, and we may fail to satisfy customer product or support requirements, maintain product quality, execute our business plan or respond to competitive pressures.
While
Deterioration of the financial conditions of our customers could adversely affect our operating results.
Deterioration of the financial condition of our distributors or customers could adversely impact our collection of accounts receivable. For the fiscal year ended January 31, 2024, the customers representing 10% or more of revenue were WT and Chicony, which accounted for approximately 53% and 14% of total revenue, respectively. As of January 31, 2024, accounts receivable with WT and Chicony were approximately $10.3 million and $7.0 million, respectively. We regularly review the collectability and creditworthiness of our distributors and customers to determine an appropriate allowance for credit losses. Based on our review of our distributors and customers, we intendcurrently have only immaterial reserves for uncollectible accounts. If our uncollectible accounts, however, were to continueexceed our current or future allowance for credit losses, our operating results would be negatively impacted.
We are subject to invest in research and development, we may be unable to make the substantial investments that are required to remain competitive in our business.cyclical nature of the semiconductor industry.
The semiconductor industry requires substantial investmentis highly cyclical and is characterized by constant and rapid technological change, rapid product obsolescence, price erosion, evolving standards, short product life cycles and wide fluctuations in researchproduct supply and development in orderdemand. Cyclical downturns have been characterized by diminished product demand, production overcapacity, high inventory levels and accelerated erosion of average selling prices, which could harm our business and operating results. We are dependent on the availability of third-party foundry and assembly capacity to bring to market newmanufacture and enhancedassemble our SoC solutions. Our research and development expense was $115.5 million, $101.2 million and $82.9 million in fiscal years 2018, 2017 and 2016, respectively. We expect to increase our research and development expenditures as compared to prior periods as partNone of our strategy of focusing on the development of innovative video and image processing solutions with increased functionality, such as analyticsthird-party foundry or computer vision capabilities, and as we target new markets, such as the automotive OEM and robotics markets. We are unableassembly contractors has provided assurances that adequate capacity will be available to predict whether we will have sufficient resources to maintain the level of investment in research and development required to remain competitive. For example, developmentus in the latest process nodes, such as 14 and 10 nm, can cost significantly more than required to developfuture. The semiconductor industry recently experienced significant shortages of capacity, which resulted in larger process nodes, such as 28 nm. This added cost could prevent us from being able to maintain a technology advantage over larger competitors that have significantly more resources to invest in research and development. In addition, we cannot assure you that the technologies which are the focus of our research and development expenditures will become commercially successful or generate any revenue.
We may have difficulty accurately predicting our future revenue and appropriately budgeting our expenses.
The rapidly evolving naturelengthening of the markets in which we sellmanufacturing lead time for our solutions, combined with substantial uncertainty concerning how these markets may develop and other factors beyond our control, limitsproducts. Such capacity shortages could negatively impact our ability to accurately forecast quarterly or annual revenue. In addition, because we record a significant portion ofmeet our customers’ demand for our products and have an adverse impact on our revenue, from sales when weresults of operations and customer relationships. We have received notification from our distributors that they have soldalso experienced, during times of supply chain capacity shortage, customers placing orders for our products some of the revenue we record inthat exceed their actual demand, which may lead to us manufacturing a quarter may be derived from salessurplus of products shippedand could have a negative impact on our results of operations and cash reserves. Most recently, some customers have indicated their intent to reduce their inventory levels as capacity shortages improve, which has and may continue to negatively impact such customers’ demand for our distributors during previous quarters. This revenue recognition methodology limits our ability to forecast quarterly or annual revenue accurately. We are currently expanding our staffing and increasing our expenditures in anticipation of future revenue growth. If our revenue does not increase as anticipated, we could incur significant losses due to our higher expense levels if we are not able to decrease our expenses in a timely manner to offset any shortfallsolutions in future revenue.
We may experience difficulties demonstrating the value to customers of newer, higher pricedperiods and, higher margin solutions if they believe existing solutions are adequate to meet end customer expectations.in turn, harm our financial results.
As we develop and introduce new solutions, we face the risk that customers may not value or be willing to bear the cost of incorporating these newer solutions into their products, particularly if they believe their customers are satisfied with current solutions. Regardless of the improved features or superior performance of the newer solutions, customers may be unwilling to adopt our new solutions due to design or pricing constraints. Owing to the extensive time and resources that we invest in developing new solutions, if we are unable to sell customers new generations of our solutions, our revenue could decline and our business, financial condition, operating results and cash flows could be negatively affected.
The complexity of our solutions could result in unforeseen delays or expenses from undetected defects, errors or bugs in hardware or software which could reduce the market adoption of our new solutions, damage our reputation with current or prospective customers and adversely affect our operating costs.
Highly complex SoC solutions such as ours frequently contain defects, errors and bugs when they are first introduced or as new versions are released. We have in the past and may in the future experience these defects, errors and bugs. If any of our solutions have reliability, quality or compatibility problems, we may not be able to successfully correct these problems in a timely manner or at all. In addition, if any of our proprietary features contain defects, errors or bugs when first introduced or as new versions of our solutions are released, we may be unable to timely correct these problems. Consequently, our reputation may be damaged and customers may be reluctant to buy our solutions, which could harm our ability to retain existing customers and attract new customers, and could adversely affect our financial results. In addition, these defects, errors or bugs could interrupt or delay sales to our customers. If any of these problems are not found until after we have commenced commercial production of a new product, we may incur significant additional development costs and product recall, repair or replacement costs. These problems may also result in claims against us by our customers or others.
Camera
We may experience difficulties in transitioning to new wafer fabrication process technologies or in achieving higher levels of design integration, which may result in reduced manufacturing yields, delays in product deliveries and increased costs.
28
We aim to use the most advanced manufacturing process technology appropriate for our products that is available from our third-party foundries. As a result, we periodically evaluate the benefits of migrating our solutions to smaller geometry process technologies in order to improve performance and reduce costs. We believe this strategy will help us remain competitive. We may face difficulties, delays and increased expense as we transition our products to new processes, such as the 4nm or 3nm process nodes, and potentially to new foundries. We currently depend on Samsung, as the principal foundry for our products, to transition to new processes successfully. We cannot assure you that Samsung will be able to effectively manage such transitions or that we will be able to maintain our relationship with Samsung or develop relationships with new foundries. Moreover, as we utilize more advanced process nodes beyond 5nm, we are increasingly dependent upon a very small number of foundries currently available for certain advanced process technologies. If we or our foundry vendors experience significant delays in transitioning to smaller geometries or fail to efficiently implement transitions, we could experience reduced manufacturing yields, delays in product deliveries and increased costs, all of which could harm our relationships with our customers and our operating results.
Rapidly changing industry standards could make our video and image processing solutions obsolete, which would cause our operating results to suffer.
We design our video and image processing solutions to conform to video compression standards, including MPEG-2, H.264 Advanced Video Coding (AVC) and H.265 High Efficiency Video Coding (HEVC), set by industry standards setting bodies such as ITU-T Video Coding Experts Group and the ISO/IEC Moving Picture Experts Group. Generally, our solutions comprise only a part of a camera device. All components of these devices must uniformly comply with industry standards in order to operate efficiently together. We depend on companies that provide other components of the devices to support prevailing industry standards. Many of these companies are significantly larger and more influential in driving industry standards than we are. Some industry standards may not be widely adopted or implemented uniformly, and competing standards may emerge that may be preferred by our customers or by consumers. If our customers or the suppliers that provide other device components adopt new or competing industry standards with which our solutions are not compatible, or if the industry groups fail to adopt standards with which our solutions are compatible, our existing solutions would become less desirable to our customers. If our solutions are not in compliance with prevailing industry standards for a significant period of time, we could miss opportunities to achieve crucial design wins, which could harm our business. As a result, our sales would suffer, and we could be required to make significant expenditures to develop new SoC solutions to ensure compliance with relevant standards.
Pandemics, epidemics, or other widespread public health crises have had, and may in the future have, an adverse impact upon our business, results of operations, and financial condition.
A future pandemic, epidemic, health crisis, or other outbreak of disease, including the emergence of new COVID-19 variants, may negatively and materially impact our business, results of operations, and financial condition, due to:
The COVID-19 pandemic created worldwide uncertainty and significantly and negatively impacted the global economy which caused significant uncertainty and volatility in global financial markets and the trading prices for the common stock of technology companies, including ours. As a result of the pandemic, from time to time government authorities imposed lockdowns and other restrictions. The pandemic impacted our workforce and the operations of our customers and suppliers. In response to the pandemic and related government measures, we implemented safety measures to protect our employees and contractors at our locations around the world.
The potential impact that a future pandemic, epidemic, health crisis, or other outbreak of disease, including the emergence of new COVID-19 variants, could have on our business, results of operations, and financial condition, and on the other risk factors described in this “Risk Factors” section, remain unclear and difficult to predict.
29
Some of our operations and a significant portion of our customers and our subcontractors are located outside of the United States, which subjects us to additional risks, including increased complexity and costs of managing international operations and geopolitical instability.
We have research and development design centers and business development offices in China, Germany, Italy, Japan, South Korea and Taiwan, and we expect to continue to conduct business with companies that are located outside the United States, particularly in Asia. We purchase wafers from foreign foundries, have our solutions assembled and tested by subcontractors located in Asia, and supply our solutions to customers located outside of the United States. Even customers of ours that are based in the United States often use contract manufacturers based in Asia to manufacture their products, and these contract manufacturers typically purchase products directly from us. As a result of our international focus, we face numerous challenges and risks, including:
Any acquisitions we may make in the future could disrupt our business, cause dilution to our shareholders, reduce our financial resources and harm our business.
Prior to our acquisition of Oculii in 2021, we had not made any acquisitions since our acquisition of VisLab S.r.l. in 2015. Our ability to make and successfully integrate acquisitions is largely unproven. Any future acquisitions may not strengthen our competitive position and may be viewed negatively by our customers, financial markets or investors, and we may not achieve our goals in a timely manner, or at all. In addition, any acquisitions we make could lead to difficulties in integrating personnel, technologies and operations from the acquired businesses and in retaining and motivating key personnel from these businesses. Acquisitions may disrupt our ongoing operations, divert management from their primary responsibilities, subject us to additional liabilities, increase our expenses and adversely impact our business, operating results, financial condition and cash flows. Acquisitions may also reduce our cash available for operations and other uses, and could also result in an increase in amortization expense related to identifiable assets acquired, potentially dilutive issuances of equity securities or the incurrence of debt, any of which could harm our business.
30
The complexity of calculating our tax provision may result in errors that could result in restatements of our financial statements.
We are incorporated in the Cayman Islands and our operations are subject to income and transaction taxes in the United States, China, Hong Kong, Germany, Italy, Japan, South Korea, Taiwan and other jurisdictions in which we do business. Due to the complexity associated with the calculation of our tax provision, we have hired independent tax advisors to assist us. If we or our independent tax advisors fail to resolve or fully understand certain issues, there may be errors that could result in us having to restate our financial statements. The risk of errors may be exacerbated by the significant number of tax law changes recently enacted in the United States and other jurisdictions. Restatements are generally costly and could adversely impact our results of operations or have a negative impact on the trading price of our ordinary shares.
Climate change and climate change-related policies and regulations may have a long-term impact on our business.
Global climate change is causing, and is projected to continue to cause, an increase in the frequency and intensity of certain natural disasters and adverse weather, such as drought, wildfires, severe storms, sea-level rise, flooding, heat waves and cold waves, occurring more frequently or with greater intensity. Such extreme events are driving changes in market dynamics, and local, national and international policies and regulations, which could result in disruptions to us, our suppliers, customers, and employees. These disruptions could make it more difficult and costly for us to deliver our products, obtain components or other supplies through our supply chain, maintain, or resume operations or perform other critical corporate functions, and could reduce customer demand for our products.
The increasing concern over climate change could also result in shifting customer preferences. If we fail to manage changes in customer expectations in an effective manner, demand for our products could diminish, and our financial performance could suffer. Additionally, new laws or regulations enacted to address climate change that are more stringent than current legal or regulatory requirements may increase our compliance burdens and costs, including indirect costs that are passed on to us from our customers or suppliers. Climate change also may reduce the availability or increase the cost of insurance for negative impacts of natural disasters by contributing to an increase in the frequency and severity of such natural disasters. Ultimately, the impacts of climate change, whether involving physical risks (such as disruptions resulting from climate-related events) or transition risks (such as regulatory changes, changes in market dynamics or increased operating costs, including the cost of insurance) are expected to be widespread and unpredictable and may materially adversely affect our business and financial results.
Risks Related to Our Financial Performance or Results
Fluctuations in our operating results on a quarterly and annual basis could cause the market price of our ordinary shares to decline.
Our revenue and operating results have fluctuated significantly from period to period in the past and are likely to do so in the future. As a result, you should not rely on period-to-period comparisons of our operating results as an indication of our future performance. It is also possible that our normal seasonal patterns will be impacted by ongoing macroeconomic uncertainty, lingering effects of pandemics, supply chain disruptions and semiconductor capacity shortages, including the buildup of inventory by customers in response to such shortages, and continued high inflation. In future periods, our forecasted or actual revenue and results of operations may be below the expectations of analysts and investors, which could cause the market price of our ordinary shares to decline.
Factors that may affect our operating results include:
31
Moreover, the semiconductor industry has historically been cyclical in nature, reflecting overall economic conditions as well as budgeting and buying patterns of consumers. For example, the semiconductor industry recently experienced significant shortages of capacity, which resulted in a lengthening of the manufacturing lead time for our products and could be impacting the normal forecasting and ordering patterns of our customers. In recent periods, some customers have indicated they are reducing their inventory levels as lead times for semiconductor chips and other components used by customers shrink, which has reduced, and may continue to reduce, such customers’ demand for our products in future periods. We expect these cyclical conditions to continue. As a result, our quarterly operating results are difficult to predict, even in the near term. Our expense levels are relatively fixed in the short term and are based, in part, on our expectations of future revenue. If revenue levels are below our expectations, we may experience material adverse impacts on our business, including declines in margins, profitability and cash flows, or incur losses.
If we do not generate revenue growth, we may not be able to execute our business plan and our operating results could suffer.
We believe that our future revenue growth, if any, will significantly depend on our ability to expand within our existing IoT camera markets, such as the existing professional and home security and monitoring camera markets, and successfully penetrate new markets, such as the OEM automotive, robotics and industrial markets, with our new AI computer vision-based SoC solutions. We believe that executing upon our business plan requires us to continue to develop new SoCs and new software to address the particular requirements of these markets. Accordingly, we continue to invest in the development of new technology and solutions and expect our research and development expenditures to increase compared to prior periods. If we are unable to generate or maintain adequate revenue growth, our financial results could suffer and we may not be able to continue to invest in the development of new technology and solutions required to be successful.
We may have difficulty accurately predicting our future revenue and appropriately budgeting our expenses.
The rapidly evolving nature of the markets in which we sell our solutions, combined with substantial uncertainty concerning how these markets may develop, the considerable amount of time our customers generally take to evaluate our solutions, and other factors beyond our control, limits our ability to accurately forecast quarterly or annual revenue. In the recent years, we expanded our staffing and increased our expenditures in anticipation of future revenue growth. If our revenue does not increase as anticipated, we could incur significant losses and declines in our cash reserves due to our higher expense levels if we are not able to decrease our expenses in a timely manner to offset any shortfall in future revenue. Continued or persistent losses may require us to obtain additional capital that may not be available on reasonable terms or at all.
Changes to financial accounting standards may affect our results of operations and could cause us to change our business practices.
32
We prepare our consolidated financial statements to conform to generally accepted accounting principles, or GAAP, in the United States. These accounting principles are subject to interpretation by the American Institute of Certified Public Accountants, the SEC and various bodies formed to interpret and create accounting rules and regulations. Changes in those accounting rules could have a significant effect on our financial results, require significant resources, pose challenges in forecasting revenue and may affect our reporting of transactions completed before a change is announced. Changes to those rules or the questioning of current practices may adversely affect our reported financial results or the way we conduct our business.
Fluctuations in exchange rates between and among the currencies of the countries in which we do business may adversely affect our operating results.
Our sales have been historically denominated in U.S. dollars. An increase in the value of the U.S. dollar relative to the currencies of the countries in which our end customers operate could impair the ability of our end customers to cost-effectively integrate our SoCs into their devices which may materially affect the demand for our solutions and cause these end customers to reduce their orders, which would adversely affect our revenue and business. We may experience foreign exchange gains or losses due to the volatility of other currencies compared to the U.S. dollar. A significant portion of our solutions are sold to customers located outside the United States, primarily in Asia. Sales to customers in Asia accounted for approximately 79%, 79% and 86% of our total revenue in fiscal years 2024, 2023 and 2022, respectively. Certain prior year amounts of revenue by geographic region have been adjusted to reflect the appropriate bill-to location for the related revenue. These adjustments did not impact the total revenues in any of the years presented. Because most of our end customers or their ODM manufacturers are located in Asia, we anticipate that a majority of our future revenue will continue to come from sales to that region. Although a large percentage of our sales are made to customers in Asia, we believe that a significant number of the products designed by these customers and incorporating our SoCs are then sold to consumers globally. In addition, if in the future we sell products or purchase inventory in currencies other than the U.S. dollar, our exposure to foreign currency risk could become more significant.
A significant number of our employees are located in Asia, principally Taiwan and China, and Europe. Therefore, a portion of our payroll as well as certain other operating expenses are paid in currencies other than the U.S. dollar, such as the New Taiwan Dollar, the Chinese Yuan Renminbi and the Eurozone Euro. Our operating results are denominated in U.S. dollars and the difference in exchange rates in one period compared to another may directly impact period-to-period comparisons of our operating results. Furthermore, currency exchange rates, particularly the exchange rates between the Chinese Yuan Renminbi and the U.S. dollar, between the New Taiwan Dollar and the U.S. dollar, and between the Eurozone Euro and the U.S. dollar, have been volatile in the recent past and these currency fluctuations may make it difficult for us to predict our operating results.
We have not implemented any hedging strategies to mitigate risks related to the impact of fluctuations in currency exchange rates. Even if we were to implement hedging strategies, not every exposure can be hedged and, where hedges are put in place based on expected foreign exchange exposure, they are based on forecasts which may vary or which may later prove to have been inaccurate. Failure to hedge successfully or anticipate currency risks accurately could adversely affect our operating results.
We cannot predict our future capital needs, and we may not be able to obtain additional financing to fund our operations.
We may need to raise additional funds in the future. Any required additional financing may not be available on terms acceptable to us, or at all. If we raise additional funds by issuing equity securities or convertible debt, investors may experience significant dilution of their ownership interest, and the newly-issued securities may have rights senior to those of the holders of our ordinary shares. If we raise additional funds by obtaining loans from third parties, the terms of those financing arrangements may include negative covenants or other restrictions on our business that could impair our operational flexibility and would also require us to incur interest expense. If additional financing is not available when required or is not available on acceptable terms, we may have to scale back our operations or limit our production activities, and we may not be able to expand our business, develop or enhance our products, take advantage of business opportunities or respond to competitive pressures which could result in lower revenue and reduce the competitiveness of our products.
Our marketable securities portfolio could experience a decline in market value or otherwise become illiquid, which could materially and adversely affect our financial results.
33
As of January 31, 2024, we had approximately $106.1 million in money market funds and debt security investments and $7.0 million in fixed deposit accounts. The debt security investments consisted of commercial paper, corporate bonds, asset-backed securities and U.S. government securities. We currently do not use derivative financial instruments to adjust our investment portfolio risk or income profile. These investments, as well as any cash deposited in bank accounts, are subject to general credit, liquidity, market and interest rate risks, which may be exacerbated by unusual events, such as the pandemics or widespread public health problems, the Eurozone crisis and the U.S. debt ceiling crisis, which affected various sectors of the financial markets and led to global credit and liquidity issues. For example, in March 2023, Silicon Valley Bank (SVB) was closed and the Federal Deposit Insurance Corporation (FDIC) was appointed as receiver. At the time of closing on March 10, 2023, we had cash deposits with SVB of approximately $17.0 million. We also had cash equivalents and marketable debt security investments residing in custodial accounts held by U.S. Bank for which SVB Asset Management was the investment advisor until March 15, 2023. While we were able to recover all deposited amounts from SVB, there can be no assurance that our current or future banks will not face similar risks as SVB or that we will be able to recover in full our deposits in the event of similar closures. We regularly maintain cash balances that are not insured or are in excess of the FDIC’s insurance limit. If the global financial markets continue to experience volatility or deteriorate, our investment portfolio may be impacted and some or all of our investments may become illiquid or otherwise experience loss which could adversely impact our financial results and position. To the extent that we increase the amount of our security investments in the future, these risks would be exacerbated.
Risks Related to Our Dependence on Third Parties
We do not have long-term supply contracts with our third-party manufacturing vendors, and they may not allocate sufficient capacity to us at reasonable prices to meet future demands for our solutions.
The semiconductor industry is subject to intense competitive pricing pressure from customers and competitors. Accordingly, any increase in the cost of our solutions, whether by adverse purchase price variances or adverse manufacturing cost variances, will reduce our gross margins and operating profit. We currently do not have long-term supply contracts with most of our primary third-party vendors, and we negotiate pricing with our main vendors on a purchase order-by-purchase order basis. Therefore, they are not obligated to perform services or supply product to us for any specific period, in any specific quantities, or at any specific price, except as may be provided in a particular purchase order. The ability of our foundry vendors to provide us with a product, which is solely sourced at each foundry, is limited by their available capacity, existing obligations and technological capabilities. Foundry capacity may not be available when we need it or at reasonable prices. None of our third-party foundry or assembly and test vendors have provided contractual assurances to us that adequate capacity will be available to us to meet our anticipated future demand for our solutions. Moreover, availability of foundry capacity at our primary foundry vendor has tightened recently, which could limit the volume of products we can produce and/or delay production of new products, both of which would negatively impact our business and operations. Similarly, our assembly vendors have recently experienced shortages of certain substrates necessary for the production of our solutions, which has negatively impacted the production time of our devices. If these conditions continue for a substantial period or worsen, our ability to meet our anticipated demand for our solutions could be impacted which, in turn, could negatively impact our operations and financial results.
Our foundry and assembly and test vendors may allocate capacity to the production of other companies’ products while reducing deliveries to us on short notice. In particular, other companies that are larger and better financed than we are or that have long-term agreements with our foundry or assembly and test vendors may cause our foundry or assembly and test vendors to reallocate capacity to them, decreasing the capacity available to us. Converting or transferring manufacturing from a primary location or supplier to a backup provider could be expensive and would likely take at least two or more quarters. There are only a few foundries, including Samsung and Taiwan Semiconductor Manufacturing Co., Ltd., or TSMC, that are currently available for certain advanced process technologies that we utilize or may utilize, such as 10nm or 5nm. Accordingly, as we continue to develop solutions in advanced process nodes, we will be increasingly dependent upon such foundries. The unavailability of one or both of these foundries could significantly impact our ability to produce our new products or delay production, which would negatively impact our business.
Our customers incorporate components supplied by multiple third parties, and a supply shortage or delay in delivery of these components could delay orders for our solutions by our customers.
34
Our customers purchase components used in the manufacture of their camerasproducts from various sources of supply, often involving several specialized components, including lenses, sensors, microcontrollers, power management integrated circuits (PMICs), Wi-Fi chips, and memory chips. Any supply shortage or delay in delivery by third-party component suppliers, or a third-party supplier’s cessation or shut down of its business, may prevent or delay production of our customers’ products. In addition, replacement or substitute components may not be available on commercially reasonable terms, or at all. As a result of delays in delivery or supply shortages of third-party components, orders for our solutions may be delayed or canceled and our business may be harmed. For example, a disruption in the availabilitysemiconductor industry recently experienced shortages of image sensors from Sony Corporation as a result of the April 14, 2016 Kumamoto, Japan earthquakecertain devices, including microcontrollers, PMICs, Wi-Fi chips, which impacted our customers’ ability to build or launch camerastheir products and as a result, negatively impacted the timing and scope ofimpact our customers’ demand for our SoCssolutions. Similarly, our ability to generate design wins in some markets, such as the secondautomotive OEM market, requires us to collaborate with third-party software suppliers in order to offer a complete solution to customers. Our inability to successfully collaborate with such third-party suppliers, or such suppliers’ inability to develop and third quarters of fiscal year 2017. Similarly, errors or defects within a camera system or in the manner in which the various components interact could prevent or delay production of our customers’ products, whichdeliver software, could harm our ability to achieve design wins and harm our business.
We outsource our wafer fabrication, assembly and testing operations to third parties, and if these parties fail to produce and deliver our products according to requested demands in specification, quantity, cost and time, our reputation, customer relationships and operating results could suffer.
We rely on third parties for substantially all of our manufacturing operations, including wafer fabrication, assembly and testing. Currently, the majority of our SoCs are supplied by Samsung in facilities located in Austin, Texas and South Korea, from whom we have the option to purchase both fully assembled and tested products as well as tested die in wafer form for assembly. Samsung subcontracts the assembly and initial testing of the assembled chips it supplies to us to Signetics Corporation and STATS ChipPAC Ltd. In the case of purchases of tested die from Samsung, we contract the assembly to Advanced Semiconductor Engineering, Inc., or ASE. We also have products supplied by Global UniChip Corporation, or GUC, in Taiwan, from whom we purchase fully assembled and tested products. The wafers used by GUC in the assembly of our products are manufactured by TSMC in Taiwan. The assembly is done by GUC subcontracted assembly suppliers ASE, and Powertech Technology Inc, or PTI. Final testing of all of our products is handled by Sigurd Corporation or King Yuan Electronics Co., Ltd. or Sigurd Corporation under the supervision of our engineers. We depend on these third parties to supply us with material of a requested quantity in a timely manner that meets our standards for yield, cost and manufacturing quality. Availability of capacity within our supply chain tightened during fiscal year 2023, which at times limited the volume of products we can produce, negatively impacting our business and operations, and similar capacity constraints may adversely affect our business in the future. Moreover, because each SoC is fabricated in only one manufacturing facility, or single sourced, any disruption to a facility could cause significant delays in the production or shipment of the products produced in that facility that could not be easily offset by having such product(s) produced in another facility. We do not have any long-term supply agreements with any of our manufacturing suppliers. If one or more of these vendors terminates its relationship with us, or if we encounter any problems with our manufacturing supply chain, including available capacity constraints, our ability to ship our solutions to our customers on time and in the quantity required would be adversely affected, which in turn could cause an unanticipated decline in our sales and damage our customer relationships.
If, in the future, we enter into arrangements with suppliers that include additional fees to expedite delivery, nonrefundable deposits or loans in exchange for capacity commitments or commitments to purchase specified quantities over extended periods, such arrangements may be costly, reduce our financial flexibility and be on terms unfavorable to us, if we are able to secure such arrangements at all. To date, we have not entered into any such arrangements with our suppliers. If we need additional foundry or assembly and test subcontractors because of increased demand or the inability to obtain timely and adequate deliveries from our current vendors, we may not be able to do so cost-effectively, if at all.
A substantial portion of our revenue is processed through a single distributor and the loss of this distributor may cause disruptions in our shipments, which may adversely affect our operations and financial condition.
We sell a significant percentage of our solutions through a single distributor, WT, which serves as our non-exclusive sales representative and fulfillment partner in Asia other than Japan. Approximately 53%, 57% and 62% of our revenue was derived from sales through WT for the fiscal years ended January 31, 2024, 2023 and 2022, respectively. We anticipate that a significant portion of our revenue will continue to be derived from sales through WT in the foreseeable future. Our current agreement with WT is effective until January 2026, unless it is terminated earlier by either party for any or no reason with 60 days written notice or by failure of the breaching party to cure a material breach within 30 days following written notice of such material breach by the non-breaching party. Our agreement with WT will automatically renew for additional successive 12-month terms unless at least 60 days before the end of the then-current term either party provides written notice to the other party that it elects not to renew the agreement. Termination of the relationship with WT, either by us or by WT, could result in a temporary or permanent loss of revenue. We may not be successful in finding suitable alternative distributors on satisfactory terms, or at all, and this could adversely affect our ability to effectively sell our solutions in certain geographical locations or to certain end customers. Furthermore, WT, or any successor or other distributors we do business with, may face issues obtaining credit, which could impair their ability to make timely payments to us.
We are subject to risks associated with our distributors' product inventories.
35
We sell many of our products to customers through distributors who maintain their own inventory of our products for sale to ODMs and end customers. We allow limited price adjustments on sales to distributors. Price adjustments may be effected by way of credits for future product or by cash payments to the distributor, either in arrears or in advance, using estimates based on historical transactions. In accordance with ASC 606, we recognize revenue on sales to distributors upon shipment and transfer of control (known as “sell-in” revenue recognition) based on the amount of consideration expected to be received. To the extent that the actual consideration received is materially different from estimated variable consideration recognized, we may be required to adjust revenue in subsequent periods.
If our distributors are unable to sell an adequate amount of their inventory of our products in a given quarter to ODMs and end customers, or if they decide to decrease their inventories for any reason, such as adverse global economic conditions or a downturn in technology spending, our sales to these distributors and our revenues may decline. We also face the risk that our distributors may purchase, or for other reasons accumulate, inventory levels of our products in any particular quarter in excess of future anticipated sales to end customers. If such sales do not occur in the time frame anticipated by these distributors for any reason, these distributors may substantially decrease the amount of product they order from us in subsequent periods until their inventory levels realign with end-customer demand, which would harm our business and could adversely affect our revenues in such subsequent periods. In recent periods, some end customers have indicated they are seeking to reduce their inventory levels, which may reduce such customers’ demand for our products, including products purchased through our distributors, in future periods and harm our financial results.
If our foundry vendors do not achieve satisfactory yields or quality, our reputation and customer relationships could be harmed.
The fabrication of our video and image processing SoC solutions is a complex and technically demanding process. Minor deviations in the manufacturing process can cause substantial decreases in yields, and in some cases, cause production to be suspended. Our foundry vendors, from time to time, experience manufacturing defects and reduced manufacturing yields, including in the fabrication of our SoCs. Changes in manufacturing processes or the inadvertent use of defective or contaminated materials by our foundry vendors could result in lower than anticipated manufacturing yields or unacceptable performance of our SoCs. Many of these problems are difficult to detect at an early stage of the manufacturing process and may be time consuming and expensive to correct. Poor yields from our foundry vendors, or defects, integration issues or other performance problems in our solutions, could cause us significant customer relations and business reputation problems, harm our financial results and give rise to financial or other damages to our customers. Our customers might consequently seek damages from us for their losses. A product liability claim brought against us, even if unsuccessful, would likely be time consuming and costly to defend.
Each of our SoC solutions is manufactured at a single location. If we experience manufacturing problems at a particular location, we would be required to transfer manufacturing to a new location or supplier. Converting or transferring manufacturing from a primary location or supplier to a backup fabrication facility could be expensive and could take two or more quarters. During such a transition, we would be required to meet customer demand from our then-existing inventory, as well as any partially finished goods that could be modified to the required product specifications. We do not seek to maintain sufficient inventory to address a lengthy transition period because we believe it is uneconomical to keep more than minimal inventory on hand.uneconomical. As a result, we may not be able to meet customer needs during such a transition, which could delay shipments, cause production delays, result in a decline in our sales and damage our customer relationships.
We may experience difficulties in transitioning to new wafer fabrication process technologies or in achieving higher levels of design integration, which may result in reduced manufacturing yields, delays in product deliveries and increased costs.
We aim to use the most advanced manufacturing process technology appropriate for our products that is available from our third-party foundries. As a result, we periodically evaluate the benefits of migrating our solutions to smaller geometry process technologies in order to improve performance and reduce costs. We believe this strategy will help us remain competitive. These ongoing efforts require us from time to time to modify the manufacturing processes for our products and to redesign some products, which in turn may result in delays in product deliveries. We may face difficulties, delays and increased expense as we transition our products to new processes, such as the 10nm process nodes, and potentially to new foundries. We depend on Samsung and TSMC, as the principal foundries for our products, to transition to new processes successfully. We cannot assure you that Samsung or TSMC will be able to effectively manage such transitions or that we will be able to maintain our relationship with Samsung or TSMC or develop relationships with new foundries. Moreover, as we utilize more advanced process nodes beyond 10nm, we are increasingly dependent upon Samsung and TSMC, who are two of the few foundries currently available for certain advanced process technologies. If we or our foundry vendors experience significant delays in transitioning to smaller geometries or fail to efficiently implement transitions, we could experience reduced manufacturing yields, delays in product deliveries and increased costs, all of which could harm our relationships with our customers and our operating results. As new processes become more prevalent, we expect to continue to integrate greater levels of functionality, as well as more end-customer and third-party intellectual property, into our solutions. We may not be able to achieve higher levels of design integration or deliver new integrated solutions on a timely basis.
We rely on third-party vendors to supply software development tools to us for the development of our new products, and we may be unable to obtain the tools necessary to develop or enhance new or existing products.
We rely on third-party software development tools to assist us in the design, simulation and verification of new products or product enhancements. To bring new products or product enhancements to market in a timely manner, or at all, we need software development tools that are sophisticated enough or technologically advanced enough to complete our design, simulations and verifications. In the future, the design requirements necessary to meet consumer demands for more features and greater functionality from our solutions may exceed the capabilities of available software development tools. Unavailability of software development tools may result in our missing design cycles or losing design wins, either of which could result in a loss of market share or negatively impact our operating results.
Because of the importance of software development tools to the development and enhancement of our solutions, our relationships with leaders in the computer-aided design industry, including Cadence Design Systems, Inc., Mentor Graphics Corporation and Synopsys, Inc., are critical to us. We have invested significant resources to develop relationships with these industry leaders. We believe that utilizing next-generation development tools to design, simulate and verify our products will help us remain at the forefront of the video compression market, and develop solutions that utilize leading-edge technology on a rapid basis. If these relationships are not successful, we may be unable to develop new products or product enhancements in a timely manner, which could result in a loss of market share, a decrease in revenue or negatively impact our operating results.
36
Our failure to adequately protect our intellectual property rights could impair our ability to compete effectively or defend ourselves from litigation, which could harm our business, financial condition and results of operations.
Our success depends, in part, on our ability to protect our intellectual property. We rely primarily on patent, copyright, trademark and trade secret laws, as well as confidentiality and non-disclosure agreements and other contractual protections, to protect our proprietary technologies and know-how, all of which offer only limited protection. The steps we have taken to protect our intellectual property rights may not be adequate to prevent misappropriation of our proprietary information or infringement of our intellectual property rights, and our ability to prevent such misappropriation or infringement is uncertain, particularly in countries outside of the United States. The failure of our patents to adequately protect our technology might make it easier for our competitors to offer similar products or technologies, which would harm our business. For example, our patents and patent applications could be opposed, contested, circumvented, designed around by our competitors or be declared invalid or unenforceable in judicial or administrative proceedings. Our foreign patent protection is generally not as comprehensive as our U.S. patent protection and may not protect our intellectual property in some countries where our products are sold or may be sold in the future. Many U.S.-based companies have encountered substantial intellectual property infringement in foreign countries, including countries where we sell products. Even if foreign patents are granted, effective enforcement in foreign countries may not be available. For example, the legal environment relating to intellectual property protection in China is relatively weak, often making it difficult to create and enforce such rights. We may not be able to effectively protect our intellectual property rights in China or elsewhere. If such an impermissible use of our intellectual property or trade secrets were to occur, our ability to sell our solutions at competitive prices may be adversely affected and our business, financial condition, operating results and cash flows could be materially and adversely affected.
The legal standards relating to the validity, enforceability and scope of protection of intellectual property rights are uncertain and evolving. We cannot assure you that others will not develop or patent similar or superior technologies, products or services, or that our patents, trademarks and other intellectual property will not be challenged, invalidated or circumvented by others.
Unauthorized copying or other misappropriation of our proprietary technologies could enable third parties to benefit from our technologies without paying us for doing so, which could harm our business. Monitoring unauthorized use of our intellectual property is difficult and costly. Although we are not aware of any unauthorized use of our intellectual property in the past, it is possible that unauthorized use of our intellectual property may have occurred or may occur without our knowledge. We cannot assure you that the steps we have taken will prevent unauthorized use of our intellectual property. Our failure to effectively protect our intellectual property could reduce the value of our technology in licensing arrangements or in cross-licensing negotiations.
We may in the future need to initiate infringement claims or litigation in order to try to protect our intellectual property rights. Litigation, whether we are a plaintiff or a defendant, can be expensive, time-consuming and may divert the efforts of our technical staff and management, which could harm our business, whether or not such litigation results in a determination favorable to us. Litigation also puts our patents at risk of being invalidated or interpreted narrowly and our patent applications at risk of not being issued. Additionally, any enforcement of our patents or other intellectual property may provoke third parties to assert counterclaims against us. If we are unable to protect our proprietary rights or if third parties independently develop or gain access to our or similar technologies, our business, revenue, reputation and competitive position could be harmed.
Third parties’ assertions of infringement of their intellectual property rights could result in our having to incur significant costs and cause our operating results to suffer.
The semiconductor industry is characterized by vigorous protection and pursuit of intellectual property rights and positions, which has resulted in protracted and expensive litigation for many companies. Certain of our customers have received, and we expect, particularly to the extent we gain greater market visibility, that in the future we may receive, communications from others alleging our infringement of their patents, trade secrets or other intellectual property rights. In addition, certain of our end customers have been the subject of lawsuits alleging infringement of intellectual property rights by products incorporating our solutions, including the assertion that the alleged infringement may be attributable, at least in part, to our technology. Lawsuits resulting from such allegations could subject us to significant liability for damages and invalidate our proprietary rights, though this has not occurred to date. Any potential intellectual property litigation also could force us to do one or more of the following:
|
|
lose the opportunity to license our technology to others or to collect royalty payments based upon successful protection and assertion of our intellectual property against others;
incur significant legal expenses;
pay substantial damages to the party whose intellectual property rights we may be found to be infringing;
redesign those products that contain the allegedly infringing intellectual property; or
attempt to obtain a license to the relevant intellectual property from third parties, which may not be available on reasonable terms or at all.
Any significant impairment of our intellectual property rights from any litigation we face could harm our business and our ability to compete.
Any potential dispute involving our patents or other intellectual property could affect our customers, which could trigger our indemnification obligations to them and result in substantial expense to us.
In any potential dispute involving our patents or other intellectual property, our customers could also become the target of litigation. Certain of our customers have received notices from third parties claiming to have patent rights in certain technology and inviting our customers to license this technology, and certain of our end customers have been the subject of lawsuits alleging infringement of patents by products incorporating our solutions, including the assertion that the alleged infringement may be attributable, at least in part, to our technology. Because we indemnify our customers for intellectual property claims made against them for products incorporating our technology, any litigation could trigger technical support and indemnification obligations under some of our license agreements, which could result in substantial expense to us. Although we have not incurred significant indemnity expenses related to intellectual property claims to date, we anticipate that we will receive requests for indemnity in the future pursuant to our license agreements with our customers. In addition, other customers or end customers with whom we do not have formal agreements requiring us to indemnify them may ask us to indemnify them if a claim is made as a condition to awarding future design wins to us. Because some of our ODMs and OEMs are larger than we are and have greater resources than we do, they may be more likely to be the target of an infringement claim by third parties than we would be, which could increase our chances of becoming involved in a future lawsuit. Although we have not yet been subject to such claims, if any such claims were to succeed, we might be forced to pay damages on behalf of our ODMs or OEMs that could increase our expenses, disrupt our ability to sell our solutions and reduce our revenue. In addition to the time and expense required for us to supply support or indemnification to our customers, any such litigation could severely disrupt or shut down the business of our customers, which in turn could hurt our relations with our customers and cause the sale of our products to decrease.
A breach of our security systems may have a material adverse effect on our business.
Our security systems are designed to maintain the physical security of our facilities and information systems and protect our customers’, suppliers’ and employees’ confidential information. Accidental or willful security breaches or other unauthorized access by third parties to our facilities or our information systems or the existence of computer viruses in our data or software could expose us to a risk of information loss and misappropriation of proprietary and confidential information. Security breaches, computer malware and computer hacking attacks have become more prevalent and sophisticated. Experienced computer programmers and hackers may be able to penetrate our security controls and misappropriate or compromise our confidential information or that of third parties or create system disruptions. Computer programmers and hackers also may be able to develop and deploy viruses, worms and other malicious software programs that attack our information systems and cause disruptions of our business. Data security breaches may also result from non-technical means, for example, actions by an employee. Any theft or misuse of this information could result in, among other things, unfavorable publicity, damage to our reputation, difficulty in marketing our products, allegations by our customers that we have not performed our contractual obligations, litigation by affected parties and possible financial obligations for liabilities and damages related to the theft or misuse of this information, any of which could have a material adverse effect on our business, financial condition, our reputation, and our relationships with our customers and partners. We also rely on a number of third-party “cloud-based” service providers of corporate infrastructure services relating to, among other things, human resources, electronic communication services and some finance functions, and we are, of necessity, dependent on the security systems of these providers. Any security breaches or other unauthorized access by third parties to the systems of our cloud-based service providers or the existence of computer viruses in their data or software could expose us to a risk of information loss and misappropriation of confidential information. Since the techniques used to obtain unauthorized access or to sabotage systems change frequently and are often not recognized until launched against a target, we may be unable to anticipate these techniques or to implement adequate preventative measures.
We are subject to governmental laws, regulations and other legal obligations related to privacy and data protection.
The legislative and regulatory framework for privacy and data protection issues worldwide is rapidly evolving and is likely to remain uncertain for the foreseeable future. We collect personally identifiable information (“PII”) and other data as part of our business processes and activities. This data is subject to a variety of U.S. and international laws and regulations, including oversight by various regulatory or other governmental bodies. Many foreign countries and governmental bodies, including the European Union and other relevant jurisdictions where we conduct business, have laws and regulations concerning the collection and use of PII and other data obtained from their residents or by businesses operating within their jurisdictions that are currently more restrictive than those in the U.S. Additionally, in May 2016, the European Union adopted the General Data Protection Regulation that will impose more stringent data protection requirements and will provide for greater penalties for noncompliance beginning in May 2018. While we have developed plans to meet these requirements, these plans are subject to many variables that could delay or otherwise affect implementation. Any inability, or perceived inability, to adequately address privacy and data protection concerns, even if unfounded, or to comply with applicable laws, regulations, policies, industry standards, contractual obligations or other legal obligations, could result in additional cost and liability to us, damage our reputation and adversely affect our business.
We rely on third parties to provide services and technology necessary for the operation of our business. Any failure of one or more of our vendors, suppliers or licensors to provide such services or technology could harm our business.
We rely on third-party vendors to provide critical services, including, among other things, services related to accounting, human resources, information technology and network monitoring that we cannot or do not create or provide ourselves. We depend on these vendors to ensure that our corporate infrastructure will consistently meet our business requirements. The ability of these third-party vendors to successfully provide reliable and high-quality services is subject to technical and operational uncertainties that are beyond our control. While we may be entitled to damages if our vendors fail to perform under their agreements with us, our agreements with these vendors limit the amount of damages we may receive. In addition, we do not know whether we will be able to collect on any award of damages or that these damages would be sufficient to cover the actual costs we would incur as a result of any vendor’s failure to perform under its agreement with us. Upon expiration or termination of any of our agreements with third-party vendors, we may not be able to replace the services provided to us in a timely manner or on terms and conditions, including service levels and cost, that are favorable to us, and a transition from one vendor to another vendor could subject us to operational delays and inefficiencies until the transition is complete.
Additionally, we incorporate
Any disruption to the operations of our third-party contractors and their suppliers could cause significant delays in the production or shipment of our products.
Our operations could be harmed if manufacturing, logistics or other operations of our third-party contractors or their suppliers are disrupted for any reason, including natural disasters, high heat events or water shortages, severe storms, other negative impacts from climate change, information technology intosystem failures, military actions or environmental, public health or regulatory issues. The majority of our products are manufactured by or receive components from third-party contractors located in South Korea, Taiwan and Japan. The risk of an earthquake or tsunami in South Korea, Taiwan, Japan and elsewhere in the Pacific Rim region is significant due to the proximity of major earthquake fault lines. A disruption in the availability of image sensors from Sony Corporation as a result of the 2016 Kumamoto, Japan earthquake impacted our customers’ ability to build or launch cameras and, as a result, negatively impacted the timing and scope of demand for our SoCs in fiscal year 2017. Similarly, a severe cold storm in Texas in February 2021 disrupted the manufacturing of some of our products at Samsung’s Texas facility for several weeks. Any disruption resulting from such events could cause significant delays in the production or shipment of our products until we are able to shift our manufacturing, assembling or testing from the affected contractor to another third-party vendor. We may not be able to obtain alternate capacity on favorable terms, or at all.
Risks Related to Our Legal and Regulatory Environment
Global economic and political conditions, including high inflation, recessionary concerns and trade restrictions, may have an impact on our business and financial condition in ways that we currently cannot predict.
Our operations and performance depend significantly on global, regional and U.S. economic and geopolitical conditions. Customer demand for our solutions may be negatively impacted by weak economic conditions, high inflation or recessionary environments in the US and other nations. Inflation or other deteriorations in global economic conditions may impact our operating expenses and third parties may demand pricing accommodations, which could harm our ability to meet customer demands or collect revenue or otherwise harm our business and financial results.
General trade tensions between the United States and China have been escalating, which has, in our view, created and will perpetuate an uncertain business environment. Additionally, the U.S. government announced new controls restricting the ability to send certain products and technology related to semiconductors, semiconductor manufacturing, advanced computing, supercomputing, and artificial intelligence to China, including Hong Kong, without an export license. In many cases, these licenses are subject to a policy of denial and will not be issued. While our current products are not restricted by these controls, such controls could impact our ability to export products to China in the future. It also is possible that the Chinese government will retaliate in ways that could impact our business.
If additional tariffs or trade restrictions are imposed on our SoC solutions or the products of our customers, or trade restrictions are imposed on our ability to conduct business with certain customers, there could be a negative impact on our operations and financial performance. Even in the absence of new restrictions, tariffs or changes in export classifications, it is possible that foreign customers could take actions to reduce dependence on the supply of components, including our solutions, that could be subject to new export classifications or trade restrictions. There are also risks that the Chinese government may, among other things, require the use of local suppliers, compel companies that do business in China to partner with local companies to conduct business and provide incentives to government-backed local customers to buy from local suppliers. A large portion of our employee base is in China and impacts to our China offices could significantly harm our operations, make it difficult to support customers and negatively impact product development. The materialization of these risks could have a material adverse effect on our business and financial condition.
37
Further, our business and performance are subject to economic conditions, and our suppliers, distributors, and customers may suffer their own financial and economic challenges.
Russia’s ongoing conflict with Ukraine has triggered significant sanctions from U.S. and European leaders. Changes in U.S. trade policy could trigger retaliatory actions by Russia, its allies and other affected countries, including China, resulting in a trade war. For example, in addition to controls imposed on China discussed above, following Russia’s invasion of Ukraine, the United States and other countries imposed certain economic sanctions and severe export control restrictions against Russia and Belarus, as well as certain Russian nationals, which caused us to terminate certain business relationships in those countries. These sanctions and restrictions have continued to increase as the conflict has further escalated, and the United States and other countries could impose wider sanctions and export restrictions and take other actions in the future that could impact our business. Furthermore, if the conflict between Russia and Ukraine continues for a long period of time, or if other countries, including the U.S., become further involved in the conflict, we could face significant adverse effects to our business and financial condition. In addition, some of our customers and third-party partners have engineering teams located in Russian and/or Ukraine, whose operations have been and may continue to be disrupted by the ongoing conflict between the countries. If such disruption were to continue for an extended period, our customers could face delays in the launch of new products containing our solutions, resulting in delayed or decreased demand for our solutions.
We have significant business operations in Taiwan, including 343 employees as of January 31, 2024, and many of our third-party manufacturing suppliers are located in Taiwan. Accordingly, our business, financial condition and results of operations may be affected by changes in governmental and economic policies in Taiwan, social instability and diplomatic and social developments in or affecting Taiwan due to its international political status. Although significant economic and cultural relations have been established between Taiwan and China, we cannot assure that relations between Taiwan and China will not face political or economic uncertainties in the future. Any deterioration in the relations between Taiwan and China, and other factors affecting military, political or economic conditions in Taiwan, could disrupt our business operations and materially and adversely affect our results of operations.
Our ability to sell our products to several China customers has been restricted.
Several of our customers, including Hangzhou Hikvision Digital Technology Co., Ltd, or Hikvision, Zhejiang Dahua Technology Co., Ltd., or Dahua, and affiliates of Shenzhen Dajiang Baiwang Technology Co., Ltd., have been added to the Entity List of the Bureau of Industry and Security, or BIS, of the U.S. Department of Commerce, or Commerce, which imposes limitations on the supply of U.S. controlled items to the listed entities. In October 2022, BIS imposed additional restrictions on transactions with Dahua involving items subject to BIS export regulations. Notwithstanding our ability to continue to supply some SoC products to some affiliates of the listed entities, these customers may seek to obtain similar or substitute products from our competitors that are not subject to these limitations, or to develop similar or substitute products themselves. We also cannot be certain what additional actions the U.S. government may take with respect to any of our China customers, including changes to the Entity List restrictions, export regulations, tariffs or other trade restrictions, or whether the Chinese government may take any actions in response to U.S. government action that may adversely affect our ability to do business with our China customers. Even in the absence of new restrictions, tariffs or trade actions imposed by the U.S. or Chinese government, our China customers may take actions to reduce dependence on the supply of components subject to U.S. trade regulations, including our SoC solutions, which could have a material adverse effect on our operating results. We are unable to predict the duration of the restrictions imposed by the U.S. government or of any additional governmental actions, any of which could have a long-term adverse effect on our business, operating results and financial condition.
We are subject to governmental export and import controls that could subject us to liability or impair our ability to compete in international markets.
The U.S. and various foreign governments have imposed controls, export license requirements and restrictions on the import or export of certain products, technologies and software. We must export our products in compliance with U.S. export controls, including the Commerce’s Export Administration Regulations. We may not always be successful in obtaining necessary export licenses, and our failure to obtain required import or export approval for our products or limitations on our ability to export or sell our products imposed by these laws may harm both our international and domestic sales and adversely affect our revenue. Noncompliance with these laws could have negative consequences, including government investigations, penalties and reputational harm.
Changes in our products or changes in export, import and economic sanctions laws and regulations may delay our introduction of new products in international markets, prevent our customers from deploying our products internationally or, in some cases, prevent the export or import of our products to or from certain countries altogether. Any change in export or import regulations or legislation, shift or change in enforcement, or change in the countries, persons or technologies targeted by these regulations, could result in decreased use of our products by, or in our decreased ability to export or sell our products to, existing or potential customers with international operations. In such event, our business and results of operations could be adversely affected.
38
We are subject to warranty and product liability claims and to product recalls.
From time to time, we are subject to warranty claims that may require us to make significant expenditures to defend these claims or pay damage awards. In the future, we may also be subject to product liability claims resulting from failure of our solutions or if products we design, manufacture, or sell, cause personal injury or property damage, even where the cause is unrelated to product defects. These risks will likely increase as our products are introduced into new devices, markets, or applications, including autonomous and semi-autonomous automotive, drone and robotic applications. In the event of a warranty claim, we may also incur costs if we compensate the affected customer. We maintain product liability insurance, but this insurance is limited in amount and subject to significant deductibles. There is no guarantee that our insurance will be available or adequate to protect against all claims. We also may incur costs and expenses relating to a recall of one of our customers’ products containing one of our devices. The process of identifying a recalled product in consumer devices that have been widely distributed may be lengthy and require significant resources, and we may do soincur significant replacement costs, contract damage claims from our customers and reputational harm. Costs or payments made in future products. connection with warranty and product liability claims and product recalls could harm our financial condition and results of operations, as well as harm our reputation and cause the market value of our ordinary shares to decline.
We are subject to governmental laws, regulations and other legal obligations related to privacy, data protection and cybersecurity.
The operationlegislative and regulatory framework for privacy, data protection and cybersecurity issues worldwide is rapidly evolving and is likely to remain uncertain for the foreseeable future. We collect and otherwise process personal information and other data as part of our business processes and activities. This data is subject to a variety of U.S. and international laws and regulations, including oversight by various regulatory or other governmental bodies. Many foreign countries and governmental bodies, including China, the European Union and other relevant jurisdictions where we conduct business, have laws and regulations concerning the collection, use and other processing of personal information and other data obtained from their residents or by businesses operating within their jurisdictions that are more restrictive than those in the U.S. For example, the European Union has adopted the General Data Protection Regulation, or GDPR, which imposed stringent data protection requirements and provided for substantial penalties for noncompliance, including the potential for fines of up to €20 million or 4% of the annual global revenues of the noncompliant entity, whichever is greater. The United Kingdom has adopted legislation that substantially implements the GDPR and provides for a similar penalty structure. Similarly, California has adopted the California Consumer Privacy Act of 2018, or CCPA, which took effect in 2020. California has adopted a new law, the California Privacy Rights Act of 2020, or CPRA, that substantially expanded the CCPA as of January 1, 2023. The CCPA, as amended and modified by the CPRA, gives California residents the right to access, delete and opt out of certain sharing of their information, and imposes penalties for failure to comply. Numerous other U.S. states have proposed, and in certain cases enacted, similar general privacy legislation.
In 2021, the National People’s Congress passed the Data Security Law of the People’s Republic of China (Data Security Law) and China’s Personal Information Protection Law (PIPL). The Data Security Law is the first comprehensive data security legislation in China and aims to regulate a wide range of issues in relation to the collection, storage, processing, use, provision, transaction and publication of any kind of data. The PIPL is the first national-level law comprehensively regulating issues in relation to personal information protection in China. Significant uncertainty remains regarding how regulators will interpret and enforce these laws, but the Data Security Law contains provisions that allow substantial government oversight and include fines for failure to obtain required approval from China’s cyber and data protection regulators for cross-border personal information-related data transfers. PIPL authorizes enforcement by cybersecurity authorities and other regulators, and provides for fines and other remedies for noncompliance.
Aspects of these laws remain unclear, resulting in further uncertainty and potentially requiring us to modify our data practices and policies and to incur substantial additional costs and expenses in an effort to comply. Because the interpretation and application of many laws and regulations relating to privacy, data protection, and data security, along with industry standards, are uncertain, it is possible that these laws and regulations may be interpreted and applied in a manner that is inconsistent with our data management practices or the features of our products or solutions, and we could face fines, lawsuits, regulatory investigations, and other claims and penalties, and we could be impairedrequired to fundamentally change our products or our business practices, which could have an adverse effect on our business. Any inability, or perceived inability, to adequately address privacy and data protection concerns, or to comply with applicable laws, regulations, policies, industry standards, contractual obligations or other legal obligations, even if errors occurunfounded, could result in the third-party technology we use. It may be more difficult for us to correct any errors in a timely manner, if at all, because the developmentadditional cost and maintenance of the technology is not within our control. We cannot assure you that these third parties will continue to make their technology, or improvements to the technology, availableliability to us, or that they will continue to supportinhibit sales, damage our reputation and maintain their technology. Further, due to the limited number of vendors of some types of technology, it may be difficult to obtain new licenses or replace existing technology. Any impairment of the technology of oradversely affect our relationship with these third parties could harm our business.
39
Failure to comply with the U.S. Foreign Corrupt Practices Act, or FCPA, and similar laws associated with our activities outside of the United States could subject us to penalties and other adverse consequences.
We face significant risks if we fail to comply with the FCPA and other anti-corruption laws that prohibit improper payments or offers of payment to foreign governments and political parties by us for the purpose of obtaining or retaining business. In many foreign countries, particularly in countries with developing economies, it may be a local custom that businesses operating in such countries engage in business practices that are prohibited by the FCPA or other applicable laws and regulations. Although we implemented an FCPA compliance program, we cannot assure you that all of our employees and agents, as well as those companies to which we outsource certain of our business operations, will not take actions in violation of our policies and applicable law, for which we may be ultimately held responsible. Any violation of the FCPA or other applicable anti-corruption laws could result in severe criminal or civil sanctions and, in the case of the FCPA, suspension or debarment from U.S. government contracting, which could have a material and adverse effect on our reputation, business, financial condition, operating results and cash flows.
We, our customers and third-party contractors are subject to increasingly complex environmental regulations and compliance with these regulations may delay or interrupt our operations and adversely affect our business.
We face increasing complexity in our procurement, design, and research and development operations as a result of requirements relating to the materials composition of our products, including the European Union’s, or EU’s, Restriction on the Use of Certain Hazardous Substances in Electrical and Electronic Equipment, or RoHS, directive, which restricts the content of lead and certain other hazardous substances in specified electronic products put on the market in the EU and similar Chinese legislation relating to marking of electronic products which became effective in March 2007. Failure to comply with these and similar laws and regulations could subject us to fines, penalties, civil or criminal sanctions, contract damage claims, and take-back of non-compliant products, which could harm our business, reputation and operating results. The passage of similar requirements in additional jurisdictions or the tightening of these standards in jurisdictions where our products are already subject to such requirements could cause us to incur significant expenditures to make our products compliant with new requirements, or could limit the markets into which we may sell our products.
Some of our operations, as well as the operations of our contract manufacturers and foundry vendors and other suppliers, are also regulated under various other federal, state, local, foreign and international environmental laws and requirements, including those governing, among other matters, the management, disposal, handling, use, labeling of, and exposure to hazardous substances, and the discharge of pollutants into the air and water. Liability under environmental laws can be joint and several and without regard to comparative fault. We cannot assure you that violations of these laws will not occur in the future, as a result of human error, accident, equipment failure or other causes. Environmental laws and regulations have increasingly become more stringent over time. We expect that our products and operations will be affected by new environmental requirements on an ongoing basis, which will likely result in additional costs, which could adversely affect our business.
Our failure to comply with present and future environmental, health and safety laws could cause us to incur substantial costs, result in civil or criminal fines and penalties and decreased revenue, which could adversely affect our operating results. Failure by our foundry vendors or other suppliers to comply with applicable environmental laws and requirements could cause disruptions and delays in our product shipments, which could adversely affect our relations with our ODMs and OEMs and adversely affect our business and results of operations.
Regulations related to “conflict minerals” may force us to incur additional expenses, may make our supply chain more complex and may result in damage to our reputation with customers.
Pursuant to the Dodd-Frank Wall Street Reform and Consumer Protection Act of 2010, or the Dodd-Frank Act, the Securities and Exchange Commission, or the SEC, has adopted requirements for companies that use certain minerals and metals, known as conflict minerals, in their products, whether or not these products are manufactured by third parties. These requirements require companies to perform due diligence, disclose and report whether or not such minerals originate from the Democratic Republic of the Congo and adjoining countries. These requirements could adversely affect the sourcing, availability and pricing of minerals used in the manufacture of semiconductor devices, including our products. While these requirements continue to be subject to administrative uncertainty, we have incurred, and willmay continue to incur, additional costs to comply with the disclosure requirements, including costs related to determining the source of any of the relevant minerals and metals used in our products. Since our supply chain is complex, we may not be able to sufficiently verify the origins for these minerals and metals used in our products through the due diligence procedures that we implement, which may harm our reputation. In such event, we may also face difficulties in satisfying customers who require that all of the components of our products are certified as conflict mineral free.
We are subject to warranty and product liability claims and to product recalls.
From time to time, we are subject to warranty claims that may require us to make significant expenditures to defend these claims or pay damage awards. In the future, we may also be subject to product liability claims resulting from failure of our solutions or if products we design, manufacture, or sell, cause personal injury or property damage, even where the cause is unrelated to product defects. These risks will likely increase as our products are introduced into new devices, market, or applications, including autonomous and semi-autonomous automotive, UAV and robotic uses. In the event of a warranty claim, we may also incur costs if we compensate the affected customer. We maintain product liability insurance, but this insurance is limited in amount and subject to significant deductibles. There is no guarantee that our insurance will be available or adequate to protect against all claims. We also may incur costs and expenses relating to a recall of one of our customers’ products containing one of our devices. The process of identifying a recalled product in consumer devices that have been widely distributed may be lengthy and require significant resources, and we may incur significant replacement costs, contract damage claims from our customers and reputational harm. Costs or payments made in connection with warranty and product liability claims and product recalls could harm our financial condition and results of operations, as well as harm our reputation and cause the market value of our ordinary shares to decline.
40
Rapidly changing industry standards could make our video and image processing solutions obsolete, which would cause our operating results to suffer.
We design our video and image processing solutions to conform to video compression standards, including MPEG-2, H.264 and H.265, set by industry standards setting bodies such as ITU-T Video Coding Experts Group and the ISO/IEC Moving Picture Experts Group. Generally, our solutions comprise only a part of a camera or broadcast infrastructure equipment device. All components of these devices must uniformly comply with industry standards in order to operate efficiently together. We depend on companies that provide other components of the devices to support prevailing industry standards. Many of these companies are significantly larger and more influential in driving industry standards than we are. Some industry standards may not be widely adopted or implemented uniformly, and competing standards may emerge that may be preferred by our customers or by consumers. If our customers or the suppliers that provide other device components adopt new or competing industry standards with which our solutions are not compatible, or if the industry groups fail to adopt standards with which our solutions are compatible, our existing solutions would become less desirable to our customers. As a result, our sales would suffer, and we could be required to make significant expenditures to develop new SoC solutions. For example, if the new H.265 video compression standard is not broadly adopted by our customers or potential customers, sales of our H.265 compliant solutions would suffer and we may be required to expend substantial resources to comply with an alternative video compression standard. In addition, existing standards may be challenged as infringing upon the intellectual property rights of other companies or may be superseded by new innovations or standards.
Products for communications applications are based on industry standards that are continually evolving. Our ability to compete in the future will depend on our ability to identify and ensure compliance with these evolving industry standards, including any new video compression standards. The emergence of new industry standards could render our solutions incompatible with products developed by other suppliers. As a result, we could be required to invest significant time and effort and to incur significant expense to redesign our solutions to ensure compliance with relevant standards. If our solutions are not in compliance with prevailing industry standards for a significant period of time, we could miss opportunities to achieve crucial design wins, which could harm our business.
We are subject to the cyclical nature of the semiconductor industry.
The semiconductor industry is highly cyclical and is characterized by constant and rapid technological change, rapid product obsolescence, price erosion, evolving standards, short product life cycles and wide fluctuations in product supply and demand. The industry experienced a significant downturn during the recent global recession. These downturns have been characterized by diminished product demand, production overcapacity, high inventory levels and accelerated erosion of average selling prices. Any future downturns could harm our business and operating results. Furthermore, any significant upturn in the semiconductor industry could result in increased competition for access to third-party foundry and assembly capacity. We are dependent on the availability of this capacity to manufacture and assemble our SoC solutions. None of our third-party foundry or assembly contractors has provided assurances that adequate capacity will be available to us in the future.
The use of open source software in our products, processes and technology may expose us to additional risks and compromise our proprietary intellectual property.
Our products, processes and technology sometimes utilize and incorporate software that is subject to an open source license. Open source software is typically freely accessible, usable and modifiable. Certain open source software licenses, such as the GNU General Public License, require a user who intends to distribute the open source software as a component of the user’s software to disclose publicly part or all of the source code to the user’s software. In addition, certain open source software licenses require the user of such software to make any derivative works of the open source code available to others on terms unfavorable to us or at no cost. This can subject previously proprietary software to open source license terms.
While we monitor the use of open source software in our products, processes and technology and try to ensure that no open source software is used in such a way as to require us to disclose the source code to the related product, processes or technology when we do not wish to do so, such use could inadvertently occur. Additionally, if a third-party software provider has incorporated certain types of open source software into software we license from such third-party for our products, processes or technology, we could, under certain circumstances, be required to disclose the source code to our products, processes or technology. This could harm our intellectual property position and our business, results of operations and financial condition.
Some of our operations and a significant portion of our customers and our subcontractors are located outside of the United States, which subjects us to additional risks, including increased complexity and costs of managing international operations and geopolitical instability.
We have research and development design centers and business development offices in China, Japan, Italy, South Korea and Taiwan, and we expect to continue to conduct business with companies that are located outside the United States, particularly in Asia. Even customers of ours that are based in the United States often use contract manufacturers based in Asia to manufacture their products, and these contract manufacturers typically purchase products directly from us. As a result of our international focus, we face numerous challenges and risks, including:
increased complexity and costs of managing international operations;
longer and more difficult collection of receivables;
difficulties in enforcing contracts generally;
regional economic instability;
geopolitical instability and military conflicts;
limited protection of our intellectual property and other assets;
compliance with local laws and regulations and unanticipated changes in local laws and regulations, including tax laws and regulations;
trade and foreign exchange restrictions and higher tariffs;
travel restrictions;
timing and availability of import and export licenses and other governmental approvals, permits and licenses, including export classification requirements;
foreign currency exchange fluctuations relating to our international operating activities;
restrictions imposed by the U.S. government on our ability to do business with certain companies or in certain countries as a result of international political conflicts;
transportation delays and other consequences of limited local infrastructure, and disruptions, such as large scale outages or interruptions of service from utilities or telecommunications providers;
difficulties in staffing international operations;
heightened risk of terrorist acts;
local business and cultural factors that differ from our normal standards and practices;
differing employment practices and labor relations;
regional health issues and natural disasters; and
work stoppages.
Our third-party contractors and their suppliers are concentrated in South Korea, Taiwan and Japan, a region subject to earthquakes and other natural disasters. Any disruption to the operations of these contractors could cause significant delays in the production or shipment of our products.
The majority of our products are manufactured by or receive components from third-party contractors located in South Korea, Taiwan and Japan. The risk of an earthquake or tsunami in South Korea, Taiwan, Japan and elsewhere in the Pacific Rim region is significant due to the proximity of major earthquake fault lines. For example, in December 2006 a major earthquake occurred in Taiwan and in March 2011 a major earthquake and tsunami occurred in Japan. Although we are not aware of any significant damage suffered by our third-party contractors as a result of those natural disasters, the occurrence of additional earthquakes or other natural disasters could result in the disruption of our foundry vendor or assembly and test capacity. Most recently, a disruption in the availability of image sensors from Sony Corporation as a result of the April 14, 2016 Kumamoto, Japan earthquake impacted our customers’ ability to build or launch cameras and, as a result, negatively impacted the timing and scope of demand for our SoCs in the second and third quarters of fiscal year 2017. Any disruption resulting from such events could cause significant delays in the production or shipment of our products until we are able to shift our manufacturing, assembling or testing from the affected contractor to another third-party vendor. We may not be able to obtain alternate capacity on favorable terms, or at all.
If our operations are interrupted, our business and reputation could suffer.
Our operations and those of our manufacturers are vulnerable to interruption caused by technical breakdowns, computer hardware and software malfunctions, software viruses, infrastructure failures, fires, earthquakes, floods, power losses, telecommunications failures, terrorist attacks, wars, Internet failures and other events beyond our control. Any disruption in our services or operations could result in a reduction in revenue or a claim for substantial damages against us, regardless of whether we are responsible for that failure. We rely on our computer equipment, database storage facilities and other office equipment, which are located primarily in the seismically active San Francisco Bay Area and Taiwan. If we suffer a significant database or network facility outage, our business could experience disruption until we fully implement our back-up systems.
We are subject to regulatory compliance requirements, including Section 404 of the Sarbanes-Oxley Act of 2002, which are costly to comply with, and our failure to comply with these requirements could harm our business and operating results.
We are subject to disclosure and compliance requirements associated with being a public company, including but not limited to compliance with Section 404 of the Sarbanes-Oxley Act of 2002. For example, Section 404 of the Sarbanes-Oxley Act requires that our management report on, and our independent auditors attest to, the effectiveness of our internal control structure and procedures for financial reporting. Compliance with Section 404 requires a significant amount of time, expenses and diversion of internal resources. If we or our auditors discover a material weakness in our internal controls, the disclosure of that fact, even if quickly remedied, could reduce the market’s confidence in our financial statements and harm our stock price. In addition, if we fail to maintain effective controls over financial reporting, we could be subject to sanctions or investigations by The NASDAQ StockNasdaq Global Select Market, the SEC, or other regulatory authorities. Furthermore, investor perceptions of our company may suffer, and this could cause a decline in the market price of our ordinary shares. Any inability to provide reliable financial reports or prevent fraud could harm our business. We may not be able to effectively and timely implement necessary control changes and employee training to ensure continued compliance with the Sarbanes-Oxley Act and other regulatory and reporting requirements. We cannot assure you that in the future we will be able to continue to fully comply with the requirements of the Sarbanes-Oxley Act or that management or our auditors will conclude that our internal controls are effective in future periods. Irrespective of compliance with Section 404, any failure of our internal controls could have a material adverse effect on our stated results of operations and harm our reputation. Furthermore, investor perceptions of our company may suffer, and this could cause a decline in the market price of our ordinary shares.
Changes
We have identified a material weakness in our internal control over financial reporting. Failure to achieve and maintain effective internal control over financial accounting standards mayreporting in accordance with Section 404 of the Sarbanes-Oxley Act of 2002 could materially and adversely affect our business, results of operations, financial condition, and stock price.
We are subject to disclosure and compliance requirements associated with being a public company, including but not limited to compliance with Section 404 of the Sarbanes-Oxley Act of 2002. For example, Section 404 of the Sarbanes-Oxley Act requires that our management report on, and our independent auditors attest to, the effectiveness of our internal control structure and procedures for financial reporting. Compliance with Section 404 requires a significant amount of time, expenses and diversion of internal resources.
In connection with the preparation of our consolidated financial statements, a material weakness was identified in our internal control over financial reporting as of January 31, 2024. We did not design and maintain effective controls over the accounting for income taxes. Specifically, we did not have tax personnel with the appropriate skills and level of experience to assess complicated tax matters, and we did not properly identify, risk assess, design and maintain effective controls related to the income tax provision, including controls related to the evaluation of tax deductions and recognition and measurement of deferred tax assets. This material weakness resulted in immaterial errors to the provision for income taxes, deferred tax assets, income taxes payable, and income tax disclosures which were adjusted in our consolidated financial statements for the fiscal year ended January 31, 2024. Additionally, this material weakness could result in a misstatement of the aforementioned account balances or disclosures that would result in a material misstatement in our annual or interim consolidated financial statements that would not be prevented or detected.
The material weakness did not result in a material misstatement to the current fiscal year’s consolidated financial statements. As a result of this material weakness, our management concluded that our internal control over financial reporting was not effective based on the framework in Internal Control-Integrated Framework (2013), issued by the Committee of Sponsoring Organizations of the Treadway Commission. We are actively engaged in implementing a remediation plan designed to address this material weakness. If our remedial measures are insufficient to address the material weakness, or if additional material weaknesses or significant deficiencies in our internal control are discovered or occur in the future, our consolidated financial statements may contain material misstatements and we could be required to restate our financial results.
Even if this material weakness is quickly remedied, or if we or our auditors discover an additional material weakness in our internal controls, the market’s confidence in our financial statements could decline and our stock price may be harmed. In addition, our failure to maintain effective controls over financial reporting could subject us to sanctions or investigations by The Nasdaq Global Select Market, the SEC, or other regulatory authorities. Irrespective of compliance with Section 404, this and any other failure of our internal controls could have a material adverse effect on our stated results of operations and harm our reputation. Furthermore, investor perceptions of our company may suffer, and this could cause us to change our business practices.
We prepare our consolidated financial statements to conform to generally accepted accounting principles, or GAAP,a decline in the United States. These accounting principles are subject to interpretation by the American Institute of Certified Public Accountants, the SEC and various bodies formed to interpret and create accounting rules and regulations. Changes in those accounting rules, including the new revenue recognition guidance and the associated adoption efforts, which are currently underway, could have a significant effect on our financial results, require significant resources, pose challenges in forecasting revenue and may affect our reporting of transactions completed before a change is announced. Changes to those rules or the questioning of current practices may adversely affect our reported financial results or the way we conduct our business.
Currently we recognize revenues for sales to distributors upon sell through by the distributors. Upon the adoption of ASU 606 effective February 1, 2018, we will recognize revenue on sales to distributors upon shipment and transfer of control (known as “sell-in” revenue recognition) based on the amount of consideration expected to be received. To the extent that the actual consideration received is materially different from estimated variable consideration used in revenue recognition, we may be required to adjust revenue in subsequent periods.
The complexity of calculating our tax provision may result in errors that could result in restatements of our financial statements.
We are incorporated in the Cayman Islands and our operations are subject to income and transaction taxes in the United States, China, Hong Kong, Japan, Italy, South Korea, Taiwan and other jurisdictions in which we do business. Due to the complexity associated with the calculation of our tax provision, we have hired independent tax advisors to assist us. If we or our independent tax advisors fail to resolve or fully understand certain issues, there may be errors that could result in us having to restate our financial statements. Restatements are generally costly and could adversely impact our results of operations or have a negative impact on the tradingmarket price of our ordinary shares.
Changes in effective tax rates or adverse outcomes resulting from examination of our income tax returns could adversely affect our results.
41
Our future effective tax rates could be adversely affected if our earnings are lower than anticipated in countries where we have lower statutory rates and higher than anticipated in countries where we have higher statutory rates, by changes in the valuation of our deferred tax assets and liabilities, transfer pricing adjustments, re-organization or restructuring of our businesses, changes in our corporate structure, including the effect of acquisitions on our legal structure, by tax costs related to intercompany realignments, tax effects of share-based compensation, expiration of or lapses in tax incentives, or by changes in tax laws, regulations, accounting principles or interpretations thereof. For example, changes in tax laws, including the recently enacted U.S. federal tax legislation commonly referred to as the Tax Cuts and Jobs Act of 2017, (Tax Act),or Tax Act, as well as other factors, could cause us to experience fluctuations in our tax obligations and effective tax rates and otherwise adversely affect our tax positions and/or our tax liabilities.
The Tax Act requires complex computations not previously provided in U.S. tax law. The U.S. Department of Treasury has broad authority to issue regulations and interpretative guidance that may significantly impact how we will apply the law and impact our results of operations in the period issued. As such,In August 2022, the applicationU.S. enacted the Inflation Reduction Act of accounting guidance for such items is currently uncertain. Further, compliance with the Tax Act and the accounting for such provisions require accumulation of information not previously required2022, or regularly produced. AsIRA, which includes a result, we have providednew 15% corporate minimum tax as well as a provisional estimate1% excise tax on the effectfair value of corporate stock repurchases made by U.S. corporations and certain foreign corporations after December 31, 2022. We do not expect the Tax Act inIRA to have a material impact on our financial statements. As additional regulatory guidance is issued by the applicable taxing authorities, as accounting treatment is clarified, as we perform additional analysis on the application of the law, and as we refine estimates in calculating the effect, our final analysis, which will be recorded in the period completed, may be different from our current provisional amounts, which could materially affect our tax obligations and effective tax rate.
In addition, our income tax returns are subject to continuous examination by the Internal Revenue Service, or IRS, and other tax authorities. We regularly assess the likelihood of adverse outcomes resulting from these examinations to determine the adequacy of our provision for income taxes. We cannot assure you that the outcomes from these continuous examinations will not have an adverse effect on our operating results and financial condition.
Unfavorable tax law changes, an unfavorable governmental review of our tax returns, changes in our geographical earnings mix or imposition of withholding taxes on repatriated earnings could adversely affect our effective tax rate and our operating results.
Our operations are subject to certain taxes, such as income and transaction taxes, in the Cayman Islands, the United States, China, Hong Kong, Japan, Italy, Germany, South Korea, Taiwan and other jurisdictions in which we do business. A change in the tax laws in the jurisdictions in which we do business, including an increase in tax rates or an adverse change in the treatment of an item of income or expense, possibly with retroactive effect, could result in a material increase in the amount of taxes we incur. In particular, past proposals have been made to change certain U.S. tax laws relating to foreign entities with U.S. connections, which may include us. For example, previously proposed legislation has considered treating certain foreign corporations as U.S. domestic corporations (and therefore taxable on all of their worldwide income) if the management and control of the foreign corporation occurs, directly or indirectly, primarily within the United States. If such legislation were enacted, we could, depending on the precise form, be subject to U.S. taxation notwithstanding our domicile outside the United States. In addition, on October 5, 2015over the last several years, the Organization for Economic Co-operation and Development (the “OECD”), which represents(OECD) has been working on a coalition of member countries, released its final reports from the BEPS Action Plans. The final reports include recommendationsBase Erosion and Profit Shifting Project and has been issuing guidelines and proposals covering a number of issues, including country-by-country reporting, permanent establishment rules, transfer pricing rules and tax treaties. TheseMany of these changes which have been or are in the process of being adopted by numerous countries and could increase uncertaintiesmaterially and may adversely affect our provision for income taxes. In 2021, more than 140 countries tentatively signed on to a framework that imposes a global minimum tax of 15%. The Council of the European Union has adopted this initiative, which has been implemented into the domestic laws of some jurisdictions for fiscal years starting on or after December 31, 2023 for multinationals that meet the annual threshold of at least EUR 750 million of consolidated revenues. Additional changes to global tax laws are likely to occur, and such changes may adversely affect our effective tax rate, operating results, and cash flow.
In December 2018, the Cayman Islands passed the International Tax Co-Operation (Economic Substance) Law, 2018, which requires Cayman Islands companies carrying on one or more relevant activities to maintain a substantial economic presence in the Cayman Islands. Effective from December 31, 2019, we have structured our activities to comply with the new law. However, the legislation remains subject to further clarification and interpretation and accordingly, there is no guarantee that we will be deemed to be compliant. Furthermore, this legislation may require us to make additional changes to the activities we carry on in the Cayman Islands, which could increase our cost of operations, and we could be subject to penalties for lack of compliance. As a result, we are not able to determine the impact on our operations and net income as of the current period.
We are subject to periodic audits or other reviews by tax authorities in the jurisdictions in which we conduct our activities. Any such audit, examination or review requires management’s time, diverts internal resources and, in the event of an unfavorable outcome, may result in additional tax liabilities or other adjustments to our historical results.
42
Because we conduct operations in multiple jurisdictions, our effective tax rate is influenced by the amounts of income and expense attributed to each such jurisdiction. If such amounts were to change so as to increase the amounts of our net income subject to taxation in higher-tax jurisdictions, or if we were to commence operations in jurisdictions assessing relatively higher tax rates, our effective tax rate could be adversely affected. In addition, we may determine that it is advisable from time to time to repatriate earnings from subsidiaries under circumstances that could give rise to imposition of potentially significant withholding taxes by the jurisdictions in which such amounts were earned, without our receiving the benefit of any offsetting tax credits, which could also adversely impact our effective tax rate.
We may be classified as a passive foreign investment company which could result in adverse U.S. federal income tax consequences for U.S. holders of our ordinary shares.
Based on the current and anticipated valuation of our assets and the composition of our income and assets, we do not expect to be considered a passive foreign investment company, or PFIC, for U.S. federal income tax purposes for our 20182024 fiscal year or the foreseeable future. However, a separate determination must be made at the close of each taxable year as to whether we are a PFIC for that taxable year, and we cannot assure you that we will not be a PFIC for our 20192025 fiscal year or any future taxable year. Under current law, a non-U.S. corporation will be considered a PFIC for any taxable year if either (a) at least 75% of its gross income is passive income or (b) at least 50% of the value of its assets, generally based on an average of the quarterly values of the assets during a taxable year, is attributable to assets that produce or are held for the production of passive income. PFIC status depends on the composition of our assets and income and the value of our assets (which may be based in part on the value of our ordinary shares, which may fluctuate), including, among others, a pro rata portion of the income and assets of each subsidiary in which we own, directly or indirectly, at least 25% by value of the subsidiary’s equity interests, from time to time. Because we currently hold, and expect to continue to hold, a substantial amount of cash or cash equivalents, and because the calculation of the value of our assets may be based in part on the value of our ordinary shares, which may fluctuate and may fluctuate considerably given that market prices of technology companies historically often have been volatile, we may be a PFIC for any taxable year. If we were treated as a PFIC for any taxable year during which a U.S. holder held ordinary shares, certain adverse U.S. federal income tax consequences could apply for such U.S. holder.
Changes in our United States federal income tax classification, or that of our subsidiaries, could result in adverse tax consequences to our 10% or greater U.S. shareholders.
The Tax Act signed on December 22, 2017 may have changed the consequences to U.S. shareholders that own, or are considered to own, as a result of thecertain attribution rules, ten percent10% or more of the voting power or value of the stock of a non-U.S. corporation (a 10% U.S. shareholder) under the U.S. Federalfederal income tax law applicable to owners of U.S. controlled foreign corporations, (“CFCs”). or CFCs.
Prior to the Tax Act, the Companywe did not believe that we, or any of our non-U.S. subsidiaries, were considered a CFC, which is a determination made daily based on whether the 10% U.S. shareholders together own, or are considered to own as a result ofunder the attribution rules, more than fifty percent50% of the voting power or value of a non-U.S. corporation. TheUnder the Tax Act, repealed Internal Revenue Code Section 958(b)(4), which, unless clarified in future regulationshowever, because our group includes one or other guidance, may result in classification ofmore U.S. subsidiaries, certain of the Company’s foreignour non-U.S. subsidiaries may be classified as CFCs with respect to any single 10% U.S. shareholder. This may be the resultshareholder, even without regard to whether 10% U.S. shareholders together own, directly or indirectly, more than fifty percent50% of the voting power or value of the Company as was the case under prior rules. The repeal is effective as of the last taxable year of CFCs beginning before January 1, 2018 and for the taxable year ofCompany. Our 10% or greater U.S. shareholders in whichshould consult their individual tax advisors for advice regarding the CFCs' taxable year ends.
Fluctuations in exchange rates between and among the currencies of the countries in which we do business may adversely affect our operating results.
Our sales have been historically denominated in U.S. dollars. An increase in the value of the U.S. dollar relative to the currencies of the countries in which our end customers operate could impair the ability of our end customers to cost-effectively integrate our SoCs into their devices which may materially affect the demand for our solutions and cause these end customers to reduce their orders, which would adversely affect our revenue and business. We may experience foreign exchange gains or losses due to the volatility of other currencies comparedTax Act’s revision to the U.S. dollar. A significant portionfederal income tax law applicable to owners of CFCs.
43
Risks Related to Our Intellectual Property
Our failure to adequately protect our solutions are sold to camera manufacturers located outside the United States, primarily in Asia. Sales to customers in Asia accounted for approximately 79%, 73% and 91% ofintellectual property rights could impair our total revenue in fiscal years 2018, 2017 and 2016, respectively. Certain prior year revenue amounts have been reclassified by geographic region to conform to the fiscal year 2018 presentation. These reclassifications did not impact total revenues in each fiscal year. Because most of our end customers or their ODM manufacturers are located in Asia, we anticipate that a majority of our future revenue will continue to come from sales to that region. Although a large percentage of our sales are made to customers in Asia, we believe that a significant number of the products designed by these customers and incorporating our SoCs are then sold to consumers globally. In addition, if in the future we sell products or purchase inventory in currencies other than the U.S. dollar, our exposure to foreign currency risk could become more significant.
A significant number of our employees are located in Asia, principally Taiwan and China. Therefore, a portion of our payroll as well as certain other operating expenses are paid in currencies other than the U.S. dollar, such as the New Taiwan Dollar and the Chinese Yuan Renminbi. Our operating results are denominated in U.S. dollars and the difference in exchange rates in one period compared to another may directly impact period-to-period comparisons of our operating results. Furthermore, currency exchange rates, particularly the exchange rates between the Chinese Yuan Renminbi and the U.S. dollar and between the New Taiwan Dollar and the U.S. dollar, have been especially volatile in the recent past and these currency fluctuations may make it difficult for us to predict our operating results.
We have not implemented any hedging strategies to mitigate risks related to the impact of fluctuations in currency exchange rates. Even if we were to implement hedging strategies, not every exposure can be hedged and, where hedges are put in place based on expected foreign exchange exposure, they are based on forecasts which may vary or which may later prove to have been inaccurate. Failure to hedge successfully or anticipate currency risks accurately could adversely affect our operating results.
We may make acquisitions in the future that could disrupt our business, cause dilution to our shareholders, reduce our financial resources and harm our business.
In the future, we may acquire other businesses, products or technologies. Other than our acquisition of VisLab S.r.l., or VisLab, in June 2015, we have not made any acquisitions to date and do not have any agreements or commitments for any specific acquisition at this time. Our ability to make and successfully integrate acquisitions is unproven. Our acquisition of VisLab and any future acquisitions may not strengthen our competitive position and may be viewed negatively by our customers, financial marketscompete effectively or investors, and we may not achieve our goals in a timely manner, or at all. In addition, any acquisitions we make could lead to difficulties in integrating personnel, technologies and operationsdefend ourselves from the acquired businesses and in retaining and motivating key personnel from these businesses. Acquisitions may disrupt our ongoing operations, divert management from their primary responsibilities, subject us to additional liabilities, increase our expenses and adversely impact our business, operating results, financial condition and cash flows. Acquisitions may also reduce our cash available for operations and other uses, and could also result in an increase in amortization expense related to identifiable assets acquired, potentially dilutive issuances of equity securities or the incurrence of debt, any oflitigation, which could harm our business.business, financial condition and results of operations.
Our success depends, in part, on our ability to protect our intellectual property. We cannot predictrely primarily on patent, copyright, trademark and trade secret laws, as well as confidentiality and non-disclosure agreements and other contractual protections, to protect our future capital needs,proprietary technologies and know-how, all of which offer only limited protection. The steps we have taken to protect our intellectual property rights may not be adequate to prevent misappropriation of our proprietary information or infringement of our intellectual property rights, and our ability to prevent such misappropriation or infringement is uncertain, particularly in countries outside of the United States. The failure of our patents to adequately protect our technology might make it easier for our competitors to offer similar products or technologies, which would harm our business. For example, our patents and patent applications could be opposed, contested, circumvented, designed around by our competitors or be declared invalid or unenforceable in judicial or administrative proceedings. Our foreign patent protection is generally not as comprehensive as our U.S. patent protection and may not protect our intellectual property in some countries where our products are sold or may be sold in the future. Many U.S.-based companies have encountered substantial intellectual property infringement in foreign countries, including countries where we sell products. Even if foreign patents are granted, effective enforcement in foreign countries may not be available. For example, the legal environment relating to intellectual property protection in certain emerging market countries where we operate is relatively weaker, often making it difficult to create and enforce such rights. We may not be able to obtain additional financingeffectively protect our intellectual property rights in these emerging markets or elsewhere. If such an impermissible use of our intellectual property or trade secrets were to fundoccur, our operations.ability to sell our solutions at competitive prices may be adversely affected and our business, financial condition, operating results and cash flows could be materially and adversely affected.
We may in the future need to raise additional fundsinitiate infringement claims or litigation in order to try to protect our intellectual property rights. Litigation, whether we are a plaintiff or a defendant, can be expensive, time-consuming and may divert the efforts of our technical staff and management, which could harm our business, whether or not such litigation results in a determination favorable to us. Litigation also puts our patents at risk of being invalidated or interpreted narrowly and our patent applications at risk of not being issued. Additionally, any enforcement of our patents or other intellectual property may provoke third parties to assert counterclaims against us. If we are unable to protect our proprietary rights or if third parties independently develop or gain access to our or similar technologies, our business, revenue, reputation and competitive position could be harmed.
Third parties’ assertions of infringement of their intellectual property rights could result in our having to incur significant costs and cause our operating results to suffer.
The semiconductor industry is characterized by vigorous protection and pursuit of intellectual property rights and positions, which has resulted in protracted and expensive litigation for many companies. We and certain of our customers have received, and in the future.future may receive, communications from others alleging our infringement of their patents, trade secrets or other intellectual property rights. In addition, we and certain of our end customers have been the subject of lawsuits alleging infringement of intellectual property rights by our solutions or products incorporating our solutions, including the assertion that the alleged infringement may be attributable, at least in part, to our technology. Such lawsuits could subject us to significant liability for damages and invalidate our proprietary rights, though this has not occurred to date. Any required additional financingpotential intellectual property litigation also could force us to do one or more of the following:
Any significant impairment of our intellectual property rights from any litigation we face could harm our business and our ability to compete.
44
Any potential dispute involving our patents or other intellectual property could affect our customers, which could trigger our indemnification obligations to them and result in substantial expense to us.
In any potential dispute involving our patents or other intellectual property, our customers could also become the target of litigation. Certain of our customers have received notices from third parties claiming to have patent rights in certain technology and inviting our customers to license this technology, and certain of our end customers have been the subject of lawsuits alleging infringement of patents by products incorporating our solutions, including the assertion that the alleged infringement may be attributable, at least in part, to our technology. Because we generally indemnify our customers for intellectual property claims made against them for products incorporating our technology, any litigation could trigger technical support and indemnification obligations under some of our license agreements, which could result in substantial expense to us. Because some of our ODMs and OEMs are larger than we are and have greater resources than we do, they may be more likely to be the target of an infringement claim by third parties than we would be, which could increase our chances of becoming involved in a future lawsuit. If any such claims were to succeed, we might be forced to pay damages on behalf of our ODMs or OEMs that could increase our expenses, disrupt our ability to sell our solutions and reduce our revenue. In addition to the time and expense required for us to supply support or indemnification to our customers, any such litigation could severely disrupt or shut down the business of our customers, which in turn could hurt our relations with our customers and cause the sale of our products to decrease.
The use of open source software in our products, processes and technology may expose us to additional risks and compromise our proprietary intellectual property.
Our products, processes and technology sometimes utilize and incorporate software that is subject to an open source license. Open source software is typically freely accessible, usable and modifiable. Certain open source software licenses, such as the GNU General Public License, require a user who intends to distribute the open source software as a component of the user’s software to disclose publicly part or all of the source code to the user’s software. In addition, certain open source software licenses require the user of such software to make any derivative works of the open source code available to others on terms unfavorable to us or at all. Ifno cost. This can subject previously proprietary software to open source license terms.
While we raise additional funds by issuing equity securities or convertible debt, investors may experience significant dilutionmonitor the use of their ownership interest,open source software in our products, processes and the newly-issued securities may have rights seniortechnology and try to those of the holders of our ordinary shares. If we raise additional funds by obtaining loans from third parties, the terms of those financing arrangements may include negative covenants or other restrictions on our businessensure that could impair our operational flexibility and would alsono open source software is used in such a way as to require us to incur interest expense. If additional financing isdisclose the source code to the related product, processes or technology when we do not available whenwish to do so, such use could inadvertently occur. Additionally, if a third-party software provider has incorporated certain types of open source software into software we license from such third-party for our products, processes or technology, we could, under certain circumstances, be required to disclose the source code to our products, processes or is not available on acceptable terms, we may have to scale backtechnology. This could harm our operations or limit our production activities,intellectual property position and we may not be able to expand our business, develop or enhance our products, take advantageresults of business opportunities or respond to competitive pressures which could result in lower revenueoperations and reduce the competitiveness of our products.financial condition.
Our marketable securities portfolio could experience a decline in market value, which could materially and adversely affect our financial results.
As of January 31, 2018, we had approximately $101.7 million in securities investments. The investments consisted primarily of money market funds, commercial paper, asset-backed securities, U.S. government securities and debt securities of corporations which are focused on the preservation of our capital. We currently do not use derivative financial instruments to adjust our investment portfolio risk or income profile.
These investments, as well as any cash deposited in bank accounts, are subject to general credit, liquidity, market and interest rate risks, which may be exacerbated by unusual events, such as the Eurozone crisis and the U.S. debt ceiling crisis, which affected various sectors of the financial markets and led to global credit and liquidity issues. If the global credit market continues to experience volatility or deteriorates, our investment portfolio may be impacted and some or all of our investments may experience other-than-temporary impairment which could adversely impact our financial results and position.
Risks Related to Ownership of Our Ordinary Shares
The market price of our ordinary shares may be volatile, which could cause the value of your investment to decline.
Since our initial public offering in October 2012, the
The market price of our ordinary shares has historically been highly volatile.volatile, and has been particularly volatile in recent years. For example, since February 1, 2020, the trading price of our common stock ranged from a low of $36.02 to a high of $227.59 and was $52.56 at the close of trading on January 31, 2024. The trading price of our ordinary shares is likely to remain volatile and could be subject to wide fluctuations in price in response to various factors, some of which are beyond our control. These factors include:
changes in financial estimates, including our ability to meet our future revenue and operating profit or loss projections;
fluctuations in our operating results or those of other semiconductor or comparable companies;
fluctuations in the economic performance or market valuations of companies perceived by investors to be comparable to us;
economic developments in the semiconductor industry as a whole;
general economic conditions, including conditions related to the banking industry or caused by pandemics and high inflation, and slow or negative growth of related markets;
trade and other geopolitical activities affecting markets we address;
45
changes in the demand for our customers’ products;
commencement of or our involvement in litigation;
disruption to our operations;
any major change in our board of directors or management;
political or social conditions in the markets where we sell our products;
changes in governmental regulations; and
changes in earnings estimates or recommendations by securities analysts.
In addition, the stock market in general, and the market for semiconductor and other technology companies in particular, have experienced extreme price and volume fluctuations that have often been unrelated or disproportionate to the operating performance of those companies. These broad market and industry factors may cause the market price of our ordinary shares to decrease, regardless of our actual operating performance. These trading price fluctuations may also make it more difficult for us to use our ordinary shares as a means to make acquisitions or to use options to purchase our ordinary shares to attract and retain employees. If the market price of our ordinary shares declines, you may not realize any return on your investment in us and may lose some or all of your investment. In addition, in the past, following periods of volatility in the overall market and the market price of a company’s securities, securities class action litigation has often been instituted against these companies. This litigation, if instituted against us, could result in substantial costs and a diversion of our management’s attention and resources.
If securities analysts or industry analysts downgrade our ordinary shares, publish negative research or reports or fail to publish reports about our business, our stock price and trading volume could decline.
The trading market for our ordinary shares will be influenced by the research and reports that industry or securities analysts publish about us, our business and our market. If one or more analysts adversely changes their recommendation regarding our stock or our competitors’ stock, our stock price would likely decline. If one or more analysts cease coverage of us or fail to regularly publish reports on us, we could lose visibility in the financial markets which in turn could cause our stock price or trading volume to decline.
Our actual operating results may differ significantly fromnot meet or exceed our guidance and investor expectations, which would likely cause our stock price to decline.
From time to time, we may release guidance in our earnings releases, earnings conference calls or otherwise, regarding our future performance that represent our management’s estimates as of the date of release. If given, this guidance, which will include forward-looking statements, will be based on projections prepared by our management. Projections are based upon a number of assumptions and estimates that, while presented with numerical specificity, are inherently subject to significant business, economic and competitive uncertainties and contingencies, many of which are beyond our control. The principal reason that we expect to release guidance is to provide a basis for our management to discuss our business outlook with analysts and investors. With or without our guidance, analysts and other investors may publish expectations regarding our business, financial performance and results of operations. We do not accept any responsibility for any projections or reports published by any such third persons.
Guidance is necessarily speculative in nature, and it can be expected that some or all of the assumptions of the guidance furnished by us will not materialize or will vary significantly from actual results. If our actual performance does not meet or exceed our guidance or investor expectations, the trading price of our ordinary shares is likely to decline. Similarly, if our guidance does not meet or exceed expectations of investors or securities analysts, the trading price of our ordinary shares is likely to decline.
The price of our ordinary shares could decrease as a result of shares being sold in the market.
Sales of a substantial number of our ordinary shares in the public market, or the perception that these sales might occur, could cause the market price of our ordinary shares to decline. Certain holders of ourIn the past, we have issued stock options to employees and we regularly issue restricted stock units (RSUs) to employees, which settle as ordinary shares are entitled to rights with respect to registration of such shares under the Securities Act of 1933, as amended, or the Securities Act, pursuant to a registration rights agreement between such holders and us. If such holders, by exercising their registration rights, sell a large number of shares, the market price for our ordinary shares could be adversely affected. If we file a registration statement for the purpose of selling additional shares to raise capital and are required to include shares held by these holders pursuant to the exercise of their registration rights, our ability to raise capital may be impaired.
We filed registration statements on Form S-8 under the Securities Act to register shares for issuance under our 2004 Stock Plan, 2012 Equity Incentive Plan and the Amended and Restated 2012 Employee Stock Purchase Plan. Our 2012 Equity Incentive Plan and the Amended and Restated 2012 Employee Stock Purchase Plan provide for automatic increases in the shares reserved for issuance under these plans which could result in additional dilution to our shareholders.upon vesting. These shares can be freely sold in the public market upon issuance and vesting, subject to restrictions provided under the terms of the applicable plan and/or the option agreements entered into with option holders.
We may also issue ordinary shares or securities convertible into ordinary shares from time to time in connection with a financing, acquisition or otherwise. Any such issuance could result in substantial dilution to our existing shareholders and cause the trading price of our stock to decline.
We do not intend to pay dividends on our ordinary shares and, consequently, a shareholder’s ability to achieve a return on its investment will depend on appreciation in the price of our ordinary shares.
We have never declared or paid any cash dividends on our ordinary shares and do not currently intend to do so for the foreseeable future. We currently intend to invest our future earnings, if any, to fund our growth. Therefore, shareholders are not likely to receive any dividends on their ordinary shares for the foreseeable future and the success of an investment in our ordinary shares will depend upon any future appreciation in their value. There is no guarantee that our ordinary shares will appreciate in value or even maintain the price at which our shareholders have purchased their shares. Investors seeking cash dividends should not purchase our ordinary shares.
46
Provisions of our memorandum and articles of association and Cayman Islands corporate law may discourage or prevent an acquisition of us which could adversely affect the value of our ordinary shares.
Provisions of our memorandum and articles of association and Cayman Islands law may have the effect of delaying or preventing a change of control or changes in our management. These provisions include the following:
the division of our board of directors into three classes;
the right of our board of directors to elect a director to fill a vacancy created by the expansion of our board of directors or due to the resignation or departure of an existing board member;
prohibition of cumulative voting in the election of directors which would otherwise allow less than a majority of shareholders to elect director candidates;
the requirement for the advance notice of nominations for election to our board of directors or for proposing matters that can be acted upon at a shareholders’ meeting;
the ability of our board of directors to issue, without shareholder approval, such amounts of preference shares as the board of directors deems necessary and appropriate with terms set by our board of directors, which rights could be senior to those of our ordinary shares;
the elimination of the rights of shareholders to call a special meeting of shareholders and to take action by written consent in lieu of a meeting; and
the required approval of a special resolution of the shareholders, being a two-thirds vote of shares held by shareholders present and voting at a shareholder meeting, to alter or amend the provisions of our post-offering memorandum and articles of association.
Holders of our ordinary shares may face difficulties in protecting their interests because we are incorporated under Cayman Islands law.
Our corporate affairs are governed by our amended and restated memorandum and articles of association, by the Companies Law (as the same may be supplemented or amended from time to time) of the Cayman Islands and by the common law of the Cayman Islands. The rights of our shareholders and the fiduciary responsibilities of our directors under Cayman Islands law are not as clearly established as under statutes or judicial precedent in existence in jurisdictions in the United States. In particular, the Cayman Islands has a less developed body of securities laws than the United States and provides significantly less protection to investors. There is no legislation specifically dedicated to the rights of investors in securities and thus no statutorily defined private cause of action specific to investors such as those provided under the Securities Act or the Securities Exchange Act of 1934, as amended. In addition, shareholders of Cayman Islands companies may not have standing to initiate shareholder derivative actions in U.S. federal courts. Therefore, you may have more difficulty in protecting your interests in the face of actions by our management, directors or controlling shareholders than would shareholders of a corporation incorporated in a jurisdiction in the United States due to the comparatively less developed nature of Cayman Islands law in this area.
Shareholders of Cayman Islands exempted companies, such as our company, have no general rights under Cayman Islands law to inspect corporate records and accounts or to obtain copies of lists of shareholders of the company. Our directors have discretion under our articles of association to determine whether or not, and under what conditions, our corporate records may be inspected by our shareholders, but are not obliged to make them available to our shareholders. This may make it more difficult for you to obtain the information needed to establish any facts necessary for a shareholder motion or to solicit proxies from other shareholders in connection with a proxy contest.
Subject to limited exceptions, under Cayman Islands law, a minority shareholder may not bring a derivative action against the board of directors.
47
Holders of our ordinary shares may have difficulty obtaining or enforcing a judgment against us because we are incorporated under the laws of the Cayman Islands.
It may be difficult or impossible for you to bring an action against us in the Cayman Islands if you believe your rights have been infringed under U.S. securities laws. There is no statutory recognition in the Cayman Islands of judgments obtained in the United States, although the courts of the Cayman Islands will in certain circumstances recognize and enforce a non-penal judgment of a foreign court of competent jurisdiction without retrial on the merits. While there is no binding authority on this point, this is likely to include, in certain circumstances, a non-penal judgment of a United States court imposing a monetary award based on the civil liability provisions of the U.S. federal securities laws. The Grand Court of the Cayman Islands may stay proceedings if concurrent proceedings are being brought elsewhere. There is uncertainty as to whether the Grand Court of the Cayman Islands would recognize or enforce judgments of United States courts obtained against us predicated upon the civil liability provisions of the securities laws of the United States or any state thereof and whether the Grand Court of the Cayman Islands would hear original actions brought in the Cayman Islands against us predicated upon the securities laws of the United States or any state thereof.
General Risk Factors
If our operations are interrupted, our business and reputation could suffer.
Our operations and those of our manufacturers are vulnerable to interruption caused by technical breakdowns, computer hardware and software malfunctions, software viruses, infrastructure failures, pandemics, and regional health issues, earthquakes, fires, severe storms, floods and other negative impacts from climate change, power losses, telecommunications failures, terrorist attacks, wars, Internet failures and other events beyond our control. Our operations could also be disrupted by geopolitical conditions, particularly in Taiwan or China, where the majority of our employees are located. Any disruption in our services or operations could result in a reduction in revenue, delay product development and R&D, or result in a claim for substantial damages against us, regardless of whether we are responsible for that failure. If remote or work from home conditions were to continue for an extended period of time, we may experience delays in product development, a decreased ability to support our customers, reduced design win activity, and overall lack of productivity. We rely on our computer equipment, database storage facilities and other office equipment, which are located primarily in the seismically active San Francisco Bay Area and Taiwan. If we suffer a significant database or network facility outage, our business could experience disruption until we fully implement our back-up systems.
If securities analysts or industry analysts downgrade our ordinary shares, publish negative research or reports or fail to publish reports about our business, our stock price and trading volume could decline.
The trading market for our ordinary shares will be influenced by the research and reports that industry or securities analysts publish about us, our business and our market. If one or more analysts adversely changes their recommendation regarding our stock or our competitors’ stock, our stock price would likely decline. If one or more analysts cease coverage of us or fail to regularly publish reports on us, we could lose visibility in the financial markets which in turn could cause our stock price or trading volume to decline.
ITEM 1B. UNRESOLVED STAFF COMMENTS
None.
ITEM 1C. CYBERSECURITY
Risk Management and Strategy
We have established policies and processes for assessing, identifying, and managing material risks from cybersecurity threats. We have designed and implemented an Incident Response Plan for cybersecurity and related processes that are overseen by our IT and management team. Our information security management system is ISO 27001 certified. In addition, our cybersecurity program leverages industry frameworks, including certain of those established by the National Institute of Standards and Technology (NIST).
None.We regularly assess material risks from cybersecurity threats, including any potential unauthorized occurrence on or conducted through our information systems that may result in adverse effects on the confidentiality, integrity, or availability of our information systems or any information residing therein. We conduct periodic risk assessments to identify cybersecurity threats, as well as assessments in the event of a material change in our business practices that may affect our information systems that are vulnerable to such cybersecurity threats. These risk assessments include identification of reasonably foreseeable internal and external risks, the likelihood and potential damage that could result from such risks, and the sufficiency of existing procedures, systems, and safeguards in place to manage such risks. Our cybersecurity risk management program is integrated into our overall risk management scheme by seeking to identify and mitigate those cybersecurity threats that are more likely to lead to a material impact on our business.
Our cybersecurity risk management program also seeks to manage cybersecurity risks associated with our use of third-party service providers through risk assessments and contractual obligations on such service providers.
Our IT management team, with oversight from our Board of Directors and Nominating and Corporate Governance Committee as well as members of our management team, including our Chief Operating Officer, Chief Financial Officer and General Counsel, are primarily responsible for assessing and managing our material risks from cybersecurity threats.
We also engage consultants or other third parties in connection with our risk assessment processes. These service providers assist us in designing and implementing our cybersecurity policies and procedures, as well as in monitoring and testing our safeguards.
Governance
Our Board considers cybersecurity risk as part of its overall risk oversight function and has delegated to the Nominating and Corporate Governance Committee oversight of cybersecurity matters and other policies and internal controls regarding information security risks. The Nominating and Corporate Governance Committee oversees management’s implementation of our cybersecurity risk management program.
The Board of Directors and the Nominating and Corporate Governance Committee receive presentations and reports on cybersecurity, which address a range of topics including recent developments, evolving standards, the threat environment, cybersecurity systems testing and vulnerability assessments, and the Company’s practices and policies to manage risks. Management reports to the Nominating and Corporate Governance Committee on cybersecurity matters and materials risks, if any, from cybersecurity threats. Our Nominating and Corporate Governance Committee provides updates to the Board of Directors on such reports. The Nominating and Corporate Governance Committee also receives notice of any significant cybersecurity incidents, as well as ongoing updates regarding any such incident until it has been addressed.
Our management team, including our IT management team, are responsible for day-to-day implementation, assessment, and management of our cybersecurity risk assessment and management processes. The IT management team has primary responsibility for our overall cybersecurity risk management program, including monitoring the prevention, detection, mitigation, and remediation of cybersecurity incidents, and works in partnership with our other business leaders, including our Chief Operating Officer, Chief Financial Officer and General Counsel. Our IT management team supervises both our internal cybersecurity personnel and any retained external cybersecurity consultants. Our Senior Director of IT has served in various roles in information technology and information security for over 25 years.
Our cybersecurity incident response plan is designed to escalate certain cybersecurity incidents to a team of business leaders, including, but not limited to, our Chief Operating Officer, Chief Financial Officer and General Counsel. This team of business leaders works with our incident response team to help determine the severity of the impact of a cybersecurity incident, as well as to help mitigate and remediate cybersecurity incidents of which they are notified.
As part of our overall risk management system, we provide periodic mandatory training for personnel regarding cybersecurity threats as a means to equip our employees with information and tools to address cybersecurity threats, and to communicate our information security policies, processes and practices. We also perform periodic email phishing tests to evaluate and maintain cybersecurity awareness among our employees.
As of the date of this Annual Report on Form 10-K, we are not aware of any risks from cybersecurity threats, including as a result of any previous cybersecurity incidents, that have materially affected the Company, its business strategy, results of operations or financial condition. As cybersecurity threats become more sophisticated, it is reasonably likely that we will be required to expend greater resources to continue to modify and enhance our protective measures. For additional information concerning risks related to cybersecurity, see Item 1A of this report, “Risk Factors – Risks Related to Our Business and Our Industry – A breach of our security systems may have a material adverse effect on our business.”
ITEM 2. PROPERTIES
Our principal executive officescorporate headquarters are located in Santa Clara, California, consisting of approximately 49,000 square feet of office space under a lease that expires in May 2020. This facility accommodatesCalifornia. These facilities accommodate our principal sales, marketing, research and development, finance, and administration activities. WeOutside of Santa Clara, California, we lease approximately 89,000 square feet of office spacessome facilities in Hsinchu, Taiwan under lease agreementsother U.S. locations that expire in December 2018, May 2020 and January 2028, respectively. The Taiwan facilities accommodateare used for research and development and marketing activities. Outside of the United States, we also lease facilities in various international locations that are used for research and development, sales, business development, operations and administrationadministrative support. WeOur lease approximately 35,000 square feetobligations primarily consist of office space in Shanghai and Shenzhen, China, underoperating leases that expire in November 2019 and September 2018, respectively,with lease periods expiring between fiscal years 2025 to support research and business development. We lease approximately 12,100 square feet of facilities in Italy for research and development. We lease additional facilities in Hong Kong for sales and inventory warehousing and in Japan and South Korea for our local business development personnel.2028.
We believe that our existing facilities are well maintained and in good operating condition, and are sufficient for our needs for the foreseeable future. The following table lists our major locations and primary usage as of January 31, 2018:2024:
Approximate | |||||||
Square | |||||||
Major Locations | Footage | Usage | |||||
United States: | |||||||
Santa Clara, California |
| Corporate Headquarters; Sales; Marketing; Research and Development; Finance;
| |||||
| 2,700 | Business Development | |||||
|
| Research and Development | |||||
Asia Pacific: | |||||||
Hsinchu, Taiwan | 86,700 | Research and Development; Business Development; Operations; Administration | |||||
Shanghai, China |
| Research and Development; Business Development | |||||
Shenzhen, China |
| Research and Development; Business Development | |||||
Kowloon, Hong Kong | 9,000 | Sales; Warehousing | |||||
Shin-Yokohama, Japan | 1,300 | Business Development | |||||
SeongNam, South Korea | 1,500 | Business Development | |||||
Europe: | |||||||
Parma, Italy | 12,100 | Research and Development | |||||
ITEM 3. LEGAL PROCEEDINGS
We are not engaged in any material legal proceedings at this time. However, from time to time, we may be subject to commercial disputes, employment issues, intellectual property claims and litigation, in the ordinary course of our business. Refer to Note 15, Commitments and Contingencies within Notes to Consolidated Financial Statements for further information.
ITEM 4. MINE SAFETY DISCLOSURES
Not applicable.
50
PART II
ITEM 5. MARKET FOR REGISTRANT’S COMMON EQUITY, RELATED STOCKHOLDER MATTERS AND ISSUER PURCHASES OF EQUITY SECURITIES
|
|
Price Range of Ordinary SharesMarket Information
Our ordinary shares have beenare traded on the NASDAQ Global Select Market under the symbol “AMBA” since October 10, 2012. Prior to that date, there was no public trading market for our ordinary shares. The following table sets forth, for the periods indicated, the high and low sales prices per ordinary share as reported by the NASDAQ Global Market:
|
| Price Range |
| |||||
|
| High |
|
| Low |
| ||
Year Ended January 31, 2018: |
|
|
|
|
|
|
|
|
Fourth Quarter |
| $ | 66.23 |
|
| $ | 46.75 |
|
Third Quarter |
| $ | 56.61 |
|
| $ | 40.06 |
|
Second Quarter |
| $ | 65.39 |
|
| $ | 47.34 |
|
First Quarter |
| $ | 60.68 |
|
| $ | 49.18 |
|
Year Ended January 31, 2017: |
|
|
|
|
|
|
|
|
Fourth Quarter |
| $ | 65.78 |
|
| $ | 46.80 |
|
Third Quarter |
| $ | 74.95 |
|
| $ | 55.75 |
|
Second Quarter |
| $ | 59.87 |
|
| $ | 35.26 |
|
First Quarter |
| $ | 47.44 |
|
| $ | 33.39 |
|
. On March 16, 2018,22, 2024, there were 3426 shareholders of record holding our ordinary shares. We cannot estimate the number of beneficial owners since many brokers and other institutions hold our shares on behalf of shareholders. On March 16, 2018, the last reported sale price of our stock was $54.24 per ordinary share as reported by the NASDAQ Global Market.
We have never declared or paid any cash dividends on our ordinary shares and do not currently intend to do so in the foreseeable future.
Share Performance Graph
This performance graph shall not be deemed to be “soliciting material” or “filed” or incorporated by reference in future filings with the Securities and Exchange Commission, or subject to the liabilities of Section 18 of the Securities Exchange Act of 1934, as amended, or the Exchange Act, except as shall be expressly set forth by specific reference in such filing.
The following graph shows a comparison from February 1, 20132019 through January 31, 20182024 of the cumulative total return for our ordinary shares, the NASDAQ Composite Index and the Philadelphia Semiconductor Index. The comparisons in the graph are historical and are not intended to forecast or be indicative of possible future performance of our ordinary shares.
Comparison of 5 year Cumulative Total Return
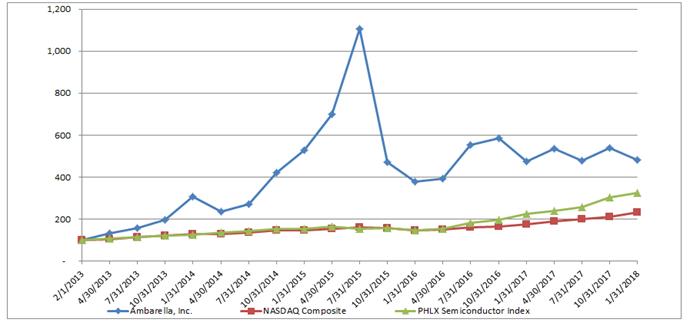
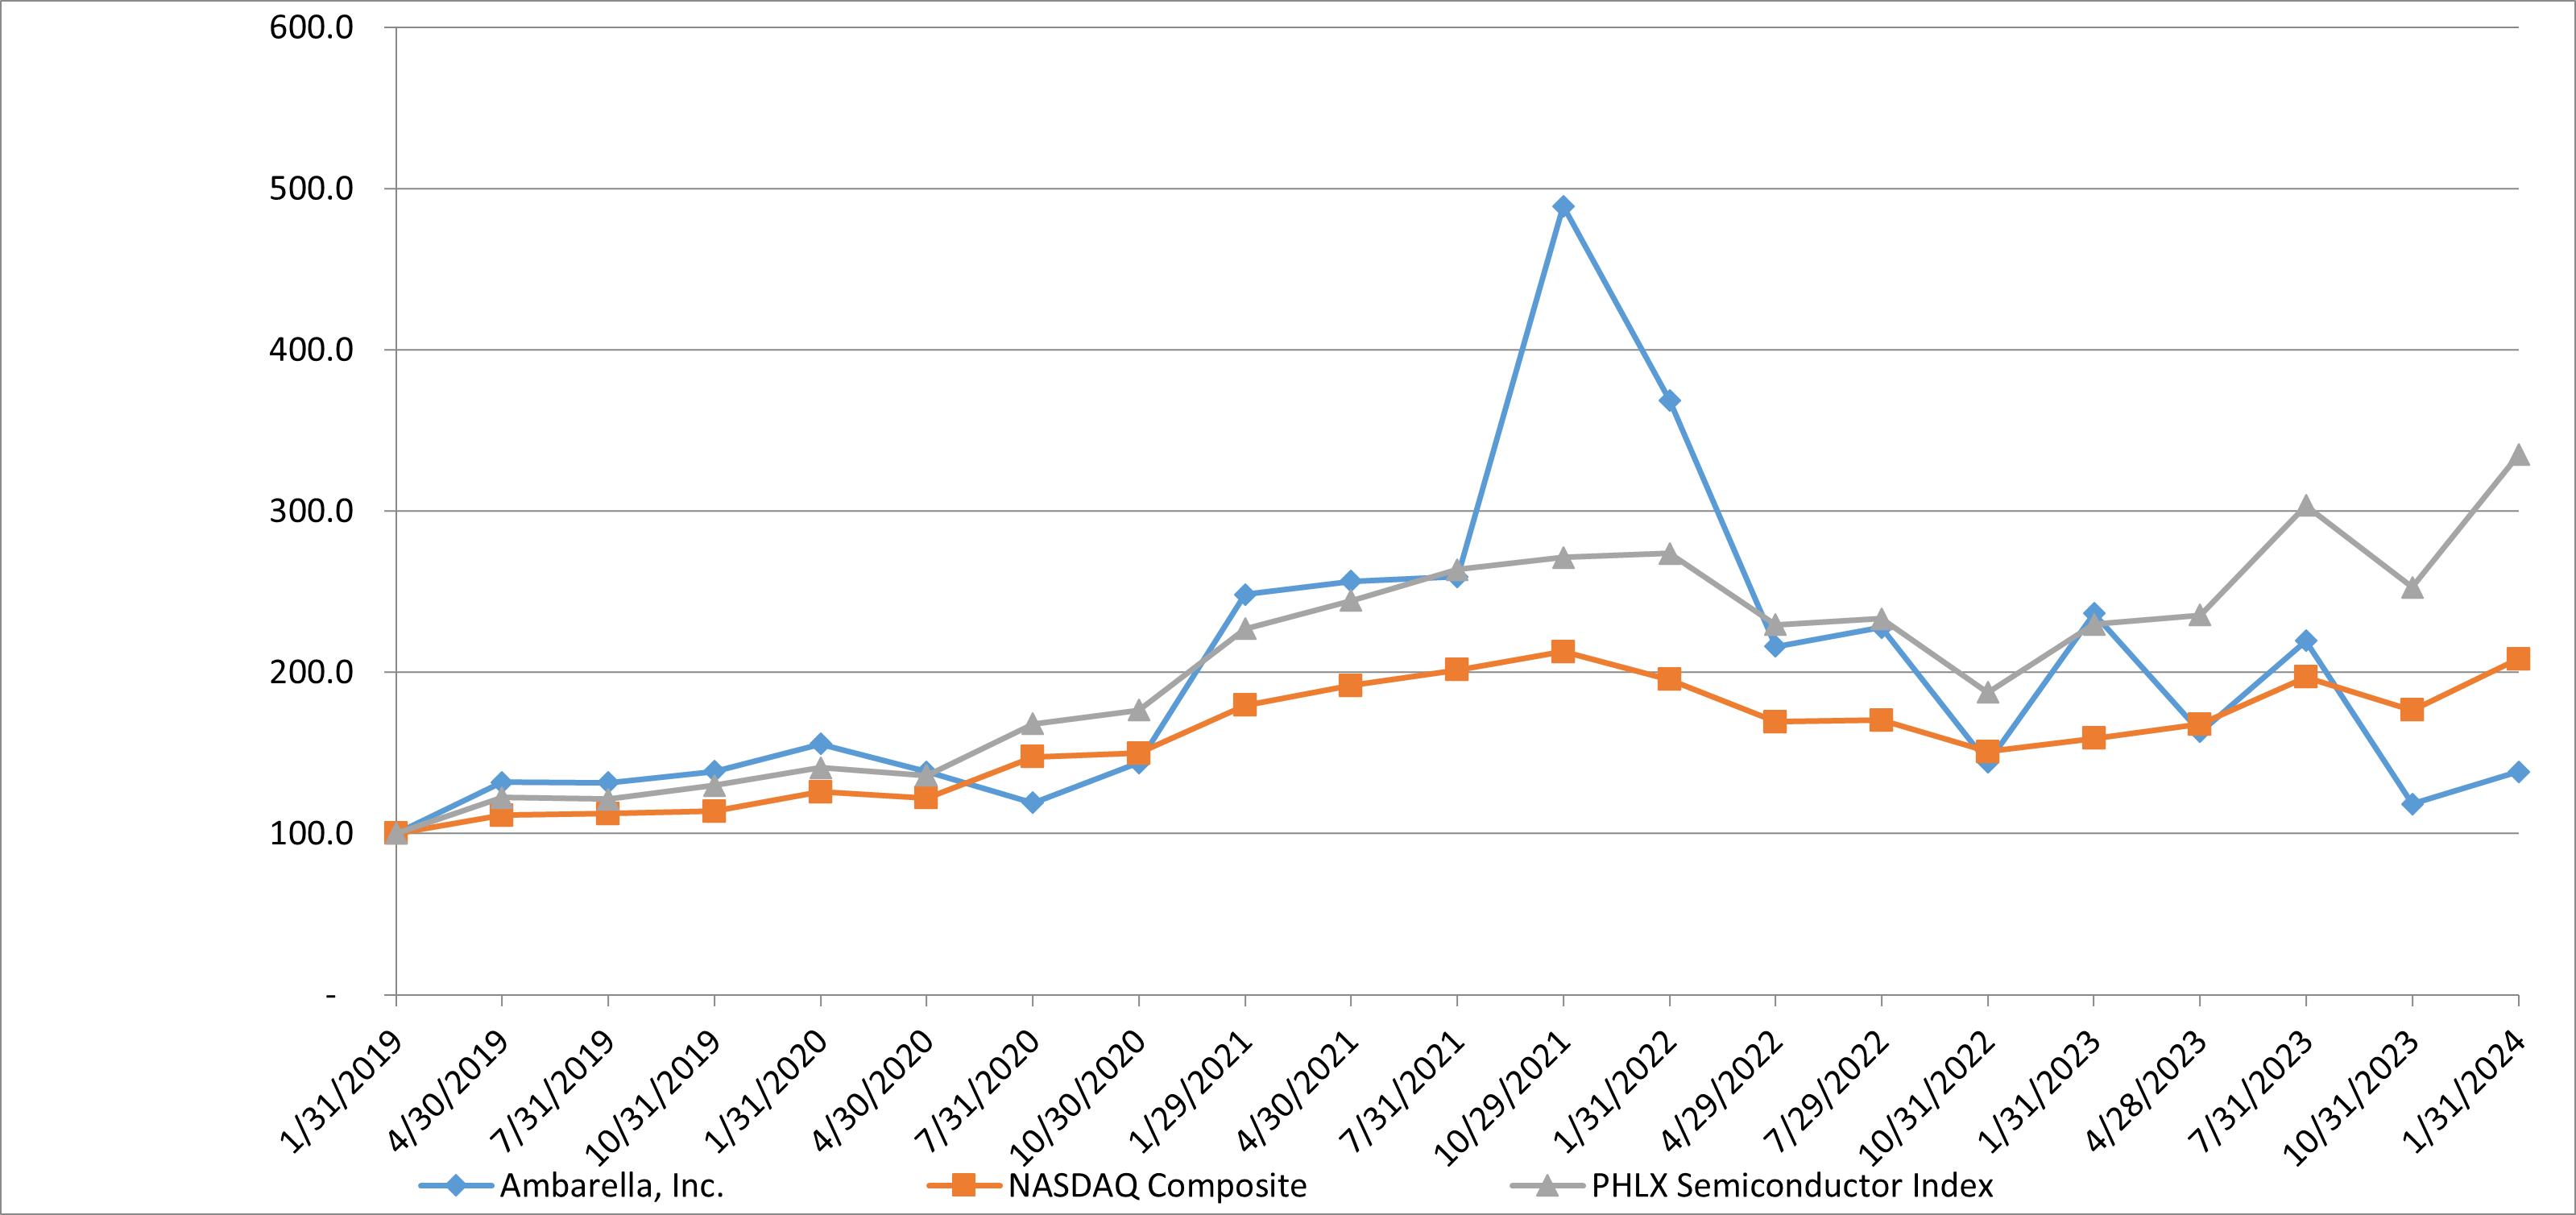
Dividends
We have never declared or paid any cash dividends on our ordinary shares and do not currently intend to do so in the foreseeable future.
Securities Authorized for Issuance under Equity Compensation Plans
For information about our equity compensation plans, see Note 12, “Employee Benefits and Stock-based Compensation” of the Notes to Consolidated Financial Statements included in this report.
51
Purchases of Equity Securities by the Issuer
There were no shares repurchased in fiscal years 2024, 2023 and 2022. On May 26, 2023, our Board of Directors approved an extension of the existing share repurchase program for an additional twelve months through June 30, 2024. As of January 31, 2024, there was approximately $49.0 million available for repurchases through June 30, 2024. Repurchases under the program may be made from time-to-time through open market purchases, 10b5-1 plans or privately negotiated transactions subject to market conditions, applicable legal requirements and other relevant factors. The repurchase program does not obligate us to acquire any particular amount of ordinary shares, and it may be suspended at any time at the company's discretion. Repurchases are funded using working capital and any repurchased shares will be recorded as authorized but unissued shares.
Recent Sales of Unregistered Securities
None.
52
ITEM 6. [RESERVED]
The following table displays information with respect to repurchases of the Company’s ordinary shares during the three months ended January 31, 2018:
|
|
|
|
|
|
|
|
|
|
|
|
|
| Approximate |
| |
|
|
|
|
|
|
|
|
|
| Total Number |
|
| Dollar Value Of |
| ||
|
|
|
|
|
|
|
|
|
| Of Shares |
|
| Shares That May |
| ||
|
|
|
|
|
|
|
|
|
| Purchased As |
|
| Yet Be Purchased |
| ||
|
|
|
|
|
|
|
|
|
| Part of Publicly |
|
| Under The Plans |
| ||
|
| Total Number |
|
| Average Price |
|
| Announced |
|
| Or Programs |
| ||||
|
| Of Shares |
|
| Paid Per Share |
|
| Plans Or |
|
| (in millions) |
| ||||
Period |
| Purchased (i) |
|
| (ii) |
|
| Programs (i) |
|
| (i) |
| ||||
November 1, 2017 to November 30, 2017 |
|
| — |
|
| $ — |
|
|
| — |
|
|
|
|
| |
December 1, 2017 to December 31, 2017 |
|
| — |
|
|
| — |
|
|
| — |
|
|
|
|
|
January 1, 2018 to January 31, 2018 |
|
| 66,747 |
|
|
| 49.18 |
|
|
| 66,747 |
|
|
|
|
|
Total |
|
| 66,747 |
|
| $ | 49.18 |
|
|
| 66,747 |
|
| $ | 31.7 |
|
53
|
|
|
|
ITEM 7. MANAGEMENT’S DISCUSSION AND ANALYSIS OF FINANCIAL CONDITION AND RESULTS OF OPERATIONS
The following table sets forth selected financial data as of and for the last five fiscal years, and should be read in conjunction with Item 7, “Management’s Discussion and Analysis of Financial Condition and Results of Operations,” and Item 8, “Financial Statements and Supplementary Data,” and other financial data included elsewhere in this report. Our historical results of operations are not necessarily indicative of results of operations to be expected for any future period.Overview
Selected Consolidated Statements of Operations Data:
|
| Year Ended January 31, |
| |||||||||||||||||
|
| 2018 |
|
| 2017 |
|
| 2016 |
|
| 2015 |
|
| 2014 |
| |||||
|
| (in thousands, except per share data) |
| |||||||||||||||||
Revenue |
| $ | 295,402 |
|
| $ | 310,297 |
|
| $ | 316,373 |
|
| $ | 218,278 |
|
| $ | 157,608 |
|
Income from operations |
| $ | 24,431 |
|
| $ | 60,363 |
|
| $ | 84,679 |
|
| $ | 51,861 |
|
| $ | 27,917 |
|
Net income |
| $ | 18,852 |
|
| $ | 57,810 |
|
| $ | 76,508 |
|
| $ | 50,571 |
|
| $ | 25,654 |
|
Net income per share attributable to ordinary shareholders: |
|
|
|
|
|
|
|
|
|
|
|
|
|
|
|
|
|
|
|
|
Basic |
| $ | 0.57 |
|
| $ | 1.77 |
|
| $ | 2.42 |
|
| $ | 1.70 |
|
| $ | 0.93 |
|
Diluted |
| $ | 0.55 |
|
| $ | 1.68 |
|
| $ | 2.27 |
|
| $ | 1.57 |
|
| $ | 0.85 |
|
Selected Consolidated Balance Sheet Data:
|
| As of January 31, |
| |||||||||||||||||
|
| 2018 |
|
| 2017 |
|
| 2016 |
|
| 2015 |
|
| 2014 |
| |||||
|
| (in thousands) |
| |||||||||||||||||
Cash, cash equivalents and marketable securities |
| $ | 434,591 |
|
| $ | 405,394 |
|
| $ | 307,893 |
|
| $ | 207,994 |
|
| $ | 143,394 |
|
Working capital |
|
| 440,047 |
|
|
| 414,139 |
|
|
| 320,828 |
|
|
| 229,889 |
|
|
| 151,834 |
|
Total assets |
|
| 546,649 |
|
|
| 512,271 |
|
|
| 410,615 |
|
|
| 284,284 |
|
|
| 183,307 |
|
Total liabilities |
|
| 64,462 |
|
|
| 57,637 |
|
|
| 61,159 |
|
|
| 47,073 |
|
|
| 26,946 |
|
Total shareholders' equity |
|
| 482,187 |
|
|
| 454,634 |
|
|
| 349,456 |
|
|
| 237,211 |
|
|
| 156,361 |
|
On June 25, 2015, we completed the acquisition of VisLab S.r.l., for $30.0 million in cash. Of this total purchase price, $4.1 million was attributed to intangible assets, $25.3 million was attributed to goodwill, and $0.6 million was attributed to net assets acquired. A deferred tax liability of $1.3 million related to the intangible assets was recorded to account for the difference between financial reporting and tax basis at the acquisition date, with an addition to goodwill.
In November 2015, the Financial Accounting Standards Board (“FASB”) issued Accounting Standards Update No. 2015-17, Balance Sheet Classification of Deferred Taxes. To simplify the presentation, the new guidance requires that all deferred tax assets and liabilities, along with any related valuation allowance, be classified as noncurrent on the balance sheet. We adopted this standard in the fourth quarter of fiscal year 2016 on a prospective basis. The adoption of this new guidance resulted in all deferred tax assets and liabilities being classified as noncurrent in the consolidated balance sheets as of January 31, 2016. The prior periods were not restated for this presentation standard.
Upon adoption of Accounting Standards Update No. 2015-05, Intangible - Goodwill and Other - Internal-Use Software (Subtopic 350-40), we account for a noncancelable on premise internal-use software license as the acquisition of an intangible asset and the incurrence of a liability to the extent that all or a portion of the software licensing fees are not paid on or before the license acquisition date. The intangible asset and related liability are recorded at net present value and interest expense is recorded over the payment term. As of January 31, 2018, there were $10.3 million of intangible assets, net of amortization expense, $4.3 million of current liabilities and $4.5 million of noncurrent liabilities related to these noncancelable internal-use software licenses recorded in the consolidated balance sheets.
Overview
We are a leading developer of semiconductorlow-power system-on-a-chip, or SoC, semiconductors providing powerful artificial intelligence, or AI, processing, solutionsadvanced image signal processing and high-resolution video compression. Since inception, we have primarily served human viewing applications with video and image processors for enterprise, public infrastructure and home applications, such as internet protocol, or IP, security cameras, sports cameras, wearables, aerial drones, and aftermarket automotive video recorders. Our recent development efforts have focused on creating advanced AI technology that enableenables edge devices to visually perceive the environment and make decisions based on the data collected from cameras and, most recently, other types of sensors. This category of AI technology is known as computer vision or edge inference AI, and our CV SoCs integrate our state-of-the-art video processor technology together with our deep learning neural network processing technology, which we refer to as CVflow™. The CVflow-architecture supports a variety of CV algorithms, including object detection, classification and tracking, semantic and instance segmentation, image processing, stereo object detection, and terrain mapping. CVflow can process other sensor modalities including lidar and radar, and allows customers to differentiate their products by porting their own, or third party, neural networks and/or classical CV algorithms to our CVflow-based SoCs. Our latest third generation CVflow technology enables us to address incremental and computationally intense AI applications for deep fusion, deep planning, and large language models (LLMs), as well as efficiently process transformer AI networks.
Our SoC designs fully integrate AI, computer vision functionality, high-definition, or HD, video capture, analysis, sharing, and display. A device that captures video includes four primary components: a lens, an image sensor, a video processor and storage memory. The video processor converts raw video input into a format that can be stored, analyzed and distributed efficiently and, in some cases, analyzes the video data to automate processes. We combine our processor design capabilities with our expertise in video, image processing and computer vision algorithms and software to provide a technology platform that is designed to be easily scalable across multiple applications and enable rapid and efficient product development. Our system-on-a-chip, or SoC, designs fully integrate HD video processing, image processing, and analysis, audio processing, and system functions onto a single chip, delivering exceptional video and image quality at high compression rates, differentiated functionality and low power consumption. These CV-based technologies are allowing us to address a broader range of markets and applications requiring AI video features, including IP security cameras, a variety of automotive cameras, consumer cameras, and industrial and robotic applications. We anticipate that our CV technology will also enable us to capture more content per electronic system and increase our average selling price.
Our development efforts are focused on SoCs that provide human viewing, computer vision and radar detection functionalities. As a result, we believe that our future revenue growth, if any, will significantly depend upon our ability to expand within camera markets with our AI and computer vision technology, particularly in the Internet of Things, or IoT, markets, as well as emerging markets such as AI-enabled security cameras, AI-based driving applications, including driver monitoring systems, advanced blind spot detection, object detection, and deep learning algorithms for HD mapping solutions, automotive advanced driver assistance systems, or ADAS, applications, and industrial and robotics markets. We expect our research and development expenditures to increase in comparison to prior periods as we devote additional resources to the development of innovative video and image processing solutions with increased functionality, such as AI and CV capabilities, and as we target new markets.
We sell our SoC solutions to leading original design manufacturers, or ODMs, and original equipment manufacturers, or OEMs, globally.globally, and in the automotive market, we also sell to Tier-1 suppliers. We refer to ODMs and Tier-1 automotive suppliers as our customers and OEMs as our end customers, except as otherwise indicated or as the context otherwise requires. In the camera market, our solutions enable the creation of high-quality video content in wearable cameras, automotive cameras, Internet Protocol, or IP, security cameras, for both professional use and home security and monitoring, unmanned aerial vehicle cameras, also referred to as UAVs or drones, and virtual reality cameras, also referred to as 360° cameras. In the infrastructure market, our solutions efficiently manage IP video traffic, broadcast encoding, transcoding and IP video delivery applications. We are also developing solutions to address emerging markets, such as OEM automotive advanced driving assistance systems and robotics markets.
Our sales cycles typically require a significant investment of time and a substantial expenditure of resources before we can realize revenue from the sale of our solutions, if any. Our typical sales cycle consists of a multi-month sales and development process involving our customers’ system designers and management along withand our sales personnel and software engineers. If successful, this process culminates in a customer’s decision to use our solutions in its system, which we refer to as a design win. Our sales efforts are typically directed to the OEM of the product that will incorporate our video and image processing solution, but the eventual design and incorporation of our SoC into the product may be handled by an ODM or Tier-1 supplier on behalf of the OEM.
Volume production may begin within six9 to 18 months after a design win, but could be longer in certain markets, depending on the complexity of our customer’s product and other factors upon which we may have little or no influence. In general, design cycles will be longer in the OEM automotive and industrial and robotics markets than in the IoT markets. Once one of our solutions hashave been incorporated into a customer’s design, we believe that our solution isthey are likely to remain a componentbe used for the life cycle of the customer’s product for its life cycle because of the time and expense associated with redesigning a product or substituting an alternative solution.product. Conversely, a design loss to a competitor will likely preclude any opportunity for us to generate future revenue from such customer’s product. Even if we obtain a design win and our SoC remains a component through the life cycle of a customer’s product, the volume and timing of actual sales of our SoCs to the customer depend upon the production, release and market acceptance of that product, none of which are within our control. A portable consumer deviceAn IoT product typically has a product life cycle of six6 to 1824 months. We anticipate that product life cycles will typically be longer than 24 months in the OEM automotive and industrial and robotics markets, as new product introductions occur less frequently in these markets.
54
Fiscal Year 20182024 Financial Highlights and Trends
We recorded revenue of $295.4$226.5 million in fiscal year 2018,2024, a decrease of 4.8%32.9% as compared to fiscal year 2017.2023. The decrease in revenue was primarily dueattributable to our majorlower product unit shipments as a result of customer in the sports camera market, GoPro, Inc., or GoPro, incorporating a competing solution into one of its recently released mainstream camera models that significantly reduced our sales to GoPro in fiscal year 2018. Compared to fiscal year 2017,inventory level reduction efforts. The decreased revenue from GoPro declinedlower product shipments was partially offset by 50.3%continued adoption of our CV-based solutions, which have higher average selling prices than non-CV solutions.
We recorded operating income of $24.4 million, a decrease of 59.5% as compared to fiscal year 2017, primarily due to a decrease in revenue and gross margin, increased stock-based compensation expense, and increased research and development costs.profit, as well as an increase in operating expenses. The increase in researchoperating expenses primarily related to higher chip tape-out costs from our foundries associated with the progress, complexity and number of chips in development, costs wasincreased engineering-related expenses for supporting our CV-based and radar solutions, as well as increased personnel costs.
Factors Affecting Our Performance
Impact of Global Supply Chain Conditions on Our Business. Uncertainty in customer demand as well as the worldwide economy, in general, have increased headcountvolatility in our sales and costs associated with new SoC developmentrevenues. Some customers have indicated they are reducing their inventory levels, as some component lead times contract toward normal levels, which has reduced and researchmay continue to reduce demand for our products. Uncertain market demand may be exacerbating these customers’ inventory reduction efforts. Supply chain issues can impact our business as they relate to both our suppliers and development effortsour customers. With respect to our suppliers, we have in the areapast experienced supply constraints for certain chips from Samsung Electronics Corporation and we may in the future experience similar issues. With respect to our customers, to the extent customers face supply chain issues with other components needed to pair with our products in order to produce their end products, such customers may delay future orders of our products or hold inventory of our products for longer periods of time. We believe that our customers are making progress with their inventory reduction efforts, and we expect conditions to return to more stability in future periods.
Ability to Capitalize on AI and Computer Vision Trends. We expect that AI and computer vision functionality will become an increasingly important requirement in many of our current and future markets, including IoT, automotive, industrial and robotics markets. As a result, we believe that our ability to develop advanced AI computer vision technology, principally forenable and support customer product development in emerging applications, in the automotive market.